UNITED STATES SECURITIES AND EXCHANGE COMMISSION
WASHINGTON, D.C. 20549
FORM 6-K
REPORT OF FOREIGN ISSUER PURSUANT TO RULE 13a-16 OR 15d-16
UNDER THE SECURITIES EXCHANGE ACT OF 1934
For the month of October, 2014
Commission file number: 1-10110
BANCO BILBAO VIZCAYA ARGENTARIA, S.A.
(Exact name of Registrant as specified in its charter)
BANK BILBAO VIZCAYA ARGENTARIA, S.A.
(Translation of Registrant’s name into English)
Paseo de la Castellana, 81
28046 Madrid
Spain
(Address of principal executive offices)
Indicate by check mark whether the registrant files or will file annual reports under cover of Form 20-F or Form 40-F:
Form 20-F X Form 40-F
Indicate by check mark if the registrant is submitting the Form 6-K in paper as permitted by Regulation S-T Rule 101(b)(1):
Yes No X
Indicate by check mark if the registrant is submitting the Form 6-K in paper as permitted by Regulation S-T Rule 101(b)(7):
Yes No X

TO THE COMISION NACIONAL DEL MERCADO DE VALORES
Banco Bilbao Vizcaya Argentaria, S.A.(BBVA), in compliance with the Securities Exchange legislation, hereby files the following
RELEVANT EVENT
Please find attached the detailed information regarding BBVA of the results of the EU- wide comprehensive assessment conducted by the European Central Bank (ECB).
The comprehensive assessment is prudential in nature and is made up of two main pillars: a) an asset quality review (AQR) and b) a stress test, performed in close cooperation with the European Banking Authority (EBA).
The comprehensive assessment was performed by the ECB in conjunction with the national competent authorities (NCAs), prior to assuming full responsibility for supervision under the Single Supervisory Mechanism in November 2014.
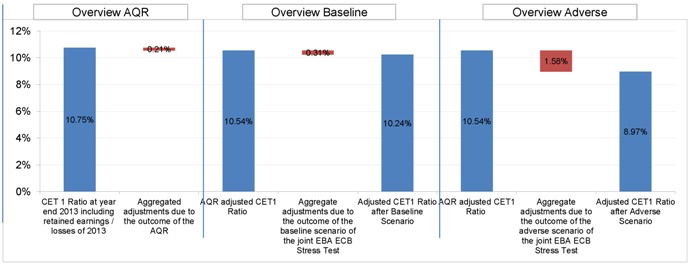
Further details on the results of the AQR and stress test under the baseline and adverse scenarios are provided in the disclosure tables based on the common format provided by the ECB and EBA. Regarding the results of the ECB exercise, BBVA would reach a level of capital CET 1 of 10.6% and 9.0% in the baseline and adverse scenarios respectively in December 2016, above the required minima. The ratio for the adverse scenario compares favorably with the median of the ratios for the group of entities subject to this analysis by the ECB (8.3%). Such results mean surpassing the exercise by a difference of€13.22 billion in the adverse scenario.
As published in the EBA templates, BBVA would reach a level of capital CET 1 fully loaded of 8.2% in 2016 under the adverse scenario.
Further information could also be consulted on the websites of the ECB, the EBA and the NCAs.
Madrid, October 26, 2014 |
Introduction to the Comprehensive Assessment disclosure templates
|
This document contains final disclosure of the results of the Comprehensive Assessment for Banco Bilbao Vizcaya Argentaria, S.A.
Specifically, the template contains the bank’s overall Comprehensive Assessment result, as well as more detail on Asset Quality Review (AQR) outcomes
Further detail on the joint ECB-EBA stress tests can be found in the bank’s EBA transparency template
This page provides detail on how to read the templates, and contains important caveats to consider within the context of final results
Bank-specific notes
-
|
| Sheet descriptions |
Main Results and Overview
A. Key information on the bank before the Comprehensive Assessment (end-2013)
B. The main results of the Comprehensive Assessment
C. Major capital measures impacting Tier 1 eligible capital, from 1 January 2014 to 30
September 2014
Detailed AQR Results
D. Matrix Breakdown of AQR Result
E. Matrix Breakdown of Asset Quality Indicators
F. Leverage ratio impact of the Comprehensive Assessment
Approved Restructuring Results
This is a repetition of Section B, main results of the Comprehensive Assessment, for those
banks who have an agreed restructuring plan
| Section descriptions |
| Section | Contents | Key fields | Notes | |||
| A. Main information on the bank before the Comprehensive Assessment (end-2013) | This section contains information on the size, performance and starting point capital holding of the bank as at year-end 2013 | A6Starting point CET1% - bank provided starting point for any adjustments following the Comprehensive Assessment | - Numbers in this section are provided primarily for transparency purposes and should not be used for comparisons to other sections/sheets. As an example, the NPE ratio exhibited in this section applies across all segments and all bank portfolios, and as such does not provide a like for like comparison with the NPE ratio data displayed in section E (which relates only to portfolios selected in Phase 1 of the AQR) | |||
| B. Main results of the Comprehensive Assessment | This key section of the disclosure template contains the main results of the Comprehensive Assessment | Key fields discussed in more detail below | - Banks have 6 months to recapitalise any shortfall resulting from the AQR and Stress Test baseline scenario, and 9 months to recapitalise any shortfall resulting from the Stress Test adverse scenario
| |||
| C. Major capital measures impacting Tier 1 eligible capital, from 1 January 2014 to 30 September 2014 | This section displays major capital market activity affecting Tier 1 eligible capital | - Section C should be read as informational only. Figures here do not feed into the final CET1% results as detailed in section B, nor do they mitigate the bank’s disclosed capital shortfall (B11) - For banks with a capital shortfall, this information will be taken into account during the capital planning phase that follows disclosure of Comprehensive Assessment results
| ||||
| D. Matrix Breakdown of AQR Result | This section gives workblock specific AQR results | D.A - D.Fprovides AQR results broken down by asset segment, and by AQR workblock D.G - D.Iprovides the results of the Level 3 non-derivative exposures review D20is the gross impact of the AQR before offsetting D21provides impact of insurance protection D22provides the tax impact D23shows the net total impact of the AQR | - The selection of asset classes for portfolio review was based on an approach aimed at identifying those portfolios with the highest risk of misclassification and misvaluation. Therefore, extrapolation of results to the non-selected portfolios would be incorrect from a statistical stand-point - In the AQR exercise the resulting increase in provisions (from a supervisory perspective) are translated into a change in CET1 - Items D1 to D21 are before offsetting impacts such as asset protection and taxes | |||
| E. Matrix Breakdown of Asset Quality Indicators | The section provides asset quality indicators (NPE levels and coverage ratio), broken down by asset segment | -E1shows the evolution of NPE levels for portfolios selected in Phase 1 -E10shows the evolution of coverage ratios for portfolios selected in Phase 1 | - Information reported only for portfolios subject to detailed review in AQR, i.e. those selected in Phase 1 of the AQR - Figures presented should not be interpreted as accounting figures - The asset quality indicators are based on EBA’s simplified definition of NPE - While the application of this definition constitutes an important step forward in terms of harmonisation across the euro area banking sector, the degree of harmonisation reached is not complete due to factors such as different materiality thresholds across Member States. However, a solid basis of consistency has been implemented for the Comprehensive Assessment, implying a very significant improvement in comparability across banks and jurisdictions | |||
| F. Leverage ratio impact of the Comprehensive Assessment | This shows the change in the leverage ratio from the AQR | - Leverage ratios are currently not binding, are displayed for information purposes only and have no impact on the capital shortfall - Due to the ‘static balance sheet’ assumption used as part of the Stress Test, the leverage ratio might be misleading for the Stress Tests and is therefore displayed for AQR only |
| Source of key figures / drivers of key results |
| B | MAIN RESULTS OF THE COMPREHENSIVE ASSESSMENT (CA)
|
| ||||||||||
| B1 | CET1 Ratio at year end 2013 including retained earnings / losses of 2013 B1 = A6 | % | 10.00% | B1 - the CET1 ratio as at 31 December 2013 is provided by the bank, and acts as the starting point against which Comprehensive Assessment impact is measured Note that CET1 is defined in accordance with CRDIV/CRR applicable as of 1 January 2014 | ||||||||
| B2 | Aggregated adjustments due to the outcome of the AQR | Basis Points Change | -100 | B2 - sourced from D23, the net AQR impact after tax and risk protection netting effects
| ||||||||
| B3 | AQR adjusted CET1 Ratio B3 = B1 + B2 | % | 9.00% | B3 = B1 + B2 | ||||||||
| B4 | Aggregate adjustments due to the outcome of thebaselinescenario of the joint EBA ECB Stress Test to lowest capital level over the 3-year period | Basis Points Change | -200 |
B4 = the delta between the AQR adjusted CET1% and the baseline scenario CET1%, in the year where capital level vs threshold (8%) is the lowest
Note - this information comes from the EBA transparency templates. The key fields in these templates are the baseline figures in the “Capital” sheet, section C.1 | ||||||||
| B5 | Adjusted CET1 Ratio after Baseline Scenario B5 = B3 + B4 | % | 7.00% | B5 = B3 + B4 (note the starting point for this adjustment is the AQR adjusted CET1%) | ||||||||
| B6 | Aggregate adjustments due to the outcome of theadverse scenario of the joint EBA ECB Stress Test to lowest capital level over the 3-year period | Basis Points Change | -400 |
B6 = the delta between the AQR adjusted CET1% and the adverse scenario CET1%, in the year where capital level vs threshold (5.5%) is the lowest | ||||||||
| B7 | Adjusted CET1 Ratio after Adverse Scenario B7 = B3 + B6 | % | 5.00% | Note - this information comes from the EBA transparency templates. The key fields in these templates are the adverse figures in the “Capital” sheet, section C.1
B7 = B3 + B6 (note the starting point for this adjustment is the AQR adjusted CET1%)
| ||||||||
For illustrative purposes only
| 2014 COMPREHENSIVE ASSESSMENT OUTCOME | ||||||||||
| ECB PUBLIC | ||||||||||
| NAME OF THE ENTITY | ESBBVA | Banco Bilbao Vizcaya Argentaria, S.A. | ||||||||
1 |
Main Results and Overview | |||||||||
A |
MAIN INFORMATION ON THE BANK BEFORE THE COMPREHENSIVE ASSESSMENT (end 2013) | |||||||||
END 2013 | ||||||||||
A1
|
Total Assets (based on prudential scope of consolidation)
|
Mill. EUR
|
587,084.99
| |||||||
| A2 |
Net (+) Profit/ (-) Loss of 2013 (based on prudential scope of consolidation)
|
Mill. EUR |
2,197.00 | |||||||
| A3 |
Common Equity Tier 1 Capital according to CRDIV/CRR definition, transitional arrangements as of 1.1.2014 | Mill. EUR | 37,058.30 | |||||||
| A4 |
Total risk exposure * according to CRDIV/CRR definition, transitional arrangements as of 1.1.2014 | Mill. EUR | 344,740.95 | |||||||
| A5 |
Total exposure measure according to Article 429 CRR “Leverage exposure” |
Mill. EUR |
621,977.66 | |||||||
| A6 |
CET1 ratio according to CRDIV/CRR definition, transitional arrangements as of 1.1.2014 A6=A3/A4 | % | 10.75% | |||||||
| A7 |
Tier 1 Ratio (where available) according to CRD3 definition, as of 31.12.2013 as reported by the bank |
% |
11.06% | |||||||
| A8 |
Core Tier 1 Ratio (where available) according to EBA definition |
% |
11.06% | |||||||
| A9 |
Leverage ratio
|
% |
6.13% | |||||||
| A10 |
Non-performing exposures ratio
|
% |
4.05% | |||||||
| A11 |
Coverage ratio for non-performing exposure
|
% |
65.57% | |||||||
A12 |
Level 3 instruments on total assets |
% |
0.14% | |||||||
B |
MAIN RESULTS OF THE COMPREHENSIVE ASSESSMENT (CA)
| |||||||||
| B1 |
CET1 Ratio at year end 2013 including retained earnings / losses of 2013 B1 = A6 | % | 10.75% | |||||||
| B2 |
Aggregated adjustments due to the outcome of the AQR |
Basis Points Change | -21 | |||||||
| B3 | AQR adjusted CET1 Ratio B3 = B1 + B2 | % | 10.54% | |||||||
| B4 | Aggregate adjustments due to the outcome of thebaselinescenario of the joint EBA ECB Stress Test to lowest capital level over the 3-year period | Basis Points Change | -31 | |||||||
| B5 |
Adjusted CET1 Ratio after Baseline Scenario B5 = B3 + B4 | % | 10.24% | |||||||
| B6 | Aggregate adjustments due to the outcome of theadversescenario of the joint EBA ECB Stress Test to lowest capital level over the 3-year period | Basis Points Change | -158 | |||||||
| B7 |
Adjusted CET1 Ratio after Adverse Scenario B7 = B3 + B6
| % | 8.97% | |||||||
Capital Shortfall |
Basis Points1 | Mill. EUR | ||||||||
B8 |
to threshold of 8% for AQR adjusted CET1 Ratio |
0 |
0.00 | |||||||
B9 |
to threshold of 8% in Baseline Scenario |
0 |
0.00 | |||||||
B10 |
to threshold of 5.5% in Adverse Scenario |
0 |
0.00 | |||||||
| B11 | Aggregated Capital Shortfall of the Comprehensive Assessment B11 = max( B8, B9, B10 ) | 0 | 0 | |||||||
* Total risk exposure figure is pre-AQR. Please note that the corresponding Year End 2013 figure in the EBA Transparency template is post-AQR and therefore may not match exactly.
1 RWA used corresponds to relevant scenario in worst case year
C
| MAJOR CAPITAL MEASURES IMPACTING TIER 1 ELIGIBLE CAPITAL FROM 1 JANUARY 2014 TO 30 SEPTEMBER 2014
| |||
Issuance of CET1 Instruments |
Impact on Common Equity Tier 1 Million EUR
| |||
| C1 | Raising of capital instruments eligible as CET1 capital |
0.00
| ||
| C2 | Repayment of CET1 capital, buybacks |
0.00
| ||
| C3 | Conversion to CET1 of hybrid instruments becoming effective between January and September 2014 |
0.00
| ||
Net issuance of Additional Tier 1 Instruments |
Impact on Additional Tier 1 Million EUR
| |||
| C4 | with a trigger at or above 5.5% and below 6% |
0.00
| ||
| C5 | with a trigger at or above 6% and below 7% |
0.00
| ||
| C6 | with a trigger at or above 7% |
0.00
| ||
| Fines/Litigation costs |
Million EUR
| |||
| C7 | Incurred fines/litigation costs from January to September 2014 (net of provisions) |
0.00
| ||
| 2014 COMPREHENSIVE ASSESSMENT OUTCOME | ||||||||
| ECB PUBLIC | ||||||||
| NAME OF THE ENTITY | ESBBVA | Banco Bilbao Vizcaya Argentaria, S.A. | ||||||
2. Detailed AQR Results
D. Matrix Breakdown of AQR Result (B2)
Note:
•The selection of asset classes for portfolio review was based on an approach aimed at identifying those portfolios with the highest risk of misclassification. Therefore, extrapolation of results to the non-selected portfolios would be incorrect.
• The columns D. C to D .F include (but are not limited to) any impacts on provisioning associated with the reclassification of performing to non-performing exposure.
• In the AQR exercise the resulting increase in provisions (from a supervisory perspective) are translated into a change in CET1.
• Items D1 to D21 are before offsetting impacts such as asset protection and taxes.
• Basis points are calculated using total risk exposure from Section A4
• For the interpretation of the detailed results the interested reader may refer to the AQR manual outlining the methodology or to the accompanying Aggregate Report where the main features of the CA exercise are reiterated. Find the AQR manual here:
http://www.ecb.europa.eu/press/pr/date/2014/html/pr140311.en.html
| D .A | D .B | D .C | D .D | D .E | D .F | |||||||||||||||||||||||||||||||||||||||||
| Credit Risk RWA year end 2013 | Portfolio selected in Phase 1 | Adjustments on sampled | Adjustments to provisions due to projection of findings | Adjustments to provisions due to collective provisioning review | Impact on CET1 capital before any offsetting impact | ||||||||||||||||||||||||||||||||||||||||
Units of Measurement | Mill. EUR |
% of RWA in Phase 1 | Basis Points | Mill. EUR | Basis Points | Mill. EUR | Basis Points | Mill. EUR | Basis Points | Mill. EUR | ||||||||||||||||||||||||||||||||||||
D1 | Total credit exposure | 289,967.75 | 40 - 60 | % | 5 | 163.22 | 1 | 49.72 | 22 | 752.12 | -28 | -965.06 | ||||||||||||||||||||||||||||||||||
D2 | Sovereigns and Supranational non-governmental organisations |
| 21,001.50 | 0 | % | 0 | 0.00 | 0 | 0.00 | 0 | 0.00 | 0 | 0.00 | |||||||||||||||||||||||||||||||||
D3 | Institutions | 19,381.51 | 0 | % | 0 | 0.00 | 0 | 0.00 | 0 | 0.00 | 0 | 0.00 | ||||||||||||||||||||||||||||||||||
D4 | Retail | 79,682.04 | 40 - 60 | % | 0 | 0.00 | 0 | 0.00 | 14 | 472.42 | -14 | -472.42 | ||||||||||||||||||||||||||||||||||
D5 | thereof SME | 15,598.47 | 0 | % | 0 | 0.00 | 0 | 0.00 | ||||||||||||||||||||||||||||||||||||||
D6 | thereof Residential Real Estate (RRE) |
| 29,597.42 | 60 - 80 | % | 0 | 0.00 | 0 | 0.00 | 14 | 472.42 | -14 | -472.42 | |||||||||||||||||||||||||||||||||
D7 | thereof Other Retail | 34,486.15 | 40 - 60 | % | 0 | 0.00 | 0 | 0.00 | ||||||||||||||||||||||||||||||||||||||
D8 | Corporates | 124,439.22 | 60 - 80 | % | 5 | 163.22 | 1 | 49.72 | 8 | 279.70 | -14 | -492.64 | ||||||||||||||||||||||||||||||||||
D9 | Other Assets | 45,463.49 | 20 - 40 | % | 0 | 0.00 | 0 | 0.00 | 0 | 0.00 | 0 | 0.00 | ||||||||||||||||||||||||||||||||||
| D10 | Additional information on portfolios with largest adjustments accounting for (at least) 30% of total bankingbook AQR adjustment: | |||||||||||||||||||||||||||||||||||||||||||||
| Asset Class | Geography | |||||||||||||||||||||||||||||||||||||||||||||
| Residential Real Estate (RRE) | SPAIN | 23,941.00 | 0.00 | 0.00 | 14 | 472.42 | -14 | -472.42 | ||||||||||||||||||||||||||||||||||||||
| Large corporates (non real estate) | SPAIN | 28,340.00 | 4 | 137.10 | 1 | 42.28 | 8 | 279.70 | -13 | -459.08 | ||||||||||||||||||||||||||||||||||||
NB: In some cases the total credit RWA reported in field D.A1 may not equal the sum of the components below, or corresponding metrics in the EBA transparency templates. These cases are driven by inclusion of specialised assets types which lie outside the categories given above
| D .G | D .H | D .I | ||||||||||
Portfolio size
|
Portfolio
|
Impact on CET1 before any offsetting
| ||||||||||
| Units of Measurement | Mill. EUR | % selected in Phase 1 | Basis points | Mill. EUR | ||||||||
D11 | CVA | 0 | 0.00 | |||||||||
D12 | Fair Value review | 0 | 0.00 | |||||||||
D13 | Non derivative exposures review | Please refer to Definitions and Explanations sheet | 704.62 | - | 0 | 0.00 | ||||||
D14 | Bonds | 0.00 | 0% | 0 | 0.00 | |||||||
D15 | Securitisations | 0.00 | 0% | 0 | 0.00 | |||||||
D16 | Loans | 0.00 | - | 0 | 0.00 | |||||||
D17 | Equity (Investment in PE and Participations) | 0.00 | 0% | 0 | 0.00 | |||||||
D18 | Investment Properties / Real Estate / Other | 704.62 | 0% | 0 | 0.00 | |||||||
D19 | Derivatives Model Review | 0 | 0.00 | |||||||||
| Basis points2 | Mill. EUR | |||||||||||
D20 | Gross impact on capital | -28 | -965.06 | |||||||||
D21 | Offsetting impact due to risk protection | 0 | 0.00 | |||||||||
D22 | Offsetting tax impact | 8 | 289.52 | |||||||||
D23 | Net total impact of AQR results on CET1 ratio | -21 | ||||||||||
| Please refer to Definitions and Explanations sheet | ||||||||||||
| D23 = (D20 + D21 + D22) + (Adjustment for change in RWA due to AQR) | ||||||||||||
E. Matrix Breakdown of Asset Quality Indicators
•The selection of asset classes for portfolio review was based on an approach aimed at identifying those portfolios with the highest risk of misclassification. Therefore, extrapolation of results to the non selected portfolios would be incorrect from a statistical stand-point.
• The asset quality indicators are based on EBA’s simplified definition of NPE.
• All parties involved made significant efforts to increase the degree of harmonisation of the NPE definition and its application.
• While the application of this definition constitutes a very important leap forward in terms of harmonisation across the euro area banking sector, the degree of harmonisation reached is not completely perfect due to factors such as different materiality thresholds across Member States. However, a solid basis of consistency has been implemented for the comprehensive assessment, implying a very significant improvement in comparability across banks from different jurisdictions.
• The figures presented should not be understood as accounting figures.
2 Basis point impact includes adjustment to RWA
Information reported only for portfolios subject to detailed review in AQR
Asset quality indicators | ||||||||||||||||||
| Based on EBA simplified definition | E .A | E .B | E .C | E .D | ||||||||||||||
Non-Performing Exposure Ratio | Unadjusted NPE Level year end 2013 | Changes due to the credit file review | Changes due to the projection of findings | AQR-adjusted NPE Level | ||||||||||||||
| Units of Measurement | % | Basis Points | Basis Points | % | ||||||||||||||
E1 | Total credit exposure | 8.83% | 22 | 4 | 9.09% | |||||||||||||
E2 | Sovereigns and Supranational non-governmental organisations | - | 0 | 0 | ||||||||||||||
E3 | Institutions | - | 0 | 0 | ||||||||||||||
E4 | Retail | 5.37% | 2 | 2 | 5.41% | |||||||||||||
E5 | thereof SME | - | ||||||||||||||||
E6 | thereof Residential Real Estate (RRE) | 5.44% | 2 | 3 | 5.49% | |||||||||||||
E7 | thereof Other Retail | 4.91% | ||||||||||||||||
E8 | Corporates | 13.62% | 50 | 6 | 14.18% | |||||||||||||
E9 | Other Assets | - | 0 | 0 | ||||||||||||||
| E .E | E .F | E .G | E .H | E .I | E.J | |||||||||||||
Coverage Ratio | ||||||||||||||||||
| NB: | Coverage ratios displayed in E.E - E.I | Unadjusted coverage ratio of non-performing exposure, year end 2013 | Changes due to the credit file review | Changes due to the projection of findings | Changes due to the collective provisioning review on non- performing exposures | AQR - adjusted ratio of provisions on NPE to NPE | Coverage ratio for exposures newly classified as NPE during the AQR | |||||||||||
| Units of Measurement | % | % | % | % | % | % | ||||||||||||
E10 | Total credit exposure | 40.20% | -1.69% | -2.42% | 2.36% | 38.44% | ||||||||||||
E11 | Sovereigns and Supranational non-governmental organisation | - | 0.00% | 0.00% | ||||||||||||||
E12 | Institutions | - | 0.00% | 0.00% | ||||||||||||||
E13 | Retail | 29.19% | 0.00% | 0.00% | 6.62% | 35.81% | ||||||||||||
E14 | thereof SME | - | 0.00% | |||||||||||||||
E15 | thereof Residential Real Estate (RRE) | 22.47% | 0.00% | 0.00% | 8.69% | 31.16% | ||||||||||||
E16 | thereof Other Retail | 79.60% | -8.93% | 70.66% | ||||||||||||||
E17 | Corporates | 46.20% | -2.55% | -3.75% | 39.90% | 9.99% | ||||||||||||
E18 | Other Assets | - | 0.00% | 0.00% | ||||||||||||||
| For information purposes only |
F. LEVERAGE RATIO IMPACT OF THE COMPREHENSIVE ASSESSMENT
Explanatory Note:
| • | Note that the leverage ratio is based on the CRR Article 429 as of January 2014. |
| • | It is currently not binding, is displayedfor information purposes onlyand has no impact on the capital shortfall(B11). |
| • | As the constant balance sheet assumption, which is applied in the Stress Test, might be misleading for the leverage ratio, the ratio is displayed for AQR only. |
| F1 | Leverage Ratio at year end 2013 | % | 6.13% | |||||||||
| Please refer to Definitions and Explanations sheet | ||||||||||||
| F1 = A9 | ||||||||||||
| F2 | Aggregated adjustments to Leverage Ratio due to the outcome of theAQR | Basis Points | -11 | |||||||||
| F2 = (D20+D21+D22)/A5 | ||||||||||||
| F3 | AQR adjusted Leverage Ratio | % | 6.02% | |||||||||
| F3 = F1 + F2 | ||||||||||||
3. Definitions and Explanations
Reference
|
Name
|
Definition or further explanation
| ||
A. MAIN INFORMATION ON THE BANK BEFORE THE COMPREHENSIVE ASSESSMENT (end 2013)
| ||||
| A1 | Total Assets (based on prudential scope of consolidation) | Sum of on balance positions. Note that for this and all following positions the scope of consolidation follows Article 18 CRR (therefore direct comparison with financial accounts based on accounting scope of consolidation will result in differences). Year-end 2013. | ||
| A2 | Net (+) Profit/ (-) Loss of 2013 (based on prudential scope of consolidation) |
Net profits (positive number) or net losses (negative number) in the year 2013. After taxes. Exclusive Other Comprehensive Income. The scope of consolidation follows Article 18 CRR (therefore direct comparison with financial accounts based on accounting scope of consolidation will result in differences).
| ||
| A3 | Common Equity Tier 1 Capital |
At year-end 2013, according to CRDIV/CRR definition, transitional arrangements as of 1.1.2014, Article 50 CRR. The only exception to national transitional arrangements is sovereign AFS losses (Article 467 CRR) where a harmonised approach is taken with a 20% deduction irrespective of national discretion concerning phase-in. This exception is necessary to be consistent with EBA’s CET1 definition applied in the stress test exercise. This includes losses of 2013 or retained earnings of 2013 subject to Article 26.2 CRR.
| ||
| A4 | Total risk exposure | Article 92.3 CRR, “total RWA”, as of year-end 2013. according to CRDIV/CRR definition, transitional arrangements as of 1.1.2014. | ||
| A5 | Total exposure measure according to Article 429 CRR | Denominator of leverage ratio (A9), “leverage exposure”, according to Article 429 CRR. | ||
| A6 | CET1 ratio |
A6=A3/A4, Article 92.1a CRR, figures as of year-end 2013. With national transitional arrangements as per 1 January 2014. The only exception to national transitional arrangements is sovereign AFS losses (Article 467 CRR) where a harmonised approach is taken with a 20% deduction irrespective of national discretion concerning phase-in. This exception is necessary to be consistent with EBA’s CET1 definition applied in the stress test exercise.
| ||
| A7 | Tier 1 Ratio |
Unadjusted Basel II figure as of 31.12.2013 as reported by the bank
| ||
| A8 | Core Tier one ratio |
Unadjusted Basel II figure as of 31.12.2013 as reported by the bank
| ||
| A9 | Leverage ratio at year end 2013 |
See EBA Implementing Technical Standards for Supervisory Reporting (Legal basis: Article 99 of Regulation (EU) No 575/2013 and ITS on Supervisory Reporting of institutions published in the Official Journal of the European Commission on 28/06/2014) module for leverage ratio:
- Annex X - Leverage ratio templates - Annex XI - Instructions on Leverage (Part II 2.12) | ||
| A10 | Non-performing exposures ratio | Numerator: Exposure (book value plus CCF-weighted off-balance exposure) that is non-performing according to the simplified NPE definition (see Section 2.4.4. of the AQR Phase 2 manual) at year end 2013 (total of consolidated bank): An NPE is defined as: Ÿ Every material exposure that is 90 days past-due even if it is not recognised as defaulted or impaired • Every exposure that is impaired (respecting specifics of definition for nGAAP vs. IFRS banks) • Every exposure that is in default according to CRR Definition of exposure: • Any facility that is NPE must be classed as such • For retail: NPE is defined at the facility level • For non-retail: NPE is defined at the debtor level – if one material exposure is classified as NPE, all exposures to this debtor level shall be treated as NPE • Materiality is defined as per the EBA ITS guidelines (i.e. as per Article 178 CRR) and hence in line with national discretion • Off balance sheet exposures are included. Derivative and trading book exposures are not included as per the EBA ITS. Denominator: total exposure (performing and non-performing). Same definition of exposure as above.
| ||
| A11 | Coverage ratio for non-performing exposure |
Numerator: Specific allowances for individually assessed financial assets (As per IAS 39 AG.84-92. FINREP table 4.4, column 080. EBA/ITS/2013/03 Annex V. Part 2. 35-38) + Specific allowances for collectively assessed financial assets (As per IAS 39 AG.84-92. FINREP table 4.4, column 090. EBA/ITS/2013/03 Annex V. Part 2. 35-38) + Collective allowances for incurred but not reported losses (As per IAS 39 AG.84-92. FINREP table 4.4, column 100. EBA/ITS/2013/03 Annex V. Part 2. 35-38)
Denominator: the non-performing exposure (numerator of A10)
As of year-end 2013 and total of consolidated bank.
| ||
| A12 | Level 3 instruments on total assets | Level 3 assets are those according to IFRS 13, para. 86-90 (covering Available for Sale, Fair Value through P&L and Held for Trading) Not defined for banks using nGAAP. Total assets = A1
| ||
B. MAIN RESULTS OF THE COMPREHENSIVE ASSESSMENT (CA)
| ||||
B1
|
CET1 Ratio
|
B1=A6
| ||
| B2 | Aggregated adjustments due to the outcome of the AQR | This is the sum of all AQR results impacting (from an accounting or prudential perspective) the CET1 ratio. The split into its components is provided in the sheet “Detailed AQR Results”. In basis points, marginal effect. | ||
| B3 | AQR adjusted CET1 Ratio | B3 = B1 + B2 based on year-end 2013 figures and CRR/CRDIV phase-in as of 1 January 2014 | ||
| B4 | Aggregate adjustments due to the outcome of the baseline scenario of the joint EBA ECB Stress Test | Additional adjustments due to baseline scenario to lowest capital level over the 3-year period. Note that this also includes phasing-in effects of CRR and CRD 4 as of arrangements of respective national jurisdiction. In line with EBA disclosure.
| ||
| B5 | Adjusted CET1 Ratio after Baseline Scenario | B5= B4 + B3 Note that this is an estimate of the outcome of a hypothetical scenario and refers to a future point in time. It should not be confused with the bank’s forecast or multi year plan. | ||
| B6 |
Aggregate adjustments due to the outcome of the adverse scenario of the joint EBA ECB Stress Test
|
Additional adjustments due to adverse scenario to lowest capital level over the 3-year period. Note that this also includes phasing-in effects of CRR and CRDIV as of arrangements of respective national jurisdiction. In line with EBA disclosure.
| ||
| B7 | Adjusted CET1 Ratio after Adverse Scenario |
B7 = B5 + B6 Note that this is an estimate of the outcome of an adverse hypothetical scenario and refers to a future point in time. It should not be confused with the bank’s forecast or multi-year plan.
| ||
| B8 |
Shortfall to threshold of 8% for AQR adjusted CET1 Ratio
| B8=(8-B3)*100 (if B3<8, otherwise 0) | ||
| B9 |
Shortfall to threshold of 8% in Baseline Scenario
| B9=(8-B5)*100 (if B5<8, otherwise 0) | ||
| B10 |
Shortfall to threshold of 5.5% in Adverse Scenario
| B10=(5.5-B7)*100 (if B7<5.5, otherwise 0) | ||
| B11 | Aggregated Capital Shortfall of the Comprehensive Assessment |
B11= max( B8, B9, B10 ) B11 will be capital shortfall coming out of the comprehensive assessment. For details on which measures are considered eligible to mitigate the shortfall see the accompanying Aggregated Report.
| ||
C. Memorandum Items
| ||||
Please refer to the bank specific notes on the first sheet for details on any capital raising that is already reflected in the dynamic balance sheet of the Stress Test
| ||||
| C1 | Raising of capital instruments eligible as CET1 capital (+) | Changes to CET1 due to new issuances of common equity. | ||
| C2 | Repayment of CET1 capital, buybacks (-) | Changes to CET1 due to repayment or reduction of CET1 (i.e. buybacks). | ||
| C3 | Conversion to CET1 of existing hybrid instruments (+) | Changes to CET1 due to conversion of existing hybrid instruments into CET1 which took place between 1 January 2014 and 30 September 2014. | ||
| C4 | Net Issuance of Additional Tier 1 Instruments with a trigger at or above 5.5% and below 6% |
Net issuance of AT1 Instruments (Article 52 CRR) with a trigger at or above 5.5% and below 6% between 1 January 2014 and 30 September 2014, expressed in terms of RWA. AT1 instruments which have been converted into CET1 are not to be accounted for in this cell to avoid double counting with C3.
| ||
| C5 | Net Issuance of Additional Tier 1 Instruments with a trigger at or above 6% and below 7% |
Net issuance of AT1 Instruments (Article 52 CRR) with a trigger at or above 6% and below 7% between 1 January 2014 and 30 September 2014, expressed in terms of RWA. AT1 instruments which have been converted into CET1 are not to be accounted for in this cell to avoid double counting with C3.
| ||
| C6 | Net Issuance of Additional Tier 1 Instruments with a trigger at or above 7% |
Net issuance of AT1 Instruments (Article 52 CRR) with a trigger at or above 7% CET1 between 1 January 2014 and 30 September 2014, expressed in terms of RWA. AT1 instruments which have been converted into CET1 are not to be accounted for in this cell to avoid double counting with C3.
| ||
| C7 |
Incurred fines/litigation costs from January to September 2014 (net of provisions)
| Incurred fines/litigation costs from 1 January to September 2014 (net of provisions). Only litigation costs with a realized loss > 1 Basis Point of CET1 (as of 1.1.2014) are in scope. | ||
D. Matrix Breakdown of AQR Result
| ||||
| Asset class | Corporates |
Asset class is an aggregated of the AQR sub-asset classes Project finance, Shipping, Aviation, Commercial real estate (CRE), Other real estate, Large corporates (non real estate) and Large SME (non real estate)
| ||
| D .A |
Credit Risk RWA year end 2013
|
Total credit risk weighted assets including off balance sheet items.
| ||
| D .B | Portfolio selected |
Indication of the fraction of the overall RWA per asset class that was selected in Phase 1 of the AQR. This follows a “bucketing approach” rather than disclosing the precise figures. Buckets are defined as follows: “Not relevant” ; 0%; < 20% ; 20-40% ; 40-60% ; 60-80% ; 80-100% ; 100%
| ||
| D .C | Adjustments to provisions on sampled files |
Amount of adjustments to specific provisions on the credit file samples. This includes all files from the single credit file review (on a technical note: also the prioritized files).
| ||
| D .D | Adjustments to provisions due to projection of findings |
Amount of adjustments to specific provisions based on the projection of findings of the credit file review to the wider portfolio (negative numbers).
| ||
| D .E | Adjustment to provisions due to collective provisioning review |
Amount of adjustments to collective provisions as determined based on the challenger model in cases where the bank’s collective provisioning model is found to be out of line with the standards expressed in the AQR Manual.
| ||
| D .F | Adjustments on CET1 before offsetting impact |
Gross amount of the aggregated adjustments disclosed in D.C - D.E before the offsetting impact of risk protection and tax (negative numbers).
| ||
| D.G | Portfolio size Carrying Amount |
Portfolio size - Level 3 Carrying Amount
| ||
| D .H | Portfolio selection |
Indication of the carrying amount (gross mark-to-market as of year-end 2013, before AQR adjustment) of Level 3 position that has been reviewed by NCA Bank Team divided by total level 3 carrying amount (gross mark-to-market as of year-end 2013, before AQR adjustment and before PP&A) for this asset class.
| ||
| D .I | Adjustments on CET1 before offsetting impact |
Amount of adjustments resulting from: - CVA Challenger model (D11). - the different components of the fair value exposures review (D13-D19), as well as the fair value review as a whole (D12) .
| ||
| D10 | Additional information on portfolios with largest adjustments accounting for (at least) 30% of total banking book AQR adjustment: | This breakdown is omitted where the overall AQR impact (B2) is less than 10 basis points CET1 and single rows are omitted where they have an impact of less than 1 basis point CET1. Note this adjustment is already reflected in the asset class break down of D1 to D9 and displayed here only on a more granular level.
| ||
| D11 | CVA | Adjustments resulting from CVA challenger model. CVA see Article 383 CRR CVA, calculated as the market loss-given-default multiplied by the sum of expected losses at each point in time. The expected loss at each point in time i is calculated as the product of the PD factor at that point in time and the Exposure factor at that point in time
| ||
| D12 | Adjustments to fair value assets in the banking and trading book | Split of the aggregated adjustment from the fair value review, excluding the adjustment to CVA (D11)
| ||
| D13 | Non derivative exposures review | This includes changes in scope of exposure following PP&A. Note this includes accrual accounted real estate positions and portfolios accounted at cost. | ||
| D20 | Sum of D.F1, D.I 11 and D.I 12 | Gross amount of the aggregated CET1 adjustment based on the AQR before offsetting impact of asset protection, insurance and tax (negative number).
| ||
| D21 | Offsetting impact due to risk protection | Aggregated estimated impact of asset protection schemes (e.g. portfolio guarantees) and insurance effects that may apply toapplicable portfolios (positive number).
| ||
| D22 | Offsetting tax impact | The offsetting tax impact includes the assumed creation of DTAs, which accounts for limitations imposed by accounting rules. Appropriate CRRIV DTA deductions are made for any tax offsets.
| ||
D23
| Net total impact of AQR results on CET1
| Net amount of the aggregated CET1 adjustment based on the AQR after offsetting impact of risk protection and tax (negative number). Sums the impact from D20, D21, D22, and incorporates the effect of changing RWA.
| ||
E. Matrix Breakdown of Asset Quality Indicators
| ||||
Ÿ The asset quality indicators are based on EBA’s simplified definition of NPE. Ÿ All parties involved made significant efforts to increase the degree of harmonisation of the NPE definition and its application. Ÿ While the application of this definition constitutes a very important leap forward in terms of harmonisation across the euro area banking sector, the degree of harmonisation reached is not completely perfect due to factors such as different materiality thresholds across Member States. However, a solid basis of consistency has been implemented for the comprehensive assessment, implying a very significant improvement in comparability across banks from different jurisdictions. ŸThe figures presented should not be understood as accounting figures.
| ||||
| E .A | unadjusted NPE Level year end 2013 | Total NPE for all portfolios in-scope for detailed review during the AQR. Expressed as a percentage of Total Exposure for these portfolios | ||
| E .B | Changes due to the single credit file review | Exposure re-classified from performing to non-performing according to the CFR classification review.
| ||
| E .C | Changes due to the projection of findings | Exposure re-classified from performing to non-performing according to the projection of findings.
| ||
| E .D | AQR - adjusted NPE level | Numerator: Exposure (book value plus CCF-weighted off-balance exposure) reported by the bank as non- performing according to the simplified NPE definition (see AQR Phase 2 Manual Section 2.4.4. and explanation for A10 above) at year end 2013 + Exposure re-classified from performing to non-performing according to the CFR classification review and projection of findings.
Denominator: total exposure (performing and non-performing). Same exposure definition as above.
| ||
| E .E | unadjusted coverage ratio of non-performing exposure, year end 2013 | Specific provisions divided by non-performing exposure for portfolios in-scope for detailed review in the AQR. NB: The NPE used is that set of of exposures which were originally marked as NPE pre-AQR. | ||
| E .F | Changes due to the single credit file review | Amount of adjustments to provisions based on single credit file review. | ||
| E .G | Changes due to the projection of findings | Amount of adjustments to provisions based on the projection of findings of the credit file review to the wider portfolio.
| ||
| E .H | Changes due to the collective provisioning review on non-performing exposures | Amount of adjustments to collective provisions as determined based on the challenger model in cases where the bank’s collective provisioning model is found to be out of line with the standards expressed in the AQR Manual.
| ||
| E .I | AQR - adjusted ratio of provisions on NPE to NPE | Coverage ratio adjusted for AQR findings.
| ||
| E.J | Coverage ratio for exposures newly classified as NPE during the AQR | Additional provisions specified for exposure newly classified as non-performing during the AQR | ||
F. LEVERAGE RATIO IMPACT OF THE COMPREHENSIVE ASSESSMENT
| ||||
| F1 | Leverage Ratio at year end 2013 | See A9 above
| ||
| F2 | Aggregated adjustments due to the outcome of the AQR | Adjustments to the leverage ratio based on all quantitative AQR adjustments affecting its components
| ||
| F3 | AQR adjusted Leverage Ratio | Leverage ratio as at December 2013, incorporating all quantitative AQR adjustments to capital. Leverage ratio definition based on CRR Article 429 as of September 2014
| ||

2014 EU-wide Stress Test
Bank Name
|
ES - Banco Bilbao Vizcaya Argentaria, S.A.
| |
LEI Code
|
K8MS7FD7N5Z2WQ51AZ71
|
 | 2014 EU-wide Stress Test | |||
| Summary Adverse Scenario | ||||
| ES - Banco Bilbao Vizcaya Argentaria, S.A. |
| Actual figures as of 31 December 2013 | mln EUR, % | |
Operating profit before impairments | 9,266 | |
Impairment losses on financial and non-financial assets in the banking book | 7,748 | |
Common Equity Tier 1 capital(1) | 36,383 | |
Total Risk Exposure(1) | 345,041 | |
Common Equity Tier 1 ratio, %(1) | 10.5% |
| Outcome of the adverse scenario as of 31 December 2016 | mln EUR, % | |
3 yr cumulative operating profit before impairments | 17,981 | |
3 yr cumulative impairment losses on financial and non-financial assets in the banking book | 15,880 | |
3 yr cumulative losses from the stress in the trading book | 2,079 | |
Valuation losses due to sovereign shock after tax and prudential filters | 736 | |
Common Equity Tier 1 capital(1) | 34,196 | |
Total Risk Exposure(1) | 381,341 | |
Common Equity Tier 1 ratio, %(1) | 9.0% |
| Memorandum items | mln EUR | |
Common EU wide CET1 Threshold (5.5%) | 20,974 | |
Total amount of instruments with mandatory conversion into ordinary shares upon a fixed date in the 2014 -2016 period (cumulative conversions)(2) | 0 | |
Total Additional Tier 1 and Tier 2 instruments eligible as regulatory capital under the CRR provisions that convert into Common Equity Tier 1 or are written down upon a trigger event(3) | 0 | |
Of which: eligible instruments whose trigger is above CET1 capital ratio in the adverse scenario(3) | 0 |
(1)According to CRR/CRD4 definition transitional arrangements as per reporting date. Figures as of 31/12/2013 computed as of first day of application: 01/01/2014.
(2) Conversions not considered for CET1 computation
(3) Excluding instruments with mandatory conversion into ordinary shares upon a fixed date in the 2014 -2016 period
| 2014 EU-wide Stress Test | |||
| Summary Baseline Scenario | ||||
| ES - Banco Bilbao Vizcaya Argentaria, S.A. |
| Actual figures as of 31 December 2013 | mln EUR, % | |
Operating profit before impairments | 9,266 | |
Impairment losses on financial and non-financial assets in the banking book | 7,748 | |
Common Equity Tier 1 capital(1) | 36,383 | |
Total Risk Exposure(1) | 345,041 | |
Common Equity Tier 1 ratio, %(1) | 10.5% |
| Outcome of the baseline scenario as of 31 December 2016 | mln EUR, % | |
3 yr cumulative operating profit before impairments | 20,065 | |
3 yr cumulative impairment losses on financial and non-financial assets in the banking book | 11,004 | |
3 yr cumulative losses from the stress in the trading book | 1,630 | |
Common Equity Tier 1 capital(1) | 38,028 | |
Total Risk Exposure(1) | 358,592 | |
Common Equity Tier 1 ratio, %(1) | 10.6% |
| Memorandum items | mln EUR | |
Common EU wide CET1 Threshold (8.0%) | 28,687 |
(1)According to CRR/CRD4 definition transitional arrangements as per reporting date. Figures as of 31/12/2013 computed as of first day of application: 01/01/2014.
 | 2014 EU-wide Stress Test Credit Risk |
LTV % (as of 31/12/2013)
| Exposure values (as of 31/12/2013) | |||||||||||||||||
| F-IRB | A-IRB | STA | ||||||||||||||||
(mln EUR, %)
| Non-defaulted | Defaulted | Non-defaulted | Defaulted | Non-defaulted | Defaulted | ||||||||||||
ES - Banco Bilbao Vizcaya Argentaria, S.A. | Central banks and central governments | 0 | 0 | 3,077 | 37 | 96,387 | 125 | |||||||||||
Institutions | 0 | 0 | 85,346 | 212 | 18,750 | 86 | ||||||||||||
Corporates | 0 | 0 | 79,189 | 10,455 | 69,552 | 2,551 | ||||||||||||
Corporates - Of Which: Specialised Lending | 0 | 0 | 11,722 | 468 | 0 | 0 | ||||||||||||
Corporates - Of Which: SME | 0 | 0 | 9,470 | 6,340 | 19,005 | 2,101 | ||||||||||||
Retail | 0 | 0 | 83,013 | 4,696 | 93,552 | 5,657 | ||||||||||||
Retail - Secured on real estate property | 63.1 | % | 0 | 0 | 68,364 | 4,106 | 50,180 | 2,889 | ||||||||||
Retail - Secured on real estate property - Of | 70.8 | % | 0 | 0 | 1,013 | 225 | 6,140 | 1,879 | ||||||||||
Retail - Secured on real estate property - Of | 62.5 | % | 0 | 0 | 67,352 | 3,881 | 44,040 | 1,010 | ||||||||||
Retail - Qualifying Revolving | 0 | 0 | 9,101 | 172 | 6,082 | 105 | ||||||||||||
Retail - Other Retail | 0 | 0 | 5,547 | 418 | 37,290 | 2,663 | ||||||||||||
Retail - Other Retail - Of Which: SME | 0 | 0 | 0 | 0 | 11,903 | 1,696 | ||||||||||||
Retail - Other Retail - Of Which: non-SME | 0 | 0 | 5,547 | 418 | 25,386 | 967 | ||||||||||||
Equity | 8,443 | 0 | 375 | 0 | 0 | 0 | ||||||||||||
Securitisation | 0 | 0 | 910 | 0 | 4,783 | 0 | ||||||||||||
Other non-credit obligation assets | 0 | 0 | 0 | 0 | 27,139 | 256 | ||||||||||||
TOTAL | 8,443 | 0 | 251,911 | 15,400 | 310,164 | 8,675 | ||||||||||||
Securitisation and re-securitisations positions deducted from capital * | 0 | 0 | 0 | 0 | 0 | 0 | ||||||||||||
LTV % (as of
| Risk exposure amounts (as of 31/12/2013) | |||||||||||||||||
| F-IRB | A-IRB | STA | ||||||||||||||||
(mln EUR, %)
| Non-defaulted | Defaulted | Non-defaulted | Defaulted | Non-defaulted | Defaulted | ||||||||||||
ES - Banco Bilbao Vizcaya Argentaria, S.A. | Central banks and central governments | 0 | 0 | 178 | 36 | 20,666 | 122 | |||||||||||
Institutions | 0 | 0 | 13,441 | 167 | 5,679 | 94 | ||||||||||||
Corporates | 0 | 0 | 48,140 | 7,084 | 66,706 | 2,509 | ||||||||||||
Corporates - Of Which: Specialised Lending | 0 | 0 | 11,167 | 0 | 0 | 0 | ||||||||||||
Corporates - Of Which: SME | 0 | 0 | 9,097 | 4,453 | 18,228 | 2,035 | ||||||||||||
Retail | 0 | 0 | 20,129 | 3,269 | 50,159 | 6,125 | ||||||||||||
Retail - Secured on real estate property | 63.1 | % | 0 | 0 | 9,621 | 3,015 | 19,010 | 3,574 | ||||||||||
Retail - Secured on real estate property - Of | 70.8 | % | 0 | 0 | 315 | 173 | 2,668 | 2,466 | ||||||||||
Retail - Secured on real estate property - Of | 62.5 | % | 0 | 0 | 9,306 | 2,842 | 16,342 | 1,108 | ||||||||||
Retail - Qualifying Revolving | 0 | 0 | 7,540 | 110 | 4,598 | 102 | ||||||||||||
Retail - Other Retail | 0 | 0 | 2,968 | 144 | 26,552 | 2,450 | ||||||||||||
Retail - Other Retail - Of Which: SME | 0 | 0 | 0 | 0 | 8,327 | 1,650 | ||||||||||||
Retail - Other Retail - Of Which: non-SME | 0 | 0 | 2,968 | 144 | 18,225 | 800 | ||||||||||||
Equity | 12,147 | 0 | 1,338 | 0 | 0 | 0 | ||||||||||||
Securitisation | 0 | 0 | 1,189 | 0 | 1,726 | 0 | ||||||||||||
Other non-credit obligation assets | 0 | 0 | 0 | 0 | 28,037 | 245 | ||||||||||||
TOTAL | 12,147 | 0 | 84,414 | 10,556 | 172,973 | 9,096 | ||||||||||||
Securitisation and re-securitisations positions deducted from capital * | ||||||||||||||||||
LTV % (as of
| Value adjustments and provisions (as of 31/12/2013) | |||||||||||||||||
| F-IRB | A-IRB | STA | ||||||||||||||||
(mln EUR, %)
| Non-defaulted | Defaulted | Non-defaulted | Defaulted | Non-defaulted | Defaulted | ||||||||||||
ES - Banco Bilbao Vizcaya Argentaria, S.A. | Central banks and central governments | 0 | 0 | 2 | 0 | 77 | 18 | |||||||||||
Institutions | 0 | 0 | 42 | 34 | 26 | 34 | ||||||||||||
Corporates | 0 | 0 | 550 | 6,167 | 1,225 | 928 | ||||||||||||
Corporates - Of Which: Specialised Lending | 0 | 0 | 35 | 265 | 11 | 0 | ||||||||||||
Corporates - Of Which: SME | 0 | 0 | 212 | 3,580 | 515 | 419 | ||||||||||||
Retail | 0 | 0 | 489 | 1,077 | 1,572 | 3,398 | ||||||||||||
Retail - Secured on real estate property | 63.1 | % | 0 | 0 | 82 | 594 | 746 | 1,383 | ||||||||||
Retail - Secured on real estate property - Of | 70.8 | % | 0 | 0 | 2 | 41 | 72 | 467 | ||||||||||
Retail - Secured on real estate property - Of | 62.5 | % | 0 | 0 | 80 | 553 | 674 | 917 | ||||||||||
Retail - Qualifying Revolving | 0 | 0 | 365 | 167 | 87 | 97 | ||||||||||||
Retail - Other Retail | 0 | 0 | 41 | 316 | 739 | 1,917 | ||||||||||||
Retail - Other Retail - Of Which: SME | 0 | 0 | 0 | 0 | 200 | 1,009 | ||||||||||||
Retail - Other Retail - Of Which: non-SME | 0 | 0 | 41 | 316 | 539 | 908 | ||||||||||||
Equity | 0 | 0 | 0 | 0 | 0 | 0 | ||||||||||||
Securitisation | 0 | 0 | 0 | 0 | 0 | 0 | ||||||||||||
Other non-credit obligation assets | 0 | 0 | 0 | 0 | 70 | 75 | ||||||||||||
TOTAL | 0 | 0 | 1,083 | 7,279 | 2,970 | 4,453 | ||||||||||||
Securitisation and re-securitisations positions deducted from capital * | 0 | 0 | 0 | 0 | 0 | 0 | ||||||||||||
(*) Refers to the part of Securitization exposure that is deducted from capital and is not included in RWA
| Baseline Scenario | ||||||||||||||||
| as of 31/12/2014 | as of 31/12/2015 | as of 31/12/2016 | ||||||||||||||
| Impairment rate | Stock of Provisions | Coverage Ratio - Default | Impairment rate | Stock of Provisions | Coverage Ratio - Default | Impairment rate | Stock of Provisions | Coverage Ratio - Default | ||||||||
| 0.14% | 113 | 29.50% | 0.14% | 158 | 32.39% | 0.14% | 203 | 34.02% | ||||||||
| 0.05% | 267 | 31.26% | 0.03% | 301 | 27.89% | 0.02% | 318 | 26.07% | ||||||||
| 0.44% | 10,991 | 55.05% | 0.40% | 11,601 | 53.26% | 0.35% | 12,127 | 51.93% | ||||||||
| - | 0 | - | - | 0 | - | - | 0 | - | ||||||||
| - | 0 | - | - | 0 | - | - | 0 | - | ||||||||
| 1.10% | 11,626 | 51.98% | 0.95% | 13,271 | 50.36% | 0.87% | 14,748 | 49.22% | ||||||||
| 0.28% | 5,011 | 41.76% | 0.20% | 5,255 | 39.18% | 0.18% | 5,475 | 37.23% | ||||||||
| 0.62% | 1,765 | 62.94% | 0.56% | 1,806 | 61.93% | 0.55% | 1,845 | 61.07% | ||||||||
| 0.26% | 3,245 | 34.04% | 0.18% | 3,449 | 31.75% | 0.16% | 3,631 | 30.07% | ||||||||
| 4.46% | 1,453 | 68.76% | 3.86% | 2,007 | 66.69% | 3.54% | 2,482 | 65.64% | ||||||||
| 2.20% | 5,162 | 63.29% | 2.06% | 6,009 | 60.53% | 1.99% | 6,790 | 58.78% | ||||||||
| 1.93% | 2,198 | 62.07% | 1.72% | 2,394 | 59.71% | 1.60% | 2,569 | 58.07% | ||||||||
| 2.30% | 2,964 | 64.37% | 2.20% | 3,616 | 61.14% | 2.14% | 4,221 | 59.24% | ||||||||
| 0.00% | 0 | - | 0.00% | 0 | - | 0.00% | 0 | - | ||||||||
| 0.58% | 22,996 | 52.84% | 0.49% | 25,331 | 50.99% | 0.44% | 27,395 | 49.71% | ||||||||
| Adverse Scenario | ||||||||||||||||
| as of 31/12/2014 | as of 31/12/2015 | as of 31/12/2016 | ||||||||||||||
| Impairment rate | Stock of Provisions | Coverage Ratio - Default Stock | Impairment rate | Stock of Provisions | Coverage Ratio - Default | Impairment rate | Stock of Provisions | Coverage Ratio - Default | ||||||||
| 0.73% | 314 | 37.65% | 0.76% | 554 | 38.67% | 0.75% | 786 | 39.06% | ||||||||
| 0.10% | 313 | 27.61% | 0.15% | 476 | 23.57% | 0.07% | 551 | 22.33% | ||||||||
| 0.63% | 11,279 | 55.14% | 0.81% | 12,548 | 52.99% | 0.70% | 13,576 | 51.73% | ||||||||
| - | 0 | - | - | 0 | - | - | 0 | - | ||||||||
| - | 0 | - | - | 0 | - | - | 0 | - | ||||||||
| 1.45% | 12,238 | 53.04% | 1.59% | 15,085 | 51.76% | 1.28% | 17,225 | 50.52% | ||||||||
| 0.46% | 5,228 | 42.24% | 0.55% | 5,929 | 39.67% | 0.41% | 6,413 | 37.64% | ||||||||
| 0.91% | 1,786 | 63.01% | 1.25% | 1,892 | 62.20% | 1.06% | 1,965 | 61.17% | ||||||||
| 0.43% | 3,442 | 34.96% | 0.51% | 4,037 | 33.09% | 0.37% | 4,448 | 31.50% | ||||||||
| 5.15% | 1,559 | 70.59% | 5.05% | 2,290 | 68.89% | 4.05% | 2,817 | 67.48% | ||||||||
| 2.87% | 5,451 | 64.88% | 3.37% | 6,866 | 63.08% | 2.95% | 7,995 | 61.68% | ||||||||
| 2.55% | 2,272 | 63.12% | 3.17% | 2,630 | 60.98% | 2.47% | 2,892 | 59.73% | ||||||||
| 2.99% | 3,180 | 66.38% | 3.44% | 4,236 | 64.56% | 3.14% | 5,103 | 62.89% | ||||||||
| 0.00% | 0 | - | 0.00% | 0 | - | 0.00% | 0 | - | ||||||||
| 0.82% | 24,145 | 53.07% | 0.93% | 28,663 | 50.90% | 0.76% | 32,137 | 49.54% | ||||||||
LTV % (as of 31/12/2013)
| Exposure values (as of 31/12/2013) | |||||||||||||||||
| F-IRB | A-IRB | STA | ||||||||||||||||
(mln EUR, %)
| Non-defaulted | Defaulted | Non-defaulted | Defaulted | Non-defaulted | Defaulted | ||||||||||||
Spain | Central banks and central governments | 0 | 0 | 413 | 0 | 47,909 | 55 | |||||||||||
Institutions | 0 | 0 | 41,817 | 204 | 7,506 | 57 | ||||||||||||
Corporates | 0 | 0 | 48,181 | 10,033 | 8,814 | 2,116 | ||||||||||||
Corporates - Of Which: Specialised Lending | 0 | 0 | 4,631 | 162 | 0 | 0 | ||||||||||||
Corporates - Of Which: SME | 0 | 0 | 9,312 | 6,336 | 3,341 | 1,889 | ||||||||||||
Retail | 0 | 0 | 75,187 | 4,528 | 24,442 | 4,215 | ||||||||||||
Retail - Secured on real estate property | 63.1 | % | 0 | 0 | 67,912 | 4,089 | 14,966 | 2,360 | ||||||||||
Retail - Secured on real estate property - Of | 70.8 | % | 0 | 0 | 993 | 224 | 2,803 | 1,818 | ||||||||||
Retail - Secured on real estate property - Of | 62.5 | % | 0 | 0 | 66,918 | 3,865 | 12,163 | 543 | ||||||||||
Retail - Qualifying Revolving | 0 | 0 | 1,740 | 21 | 758 | 61 | ||||||||||||
Retail - Other Retail | 0 | 0 | 5,534 | 418 | 8,717 | 1,793 | ||||||||||||
Retail - Other Retail - Of Which: SME | 0 | 0 | 0 | 0 | 4,317 | 1,445 | ||||||||||||
Retail - Other Retail - Of Which: non-SME | 0 | 0 | 5,534 | 418 | 4,400 | 348 | ||||||||||||
Equity | 4,738 | 0 | 375 | 0 | 0 | 0 | ||||||||||||
Securitisation | 0 | 0 | 910 | 0 | 229 | 0 | ||||||||||||
Other non-credit obligation assets | 0 | 0 | 0 | 0 | 10,441 | 230 | ||||||||||||
TOTAL | 4,738 | 0 | 166,883 | 14,765 | 99,340 | 6,673 | ||||||||||||
Securitisation and re-securitisations positions deducted from capital * | 0 | 0 | 0 | 0 | 0 | 0 | ||||||||||||
LTV % (as of
| Risk exposure amounts (as of 31/12/2013) | |||||||||||||||||
| F-IRB | A-IRB | STA | ||||||||||||||||
(mln EUR, %)
| Non-defaulted | Defaulted | Non-defaulted | Defaulted | Non-defaulted | Defaulted | ||||||||||||
Spain | Central banks and central governments | 0 | 0 | 15 | 0 | 3,070 | 60 | |||||||||||
Institutions | 0 | 0 | 7,986 | 167 | 1,347 | 62 | ||||||||||||
Corporates | 0 | 0 | 30,951 | 7,015 | 8,646 | 2,097 | ||||||||||||
Corporates - Of Which: Specialised Lending | 0 | 0 | 4,328 | 0 | 0 | 0 | ||||||||||||
Corporates - Of Which: SME | 0 | 0 | 8,947 | 4,450 | 3,339 | 1,851 | ||||||||||||
Retail | 0 | 0 | 12,595 | 3,155 | 11,104 | 4,953 | ||||||||||||
Retail - Secured on real estate property | 63.1 | % | 0 | 0 | 9,431 | 3,002 | 5,376 | 3,103 | ||||||||||
Retail - Secured on real estate property - Of | 70.8 | % | 0 | 0 | 292 | 173 | 1,007 | 2,402 | ||||||||||
Retail - Secured on real estate property - Of | 62.5 | % | 0 | 0 | 9,139 | 2,829 | 4,368 | 701 | ||||||||||
Retail - Qualifying Revolving | 0 | 0 | 200 | 9 | 569 | 57 | ||||||||||||
Retail - Other Retail | 0 | 0 | 2,964 | 144 | 5,159 | 1,793 | ||||||||||||
Retail - Other Retail - Of Which: SME | 0 | 0 | 0 | 0 | 2,641 | 1,445 | ||||||||||||
Retail - Other Retail - Of Which: non-SME | 0 | 0 | 2,964 | 144 | 2,517 | 348 | ||||||||||||
Equity | 6,261 | 0 | 1,338 | 0 | 0 | 0 | ||||||||||||
Securitisation | 0 | 0 | 1,189 | 0 | 637 | 0 | ||||||||||||
Other non-credit obligation assets | 0 | 0 | 0 | 0 | 6,909 | 221 | ||||||||||||
TOTAL | 6,261 | 0 | 54,074 | 10,337 | 31,713 | 7,394 | ||||||||||||
Securitisation and re-securitisations positions deducted from capital * | ||||||||||||||||||
LTV % (as of
| Value adjustments and provisions (as of 31/12/2013) | |||||||||||||||||
| F-IRB | A-IRB | STA | ||||||||||||||||
(mln EUR, %)
| Non-defaulted | Defaulted | Non-defaulted | Defaulted | Non-defaulted | Defaulted | ||||||||||||
Spain | Central banks and central governments | 0 | 0 | 1 | 0 | 10 | 0 | |||||||||||
Institutions | 0 | 0 | 32 | 26 | 6 | 7 | ||||||||||||
Corporates | 0 | 0 | 494 | 5,936 | 366 | 476 | ||||||||||||
Corporates - Of Which: Specialised Lending | 0 | 0 | 16 | 106 | 0 | 0 | ||||||||||||
Corporates - Of Which: SME | 0 | 0 | 212 | 3,579 | 309 | 227 | ||||||||||||
Retail | 0 | 0 | 126 | 922 | 289 | 2,079 | ||||||||||||
Retail - Secured on real estate property | 63.1 | % | 0 | 0 | 82 | 591 | 228 | 819 | ||||||||||
Retail - Secured on real estate property - Of | 70.8 | % | 0 | 0 | 2 | 41 | 4 | 397 | ||||||||||
Retail - Secured on real estate property - Of | 62.5 | % | 0 | 0 | 79 | 550 | 223 | 422 | ||||||||||
Retail - Qualifying Revolving | 0 | 0 | 3 | 16 | 1 | 40 | ||||||||||||
Retail - Other Retail | 0 | 0 | 41 | 316 | 60 | 1,220 | ||||||||||||
Retail - Other Retail - Of Which: SME | 0 | 0 | 0 | 0 | 7 | 751 | ||||||||||||
Retail - Other Retail - Of Which: non-SME | 0 | 0 | 41 | 316 | 53 | 469 | ||||||||||||
Equity | 0 | 0 | 0 | 0 | 0 | 0 | ||||||||||||
Securitisation | 0 | 0 | 0 | 0 | 0 | 0 | ||||||||||||
Other non-credit obligation assets | 0 | 0 | 0 | 0 | 0 | 17 | ||||||||||||
TOTAL | 0 | 0 | 652 | 6,885 | 670 | 2,580 | ||||||||||||
Securitisation and re-securitisations positions deducted from capital * | 0 | 0 | 0 | 0 | 0 | 0 | ||||||||||||
(*) Refers to the part of Securitization exposure that is deducted from capital and is not included in RWA
| Baseline Scenario | ||||||||||||||||
| as of 31/12/2014 | as of 31/12/2015 | as of 31/12/2016 | ||||||||||||||
| Impairment rate | Stock of Provisions | Coverage Ratio - Default | Impairment rate | Stock of Provisions | Coverage Ratio - Default | Impairment rate | Stock of Provisions | Coverage Ratio - Default | ||||||||
| 0.20% | 70 | 40.00% | 0.20% | 113 | 40.00% | 0.20% | 157 | 40.00% | ||||||||
| 0.08% | 188 | 31.58% | 0.05% | 212 | 29.24% | 0.01% | 218 | 28.78% | ||||||||
| 0.52% | 8,927 | 55.68% | 0.42% | 9,175 | 54.56% | 0.32% | 9,357 | 53.82% | ||||||||
| - | 0 | - | - | 0 | - | - | 0 | - | ||||||||
| - | 0 | - | - | 0 | - | - | 0 | - | ||||||||
| 0.38% | 6,332 | 48.66% | 0.29% | 6,623 | 46.90% | 0.24% | 6,857 | 45.57% | ||||||||
| 0.19% | 3,724 | 42.77% | 0.13% | 3,829 | 40.98% | 0.10% | 3,913 | 39.61% | ||||||||
| 0.15% | 1,571 | 63.27% | 0.11% | 1,575 | 62.72% | 0.08% | 1,578 | 62.26% | ||||||||
| 0.19% | 2,153 | 33.62% | 0.13% | 2,254 | 32.09% | 0.10% | 2,335 | 30.96% | ||||||||
| 0.60% | 100 | 59.61% | 0.50% | 112 | 56.38% | 0.45% | 123 | 54.08% | ||||||||
| 1.48% | 2,507 | 60.20% | 1.26% | 2,681 | 58.16% | 1.04% | 2,821 | 56.66% | ||||||||
| 1.82% | 1,489 | 62.11% | 1.60% | 1,555 | 60.48% | 1.14% | 1,600 | 59.39% | ||||||||
| 1.33% | 1,018 | 57.25% | 1.11% | 1,126 | 54.88% | 1.00% | 1,221 | 53.11% | ||||||||
| 0.00% | 0 | - | 0.00% | 0 | - | 0.00% | 0 | - | ||||||||
| 0.33% | 15,517 | 51.98% | 0.26% | 16,123 | 50.40% | 0.20% | 16,589 | 49.31% | ||||||||
| Adverse Scenario | ||||||||||||||||
| as of 31/12/2014 | as of 31/12/2015 | as of 31/12/2016 | ||||||||||||||
| Impairment rate | Stock of Provisions | Coverage Ratio - Default Stock | Impairment rate | Stock of Provisions | Coverage Ratio - Default | Impairment rate | Stock of Provisions | Coverage Ratio - Default | ||||||||
| 1.06% | 261 | 40.00% | 1.06% | 489 | 40.00% | 1.06% | 711 | 40.00% | ||||||||
| 0.17% | 232 | 27.88% | 0.28% | 367 | 24.01% | 0.11% | 418 | 23.38% | ||||||||
| 0.85% | 9,122 | 55.77% | 0.99% | 9,697 | 54.44% | 0.65% | 10,060 | 53.66% | ||||||||
| - | 0 | - | - | 0 | - | - | 0 | - | ||||||||
| - | 0 | - | - | 0 | - | - | 0 | - | ||||||||
| 0.71% | 6,661 | 49.52% | 0.78% | 7,427 | 48.08% | 0.57% | 7,973 | 46.97% | ||||||||
| 0.38% | 3,885 | 43.17% | 0.42% | 4,230 | 41.24% | 0.27% | 4,452 | 39.80% | ||||||||
| 0.37% | 1,579 | 63.25% | 0.45% | 1,596 | 62.51% | 0.31% | 1,608 | 61.95% | ||||||||
| 0.38% | 2,306 | 34.60% | 0.42% | 2,634 | 33.52% | 0.27% | 2,844 | 32.53% | ||||||||
| 1.03% | 111 | 61.94% | 1.03% | 136 | 60.18% | 0.86% | 157 | 58.78% | ||||||||
| 2.58% | 2,665 | 61.94% | 2.89% | 3,060 | 61.18% | 2.35% | 3,365 | 60.41% | ||||||||
| 2.88% | 1,535 | 63.33% | 3.56% | 1,681 | 62.66% | 2.84% | 1,790 | 62.00% | ||||||||
| 2.45% | 1,130 | 59.92% | 2.61% | 1,380 | 59.32% | 2.14% | 1,575 | 58.57% | ||||||||
| 0.00% | 0 | - | 0.00% | 0 | - | 0.00% | 0 | - | ||||||||
| 0.65% | 16,276 | 51.94% | 0.73% | 17,980 | 49.83% | 0.52% | 19,163 | 48.66% | ||||||||
LTV % (as of 31/12/2013)
| Exposure values (as of 31/12/2013) | |||||||||||||||||
| F-IRB | A-IRB | STA | ||||||||||||||||
(mln EUR, %)
| Non-defaulted | Defaulted | Non-defaulted | Defaulted | Non-defaulted | Defaulted | ||||||||||||
Mexico | Central banks and central governments | 0 | 0 | 347 | 0 | 17,682 | 0 | |||||||||||
Institutions | 0 | 0 | 185 | 0 | 2,210 | 0 | ||||||||||||
Corporates | 0 | 0 | 569 | 0 | 11,708 | 88 | ||||||||||||
Corporates - Of Which: Specialised Lending | 0 | 0 | 23 | 0 | 0 | 0 | ||||||||||||
Corporates - Of Which: SME | 0 | 0 | 31 | 0 | 3,903 | 71 | ||||||||||||
Retail | 0 | 0 | 7,359 | 151 | 15,586 | 834 | ||||||||||||
Retail - Secured on real estate property | 0.0 | % | 0 | 0 | 7 | 0 | 9,106 | 268 | ||||||||||
Retail - Secured on real estate property - Of | 0.0 | % | 0 | 0 | 0 | 0 | 569 | 20 | ||||||||||
Retail - Secured on real estate property - Of | 0.0 | % | 0 | 0 | 7 | 0 | 8,537 | 248 | ||||||||||
Retail - Qualifying Revolving | 0 | 0 | 7,351 | 151 | 7 | 0 | ||||||||||||
Retail - Other Retail | 0 | 0 | 1 | 0 | 6,473 | 566 | ||||||||||||
Retail - Other Retail - Of Which: SME | 0 | 0 | 0 | 0 | 1,613 | 119 | ||||||||||||
Retail - Other Retail - Of Which: non-SME | 0 | 0 | 1 | 0 | 4,860 | 447 | ||||||||||||
Equity | 1,116 | 0 | 0 | 0 | 0 | 0 | ||||||||||||
Securitisation | 0 | 0 | 0 | 0 | 70 | 0 | ||||||||||||
Other non-credit obligation assets | 0 | 0 | 0 | 0 | 6,292 | 0 | ||||||||||||
TOTAL | 1,116 | 0 | 8,460 | 151 | 53,549 | 922 | ||||||||||||
Securitisation and re-securitisations positions deducted from capital * | 0 | 0 | 0 | 0 | 0 | 0 | ||||||||||||
LTV % (as of
| Risk exposure amounts (as of 31/12/2013) | |||||||||||||||||
| F-IRB | A-IRB | STA | ||||||||||||||||
(mln EUR, %)
| Non-defaulted | Defaulted | Non-defaulted | Defaulted | Non-defaulted | Defaulted | ||||||||||||
Mexico | Central banks and central governments | 0 | 0 | 2 | 0 | 1,153 | 0 | |||||||||||
Institutions | 0 | 0 | 24 | 0 | 1,059 | 0 | ||||||||||||
Corporates | 0 | 0 | 393 | 0 | 10,507 | 56 | ||||||||||||
Corporates - Of Which: Specialised Lending | 0 | 0 | 21 | 0 | 0 | 0 | ||||||||||||
Corporates - Of Which: SME | 0 | 0 | 47 | 0 | 3,502 | 44 | ||||||||||||
Retail | 0 | 0 | 7,343 | 101 | 8,321 | 576 | ||||||||||||
Retail - Secured on real estate property | 0.0 | % | 0 | 0 | 4 | 0 | 3,462 | 224 | ||||||||||
Retail - Secured on real estate property - Of | 0.0 | % | 0 | 0 | 0 | 0 | 336 | 17 | ||||||||||
Retail - Secured on real estate property - Of | 0.0 | % | 0 | 0 | 4 | 0 | 3,126 | 207 | ||||||||||
Retail - Qualifying Revolving | 0 | 0 | 7,339 | 101 | 5 | 0 | ||||||||||||
Retail - Other Retail | 0 | 0 | 0 | 0 | 4,854 | 352 | ||||||||||||
Retail - Other Retail - Of Which: SME | 0 | 0 | 0 | 0 | 1,209 | 74 | ||||||||||||
Retail - Other Retail - Of Which: non-SME | 0 | 0 | 0 | 0 | 3,645 | 277 | ||||||||||||
Equity | 1,353 | 0 | 0 | 0 | 0 | 0 | ||||||||||||
Securitisation | 0 | 0 | 0 | 0 | 58 | 0 | ||||||||||||
Other non-credit obligation assets | 0 | 0 | 0 | 0 | 2,519 | 0 | ||||||||||||
TOTAL | 1,353 | 0 | 7,763 | 101 | 23,618 | 632 | ||||||||||||
Securitisation and re-securitisations positions deducted from capital * | ||||||||||||||||||
LTV % (as of
| Value adjustments and provisions (as of 31/12/2013) | |||||||||||||||||
| F-IRB | A-IRB | STA | ||||||||||||||||
(mln EUR, %)
| Non-defaulted | Defaulted | Non-defaulted | Defaulted | Non-defaulted | Defaulted | ||||||||||||
Mexico | Central banks and central governments | 0 | 0 | 0 | 0 | 27 | 0 | |||||||||||
Institutions | 0 | 0 | 0 | 0 | 8 | 0 | ||||||||||||
Corporates | 0 | 0 | 1 | 0 | 112 | 127 | ||||||||||||
Corporates - Of Which: Specialised Lending | 0 | 0 | 0 | 0 | 11 | 0 | ||||||||||||
Corporates - Of Which: SME | 0 | 0 | 0 | 0 | 47 | 102 | ||||||||||||
Retail | 0 | 0 | 362 | 151 | 407 | 522 �� | ||||||||||||
Retail - Secured on real estate property | 0.0 | % | 0 | 0 | 0 | 0 | 201 | 291 | ||||||||||
Retail - Secured on real estate property - Of | 0.0 | % | 0 | 0 | 0 | 0 | 14 | 10 | ||||||||||
Retail - Secured on real estate property - Of | 0.0 | % | 0 | 0 | 0 | 0 | 187 | 281 | ||||||||||
Retail - Qualifying Revolving | 0 | 0 | 362 | 151 | 0 | 0 | ||||||||||||
Retail - Other Retail | 0 | 0 | 0 | 0 | 206 | 231 | ||||||||||||
Retail - Other Retail - Of Which: SME | 0 | 0 | 0 | 0 | 22 | 88 | ||||||||||||
Retail - Other Retail - Of Which: non-SME | 0 | 0 | 0 | 0 | 185 | 143 | ||||||||||||
Equity | 0 | 0 | 0 | 0 | 0 | 0 | ||||||||||||
Securitisation | 0 | 0 | 0 | 0 | 0 | 0 | ||||||||||||
Other non-credit obligation assets | 0 | 0 | 0 | 0 | 0 | 0 | ||||||||||||
TOTAL | 0 | 0 | 363 | 151 | 554 | 649 | ||||||||||||
Securitisation and re-securitisations positions deducted from capital * | 0 | 0 | 0 | 0 | 0 | 0 | ||||||||||||
(*) Refers to the part of Securitization exposure that is deducted from capital and is not included in RWA
| Baseline Scenario | ||||||||||||||||
| as of 31/12/2014 | as of 31/12/2015 | as of 31/12/2016 | ||||||||||||||
| Impairment rate | Stock of Provisions | Coverage Ratio - Default | Impairment rate | Stock of Provisions | Coverage Ratio - Default | Impairment rate | Stock of Provisions | Coverage Ratio - Default | ||||||||
| - | 0 | 100.00% | - | 0 | 100.00% | - | 0 | 100.00% | ||||||||
| 0.27% | 15 | 20.00% | 0.17% | 19 | 20.00% | 0.19% | 24 | 20.00% | ||||||||
| 0.80% | 340 | 41.40% | 0.59% | 410 | 38.54% | 0.62% | 483 | 37.20% | ||||||||
| - | 0 | - | - | 0 | - | - | 0 | - | ||||||||
| - | 0 | - | - | 0 | - | - | 0 | - | ||||||||
| 4.00% | 2,882 | 65.28% | 3.23% | 3,568 | 62.20% | 3.08% | 4,179 | 60.22% | ||||||||
| 1.26% | 622 | 38.36% | 0.90% | 699 | 34.09% | 0.94% | 776 | 31.49% | ||||||||
| 4.02% | 62 | 75.42% | 2.86% | 77 | 72.47% | 3.01% | 93 | 70.68% | ||||||||
| 1.08% | 560 | 36.10% | 0.77% | 622 | 31.70% | 0.80% | 683 | 29.02% | ||||||||
| 7.37% | 1,061 | 71.86% | 6.24% | 1,468 | 69.74% | 5.80% | 1,808 | 68.74% | ||||||||
| 4.00% | 1,199 | 85.76% | 3.29% | 1,401 | 82.95% | 3.34% | 1,595 | 80.95% | ||||||||
| 3.10% | 251 | 81.08% | 2.49% | 289 | 78.20% | 2.56% | 327 | 76.13% | ||||||||
| 4.30% | 948 | 87.27% | 3.56% | 1,111 | 84.42% | 3.60% | 1,268 | 82.40% | ||||||||
| 0.00% | 0 | - | 0.00% | 0 | - | 0.00% | 0 | - | ||||||||
| 2.64% | 3,237 | 61.49% | 2.07% | 3,997 | 58.40% | 1.96% | 4,686 | 56.43% | ||||||||
| Adverse Scenario | ||||||||||||||||
| as of 31/12/2014 | as of 31/12/2015 | as of 31/12/2016 | ||||||||||||||
| Impairment rate | Stock of Provisions | Coverage Ratio - Default Stock | Impairment rate | Stock of Provisions | Coverage Ratio - Default | Impairment rate | Stock of Provisions | Coverage Ratio - Default | ||||||||
| - | 0 | 100.00% | - | 0 | 100.00% | - | 0 | 100.00% | ||||||||
| 0.30% | 16 | 20.00% | 0.26% | 22 | 20.00% | 0.26% | 28 | 20.00% | ||||||||
| 0.85% | 346 | 40.96% | 0.80% | 443 | 38.22% | 0.83% | 540 | 37.39% | ||||||||
| - | 0 | - | - | 0 | - | - | 0 | - | ||||||||
| - | 0 | - | - | 0 | - | - | 0 | - | ||||||||
| 4.52% | 3,002 | 66.50% | 4.10% | 3,867 | 63.21% | 3.55% | 4,556 | 61.06% | ||||||||
| 1.53% | 647 | 39.29% | 1.44% | 769 | 35.28% | 1.46% | 886 | 33.20% | ||||||||
| 4.74% | 66 | 78.96% | 4.12% | 88 | 76.30% | 3.98% | 108 | 74.18% | ||||||||
| 1.32% | 581 | 36.86% | 1.27% | 682 | 32.71% | 1.29% | 779 | 30.59% | ||||||||
| 8.33% | 1,131 | 73.62% | 7.77% | 1,632 | 71.23% | 6.25% | 1,985 | 70.00% | ||||||||
| 4.38% | 1,224 | 86.97% | 3.95% | 1,465 | 84.26% | 3.81% | 1,684 | 82.07% | ||||||||
| 3.57% | 259 | 82.82% | 3.22% | 308 | 80.41% | 3.10% | 353 | 78.31% | ||||||||
| 4.65% | 965 | 88.32% | 4.19% | 1,157 | 85.46% | 4.05% | 1,331 | 83.21% | ||||||||
| 0.00% | 0 | - | 0.00% | 0 | - | 0.00% | 0 | - | ||||||||
| 2.96% | 3,364 | 62.43% | 2.65% | 4,331 | 59.07% | 2.29% | 5,124 | 56.97% | ||||||||
LTV % (as of
| Exposure values (as of 31/12/2013) | |||||||||||||||||
| F-IRB | A-IRB | STA | ||||||||||||||||
(mln EUR, %)
| Non-defaulted | Defaulted | Non-defaulted | Defaulted | Non-defaulted | Defaulted | ||||||||||||
United States | Central banks and central governments | 0 | 0 | 591 | 0 | 6,172 | 66 | |||||||||||
Institutions | 0 | 0 | 1,770 | 0 | 2,456 | 28 | ||||||||||||
Corporates | 0 | 0 | 4,056 | 12 | 23,973 | 91 | ||||||||||||
Corporates - Of Which: Specialised Lending | 0 | 0 | 881 | 12 | 0 | 0 | ||||||||||||
Corporates - Of Which: SME | 0 | 0 | 27 | 0 | 8,553 | 48 | ||||||||||||
Retail | 0 | 0 | 16 | 0 | 15,554 | 204 | ||||||||||||
Retail - Secured on real estate property | 0.0 | % | 0 | 0 | 15 | 0 | 11,128 | 117 | ||||||||||
Retail - Secured on real estate property - Of | 0.0 | % | 0 | 0 | 0 | 0 | 0 | 0 | ||||||||||
Retail - Secured on real estate property - Of | 0.0 | % | 0 | 0 | 14 | 0 | 11,128 | 117 | ||||||||||
Retail - Qualifying Revolving | 0 | 0 | 1 | 0 | 549 | 13 | ||||||||||||
Retail - Other Retail | 0 | 0 | 1 | 0 | 3,877 | 74 | ||||||||||||
Retail - Other Retail - Of Which: SME | 0 | 0 | 0 | 0 | 1,441 | 73 | ||||||||||||
Retail - Other Retail - Of Which: non-SME | 0 | 0 | 1 | 0 | 2,436 | 1 | ||||||||||||
Equity | 99 | 0 | 0 | 0 | 0 | 0 | ||||||||||||
Securitisation | 0 | 0 | 0 | 0 | 4,484 | 0 | ||||||||||||
Other non-credit obligation assets | 0 | 0 | 0 | 0 | 2,290 | 0 | ||||||||||||
TOTAL | 99 | 0 | 6,434 | 12 | 54,930 | 389 | ||||||||||||
Securitisation and re-securitisations positions deducted from capital * | 0 | 0 | 0 | 0 | 0 | 0 | ||||||||||||
LTV % (as of
| Risk exposure amounts (as of 31/12/2013) | |||||||||||||||||
| F-IRB | A-IRB | STA | ||||||||||||||||
(mln EUR, %)
| Non-defaulted | Defaulted | Non-defaulted | Defaulted | Non-defaulted | Defaulted | ||||||||||||
United States | Central banks and central governments | 0 | 0 | 1 | 0 | 991 | 58 | |||||||||||
Institutions | 0 | 0 | 781 | 0 | 413 | 31 | ||||||||||||
Corporates | 0 | 0 | 2,757 | 0 | 22,804 | 95 | ||||||||||||
Corporates - Of Which: Specialised Lending | 0 | 0 | 1,697 | 0 | 0 | 0 | ||||||||||||
Corporates - Of Which: SME | 0 | 0 | 4 | 0 | 8,136 | 48 | ||||||||||||
Retail | 0 | 0 | 3 | 0 | 7,783 | 174 | ||||||||||||
Retail - Secured on real estate property | 0.0 | % | 0 | 0 | 3 | 0 | 4,327 | 89 | ||||||||||
Retail - Secured on real estate property - Of | 0.0 | % | 0 | 0 | 0 | 0 | 0 | 0 | ||||||||||
Retail - Secured on real estate property - Of | 0.0 | % | 0 | 0 | 3 | 0 | 4,327 | 89 | ||||||||||
Retail - Qualifying Revolving | 0 | 0 | 0 | 0 | 549 | 13 | ||||||||||||
Retail - Other Retail | 0 | 0 | 0 | 0 | 2,908 | 72 | ||||||||||||
Retail - Other Retail - Of Which: SME | 0 | 0 | 0 | 0 | 1,081 | 71 | ||||||||||||
Retail - Other Retail - Of Which: non-SME | 0 | 0 | 0 | 0 | 1,827 | 1 | ||||||||||||
Equity | 316 | 0 | 0 | 0 | 0 | 0 | ||||||||||||
Securitisation | 0 | 0 | 0 | 0 | 1,031 | 0 | ||||||||||||
Other non-credit obligation assets | 0 | 0 | 0 | 0 | 845 | 0 | ||||||||||||
TOTAL | 316 | 0 | 3,542 | 0 | 33,868 | 357 | ||||||||||||
Securitisation and re-securitisations positions deducted from capital * | ||||||||||||||||||
LTV % (as of
| Value adjustments and provisions (as of 31/12/2013) | |||||||||||||||||
| F-IRB | A-IRB | STA | ||||||||||||||||
(mln EUR, %)
| Non-defaulted | Defaulted | Non-defaulted | Defaulted | Non-defaulted | Defaulted | ||||||||||||
United States | Central banks and central governments | 0 | 0 | 0 | 0 | 24 | 15 | |||||||||||
Institutions | 0 | 0 | 4 | 0 | 6 | 24 | ||||||||||||
Corporates | 0 | 0 | 8 | 3 | 197 | 19 | ||||||||||||
Corporates - Of Which: Specialised Lending | 0 | 0 | 5 | 3 | 0 | 0 | ||||||||||||
Corporates - Of Which: SME | 0 | 0 | 0 | 0 | 66 | 5 | ||||||||||||
Retail | 0 | 0 | 0 | 0 | 296 | 105 | ||||||||||||
Retail - Secured on real estate property | 0.0 | % | 0 | 0 | 0 | 0 | 66 | 66 | ||||||||||
Retail - Secured on real estate property - Of | 0.0 | % | 0 | 0 | 0 | 0 | 0 | 0 | ||||||||||
Retail - Secured on real estate property - Of | 0.0 | % | 0 | 0 | 0 | 0 | 66 | 66 | ||||||||||
Retail - Qualifying Revolving | 0 | 0 | 0 | 0 | 24 | 11 | ||||||||||||
Retail - Other Retail | 0 | 0 | 0 | 0 | 206 | 28 | ||||||||||||
Retail - Other Retail - Of Which: SME | 0 | 0 | 0 | 0 | 73 | 28 | ||||||||||||
Retail - Other Retail - Of Which: non-SME | 0 | 0 | 0 | 0 | 134 | 0 | ||||||||||||
Equity | 0 | 0 | 0 | 0 | 0 | 0 | ||||||||||||
Securitisation | 0 | 0 | 0 | 0 | 0 | 0 | ||||||||||||
Other non-credit obligation assets | 0 | 0 | 0 | 0 | 0 | 0 | ||||||||||||
TOTAL | 0 | 0 | 12 | 3 | 522 | 163 | ||||||||||||
Securitisation and re-securitisations positions deducted from capital * | 0 | 0 | 0 | 0 | 0 | 0 | ||||||||||||
(*) Refers to the part of Securitization exposure that is deducted from capital and is not included in RWA
| Baseline Scenario | ||||||||||||||||
| as of 31/12/2014 | as of 31/12/2015 | as of 31/12/2016 | ||||||||||||||
| Impairment rate | Stock of Provisions | Coverage Ratio - Default Stock | Impairment rate | Stock of Provisions | Coverage Ratio - Default Stock | Impairment rate | Stock of Provisions | Coverage Ratio - Default Stock | ||||||||
| 0.00% | 26 | 18.47% | 0.00% | 26 | 18.40% | 0.00% | 26 | 18.34% | ||||||||
| 0.02% | 35 | 44.13% | 0.01% | 35 | 43.03% | 0.01% | 36 | 42.15% | ||||||||
| 0.14% | 325 | 42.63% | 0.10% | 354 | 39.55% | 0.09% | 379 | 37.78% | ||||||||
| - | 0 | - | - | 0 | - | - | 0 | - | ||||||||
| - | 0 | - | - | 0 | - | - | 0 | - | ||||||||
| 0.39% | 467 | 35.25% | 0.31% | 515 | 37.35% | 0.29% | 559 | 38.61% | ||||||||
| 0.22% | 156 | 30.99% | 0.15% | 173 | 32.20% | 0.14% | 188 | 32.88% | ||||||||
| 0.21% | 0 | 34.14% | 0.15% | 0 | 35.51% | 0.14% | 0 | 36.15% | ||||||||
| 0.22% | 156 | 30.99% | 0.15% | 173 | 32.20% | 0.14% | 188 | 32.88% | ||||||||
| 2.05% | 50 | 63.64% | 1.82% | 60 | 63.91% | 1.75% | 69 | 64.00% | ||||||||
| 0.65% | 261 | 35.38% | 0.56% | 282 | 38.09% | 0.53% | 302 | 39.61% | ||||||||
| 0.42% | 107 | 29.72% | 0.34% | 112 | 30.62% | 0.31% | 116 | 31.26% | ||||||||
| 0.79% | 154 | 50.61% | 0.69% | 170 | 50.32% | 0.66% | 186 | 50.11% | ||||||||
| 0.00% | 0 | - | 0.00% | 0 | - | 0.00% | 0 | - | ||||||||
| 0.20% | 852 | 36.61% | 0.15% | 930 | 37.03% | 0.14% | 999 | 37.22% | ||||||||
| Adverse Scenario | ||||||||||||||||
| as of 31/12/2014 | as of 31/12/2015 | as of 31/12/2016 | ||||||||||||||
| Impairment rate | Stock of Provisions | Coverage Ratio - Default Stock | Impairment rate | Stock of Provisions | Coverage Ratio - Default Stock | Impairment rate | Stock of Provisions | Coverage Ratio - Default Stock | ||||||||
| 0.00% | 26 | 18.40% | 0.00% | 26 | 18.34% | 0.00% | 26 | 18.27% | ||||||||
| 0.02% | 35 | 43.78% | 0.07% | 39 | 39.90% | 0.06% | 41 | 37.05% | ||||||||
| 0.22% | 347 | 47.06% | 0.48% | 487 | 42.68% | 0.35% | 582 | 39.66% | ||||||||
| - | 0 | - | - | 0 | - | - | 0 | - | ||||||||
| - | 0 | - | - | 0 | - | - | 0 | - | ||||||||
| 0.49% | 482 | 37.42% | 0.83% | 626 | 43.91% | 0.68% | 733 | 45.18% | ||||||||
| 0.30% | 165 | 33.42% | 0.63% | 243 | 39.95% | 0.48% | 301 | 41.64% | ||||||||
| 0.27% | 0 | 37.72% | 0.57% | 0 | 53.12% | 0.45% | 0 | 49.26% | ||||||||
| 0.30% | 165 | 33.42% | 0.63% | 243 | 39.94% | 0.48% | 301 | 41.64% | ||||||||
| 2.25% | 51 | 64.97% | 3.02% | 67 | 65.80% | 2.76% | 81 | 65.81% | ||||||||
| 0.77% | 265 | 37.33% | 1.11% | 315 | 44.87% | 0.96% | 351 | 45.52% | ||||||||
| 0.53% | 109 | 30.78% | 0.87% | 121 | 33.29% | 0.72% | 131 | 34.31% | ||||||||
| 0.91% | 156 | 54.33% | 1.25% | 194 | 61.21% | 1.11% | 220 | 57.92% | ||||||||
| 0.00% | 0 | - | 0.00% | 0 | - | 0.00% | 0 | - | ||||||||
| 0.27% | 890 | 39.27% | 0.52% | 1,177 | 41.91% | 0.40% | 1,383 | 41.34% | ||||||||
LTV % (as of
| Exposure values (as of 31/12/2013) | |||||||||||||||||
| F-IRB | A-IRB | STA | ||||||||||||||||
(mln EUR, %)
| Non-defaulted | Defaulted | Non-defaulted | Defaulted | Non-defaulted | Defaulted | ||||||||||||
Venezuela | Central banks and central governments | 0 | 0 | 58 | 0 | 10,829 | 0 | |||||||||||
Institutions | 0 | 0 | 3 | 0 | 727 | 0 | ||||||||||||
Corporates | 0 | 0 | 15 | 0 | 3,732 | 52 | ||||||||||||
Corporates - Of Which: Specialised Lending | 0 | 0 | 0 | 0 | 0 | 0 | ||||||||||||
Corporates - Of Which: SME | 0 | 0 | 0 | 0 | 0 | 0 | ||||||||||||
Retail | 0 | 0 | 15 | 0 | 6,819 | 87 | ||||||||||||
Retail - Secured on real estate property | 0.0 | % | 0 | 0 | 13 | 0 | 896 | 11 | ||||||||||
Retail - Secured on real estate property - Of | 0.0 | % | 0 | 0 | 0 | 0 | 423 | 5 | ||||||||||
Retail - Secured on real estate property - Of | 0.0 | % | 0 | 0 | 13 | 0 | 472 | 6 | ||||||||||
Retail - Qualifying Revolving | 0 | 0 | 1 | 0 | 1,417 | 18 | ||||||||||||
Retail - Other Retail | 0 | 0 | 1 | 0 | 4,506 | 57 | ||||||||||||
Retail - Other Retail - Of Which: SME | 0 | 0 | 0 | 0 | 299 | 4 | ||||||||||||
Retail - Other Retail - Of Which: non-SME | 0 | 0 | 1 | 0 | 4,207 | 53 | ||||||||||||
Equity | 63 | 0 | 0 | 0 | 0 | 0 | ||||||||||||
Securitisation | 0 | 0 | 0 | 0 | 0 | 0 | ||||||||||||
Other non-credit obligation assets | 0 | 0 | 0 | 0 | 916 | 6 | ||||||||||||
TOTAL | 63 | 0 | 92 | 0 | 23,023 | 144 | ||||||||||||
Securitisation and re-securitisations positions deducted from capital * | 0 | 0 | 0 | 0 | 0 | 0 | ||||||||||||
LTV % (as of
| Risk exposure amounts (as of 31/12/2013) | |||||||||||||||||
| F-IRB | A-IRB | STA | ||||||||||||||||
(mln EUR, %)
| Non-defaulted | Defaulted | Non-defaulted | Defaulted | Non-defaulted | Defaulted | ||||||||||||
Venezuela | Central banks and central governments | 0 | 0 | 0 | 0 | 10,772 | 0 | |||||||||||
Institutions | 0 | 0 | 1 | 0 | 379 | 0 | ||||||||||||
Corporates | 0 | 0 | 6 | 0 | 3,678 | 52 | ||||||||||||
Corporates - Of Which: Specialised Lending | 0 | 0 | 0 | 0 | 0 | 0 | ||||||||||||
Corporates - Of Which: SME | 0 | 0 | 0 | 0 | 0 | 0 | ||||||||||||
Retail | 0 | 0 | 5 | 0 | 4,845 | 85 | ||||||||||||
Retail - Secured on real estate property | 0.0 | % | 0 | 0 | 4 | 0 | 403 | 11 | ||||||||||
Retail - Secured on real estate property - Of | 0.0 | % | 0 | 0 | 0 | 0 | 201 | 5 | ||||||||||
Retail - Secured on real estate property - Of | 0.0 | % | 0 | 0 | 4 | 0 | 202 | 6 | ||||||||||
Retail - Qualifying Revolving | 0 | 0 | 0 | 0 | 1,062 | 18 | ||||||||||||
Retail - Other Retail | 0 | 0 | 0 | 0 | 3,380 | 56 | ||||||||||||
Retail - Other Retail - Of Which: SME | 0 | 0 | 0 | 0 | 224 | 4 | ||||||||||||
Retail - Other Retail - Of Which: non-SME | 0 | 0 | 0 | 0 | 3,155 | 52 | ||||||||||||
Equity | 120 | 0 | 0 | 0 | 0 | 0 | ||||||||||||
Securitisation | 0 | 0 | 0 | 0 | 0 | 0 | ||||||||||||
Other non-credit obligation assets | 0 | 0 | 0 | 0 | 437 | 5 | ||||||||||||
TOTAL | 120 | 0 | 12 | 0 | 20,111 | 142 | ||||||||||||
Securitisation and re-securitisations positions deducted from capital * | ||||||||||||||||||
LTV % (as of
| Value adjustments and provisions (as of 31/12/2013) | |||||||||||||||||
| F-IRB | A-IRB | STA | ||||||||||||||||
(mln EUR, %)
| Non-defaulted | Defaulted | Non-defaulted | Defaulted | Non-defaulted | Defaulted | ||||||||||||
Venezuela | Central banks and central governments | 0 | 0 | 0 | 0 | 0 | 0 | |||||||||||
Institutions | 0 | 0 | 0 | 0 | 0 | 0 | ||||||||||||
Corporates | 0 | 0 | 0 | 0 | 81 | 44 | ||||||||||||
Corporates - Of Which: Specialised Lending | 0 | 0 | 0 | 0 | 0 | 0 | ||||||||||||
Corporates - Of Which: SME | 0 | 0 | 0 | 0 | 0 | 0 | ||||||||||||
Retail | 0 | 0 | 0 | 0 | 135 | 73 | ||||||||||||
Retail - Secured on real estate property | 0.0 | % | 0 | 0 | 0 | 0 | 18 | 10 | ||||||||||
Retail - Secured on real estate property - Of | 0.0 | % | 0 | 0 | 0 | 0 | 9 | 5 | ||||||||||
Retail - Secured on real estate property - Of | 0.0 | % | 0 | 0 | 0 | 0 | 9 | 5 | ||||||||||
Retail - Qualifying Revolving | 0 | 0 | 0 | 0 | 28 | 15 | ||||||||||||
Retail - Other Retail | 0 | 0 | 0 | 0 | 89 | 48 | ||||||||||||
Retail - Other Retail - Of Which: SME | 0 | 0 | 0 | 0 | 6 | 3 | ||||||||||||
Retail - Other Retail - Of Which: non-SME | 0 | 0 | 0 | 0 | 83 | 45 | ||||||||||||
Equity | 0 | 0 | 0 | 0 | 0 | 0 | ||||||||||||
Securitisation | 0 | 0 | 0 | 0 | 0 | 0 | ||||||||||||
Other non-credit obligation assets | 0 | 0 | 0 | 0 | 0 | 0 | ||||||||||||
TOTAL | 0 | 0 | 0 | 0 | 216 | 116 | ||||||||||||
Securitisation and re-securitisations positions deducted from capital * | 0 | 0 | 0 | 0 | 0 | 0 | ||||||||||||
(*) Refers to the part of Securitization exposure that is deducted from capital and is not included in RWA
| Baseline Scenario | ||||||||||||||||
| as of 31/12/2014 | as of 31/12/2015 | as of 31/12/2016 | ||||||||||||||
| Impairment rate | Stock of Provisions | Coverage Ratio - Default Stock | Impairment rate | Stock of Provisions | Coverage Ratio - Default Stock | Impairment rate | Stock of Provisions | Coverage Ratio - Default Stock | ||||||||
| - | 0 | - | - | 0 | - | - | 0 | - | ||||||||
| 0.00% | 0 | - | 0.00% | 0 | 20.00% | 0.00% | 0 | 20.00% | ||||||||
| 0.83% | 184 | 58.93% | 1.74% | 248 | 49.75% | 1.74% | 309 | 46.66% | ||||||||
| - | 0 | - | - | 0 | - | - | 0 | - | ||||||||
| - | 0 | - | - | 0 | - | - | 0 | - | ||||||||
| 2.39% | 410 | 58.23% | 3.39% | 631 | 54.43% | 3.31% | 832 | 52.84% | ||||||||
| 0.71% | 35 | 36.93% | 1.49% | 48 | 30.39% | 1.47% | 61 | 28.42% | ||||||||
| 1.13% | 19 | 48.39% | 2.39% | 29 | 43.17% | 2.35% | 38 | 41.49% | ||||||||
| 0.34% | 16 | 26.74% | 0.71% | 19 | 19.15% | 0.70% | 22 | 16.95% | ||||||||
| 3.09% | 98 | 66.90% | 4.28% | 156 | 63.76% | 4.17% | 208 | 62.25% | ||||||||
| 2.51% | 277 | 58.59% | 3.50% | 427 | 55.45% | 3.43% | 563 | 54.08% | ||||||||
| 1.37% | 14 | 47.31% | 2.04% | 20 | 43.24% | 2.02% | 26 | 41.68% | ||||||||
| 2.59% | 263 | 59.25% | 3.61% | 407 | 56.15% | 3.53% | 538 | 54.79% | ||||||||
| 0.00% | 0 | - | 0.00% | 0 | - | 0.00% | 0 | - | ||||||||
| 1.71% | 594 | 58.42% | 2.59% | 879 | 53.17% | 2.53% | 1,140 | 51.16% | ||||||||
| Adverse Scenario | ||||||||||||||||
| as of 31/12/2014 | as of 31/12/2015 | as of 31/12/2016 | ||||||||||||||
| Impairment rate | Stock of Provisions | Coverage Ratio - Default Stock | Impairment rate | Stock of Provisions | Coverage Ratio - Default Stock | Impairment rate | Stock of Provisions | Coverage Ratio - Default Stock | ||||||||
| - | 0 | - | - | 0 | - | - | 0 | - | ||||||||
| 0.00% | 0 | 20.00% | 0.00% | 0 | 20.00% | 0.00% | 0 | 20.00% | ||||||||
| 1.16% | 197 | 55.97% | 2.87% | 311 | 49.13% | 2.87% | 408 | 45.99% | ||||||||
| - | 0 | - | - | 0 | - | - | 0 | - | ||||||||
| - | 0 | - | - | 0 | - | - | 0 | - | ||||||||
| 2.95% | 448 | 58.90% | 4.44% | 738 | 54.41% | 4.32% | 991 | 52.52% | ||||||||
| 1.03% | 38 | 35.15% | 2.47% | 63 | 31.19% | 2.42% | 82 | 28.84% | ||||||||
| 1.65% | 22 | 47.39% | 3.95% | 41 | 46.99% | 3.88% | 55 | 43.89% | ||||||||
| 0.49% | 17 | 24.30% | 1.17% | 22 | 17.33% | 1.15% | 27 | 15.66% | ||||||||
| 3.82% | 108 | 68.82% | 5.50% | 182 | 64.69% | 5.32% | 246 | 62.84% | ||||||||
| 3.06% | 302 | 59.60% | 4.51% | 493 | 55.84% | 4.39% | 663 | 54.29% | ||||||||
| 1.70% | 15 | 47.17% | 2.74% | 23 | 42.89% | 2.69% | 30 | 41.36% | ||||||||
| 3.16% | 287 | 60.33% | 4.64% | 470 | 56.60% | 4.52% | 633 | 55.06% | ||||||||
| 0.00% | 0 | - | 0.00% | 0 | - | 0.00% | 0 | - | ||||||||
| 2.15% | 645 | 58.08% | 3.59% | 1,050 | 52.83% | 3.49% | 1,399 | 50.53% | ||||||||
LTV % (as of 31/12/2013)
| Exposure values (as of 31/12/2013) | |||||||||||||||||
| F-IRB | A-IRB | STA | ||||||||||||||||
(mln EUR, %)
| Non-defaulted | Defaulted | Non-defaulted | Defaulted | Non-defaulted | Defaulted | ||||||||||||
Turkey | Central banks and central governments | 0 | 0 | 121 | 0 | 4,756 | 0 | |||||||||||
Institutions | 0 | 0 | 39 | 0 | 1,098 | 0 | ||||||||||||
Corporates | 0 | 0 | 53 | 0 | 6,244 | 30 | ||||||||||||
Corporates - Of Which: Specialised Lending | 0 | 0 | 0 | 0 | 0 | 0 | ||||||||||||
Corporates - Of Which: SME | 0 | 0 | 0 | 0 | 605 | 0 | ||||||||||||
Retail | 0 | 0 | 0 | 0 | 5,185 | 48 | ||||||||||||
Retail - Secured on real estate property | 0.0 | % | 0 | 0 | 0 | 0 | 1,496 | 13 | ||||||||||
Retail - Secured on real estate property - Of | 0.0 | % | 0 | 0 | 0 | 0 | 600 | 5 | ||||||||||
Retail - Secured on real estate property - Of | 0.0 | % | 0 | 0 | 0 | 0 | 896 | 8 | ||||||||||
Retail - Qualifying Revolving | 0 | 0 | 0 | 0 | 1,266 | 10 | ||||||||||||
Retail - Other Retail | 0 | 0 | 0 | 0 | 2,422 | 26 | ||||||||||||
Retail - Other Retail - Of Which: SME | 0 | 0 | 0 | 0 | 891 | 13 | ||||||||||||
Retail - Other Retail - Of Which: non-SME | 0 | 0 | 0 | 0 | 1,531 | 13 | ||||||||||||
Equity | 53 | 0 | 0 | 0 | 0 | 0 | ||||||||||||
Securitisation | 0 | 0 | 0 | 0 | 0 | 0 | ||||||||||||
Other non-credit obligation assets | 0 | 0 | 0 | 0 | 976 | 18 | ||||||||||||
TOTAL | 53 | 0 | 214 | 0 | 18,258 | 95 | ||||||||||||
Securitisation and re-securitisations positions deducted from capital * | 0 | 0 | 0 | 0 | 0 | 0 | ||||||||||||
LTV % (as of
| Risk exposure amounts (as of 31/12/2013) | |||||||||||||||||
| F-IRB | A-IRB | STA | ||||||||||||||||
(mln EUR, %)
| Non-defaulted | Defaulted | Non-defaulted | Defaulted | Non-defaulted | Defaulted | ||||||||||||
Turkey | Central banks and central governments | 0 | 0 | 2 | 0 | 957 | 0 | |||||||||||
Institutions | 0 | 0 | 13 | 0 | 256 | 0 | ||||||||||||
Corporates | 0 | 0 | 27 | 0 | 6,240 | 32 | ||||||||||||
Corporates - Of Which: Specialised Lending | 0 | 0 | 0 | 0 | 0 | 0 | ||||||||||||
Corporates - Of Which: SME | 0 | 0 | 0 | 0 | 605 | 0 | ||||||||||||
Retail | 0 | 0 | 0 | 0 | 3,403 | 54 | ||||||||||||
Retail - Secured on real estate property | 0.0 | % | 0 | 0 | 0 | 0 | 614 | 14 | ||||||||||
Retail - Secured on real estate property - Of | 0.0 | % | 0 | 0 | 0 | 0 | 300 | 6 | ||||||||||
Retail - Secured on real estate property - Of | 0.0 | % | 0 | 0 | 0 | 0 | 314 | 8 | ||||||||||
Retail - Qualifying Revolving | 0 | 0 | 0 | 0 | 973 | 11 | ||||||||||||
Retail - Other Retail | 0 | 0 | 0 | 0 | 1,817 | 29 | ||||||||||||
Retail - Other Retail - Of Which: SME | 0 | 0 | 0 | 0 | 668 | 14 | ||||||||||||
Retail - Other Retail - Of Which: non-SME | 0 | 0 | 0 | 0 | 1,148 | 14 | ||||||||||||
Equity | 103 | 0 | 0 | 0 | 0 | 0 | ||||||||||||
Securitisation | 0 | 0 | 0 | 0 | 0 | 0 | ||||||||||||
Other non-credit obligation assets | 0 | 0 | 0 | 0 | 194 | 16 | ||||||||||||
TOTAL | 103 | 0 | 42 | 0 | 11,052 | 102 | ||||||||||||
Securitisation and re-securitisations positions deducted from capital * | ||||||||||||||||||
LTV % (as of
| Value adjustments and provisions (as of 31/12/2013) | |||||||||||||||||
| F-IRB | A-IRB | STA | ||||||||||||||||
(mln EUR, %)
| Non-defaulted | Defaulted | Non-defaulted | Defaulted | Non-defaulted | Defaulted | ||||||||||||
Turkey | Central banks and central governments | 0 | 0 | 0 | 0 | 0 | 0 | |||||||||||
Institutions | 0 | 0 | 0 | 0 | 0 | 0 | ||||||||||||
Corporates | 0 | 0 | 0 | 0 | 53 | 68 | ||||||||||||
Corporates - Of Which: Specialised Lending | 0 | 0 | 0 | 0 | 0 | 0 | ||||||||||||
Corporates - Of Which: SME | 0 | 0 | 0 | 0 | 0 | 0 | ||||||||||||
Retail | 0 | 0 | 0 | 0 | 85 | 108 | ||||||||||||
Retail - Secured on real estate property | 0.0 | % | 0 | 0 | 0 | 0 | 23 | 29 | ||||||||||
Retail - Secured on real estate property - Of | 0.0 | % | 0 | 0 | 0 | 0 | 9 | 11 | ||||||||||
Retail - Secured on real estate property - Of | 0.0 | % | 0 | 0 | 0 | 0 | 14 | 17 | ||||||||||
Retail - Qualifying Revolving | 0 | 0 | 0 | 0 | 17 | 22 | ||||||||||||
Retail - Other Retail | 0 | 0 | 0 | 0 | 46 | 58 | ||||||||||||
Retail - Other Retail - Of Which: SME | 0 | 0 | 0 | 0 | 23 | 29 | ||||||||||||
Retail - Other Retail - Of Which: non-SME | 0 | 0 | 0 | 0 | 23 | 29 | ||||||||||||
Equity | 0 | 0 | 0 | 0 | 0 | 0 | ||||||||||||
Securitisation | 0 | 0 | 0 | 0 | 0 | 0 | ||||||||||||
Other non-credit obligation assets | 0 | 0 | 0 | 0 | 0 | 0 | ||||||||||||
TOTAL | 0 | 0 | 0 | 0 | 139 | 176 | ||||||||||||
Securitisation and re-securitisations positions deducted from capital * | 0 | 0 | 0 | 0 | 0 | 0 | ||||||||||||
(*) Refers to the part of Securitization exposure that is deducted from capital and is not included in RWA
| Baseline Scenario | ||||||||||||||||
| as of 31/12/2014 | as of 31/12/2015 | as of 31/12/2016 | ||||||||||||||
| Impairment rate | Stock of Provisions | Coverage Ratio - Default | Impairment rate | Stock of Provisions | Coverage Ratio - Default | Impairment rate | Stock of Provisions | Coverage Ratio - Default | ||||||||
| - | 0 | - | - | 0 | - | - | 0 | - | ||||||||
| 0.01% | 0 | 1.00% | 0.01% | 0 | 1.05% | 0.01% | 0 | 1.03% | ||||||||
| 0.29% | 155 | 62.94% | 0.32% | 175 | 52.98% | 0.32% | 195 | 47.70% | ||||||||
| - | 0 | - | - | 0 | - | - | 0 | - | ||||||||
| - | 0 | - | - | 0 | - | - | 0 | - | ||||||||
| 0.80% | 247 | 55.69% | 0.81% | 287 | 48.04% | 0.78% | 326 | 44.26% | ||||||||
| 0.15% | 53 | 63.07% | 0.17% | 56 | 57.99% | 0.16% | 58 | 54.33% | ||||||||
| 0.15% | 21 | 63.07% | 0.17% | 22 | 57.99% | 0.16% | 23 | 54.33% | ||||||||
| 0.15% | 32 | 63.07% | 0.17% | 33 | 57.99% | 0.16% | 35 | 54.33% | ||||||||
| 0.50% | 49 | 61.85% | 0.52% | 56 | 53.02% | 0.52% | 62 | 48.29% | ||||||||
| 1.35% | 144 | 52.14% | 1.38% | 176 | 44.87% | 1.33% | 206 | 41.60% | ||||||||
| 0.17% | 60 | 81.03% | 0.19% | 62 | 75.68% | 0.18% | 64 | 71.46% | ||||||||
| 2.04% | 84 | 42.90% | 2.11% | 114 | 38.32% | 2.10% | 142 | 36.50% | ||||||||
| 0.00% | 0 | - | 0.00% | 0 | - | 0.00% | 0 | - | ||||||||
| 0.47% | 402 | 56.88% | 0.49% | 463 | 48.08% | 0.47% | 521 | 43.68% | ||||||||
| Adverse Scenario | ||||||||||||||||
| as of 31/12/2014 | as of 31/12/2015 | as of 31/12/2016 | ||||||||||||||
| Impairment rate | Stock of Provisions | Coverage Ratio - Default Stock | Impairment rate | Stock of Provisions | Coverage Ratio - Default | Impairment rate | Stock of Provisions | Coverage Ratio - Default | ||||||||
| - | 0 | - | - | 0 | - | - | 0 | - | ||||||||
| 0.01% | 0 | 1.00% | 0.01% | 0 | 1.03% | 0.01% | 0 | 1.02% | ||||||||
| 0.45% | 164 | 61.28% | 0.48% | 194 | 52.43% | 0.46% | 222 | 48.13% | ||||||||
| - | 0 | - | - | 0 | - | - | 0 | - | ||||||||
| - | 0 | - | - | 0 | - | - | 0 | - | ||||||||
| 1.05% | 260 | 56.83% | 1.06% | 313 | 50.24% | 1.00% | 362 | 47.11% | ||||||||
| 0.27% | 55 | 63.34% | 0.29% | 60 | 59.07% | 0.28% | 64 | 56.25% | ||||||||
| 0.27% | 22 | 63.34% | 0.29% | 24 | 59.07% | 0.28% | 26 | 56.25% | ||||||||
| 0.27% | 33 | 63.34% | 0.29% | 36 | 59.07% | 0.28% | 38 | 56.25% | ||||||||
| 0.66% | 51 | 62.32% | 0.68% | 59 | 54.42% | 0.66% | 68 | 50.36% | ||||||||
| 1.74% | 154 | 53.71% | 1.75% | 194 | 47.46% | 1.67% | 231 | 44.73% | ||||||||
| 0.25% | 61 | 80.17% | 0.27% | 63 | 74.56% | 0.26% | 66 | 70.43% | ||||||||
| 2.61% | 93 | 45.58% | 2.67% | 131 | 41.83% | 2.62% | 165 | 40.36% | ||||||||
| 0.00% | 0 | - | 0.00% | 0 | - | 0.00% | 0 | - | ||||||||
| 0.65% | 425 | 56.78% | 0.67% | 508 | 49.03% | 0.63% | 585 | 45.37% | ||||||||
 | 2014 EU-wide Stress Test Credit Risk |
LTV % (as of 31/12/2013)
| Exposure values (as of 31/12/2013) | |||||||||||||||||
| F-IRB | A-IRB | STA | ||||||||||||||||
(mln EUR, %)
| Non-defaulted | Defaulted | Non-defaulted | Defaulted | Non-defaulted | Defaulted | ||||||||||||
Peru | Central banks and central governments | 0 | 0 | 147 | 0 | 3,475 | 0 | |||||||||||
Institutions | 0 | 0 | 1 | 0 | 649 | 0 | ||||||||||||
Corporates | 0 | 0 | 337 | 0 | 4,331 | 11 | ||||||||||||
Corporates - Of Which: Specialised Lending | 0 | 0 | 181 | 0 | 0 | 0 | ||||||||||||
Corporates - Of Which: SME | 0 | 0 | 0 | 0 | 1,544 | 1 | ||||||||||||
Retail | 0 | 0 | 1 | 0 | 6,615 | 71 | ||||||||||||
Retail - Secured on real estate property | 0.0 | % | 0 | 0 | 1 | 0 | 2,697 | 0 | ||||||||||
Retail - Secured on real estate property - Of | 0.0 | % | 0 | 0 | 0 | 0 | 535 | �� | 0 | |||||||||
Retail - Secured on real estate property - Of | 0.0 | % | 0 | 0 | 1 | 0 | 2,162 | 0 | ||||||||||
Retail - Qualifying Revolving | 0 | 0 | 0 | 0 | 435 | 0 | ||||||||||||
Retail - Other Retail | 0 | 0 | 0 | 0 | 3,483 | 71 | ||||||||||||
Retail - Other Retail - Of Which: SME | 0 | 0 | 0 | 0 | 2,324 | 12 | ||||||||||||
Retail - Other Retail - Of Which: non-SME | 0 | 0 | 0 | 0 | 1,159 | 59 | ||||||||||||
Equity | 14 | 0 | 0 | 0 | 0 | 0 | ||||||||||||
Securitisation | 0 | 0 | 0 | 0 | 0 | 0 | ||||||||||||
Other non-credit obligation assets | 0 | 0 | 0 | 0 | 1,004 | 0 | ||||||||||||
TOTAL | 14 | 0 | 486 | 0 | 16,074 | 82 | ||||||||||||
Securitisation and re-securitisations positions deducted from capital * | 0 | 0 | 0 | 0 | 0 | 0 | ||||||||||||
LTV % (as of 31/12/2013)
| Risk exposure amounts (as of 31/12/2013) | |||||||||||||||||
| F-IRB | A-IRB | STA | ||||||||||||||||
(mln EUR, %)
| Non-defaulted | Defaulted | Non-defaulted | Defaulted | Non-defaulted | Defaulted | ||||||||||||
Peru | Central banks and central governments | 0 | 0 | 14 | 0 | 1,148 | 0 | |||||||||||
Institutions | 0 | 0 | 0 | 0 | 309 | 0 | ||||||||||||
Corporates | 0 | 0 | 180 | 0 | 4,328 | 11 | ||||||||||||
Corporates - Of Which: Specialised Lending | 0 | 0 | 127 | 0 | 0 | 0 | ||||||||||||
Corporates - Of Which: SME | 0 | 0 | 0 | 0 | 1,544 | 1 | ||||||||||||
Retail | 0 | 0 | 0 | 0 | 4,078 | 71 | ||||||||||||
Retail - Secured on real estate property | 0.0 | % | 0 | 0 | 0 | 0 | 1,139 | 0 | ||||||||||
Retail - Secured on real estate property - Of | 0.0 | % | 0 | 0 | 0 | 0 | 278 | 0 | ||||||||||
Retail - Secured on real estate property - Of | 0.0 | % | 0 | 0 | 0 | 0 | 861 | 0 | ||||||||||
Retail - Qualifying Revolving | 0 | 0 | 0 | 0 | 326 | 0 | ||||||||||||
Retail - Other Retail | 0 | 0 | 0 | 0 | 2,612 | 71 | ||||||||||||
Retail - Other Retail - Of Which: SME | 0 | 0 | 0 | 0 | 1,743 | 12 | ||||||||||||
Retail - Other Retail - Of Which: non-SME | 0 | 0 | 0 | 0 | 869 | 59 | ||||||||||||
Equity | 39 | 0 | 0 | 0 | 0 | 0 | ||||||||||||
Securitisation | 0 | 0 | 0 | 0 | 0 | 0 | ||||||||||||
Other non-credit obligation assets | 0 | 0 | 0 | 0 | 278 | 0 | ||||||||||||
TOTAL | 39 | 0 | 195 | 0 | 10,142 | 82 | ||||||||||||
Securitisation and re-securitisations positions deducted from capital * | ||||||||||||||||||
LTV % (as of 31/12/2013)
| Value adjustments and provisions (as of 31/12/2013)) | |||||||||||||||||
| F-IRB | A-IRB | STA | ||||||||||||||||
(mln EUR, %)
| Non-defaulted | Defaulted | Non-defaulted | Defaulted | Non-defaulted | Defaulted | ||||||||||||
Peru | Central banks and central governments | 0 | 0 | 0 | 0 | 6 | 0 | |||||||||||
Institutions | 0 | 0 | 0 | 0 | 5 | 0 | ||||||||||||
Corporates | 0 | 0 | 0 | 0 | 86 | 25 | ||||||||||||
Corporates - Of Which: Specialised Lending | 0 | 0 | 0 | 0 | 0 | 0 | ||||||||||||
Corporates - Of Which: SME | 0 | 0 | 0 | 0 | 31 | 3 | ||||||||||||
Retail | 0 | 0 | 0 | 0 | 165 | 155 | ||||||||||||
Retail - Secured on real estate property | 0.0 | % | 0 | 0 | 0 | 0 | 67 | 0 | ||||||||||
Retail - Secured on real estate property - Of | 0.0 | % | 0 | 0 | 0 | 0 | 13 | 0 | ||||||||||
Retail - Secured on real estate property - Of | 0.0 | % | 0 | 0 | 0 | 0 | 54 | 0 | ||||||||||
Retail - Qualifying Revolving | 0 | 0 | 0 | 0 | 11 | 0 | ||||||||||||
Retail - Other Retail | 0 | 0 | 0 | 0 | 87 | 155 | ||||||||||||
Retail - Other Retail - Of Which: SME | 0 | 0 | 0 | 0 | 58 | 27 | ||||||||||||
Retail - Other Retail - Of Which: non-SME | 0 | 0 | 0 | 0 | 29 | 129 | ||||||||||||
Equity | 0 | 0 | 0 | 0 | 0 | 0 | ||||||||||||
Securitisation | 0 | 0 | 0 | 0 | 0 | 0 | ||||||||||||
Other non-credit obligation assets | 0 | 0 | 0 | 0 | 0 | 0 | ||||||||||||
TOTAL | 0 | 0 | 1 | 0 | 261 | 181 | ||||||||||||
Securitisation and re-securitisations positions deducted from capital * | 0 | 0 | 0 | 0 | 0 | 0 | ||||||||||||
(*) Refers to the part of Securitization exposure that is deducted from capital and is not included in RWA
| Baseline Scenario | ||||||||||||||||
| as of 31/12/2014 | as of 31/12/2015 | as of 31/12/2016 | ||||||||||||||
| Impairment rate | Stock of Provisions | Coverage Ratio - Default Stock | Impairment rate | Stock of Provisions | Coverage Ratio - Default Stock | Impairment rate | Stock of Provisions | Coverage Ratio - Default Stock | ||||||||
| - | 0 | - | - | 0 | - | - | 0 | - | ||||||||
| 0.02% | 5 | 20.00% | 0.02% | 5 | 20.00% | 0.03% | 5 | 20.00% | ||||||||
| 0.04% | 115 | 58.62% | 0.03% | 117 | 52.00% | 0.05% | 119 | 45.43% | ||||||||
| - | 0 | - | - | 0 | - | - | 0 | - | ||||||||
| - | 0 | - | - | 0 | - | - | 0 | - | ||||||||
| 1.74% | 435 | 55.64% | 1.54% | 533 | 52.39% | 1.73% | 638 | 50.35% | ||||||||
| 0.18% | 72 | 15.13% | 0.14% | 76 | 15.16% | 0.19% | 81 | 15.24% | ||||||||
| 0.58% | 16 | 43.36% | 0.45% | 19 | 43.38% | 0.62% | 22 | 43.46% | ||||||||
| 0.08% | 56 | 8.15% | 0.06% | 57 | 8.18% | 0.09% | 59 | 8.26% | ||||||||
| 4.63% | 31 | 65.87% | 4.22% | 48 | 65.87% | 4.74% | 66 | 65.89% | ||||||||
| 2.59% | 332 | 58.48% | 2.35% | 409 | 55.23% | 2.66% | 492 | 53.39% | ||||||||
| 2.52% | 143 | 48.78% | 2.29% | 193 | 46.63% | 2.59% | 247 | 45.73% | ||||||||
| 2.72% | 189 | 65.66% | 2.46% | 216 | 64.05% | 2.80% | 245 | 62.87% | ||||||||
| 0.00% | 0 | - | 0.00% | 0 | - | 0.00% | 0 | - | ||||||||
| 0.98% | 555 | 55.86% | 0.85% | 655 | 52.30% | 0.95% | 763 | 49.94% | ||||||||
| Adverse Scenario | ||||||||||||||||
| as of 31/12/2014 | as of 31/12/2015 | as of 31/12/2016 | ||||||||||||||
| Impairment rate | Stock of Provisions | Coverage Stock | Impairment rate | Stock of Provisions | Coverage Ratio - Default Stock | Impairment rate | Stock of Provisions | Coverage Ratio - Default Stock | ||||||||
| - | 0 | - | - | 0 | - | - | 0 | - | ||||||||
| 0.05% | 5 | 20.00% | 0.21% | 8 | 31.96% | 0.03% | 8 | 30.87% | ||||||||
| 0.10% | 118 | 51.36% | 0.32% | 136 | 35.58% | 0.06% | 139 | 34.23% | ||||||||
| - | 0 | - | - | 0 | - | - | 0 | - | ||||||||
| - | 0 | - | - | 0 | - | - | 0 | - | ||||||||
| 2.14% | 462 | 53.67% | 3.10% | 676 | 49.18% | 1.73% | 775 | 48.38% | ||||||||
| 0.30% | 75 | 15.50% | 0.71% | 106 | 21.68% | 0.20% | 111 | 20.75% | ||||||||
| 0.94% | 18 | 43.71% | 2.23% | 37 | 61.06% | 0.62% | 40 | 58.40% | ||||||||
| 0.14% | 57 | 8.51% | 0.33% | 69 | 11.93% | 0.09% | 71 | 11.43% | ||||||||
| 5.54% | 35 | 65.97% | 7.72% | 72 | 73.84% | 4.75% | 89 | 72.02% | ||||||||
| 3.15% | 352 | 57.69% | 4.48% | 497 | 53.60% | 2.68% | 575 | 52.55% | ||||||||
| 3.06% | 156 | 48.32% | 4.33% | 249 | 45.96% | 2.61% | 299 | 45.51% | ||||||||
| 3.33% | 196 | 65.36% | 4.78% | 248 | 63.02% | 2.83% | 276 | 62.24% | ||||||||
| 0.00% | 0 | - | 0.00% | 0 | - | 0.00% | 0 | - | ||||||||
| 1.23% | 585 | 53.35% | 1.82% | 819 | 47.46% | 0.93% | 922 | 46.74% | ||||||||
LTV % (as of 31/12/2013)
| Exposure values (as of 31/12/2013) | |||||||||||||||||
| F-IRB | A-IRB | STA | ||||||||||||||||
(mln EUR, %)
| Non-defaulted | Defaulted | Non-defaulted | Defaulted | Non-defaulted | Defaulted | ||||||||||||
Chile | Central banks and central governments | 0 | 0 | 4 | 0 | 548 | 0 | |||||||||||
Institutions | 0 | 0 | 32 | 0 | 1,304 | 0 | ||||||||||||
Corporates | 0 | 0 | 306 | 0 | 4,752 | 38 | ||||||||||||
Corporates - Of Which: Specialised Lending | 0 | 0 | 51 | 0 | 0 | 0 | ||||||||||||
Corporates - Of Which: SME | 0 | 0 | 0 | 0 | 938 | 5 | ||||||||||||
Retail | 0 | 0 | 2 | 0 | 6,443 | 132 | ||||||||||||
Retail - Secured on real estate property | 0.0 | % | 0 | 0 | 2 | 0 | 3,885 | 91 | ||||||||||
Retail - Secured on real estate property - Of | 0.0 | % | 0 | 0 | 0 | 0 | 552 | 13 | ||||||||||
Retail - Secured on real estate property - Of | 0.0 | % | 0 | 0 | 2 | 0 | 3,333 | 78 | ||||||||||
Retail - Qualifying Revolving | 0 | 0 | 0 | 0 | 230 | 2 | ||||||||||||
Retail - Other Retail | 0 | 0 | 0 | 0 | 2,327 | 40 | ||||||||||||
Retail - Other Retail - Of Which: SME | 0 | 0 | 0 | 0 | 253 | 3 | ||||||||||||
Retail - Other Retail - Of Which: non-SME | 0 | 0 | 0 | 0 | 2,074 | 36 | ||||||||||||
Equity | 66 | 0 | 0 | 0 | 0 | 0 | ||||||||||||
Securitisation | 0 | 0 | 0 | 0 | 0 | 0 | ||||||||||||
Other non-credit obligation assets | 0 | 0 | 0 | 0 | 1,083 | 0 | ||||||||||||
TOTAL | 66 | 0 | 344 | 0 | 14,130 | 170 | ||||||||||||
Securitisation and re-securitisations positions deducted from capital * | 0 | 0 | 0 | 0 | 0 | 0 | ||||||||||||
LTV % (as of 31/12/2013)
| Risk exposure amounts (as of 31/12/2013) | |||||||||||||||||
| F-IRB | A-IRB | STA | ||||||||||||||||
(mln EUR, %)
| Non-defaulted | Defaulted | Non-defaulted | Defaulted | Non-defaulted | Defaulted | ||||||||||||
Chile | Central banks and central governments | 0 | 0 | 0 | 0 | 122 | 0 | |||||||||||
Institutions | 0 | 0 | 23 | 0 | 475 | 0 | ||||||||||||
Corporates | 0 | 0 | 158 | 0 | 4,535 | 42 | ||||||||||||
Corporates - Of Which: Specialised Lending | 0 | 0 | 36 | 0 | 0 | 0 | ||||||||||||
Corporates - Of Which: SME | 0 | 0 | 0 | 0 | 938 | 5 | ||||||||||||
Retail | 0 | 0 | 1 | 0 | 3,536 | 147 | ||||||||||||
Retail - Secured on real estate property | 0.0 | % | 0 | 0 | 1 | 0 | 1,619 | 101 | ||||||||||
Retail - Secured on real estate property - Of | 0.0 | % | 0 | 0 | 0 | 0 | 297 | 14 | ||||||||||
Retail - Secured on real estate property - Of | 0.0 | % | 0 | 0 | 1 | 0 | 1,321 | 87 | ||||||||||
Retail - Qualifying Revolving | 0 | 0 | 0 | 0 | 172 | 2 | ||||||||||||
Retail - Other Retail | 0 | 0 | 0 | 0 | 1,745 | 44 | ||||||||||||
Retail - Other Retail - Of Which: SME | 0 | 0 | 0 | 0 | 190 | 4 | ||||||||||||
Retail - Other Retail - Of Which: non-SME | 0 | 0 | 0 | 0 | 1,556 | 40 | ||||||||||||
Equity | 126 | 0 | 0 | 0 | 0 | 0 | ||||||||||||
Securitisation | 0 | 0 | 0 | 0 | 0 | 0 | ||||||||||||
Other non-credit obligation assets | 0 | 0 | 0 | 0 | 162 | 0 | ||||||||||||
TOTAL | 126 | 0 | 181 | 0 | 8,830 | 189 | ||||||||||||
Securitisation and re-securitisations positions deducted from capital * | ||||||||||||||||||
LTV % (as of 31/12/2013)
| Value adjustments and provisions (as of 31/12/2013) | |||||||||||||||||
| F-IRB | A-IRB | STA | ||||||||||||||||
(mln EUR, %)
| Non-defaulted | Defaulted | Non-defaulted | Defaulted | Non-defaulted | Defaulted | ||||||||||||
Chile | Central banks and central governments | 0 | 0 | 0 | 0 | 0 | 0 | |||||||||||
Institutions | 0 | 0 | 0 | 0 | 0 | 0 | ||||||||||||
Corporates | 0 | 0 | 1 | 0 | 83 | 29 | ||||||||||||
Corporates - Of Which: Specialised Lending | 0 | 0 | 0 | 0 | 0 | 0 | ||||||||||||
Corporates - Of Which: SME | 0 | 0 | 0 | 0 | 22 | 4 | ||||||||||||
Retail | 0 | 0 | 0 | 0 | 44 | 101 | ||||||||||||
Retail - Secured on real estate property | 0.0 | % | 0 | 0 | 0 | 0 | 44 | 70 | ||||||||||
Retail - Secured on real estate property - Of | 0.0 | % | 0 | 0 | 0 | 0 | 11 | 10 | ||||||||||
Retail - Secured on real estate property - Of | 0.0 | % | 0 | 0 | 0 | 0 | 33 | 60 | ||||||||||
Retail - Qualifying Revolving | 0 | 0 | 0 | 0 | 0 | 1 | ||||||||||||
Retail - Other Retail | 0 | 0 | 0 | 0 | 0 | 30 | ||||||||||||
Retail - Other Retail - Of Which: SME | 0 | 0 | 0 | 0 | 0 | 3 | ||||||||||||
Retail - Other Retail - Of Which: non-SME | 0 | 0 | 0 | 0 | 0 | 28 | ||||||||||||
Equity | 0 | 0 | 0 | 0 | 0 | 0 | ||||||||||||
Securitisation | 0 | 0 | 0 | 0 | 0 | 0 | ||||||||||||
Other non-credit obligation assets | 0 | 0 | 0 | 0 | 0 | 0 | ||||||||||||
TOTAL | 0 | 0 | 1 | 0 | 128 | 130 | ||||||||||||
Securitisation and re-securitisations positions deducted from capital * | 0 | 0 | 0 | 0 | 0 | 0 | ||||||||||||
(*) Refers to the part of Securitization exposure that is deducted from capital and is not included in RWA
| Baseline Scenario | ||||||||||||||||
| as of 31/12/2014 | as of 31/12/2015 | as of 31/12/2016 | ||||||||||||||
| Impairment rate | Stock of Provisions | Coverage Ratio - Default | Impairment rate | Stock of Provisions | Coverage Ratio - Default | Impairment rate | Stock of Provisions | Coverage Ratio - Default | ||||||||
| - | 0 | - | - | 0 | - | - | 0 | - | ||||||||
| 0.33% | 5 | 20.00% | 0.26% | 8 | 20.00% | 0.23% | 11 | 20.00% | ||||||||
| 1.28% | 185 | 68.50% | 1.00% | 234 | 71.96% | 0.91% | 279 | 73.69% | ||||||||
| - | 0 | - | - | 0 | - | - | 0 | - | ||||||||
| - | 0 | - | - | 0 | - | - | 0 | - | ||||||||
| 1.86% | 270 | 41.50% | 1.68% | 373 | 41.14% | 1.57% | 465 | 40.99% | ||||||||
| 0.20% | 122 | 29.74% | 0.17% | 128 | 24.87% | 0.16% | 134 | 22.12% | ||||||||
| 0.71% | 25 | 37.63% | 0.61% | 28 | 35.95% | 0.57% | 31 | 35.04% | ||||||||
| 0.11% | 97 | 28.44% | 0.10% | 100 | 23.04% | 0.09% | 103 | 19.98% | ||||||||
| 5.88% | 15 | 58.35% | 5.43% | 26 | 58.87% | 5.27% | 36 | 59.07% | ||||||||
| 4.24% | 133 | 51.95% | 3.98% | 218 | 52.84% | 3.86% | 295 | 53.25% | ||||||||
| 2.28% | 8 | 32.11% | 2.23% | 14 | 31.47% | 2.17% | 18 | 31.27% | ||||||||
| 4.47% | 124 | 54.21% | 4.19% | 204 | 55.34% | 4.07% | 276 | 55.84% | ||||||||
| 0.00% | 0 | - | 0.00% | 0 | - | 0.00% | 0 | - | ||||||||
| 1.46% | 459 | 46.46% | 1.25% | 615 | 46.59% | 1.15% | 755 | 46.66% | ||||||||
| Adverse Scenario | ||||||||||||||||
| as of 31/12/2014 | as of 31/12/2015 | as of 31/12/2016 | ||||||||||||||
| Impairment rate | Stock of Provisions | Coverage Ratio - Default Stock | Impairment rate | Stock of Provisions | Coverage Ratio - Default | Impairment rate | Stock of Provisions | Coverage Ratio - Default | ||||||||
| - | 0 | - | - | 0 | - | - | 0 | - | ||||||||
| 0.35% | 5 | 20.00% | 0.41% | 11 | 21.66% | 0.85% | 22 | 20.83% | ||||||||
| 1.39% | 190 | 70.21% | 1.71% | 276 | 76.17% | 3.51% | 447 | 79.76% | ||||||||
| - | 0 | - | - | 0 | - �� | - | 0 | - | ||||||||
| - | 0 | - | - | 0 | - | - | 0 | - | ||||||||
| 2.18% | 290 | 44.54% | 2.53% | 445 | 45.46% | 3.33% | 638 | 43.99% | ||||||||
| 0.28% | 125 | 30.36% | 0.40% | 140 | 24.97% | 0.76% | 168 | 20.71% | ||||||||
| 1.09% | 27 | 42.31% | 1.62% | 36 | 45.04% | 3.07% | 52 | 47.23% | ||||||||
| 0.15% | 98 | 28.38% | 0.20% | 105 | 21.65% | 0.38% | 117 | 16.31% | ||||||||
| 6.01% | 15 | 58.53% | 6.40% | 29 | 59.15% | 8.19% | 44 | 59.41% | ||||||||
| 4.98% | 150 | 57.88% | 5.90% | 276 | 62.14% | 7.66% | 426 | 64.13% | ||||||||
| 3.29% | 11 | 41.34% | 4.39% | 21 | 45.48% | 5.67% | 33 | 47.34% | ||||||||
| 5.18% | 139 | 59.77% | 6.09% | 255 | 64.09% | 7.91% | 393 | 66.11% | ||||||||
| 0.00% | 0 | - | 0.00% | 0 | - | 0.00% | 0 | - | ||||||||
| 1.67% | 486 | 49.16% | 1.97% | 733 | 51.06% | 3.12% | 1,108 | 51.33% | ||||||||
LTV % (as of 31/12/2013)
| Exposure values (as of 31/12/2013) | |||||||||||||||||
| F-IRB | A-IRB | STA | ||||||||||||||||
(mln EUR, %)
| Non-defaulted | Defaulted | Non-defaulted | Defaulted | Non-defaulted | Defaulted | ||||||||||||
Colombia | Central banks and central governments | 0 | 0 | 0 | 0 | 1,586 | 3 | |||||||||||
Institutions | 0 | 0 | 61 | 0 | 631 | 0 | ||||||||||||
Corporates | 0 | 0 | 63 | 0 | 1,645 | 100 | ||||||||||||
Corporates - Of Which: Specialised Lending | 0 | 0 | 0 | 0 | 0 | 0 | ||||||||||||
Corporates - Of Which: SME | 0 | 0 | 0 | 0 | 83 | 67 | ||||||||||||
Retail | 0 | 0 | 2 | 0 | 6,899 | 11 | ||||||||||||
Retail - Secured on real estate property | 0.0 | % | 0 | 0 | 1 | 0 | 2,916 | 0 | ||||||||||
Retail - Secured on real estate property - Of | 0.0 | % | 0 | 0 | 0 | 0 | 391 | 0 | ||||||||||
Retail - Secured on real estate property - Of | 0.0 | % | 0 | 0 | 1 | 0 | 2,526 | 0 | ||||||||||
Retail - Qualifying Revolving | 0 | 0 | 0 | 0 | 404 | 0 | ||||||||||||
Retail - Other Retail | 0 | 0 | 1 | 0 | 3,579 | 11 | ||||||||||||
Retail - Other Retail - Of Which: SME | 0 | 0 | 0 | 0 | 731 | 11 | ||||||||||||
Retail - Other Retail - Of Which: non-SME | 0 | 0 | 1 | 0 | 2,848 | 0 | ||||||||||||
Equity | 138 | 0 | 0 | 0 | 0 | 0 | ||||||||||||
Securitisation | 0 | 0 | 0 | 0 | 0 | 0 | ||||||||||||
Other non-credit obligation assets | 0 | 0 | 0 | 0 | 1,045 | 0 | ||||||||||||
TOTAL | 138 | 0 | 125 | 0 | 11,805 | 114 | ||||||||||||
Securitisation and re-securitisations positions deducted from capital * | 0 | 0 | 0 | 0 | 0 | 0 | ||||||||||||
LTV % (as of 31/12/2013)
| Risk exposure amounts (as of 31/12/2013) | |||||||||||||||||
| F-IRB | A-IRB | STA | ||||||||||||||||
(mln EUR, %)
| Non-defaulted | Defaulted | Non-defaulted | Defaulted | Non-defaulted | Defaulted | ||||||||||||
Colombia | Central banks and central governments | 0 | 0 | 0 | 0 | 3 | 3 | |||||||||||
Institutions | 0 | 0 | 16 | 0 | 410 | 0 | ||||||||||||
Corporates | 0 | 0 | 26 | 0 | 1,645 | 102 | ||||||||||||
Corporates - Of Which: Specialised Lending | 0 | 0 | 0 | 0 | 0 | 0 | ||||||||||||
Corporates - Of Which: SME | 0 | 0 | 0 | 0 | 83 | 68 | ||||||||||||
Retail | 0 | 0 | 0 | 0 | 4,071 | 11 | ||||||||||||
Retail - Secured on real estate property | 0.0 | % | 0 | 0 | 0 | 0 | 1,084 | 0 | ||||||||||
Retail - Secured on real estate property - Of | 0.0 | % | 0 | 0 | 0 | 0 | 198 | 0 | ||||||||||
Retail - Secured on real estate property - Of | 0.0 | % | 0 | 0 | 0 | 0 | 886 | 0 | ||||||||||
Retail - Qualifying Revolving | 0 | 0 | 0 | 0 | 303 | 0 | ||||||||||||
Retail - Other Retail | 0 | 0 | 0 | 0 | 2,684 | 11 | ||||||||||||
Retail - Other Retail - Of Which: SME | 0 | 0 | 0 | 0 | 548 | 11 | ||||||||||||
Retail - Other Retail - Of Which: non-SME | 0 | 0 | 0 | 0 | 2,136 | 0 | ||||||||||||
Equity | 197 | 0 | 0 | 0 | 0 | 0 | ||||||||||||
Securitisation | 0 | 0 | 0 | 0 | 0 | 0 | ||||||||||||
Other non-credit obligation assets | 0 | 0 | 0 | 0 | 386 | 0 | ||||||||||||
TOTAL | 197 | 0 | 43 | 0 | 6,513 | 116 | ||||||||||||
Securitisation and re-securitisations positions deducted from capital * | ||||||||||||||||||
LTV % (as of 31/12/2013)
| Value adjustments and provisions (as of 31/12/2013) | |||||||||||||||||
| F-IRB | A-IRB | STA | ||||||||||||||||
(mln EUR, %)
| Non-defaulted | Defaulted | Non-defaulted | Defaulted | Non-defaulted | Defaulted | ||||||||||||
Colombia | Central banks and central governments | 0 | 0 | 0 | 0 | 6 | 2 | |||||||||||
Institutions | 0 | 0 | 0 | 0 | 0 | 0 | ||||||||||||
Corporates | 0 | 0 | 0 | 0 | 172 | 73 | ||||||||||||
Corporates - Of Which: Specialised Lending | 0 | 0 | 0 | 0 | 0 | 0 | ||||||||||||
Corporates - Of Which: SME | 0 | 0 | 0 | 0 | 0 | 0 | ||||||||||||
Retail | 0 | 0 | 0 | 0 | 54 | 8 | ||||||||||||
Retail - Secured on real estate property | 0.0 | % | 0 | 0 | 0 | 0 | 54 | 0 | ||||||||||
Retail - Secured on real estate property - Of | 0.0 | % | 0 | 0 | 0 | 0 | 8 | 0 | ||||||||||
Retail - Secured on real estate property - Of | 0.0 | % | 0 | 0 | 0 | 0 | 46 | 0 | ||||||||||
Retail - Qualifying Revolving | 0 | 0 | 0 | 0 | 0 | 0 | ||||||||||||
Retail - Other Retail | 0 | 0 | 0 | 0 | 0 | 8 | ||||||||||||
Retail - Other Retail - Of Which: SME | 0 | 0 | 0 | 0 | 0 | 8 | ||||||||||||
Retail - Other Retail - Of Which: non-SME | 0 | 0 | 0 | 0 | 0 | 0 | ||||||||||||
Equity | 0 | 0 | 0 | 0 | 0 | 0 | ||||||||||||
Securitisation | 0 | 0 | 0 | 0 | 0 | 0 | ||||||||||||
Other non-credit obligation assets | 0 | 0 | 0 | 0 | 0 | 0 | ||||||||||||
TOTAL | 0 | 0 | 0 | 0 | 233 | 82 | ||||||||||||
Securitisation and re-securitisations positions deducted from capital * | 0 | 0 | 0 | 0 | 0 | 0 | ||||||||||||
(*) Refers to the part of Securitization exposure that is deducted from capital and is not included in RWA
| Baseline Scenario | ||||||||||||||||
| as of 31/12/2014 | as of 31/12/2015 | as of 31/12/2016 | ||||||||||||||
| Impairment rate | Stock of Provisions | Coverage Ratio - Default | Impairment rate | Stock of Provisions | Coverage Ratio - Default | Impairment rate | Stock of Provisions | Coverage Ratio - Default | ||||||||
| - | 2 | 100.00% | - | 2 | 100.00% | - | 2 | 100.00% | ||||||||
| 0.15% | 1 | 20.00% | 0.17% | 2 | 21.51% | 0.18% | 4 | 20.96% | ||||||||
| 0.85% | 295 | 63.27% | 0.95% | 311 | 60.22% | 1.01% | 327 | 58.01% | ||||||||
| - | 0 | - | - | 0 | - | - | 0 | - | ||||||||
| - | 0 | - | - | 0 | - | - | 0 | - | ||||||||
| 1.62% | 180 | 43.88% | 1.69% | 294 | 42.83% | 1.72% | 403 | 42.18% | ||||||||
| 0.26% | 61 | 16.42% | 0.30% | 71 | 17.48% | 0.32% | 80 | 17.22% | ||||||||
| 0.74% | 11 | 43.86% | 0.84% | 14 | 46.41% | 0.90% | 18 | 45.55% | ||||||||
| 0.18% | 51 | 12.18% | 0.21% | 57 | 13.01% | 0.23% | 62 | 12.85% | ||||||||
| 4.56% | 18 | 57.40% | 4.79% | 36 | 57.42% | 4.92% | 53 | 57.47% | ||||||||
| 2.41% | 100 | 48.63% | 2.53% | 187 | 47.52% | 2.60% | 270 | 47.10% | ||||||||
| 3.41% | 39 | 51.92% | 3.58% | 63 | 48.54% | 3.67% | 86 | 47.25% | ||||||||
| 2.15% | 61 | 46.74% | 2.28% | 124 | 47.02% | 2.35% | 184 | 47.02% | ||||||||
| 0.00% | 0 | - | 0.00% | 0 | - | 0.00% | 0 | - | ||||||||
| 1.35% | 478 | 51.97% | 1.42% | 609 | 48.05% | 1.44% | 736 | 46.11% | ||||||||
| Adverse Scenario | ||||||||||||||||
| as of 31/12/2014 | as of 31/12/2015 | as of 31/12/2016 | ||||||||||||||
| Impairment rate | Stock of Provisions | Coverage Ratio - Default Stock | Impairment rate | Stock of Provisions | Coverage Ratio - Default | Impairment rate | Stock of Provisions | Coverage Ratio - Default | ||||||||
| - | 2 | 100.00% | - | 2 | 100.00% | - | 2 | 100.00% | ||||||||
| 0.15% | 1 | 20.00% | 0.59% | 8 | 31.64% | 0.33% | 10 | 28.17% | ||||||||
| 0.95% | 297 | 63.63% | 2.55% | 340 | 58.50% | 1.55% | 364 | 56.29% | ||||||||
| - | 0 | - | - | 0 | - | - | 0 | - | ||||||||
| - | 0 | - | - | 0 | - | - | 0 | - | ||||||||
| 1.86% | 196 | 48.27% | 3.05% | 464 | 52.46% | 2.14% | 595 | 48.48% | ||||||||
| 0.39% | 65 | 22.82% | 1.11% | 120 | 32.41% | 0.52% | 133 | 27.68% | ||||||||
| 0.83% | 11 | 46.51% | 2.48% | 27 | 68.88% | 1.45% | 32 | 61.35% | ||||||||
| 0.32% | 54 | 19.15% | 0.90% | 92 | 26.78% | 0.37% | 101 | 22.47% | ||||||||
| 4.94% | 20 | 61.00% | 7.46% | 55 | 70.46% | 5.88% | 75 | 66.63% | ||||||||
| 2.71% | 111 | 52.86% | 4.20% | 289 | 58.31% | 3.16% | 387 | 54.68% | ||||||||
| 3.68% | 41 | 53.81% | 5.44% | 78 | 49.84% | 4.34% | 103 | 48.25% | ||||||||
| 2.46% | 70 | 52.31% | 3.89% | 211 | 62.19% | 2.87% | 283 | 57.48% | ||||||||
| 0.00% | 0 | - | 0.00% | 0 | - | 0.00% | 0 | - | ||||||||
| 1.54% | 496 | 54.54% | 2.73% | 814 | 53.80% | 1.85% | 972 | 50.04% | ||||||||
LTV % (as of 31/12/2013)
| Exposure values (as of 31/12/2013) | |||||||||||||||||
| F-IRB | A-IRB | STA | ||||||||||||||||
(mln EUR, %)
| Non-defaulted | Defaulted | Non-defaulted | Defaulted | Non-defaulted | Defaulted | ||||||||||||
United Kingdom | Central banks and central governments | 0 | 0 | 38 | 0 | 0 | 0 | |||||||||||
Institutions | 0 | 0 | 17,818 | 0 | 0 | 0 | ||||||||||||
Corporates | 0 | 0 | 1,851 | 102 | 0 | 0 | ||||||||||||
Corporates - Of Which: Specialised Lending | 0 | 0 | 805 | 89 | 0 | 0 | ||||||||||||
Corporates - Of Which: SME | 0 | 0 | 4 | 0 | 0 | 0 | ||||||||||||
Retail | 0 | 0 | 172 | 7 | 0 | 0 | ||||||||||||
Retail - Secured on real estate property | 0.0 | % | 0 | 0 | 169 | 7 | 0 | 0 | ||||||||||
Retail - Secured on real estate property - Of | 0.0 | % | 0 | 0 | 4 | 0 | 0 | 0 | ||||||||||
Retail - Secured on real estate property - Of | 0.0 | % | 0 | 0 | 164 | 7 | 0 | 0 | ||||||||||
Retail - Qualifying Revolving | 0 | 0 | 1 | 0 | 0 | 0 | ||||||||||||
Retail - Other Retail | 0 | 0 | 2 | 0 | 0 | 0 | ||||||||||||
Retail - Other Retail - Of Which: SME | 0 | 0 | 0 | 0 | 0 | 0 | ||||||||||||
Retail - Other Retail - Of Which: non-SME | 0 | 0 | 2 | 0 | 0 | 0 | ||||||||||||
Equity | 68 | 0 | 0 | 0 | 0 | 0 | ||||||||||||
Securitisation | 0 | 0 | 0 | 0 | 0 | 0 | ||||||||||||
Other non-credit obligation assets | 0 | 0 | 0 | 0 | 0 | 0 | ||||||||||||
TOTAL | 68 | 0 | 19,878 | 110 | 0 | 0 | ||||||||||||
Securitisation and re-securitisations positions deducted from capital * | 0 | 0 | 0 | 0 | 0 | 0 | ||||||||||||
LTV % (as of 31/12/2013)
| Risk exposure amounts (as of 31/12/2013) | |||||||||||||||||
| F-IRB | A-IRB | STA | ||||||||||||||||
(mln EUR, %)
| Non-defaulted | Defaulted | Non-defaulted | Defaulted | Non-defaulted | Defaulted | ||||||||||||
United Kingdom | Central banks and central governments | 0 | 0 | 1 | 0 | 0 | 0 | |||||||||||
Institutions | 0 | 0 | 1,147 | 0 | 0 | 0 | ||||||||||||
Corporates | 0 | 0 | 954 | 13 | 0 | 0 | ||||||||||||
Corporates - Of Which: Specialised Lending | 0 | 0 | 604 | 0 | 0 | 0 | ||||||||||||
Corporates - Of Which: SME | 0 | 0 | 3 | 0 | 0 | 0 | ||||||||||||
Retail | 0 | 0 | 65 | 6 | 0 | 0 | ||||||||||||
Retail - Secured on real estate property | 0.0 | % | 0 | 0 | 64 | 6 | 0 | 0 | ||||||||||
Retail - Secured on real estate property - Of | 0.0 | % | 0 | 0 | 7 | 0 | 0 | 0 | ||||||||||
Retail - Secured on real estate property - Of | 0.0 | % | 0 | 0 | 57 | 6 | 0 | 0 | ||||||||||
Retail - Qualifying Revolving | 0 | 0 | 0 | 0 | 0 | 0 | ||||||||||||
Retail - Other Retail | 0 | 0 | 1 | 0 | 0 | 0 | ||||||||||||
Retail - Other Retail - Of Which: SME | 0 | 0 | 0 | 0 | 0 | 0 | ||||||||||||
Retail - Other Retail - Of Which: non-SME | 0 | 0 | 1 | 0 | 0 | 0 | ||||||||||||
Equity | 241 | 0 | 0 | 0 | 0 | 0 | ||||||||||||
Securitisation | 0 | 0 | 0 | 0 | 0 | 0 | ||||||||||||
Other non-credit obligation assets | 0 | 0 | 0 | 0 | 0 | 0 | ||||||||||||
TOTAL | 241 | 0 | 2,167 | 19 | 0 | 0 | ||||||||||||
Securitisation and re-securitisations positions deducted from capital * | ||||||||||||||||||
LTV % (as of 31/12/2013)
| Value adjustments and provisions (as of 31/12/2013) | |||||||||||||||||
| F-IRB | A-IRB | STA | ||||||||||||||||
(mln EUR, %)
| Non-defaulted | Defaulted | Non-defaulted | Defaulted | Non-defaulted | Defaulted | ||||||||||||
United Kingdom | Central banks and central governments | 0 | 0 | 0 | 0 | 0 | 0 | |||||||||||
Institutions | 0 | 0 | 0 | 0 | 0 | 0 | ||||||||||||
Corporates | 0 | 0 | 3 | 61 | 0 | 0 | ||||||||||||
Corporates - Of Which: Specialised Lending | 0 | 0 | 1 | 56 | 0 | 0 | ||||||||||||
Corporates - Of Which: SME | 0 | 0 | 0 | 0 | 0 | 0 | ||||||||||||
Retail | 0 | 0 | 0 | 1 | 0 | 0 | ||||||||||||
Retail - Secured on real estate property | 0.0 | % | 0 | 0 | 0 | 1 | 0 | 0 | ||||||||||
Retail - Secured on real estate property - Of | 0.0 | % | 0 | 0 | 0 | 0 | 0 | 0 | ||||||||||
Retail - Secured on real estate property - Of | 0.0 | % | 0 | 0 | 0 | 1 | 0 | 0 | ||||||||||
Retail - Qualifying Revolving | 0 | 0 | 0 | 0 | 0 | 0 | ||||||||||||
Retail - Other Retail | 0 | 0 | 0 | 0 | 0 | 0 | ||||||||||||
Retail - Other Retail - Of Which: SME | 0 | 0 | 0 | 0 | 0 | 0 | ||||||||||||
Retail - Other Retail - Of Which: non-SME | 0 | 0 | 0 | 0 | 0 | 0 | ||||||||||||
Equity | 0 | 0 | 0 | 0 | 0 | 0 | ||||||||||||
Securitisation | 0 | 0 | 0 | 0 | 0 | 0 | ||||||||||||
Other non-credit obligation assets | 0 | 0 | 0 | 0 | 0 | 0 | ||||||||||||
TOTAL | 0 | 0 | 3 | 63 | 0 | 0 | ||||||||||||
Securitisation and re-securitisations positions deducted from capital * | 0 | 0 | 0 | 0 | 0 | 0 | ||||||||||||
(*) Refers to the part of Securitization exposure that is deducted from capital and is not included in RWA
| Baseline Scenario | ||||||||||||||||
| as of 31/12/2014 | as of 31/12/2015 | as of 31/12/2016 | ||||||||||||||
| Impairment rate | Stock of Provisions | Coverage Ratio - Default | Impairment rate | Stock of Provisions | Coverage Ratio - Default | Impairment rate | Stock of Provisions | Coverage Ratio - Default | ||||||||
| - | 0 | - | - | 0 | - | - | 0 | - | ||||||||
| 0.00% | 0 | 1.00% | 0.00% | 0 | 1.07% | 0.00% | 1 | 1.05% | ||||||||
| 1.04% | 83 | 38.10% | 1.04% | 101 | 31.48% | 1.00% | 118 | 28.35% | ||||||||
| - | 0 | - | - | 0 | - | - | 0 | - | ||||||||
| - | 0 | - | - | 0 | - | - | 0 | - | ||||||||
| 0.25% | 2 | 15.83% | 0.23% | 2 | 14.21% | 0.22% | 3 | 13.29% | ||||||||
| 0.25% | 2 | 15.68% | 0.23% | 2 | 14.08% | 0.22% | 3 | 13.17% | ||||||||
| 1.42% | 0 | 8.22% | 1.34% | 0 | 8.22% | 1.34% | 0 | 8.22% | ||||||||
| 0.22% | 2 | 16.21% | 0.20% | 2 | 14.64% | 0.20% | 3 | 13.70% | ||||||||
| 0.17% | 0 | 63.08% | 0.17% | 0 | 61.72% | 0.19% | 0 | 60.67% | ||||||||
| 0.14% | 0 | 52.21% | 0.14% | 0 | 44.28% | 0.15% | 0 | 39.43% | ||||||||
| - | 0 | - | - | 0 | - | - | 0 | - | ||||||||
| 0.14% | 0 | 52.21% | 0.14% | 0 | 44.28% | 0.15% | 0 | 39.43% | ||||||||
| 0.00% | 0 | - | 0.00% | 0 | - | 0.00% | 0 | - | ||||||||
| 0.10% | 85 | 35.39% | 0.09% | 104 | 28.86% | 0.09% | 121 | 25.72% | ||||||||
| Adverse Scenario | ||||||||||||||||
| as of 31/12/2014 | as of 31/12/2015 | as of 31/12/2016 | ||||||||||||||
| Impairment rate | Stock of Provisions | Coverage Ratio - Default Stock | Impairment rate | Stock of Provisions | Coverage Ratio - Default | Impairment rate | Stock of Provisions | Coverage Ratio - Default | ||||||||
| - | 0 | - | - | 0 | - | - | 0 | - | ||||||||
| 0.00% | 0 | 1.00% | 0.00% | 1 | 1.20% | 0.00% | 1 | 1.12% | ||||||||
| 1.20% | 86 | 39.48% | 1.46% | 111 | 32.40% | 1.58% | 137 | 29.16% | ||||||||
| - | 0 | - | - | 0 | - | - | 0 | - | ||||||||
| - | 0 | - | - | 0 | - | - | 0 | - | ||||||||
| 0.65% | 3 | 18.51% | 0.91% | 4 | 17.95% | 1.12% | 6 | 17.70% | ||||||||
| 0.66% | 3 | 18.37% | 0.92% | 4 | 17.83% | 1.13% | 6 | 17.59% | ||||||||
| 3.28% | 0 | 14.90% | 4.09% | 0 | 14.90% | 4.67% | 0 | 14.90% | ||||||||
| 0.58% | 3 | 18.64% | 0.85% | 4 | 18.11% | 1.07% | 6 | 17.84% | ||||||||
| 0.35% | 0 | 64.53% | 0.57% | 0 | 64.05% | 0.74% | 0 | 63.77% | ||||||||
| 0.27% | 0 | 47.92% | 0.43% | 0 | 38.39% | 0.55% | 0 | 34.10% | ||||||||
| - | 0 | - | - | 0 | - | - | 0 | - | ||||||||
| 0.27% | 0 | 47.92% | 0.43% | 0 | 38.39% | 0.55% | 0 | 34.10% | ||||||||
| 0.00% | 0 | - | 0.00% | 0 | - | 0.00% | 0 | - | ||||||||
| 0.12% | 89 | 35.56% | 0.14% | 117 | 28.28% | 0.14% | 144 | 25.07% | ||||||||
LTV % (as of 31/12/2013)
| Exposure values (as of 31/12/2013) | |||||||||||||||||
| F-IRB | A-IRB | STA | ||||||||||||||||
(mln EUR, %)
| Non-defaulted | Defaulted | Non-defaulted | Defaulted | Non-defaulted | Defaulted | ||||||||||||
France | Central banks and central governments | 0 | 0 | 3 | 0 | 0 | 0 | |||||||||||
Institutions | 0 | 0 | 12,593 | 0 | 0 | 0 | ||||||||||||
Corporates | 0 | 0 | 4,581 | 7 | 0 | 0 | ||||||||||||
Corporates - Of Which: Specialised Lending | 0 | 0 | 1,442 | 0 | 0 | 0 | ||||||||||||
Corporates - Of Which: SME | 0 | 0 | 89 | 4 | 0 | 0 | ||||||||||||
Retail | 0 | 0 | 28 | 2 | 0 | 0 | ||||||||||||
Retail - Secured on real estate property | 0.0 | % | 0 | 0 | 26 | 2 | 0 | 0 | ||||||||||
Retail - Secured on real estate property - Of | 0.0 | % | 0 | 0 | 1 | 0 | 0 | 0 | ||||||||||
Retail - Secured on real estate property - Of | 0.0 | % | 0 | 0 | 25 | 2 | 0 | 0 | ||||||||||
Retail - Qualifying Revolving | 0 | 0 | 1 | 0 | 0 | 0 | ||||||||||||
Retail - Other Retail | 0 | 0 | 1 | 0 | 0 | 0 | ||||||||||||
Retail - Other Retail - Of Which: SME | 0 | 0 | 0 | 0 | 0 | 0 | ||||||||||||
Retail - Other Retail - Of Which: non-SME | 0 | 0 | 1 | 0 | 0 | 0 | ||||||||||||
Equity | 11 | 0 | 0 | 0 | 0 | 0 | ||||||||||||
Securitisation | 0 | 0 | 0 | 0 | 0 | 0 | ||||||||||||
Other non-credit obligation assets | 0 | 0 | 0 | 0 | 0 | 0 | ||||||||||||
TOTAL | 11 | 0 | 17,205 | 9 | 0 | 0 | ||||||||||||
Securitisation and re-securitisations positions deducted from capital * | 0 | 0 | 0 | 0 | 0 | 0 | ||||||||||||
LTV % (as of 31/12/2013)
| Risk exposure amounts (as of 31/12/2013) | |||||||||||||||||
| F-IRB | A-IRB | STA | ||||||||||||||||
(mln EUR, %)
| Non-defaulted | Defaulted | Non-defaulted | Defaulted | Non-defaulted | Defaulted | ||||||||||||
France | Central banks and central governments | 0 | 0 | 0 | 0 | 0 | 0 | |||||||||||
Institutions | 0 | 0 | 616 | 0 | 0 | 0 | ||||||||||||
Corporates | 0 | 0 | 2,395 | 6 | 0 | 0 | ||||||||||||
Corporates - Of Which: Specialised Lending | 0 | 0 | 1,066 | 0 | 0 | 0 | ||||||||||||
Corporates - Of Which: SME | 0 | 0 | 90 | 2 | 0 | 0 | ||||||||||||
Retail | 0 | 0 | 16 | 2 | 0 | 0 | ||||||||||||
Retail - Secured on real estate property | 0.0 | % | 0 | 0 | 15 | 1 | 0 | 0 | ||||||||||
Retail - Secured on real estate property - Of | 0.0 | % | 0 | 0 | 2 | 0 | 0 | 0 | ||||||||||
Retail - Secured on real estate property - Of | 0.0 | % | 0 | 0 | 13 | 1 | 0 | 0 | ||||||||||
Retail - Qualifying Revolving | 0 | 0 | 0 | 0 | 0 | 0 | ||||||||||||
Retail - Other Retail | 0 | 0 | 0 | 0 | 0 | 0 | ||||||||||||
Retail - Other Retail - Of Which: SME | 0 | 0 | 0 | 0 | 0 | 0 | ||||||||||||
Retail - Other Retail - Of Which: non-SME | 0 | 0 | 0 | 0 | 0 | 0 | ||||||||||||
Equity | 43 | 0 | 0 | 0 | 0 | 0 | ||||||||||||
Securitisation | 0 | 0 | 0 | 0 | 0 | 0 | ||||||||||||
Other non-credit obligation assets | 0 | 0 | 0 | 0 | 0 | 0 | ||||||||||||
TOTAL | 43 | 0 | 3,027 | 7 | 0 | 0 | ||||||||||||
Securitisation and re-securitisations positions deducted from capital * | ||||||||||||||||||
LTV % (as of 31/12/2013)
| Value adjustments and provisions (as of 31/12/2013) | |||||||||||||||||
| F-IRB | A-IRB | STA | ||||||||||||||||
(mln EUR, %)
| Non-defaulted | Defaulted | Non-defaulted | Defaulted | Non-defaulted | Defaulted | ||||||||||||
France | Central banks and central governments | 0 | 0 | 0 | 0 | 0 | 0 | |||||||||||
Institutions | 0 | 0 | 0 | 0 | 0 | 0 | ||||||||||||
Corporates | 0 | 0 | 5 | 3 | 0 | 0 | ||||||||||||
Corporates - Of Which: Specialised Lending | 0 | 0 | 2 | 0 | 0 | 0 | ||||||||||||
Corporates - Of Which: SME | 0 | 0 | 0 | 2 | 0 | 0 | ||||||||||||
Retail | 0 | 0 | 0 | 0 | 0 | 0 | ||||||||||||
Retail - Secured on real estate property | 0.0 | % | 0 | 0 | 0 | 0 | 0 | 0 | ||||||||||
Retail - Secured on real estate property - Of | 0.0 | % | 0 | 0 | 0 | 0 | 0 | 0 | ||||||||||
Retail - Secured on real estate property - Of | 0.0 | % | 0 | 0 | 0 | 0 | 0 | 0 | ||||||||||
Retail - Qualifying Revolving | 0 | 0 | 0 | 0 | 0 | 0 | ||||||||||||
Retail - Other Retail | 0 | 0 | 0 | 0 | 0 | 0 | ||||||||||||
Retail - Other Retail - Of Which: SME | 0 | 0 | 0 | 0 | 0 | 0 | ||||||||||||
Retail - Other Retail - Of Which: non-SME | 0 | 0 | 0 | 0 | 0 | 0 | ||||||||||||
Equity | 0 | 0 | 0 | 0 | 0 | 0 | ||||||||||||
Securitisation | 0 | 0 | 0 | 0 | 0 | 0 | ||||||||||||
Other non-credit obligation assets | 0 | 0 | 0 | 0 | 0 | 0 | ||||||||||||
TOTAL | 0 | 0 | 5 | 3 | 0 | 0 | ||||||||||||
Securitisation and re-securitisations positions deducted from capital * | 0 | 0 | 0 | 0 | 0 | 0 | ||||||||||||
(*) Refers to the part of Securitization exposure that is deducted from capital and is not included in RWA
| Baseline Scenario | ||||||||||||||||
| as of 31/12/2014 | as of 31/12/2015 | as of 31/12/2016 | ||||||||||||||
| Impairment rate | Stock of Provisions | Coverage Ratio - Default | Impairment rate | Stock of Provisions | Coverage Ratio - Default | Impairment rate | Stock of Provisions | Coverage Ratio - Default | ||||||||
| - | 0 | - | - | 0 | - | - | 0 | - | ||||||||
| 0.00% | 0 | 1.00% | 0.00% | 0 | 1.00% | 0.00% | 0 | 1.10% | ||||||||
| 0.45% | 29 | 44.96% | 0.45% | 49 | 44.83% | 0.60% | 76 | 44.78% | ||||||||
| - | 0 | - | - | 0 | - | - | 0 | - | ||||||||
| - | 0 | - | - | 0 | - | - | 0 | - | ||||||||
| 0.84% | 1 | 23.65% | 0.83% | 1 | 23.05% | 0.92% | 1 | 22.71% | ||||||||
| 0.57% | 1 | 21.02% | 0.59% | 1 | 19.95% | 0.64% | 1 | 19.29% | ||||||||
| 0.57% | 0 | 16.84% | 0.59% | 0 | 16.84% | 0.64% | 0 | 16.84% | ||||||||
| 0.57% | 1 | 21.09% | 0.59% | 1 | 20.03% | 0.64% | 1 | 19.37% | ||||||||
| 6.68% | 0 | 56.33% | 6.59% | 0 | 55.64% | 8.03% | 0 | 55.37% | ||||||||
| 1.77% | 0 | 44.74% | 1.74% | 0 | 39.65% | 2.20% | 0 | 36.38% | ||||||||
| - | 0 | - | - | 0 | - | - | 0 | - | ||||||||
| 1.77% | 0 | 44.74% | 1.74% | 0 | 39.65% | 2.20% | 0 | 36.38% | ||||||||
| 0.00% | 0 | - | 0.00% | 0 | - | 0.00% | 0 | - | ||||||||
| 0.12% | 30 | 39.26% | 0.12% | 51 | 39.02% | 0.16% | 78 | 37.45% | ||||||||
| Adverse Scenario | ||||||||||||||||
| as of 31/12/2014 | as of 31/12/2015 | as of 31/12/2016 | ||||||||||||||
| Impairment rate | Stock of Provisions | Coverage Ratio - Default Stock | Impairment rate | Stock of Provisions | Coverage Ratio - Default | Impairment rate | Stock of Provisions | Coverage Ratio - Default | ||||||||
| - | 0 | - | - | 0 | - | - | 0 | - | ||||||||
| 0.00% | 0 | 1.00% | 0.00% | 0 | 1.09% | 0.00% | 1 | 1.06% | ||||||||
| 0.68% | 40 | 50.89% | 0.88% | 86 | 56.11% | 1.14% | 137 | 54.21% | ||||||||
| - | 0 | - | - | 0 | - | - | 0 | - | ||||||||
| - | 0 | - | - | 0 | - | - | 0 | - | ||||||||
| 1.56% | 1 | 29.27% | 2.01% | 1 | 31.39% | 2.41% | 2 | 32.28% | ||||||||
| 1.21% | 1 | 26.44% | 1.64% | 1 | 28.31% | 2.05% | 2 | 29.30% | ||||||||
| 1.21% | 0 | 31.86% | 1.64% | 0 | 35.96% | 2.05% | 0 | 34.31% | ||||||||
| 1.21% | 1 | 26.34% | 1.64% | 1 | 28.10% | 2.05% | 2 | 29.13% | ||||||||
| 9.24% | 0 | 63.96% | 11.30% | 0 | 63.49% | 12.79% | 0 | 63.34% | ||||||||
| 2.53% | 0 | 44.93% | 3.20% | 0 | 39.76% | 3.71% | 0 | 37.24% | ||||||||
| - | 0 | - | - | 0 | - | - | 0 | - | ||||||||
| 2.53% | 0 | 44.93% | 3.20% | 0 | 39.76% | 3.71% | 0 | 37.24% | ||||||||
| 0.00% | 0 | - | 0.00% | 0 | - | 0.00% | 0 | - | ||||||||
| 0.19% | 41 | 40.75% | 0.24% | 88 | 44.76% | 0.30% | 140 | 44.08% | ||||||||
 |
2014 EU-wide Stress Test
P&L |
| 31/12/2013 | Baseline Scenario | Adverse Scenario | ||||||||||||
| (mln EUR) |
31/12/2014
|
31/12/2015
|
31/12/2016
|
31/12/2014
|
31/12/2015
|
31/12/2016
| ||||||||
Net interest income | 14,613 | 14,279 | 13,433 | 13,637 | 14,613 | 13,166 | 12,586 | |||||||
Net trading income | -171 | 155 | 318 | -395 | 21 | 229 | ||||||||
of which trading losses from stress scenarios | -815 | -489 | -326 | -1,040 | -624 | -416 | ||||||||
Other operating income | -699 | -701 | -763 | -890 | -704 | -814 | -949 | |||||||
Operating profit before impairments | 9,266 | 6,994 | 6,414 | 6,657 | 6,907 | 5,785 | 5,289 | |||||||
Impairment of financial assets (-) | -6,705 | -6,590 | -2,342 | -2,072 | -7,752 | -4,555 | -3,534 | |||||||
Impairment of financial assets other than instruments designated at fair value through P&L (-) | -6,669 | -6,590 | -2,342 | -2,072 | -7,752 | -4,555 | -3,534 | |||||||
Impairment Financial assets designated at fair value through P&L (-) | -36 | 0 | 0 | 0 | 0 | 0 | 0 | |||||||
Impairment on non financial assets (-) | -1,043 | 0 | 0 | 0 | -20 | -12 | -8 | |||||||
Operating profit after impairments from stress scenarios | 1,518 | 403 | 4,072 | 4,585 | -865 | 1,218 | 1,748 | |||||||
Other Income and expenses | 544 | 930 | 926 | 928 | 930 | 926 | 928 | |||||||
Pre-Tax profit | 2,061 | 1,334 | 4,998 | 5,513 | 65 | 2,144 | 2,676 | |||||||
Tax | 244 | -400 | -1,499 | -1,654 | -20 | -643 | -803 | |||||||
Net income | 2,305 | 933 | 3,499 | 3,859 | 46 | 1,501 | 1,873 | |||||||
Attributable to owners of the parent | 1,552 | 295 | 3,001 | 3,365 | -499 | 1,275 | 1,666 | |||||||
of which carried over to capital through retained earnings | 819 | 200 | 1,703 | 1,614 | -499 | 954 | 1,248 | |||||||
of which distributed as dividends | 733 | 95 | 1,298 | 1,751 | 0 | 321 | 418 | |||||||
In the figures above, the original (official published) 2013 P&L figures may have been adjusted as part of the ECB Comprehensive Assessment join-up calculation.
| 2014 EU-wide Stress Test |

| RWA | Baseline Scenario | Adverse Scenario | ||||||||||||
| (mln EUR) |
as of 31/12/2013
| as of 31/12/2014
| as of 31/12/2015
| as of 31/12/2016
| as of 31/12/2014
| as of 31/12/2015
| as of 31/12/2016
| |||||||
Risk exposure amount for credit risk | 289,273 | 298,807 | 300,763 | 302,290 | 307,697 | 318,167 | 321,186 | |||||||
Risk exposure amount Securitisation and re-securitisations | 3,001 | 4,165 | 4,864 | 5,328 | 6,908 | 9,252 | 10,812 | |||||||
Risk exposure amount Other credit risk | 286,271 | 294,641 | 295,900 | 296,962 | 300,789 | 308,915 | 310,374 | |||||||
Risk exposure amount for market risk | 25,212 | 25,356 | 25,503 | 25,745 | 29,210 | 29,357 | 29,599 | |||||||
Risk exposure amount for operational risk | 30,256 | 30,256 | 30,256 | 30,256 | 30,256 | 30,256 | 30,256 | |||||||
Transitional floors for Risk exposure amount | 0 | 0 | 0 | 0 | 0 | 0 | 0 | |||||||
AQR adjustments (for SSM countries only) | 300 | 300 | 300 | 300 | 300 | 300 | 300 | |||||||
Total Risk exposure amount
| 345,041 | 354,719 | 356,823 | 358,592 | 367,463 | 378,080 | 381,341 | |||||||
| 2014 EU-wide Stress Test | |||||||||||||||
Securitisation | Baseline scenario | Adverse scenario | ||||||||||||||
| (mln EUR) |
as of 31/12/2013
| 31/12/2014
| 31/12/2015
| 31/12/2016
| 31/12/2014
| 31/12/2015
| 31/12/2016
| |||||||||
Exposure values | Banking Book | 5,619 | ||||||||||||||
Trading Book (excl. correlation trading positions under CRM) | 224 | |||||||||||||||
Correlation Trading Portfolio (CRM) | 0 | |||||||||||||||
Total | 5,844 | |||||||||||||||
Risk exposure values | Banking Book | 2,915 | 4,019 | 4,681 | 5,121 | 6,658 | 8,905 | 10,400 | ||||||||
Trading Book (excl. correlation trading positions under CRM) | 86 | 147 | 183 | 207 | 249 | 347 | 412 | |||||||||
Total | 3,001 | 4,165 | 4,864 | 5,328 | 6,908 | 9,252 | 10,812 | |||||||||
Impairments | Hold to Maturity portfolio | 0 | 0 | 0 | 0 | 0 | 0 | 0 | ||||||||
Available for Sale portfolio | 542 | 556 | 562 | 571 | 568 | 606 | 665 | |||||||||
Held for trading portfolio | ||||||||||||||||
Total | 542 | 556 | 562 | 571 | 568 | 606 | 665 | |||||||||

 | 2014 EU-wide Stress Test - Sovereign Exposure |
| (mln EUR) |
VALUES AS OF 31/12/2013 | |||||||||||||
| Residual Maturity | Country / Region |
GROSS DIRECT LONG (1)
|
NET DIRECT POSITIONS (gross exposures (long) net of cash (1)
| |||||||||||
| of which: loans and advances | of which: AFS banking book |
of which: FVO
| of which: Financial (2) | |||||||||||
[ 0 - 3M [ | Austria | 2 | 0 | 2 | 0 | 0 | 2 | |||||||
[3M - 1Y [ | 1 | 0 | 1 | 0 | 0 | 1 | ||||||||
[ 1Y - 2Y [ | 0 | 0 | 0 | 0 | 0 | 0 | ||||||||
[ 2Y - 3Y [ | 6 | 0 | 6 | 4 | 0 | 1 | ||||||||
[3Y - 5Y [ | 0 | 0 | 0 | 0 | 0 | 0 | ||||||||
[5Y - 10Y [ | 7 | 0 | 1 | 0 | 0 | 1 | ||||||||
[10Y - more | 2 | 0 | 2 | 0 | 0 | 2 | ||||||||
Tot | 17 | 0 | 10 | 4 | 0 | 6 | ||||||||
[ 0 - 3M [ | Belgium | 3 | 0 | 3 | 0 | 0 | 3 | |||||||
[ 3M - 1Y [ | 96 | 0 | 17 | 4 | 0 | 14 | ||||||||
[ 1Y - 2Y [ | 115 | 0 | 108 | 19 | 0 | 89 | ||||||||
[ 2Y - 3Y [ | 7 | 0 | -47 | 0 | 0 | -47 | ||||||||
[3Y - 5Y [ | 44 | 0 | 37 | 15 | 0 | 22 | ||||||||
[5Y - 10Y [ | 11 | 0 | -80 | 0 | 0 | -80 | ||||||||
[10Y - more | 52 | 33 | 44 | 0 | 0 | 11 | ||||||||
Tot | 327 | 33 | 82 | 38 | 0 | 11 | ||||||||
[ 0 - 3M [ | Bulgaria | 0 | 0 | 0 | 0 | 0 | 0 | |||||||
[ 3M - 1Y [ | 0 | 0 | 0 | 0 | 0 | 0 | ||||||||
[ 1Y - 2Y [ | 0 | 0 | 0 | 0 | 0 | 0 | ||||||||
[ 2Y - 3Y [ | 0 | 0 | 0 | 0 | 0 | 0 | ||||||||
[3Y - 5Y [ | 0 | 0 | 0 | 0 | 0 | 0 | ||||||||
[5Y - 10Y [ | 0 | 0 | 0 | 0 | 0 | 0 | ||||||||
[10Y - more | 0 | 0 | 0 | 0 | 0 | 0 | ||||||||
Tot | 0 | 0 | 0 | 0 | 0 | 0 | ||||||||
[ 0 - 3M [ | Cyprus | 0 | 0 | 0 | 0 | 0 | 0 | |||||||
[ 3M - 1Y [ | 0 | 0 | 0 | 0 | 0 | 0 | ||||||||
[ 1Y - 2Y [ | 0 | 0 | 0 | 0 | 0 | 0 | ||||||||
[ 2Y - 3Y [ | 0 | 0 | 0 | 0 | 0 | 0 | ||||||||
[3Y - 5Y [ | 0 | 0 | 0 | 0 | 0 | 0 | ||||||||
[5Y - 10Y [ | 0 | 0 | 0 | 0 | 0 | 0 | ||||||||
[10Y - more | 0 | 0 | 0 | 0 | 0 | 0 | ||||||||
Tot | 0 | 0 | 0 | 0 | 0 | 0 | ||||||||
[ 0 - 3M [ | Czech Republic | 0 | 0 | 0 | 0 | 0 | 0 | |||||||
[ 3M - 1Y [ | 0 | 0 | 0 | 0 | 0 | 0 | ||||||||
[ 1Y - 2Y [ | 0 | 0 | 0 | 0 | 0 | 0 | ||||||||
[ 2Y - 3Y [ | 0 | 0 | 0 | 0 | 0 | 0 | ||||||||
[3Y - 5Y [ | 0 | 0 | 0 | 0 | 0 | 0 | ||||||||
[5Y - 10Y [ | 0 | 0 | 0 | 0 | 0 | 0 | ||||||||
[10Y - more | 0 | 0 | 0 | 0 | 0 | 0 | ||||||||
Tot | 0 | 0 | 0 | 0 | 0 | 0 | ||||||||
[ 0 - 3M [ | Denmark | 0 | 0 | 0 | 0 | 0 | 0 | |||||||
[ 3M - 1Y [ | 0 | 0 | 0 | 0 | 0 | 0 | ||||||||
[ 1Y - 2Y [ | 0 | 0 | 0 | 0 | 0 | 0 | ||||||||
[ 2Y - 3Y [ | 0 | 0 | 0 | 0 | 0 | 0 | ||||||||
[3Y - 5Y [ | 0 | 0 | 0 | 0 | 0 | 0 | ||||||||
[5Y - 10Y [ | 0 | 0 | 0 | 0 | 0 | 0 | ||||||||
[10Y - more | 0 | 0 | 0 | 0 | 0 | 0 | ||||||||
Tot | 0 | 0 | 0 | 0 | 0 | 0 | ||||||||
[ 0 - 3M [ | Estonia | 0 | 0 | 0 | 0 | 0 | 0 | |||||||
[ 3M - 1Y [ | 0 | 0 | 0 | 0 | 0 | 0 | ||||||||
[ 1Y - 2Y [ | 0 | 0 | 0 | 0 | 0 | 0 | ||||||||
[ 2Y - 3Y [ | 0 | 0 | 0 | 0 | 0 | 0 | ||||||||
[3Y - 5Y [ | 0 | 0 | 0 | 0 | 0 | 0 | ||||||||
[5Y - 10Y [ | 0 | 0 | 0 | 0 | 0 | 0 | ||||||||
[10Y - more | 0 | 0 | 0 | 0 | 0 | 0 | ||||||||
Tot | 0 | 0 | 0 | 0 | 0 | 0 | ||||||||
[ 0 - 3M [ | Finland | 0 | 0 | 0 | 0 | 0 | 0 | |||||||
[ 3M - 1Y [ | 0 | 0 | 0 | 0 | 0 | 0 | ||||||||
[ 1Y - 2Y [ | 0 | 0 | 0 | 0 | 0 | 0 | ||||||||
[ 2Y - 3Y [ | 0 | 0 | 0 | 0 | 0 | 0 | ||||||||
[3Y - 5Y [ | 0 | 0 | 0 | 0 | 0 | 0 | ||||||||
[5Y - 10Y [ | 0 | 0 | 0 | 0 | 0 | 0 | ||||||||
[10Y - more | 0 | 0 | 0 | 0 | 0 | 0 | ||||||||
Tot | 1 | 0 | 1 | 0 | 0 | 1 | ||||||||
[ 0 - 3M [ | France | 39 | 0 | 29 | 0 | 0 | 29 | |||||||
[ 3M - 1Y [ | 627 | 0 | 601 | 0 | 0 | 601 | ||||||||
[ 1Y - 2Y [ | 154 | 0 | 154 | 0 | 0 | 154 | ||||||||
[ 2Y - 3Y [ | 0 | 0 | -220 | 0 | 0 | -220 | ||||||||
[3Y - 5Y [ | 10 | 0 | -12 | 0 | 0 | -12 | ||||||||
[5Y - 10Y [ | 35 | 0 | -6 | 0 | 0 | -6 | ||||||||
[10Y - more | 10 | 0 | -3 | 0 | 0 | -3 | ||||||||
Tot | 874 | 0 | 543 | 0 | 0 | 543 | ||||||||
| (mln EUR) |
VALUES AS OF 31/12/2013 |
VALUES AS OF 31/12/2013 | ||||||||||||||||
| Residual Maturity | Country / Region |
DIRECT SOVEREIGN EXPOSURES IN
|
INDIRECT SOVEREIGN EXPOSURES (3) (on and off balance sheet)
| |||||||||||||||
Derivatives with
| Derivatives with
| Derivatives with
| Derivatives with
| |||||||||||||||
| Notional value | Fair-value at 31/12/2013 (+) | Notional value |
Fair-value at
| Notional value | Fair-value at 31/12/2013 (+) | Notional value | Fair-value at 31/12/2013 (-) | |||||||||||
[ 0 - 3M [ | Austria | 0 | 0 | 0 | 0 | 0 | 0 | 0 | 0 | |||||||||
[3M - 1Y [ | 0 | 0 | 0 | 0 | 3 | 0 | 4 | 0 | ||||||||||
[ 1Y - 2Y [ | 0 | 0 | 0 | 0 | 87 | 0 | 87 | 0 | ||||||||||
[ 2Y - 3Y [ | 0 | 0 | 0 | 0 | 15 | 0 | 7 | 0 | ||||||||||
[3Y - 5Y [ | 0 | 0 | 0 | 0 | 0 | 0 | 0 | 0 | ||||||||||
[5Y - 10Y [ | 0 | 0 | 0 | 0 | 0 | 0 | 0 | 0 | ||||||||||
[10Y - more | 0 | 0 | 0 | 0 | 0 | 0 | 0 | 0 | ||||||||||
Tot | 0 | 0 | 0 | 0 | 104 | 0 | 98 | 0 | ||||||||||
[ 0 - 3M [ | Belgium | 0 | 0 | 0 | 0 | 0 | 0 | 0 | 0 | |||||||||
[ 3M - 1Y [ | 0 | 0 | 0 | 0 | 1 | 0 | 1 | 0 | ||||||||||
[ 1Y - 2Y [ | 0 | 0 | 0 | 0 | 65 | 0 | 65 | 0 | ||||||||||
[ 2Y - 3Y [ | 0 | 0 | 0 | 0 | 22 | 0 | 22 | 0 | ||||||||||
[3Y - 5Y [ | 0 | 0 | 0 | 0 | 192 | 2 | 240 | -1 | ||||||||||
[5Y - 10Y [ | 0 | 0 | 0 | 0 | 532 | 14 | 597 | -7 | ||||||||||
[10Y - more | 0 | 0 | 0 | 0 | 0 | 0 | 0 | 0 | ||||||||||
Tot | 0 | 0 | 0 | 0 | 811 | 17 | 924 | -9 | ||||||||||
[ 0 - 3M [ | Bulgaria | 0 | 0 | 0 | 0 | 0 | 0 | 0 | 0 | |||||||||
[ 3M - 1Y [ | 0 | 0 | 0 | 0 | 0 | 0 | 0 | 0 | ||||||||||
[ 1Y - 2Y [ | 0 | 0 | 0 | 0 | 0 | 0 | 0 | 0 | ||||||||||
[ 2Y - 3Y [ | 0 | 0 | 0 | 0 | 0 | 0 | 0 | 0 | ||||||||||
[3Y - 5Y [ | 0 | 0 | 0 | 0 | 0 | 0 | 0 | 0 | ||||||||||
[5Y - 10Y [ | 0 | 0 | 0 | 0 | 0 | 0 | 0 | 0 | ||||||||||
[10Y - more | 0 | 0 | 0 | 0 | 0 | 0 | 0 | 0 | ||||||||||
Tot | 0 | 0 | 0 | 0 | 0 | 0 | 0 | 0 | ||||||||||
[ 0 - 3M [ | Cyprus | 0 | 0 | 0 | 0 | 0 | 0 | 0 | 0 | |||||||||
[ 3M - 1Y [ | 0 | 0 | 0 | 0 | 0 | 0 | 0 | 0 | ||||||||||
[ 1Y - 2Y [ | 0 | 0 | 0 | 0 | 0 | 0 | 0 | 0 | ||||||||||
[ 2Y - 3Y [ | 0 | 0 | 0 | 0 | 0 | 0 | 0 | 0 | ||||||||||
[3Y - 5Y [ | 0 | 0 | 0 | 0 | 0 | 0 | 0 | 0 | ||||||||||
[5Y - 10Y [ | 0 | 0 | 0 | 0 | 0 | 0 | 0 | 0 | ||||||||||
[10Y - more | 0 | 0 | 0 | 0 | 0 | 0 | 0 | 0 | ||||||||||
Tot | 0 | 0 | 0 | 0 | 0 | 0 | 0 | 0 | ||||||||||
[ 0 - 3M [ | Czech Republic | 0 | 0 | 0 | 0 | 0 | 0 | 0 | 0 | |||||||||
[ 3M - 1Y [ | 0 | 0 | 0 | 0 | 0 | 0 | 0 | 0 | ||||||||||
[ 1Y - 2Y [ | 0 | 0 | 0 | 0 | 0 | 0 | 0 | 0 | ||||||||||
[ 2Y - 3Y [ | 0 | 0 | 0 | 0 | 0 | 0 | 0 | 0 | ||||||||||
[3Y - 5Y [ | 0 | 0 | 0 | 0 | 0 | 0 | 0 | 0 | ||||||||||
[5Y - 10Y [ | 0 | 0 | 0 | 0 | 0 | 0 | 0 | 0 | ||||||||||
[10Y - more | 0 | 0 | 0 | 0 | 0 | 0 | 0 | 0 | ||||||||||
Tot | 0 | 0 | 0 | 0 | 0 | 0 | 0 | 0 | ||||||||||
[ 0 - 3M [ | Denmark | 0 | 0 | 0 | 0 | 0 | 0 | 0 | 0 | |||||||||
[ 3M - 1Y [ | 0 | 0 | 0 | 0 | 0 | 0 | 0 | 0 | ||||||||||
[ 1Y - 2Y [ | 0 | 0 | 0 | 0 | 0 | 0 | 0 | 0 | ||||||||||
[ 2Y - 3Y [ | 0 | 0 | 0 | 0 | 0 | 0 | 0 | 0 | ||||||||||
[3Y - 5Y [ | 0 | 0 | 0 | 0 | 0 | 0 | 0 | 0 | ||||||||||
[5Y - 10Y [ | 0 | 0 | 0 | 0 | 0 | 0 | 0 | 0 | ||||||||||
[10Y - more | 0 | 0 | 0 | 0 | 0 | 0 | 0 | 0 | ||||||||||
Tot | 0 | 0 | 0 | 0 | 0 | 0 | 0 | 0 | ||||||||||
[ 0 - 3M [ | Estonia | 0 | 0 | 0 | 0 | 0 | 0 | 0 | 0 | |||||||||
[ 3M - 1Y [ | 0 | 0 | 0 | 0 | 0 | 0 | 0 | 0 | ||||||||||
[ 1Y - 2Y [ | 0 | 0 | 0 | 0 | 0 | 0 | 0 | 0 | ||||||||||
[ 2Y - 3Y [ | 0 | 0 | 0 | 0 | 0 | 0 | 0 | 0 | ||||||||||
[3Y - 5Y [ | 0 | 0 | 0 | 0 | 0 | 0 | 0 | 0 | ||||||||||
[5Y - 10Y [ | 0 | 0 | 0 | 0 | 0 | 0 | 0 | 0 | ||||||||||
[10Y - more | 0 | 0 | 0 | 0 | 0 | 0 | 0 | 0 | ||||||||||
Tot | 0 | 0 | 0 | 0 | 0 | 0 | 0 | 0 | ||||||||||
[ 0 - 3M [ | Finland | 0 | 0 | 0 | 0 | 0 | 0 | 0 | 0 | |||||||||
[ 3M - 1Y [ | 0 | 0 | 0 | 0 | 0 | 0 | 0 | 0 | ||||||||||
[ 1Y - 2Y [ | 0 | 0 | 0 | 0 | 0 | 0 | 0 | 0 | ||||||||||
[ 2Y - 3Y [ | 0 | 0 | 0 | 0 | 22 | 0 | 22 | 0 | ||||||||||
[3Y - 5Y [ | 0 | 0 | 0 | 0 | 0 | 0 | 0 | 0 | ||||||||||
[5Y - 10Y [ | 0 | 0 | 0 | 0 | 0 | 0 | 0 | 0 | ||||||||||
[10Y - more | 0 | 0 | 0 | 0 | 0 | 0 | 0 | 0 | ||||||||||
Tot | 0 | 0 | 0 | 0 | 22 | 0 | 22 | 0 | ||||||||||
[ 0 - 3M [ | France | 0 | 0 | 0 | 0 | 47 | 0 | 44 | 0 | |||||||||
[ 3M - 1Y [ | 0 | 0 | 0 | 0 | 12 | 0 | 13 | 0 | ||||||||||
[ 1Y - 2Y [ | 0 | 0 | 0 | 0 | 183 | 0 | 246 | 0 | ||||||||||
[ 2Y - 3Y [ | 0 | 0 | 0 | 0 | 1 | 0 | 3 | 0 | ||||||||||
[3Y - 5Y [ | 0 | 0 | 0 | 0 | 65 | 1 | 123 | -1 | ||||||||||
[5Y - 10Y [ | 0 | 0 | 0 | 0 | 10 | 1 | 40 | -1 | ||||||||||
[10Y - more | 0 | 0 | 0 | 0 | 0 | 0 | 0 | 0 | ||||||||||
Tot | 0 | 0 | 0 | 0 | 318 | 2 | 468 | -2 | ||||||||||
| | 2014 EU-wide Stress Test - Sovereign Exposure |
| (mln EUR) |
VALUES AS OF 31/12/2013 | |||||||||||||
| Residual Maturity | Country / Region |
GROSS DIRECT LONG (1)
|
NET DIRECT POSITIONS (gross exposures (long) net of cash (1)
| |||||||||||
| of which: loans and advances | of which: AFS banking book |
of which: FVO
| of which: Financial (2) | |||||||||||
[ 0 - 3M [ | Germany | 41 | 0 | 39 | 0 | 0 | 39 | |||||||
[3M - 1Y [ | 612 | 0 | 578 | 0 | 0 | 578 | ||||||||
[ 1Y - 2Y [ | 6 | 0 | -412 | 0 | 0 | -412 | ||||||||
[ 2Y - 3Y [ | 94 | 0 | -30 | 0 | 0 | -30 | ||||||||
[3Y - 5Y [ | 42 | 0 | -9 | 0 | 0 | -9 | ||||||||
[5Y - 10Y [ | 247 | 0 | 136 | 0 | 0 | 136 | ||||||||
[10Y - more | 22 | 0 | 21 | 0 | 0 | 21 | ||||||||
Tot | 1,064 | 0 | 322 | 0 | 0 | 322 | ||||||||
[ 0 - 3M [ | Croatia | 0 | 0 | 0 | 0 | 0 | 0 | |||||||
[ 3M - 1Y [ | 0 | 0 | 0 | 0 | 0 | 0 | ||||||||
[ 1Y - 2Y [ | 0 | 0 | 0 | 0 | 0 | 0 | ||||||||
[ 2Y - 3Y [ | 0 | 0 | 0 | 0 | 0 | 0 | ||||||||
[3Y - 5Y [ | 0 | 0 | 0 | 0 | 0 | 0 | ||||||||
[5Y - 10Y [ | 0 | 0 | 0 | 0 | 0 | 0 | ||||||||
[10Y - more | 0 | 0 | 0 | 0 | 0 | 0 | ||||||||
Tot | 0 | 0 | 0 | 0 | 0 | 0 | ||||||||
[ 0 - 3M [ | Greece | 0 | 0 | 0 | 0 | 0 | 0 | |||||||
[ 3M - 1Y [ | 0 | 0 | 0 | 0 | 0 | 0 | ||||||||
[ 1Y - 2Y [ | 0 | 0 | 0 | 0 | 0 | 0 | ||||||||
[ 2Y - 3Y [ | 0 | 0 | 0 | 0 | 0 | 0 | ||||||||
[3Y - 5Y [ | 0 | 0 | 0 | 0 | 0 | 0 | ||||||||
[5Y - 10Y [ | 0 | 0 | 0 | 0 | 0 | 0 | ||||||||
[10Y - more | 0 | 0 | 0 | 0 | 0 | 0 | ||||||||
Tot | 0 | 0 | 0 | 0 | 0 | 0 | ||||||||
[ 0 - 3M [ | Hungary | 0 | 0 | 0 | 0 | 0 | 0 | |||||||
[ 3M - 1Y [ | 0 | 0 | 0 | 0 | 0 | 0 | ||||||||
[ 1Y - 2Y [ | 0 | 0 | 0 | 0 | 0 | 0 | ||||||||
[ 2Y - 3Y [ | 20 | 0 | 20 | 20 | 0 | 0 | ||||||||
[3Y - 5Y [ | 6 | 0 | 6 | 6 | 0 | 0 | ||||||||
[5Y - 10Y [ | 39 | 0 | 39 | 39 | 0 | 0 | ||||||||
[10Y - more | 0 | 0 | 0 | 0 | 0 | 0 | ||||||||
Tot | 65 | 0 | 65 | 65 | 0 | 0 | ||||||||
[ 0 - 3M [ | Iceland | 0 | 0 | 0 | 0 | 0 | 0 | |||||||
[ 3M - 1Y [ | 0 | 0 | 0 | 0 | 0 | 0 | ||||||||
[ 1Y - 2Y [ | 0 | 0 | 0 | 0 | 0 | 0 | ||||||||
[ 2Y - 3Y [ | 0 | 0 | 0 | 0 | 0 | 0 | ||||||||
[3Y - 5Y [ | 0 | 0 | 0 | 0 | 0 | 0 | ||||||||
[5Y - 10Y [ | 0 | 0 | 0 | 0 | 0 | 0 | ||||||||
[10Y - more | 0 | 0 | 0 | 0 | 0 | 0 | ||||||||
Tot | 0 | 0 | 0 | 0 | 0 | 0 | ||||||||
[ 0 - 3M [ | Ireland | 0 | 0 | 0 | 0 | 0 | 0 | |||||||
[ 3M - 1Y [ | 0 | 0 | 0 | 0 | 0 | 0 | ||||||||
[ 1Y - 2Y [ | 0 | 0 | 0 | 0 | 0 | 0 | ||||||||
[ 2Y - 3Y [ | 0 | 0 | 0 | 0 | 0 | 0 | ||||||||
[3Y - 5Y [ | 0 | 0 | 0 | 0 | 0 | 0 | ||||||||
[5Y - 10Y [ | 0 | 0 | 0 | 0 | 0 | 0 | ||||||||
[10Y - more | 0 | 0 | 0 | 0 | 0 | 0 | ||||||||
Tot | 0 | 0 | 0 | 0 | 0 | 0 | ||||||||
[ 0 - 3M [ | Italy | 71 | 6 | 47 | 0 | 0 | 41 | |||||||
[ 3M - 1Y [ | 275 | 0 | 228 | 6 | 0 | 222 | ||||||||
[ 1Y - 2Y [ | 495 | 4 | 220 | 359 | 0 | -143 | ||||||||
[ 2Y - 3Y [ | 1,121 | 4 | 1,019 | 1,117 | 0 | -102 | ||||||||
[3Y - 5Y [ | 495 | 0 | 454 | 426 | 0 | 29 | ||||||||
[5Y - 10Y [ | 500 | 77 | 295 | 283 | 0 | -64 | ||||||||
[10Y - more | 557 | 0 | 504 | 500 | 0 | 4 | ||||||||
Tot | 3,514 | 91 | 2,769 | 2,691 | 0 | -13 | ||||||||
[ 0 - 3M [ | Latvia | 0 | 0 | 0 | 0 | 0 | 0 | |||||||
[ 3M - 1Y [ | 0 | 0 | 0 | 0 | 0 | 0 | ||||||||
[ 1Y - 2Y [ | 0 | 0 | 0 | 0 | 0 | 0 | ||||||||
[ 2Y - 3Y [ | 0 | 0 | 0 | 0 | 0 | 0 | ||||||||
[3Y - 5Y [ | 0 | 0 | 0 | 0 | 0 | 0 | ||||||||
[5Y - 10Y [ | 0 | 0 | 0 | 0 | 0 | 0 | ||||||||
[10Y - more | 0 | 0 | 0 | 0 | 0 | 0 | ||||||||
Tot | 0 | 0 | 0 | 0 | 0 | 0 | ||||||||
[ 0 - 3M [ | Liechtenstein | 0 | 0 | 0 | 0 | 0 | 0 | |||||||
[ 3M - 1Y [ | 0 | 0 | 0 | 0 | 0 | 0 | ||||||||
[ 1Y - 2Y [ | 0 | 0 | 0 | 0 | 0 | 0 | ||||||||
[ 2Y - 3Y [ | 0 | 0 | 0 | 0 | 0 | 0 | ||||||||
[3Y - 5Y [ | 0 | 0 | 0 | 0 | 0 | 0 | ||||||||
[5Y - 10Y [ | 0 | 0 | 0 | 0 | 0 | 0 | ||||||||
[10Y - more | 0 | 0 | 0 | 0 | 0 | 0 | ||||||||
Tot | 0 | 0 | 0 | 0 | 0 | 0 | ||||||||
| (mln EUR) |
VALUES AS OF 31/12/2013 |
VALUES AS OF 31/12/2013 | ||||||||||||||||
| Residual Maturity | Country / Region |
DIRECT SOVEREIGN EXPOSURES IN
|
INDIRECT SOVEREIGN EXPOSURES (3) (on and off balance sheet)
| |||||||||||||||
Derivatives with
| Derivatives with
| Derivatives with
| Derivatives with
| |||||||||||||||
| Notional value | Fair-value at 31/12/2013 (+) | Notional value |
Fair-value at
| Notional value | Fair-value at 31/12/2013 (+) | Notional value | Fair-value at 31/12/2013 (-) | |||||||||||
[ 0 - 3M [ | Germany | 0 | 0 | 0 | 0 | 163 | 0 | 163 | 0 | |||||||||
[3M - 1Y [ | 0 | 0 | 0 | 0 | 0 | 0 | 0 | 0 | ||||||||||
[ 1Y - 2Y [ | 0 | 0 | 0 | 0 | 131 | 0 | 131 | 0 | ||||||||||
[ 2Y - 3Y [ | 0 | 0 | 0 | 0 | 0 | 0 | 0 | 0 | ||||||||||
[3Y - 5Y [ | 0 | 0 | 0 | 0 | 219 | 0 | 255 | -1 | ||||||||||
[5Y - 10Y [ | 0 | 0 | 0 | 0 | 0 | 0 | 0 | 0 | ||||||||||
[10Y - more | 0 | 0 | 0 | 0 | 0 | 0 | 0 | 0 | ||||||||||
Tot | 0 | 0 | 0 | 0 | 512 | 0 | 549 | -1 | ||||||||||
[ 0 - 3M [ | Croatia | 0 | 0 | 0 | 0 | 0 | 0 | 0 | 0 | |||||||||
[ 3M - 1Y [ | 0 | 0 | 0 | 0 | 0 | 0 | 0 | 0 | ||||||||||
[ 1Y - 2Y [ | 0 | 0 | 0 | 0 | 0 | 0 | 0 | 0 | ||||||||||
[ 2Y - 3Y [ | 0 | 0 | 0 | 0 | 0 | 0 | 0 | 0 | ||||||||||
[3Y - 5Y [ | 0 | 0 | 0 | 0 | 0 | 0 | 0 | 0 | ||||||||||
[5Y - 10Y [ | 0 | 0 | 0 | 0 | 0 | 0 | 0 | 0 | ||||||||||
[10Y - more | 0 | 0 | 0 | 0 | 0 | 0 | 0 | 0 | ||||||||||
Tot | 0 | 0 | 0 | 0 | 0 | 0 | 0 | 0 | ||||||||||
[ 0 - 3M [ | Greece | 0 | 0 | 0 | 0 | 0 | 0 | 0 | 0 | |||||||||
[ 3M - 1Y [ | 0 | 0 | 0 | 0 | 0 | 0 | 0 | 0 | ||||||||||
[ 1Y - 2Y [ | 0 | 0 | 0 | 0 | 0 | 0 | 0 | 0 | ||||||||||
[ 2Y - 3Y [ | 0 | 0 | 0 | 0 | 0 | 0 | 0 | 0 | ||||||||||
[3Y - 5Y [ | 0 | 0 | 0 | 0 | 0 | 0 | 0 | 0 | ||||||||||
[5Y - 10Y [ | 0 | 0 | 0 | 0 | 0 | 0 | 0 | 0 | ||||||||||
[10Y - more | 0 | 0 | 0 | 0 | 0 | 0 | 0 | 0 | ||||||||||
Tot | 0 | 0 | 0 | 0 | 0 | 0 | 0 | 0 | ||||||||||
[ 0 - 3M [ | Hungary | 0 | 0 | 0 | 0 | 0 | 0 | 0 | 0 | |||||||||
[ 3M - 1Y [ | 0 | 0 | 0 | 0 | 0 | 0 | 0 | 0 | ||||||||||
[ 1Y - 2Y [ | 0 | 0 | 0 | 0 | 1 | 0 | 3 | 0 | ||||||||||
[ 2Y - 3Y [ | 0 | 0 | 0 | 0 | 0 | 0 | 0 | 0 | ||||||||||
[3Y - 5Y [ | 0 | 0 | 0 | 0 | 0 | 0 | 0 | 0 | ||||||||||
[5Y - 10Y [ | 0 | 0 | 0 | 0 | 0 | 0 | 0 | 0 | ||||||||||
[10Y - more | 0 | 0 | 0 | 0 | 0 | 0 | 0 | 0 | ||||||||||
Tot | 0 | 0 | 0 | 0 | 1 | 0 | 3 | 0 | ||||||||||
[ 0 - 3M [ | Iceland | 0 | 0 | 0 | 0 | 0 | 0 | 0 | 0 | |||||||||
[ 3M - 1Y [ | 0 | 0 | 0 | 0 | 0 | 0 | 0 | 0 | ||||||||||
[ 1Y - 2Y [ | 0 | 0 | 0 | 0 | 0 | 0 | 0 | 0 | ||||||||||
[ 2Y - 3Y [ | 0 | 0 | 0 | 0 | 0 | 0 | 0 | 0 | ||||||||||
[3Y - 5Y [ | 0 | 0 | 0 | 0 | 0 | 0 | 0 | 0 | ||||||||||
[5Y - 10Y [ | 0 | 0 | 0 | 0 | 0 | 0 | 0 | 0 | ||||||||||
[10Y - more | 0 | 0 | 0 | 0 | 0 | 0 | 0 | 0 | ||||||||||
Tot | 0 | 0 | 0 | 0 | 0 | 0 | 0 | 0 | ||||||||||
[ 0 - 3M [ | Ireland | 0 | 0 | 0 | 0 | 11 | 0 | 11 | 0 | |||||||||
[ 3M - 1Y [ | 0 | 0 | 0 | 0 | 11 | 0 | 11 | 0 | ||||||||||
[ 1Y - 2Y [ | 0 | 0 | 0 | 0 | 0 | 0 | 0 | 0 | ||||||||||
[ 2Y - 3Y [ | 0 | 0 | 0 | 0 | 0 | 0 | 0 | 0 | ||||||||||
[3Y - 5Y [ | 0 | 0 | 0 | 0 | 0 | 0 | 0 | 0 | ||||||||||
[5Y - 10Y [ | 0 | 0 | 0 | 0 | 0 | 0 | 0 | 0 | ||||||||||
[10Y - more | 0 | 0 | 0 | 0 | 0 | 0 | 0 | 0 | ||||||||||
Tot | 0 | 0 | 0 | 0 | 22 | 0 | 22 | 0 | ||||||||||
[ 0 - 3M [ | Italy | 0 | 0 | 0 | 0 | 0 | 0 | 0 | 0 | |||||||||
[ 3M - 1Y [ | 0 | 0 | 0 | 0 | 8 | 0 | 7 | 0 | ||||||||||
[ 1Y - 2Y [ | 0 | 0 | 0 | 0 | 794 | 1 | 855 | -1 | ||||||||||
[ 2Y - 3Y [ | 0 | 0 | 0 | 0 | 216 | 0 | 197 | 0 | ||||||||||
[3Y - 5Y [ | 0 | 0 | 0 | 0 | 194 | 2 | 245 | -3 | ||||||||||
[5Y - 10Y [ | 0 | 0 | 0 | 0 | 325 | 15 | 392 | -20 | ||||||||||
[10Y - more | 0 | 0 | 0 | 0 | 21 | 1 | 54 | -1 | ||||||||||
Tot | 0 | 0 | 0 | 0 | 1,558 | 19 | 1,751 | -25 | ||||||||||
[ 0 - 3M [ | Latvia | 0 | 0 | 0 | 0 | 0 | 0 | 0 | 0 | |||||||||
[ 3M - 1Y [ | 0 | 0 | 0 | 0 | 0 | 0 | 0 | 0 | ||||||||||
[ 1Y - 2Y [ | 0 | 0 | 0 | 0 | 0 | 0 | 0 | 0 | ||||||||||
[ 2Y - 3Y [ | 0 | 0 | 0 | 0 | 0 | 0 | 0 | 0 | ||||||||||
[3Y - 5Y [ | 0 | 0 | 0 | 0 | 0 | 0 | 0 | 0 | ||||||||||
[5Y - 10Y [ | 0 | 0 | 0 | 0 | 0 | 0 | 0 | 0 | ||||||||||
[10Y - more | 0 | 0 | 0 | 0 | 0 | 0 | 0 | 0 | ||||||||||
Tot | 0 | 0 | 0 | 0 | 0 | 0 | 0 | 0 | ||||||||||
[ 0 - 3M [ | Liechtenstein | 0 | 0 | 0 | 0 | 0 | 0 | 0 | 0 | |||||||||
[ 3M - 1Y [ | 0 | 0 | 0 | 0 | 0 | 0 | 0 | 0 | ||||||||||
[ 1Y - 2Y [ | 0 | 0 | 0 | 0 | 0 | 0 | 0 | 0 | ||||||||||
[ 2Y - 3Y [ | 0 | 0 | 0 | 0 | 0 | 0 | 0 | 0 | ||||||||||
[3Y - 5Y [ | 0 | 0 | 0 | 0 | 0 | 0 | 0 | 0 | ||||||||||
[5Y - 10Y [ | 0 | 0 | 0 | 0 | 0 | 0 | 0 | 0 | ||||||||||
[10Y - more | 0 | 0 | 0 | 0 | 0 | 0 | 0 | 0 | ||||||||||
Tot | 0 | 0 | 0 | 0 | 0 | 0 | 0 | 0 | ||||||||||
 | 2014 EU-wide Stress Test - Sovereign Exposure |
| (mln EUR) |
VALUES AS OF 31/12/2013 | |||||||||||||
| Residual Maturity | Country / Region |
GROSS DIRECT LONG (1)
|
NET DIRECT POSITIONS (gross exposures (long) net of cash (1)
| |||||||||||
| of which: loans and advances | of which: AFS banking book |
of which: FVO
| of which: Financial (2) | |||||||||||
[ 0 - 3M [ | Lithuania | 0 | 0 | 0 | 0 | 0 | 0 | |||||||
[ 3M - 1Y [ | 0 | 0 | 0 | 0 | 0 | 0 | ||||||||
[ 1Y - 2Y [ | 0 | 0 | 0 | 0 | 0 | 0 | ||||||||
[ 2Y - 3Y [ | 0 | 0 | 0 | 0 | 0 | 0 | ||||||||
[3Y - 5Y [ | 0 | 0 | 0 | 0 | 0 | 0 | ||||||||
[5Y - 10Y [ | 0 | 0 | 0 | 0 | 0 | 0 | ||||||||
[10Y - more | 0 | 0 | 0 | 0 | 0 | 0 | ||||||||
Tot | 0 | 0 | 0 | 0 | 0 | 0 | ||||||||
[ 0 - 3M [ | Luxembourg | 0 | 0 | -28 | 0 | 0 | -28 | |||||||
[ 3M - 1Y [ | 0 | 0 | -1 | 0 | 0 | -1 | ||||||||
[ 1Y - 2Y [ | 0 | 0 | 0 | 0 | 0 | 0 | ||||||||
[ 2Y - 3Y [ | 0 | 0 | -3 | 0 | 0 | -3 | ||||||||
[3Y - 5Y [ | 0 | 0 | -19 | 0 | 0 | -19 | ||||||||
[5Y - 10Y [ | 0 | 0 | -89 | 0 | 0 | -89 | ||||||||
[10Y - more | 0 | 0 | -62 | 0 | 0 | -62 | ||||||||
Tot | 0 | 0 | -203 | 0 | 0 | -203 | ||||||||
[ 0 - 3M [ | Malta | 0 | 0 | 0 | 0 | 0 | 0 | |||||||
[ 3M - 1Y [ | 0 | 0 | 0 | 0 | 0 | 0 | ||||||||
[ 1Y - 2Y [ | 0 | 0 | 0 | 0 | 0 | 0 | ||||||||
[ 2Y - 3Y [ | 0 | 0 | 0 | 0 | 0 | 0 | ||||||||
[3Y - 5Y [ | 0 | 0 | 0 | 0 | 0 | 0 | ||||||||
[5Y - 10Y [ | 0 | 0 | 0 | 0 | 0 | 0 | ||||||||
[10Y - more | 0 | 0 | 0 | 0 | 0 | 0 | ||||||||
Tot | 0 | 0 | 0 | 0 | 0 | 0 | ||||||||
[ 0 - 3M [ | Netherlands | 15 | 0 | 1 | 4 | 0 | -3 | |||||||
[ 3M - 1Y [ | 1,046 | 0 | 1,012 | 0 | 0 | 1,012 | ||||||||
[ 1Y - 2Y [ | 3 | 0 | -105 | 0 | 0 | -105 | ||||||||
[ 2Y - 3Y [ | 61 | 0 | 23 | 0 | 0 | 23 | ||||||||
[3Y - 5Y [ | 4 | 0 | 2 | 0 | 0 | 2 | ||||||||
[5Y - 10Y [ | 11 | 0 | 6 | 2 | 0 | 3 | ||||||||
[10Y - more | 8 | 0 | -6 | 0 | 0 | -6 | ||||||||
Tot | 1,149 | 0 | 934 | 6 | 0 | 927 | ||||||||
[ 0 - 3M [ | Norway | 0 | 0 | 0 | 0 | 0 | 0 | |||||||
[ 3M - 1Y [ | 0 | 0 | 0 | 0 | 0 | 0 | ||||||||
[ 1Y - 2Y [ | 0 | 0 | 0 | 0 | 0 | 0 | ||||||||
[ 2Y - 3Y [ | 0 | 0 | 0 | 0 | 0 | 0 | ||||||||
[3Y - 5Y [ | 0 | 0 | 0 | 0 | 0 | 0 | ||||||||
[5Y - 10Y [ | 0 | 0 | 0 | 0 | 0 | 0 | ||||||||
[10Y - more | 0 | 0 | 0 | 0 | 0 | 0 | ||||||||
Tot | 0 | 0 | 0 | 0 | 0 | 0 | ||||||||
[ 0 - 3M [ | Poland | 0 | 0 | 0 | 0 | 0 | 0 | |||||||
[ 3M - 1Y [ | 11 | 0 | 11 | 11 | 0 | 0 | ||||||||
[ 1Y - 2Y [ | 4 | 0 | 4 | 4 | 0 | 0 | ||||||||
[ 2Y - 3Y [ | 77 | 0 | 77 | 77 | 0 | 0 | ||||||||
[3Y - 5Y [ | 0 | 0 | 0 | 0 | 0 | 0 | ||||||||
[5Y - 10Y [ | 90 | 0 | 90 | 90 | 0 | 0 | ||||||||
[10Y - more | 4 | 0 | 4 | 4 | 0 | 0 | ||||||||
Tot | 187 | 0 | 187 | 187 | 0 | 0 | ||||||||
[ 0 - 3M [ | Portugal | 0 | 0 | 0 | 0 | 0 | 0 | |||||||
[ 3M - 1Y [ | 320 | 302 | 320 | 0 | 0 | 18 | ||||||||
[ 1Y - 2Y [ | 6 | 0 | 6 | 0 | 0 | 6 | ||||||||
[ 2Y - 3Y [ | 7 | 0 | 2 | 0 | 0 | 2 | ||||||||
[3Y - 5Y [ | 5 | 0 | 5 | 0 | 0 | 5 | ||||||||
[5Y - 10Y [ | 41 | 0 | 40 | 19 | 0 | 21 | ||||||||
[10Y - more | 6 | 0 | 1 | 0 | 0 | 1 | ||||||||
Tot | 386 | 302 | 375 | 19 | 0 | 53 | ||||||||
[ 0 - 3M [ | Romania | 1 | 0 | 1 | 1 | 0 | 0 | |||||||
[ 3M - 1Y [ | 3 | 3 | 0 | 0 | 0 | 0 | ||||||||
[ 1Y - 2Y [ | 7 | 0 | 7 | 1 | 0 | 6 | ||||||||
[ 2Y - 3Y [ | 16 | 0 | 16 | 0 | 0 | 16 | ||||||||
[3Y - 5Y [ | 17 | 0 | 17 | 16 | 0 | 1 | ||||||||
[5Y - 10Y [ | 40 | 1 | 39 | 39 | 0 | 0 | ||||||||
[10Y - more | 0 | 0 | 0 | 0 | 0 | 0 | ||||||||
Tot | 83 | 4 | 79 | 57 | 0 | 23 | ||||||||
[ 0 - 3M [ | Slovakia | 0 | 0 | 0 | 0 | 0 | 0 | |||||||
[ 3M - 1Y [ | 0 | 0 | 0 | 0 | 0 | 0 | ||||||||
[ 1Y - 2Y [ | 0 | 0 | 0 | 0 | 0 | 0 | ||||||||
[ 2Y - 3Y [ | 0 | 0 | 0 | 0 | 0 | 0 | ||||||||
[3Y - 5Y [ | 0 | 0 | 0 | 0 | 0 | 0 | ||||||||
[5Y - 10Y [ | 0 | 0 | 0 | 0 | 0 | 0 | ||||||||
[10Y - more | 0 | 0 | 0 | 0 | 0 | 0 | ||||||||
Tot | 0 | 0 | 0 | 0 | 0 | 0 | ||||||||
| (mln EUR) |
VALUES AS OF 31/12/2013 |
VALUES AS OF 31/12/2013 | ||||||||||||||||
| Residual Maturity | Country / Region |
DIRECT SOVEREIGN EXPOSURES IN
|
INDIRECT SOVEREIGN EXPOSURES (3) (on and off balance sheet)
| |||||||||||||||
Derivatives with
| Derivatives with
| Derivatives with
| Derivatives with
| |||||||||||||||
| Notional value | Fair-value at 31/12/2013 (+) | Notional value |
Fair-value at
| Notional value | Fair-value at 31/12/2013 (+) | Notional value | Fair-value at 31/12/2013 (-) | |||||||||||
[ 0 - 3M [ | Lithuania | 0 | 0 | 0 | 0 | 0 | 0 | 0 | 0 | |||||||||
[ 3M - 1Y [ | 0 | 0 | 0 | 0 | 0 | 0 | 0 | 0 | ||||||||||
[ 1Y - 2Y [ | 0 | 0 | 0 | 0 | 0 | 0 | 0 | 0 | ||||||||||
[ 2Y - 3Y [ | 0 | 0 | 0 | 0 | 0 | 0 | 0 | 0 | ||||||||||
[3Y - 5Y [ | 0 | 0 | 0 | 0 | 0 | 0 | 0 | 0 | ||||||||||
[5Y - 10Y [ | 0 | 0 | 0 | 0 | 0 | 0 | 0 | 0 | ||||||||||
[10Y - more | 0 | 0 | 0 | 0 | 0 | 0 | 0 | 0 | ||||||||||
Tot | 0 | 0 | 0 | 0 | 0 | 0 | 0 | 0 | ||||||||||
[ 0 - 3M [ | Luxembourg | 0 | 0 | 0 | 0 | 0 | 0 | 0 | 0 | |||||||||
[ 3M - 1Y [ | 0 | 0 | 0 | 0 | 0 | 0 | 0 | 0 | ||||||||||
[ 1Y - 2Y [ | 0 | 0 | 0 | 0 | 0 | 0 | 0 | 0 | ||||||||||
[ 2Y - 3Y [ | 0 | 0 | 0 | 0 | 0 | 0 | 0 | 0 | ||||||||||
[3Y - 5Y [ | 0 | 0 | 0 | 0 | 0 | 0 | 0 | 0 | ||||||||||
[5Y - 10Y [ | 0 | 0 | 0 | 0 | 0 | 0 | 0 | 0 | ||||||||||
[10Y - more | 0 | 0 | 0 | 0 | 0 | 0 | 0 | 0 | ||||||||||
Tot | 0 | 0 | 0 | 0 | 0 | 0 | 0 | 0 | ||||||||||
[ 0 - 3M [ | Malta | 0 | 0 | 0 | 0 | 0 | 0 | 0 | 0 | |||||||||
[ 3M - 1Y [ | 0 | 0 | 0 | 0 | 0 | 0 | 0 | 0 | ||||||||||
[ 1Y - 2Y [ | 0 | 0 | 0 | 0 | 0 | 0 | 0 | 0 | ||||||||||
[ 2Y - 3Y [ | 0 | 0 | 0 | 0 | 0 | 0 | 0 | 0 | ||||||||||
[3Y - 5Y [ | 0 | 0 | 0 | 0 | 0 | 0 | 0 | 0 | ||||||||||
[5Y - 10Y [ | 0 | 0 | 0 | 0 | 0 | 0 | 0 | 0 | ||||||||||
[10Y - more | 0 | 0 | 0 | 0 | 0 | 0 | 0 | 0 | ||||||||||
Tot | 0 | 0 | 0 | 0 | 0 | 0 | 0 | 0 | ||||||||||
[ 0 - 3M [ | Netherlands | 0 | 0 | 0 | 0 | 0 | 0 | 0 | 0 | |||||||||
[ 3M - 1Y [ | 0 | 0 | 0 | 0 | 0 | 0 | 0 | 0 | ||||||||||
[ 1Y - 2Y [ | 0 | 0 | 0 | 0 | 0 | 0 | 0 | 0 | ||||||||||
[ 2Y - 3Y [ | 0 | 0 | 0 | 0 | 0 | 0 | 0 | 0 | ||||||||||
[3Y - 5Y [ | 0 | 0 | 0 | 0 | 73 | 0 | 207 | 0 | ||||||||||
[5Y - 10Y [ | 0 | 0 | 0 | 0 | 0 | 0 | 0 | 0 | ||||||||||
[10Y - more | 0 | 0 | 0 | 0 | 0 | 0 | 0 | 0 | ||||||||||
Tot | 0 | 0 | 0 | 0 | 73 | 0 | 207 | 0 | ||||||||||
[ 0 - 3M [ | Norway | 0 | 0 | 0 | 0 | 0 | 0 | 0 | 0 | |||||||||
[ 3M - 1Y [ | 0 | 0 | 0 | 0 | 0 | 0 | 0 | 0 | ||||||||||
[ 1Y - 2Y [ | 0 | 0 | 0 | 0 | 0 | 0 | 0 | 0 | ||||||||||
[ 2Y - 3Y [ | 0 | 0 | 0 | 0 | 0 | 0 | 0 | 0 | ||||||||||
[3Y - 5Y [ | 0 | 0 | 0 | 0 | 0 | 0 | 0 | 0 | ||||||||||
[5Y - 10Y [ | 0 | 0 | 0 | 0 | 0 | 0 | 0 | 0 | ||||||||||
[10Y - more | 0 | 0 | 0 | 0 | 0 | 0 | 0 | 0 | ||||||||||
Tot | 0 | 0 | 0 | 0 | 0 | 0 | 0 | 0 | ||||||||||
[ 0 - 3M [ | Poland | 0 | 0 | 0 | 0 | 0 | 0 | 0 | 0 | |||||||||
[ 3M - 1Y [ | 0 | 0 | 0 | 0 | 0 | 0 | 0 | 0 | ||||||||||
[ 1Y - 2Y [ | 0 | 0 | 0 | 0 | 0 | 0 | 0 | 0 | ||||||||||
[ 2Y - 3Y [ | 0 | 0 | 0 | 0 | 0 | 0 | 0 | 0 | ||||||||||
[3Y - 5Y [ | 0 | 0 | 0 | 0 | 0 | 0 | 0 | 0 | ||||||||||
[5Y - 10Y [ | 0 | 0 | 0 | 0 | 0 | 0 | 0 | 0 | ||||||||||
[10Y - more | 0 | 0 | 0 | 0 | 0 | 0 | 0 | 0 | ||||||||||
Tot | 0 | 0 | 0 | 0 | 0 | 0 | 0 | 0 | ||||||||||
[ 0 - 3M [ | Portugal | 0 | 0 | 0 | 0 | 0 | 0 | 0 | 0 | |||||||||
[ 3M - 1Y [ | 0 | 0 | 0 | 0 | 75 | 0 | 75 | 0 | ||||||||||
[ 1Y - 2Y [ | 0 | 0 | 0 | 0 | 33 | 0 | 33 | 0 | ||||||||||
[ 2Y - 3Y [ | 0 | 0 | 0 | 0 | 0 | 0 | 0 | 0 | ||||||||||
[3Y - 5Y [ | 0 | 0 | 0 | 0 | 75 | 3 | 75 | -3 | ||||||||||
[5Y - 10Y [ | 0 | 0 | 0 | 0 | 0 | 0 | 0 | 0 | ||||||||||
[10Y - more | 0 | 0 | 0 | 0 | 0 | 0 | 0 | 0 | ||||||||||
Tot | 0 | 0 | 0 | 0 | 183 | 3 | 183 | -3 | ||||||||||
[ 0 - 3M [ | Romania | 0 | 0 | 0 | 0 | 0 | 0 | 0 | 0 | |||||||||
[ 3M - 1Y [ | 0 | 0 | 0 | 0 | 0 | 0 | 0 | 0 | ||||||||||
[ 1Y - 2Y [ | 0 | 0 | 0 | 0 | 0 | 0 | 0 | 0 | ||||||||||
[ 2Y - 3Y [ | 0 | 0 | 0 | 0 | 0 | 0 | 0 | 0 | ||||||||||
[3Y - 5Y [ | 0 | 0 | 0 | 0 | 0 | 0 | 0 | 0 | ||||||||||
[5Y - 10Y [ | 0 | 0 | 0 | 0 | 0 | 0 | 0 | 0 | ||||||||||
[10Y - more | 0 | 0 | 0 | 0 | 0 | 0 | 0 | 0 | ||||||||||
Tot | 0 | 0 | 0 | 0 | 0 | 0 | 0 | 0 | ||||||||||
[ 0 - 3M [ | Slovakia | 0 | 0 | 0 | 0 | 0 | 0 | 0 | 0 | |||||||||
[ 3M - 1Y [ | 0 | 0 | 0 | 0 | 0 | 0 | 0 | 0 | ||||||||||
[ 1Y - 2Y [ | 0 | 0 | 0 | 0 | 0 | 0 | 0 | 0 | ||||||||||
[ 2Y - 3Y [ | 0 | 0 | 0 | 0 | 0 | 0 | 0 | 0 | ||||||||||
[3Y - 5Y [ | 0 | 0 | 0 | 0 | 0 | 0 | 0 | 0 | ||||||||||
[5Y - 10Y [ | 0 | 0 | 0 | 0 | 0 | 0 | 0 | 0 | ||||||||||
[10Y - more | 0 | 0 | 0 | 0 | 0 | 0 | 0 | 0 | ||||||||||
Tot | 0 | 0 | 0 | 0 | 0 | 0 | 0 | 0 | ||||||||||
 | 2014 EU-wide Stress Test - Sovereign Exposure |
| (mln EUR) |
VALUES AS OF 31/12/2013 | |||||||||||||
| Residual Maturity | Country / Region |
GROSS DIRECT LONG (1)
|
NET DIRECT POSITIONS (gross exposures (long) net of cash (1)
| |||||||||||
| of which: loans and advances | of which: AFS banking book |
of which: FVO
| of which: Financial (2) | |||||||||||
[ 0 - 3M [ | Slovenia | 0 | 0 | 0 | 0 | 0 | 0 | |||||||
[ 3M - 1Y [ | 0 | 0 | 0 | 0 | 0 | 0 | ||||||||
[ 1Y - 2Y [ | 0 | 0 | 0 | 0 | 0 | 0 | ||||||||
[ 2Y - 3Y [ | 0 | 0 | 0 | 0 | 0 | 0 | ||||||||
[3Y - 5Y [ | 0 | 0 | 0 | 0 | 0 | 0 | ||||||||
[5Y - 10Y [ | 0 | 0 | 0 | 0 | 0 | 0 | ||||||||
[10Y - more | 0 | 0 | 0 | 0 | 0 | 0 | ||||||||
Tot | 0 | 0 | 0 | 0 | 0 | 0 | ||||||||
[ 0 - 3M [ | Spain | 6,431 | 5,627 | 6,431 | 45 | 0 | 759 | |||||||
[ 3M - 1Y [ | 5,384 | 3,407 | 5,169 | 801 | 0 | 961 | ||||||||
[ 1Y - 2Y [ | 2,942 | 716 | 2,502 | 1,712 | 0 | 74 | ||||||||
[ 2Y - 3Y [ | 6,850 | 974 | 6,772 | 5,679 | 0 | 118 | ||||||||
[3Y - 5Y [ | 12,809 | 3,379 | 12,682 | 8,133 | 0 | 693 | ||||||||
[5Y - 10Y [ | 11,741 | 4,015 | 11,737 | 5,469 | 0 | 1,467 | ||||||||
[10Y - more | 6,861 | 4,048 | 6,498 | 2,501 | 0 | -51 | ||||||||
Tot | 53,019 | 22,165 | 51,791 | 24,339 | 0 | 4,022 | ||||||||
[ 0 - 3M [ | Sweden | 0 | 0 | 0 | 0 | 0 | 0 | |||||||
[ 3M - 1Y [ | 0 | 0 | 0 | 0 | 0 | 0 | ||||||||
[ 1Y - 2Y [ | 0 | 0 | 0 | 0 | 0 | 0 | ||||||||
[ 2Y - 3Y [ | 0 | 0 | 0 | 0 | 0 | 0 | ||||||||
[3Y - 5Y [ | 0 | 0 | 0 | 0 | 0 | 0 | ||||||||
[5Y - 10Y [ | 0 | 0 | 0 | 0 | 0 | 0 | ||||||||
[10Y - more | 0 | 0 | 0 | 0 | 0 | 0 | ||||||||
Tot | 0 | 0 | 0 | 0 | 0 | 0 | ||||||||
[ 0 - 3M [ | United Kingdom | 0 | 0 | 0 | 0 | 0 | 0 | |||||||
[ 3M - 1Y [ | 0 | 0 | 0 | 0 | 0 | 0 | ||||||||
[ 1Y - 2Y [ | 0 | 0 | 0 | 0 | 0 | 0 | ||||||||
[ 2Y - 3Y [ | 0 | 0 | 0 | 0 | 0 | 0 | ||||||||
[3Y - 5Y [ | 0 | 0 | 0 | 0 | 0 | 0 | ||||||||
[5Y - 10Y [ | 0 | 0 | 0 | 0 | 0 | 0 | ||||||||
[10Y - more | 0 | 0 | 0 | 0 | 0 | 0 | ||||||||
Tot | 0 | 0 | 0 | 0 | 0 | 0 | ||||||||
[ 0 - 3M [ | Australia | 0 | 0 | 0 | 0 | 0 | 0 | |||||||
[ 3M - 1Y [ | 0 | 0 | 0 | 0 | 0 | 0 | ||||||||
[ 1Y - 2Y [ | 0 | 0 | 0 | 0 | 0 | 0 | ||||||||
[ 2Y - 3Y [ | 0 | 0 | 0 | 0 | 0 | 0 | ||||||||
[3Y - 5Y [ | 0 | 0 | 0 | 0 | 0 | 0 | ||||||||
[5Y - 10Y [ | 0 | 0 | 0 | 0 | 0 | 0 | ||||||||
[10Y - more | 0 | 0 | 0 | 0 | 0 | 0 | ||||||||
Tot | 0 | 0 | 0 | 0 | 0 | 0 | ||||||||
[ 0 - 3M [ | Canada | 0 | 0 | 0 | 0 | 0 | 0 | |||||||
[ 3M - 1Y [ | 0 | 0 | 0 | 0 | 0 | 0 | ||||||||
[ 1Y - 2Y [ | 0 | 0 | 0 | 0 | 0 | 0 | ||||||||
[ 2Y - 3Y [ | 0 | 0 | 0 | 0 | 0 | 0 | ||||||||
[3Y - 5Y [ | 0 | 0 | 0 | 0 | 0 | 0 | ||||||||
[5Y - 10Y [ | 0 | 0 | 0 | 0 | 0 | 0 | ||||||||
[10Y - more | 8 | 0 | 8 | 8 | 0 | 0 | ||||||||
Tot | 8 | 0 | 8 | 8 | 0 | 0 | ||||||||
[ 0 - 3M [ | Hong Kong | 0 | 0 | 0 | 0 | 0 | 0 | |||||||
[ 3M - 1Y [ | 37 | 0 | 37 | 37 | 0 | 0 | ||||||||
[ 1Y - 2Y [ | 0 | 0 | 0 | 0 | 0 | 0 | ||||||||
[ 2Y - 3Y [ | 0 | 0 | 0 | 0 | 0 | 0 | ||||||||
[3Y - 5Y [ | 0 | 0 | 0 | 0 | 0 | 0 | ||||||||
[5Y - 10Y [ | 0 | 0 | 0 | 0 | 0 | 0 | ||||||||
[10Y - more | 0 | 0 | 0 | 0 | 0 | 0 | ||||||||
Tot | 37 | 0 | 37 | 37 | 0 | 0 | ||||||||
[ 0 - 3M [ | Japan | 0 | 0 | 0 | 0 | 0 | 0 | |||||||
[ 3M - 1Y [ | 0 | 0 | 0 | 0 | 0 | 0 | ||||||||
[ 1Y - 2Y [ | 0 | 0 | 0 | 0 | 0 | 0 | ||||||||
[ 2Y - 3Y [ | 0 | 0 | 0 | 0 | 0 | 0 | ||||||||
[3Y - 5Y [ | 0 | 0 | 0 | 0 | 0 | 0 | ||||||||
[5Y - 10Y [ | 0 | 0 | 0 | 0 | 0 | 0 | ||||||||
[10Y - more | 0 | 0 | 0 | 0 | 0 | 0 | ||||||||
Tot | 0 | 0 | 0 | 0 | 0 | 0 | ||||||||
[ 0 - 3M [ | U.S. | 471 | 0 | 471 | 80 | 0 | 391 | |||||||
[ 3M - 1Y [ | 19 | 0 | 19 | 19 | 0 | 0 | ||||||||
[ 1Y - 2Y [ | 2,204 | 2,059 | 2,197 | 141 | 0 | -5 | ||||||||
[ 2Y - 3Y [ | 19 | 0 | 11 | 19 | 0 | -8 | ||||||||
[3Y - 5Y [ | 87 | 0 | 47 | 20 | 0 | -25 | ||||||||
[5Y - 10Y [ | 352 | 0 | 338 | 155 | 0 | 21 | ||||||||
[10Y - more | 2,072 | 891 | 2,067 | 993 | 0 | 0 | ||||||||
Tot | 5,224 | 2,950 | 5,150 | 1,427 | 0 | 373 | ||||||||
| (mln EUR) |
VALUES AS OF 31/12/2013 |
VALUES AS OF 31/12/2013 | ||||||||||||||||
| Residual Maturity | Country / Region |
DIRECT SOVEREIGN EXPOSURES IN
|
INDIRECT SOVEREIGN EXPOSURES (3) (on and off balance sheet)
| |||||||||||||||
Derivatives with
| Derivatives with
| Derivatives with
| Derivatives with
| |||||||||||||||
| Notional value | Fair-value at 31/12/2013 (+) | Notional value |
Fair-value at
| Notional value | Fair-value at 31/12/2013 (+) | Notional value | Fair-value at 31/12/2013 (-) | |||||||||||
[ 0 - 3M [ | Slovenia | 0 | 0 | 0 | 0 | 0 | 0 | 0 | 0 | |||||||||
[ 3M - 1Y [ | 0 | 0 | 0 | 0 | 0 | 0 | 0 | 0 | ||||||||||
[ 1Y - 2Y [ | 0 | 0 | 0 | 0 | 0 | 0 | 0 | 0 | ||||||||||
[ 2Y - 3Y [ | 0 | 0 | 0 | 0 | 0 | 0 | 0 | 0 | ||||||||||
[3Y - 5Y [ | 0 | 0 | 0 | 0 | 0 | 0 | 0 | 0 | ||||||||||
[5Y - 10Y [ | 0 | 0 | 0 | 0 | 0 | 0 | 0 | 0 | ||||||||||
[10Y - more | 0 | 0 | 0 | 0 | 0 | 0 | 0 | 0 | ||||||||||
Tot | 0 | 0 | 0 | 0 | 0 | 0 | 0 | 0 | ||||||||||
[ 0 - 3M [ | Spain | 202 | 9 | 600 | -1 | 0 | 0 | 0 | 0 | |||||||||
[ 3M - 1Y [ | 231 | 2 | 71 | -2 | 0 | 0 | 0 | 0 | ||||||||||
[ 1Y - 2Y [ | 825 | 17 | 550 | -5 | 0 | 0 | 0 | 0 | ||||||||||
[ 2Y - 3Y [ | 271 | 8 | 44 | -3 | 0 | 0 | 0 | 0 | ||||||||||
[3Y - 5Y [ | 420 | 24 | 20 | 0 | 0 | 0 | 0 | 0 | ||||||||||
[5Y - 10Y [ | 904 | 76 | 512 | -29 | 0 | 0 | 0 | 0 | ||||||||||
[10Y - more | 966 | 170 | 75 | -8 | 173 | 0 | 48 | -25 | ||||||||||
Tot | 3,819 | 306 | 1,872 | -48 | 173 | 0 | 48 | -25 | ||||||||||
[ 0 - 3M [ | Sweden | 0 | 0 | 0 | 0 | 0 | 0 | 0 | 0 | |||||||||
[ 3M - 1Y [ | 0 | 0 | 0 | 0 | 0 | 0 | 0 | 0 | ||||||||||
[ 1Y - 2Y [ | 0 | 0 | 0 | 0 | 0 | 0 | 0 | 0 | ||||||||||
[ 2Y - 3Y [ | 0 | 0 | 0 | 0 | 0 | 0 | 0 | 0 | ||||||||||
[3Y - 5Y [ | 0 | 0 | 0 | 0 | 0 | 0 | 0 | 0 | ||||||||||
[5Y - 10Y [ | 0 | 0 | 0 | 0 | 0 | 0 | 0 | 0 | ||||||||||
[10Y - more | 0 | 0 | 0 | 0 | 0 | 0 | 0 | 0 | ||||||||||
Tot | 0 | 0 | 0 | 0 | 0 | 0 | 0 | 0 | ||||||||||
[ 0 - 3M [ | United Kingdom | 0 | 0 | 0 | 0 | 0 | 0 | 0 | 0 | |||||||||
[ 3M - 1Y [ | 9 | 9 | 41 | -22 | 0 | 0 | 0 | 0 | ||||||||||
[ 1Y - 2Y [ | 0 | 0 | 0 | 0 | 73 | 0 | 92 | 0 | ||||||||||
[ 2Y - 3Y [ | 0 | 0 | 0 | 0 | 0 | 0 | 0 | 0 | ||||||||||
[3Y - 5Y [ | 0 | 0 | 0 | 0 | 199 | 4 | 197 | -1 | ||||||||||
[5Y - 10Y [ | 0 | 0 | 0 | 0 | 0 | 0 | 0 | 0 | ||||||||||
[10Y - more | 0 | 0 | 0 | 0 | 0 | 0 | 0 | 0 | ||||||||||
Tot | 9 | 9 | 41 | -22 | 272 | 4 | 289 | -1 | ||||||||||
[ 0 - 3M [ | Australia | 0 | 0 | 0 | 0 | 0 | 0 | 0 | 0 | |||||||||
[ 3M - 1Y [ | 0 | 0 | 0 | 0 | 0 | 0 | 0 | 0 | ||||||||||
[ 1Y - 2Y [ | 0 | 0 | 0 | 0 | 28 | 0 | 55 | 0 | ||||||||||
[ 2Y - 3Y [ | 0 | 0 | 0 | 0 | 0 | 0 | 0 | 0 | ||||||||||
[3Y - 5Y [ | 0 | 0 | 0 | 0 | 80 | 2 | 78 | 0 | ||||||||||
[5Y - 10Y [ | 0 | 0 | 0 | 0 | 0 | 0 | 0 | 0 | ||||||||||
[10Y - more | 0 | 0 | 0 | 0 | 0 | 0 | 0 | 0 | ||||||||||
Tot | 0 | 0 | 0 | 0 | 107 | 2 | 133 | 0 | ||||||||||
[ 0 - 3M [ | Canada | 0 | 0 | 0 | 0 | 0 | 0 | 0 | 0 | |||||||||
[ 3M - 1Y [ | 0 | 0 | 0 | 0 | 0 | 0 | 0 | 0 | ||||||||||
[ 1Y - 2Y [ | 0 | 0 | 0 | 0 | 0 | 0 | 0 | 0 | ||||||||||
[ 2Y - 3Y [ | 0 | 0 | 0 | 0 | 0 | 0 | 0 | 0 | ||||||||||
[3Y - 5Y [ | 0 | 0 | 0 | 0 | 0 | 0 | 0 | 0 | ||||||||||
[5Y - 10Y [ | 0 | 0 | 0 | 0 | 0 | 0 | 0 | 0 | ||||||||||
[10Y - more | 0 | 0 | 0 | 0 | 0 | 0 | 0 | 0 | ||||||||||
Tot | 0 | 0 | 0 | 0 | 0 | 0 | 0 | 0 | ||||||||||
[ 0 - 3M [ | Hong Kong | 0 | 0 | 0 | 0 | 0 | 0 | 0 | 0 | |||||||||
[ 3M - 1Y [ | 0 | 0 | 0 | 0 | 0 | 0 | 0 | 0 | ||||||||||
[ 1Y - 2Y [ | 0 | 0 | 0 | 0 | 0 | 0 | 0 | 0 | ||||||||||
[ 2Y - 3Y [ | 0 | 0 | 0 | 0 | 0 | 0 | 0 | 0 | ||||||||||
[3Y - 5Y [ | 0 | 0 | 0 | 0 | 0 | 0 | 0 | 0 | ||||||||||
[5Y - 10Y [ | 0 | 0 | 0 | 0 | 0 | 0 | 0 | 0 | ||||||||||
[10Y - more | 0 | 0 | 0 | 0 | 0 | 0 | 0 | 0 | ||||||||||
Tot | 0 | 0 | 0 | 0 | 0 | 0 | 0 | 0 | ||||||||||
[ 0 - 3M [ | Japan | 0 | 0 | 0 | 0 | 0 | 0 | 0 | 0 | |||||||||
[ 3M - 1Y [ | 0 | 0 | 0 | 0 | 0 | 0 | 0 | 0 | ||||||||||
[ 1Y - 2Y [ | 0 | 0 | 0 | 0 | 20 | 0 | 39 | 0 | ||||||||||
[ 2Y - 3Y [ | 0 | 0 | 0 | 0 | 0 | 0 | 0 | 0 | ||||||||||
[3Y - 5Y [ | 0 | 0 | 0 | 0 | 39 | 1 | 38 | 0 | ||||||||||
[5Y - 10Y [ | 0 | 0 | 0 | 0 | 0 | 0 | 0 | 0 | ||||||||||
[10Y - more | 0 | 0 | 0 | 0 | 0 | 0 | 0 | 0 | ||||||||||
Tot | 0 | 0 | 0 | 0 | 59 | 1 | 77 | 0 | ||||||||||
[ 0 - 3M [ | U.S. | 0 | 0 | 0 | 0 | 0 | 0 | 0 | 0 | |||||||||
[ 3M - 1Y [ | 0 | 0 | 0 | 0 | 0 | 0 | 0 | 0 | ||||||||||
[ 1Y - 2Y [ | 0 | 0 | 0 | 0 | 0 | 0 | 0 | 0 | ||||||||||
[ 2Y - 3Y [ | 20 | 1 | 0 | 0 | 0 | 0 | 0 | 0 | ||||||||||
[3Y - 5Y [ | 0 | 0 | 0 | 0 | 0 | 0 | 0 | 0 | ||||||||||
[5Y - 10Y [ | 31 | 2 | 0 | 0 | 0 | 0 | 0 | 0 | ||||||||||
[10Y - more | 0 | 0 | 0 | 0 | 0 | 0 | 0 | 0 | ||||||||||
Tot | 52 | 2 | 0 | 0 | 0 | 0 | 0 | 0 | ||||||||||
 | 2014 EU-wide Stress Test - Sovereign Exposure |
| (mln EUR) |
VALUES AS OF 31/12/2013 | |||||||||||||
| Residual Maturity | Country / Region |
GROSS DIRECT LONG (1)
|
NET DIRECT POSITIONS (gross exposures (long) net of cash (1)
| |||||||||||
| of which: loans and advances | of which: AFS banking book |
of which: FVO
| of which: Financial (2) | |||||||||||
[ 0 - 3M [ | China | 0 | 0 | 0 | 0 | 0 | 0 | |||||||
[ 3M - 1Y [ | 7 | 0 | 7 | 0 | 0 | 7 | ||||||||
[ 1Y - 2Y [ | 0 | 0 | 0 | 0 | 0 | 0 | ||||||||
[ 2Y - 3Y [ | 0 | 0 | 0 | 0 | 0 | 0 | ||||||||
[3Y - 5Y [ | 0 | 0 | 0 | 0 | 0 | 0 | ||||||||
[5Y - 10Y [ | 0 | 0 | 0 | 0 | 0 | 0 | ||||||||
[10Y - more | 0 | 0 | 0 | 0 | 0 | 0 | ||||||||
Tot | 7 | 0 | 7 | 0 | 0 | 7 | ||||||||
[ 0 - 3M [ | Switzerland | 0 | 0 | 0 | 0 | 0 | 0 | |||||||
[ 3M - 1Y [ | 0 | 0 | 0 | 0 | 0 | 0 | ||||||||
[ 1Y - 2Y [ | 0 | 0 | 0 | 0 | 0 | 0 | ||||||||
[ 2Y - 3Y [ | 0 | 0 | 0 | 0 | 0 | 0 | ||||||||
[3Y - 5Y [ | 0 | 0 | 0 | 0 | 0 | 0 | ||||||||
[5Y - 10Y [ | 0 | 0 | 0 | 0 | 0 | 0 | ||||||||
[10Y - more | 0 | 0 | 0 | 0 | 0 | 0 | ||||||||
Tot | 0 | 0 | 0 | 0 | 0 | 0 | ||||||||
[ 0 - 3M [ | Other advanced economies non EEA | 0 | 0 | 0 | 0 | 0 | 0 | |||||||
[ 3M - 1Y [ | 27 | 0 | 27 | 3 | 0 | 24 | ||||||||
[ 1Y - 2Y [ | 0 | 0 | 0 | 0 | 0 | 0 | ||||||||
[ 2Y - 3Y [ | 0 | 0 | 0 | 0 | 0 | 0 | ||||||||
[3Y - 5Y [ | 0 | 0 | 0 | 0 | 0 | 0 | ||||||||
[5Y - 10Y [ | 0 | 0 | 0 | 0 | 0 | 0 | ||||||||
[10Y - more | 0 | 0 | 0 | 0 | 0 | 0 | ||||||||
Tot | 27 | 0 | 27 | 3 | 0 | 24 | ||||||||
[ 0 - 3M [ | Other Central and eastern Europe countries non EEA | 67 | 0 | 67 | 66 | 0 | 1 | |||||||
[ 3M - 1Y [ | 561 | 0 | 561 | 554 | 0 | 7 | ||||||||
[ 1Y - 2Y [ | 271 | 0 | 271 | 270 | 0 | 1 | ||||||||
[ 2Y - 3Y [ | 297 | 0 | 297 | 296 | 0 | 1 | ||||||||
[3Y - 5Y [ | 384 | 0 | 384 | 384 | 0 | 1 | ||||||||
[5Y - 10Y [ | 1,125 | 0 | 1,125 | 1,124 | 0 | 2 | ||||||||
[10Y - more | 53 | 0 | 53 | 52 | 0 | 1 | ||||||||
Tot | 2,758 | 0 | 2,758 | 2,745 | 0 | 13 | ||||||||
[ 0 - 3M [ | Middle East | 0 | 0 | 0 | 0 | 0 | 0 | |||||||
[ 3M - 1Y [ | 0 | 0 | 0 | 0 | 0 | 0 | ||||||||
[ 1Y - 2Y [ | 0 | 0 | 0 | 0 | 0 | 0 | ||||||||
[ 2Y - 3Y [ | 0 | 0 | 0 | 0 | 0 | 0 | ||||||||
[3Y - 5Y [ | 0 | 0 | 0 | 0 | 0 | 0 | ||||||||
[5Y - 10Y [ | 0 | 0 | 0 | 0 | 0 | 0 | ||||||||
[10Y - more | 0 | 0 | 0 | 0 | 0 | 0 | ||||||||
Tot | 0 | 0 | 0 | 0 | 0 | 0 | ||||||||
[ 0 - 3M [ | Latin America and the Caribbean | 556 | 0 | 540 | 129 | 0 | 412 | |||||||
[ 3M - 1Y [ | 4,361 | 0 | 4,118 | 1,555 | 0 | 2,564 | ||||||||
[ 1Y - 2Y [ | 3,269 | 421 | 3,187 | 1,541 | 0 | 764 | ||||||||
[ 2Y - 3Y [ | 3,282 | 0 | 3,219 | 608 | 0 | 2,595 | ||||||||
[3Y - 5Y [ | 5,526 | 54 | 5,155 | 2,973 | 0 | 2,128 | ||||||||
[5Y - 10Y [ | 5,152 | 0 | 4,858 | 1,712 | 0 | 2,112 | ||||||||
[10Y - more | 7,473 | 5,867 | 6,448 | 236 | 0 | 345 | ||||||||
Tot | 29,619 | 6,342 | 27,525 | 8,754 | 0 | 10,919 | ||||||||
[ 0 - 3M [ | Africa | 0 | 0 | 0 | 0 | 0 | 0 | |||||||
[ 3M - 1Y [ | 0 | 0 | 0 | 0 | 0 | 0 | ||||||||
[ 1Y - 2Y [ | 0 | 0 | 0 | 0 | 0 | 0 | ||||||||
[ 2Y - 3Y [ | 0 | 0 | 0 | 0 | 0 | 0 | ||||||||
[3Y - 5Y [ | 0 | 0 | 0 | 0 | 0 | 0 | ||||||||
[5Y - 10Y [ | 0 | 0 | 0 | 0 | 0 | 0 | ||||||||
[10Y - more | 0 | 0 | 0 | 0 | 0 | 0 | ||||||||
Tot | 0 | 0 | 0 | 0 | 0 | 0 | ||||||||
[ 0 - 3M [ | Others | 328 | 0 | 328 | 0 | 0 | 328 | |||||||
[ 3M - 1Y [ | 35 | 0 | 35 | 0 | 0 | 35 | ||||||||
[ 1Y - 2Y [ | 31 | 9 | 21 | 0 | 0 | 12 | ||||||||
[ 2Y - 3Y [ | 36 | 0 | 11 | 0 | 0 | 11 | ||||||||
[3Y - 5Y [ | 59 | 19 | 57 | 3 | 0 | 35 | ||||||||
[5Y - 10Y [ | 130 | 0 | 121 | 2 | 0 | 119 | ||||||||
[10Y - more | 145 | 76 | 107 | 2 | 0 | 29 | ||||||||
Tot | 763 | 104 | 680 | 7 | 0 | 569 | ||||||||
| (mln EUR) |
VALUES AS OF 31/12/2013 |
VALUES AS OF 31/12/2013 | ||||||||||||||||
| Residual Maturity | Country / Region |
DIRECT SOVEREIGN EXPOSURES IN
|
INDIRECT SOVEREIGN EXPOSURES (3) (on and off balance sheet)
| |||||||||||||||
Derivatives with
| Derivatives with
| Derivatives with
| Derivatives with
| |||||||||||||||
| Notional value | Fair-value at 31/12/2013 (+) | Notional value |
Fair-value at
| Notional value | Fair-value at 31/12/2013 (+) | Notional value | Fair-value at 31/12/2013 (-) | |||||||||||
[ 0 - 3M [ | China | 0 | 0 | 0 | 0 | 0 | 0 | 0 | 0 | |||||||||
[ 3M - 1Y [ | 0 | 0 | 0 | 0 | 0 | 0 | 0 | 0 | ||||||||||
[ 1Y - 2Y [ | 0 | 0 | 0 | 0 | 51 | 1 | 102 | 0 | ||||||||||
[ 2Y - 3Y [ | 0 | 0 | 0 | 0 | 44 | 0 | 44 | 0 | ||||||||||
[3Y - 5Y [ | 0 | 0 | 0 | 0 | 421 | 9 | 437 | 0 | ||||||||||
[5Y - 10Y [ | 0 | 0 | 0 | 0 | 0 | 0 | 0 | 0 | ||||||||||
[10Y - more | 0 | 0 | 0 | 0 | 0 | 0 | 0 | 0 | ||||||||||
Tot | 0 | 0 | 0 | 0 | 515 | 10 | 582 | 0 | ||||||||||
[ 0 - 3M [ | Switzerland | 0 | 0 | 0 | 0 | 0 | 0 | 0 | 0 | |||||||||
[ 3M - 1Y [ | 0 | 0 | 0 | 0 | 0 | 0 | 0 | 0 | ||||||||||
[ 1Y - 2Y [ | 0 | 0 | 0 | 0 | 0 | 0 | 0 | 0 | ||||||||||
[ 2Y - 3Y [ | 0 | 0 | 0 | 0 | 0 | 0 | 0 | 0 | ||||||||||
[3Y - 5Y [ | 0 | 0 | 0 | 0 | 0 | 0 | 0 | 0 | ||||||||||
[5Y - 10Y [ | 0 | 0 | 0 | 0 | 0 | 0 | 0 | 0 | ||||||||||
[10Y - more | 0 | 0 | 0 | 0 | 0 | 0 | 0 | 0 | ||||||||||
Tot | 0 | 0 | 0 | 0 | 0 | 0 | 0 | 0 | ||||||||||
[ 0 - 3M [ | Other advanced economies non EEA | 0 | 0 | 0 | 0 | 0 | 0 | 0 | 0 | |||||||||
[ 3M - 1Y [ | 0 | 0 | 0 | 0 | 0 | 0 | 0 | 0 | ||||||||||
[ 1Y - 2Y [ | 0 | 0 | 0 | 0 | 0 | 0 | 0 | 0 | ||||||||||
[ 2Y - 3Y [ | 0 | 0 | 0 | 0 | 87 | 0 | 65 | 0 | ||||||||||
[3Y - 5Y [ | 0 | 0 | 0 | 0 | 87 | 0 | 87 | 0 | ||||||||||
[5Y - 10Y [ | 0 | 0 | 0 | 0 | 0 | 0 | 0 | 0 | ||||||||||
[10Y - more | 0 | 0 | 0 | 0 | 0 | 0 | 0 | 0 | ||||||||||
Tot | 0 | 0 | 0 | 0 | 174 | 1 | 152 | -1 | ||||||||||
[ 0 - 3M [ | Other Central and eastern Europe countries non EEA | 0 | 0 | 0 | 0 | 0 | 0 | 0 | 0 | |||||||||
[ 3M - 1Y [ | 0 | 0 | 0 | 0 | 0 | 0 | 0 | 0 | ||||||||||
[ 1Y - 2Y [ | 0 | 0 | 0 | 0 | 0 | 0 | 0 | 0 | ||||||||||
[ 2Y - 3Y [ | 0 | 0 | 0 | 0 | 0 | 0 | 0 | 0 | ||||||||||
[3Y - 5Y [ | 0 | 0 | 0 | 0 | 0 | 0 | 0 | 0 | ||||||||||
[5Y - 10Y [ | 0 | 0 | 0 | 0 | 0 | 0 | 0 | 0 | ||||||||||
[10Y - more | 0 | 0 | 0 | 0 | 0 | 0 | 0 | 0 | ||||||||||
Tot | 0 | 0 | 0 | 0 | 0 | 0 | 0 | 0 | ||||||||||
[ 0 - 3M [ | Middle East | 0 | 0 | 0 | 0 | 0 | 0 | 0 | 0 | |||||||||
[ 3M - 1Y [ | 0 | 0 | 0 | 0 | 0 | 0 | 0 | 0 | ||||||||||
[ 1Y - 2Y [ | 0 | 0 | 0 | 0 | 0 | 0 | 0 | 0 | ||||||||||
[ 2Y - 3Y [ | 0 | 0 | 0 | 0 | 0 | 0 | 0 | 0 | ||||||||||
[3Y - 5Y [ | 0 | 0 | 0 | 0 | 45 | 1 | 62 | 0 | ||||||||||
[5Y - 10Y [ | 0 | 0 | 0 | 0 | 0 | 0 | 0 | 0 | ||||||||||
[10Y - more | 0 | 0 | 0 | 0 | 0 | 0 | 0 | 0 | ||||||||||
Tot | 0 | 0 | 0 | 0 | 45 | 1 | 62 | 0 | ||||||||||
[ 0 - 3M [ | Latin America and the Caribbean | 14 | 3 | 497 | 0 | 61 | 61 | 0 | 0 | |||||||||
[ 3M - 1Y [ | 75 | 15 | 384 | 0 | 34 | 1 | 8 | -9 | ||||||||||
[ 1Y - 2Y [ | 55 | 10 | 1,267 | 0 | 0 | 0 | 4 | 0 | ||||||||||
[ 2Y - 3Y [ | 55 | 8 | 692 | -1 | 68 | 0 | 68 | 0 | ||||||||||
[3Y - 5Y [ | 115 | 12 | 19 | 0 | 58 | 0 | 61 | 0 | ||||||||||
[5Y - 10Y [ | 185 | 7 | 93 | -2 | 7 | 0 | 4 | 0 | ||||||||||
[10Y - more | 0 | 0 | 174 | -10 | 0 | 0 | 0 | 0 | ||||||||||
Tot | 499 | 55 | 3,128 | -13 | 228 | 63 | 145 | -9 | ||||||||||
[ 0 - 3M [ | Africa | 0 | 0 | 0 | 0 | 0 | 0 | 0 | 0 | |||||||||
[ 3M - 1Y [ | 0 | 0 | 0 | 0 | 0 | 0 | 0 | 0 | ||||||||||
[ 1Y - 2Y [ | 0 | 0 | 0 | 0 | 0 | 0 | 0 | 0 | ||||||||||
[ 2Y - 3Y [ | 0 | 0 | 0 | 0 | 0 | 0 | 0 | 0 | ||||||||||
[3Y - 5Y [ | 0 | 0 | 0 | 0 | 0 | 0 | 0 | 0 | ||||||||||
[5Y - 10Y [ | 0 | 0 | 0 | 0 | 0 | 0 | 0 | 0 | ||||||||||
[10Y - more | 0 | 0 | 0 | 0 | 0 | 0 | 0 | 0 | ||||||||||
Tot | 0 | 0 | 0 | 0 | 0 | 0 | 0 | 0 | ||||||||||
[ 0 - 3M [ | Others | 0 | 0 | 0 | 0 | 0 | 0 | 0 | 0 | |||||||||
[ 3M - 1Y [ | 0 | 0 | 0 | 0 | 1 | 0 | 2 | 0 | ||||||||||
[ 1Y - 2Y [ | 0 | 0 | 0 | 0 | 0 | 0 | 0 | 0 | ||||||||||
[ 2Y - 3Y [ | 0 | 0 | 0 | 0 | 0 | 0 | 0 | 0 | ||||||||||
[3Y - 5Y [ | 0 | 0 | 0 | 0 | 0 | 0 | 0 | 0 | ||||||||||
[5Y - 10Y [ | 0 | 0 | 0 | 0 | 0 | 0 | 0 | 0 | ||||||||||
[10Y - more | 0 | 0 | 0 | 0 | 0 | 0 | 0 | 0 | ||||||||||
Tot | 0 | 0 | 0 | 0 | 1 | 0 | 2 | 0 | ||||||||||
Notes and definitions |
(1)The exposures reported cover only exposures to central, regional and local governments on immediate borrower basis, and do not include exposures to other counterparts with full or partial government guarantees (2)The banks disclose the exposures in the “Financial assets held for trading” portfolio after offsetting the cash short positions having the same maturities. (3)The exposures reported include the positions towards counterparts (other than sovereign) on sovereign credit risk (i.e. CDS, financial guarantees) booked in all the accounting portfolio (on-off balance sheet). |
‘Irrespective of the denomination and or accounting classification of the positions the economic substance over the form must be used as a criteria for the identification of the exposures to be included in this column. This item does not include exposures to counterparts (other than sovereign) with full or partial government guarantees by central, regional and local governments
 | 2014 EU-wide Stress Test Capital |
Baseline Scenario
| ||||||||||||
(mln EUR)
|
CRR / CRDIV DEFINITION OF CAPITAL
|
As of 31/12/2013
|
As of 31/12/2014
|
As of 31/12/2015
|
As of 31/12/2016
| |||||||
OWN FUNDS |
A
|
OWN FUNDS
|
45,028
|
44,957
|
45,998
|
46,591
| ||||||
| A.1 |
COMMON EQUITY TIER 1 CAPITAL (net of deductions and after applying transitional adjustments)
| 36,383 | 36,321 | 37,238 | 38,028 | |||||||
| A.1.1 |
Capital instruments eligible as CET1 Capital (including share premium and net own capital instruments)
| 24,692 | 24,692 | 24,692 | 24,692 | |||||||
| A.1.1.1 |
Of which: CET1 instruments subscribed by Government
| 0 | 0 | 0 | 0 | |||||||
| A.1.2 |
Retained earnings
| 756 | 956 | 2,659 | 4,273 | |||||||
| A.1.3 |
Accumulated other comprehensive income
| -3,658 | -4,210 | -4,430 | -4,577 | |||||||
| A.1.3.1 |
Of which: arising from unrealised gains/losses from Sovereign exposure in AFS portfolio
| 510 | 510 | 510 | 510 | |||||||
| A.1.3.2 |
Of which: arising from unrealised gains/losses from the rest of AFS portfolio
| 186 | -367 | -587 | -733 | |||||||
| A.1.4 |
Other Reserves
| 19,935 | 19,935 | 19,935 | 19,935 | |||||||
| A.1.5 |
Funds for general banking risk
| 0 | 0 | 0 | 0 | |||||||
| A.1.6 |
Minority interest given recognition in CET1 capital
| 934 | 934 | 934 | 934 | |||||||
| A.1.7 |
Adjustments to CET1 due to prudential filters excluding those from unrealised gains/losses from AFS portfolio
| -186 | 367 | 352 | 293 | |||||||
| A.1.8 |
Adjustments to CET1 due to prudential filters from unrealised gains/losses from Sovereign Exposure in AFS portfolio
| -510 | -510 | -306 | -204 | |||||||
| A.1.9 |
(-) Intangible assets (including Goodwill)
| -8,034 | -8,034 | -8,034 | -8,034 | |||||||
| A.1.10 |
(-) DTAs that rely on future profitability and do not arise from temporary differences net of associated DTLs
| -1,057 | -1,057 | -1,057 | -1,057 | |||||||
| A.1.11 |
(-) IRB shortfall of credit risk adjustments to expected losses
| 0 | 0 | 0 | 0 | |||||||
| A.1.12 |
(-) Defined benefit pension fund assets
| 0 | 0 | 0 | 0 | |||||||
| A.1.13 |
(-) Reciprocal cross holdings in CET1 Capital
| 0 | 0 | 0 | 0 | |||||||
| A.1.14 |
(-) Excess deduction from AT1 items over AT1 Capital
| 0 | 0 | 0 | 0 | |||||||
| A.1.15 |
(-) Deductions related to assets which can alternatively be subject to a 1.250% risk weight
| -126 | -126 | -126 | -126 | |||||||
| A.1.15.1 |
Of which: from securitisation positions (-)
| -73 | -73 | -73 | -73 | |||||||
| A.1.16 |
(-) Holdings of CET1 capital instruments of financial sector entities where the institution does not have a significant investment
| 0 | 0 | 0 | 0 | |||||||
| A.1.17 |
(-) Deductible DTAs that rely on future profitability and arise from temporary differences
| 0 | 0 | 0 | 0 | |||||||
| A.1.18 |
(-) Holdings of CET1 capital instruments of financial sector entities where the institution has a significant investment
| -252 | -274 | -124 | 0 | |||||||
| A.1.19 |
(-) Amount exceding the 17.65% threshold
| -630 | -647 | -533 | -396 | |||||||
| A.1.20 |
Transitional adjustments
| 4,518 | 4,296 | 3,277 | 2,295 | |||||||
| A.1.20.1 |
Transitional adjustments due to grandfathered CET1 Capital instruments (+/-)
| 0 | 0 | 0 | 0 | |||||||
| A.1.20.2 |
Transitional adjustments due to additional minority interests (+/-)
| 1,043 | 780 | 517 | 255 | |||||||
| A.1.20.3 |
Other transitional adjustments to CET1 Capital excl. adjustments for Sovereign exposure in AFS (+/-)
| 3,475 | 3,516 | 2,759 | 2,041 | |||||||
| A.2 |
ADDITIONAL TIER 1 CAPITAL (net of deductions and after transitional adjustments)
| 973 | 969 | 1,219 | 1,450 | |||||||
| A.2.1 |
Of which: (+) Other existing support government measures
| 0 | 0 | 0 | 0 | |||||||
| A.3 |
TIER 1 CAPITAL (net of deductions and after transitional adjustments)
| 37,356 | 37,290 | 38,457 | 39,479 | |||||||
| A.4 |
TIER 2 CAPITAL (net of deductions and after transitional adjustments)
| 7,672 | 7,667 | 7,540 | 7,113 | |||||||
OWN FUNDS REQUIREMENTS | B |
TOTAL RISK EXPOSURE AMOUNT
| 345,041 | 354,719 | 356,823 | 358,592 | ||||||
| B.1 |
of which: stemming from exposures that fall below the 10% / 15% limits for CET1 deduction (+)
| 0 | ||||||||||
| B.2 |
of which: stemming from CVA capital requirements (+)
| 0 | ||||||||||
| B.3 |
of which: stemming from higher asset correlation parameter against exposures to large financial institutions under IRB the IRB approaches to credit risk (+)
| 0 | ||||||||||
| B.4 |
of which: stemming from the application of the supporting factor to increase lending to SMEs (-)
| 0 | ||||||||||
| B.5 |
of which: stemming from the effect of exposures that were previously part of Risk Exposure amount and receive a deduction treatment under CRR/CRDIV (-)
| 0 | ||||||||||
| B.6 |
of which: others subject to the discretion of National Competent Authorities
| 0 | ||||||||||
CAPITAL RATIOS (%) - Transitional period | C.1 |
Common Equity Tier 1 Capital ratio
| 10.54% | 10.24% | 10.44% | 10.60% | ||||||
| C.2 |
Tier 1 Capital ratio
| 10.83% | 10.51% | 10.78% | 11.01% | |||||||
| C.3 |
Total Capital ratio
| 13.05% | 12.67% | 12.89% | 12.99% | |||||||
| D |
Common Equity Tier 1 Capital Threshold
| 28,378 | 28,546 | 28,687 | ||||||||
Memorandum items | E |
Total amount of instruments with mandatory conversion into ordinary shares upon a fixed date in the 2014 -2016 period (cumulative conversions) (1)
| 0 | 0 | 0 | |||||||
| F |
Total Additional Tier 1 and Tier 2 instruments eligible as regulatory capital under the CRR provisions that convert into Common Equity Tier 1 or are written down upon a trigger event (2)
| |||||||||||
| F.1 |
Of which: eligible instruments whose trigger is above CET1 capital ratio in the adverse scenario (2)
| |||||||||||
| G |
Fully Loaded Common Equity Tier 1 Capital ratio (3)
| 9.96% | ||||||||||
Adverse Scenario
| ||||||||||||||
(mln EUR)
|
CRR / CRDIV DEFINITION OF CAPITAL
|
As of 31/12/2014
|
As of 31/12/2015
|
As of 31/12/2016
|
COREP CODE
|
REGULATION
| ||||||||
OWN FUNDS | A |
OWN FUNDS
|
43,581
|
43,298
|
42,705
|
CA1 {1}
|
Articles 4(118) and 72 of CRR
| |||||||
| A.1 |
COMMON EQUITY TIER 1 CAPITAL (net of deductions and after applying transitional adjustments)
| 34,988 | 34,613 | 34,196 | CA1 {1.1.1} | Article 50 of CRR | ||||||||
| A.1.1 |
Capital instruments eligible as CET1 Capital (including share premium and net own capital instruments)
| 24,692 | 24,692 | 24,692 | CA1 {1.1.1.1} | Articles 26(1) points (a) and (b), 27 to 29, 36(1) point (f) and 42 of CRR | ||||||||
| A.1.1.1 |
Of which: CET1 instruments subscribed by Government
| 0 | 0 | 0 | - | - | ||||||||
| A.1.2 |
Retained earnings
| 257 | 1,211 | 2,459 | CA1 {1.1.1.2} | Articles 26(1) point (c), 26(2) and 36 (1) points (a) and (l) of CRR | ||||||||
| A.1.3 |
Accumulated other comprehensive income
| -7,181 | -6,940 | -7,509 | CA1 {1.1.1.3} | Articles 4(100), 26(1) point (d) and 36 (1) point (l) of CRR | ||||||||
| A.1.3.1 |
Of which: arising from unrealised gains/losses from Sovereign exposure in AFS portfolio
| -1,863 | -1,043 | -1,226 | - | - | ||||||||
| A.1.3.2 |
Of which: arising from unrealised gains/losses from the rest of AFS portfolio
| -964 | -1,543 | -1,928 | - | - | ||||||||
| A.1.4 |
Other Reserves
| 19,935 | 19,935 | 19,935 | CA1 {1.1.1.4} | Articles 4(117) and 26(1) point (e) of CRR | ||||||||
| A.1.5 |
Funds for general banking risk
| 0 | 0 | 0 | CA1 {1.1.1.5} | Articles 4(112), 26(1) point (f) and 36 (1) point (l) of CRR | ||||||||
| A.1.6 |
Minority interest given recognition in CET1 capital
| 934 | 934 | 934 | CA1 {1.1.1.7} | Article 84 of CRR | ||||||||
| A.1.7 |
Adjustments to CET1 due to prudential filters excluding those from unrealised gains/losses from AFS portfolio
| 771 | 926 | 771 | CA1 {1.1.1.9} | Articles 32 to 35 of and 36 (1) point (l) of CRR | ||||||||
| A.1.8 |
Adjustments to CET1 due to prudential filters from unrealised gains/losses from Sovereign Exposure in AFS portfolio
| 1,490 | 626 | 490 | - | |||||||||
| A.1.9 |
(-) Intangible assets (including Goodwill)
| -8,034 | -8,034 | -8,034 | CA1 {1.1.1.10 + 1.1.1.11} | Articles 4(113), 36(1) point (b) and 37 of CRR. Articles 4(115), 36(1) point (b) and 37 point (a) of CCR | ||||||||
| A.1.10 |
(-) DTAs that rely on future profitability and do not arise from temporary differences net of associated DTLs
| -1,057 | -1,057 | -1,057 | CA1 {1.1.1.12} | Articles 36(1) point (c) and 38 of CRR | ||||||||
| A.1.11 |
(-) IRB shortfall of credit risk adjustments to expected losses
| -39 | -57 | -5 | CA1 {1.1.1.13} | Articles 36(1) point (d), 40 and 159 of CRR | ||||||||
| A.1.12 |
(-) Defined benefit pension fund assets
| 0 | 0 | 0 | CA1 {1.1.1.14} | Articles 4(109), 36(1) point (e) and 41 of CRR | ||||||||
| A.1.13 |
(-) Reciprocal cross holdings in CET1 Capital
| 0 | 0 | 0 | CA1 {1.1.1.15} | Articles 4(122), 36(1) point (g) and 44 of CRR | ||||||||
| A.1.14 |
(-) Excess deduction from AT1 items over AT1 Capital
| 0 | 0 | 0 | CA1 {1.1.1.16} | Article 36(1) point (j) of CRR | ||||||||
| A.1.15 |
(-) Deductions related to assets which can alternatively be subject to a 1.250% risk weight
| -126 | -126 | -126 | CA1 {1.1.1.17 to 1.1.1.21} | Articles 4(36), 36(1) point (k) (i) and 89 to 91 of CRR; Articles 36(1) point (k) (ii), 243(1) point (b), 244(1) point (b) and 258 of CRR; Articles 36(1) point k) (iii) and 379(3) of CRR; Articles 36(1) point k) (iv) and 153(8) of CRR and | ||||||||
| A.1.15.1 |
Of which: from securitisation positions (-)
| -73 | -73 | -73 | CA1 {1.1.1.18.1} | Articles 36(1) point (k) (ii), 243(1) point (b), 244(1) point (b) and 258 of CRR | ||||||||
| A.1.16 |
(-) Holdings of CET1 capital instruments of financial sector entities where the institution does not have a significant investment
| 0 | 0 | 0 | CA1 {1.1.1.22} | Articles 4(27), 36(1) point (h); 43 to 46, 49 (2) and (3) and 79 of CRR | ||||||||
| A.1.17 |
(-) Deductible DTAs that rely on future profitability and arise from temporary differences
| 0 | 0 | 0 | CA1 {1.1.1.23} | Articles 36(1) point (c) and 38; Articles 48(1) point (a) and 48(2) of CRR | ||||||||
| A.1.18 |
(-) Holdings of CET1 capital instruments of financial sector entities where the institution has a significant investment
| -643 | -520 | -443 | CA1 {1.1.1.24} | Articles 4(27); 36(1) point (i); 43, 45; 47; 48(1) point (b); 49(1) to (3) and 79 of CRR | ||||||||
| A.1.19 |
(-) Amount exceding the 17.65% threshold
| -930 | -836 | -777 | CA1 {1.1.1.25} | Article 470 of CRR | ||||||||
| A.1.20 |
Transitional adjustments
| 4,918 | 3,859 | 2,865 | CA1 {1.1.1.6 + 1.1.8 + 1.1.26} | - | ||||||||
| A.1.20.1 |
Transitional adjustments due to grandfathered CET1 Capital instruments (+/-)
| 0 | 0 | 0 | CA1 {1.1.1.6} | Articles 483(1) to (3), and 484 to 487 of CRR | ||||||||
| A.1.20.2 |
Transitional adjustments due to additional minority interests (+/-)
| 780 | 517 | 255 | CA1 {1.1.1.8} | Articles 479 and 480 of CRR | ||||||||
| A.1.20.3 |
Other transitional adjustments to CET1 Capital excl. adjustments for Sovereign exposure in AFS (+/-)
| 4,138 | 3,341 | 2,610 | CA1 {1.1.1.26} | Articles 469 to 472, 478 and 481 of CRR | ||||||||
| A.2 |
ADDITIONAL TIER 1 CAPITAL (net of deductions and after transitional adjustments)
| 947 | 1,182 | 1,423 | CA1 {1.1.2} | Article 61 of CRR | ||||||||
| A.2.1 |
Of which: (+) Other existing support government measures
| 0 | 0 | 0 | - | - | ||||||||
| A.3 |
TIER 1 CAPITAL (net of deductions and after transitional adjustments)
| 35,935 | 35,795 | 35,619 | CA1 {1.1} | Article 25 of CRR | ||||||||
| A.4 |
TIER 2 CAPITAL (net of deductions and after transitional adjustments)
| 7,646 | 7,504 | 7,085 | CA1 {1.2} | Article 71 of CRR | ||||||||
OWN FUNDS REQUIREMENTS | B |
TOTAL RISK EXPOSURE AMOUNT
| 367,463 | 378,080 | 381,341 | CA2 {1} | Articles 92(3), 95, 96 and 98 of CRR | |||||||
| B.1 |
of which: stemming from exposures that fall below the 10% / 15% limits for CET1 deduction (+)
| Articles 36(1) points (a) and (i); Article 38 and Article 48 of CRR | ||||||||||||
| B.2 |
of which: stemming from CVA capital requirements (+)
| Article 381 to 386 of CRR | ||||||||||||
| B.3 |
of which: stemming from higher asset correlation parameter against exposures to large financial institutions under IRB the IRB approaches to credit risk (+)
| Articles 153(2) of CRR | ||||||||||||
| B.4 |
of which: stemming from the application of the supporting factor to increase lending to SMEs (-)
| Recital (44) of CRR | ||||||||||||
| B.5 |
of which: stemming from the effect of exposures that were previously part of Risk Exposure amount and receive a deduction treatment under CRR/CRDIV (-)
| - | ||||||||||||
| B.6 |
of which: others subject to the discretion of National Competent Authorities
| Article 124 to 164 of CRR | ||||||||||||
CAPITAL RATIOS (%) - Transitional period | C.1 |
Common Equity Tier 1 Capital ratio
| 9.52% | 9.15% | 8.97% | CA3 {1} | - | |||||||
| C.2 |
Tier 1 Capital ratio
| 9.78% | 9.47% | 9.34% | CA3 {3} | - | ||||||||
| C.3 |
Total Capital ratio
| 11.86% | 11.45% | 11.20% | CA3 {5} | - | ||||||||
| D |
Common Equity Tier 1 Capital Threshold
| 20,210 | 20,794 | 20,974 | ||||||||||
Memorandum items | E |
Total amount of instruments with mandatory conversion into ordinary shares upon a fixed date in the 2014 -2016 period (cumulative conversions) (1)
| 0 | 0 | 0 | |||||||||
| F |
Total Additional Tier 1 and Tier 2 instruments eligible as regulatory capital under the CRR provisions that convert into Common Equity Tier 1 or are written down upon a trigger event (2)
| 0 | 0 | 0 | ||||||||||
| F.1 |
Of which: eligible instruments whose trigger is above CET1 capital ratio in the adverse scenario (2)
| 0 | 0 | 0 | ||||||||||
| G |
Fully Loaded Common Equity Tier 1 Capital ratio (3)
| 8.22% | �� | |||||||||||
(1) Conversions not considered for CET1 computation
(2) Excluding instruments included in E
(3) Memorandum item based on a fully implemented CRR/CRD IV definition of Common Equity Tier 1 capital including 60% of unrealised gains/losses from Sovereign Exposure in AFS portfolio
 | 2014 EU-wide Stress Test - Restructuring scenarios |
Effects of mandatory restructuring plans publicly announced before 31 December 2013 and formally agreed with the European Commission.
| ||||||||||
Baseline scenario
|
Adverse scenario
| Narrative description of the transactions. (type, date of completion/commitment, portfolios, subsidiaries, branches) | ||||||||
| (mln EUR) | CET1 impact | Risk exposure amount impact | CET1 impact | Risk exposure amount impact | ||||||
2013 | 0 | 0 | ||||||||
2014 | 0 | 0 | 0 | 0 | ||||||
2015 | 0 | 0 | 0 | 0 | ||||||
2016 | 0 | 0 | 0 | 0 | ||||||
Total | 0 | 0 | 0 | 0 | ||||||
 | 2014 EU-wide Stress Test |
Outcome of the Stress Test based on the Restructuring plan for banks whose plan was formally agreed with the European Commission after 31 December 2013
Baseline scenario
|
Adverse scenario
| |||||||||||||
| (mln EUR) |
As of
|
As of
|
As of
|
As of
|
As of
|
As of
|
As of
| |||||||
COMMON EQUITY TIER 1 CAPITAL (net of deductions and after applying transitional adjustments)
| ||||||||||||||
TOTAL RISK EXPOSURE AMOUNT
| ||||||||||||||
COMMON EQUITY TIER 1 RATIO
| ||||||||||||||
 | 2014 EU-wide Stress Test | |
| Major Capital Measures from 1 January to 30 September 2014 |
| Major Capital Measures Impacting Tier 1 and Tier 2 Eligible Capital from 1 January 2014 to 30 September 2014 |
| Issuance of CET 1 Instruments | Impact on Common Million EUR | |
Raising of capital instruments eligible as CET1 capital (+) | 0 | |
Repayment of CET1 capital, buybacks (-) | 0 | |
Conversion to CET1 of hybrid instruments becoming effective between 1 January and 30 September 2014 (+) | 0 | |
| Net issuance of Additional Tier 1 and T2 Instruments | Impact on Additional Tier 1 and Tier 2 Million EUR | |
Net issuance of Additional Tier 1 and T2 Instruments with a trigger at or above bank’s post stress test CET1 ratio in the adverse scenario during the stress test horizon (+/-) | 0 | |
Net issuance of Additional Tier 1 and T2 Instrument with a trigger below bank’s post stress test CET1 ratio in the adverse scenario during the stress test horizon (+/-) | 1,500 | |
| Losses |
Million EUR | |
Realized fines/litigation costs from 1 January to 30 September 2014 (net of provisions) (-) | 0 | |
Other material losses and provisions from 1 January to 30 September 2014 (-) | 0 | |
SIGNATURE
Pursuant to the requirements of the Securities Exchange Act of 1934, the registrant has duly caused this report to be signed on its behalf by the undersigned, thereunto duly authorized.
| Banco Bilbao Vizcaya Argentaria, S.A. | ||||||
| Date: October 27, 2014 | By: | By: /s/ Ricardo Gómez Barredo | ||||
| Name: | Ricardo Gómez Barredo | |||||
| Title: | Head of Group Accounting & Information Management | |||||