Table of Contents
UNITED STATES
SECURITIES AND EXCHANGE COMMISSION
WASHINGTON, D.C. 20549
FORM 6-K
REPORT OF FOREIGN ISSUER
PURSUANT TO RULE 13a-16 OR 15d-16
UNDER THE SECURITIES EXCHANGE ACT OF 1934
For the month of February, 2015
Commission file number: 1-10110
BANCO BILBAO VIZCAYA ARGENTARIA, S.A.
(Exact name of Registrant as specified in its charter)
BANK BILBAO VIZCAYA ARGENTARIA, S.A.
(Translation of Registrant’s name into English)
Paseo de la Castellana, 81
28046 Madrid
Spain
(Address of principal executive offices)
Indicate by check mark whether the registrant files or will file annual reports under cover of Form 20-F or Form 40-F:
Form 20-F x Form 40-F ¨
Indicate by check mark if the registrant is submitting the Form 6-K in paper as permitted by Regulation S-T Rule 101(b)(1):
Yes ¨ No x
Indicate by check mark if the registrant is submitting the Form 6-K in paper as permitted by Regulation S-T Rule 101(b)(7):
Yes ¨ No x
Table of Contents

Table of Contents

Quarterly report
Results
2014
Table of Contents
BBVA Group Highlights
(Consolidated figures)
| 31-12-14 | D% | 31-12-13 | 31-12-12 | |||||||||||||
Balance sheet (million euros) | ||||||||||||||||
Total assets | 651,511 | 8.7 | 599,517 | 637,785 | ||||||||||||
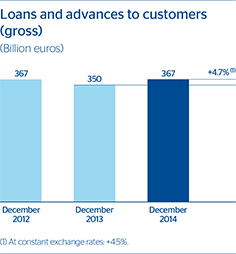
Loans and advances to customers (gross) | 366,536 | 4.7 | 350,110 | 367,415 | ||||||||||||
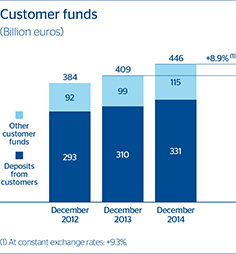
Deposits from customers | 330,686 | 6.6 | 310,176 | 292,716 | ||||||||||||
Other customer funds | 115,274 | 16.2 | 99,213 | 91,776 | ||||||||||||
Total customer funds | 445,960 | 8.9 | 409,389 | 384,493 | ||||||||||||
Total equity | 51,609 | 15.1 | 44,850 | 43,802 | ||||||||||||
Income statement (million euros) | ||||||||||||||||
Net interest income | 15,116 | 3.4 | 14,613 | 15,122 | ||||||||||||
Gross income | 21,357 | (0.2 | ) | 21,397 | 21,892 | |||||||||||
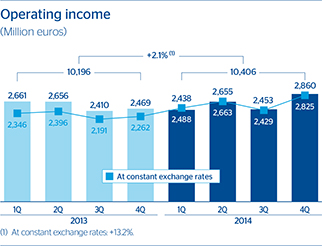
Operating income | 10,406 | 2.1 | 10,196 | 11,106 | ||||||||||||
Income before tax | 4,063 | 47.7 | 2,750 | 749 | ||||||||||||
Net attributable profit | 2,618 | 17.5 | 2,228 | 1,676 | ||||||||||||
Data per share and share performance ratios | ||||||||||||||||
Share price (euros) | 7.85 | (12.2 | ) | 8.95 | 6.96 | |||||||||||
Market capitalization (million euros) | 48,470 | (6.4 | ) | 51,773 | 37,924 | |||||||||||
Net attributable profit per share (euros) | 0.44 | 15.7 | 0.38 | 0.30 | ||||||||||||
Book value per share (euros) | 8.01 | 0.1 | 8.00 | 8.00 | ||||||||||||
P/BV (Price/book value; times) | 1.0 | 1.1 | 0.9 | |||||||||||||
PER (Price/Earnings; times) | 17.3 | 23.2 | 21.5 | |||||||||||||
Yield (Dividend/Price;%) | 4.5 | 4.1 | 6.0 | |||||||||||||
Significant ratios (%) | ||||||||||||||||
ROE (Net attributable profit/average equity) | 5.6 | 5.0 | 4.0 | |||||||||||||
ROTE (Net attributable profit/average tangible equity) | 6.5 | 6.0 | 5.0 | |||||||||||||
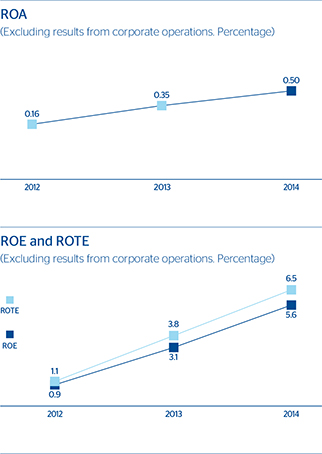
ROA (Net income/average total assets) | 0.50 | 0.48 | 0.37 | |||||||||||||
RORWA (Net income/average risk-weighted assets) | 0.90 | 0.91 | 0.70 | |||||||||||||
Efficiency ratio | 51.3 | 52.3 | 49.3 | |||||||||||||
Cost of risk | 1.25 | 1.59 | 2.15 | |||||||||||||
NPA ratio | 5.8 | 6.8 | 5.1 | |||||||||||||
NPA coverage ratio | 64 | 60 | 72 | |||||||||||||
Capital adequacy ratios (%)(1) | ||||||||||||||||
Core capital | 12.0 | 11.6 | 10.8 | |||||||||||||
Tier I | 12.0 | 12.2 | 10.8 | |||||||||||||
BIS II Ratio | 15.1 | 14.9 | 13.0 | |||||||||||||
Other information | ||||||||||||||||
Number of shares (millions) | 6,171 | 6.7 | 5,786 | 5,449 | ||||||||||||
Number of shareholders | 960,397 | (1.4 | ) | 974,395 | 1,012,864 | |||||||||||
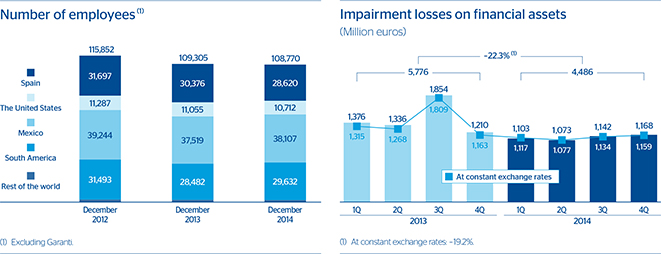
Number of employees(2) | 108,770 | (0.5 | ) | 109,305 | 115,852 | |||||||||||
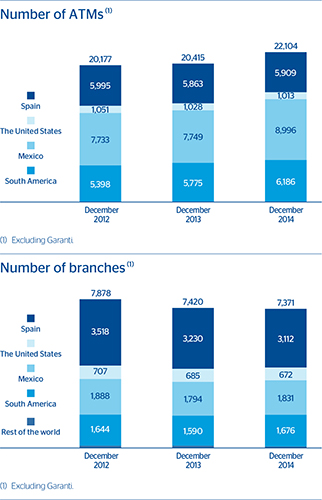
Number of branches(2) | 7,371 | (0.7 | ) | 7,420 | 7,878 | |||||||||||
Number of ATMs(2) | 22,104 | 8.3 | 20,415 | 20,177 | ||||||||||||
Memorandum item: this quarterly information has not been audited. The consolidated accounts of the BBVA Group have been drawn up according to the International Financial Reporting Standards (IFRS) adopted by the European Union and in accordance with Bank of Spain Circular 4/2004 and with its subsequent amendments. As regards the stake in the Garanti Group, the information is presented as in previous periods and consolidated in proportion to the percentage of the Group’s stake. See pages 47 and 48 for the reconciliation of the BBVA Group’s financial statements.
| (1) | The capital ratios in 2014 have been calculated under the Basel III phased-in regulations. For previous periods, the calculation was done in accordance with the Basel II regulations in force at the time. |
| (2) | Excluding Garanti. |
Information about the net attributable profit (excluding results from corporate operations)(1) | 31-12-14 | D% | 31-12-13 | 31-12-12 | ||||||||||||
Net attributable profit | 2,618 | 86.4 | 1,405 | 373 | ||||||||||||
Net attributable profit per share (euros) | 0.44 | 83.6 | 0.24 | 0.08 | ||||||||||||
ROE | 5.6 | 3.1 | 0.9 | |||||||||||||
ROTE | 6.5 | 3.8 | 1.1 | |||||||||||||
ROA | 0.50 | 0.35 | 0.16 | |||||||||||||
RORWA | 0.90 | 0.66 | 0.31 | |||||||||||||
| (1) | In 2013 and 2012 the figures include the results from the pension business in Latin America, including the capital gains from their sale; the capital gains from the sale of BBVA Panama; the capital gains generated by the reinsurance operation on the individual life and accident insurance portfolio in Spain; the equity-accounted earnings from CNCB (excluding dividends), together with the effect of the mark-to-market valuation of BBVA’s stake in CNCB following the agreement concluded with the CITIC group, which included the sale of 5.1% of CNCB. |
| 2 | BBVA Group Highlights |
Table of Contents
Thefourth quarter of 2014 has been generally favorable for BBVA across our global footprint.
| 1. | Theexchange rates of most currencies have continued to recover against the euro (except for the Mexican and Colombian pesos) and their cumulative negative effect over the last 12 months has moderated further. |
| 2. | From the point of view ofearnings, it has been a very positive quarter, with net income from ongoing operations growing 9.8% on the previous quarter and 41.7% compared with the figure for the same period in 2013. The excellent performance of gross income, strongly supported by recurring revenue and net trading income (NTI) largely explains this trend, although moderate cost growth has also been a positive influence. However, the figure for provisions (net) and other gains/losses is more negative over the quarter, mainly as a result of the increased restructuring costs announced in previous quarters. Nevertheless, net attributable profit in 2014 stands at €2,618m, up 17.5% year-on-year (42.5% at constant exchange rates), despite the fact that a positive figure of €823m was registered in 2013 from corporate operations. |
| 3. | With respect tobusiness activity, the level of production of new loans was very positive in practically all the geographical areas in which BBVA operates. This is particularly notable in Spain, and has limited the decline in the balance of loans managed by the area compared with previous periods. |
| 4. | As regardsliquidity, the situation of the wholesale funding markets has remained favorable and BBVA and its franchises have continued to have access to the market. In addition, the new targeted longer-term refinancing operations (TLTRO) program announced by the European Central Bank (ECB) and the increased proportion of retail deposits continue to strengthen the Group’s liquidity position and improve its funding structure. BBVA borrowed €2.6 billion at the TLTRO auction held in December. |
| 5. | Insolvency, BBVA has increased its phased-in and fully-loaded capital ratios, thanks to the organic generation of earnings and the capital increases completed during the period (one to implement the “dividend option” in October and the other through an accelerated bookbuilt offering of shares among qualified investors in November). As a result, BBVA continues to maintain its capital levels well above the minimum regulatory requirements. The leverage ratio (fully-loaded) stands at 5.9%, a percentage that continues to compare very favorably with its peer group. |
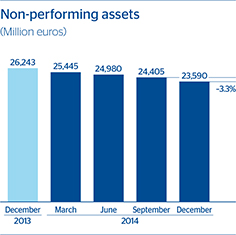
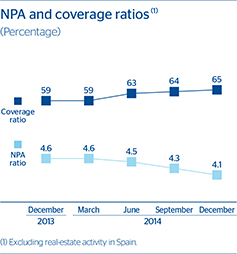
| 6. | The mainrisk indicators have continued to improve, with a 29 basis-point reduction in the Group’s NPA ratio over the last three months to 5.8%. This is due to a further decline in the non-performing portfolio and the increase in total risks. The coverage ratio has also improved to 64%, as has the cost of risk, which for the year to December 2014 fell 34 basis points in year-on-year terms and stands at 1.25%. |
| 7. | Other highlights in the period, apart from the capital increase completed in November and mentioned in the solvency paragraph, include: |
| • | The announcement of severalcorporate operations, which are expected to be closed in the first half of 2015. |
| • | Agreement to increase by 14.89% the stake in Garanti (November) to 39.9%. This operation gives BBVA a majority position on the Board of Directors of Garanti. |
| • | The sale agreement in December of the 29.68% holding in Citic International Financial Holdings Ltd. (CIFH) to China Citic Bank (CNCB). The disposal of this asset will improve even further the Group’s fully-loaded CET 1 (Common Equity Tier 1) capital position. |
| • | Agreement for the sale in January 2015 of a 4.9% stake in CNCB. This operation will also have a positive impact on the bank’s fully-loaded CET 1 ratio. |
| • | With respect toshareholder remuneration, a new capital increase was carried out in December to implement the “dividend option”. On this occasion, the holders of 86.0% of the free allocation rights chose to receive new shares, which once more demonstrates the success of this remuneration system. |
| • | Lastly, BBVA continues to make progress with itsdigital transformation process. Moreover, the year 2014 ends with 9 million digital customers who interact with the Entity via the Internet or cell phone. Of these, 4.2 million are mobile banking customers. In addition, is worth mentioning the acquisition of Madiva Soluciones, a Spanish startup specializing in services based on Big Data and cloud computing. |
| Relevant events | 3 |
Table of Contents
As a result of the adoption of the IFRIC 21 Interpretation on levies issued by the IFRS Interpretation Committee, the accounting policy related to the contributions made to the Deposit Guarantee Fund in Spain was amended in 2014. This change entails that levies are booked when the payment obligation is produced, regardless of when the actual payment is done. In accordance with the International Accounting Standards, this change has been applied retroactively, and therefore certain amounts from previous years have been re-expressed, exclusively for comparison purposes. The main effect of this amendment is that, with respect to the previously published income statements for the year 2013, the amount of the “other operating income and expenses” heading has been modified and, consequently, changes have also been made to the “gross income”, “operating income”, “income before tax”, “net income from ongoing operations”, “net income” and the Group’s “net attributable profit” headings. In 2013, “net attributable profit” would be €2,084m, instead of the €2,228m published under the previous regulations. Additionally, the
Group’s total equity in 2013 would change from €44,850m published with the previous regulation to €44,565m. However, in the explanations contained in this quarterly information, the 2013 figures have been maintained as presented previously, in order to isolate the effect of the aforementioned modification on the year-on-year variations in the various income headings. Pages 47 and 48 of this document present a reconciliation between the Group’s financial statements presented in this quarterly information and the audited financial statements.
The Group’s earnings in thefourth quarter of 2014 have been very favorable, with the main headings continuing the trend observed throughout the year. Their most relevant features are summarized below:
| 1. | Another upturn inrecurring revenue, registering the best quarterly figure of the year, thanks to growth in net interest income in all the geographical areas and high income from fees and commissions. |
Consolidated income statement: quarterly evolution(1)
(Million euros)
| 2014 | 2013 | |||||||||||||||||||||||||||||||
| 4Q | 3Q | 2Q | 1Q | 4Q | 3Q | 2Q | 1Q | |||||||||||||||||||||||||
Net interest income | 4,248 | 3,830 | 3,647 | 3,391 | 3,760 | 3,551 | 3,679 | 3,623 | ||||||||||||||||||||||||
Net fees and commissions | 1,168 | 1,111 | 1,101 | 985 | 1,139 | 1,114 | 1,126 | 1,052 | ||||||||||||||||||||||||
Net trading income | 514 | 444 | 426 | 751 | 609 | 569 | 630 | 719 | ||||||||||||||||||||||||
Dividend income | 119 | 42 | 342 | 29 | 114 | 56 | 176 | 19 | ||||||||||||||||||||||||
Income by the equity method | 3 | 31 | 16 | (14 | ) | 53 | 9 | 11 | (1 | ) | ||||||||||||||||||||||
Other operating income and expenses | (287 | ) | (234 | ) | (215 | ) | (90 | ) | (353 | ) | (113 | ) | (153 | ) | 7 | |||||||||||||||||
Gross income | 5,765 | 5,223 | 5,317 | 5,051 | 5,321 | 5,186 | 5,470 | 5,419 | ||||||||||||||||||||||||
Operating expenses | (2,905 | ) | (2,770 | ) | (2,662 | ) | (2,613 | ) | (2,852 | ) | (2,777 | ) | (2,814 | ) | (2,758 | ) | ||||||||||||||||
Personnel expenses | (1,438 | ) | (1,438 | ) | (1,359 | ) | (1,375 | ) | (1,423 | ) | (1,452 | ) | (1,454 | ) | (1,458 | ) | ||||||||||||||||
General and administrative expenses | (1,147 | ) | (1,037 | ) | (1,017 | ) | (959 | ) | (1,134 | ) | (1,042 | ) | (1,080 | ) | (1,025 | ) | ||||||||||||||||
Depreciation and amortization | (320 | ) | (296 | ) | (286 | ) | (279 | ) | (295 | ) | (283 | ) | (279 | ) | (276 | ) | ||||||||||||||||
Operating income | 2,860 | 2,453 | 2,655 | 2,438 | 2,469 | 2,410 | 2,656 | 2,661 | ||||||||||||||||||||||||
Impairment on financial assets (net) | (1,168 | ) | (1,142 | ) | (1,073 | ) | (1,103 | ) | (1,210 | ) | (1,854 | ) | (1,336 | ) | (1,376 | ) | ||||||||||||||||
Provisions (net) | (513 | ) | (199 | ) | (298 | ) | (144 | ) | (196 | ) | (137 | ) | (130 | ) | (167 | ) | ||||||||||||||||
Other gains (losses) | (201 | ) | (136 | ) | (191 | ) | (173 | ) | (382 | ) | (198 | ) | (172 | ) | (287 | ) | ||||||||||||||||
Income before tax | 978 | 976 | 1,092 | 1,017 | 682 | 221 | 1,017 | 831 | ||||||||||||||||||||||||
Income tax | (173 | ) | (243 | ) | (292 | ) | (273 | ) | (114 | ) | (13 | ) | (261 | ) | (205 | ) | ||||||||||||||||
Net income from ongoing operations | 805 | 733 | 800 | 744 | 568 | 208 | 756 | 626 | ||||||||||||||||||||||||
Results from corporate operations | — | — | — | — | (1,245 | ) | 160 | 593 | 1,315 | |||||||||||||||||||||||
Net income | 805 | 733 | 800 | 744 | (677 | ) | 368 | 1,349 | 1,941 | |||||||||||||||||||||||
Non-controlling interests | (116 | ) | (132 | ) | (95 | ) | (120 | ) | (172 | ) | (172 | ) | (202 | ) | (206 | ) | ||||||||||||||||
Net attributable profit | 689 | 601 | 704 | 624 | (849 | ) | 195 | 1,147 | 1,734 | |||||||||||||||||||||||
Net attributable profit (excluding results from corporate operations)(2) | 689 | 601 | 704 | 624 | 396 | 35 | 554 | 420 | ||||||||||||||||||||||||
Basic earnings per share (euros) | 0.11 | 0.10 | 0.12 | 0.10 | (0.14 | ) | 0.03 | 0.19 | 0.29 | |||||||||||||||||||||||
Basic earnings per share (excluding results from corporate operations) (euros)(2) | 0.11 | 0.10 | 0.12 | 0.10 | 0.07 | 0.01 | 0.09 | 0.07 | ||||||||||||||||||||||||
| (1) | Pro forma financial statements with the revenues and expenses of the Garanti Group consolidated in proportion to the percentage of the Group’s stake. |
| (2) | In 2013 the figures include the results from the pension business in Latin America, including the capital gains from their sale; the capital gains from the sale of BBVA Panama; the capital gains generated by the reinsurance operation on the individual life and accident insurance portfolio in Spain; the equity-accounted earnings from CNCB (excluding dividends), together with the effect of the mark-to-market valuation of BBVA’s stake in CNCB following the agreement concluded with the CITIC group, which included the sale of 5.1% of CNCB. |
| 4 | Group information |
Table of Contents
Consolidated income statement(1)
(Million euros)
| 2014 | D% | D% at constant exchange rates | 2013 | |||||||||||||
Net interest income | 15,116 | 3.4 | 15.6 | 14,613 | ||||||||||||
Net fees and commissions | 4,365 | (1.5 | ) | 6.1 | 4,431 | |||||||||||
Net trading income | 2,135 | (15.5 | ) | (7.0 | ) | 2,527 | ||||||||||
Dividend income | 531 | 45.5 | 46.7 | 365 | ||||||||||||
Income by the equity method | 35 | (51.9 | ) | (48.1 | ) | 72 | ||||||||||
Other operating income and expenses | (826 | ) | 34.8 | 260.3 | (612 | ) | ||||||||||
Gross income | 21,357 | (0.2 | ) | 8.5 | 21,397 | |||||||||||
Operating expenses | (10,951 | ) | (2.2 | ) | 4.3 | (11,201 | ) | |||||||||
Personnel expenses | (5,609 | ) | (3.1 | ) | 2.7 | (5,788 | ) | |||||||||
General and administrative expenses | �� | (4,161 | ) | (2.8 | ) | 5.1 | (4,280 | ) | ||||||||
Depreciation and amortization | (1,180 | ) | 4.2 | 9.9 | (1,133 | ) | ||||||||||
Operating income | 10,406 | 2.1 | 13.2 | 10,196 | ||||||||||||
Impairment on financial assets (net) | (4,486 | ) | (22.3 | ) | (19.2 | ) | (5,776 | ) | ||||||||
Provisions (net) | (1,155 | ) | 83.4 | 108.4 | (630 | ) | ||||||||||
Other gains (losses) | (701 | ) | (32.5 | ) | (32.1 | ) | (1,040 | ) | ||||||||
Income before tax | 4,063 | 47.7 | 97.9 | 2,750 | ||||||||||||
Income tax | (981 | ) | 65.5 | 118.8 | (593 | ) | ||||||||||
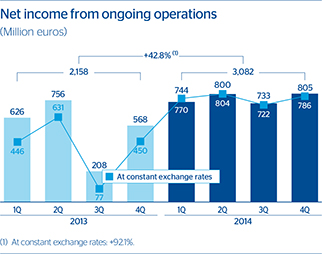
Net income from ongoing operations | 3,082 | 42.8 | 92.1 | 2,158 | ||||||||||||
Results from corporate operations | — | — | — | 823 | ||||||||||||
Net income | 3,082 | 3.4 | 27.6 | 2,981 | ||||||||||||
Non-controlling interests | (464 | ) | (38.4 | ) | (19.8 | ) | (753 | ) | ||||||||
Net attributable profit | 2,618 | 17.5 | 42.5 | 2,228 | ||||||||||||
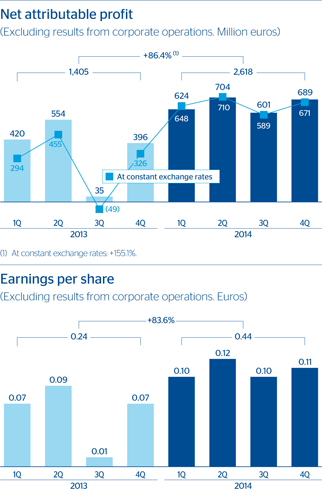
Net attributable profit (excluding results from corporate operations)(2) | 2,618 | 86.4 | 155.1 | 1,405 | ||||||||||||
Basic earnings per share (euros) | 0.44 | 0.38 | ||||||||||||||
Basic earnings per share (excluding results from corporate operations) (euros)(2) | 0.44 | 0.24 | ||||||||||||||
| (1) | Pro forma financial statements with the revenues and expenses of the Garanti Group consolidated in proportion to the percentage of the Group’s stake. |
| (2) | In 2013 the figures include the results from the pension business in Latin America, including the capital gains from their sale; the capital gains from the sale of BBVA Panama; the capital gains generated by the reinsurance operation on the individual life and accident insurance portfolio in Spain; the equity-accounted earnings from CNCB (excluding dividends), together with the effect of the mark-to-market valuation of BBVA’s stake in CNCB following the agreement concluded with the CITIC group, which included the sale of 5.1% of CNCB. |
| 2. | The figures forNTI have also been positive, largely as a result of the capital gains generated from the sale of the ALCO (Assets and Liabilities Committee) portfolio and the recovery of European markets after a modest third quarter. |
| 3. | Accounting for thedividend from Telefónica. |
| 4. | Under theother operating income and expenses heading, a very negative adjustment for hyperinflation in Venezuela in the quarter and accounting for the Tax on Deposits in Financial Institutions (IDEC) in Spain. Both charges are partially offset by the positive performance of insurance activities over the period. |
| 5. | Moderate growth inoperating expenses, above all because they have been kept firmly in check in Spain and the Corporate Center. |
| 6. | Impairment losses on financial assets similar to the third quarter. |
| 7. | Provisions (net) and other gains (losses) have been more negative in the quarter, due mainly to higher restructuring costs, in line with what was announced in the third quarter. |
| 8. | Overall,net income from ongoing operations from October to December amounted to €805m, the highest figure in 2014, and well above the €568m reported in the same period in 2013. |
| 9. | Recovery in theexchange rates of most of the currencies against the euro, except for the Mexican and Colombian peso. |
Gross income
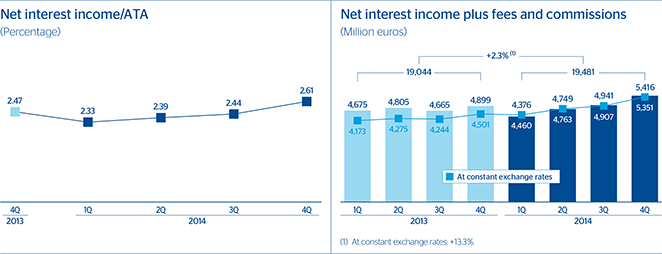
As mentioned above, one of the most notable elements in the fourth quarter has been the increase innet interestincome across BBVA’s global footprint. In Spain, the increase is mainly the result of the decline in the cost of deposits, although it is also influenced by the lower level of deleveraging. In Turkey and Mexico, the key has been the quarterly growth in activity and the increased contribution from the securities portfolio. In the United States, there has also been a positive effect from the strength of business activity, in a quarter where the narrowing of spreads has been far less pronounced. Lastly, in South America, the increase is supported by growing business volumes and improved spreads. As a result of the above factors, net interest income from October to December has been 10.9% higher than in the third quarter and 13.0% higher than in the same period in 2013. For the year as a whole, net interest income stands at €15,116m, up 3.4% on the figure for 2013, or 15.6% excluding the negative impact of exchange rates.
| Earnings | 5 |
Table of Contents
The trend inincome from fees and commissions has also been positive in the quarter. In Spain, the improvement is largely due to the strong activity in the Group’s wholesale banking businesses, as is the case in the United States. In the other geographical areas, this positive performance is very closely related to the increased banking activity mentioned above. As a result, the cumulative income from fees and commissions decreased by 1.5% in 2014. This is below the figure for the previous year, but excluding the negative currency effect, the rise is 6.1%. It should be noted that this growth has been affected by certain regulatory constraints. In the case of Spain, they include certain regulations limiting revenue from credit cards and pension fund management.
Overall,more recurring revenue has performed very well. The cumulative total for 2014 increased by 2.3% year-on-year (13.3% at constant exchange rates).
At €2,135m,NTI is below last year’s figure. It should be noted that the figure for the fourth quarter includes capital gains generated by the sale of the ALCO portfolios, as well as an increased contribution from the Global Markets unit in the different geographical areas.
The figure fordividends in the quarter includes those from the Group’s stake in Telefónica.
Income by the equity method basically includes income from the Group’s stake in the Chinese entity CIFH until the month of November.
Breakdown of yields and costs
| 4Q14 | 3Q14 | 2Q14 | 1Q14 | 4Q13 | ||||||||||||||||||||||||||||||||||||
| % of ATA | % yield/ Cost | % of ATA | % yield/ Cost | % of ATA | % yield/ Cost | % of ATA | % yield/ Cost | % of ATA | % yield/ Cost | |||||||||||||||||||||||||||||||
Cash and balances with central banks | 4.4 | 0.49 | 3.9 | 0.40 | 4.6 | 0.51 | 4.5 | 0.56 | 4.8 | 0.57 | ||||||||||||||||||||||||||||||
Financial assets and derivatives | 29.2 | 2.65 | 29.1 | 2.56 | 28.7 | 2.68 | 27.5 | 2.89 | 26.7 | 3.04 | ||||||||||||||||||||||||||||||
Loans and advances to credit institutions | 4.3 | 1.01 | 4.4 | 1.10 | 4.1 | 1.24 | 3.9 | 1.53 | 4.5 | 1.98 | ||||||||||||||||||||||||||||||
Loans and advances to customers | 54.3 | 5.81 | 54.8 | 5.51 | 54.9 | 5.54 | 56.2 | 5.34 | 56.2 | 5.63 | ||||||||||||||||||||||||||||||
Euros | 28.7 | 2.46 | 30.0 | 2.52 | 31.1 | 2.63 | 32.4 | 2.68 | 32.6 | 2.62 | ||||||||||||||||||||||||||||||
Foreign currencies | 25.5 | 9.58 | 24.7 | 9.15 | 23.8 | 9.33 | 23.8 | 8.95 | 23.6 | 9.80 | ||||||||||||||||||||||||||||||
Other assets | 7.8 | 0.54 | 7.9 | 0.50 | 7.7 | 0.40 | 7.8 | 0.48 | 7.9 | 0.29 | ||||||||||||||||||||||||||||||
Total assets | 100.0 | 4.04 | 100.0 | 3.87 | 100.0 | 3.91 | 100.0 | 3.92 | 100.0 | 4.11 | ||||||||||||||||||||||||||||||
Deposits from central banks and credit institutions | 14.6 | 1.64 | 12.9 | 1.74 | 13.9 | 1.89 | 14.2 | 1.80 | 14.5 | 1.82 | ||||||||||||||||||||||||||||||
Deposits from customers | 50.9 | 1.43 | 52.1 | 1.45 | 51.4 | 1.57 | 51.2 | 1.60 | 50.7 | 1.65 | ||||||||||||||||||||||||||||||
Euros | 25.2 | 0.87 | 26.7 | 0.98 | 26.7 | 1.14 | 26.8 | 1.28 | 26.3 | 1.20 | ||||||||||||||||||||||||||||||
Foreign currencies | 25.7 | 1.97 | 25.4 | 1.94 | 24.7 | 2.03 | 24.4 | 1.95 | 25.2 | 1.75 | ||||||||||||||||||||||||||||||
Debt certificates and subordinated liabilities | 12.5 | 2.25 | 13.2 | 2.24 | 13.7 | 2.36 | 13.9 | 2.40 | 14.0 | 2.63 | ||||||||||||||||||||||||||||||
Other liabilities | 14.1 | 1.28 | 14.1 | 1.10 | 13.5 | 1.00 | 13.1 | 1.33 | 13.1 | 1.28 | ||||||||||||||||||||||||||||||
Equity | 7.8 | — | 7.6 | — | 7.5 | — | 7.5 | — | 7.6 | — | ||||||||||||||||||||||||||||||
Total liabilities and equity | 100.0 | 1.43 | 100.0 | 1.43 | 100.0 | 1.53 | 100.0 | 1.59 | 100.0 | 1.64 | ||||||||||||||||||||||||||||||
Net interest income/average total assets (ATA) | 2.61 | 2.44 | 2.39 | 2.33 | 2.47 | |||||||||||||||||||||||||||||||||||
| 6 | Group information |
Table of Contents
Lastly,other operating income and expenses for the quarter includes an adjustment for hyperinflation in Venezuela that is more negative than in previous periods, as well as the aforementioned charge for payment of the IDEC deposit tax in Spain. It is important to remember that in the fourth quarter of 2013 this heading included the extraordinary payment to the Deposit Guarantee Fund in Spain in compliance with Royal Decree-Law 6/2013.
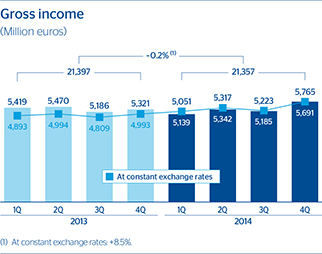
In short, BBVA generatedgross income for the quarter of €5,765m, the highest figure in the last two years. For the year as a whole, gross income amounted to €21,357m, a similar amount to 2013 at current exchange rates, but 8.5% higher at constant exchange rates.
Operating income
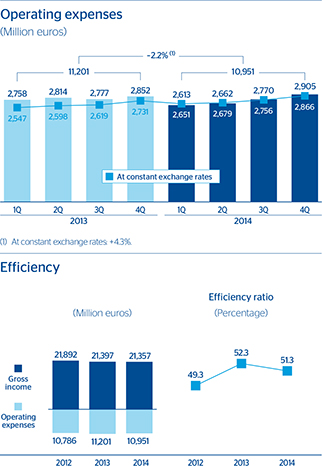
Operating expenses for the quarter stand at €2,905m, giving a cumulative figure for 2014 of €10,951m, 2.2% below the figure for 2013 (although up 4.3% at constant exchange rates), despite the effect of high inflation in some countries (Venezuela and Argentina) and the digital transformation plans being implemented by the Group. By geographical area, there has
been a year-on-year reduction in operating expenses in Spain and in the rest of Europe; they were held in check in the United States (despite the impact of the incorporation of Simple); and they grew, as expected, in the rest of the geographical areas.
Breakdown of operating expenses and efficiency calculation
(Million euros)
| 2014 | D% | 2013 | ||||||||||
Personnel expenses | 5,609 | (3.1 | ) | 5,788 | ||||||||
Wages and salaries | 4,268 | (2.8 | ) | 4,392 | ||||||||
Employee welfare expenses | 826 | (4.6 | ) | 866 | ||||||||
Training expenses and other | 515 | (2.7 | ) | 530 | ||||||||
General and administrative expenses | 4,161 | (2.8 | ) | 4,280 | ||||||||
Premises | 963 | (0.4 | ) | 966 | ||||||||
IT | 831 | 3.8 | 801 | |||||||||
Communications | 288 | (8.0 | ) | 313 | ||||||||
Advertising and publicity | 346 | (11.3 | ) | 391 | ||||||||
Corporate expenses | 103 | (2.6 | ) | 106 | ||||||||
Other expenses | 1,194 | (5.8 | ) | 1,268 | ||||||||
Levies and taxes | 437 | 0.1 | 437 | |||||||||
Administration expenses | 9,771 | (3.0 | ) | 10,068 | ||||||||
Depreciation and amortization | 1,180 | 4.2 | 1,133 | |||||||||
Operating expenses | 10,951 | (2.2 | ) | 11,201 | ||||||||
Gross income | 21,357 | (0.2 | ) | 21,397 | ||||||||
Efficiency ratio (Operating expenses/gross income, in %) | 51.3 | 52.3 | ||||||||||
| Earnings | 7 |
Table of Contents
The number ofATMs continues to grow. It has done so in practically all the geographical areas over the quarter. In contrast, the number ofbranch offices has fallen, as a result of the boost to alternative channels.
With respect to theworkforce, the number of employees in the Group stood at 108,770 as of 31-Dec-2014. This figure is practically the same as at the close of September (108,920) and 0.5% below the figure for the close of 2013. By geographical area, the numbers continued to fall in Spain and in the United States, while there were new hirings in the rest of the areas.
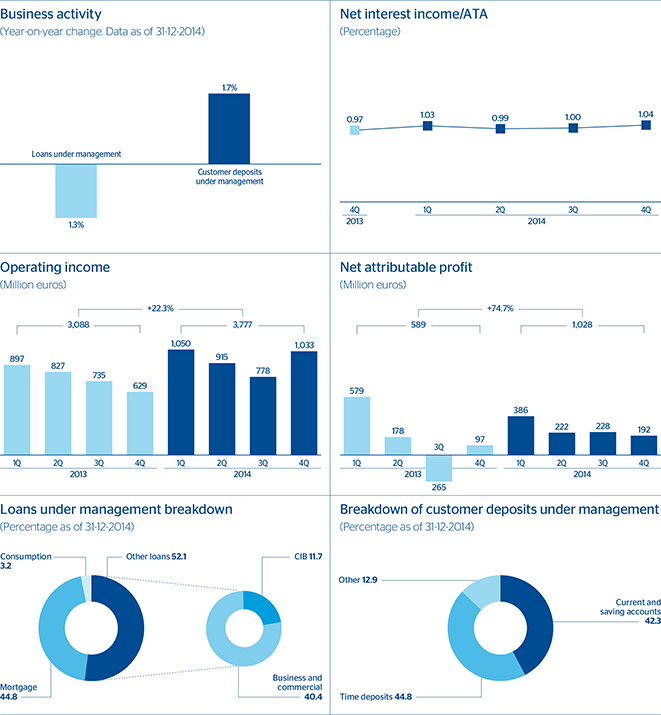
For 2014 as a whole, the year-on-year increase in expenses has been below that of gross income, thus improving the efficiency ratio to 51.3% from the figure of 52.3% in 2013, and boostingoperating income to €10,406m, a year-on-year increase of 2.1%, or 13.2% excluding the impact of exchange rates.
Provisions and others
Impairment losses on financial assets for the last three months of the year are similar to those booked between June and September 2014, so the cumulative total for the year amounts to €4,486m. This figure represents a year-on-year decline of 22.3% (down 19.2% at constant exchange rates), due largely to its steady return to normal in Spain. The Group’s cumulative cost of risk in 2014 closed at 1.25%, compared with 1.59% the previous year.
Provisions include items such as restructuring costs, provisions for contingent liabilities and contributions to pension funds. In the last quarter, this heading includes a greater volume of restructuring costs associated with the digitization and transformation process underway in the Group, in line with the announcement made in the third quarter.
| 8 | Group information |
Table of Contents
The main component ofother gains (losses) is the provisions for real-estate and foreclosed or acquired assets in Spain, which in 2014 have declined year-on-year by 32.5% (down 32.1% at constant exchange rates).
As a result of the above,net income from ongoing operations in the year grew year-on-year by 42.8% (up 92.1% at constant exchange rates).
Lastly, no transaction has been recorded in 2014 under theresults from corporate operations heading, unlike the case in 2013, when it included the following items: the reinsurance operation on the individual life-risk insurance portfolio in Spain (first quarter); the earnings from the Group’s pension business in Latin America (including the capital gains from the sale of the Afore pension manager in Mexico in the first quarter, the pension fund administrators in Colombia and Peru in the second quarter and the pension fund administrator in Chile in the fourth quarter); the capital gains from the sale of BBVA Panama (fourth quarter); and, lastly, the effect of the signing of the agreement with CITIC Limited (fourth quarter), which involved the disposal of 5.1% of CNCB, valuing BBVA’s entire stake in CNCB at mark-to-market (fourth quarter). The equity-accounted income (excluding dividends) of CNCB had been included in the first, second and third quarters of 2013.
Net attributable profit
BBVA’snet attributable profit in 2014 stands at €2,618m, up 17.5% on the figure for 2013 (up 42.5% at constant exchange rates), despite the fact that in 2013 earnings for an amount of €823m were registered from the corporate operations mentioned in the above paragraph.
Bybusiness area, banking activity in Spain has contributed €1,028m, real-estate activity in Spain generated a loss of €876m, while the United States contributed €428m, Eurasia €565m, Mexico €1,915m and South America €1,001m.
| Earnings | 9 |
Table of Contents
Balance sheet and business activity
The Group’s balance sheet and business activity in thelast quarter of 2014 was marked by:
| • | Theexchange-rate gains against the euro of the main currencies that have an influence on the Group’s financial statements, except for the Mexican and Colombian peso, which depreciated by 4.9% and 12.2%, respectively, between October and December. Over the last 12 months, the appreciation of the Mexican peso, U.S. dollar, Peruvian new sol and Turkish lira has had a positive effect on the year-on-year changes in the headings of the Group’s balance sheet and its business activity. |
| • | Faster growth ingross lending to customers, which at the close of the year was up 1.5% in the quarter and 4.7% over the year as a whole, at current exchange rates. As regards performance by area, the deleveraging process has slowed in Spain, thanks to the recovery of the production of new loans, while in the United States, Mexico, Turkey and South America the loan book has grown at double-digit year-on-year growth rates. |
Consolidated balance sheet(1)
(Million euros)
| 31-12-14 | D% | 31-12-13 | 30-09-14 | |||||||||||||
Cash and balances with central banks | 33,908 | (8.5 | ) | 37,064 | 23,121 | |||||||||||
Financial assets held for trading | 83,427 | 15.4 | 72,301 | 88,023 | ||||||||||||
Other financial assets designated at fair value | 3,236 | 18.3 | 2,734 | 3,227 | ||||||||||||
Available-for-sale financial assets | 98,734 | 22.1 | 80,848 | 98,322 | ||||||||||||
Loans and receivables | 386,839 | 6.4 | 363,575 | 379,715 | ||||||||||||
Loans and advances to credit institutions | 28,254 | 16.7 | 24,203 | 27,561 | ||||||||||||
Loans and advances to customers | 351,755 | 5.1 | 334,744 | 346,103 | ||||||||||||
Debt securities | 6,831 | 47.6 | 4,628 | 6,051 | ||||||||||||
Held-to-maturity investments | — | — | — | — | ||||||||||||
Investments in entities accounted for using the equity method | 661 | (55.8 | ) | 1,497 | 1,443 | |||||||||||
Tangible assets | 8,014 | 3.8 | 7,723 | 7,762 | ||||||||||||
Intangible assets | 8,840 | 8.3 | 8,165 | 8,621 | ||||||||||||
Other assets | 27,851 | 8.7 | 25,611 | 27,465 | ||||||||||||
Total assets | 651,511 | 8.7 | 599,517 | 637,699 | ||||||||||||
Financial liabilities held for trading | 56,990 | 24.5 | 45,782 | 59,084 | ||||||||||||
Other financial liabilities designated at fair value | 3,590 | 29.5 | 2,772 | 3,615 | ||||||||||||
Financial liabilities at amortized cost | 509,974 | 6.2 | 480,307 | 497,179 | ||||||||||||
Deposits from central banks and credit institutions | 97,735 | 11.4 | 87,746 | 84,199 | ||||||||||||
Deposits from customers | 330,686 | 6.6 | 310,176 | 329,610 | ||||||||||||
Debt certificates | 59,393 | (9.3 | ) | 65,497 | 61,181 | |||||||||||
Subordinated liabilities | 14,118 | 33.5 | 10,579 | 14,265 | ||||||||||||
Other financial liabilities | 8,042 | 27.5 | 6,309 | 7,923 | ||||||||||||
Liabilities under insurance contracts | 10,471 | 6.4 | 9,844 | 10,624 | ||||||||||||
Other liabilities | 18,877 | 18.3 | 15,962 | 18,808 | ||||||||||||
Total liabilities | 599,902 | 8.2 | 554,667 | 589,310 | ||||||||||||
Non-controlling interests | 2,511 | 5.9 | 2,371 | 2,253 | ||||||||||||
Valuation adjustments | (348 | ) | (90.9 | ) | (3,831 | ) | (879 | ) | ||||||||
Shareholders’ funds | 49,446 | 6.8 | 46,310 | 47,015 | ||||||||||||
Total equity | 51,609 | 15.1 | 44,850 | 48,389 | ||||||||||||
Total equity and liabilities | 651,511 | 8.7 | 599,517 | 637,699 | ||||||||||||
Memorandum item: | ||||||||||||||||
Contingent liabilities | 37,070 | 1.7 | 36,437 | 36,864 | ||||||||||||
| (1) | Pro forma financial statements with the assets and liabilities of the Garanti Group consolidated in proportion to the percentage of the Group’s stake. |
| 10 | Group information |
Table of Contents
| • | Non-performing loans have continued to decline throughout the year, although at a faster pace in the second half. The steepest declines have been registered in Spain. Non-performing assets fell 3.4% in the quarter and 10.3% over the year, also at current exchange rates. |
| • | Customer deposits closed December at a similar level to 30-Sep-2014 and are up 6.6% over the year as a whole, at current exchange rates. This heading continues to perform well in the non-domestic sector. In the domestic sector it is down in time deposits and in the public sector segment. This decline is the result of the reduction in the cost of time deposits, which has led to a transfer of money to current and savings accounts and to mutual and pension funds. |
Loans and advances to customers
(Million euros)
| 31-12-14 | D% | 31-12-13 | 30-09-14 | |||||||||||||
Domestic sector | 162,652 | (3.0 | ) | 167,670 | 162,301 | |||||||||||
Public sector | 23,362 | 5.6 | 22,128 | 23,302 | ||||||||||||
Other domestic sectors | 139,290 | (4.3 | ) | 145,542 | 138,999 | |||||||||||
Secured loans | 87,371 | (6.5 | ) | 93,446 | 88,880 | |||||||||||
Other loans | 51,920 | (0.3 | ) | 52,095 | 50,119 | |||||||||||
Non-domestic sector | 180,719 | 15.4 | 156,615 | 174,800 | ||||||||||||
Secured loans | 72,836 | 16.7 | 62,401 | 71,063 | ||||||||||||
Other loans | 107,883 | 14.5 | 94,214 | 103,737 | ||||||||||||
Non-performing loans | 23,164 | (10.3 | ) | 25,826 | 23,983 | |||||||||||
Domestic sector | 18,563 | (11.5 | ) | 20,985 | 19,243 | |||||||||||
Non-domestic sector | 4,601 | (5.0 | ) | 4,841 | 4,740 | |||||||||||
Loans and advances to customers (gross) | 366,536 | 4.7 | 350,110 | 361,084 | ||||||||||||
Loan-loss provisions | (14,781 | ) | (3.8 | ) | (15,366 | ) | (14,980 | ) | ||||||||
Loans and advances to customers | 351,755 | 5.1 | 334,744 | 346,103 | ||||||||||||
| • | Lastly,off-balance-sheet customer funds continue to perform very favorably, above all in Spain (up 2.4% over the last three months and 17.6% in year-on-year terms), due to the aforementioned transfer of funds; however, their performance has also been positive in the rest of the geographical areas (up 14.1% year-on-year at current exchange rates). |
Customer funds
(Million euros)
| 31-12-14 | D% | 31-12-13 | 30-09-14 | |||||||||||||
Deposits from customers | 330,686 | 6.6 | 310,176 | 329,610 | ||||||||||||
Domestic sector | 145,251 | (3.9 | ) | 151,070 | 150,840 | |||||||||||
Public sector | 10,651 | (26.2 | ) | 14,435 | 16,240 | |||||||||||
Other domestic sectors | 134,600 | (1.5 | ) | 136,635 | 134,600 | |||||||||||
Current and savings accounts | 59,509 | 11.1 | 53,558 | 55,236 | ||||||||||||
Time deposits | 60,783 | (13.1 | ) | 69,977 | 65,636 | |||||||||||
Assets sold under repurchase agreement and other | 14,308 | 9.2 | 13,100 | 13,729 | ||||||||||||
Non-domestic sector | 185,435 | 16.5 | 159,106 | 178,770 | ||||||||||||
Current and savings accounts | 113,795 | 12.1 | 101,515 | 108,154 | ||||||||||||
Time deposits | 62,705 | 27.3 | 49,266 | 60,580 | ||||||||||||
Assets sold under repurchase agreement and other | 8,935 | 7.3 | 8,325 | 10,035 | ||||||||||||
Other customer funds | 115,274 | 16.2 | 99,213 | 114,630 | ||||||||||||
Spain | 69,943 | 17.6 | 59,490 | 68,301 | ||||||||||||
Mutual funds | 28,695 | 28.7 | 22,298 | 27,552 | ||||||||||||
Pension funds | 21,880 | 7.1 | 20,428 | 21,677 | ||||||||||||
Customer portfolios | 19,368 | 15.5 | 16,763 | 19,073 | ||||||||||||
Rest of the world | 45,332 | 14.1 | 39,723 | 46,329 | ||||||||||||
Mutual funds and investment companies | 24,087 | 13.7 | 21,180 | 25,294 | ||||||||||||
Pension funds | 5,484 | 29.5 | 4,234 | 5,079 | ||||||||||||
Customer portfolios | 15,761 | 10.1 | 14,309 | 15,956 | ||||||||||||
Total customer funds | 445,960 | 8.9 | 409,389 | 444,240 | ||||||||||||
| Balance sheet and business activity | 11 |
Table of Contents
In thefourth quarter of 2014, BBVA has continued to carry out active management of its capital. The most relevant events that have influenced the Group’s capital base are as follows:
| • | Acapital increase was completed last November for €2,000m through an accelerated bookbuilt offering targeted at institutional investors, which has strengthened the Group’s capital adequacy ratios by 58 basis points at the date of its execution. |
| • | RWAs stood at €350,588m as of 31-Dec-2014, up 1.5% since the end of September, due basically to exchange-rate movements, increased activity in emerging countries and the United States, and the lower level of deleveraging in Spain as a result of the growth in the production of new loans. |
| • | These two factors, combined with the other factors impacting the capital base (organic growth, variation due to exchange rates and increase in some deductions), have resulted in an increase in the phased-incore capital ratio to 12.0% (10.4% fully-loaded). |
| • | There were no significant changes in the last quarter in theTier II ratio (also phased-in), which stands at 3.2% as of 31-Dec-2014, exactly the same level as in the previous quarter. |
| • | Lastly, as a result of what has been mentioned above, the phased-inBIS III ratio closed the year at 15.1% and the fully-loaded ratio at 14.2%, both well above current regulatory requirements (8.0%). |
In short, BBVA Group continues to manage its solvency ratios appropriately and has a strong capital position that is clearly above regulatory requirements.
Ratings
Following the announcement of the acquisition of the additional 14.89% in Garanti Bank, in November 2014 the main agencies verified BBVA’s rating. The upgrades in the Bank’s ratings in the first half of 2014 have thus been confirmed.
Ratings
Long term | Short term | Outlook | ||||
DBRS | A | R-1 (low) | Negative | |||
Fitch | A– | F-2 | Stable | |||
Moody’s | Baa2 | P-2 | Positive | |||
Scope Ratings | A | S-1 | Stable | |||
Standard & Poor’s | BBB | A-2 | Stable |
Capital base
(Million euros)
| BIS III phased-in | BIS II | |||||||||||||||||||
| 31-12-14 | 30-09-14 | 30-06-14 | 31-03-14 | 31-12-13 | ||||||||||||||||
Core capital | 41,937 | 40,422 | 38,978 | 38,700 | 37,492 | |||||||||||||||
Capital (Tier I) | 41,937 | 40,422 | 38,978 | 38,700 | 39,611 | |||||||||||||||
Other eligible capital (Tier II) | 11,046 | 10,893 | 10,421 | 9,170 | 8,695 | |||||||||||||||
Capital base | 52,983 | 51,316 | 49,399 | 47,870 | 48,306 | |||||||||||||||
Risk-weighted assets | 350,588 | 345,381 | 336,584 | 335,276 | 323,605 | |||||||||||||||
BIS ratio (%) | 15.1 | 14.9 | 14.7 | 14.3 | 14.9 | |||||||||||||||
Core capital (%) | 12.0 | 11.7 | 11.6 | 11.5 | 11.6 | |||||||||||||||
Tier I (%) | 12.0 | 11.7 | 11.6 | 11.5 | 12.2 | |||||||||||||||
Tier II (%) | 3.2 | 3.2 | 3.1 | 2.7 | 2.7 | |||||||||||||||
| 12 | Group information |
Table of Contents
Credit risk
In thelast quarter of 2014 the main variables related to the Group’s credit risk management have been positive, in line with the trend of previous quarters:
| • | The Group’sNPA ratio continued to decline, closing December at 5.8% (including real-estate activity), down from 6.1% in September 2014. This favorable performance cuts across all geographical areas and is due to the declining trend in non-performing assets, combined with an increase in the balance of the loan book. |
| • | The totalcoverage ratio has increased by 142 basis points over the quarter to 64%, also across all the geographical areas. |
Credit risks(1)
(Million euros)
| 31-12-14 | 30-09-14 | 30-06-14 | 31-03-14 | 31-12-13 | ||||||||||||||||
Non-performing assets(2) | 23,590 | 24,405 | 24,980 | 25,445 | 26,243 | |||||||||||||||
Credit risks | 403,633 | 397,952 | 389,355 | 384,577 | 386,401 | |||||||||||||||
Provisions | 15,157 | 15,335 | 15,515 | 15,372 | 15,715 | |||||||||||||||
Specific | 12,169 | 12,436 | 12,750 | 12,752 | 13,030 | |||||||||||||||
Generic and country-risk | 2,988 | 2,899 | 2,765 | 2,620 | 2,684 | |||||||||||||||
NPA ratio (%) | 5.8 | 6.1 | 6.4 | 6.6 | 6.8 | |||||||||||||||
NPA coverage ratio (%) | 64 | 63 | 62 | 60 | 60 | |||||||||||||||
NPA ratio (%) (excluding real-estate activity in Spain) | 4.1 | 4.3 | 4.5 | 4.6 | 4.6 | |||||||||||||||
NPA coverage ratio (%) (excluding real-estate activity in Spain) | 65 | 64 | 63 | 59 | 59 | |||||||||||||||
| (1) | Include gross customer lending plus contingent exposures. |
| (2) | Include non-performing assets originating from lending to customers and contingent liabilities. |
Non-performing assets evolution(1)
(Million euros)
| 4Q14 | 3Q14 | 2Q14 | 1Q14 | 4Q13 | ||||||||||||||||
Beginning balance | 24,405 | 24,980 | 25,445 | 26,243 | 26,508 | |||||||||||||||
Entries | 2,363 | 2,429 | 2,092 | 2,190 | 3,255 | |||||||||||||||
Recoveries | (1,935 | ) | (1,840 | ) | (1,781 | ) | (1,708 | ) | (2,261 | ) | ||||||||||
Net variation | 427 | 589 | 311 | 482 | 993 | |||||||||||||||
Write-offs | (1,248 | ) | (1,297 | ) | (961 | ) | (1,248 | ) | (1,102 | ) | ||||||||||
Exchange rate differences and other | 5 | 133 | 185 | (32 | ) | (155 | ) | |||||||||||||
Period-end balance | 23,590 | 24,405 | 24,980 | 25,445 | 26,243 | |||||||||||||||
Memorandum item: | ||||||||||||||||||||
Non-performing loans | 23,164 | 23,983 | 24,554 | 25,032 | 25,826 | |||||||||||||||
Non-performing contingent liabilities | 426 | 422 | 426 | 413 | 418 | |||||||||||||||
| (1) | Includes non-performing assets originating from lending to customers and contingent liabilities. |
| Risk management | 13 |
Table of Contents
As of 31-Dec-2014, the Group’scredit risk has once more shown an upward movement over the quarter of 1.4% since the end of September. This change has been influenced by strong activity in the Americas and Turkey, as well as the recovery in new production in Spain. Although this recovery is still insufficient to offset the maturities of the current stock of credit, the lending trend is stabilizing.
Non-performing assets once again declined in the quarter, influenced by the reduction in net additions to NPA, due both to the control of gross entries and to increased recoveries with respect to the previous quarter (the ratio of recoveries to gross entries in the quarter has been 81.9% in the fourth quarter).
The Group’sNPA ratio closed 2014 at 5.8% (4.1% excluding real-estate activity in Spain), once again falling 29 basis points over the last three months of the year. The decline was due to the aforementioned reduction in the volume of the non-performing portfolio and the increase in the Group’s credit risk. By area, the ratio in the banking business in Spain stands at 6.0%, with a fall of 20 basis points since September; in real-estate activity in Spain is stable at 55.4%; in Mexico and Eurasia this ratio has improved to 2.9% and to 3.3%, respectively (3.2% for Mexico and 3.4% for Eurasia, with data as of the close of the previous quarter); in South America and in the United States is stable at 2.1% and 0.9% respectively.
Lastly,coverage provisions for customer risk amounted to €15,157m as of 31-Dec-2014, a decline of 1.2% over the quarter. Despite this, and given the aforementioned reduction in the non-performing balances, the Group’s coverage ratio has increased by 142 basis points to 64%. By business area, there has been an increase in the coverage ratio in all the geographical areas: in Spain from 51% to 52% (45% in banking activity and 63% in real-estate activity); in the United States it closed the quarter at 167% (164% in September); in Eurasia it has increased from 91% to 92%; in Mexico to 114% (112% at the close of the third quarter); and in South America it stands at 138% (up from 137% as of 30-Sep-2014).
Structural risks
The Assets and Liabilities Management unit in BBVA’s Strategy and Finance area is responsible for managing the Group’s overall liquidity and structural interest-rate and foreign-exchange positions.
Liquidity and finance management aims to finance the recurring growth of the banking business at suitable maturities and costs, using a wide range of instruments that provide access to a large number of alternative sources of finance. A core principle in BBVA Group’s liquidity and finance management is the financial independence of its banking subsidiaries abroad. This principle prevents the propagation of a liquidity crisis among the Group’s different areas and guarantees correct transmission of the cost of liquidity to the price formation process.
In the fourth quarter of 2014, the liquidity conditions remained comfortable in the euro area. The unconventional measures announced by the ECB at its meeting on June 5, 2014 were followed by a second round in the form of the TLTRO auction of December 2014, at which BBVA borrowed €2.6 billion. The ECB has also launched covered bond purchase programs (CBPP) and asset-backed securities purchase programs (ABSPP). The long-term wholesale funding market in Europe has been stable, thanks to the improvement in sovereign risk premiums and the banking system’s better profile, following the results of the stress tests published this quarter. Short-term funding in Europe has also continued to perform extremely well, in a context marked by a high level of market liquidity. In addition to the above, BBVA’s retail franchise in Spain performed well as a result of its customer-centric strategy and the Entity’s financial soundness.
| 14 | Group information |
Table of Contents
With respect to the Group’s international subsidiaries, the financial soundness of the banks in other jurisdictions is supported by the funding of lending activity basically through the use of customer funds. Of note in this respect is the extraordinary performance of new deposits in Mexico over the year, which has continued into the last quarter. In the case of BBVA Compass, excess liquidity has been the dominant trend over the fourth quarter, despite the demands of lending activity. In both Mexico and the United States, in 2014 BBVA has adapted to the local liquidity coverage ratio (LCR) regulations, which will be binding starting in 2015 for BBVA Bancomer, and in January 2016 in the case of BBVA Compass. With respect to the balance sheets in South America, the liquidity situation has once more been strengthened this quarter by the growth in customer funds and also by bond issues on the respective local markets in Chile, Colombia, Argentina and Paraguay. All these issues have enjoyed an excellent uptake by investors. They have allowed the banks to diversify their sources of finance and demonstrated BBVA’s soundness in the region, as well as the good operation of local markets.
To sum up, BBVA’s proactive policy in its liquidity management, the outstanding performance of customer funds in all geographical areas, its proven ability to access the market, even in difficult environments, its retail business model and the lower volume of maturities compared with its competitors, all give it a comparative advantage against its peers. Moreover, the increased proportion of retail deposits continues to strengthen the Group’s liquidity position and to improve its financing structure.
Foreign-exchange risk management of BBVA’s long-term investments, basically stemming from its franchises abroad, aims to preserve the Group’s capital adequacy ratios and ensure the stability of its income statement.
The fourth quarter of the year saw gains in the dollar against the euro and greater volatility in those emerging currencies affected by the major fall in the oil price. In this context, BBVA has maintained a policy of actively hedging its investments in Mexico, Chile, Colombia, Turkey and the dollar area. In addition to this corporate-level hedging, dollar positions are held at a local level by some of the subsidiary banks. The foreign-exchange risk of the earnings expected from abroad for 2014 is also managed.
The unit also actively manages thestructural interest-rate exposure on the Group’s balance sheet. This aims to maintain a steady growth in net interest income in the short and medium term, regardless of interest-rate fluctuations.
In the fourth quarter of 2014, the results of this management have been very satisfactory, with strategies limiting risk in Europe, the United States and Mexico. These strategies are managed both with hedging derivatives (caps, floors, swaps and FRAs) and with balance-sheet instruments (mainly government bonds with the highest credit ratings and liquidity). The amount of NTI generated in Spain, Mexico and the United States is the result of prudent portfolio management strategies, particularly in terms of sovereign debt, in a context marked by low interest rates.
Economic capital
Attributableeconomic risk capital (ERC) consumption at the end of 2014 stood at €31,569m, up 3.5% with respect to the close of the previous quarter.
As is to be expected from BBVA’s profile, the largest allocation to ERC (52.3%) relates tocredit risk on portfolios originated in the Group’s branch network from its own customer base. Over the last 3 months, ERC from credit risk has increased by 4.2%, due mainly to rises in the United States and South America.
Equity risk, in other words, from the portfolio of holdings in industrial and financial companies, the stake in the CNCB group and consumption of economic capital from goodwill, has increased slightly as a proportion of total risks to 18.1%.
Structural balance-sheet risk, which originates from the management of both, structural interest-rate risk and exchange-rate risk, accounts for 7.2% of all ERC. It has increased by 6.7% during the period.
Operational risk remains stable and accounts for 6.7% of the total, whilefixed-asset risk has reduced its share to 11.7%.
Lastly,trading risk which is of less importance given the nature of the business and BBVA’s policy of minimal proprietary trading, remains at 2.9%.
| Risk management | 15 |
Table of Contents
Theglobal economy continued to grow in the second half of 2014, and at a slightly faster pace than at the beginning of the year (+3.0%), but performance varied from one geographical area to another: sustained improvement in the United States, reduced growth in Europe and Japan, and moderation in China and in other large emerging economies. The impact of the sharp slump in oil prices, which is positive for overall economic activity and exerts a downward pressure on prices, is a new factor that will widen the gap between exporting and importing economies, in a scenario marked by geopolitical tension and diverging monetary policies. Financial assets, interest rates and exchange rates reflect this scenario.
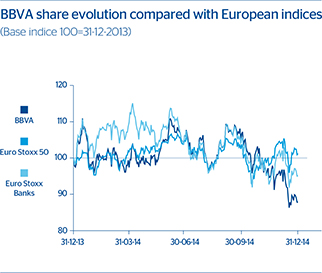
In this context, the mainstock market indices have performed unevenly over the quarter. In Europe, the Euro Stoxx 50 fell by 2.5% and the Ibex 35 by 5.0%, while in the United States the S&P 500 gained 4.4%. The Eurozone’s banking sector index, Euro Stoxx Banks, fell by 9.9%, partly reflecting the uncertainty surrounding growth and monetary policy measures. In contrast, in the United States, the S&P Regional Banks index gained 5.2%.
The BBVA share and share performance ratios
| 31-12-14 | 30-09-14 | |||||||
Number of shareholders | 960,397 | 947,901 | ||||||
Number of shares issued | 6,171,338,995 | 5,887,168,710 | ||||||
Daily average number of shares traded | 59,856,509 | 60,252,342 | ||||||
Daily average trading | 508 | 561 | ||||||
Maximum price (euros) | 9.66 | 9.91 | ||||||
Minimum price (euros) | 7.45 | 8.51 | ||||||
Closing price (euros) | 7.85 | 9.55 | ||||||
Book value per share (euros) | 8.01 | 7.99 | ||||||
Market capitalization (million euros) | 48,470 | 56,228 | ||||||
Price/book value (times) | 1.0 | 1.2 | ||||||
PER (Price/earnings; times) | 17.3 | 18.4 | ||||||
Yield (Dividend/price; %)(1) | 4.5 | 3.8 | ||||||
| (1) | Calculated by dividing the median of the forecast dividend per share of a consensus of analysts by the BBVA share price at the end of each quarter. |
BBVA’searnings for the third quarter of 2014 coincided with the publication of the results of the comprehensive assessment of European banks conducted by the European Central Bank (ECB). For the Group, the results for the period confirm its sound solvency position and its capacity to generate earnings under different scenarios, placing BBVA among the leaders in the ranking of the main European banks.
As of December 31, 2014, theBBVA share closed at €7.85, down 17.8% in the quarter and 12.2% in the year, after a very positive performance in 2013. As of 31-Dec-2014, BBVA weight on the Ibex 35 was 10.11% (2.44% on the Euro Stoxx 50). At year-end 2014, BBVA’s market capitalization amounted to €48,470m, down 13.8% on the figure as of 30-Sep-2014.
With respect toshareholder remuneration, the Board of Directors agreed on December 17 to once again perform a capital increase against reserves for the implementation of a new “dividend option”. Each shareholder had one free allocation right for every BBVA share held on December 19, with 99 rights entitling the holder to receive one new BBVA share. Alternatively, shareholders who wish to receive their remuneration in cash are entitled to sell their rights to BBVA at a gross fixed price of €0.08 per right during the first ten calendar days of their trading period, or on the market during the complete trading period. On this occasion, owners of 86.0% of these rights chose to receive new shares. This once more confirms the excellent response to this system of remuneration and the confidence felt by shareholders in the future performance of the share.
| 16 | Group information |
Table of Contents
Environmental and Social Governance
At BBVA we are convinced that the return adjusted to principles is, in itself, a source of competitive advantage that can ensure the Group’s long-term sustainability.
The most relevant highlights in environmental and social governance in thefourth quarter of 2014 are summarized below:
Transparent, Clear and Responsible (TCR) Communication
BBVA has continued to make progress in its TCR communication strategy. In this regard, a Commercial TCR Communication Code, which began to be implemented on January 1, 2015, has been developed that guarantees the use of simple, clear and precise language in all Group commercial communication and advertising, which will help our customers make the right decisions.
Education
The4th Pensions Event organized by BBVA Pensiones on the theme of financial literacy for retirement was held in October 2014. During the event, it was announced the launch of a new tool that has been designed to facilitate decision-making in matters related to retirement. It is a public pensions simulator adapted to the latest Social Security reforms in Spain that enables the expected pension to be calculated under different scenarios.
The 5th edition of theMomentum Project has also been launched in Spain. For the first time in this program’s history, 5 of the 15 participating social enterprises will come from the organizations recognized in BBVA’s 7th Integra Awards.
Lastly, the Group has received the “Premio Latinoamericano a la Responsabilidad de Empresas” (Latin American Award for Responsibility in Business). The award has highlighted the commitment to education and the integration scholarship program that promotes access to quality education for children and young people from the most underprivileged areas in Latin America.
Products with a high social impact
BBVA has received the Award for Innovation and Social Engagement from the SERES Foundation for promoting job creation through the “Yo Soy Empleo” (I am Employment) initiative. This program has helped 4,614 businesses and self-employed workers create 7,427 jobs in Spain, nearly 70% with permanent employment contracts. On average, those hired had been unemployed for 14 months and 40% were under the age of 30. Of these new jobs, 1,000 correspond to €1,500 non-repayable self-employment aid packages for each new self-employed person starting work in Spain. In addition, in November, BBVA reached an agreement with the ONCE Foundation whereby they will allocate €750,000 in aid packages to create 500 new jobs for disabled people.
Other lines
In partnership with Deusto University, BBVA has organized the series of conferences “Empresa y Banca Responsable” (Business and Responsible Banking), which discussed the link between banking and social innovation processes.
Aware of its responsibility to society, BBVA will donate up to €3 million tocharity projects (Cáritas, Spanish Red Cross and Food Bank).
Team
In Spain, the 6thIntegra Prize was awarded to the AMIAB group, an organization that promotes the labor and social integration of disabled people in Albacete. The prize is worth €200,000. Moreover, a special mention worth €100,000 and another four additional recognitions for €50,000 each were also granted. The 7th edition of the Integra Prize was launched in December 2014. On this occasion there will be two categories: one, for €150,000, that recognizes an organization’s track record, and one for innovative projects, with a €25,000 prize. In addition, all the winners will become participants in Momentum Project, an initiative that aims to promote and extend the activity and impact of social ventures.
Lastly, the “8th Carrera Solidaria” BBVA (Charity Run) brought together nearly 8,000 runners. A total of €140,000 has been raised from registrations of those taking part, the matching contribution made by BBVA and “zero vest number” donations. The funds will go to the Cáritas Madrid charity store.
BBVA in the sustainability indices
BBVA has a notable position on the main international sustainability indices, with a weight as of 31-Dec-2014 as follows:
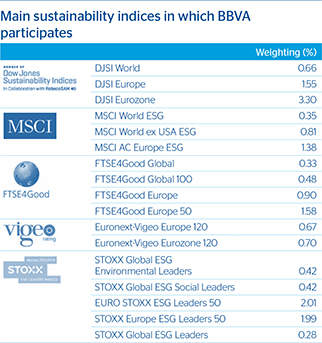
For more information and contact details, see the chapter on Business areas and www.bbvaresponsiblebanking.com
| Environmental and Social Governance | 17 |
Table of Contents
This section presents and analyzes the most relevant aspects of the Group’s different areas. Specifically, it shows the income statement, the balance sheet, the business activity and the most significant ratios in each of them: loan book, customer deposits under management, mutual funds and pension funds, efficiency ratio, NPA ratio, coverage ratio and risk premium.
In 2014, thereporting structure of the BBVA Group’s business areas is basically the same as that reported in 2013:
| • | Banking activity in Spain, which as in previous years includes: The Retail network, with the segments of individual customers, private banking and small businesses; Corporate and Business Banking (CBB), which handles the SMEs, corporations and institutions in the country; Corporate & Investment Banking (CIB), which includes business with large corporations and multinational groups and the trading floor and distribution business in the same geographical area; and other units, among them BBVA Seguros and Asset Management (management of mutual and pension funds in Spain). It also includes the portfolios, finance and structural interest-rate positions of the euro balance sheet. |
| • | Real-estate activity in Spain. This area basically covers lending to real-estate developers and foreclosed real-estate assets in the country. |
| • | The United States encompasses the Group’s businesses in the United States. |
| • | Eurasia, which includes the business carried out in the rest of Europe and Asia, i.e. the Group’s retail and wholesale businesses in the area. It also includes BBVA’s stakes in the Turkish bank Garanti and the Chinese banks CNCB and CIFH (a sell agreement on the later stake was signed in December 2014 and its execution is subject to the pertinent authorizations). However, the equity-accounted income of CNCB (excluding the dividends) from its acquisition until the conclusion of the new agreement with the CITIC Group in the fourth quarter of 2013 (which included the sale of 5.1% of the stake in CNCB) has been reclassified in the Corporate Center under the heading “Results from corporate operations”. |
| • | Mexico includes the banking and insurance businesses in the country. |
| • | South America includes the banking and insurance businesses that BBVA carries out in the region. In the first quarter of 2014, the historical series in this area has been reconstructed to exclude the business in Panama, which was sold in the fourth quarter of 2013, and include it in the Corporate Center. |
In addition to the above, all the areas include a remainder made up of other businesses and of a supplement that includes deletions and allocations not assigned to the units making up the above areas.
Lastly, theCorporate Center is an aggregate that contains the rest of the items that have not been allocated to the business areas, as it basically corresponds to the Group’s holding function. It groups together the costs of the head offices that have a corporate function; management of structural exchange-rate positions, carried out by BBVA’s Strategy and Finance area; specific issues of capital instruments to ensure adequate management of the Group’s global solvency; portfolios and their corresponding results, whose management is not linked to customer relations, such as industrial holdings; certain tax assets and liabilities; funds due to commitments with pensioners; goodwill and other intangibles. It also comprises the result from certain corporate operations carried out in 2013, such as the earnings and capital gains from the pension business disposals in Latin America during 2013; those from BBVA Panama taking into consideration the capital gain from its disposal (in the fourth quarter); and the effect of the repricing of the stake in CNCB to market value following the signing in the fourth quarter of 2013 of the agreement with the CITIC group, which included the sale of 5.1% of the stake in CNCB. It also includes the equity-accounted earnings from CNCB (excluding the dividends).
In addition to this geographical breakdown,supplementary information is provided for all the wholesale businesses carried out by BBVA, i.e. Corporate & Investment Banking (CIB). This aggregate business is considered relevant to better understand the BBVA Group because of the characteristics of the customers served, the type of products offered and the risks assumed.
Lastly, as usual, in the case of the Americas and Eurasia (basically Garanti), the results of applying constant exchange rates are given in addition to the year-on-year variations at currentexchange rates.
The Group compilesinformation by areas based on units at the same level, and all the accounting data related to the business they manage are recorded in full. These basic units are then aggregated in accordance with the organizational structure established by the Group for higher-level units and, finally, the business areas themselves. Similarly, all the companies making up the Group are also assigned to the different units according to the geographical area of their activity.
Once the composition of each business area has been defined, certainmanagement criteria are applied, of which the following are particularly important:
| 18 | Business areas |
Table of Contents
| • | Capital. Capital is allocated to each business according to economic risk capital (ERC) criteria. This is based on the concept of unexpected loss at a specific confidence level, depending on the Group’s capital adequacy targets. The calculation of the ERC combines credit risk, market risk, structural balance-sheet risk, equity positions, operational risk, fixed-asset risk and technical risks in the case of insurance companies. These calculations are carried out using internal models that have been defined following the guidelines and requirements established under the Basel III capital accord, with economic criteria taking precedence over regulatory ones. |
ERC is risk-sensitive and thus linked to the management policies of the businesses themselves. It standardizes capital allocation between them in accordance with the risks incurred. In other words, it is calculated in a way that is standard and integrated for all kinds of risks and for each operation, balance or risk position, allowing its risk-adjusted return to be assessed and an aggregate to be calculated for profitability by client, product, segment, unit or business area.
| • | Internal transfer prices. Within each geographical area, internal transfer rates are applied to calculate the net interest income of its businesses, under both the asset and liability headings. These rates are composed of a market rate that depends on the operation’s revision period, and a liquidity premium that aims to reflect the conditions and outlook for the financial markets in each area. Earnings are distributed across revenue-generating and distribution units (e.g., in asset management products) at market prices. |
| • | Allocation of operating expenses. Both direct and indirect costs are allocated to the business areas, except where there is no clearly defined relationship with the businesses, i.e. when they are of a clearly corporate or institutional nature for the Group as a whole. |
| • | Cross-selling. In some cases, consolidation adjustments are required to eliminate shadow accounting entries in the earnings of two or more units as a result of cross-selling incentives. |
Mayor income statement items by business area
(Million euros)
| Business areas | ||||||||||||||||||||||||||||||||||||
| BBVA Group (1) | Banking activity in Spain | Real-estate activity in Spain | The United States | Eurasia (1) | Mexico | South America | S Business areas | Corporate Center | ||||||||||||||||||||||||||||
2014 | ||||||||||||||||||||||||||||||||||||
Net interest income | 15,116 | 3,830 | (38 | ) | 1,443 | 924 | 4,910 | 4,699 | 15,767 | (651 | ) | |||||||||||||||||||||||||
Gross income | 21,357 | 6,622 | (132 | ) | 2,137 | 1,680 | 6,522 | 5,191 | 22,020 | (664 | ) | |||||||||||||||||||||||||
Operating income | 10,406 | 3,777 | (291 | ) | 640 | 942 | 4,115 | 2,875 | 12,058 | (1,653 | ) | |||||||||||||||||||||||||
Income before tax | 4,063 | 1,463 | (1,225 | ) | 561 | 713 | 2,519 | 1,951 | 5,983 | (1,920 | ) | |||||||||||||||||||||||||
Net attributable profit | 2,618 | 1,028 | (876 | ) | 428 | 565 | 1,915 | 1,001 | 4,062 | (1,444 | ) | |||||||||||||||||||||||||
2013 | ||||||||||||||||||||||||||||||||||||
Net interest income | 14,613 | 3,838 | (3 | ) | 1,402 | 909 | 4,478 | 4,660 | 15,284 | (671 | ) | |||||||||||||||||||||||||
Gross income | 21,397 | 6,103 | (38 | ) | 2,047 | 1,717 | 6,194 | 5,583 | 21,607 | (210 | ) | |||||||||||||||||||||||||
Operating income | 10,196 | 3,088 | (188 | ) | 618 | 981 | 3,865 | 3,208 | 11,573 | (1,378 | ) | |||||||||||||||||||||||||
Income before tax | 2,750 | 230 | (1,838 | ) | 534 | 586 | 2,358 | 2,354 | 4,225 | (1,474 | ) | |||||||||||||||||||||||||
Net attributable profit | 2,228 | 589 | (1,252 | ) | 390 | 449 | 1,802 | 1,224 | 3,201 | (973 | ) | |||||||||||||||||||||||||
| (1) | Pro forma financial statements with the revenues and expenses of the Garanti Group consolidated in proportion to the percentage of the Group’s stake. |
Breakdown of gross income, operating income and net attributable profit by geography(1)
(2014)
| Banking activity in Spain | Spain (2) | The United States | Eurasia | Mexico | South America | |||||||||||||||||||
Gross income | 30.1 | % | 29.5 | % | 9.7 | % | 7.6 | % | 29.6 | % | 23.6 | % | ||||||||||||
Operating income | 31.3 | % | 28.9 | % | 5.3 | % | 7.8 | % | 34.1 | % | 23.8 | % | ||||||||||||
Net attributable profit | 25.3 | % | 3.7 | % | 10.5 | % | 13.9 | % | 47.1 | % | 24.6 | % | ||||||||||||
| (1) | Excludes the Corporate Center. |
| (2) | Including real-estate activity in Spain. |
| Business areas | 19 |
Table of Contents

| 20 | Business areas |
Table of Contents
Highlights
In thefourth quarter of 2014 earnings continued to rise, as they had in previous quarters. The main reason has been the falling cost of deposits and the recovery of production of new loans, above all mortgage loans, consumer finance and finance for SMEs.
Macro and industry trends
The Spanisheconomy continued to improve in the second half of 2014. The rate of growth in the third quarter of 0.5% is expected to be slightly exceeded in the fourth quarter. This improvement can be seen both in consumption and in investment and exports, boosted by the depreciation of the euro, the rise in the index of household and business confidence, reduced financial tension and a looser fiscal policy. In addition, the reforms carried out over recent years, such as those affecting the labor market, have had a positive impact.
The highlight in thebanking sector in the quarter has been the publication of the results of the comprehensive assessment of the European banking system, which were in general positive for Spanish banks. Thus, the asset quality review identified a limited volume of adjustments required, even under the most extreme stress scenario.
According to the latest information available as of November 2014, the decline in the volume of loans in the Spanish banking system amounts to 5.8% year-on-year, although the flow of new lending to the retail segment (loans to companies for less than one million euros and to individuals) continues to improve. Moreover, the total figure for non-performing loans has fallen for the tenth month in a row, and the NPA ratio stood at 12.75% at the close of November.
Activity
The increase in new loan production is the result of increased demand for finance, although the higher production still does not offset the maturities of the current stock. Thus, the volume ofloans under management by the area continues to decline, although at a much slower pace than in previous quarters (down 1.3% year-on-year) in practically all the portfolios. Consumer finance has grown quarter-on-quarter (up 1.4%, including credit cards). This improvement in demand for finance is expected to consolidate further over the coming quarters, underpinned by stronger economic activity in the country.
Financial statements and relevant business indicators
(Million euros and percentage)
Income statement | 2014 | D% | 2013 | |||||||||
Net interest income | 3,830 | (0.2 | ) | 3,838 | ||||||||
Net fees and commissions | 1,454 | 5.7 | 1,376 | |||||||||
Net trading income | 1,149 | 42.4 | 807 | |||||||||
Other income/expenses | 189 | 129.6 | 82 | |||||||||
Gross income | 6,622 | 8.5 | 6,103 | |||||||||
Operating expenses | (2,845 | ) | (5.6 | ) | (3,014 | ) | ||||||
Personnel expenses | (1,707 | ) | (7.8 | ) | (1,851 | ) | ||||||
General and administrative expenses | (1,034 | ) | (1.8 | ) | (1,052 | ) | ||||||
Depreciation and amortization | (105 | ) | (5.3 | ) | (111 | ) | ||||||
Operating income | 3,777 | 22.3 | 3,088 | |||||||||
Impairment on financial assets (net) | (1,690 | ) | (34.4 | ) | (2,577 | ) | ||||||
Provisions (net) and other gains (losses) | (623 | ) | 121.3 | (282 | ) | |||||||
Income before tax | 1,463 | n.m. | 230 | |||||||||
Income tax | (432 | ) | n.m. | (62 | ) | |||||||
Net income from ongoing operations | 1,032 | n.m. | 168 | |||||||||
Results from corporate operations | — | — | 440 | |||||||||
Net income | 1,032 | 69.7 | 608 | |||||||||
Non-controlling interests | (4 | ) | (81.8 | ) | (20 | ) | ||||||
Net attributable profit | 1,028 | 74.7 | 589 | |||||||||
Net attributable profit (excluding results from corporate operations) | 1,028 | n.m. | 149 | |||||||||
Balance sheet | 31-12-14 | D% | 31-12-13 | |||||||||
Cash and balances with central banks | 7,876 | (30.8 | ) | 11,389 | ||||||||
Financial assets | 116,016 | 16.4 | 99,712 | |||||||||
Loans and receivables | 191,273 | 0.8 | 189,734 | |||||||||
Loans and advances to customers | 169,211 | (2.3 | ) | 173,249 | ||||||||
Loans and advances to credit institutions and other | 22,062 | 33.8 | 16,484 | |||||||||
Inter-area positions | 173 | (98.6 | ) | 12,699 | ||||||||
Tangible assets | 700 | (10.4 | ) | 781 | ||||||||
Other assets | 2,315 | 293.3 | 589 | |||||||||
Total assets/liabilities and equity | 318,353 | 1.1 | 314,902 | |||||||||
Deposits from central banks and credit institutions | 64,765 | 12.5 | 57,562 | |||||||||
Deposits from customers | 154,261 | (1.8 | ) | 157,124 | ||||||||
Debt certificates | 41,689 | (15.1 | ) | 49,105 | ||||||||
Subordinated liabilities | 2,077 | (13.9 | ) | 2,411 | ||||||||
Inter-area positions | — | — | — | |||||||||
Financial liabilities held for trading | 43,977 | 14.4 | 38,435 | |||||||||
Other liabilities | 3,426 | n.m. | 673 | |||||||||
Economic capital allocated | 8,158 | (14.9 | ) | 9,592 | ||||||||
Relevant business indicators | 31-12-14 | 30-09-14 | 31-12-13 | |||||||||
Loans under management(1) | 166,446 | 166,065 | 168,594 | |||||||||
Customer deposits under management(2) | 138,647 | 139,838 | 136,295 | |||||||||
Mutual funds | 28,695 | 27,552 | 22,298 | |||||||||
Pension funds | 21,880 | 21,677 | 20,428 | |||||||||
Efficiency ratio (%) | 43.0 | 43.8 | 49.4 | |||||||||
NPA ratio (%) | 6.0 | 6.2 | 6.4 | |||||||||
NPA coverage ratio (%) | 45 | 44 | 41 | |||||||||
Cost of risk (%) | 0.95 | 0.93 | 1.36 | |||||||||
| (1) | Includes funding for segments managed by CBB through fixed-income. |
| (2) | Excluding repos. |
| Banking activity in Spain | 21 |
Table of Contents
Asset quality continues to improve, thanks to the excellent trend in net additions to NPA, which put the NPA ratio at the close of the year at 6.0%. This figure represents a fall of 20 basis points in the quarter and 42 basis points over the last 12 months. The coverage ratio has increased to 45% (44% as of 30-Sep-2014 and 41% as of 31-Dec-2013).
The trend in customerdeposits under management is also favorable, but varies between products. The reduction in the remuneration paid for time deposits has led to funds being shifted toward demand deposits and mutual funds. This downward correction to the cost of time deposits and the greater weight of transactional products in the fund mix are generating a positive effect on the net interest income in the area.
Lastly,off-balance-sheet funds continue to grow, with a cumulative figure at the close of 2014 that is up 2.4% quarter-on-quarter and 17.6% year-on-year, largely due to the improvement in mutual funds (up 4.1% in the last three months and up 28.7% since the close of 2013). As a result, the Group has maintained its leading position as a fund manager in Spain.
Earnings
The year-on-year comparison of earnings in the area continues to be influenced by the following factors from the previous year:
| • | Elimination of the “floor clauses” in residential mortgage loans for consumers in May 2013, which were in place throughout practically the entire first half of 2013 and had a positive effect on net interest income for that period. |
| • | The capital gain generated in the first quarter of 2013 by the reinsurance operation on the individual life and accident insurance portfolio. |
In 2014, the net interest income figure has been practically the same as in the previous year, despite the aforementioned negative effect of the elimination of the “floor clauses”, the reduction in the stock of loans and the current environment of all-time low interest rates. This is because the impact of these three elements is being offset by good price management of customer funds, which is allowing customer spreads to improve. Income from fees and commissions has performed very well in the last quarter of 2014, despite the coming into force of regulatory limitations that affect the revenue from credit cards and pension fund management. Overall, themore recurring revenue has grown at a year-on-year rate of 1.4%.
There was an upturn in NTI in the last quarter, closing a very positive year (up 42.4% year-on-year), thanks to the good performance of Global Markets and the appropriate management of structural risks on the balance sheet. The other income/ expenses heading also rose in cumulative terms by 129.6% on the previous year, due to the good performance of insurance activity, the dividends received in the Global Markets area and the fact that in 2013 there had been an extraordinary payment to the Deposit Guarantee Fund to comply with Royal Decree-Law 6/2013. However, it should be noted that the last quarter includes the charge for the IDEC, for €54m. As a result, banking activity in Spain has registered goodgross income figures for 2014, with a year-on-year rise of 8.5%.
The transformation and digitization process implemented by the Group has had a clear effect on operating expenses, whose cumulative figure in 2014 has fallen year-on-year by 5.6%, with reductions in all the expense lines.
As a result of the above,operating income has increased year-on-year by double-digit figures (22.3%) to €3,777m for the year as a whole.
In addition, the improvement in asset quality has led to provision requirements for impairment losses on financial assets that are clearly below those registered in 2013 (that year they were influenced by the refinanced loans). This explains the year-on-year decline fall of 34.4% in this heading, and the reduction of the cumulative cost of risk over the year to 0.95%.
Lastly, there has been a year-on-year increase of 121.3% in provisions (net) and other gains (losses), basically due to the restructuring costs derived from the aforementioned digitization and transformation process being implemented by the Group.
To sum up, and given the absence this year of one-off earnings, thenet attributable profit generated in 2014 by banking activity in Spain is €1,028m. This compares with a figure of €589m in 2013, which included €440m of earnings from corporate operations (capital gains from the reinsurance operation on the life-individual accident insurance portfolio).
| 22 | Business areas |
Table of Contents
Main highlights
BBVA aims to continue to strengthen its leading position in Spain by attracting customers and increasing their levels of loyalty. To do so, a number of different lines of action have been undertaken in the different business units forming part of the area. Below are the most significant ones in the fourth quarter of 2014.
InCommercial Banking, the commercial actions undertaken in previous quarters have continued. In addition, the most notable items in the period are:
| • | In lending, the launch of the “Quiero una Hipoteca Transparente” (I want a Transparent Mortgage) campaign, with a special rate that is targeted at customers who meet certain minimum requirements of solvency, profitability and loyalty. The campaign is proving very successful. |
| • | In fund management, the launch in October of the “Acuérdate de tu futuro” (Remember your Future) campaign, whose main goal is to make people aware of the importance of planning their saving for retirement and to help them make decisions in advance. This year, the commercial offering has been accompanied by information initiatives, such as simulators of contributions to pension plans and future total estimated pensions; and promotional activity, such as the payment of up to 4% toward pension fund contributions and transfers and the daily prize draw of €6,000 for customers using the simulations. |
| • | Support for SMEs and business finance through loans and leases without origination or processing fees. |
| • | Boost to ICO credit lines. Until the 24th half-month of 2014 a total of 29,581 operations have been closed for more than €781m, an increase of 108% on the figure on the same date in 2013. |
In theSME Banking segment, finance continues to be a clear priority in an increasingly competitive environment. A total of 18,784 operations had been granted within the ICO lines for this segment up to the 24th half-month of 2014, with a year-on-year growth in the volume of finance of 104%. Also of note is the funding granted to 506 companies under the umbrella agreement with the European Investment Bank (EIB) in May for €400m.
In theCorporate Banking segment, lending has been strong over the quarter, notably with major one-off transactions with European parent companies of customers in the segment, and operations within the Cross Border Plan carried out by customers abroad, above all in the United States, Mexico, Peru and Colombia.
Lastly, further progress has been made on themulti-channel strategy with the aim of allowing customers to establish relationships with the Bank through digital and/or remote channels. In particular:
| • | Improvements in ATMs and self-service terminals. |
| • | Progress in the online commercial capability, above all in the dividend reinvestment operations, and the inclusion of online contracting of the One-Click Loan product (Immediate Loan). |
| • | The launch of the new version of the cell phone app that allows adjustment of transfers, activation of cards, changing the card PIN number and payment of receipts without direct billing, among other features. |
| • | Lastly, at the start of 2015 there was a new reorganization of the Commercial Banking branches, which has reduced the number of “head branches” by 90, without any cut in the total number of branches of the network. The new “head branches” will be bigger, with more dependent branches, and will include remote managers to speed up customer service. The aim is to achieve a more specialized, productive and efficient network. |
Lastly, the following are worth noting inprizes and awards:
| • | BBVA Private Banking has been named the best private bank in Spain for the fifth year in a row in the 2014 Global Private Banking Awards. These awards are granted annually by the prestigious magazinesThe Banker andPWM. |
| • | BBVA has received an award from the SERES Foundation for promoting job creation through the “Yo Soy Empleo” (I am Employment) initiative, which has helped create more than 7,400 jobs. Moreover, an agreement has just been signed with ONCE to set aside 500 of these jobs for people with disabilities. |
| Banking activity in Spain | 23 |
Table of Contents

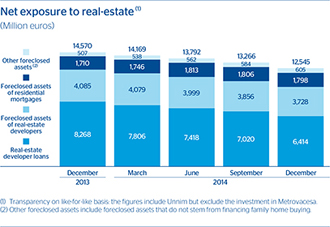
Coverage of real-estate exposure in Spain
(Million of euros as of 31-12-14)
| Risk amount | Provision | % Coverage over risk | ||||||||||
NPL + Substandard | 8,399 | 4,572 | 54 | |||||||||
NPL | 7,418 | 4,225 | 57 | |||||||||
Substandard | 981 | 347 | 35 | |||||||||
Foreclosed real estate and other assets | 13,016 | 6,885 | 53 | |||||||||
From real-estate developers | 8,629 | 4,901 | 57 | |||||||||
From dwellings | 3,250 | 1,452 | 45 | |||||||||
Other | 1,137 | 532 | 47 | |||||||||
Subtotal | 21,415 | 11,457 | 53 | |||||||||
Performing | 2,587 | — | — | |||||||||
With collateral | 2,401 | |||||||||||
Finished properties | 1,873 | |||||||||||
Construction in progress | 225 | |||||||||||
Land | 303 | |||||||||||
Without collateral and other | 186 | |||||||||||
Real-estate exposure | 24,002 | 11,457 | 48 | |||||||||
Note: Transparency scope according to Bank of Spain Circular 5/2011 dated November 30.
Highlights
The brighter market outlook has been confirmed in the last quarter of 2014, which in terms ofactivity in the area has led to a further quarterly reduction of exposure to developer risk and a higher level of property sales compared to June and September 2014, thus continuing with the trend seen in previous quarters.
Consequently, the area’s quarterlyresults reflect a notably less negative impact than in the same period in 2013, due mainly to lower provisions for real-estate assets and to the less unfavorable impact of repricing foreclosed assets to market value.
Industry trends
The available data on the real-estate sector for the second half of 2014 reveals growingdemand for real-estate assets in an environment marked by a gradual stabilization of prices. The number of new construction permits signed between January and October 2014 is up 6.7% compared with the figure for the same period in 2013, which suggests that the sector is beginning to pick up in terms of real-estate development. The latest available data for October from the General Council of Spanish Notaries show a positive trend in sales of real-estate assets, which have increased by 16.5% on the figure for the first ten months of 2013 (up 17.3% in homes, 18.1% in commercial assets and 9.8% in land). The positive trend in employment and financial conditions provides a stable environment for this improvement.
As for housingprices, the data released by the National Institute for Statistics (INE) for the third quarter of 2014 confirm the trend toward stability already seen in the information published by the Ministry of Public Works. For the second quarter in a row, the INE’s housing price index (IPV) shows a slight year-on-year increase. It thus seems that the adjustment in prices has come to an end after a cumulative decline of around 40% from their peak.
| 24 | Business areas |
Table of Contents
Exposure
In thefourth quarter of 2014, the Group’s net exposure to the developer segment in Spain (lending to developers plus the developers’ foreclosed assets) has continued to decline, as in recent quarters. At the same time, the rate of new non-performing real-estate assets and retail foreclosures (i.e. those from defaulting mortgage loans) show deceleration yet again.
Overall, BBVA’snet exposure to the real-estate sector in Spain stood at the end of 2014 at €12,545m, down 13.9% in year-on-year terms and 5.4% with respect to the balance at the end of the third quarter.
Of this figure, exposure toproperty securing mortgage loans to individuals (not taking into account the volume of provisions) has increased by 3.2% since September 2014, a decline of 0.4% in terms of net exposure.
Non-performing assets have continued to decline quarter-on-quarter, and are now 4.9% below the figure for the close of the previous quarter, and 16.1% below December 2013. Thecoverage of non-performing and substandard loans increased over the quarter to 54% as of 31-Dec-2014, compared with 48% for real-estate exposure as a whole, i.e. an improvement of 112 basis points in the quarter and of 278 basis points over the year.
Sales of real-estate assets in the quarter totaled 3,458 units, or 7,020 if third-party and developer sales are added to this figure. For the year as a whole, the cumulative sales volume is slightly lower than to the previous year (down 1.5%), although it relates to assets with higher gross value and average price, with a higher impact in the reduction of total exposure. If the wholesale transactions done the previous year were excluded, the number of real-estate asset sales would show a slight increase in the year-on-year comparison (up 1.6%).
Results
The highlights of the area’s annual results are the less negative impact of loan-loss provisions for developer loans and foreclosed real-estate assets, as well as the negligible effect of the sale of properties, as they are being sold at a price close to their net book value.
Financial statements
(Million euros)
Income statement | 2014 | D% | 2013 | |||||||||
Net interest income | (38 | ) | n.m. | (3 | ) | |||||||
Net fees and commissions | 4 | (56.8 | ) | 9 | ||||||||
Net trading income | 72 | 7.4 | 67 | |||||||||
Other income/expenses | (170 | ) | 52.9 | (111 | ) | |||||||
Gross income | (132 | ) | 248.3 | (38 | ) | |||||||
Operating expenses | (159 | ) | 6.3 | (150 | ) | |||||||
Personnel expenses | (86 | ) | 2.2 | (84 | ) | |||||||
General and administrative expenses | (50 | ) | 16.6 | (43 | ) | |||||||
Depreciation and amortization | (23 | ) | 1.8 | (23 | ) | |||||||
Operating income | (291 | ) | 55.2 | (188 | ) | |||||||
Impairment on financial assets (net) | (305 | ) | (52.6 | ) | (643 | ) | ||||||
Provisions (net) and other gains (losses) | (629 | ) | (37.6 | ) | (1,008 | ) | ||||||
Income before tax | (1,225 | ) | (33.4 | ) | (1,838 | ) | ||||||
Income tax | 351 | (40.9 | ) | 595 | ||||||||
Net income | (873 | ) | (29.8 | ) | (1,243 | ) | ||||||
Non-controlling interests | (3 | ) | (65.8 | ) | (9 | ) | ||||||
Net attributable profit | (876 | ) | (30.0 | ) | (1,252 | ) | ||||||
Balance sheet | 31-12-14 | D% | 31-12-13 | |||||||||
Cash and balances with central banks | 6 | (7.4 | ) | 6 | ||||||||
Financial assets | 646 | (44.3 | ) | 1,159 | ||||||||
Loans and receivables | 8,819 | (16.5 | ) | 10,559 | ||||||||
Loans and advances to customers | 8,819 | (16.5 | ) | 10,559 | ||||||||
Loans and advances to credit institutions and other | — | — | — | |||||||||
Inter-area positions | — | — | — | |||||||||
Tangible assets | 1,373 | (17.3 | ) | 1,661 | ||||||||
Other assets | 7,090 | (1.5 | ) | 7,196 | ||||||||
Total assets/liabilities and equity | 17,934 | (12.9 | ) | 20,582 | ||||||||
Deposits from central banks and credit institutions | — | — | — | |||||||||
Deposits from customers | 53 | (48.7 | ) | 103 | ||||||||
Debt certificates | — | — | — | |||||||||
Subordinated liabilities | 922 | 65.9 | 556 | |||||||||
Inter-area positions | 13,250 | (25.1 | ) | 17,697 | ||||||||
Financial liabilities held for trading | — | — | — | |||||||||
Other liabilities | — | — | — | |||||||||
Economic capital allocated | 3,709 | 66.6 | 2,227 | |||||||||
In 2014, BBVA’s real-estate business in Spain registered aloss of €876m, notably less than the €1,252m loss posted in the same period the previous year, due basically to the reduced need for loan-loss provisions and less value deterioration in real-estate assets.
| Real-estate activity in Spain | 25 |
Table of Contents

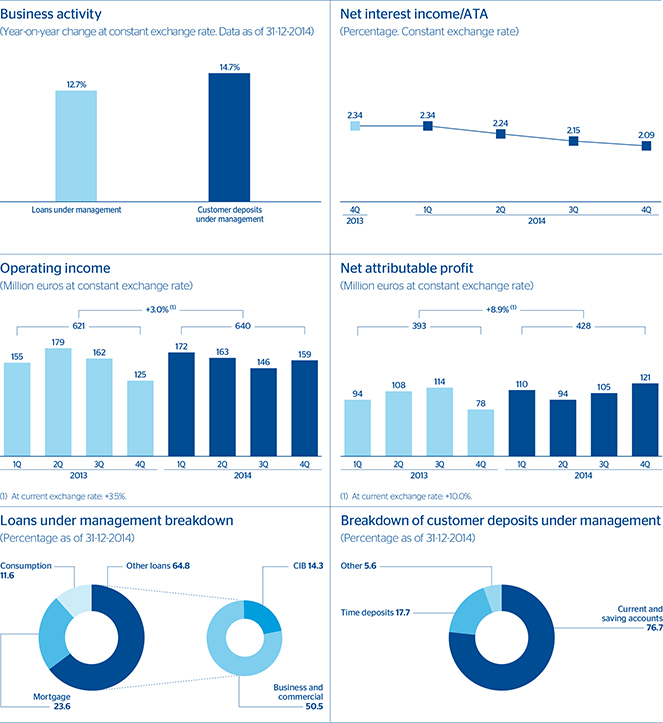
| 26 | Business areas |
Table of Contents
Highlights
In the fourth quarter, the area’sactivity has once again been very positive in all segments of the loan portfolios and customer funds.
The quarterlyearnings figures confirm the trend toward improved net interest income, where the effect of the increase in volumes of activity is gathering pace, while the narrowing of spreads is more moderate than in previous quarters.
Macro and industry trends
The latest activity data confirms that the U.S.economy is on the road to recovery, as already suggested in previous quarters. GDP growth has been stronger than expected, the unemployment rate has fallen to 5.8% and private consumption is being driven by increased purchasing power. It is true that the recovery could be affected by events such as a continued appreciation of the dollar, the uncertainty surrounding the normalization of monetary policy and downward pressure on the long-term yield of Treasury bonds. Caution and the response to warning signals as economic data is released will modulate the pace of the normalization ahead.
In thefinancial system as a whole, the trend toward a reduction in the sector’s NPA ratio continues. At the end of the third quarter it stood below 3%. In terms of activity, lending continues to grow at higher rates than in 2013 (up 7.7% in year-on-year terms, according to November figures), supported basically by the growth in corporate lending and, to a lesser extent, by the increase in consumer finance. Despite the volatility seen in recent months, deposits continue to post positive rates of growth.
As regardsexchange rate, the U.S. dollar continued to gain steadily against the euro in the last few months of the year. This has had a positive impact on the year-on-year and quarter-on-quarter changes in the balance sheet headings and in activity. However, the effect of the currency on the income statement for the year as a whole has been very limited. To provide a better understanding of the changes in the business, the percentages given below refer to constant exchange rate, unless otherwise indicated.
Financial statements and relevant business indicators
(Million euros and percentage)
Income statement | 2014 | D% | D%(1) | 2013 | ||||||||||||
Net interest income | 1,443 | 2.9 | 2.7 | 1,402 | ||||||||||||
Net fees and commissions | 553 | 9.2 | 8.7 | 507 | ||||||||||||
Net trading income | 145 | 3.8 | 2.1 | 139 | ||||||||||||
Other income/expenses | (4 | ) | 265.4 | 224.4 | (1 | ) | ||||||||||
Gross income | 2,137 | 4.4 | 4.0 | 2,047 | ||||||||||||
Operating expenses | (1,497 | ) | 4.8 | 4.4 | (1,429 | ) | ||||||||||
Personnel expenses | (861 | ) | 5.0 | 4.5 | (820 | ) | ||||||||||
General and administrative expenses | (457 | ) | 6.3 | 6.0 | (430 | ) | ||||||||||
Depreciation and amortization | (179 | ) | 0.1 | (0.1 | ) | (179 | ) | |||||||||
Operating income | 640 | 3.5 | 3.0 | 618 | ||||||||||||
Impairment on financial assets (net) | (68 | ) | (8.2 | ) | (8.1 | ) | (74 | ) | ||||||||
Provisions (net) and other gains (losses) | (10 | ) | 6.2 | 3.7 | (10 | ) | ||||||||||
Income before tax | 561 | 5.1 | 4.5 | 534 | ||||||||||||
Income tax | (133 | ) | (8.0 | ) | (7.5 | ) | (145 | ) | ||||||||
Net incomes | 428 | 10.0 | 8.9 | 390 | ||||||||||||
Non-controlling interests | — | — | — | — | ||||||||||||
Net attributable profit | 428 | 10.0 | 8.9 | 390 | ||||||||||||
Balance sheet | 31-12-14 | D% | D%(1) | 31-12-13 | ||||||||||||
Cash and balances with central banks | 3,808 | 13.3 | (0.3 | ) | 3,362 | |||||||||||
Financial assets | 11,892 | 64.5 | 44.8 | 7,231 | ||||||||||||
Loans and receivables | 50,970 | 28.5 | 13.1 | 39,677 | ||||||||||||
Loans and advances to customers | 48,976 | 30.8 | 15.2 | 37,430 | ||||||||||||
Loans and advances to credit institutions and other | 1,994 | (11.3 | ) | (21.9 | ) | 2,247 | ||||||||||
Inter-area positions | — | — | — | — | ||||||||||||
Tangible assets | 725 | 7.9 | (5.0 | ) | 672 | |||||||||||
Other assets | 1,866 | (11.3 | ) | (21.9 | ) | 2,104 | ||||||||||
Total assets/liabilities and equity | 69,261 | 30.6 | 14.9 | 53,046 | ||||||||||||
Deposits from central banks and credit institutions | 5,765 | 23.7 | 8.9 | 4,662 | ||||||||||||
Deposits from customers | 51,394 | 29.0 | 13.6 | 39,844 | ||||||||||||
Debt certificates | 822 | — | — | — | ||||||||||||
Subordinated liabilities | 742 | 14.0 | 0.4 | 651 | ||||||||||||
Inter-area positions | 345 | (50.3 | ) | (56.2 | ) | 693 | ||||||||||
Financial liabilities held for trading | 2,341 | n.m. | n.m. | 168 | ||||||||||||
Other liabilities | 5,289 | 16.5 | 2.5 | 4,541 | ||||||||||||
Economic capital allocated | 2,563 | 3.0 | (9.3 | ) | 2,488 | |||||||||||
Relevant business indicators | 31-12-14 | 30-09-14 | 31-12-13 | |||||||||
Loans under management(1) | 50,280 | 48,193 | 44,604 | |||||||||
Customer deposits under management(1-2) | 50,093 | 49,427 | 43,673 | |||||||||
Mutual funds | — | — | — | |||||||||
Pension funds | — | — | — | |||||||||
Efficiency ratio (%) | 70.1 | 69.9 | 69.8 | |||||||||
NPA ratio (%) | 0.9 | 0.9 | 1.2 | |||||||||
NPA coverage ratio (%) | 167 | 164 | 134 | |||||||||
Cost of risk (%) | 0.16 | 0.17 | 0.20 | |||||||||
| (1) | Figures at constant exchange rate. |
| (2) | Excludes repos. |
| The United States | 27 |
Table of Contents
Activity
In line with the trend seen in previous quarters,loans under management in the area as of 31-Dec-2014 were up 4.3% in the quarter and 12.7% over the year. This rise is general across all portfolios. Of particular note is commercial lending, which grew by 5.7% in the quarter and 15.4% since the end of 2013; residential real-estate mortgages, which are up 1.9% and 9.0%, respectively; and consumer finance (up 3.6% in the quarter and 14.9% over the year).
The main indicators of the area’sasset quality and risk management remained practically the same in the last quarter, with an NPA ratio of 0.9% and a coverage ratio of 167% as of 31-Dec-2014.
Customerdeposits under management have also increased compared with the third quarter (up 1.3%) and by 14.7% over the last 12 months. These positive figures are due to the good performance of lower-cost deposits, namely current and savings accounts, which are up 2.1% since the close of September 2014 and 13.6% since December 31, 2013.
Earnings
The variation in the key headings of the income statement is due to the following factors:
| • | Themore recurring revenue has performed well in both year-on-year and quarterly terms, thanks mainly to strong activity. Net interest income for 2014 has increased by 2.7% over the year (with the quarterly figure growing by 1.9% on the third quarter, due to the fact that the narrowing of spreads since the end of September has been much more limited). Income from fees and commissions has improved significantly (up 8.7% year-on-year), largely as a result of strong activity in the franchise’s wholesale businesses. |
| • | There was also a positive performance by the other headings making upgross income, which totals €2,137m in the year (up 4.0% year-on-year). |
| • | Operating expenses have grown moderately, by 4.4% over the year, despite the impact of the incorporation of Simple and the higher costs derived from regulatory requirements. In fact, they remained practically flat in the quarter (up 0.3%). |
| • | Impairment losses on financial assets continue to decline and the cost of risk has improved again this quarter, standing at 0.16% for the year. |
| • | As a result of the above, in 2014 the area has generated anet attributable profit of €428m, up 8.9% compared with the figure for 2013. |
Main highlights
As regardsprizes and awards in the quarter,Money Magazine chose BBVA Compass as one of the best banks in the United States in a ranking that rates 70 of the country’s largest banks (including online banking competitors). This magazine has also chosen it as the best mid-sized bank in the South of the United States and one of the leading banks for small businesses. Lastly, the magazine selected the BBVA Compass ClearConnect account for companies as one of the best for its features (for example, the possibility of performing unlimited free digital transactions).
Indigital banking, BBVA Compass has formed a partnership agreement with Dwolla, a company that owns an innovative system of payment channels that operate in real time. The agreement allows the bank’s customers to use Dwolla’s technological platform to make payments that are as fast, secure, direct and transparent as e-mail. BBVA Ventures has acquired two companies: DocuSign, a San Francisco company that offers electronic signature technology and digital transaction management services; and Personal Capital, which provides financial advice and money management services. These transactions are part of BBVA’s strategy of being in close contact with companies that develop disruptive business models and technologies to build the best customer experience in the digital era, one of the key elements in BBVA’s comprehensive transformation process.
Inbrand recognition, the renewal of the agreement making BBVA Compass the official bank of the NBA for the next three years has been announced. A digital campaign has been run to celebrate this announcement, starring players Kevin Durant and James Harden.
Innew products and services, BBVA Compass customers can now make their purchases through Apple Pay, the payment solution launched recently by Apple that can be used in stores via mobile apps.
Lastly, inESG, the highlights in the quarter are as follows:
| • | BBVA Compass’s efforts to provide its customers with a clear and transparent banking service have been recognized with second place in the 2014 Checking Account Transparency Report of the WalletHub comparison website. It has also obtained the highest scores in a study by The Pew Charitable Trusts that evaluates the practices of the leading U.S. banks in current accounts. |
| • | In financial literacy, BBVA Compass and NBA Cares celebrated the achievement of their goal to provide financial literacy to 25,000 students in 2014, based on EverFi’s web-based program. |
| • | The bank has made a donation to the Museum of Fine Arts of Houston to contribute to its remodeling. |
| • | In November 2014, BBVA Compass announced a program of loans, investments and services aimed at helping people and neighborhoods with low-middle income. The bank is also planning to present new distribution channels, products and services in 2015 for people with low income. |
| 28 | Business areas |
Table of Contents

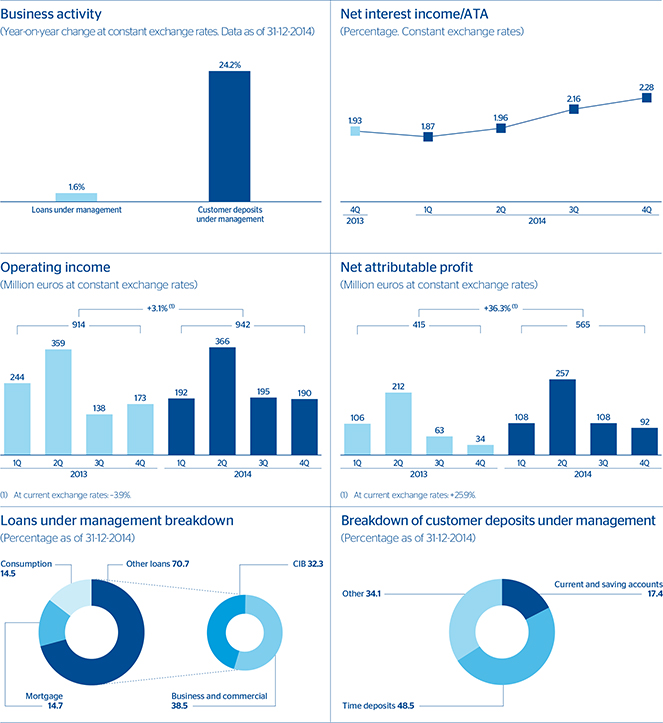
| Eurasia | 29 |
Table of Contents
Financial statements and relevant business indicators
(Million euros and percentage)
Income statement(1) | 2014 | D% | D%(2) | 2013 | ||||||||||||
Net interest income | 924 | 1.7 | 13.0 | 909 | ||||||||||||
Net fees and commissions | 378 | (3.0 | ) | 3.1 | 390 | |||||||||||
Net trading income | 151 | (22.4 | ) | (21.6 | ) | 195 | ||||||||||
Other income/expenses | 227 | 1.5 | 2.7 | 224 | ||||||||||||
Gross income | 1,680 | (2.1 | ) | 5.1 | 1,717 | |||||||||||
Operating expenses | (738 | ) | 0.2 | 7.8 | (736 | ) | ||||||||||
Personnel expenses | (387 | ) | 0.9 | 8.0 | (384 | ) | ||||||||||
General and administrative expenses | (304 | ) | 0.8 | 8.4 | (301 | ) | ||||||||||
Depreciation and amortization | (47 | ) | (7.7 | ) | 2.1 | (51 | ) | |||||||||
Operating income | 942 | (3.9 | ) | 3.1 | 981 | |||||||||||
Impairment on financial assets (net) | (203 | ) | (38.5 | ) | (34.4 | ) | (330 | ) | ||||||||
Provisions (net) and other gains (losses) | (27 | ) | (57.9 | ) | (56.2 | ) | (65 | ) | ||||||||
Income before tax | 713 | 21.5 | 31.3 | 586 | ||||||||||||
Income tax | (147 | ) | 7.0 | 15.1 | (137 | ) | ||||||||||
Net income | 565 | 25.9 | 36.3 | 449 | ||||||||||||
Non-controlling interests | — | — | — | — | ||||||||||||
Net attributable profit | 565 | 25.9 | 36.3 | 449 | ||||||||||||
Balance sheet(1) | 31-12-14 | D% | D%(2) | 31-12-13 | ||||||||||||
Cash and balances with central banks | 2,677 | 3.1 | (0.9 | ) | 2,596 | |||||||||||
Financial assets | 9,627 | 35.9 | 32.7 | 7,085 | ||||||||||||
Loans and receivables | 30,741 | 2.5 | 0.5 | 30,004 | ||||||||||||
Loans and advances to customers | 28,199 | 3.5 | 1.6 | 27,247 | ||||||||||||
Loans and advances to credit institutions and other | 2,542 | (7.8 | ) | (10.3 | ) | 2,757 | ||||||||||
Inter-area positions | — | — | — | — | ||||||||||||
Tangible assets | 247 | (9.6 | ) | (12.4 | ) | 273 | ||||||||||
Other assets | 1,375 | 8.6 | 5.3 | 1,267 | ||||||||||||
Total assets/liabilities and equity | 44,667 | 8.4 | 6.0 | 41,223 | ||||||||||||
Deposits from central banks and credit institutions | 9,817 | 1.0 | (1.1 | ) | 9,725 | |||||||||||
Deposits from customers | 22,671 | 28.6 | 25.3 | 17,634 | ||||||||||||
Debt certificates | 1,298 | 8.1 | 3.4 | 1,201 | ||||||||||||
Subordinated liabilities | 633 | 10.0 | 9.8 | 575 | ||||||||||||
Inter-area positions | 1,278 | (77.1 | ) | (77.1 | ) | 5,573 | ||||||||||
Financial liabilities held for trading | 408 | 25.0 | 22.7 | 327 | ||||||||||||
Other liabilities | 5,206 | 69.4 | 62.0 | 3,073 | ||||||||||||
Economic capital allocated | 3,357 | 7.7 | 6.3 | 3,115 | ||||||||||||
Relevant business indicators | 31-12-14 | 30-09-14 | 31-12-13 | |||||||||
Loans under management(2) | 28,481 | 29,130 | 28,027 | |||||||||
Customer deposits under management(2-3) | 20,952 | 18,190 | 16,867 | |||||||||
Mutual funds | 1,549 | 1,531 | 1,332 | |||||||||
Pension funds | 852 | 794 | 634 | |||||||||
Efficiency ratio (%) | 43.9 | 41.9 | 42.9 | |||||||||
NPA ratio (%) | 3.3 | 3.4 | 3.4 | |||||||||
NPA coverage ratio (%) | 92 | 91 | 87 | |||||||||
Cost of risk (%) | 0.68 | 0.71 | 1.11 | |||||||||
| (1) | Pro forma financial statements with Garanti Group consolidated in proportion to the percentage of the Group’s stake. |
| (2) | Figures at constant exchange rates. |
| (3) | Excluding repos. |
Highlights
With respect toactivity, in the last quarter of 2014 lending continued to grow in Garanti’s retail business, while in the wholesale segments in the rest of Europe and Asia, the deleveraging process has eased notably. Customer deposit performance over the last three months has been excellent, particularly in the case of global customers in Europe.
As regards theincome statement, revenue improved, with operating expenses increasing at the same pace and a decreasing need for loan-loss provisions.
Lastly, threeagreements were closed in the area. The first agreement was for an increase in the stake in Garanti to 39.9%; the second was for the sale of the 29.68% of the Chinese bank CIFH; and the third (signed in January 2015) was for the sale of 4.9% of CNCB.
Macro and industry trends
Economic activity in theEurozone grew at moderate levels, although with some improvement in the second half of 2014. As a result, the year closed with a year-on-year rate of GDP growth of around 1%. Household consumption and exports have been slightly stronger than investment, which continues to be held back by moderate economic activity and unused capacity. Inflation remains at very low levels, far from the ECB medium-term target of price stability. As a result, the ECB has implemented a program of quantitative easing based on the purchase of additional assets, in order to increase inflation expectations among agents and avoid the risk of deflation. Thus, at the start of October, the ECB announced the main details of the asset-backed securities purchase program (ABSPP) and the third covered bond purchase program (CBPP3), which would last at least two years. Lastly, on December 15, details of the second targeted longer-term refinancing operation (TLTRO) were released. This time, BBVA has requested a similar amount to that on September 18.
InTurkey, after moderating in the third quarter, economic growth improved over recent months, due largely to the contribution of the foreign sector and the positive effect of the decline in oil prices. The reduction in the cost of energy is helping moderate inflation and the current-account deficit, giving the Central Bank more room for maneuver. In the year as a whole, the increase in global risk aversion and reduced investment flows to the emerging economies have accelerated the depreciation of the Turkish lira, which lost 12.8% in average exchange rates against the euro, despite the final upturn that led to the year closing with a rate 4.5% higher than in December 2013.
| 30 | Business areas |
Table of Contents
With respect to banking activity, the rate of growth in lending has continued to moderate (particularly in loans to individuals), though it is still increasing at double-digit rates, according to the latest figures from December 2014. This moderation is a reflection of a less expansive monetary policy and the adoption of macroprudential measures. The NPA ratio in the sector remains stable at around 3%. Fund gathering in the private sector has also slowed, above all in local-currency deposits. Lastly, the tougher monetary policy measures and significant rise in interest rates in the first quarter have led to a rise in the cost of liabilities and temporary downward pressure on bank margins.
InChina GDP continues to slow, with forecast growth for 2015 at 7.0% compared with the expected 7.3% for 2014. As a result, demand, fiscal and, above all, monetary policies have room for responding to modulate the rate of GDP growth.
To better understand the changes in the business figures, the percentages given below refer to constantexchange rates, unless otherwise indicated.
Activity
Loans under management in the area closed 2014 with year-on-year growth similar to that at the close of the previous quarter: up 1.6%. The most notable aspect of this trend is:
| • | Excluding Garanti, the deleveraging process in the business with customers in Europe and Asia continues, although at a much slower pace than in previous periods. The balance of the loan book closed 2014 at €15,308m, a year-on-year decline of 6.4% (compared to a reduction of 7.9% at the close of September). |
| • | Good performance of loans under management from BBVA’s stake in Garanti, which continues to grow at double-digit rates in year-on-year terms (12.8% year-on-year, 2.1% quarter-on-quarter). Breaking down lending activity in the Turkish bank by portfolio, there has been a slight slowdown of growth in the quarter in Turkish lira loans (up 3.8% compared with 6.3% in the third quarter), though the year-on-year increase stands at 12.8% and is strongly focused on finance to companies and consumers. Foreign-currency loans have remained flat over the last twelve months, though demand is expected to return in 2015. |
Theasset quality indicators in the area have improved over the quarter. The NPA ratio stands at 3.3% and the coverage ratio at 92%, compared with 3.4% and 91%, respectively, at the close of September. In fact, the indicators of asset quality in Garanti are outstanding compared with the average for the Turkish banking system.
With respect to customer funds, there has been a very significant increase in customerdeposits under management in the area (up 24.2% year-on-year), above all over the last three months of the year (up 15.2%), particularly from deposits in the rest of Europe and Asia (up 26.3% in the quarter and 39.2% over the year). In the case of Garanti, there was an upturn in local-currency deposits over the quarter, in line with the rise in the sector as a whole (up 9.2% compared with a fall of 3.4% in the previous quarter). Foreign-currency customer funds have also accelerated their rate of growth compared with the close of the previous quarter, at above the sector average (up 2.7% in the fourth quarter and 15.5% over the year, compared with a quarterly decline of 5.2% and a year-on-year rise of 1.1% in the sector as a whole).
Earnings
Eurasia generated a cumulativenet attributable profit in 2014 of €565m, a year-on-year increase of 36.3%. This was based on:
| • | Positive performance ofnet interest income, which picked up its rate of year-on-year growth to 13.0%, thanks to the significant rise in the last quarter (up 7.1%). The active management of customer spreads in Garanti is the main reason for this positive trend. |
| • | Good performance also ofincome from fees and commissions (up 3.1% year-on-year), closely related to the increase in banking activity. More specifically, in the case of Garanti, income from fees and commissions grew by 20.5% over the last twelve months. This is a high percentage taking into account the recent regulatory changes affecting this heading. A varied and well diversified revenue base, with good performance of revenue from payment channels, transfers and insurance activities, as well as the active use of digital channels, are the main causes of growth. |
| • | Lower contribution fromNTI than in 2013, which included an extraordinarily high level in the first half of the year. |
| • | Cumulativeoperating expenses have grown at a year-on-year rate similar to the previous quarter (up 7.8%), strongly influenced by Garanti’s commitment to strict cost discipline after the intense process of expansion carried out in 2013, in an environment of high inflation in Turkey. |
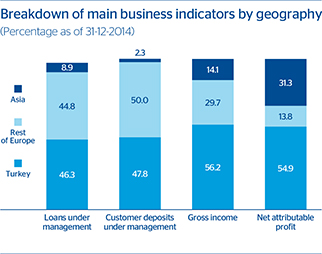
| Eurasia | 31 |
Table of Contents
| • | Lastly,impairment losses on financial assets fell in year-on-year terms by 34.4%, due to the lack of any significant one-off provisions, unlike in the previous year. The cumulative cost of risk in the area as of 31-Dec-2014 stands at 0.68% (compared with 0.71% in September and 1.11% in 2013). |
Main highlights
As mentioned above, a number ofcorporate operations agreements have been signed in recent months. They will probably be closed in the first half of 2015, subject to obtaining the relevant authorizations:
| • | An increase of 14.89% in the stake in Garanti to 39.9%, announced in November 2014. This Turkish bank is a clear leader in Turkey, a country with high growth potential. The operation gives BBVA a majority on the bank’s Board of Directors. |
| • | The sale in December of 29.68% of CIFH to CNCB for €845m. This operation will have a net negative effect on earnings estimated at €25m but will improve the Group’s fully-loaded CET1 capital position. |
| • | In January 2015, 4.9% of CNCB was sold in an operation that will generate net capital gains of around €400m and will also have a positive impact on the fully-loaded CET1 ratio. |
In the section onprizes and awards, Garanti has been recognized for the third time as the “Best Domestic Cash Management Bank in Turkey” for its customer-centric approach. The award was voted by customers in the 2014 Euromoney Cash Management Survey.
Garanti. Significant data 31-12-14(1)
| 31-12-14 | ||||
Financial statements (million euros) | ||||
Attributable profit | 1,101 | |||
Total assets | 77,302 | |||
Loans and advances to customers | 47,337 | |||
Deposits from customers | 40,587 | |||
Relevant ratios (%) | ||||
Efficiency ratio(2) | 49.2 | |||
NPA ratio | 2.4 | |||
Other information | ||||
Number of employees | 19,036 | |||
Number of branches | 1,005 | |||
Number of ATMs | 4,152 | |||
| (1) | BRSA data for the Garanti Bank. |
| (2) | Normalized figure excluding the effect of non-recurrent items. |
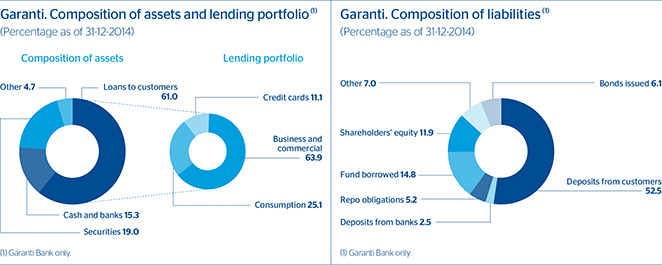
| 32 | Business areas |
Table of Contents

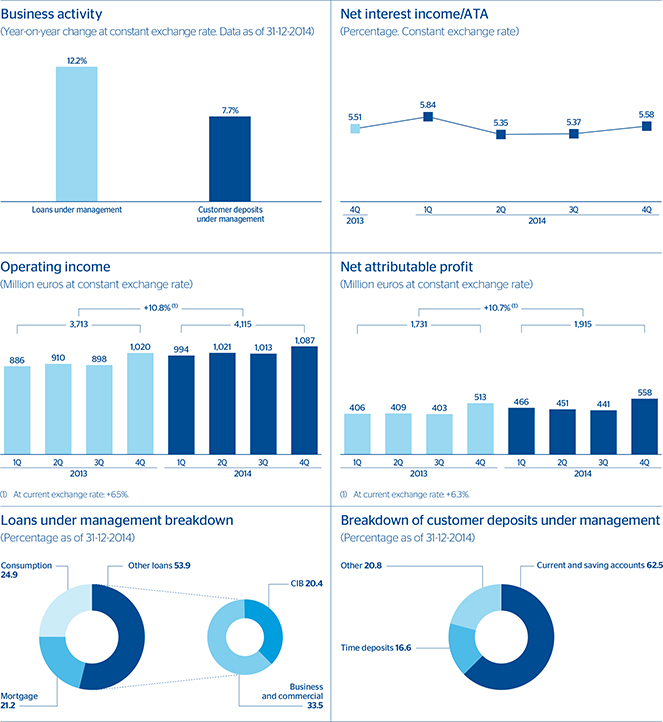
| Mexico | 33 |
Table of Contents
Financial statements and relevant business indicators
(Million euros and percentage)
Income statement | 2014 | D% | D%(1) | 2013 | ||||||||||||
Net interest income | 4,910 | 9.6 | 14.1 | 4,478 | ||||||||||||
Net fees and commissions | 1,166 | (1.4 | ) | 2.6 | 1,183 | |||||||||||
Net trading income | 195 | (6.3 | ) | (2.4 | ) | 208 | ||||||||||
Other income/expenses | 250 | (22.9 | ) | (19.8 | ) | 325 | ||||||||||
Gross income | 6,522 | 5.3 | 9.6 | 6,194 | ||||||||||||
Operating expenses | (2,406 | ) | 3.3 | 7.6 | (2,329 | ) | ||||||||||
Personnel expenses | (1,020 | ) | 2.4 | 6.6 | (996 | ) | ||||||||||
General and administrative expenses | (1,199 | ) | 2.5 | 6.7 | (1,170 | ) | ||||||||||
Depreciation and amortization | (187 | ) | 15.0 | 19.7 | (163 | ) | ||||||||||
Operating income | 4,115 | 6.5 | 10.8 | 3,865 | ||||||||||||
Impairment on financial assets (net) | (1,517 | ) | 5.1 | 9.4 | (1,443 | ) | ||||||||||
Provisions (net) and other gains (losses) | (79 | ) | 22.2 | 27.2 | (64 | ) | ||||||||||
Income before tax | 2,519 | 6.9 | 11.2 | 2,358 | ||||||||||||
Income tax | (604 | ) | 8.7 | 13.1 | (555 | ) | ||||||||||
Net income | 1,916 | 6.3 | 10.7 | 1,802 | ||||||||||||
Non-controlling interests | (1 | ) | 4.4 | 8.7 | — | |||||||||||
Net attributable profit | 1,915 | 6.3 | 10.7 | 1,802 | ||||||||||||
Balance sheet | 31-12-14 | D% | D%(1) | 31-12-13 | ||||||||||||
Cash and balances with central banks | 6,004 | (2.8 | ) | (3.9 | ) | 6,175 | ||||||||||
Financial assets | 34,311 | 16.2 | 14.9 | 29,528 | ||||||||||||
Loans and receivables | 47,800 | 15.2 | 13.9 | 41,482 | ||||||||||||
Loans and advances to customers | 45,224 | 15.8 | 14.5 | 39,059 | ||||||||||||
Loans and advances to credit institutions and other | 2,576 | 6.3 | 5.1 | 2,423 | ||||||||||||
Tangible assets | 1,662 | 28.6 | 27.2 | 1,292 | ||||||||||||
Other assets | 3,953 | 18.9 | 17.6 | 3,323 | ||||||||||||
Total assets/liabilities and equity | 93,731 | 14.6 | 13.3 | 81,801 | ||||||||||||
Deposits from central banks and credit institutions | 11,617 | 28.2 | 26.8 | 9,061 | ||||||||||||
Deposits from customers | 45,937 | 8.2 | 7.0 | 42,452 | ||||||||||||
Debt certificates | 5,033 | 28.5 | 27.0 | 3,917 | ||||||||||||
Subordinated liabilities | 4,128 | 13.8 | 12.5 | 3,627 | ||||||||||||
Financial liabilities held for trading | 7,616 | 31.7 | 30.2 | 5,784 | ||||||||||||
Other liabilities | 14,432 | 13.7 | 12.4 | 12,690 | ||||||||||||
Economic capital allocated | 4,968 | 16.3 | 15.0 | 4,270 | ||||||||||||
Relevant business indicators | 31-12-14 | 30-09-14 | 31-12-13 | |||||||||
Loans under management(1) | 43,767 | 41,380 | 39,018 | |||||||||
Customer deposits under management(1-2) | 44,437 | 43,975 | 41,268 | |||||||||
Mutual funds | 18,691 | 20,027 | 16,896 | |||||||||
Pension funds | — | — | — | |||||||||
Efficiency ratio (%) | 36.9 | 37.1 | 37.6 | |||||||||
NPA ratio (%) | 2.9 | 3.2 | 3.6 | |||||||||
NPA coverage ratio (%) | 114 | 112 | 110 | |||||||||
Cost of risk (%) | 3.45 | 3.56 | 3.55 | |||||||||
| (1) | Figures at constant exchange rate. |
| (2) | Including all the repos. |
Highlights
One of the highlights in 2014 has been the excellent trend in businessactivity in the area, above all given the environment of moderate growth in the Mexican economy over the year.
Also of note is the sound performance of the main items of theincome statement, as a result of favorable net interest income figures, adequate cost control and good risk management.
Macro and industry trends
The downward revision of the factualGDP data for the first half of 2014 and the weakness in the recovery of domestic demand in the third quarter have led to a reduction in Mexico’s growth estimates for 2014 at the close of November. The outlook for 2015 has improved with the expansion in the United States, the country’s largest trading partner, despite the persistent downside risks (due to the fall in oil prices and what is still a moderate increase in demand from the public sector). In this environment, Banxico can be expected to increase its interest rates in 2015, in line with the current Federal Reserve (Fed) outlook.
Solvency ratios in thefinancial system continue to be high. The total capitalization ratio stood at 15.9% in October 2014, with adequate liquidity levels and good profitability. In terms of activity, lending to the private sector has slowed its year-on-year rate of growth in 2014 to 9.4%, according to the latest available information as of November 2014 from the National Banking and Securities Commission (CNBV). Fund gathering has also slowed (up 9.4% year-on-year, according to November 2014 data). The NPA ratio remains stable at around 3%.
In the last quarter of the year theexchangerate of the Mexican peso against the euro depreciated by 4.9%, although in year-on-year terms it has gained 1.1%. Average exchange rates show a depreciation of 3.9% over the year. This means that the impact of the exchange rate on the year-on-year changes in the income statement headings is negative, while slightly positive on the balance sheet and activity. All the comments below on rates of change will be expressed at constant exchange rates, unless expressly stated otherwise.
Activity
Commercial activity in Mexico in 2014 was positive, particularly given that economic growth has been weaker than expected. At the close of 2014, theloan book in the area totaled €43,767m, up 12.2% on the same date the previous year. This rise is above the average growth in the market, which according to the latest local information from the CNBV mentioned above.
| 34 | Business areas |
Table of Contents
The growth in loans is mainly due to the strong performance of thewholesale banking portfolio, which has increased its year-on-year rate of growth to 19.1%. Of particular note was the positive trend in lending to large corporations and medium-sized companies (up 23.0% and 19.5%, respectively).
In theretail portfolio, the trend in loans to small businesses is also favorable, with growth over the year of 27.1%, while consumer loans (payroll and personal loans) increased at a year-on-year rate of 29.3%, while also maintaining the portfolio quality. The growth in consumer loans has been boosted by the ongoing strategy of building loyalty in the customer base. Bank credit cards are up 4.5% in the last twelve months, while the Finanzia (own brand) credit card has declined as a result of the end of the commercial agreement with Walmart at the close of 2013. Lastly, of note in the residential mortgage portfolio is the significant improvement in the levels of new production, with a cumulative figure 13.6% higher than that of 2013. BBVA in Mexico now grants one of every three new mortgages in the private sector.
With respect toasset quality, the good risk management by the Mexican franchise has resulted in indicators that compare positively with those of its main competitors. Mexico has closed the year with an NPA ratio of 2.9%, 31 basis points below the figure at the close of the third quarter of 2014, and a coverage ratio of 114%, 1 percentage point above the previous quarter’s figure.
Customer funds (on-balance-sheet deposits, assets sold under repurchase agreements, mutual funds and other off-balance sheet funds) have increased at a year-on-year rate of 8.8% and totaled €66,531m as of 31-Dec-2014. The customer deposit mix is still very profitable, with a very high relative proportion of lower-cost funds: at the close of the year they accounted for 81% of deposits, with a year-on-year rise of 10.7%. The trend in time deposits remains positive (up 13.9%), and mutual funds also performed well over the year (up 9.4%).
Earnings
In2014, BBVA’s income statement in Mexico showed outstanding soundness, strongly supported by a number of factors: growing generation of net interest income; adequate cost control, despite the major investment plan underway; and good risk management, reflected in the positive trend in impairment losses on financial assets and in the cumulative cost of risk (3.45% in 2014 compared with 3.55% in 2013).
Net interest income stands at €4,910m, up 14.1% on the figure for 2013. Increased volumes of activity, combined with good price management, have offset the impact of falling interest rates, which are at all-time lows. The strong net interest income also allows for a positive comparison with BBVA’s main competitors in terms of net interest income over ATA, which under local criteria stands at 117 basis points above the average of its main market peers, according to their latest quarterly reports available (information as of the close of the third quarter). Income from fees and commissions has increased at a moderate rate (up 2.6% year-on-year), while NTI has declined by 2.4% due to gains from portfolio sales accounted for in 2013, which has negatively affected the year-on-year comparison. The other income/expenses heading also compares unfavorably for a number of reasons, among which, a quite year in the insurance business is of note. As a result of the above,gross income amounts to €6,522m, 9.6% above the figure for 2013.
Operating expenses have increased by 7.6%, mainly due to the investment plan being implemented by the area. At the close of the year, 711 branch offices have been completely remodeled and the number of ATMs has increased by 1,247. Despite this, the percent increase of expenses is below that of gross income, so the efficiency ratio has improved to 36.9%, maintaining BBVA as one of the most efficient institutions in the Mexican banking system.Operating income closed the year at €4,115m, a rise of 10.8% on the 2013 figure.
Impairment losses on financial assets have risen 9.4%, slightly below the growth in activity in the area, and without special requirements in any portfolio. As a result, thenet attributable profit for 2014 has increased at a year-on-year rate of 10.7% to €1,915m.
Main highlights
Anissue of subordinated debt of USD 200m, under Basel III requirements, at 15 years with a yield of 5.35%. The issue was extremely successful and was oversubscribed four times, thus once more demonstrating the confidence of investors in both the bank and the country.
Inenvironmental and social governance, the BBVA Bancomer Foundation and the Instituto Tecnológico y de Estudios Superiores de Monterrey (ITESM) have pushed through new entrepreneurship projects through educational and production centers, which have already benefited more than 53,000 people since they were started in 2009. Notable in the area of community education is the agreement signed by the BBVA Bancomer Foundation and the Secretariat for Public Education (SEP) designed to double the beneficiaries of theBecas Adelante scholarships. Specifically, they envisage a joint investment of MXN 48m, which will be used to increase the number of students supported by the program from 2,000 to 4,000. As a result of these and other initiatives, BBVA in Mexico has positioned itself as an institution that is highly active in the areas of education and community involvement. In addition, at the close of the year, the first generation of 180 students graduated from the BBVA Bancomer University, which currently has over 1,100 students enrolled.
| Mexico | 35 |
Table of Contents

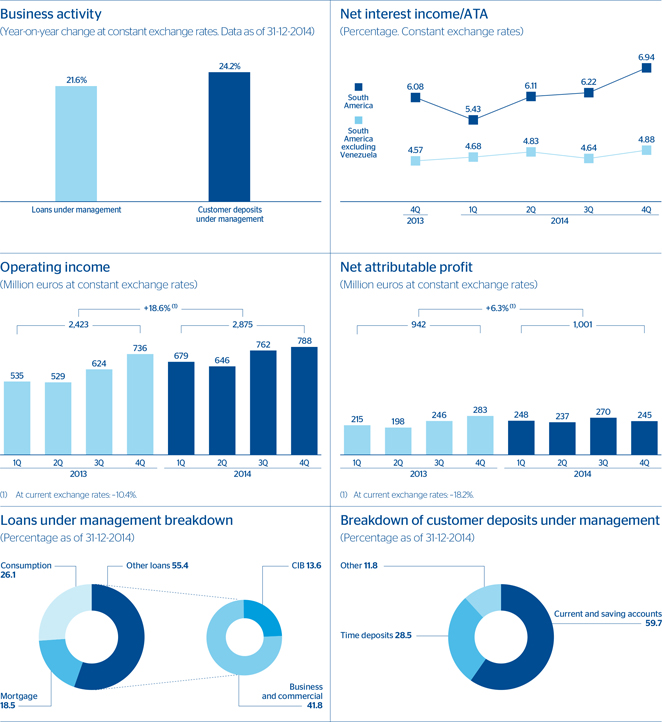
| 36 | Business areas |
Table of Contents
Highlights
The most notable features of thefourth quarterof 2014 in Latin America was the continued rising trend in the most recurring revenue and the great strength of business activity. Both elements are largely a result of the strategic plans implemented by the different banks in the area over recent years that are still in place.
Macro and industry trends
Economic activity in the region has continued to show clear signs of moderation, particularly due to the slowdown in investment and more sluggish domestic demand, although there are notable differences between the different economies in BBVA’s footprint. South America is suffering from the effects of greater uncertainty regarding the future of the global economy, and this is leading to a fall in commodity prices, tighter financial conditions due to the appreciation of the dollar and moderation in capital flows into the region. In this more restrictive environment, the central banks in the region have applied a looser bias to their monetary policy, except in the case of Brazil. In the coming months, this could lead to additional cuts in interest rates in Peru and Chile and a delay in raising rates in Colombia.
No major differences are evident in thefinancial system with respect to previous quarters: its levels of capitalization are sound, with a high level of profitability and the NPA ratio in check. In addition, progress is continuing toward legal frameworks that are increasingly more compliant with international standards, above all in the case of Colombia, Chile and Peru. With respect to activity, the moderation in the rates of lending growth continues in most countries, in line with economic growth in the different economies.
Lastly, the year-endexchange rates of the currencies of most of the countries where BBVA operates have appreciated against the euro over the quarter (except for the Colombian peso). However, in the last 12 months there have been losses in all the currencies, except in the case of the Peruvian new sol. In average exchange rates, there has been a general year-on-year depreciation. The effect of the currency on the year-on-year changes in the area’s financial statements is therefore negative. All the comments below on rates of change are expressed at a constant exchange rate, unless stated otherwise.
Financial statements and relevant business indicators
(Million euros and percentage)
Income statement | 2014 | D% | D%(1) | 2013 | ||||||||||||
Net interest income | 4,699 | 0.8 | 38.7 | 4,660 | ||||||||||||
Net fees and commissions | 901 | (7.1 | ) | 24.9 | 970 | |||||||||||
Net trading income | 482 | (36.8 | ) | (10.8 | ) | 763 | ||||||||||
Other income/expenses | (890 | ) | 9.9 | 115.1 | (810 | ) | ||||||||||
Gross income | 5,191 | (7.0 | ) | 22.5 | 5,583 | |||||||||||
Operating expenses | (2,316 | ) | (2.5 | ) | 27.8 | (2,375 | ) | |||||||||
Personnel expenses | (1,099 | ) | (6.4 | ) | 20.9 | (1,174 | ) | |||||||||
General and administrative expenses | (1,038 | ) | 0.8 | 33.2 | (1,030 | ) | ||||||||||
Depreciation and amortization | (179 | ) | 4.7 | 43.8 | (171 | ) | ||||||||||
Operating income | 2,875 | (10.4 | ) | 18.6 | 3,208 | |||||||||||
Impairment on financial assets (net) | (706 | ) | 1.2 | 27.4 | (698 | ) | ||||||||||
Provisions (net) and other gains (losses) | (219 | ) | 40.2 | 178.3 | (156 | ) | ||||||||||
Income before tax | 1,951 | (17.1 | ) | 8.9 | 2,354 | |||||||||||
Income tax | (490 | ) | (6.3 | ) | 19.1 | (523 | ) | |||||||||
Net income | 1,461 | (20.2 | ) | 5.9 | 1,831 | |||||||||||
Non-controlling interests | (460 | ) | (24.3 | ) | 5.1 | (607 | ) | |||||||||
Net attributable profit | 1,001 | (18.2 | ) | 6.3 | 1,224 | |||||||||||
Balance sheet | 31-12-14 | D% | D%(1) | 31-12-13 | ||||||||||||
Cash and balances with central banks | 13,523 | 0.1 | 28.7 | 13,507 | ||||||||||||
Financial assets | 10,671 | 9.3 | 26.4 | 9,765 | ||||||||||||
Loans and receivables | 57,212 | 10.3 | 24.8 | 51,881 | ||||||||||||
Loans and advances to customers | 51,302 | 9.2 | 22.3 | 46,962 | ||||||||||||
Loans and advances to credit institutions and other | 5,910 | 20.1 | 52.6 | 4,919 | ||||||||||||
Tangible assets | 1,062 | 12.6 | 34.2 | 943 | ||||||||||||
Other assets | 1,896 | 6.7 | 18.8 | 1,777 | ||||||||||||
Total assets/liabilities and equity | 84,364 | 8.3 | 25.6 | 77,874 | ||||||||||||
Deposits from central banks and credit institutions | 5,770 | 25.7 | 27.0 | 4,589 | ||||||||||||
Deposits from customers | 56,370 | 2.2 | 22.1 | 55,167 | ||||||||||||
Debt certificates | 4,677 | 31.5 | 30.0 | 3,556 | ||||||||||||
Subordinated liabilities | 1,658 | 32.4 | 33.6 | 1,252 | ||||||||||||
Financial liabilities held for trading | 2,648 | 147.6 | 151.3 | 1,069 | ||||||||||||
Other liabilities | 9,834 | 8.8 | 26.4 | 9,036 | ||||||||||||
Economic capital allocated | 3,408 | 6.3 | 21.9 | 3,205 | ||||||||||||
Relevant business indicators | 31-12-14 | 30-09-14 | 31-12-13 | |||||||||
Loans under management(1) | 52,009 | 49,356 | 42,779 | |||||||||
Customer deposits under management(1-2) | 61,992 | 57,005 | 49,931 | |||||||||
Mutual funds | 3,848 | 3,735 | 2,952 | |||||||||
Pension funds | 4,632 | 4,285 | 3,600 | |||||||||
Efficiency ratio (%) | 44.6 | 43.9 | 42.5 | |||||||||
NPA ratio (%) | 2.1 | 2.1 | 2.1 | |||||||||
NPA coverage ratio (%) | 138 | 137 | 141 | |||||||||
Cost of risk (%) | 1.46 | 1.44 | 1.50 | |||||||||
| (1) | Figures at constant exchange rates. |
| (2) | Excluding repos and including specific marketable debt securities. |
| South America | 37 |
Table of Contents
Activity
South America closed 2014 withloans under management at €52,009m, a year-on-year increase of 21.6%, once more demonstrating the Group’s strength and buoyant activity in the region. Of particular note is the rise in small business finance within the retail world (up 25.8% year-on-year) and lending to corporates (up 19.7%).
Non-performing assets have evolved closely in line with the level of lending as a whole. As a result, the NPA ratio remained stable over the year (2.1% as of 31-Dec-2014), although with slight improvement in the coverage ratio (138% at the close of December, compared with 137% at the close of September).
The growth of customerdeposits under management in the last quarter has been particularly significant, leading to a year-on-year increase of 24.2% to €61,992m at the close of 2014. It’s worth mentioning the positive performance of transactional accounts (current and savings accounts up 24.4%).
Mutualfunds have also performed very well. Their balance closed 2014 at €3,848m, up 32.4% on the figure for 31-Dec-2013.
Bycountry, the most relevant aspects are:
| • | InArgentina, year-on-year growth of lending stands at 18.8%, thanks to the good performance of the car loan business and particularly to the growth in credit cards, which gained 89 basis points of market share over the last 12 months (latest available figure through November). Total customer funds rose by 25.5%, strongly supported by the positive trend in current and savings accounts (a rise of 57 basis points in market share in current accounts) and mutual funds. |
| • | InChile, lending has increased by 9.4% over the same period, thanks above all to the performance of the mortgage portfolio (up 15.1%), and also to credit cards (up 14.9%) and business finance (up 11.3% in corporates and 10.7% in small businesses). Customer funds have grown by 17.6%, with a notable difference between growth in lower-cost funds (up 12.5%) and time deposits (up 7.4%). |
| • | InColombia lending grew by 18.4% in 2014, and total customer funds by 14.4%, thanks to year-on-year gains in market share of 48 and 27 basis points, respectively. The growing contribution of Colombia to lending in the area as a whole is mainly the result of the mortgage portfolio (up 15 basis points year-on-year in market share, with a 22.4% increase in the same time period) and loans to companies (up 54 basis points, a rise of 19.6%). |
| • | InPeru lending in 2014 increased by 9.4%, with notable increases in both the mortgage portfolio (up 13.5%) and in lending to companies (up 14.4%). Total customer funds have increased by 8.9%, with a gain in market share of 100 basis points since the end of November 2013, and significant relative increases in both current and savings accounts and time deposits (gains of 77 and 150 basis points, respectively, in market share). |
| • | Venezuela ended 2014 with another strong year-on-year growth in both lending (up 70.2%) and customer funds (up 56.7%). |
Earnings
South America closed 2014 with anet attributable profit of €1,001m, up 6.3% on the figure the previous year.
The area has posted significantly higher revenue figures, with a rise of 22.5% year-on-year, andgross income of €5,191m. This increase has been possible thanks to the high generation of recurring revenue resulting from strong activity and improved customer spreads.
Operating expenses have risen by 27.8%, strongly linked to the investment plans underway, and that are leading to an improvement and continuous boost to business in the region. Overall, the area’soperating income amounts to €2,875m, a year-on-year rise of 18.6%.
Lastly, impairment losses on financial assets have slowed their year-on-year growth to 27.4%. The cumulative cost of risk is now 1.46% (1.44% at the close of September and 1.50% one year earlier).
Bycountry, the following aspects are of particular note:
| • | InArgentina, BBVA Francés posted a net attributable profit of €217m, a year-on-year increase of 52.7%, leveraged on strong revenue. |
| • | InChile the net attributable profit stands at €136m, 30.7% higher than in 2013, thanks mainly to the increase in net interest income and tightened loan-loss provisions. All this despite the €52m charge derived from the penalty for joint civil liability issued in the Inverlink case. |
| • | Colombia has posted a net attributable profit of €269m, down 2.9% on the figure for 2013, affected by the increase in expenses, provisions and increased tax pressure. |
| • | Peru had a net attributable profit in the year of €169m, a year-on-year increase of 6.7%. This result can be explained mainly by the positive trend in recurring revenue, as well as the containment in loan-loss provisions. |
| • | Venezuela closed 2014 with a net attributable profit of €162m, 19.0% below the figure in 2013, as net interest income growth, among other factors, have not offset the increase in operating expenses. There was also a greater negative adjustment for hyperinflation in 2014 than in 2013. |
Main highlights
Once more, the area has obtained numerousprizesandawards, among them the following:
| • | BBVA Francés has won an award at the Effie Awards Argentina 2014, in the category of financial services, for two campaigns: “Estás Dulce”, a simple loan that has received the Gold Effie, and “Souvenir”, an initiative within the BBVA Francés Lanpass Cards product, which has received the Silver Effie. |
| 38 | Business areas |
Table of Contents
| • | BBVA Francés has also been chosen one of the best companies to work for, in 10th place in Argentina in the ranking prepared by the global firm Great Place to Work.BBVA Continental is in 14th place in this ranking in Peru. |
| • | BBVA Argentina, BBVA Continental and BBVA Provincial have been recognized byThe Banker as “Best Bank” in their respective countries. |
| • | The magazineLatin Finance has chosen BBVA Continental and BBVA Provincial as the best banks in their respective countries. |
| • | BBVA Colombia and BBVA Provincial have once more been named the best cash management service providers by the magazineEuromoney. |
| • | BBVA Seguros Colombia has become the only insurer in Colombia with an AAA national financial strength rating granted by Fitch. |
InEnvironmental and Social Governance, a number of training programs have been developed:
| • | The training program for SMEs, developed through the Universidad Católica de Argentina Business School, covers 120 businesspeople. In Colombia, a total of 150 businesspeople from different economic sectors have received the BBVA SME Training diploma, under a program funded by the Bank and run by the Universidad de los Andes. |
| • | BBVA Chile has launched financial literacy microprograms through various social networks and the CNN Chile channel, including a new website: www.educacionfinancierabbva.com. |
| • | BBVA volunteer groups have run financial literacy workshops in Uruguay. |
Numerous campaigns and initiatives have been launched in the last quarter as part of the area’sDigitization Plan:
| • | BBVA Francés has opened a cutting-edge branch with technology as its core element. It thus adds to the Group’s innovation strategy designed to make it the best digital bank. |
| • | BBVA Continental has launched the Delivery Loan, which allows customers to request a product online or by telebanking, as well as including other benefits, such as the possibility of choosing the best day for customers to make regular payments. |
| • | BBVA Provincial is developing a new loan with flexible conditions targeted at individuals. It also offers the first banking website in Venezuela with a responsive design, which allows access to the BBVA Provincial websites from any mobile device, providing complete, easy-to-use navigation regardless of screen size. |
South America. Data per country
(Million euros)
| Operating income | Net attributable profit | |||||||||||||||||||||||||||||||
| D% at constant | D% at constant | |||||||||||||||||||||||||||||||
Country | 2014 | D% | exchange rates | 2013 | 2014 | D% | exchange rates | 2013 | ||||||||||||||||||||||||
Argentina | 523 | 3.5 | 53.1 | 506 | 217 | 3.2 | 52.7 | 210 | ||||||||||||||||||||||||
Chile | 337 | 0.4 | 15.4 | 336 | 136 | 13.8 | 30.7 | 119 | ||||||||||||||||||||||||
Colombia | 560 | 6.5 | 13.9 | 525 | 269 | (9.2 | ) | (2.9 | ) | 296 | ||||||||||||||||||||||
Peru | 652 | 0.1 | 5.1 | 651 | 169 | 1.7 | 6.7 | 167 | ||||||||||||||||||||||||
Venezuela | 731 | (34.5 | ) | 20.4 | 1,116 | 162 | (55.9 | ) | (19.0 | ) | 369 | |||||||||||||||||||||
Other countries(1) | 72 | (3.1 | ) | 2.9 | 75 | 47 | (24.6 | ) | (20.1 | ) | 63 | |||||||||||||||||||||
Total | 2,875 | (10.4 | ) | 18.6 | 3,208 | 1,001 | (18.2 | ) | 6.3 | 1,224 | ||||||||||||||||||||||
| (1) | Paraguay, Uruguay and Bolivia. Additionally, it includes eliminations and other charges. |
| South America | 39 |
Table of Contents
Financial statements
(Million euros)
Income statement | 2014 | D% | 2013 | |||||||||
Net interest income | (651 | ) | (3.0 | ) | (671 | ) | ||||||
Net fees and commissions | (92 | ) | n.m. | (3 | ) | |||||||
Net trading income | (60 | ) | n.m. | 347 | ||||||||
Other income/expenses | 139 | 18.2 | 117 | |||||||||
Gross income | (664 | ) | 216.3 | (210 | ) | |||||||
Operating expenses | (989 | ) | (15.3 | ) | (1,168 | ) | ||||||
Personnel expenses | (450 | ) | (6.1 | ) | (479 | ) | ||||||
General and administrative expenses | (80 | ) | (68.6 | ) | (254 | ) | ||||||
Depreciation and amortization | (459 | ) | 5.6 | (435 | ) | |||||||
Operating income | (1,653 | ) | 20.0 | (1,378 | ) | |||||||
Impairment on financial assets (net) | 3 | n.m. | (11 | ) | ||||||||
Provisions (net) and other gains (losses) | (270 | ) | 215.9 | (85 | ) | |||||||
Income before tax | (1,920 | ) | 30.2 | (1,474 | ) | |||||||
Income tax | 472 | 101.3 | 235 | |||||||||
Net income from ongoing operations | (1,447 | ) | 16.8 | (1,240 | ) | |||||||
Results from corporate operations | — | — | 383 | |||||||||
Net income | (1,447 | ) | 69.0 | (857 | ) | |||||||
Non-controlling interests | 3 | n.m. | (116 | ) | ||||||||
Net attributable profit | (1,444 | ) | 48.4 | (973 | ) | |||||||
Net attributable profit (excluding results from corporate operations) | (1,444 | ) | 6.5 | (1,356 | ) | |||||||
Balance sheet | 31-12-14 | D% | 31-12-13 | |||||||||
Cash and balances with central banks | 14 | (50.0 | ) | 29 | ||||||||
Financial assets | 2,894 | (0.2 | ) | 2,901 | ||||||||
Loans and receivables | 24 | (89.9 | ) | 238 | ||||||||
Loans and advances to customers | 24 | (89.9 | ) | 238 | ||||||||
Loans and advances to credit institutions and other | — | — | — | |||||||||
Inter-area positions | — | — | — | |||||||||
Tangible assets | 2,245 | 6.9 | 2,101 | |||||||||
Other assets | 18,196 | 3.9 | 17,520 | |||||||||
Total assets/liabilities and equity | 23,374 | 2.6 | 22,787 | |||||||||
Deposits from central banks and credit institutions | — | — | 2,148 | |||||||||
Deposits from customers | — | — | (2,148 | ) | ||||||||
Debt certificates | 5,875 | (23.9 | ) | 7,717 | ||||||||
Subordinated liabilities | 3,958 | 162.6 | 1,507 | |||||||||
Inter-area positions | (14,700 | ) | 30.5 | (11,265 | ) | |||||||
Financial liabilities held for trading | — | — | — | |||||||||
Other liabilities | 6,733 | 38.1 | 4,877 | |||||||||
Shareholders’ funds | 47,669 | 6.3 | 44,847 | |||||||||
Economic capital allocated | (26,162 | ) | 5.1 | (24,897 | ) | |||||||
The main difference in the Corporate Center’s income statement in thefourth quarter of 2014 is the dividend from BBVA’s stake in Telefónica, which was booked in November. The same comments as in previous quarters are applicable to the other headings:
| • | Gross income in 2014 has been a negative €664m. This figure compares with the negative €210m in 2013, which included high positive NTI resulting from the management of structural exchange-rate risk and the capital gains from the sale of some of the unit’s holdings in industrial and financial companies. |
| • | Operating expenses have accelerated their year-on-year decline to 15.3% due to the measures to keep costs in check applied in recent years. |
| • | There were no results fromcorporate operations in 2014. In 2013 this heading included: income from the Group’s pension business in Latin America (including capital gains from its sale); the capital gains from the sale of BBVA Panama; and lastly, the effect of the signing of the agreement with CITIC Limited, which included the divestment of 5.1% of CNCB, and brought as a consequence the repricing of BBVA’s entire stake in CNCB to market value, as well as the reclassification of the equity-accounted income from CNCB (excluding dividends). |
| • | The Corporate Center also includes the figures fromBBVA Panama until its sale, which was closed in December 2013. |
With all these elements, the Corporate Center registered anet attributable loss in 2014 of €1,444m, compared with a loss of €1,356m in 2013.
Asset/Liability Management
The Assets and Liabilities Management unit is responsible for managing structural interest-rate and foreign-exchange positions, the Group’s overall liquidity as well as shareholders’ funds.
Earnings from the management ofliquidity and the structural interest-rate positions in each balance sheet are registered in the corresponding areas.
| 40 | Business areas |
Table of Contents
With respect to the management ofexchange-rate risk of BBVA Group’s long-term corporate investments, the results are included in the Corporate Center and explained in detail in the Risk Management section, under the sub-section Structural Risks.
The bank’scapital management has a twofold aim: to maintain levels of capitalization appropriate to the business targets in all the countries in which it operates and, at the same time, to maximize return on shareholders’ funds through the efficient allocation of capital to the various units, good management of the balance sheet and proportionate use of the various instruments that comprise the Group’s equity: common stock, preferred securities, contingent convertible bonds and subordinate debt.
In thefourth quarter of 2014 the following capital management actions were carried out:
| • | The Group carried out a capital increase for €2 billion through an accelerated bookbuilt offering targeted at institutional investors. The capital increase has strengthened the Group’s capital adequacy ratios by 58 basis points (at the date of its execution), which will allow the Bank to address future growth from a sound solvency position. |
| • | BBVA Bancomer has issued 15-year subordinated debt for USD 200m. In addition, the subsidiaries in Colombia, Paraguay and Uruguay have issued subordinated debt for COP 200 billion, USD 20m and USD 15m, respectively. |
| • | In 2014, BBVA has repurchased three subordinated issues which were no longer eligible as Tier II capital and, for January 21, 2015, has announced the exercise of its call option on two issues of preferred debt subject to grandfathering: series E and F, at a nominal GBP 251m and €664.65m, respectively. These issues come from a liability management operation carried out in 2009. They were placed on the institutional market and are gradually becoming non-eligible as Tier I capital. |
| • | In addition, in December the system of flexible remuneration called the “dividend option” was implemented for a gross €0.08 per share, offering shareholders the possibility of receiving their remuneration in new BBVA shares, or in cash, as they choose. The percentage of shareholders choosing to receive new BBVA shares was 86.0%. This high percentage again confirms the confidence of shareholders in the future evolution of the share. Thus the number of ordinary BBVA shares issued was 53,584,943, with the total nominal amount of this capital increase being €26,256,622. |
These measures mean that the current levels of the Group’s capitalization easily meet the legal limits and enable appropriate compliance with all the capital targets, as has been reflected in the Capital Base chapter.
| Corporate Center | 41 |
Table of Contents
Other information: Corporate & Investment Banking

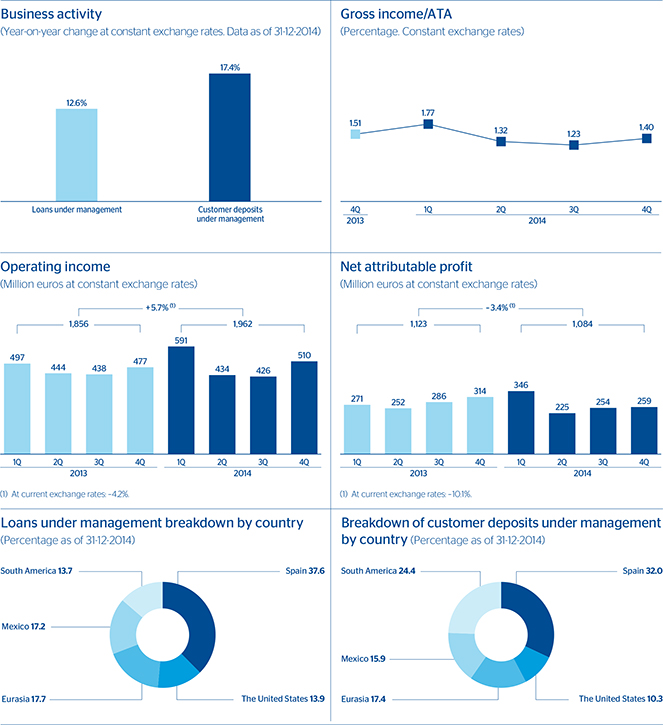
| 42 | Business areas |
Table of Contents
Highlights
There has been a good level of both lending and depositactivity in practically all the geographical areas. In Europe, specifically in Spain, the deleveraging process in the economy continues, although at a much more moderate pace than in previous quarters.
Inearnings, gross income has remained strong and of good quality, supported once more by positive revenue figures from activity with customers.
Macro and industry trends
The most importantmacroeconomic and industry trends affecting the Group’s wholesale business in the fourth quarter of 2014 have been:
| • | A difficult situation in the financial markets, which recorded significant increases in volatility and risk aversion in October, after which they recovered at the end of the quarter. |
| • | Deterioration in investor appetite, due to the uncertainty with respect to economic growth (reflected in the falls in crude oil prices), the differing monetary policies of the central banks (strong appreciation of the dollar against the rest of the currencies) and greater geopolitical tension. |
Activity
CIB continues to focus on its customer-centric strategy, boosting cross-selling and prioritizing profitability over volume. From the point of view of activity this means:
| • | Maintaining the trend mentioned in the third quarter of 2014 for increasedlending, which with the data for the close of the fourth quarter grew 9.2% year-on-year and 4.2% over the quarter (not including the balances of Global Markets). This increase is general across all geographical areas. |
| • | In 2014 there has been a significant increase in customerdeposits under management, with their balance as of 31-Dec-2014 increasing year-on-year by 25.2% and quarter-on-quarter by 3.0% (also excluding the Global Markets unit). |
| • | As a result of the above, the commercial and liquidity gap of CIB’s banking business continues to narrow. |
Financial statements and relevant business indicators
(Million euros and percentage)
Income statement | 2014 | D% | D%(1) | 2013 | ||||||||||||
Net interest income | 1,520 | (1.9 | ) | 7.0 | 1,549 | |||||||||||
Net fees and commissions | 744 | 1.3 | 5.2 | 734 | ||||||||||||
Net trading income | 555 | (15.3 | ) | (2.0 | ) | 656 | ||||||||||
Other income/expenses | 54 | n.m. | 75.2 | 7 | ||||||||||||
Gross income | 2,873 | (2.5 | ) | 5.5 | 2,946 | |||||||||||
Operating expenses | (911 | ) | 1.4 | 5.0 | (899 | ) | ||||||||||
Personnel expenses | (473 | ) | (1.5 | ) | (0.3 | ) | (481 | ) | ||||||||
General and administrative expenses | (419 | ) | 5.0 | 11.9 | (399 | ) | ||||||||||
Depreciation and amortization | (19 | ) | (0.9 | ) | 0.3 | (19 | ) | |||||||||
Operating income | 1,962 | (4.2 | ) | 5.7 | 2,047 | |||||||||||
Impairment on financial assets (net) | (200 | ) | 113.7 | 114.2 | (94 | ) | ||||||||||
Provisions (net) and other gains (losses) | (72 | ) | 113.8 | 158.3 | (34 | ) | ||||||||||
Income before tax | 1,689 | (12.0 | ) | (2.6 | ) | 1,919 | ||||||||||
Income tax | (467 | ) | (15.7 | ) | (6.3 | ) | (554 | ) | ||||||||
Net income | 1,222 | (10.5 | ) | (1.1 | ) | 1,365 | ||||||||||
Non-controlling interests | (138 | ) | (13.3 | ) | 21.6 | (159 | ) | |||||||||
Net attributable profit | 1,084 | (10.1 | ) | (3.4 | ) | 1,206 | ||||||||||
Balance sheet | 31-12-14 | D% | D%(1) | 31-12-13 | ||||||||||||
Cash and balances with central banks | 3,297 | 21.1 | 31.1 | 2,722 | ||||||||||||
Financial assets | 93,648 | 17.7 | 17.6 | 79,572 | ||||||||||||
Loans and receivables | 76,096 | 18.8 | 17.6 | 64,028 | ||||||||||||
Loans and advances to customers | 51,841 | 13.2 | 11.9 | 45,813 | ||||||||||||
Loans and advances to credit institutions and other | 24,254 | 33.2 | 31.8 | 18,215 | ||||||||||||
Inter-area positions | 3,262 | (55.8 | ) | (35.6 | ) | 7,377 | ||||||||||
Tangible assets | 23 | (10.3 | ) | (14.3 | ) | 26 | ||||||||||
Other assets | 3,424 | 29.5 | 30.3 | 2,644 | ||||||||||||
Total assets/liabilities and equity | 179,750 | 15.0 | 16.3 | 156,370 | ||||||||||||
Deposits from central banks and credit institutions | 59,923 | 10.1 | 9.8 | 54,435 | ||||||||||||
Deposits from customers | 51,334 | 12.8 | 17.7 | 45,511 | ||||||||||||
Debt certificates | (44 | ) | (65.7 | ) | (65.7 | ) | (128 | ) | ||||||||
Subordinated liabilities | 1,514 | 20.8 | 19.7 | 1,253 | ||||||||||||
Inter-area positions | — | — | — | — | ||||||||||||
Financial liabilities held for trading | 57,328 | 23.4 | 23.4 | 46,442 | ||||||||||||
Other liabilities | 5,323 | 7.7 | 9.2 | 4,942 | ||||||||||||
Economic capital allocated | 4,371 | 11.6 | 11.3 | 3,915 | ||||||||||||
Relevant business indicators | 31-12-14 | 30-09-14 | 31-12-13 | |||||||||
Loans under management(1) | 51,861 | 50,802 | 46,066 | |||||||||
Customer deposits under management(1-2) | 37,289 | 36,220 | 31,765 | |||||||||
Mutual funds | 1,093 | 1,050 | 713 | |||||||||
Pension funds | — | — | — | |||||||||
Efficiency ratio (%) | 31.7 | 32.0 | 30.5 | |||||||||
NPA ratio (%) | 0.9 | 0.9 | 1.6 | |||||||||
NPA coverage ratio (%) | 136 | 149 | 80 | |||||||||
Cost of risk (%) | 0.39 | 0.40 | 0.19 | |||||||||
| (1) | Figures at constant exchange rates. |
| (2) | Including area’s repos in Mexico. |
| Other information: Corporate & Investment Banking | 43 |
Table of Contents
Earnings
The strategy applied in recent quarters has maintained the good performance of CIB’s income statement. In 2014 it generated anet attributable profit of €1,084m, 3.4% less than in the same period in 2013. This was a result of a number of factors:
| • | Good revenue figures, with a cumulativegross incomefor the 12 months growing year-on-year by 5.5%. |
| • | The slowdown in the increase of operating expenses to a year-on-year growth of 5.0%, despite the high level of inflation in some countries and the costs derived from the investments in technology. |
| • | As a result,operating income rose by 5.7% in year-on-year terms. |
| • | The year-on-year comparison ofimpairment losses on financial assets is influenced both by the provisions derived from increased lending this year and one-off items registered last year. |
Main highlights
TheMergers & Acquisitions (M&A) Corporate Finance unit continues to be the Spanish leader in financial advice for M&A operations, with a total of 86 deals advised since 2009, according to Thomson Reuters. In addition, BBVA was named “Spain M&A Financial Adviser of the Year” by Mergermarket in the fourth quarter of 2014. The transactions completed in this period include operations involving advice for:
| • | Soletanche Freyssinet, a wholly-owned subsidiary of Vinci, for the acquisition from Acciona of the 50% of Freyssinet it did not own. |
| • | Vocento, in the sale of 80% of Sarenet to Lodemel, the owner of the remaining 20%. |
Similarly, BBVA continues to strengthen its teams in Latin America and the United States with the aim of bolstering its position in these geographical areas and repeating the unit’s success in the Spanish market. The operations carried out in the Americas in the fourth quarter of 2014 include:
| • | Advice in the U.S. to Heritage-Crystal Clean on the acquisition of 100% of FCC Environmental USA, a subsidiary of FCC. |
| • | Advice in Mexico to Alsea on the acquisition of 71.76% of Grupo Zena. |
InEquity Capital Markets, with 31 operations completed in 2014, BBVA has consolidated its leadership in the capital markets one more year. In the fourth quarter of the year, the Group has participated in the largest operations on the Spanish market, such as Endesa’s follow-on offering and the BBVA capital increase. In Mexico, BBVA has participated as lead manager in the initial public offering (IPO) by Fideicomiso Hipotecario.
InCorporate Lending the bank has been involved in several deals, including:
| • | Spain and Portugal: more than 20 syndicated loans have been closed this quarter. In most operations, BBVA has acted as a bookrunner (including García Carrión, Osborne, Roca, Mapfre, Tradebe, Red Eléctrica and Enagás). |
| • | Rest of Europe: notable activity in Italy, where syndicated loans with Astaldi, Edison, CNH Industrial, A2A and a bilateral loan with Publiacqua (ACEA group) have been closed. |
| • | Latin America: BBVA led 6 relevant operations, as sole bookrunner for San Luis Rassini, and as joint bookrunner for América Móvil, Cotemar, Molymet, Cemex and Unacem. BBVA ended the year as number two in the Latam league tables as bookrunner, according toDealogic. |
| • | The United States: of note are the syndicated operations led in the role of co-lead for Arranger Synchrony Financial, and as documentation agent for AECOM Technology, Allegion Plc, Amcor Finance USA, Graphic Packaging and Mary Kay. |
| • | Asia: syndicated loans have been concluded for OLAM in Singapore, Origin in Australia and Sinopec Century Bright in Hong Kong. |
The most significant aspects inProject Finance are as follows:
| • | Spain: renewal of the Saba Aparcamientos debt and finance of the 60% concession in BAMSA; finance of the acquisition of the building on Paseo de Gracia 111 to turn it into a hotel; renewal of the debt of the Palacio de Congresos conference center in Seville and the shopping mall Portal de La Marina in Ondara; finance for a logistical warehouse for Mango; and closing of the acquisition of rights to the Tariff Deficit in 2013. |
| • | Eurasia: finance of the construction of Adana Hospital in Turkey. |
| • | The United States: finance of two Liquefied Natural Gas export deals: Freeport LNG, with a novel corporate and contractual structure, which is expected to be refinanced through bonds; and Cameron LNG, the first LNG export terminal at international level, with a tolling structure financed in the United States. |
InLeveraged Finance there was finance for the acquisition of the Quirón group by IDC (a company controlled by CVC) and of Deolo Doltz, bought by CVC.
Global Transaction Banking (GTB) has continued to develop solutions to meet the transaction needs of BBVA customers, launching new products and services through online and mobile banking. A number of products and services were launched in Cash Management, including:
| • | Europe: A token for cell phones, which allows transactions to be signed and validated. It is now available for BlackBerry and Windows devices, thus completing the current offering and improving existing coverage of smartphones to 99%; file encryption with Pretty Good Privacy (PGP) in the BBVA net cash download module, which allows information to be sent securely. |
| 44 | Business areas |
Table of Contents
| • | Argentina: improvement in service for purchase and sale of securities, bonds and shares by individual and joint signatures; customization of payment cards, allowing customers to request personalized payment cards for their payers/debtors. |
| • | Chile: electronic reverse factoring, a new functionality that complements the supplier payment service; Relay Pay, which allows transactions to be signed via a pop-up window from institutional tax websites. |
| • | Peru: optimization of the customs payment service, which improves the communication scheme between BBVA Continental and SUNAT (the state tax collection and administration agency). |
| • | Venezuela: new functionality in BBVA Provinet Empresas for payment to SMEs with an agreement for special collection; Online Bulk Deposit (DEM) with improved automation, transmission and accounting processes. |
| • | The United States: start of the marketing of Direct H2H and SWIFT channels for companies, in account transfers and information. |
In addition, and as part of the Global Trade Finance Solution project, in the external network, Client Trade has been integrated into BBVA net cash for London and Paris, which allows management of their Trade Finance operations through online banking.
Furthermore, it is worth highlighting the participation of GTB in the following operations:
| • | Europe: guarantor of the Xcabal hydroelectric project, carried out in Guatemala. Of note is the significant increase in factoring andreverse factoring operations, together with the attraction of the acquiring business, thanks to the comprehensive offering of cross-border solutions, which incorporate countries such as Germany, Finland and Italy. |
| • | Mexico: increase in the acquiring, payments, collection and payroll business. |
In prizes and awards, the unit received one of the World’s Best Internet Banks in Latin America 2014 Awards in Colombia (regional category of “Best Information Security Initiatives”), granted by the magazineGlobal Finance; and received an award for “Best Cash Management Provider” in Venezuela, Colombia and Peru, fromEuromoney.
Thanks to its customer-centric business model,GlobalMarkets has maintained the positive trend in gross income, which over the quarter has grown by 11.0%, increasing the cumulative figure for the year as a whole by 3.5% to €1,166m. There was an outstanding performance by the institutional segment (up 13% year-on-year) and the equity business at global level (up 12% year-on-year).
By geographical area, customer revenue in Europe has grown year-on-year by 2%, strongly supported by the institutional segment (up 19%) and the equity business (up 13%), as well as by the recovery of the interest-rate business (up 10%). The trend in gross income has been excellent in the United States (up 11.1% year-on-year) and Mexico (up 15.9% year-on-year), both boosted by the fixed-income and foreign-currency businesses.
BBVA has led the debt markets in the fourth quarter of 2014, acting as bookrunner in operations such as the issue of 12-year bonds by Repsol for €500m and the issue by the French toll-road group APRR (Autoroutes Paris-Rhin-Rhône) for a nominal amount of €1,400m.
In Spain, BBVA continues to lead equity brokerage activity on the Spanish stock market, increasing its market share to 13.8% at the close of the fourth quarter of 2014.
As a result of this excellent performance, in 2014 BBVA was named Best Bank in Interest-Rate and Currency Derivatives in Spain and Best Research Service by the prestigiousRisk Magazine.
| Other information: Corporate & Investment Banking | 45 |
Table of Contents
Interest rates
(Quarterly averages)
| 2014 | 2013 | |||||||||||||||||||||||||||||||
| 4Q | 3Q | 2Q | 1Q | 4Q | 3Q | 2Q | 1Q | |||||||||||||||||||||||||
Official ECB rate | 0.05 | 0.12 | 0.22 | 0.25 | 0.33 | 0.50 | 0.58 | 0.75 | ||||||||||||||||||||||||
Euribor 3 months | 0.08 | 0.16 | 0.30 | 0.30 | 0.24 | 0.22 | 0.21 | 0.21 | ||||||||||||||||||||||||
Euribor 1 year | 0.33 | 0.44 | 0.57 | 0.56 | 0.53 | 0.54 | 0.51 | 0.57 | ||||||||||||||||||||||||
USA Federal rates | 0.25 | 0.25 | 0.25 | 0.25 | 0.25 | 0.25 | 0.25 | 0.25 | ||||||||||||||||||||||||
TIIE (Mexico) | 3.29 | 3.29 | 3.67 | 3.79 | 3.85 | 4.24 | 4.32 | 4.72 | ||||||||||||||||||||||||
Exchange rates
(Expressed in currency/euro)
| Year-end exchange rates | Average exchange rates | |||||||||||||||||||
| D% on | D% sobre | D% on | ||||||||||||||||||
| 31-12-14 | 31-12-13 | 30-09-14 | 2014 | 2013 | ||||||||||||||||
Mexican peso | 17.8680 | 1.1 | (4.9 | ) | 17.6582 | (3.9 | ) | |||||||||||||
U.S. dollar | 1.2141 | 13.6 | 3.6 | 1.3283 | (0.0 | ) | ||||||||||||||
Argentinean peso | 10.3830 | (13.4 | ) | 2.5 | 10.7680 | (32.4 | ) | |||||||||||||
Chilean peso | 736.92 | (2.0 | ) | 2.7 | 756.43 | (13.0 | ) | |||||||||||||
Colombian peso | 2,906.98 | (8.5 | ) | (12.2 | ) | 2,652.52 | (6.5 | ) | ||||||||||||
Peruvian new sol | 3.6144 | 6.6 | 0.7 | 3.7672 | (4.7 | ) | ||||||||||||||
Venezuelan bolivar fuerte | 14.5692 | (40.4 | ) | 3.6 | 14.7785 | (45.6 | ) | |||||||||||||
Turkish lira | 2.8320 | 4.5 | 1.6 | 2.9064 | (12.8 | ) | ||||||||||||||
Recurrent economic profit by business area
(January-December 2014. Million euros)
| Adjusted net attributable profit | Economic profit (EP) | |||||||
Banking activity in Spain | 1,054 | 269 | ||||||
Real-estate activity in Spain | 12 | (69 | ) | |||||
The United States | 291 | 68 | ||||||
Eurasia | 500 | 61 | ||||||
Mexico | 2,129 | 1,562 | ||||||
South America | 722 | 287 | ||||||
Corporate Center | (812 | ) | (869 | ) | ||||
BBVA Group | 3,897 | 1,308 | ||||||
| 46 | Annex |
Table of Contents
Conciliation of the BBVA Group’s financial statements
Below is presented the conciliation of the Group’s financial statements with the Garanti Group using the equity method versus consolidation in proportion to the percentage of the BBVA Group’s stake in the Turkish entity. In terms of reporting to the market, this consolidation method is deemed better for evaluating the nature and financial effects of the Garanti Group’s business activities, consistent with the information from previous periods, and more coherent in its effects on solvency. Also shown is the reconciliation of the financial information included in this document with the audited information,
following the change to the accounting policy with respect to the contributions made to the Deposit Guarantee Fund (DGF) in Spain. This change has been explained in this report’s section on earnings. Moreover, in 2013 the corporate operations heading includes the results from the Group’s pension business in Latin America and the capital gains from the sale of the various companies, the capital gain from the disposal of BBVA Panama, the capital gain generated by the reinsurance operation on the individual life and accident insurance portfolio in Spain and the effects of the conclusion of the agreement with the CITIC Group.
Consolidated income statement BBVA Group
(Million euros)
| Garanti Group consolidated in proportion to the | ||||||||||||||||||||||||
| percentage of the Group’s stake and with the | Garanti Group consolidated using | |||||||||||||||||||||||
| heading “Results from corporate operations” | the equity method | |||||||||||||||||||||||
| 2014 | 2013 | 2013(1) | 2014 | 2013 | 2013(1) | |||||||||||||||||||
Net interest income | 15,116 | 14,613 | 14,613 | 14,382 | 13,900 | 13,900 | ||||||||||||||||||
Net fees and commissions | 4,365 | 4,431 | 4,431 | 4,174 | 4,250 | 4,250 | ||||||||||||||||||
Net trading income | 2,135 | 2,527 | 2,527 | 2,134 | 2,511 | 2,511 | ||||||||||||||||||
Dividend income | 531 | 365 | 365 | 531 | 235 | 235 | ||||||||||||||||||
Income by the equity method | 35 | 72 | 72 | 343 | 694 | 694 | ||||||||||||||||||
Other operating income and expenses | (826 | ) | (612 | ) | (819 | ) | (839 | ) | (632 | ) | (838 | ) | ||||||||||||
Gross income | 21,357 | 21,397 | 21,190 | 20,725 | 20,958 | 20,752 | ||||||||||||||||||
Operating expenses | (10,951 | ) | (11,201 | ) | (11,201 | ) | (10,559 | ) | (9,701 | ) | (10,796 | ) | ||||||||||||
Personnel expenses | (5,609 | ) | (5,788 | ) | (5,788 | ) | (5,410 | ) | (5,588 | ) | (5,588 | ) | ||||||||||||
General and administrative expenses | (4,161 | ) | (4,280 | ) | (4,280 | ) | (4,004 | ) | (4,113 | ) | (4,113 | ) | ||||||||||||
Depreciation and amortization | (1,180 | ) | (1,133 | ) | (1,133 | ) | (1,145 | ) | (1,095 | ) | (1,095 | ) | ||||||||||||
Operating income | 10,406 | 10,196 | 9,989 | 10,166 | 10,162 | 9,956 | ||||||||||||||||||
Impairment on financial assets (net) | (4,486 | ) | (5,776 | ) | (5,776 | ) | (4,340 | ) | (5,612 | ) | (5,612 | ) | ||||||||||||
Provisions (net) | (1,155 | ) | (630 | ) | (630 | ) | (1,142 | ) | (609 | ) | (609 | ) | ||||||||||||
Other gains (losses) | (701 | ) | (1,040 | ) | (1,040 | ) | (704 | ) | (2,781 | ) | (2,781 | ) | ||||||||||||
Income before tax | 4,063 | 2,750 | 2,544 | 3,980 | 1,160 | 954 | ||||||||||||||||||
Income tax | (981 | ) | (593 | ) | (531 | ) | (898 | ) | (46 | ) | 16 | |||||||||||||
Net income from ongoing operations | 3,082 | 2,158 | 2,013 | 3,082 | 1,114 | 970 | ||||||||||||||||||
Net income from discontinued operations | — | — | — | — | 1,866 | 1,866 | ||||||||||||||||||
Results from corporate operations | — | 823 | 823 | — | — | — | ||||||||||||||||||
Net income | 3,082 | 2,981 | 2,836 | 3,082 | 2,981 | 2,836 | ||||||||||||||||||
Non-controlling interests | (464 | ) | (753 | ) | (753 | ) | (464 | ) | (753 | ) | (753 | ) | ||||||||||||
Net attributable profit | 2,618 | 2,228 | 2,084 | 2,618 | 2,228 | 2,084 | ||||||||||||||||||
| (1) | Figures restated following the change made in accounting policy relating to contributions to the Deposit Guarantee Fund. |
Impact on income statement of the changes on the accounting policy related to the contributions made to the DGF in Spain(Million euros)
| 2013 published | 2013 re-expressed | Diference | ||||||||||
Extraordinary contribution | (120 | ) | (301 | ) | (181 | ) | ||||||
Ordinary contribution | ||||||||||||
On deposits balance as of 31-12-2012 | (202 | ) | — | 202 | ||||||||
On deposits balance as of 31-12-2013 | — | (226 | ) | (226 | ) | |||||||
Impact on income before tax | (206 | ) | ||||||||||
Impact on income tax | (62 | ) | ||||||||||
Impact on net attributable profit | (144 | ) | ||||||||||
| Conciliation of the BBVA Group’s financial statements | 47 |
Table of Contents
Consolidated balance sheet BBVA Group
(Million euros)
| Garanti Group consolidated in | ||||||||
| proportion to the percentage of | Garanti Group consolidated using | |||||||
| the Group’s stake | the equity method | |||||||
| 31-12-14 | 31-12-14 | |||||||
Cash and balances with central banks | 33,908 | 31,430 | ||||||
Financial assets held for trading | 83,427 | 83,258 | ||||||
Other financial assets designated at fair value | 3,236 | 2,761 | ||||||
Available-for-sale financial assets | 98,734 | 94,875 | ||||||
Loans and receivables | 386,839 | 372,375 | ||||||
Loans and advances to credit institutions | 28,254 | 27,059 | ||||||
Loans and advances to customers | 351,755 | 338,657 | ||||||
Debt securities | 6,831 | 6,659 | ||||||
Held-to-maturity investments | — | — | ||||||
Investments in entities accounted for using the equity method | 661 | 4,509 | ||||||
Tangible assets | 8,014 | 7,820 | ||||||
Intangible assets | 8,840 | 7,371 | ||||||
Other assets | 27,851 | 27,544 | ||||||
Total assets | 651,511 | 631,942 | ||||||
Financial liabilities held for trading | 56,990 | 56,798 | ||||||
Other financial liabilities designated at fair value | 3,590 | 2,724 | ||||||
Financial liabilities at amortized cost | 509,974 | 491,899 | ||||||
Deposits from central banks and credit institutions | 97,735 | 93,361 | ||||||
Deposits from customers | 330,686 | 319,060 | ||||||
Debt certificates | 59,393 | 58,096 | ||||||
Subordinated liabilities | 14,118 | 14,095 | ||||||
Other financial liabilities | 8,042 | 7,288 | ||||||
Liabilities under insurance contracts | 10,471 | 10,460 | ||||||
Other liabilities | 18,877 | 18,451 | ||||||
Total liabilities | 599,902 | 580,333 | ||||||
Non-controlling interests | 2,511 | 2,511 | ||||||
Valuation adjustments | (348 | ) | (348 | ) | ||||
Shareholders’ funds | 49,446 | 49,446 | ||||||
Total equity | 51,609 | 51,609 | ||||||
Total equity and liabilities | 651,511 | 631,942 | ||||||
Memorandum item: | ||||||||
Contingent liabilities | 37,070 | 33,741 | ||||||
Impact on reserves of the changes on the accounting policy related to the contributions made to the DGF in Spain(Million euros)
| 2013 | ||||
Ordinary contribution on deposits balance as of December 2012 | (202 | ) | ||
Impact on income tax | 60 | |||
Adjustment on reserves 2013 | (141 | ) | ||
Impact on reserves throught net attributable profit | (144 | ) | ||
Total adjustment on reserves 2013 | (285 | ) | ||
| 48 | Annex |
Table of Contents
BBVA INVESTOR RELATIONS
Headquarters
Paseo de la Castellana, 81 – 17th floor
28046 Madrid
SPAIN
Telephone: +34 91 374 65 26
E-mail: bbvainvestorrelations@bbva.com
New York Office
1345 Avenue of the Americas, 44th floor
10105 New York, NY
Telephones: +1 212 728 24 16 / +1 212 728 16 60
Hong Kong Office
Level 95, International Commerce Centre
One Austin Road West, Kowloon,
Hong Kong
Telephone: +852 2582 3229
More information at:
http://shareholdersandinvestors.bbva.com
Table of Contents

Table of Contents
SIGNATURE
Pursuant to the requirements of the Securities Exchange Act of 1934, the registrant has duly caused this report to be signed on its behalf by the undersigned, thereunto duly authorized.
| Banco Bilbao Vizcaya Argentaria, S.A. | ||||||
| Date: February 4, 2015 | By: | /s/ María Ángeles Peláez | ||||
| Name: | María Ángeles Peláez | |||||
| Title: | Authorized Representative | |||||