Table of Contents
UNITED STATES
SECURITIES AND EXCHANGE COMMISSION
WASHINGTON, D.C. 20549
FORM 6-K
REPORT OF FOREIGN ISSUER
PURSUANT TO RULE 13a-16 OR 15d-16
UNDER THE SECURITIES EXCHANGE ACT OF 1934
For the month of April, 2015
Commission file number: 1-10110
BANCO BILBAO VIZCAYA ARGENTARIA, S.A.
(Exact name of Registrant as specified in its charter)
BANK BILBAO VIZCAYA ARGENTARIA, S.A.
(Translation of Registrant’s name into English)
Paseo de la Castellana, 81
28046 Madrid
Spain
(Address of principal executive offices)
Indicate by check mark whether the registrant files or will file annual reports under cover of Form 20-F or Form 40-F:
Form 20-F x Form 40-F ¨
Indicate by check mark if the registrant is submitting the Form 6-K in paper as permitted by Regulation S-T Rule 101(b)(1):
Yes ¨ No x
Indicate by check mark if the registrant is submitting the Form 6-K in paper as permitted by Regulation S-T Rule 101(b)(7):
Yes ¨ No x
Table of Contents

Table of Contents

Quarterly report
January-March 2015
| 2 | ||||||
| 3 | ||||||
| 3 | ||||||
| 4 | ||||||
| 9 | ||||||
| 11 | ||||||
| 12 | ||||||
| 14 | ||||||
| 15 | ||||||
| 16 | ||||||
| 18 | ||||||
| 21 | ||||||
| 23 | ||||||
| 26 | ||||||
| 29 | ||||||
| 32 | ||||||
| 35 | ||||||
| 37 | ||||||
| 38 | ||||||
| 39 | ||||||
| 42 | ||||||
Table of Contents
BBVA Group Highlights
(Consolidated figures)
| 31-03-15 | D% | 31-03-14 | 31-12-14 | |||||||||||||
Balance sheet (million euros) | ||||||||||||||||
Total assets | 672,598 | 12.3 | 599,135 | 651,511 | ||||||||||||
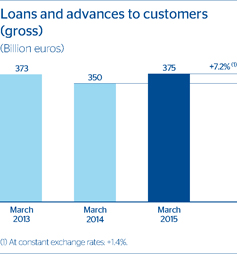
Loans and advances to customers (gross) | 374,873 | 7.2 | 349,726 | 366,536 | ||||||||||||
Deposits from customers | 339,675 | 9.6 | 309,817 | 330,686 | ||||||||||||
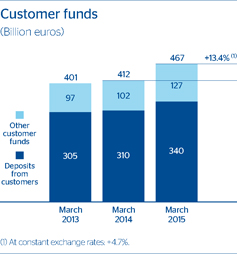
Other customer funds | 127,364 | 24.7 | 102,128 | 115,275 | ||||||||||||
Total customer funds | 467,039 | 13.4 | 411,945 | 445,961 | ||||||||||||
Total equity | 52,366 | 18.9 | 44,056 | 51,609 | ||||||||||||
Income statement (million euros) | ||||||||||||||||
Net interest income | 3,663 | 8.0 | 3,391 | 15,116 | ||||||||||||
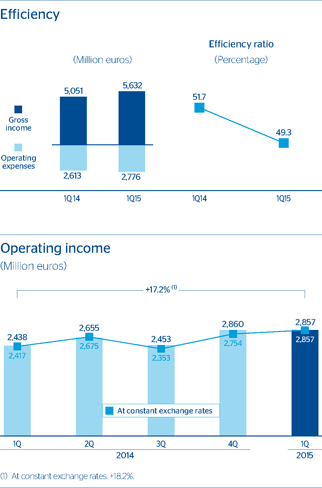
Gross income | 5,632 | 11.5 | 5,051 | 21,357 | ||||||||||||
Operating income | 2,857 | 17.2 | 2,438 | 10,406 | ||||||||||||
Income before tax | 1,442 | 41.8 | 1,017 | 4,063 | ||||||||||||
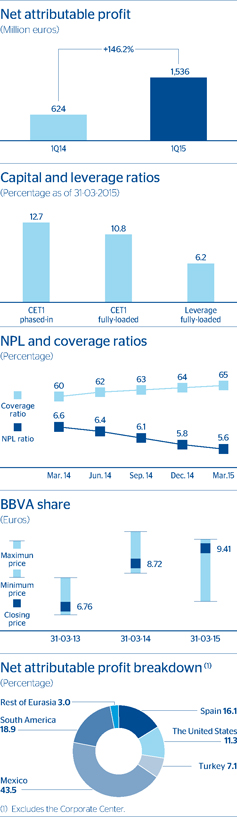
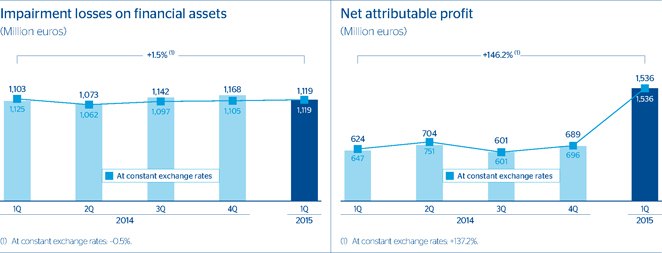
Net attributable profit | 1,536 | 146.2 | 624 | 2,618 | ||||||||||||
Data per share and share performance ratios | ||||||||||||||||
Share price (euros) | 9.41 | 7.9 | 8.72 | 7.85 | ||||||||||||
Market capitalization (million euros) | 58,564 | 16.1 | 50,442 | 48,470 | ||||||||||||
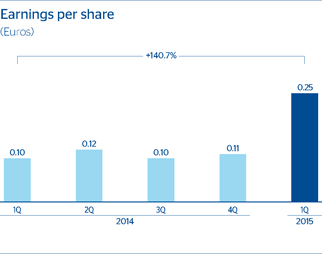
Net attributable profit per share (euros) | 0.25 | 140.7 | 0.10 | 0.44 | ||||||||||||
Book value per share (euros) | 8.09 | 2.1 | 7.92 | 8.01 | ||||||||||||
P/BV (Price/book value; times) | 1.2 | 1.1 | 1.0 | |||||||||||||
Significant ratios (%) | ||||||||||||||||
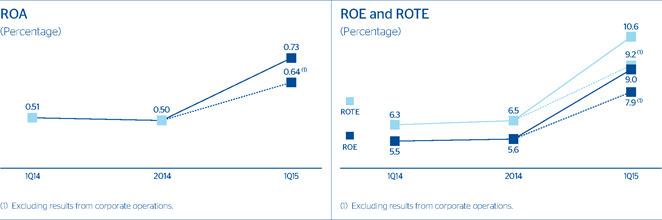
ROE (Net attributable profit/average equity) | 9.0 | 5.5 | 5.6 | |||||||||||||
ROTE (Net attributable profit/average tangible equity) | 10.6 | 6.3 | 6.5 | |||||||||||||
ROA (Net income/average total assets) | 0.73 | 0.51 | 0.50 | |||||||||||||
RORWA (Net income/average risk-weighted assets) | 1.34 | 0.91 | 0.90 | |||||||||||||
Efficiency ratio | 49.3 | 51.7 | 51.3 | |||||||||||||
Cost of risk | 1.21 | 1.27 | 1.25 | |||||||||||||
NPL ratio | 5.6 | 6.6 | 5.8 | |||||||||||||
NPL coverage ratio | 65 | 60 | 64 | |||||||||||||
Capital adequacy ratios (%)(1) | ||||||||||||||||
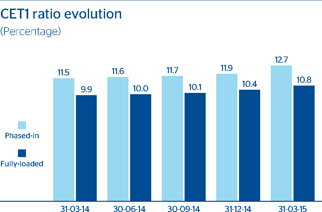
CET1 | 12.7 | 11.5 | 11.9 | |||||||||||||
Tier I | 12.7 | 11.5 | 11.9 | |||||||||||||
Total ratio | 15.8 | 14.3 | 15.1 | |||||||||||||
Other information | ||||||||||||||||
Number of shares (millions) | 6,225 | 7.6 | 5,786 | 6,171 | ||||||||||||
Number of shareholders | 944,631 | (2.4 | ) | 968,213 | 960,397 | |||||||||||
Number of employees(2) | 108,844 | (0.2 | ) | 109,079 | 108,770 | |||||||||||
Number of branches(2) | 7,360 | (1.1 | ) | 7,441 | 7,371 | |||||||||||
Number of ATMs(2) | 22,595 | 7.8 | 20,964 | 22,159 | ||||||||||||
General note: the financial information included in this document with respect to the stake in Garanti Group is presented as continuous with previous years, and integrated in the proportion corresponding to the Group’s percentage holding. For the reconciliation of the BBVA Group’s financial statements, see pages 42 and 43.
| (1) | The capital ratios are calculated under CRD IV, applying a 40% phase in for 2015. |
| (2) | Excluding Garanti. |
| 2 | BBVA Group Highlights |
Table of Contents
Earnings (more information on pages 4-8)
| • | Good year-on-year revenue performance, especially those of more recurring nature. |
| • | Operating expenses growing below gross income, which has a positive influence on operating income and the efficiency ratio. |
| • | Impairment losses on financial assets in line with the quarterly average in 2014. |
| • | The result from corporate operations is due to the capital gains (net of taxes) from the various sale operations equivalent to 5.6% of BBVA Group’s stake in China Citic Bank (CNCB). |
Balance sheet and business activity (more information on pages 9-10)
| • | Favorable performance of production of new loans in practically all the geographical areas. |
| • | Also, good performance of customer funds. |
| • | Further decline in non-performing loans. |
Solvency (more information on page 11)
| • | BBVA’s capital levels are well above the minimum required levels, thanks basically to three factors: organic generation of earnings, closing of the aforementioned sale of CNCB and issuance of instruments eligible as additional Tier I. |
| • | The Bank’s leverage ratio (fully-loaded) also continues to compare very favorably with that of its peer group. |
| • | Moody’s has placed BBVA’s senior debt and deposit long-term rating in review for an upgrade. |
Risk management(more information on pages 12-13)
| • | The main credit risk indicators continue to perform well. |
The BBVA share (more information on page 14)
| • | A new bonus share issue was carried out in April to implement the “dividend option”. On this occasion, the holders of 90.3% of the free allocation rights chose to receive new shares, which once more demonstrates the success of this remuneration system. |
| • | Holding of the Annual General Meeting on March 13, with attendance at more than 62%, in line with previous meetings, and with very strong support from both institutional and individual shareholders. BBVA’s management during 2014 has thus once again received very strong support. BBVA has been the first company in Spain to ask its shareholders to vote on the remuneration policy of its Board of Directors, and obtained more than 95% of the vote in favor. |
Business areas (more information on page 16)
| • | Presentation of Turkey separately from the rest of Eurasia. |
| • | Application of the SIMADI in Venezuela. |
Other matters of interest
| • | Indigital transformation, as of February 2015, BBVA has 9.4 million digital customers, who interact with the Entity via the Internet or cell phones (+21% average annual growth rate-CAGR-since December 2011). Of these, 4.6 million are mobile banking customers (+129% CAGR also from December 2011). Including Garanti, BBVA has 12.8 million digital customers and 6.4 million mobile banking customers. |
| Relevant events | 3 |
Table of Contents
Consolidated income statement: quarterly evolution(1)
(Million euros)
| 2015 | 2014 | |||||||||||||||||||
| 1Q | 4Q | 3Q | 2Q | 1Q | ||||||||||||||||
Net interest income | 3,663 | 4,248 | 3,830 | 3,647 | 3,391 | |||||||||||||||
Net fees and commissions | 1,077 | 1,168 | 1,111 | 1,101 | 985 | |||||||||||||||
Net trading income | 775 | 514 | 444 | 426 | 751 | |||||||||||||||
Dividend income | 42 | 119 | 42 | 342 | 29 | |||||||||||||||
Income by the equity method | 3 | 3 | 31 | 16 | (14 | ) | ||||||||||||||
Other operating income and expenses | 73 | (287 | ) | (234 | ) | (215 | ) | (90 | ) | |||||||||||
Gross income | 5,632 | 5,765 | 5,223 | 5,317 | 5,051 | |||||||||||||||
Operating expenses | (2,776 | ) | (2,905 | ) | (2,770 | ) | (2,662 | ) | (2,613 | ) | ||||||||||
Personnel expenses | (1,460 | ) | (1,438 | ) | (1,438 | ) | (1,359 | ) | (1,375 | ) | ||||||||||
General and administrative expenses | (1,024 | ) | (1,147 | ) | (1,037 | ) | (1,017 | ) | (959 | ) | ||||||||||
Depreciation and amortization | (291 | ) | (320 | ) | (296 | ) | (286 | ) | (279 | ) | ||||||||||
Operating income | 2,857 | 2,860 | 2,453 | 2,655 | 2,438 | |||||||||||||||
Impairment on financial assets (net) | (1,119 | ) | (1,168 | ) | (1,142 | ) | (1,073 | ) | (1,103 | ) | ||||||||||
Provisions (net) | (230 | ) | (513 | ) | (199 | ) | (298 | ) | (144 | ) | ||||||||||
Other gains (losses) | (66 | ) | (201 | ) | (136 | ) | (191 | ) | (173 | ) | ||||||||||
Income before tax | 1,442 | 978 | 976 | 1,092 | 1,017 | |||||||||||||||
Income tax | (386 | ) | (173 | ) | (243 | ) | (292 | ) | (273 | ) | ||||||||||
Net income from ongoing operations | 1,056 | 805 | 733 | 800 | 744 | |||||||||||||||
Results from corporate operations(2) | 583 | — | — | — | — | |||||||||||||||
Net income | 1,639 | 805 | 733 | 800 | 744 | |||||||||||||||
Non-controlling interests | (103 | ) | (116 | ) | (132 | ) | (95 | ) | (120 | ) | ||||||||||
Net attributable profit | 1,536 | 689 | 601 | 704 | 624 | |||||||||||||||
Net attributable profit (excluding results from corporate operations) | 953 | 689 | 601 | 704 | 624 | |||||||||||||||
Basic earnings per share (euros) | 0.25 | 0.11 | 0.10 | 0.12 | 0.10 | |||||||||||||||
| (1) | Financial statements with the revenues and expenses of the Garanti Group consolidated in proportion to the percentage of the Group’s stake. |
| (2) | 2015 includes the capital gains from the various sale transactions equivalent to 5.6% of BBVA Group’s stake in CNCB. |
The following are the most notable aspects of BBVA Group’s earningsin the first quarter of 2015:
Gross income
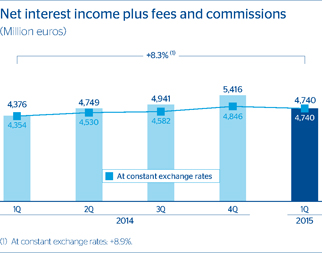
Year-on-year increase of 8.3% inrecurring revenue, thanks to the growth of net interest income in practically all geographical areas and to the positive trend in fees and commissions, despite the regulatory limitations that took effect in several countries in recent quarters.
Net gains/losses on financial assets (NTI) above the figure reported for the first quarter of 2014, largely due to portfolio sells and to the good performance of the Global Markets unit in the quarter.
| 4 | Group information |
Table of Contents
Consolidated income statement(1)
(Million euros)
| D% at constant | ||||||||||||||||
| 1Q15 | D% | exchange rates | 1Q14 | |||||||||||||
Net interest income | 3,663 | 8.0 | 9.7 | 3,391 | ||||||||||||
Net fees and commissions | 1,077 | 9.3 | 6.0 | 985 | ||||||||||||
Net trading income | 775 | 3.3 | 10.0 | 751 | ||||||||||||
Dividend income | 42 | 46.7 | 41.4 | 29 | ||||||||||||
Income by the equity method | 3 | n.m. | n.m. | (14 | ) | |||||||||||
Other operating income and expenses | 73 | n.m. | 184.7 | (90 | ) | |||||||||||
Gross income | 5,632 | 11.5 | 10.4 | 5,051 | ||||||||||||
Operating expenses | (2,776 | ) | 6.2 | 3.4 | (2,613 | ) | ||||||||||
Personnel expenses | (1,460 | ) | 6.2 | 2.5 | (1,375 | ) | ||||||||||
General and administrative expenses | (1,024 | ) | 6.8 | 5.0 | (959 | ) | ||||||||||
Depreciation and amortization | (291 | ) | 4.5 | 2.6 | (279 | ) | ||||||||||
Operating income | 2,857 | 17.2 | 18.2 | 2,438 | ||||||||||||
Impairment on financial assets (net) | (1,119 | ) | 1.5 | (0.5 | ) | (1,103 | ) | |||||||||
Provisions (net) | (230 | ) | 58.9 | 74.5 | (144 | ) | ||||||||||
Other gains (losses) | (66 | ) | (62.0 | ) | (62.2 | ) | (173 | ) | ||||||||
Income before tax | 1,442 | 41.8 | 46.1 | 1,017 | ||||||||||||
Income tax | (386 | ) | 41.3 | 51.4 | (273 | ) | ||||||||||
Net income from ongoing operations | 1,056 | 42.0 | 44.3 | 744 | ||||||||||||
Results from corporate operations(2) | 583 | — | — | — | ||||||||||||
Net income | 1,639 | 120.4 | 124.0 | 744 | ||||||||||||
Non-controlling interests | (103 | ) | (14.2 | ) | 22.2 | (120 | ) | |||||||||
Net attributable profit | 1,536 | 146.2 | 137.2 | 624 | ||||||||||||
Net attributable profit (excluding results from corporate operations) | 953 | 52.8 | 47.2 | 624 | ||||||||||||
Basic earnings per share (euros) | 0.25 | 0.10 | ||||||||||||||
| (1) | Financial statements with the revenues and expenses of the Garanti Group consolidated in proportion to the percentage of the Group’s stake. |
| (2) | 2015 includes the capital gains from the various sale transactions equivalent to 5.6% of BBVA Group’s stake in CNCB. |
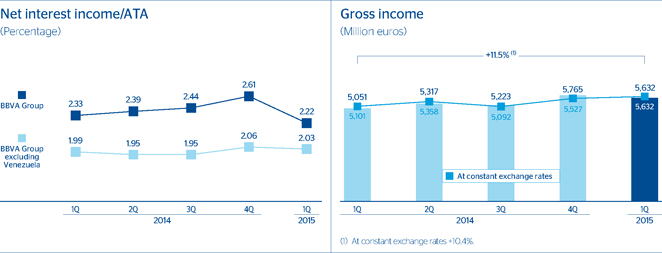
Thus, the Group’sgross income has risen by 11.5% over the last twelve months to €5,632m in the quarter.
Operating income
There has been a moderate increase inoperating expenses, largely because they have been kept in check in Spain, the United States and Corporate Center. This has offset the effect of the high inflation in some countries and the digital transformation plans that the Group continues to implement.
| Earnings | 5 |
Table of Contents
Breakdown of operating expenses and efficiency calculation
(Million euros)
| 1Q15 | D% | 1Q14 | ||||||||||
Personnel expenses | 1,460 | 6.2 | 1,375 | |||||||||
Wages and salaries | 1,115 | 7.3 | 1,039 | |||||||||
Employee welfare expenses | 222 | 0.4 | 221 | |||||||||
Training expenses and other | 123 | 7.5 | 114 | |||||||||
General and administrative expenses | 1,024 | 6.8 | 959 | |||||||||
Premises | 241 | 5.4 | 228 | |||||||||
IT | 203 | 7.9 | 188 | |||||||||
Communications | 64 | (5.0 | ) | 68 | ||||||||
Advertising and publicity | 83 | (1.5 | ) | 84 | ||||||||
Corporate expenses | 21 | 3.9 | 20 | |||||||||
Other expenses | 301 | 9.7 | 274 | |||||||||
Levies and taxes | 111 | 15.6 | 96 | |||||||||
Administration expenses | 2,484 | 6.4 | 2,334 | |||||||||
Depreciation and amortization | 291 | 4.5 | 279 | |||||||||
Operating expenses | 2,776 | 6.2 | 2,613 | |||||||||
Gross income | 5,632 | 11.5 | 5,051 | |||||||||
Efficiency ratio (Operating expenses/gross income, in %) | 49.3 | 51.7 | ||||||||||
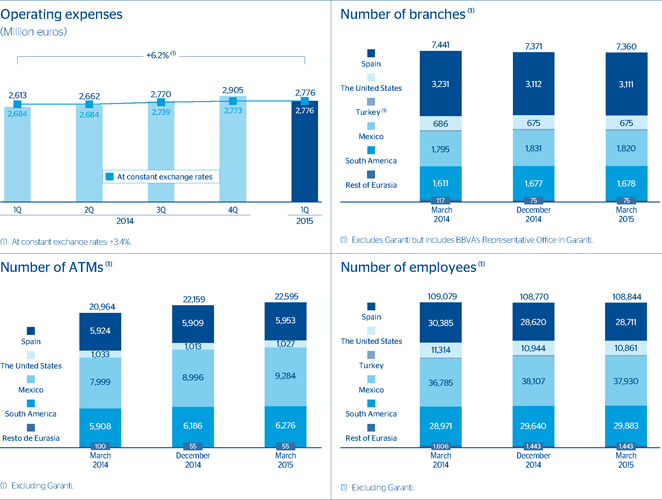
This digital transformation process is driving the alternative sales channels. It explains the growing number ofATMs, which, in turn, makes it possible to reduce the number ofbranch offices.
Thenumber of employees remains the same this quarter at the aggregate level (up 0.1%), with no major changes by geographical area.
| 6 | Group information |
Table of Contents
The year-on-year increase in expenses has been lower than that of gross income, thus improving the efficiency ratio (to 49.3% from the figure of 51.7% in the first quarter of 2014) and boostingoperating income to €2,857m, a year-on-year increase of 17.2%.
Provisions and others
Impairment losses on financial assets have been very similar to the 2014 quarterly average. They fall in Spain and have increased in the Americas and Turkey, in line with the performance of the business activity.
Provisions include among others, the costs stemming from the Group’s digital transformation plans, provisions for contingent liabilities and contributions to pension funds. These items totaled €230m in the quarter.
The main component ofother gains (losses) is loan-loss provisions for real estate and foreclosed or acquired assets in Spain, which have decreased 62.0% in the first quarter of 2015.
Profit
As a result of the above,net income from ongoing operationsgrew year-on-year by 42.0%.
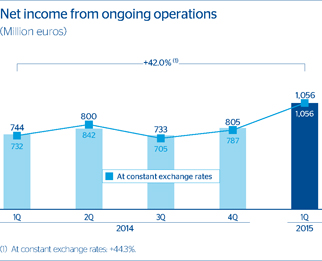
Theresults from corporate operations line includes the capital gains (€583m net of taxes) from the various sale operations equivalent to 5.6% of BBVA Group’s stake in CNCB. In 2014 there were no transactions under this heading.
As a result, thenet attributable profit for the quarter stands at €1,536m, well above the €624m reported for the same period the previous year.
| Earnings | 7 |
Table of Contents
Bybusiness area, banking activity in Spain has contributed €347m, real-estate activity in Spain generated a loss of €154m, while the United States contributed €136m, Turkey €86m, Mexico €524m, South America €227m and the Rest of Eurasia €36m.
BBVA Group excluding Venezuela
On February 10, 2015, the Venezuelan government announced the closure of SICAD II as a mechanism regulating the purchase and sale of foreign currency, its merger with SICAD I in a new SICAD (not yet in place) and the creation of a new foreign-currency system called SIMADI. In accordance with the IAS 21, the exchange rate to be used to convert currencies is that which in the entity’s judgement best reflects the situation at the date of the financial statements. The exchange rate used by the Group for converting the Venezuelan currency as of March 31, 2015 is that of SIMADI. Below are the income statements for the Group, excluding Venezuela.
Consolidated income statement of BBVA Group excluding Venezuela (1)
(Million euros)
| 1Q15 | D% | D% at constant exchange rates | 1Q14 | |||||||||||||
Net interest income | 3,624 | 17.0 | 9.3 | 3,097 | ||||||||||||
Net fees and commissions | 1,071 | 12.9 | 5.7 | 948 | ||||||||||||
Net trading income | 703 | 3.4 | 0.5 | 680 | ||||||||||||
Other income/expenses | 140 | 230.3 | 175.9 | 43 | ||||||||||||
Gross income | 5,538 | 16.2 | 9.0 | 4,768 | ||||||||||||
Operating expenses | (2,761 | ) | 9.6 | 3.1 | (2,519 | ) | ||||||||||
Operating income | 2,778 | 23.5 | 15.6 | 2,249 | ||||||||||||
Impairment on financial assets (net) | (1,116 | ) | 3.1 | (0.6 | ) | (1,082 | ) | |||||||||
Provisions (net) and other gains (losses) | (267 | ) | (11.4 | ) | (12.4 | ) | (301 | ) | ||||||||
Income before tax | 1,395 | 61.2 | 43.0 | 865 | ||||||||||||
Income tax | (365 | ) | 62.9 | 45.3 | (224 | ) | ||||||||||
Net income from ongoing operations | 1,030 | 60.5 | 42.2 | 641 | ||||||||||||
Results from corporate operations(2) | 583 | n.m. | n.m. | — | ||||||||||||
Net income | 1,613 | 151.4 | 122.8 | 641 | ||||||||||||
Non-controlling interests | (91 | ) | 23.3 | 13.1 | (74 | ) | ||||||||||
Net attributable profit | 1,521 | 168.1 | 136.5 | 567 | ||||||||||||
Net attributable profit (excluding results from corporate operations) | 938 | 65.4 | 45.9 | 567 | ||||||||||||
| (1) | Financial statements with the revenues and expenses of the Garanti Group consolidated in proportion to the percentage of the Group’s stake. |
| (2) | 2015 includes the capital gains from the various sale transactions equivalent to 5.6% of BBVA Group’s stake in CNCB. |
| 8 | Group information |
Table of Contents
Balance sheet and business activity
The Group’s balance sheet and business activity in thefirst quarter of 2015 were shaped by:
| • | The strengthening against the euro of theexchange rates of the currencies that most influence the Group’s financial statements, with the exception of the Venezuelan bolivar. |
| • | There was widespread growth ingross lending tocustomers, with the exception of Spain, where year-on-year growth rates remain negative, but are gradually improving. |
| • | Incustomer deposits all geographical areas recorded growth. In Spain there was an outflow from time deposits |
due to the significant decrease in costs compared with figures for the same period the previous year. Those funds were partly transferred to current and savings accounts and partly to mutual funds. |
| • | Further reduction innon-performing loans in the quarter. |
| • | Lastly,off-balance-sheet funds continue to perform very well, particularly in Spain, due to the aforementioned transfer of funds, although they are also progressing well in all other geographical regions. |
Consolidated balance sheet (1)
(Million euros)
| 31-03-15 | D% | 31-03-14 | 31-12-14 | |||||||||||||
Cash and balances with central banks | 27,553 | — | 27,546 | 33,908 | ||||||||||||
Financial assets held for trading | 94,883 | 24.1 | 76,433 | 83,427 | ||||||||||||
Other financial assets designated at fair value | 3,603 | 6.4 | 3,385 | 3,236 | ||||||||||||
Available-for-sale financial assets | 101,183 | 14.7 | 88,236 | 98,734 | ||||||||||||
Loans and receivables | 398,558 | 10.4 | 360,938 | 386,839 | ||||||||||||
Loans and advances to credit institutions | 33,672 | 57.0 | 21,441 | 28,254 | ||||||||||||
Loans and advances to customers | 360,265 | 7.6 | 334,698 | 351,755 | ||||||||||||
Debt securities | 4,622 | (3.7 | ) | 4,799 | 6,831 | |||||||||||
Held-to-maturity investments | — | — | — | — | ||||||||||||
Investments in entities accounted for using the equity method | 674 | (48.9 | ) | 1,319 | 661 | |||||||||||
Tangible assets | 8,057 | 7.8 | 7,474 | 8,014 | ||||||||||||
Intangible assets | 9,493 | 16.6 | 8,139 | 8,840 | ||||||||||||
Other assets | 28,593 | 11.4 | 25,666 | 27,851 | ||||||||||||
Total assets | 672,598 | 12.3 | 599,135 | 651,511 | ||||||||||||
Financial liabilities held for trading | 67,438 | 37.7 | 48,976 | 56,990 | ||||||||||||
Other financial liabilities designated at fair value | 3,903 | 28.4 | 3,040 | 3,590 | ||||||||||||
Financial liabilities at amortized cost | 518,819 | 8.8 | 476,656 | 509,974 | ||||||||||||
Deposits from central banks and credit institutions | 92,547 | 9.6 | 84,461 | 97,735 | ||||||||||||
Deposits from customers | 339,675 | 9.6 | 309,817 | 330,686 | ||||||||||||
Debt certificates | 58,259 | (7.4 | ) | 62,892 | 59,393 | |||||||||||
Subordinated liabilities | 15,723 | 29.7 | 12,123 | 14,118 | ||||||||||||
Other financial liabilities | 12,616 | 71.3 | 7,363 | 8,042 | ||||||||||||
Liabilities under insurance contracts | 11,193 | 10.8 | 10,102 | 10,471 | ||||||||||||
Other liabilities | 18,879 | 15.8 | 16,306 | 18,877 | ||||||||||||
Total liabilities | 620,232 | 11.7 | 555,079 | 599,902 | ||||||||||||
Non-controlling interests | 1,692 | (9.2 | ) | 1,863 | 2,511 | |||||||||||
Valuation adjustments | 327 | n.m. | (3,636 | ) | (348 | ) | ||||||||||
Shareholders’ funds | 50,347 | 9.9 | 45,830 | 49,446 | ||||||||||||
Total equity | 52,366 | 18.9 | 44,056 | 51,609 | ||||||||||||
Total equity and liabilities | 672,598 | 12.3 | 599,135 | 651,511 | ||||||||||||
Memorandum item: | ||||||||||||||||
Contingent liabilities | 38,923 | 11.6 | 34,878 | 37,070 | ||||||||||||
| (1) | Financial statements with the revenues and expenses of the Garanti Group consolidated in proportion to the percentage of the Group’s stake. |
| Balance sheet and business activity | 9 |
Table of Contents
Loans and advances to customers
(Million euros)
| 31-03-15 | D% | 31-03-14 | 31-12-14 | |||||||||||||
Domestic sector | 160,938 | (4.5 | ) | 168,461 | 162,652 | |||||||||||
Public sector | 23,106 | (3.6 | ) | 23,962 | 23,362 | |||||||||||
Other domestic sectors | 137,832 | (4.6 | ) | 144,499 | 139,290 | |||||||||||
Secured loans | 86,144 | (6.2 | ) | 91,858 | 87,371 | |||||||||||
Other loans | 51,688 | (1.8 | ) | 52,641 | 51,920 | |||||||||||
Non-domestic sector | 191,148 | 22.3 | 156,233 | 180,719 | ||||||||||||
Secured loans | 79,500 | 25.4 | 63,391 | 72,836 | ||||||||||||
Other loans | 111,648 | 20.3 | 92,842 | 107,883 | ||||||||||||
Non-performing loans | 22,787 | (9.0 | ) | 25,033 | 23,164 | |||||||||||
Domestic sector | 18,058 | (11.3 | ) | 20,356 | 18,563 | |||||||||||
Non-domestic sector | 4,729 | 1.1 | 4,677 | 4,601 | ||||||||||||
Loans and advances to customers (gross) | 374,873 | 7.2 | 349,726 | 366,536 | ||||||||||||
Loan-loss provisions | (14,607 | ) | (2.8 | ) | (15,028 | ) | (14,781 | ) | ||||||||
Loans and advances to customers | 360,265 | 7.6 | 334,698 | 351,755 | ||||||||||||
Customer funds
(Million euros)
| 31-03-15 | D% | 31-03-14 | 31-12-14 | |||||||||||||
Deposits from customers | 339,675 | 9.6 | 309,817 | 330,686 | ||||||||||||
Domestic sector | 150,512 | 0.1 | 150,415 | 145,251 | ||||||||||||
Public sector | 13,142 | (27.6 | ) | 18,160 | 10,651 | |||||||||||
Other domestic sectors | 137,370 | 3.9 | 132,255 | 134,600 | ||||||||||||
Current and savings accounts | 62,783 | 18.1 | 53,150 | 59,509 | ||||||||||||
Time deposits | 56,571 | (17.6 | ) | 68,676 | 60,783 | |||||||||||
Assets sold under repurchase agreement and other | 18,016 | 72.8 | 10,428 | 14,308 | ||||||||||||
Non-domestic sector | 189,163 | 18.7 | 159,402 | 185,435 | ||||||||||||
Current and savings accounts | 113,399 | 15.2 | 98,402 | 113,795 | ||||||||||||
Time deposits | 69,107 | 34.3 | 51,473 | 62,705 | ||||||||||||
Assets sold under repurchase agreement and other | 6,657 | (30.1 | ) | 9,527 | 8,935 | |||||||||||
Other customer funds | 127,364 | 24.7 | 102,128 | 115,275 | ||||||||||||
Spain | 74,824 | 20.2 | 62,263 | 69,943 | ||||||||||||
Mutual funds | 30,743 | 29.3 | 23,783 | 28,695 | ||||||||||||
Pension funds | 22,595 | 7.6 | 20,994 | 21,880 | ||||||||||||
Customer portfolios | 21,485 | 22.9 | 17,486 | 19,368 | ||||||||||||
Rest of the world | 52,540 | 31.8 | 39,865 | 45,332 | ||||||||||||
Mutual funds and investment companies | 26,798 | 23.2 | 21,759 | 24,087 | ||||||||||||
Pension funds | 6,349 | 46.6 | 4,331 | 5,484 | ||||||||||||
Customer portfolios | 19,394 | 40.8 | 13,775 | 15,761 | ||||||||||||
Total customer funds | 467,039 | 13.4 | 411,945 | 445,961 | ||||||||||||
| 10 | Group information |
Table of Contents
Capital base
BBVA ended thefirst quarter of 2015 with comfortable capital levels clearly above the minimum regulatory requirements and reached a leverage ratio (fully-loaded) that continues to compare very favorably with the rest of its peer group. The main highlights in the quarter are:
| • | Anissue of contingent convertible securities, eligible as additional Tier I, for an amount of €1.5bn. |
| • | The varioussale operations of BBVA Group’s stake in CNCB. |
| • | It should be noted that a 40%phased-in is applied to the CET1 ratio in 2015, versus the 20% in 2014. |
| • | Lastly,RWAs are down 1.1% in the quarter. The positive impacts stemming from the increased lending activity and the appreciation of the exchange rates of most currencies against the euro, have been offset by the application of the new SIMADI exchange-rate system in Venezuela. |
Another relevant highlight in the quarter was thatBBVACompass passed the stress tests conducted in the United States and, thus, its capital plans have been approved without objections by the Fed. Moreover, in April, BBVA Compass completed a subordinated debt issue, eligible as Tier II, for $700m, with demand that was oversubscribed over 4.8 times.
To sum up, the Group’s capitalization levels easily exceed the regulatory limits and enable it to meet all the capital targets.
Ratings
After the publication byMoody’s of the new bank rating methodology on March 16, the agency has reviewed its forecasts to upgrade the long-term rating for BBVA’s senior debt and deposits. Should the upgrades take place, the senior debt rating would be one notch higher and the rating for deposits would be up two notches.
On February 10,DBRS changed its forecast for BBVA from negative to stable. This is a reflection of its outlook on the improvement of the Group’s fundamentals, reinforced after the presentation of the results for the fourth quarter of 2014.
Ratings
| Long term | Short term | Outlook | ||||||||||
DBRS | A | R-1 (low) | Stable | |||||||||
Fitch | A– | F-2 | Stable | |||||||||
Moody’s | Baa2 | P-2 | | Under review for upgrade | | |||||||
Scope Ratings | A | S-1 | Stable | |||||||||
Standard & Poor’s | BBB | A-2 | Stable | |||||||||
Capital base
(Million euros)
| CRD IV phased-in | ||||||||||||||||||||
| 31-03-15 | 31-12-14 | 30-09-14 | 30-06-14 | 31-03-14 | ||||||||||||||||
Common equity Tier I | 43,995 | 41,832 | 40,422 | 38,978 | 38,700 | |||||||||||||||
Capital (Tier I) | 43,995 | 41,832 | 40,422 | 38,978 | 38,700 | |||||||||||||||
Other eligible capital (Tier II) | 10,686 | 10,986 | 10,893 | 10,421 | 9,170 | |||||||||||||||
Capital base | 54,681 | 52,818 | 51,316 | 49,399 | 47,870 | |||||||||||||||
Risk-weighted assets | 347,096 | 350,803 | 345,381 | 336,584 | 335,276 | |||||||||||||||
Total ratio (%) | 15.8 | 15.1 | 14.9 | 14.7 | 14.3 | |||||||||||||||
CET1 (%) | 12.7 | 11.9 | 11.7 | 11.6 | 11.5 | |||||||||||||||
Tier I (%) | 12.7 | 11.9 | 11.7 | 11.6 | 11.5 | |||||||||||||||
Tier II (%) | 3.1 | 3.1 | 3.2 | 3.1 | 2.7 | |||||||||||||||
| Solvency | 11 |
Table of Contents
Credit risk
In thefirst quarter of 2015 the main variables related to the Group’s credit risk management have been positive, in line with the trend of previous quarters:
| • | The Group’s credit risk has increased by 2.5% since the end of 2014, despite the negative effect of the application of the new SIMADI exchange rate in Venezuela. |
| • | Stability in NPL flows due to containment of gross additions. |
| • | Therefore, positive trend in the NPL ratio, which closed at 5.6% as of 31-Mar-2015. |
| • | Improvement in the coverage ratio (65%) and the cost of risk (1.21% accumulated to March 2015, compared with 1.25% in 2014 and 1.27% in the same period the previous year). |
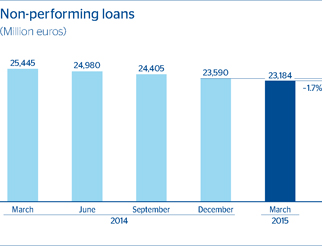
Credit risks (1)
(Million euros)
| 31-03-15 | 31-12-14 | 30-09-14 | 30-06-14 | 31-03-14 | ||||||||||||||||
Non-performing loans and contingent liabilities | 23,184 | 23,590 | 24,405 | 24,980 | 25,445 | |||||||||||||||
Credit risks | 413,687 | 403,633 | 397,952 | 389,355 | 384,577 | |||||||||||||||
Provisions | 15,002 | 15,157 | 15,335 | 15,515 | 15,372 | |||||||||||||||
NPL ratio (%)(2) | 5.6 | 5.8 | 6.1 | 6.4 | 6.6 | |||||||||||||||
NPL coverage ratio (%)(2) | 65 | 64 | 63 | 62 | 60 | |||||||||||||||
NPL ratio (%) (excluding real-estate activity in Spain)(2) | 3.9 | 4.1 | 4.3 | 4.5 | 4.6 | |||||||||||||||
NPL coverage ratio (%) (excluding real-estate activity in Spain)(2) | 66 | 65 | 64 | 63 | 59 | |||||||||||||||
| (1) | Include gross customer lending plus contingent exposures. |
| (2) | Includes contingent liabilities. |
Non-performing loans evolution
(Million euros)
| 1Q15 | 4Q14 | 3Q14 | 2Q14 | 1Q14 | ||||||||||||||||
Beginning balance | 23,590 | 24,405 | 24,980 | 25,445 | 26,243 | |||||||||||||||
Entries | 2,359 | 2,363 | 2,429 | 2,092 | 2,190 | |||||||||||||||
Recoveries | (1,751 | ) | (1,935 | ) | (1,840 | ) | (1,781 | ) | (1,708 | ) | ||||||||||
Net variation | 608 | 427 | 589 | 311 | 482 | |||||||||||||||
Write-offs | (1,152 | ) | (1,248 | ) | (1,297 | ) | (961 | ) | (1,248 | ) | ||||||||||
Exchange rate differences and other | 138 | 5 | 133 | 185 | (32 | ) | ||||||||||||||
Period-end balance | 23,184 | 23,590 | 24,405 | 24,980 | 25,445 | |||||||||||||||
Memorandum item: | ||||||||||||||||||||
Non-performing loans | 22,787 | 23,164 | 23,983 | 24,554 | 25,032 | |||||||||||||||
Non-performing contingent liabilities | 398 | 426 | 422 | 426 | 413 | |||||||||||||||
| 12 | Group information |
Table of Contents
Structural risks
Liquidity and funding
Management ofliquidity and funding aims to finance the recurring growth of the banking business at suitable maturities and costs, using a wide range of instruments that provide access to a large number of alternative sources of finance.
A core principle in BBVA’s management of the Group’s liquidity and funding is the financial independence of its banking subsidiaries abroad. This principle prevents the propagation of a liquidity crisis between the different areas and ensures that the cost of liquidity is correctly reflected in price formation.
In thefirst quarter of 2015, the liquidity conditions remained comfortable across BBVA’s global footprint:
| • | The third TLTRO auction was held in March, at which BBVA borrowed €2,000m. |
| • | The long-term wholesale financial markets in Europe have remained stable and BBVA completed a new issue of mortgage-covered bonds for €1,250m. |
| • | Short-term funding in Europe has also continued to perform extremely well, in a context marked by a high level of market liquidity. |
| • | In general, the financial soundness of the banks in other regions is based on the funding of lending activity, done basically with customer funds. |
Foreign exchange
Foreign-exchange risk management of BBVA’s long-term investments, basically stemming from its franchises abroad, aims to preserve the Group’s capital adequacy ratios and ensure the stability of its income statement.
Thefirst quarter of the year saw gains in the dollar against the euro and greater volatility in those emerging currencies affected by the major fall in the oil price. In this context, BBVA has maintained a policy of actively hedging its investments in Mexico, Chile, Colombia, Turkey and the dollar area. In addition to this corporate-level hedging, dollar positions are held at a local level by some of the subsidiary banks. The foreign-exchange risk of the earnings expected from abroad for 2015 is also managed.
Interest rate
The aim of managing this risk is to maintain sustained growth of net interest income in the short and medium term, irrespective of interest-rate fluctuations.
In thefirst quarter of 2015, the results of this management have been satisfactory, with limited risk strategies in Europe, the United States and Mexico. The amount of NTI generated in these geographical areas is the result of prudent portfolio management strategies, particularly in terms of sovereign debt, in a context marked by low interest rates.
Economic capital
Attributable economic risk capital (ERC) consumption at the end of March 2015 stood at €30,836m(1), equivalent to an increase of 1.3% with respect to the close of December 2014. The most significant changes are summarized below:
| • | Increase in credit ERC due to the euro’s depreciation against the respective local currencies (except the Venezuelan bolivar fuerte), affected by the approval of the quantitative easing (QE) program approved by the European Central Bank (ECB). |
| • | Decline in equities ERC due to the reduction of the stake in CNCB. |
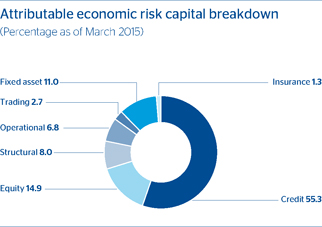
| (1) | The rate of change is calculated against the close of December 2014 (€30,452m), which includes the annual effects of the update of the methodology, the credit risk parameters at the end of the year (Mexico, South America and the United States) and the review of models for the other risks. The figure published in the Quarterly Report of the fourth quarter of 2014 was €31,569m. |
| Risk management | 13 |
Table of Contents
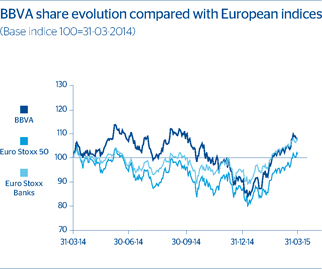
In the first quarter of 2015, theglobal economy has continued to show differences between the geographical areas, with better relative performance in developed economies compared with the gradual slowdown in China and moderate activity in other emerging regions. This is taking place in a scenario of certain geopolitical tensions, an absence of inflationary pressures and diverging monetary policies.
Against this backdrop, the mainstock market indices ended the first quarter of 2015 with general rises, which were significantly higher in Europe than in the United States (the Euro Stoxx 50 up 17.5%, the Ibex 35 up 12.1% and the S&P500 up 0.4%). The Eurozone banking index, Euro Stoxx Banks, gained 17.2% in the quarter, while the S&P Regional Banks in the United States lost 0.9% in the same period.
As of March 31, 2015, theBBVA share price stood at €9.41 per share, a gain of 19.8% over the quarter and 7.9% in the last 12 months. In quarter-on-quarter terms it outperformed the Ibex 35 and the European indices Euro Stoxx 50 and Euro Stoxx Banks. As of 31-Mar-2015, the share has a weighting of 10.51% on the Ibex 35 and of 2.49% on the Euro Stoxx 50. As of the same date, BBVA’s market capitalization stood at €58,564m, 20.8% higher than on 31-Dec-2014.
With respect toshareholder remuneration, at the meeting held on March 25, 2015 the Board of Directors of BBVA agreed to perform a capital increase against reserves for the implementation of the “dividend option” shareholder remuneration scheme. Each shareholder is entitled to one
The BBVA share and share performance ratios
| 31-03-15 | 31-12-14 | |||||||
Number of shareholders | 944,631 | 960,397 | ||||||
Number of shares issued | 6,224,923,938 | 6,171,338,995 | ||||||
Maximum price (euros) | 9.60 | 9.66 | ||||||
Minimum price (euros) | 7.21 | 7.45 | ||||||
Closing price (euros) | 9.41 | 7.85 | ||||||
Book value per share (euros) | 8.09 | 8.01 | ||||||
Market capitalization (million euros) | 58,564 | 48,470 | ||||||
Price/book value (times) | 1.2 | 1.0 | ||||||
PER (Price/earnings; times) | 15.9 | 17.3 | ||||||
Yield (Dividend/price; %)(1) | 3.4 | 4.5 | ||||||
| (1) | Calculated by dividing the median of the forecast dividend per share of a consensus of analysts by the BBVA share price at the end of each quarter. |
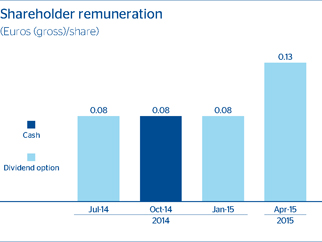
free allocation right for each BBVA share held on the date of publication of the announcement of the capital increase in the Official Bulletin of the Companies Register, with 70 rights entitling the holder to one new BBVA share. Alternatively, shareholders who wish to receive their remuneration in cash are entitled to sell their free allocation rights to BBVA at a gross fixed price of €0.13 per right during the first ten calendar days of their trading period, or on the market during the complete trading period. This system seeks to optimize and customize the remuneration scheme so that shareholders can benefit from greater flexibility, since they can adapt their remuneration to their preferences and personal circumstances.
| 14 | Group information |
Table of Contents
The highlight of thefirst quarter of 2015 in terms of responsible banking has been BBVA’s joining of CSR Europe (The European Business Network for Corporate Social Responsibility) and the launch of ‘Camino al éxito’ (Path to Success).
Founded to promote companies’ contributions to social development at both the local and European levels,CSR Europe has the participation of 70 large international companies, and BBVA is the first Spanish financial entity to join. Through active collaboration, the members of CSR Europe have been able to influence European policies on employment, education and the environment, as well as to promote inclusive and sustainable growth.
‘Camino al éxito’ is a comprehensive program for SMEs in South America whose aim is to contribute to their growth and, therefore, to the development of Latin American societies. The program has been launched in seven countries in which BBVA is present (Argentina, Chile, Colombia, Paraguay, Peru, Uruguay and Venezuela) and addresses three areas: 1) training, 2) financing and value offer and 3) recognition and visibility.
Investment in social programs
In March 2015, the2014 Responsible Banking Report was published. According to the Report, the Group allocated €107.15m to social programs, representing 4.1% of the net attributable profit and an increase of 10% on 2013. BBVA allocated 16% of said investment to financial literacy and 17% to high social impact products, 25% to educational programs for society and 41% to other strategic projects. By geographical area, 37% is allocated to Spain, 22% to Mexico, 11% to South America, 5% to the United States, 21% to the BBVA Foundation and 5% to the Microfinance Foundation.
TCR Communication
BBVA continues to make progress on closer and simpler communication with its customers. In 2015, the aim is to be perceived as one of the top two banks for the clearest and most transparent communication in the eight main geographical areas where we operate. On January 1, 2015, theTCR Commercial Communication Code was implemented. This document contains the principles to be followed in commercial communication and advertising in the Group to guarantee they are transparent, clear and responsible.
Financial literacy
In the first quarter of 2015, BBVA joined the program‘Tus Finanzas, Tu Futuro’ (Your Finances, Your Future), the joint initiative of 16 Spanish banks promoted by the Spanish Banking Association (AEB), whose purpose is to foster financial literacy among Spanish youth. The aim is to enroll 6,500 students and more than 100 schools around Spain in the course, which will be taught by 400 volunteers. All volunteers will be employees from participating banks.
Products with a high social impact
The use of new digitalchannels and products bolsters a form of banking that is in touch with the needs of every customer. They also make it possible to unveil new opportunities for banking penetration for a segment of the population that is also in need of a savings strategy to help make financial projects a reality. BBVA Bancomer continues to lead in the creation of financial products and services for lower income customers, who benefit from access to the bank through various channels. This, in turn, strengthens financial inclusion, as seen in the 40% share achieved in this segment. Moreover, the entity in Mexico maintains its banking correspondent network with 24,500 member retailers. Through them, more than 45 million transactions are completed every year.
The BBVA Microfinance Foundation serves almost 1.6 million customers, to whom €983m in microloans have been granted. A total of 96% of these customers are considered successful in the business they have set up to rise out of poverty. The BBVA Microfinance Foundation has signed an alliance withUN WOMENto promote the development and inclusion of low-income female entrepreneurs in Latin America and the Caribbean.
TheMomentum Social Investment committee has selected the five 2014 Momentum Project ventures and another two from past editions. The recipients will receive more than €900,000 to grow their business. With this funding, Momentum Project wants to lead and promote social investment in Spain, to which it has allocated more than €8m since its launch in 2011.
Society
Innovation and knowledge
The BBVA FoundationAyudas a Proyectos de Investigación (Research Project Grants) program has received more than 1,000 project applications from a total of 7,607 researchers in hopes of accessing one of the 21 BBVA Foundation Research Project Grants in the areas of Biomedicine, Ecology and Conservation Biology, Socioeconomics and Digital Humanities, in this first edition of the call for proposals. This program has €2.2m in funds available per year.
Environment
BBVA has significantly boosted itsGlobal Eco-efficiency Plan with the signing of an agreement with Iberdrola for the electric power supplied to the 3,091-branch offices network and 71-buildings in Spain to be entirely renewable as of 2015. This measure will prevent the emission of 180,000 tons of CO2 per year, the equivalent of the annual emissions of 75,000 vehicles, a city with 50,000 inhabitants or the planting of 4.5 million trees.
On March 28, 2015, the BBVA Group again took part in the globalEarth Hour campaign, switching off the lights of 523 buildings (133 corporate buildings and 390 branch offices) in 158 cities in 10 countries in the Americas and Europe. This project, which is now in its seventh edition, has become the main world event for environmental protection.
| Responsible Banking | 15 |
Table of Contents
This section presents and analyzes the most relevant aspects of the Group’s different areas. Specifically, it shows the income statement, the balance sheet, the business activity and the most significant ratios in each of them.
In 2015 changes have been made to thereporting structure of BBVA Group’s business areas with respect to that in place during 2014. Due to the increase of the stake in the Turkish bank Garanti to 39.9%, expected to take effect in the coming months, its balance sheet and earnings are presented separately from the rest of Eurasia. Thus, the business areas are:
| • | Banking activity in Spain includes, as in previous years, the Retail Network, Corporate and Business Banking (CBB), Corporate & Investment Banking (CIB), BBVA Seguros and Asset Management. It also includes the portfolios, funding and structural interest-rate positions of the euro balance sheet. |
| • | Real-estate activity in Spain basically covers lending to rea l-estate developers and foreclosed real-estate assets in the country. |
| • | TheUnited States encompasses the business conducted by the Bank in that country through BBVA Compass, the office in New York and Simple. |
| • | Turkey includes BBVA’s stake in the Turkish bank Garanti (currently 25.01%, as the additional 14.89% is still pending the relevant authorizations). |
| • | Mexico includes the banking and insurance businesses in the country. |
| • | South America includes the banking and insurance businesses that BBVA carries out in the region. |
| • | The rest of Eurasia includes the business carried out in the rest of Europe and Asia, i.e. the Group’s retail and wholesale businesses in the area. |
In addition to the above, all the areas include a remainder made up of other businesses and a supplement that includes deletions and allocations not assigned to the units making up the above areas.
Lastly, theCorporate Center is an aggregate that contains the rest of the items that have not been allocated to the business areas, as it basically corresponds to the Group’s holding function. It includes: the costs of the head offices that have a corporate function; management of structural exchange-rate positions; specific issues of capital instruments to ensure adequate management of the Group’s global solvency; portfolios and their corresponding results, whose management is not linked to customer relations, such as industrial holdings; certain tax assets and liabilities; funds due to commitments with pensioners; goodwill and other intangibles. It also comprises the result from certain corporate operations carried out by the Group that are commented at various points in this report.
In addition to this geographical breakdown,supplementaryinformation is provided for all the wholesale businesses carried out by BBVA, i.e. Corporate & Investment Banking (CIB). This aggregate business is considered relevant to better understand the Group because of the characteristics of the customers served, the type of products offered and the risks assumed.
Lastly, as usual, in the case of the Americas and Turkey the results of applying constantexchange rates are given in addition to the year-on-year variations at current exchange rates.
The Group compilesinformation by areas based on units at the lowest level, and all the accounting data related to the business they manage is recorded in full. These basic units are then aggregated in accordance with the organizational structure established by the Group for higher-level units and, finally, the business areas themselves. Similarly, all the companies making up the Group are also assigned to the different units according to the geographical area in which they carry out their activity.
Once the composition of each business area has been defined, certainmanagement criteria are applied, of which the following are particularly important:
| • | Capital. Capital is allocated to each business according to ERC criteria. This is based on the concept of unexpected loss at a specific confidence level, depending on the Group’s capital adequacy targets. The calculation of the ERC combines credit risk, market risk, structural balance-sheet risk, equity positions, operational risk, fixed-asset risk and technical risks in the case of insurance companies. These calculations are carried out using internal models that have been defined following the guidelines and requirements established under the Basel III capital accord, with economic criteria taking precedence over regulatory ones. |
ERC is risk-sensitive and thus linked to the management policies of the businesses themselves. It standardizes capital allocation among them in accordance with the risks incurred. In other words, it is calculated in a way that is standard and integrated for all kinds of risks and for each operation, balance or risk position, allowing its risk-adjusted return to be assessed and an aggregate to be calculated for profitability by client, product, segment, unit or business area.
| 16 | Business areas |
Table of Contents
| • | Internal transfer prices. BBVA Group has a transfer prices system whose general principles apply in the Bank’s different entities, business areas and units. Within each geographical area, internal transfer rates are established to calculate the net interest income of its businesses, under both the asset and liability headings. These rates consist of a reference rate (an index whose use is generally accepted on the market) that is applied based on the transaction’s revision period or maturity, and a liquidity premium, i.e. a spread, that is established based on the conditions and outlook of the financial markets in this respect. There are also agreements for the allocation of earnings between the product-generating units and the distribution units. |
| • | Allocation of operating expenses. Both direct and indirect costs are allocated to the business areas, except where there is no clearly defined relationship with the businesses, i.e. when they are of a clearly corporate or institutional nature for the Group as a whole. |
| • | Cross-selling.In some cases, consolidation adjustments are made to eliminate double accounting entries in the results of two or more units as a result of cross-selling incentives between businesses. |
Mayor income statement items by business area
(Million euros)
| Business areas | ||||||||||||||||||||||||||||||||||||||||
| BBVA Group (1) | Banking activity in Spain | Real-estate activity in Spain | The United States | Turkey (1) | Mexico | South America | Rest of Eurasia | S Business areas | Corporate Center | |||||||||||||||||||||||||||||||
1Q15 | ||||||||||||||||||||||||||||||||||||||||
Net interest income | 3,663 | 968 | (9 | ) | 435 | 210 | 1,340 | 802 | 46 | 3,792 | (129 | ) | ||||||||||||||||||||||||||||
Gross income | 5,632 | 1,786 | (46 | ) | 654 | 250 | 1,752 | 1,159 | 164 | 5,718 | (86 | ) | ||||||||||||||||||||||||||||
Operating income | 2,857 | 1,081 | (79 | ) | 223 | 140 | 1,105 | 655 | 74 | 3,200 | (343 | ) | ||||||||||||||||||||||||||||
Income before tax | 1,442 | 496 | (221 | ) | 191 | 107 | 693 | 468 | 56 | 1,791 | (349 | ) | ||||||||||||||||||||||||||||
Net attributable profit | 1,536 | 347 | (154 | ) | 136 | 86 | 524 | 227 | 36 | 1,203 | 333 | |||||||||||||||||||||||||||||
1Q14 | ||||||||||||||||||||||||||||||||||||||||
Net interest income | 3,391 | 931 | (7 | ) | 345 | 146 | 1,173 | 934 | 47 | 3,569 | (179 | ) | ||||||||||||||||||||||||||||
Gross income | 5,051 | 1,753 | (58 | ) | 517 | 210 | 1,537 | 1,160 | 156 | 5,275 | (225 | ) | ||||||||||||||||||||||||||||
Operating income | 2,438 | 1,048 | (94 | ) | 166 | 118 | 969 | 665 | 70 | 2,941 | (504 | ) | ||||||||||||||||||||||||||||
Income before tax | 1,017 | 550 | (353 | ) | 143 | 88 | 598 | 501 | 48 | 1,576 | (559 | ) | ||||||||||||||||||||||||||||
Net attributable profit | 624 | 384 | (245 | ) | 106 | 70 | 454 | 243 | 37 | 1,049 | (425 | ) | ||||||||||||||||||||||||||||
| (1) | Financial statements with the revenues and expenses of the Garanti Group consolidated in proportion to the percentage of the Group’s stake. |
Breakdown of gross income, operating income and net attributable profit by geography (1)
(1Q15)
| Banking activity | The United | South | Rest | |||||||||||||||||||||||||
| in Spain | Spain (2) | States | Turkey | Mexico | America | of Eurasia | ||||||||||||||||||||||
Gross income | 31.2 | 30.4 | 11.4 | 4.4 | 30.6 | 20.3 | 2.9 | |||||||||||||||||||||
Operating income | 33.8 | 31.3 | 7.0 | 4.4 | 34.5 | 20.5 | 2.3 | |||||||||||||||||||||
Net attributable profit | 28.9 | 16.1 | 11.3 | 7.1 | 43.5 | 18.9 | 3.0 | |||||||||||||||||||||
| (1) | Excludes the Corporate Center. |
| (2) | Including real-estate activity in Spain. |
| Business areas | 17 |
Table of Contents
| 18 | Business areas |
Table of Contents
Macro and industry trends
GDP growth in Spain is expected to pick up in the quarter, thanks to an improvement in household and business confidence, the sustained recovery of employment, reduced financial tension, a less restrictive fiscal policy and the positive effect of the euro’s depreciation on exports.
In thebanking system, the decline in the volume of loans continues to moderate (down 6% year-on-year according to the information available as of February 2015), thanks to the fact that the flow of new loans to the retail segment continues to improve (up 10.3% year-on-year also as of February 2015). A reduction in the financing costs of households and businesses has also been observed in recent months.
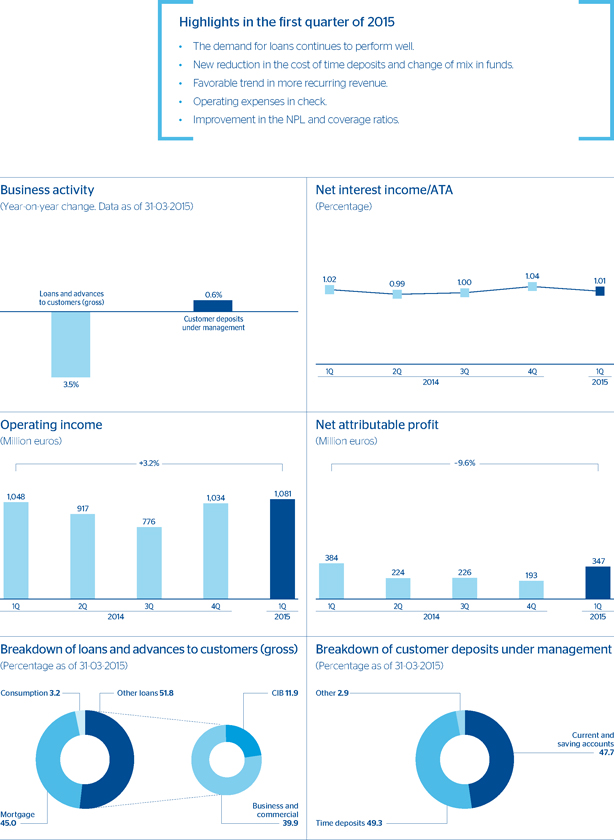
Activity
The recovery ofcredit is underway, with good performance in the production of new loans, although growth is not yet perceived in the stock. By portfolio, the demand for mortgage, consumer, SME and business loans shows positive year-on-year growth supported by stronger economic activity in the country. As a result, the percentage change of gross lending to customers in the quarter is –0.6%, a lower decline to that reported in the immediate previous periods.
Improvement in theNPL and coverage ratios over the quarter.
Year-on-year growth in customerdeposits under management, but with a change in the mix, as seen in recent quarters. The significant reduction in the remuneration paid for time deposits has led to funds being shifted toward demand deposits and mutual funds.
Earnings
Favorable trend inmore recurring revenue in the first quarter of 2015:
| • | Year-on-year growth in net interest income (up 3.9%), basically due to the reduced cost of both retail (reduction in the cost of deposits) and wholesale funding. The customer spread remains flat in the quarter, as the lower cost of deposits has been offset by the reduction of the average yield on assets, significantly affected by all-time low interest rates. |
Financial statements and relevant business indicators
(Million euros and percentage)
Income statement | 1Q15 | D% | 1Q14 | |||||||||
Net interest income | 968 | 3.9 | 931 | |||||||||
Net fees and commissions | 378 | 8.9 | 347 | |||||||||
Net trading income | 337 | (22.9 | ) | 437 | ||||||||
Other income/expenses | 104 | 166.3 | 39 | |||||||||
Gross income | 1,786 | 1.9 | 1,753 | |||||||||
Operating expenses | (705 | ) | (0.1 | ) | (706 | ) | ||||||
Personnel expenses | (411 | ) | (6.2 | ) | (438 | ) | ||||||
General and administrative expenses | (269 | ) | 11.2 | (242 | ) | |||||||
Depreciation and amortization | (25 | ) | (3.4 | ) | (26 | ) | ||||||
Operating income | 1,081 | 3.2 | 1,048 | |||||||||
Impairment on financial assets (net) | (421 | ) | (9.1 | ) | (463 | ) | ||||||
Provisions (net) and other gains (losses) | (164 | ) | n.m. | (35 | ) | |||||||
Income before tax | 496 | (9.8 | ) | 550 | ||||||||
Income tax | (148 | ) | (10.1 | ) | (165 | ) | ||||||
Net income | 348 | (9.6 | ) | 385 | ||||||||
Non-controlling interests | (1 | ) | (3.9 | ) | (1 | ) | ||||||
Net attributable profit | 347 | (9.6 | ) | 384 | ||||||||
Balance sheet | 31-03-15 | D% | 31-03-14 | |||||||||
Cash and balances with central banks | 3,902 | (12.7 | ) | 4,468 | ||||||||
Financial assets | 125,945 | 16.2 | 108,377 | |||||||||
Loans and receivables | 195,472 | 3.0 | 189,842 | |||||||||
Loans and advances to customers | 168,212 | (3.6 | ) | 174,566 | ||||||||
Loans and advances to credit institutions and other | 27,260 | 78.4 | 15,276 | |||||||||
Inter-area positions | — | — | 8,515 | |||||||||
Tangible assets | 706 | (5.4 | ) | 746 | ||||||||
Other assets | 3,501 | 95.1 | 1,794 | |||||||||
Total assets/liabilities and equity | 329,526 | 5.0 | 313,743 | |||||||||
Deposits from central banks and credit institutions | 58,264 | 1.7 | 57,306 | |||||||||
Deposits from customers | 159,816 | 2.4 | 156,123 | |||||||||
Debt certificates | 39,184 | (18.8 | ) | 48,236 | ||||||||
Subordinated liabilities | 2,052 | (5.6 | ) | 2,173 | ||||||||
Inter-area positions | 5,769 | — | — | |||||||||
Financial liabilities held for trading | 51,938 | 29.2 | 40,193 | |||||||||
Other liabilities | 4,638 | 230.3 | 1,404 | |||||||||
Economic capital allocated | 7,866 | (5.3 | ) | 8,307 | ||||||||
Relevant business indicators | 31-03-15 | 31-12-14 | 31-03-14 | |||||||||
Loans and advances to customers (gross) | 173,234 | 174,201 | 179,563 | |||||||||
Customer deposits under management(1) | 136,250 | 138,140 | 135,416 | |||||||||
Mutual funds | 30,743 | 28,695 | 23,783 | |||||||||
Pension funds | 22,595 | 21,880 | 20,994 | |||||||||
Efficiency ratio (%) | 39.5 | 43.0 | 40.3 | |||||||||
NPL ratio (%) | 5.9 | 6.0 | 6.4 | |||||||||
NPL coverage ratio (%) | 46 | 45 | 41 | |||||||||
Cost of risk (%) | 0.99 | 0.95 | 1.04 | |||||||||
| (1) | Excluding repos. |
| Banking activity in Spain | 19 |
Table of Contents
| • | There has also been good performance in income from fees and commissions (up 8.9%) thanks to those from fund management and securities. All this against a backdrop of regulatory restrictions in credit-card and pension fund fees and commissions. |
Lower contribution fromNTI compared with the first quarter of 2014 due to lower capital gains from sales of ALCO portfolios.
The Group’s transformation and digitization process in Spain is having a clear positive effect onoperating expenses, which are down slightly (0.1%) in year-on-year terms.
Impairment losses on financial assets have continued to decline as in previous quarters: they are down 9.1% in year-on-year terms and 5.5% in the quarter. The cost of risk stands below 1%.
The costs resulting from the aforementioned transformation and digitization process explain the higher amount allocated toprovisions.
As a result, thenet attributable profit generated by banking activity in Spain in the first quarter of 2015 totaled €347m, which means a decline of 9.6% year-on-year.
| 20 | Business areas |
Table of Contents

Industry trends
According to the latest data from the General Council of Spanish Notaries,home sales picked up in the last months of 2014. This trend is expected to continue in 2015, so the excess housing stock should be reduced gradually, and it will continue to influence the stabilization of prices, whose adjustment could be practically completed.
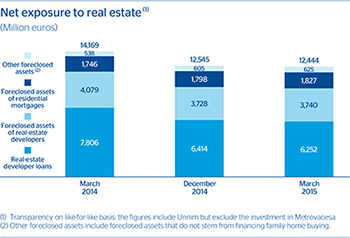
Exposure
BBVA continues with its strategy of reducing its netexposure to the real-estate sector in Spain, both to the developer segment (lending to real-estate developers plus foreclosed assets derived from those loans) and to foreclosed real-estate assets from retail mortgage loans.
Non-performing loans continued to decline over the quarter, with contained additions during the period. The coverage ratio of non-performing and substandard loans in the last three months stood at 54%, and of real-estate exposure as a whole at 48%.
Sales of real-estate assets in the quarter totaled 2,105 units, or 4,094 if third-party and developer sales are added to this figure. In the first quarter of 2015, the average monthly sales in monetary units, is in line with the first three months of 2014. Thus, the change of strategy already seen in 2014 of more selective sales and higher profitability is consolidated.
Coverage of real-estate exposure in Spain
(Million of euros as of 31-03-15)
| Risk amount | Provision | % Coverage over risk | ||||||||||
NPL + Substandard | 8,136 | 4,360 | 54 | |||||||||
NPL | 7,097 | 4,028 | 57 | |||||||||
Substandard | 1,039 | 332 | 32 | |||||||||
Foreclosed real-estate and other assets | 13,092 | 6,900 | 53 | |||||||||
From real-estate developers | 8,580 | 4,840 | 56 | |||||||||
From dwellings | 3,305 | 1,478 | 45 | |||||||||
Other | 1,207 | 582 | 48 | |||||||||
Subtotal | 21,228 | 11,260 | 53 | |||||||||
Performing | 2,476 | — | — | |||||||||
With collateral | 2,280 | |||||||||||
Finished properties | 1,720 | |||||||||||
Construction in progress | 313 | |||||||||||
Land | 247 | |||||||||||
Without collateral and other | 196 | |||||||||||
Real-estate exposure | 23,704 | 11,260 | 48 | |||||||||
Note: Transparency scope according to Bank of Spain Circular 5/2011 dated November 30.
| Real-estate activity in Spain | 21 |
Table of Contents
Earnings
In the first quarter of 2015, BBVA’s real-estate business in Spain registered aloss of €154m,
less than the €245m loss posted in the same period the previous year, due basically to the reduced need for loan-loss and real-estate provisions.
Financial statements
(Million euros)
Income statement | 1Q15 | D % | 1Q14 | |||||||||
Net interest income | (9 | ) | 29.4 | (7 | ) | |||||||
Net fees and commissions | 1 | (14.8 | ) | 1 | ||||||||
Net trading income | 1 | n.m. | 0 | |||||||||
Other income/expenses | (39 | ) | (25.8 | ) | (52 | ) | ||||||
Gross income | (46 | ) | (20.3 | ) | (58 | ) | ||||||
Operating expenses | (33 | ) | (10.0 | ) | (36 | ) | ||||||
Personnel expenses | (18 | ) | (0.3 | ) | (18 | ) | ||||||
General and administrative expenses | (9 | ) | (27.0 | ) | (12 | ) | ||||||
Depreciation and amortization | (5 | ) | (4.2 | ) | (5 | ) | ||||||
Operating income | (79 | ) | (16.3 | ) | (94 | ) | ||||||
Impairment on financial assets (net) | (57 | ) | (24.4 | ) | (76 | ) | ||||||
Provisions (net) and other gains (losses) | (85 | ) | (53.8 | ) | (183 | ) | ||||||
Income before tax | (221 | ) | (37.5 | ) | (353 | ) | ||||||
Income tax | 67 | (36.7 | ) | 107 | ||||||||
Net income | (153 | ) | (37.8 | ) | (246 | ) | ||||||
Non-controlling interests | (1 | ) | n.m. | 1 | ||||||||
Net attributable profit | (154 | ) | (37.2 | ) | (245 | ) | ||||||
Balance sheet | 31-03-15 | D% | 31-03-14 | |||||||||
Cash and balances with central banks | 6 | 19.4 | 5 | |||||||||
Financial assets | 346 | (42.6 | ) | 603 | ||||||||
Loans and receivables | 8,777 | (12.8 | ) | 10,067 | ||||||||
Loans and advances to customers | 8,777 | (12.8 | ) | 10,067 | ||||||||
Loans and advances to credit institutions and other | — | — | — | |||||||||
Inter-area positions | — | — | — | |||||||||
Tangible assets | 1,279 | (20.0 | ) | 1,600 | ||||||||
Other assets | 6,762 | (4.5 | ) | 7,080 | ||||||||
Total assets/liabilities and equity | 17,170 | (11.3 | ) | 19,355 | ||||||||
Deposits from central banks and credit institutions | — | — | — | |||||||||
Deposits from customers | 28 | (72.4 | ) | 100 | ||||||||
Debt certificates | — | — | — | |||||||||
Subordinated liabilities | 776 | (14.9 | ) | 912 | ||||||||
Inter-area positions | 13,264 | (9.7 | ) | 14,695 | ||||||||
Financial liabilities held for trading | — | — | — | |||||||||
Other liabilities | — | — | — | |||||||||
Economic capital allocated | 3,103 | (14.9 | ) | 3,648 | ||||||||
| 22 | Business areas |
Table of Contents
| The United States | 23 |
Table of Contents
Financial statements and relevant business indicators
(Million euros and percentage)
Income statement | 1Q15 | D% | D%(1) | 1Q15 | ||||||||||||
Net interest income | 435 | 25.9 | 3.5 | 345 | ||||||||||||
Net fees and commissions | 156 | 17.2 | (3.8 | ) | 133 | |||||||||||
Net trading income | 56 | 51.4 | 23.1 | 37 | ||||||||||||
Other income/expenses | 7 | 231.3 | 175.5 | 2 | ||||||||||||
Gross income | 654 | 26.4 | 3.7 | 517 | ||||||||||||
Operating expenses | (431 | ) | 22.6 | 0.7 | (351 | ) | ||||||||||
Personnel expenses | (246 | ) | 19.5 | (1.9 | ) | (206 | ) | |||||||||
General and administrative expenses | (132 | ) | 30.3 | 7.1 | (102 | ) | ||||||||||
Depreciation and amortization | (52 | ) | 19.5 | (1.8 | ) | (43 | ) | |||||||||
Operating income | 223 | 34.3 | 10.1 | 166 | ||||||||||||
Impairment on financial assets (net) | (30 | ) | 53.4 | 27.6 | (19 | ) | ||||||||||
Provisions (net) and other gains (losses) | (2 | ) | (34.9 | ) | (46.5 | ) | (3 | ) | ||||||||
Income before tax | 191 | 33.3 | 9.1 | 143 | ||||||||||||
Income tax | (55 | ) | 45.0 | 19.1 | (38 | ) | ||||||||||
Net incomes | 136 | 29.2 | 5.6 | 106 | ||||||||||||
Non-controlling interests | — | — | — | — | ||||||||||||
Net attributable profit | 136 | 29.2 | 5.6 | 106 | ||||||||||||
Balance sheet | 31-03-15 | D % | D %(1) | 31-03-14 | ||||||||||||
Cash and balances with central banks | 4,839 | 8.0 | (15.7 | ) | 4,479 | |||||||||||
Financial assets | 14,179 | 92.7 | 50.4 | 7,358 | ||||||||||||
Loans and receivables | 59,243 | 44.2 | 12.5 | 41,080 | ||||||||||||
Loans and advances to customers | 57,096 | 44.1 | 12.5 | 39,619 | ||||||||||||
Loans and advances to credit institutions and other | 2,146 | 46.9 | 14.6 | 1,461 | ||||||||||||
Inter-area positions | — | — | — | — | ||||||||||||
Tangible assets | 811 | 23.3 | (3.8 | ) | 658 | |||||||||||
Other assets | 1,858 | (14.7 | ) | (33.5 | ) | 2,180 | ||||||||||
Total assets/liabilities and equity | 80,930 | 45.2 | 13.3 | 55,754 | ||||||||||||
Deposits from central banks and credit institutions | 7,548 | 105.0 | 59.9 | 3,683 | ||||||||||||
Deposits from customers | 59,337 | 39.5 | 8.9 | 42,536 | ||||||||||||
Debt certificates | 926 | — | — | — | ||||||||||||
Subordinated liabilities | 846 | 29.9 | 1.4 | 651 | ||||||||||||
Inter-area positions | 223 | (86.6 | ) | (89.6 | ) | 1,669 | ||||||||||
Financial liabilities held for trading | 3,492 | n.m. | n.m. | 178 | ||||||||||||
Other liabilities | 5,635 | 18.6 | (7.4 | ) | 4,751 | |||||||||||
Economic capital allocated | 2,922 | 27.8 | (0.3 | ) | 2,286 | |||||||||||
Relevant business indicators | 31-03-15 | 31-12-14 | 31-03-14 | |||||||||
Loans and advances to customers (gross)(1) | 57,878 | 56,047 | 51,588 | |||||||||
Customer deposits under management(1-2) | 58,424 | 56,528 | 50,673 | |||||||||
Mutual funds | — | — | — | |||||||||
Pension funds | — | — | — | |||||||||
Efficiency ratio (%) | 65.9 | 70.1 | 67.9 | |||||||||
NPL ratio (%) | 0.9 | 0.9 | 1.0 | |||||||||
NPL coverage ratio (%) | 164 | 167 | 160 | |||||||||
Cost of risk (%) | 0.23 | 0.16 | 0.19 | |||||||||
(1) Figures at constant exchange rate.
(2) Excludes repos.
Macro and industry trends
The macroeconomic outlook for 2015 in theUnited States is clearly positive, particularly in terms of improved employment and private disposable income, two determining factors in the recovery of domestic spending. This excellent backdrop is consistent with a scenario in which the Federal Reserve (Fed) launches the normalization process for the monetary policy.
With respect to theexchange rate, the U.S. dollar has strengthened its appreciation against the euro, due to the change in the course of the monetary policies of the ECB (towards the expansion of its balance sheet) and of the Fed (towards an increase in rates) and the increased spread between the United States and the euro area, in favor of the United States. All the comments below referring to rates of change are expressed at a constant exchange rate, unless expressly stated otherwise.
The most notable event with respect to thefinancial system was the publication in March of the results of the Fed’s stress test carried out on the leading banks in the country. In it, all banks exceeded the minimum CET1 capital adequacy ratio threshold of 4.5% (Basel III) permitted in the severely adverse scenario.
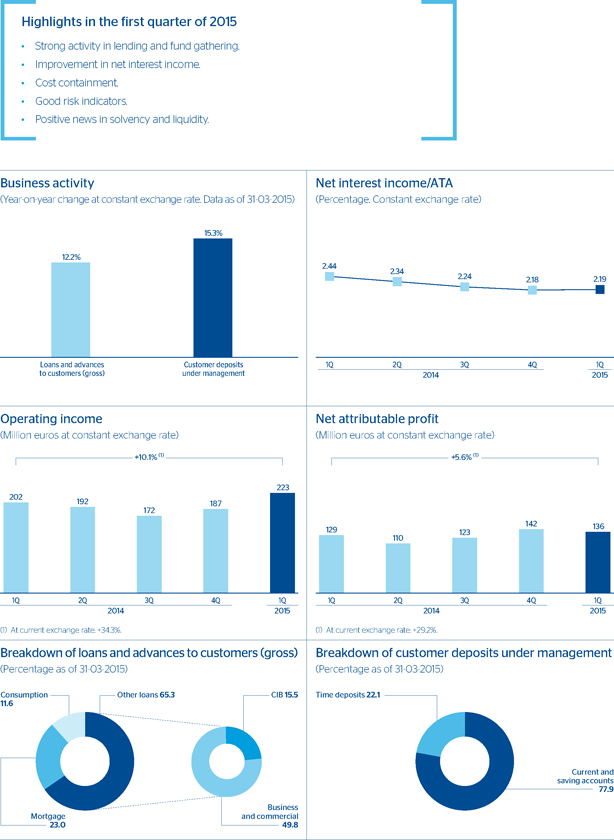
Activity
Lending maintains its upward trend of previous periods (up 12.2% year-on-year and up 3.3% in the quarter), though with a slight moderation in growth rates. By portfolio, of note is that of companies (commercial lending), which represents 46% of the gross lending in the area and is growing at year-on-year rates of 14.0% (up 5.1% in the quarter). Also worth highlighting is consumer finance, accounting for 12% and presenting growth of 18.2% and 4.0%, respectively, in the last 12 and three month periods.
Asset quality indicators remain at historically low levels, with the NPL (0.9%) maintaining levels from the end of 2014 while the coverage ratio increases to 164%. Progressive normalization of the cost of risk continued and remains very low (0.23%).
Customer deposits under management also performed well, with a year-on-year rise of 15.3% (up 3.4% in the quarter) supported by the favorable performance of both time deposits (up 23.5% in the last 12 months and up 1.9% since the end of December) and the current and savings accounts (up 13.2% in the year and up 3.8% in the quarter).
| 24 | Business areas |
Table of Contents
Earnings
The area generated anet attributable profitin the quarter of €136m, 5.6% more than in the same period in 2014.
Gross income progressed favorably, up 3.7% in the year and 0.5% in the quarter. This good performance is supported by net interest income, positively impacted by increased activity in the context of unfavorable rates and by the NTI, due to the capital gains from the sale of ALCO portfolios and the positive performance of the Global Markets unit in the quarter. The above were able to offset the reported decrease in fees and commissions, due in part to revenues from one-off wholesale operations in the first quarter of 2014.
Operating expenses have been contained due to the structural adjustments made in previous periods, particularly in personnel costs.
As a result,operating incomeexperienced double-digit year-on-year growth, up 10.1%, and theefficiency ratio improved significantly, from 70.1% in December 2014 to 65.9% in March 2015.
Lastly, impairment losses on financial assets increased year-on-year by 27.6%, but at highly contained levels. This was affected by the growth of activity and the aforementioned progressive normalization of the cost of risk.
| The United States | 25 |
Table of Contents
| 26 | Business areas |
Table of Contents
Macro and industry trends
Economic growth picked up in the last quarter of 2014 due to the recovery of private consumption. The outlook for 2015 is favorable, positively influenced by the fall in oil prices and sound foreign demand. Moderation in inflation and in the current account deficit is giving the Central Bank more room for maneuver, enabling it to maintain in the first quarter of 2015 the gradual cuts to interest rates, a process it started in the second half of 2014.
Lending to the private sector maintains relatively high rates of growth, supported above all by the increase in the commercial segment, while the system’sNPL ratio remains stable.Gathering of funds in the private sector is also in line with the figures registered in 2014. The Turkish banking system continues to enjoy high levels of capitalization and sound profitability.
All the comments below on rates of change will be expressed at a constant exchange rate, unless expressly stated otherwise.
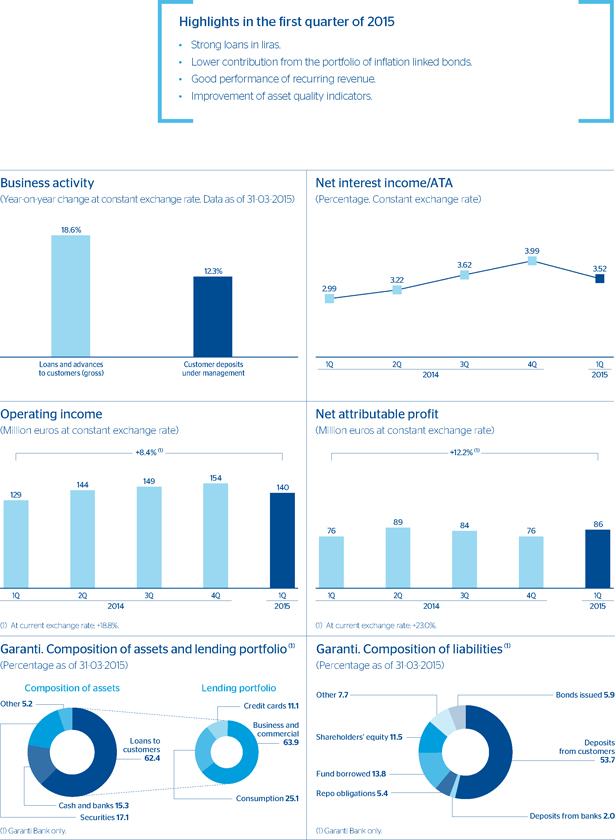
Activity
Gross lending to customers closed the quarter with year-on-year growth above 18%, driven by strong consumer finance, mortgage loans and commercial lending in Turkish liras, which offsets the lower demand for loans in foreign currency, held back by exchange rate volatility.
Asset quality indicators improved in the quarter, with the NPL ratio down 15 basis points and the coverage ratio improving by 2.7% compared with the figure at the end of 2014. Significant improvement also in the cost of risk, which is below 1% in the quarter as a whole.
Customerdeposits under management in the area registered a significant increase over the last twelve months, which affected most products, although the increase in time deposits in foreign currency (of lower cost than those in local currency) is worth mentioning.
Financial statements and relevant business indicators
(Million euros and percentage)
Income statement(1) | 1Q15 | D% | D% (2) | 1Q14 | ||||||||||||
Net interest income | 210 | 43.8 | 31.3 | 146 | ||||||||||||
Net fees and commissions | 50 | 18.9 | 8.6 | 42 | ||||||||||||
Net trading income | (15 | ) | n.m. | n.m. | 18 | |||||||||||
Other income/expenses | 5 | 25.2 | 14.3 | 4 | ||||||||||||
Gross income | 250 | 19.2 | 8.9 | 210 | ||||||||||||
Operating expenses | (110 | ) | 19.7 | 9.5 | (92 | ) | ||||||||||
Personnel expenses | (56 | ) | 19.9 | 9.6 | (47 | ) | ||||||||||
General and administrative expenses | (44 | ) | 20.5 | 10.0 | (37 | ) | ||||||||||
Depreciation and amortization | (10 | ) | 15.8 | 5.7 | (8 | ) | ||||||||||
Operating income | 140 | 18.8 | 8.4 | 118 | ||||||||||||
Impairment on financial assets (net) | (33 | ) | 31.4 | 20.0 | (25 | ) | ||||||||||
Provisions (net) and other gains (losses) | (0 | ) | (89.5 | ) | (90.4 | ) | (5 | ) | ||||||||
Income before tax | 107 | 20.9 | 10.2 | 88 | ||||||||||||
Income tax | (21 | ) | 12.7 | 2.7 | (19 | ) | ||||||||||
Net income | 86 | 23.0 | 12.2 | 70 | ||||||||||||
Non-controlling interests | — | — | — | — | ||||||||||||
Net attributable profit | 86 | 23.0 | 12.2 | 70 | ||||||||||||
Balance sheet(1) | 31-03-15 | D% | D%(2) | 31-03-14 | ||||||||||||
Cash and balances with central banks | 2,430 | 20.1 | 13.8 | 2,024 | ||||||||||||
Financial assets | 4,469 | 16.2 | 10.0 | 3,848 | ||||||||||||
Loans and receivables | 15,749 | 23.5 | 17.0 | 12,748 | ||||||||||||
Loans and advances to customers | 14,177 | 25.1 | 18.5 | 11,335 | ||||||||||||
Loans and advances to credit institutions and other | 1,572 | 11.3 | 5.4 | 1,413 | ||||||||||||
Tangible assets | 193 | 10.0 | 4.2 | 175 | ||||||||||||
Other assets | 779 | 22.6 | 16.2 | 636 | ||||||||||||
Total assets/liabilities and equity | 23,620 | 21.6 | 15.2 | 19,430 | ||||||||||||
Deposits from central banks and credit institutions | 4,349 | (1.3 | ) | (6.5 | ) | 4,407 | ||||||||||
Deposits from customers | 12,507 | 23.4 | 16.9 | 10,133 | ||||||||||||
Debt certificates | 1,306 | 38.9 | 31.6 | 940 | ||||||||||||
Subordinated liabilities | 23 | (1.6 | ) | (6.7 | ) | 23 | ||||||||||
Financial liabilities held for trading | 373 | 125.3 | 113.4 | 166 | ||||||||||||
Other liabilities | 4,120 | 38.6 | 31.3 | 2,973 | ||||||||||||
Economic capital allocated | 943 | 19.5 | 13.3 | 789 | ||||||||||||
Relevant business indicators | 31-03-15 | 31-12-14 | 31-03-14 | |||||||||
Loans and advances to customers (gross)(2) | 14,741 | 13,726 | 12,429 | |||||||||
Customer deposits under management(2-3) | 12,057 | 11,054 | 10,733 | |||||||||
Mutual funds | 365 | 344 | 350 | |||||||||
Pension funds | 572 | 538 | 385 | |||||||||
Efficiency ratio (%) | 44.0 | 41.8 | 43.8 | |||||||||
NPL ratio (%) | 2.6 | 2.8 | 2.7 | |||||||||
NPL coverage ratio (%) | 118 | 115 | 112 | |||||||||
Cost of risk (%) | 0.94 | 1.16 | 0.88 | |||||||||
| (1) | Financial statements with the revenues and expenses of the Garanti Group consolidated in proportion to the percentage of the Group’s stake. |
| (2) | Figures at constant exchange rate. |
| (3) | Excluding repos. |
| Turkey | 27 |
Table of Contents
Earnings
There has been a positive trend inmore recurring revenue, due to:
| • | Stable customer spreads. This, however, has been reversed by the lower contribution from inflation-linked bonds in the quarter, due to the moderation in the consumer price index. This explains the decline in net interest income in the quarter, although in year-on-year terms it has grown 31.3%. |
| • | Good performance of income from fees and commissions, which continues to grow thanks to a diversified revenue base that mitigates the impact of the regulations, approved in October 2014, that limit fees and commissions on consumer loans and credit cards. In addition, the quarter includes one-off fees and commissions from the closing of several project finance deals. |
Operating expenses closed in line with those for the previous quarter, despite the negative effect that the Turkish lira’s depreciation against the U.S. dollar has on expense items that are paid in dollars.
Increase inimpairment losses on financial assets due to a provision for loans in foreign currency, also influenced by the aforementioned deterioration of the Turkish lira since the beginning of the year.
As a result of the above, thenet attributable profit generated by the inclusion in BBVA Group’s earnings of the 25.01% stake in Garanti amounts to €86m, 12.2% more than in the same quarter of the previous year.
| 28 | Business areas |
Table of Contents
| Mexico | 29 |
Table of Contents
Financial statements and relevant business indicators
(Million euros and percentage)
Income statement | 1Q15 | D% | D%(2) | 1Q14 | ||||||||||||
Net interest income | 1,340 | 14.3 | 6.1 | 1,173 | ||||||||||||
Net fees and commissions | 295 | 12.6 | 4.5 | 262 | ||||||||||||
Net trading income | 52 | 7.2 | (0.5 | ) | 48 | |||||||||||
Other income/expenses | 64 | 20.0 | 11.3 | 54 | ||||||||||||
Gross income | 1,752 | 14.0 | 5.8 | 1,537 | ||||||||||||
Operating expenses | (647 | ) | 13.9 | 5.8 | (568 | ) | ||||||||||
Personnel expenses | (288 | ) | 17.8 | 9.4 | (244 | ) | ||||||||||
General and administrative expenses | (305 | ) | 8.9 | 1.1 | (280 | ) | ||||||||||
Depreciation and amortization | (54 | ) | 24.6 | 15.7 | (44 | ) | ||||||||||
Operating income | 1,105 | 14.0 | 5.8 | 969 | ||||||||||||
Impairment on financial assets (net) | (422 | ) | 18.7 | 10.2 | (355 | ) | ||||||||||
Provisions (net) and other gains (losses) | 10 | n.m. | n.m. | (16 | ) | |||||||||||
Income before tax | 693 | 16.0 | 7.7 | 598 | ||||||||||||
Income tax | (170 | ) | 18.0 | 9.5 | (144 | ) | ||||||||||
Net income | 524 | 15.4 | 7.1 | 454 | ||||||||||||
Non-controlling interests | — | — | — | — | ||||||||||||
Net attributable profit | 524 | 15.4 | 7.1 | 454 | ||||||||||||
Balance sheet | 31-03-15 | D% | D%(1) | 31-03-14 | ||||||||||||
Cash and balances with central banks | 6,328 | 19.4 | 9.5 | 5,299 | ||||||||||||
Financial assets | 37,896 | 16.6 | 6.9 | 32,502 | ||||||||||||
Loans and receivables | 51,672 | 21.1 | 11.0 | 42,673 | ||||||||||||
Loans and advances to customers | 49,987 | 23.8 | 13.5 | 40,381 | ||||||||||||
Loans and advances to credit institutions and other | 1,685 | (26.5 | ) | (32.6 | ) | 2,292 | ||||||||||
Tangible assets | 1,898 | 42.4 | 30.5 | 1,333 | ||||||||||||
Other assets | 4,505 | 22.3 | 12.1 | 3,682 | ||||||||||||
Total assets/liabilities and equity | 102,300 | 19.7 | 9.7 | 85,489 | ||||||||||||
Deposits from central banks and credit institutions | 9,241 | (1.3 | ) | (9.6 | ) | 9,366 | ||||||||||
Deposits from customers | 50,963 | 14.9 | 5.3 | 44,342 | ||||||||||||
Debt certificates | 6,189 | 59.4 | 46.1 | 3,883 | ||||||||||||
Subordinated liabilities | 4,683 | 28.7 | 18.0 | 3,638 | ||||||||||||
Financial liabilities held for trading | 7,861 | 14.1 | 4.6 | 6,890 | ||||||||||||
Other liabilities | 18,321 | 43.1 | 31.1 | 12,807 | ||||||||||||
Economic capital allocated | 5,041 | 10.5 | 1.3 | 4,562 | ||||||||||||
Relevant business indicators | 31-03-15 | 31-12-14 | 31-03-14 | |||||||||
Loans and advances to customers | 51,700 | 50,640 | 45,809 | |||||||||
Customer deposits under | 50,251 | 48,086 | 45,070 | |||||||||
Mutual funds | 20,797 | 18,691 | 17,191 | |||||||||
Pension funds | — | — | — | |||||||||
Efficiency ratio (%) | 36.9 | 36.9 | 36.9 | |||||||||
NPL ratio (%) | 2.8 | 2.9 | 3.4 | |||||||||
NPL coverage ratio (%) | 116 | 114 | 114 | |||||||||
Cost of risk (%) | 3.44 | 3.45 | 3.51 | |||||||||
| (1) | Figures at constant exchange rate. |
| (2) | Including all the repos. |
Macro and industry trends
Moderate growth of theMexican economy, which will continue to be driven by foreign demand from the United States. Recently, some factors have surprised on the downside, such as, for example, lower oil production and the cutbacks announced for public spending. In terms of interest rates, the Mexican Central Bank’s announcement points toward a synchronization of its monetary policy with the Fed’s normalization process, but the elevated ease and low inflation suggest that the cycle of upgrades should be slow.
Strengthening of the Mexican peso’sexchange rate against the euro, both over the last twelve months and in the quarter. All the comments below on rates of change will be expressed at a constant exchange rate, unless expressly stated otherwise.
The country’sfinancial system has recorded double-digit growth in business activity (in both loans and customer funds gathering), according to the latest information available, from February 2015, released by the National Banking and Securities Commission (CNBV); it maintains high solvency levels, adequate liquidity, a gradual improvement of the NPL ratio and robust profitability, strongly supported by financial revenue.
Activity
In the first months of 2015, BBVA’s business activity in Mexico performed well, with the loan book growing at a double-digit rate (up 12.9% year-on-year), above the figure registered by the market as a whole (up 11.7% according to February data published by the CNBV).
Boost of thewholesale portfolio, which recorded a balance 24.4% above that of March 2014 (taking into consideration commercial and public sector loans). Lending to large corporations and medium-sized companies maintains its positive trajectory.
Within theretail portfolio, consumer lending sold by the branch network (payroll and personal loans) performed strongly (up 24.9%), boosted by the pre-approved loan campaigns. Also, positive performance of lending to small businesses (up 24.7%), due largely to the recent expansion of the network and the number of specialized executives. The housing portfolio continues to perform well, with a cumulative increase in new production of 18.8% over the first three months of the year. In contrast, weak increase in the balances from credit cards (up 3.5% year-on-year excluding the Finanzia card) in line with the country’s moderate economic growth.
| 30 | Business areas |
Table of Contents
This trend has been accompanied by soundrisk indicators, which compare favorably with those of the competitors. Worth noting is the 8 bp decline in the quarter in the NPL ratio to 2.8% as of 31-Mar-2015, and a new improvement in the coverage ratio, which at the end of March stood at 116%.
Customerfunds (on-balance-sheet deposits, repos, mutual funds and other off-balance-sheet funds) are up 11.2% since the end of the first quarter of 2014, thanks to the favorable trend in all of its headings (up 17.0% in deposits, up 24.7% in time deposits and up 10.9% in mutual funds), maintaining a mix with a greater share of lower-cost deposits.
Earnings
In Mexico, BBVA has registered a sound income statement, despite the country’s moderate economic growth.
Progress in thenet interest income, though with a year-on-year rate of growth lower than in previous quarters. The above is mainly due to the lower growth of credit card volumes, and to the high revenue of the Global Markets in the first quarter of the previous year.
Income from fees and commissions has increased year-on-year by 4.5%, driven by banking fees and fees from advice to corporate and investment banking customers.
NTI stands at levels similar to those posted in the same period the previous year.
Theother income/expenses heading has improved thanks to the more favorable trend in the insurance business in this quarter compared with the same period in 2014.
Operating expenses have increased by 5.8%, while the efficiency ratio remains at the level posted in previous quarters (36.9%), once again positioning BBVA in Mexico as one of the most efficient institutions in the Mexican banking system.
Impairment losses on financial assets are in line with the growth of the loan portfolio, and the cost of risk in the quarter (3.44%) is practically stable (3.45% in 2014 as a whole).
As a result of the above, the area’snet attributable profit stands at €524m, up 7.1% over the last twelve months.
| Mexico | 31 |
Table of Contents
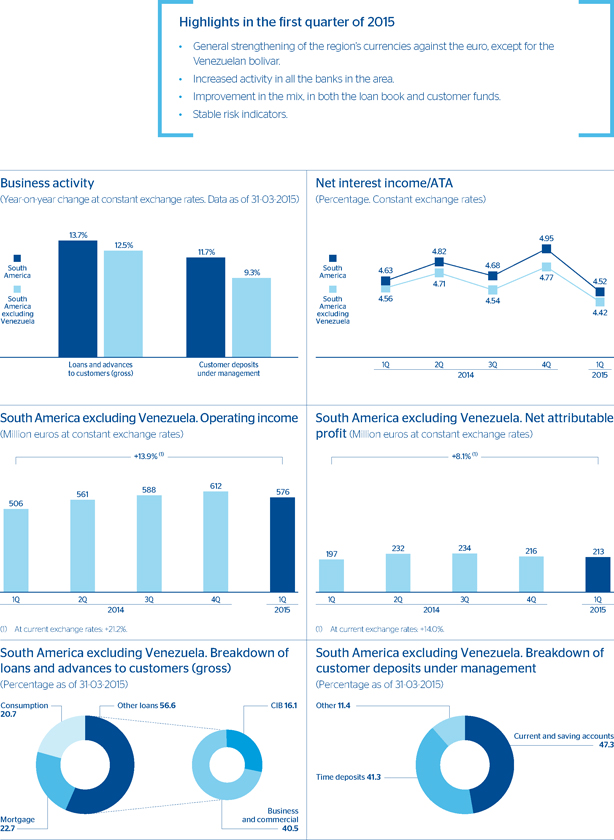
| 32 | Business areas |
Table of Contents
Macro and industry trends
South America faces an unfavorableexternal environment due to the decline in commodity prices, the slowdown of growth in China and less lax financing conditions as a result of the appreciation of the dollar and the moderation in capital flows into the region. Growth is expected to return in 2015, although the recovery will vary widely by country. The central banks in the region have taken advantage of the decline in inflation to support the economic cycle, with laxer monetary policies, and this could lead to additional cuts in interest rates in Peru, Chile and Colombia.
In terms ofexchange rates, there were general appreciations in all the currencies in the region, except for the Venezuelan bolivar, as a result of the new exchange-rate system SIMADI. All the comments below on rates of change are expressed at constant exchange rates and without taking into account earnings and activity in Venezuela, unless stated otherwise.
Thefinancial system remains sound, as was recently acknowledged by the International Monetary Fund in the specific case of Peru and Colombia.
Activity
Gross lending to customers once again grew in year-on-year terms (up 12.5%), driven by all banking businesses and, particularly, by the significant increase in balances in Colombia and Peru.
Byportfolio, worth mentioning is the excellent performance of all of them, but particularly loans to individuals due to the good performance of credit cards (up 30.7%), mortgage loans (up 14.0%), consumer credit (up 9.1%) as well as commercial lending (up 13.4%).
The most noteworthy aspect inasset quality in the quarter is the stability in both the NPL and coverage ratios.
Customerfunds, both on-balance and off-balance, have grown by 11.0% in the year-on-year comparison. BBVA Francés is the bank that has shown the highest growth (up 31.8%). By products, there has once again been notable growth in those most transactional, which has resulted in an improvement of the mix, although there has also been a significant increase in funds under management in mutual funds (up 23.5%).
Financial statements and relevant business indicators
(Million euros and percentage)
| South | ||||||||||||||||||||
| America | South America excluding Venezuela | |||||||||||||||||||
Income statement | 1Q15 | 1Q15 | D% | D%(1) | 1Q14 | |||||||||||||||
Net interest income | 802 | 763 | 19.1 | 12.3 | 641 | |||||||||||||||
Net fees and commissions | 174 | 168 | 23.8 | 15.0 | 136 | |||||||||||||||
Net trading income | 180 | 108 | 32.4 | 23.8 | 82 | |||||||||||||||
Other income/expenses | 2 | 26 | 34.5 | 31.1 | 19 | |||||||||||||||
Gross income | 1,159 | 1,065 | 21.4 | 14.2 | 877 | |||||||||||||||
Operating expenses | (504 | ) | (489 | ) | 21.7 | 14.5 | (402 | ) | ||||||||||||
Personnel expenses | (266 | ) | (261 | ) | 24.2 | 16.6 | (210 | ) | ||||||||||||
General and administrative expenses | (211 | ) | (203 | ) | 20.0 | 13.2 | (169 | ) | ||||||||||||
Depreciation and amortization | (27 | ) | (25 | ) | 11.6 | 5.1 | (22 | ) | ||||||||||||
Operating income | 655 | 576 | 21.2 | 13.9 | 475 | |||||||||||||||
Impairment on financial assets (net) | (137 | ) | (133 | ) | 15.6 | 9.0 | (115 | ) | ||||||||||||
Provisions (net) and other gains (losses) | (50 | ) | (22 | ) | 116.1 | 99.6 | (10 | ) | ||||||||||||
Income before tax | 468 | 421 | 20.3 | 13.1 | 350 | |||||||||||||||
Income tax | (145 | ) | (124 | ) | 33.7 | 26.4 | (93 | ) | ||||||||||||
Net income | 323 | �� | 297 | 15.4 | 8.3 | 258 | ||||||||||||||
Non-controlling interests | (96 | ) | (85 | ) | 19.2 | 9.0 | (71 | ) | ||||||||||||
Net attributable profit | 227 | 213 | 14.0 | 8.1 | 187 | |||||||||||||||
Balance sheet | 31-03-15 | 31-03-15 | D% | D%(1) | 31-03-14 | |||||||||||||||
Cash and balances with central banks | 9,786 | 9,237 | 42.1 | 26.5 | 6,501 | |||||||||||||||
Financial assets | 10,528 | 10,274 | 36.5 | 28.6 | 7,525 | |||||||||||||||
Loans and receivables | 50,427 | 48,885 | 25.5 | 13.8 | 38,956 | |||||||||||||||
Loans and advances to customers | 45,800 | 44,789 | 24.0 | 12.7 | 36,108 | |||||||||||||||
Loans and advances to credit institutions and other | 4,627 | 4,096 | 43.8 | 28.4 | 2,848 | |||||||||||||||
Tangible assets | 808 | 777 | 33.1 | 18.9 | 583 | |||||||||||||||
Other assets | 1,979 | 1,913 | 39.9 | 25.5 | 1,368 | |||||||||||||||
Total assets/liabilities and equity | 73,529 | 71,086 | 29.4 | 17.7 | 54,933 | |||||||||||||||
Deposits from central banks and credit institutions | 7,075 | 7,038 | 64.1 | 45.2 | 4,288 | |||||||||||||||
Deposits from customers | 44,055 | 42,111 | 18.9 | 8.7 | 35,425 | |||||||||||||||
Debt certificates | 5,315 | 5,315 | 40.5 | 24.1 | 3,783 | |||||||||||||||
Subordinated liabilities | 1,814 | 1,814 | 45.9 | 33.0 | 1,243 | |||||||||||||||
Financial liabilities held for trading | 3,659 | 3,659 | 169.8 | 141.2 | 1,356 | |||||||||||||||
Other liabilities | 8,968 | 8,594 | 29.8 | 17.6 | 6,622 | |||||||||||||||
Economic capital allocated | 2,644 | 2,556 | 15.4 | 8.2 | 2,215 | |||||||||||||||
| South | ||||||||||||||||
| America | South America excluding Venezuela | |||||||||||||||
Relevant business indicators | 31-03-15 | 31-03-15 | 31-12-14 | 31-03-14 | ||||||||||||
Loans and advances to customers (gross)(1) | 47,212 | 46,171 | 45,272 | 41,026 | ||||||||||||
Customer deposits under management(1-2) | 44,235 | 42,313 | 41,218 | 38,720 | ||||||||||||
Mutual funds | 4,400 | 4,399 | 3,838 | 3,210 | ||||||||||||
Pension funds | 5,411 | 5,411 | 4,632 | 3,656 | ||||||||||||
Efficiency ratio (%) | 43.5 | 45.9 | 44.0 | 45.8 | ||||||||||||
NPL ratio (%) | 2.3 | 2.3 | 2.2 | 2.2 | ||||||||||||
NPL coverage ratio (%) | 121 | 119 | 123 | 134 | ||||||||||||
Cost of risk (%) | 1.03 | 1.21 | 1.19 | 1.23 | ||||||||||||
| (1) | Figures at constant exchange rates. |
| (2) | Excluding repos and including specific marketable debt securities. |
| South America | 33 |
Table of Contents
Earnings
In the first quarter of 2015, South America posted anet attributable profit of €213m, equivalent to a year-on-year increase of 8.1%.
Recurring revenue performed very well, with a year-on-year increase of 12.3% in net interest income (thanks to strong activity and the maintenance of spreads) and of 15.0% in fees and commissions.
Meanwhile,NTI registered year-on-year growth of 23.8%, despite the fact that in the first quarter of 2014 this heading included the positive impact resulting from the revaluation of the dollar positions due to the depreciation of the Argentinean peso.
Operating expenses continue to be greatly influenced by the investment plans implemented and by the high inflation in some countries in the area.
Moderate performance ofimpairment losses on financial assets, together with an improvement in the cost of risk, both over the year and in the quarter.
Lastly, there has been a negative impact from the increase intax rates in Chile and Colombia as a result of the reforms implemented in those countries.
Bycountry, Argentina shows the best trend in recurring revenues. In Colombia and more clearly in Peru, cost control and good performance of impairments drove earnings above the growth of gross income. Of note in Chile is the favorable performance of Forum Chile, a leading entity in the country, in which BBVA has increased its stake to 100% at the end of this quarter. Moreover, there has also been a general improvement in the cost/ income of the banking businesses.
South America. Relevant business indicators per country
(Million euros)
| Argentina | Chile | Colombia | Peru | Venezuela | ||||||||||||||||||||||||||||||||||||
| 31-03-15 | 31-03-14 | 31-03-15 | 31-03-14 | 31-03-15 | 31-03-14 | 31-03-15 | 31-03-14 | 31-03-15 | 31-03-14 | |||||||||||||||||||||||||||||||
Loans and advances to customers | 4,629 | 3,779 | 13,622 | 12,702 | 11,426 | 9,827 | 13,397 | 12,238 | 1,042 | 484 | ||||||||||||||||||||||||||||||
Customer deposits under | 5,729 | 4,640 | 9,163 | 8,710 | 11,753 | 11,315 | 11,642 | 10,695 | 1,922 | 889 | ||||||||||||||||||||||||||||||
Mutual funds | 819 | 281 | 1,441 | 1,146 | 770 | 701 | 1,369 | 1,082 | 1 | 10 | ||||||||||||||||||||||||||||||
Efficiency ratio (%) | 51.8 | 52.7 | 48.5 | 46.3 | 39.1 | 41.3 | 36.4 | 37.2 | 15.7 | 33.1 | ||||||||||||||||||||||||||||||
NPL ratio (%) | 0.9 | 0.8 | 2.5 | 2.5 | 2.3 | 2.0 | 2.8 | 2.3 | 1.3 | 2.2 | ||||||||||||||||||||||||||||||
NPL coverage ratio (%) | 388 | 406 | 68 | 84 | 139 | 153 | 122 | 149 | 232 | 146 | ||||||||||||||||||||||||||||||
Cost of risk (%) | 1.39 | 1.18 | 1.13 | 1.04 | 1.35 | 1.49 | 1.23 | 1.39 | 0.16 | 1.20 | ||||||||||||||||||||||||||||||
| (1) | Figures at constant exchange rates. |
| (2) | Excluding repos and including specific marketable debt securities. |
South America. Data per country
(Million euros)
| Operating income | Net attributable profit | |||||||||||||||||||||||||||||||
Country | 1Q15 | D% | D% at constant exchange rates | 1Q14 | 1Q15 | D% | D% at constant exchange rates | 1Q14 | ||||||||||||||||||||||||
Argentina | 149 | 50.7 | 41.8 | 99 | 60 | 40.4 | 32.0 | 43 | ||||||||||||||||||||||||
Chile | 89 | 4.3 | (2.9 | ) | 85 | 30 | (15.1 | ) | (20.9 | ) | 36 | |||||||||||||||||||||
Colombia | 151 | 15.8 | 17.1 | 131 | 72 | 18.1 | 19.5 | 61 | ||||||||||||||||||||||||
Peru | 176 | 22.2 | 9.4 | 144 | 46 | 28.5 | 15.1 | 36 | ||||||||||||||||||||||||
Venezuela | 79 | (58.2 | ) | n.m. | 189 | 15 | (74.2 | ) | 246.2 | 57 | ||||||||||||||||||||||
Other countries(1) | 11 | (33.9 | ) | (41.1 | ) | 17 | 4 | (61.2 | ) | (65.3 | ) | 12 | ||||||||||||||||||||
Total | 655 | (1.4 | ) | 26.1 | 665 | 227 | (6.5 | ) | 13.1 | 243 | ||||||||||||||||||||||
| (1) | Paraguay, Uruguay and Bolivia. Additionally, it includes eliminations and other charges. |
| 34 | Business areas |
Table of Contents

Macro and industry trends
Economic activity in theeuro zone in the quarter has been influenced by the ECB’s asset purchase program and its impact on the currency’s depreciation and the reduction in financing costs, with an incipient recovery of demand for new bank lending in an environment of inflation at all-time lows. Growth in the area is expected to consolidate in 2015, on the back of the recovery of the peripheral countries and the better relative performance of Italy and France.
InChina, activity continues to slow down. As a result, demand, fiscal and, above all, monetary policies have room for responding to modulate the rate of GDP growth. In fact, the Central Bank cut interest rates by 25 basis points last March 1st and new cuts cannot be ruled out.
Activity
Gross lending to customers in the area already shows positive year-on-year rates of change (up 1.2%). Particularly strong performance has been observed in the quarter, when this heading has increased by 6.8%.
Asset quality indicators are favorable, both in the quarter and over the last twelve months.
Customerdeposits under management have grown significantly, 52.6% over the last twelve months and 17.5% on the figure for December, influenced by the good performance of deposits in the wholesale segment in Europe, which maintain the positive trend seen at the end of the previous year.
Financial statements and relevant business indicators
(Million euros and percentage)
Income statement | 1Q15 | D% | 1Q14 | |||||||||
Net interest income | 46 | (2.2 | ) | 47 | ||||||||
Net fees and commissions | 46 | (3.5 | ) | 47 | ||||||||
Net trading income | 73 | 71.4 | 43 | |||||||||
Other income/expenses | (1 | ) | n.m. | 19 | ||||||||
Gross income | 164 | 4.9 | 156 | |||||||||
Operating expenses | (90 | ) | 4.4 | (86 | ) | |||||||
Personnel expenses | (51 | ) | 0.6 | (51 | ) | |||||||
General and administrative expenses | (35 | ) | 8.0 | (32 | ) | |||||||
Depreciation and amortization | (4 | ) | 35.1 | (3 | ) | |||||||
Operating income | 74 | 5.4 | 70 | |||||||||
Impairment on financial assets (net) | (22 | ) | (8.4 | ) | (24 | ) | ||||||
Provisions (net) and other gains (losses) | 4 | 71.7 | 2 | |||||||||
Income before tax | 56 | 15.5 | 48 | |||||||||
Income tax | (20 | ) | 77.8 | (11 | ) | |||||||
Net income | 36 | (3.0 | ) | 37 | ||||||||
Non-controlling interests | — | — | — | |||||||||
Net attributable profit | 36 | (3.0 | ) | 37 | ||||||||
Balance sheet | 31-03-15 | D% | 31-03-14 | |||||||||
Cash and balances with central banks | 247 | 42.0 | 174 | |||||||||
Financial assets | 3,474 | (17.8 | ) | 4,229 | ||||||||
Loans and receivables | 17,189 | (0.2 | ) | 17,222 | ||||||||
Loans and advances to customers | 16,187 | 1.5 | 15,949 | |||||||||
Loans and advances to credit institutions and other | 1,002 | (21.3 | ) | 1,273 | ||||||||
Inter-area positions | — | — | — | |||||||||
Tangible assets | 52 | (36.3 | ) | 82 | ||||||||
Other assets | 621 | 97.7 | 314 | |||||||||
Total assets/liabilities and equity | 21,583 | (2.0 | ) | 22,020 | ||||||||
Deposits from central banks and credit institutions | 6,070 | 14.9 | 5,282 | |||||||||
Deposits from customers | 12,969 | 52.1 | 8,525 | |||||||||
Debt certificates | — | — | — | |||||||||
Subordinated liabilities | 331 | (35.8 | ) | 516 | ||||||||
Inter-area positions | 310 | (94.4 | ) | 5,486 | ||||||||
Financial liabilities held for trading | 115 | (39.7 | ) | 190 | ||||||||
Other liabilities | 461 | n.m. | (46 | ) | ||||||||
Economic capital allocated | 1,327 | (35.8 | ) | 2,065 | ||||||||
| Rest of Eurasia | 35 |
Table of Contents
Financial statements and relevant business indicators
(Million euros and percentage)
Relevant business indicators | 31-03-15 | 31-12-14 | 31-03-14 | |||||||||
Loans and advances to customers (gross) | 16,868 | 15,795 | 16,676 | |||||||||
Customer deposits under management(1) | 12,858 | 10,941 | 8,425 | |||||||||
Mutual funds | 1,236 | 1,205 | 998 | |||||||||
Pension funds | 365 | 314 | 290 | |||||||||
Efficiency ratio (%) | 54.8 | 46.6 | 55.0 | |||||||||
NPL ratio (%) | 3.4 | 3.7 | 3.8 | |||||||||
NPL coverage ratio (%) | 82 | 80 | 77 | |||||||||
Cost of risk (%) | 0.55 | 0.31 | 0.49 | |||||||||
| (1) | Excluding repos. |
Earnings
Growth ofgross income (up 4.9% year-on-year) thanks to the positive contribution fromNTI, as a result of the stronger activity of the Global Markets unit.
Operating expenses remain at levels similar to those in the fourth quarter and grow year-on-year belowgross income in cumulative terms, enablingoperating income to increase by 5.4% compared with the first quarter of 2014.
Lastly, reduction inimpairment losses on financial assets.
As a result, thenet attributable profit is very similar to that for the first three months of 2014, although significantly better than in the previous quarter.
| 36 | Business areas |
Table of Contents
The Corporate Centerresults in the first quarter of 2015 were a loss of €250m, notably less than that registered in the same period of the previous year (€425m). The comparison is heavily influenced by:
| • | The good performance of NTI, due basically to the accounting of certain capital gains from the Holdings in Industrial and Financial Companies unit. |
| • | The reduction in operating expenses as a result of the measures to keep costs in check applied in recent years. |
| • | Results from corporate operations, which include the capital gains (net of taxes) of €583m from the various sale operations equivalent to 5.6% of BBVA Group’s stake in CNCB. |
Financial statements
(Million euros)
Income statement | 1Q15 | D% | 1Q14 | |||||||||
Net interest income | (129 | ) | (27.6 | ) | (179 | ) | ||||||
Net fees and commissions | (23 | ) | 14.3 | (20 | ) | |||||||
Net trading income | 91 | n.m. | 16 | |||||||||
Other income/expenses | (25 | ) | (40.0 | ) | (42 | ) | ||||||
Gross income | (86 | ) | (61.8 | ) | (225 | ) | ||||||
Operating expenses | (257 | ) | (7.8 | ) | (279 | ) | ||||||
Personnel expenses | (123 | ) | (0.8 | ) | (124 | ) | ||||||
General and administrative expenses | (20 | ) | (50.2 | ) | (40 | ) | ||||||
Depreciation and amortization | (114 | ) | (0.7 | ) | (115 | ) | ||||||
Operating income | (343 | ) | (31.9 | ) | (504 | ) | ||||||
Impairment on financial assets (net) | 2 | n.m. | (4 | ) | ||||||||
Provisions (net) and other gains (losses) | (8 | ) | (84.7 | ) | (51 | ) | ||||||
Income before tax | (349 | ) | (37.6 | ) | (559 | ) | ||||||
Income tax | 104 | (24.5 | ) | 137 | ||||||||
Net income from ongoing operations | (245 | ) | (41.9 | ) | (422 | ) | ||||||
Results from corporate operations(1) | 583 | n.m. | — | |||||||||
Net income | 338 | n.m. | (422 | ) | ||||||||
Non-controlling interests | (5 | ) | 47.6 | (3 | ) | |||||||
Net attributable profit | 333 | n.m. | (425 | ) | ||||||||
Net attributable profit (excluding results from corporate operations) | (250 | ) | (41.2 | ) | (425 | ) | ||||||
| (1) | 2015 includes the capital gains from the various sale transactions equivalent to 5.6% of BBVA Group’s stake in CNCB. |
Balance sheet | 31-03-15 | D% | 31-03-14 | |||||||||
Cash and balances with central banks | 15 | (31.5 | ) | 21 | ||||||||
Financial assets | 3,504 | 10.7 | 3,164 | |||||||||
Loans and receivables | 30 | (62.5 | ) | 81 | ||||||||
Loans and advances to customers | 30 | (62.5 | ) | 81 | ||||||||
Loans and advances to credit institutions and other | — | — | — | |||||||||
Inter-area positions | — | — | — | |||||||||
Tangible assets | 2,310 | 10.8 | 2,085 | |||||||||
Other assets | 18,081 | 9.3 | 16,540 | |||||||||
|
|
|
|
|
| |||||||
Total assets/liabilities and equity | 23,940 | 9.4 | 21,891 | |||||||||
|
|
|
|
|
| |||||||
Deposits from central banks and credit institutions | — | — | — | |||||||||
Deposits from customers | — | — | — | |||||||||
Debt certificates | 5,339 | (11.7 | ) | 6,049 | ||||||||
Subordinated liabilities | 5,198 | 75.3 | 2,965 | |||||||||
Inter-area positions | (19,566 | ) | 46.7 | (13,335 | ) | |||||||
Financial liabilities held for trading | — | — | — | |||||||||
Other liabilities | 7,181 | 55.7 | 4,611 | |||||||||
Shareholders’ funds | 49,633 | 7.5 | 46,165 | |||||||||
Economic capital allocated | (23,845 | ) | (2.9 | ) | (24,564 | ) | ||||||
| Corporate Center | 37 |
Table of Contents
Interest rates
(Quarterly averages)
| 2015 | 2014 | |||||||||||||||||||
| 1Q | 4Q | 3Q | 2Q | 1Q | ||||||||||||||||
Official ECB rate | 0.05 | 0.05 | 0.12 | 0.22 | 0.25 | |||||||||||||||
Euribor 3 months | 0.05 | 0.08 | 0.16 | 0.30 | 0.30 | |||||||||||||||
Euribor 1 year | 0.25 | 0.33 | 0.44 | 0.57 | 0.56 | |||||||||||||||
USA Federal rates | 0.25 | 0.25 | 0.25 | 0.25 | 0.25 | |||||||||||||||
TIIE (Mexico) | 3.30 | 3.29 | 3.29 | 3.67 | 3.79 | |||||||||||||||
CBRT (Turkey) | 7.99 | 8.40 | 8.40 | 9.79 | 9.22 | |||||||||||||||
Exchange rates
(Expressed in currency/euro)
| Year-end exchange rates | Average exchange rates | |||||||||||||||||||
| 31-03-15 | D% on 31-03-14 | D% on 31-12-14 | 1Q15 | D% on 1Q14 | ||||||||||||||||
Mexican peso | 16.5123 | 9.1 | 8.2 | 16.8274 | 7.7 | |||||||||||||||
U.S. dollar | 1.0759 | 28.2 | 12.8 | 1.1261 | 21.6 | |||||||||||||||
Argentinean peso | 9.4849 | 16.4 | 9.5 | 9.7799 | 6.3 | |||||||||||||||
Chilean peso | 674.31 | 12.6 | 9.3 | 703.23 | 7.4 | |||||||||||||||
Colombian peso | 2,770.08 | (2.2 | ) | 4.9 | 2,777.78 | (1.1 | ) | |||||||||||||
Peruvian new sol | 3.3321 | 16.2 | 8.5 | 3.4433 | 11.7 | |||||||||||||||
Venezuelan bolivar fuerte | 207.5981 | (92.9 | ) | (93.0 | ) | 207.5981 | (92.5 | ) | ||||||||||||
Turkish lira | 2.8131 | 5.6 | 0.7 | 2.7731 | 9.5 | |||||||||||||||
| 38 | Annex |
Table of Contents
Other information: Corporate & Investment Banking
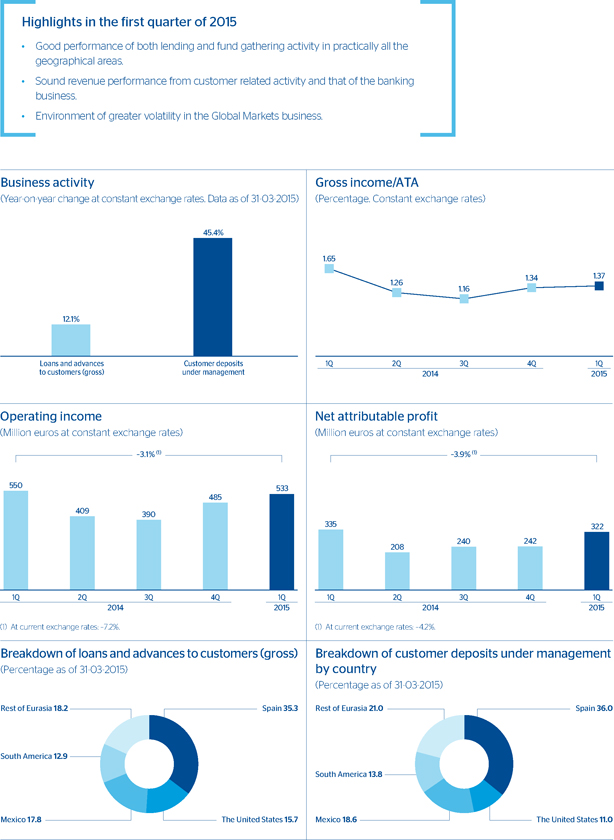
| Other information: Corporate & Investment Banking | 39 |
Table of Contents
Financial statements and relevant business indicators
(Million euros and percentage)
Income statement | 1Q15 | D% | D%(1) | 1Q14 | ||||||||||||
Net interest income | 342 | (7.5 | ) | (2.4 | ) | 370 | ||||||||||
Net fees and commissions | 186 | 6.8 | 2.1 | 175 | ||||||||||||
Net trading income | 233 | (7.5 | ) | (0.7 | ) | 251 | ||||||||||
Other income/expenses | 16 | n.m. | n.m. | (6 | ) | |||||||||||
Gross income | 776 | (1.7 | ) | 0.8 | 790 | |||||||||||
Operating expenses | (243 | ) | 13.0 | 10.3 | (215 | ) | ||||||||||
Personnel expenses | (124 | ) | 5.5 | 0.7 | (118 | ) | ||||||||||
General and administrative expenses | (113 | ) | 22.0 | 22.9 | (93 | ) | ||||||||||
Depreciation and amortization | (6 | ) | 24.0 | 13.2 | (5 | ) | ||||||||||
Operating income | 533 | (7.2 | ) | (3.1 | ) | 575 | ||||||||||
Impairment on financial assets (net) | (23 | ) | (47.8 | ) | (45.1 | ) | (44 | ) | ||||||||
Provisions (net) and other gains (losses) | 2 | (25.3 | ) | (62.1 | ) | 3 | ||||||||||
Income before tax | 513 | (4.0 | ) | (0.4 | ) | 535 | ||||||||||
Income tax | (144 | ) | (11.0 | ) | (6.5 | ) | (162 | ) | ||||||||
Net income | 369 | (1.0 | ) | 2.2 | 372 | |||||||||||
Non-controlling interests | (46 | ) | 28.2 | 84.2 | (36 | ) | ||||||||||
Net attributable profit | 322 | (4.2 | ) | (3.9 | ) | 336 | ||||||||||
Balance sheet | 31-03-15 | D% | D%(1) | 31-03-14 | ||||||||||||
Cash and balances with central banks | 3,424 | 20.6 | 31.4 | 2,838 | ||||||||||||
Financial assets | 103,224 | 22.0 | 19.2 | 84,631 | ||||||||||||
Loans and receivables | 89,075 | 36.7 | 30.2 | 65,181 | ||||||||||||
Loans and advances to customers | 57,593 | 19.0 | 12.5 | 48,385 | ||||||||||||
Loans and advances to credit institutions and other | 31,482 | 87.4 | 82.7 | 16,795 | ||||||||||||
Inter-area positions | — | — | — | — | ||||||||||||
Tangible assets | 56 | 123.2 | 100.1 | 25 | ||||||||||||
Other assets | 4,968 | 44.2 | 40.1 | 3,444 | ||||||||||||
Total assets/liabilities and equity | 200,747 | 28.6 | 24.6 | 156,118 | ||||||||||||
Deposits from central banks and credit institutions | 51,686 | (4.3 | ) | (6.0 | ) | 58,506 | ||||||||||
Deposits from customers | 58,462 | 50.5 | 57.1 | 38,836 | ||||||||||||
Debt certificates | (19 | ) | (71.8 | ) | (69.2 | ) | (67 | ) | ||||||||
Subordinated liabilities | 1,875 | 44.5 | 37.1 | 1,298 | ||||||||||||
Inter-area positions | 12,081 | 154.6 | 25.1 | 222 | ||||||||||||
Financial liabilities held for trading | 67,362 | 35.9 | 34.7 | 49,550 | ||||||||||||
Other liabilities | 5,111 | 38.9 | 37.7 | 3,678 | ||||||||||||
Economic capital allocated | 4,189 | 2.3 | (1.6 | ) | 4,094 | |||||||||||
Relevant business indicators | 31-03-15 | 31-12-14 | 31-03-14 | |||||||||
Loans and advances to customers (gross)(1) | 58,466 | 54,782 | 52,148 | |||||||||
Customer deposits under management(1-2) | 40,030 | 33,916 | 27,563 | |||||||||
Mutual funds | 1,314 | 1,093 | 984 | |||||||||
Pension funds | — | — | — | |||||||||
Efficiency ratio (%) | 31.3 | 32.5 | 27.2 | |||||||||
NPL ratio (%) | 0.9 | 0.9 | 1.6 | |||||||||
NPL coverage ratio (%) | 119 | 136 | 83 | |||||||||
Cost of risk (%) | 0.17 | 0.39 | 0.29 | |||||||||
| (1) | Figures at constant exchange rates. |
| (2) | Including area’s repos in Mexico. |
Macro and industry trends
The most important macroeconomic and industry trends affecting the Group’s wholesale business in thefirst quarter of 2015 have been:
| • | Financial markets characterized by higher volatility and greater risk appetite, particularly in the first half of the quarter. |
| • | Increased investor activity, driven by a number of significant events (ECB bond purchase program, end of the fixed exchange rate between the euro and the Swiss franc, dollar strengthening, uncertainty surrounding Greece). |
All the comments below on rates of change will be expressed at a constantexchange rate, unless expressly stated otherwise.
Activity
CIB continues to focus on its customer-centric strategy, boosting cross-selling and prioritizing profitability over volume. From the point of view of activity this means:
| • | Maintaining the trend mentioned in the fourth quarter of 2014 for increasedgross lending to customers, which as of 31-Mar-2015 grew 15.2% year-on-year (up 12.1% including the balances of Global Markets). This increase is general across all geographical areas. |
| • | Significant increase in gathering of new customerdepositsunder management, whose balance grew year-on-year by 42.9% (up 45.4% including Global Markets). |
| • | Maintenance of theNPL ratio in the quarter and decline in thecoverage ratio, which started at high levels. |
Earnings
In the first quarter of 2015, thenet attributable profit generated by CIB was 3.9% lower than in the same period in 2014. This was strongly influenced by the Global Markets units, whose performance has been lower than in the first three months of the previous year (although above that shown in the last three months of the previous year). Not taking into account market activity, the net attributable profit generated by CIB is 4.7% higher than the figure registered in the first quarter of 2014. The most relevant elements are summarized below:
| 40 | Annex |
Table of Contents
| • | Good performance ofrevenue from customer activity. CIB’s gross income not including Global Markets is up 7.2%. Taking into account this unit, the year-on-year figure is a 0.8% increase, which is positive considering the complex environment in which it was generated. |
| • | Operating expenses have grown by 10.3% over the same period as a result of high inflation in some geographical areas and the investments in technology being undertaken. Despite this, the efficiency ratio has improved in the quarter. |
| • | Lastly, lowerimpairment losses on financial assets than in the first quarter of 2014. |
| Other information: Corporate & Investment Banking | 41 |
Table of Contents
Conciliation of the BBVA Group’s financial statements
These headings present the reconciliation of the Group’s financial statements with the Garanti Group using the equity method versus consolidation in proportion to the percentage of the BBVA Group’s stake in the Turkish entity. In terms of reporting to the market, this consolidation method is deemed better for evaluating the nature and financial effects of
the Garanti Group’s business activities, consistent with the information from previous periods, and more coherent in its effects on solvency. Moreover, the corporate operations heading in 2015 includes the capital gains from the various sale transactions equivalent to 5.6% of BBVA Group’s stake in CNCB.
Consolidated income statement BBVA Group
(Million euros)
| Garanti Group consolidated in proportion to the percentage of the Group’s stake and with the heading “Results from corporate operations” | Garanti Group consolidated using the equity method | |||||||||||||||
| 1Q15 | 1Q14 | 1Q15 | 1Q14 | |||||||||||||
Net interest income | 3,663 | 3,391 | 3,453 | 3,244 | ||||||||||||
Net fees and commissions | 1,077 | 985 | 1,027 | 943 | ||||||||||||
Net trading income(1) | 775 | 751 | 790 | 733 | ||||||||||||
Dividend income | 42 | 29 | 42 | 29 | ||||||||||||
Income by the equity method | 3 | (14 | ) | 88 | 55 | |||||||||||
Other operating income and expenses | 73 | (90 | ) | 69 | (92 | ) | ||||||||||
Gross income | 5,632 | 5,051 | 5,469 | 4,912 | ||||||||||||
Operating expenses | (2,776 | ) | (2,613 | ) | (2,385 | ) | (2,252 | ) | ||||||||
Personnel expenses | (1,460 | ) | (1,375 | ) | (1,405 | ) | (1,329 | ) | ||||||||
General and administrative expenses | (1,024 | ) | (959 | ) | (980 | ) | (923 | ) | ||||||||
Depreciation and amortization | (291 | ) | (279 | ) | (282 | ) | (271 | ) | ||||||||
Operating income | 2,857 | 2,438 | 2,802 | 2,389 | ||||||||||||
Impairment on financial assets (net) | (1,119 | ) | (1,103 | ) | (1,086 | ) | (1,078 | ) | ||||||||
Provisions (net) | (230 | ) | (144 | ) | (228 | ) | (140 | ) | ||||||||
Other gains (losses)(2) | (66 | ) | (173 | ) | 671 | (174 | ) | |||||||||
Income before tax | 1,442 | 1,017 | 2,159 | 998 | ||||||||||||
Income tax | (386 | ) | (273 | ) | (520 | ) | (254 | ) | ||||||||
Net income from ongoing operations | 1,056 | 744 | 1,639 | 744 | ||||||||||||
Net income from discontinued operations | — | — | — | — | ||||||||||||
Results from corporate operations | 583 | — | — | — | ||||||||||||
Net income | 1,639 | 744 | 1,639 | 744 | ||||||||||||
Non-controlling interests | (103 | ) | (120 | ) | (103 | ) | (120 | ) | ||||||||
Net attributable profit | 1,536 | 624 | 1,536 | 624 | ||||||||||||
| (1) | Includes “Net trading income” and “Exchange rate differences (net)”. |
| (2) | Includes “Impairment losses on other assets (net)”, “Gains (losses) on derecognized assets not classified as non-recurrent assets held for sale” and “Gains (losses) in non-current assets held for sale not classified as discontinued operations”. |
| 42 | Annex |
Table of Contents
Consolidated balance sheet BBVA Group
(Million euros)
| Garanti Group consolidated in proportion to the percentage of the Group’s stake | Garanti Group consolidated using the equity method | |||||||
| 31-03-15 | 31-03-15 | |||||||
Cash and balances with central banks | 27,553 | 25,123 | ||||||
Financial assets held for trading | 94,883 | 94,651 | ||||||
Other financial assets designated at fair value | 3,603 | 3,098 | ||||||
Available-for-sale financial assets | 101,183 | 97,456 | ||||||
Loans and receivables | 398,558 | 382,810 | ||||||
Loans and advances to credit institutions | 33,672 | 32,215 | ||||||
Loans and advances to customers | 360,265 | 346,089 | ||||||
Debt securities | 4,622 | 4,506 | ||||||
Held-to-maturity investments | — | — | ||||||
Investments in entities accounted for using the equity method | 674 | 4,579 | ||||||
Tangible assets | 8,057 | 7,864 | ||||||
Intangible assets | 9,493 | 8,017 | ||||||
Other assets(1) | 28,593 | 28,204 | ||||||
Total assets | 672,598 | 651,802 | ||||||
Financial liabilities held for trading | 67,438 | 67,065 | ||||||
Other financial liabilities designated at fair value | 3,903 | 2,956 | ||||||
Financial liabilities at amortized cost | 518,819 | 499,831 | ||||||
Deposits from central banks and credit institutions | 92,547 | 88,199 | ||||||
Deposits from customers | 339,675 | 327,167 | ||||||
Debt certificates | 58,259 | 56,953 | ||||||
Subordinated liabilities | 15,723 | 15,700 | ||||||
Other financial liabilities | 12,616 | 11,813 | ||||||
Liabilities under insurance contracts | 11,193 | 11,181 | ||||||
Other liabilities(2) | 18,879 | 18,403 | ||||||
Total liabilities | 620,232 | 599,436 | ||||||
Non-controlling interests | 1,692 | 1,692 | ||||||
Valuation adjustments | 327 | 327 | ||||||
Shareholders’ funds | 50,347 | 50,347 | ||||||
Total equity | 52,366 | 52,366 | ||||||
Total equity and liabilities | 672,598 | 651,802 | ||||||
Memorandum item: | ||||||||
Contingent liabilities | 38,923 | 35,264 | ||||||
| (1) | Includes “Fair value changes of the hedge items in portfolio hedges of interest-rate risk”, “Hedging derivatives”, “Non-current assets held for sale”, “Reinsurance assets”, “Tax assets” and “Other assets”. |
| (2) | Includes “Hedging derivatives”, “Provisions”, “Tax liabilities” and “Other liabilities”. |
| Conciliation of the BBVA Group’s financial statements | 43 |
Table of Contents
BBVA INVESTOR RELATIONS
Headquarters
Paseo de la Castellana, 81 – 17th floor
28046 Madrid
SPAIN
Telephone: +34 91 374 65 26
E-mail: bbvainvestorrelations@bbva.com
New York Office
1345 Avenue of the Americas, 44th floor
10105 New York, NY
Telephones: +1 212 728 24 16 / +1 212 728 16 60
Hong Kong Office
Level 95, International Commerce Centre
One Austin Road West, Kowloon,
Hong Kong
Telephone: +852 2582 3229
More information at:
http://shareholdersandinvestors.bbva.com
Table of Contents


Table of Contents
SIGNATURE
Pursuant to the requirements of the Securities Exchange Act of 1934, the registrant has duly caused this report to be signed on its behalf by the undersigned, thereunto duly authorized.
| Banco Bilbao Vizcaya Argentaria, S.A. | ||||||
| Date: April 29, 2015 | By: | /s/ María Ángeles Peláez | ||||
| Name: | María Ángeles Peláez | |||||
| Title: | Authorized Representative | |||||