Table of Contents
UNITED STATES
SECURITIES AND EXCHANGE COMMISSION
WASHINGTON, D.C. 20549
FORM 6-K
REPORT OF FOREIGN ISSUER
PURSUANT TO RULE 13a-16 OR 15d-16
UNDER THE SECURITIES EXCHANGE ACT OF 1934
For the month of July, 2015
Commission file number: 1-10110
BANCO BILBAO VIZCAYA ARGENTARIA, S.A.
(Exact name of Registrant as specified in its charter)
BANK BILBAO VIZCAYA ARGENTARIA, S.A.
(Translation of Registrant’s name into English)
Paseo de la Castellana, 81
28046 Madrid
Spain
(Address of principal executive offices)
Indicate by check mark whether the registrant files or will file annual reports under cover of Form 20-F or Form 40-F:
Form 20-F x Form 40-F ¨
Indicate by check mark if the registrant is submitting the Form 6-K in paper as permitted by Regulation S-T Rule 101(b)(1):
Yes ¨ No x
Indicate by check mark if the registrant is submitting the Form 6-K in paper as permitted by Regulation S-T Rule 101(b)(7):
Yes ¨ No x
Table of Contents

Table of Contents

Information for the semester
January-June
2015
| 2 | ||||||
| 3 | ||||||
| 3 | ||||||
| 4 | ||||||
| 9 | ||||||
| 11 | ||||||
| 12 | ||||||
| 14 | ||||||
| 15 | ||||||
| 16 | ||||||
| 18 | ||||||
| 21 | ||||||
| 23 | ||||||
| 26 | ||||||
| 29 | ||||||
| 32 | ||||||
| 35 | ||||||
| 37 | ||||||
| 38 | ||||||
| 38 | ||||||
| 39 | ||||||
| 42 | ||||||
Table of Contents
BBVA Group highlights
(Consolidated figures)
| 30-06-15 | D% | 30-06-14 | 31-12-14 | |||||||||||||
Balance sheet (million euros) | ||||||||||||||||
Total assets | 689,071 | 11.7 | 617,131 | 651,511 | ||||||||||||
|
|
|
|
|
|
|
| |||||||||
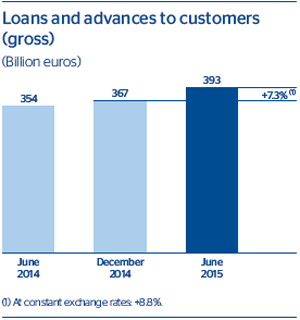
Loans and advances to customers (gross) | 393,158 | 11.0 | 354,202 | 366,536 | ||||||||||||
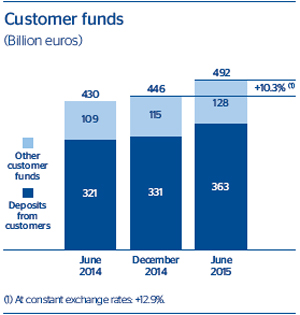
Deposits from customers | 363,373 | 13.3 | 320,796 | 330,686 | ||||||||||||
Other customer funds | 128,323 | 17.9 | 108,841 | 115,275 | ||||||||||||
|
|
|
|
|
|
|
| |||||||||
Total customer funds | 491,695 | 14.4 | 429,637 | 445,961 | ||||||||||||
|
|
|
|
|
|
|
| |||||||||
Total equity | 50,997 | 8.8 | 46,867 | 51,609 | ||||||||||||
|
|
|
|
|
|
|
| |||||||||
Income statement (million euros) | ||||||||||||||||
Net interest income | 7,521 | 6.9 | 7,038 | 15,116 | ||||||||||||
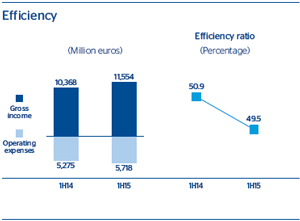
Gross income | 11,554 | 11.4 | 10,368 | 21,357 | ||||||||||||
Operating income | 5,836 | 14.6 | 5,093 | 10,406 | ||||||||||||
Income before tax | 3,046 | 44.4 | 2,109 | 4,063 | ||||||||||||
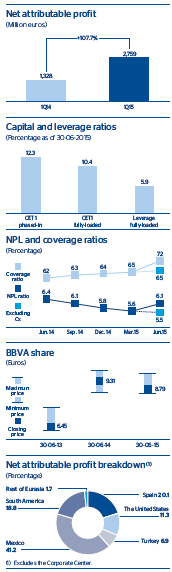
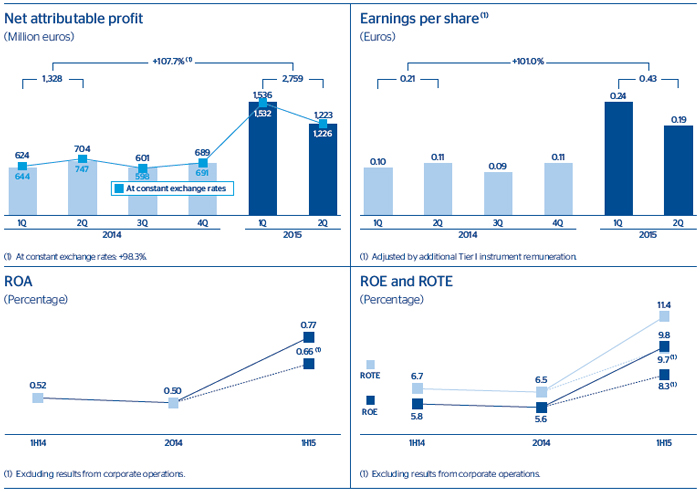
Net attributable profit | 2,759 | 107.7 | 1,328 | 2,618 | ||||||||||||
Data per share and share performance ratios | ||||||||||||||||
Share price (euros) | 8.79 | (5.6 | ) | 9.31 | 7.85 | |||||||||||
Market capitalization (million euros) | 55,436 | 1.2 | 54,804 | 48,470 | ||||||||||||
Net attributable profit per share (euros)(1) | 0.43 | 101.0 | 0.21 | 0.42 | ||||||||||||
Book value per share (euros) | 8.28 | 3.7 | 7.98 | 8.01 | ||||||||||||
P/BV (Price/book value; times) | 1.1 | 1.2 | 1.0 | |||||||||||||
Significant ratios (%) | ||||||||||||||||
ROE (Net attributable profit/average equity) | 9.8 | 5.8 | 5.6 | |||||||||||||
ROTE (Net attributable profit/average tangible equity) | 11.4 | 6.7 | 6.5 | |||||||||||||
ROA (Net income/average total assets) | 0.77 | 0.52 | 0.50 | |||||||||||||
RORWA (Net income/average risk-weighted assets) | 1.45 | 0.93 | 0.90 | |||||||||||||
Efficiency ratio | 49.5 | 50.9 | 51.3 | |||||||||||||
Cost of risk | 1.16 | 1.24 | 1.25 | |||||||||||||
NPL ratio | 6.1 | 6.4 | 5.8 | |||||||||||||
NPL coverage ratio | 72 | 62 | 64 | |||||||||||||
Capital adequacy ratios (%) (2) | ||||||||||||||||
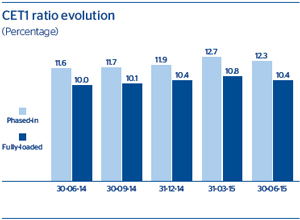
CET1 | 12.3 | 11.6 | 11.9 | |||||||||||||
Tier I | 12.3 | 11.6 | 11.9 | |||||||||||||
|
|
|
|
|
| |||||||||||
Total ratio | 15.5 | 14.7 | 15.1 | |||||||||||||
|
|
|
|
|
| |||||||||||
Other information | ||||||||||||||||
Number of shares (millions) | 6,305 | 7.1 | 5,887 | 6,171 | ||||||||||||
Number of shareholders | 940,619 | (1.4 | ) | 954,325 | 960,397 | |||||||||||
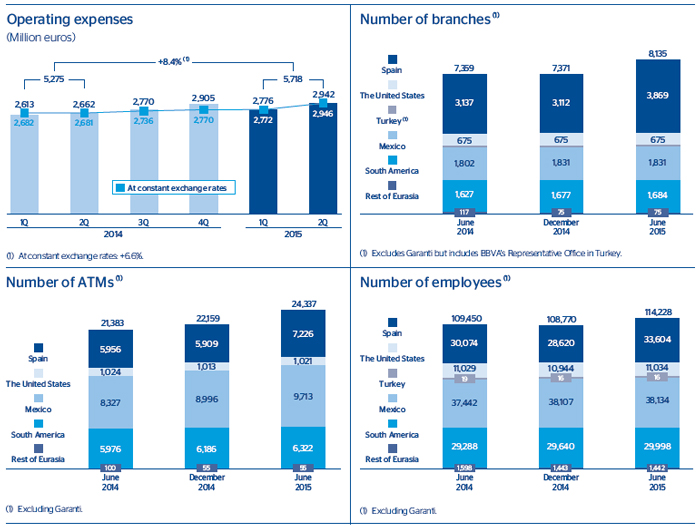
Number of employees(3) | 114,228 | 4.4 | 109,450 | 108,770 | ||||||||||||
Number of branches(3) | 8,135 | 10.5 | 7,359 | 7,371 | ||||||||||||
Number of ATMs(3) | 24,337 | 13.8 | 21,383 | 22,159 | ||||||||||||
General note: The financial information included in this document with respect to the stake in Garanti Group is presented as continuous with previous years, and integrated in the proportion corresponding to the Group’s percentage holding at 30-6-2015. For the reconciliation of the BBVA Group’s consolidated financial statements, see pages 42 and 43.
| (1) | Adjusted by additional Tier I instrument remuneration. |
| (2) | The capital ratios are calculated under CRD IV, applying a 40% phase in for 2015. |
| (3) | Excluding Garanti. |
| 2 | BBVA Group highlights |
Table of Contents
Results(pages 4-8)
| • | Incorporation of Catalunya Banc (hereinafter Cx) from April 24, although this has had a practically neutral effect on the net attributable profit for the quarter. |
| • | Positive trend in revenue items: good performance of the most recurring items, payment of the Telefónica dividend and capital gains in net trading income (NTI) from the sales in the securities portfolio. |
| • | Operating expenses grow below gross income. Efficiency continues to improve. |
| • | Impairment losses on financial assets slightly below those in the previous quarter. |
| • | Sale on the stock market of 0.8% of China Citic Bank (CNCB) in the quarter, generating net gains after tax of €122m. |
Balance sheet and business activity(pages 9-10)
| • | Figures affected by the incorporation of Cx. |
| • | Excluding this effect, growing trend in gross customer lending and customer funds, with a reduction of NPA risks. |
Solvency(page 11)
| • | Sound capital position (fully-loaded CET1 ratio of 10.4% at the close of June 2015), clearly above regulatory requirements, and with an extraordinary quality (the fully-loaded leverage ratio was 5.9% on the same date). |
| • | Moody’s has upgraded its ratings for unsecured senior debt issued by BBVA (to Baa1) and for deposits (to A3), both with a stable outlook. |
Risk management(pages 12-13)
| • | Good performance in the main asset quality indicators on a comparable scale. |
| • | The incorporation of Cx increases the NPA ratio due to higher levels of non-performing loans, but the coverage ratio has increased. |
The BBVA share(page 14)
| • | Distribution to shareholders on July 16, 2015 of a cash amount for 8 cents of euro gross per share. |
Business areas(starting on page 16)
| • | The purchase of Cx was completed on April 24. With this operation, BBVA has acquired 1.5 million customers, doubled its market share in Catalonia and become the most important player in Spain. |
| • | BBVA has completed the acquisition of 14.89% stake in the share capital of Turkiye Garanti Bankasi, A.S. (Garanti Bank). The effects of this purchase are stated in the relevant event published on July 27th. |
Other matters of interest
| • | The Board of Directors has appointed Carlos Torres Vila as President and COO. It has also approved an organizational structure whose top priority is to boost the business and continue to grow profitably, increasing the number of customers with the focus on their satisfaction. To gain market share, customers and business, BBVA is committed to investing in new capabilities associated with customer experience, big data, technology and engineering, marketing and digital sales, and talent and new digital businesses. |
| • | BBVA has drawn up a new Code of Conduct to adapt to social, technological and regulatory changes. It strengthens the Bank’s commitment to its customers, employees and society as a whole. |
| Relevant events | 3 |
Table of Contents
BBVA Group has generated a half-yearlynet attributable profit of €2,759m. As already mentioned above, these earnings include those generated by Cx, whose effect is practically neutral at the level of net attributable profit.
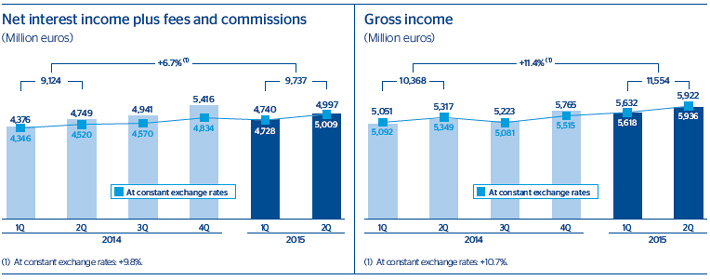
Gross income
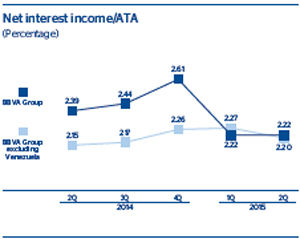
Net interest income increased year-on-year in the first six months thanks to increased activity in emerging countries and the United States and the reduction in the cost of deposits in Spain and Turkey.
Good performance of accumulated net fees and commissions in the half-year, despite the regulatory limitations that came into force recently in some countries. Overall, another positive performance from themore recurring revenue (net interest income plus net fees and commissions) through June 30.
Consolidated income statement: quarterly evolution(1)
(Million euros)
| 2015 | 2014 | |||||||||||||||||||||||
| 2Q | 1Q | 4Q | 3Q | 2Q | 1Q | |||||||||||||||||||
Net interest income | 3,858 | 3,663 | 4,248 | 3,830 | 3,647 | 3,391 | ||||||||||||||||||
Net fees and commissions | 1,140 | 1,077 | 1,168 | 1,111 | 1,101 | 985 | ||||||||||||||||||
Net trading income | 650 | 775 | 514 | 444 | 426 | 751 | ||||||||||||||||||
Dividend income | 194 | 42 | 119 | 42 | 342 | 29 | ||||||||||||||||||
Income by the equity method | 18 | 3 | 3 | 31 | 16 | (14 | ) | |||||||||||||||||
Other operating income and expenses | 62 | 73 | (287 | ) | (234 | ) | (215 | ) | (90 | ) | ||||||||||||||
Gross income | 5,922 | 5,632 | 5,765 | 5,223 | 5,317 | 5,051 | ||||||||||||||||||
Operating expenses | (2,942 | ) | (2,776 | ) | (2,905 | ) | (2,770 | ) | (2,662 | ) | (2,613 | ) | ||||||||||||
Personnel expenses | (1,538 | ) | (1,460 | ) | (1,438 | ) | (1,438 | ) | (1,359 | ) | (1,375 | ) | ||||||||||||
General and administrative expenses | (1,106 | ) | (1,024 | ) | (1,147 | ) | (1,037 | ) | (1,017 | ) | (959 | ) | ||||||||||||
Depreciation and amortization | (299 | ) | (291 | ) | (320 | ) | (296 | ) | (286 | ) | (279 | ) | ||||||||||||
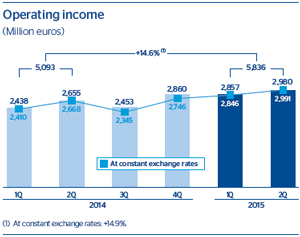
Operating income | 2,980 | 2,857 | 2,860 | 2,453 | 2,655 | 2,438 | ||||||||||||||||||
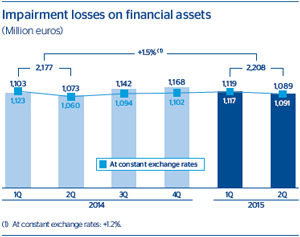
Impairment on financial assets (net) | (1,089 | ) | (1,119 | ) | (1,168 | ) | (1,142 | ) | (1,073 | ) | (1,103 | ) | ||||||||||||
Provisions (net) | (164 | ) | (230 | ) | (513 | ) | (199 | ) | (298 | ) | (144 | ) | ||||||||||||
Other gains (losses) | (123 | ) | (66 | ) | (201 | ) | (136 | ) | (191 | ) | (173 | ) | ||||||||||||
Income before tax | 1,604 | 1,442 | 978 | 976 | 1,092 | 1,017 | ||||||||||||||||||
Income tax | (429 | ) | (386 | ) | (173 | ) | (243 | ) | (292 | ) | (273 | ) | ||||||||||||
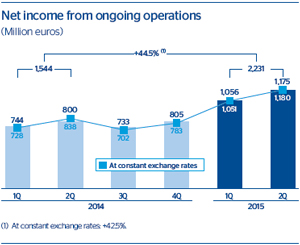
Net income from ongoing operations | 1,175 | 1,056 | 805 | 733 | 800 | 744 | ||||||||||||||||||
Results from corporate operations(2) | 144 | 583 | — | — | — | — | ||||||||||||||||||
Net income | 1,319 | 1,639 | 805 | 733 | 800 | 744 | ||||||||||||||||||
Non-controlling interests | (97 | ) | (103 | ) | (116 | ) | (132 | ) | (95 | ) | (120 | ) | ||||||||||||
Net attributable profit | 1,223 | 1,536 | 689 | 601 | 704 | 624 | ||||||||||||||||||
Net attributable profit (excluding results from corporate operations) | 1,078 | 953 | 689 | 601 | 704 | 624 | ||||||||||||||||||
Basic earnings per share (euros)(3) | 0.19 | 0.24 | 0.11 | 0.09 | 0.11 | 0.10 | ||||||||||||||||||
| (1) | Financial statements with the revenues and expenses of the Garanti Group consolidated in proportion to the percentage of the Group’s stake. |
| (2) | 2015 includes the capitral gains from the various sale operations equivalent to 6.34% of BBVA Group’s stake in CNCB and the badwill from Cx operation. |
| (3) | Adjusted by additional Tier I instrument remuneration. |
| 4 | Group information |
Table of Contents
Consolidated income statement(1)
(Million euros)
| 1H15 | D% | D% at constant exchange rates | 1H14 | |||||||||||||
Net interest income | 7,521 | 6.9 | 11.4 | 7,038 | ||||||||||||
Net fees and commissions | 2,216 | 6.2 | 4.7 | 2,086 | ||||||||||||
Net trading income | 1,425 | 21.1 | 25.2 | 1,176 | ||||||||||||
Dividend income | 236 | (36.3 | ) | (36.8 | ) | 371 | ||||||||||
Income by the equity method | 21 | n.m. | n.m. | 1 | ||||||||||||
Other operating income and expenses | 135 | n.m. | 129.3 | (305 | ) | |||||||||||
Gross income | 11,554 | 11.4 | 10.7 | 10,368 | ||||||||||||
Operating expenses | (5,718 | ) | 8.4 | 6.6 | (5,275 | ) | ||||||||||
Personnel expenses | (2,998 | ) | 9.6 | 6.6 | (2,734 | ) | ||||||||||
General and administrative expenses | (2,130 | ) | 7.8 | 7.4 | (1,976 | ) | ||||||||||
Depreciation and amortization | (590 | ) | 4.5 | 4.0 | (565 | ) | ||||||||||
Operating income | 5,836 | 14.6 | 14.9 | 5,093 | ||||||||||||
Impairment on financial assets (net) | (2,208 | ) | 1.5 | 1.2 | (2,177 | ) | ||||||||||
Provisions (net) | (394 | ) | (11.1 | ) | (5.8 | ) | (443 | ) | ||||||||
Other gains (losses) | (188 | ) | (48.3 | ) | (48.3 | ) | (365 | ) | ||||||||
Income before tax | 3,046 | 44.4 | 44.2 | 2,109 | ||||||||||||
Income tax | (815 | ) | 44.1 | 49.3 | (566 | ) | ||||||||||
Net income from ongoing operations | 2,231 | 44.5 | 42.5 | 1,544 | ||||||||||||
Results from corporate operations(2) | 727 | — | — | — | ||||||||||||
Net income | 2,958 | 91.6 | 88.9 | 1,544 | ||||||||||||
Non-controlling interests | (200 | ) | (7.3 | ) | 14.3 | (215 | ) | |||||||||
Net attributable profit | 2,759 | 107.7 | 98.3 | 1,328 | ||||||||||||
Net attributable profit (excluding results from corporate operations) | 2,031 | 52.9 | 46.0 | 1,328 | ||||||||||||
Basic earnings per share (euros)(3) | 0.43 | 0.21 | ||||||||||||||
| (1) | Financial statements with the revenues and expenses of the Garanti Group consolidated in proportion to the percentage of the Group’s stake. |
| (2) | 2015 includes the capitral gains from the various sale operations equivalent to 6.34% of BBVA Group’s stake in CNCB and the badwill from Cx operation. |
| (3) | Adjusted by additional Tier I instrument remuneration. |
QuarterlyNTI was below the figure reported for the first quarter, basically due to lower capital gains from portfolio sales. However, the cumulative half-yearly total is higher than in the same period of 2014 due mainly to the positive evolution of the Global Markets unit so far this year.
Thedividends item basically includes the payment by Telefónica in May.
As a result of the above, the Group’sgross income for the first half of the year grew by 11.4% in year-on-year terms (up 10.7% at constant exchange rates) to €11,554m.
| Results | 5 |
Table of Contents
Operating income
Operating expenses continue to be affected by the efforts to keep them in check in Spain, the Rest of Eurasia, and the
Corporate Center, as opposed to their growth in the rest of geographical areas, due to the year-on-year general appreciation of foreign currencies against the euro (though they depreciated over the quarter), and the high inflation in some countries. The
Breakdown of operating expenses and efficiency calculation
(Million euros)
| 1H15 | D% | 1H14 | ||||||||||
Personnel expenses | 2,998 | 9.6 | 2,734 | |||||||||
Wages and salaries | 2,307 | 11.7 | 2,066 | |||||||||
Employee welfare expenses | 440 | 1.9 | 431 | |||||||||
Training expenses and other | 251 | 6.0 | 236 | |||||||||
General and administrative expenses | 2,130 | 7.8 | 1,976 | |||||||||
Premises | 493 | 7.5 | 459 | |||||||||
IT | 428 | 10.9 | 386 | |||||||||
Communications | 130 | (8.1 | ) | 142 | ||||||||
Advertising and publicity | 176 | 1.2 | 174 | |||||||||
Corporate expenses | 48 | 4.0 | 46 | |||||||||
Other expenses | 641 | 12.3 | 571 | |||||||||
Levies and taxes | 214 | 7.1 | 199 | |||||||||
Administration expenses | 5,127 | 8.9 | 4,710 | |||||||||
Depreciation and amortization | 590 | 4.5 | 565 | |||||||||
Operating expenses | 5,718 | 8.4 | 5,275 | |||||||||
Gross income | 11,554 | 11.4 | 10,368 | |||||||||
Efficiency ratio (Operating expenses/gross income, in %) | 49.5 | 50.9 | ||||||||||
| 6 | Group information |
Table of Contents
transformation plans the Group is undertaking in all its units also continue to affect costs. These programs are aimed at boosting alternative sales channels. Thanks to these programs, BBVA is already the leading financial institution in terms of customer satisfaction in Spain, both in mobile banking and online banking, according to the FRS ranking.
There was further improvement in the efficiency ratio (to 49.5% from 50.9% in the first half of 2014), thanks to the strength of revenue lines and control of overall costs, which boostedoperating income over the half-year to €5,836m, 14.6% more than in the same period in 2014.
Provisions and other
Impairment losses on financial assets in the second quarter were slightly below the figure for the previous quarter. By areas, there was a fall in the Eurozone and a limited increase in the rest of the geographical areas very much in line with the increase in activity. Overall, the figure for the half-year is up 1.5% on the same period in 2014.
Transfers toprovisions, which include the cost of the transformation plans, provisions for contingent liabilities and other
commitments, as well as contributions to pension funds, total €394m in the half year (down 11.1% year-on-year).
Other earnings performed well over the half year, largely due to lower impairment losses on real-estate activity and foreclosed or acquired assets in Spain.
Profit
As a result of the above,net income from ongoing operations in the first half of 2015 grew year-on-year by 44.5%.
Theresults from corporate operations line includes the capital gains over the half year (€705m net of taxes) from various sale operations equivalent to 6.34% of BBVA Group’s stake in CNCB (of which 0.8% happened in the second quarter) and the credit of €22m, also net of taxes, for the badwill generated in the Cx deal.
As a result, thenet attributable profit in the second quarter was €1,223m. The cumulative total for the first six months is €2,759m, a figure that is more than double that of the same period in 2014.
| Results | 7 |
Table of Contents
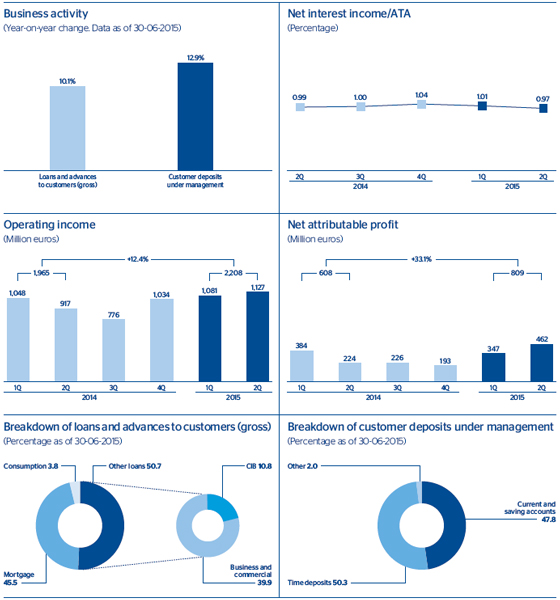
Bybusiness area, banking activity in Spain has contributed €809m, real-estate activity in Spain generated a loss of €300m, the United States contributed €286m, Turkey €174m, Mexico €1,041m, South America €474m (€465m without Venezuela) and the Rest of Eurasia €43m.
BBVA Group excluding Venezuela
For a more uniform comparison (due to the exchange-rate impact), below is the Group’s income statement excluding Venezuela.
Consolidated income statement of BBVA Group excluding Venezuela(1)
(Million euros)
| 1H15 | D% | D% at constant exchange rates | 1H14 | |||||||||||||
Net interest income | 7,427 | 17.9 | 10.8 | 6,298 | ||||||||||||
Net fees and commissions | 2,202 | 11.1 | 4.4 | 1,982 | ||||||||||||
Net trading income | 1,336 | 21.9 | 17.9 | 1,095 | ||||||||||||
Other income/expenses | 462 | 3.7 | 0.2 | 446 | ||||||||||||
Gross income | 11,426 | 16.4 | 9.8 | 9,821 | ||||||||||||
Operating expenses | (5,684 | ) | 12.7 | 6.3 | (5,042 | ) | ||||||||||
Operating income | 5,742 | 20.2 | 13.6 | 4,779 | ||||||||||||
Impairment on financial assets (net) | (2,199 | ) | 4.4 | 0.9 | (2,105 | ) | ||||||||||
Provisions (net) and other gains (losses) | (551 | ) | (28.5 | ) | (29.3 | ) | (771 | ) | ||||||||
Income before tax | 2,992 | 57.3 | 42.6 | 1,902 | ||||||||||||
Income tax | (778 | ) | 58.1 | 43.8 | (492 | ) | ||||||||||
Net income from ongoing operations | 2,215 | 57.0 | 42.2 | 1,410 | ||||||||||||
Results from corporate operations(2) | 727 | — | — | — | ||||||||||||
Net income | 2,942 | 108.6 | 88.9 | 1,410 | ||||||||||||
Non-controlling interests | (192 | ) | 23.5 | 12.7 | (156 | ) | ||||||||||
Net attributable profit | 2,749 | 119.2 | 98.3 | 1,254 | ||||||||||||
Net attributable profit (excluding results from corporate operations) | 2,022 | 61.2 | 45.9 | 1,254 | ||||||||||||
| (1) | Financial statements with the revenues and expenses of the Garanti Group consolidated in proportion to the percentage of the Group’s stake. |
| (2) | 2015 includes the capitral gains from the various sale operations equivalent to 6.34% of BBVA Group’s stake in CNCB and the badwill from Cx operation. |
| 8 | Group information |
Table of Contents
Balance sheet and business activity
The BBVA Group’s business activity and balance sheet as of30-Jun-2015 include the balances from Cx. Not including these, the observed trends are as follows:
| • | General depreciation ofexchange rates against the euro over the quarter. |
| • | Growth ingross lending to customers (up 7.3% since December 2014 at current exchange rates). In Spain, apart from the incorporation of Cx, more new loans have been granted, basically in the retail segment (mortgages, consumer finance and small businesses). At the close of the previous |
year, 1.1 million households are being financed by BBVA in Spain. Also worth noting is the positive trend in funding for SMEs, particularly in Mexico and South America. Of note in this respect is the SME support program “Camino al Éxito” (Road to Success), which was launched in South America at the end of March 2015. |
| • | Increase incustomer deposits in all the areas, in line with previous quarters (up 9.9% year to date also at current exchange rates). In Spain, not including the Cx figures, the decline in the balance of time deposits moderated in the quarter, while current and savings accounts continue to grow. |
Consolidated balance sheet(1)
(Million euros)
| 30-06-15 | D% | 30-06-14 | 31-03-15 | 31-12-14 | ||||||||||||||||
Cash and balances with central banks | 30,192 | 11.0 | 27,210 | 27,553 | 33,908 | |||||||||||||||
Financial assets held for trading | 82,693 | 3.9 | 79,589 | 94,883 | 83,427 | |||||||||||||||
Other financial assets designated at fair value | 3,499 | 17.0 | 2,990 | 3,603 | 3,236 | |||||||||||||||
Available-for-sale financial assets | 107,136 | 16.1 | 92,316 | 101,183 | 98,734 | |||||||||||||||
Loans and receivables | 415,020 | 11.5 | 372,180 | 398,558 | 386,839 | |||||||||||||||
Loans and advances to credit institutions | 29,074 | 4.3 | 27,874 | 33,672 | 28,254 | |||||||||||||||
Loans and advances to customers | 374,888 | 10.6 | 339,063 | 360,265 | 351,755 | |||||||||||||||
Debt securities | 11,058 | 110.9 | 5,243 | 4,622 | 6,831 | |||||||||||||||
Held-to-maturity investments | — | — | — | — | — | |||||||||||||||
Investments in entities accounted for using the equity method | 1,013 | (24.4 | ) | 1,339 | 674 | 661 | ||||||||||||||
Tangible assets | 8,753 | 17.2 | 7,466 | 8,057 | 8,014 | |||||||||||||||
Intangible assets | 9,212 | 12.1 | 8,219 | 9,493 | 8,840 | |||||||||||||||
Other assets | 31,553 | 22.2 | 25,822 | 28,593 | 27,851 | |||||||||||||||
|
|
|
|
|
|
|
|
|
| |||||||||||
Total assets | 689,071 | 11.7 | 617,131 | 672,598 | 651,511 | |||||||||||||||
|
|
|
|
|
|
|
|
|
| |||||||||||
Financial liabilities held for trading | 56,977 | 9.8 | 51,869 | 67,438 | 56,990 | |||||||||||||||
Other financial liabilities designated at fair value | 3,746 | 10.4 | 3,395 | 3,903 | 3,590 | |||||||||||||||
Financial liabilities at amortized cost | 546,480 | 12.2 | 486,889 | 518,819 | 509,974 | |||||||||||||||
Deposits from central banks and credit institutions | 94,763 | 15.9 | 81,772 | 92,547 | 97,735 | |||||||||||||||
Deposits from customers | 363,373 | 13.3 | 320,796 | 339,675 | 330,686 | |||||||||||||||
Debt certificates | 62,299 | (0.6 | ) | 62,645 | 58,259 | 59,393 | ||||||||||||||
Subordinated liabilities | 16,126 | 16.7 | 13,821 | 15,723 | 14,118 | |||||||||||||||
Other financial liabilities | 9,919 | 26.3 | 7,854 | 12,616 | 8,042 | |||||||||||||||
Liabilities under insurance contracts | 10,333 | 0.7 | 10,266 | 11,193 | 10,471 | |||||||||||||||
Other liabilities | 20,538 | 15.1 | 17,846 | 18,879 | 18,877 | |||||||||||||||
|
|
|
|
|
|
|
|
|
| |||||||||||
Total liabilities | 638,074 | 11.9 | 570,264 | 620,232 | 599,902 | |||||||||||||||
|
|
|
|
|
|
|
|
|
| |||||||||||
Non-controlling interests | 1,728 | (15.6 | ) | 2,048 | 1,692 | 2,511 | ||||||||||||||
Valuation adjustments | (2,909 | ) | 35.6 | (2,146 | ) | 327 | (348 | ) | ||||||||||||
Shareholders’ funds | 52,177 | 11.1 | 46,965 | 50,347 | 49,446 | |||||||||||||||
|
|
|
|
|
|
|
|
|
| |||||||||||
Total equity | 50,997 | 8.8 | 46,867 | 52,366 | 51,609 | |||||||||||||||
|
|
|
|
|
|
|
|
|
| |||||||||||
Total equity and liabilities | 689,071 | 11.7 | 617,131 | 672,598 | 651,511 | |||||||||||||||
|
|
|
|
|
|
|
|
|
| |||||||||||
Memorandum item: | ||||||||||||||||||||
Contingent liabilities | 37,812 | 7.7 | 35,098 | 38,923 | 37,070 | |||||||||||||||
| (1) | Financial statements with the assets and liabilities of the Garanti Group consolidated in proportion to the percentage of the Group’s stake. |
| Balance sheet and business activity | 9 |
Table of Contents
Loans and advances to customers
(Million euros)
| 30-06-15 | D% | 30-06-14 | 31-03-15 | 31-12-14 | ||||||||||||||||
Domestic sector | 181,356 | 8.1 | 167,789 | 160,938 | 162,652 | |||||||||||||||
Public sector | 22,998 | (2.7 | ) | 23,637 | 23,106 | 23,362 | ||||||||||||||
Other domestic sectors | 158,358 | 9.9 | 144,152 | 137,832 | 139,290 | |||||||||||||||
Secured loans | 100,443 | 11.3 | 90,270 | 86,144 | 87,371 | |||||||||||||||
Other loans | 57,915 | 7.5 | 53,881 | 51,688 | 51,920 | |||||||||||||||
Non-domestic sector | 186,036 | 14.9 | 161,858 | 191,148 | 180,719 | |||||||||||||||
Secured loans | 78,147 | 18.1 | 66,158 | 79,500 | 72,836 | |||||||||||||||
Other loans | 107,889 | 12.7 | 95,701 | 111,648 | 107,883 | |||||||||||||||
Non-performing loans | 25,766 | 4.9 | 24,554 | 22,787 | 23,164 | |||||||||||||||
Domestic sector | 21,142 | 6.9 | 19,769 | 18,058 | 18,563 | |||||||||||||||
Non-domestic sector | 4,624 | (3.4 | ) | 4,785 | 4,729 | 4,601 | ||||||||||||||
Loans and advances to customers (gross) | 393,158 | 11.0 | 354,202 | 374,873 | 366,536 | |||||||||||||||
Loan-loss provisions | (18,271 | ) | 20.7 | (15,139 | ) | (14,607 | ) | (14,7.81 | ) | |||||||||||
Loans and advances to customers | 374,888 | 10.6 | 339,063 | 360,265 | 351,755 | |||||||||||||||
Customer funds
(Million euros)
| 30-06-15 | D% | 30-06-14 | 31-03-15 | 31-12-14 | ||||||||||||||||
Deposits from customers | 363,373 | 13.3 | 320,796 | 339,675 | 330,686 | |||||||||||||||
Domestic sector | 178,581 | 15.8 | 154,244 | 150,512 | 145,251 | |||||||||||||||
Public sector | 17,851 | 10.4 | 16,176 | 13,142 | 10,651 | |||||||||||||||
Other domestic sectors | 160,729 | 16.4 | 138,069 | 137,370 | 134,600 | |||||||||||||||
Current and savings accounts | 73,247 | 27.9 | 57,278 | 62,783 | 59,509 | |||||||||||||||
Time deposits | 70,270 | 5.3 | 66,744 | 56,571 | 60,783 | |||||||||||||||
Assets sold under repurchase agreement and other | 17,213 | 22.5 | 14,047 | 18,016 | 14,308 | |||||||||||||||
Non-domestic sector | 184,792 | 11.0 | 166,552 | 189,163 | 185,435 | |||||||||||||||
Current and savings accounts | 108,784 | 7.2 | 101,493 | 113,399 | 113,795 | |||||||||||||||
Time deposits | 68,197 | 25.1 | 54,504 | 69,107 | 62,705 | |||||||||||||||
Assets sold under repurchase agreement and other | 7,811 | (26.0 | ) | 10,555 | 6,657 | 8,935 | ||||||||||||||
Other customer funds | 128,323 | 17.9 | 108,841 | 127,364 | 115,275 | |||||||||||||||
Spain | 78,789 | 19.7 | 65,799 | 74,824 | 69,943 | |||||||||||||||
Mutual funds | 32,892 | 27.7 | 25,752 | 30,743 | 28,695 | |||||||||||||||
Pension funds | 23,106 | 8.2 | 21,364 | 22,595 | 21,880 | |||||||||||||||
Customer portfolios | 22,791 | 22.0 | 18,683 | 21,485 | 19,368 | |||||||||||||||
Rest of the world | 49,534 | 15.1 | 43,042 | 52,540 | 45,332 | |||||||||||||||
Mutual funds and investment companies | 26,125 | 13.4 | 23,046 | 26,798 | 24,087 | |||||||||||||||
Pension funds | 6,283 | 37.2 | 4,580 | 6,349 | 5,484 | |||||||||||||||
Customer portfolios | 17,126 | 11.1 | 15,416 | 19,394 | 15,761 | |||||||||||||||
|
|
|
|
|
|
|
|
|
| |||||||||||
Total customer funds | 491,695 | 14.4 | 429,637 | 467,039 | 445,961 | |||||||||||||||
|
|
|
|
|
|
|
|
|
| |||||||||||
| • | The increase innon-performing loans in the quarter is due basically to the incorporation of those from Cx. Not including these, the positive trend seen in previous quarters has been maintained. |
| • | Off-balance-sheet funds continue to perform very favorably, above all in Spain, although they have also increased in the other geographical areas. |
| • | Lastly, the use ofdigital channels continues to increase. At the close of the first half of the year, the Group had 13.5 million digital customers (including Garanti’s), with year-on-year growth of 20.6%. Of these, 7.0 million access these channels from mobile devices. |
| 10 | Group information |
Table of Contents
Capital base
BBVA ended thefirst half of 2015 with comfortable capital levels clearly above the minimum regulatory requirements, and a leverage ratio (fully-loaded) that continues to compare very favorably with the rest of its peer group. The highlights in the period, apart from the incorporation of Cx, were the following:
| • | New “dividend option” program in April for 13 cents of euro gross per share, which was highly successful: 90.3% of shareholders chose to receive bonus BBVA shares, which resulted in the issue of 80,314,074 new ordinary shares, totaling a share capital increase with a nominal value of €39,353,896.26. |
| • | Distribution to shareholders on July 16th of acash amount of 8 cents of euro gross per share, which has involved a disbursement of €504.4m. |
| • | Issue of subordinated debt by BBVA Compass and BBVA Colombia for USD 700 million and USD 400 million, respectively. |
| • | Exercise of the earlyrepayment option for eight issues of preferred debt and eight subordinated debt issues subject to grandfathering. |
| • | Lastly, increase in risk weighted assets –RWA– (up 1.6% in the quarter and up 0.6% over the year). During the quarter, impacts such as increased lending activity outside Spain and the incorporation of Cx have been offset by the general depreciation of currencies, as well as by the sale of BBVA Group’s stake in CNCB and the switch to advanced models of the portfolios from Unnim. |
| • | These factors, together with the other impacts of CET1 (organic growth and declines due to exchange rates), bring the phased-incore capital ratio to 12.3% (10.4% fully-loaded). |
| • | BBVA Group continues to maintain a highleverage ratio (6.2% using phased-in criterion). |
Ratings
After the publication byMoody’s of the new bank rating methodology on March 16, the agency has upgraded by one notch the rating for the senior unsecured debt issued by BBVA from Baa2 to Baa1, with a stable outlook (1 notch above Spain’s sovereign rating), and the rating for BBVA’s deposits by two notches, from Baa2 to A3, also with a stable outlook, as was anticipated in the first quarter.
Ratings
| Long term | Short term | Outlook | ||||||||||
| DBRS | A | R-1 (low) | Stable | |||||||||
| Fitch | A– | F-2 | Stable | |||||||||
| Moody’s | Baa1 | P-2 | Stable | |||||||||
| Scope Ratings | A | S-1 | Stable | |||||||||
| Standard & Poor’s | BBB | A-2 | Stable | |||||||||
Capital base
(Million euros)
| CRD IV phased-in | ||||||||||||||||||||
| 30-06-15 | 31-03-15 | 31-12-14 | 30-09-14 | 30-06-14 | ||||||||||||||||
Common equity Tier I | 43,422 | 43,995 | 41,832 | 40,422 | 38,978 | |||||||||||||||
Capital (Tier I) | 43,422 | 43,995 | 41,832 | 40,422 | 38,978 | |||||||||||||||
Other eligible capital (Tier II) | 11,276 | 10,686 | 10,986 | 10,893 | 10,421 | |||||||||||||||
Capital base | 54,698 | 54,681 | 52,818 | 51,316 | 49,399 | |||||||||||||||
Risk-weighted assets | 352,782 | 347,096 | 350,803 | 345,381 | 336,584 | |||||||||||||||
Total ratio (%) | 15.5 | 15.8 | 15.1 | 14.9 | 14.7 | |||||||||||||||
CET1 (%) | 12.3 | 12.7 | 11.9 | 11.7 | 11.6 | |||||||||||||||
Tier I (%) | 12.3 | 12.7 | 11.9 | 11.7 | 11.6 | |||||||||||||||
Tier II (%) | 3.2 | 3.1 | 3.1 | 3.2 | 3.1 | |||||||||||||||
| Solvency | 11 |
Table of Contents
Credit risk
In thefirst half of 2015 the main variables related to the Group’s credit risk management have been positive. The increase in credit risk and non-performing loans, as well as the performance of the main risk indicators, have been affected by the incorporation of Cx. On a comparable basis, the general tone remains positive.
| • | The Group’scredit risk has increased by 4.2% in the quarter (down 1.9% excluding Cx) and 6.7% in the semester. |
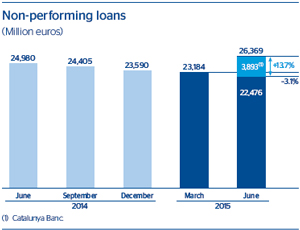
| • | Non-performing loans amount to €26,369m. Excluding those from Cx, this heading declined 3.1% in the quarter to €22,476m, mainly from the business in Spain and Europe. |
Credit risks(1)
(Million euros)
| 30-06-15 | 31-03-15 | 31-12-14 | 30-09-14 | 30-06-14 | ||||||||||||||||
Non-performing loans and contingent liabilities | 26,369 | 23,184 | 23,590 | 24,405 | 24,980 | |||||||||||||||
Credit risks | 430,870 | 413,687 | 403,633 | 397,952 | 389,355 | |||||||||||||||
Provisions | 18,909 | 15,002 | 15,157 | 15,335 | 15,515 | |||||||||||||||
NPL ratio (%) | 6.1 | 5.6 | 5.8 | 6.1 | 6.4 | |||||||||||||||
NPL coverage ratio (%) | 72 | 65 | 64 | 63 | 62 | |||||||||||||||
NPL ratio (%) (excluding Cx) | 5.5 | — | — | — | — | |||||||||||||||
NPL coverage ratio (%) (excluding Cx) | 65 | — | — | — | — | |||||||||||||||
| (1) | Include gross customer lending plus contingent exposures. |
Non-performing loans evolution
(Million euros)
| 2Q15 | 1Q15 | 4Q14 | 3Q14 | 2Q14 | ||||||||||||||||
Beginning balance | 23,184 | 23,590 | 24,405 | 24,980 | 25,445 | |||||||||||||||
Entries | 2,223 | 2,359 | 2,363 | 2,429 | 2,092 | |||||||||||||||
Recoveries | (1,643 | ) | (1,751 | ) | (1,935 | ) | (1,840 | ) | (1,781 | ) | ||||||||||
Net variation | 580 | 608 | 427 | 589 | 311 | |||||||||||||||
Write-offs | (1,105 | ) | (1,152 | ) | (1,248 | ) | (1,297 | ) | (961 | ) | ||||||||||
Exchange rate differences and other | 3,709 | 138 | 5 | 133 | 185 | |||||||||||||||
Period-end balance | 26,369 | 23,184 | 23,590 | 24,405 | 24,980 | |||||||||||||||
Memorandum item: | ||||||||||||||||||||
Non-performing loans | 25,766 | 22,787 | 23,164 | 23,983 | 24,554 | |||||||||||||||
Non-performing contingent liabilities | 602 | 398 | 426 | 422 | 426 | |||||||||||||||
| 12 | Group information |
Table of Contents
| • | 26.0% increase inloan-loss provisions since the end of March and 24.8% since the end of 2014. Not including Cx, there was a 2.4% decline since 31-Mar-2015. |
| • | As a result, theNPA and coverage ratios are up in the quarter. On a uniform basis, the trend in the NPA and coverage ratios is favorable, since the NPA ratio fell by 7 basis points, while the coverage ratio increased 0.4 percentage points against the close of March. |
| • | Lastly, improvement in thecost of risk (1.16% accumulated to June 2015, compared with 1.21% in the previous quarter). |
Structural risks
Liquidity and funding
Management ofliquidity and funding aims to finance the recurring growth of the banking business at suitable maturities and costs, using a wide range of instruments that provide access to a large number of alternative sources of finance.
A core principle in BBVA’s management of the Group’s liquidity and funding is the financial independence of its banking subsidiaries abroad. This principle prevents the propagation of a liquidity crisis among the Group’s different areas and ensures that the cost of liquidity is correctly reflected in price formation.
In thesecond quarter of 2015, the liquidity conditions have remained comfortable across BBVA’s global footprint:
| • | The fourth TLTRO auction was held in June, at which BBVA borrowed €4,000m. |
| • | The long-term wholesale funding markets have remained stable in Europe and in the other geographical areas where the Group operates. |
| • | Short-term funding has also continued to perform extremely well, in a context marked by a high level of liquidity. |
| • | In general, the financial soundness of the Group’s banks is based on the funding of lending activity, basically through the use of customer funds. |
Foreign exchange
Foreign-exchange risk management of BBVA’s long-term
investments, basically stemming from its franchises abroad, aims
to preserve the Group’s capital adequacy ratios and ensure the stability of its income statement.
Thesecond quarter of the year was characterized by the volatility of the currencies of emerging economies, affected by weak global growth. In this context, BBVA has maintained a policy of actively hedging its investments in Mexico, Chile, Colombia, Turkey and the dollar area. In addition to this corporate-level hedging, dollar positions are held at a local level by some of the subsidiary banks. The foreign-exchange risk of the earnings expected from abroad for 2015 is also managed.
Interest rate
The aim of managing this risk is to maintain sustained growth of net interest income in the short and medium term, irrespective of interest-rate fluctuations.
In thesecond quarter of 2015, the results of this management have been satisfactory, with limited risk strategies in Europe, the United States and Mexico. The amount of NTI generated in these geographical regions is the result of prudent portfolio management strategies, particularly in terms of sovereign debt, in a context marked by low interest rates.
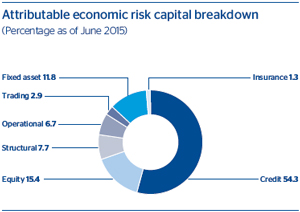
Economic capital
Attributable economic risk capital (ERC) consumption at the end of June stood at €31,071m, up 0.8% in the quarter. The most significant aspect in the period has been the increase in ERC as a result of the integration of Cx (affecting mainly credit and fixed-asset risk).
| Risk management | 13 |
Table of Contents
In the first half of 2015, theglobal economy slowed its pace of growth due to the contraction of activity in the United States, considered to be temporary, and the slowdown of the main emerging economies. This has taken place against a backdrop of a steady upturn in financial volatility, some geopolitical tension, the gradual recovery of inflation rates and accommodative monetary policies, in the lead-up to the start of interest-rate rises in the United States.
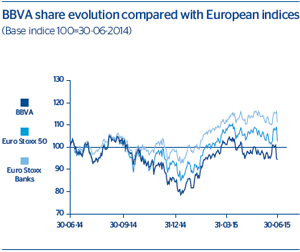
The mainstock-market indices ended the period with gains so far this year (+4.8% for the Ibex 35, +8.8% for Euro Stoxx 50 and +0.2% for the S&P 500), although there were falls over the quarter (–6.5% for the Ibex 35, –7.4% for the Euro Stoxx 50 and –0.2% for the S&P 500). At the industry level, Euro Stoxx Banks lost 4.9% over the quarter, though it posted cumulative gains of 11.4% in 2015. However, the S&P Regional Banks in the U.S. posted a quarterly gain of 4.6% and 3.7% as a cumulative total for the year so far.
TheBBVA share closed on June 30, 2015 at €8.79 (+11.9% in 2015 and –6.5% since March), with a better evolution than the Euro Stoxx 50 (both in the year to date and over the quarter), and also the Ibex 35 since the end of 2014. Its weighting in the Ibex 35 and the Euro Stoxx 50 has increased slightly with respect to the previous quarter, to 10.58% in the Ibex 35 and 2.54% in the Euro Stoxx 50.
The BBVA share and share performance ratios
| 30-06-15 | 31-03-15 | |||||||
Number of shareholders | 940,619 | 944,631 | ||||||
Number of shares issued | 6,305,238,012 | 6,224,923,938 | ||||||
Maximum price (euros) | 9.77 | 9.60 | ||||||
Minimum price (euros) | 8.51 | 7.21 | ||||||
Closing price (euros) | 8.79 | 9.41 | ||||||
Book value per share (euros) | 8.28 | 8.09 | ||||||
Market capitalization (million euros) | 55,436 | 58,564 | ||||||
Price/book value (times) | 1.1 | 1.2 | ||||||
PER (Price/earnings; times) | 15.1 | 15.9 | ||||||
Yield (Dividend/price; %) (1) | 4.2 | 4.3 | ||||||
| (1) | Calculated by dividing the median of the forecast dividend per share of a consensus of analysts by the BBVA share price at the end of each quarter. |
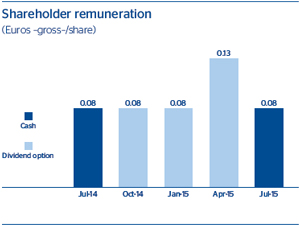
With respect toshareholder remuneration, apart from the execution in April of the new “dividend option” program (see section on Solvency), the Board of Directors of BBVA agreed on July 1st the distribution of an amount of 8 cents of euro gross for each of the outstanding shares, paid on July 16, 2015.
| 14 | Group information |
Table of Contents
The highlights of the period in terms of responsible banking were as follows:
| • | Creation of aunit specifically dedicated to responsible banking (Responsible Business). The unit allows BBVA to enhance the integration of all aspects related to responsible banking into the business and its relations with the different stakeholders, while reaffirming its commitment to make people the focus of its strategy. |
| • | The presentation of the2014 Social Impact Report of BBVA in Spain, which explains simply and directly the Bank’s influence on society and shows how its products and services are improving the lives of people across the age spectrum, from financial literacy programs for children and scholarships for young people to finance for adults and pension plans. It also stresses two issues that are of concern to the general population: housing and unemployment. BBVA has adopted a social housing policy that has prevented the most vulnerable families from being left without a home. With respect to the labor market, over 100,000 jobs, accounting for 0.6% of the occupied active population in Spain, are linked to BBVA’s activity. |
In addition, BBVA has renewed its place on the Ethibel Excellence, Euronext Vigeo (Eurozone and Europe) and MSCI Globalsustainability indices.
TCR Communication
BBVA has anticipated the risk warning light for financial products proposed by the Securities Exchange Commission (CNMV), developingTCR leaflets to explain the vast majority of its financial products (90%) clearly and fully.
Financial Literacy
For the second year in a row,BBVA Bancomer has won the award for Best Financial Literacy Program for Children at the EIFLE Awards organized by the Institute for Financial Literacy. Since the launch of “Valores de Futuro” (Future Values), more than 100,000 workshops have been run, benefiting over 25,000 children and young people.
BBVA Compass has taken a further step to improve people’s financial future with the launch of two websites: Money Fit and Great Ideas for Small Businesses.
Products with a high social impact
BBVA has signed an agreement with theEuropean Investment Bank (EIB) to help kick-start the economy and boost job creation in Spain. It consists of a credit line of €1 billion to help finance SMEs.
BBVA Colombia has joined the “40,000 Primeros Empleos” (40,000 First Jobs) program, a Colombian government initiative that aims to help young people find their first job.
Momentum Project Spain is into its fifth year. The 15 entrepreneurship projects selected will have access to a training program, strategic mentoring and finance which will help them improve their projects, multiply their impact and develop sustainable business models.
BBVA has called for applications for a new edition of theBBVA Open Talent awards, which recognize innovative startups that are transforming financial services, or are linked to security, user experience or big data.
BBVA Suma has launched a donation campaign to collaborate with Nepal.
Society
Education for society
TheBBVA Bancomer Foundation and the National Institute for Adult Education (INEA) have concluded an agreement to work together on the National Campaign for Literacy and Defeat of Educational Backwardness.
Ruta BBVA has presented its 30th edition. This year, the 176 participants will travel through Spain and Colombia on a route called an “adventure to the emerald country”.
The environment
BBVA has joined theSpanish Green Growth Group, a public-private partnership platform that aims to make joint progress in the fight against climate change and toward a low-carbon economy. In May, the Group presented the Barcelona Declaration, a document that includes 10 recommendations designed to create an appropriate environment for transforming the potential of a low-carbon economy into economic growth and employment.
Through theDigitization & NFT (New Forms of Work) project, the Bank in Spain has got rid of paper equivalent to 350 tons.
Science and Culture
The BBVA Foundation has held the 7thFrontiers of Knowledge Awards, which recognize people who have made particularly significant progress in a wide range of areas.
The team
BBVA has been named one of theBest Companies to Work For in Latin America in 2015 in the annual ranking prepared by Great Place to Work. The overall recognition has been achieved thanks to the local awards received in Argentina, Chile, Mexico, Paraguay, Peru and Venezuela.
TheTerritorios Solidarios program, now in its fourth year, aims to continue encouraging the greatest possible participation among employees resident in Spain to carry out projects headed up by non-profit organizations.
| Responsible banking | 15 |
Table of Contents
This section presents and analyzes the most relevant aspects of the Group’s different areas. Specifically, it shows a summary of the income statement and balance sheet, data on business activity and the most significant ratios in each of them.
In 2015 changes have been made to thereporting structure of BBVA Group’s business areas with respect to that in place during 2014. Due to the agreement to increase of the stake in the Turkish bank Garanti to 39.9%, its balance sheet and earnings are presented separately from the rest of Eurasia. Thus, the business areas are:
| • | Banking activity in Spain includes, as in previous years, the Retail Network, Corporate and Business Banking (CBB), Corporate & Investment Banking (CIB), BBVA Seguros and Asset Management. It also includes the portfolios, funding and structural interest-rate positions of the euro balance sheet. And from April 24th brings together the activity, balance sheet and results of Cx banking business. |
| • | Real-estate activity in Spain basically covers lending to real-estate developers and foreclosed real-estate assets in the country (including those coming from Cx). |
| • | TheUnited States encompasses the business conducted by the Bank in that country through BBVA Compass, the office in New York and the US companies Simple and Spring Studio bought in February 2014 and April 2015 respectively as part of BBVA’s strategy to lead the technological transformation of the financial industry. |
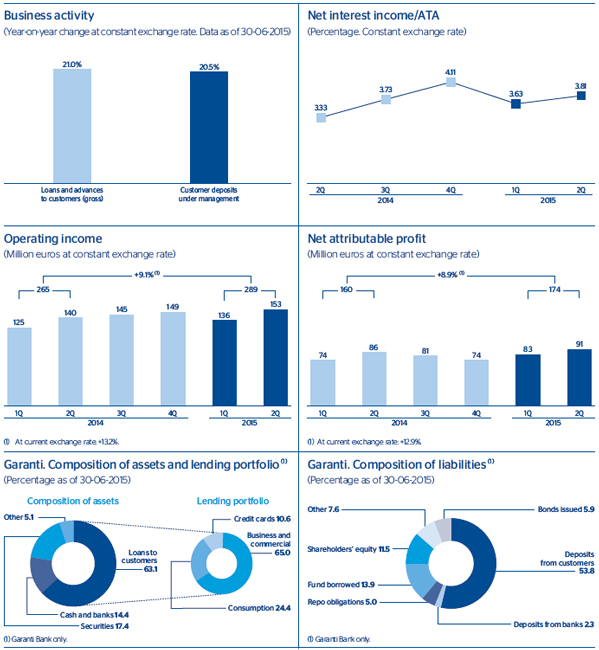
| • | Turkey includes BBVA’s stake in the Turkish bank Garanti (25.01%, as the additional 14.89% will follow in the third quarter of 2015. |
| • | Mexico includes the banking and insurance businesses in the country. |
| • | South America includes the banking and insurance businesses that BBVA carries out in the region. |
| • | Therest of Eurasia includes the business carried out in the rest of Europe and Asia, i.e. the Group’s retail and wholesale businesses in the area. |
In addition to the above, all the areas include a remainder made up of other businesses and a supplement that includes deletions and allocations not assigned to the units making up the above areas.
Lastly, theCorporate Center is an aggregate that contains the rest of the items that have not been allocated to the business areas, as it basically corresponds to the Group’s holding function. It includes: the costs of the head offices that have a corporate function; management of structural exchange-rate positions; specific issues of capital instruments to ensure adequate management of the
Group’s global solvency; portfolios and their corresponding results, whose management is not linked to customer relations, such as industrial holdings; certain tax assets and liabilities; funds due to commitments with employees; goodwill and other intangibles. It also comprises the result from certain corporate operations carried out by the Group that are commented at various points in this report.
In addition to this geographical breakdown,supplementary information is provided for all the wholesale businesses carried out by BBVA, i.e. Corporate & Investment Banking (CIB). This aggregate business is considered relevant to better understand the Group because of the characteristics of the customers served, the type of products offered and the risks assumed.
Lastly, as usual, in the case of the Americas and Turkey the results of applying constantexchange rates are given in addition to the variations at current exchange rates.
The Group compilesinformation by areas based on units at the lowest level, and all the data related to the business they manage is recorded in full. These basic units are then aggregated in accordance with the organizational structure established by the Group for higher-level units and, finally, the business areas themselves. Similarly, all the companies making up the Group are also assigned to the different units according to the geographical area in which they carry out their activity.
Once the composition of each business area has been defined, certainmanagement criteria are applied, of which the following are particularly important:
| • | Capital. Capital is allocated to each business according to ERC criteria. This is based on the concept of unexpected loss at a specific confidence level, depending on the Group’s capital adequacy targets. The calculation of the ERC combines credit risk, market risk, structural balance-sheet risk, equity positions, operational risk, fixed-asset risk and technical risks in the case of insurance companies. These calculations are carried out using internal models that have been defined following the guidelines and requirements established under the Basel III capital accord, with economic criteria taking precedence over regulatory ones. |
ERC is risk-sensitive and thus linked to the management policies of the businesses themselves. It standardizes capital allocation among them in accordance with the risks incurred. In other words, it is calculated in a way that is standard and integrated for all kinds of risks and for each operation, balance or risk position, allowing its risk-adjusted return to be assessed and an aggregate to be calculated for profitability by client, product, segment, unit or business area.
| • | Internal transfer prices. BBVA Group has a transfer prices system whose general principles apply in the Bank’s different |
| 16 | Business areas |
Table of Contents
entities, business areas and units. Within each geographical area, internal transfer rates are established to calculate the net interest income of its businesses, under both the asset and liability headings. These rates consist of a reference rate (an index whose use is generally accepted on the market) that is applied based on the transaction’s revision period or maturity, and a liquidity premium, i.e. a spread, that is established based on the conditions and outlook of the financial markets in this respect. There are also agreements for the allocation of earnings between the product-generating units and the distribution units. |
| • | Allocation of operating expenses. Both direct and indirect costs are allocated to the business areas, except where there is no clearly defined relationship with the businesses, i.e. when they are of a clearly corporate or institutional nature for the Group as a whole. |
| • | Cross-selling. In some cases, consolidation adjustments are made to eliminate double entries in the results of two or more units as a result of cross-selling incentives between businesses. |
Mayor income statement items by business area
(Million euros)
| Business areas | ||||||||||||||||||||||||||||||||||||||||
| BBVA Group (1) | Banking activity in Spain | Real-estate activity in Spain | The United States | Turkey (1) | Mexico | South America | Rest of Eurasia | S Business areas | Corporate Center | |||||||||||||||||||||||||||||||
1H15 | ||||||||||||||||||||||||||||||||||||||||
Net interest income | 7,521 | 1,982 | (14 | ) | 881 | 425 | 2,734 | 1,652 | 85 | 7,746 | (225 | ) | ||||||||||||||||||||||||||||
Gross income | 11,554 | 3,711 | (56 | ) | 1,332 | 510 | 3,558 | 2,297 | 265 | 11,617 | (63 | ) | ||||||||||||||||||||||||||||
Operating income | 5,836 | 2,208 | (125 | ) | 449 | 289 | 2,248 | 1,283 | 89 | 6,441 | (605 | ) | ||||||||||||||||||||||||||||
Income before tax | 3,046 | 1,152 | (437 | ) | 390 | 219 | 1,380 | 927 | 66 | 3,698 | (652 | ) | ||||||||||||||||||||||||||||
Net attributable profit | 2,759 | 809 | (300 | ) | 286 | 174 | 1,041 | 474 | 43 | 2,528 | 230 | |||||||||||||||||||||||||||||
1H14 | ||||||||||||||||||||||||||||||||||||||||
Net interest income | 7,038 | 1,869 | (22 | ) | 693 | 314 | 2,354 | 2,061 | 95 | 7,363 | (325 | ) | ||||||||||||||||||||||||||||
Gross income | 10,368 | 3,384 | (118 | ) | 1,037 | 442 | 3,134 | 2,362 | 463 | 10,703 | (335 | ) | ||||||||||||||||||||||||||||
Operating income | 5,093 | 1,965 | (193 | ) | 324 | 255 | 1,980 | 1,317 | 298 | 5,945 | (852 | ) | ||||||||||||||||||||||||||||
Income before tax | 2,109 | 868 | (661 | ) | 266 | 196 | 1,188 | 956 | 253 | 3,066 | (957 | ) | ||||||||||||||||||||||||||||
Net attributable profit | 1,328 | 608 | (465 | ) | 196 | 155 | 900 | 481 | 208 | 2,083 | (755 | ) | ||||||||||||||||||||||||||||
| (1) | Financial statements with the revenues and expenses of the Garanti Group consolidated in proportion to the percentage of the Group’s stake. |
Breakdown of gross income, operating income and net attributable profit by geography(1)
(1H15. Percentage)
| Banking activity in Spain | Spain (2) | The United States | Turkey | Mexico | South America | Rest of Eurasia | ||||||||||||||||||||||
Gross income | 31.9 | 31.5 | 11.5 | 4.4 | 30.6 | 19.8 | 2.3 | |||||||||||||||||||||
Operating income | 34.3 | 32.3 | 7.0 | 4.5 | 34.9 | 19.9 | 1.4 | |||||||||||||||||||||
Net attributable profit | 32.0 | 20.1 | 11.3 | 6.9 | 41.2 | 18.8 | 1.7 | |||||||||||||||||||||
| (1) | Excludes the Corporate Center. |
| (2) | Including real-estate activity in Spain. |
| Business areas | 17 |
Table of Contents
| Highlights | ||||||||||
• |
Integration of Cx since April 24. | |||||||||
• |
Continuing growth in origination of new loans. | |||||||||
• |
Very favorable trend in all revenue items. | |||||||||
• |
Good performance of risk indicators. | |||||||||
| 18 | Business areas |
Table of Contents
Macro and industry trends
The recovery in the Spanisheconomy is becoming more firmly established thanks to factors that are both external (stimulus measures by the European Central Bank (ECB), depreciation of the euro over the year and a reduction in the price of oil) and domestic (increased confidence in the private sector, incipient recovery of the real-estate market, job creation and a less restrictive fiscal policy).
In thebanking system, the trend in recovery over the last few months continues. The total figure of non-performing loans continues to fall and the NPA ratio is still improving (with information of the Bank of Spain available as of May 2015 it stands at 11.4%, the best figure since May 2013). In activity, the deleveraging process is still underway (the volume of loans is down 4.6% year-on-year, also according to Bank of Spain data available as of May 2015), despite the fact that the flow of new loans continues to improve (up 18.0% year-on-year as of May 2015).
Activity
The purchase ofCatalunya Banc was completed on April 24. As of June 30, this bank contributed €23,459m to the loan book and €29,555m in customer funds.
As a result,the loan book in the area increased by 12.9% in the year so far and 13.5% over the quarter. Excluding the effect of the change in the basis of comparison due to Cx, the rate of year-on-year decline in gross customer lending is continuing to level off every quarter (down 0.6% since December 2014), thanks to the good performance of new loans, above all to the retail sector (mortgages, consumer finance and small businesses).
With respect toasset quality, the incorporation of Cx has led to an increase in non-performing loans, and as a result a rise in the NPA ratio, but also an increased coverage ratio. On a comparable basis, there was a notable reduction in NPA flows over the quarter, thanks to the limitation of gross additions and a good rate of recoveries. As a result, the NPA ratio improved by 4 basis points over the quarter, with a stable coverage ratio compared with the data as of the close of March 2015 (up 0.8 percentage points compared with the figure for 31-Mar-2015).
Growth in customerdeposits under management since December 2014 of 15.6% (up 17.2% over the quarter). Excluding the Cx data, there has been a fall of 2.5% due to the reduction
Financial statements and relevant business indicators
(Million euros and percentage)
Income statement | 1H15 | D% | 1H14 | |||||||||
Net interest income | 1,982 | 6.1 | 1,869 | |||||||||
Net fees and commissions | 810 | 10.5 | 733 | |||||||||
Net trading income | 675 | 5.0 | 642 | |||||||||
Other income/expenses | 244 | 74.2 | 140 | |||||||||
Gross income | 3,711 | 9.7 | 3,384 | |||||||||
Operating expenses | (1,503 | ) | 5.9 | (1,419 | ) | |||||||
Personnel expenses | (869 | ) | 1.4 | (857 | ) | |||||||
General and administrative expenses | (578 | ) | 13.4 | (510 | ) | |||||||
Depreciation and amortization | (56 | ) | 6.9 | (52 | ) | |||||||
Operating income | 2,208 | 12.4 | 1,965 | |||||||||
Impairment on financial assets (net) | (775 | ) | (9.7 | ) | (859 | ) | ||||||
Provisions (net) and other gains (losses) | (280 | ) | 17.6 | (238 | ) | |||||||
Income before tax | 1,152 | 32.8 | 868 | |||||||||
Income tax | (341 | ) | 32.3 | (258 | ) | |||||||
Net income | 811 | 33.0 | 610 | |||||||||
Non-controlling interests | (2 | ) | 9.0 | (2 | ) | |||||||
Net attributable profit | 809 | 33.1 | 608 | |||||||||
Balance sheet | 30-06-15 | D% | 30-06-14 | |||||||||
Cash and balances with central banks | 7,922 | 35.8 | 5,835 | |||||||||
Financial assets | 122,872 | 9.7 | 112,019 | |||||||||
Loans and receivables | 216,897 | 11.2 | 195,026 | |||||||||
Loans and advances to customers | 187,962 | 8.4 | 173,370 | |||||||||
Loans and advances to credit institutions and other | 28,936 | 33.6 | 21,656 | |||||||||
Inter-area positions | 1,260 | (80.7 | ) | 6,521 | ||||||||
Tangible assets | 701 | (5.0 | ) | 738 | ||||||||
Other assets | 2,290 | 37.6 | 1,665 | |||||||||
|
|
|
|
|
| |||||||
Total assets/liabilities and equity | 351,943 | 9.4 | 321,805 | |||||||||
|
|
|
|
|
| |||||||
Deposits from central banks and credit institutions | 61,816 | 13.4 | 54,519 | |||||||||
Deposits from customers | 187,968 | 15.9 | 162,241 | |||||||||
Debt certificates | 43,677 | (9.5 | ) | 48,275 | ||||||||
Subordinated liabilities | 2,202 | (0.1 | ) | 2,204 | ||||||||
Inter-area positions | — | — | — | |||||||||
Financial liabilities held for trading | 41,361 | (3.1 | ) | 42,694 | ||||||||
Other liabilities | 6,220 | 70.5 | 3,647 | |||||||||
Economic capital allocated | 8,698 | 5.8 | 8,223 | |||||||||
Relevant business indicators | 30-06-15 | 31-03-15 | 30-06-14 | |||||||||
Loans and advances to customers (gross) | 196,615 | 173,234 | 178,656 | |||||||||
Customer deposits under management(1) | 159,725 | 136,250 | 141,510 | |||||||||
Mutual funds | 32,892 | 30,743 | 25,752 | |||||||||
Pension funds | 23,106 | 22,595 | 21,364 | |||||||||
Efficiency ratio (%) | 40.5 | 39.5 | 41.9 | |||||||||
NPL ratio (%) | 6.8 | 5.9 | 6.3 | |||||||||
NPL coverage ratio (%) | 62 | 46 | 44 | |||||||||
Cost of risk (%) | 0.86 | 0.99 | 0.97 | |||||||||
| (1) | Excluding repos. |
| Banking activity in Spain | 19 |
Table of Contents
in the balance of funds in time deposits (down 8.8%) and their transfer to current and savings accounts (up 11.1%) and mutual funds (up 7.7%), as mentioned in recent quarters. It is also worth noting that the rate of decline in time deposits has slowed this quarter.
Results
The incorporation of Cx affects the different lines in the area’s income statement, but the effect is practically neutral at the level of net attributable profit. The most significant aspects in the half year are as follows:
Positive trend inmore recurring revenue:
| • | Year-on-year growth in net interest income (up 6.1% with the figures of Cx and up 3.1% on a comparable basis), basically due to cheaper deposits, both retail (reduction in the cost of deposits) and wholesale. As a result, customer spreads barely moved in the quarter, despite the abundance of liquidity in the system and to the fact that the average yield on assets is strongly influenced by the trend in interest rates. |
| • | Good performance of income from fees and commissions (up 10.5% year-on-year including Cx and up 6.3% not including those from Cx), the best figure in the last six quarters, despite the regulatory limitations |
currently in place governing credit cards and pension fund management. This positive performance is determined by the excellent trend in fees and commissions from funds, both in terms of the volume under management and their mix, and by the plans underway to improve this revenue heading. |
Greater contribution ofNTI than in the first half of 2014, mainly due to the positive performance of the Global Markets unit.
Growth ofoperating expenses (up 5.9%) although below the figure for gross income (up 9.7%) as a consequence of the inclusion of Cx and the related integration costs. On a comparable basis, expenses continue in check (down 0.3% year-on-year).
Impairment losses on financial assets continue the declining trend of previous quarters. They have fallen by 9.7% in year-on-year terms and 15.8% over the quarter. As a result the cumulative cost of risk for the half-year has fallen to 0.86%.
Provisions (net) and other gains/losses are in line with expectations. This heading includes the costs derived from the transformation process, as mentioned in previous quarters.
As a result, thenet attributable profit generated by banking activity in Spain in the first half of 2015 was €809m, a year-on-year increase of 33.1%.
| 20 | Business areas |
Table of Contents
| Highlights | ||||||||||
• |
Integration of Cx real-estate activities since April 24. | |||||||||
• |
Stabilization of prices. | |||||||||
• |
Negative contribution to earnings continues to decline. | |||||||||
Industry trends
The increase in new loan production has begun to support the moderate recovery inhome sales, which in the first five months of 2015 grew year-on-year by 4.7%. The improved demand is resulting in an increase in construction activity (new home starts are 30% up on 2014) and is contributing to the stabilization of prices.
Exposure
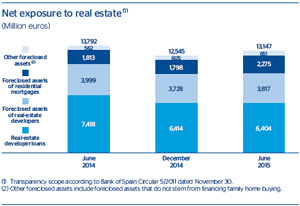
BBVA continues with the strategy of reducing its netexposure to the real-estate sector in Spain. However, with the incorporation of Cx, the net exposure of the group in Spain as of 30-Jun-2015 stood at €13,147m, up 5.6% in the quarter and 4.8% since 31-Dec-2014.
Non-performing loans, excluding those from Cx, have fallen again over the quarter, with new additions to NPA remaining in check over the period. Including Cx’s, NPLs increased 1.6% since the end of March (+0.9% if in addition, substandard volumes are taken into consideration). Thus, the coverage of NPLs and substandard loans was 55% as of 30-Jun-2015. In terms of the total real-estate exposure, including the outstanding loans to developers, foreclosed assets and other BBVA and Cx assets, the coverage ratio stands at 50%.
Sales of real-estate assets in the quarter (excluding Cx) totaled 2,414 units, or 5,465 if the sales of developer assets on the balance-sheet are added to this sum. In the second quarter of 2015, the number of sales increased on the previous quarter by 33%, although it is still at figures that are very similar to those of the same period in 2014 (down 3.8%). Progress continues in the shift in strategy begun in 2014 for selective sales that prioritize profitability.
Coverage of real-estate exposure in Spain
(Million of euros as of 30-06-15)
| Risk amount | Provision | % Coverage over risk | ||||||||||
NPL + Substandard | 8,212 | 4,533 | 55 | |||||||||
NPL | 7,213 | 4,212 | 58 | |||||||||
Substandard | 999 | 321 | 32 | |||||||||
Foreclosed real-estate and other assets | 15,223 | 8,480 | 56 | |||||||||
From real-estate developers | 9,140 | 5,323 | 58 | |||||||||
From dwellings | 4,815 | 2,540 | 53 | |||||||||
Other | 1,268 | 617 | 49 | |||||||||
|
|
|
|
|
| |||||||
Subtotal | 23,435 | 13,013 | 56 | |||||||||
|
|
|
|
|
| |||||||
Performing | 2,725 | — | — | |||||||||
With collateral | 2,413 | |||||||||||
Finished properties | 1,880 | |||||||||||
Construction in progress | 299 | |||||||||||
Land | 234 | |||||||||||
Without collateral and other | 312 | |||||||||||
Real-estate exposure | 26,160 | 13,013 | 50 | |||||||||
| Real-estate activity in Spain | 21 |
Table of Contents
Results
BBVA’s real-estate business in Spain registered aloss of €300m in the first half of 2015 (including
Cx), lower than the figure of €465m on the same period in 2014, basically due to the reduced need for loan-loss and real-estate provisions, as well as improved results from sales.
Financial statements
(Million euros)
Income statement | 1H15 | D% | 1H14 | |||||||||
Net interest income | (14 | ) | (35.1 | ) | (22 | ) | ||||||
Net fees and commissions | 1 | 57.8 | 1 | |||||||||
Net trading income | 2 | n.m. | 0 | |||||||||
Other income/expenses | (45 | ) | (53.9 | ) | (97 | ) | ||||||
Gross income | (56 | ) | (52.6 | ) | (118 | ) | ||||||
Operating expenses | (69 | ) | (8.2 | ) | (75 | ) | ||||||
Personnel expenses | (36 | ) | (8.7 | ) | (40 | ) | ||||||
General and administrative expenses | (21 | ) | (12.6 | ) | (24 | ) | ||||||
Depreciation and amortization | (12 | ) | 2.5 | (12 | ) | |||||||
Operating income | (125 | ) | (35.3 | ) | (193 | ) | ||||||
Impairment on financial assets (net) | (116 | ) | (8.1 | ) | (126 | ) | ||||||
Provisions (net) and other gains (losses) | (196 | ) | (42.5 | ) | (341 | ) | ||||||
Income before tax | (437 | ) | (33.9 | ) | (661 | ) | ||||||
Income tax | 136 | (30.0 | ) | 195 | ||||||||
Net income | (301 | ) | (35.5 | ) | (466 | ) | ||||||
Non-controlling interests | 0 | (68.1 | ) | 1 | ||||||||
Net attributable profit | (300 | ) | (35.4 | ) | (465 | ) | ||||||
Balance sheet | 30-06-15 | D% | 30-06-14 | |||||||||
Cash and balances with central banks | 7 | 22.1 | 6 | |||||||||
Financial assets | 555 | 48.7 | 373 | |||||||||
Loans and receivables | 8,532 | (12.1 | ) | 9,711 | ||||||||
Loans and advances to customers | 8,532 | (12.1 | ) | 9,711 | ||||||||
Loans and advances to credit institutions and other | — | — | — | |||||||||
Inter-area positions | — | — | — | |||||||||
Tangible assets | 1,608 | 11.0 | 1,449 | |||||||||
Other assets | 7,217 | (0.5 | ) | 7,256 | ||||||||
|
|
|
|
|
| |||||||
Total assets/liabilities and equity | 17,919 | (4.7 | ) | 18,795 | ||||||||
|
|
|
|
|
| |||||||
Deposits from central banks and credit institutions | — | — | — | |||||||||
Deposits from customers | 174 | 153.6 | 69 | |||||||||
Debt certificates | — | — | — | |||||||||
Subordinated liabilities | 870 | (0.7 | ) | 876 | ||||||||
Inter-area positions | 13,422 | (6.4 | ) | 14,346 | ||||||||
Financial liabilities held for trading | — | — | — | |||||||||
Other liabilities | 0 | n.m. | — | |||||||||
Economic capital allocated | 3,453 | (1.4 | ) | 3,504 | ||||||||
| 22 | Business areas |
Table of Contents
| Highlights | ||||||||||
• |
Activity continues the growing trend of previous periods. | |||||||||
• |
Positive performance of all revenue items. | |||||||||
• |
Incorporation of Spring Studio in April. | |||||||||
• |
Risk indicators continue at minimum levels. | |||||||||
| The United States | 23 |
Table of Contents
Financial statements and relevant business indicators
(Million euros and percentage)
Income statement | 1H15 | D% | D% (1) | 1H14 | ||||||||||||
Net interest income | 881 | 27.3 | 3.6 | 693 | ||||||||||||
Net fees and commissions | 317 | 18.4 | (3.6 | ) | 268 | |||||||||||
Net trading income | 117 | 57.8 | 28.6 | 74 | ||||||||||||
Other income/expenses | 16 | n.m. | n.m. | 2 | ||||||||||||
Gross income | 1,332 | 28.5 | 4.6 | 1,037 | ||||||||||||
Operating expenses | (883 | ) | 23.8 | 0.8 | (713 | ) | ||||||||||
Personnel expenses | (508 | ) | 22.8 | 0.0 | (414 | ) | ||||||||||
General and administrative expenses | (270 | ) | 27.2 | 3.6 | (212 | ) | ||||||||||
Depreciation and amortization | (104 | ) | 20.3 | (2.1 | ) | (87 | ) | |||||||||
Operating income | 449 | 38.7 | 13.0 | 324 | ||||||||||||
Impairment on financial assets (net) | (62 | ) | 50.3 | 22.3 | (42 | ) | ||||||||||
Provisions (net) and other gains (losses) | 3 | n.m. | n.m. | (16 | ) | |||||||||||
Income before tax | 390 | 46.6 | 19.4 | 266 | ||||||||||||
Income tax | (104 | ) | 48.7 | 21.0 | (70 | ) | ||||||||||
Net incomes | 286 | 45.9 | 18.8 | 196 | ||||||||||||
Non-controlling interests | 0 | 50.0 | 22.1 | 0 | ||||||||||||
Net attributable profit | 286 | 45.9 | 18.8 | 196 | ||||||||||||
Balance sheet | 30-06-15 | D% | D% (1) | 30-06-14 | ||||||||||||
Cash and balances with central banks | 4,608 | 19.2 | (2.4 | ) | 3,867 | |||||||||||
Financial assets | 14,897 | 90.2 | 55.8 | 7,834 | ||||||||||||
Loans and receivables | 58,722 | 38.6 | 13.5 | 42,370 | ||||||||||||
Loans and advances to customers | 56,414 | 38.1 | 13.1 | 40,857 | ||||||||||||
Loans and advances to credit institutions and other | 2,308 | 52.6 | 25.0 | 1,512 | ||||||||||||
Inter-area positions | 100 | n.m. | n.m. | 9 | ||||||||||||
Tangible assets | 769 | 17.6 | (3.6 | ) | 653 | |||||||||||
Other assets | 1,713 | (18.9 | ) | (33.6 | ) | 2,112 | ||||||||||
|
|
|
|
|
|
|
| |||||||||
Total assets/liabilities and equity | 80,809 | 42.2 | 16.5 | 56,845 | ||||||||||||
|
|
|
|
|
|
|
| |||||||||
Deposits from central banks and credit institutions | 7,806 | 63.9 | 34.3 | 4,761 | ||||||||||||
Deposits from customers | 57,569 | 30.8 | 7.1 | 44,024 | ||||||||||||
Debt certificates | 896 | n.m. | n.m. | — | ||||||||||||
Subordinated liabilities | 1,405 | 115.7 | 76.7 | 651 | ||||||||||||
Inter-area positions | — | — | — | — | ||||||||||||
Financial liabilities held for trading | 4,581 | n.m. | n.m. | 183 | ||||||||||||
Other liabilities | 5,624 | 16.3 | (4.7 | ) | 4,834 | |||||||||||
Economic capital allocated | 2,929 | 22.5 | 0.4 | 2,391 | ||||||||||||
Relevant business indicators | 30-06-15 | 31-03-15 | 30-06-14 | |||||||||
Loans and advances to customers (gross) (1) | 57,176 | 55,653 | 50,653 | |||||||||
Customer deposits under management (1-2) | 56,458 | 56,179 | 51,791 | |||||||||
Mutual funds | — | — | — | |||||||||
Pension funds | — | — | — | |||||||||
Efficiency ratio (%) | 66.3 | 65.9 | 68.8 | |||||||||
NPL ratio (%) | 0.9 | 0.9 | 0.9 | |||||||||
NPL coverage ratio (%) | 151 | 164 | 168 | |||||||||
Cost of risk (%) | 0.23 | 0.23 | 0.21 | |||||||||
| (1) | Figures at constant exchange rate. |
| (2) | Excludes repos. |
Macro and industry trends
GDP contracted in the first quarter of 2015, although this is considered to be temporary due to the strength exhibited by the labor market and its effect on disposable income, as well as spending on private consumption. Against this backdrop, a start to the normalization of monetary policy by the Federal Reserve (Fed) is considered feasible, although the trend in interest rate increases will likely be steady given the lack of inflationary pressure and a somewhat uncertain global environment.
With regard toexchange rates, the U.S. dollar weakened against the euro in the second quarter, in contrast with the appreciation seen in the first few months of the year. However, the divergence between ECB monetary policies (extension of the debt purchase program) and the Fed (moving toward interest rate increases), the difference in growth between the United States and the Eurozone, and the instability arising from the management of the Greek crisis, will all continue to provide support for the U.S. dollar. All the rates of change below are expressed at a constant exchange rate, unless expressly stated otherwise.
Thebanking sector performance has been positive with respect to its main risk indicators, with the NPA ratio at historical lows compared to the last decade. In terms of activity, both lending and deposits continue to grow at positive rates.
Activity
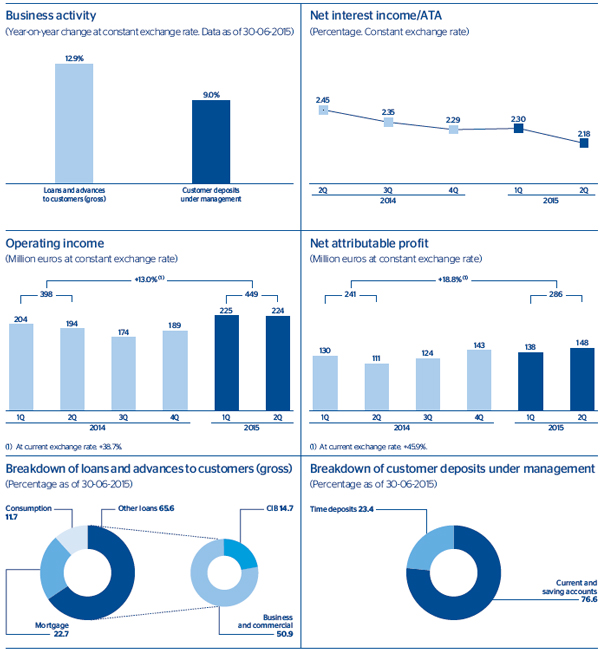
Lending maintained its upward trend of prior periods, up 6.1% since the end of the year and 2.7% over the quarter. There has been significant growth in all of the portfolios, particularly developer (up 13.1% since December 2014, although starting from a lower base), commercial (up 7.8% since 31-Dec-2014) and consumer finance (up 7.5% over the same period).
Asset quality indicators remain at the minimum cyclical levels, with a NPA ratio (0.9%) that is relatively the same as at the close of March 2015 and a coverage ratio of 151%. The cumulative cost of risk over the first half of the year is at a very similar level to that in the first quarter of 2015.
Customerdeposits under management maintained the strength of previous quarters, with year-over-year growth of 3.9%. Time deposits increased more (up 8.6%) during the quarter than current and savings accounts (up 2.5%).
| 24 | Business areas |
Table of Contents
Results
The area generated a netattributable profit over the quarter 7.2% higher than the first quarter of the year. Year to date this heading amounted to €286m, 18.8% up over the figure for the first half of 2014. The most relevant points are as follows:
| • | Positive quarterly and year-over-year growth innet interest income (up 0.8% and 3.6% respectively) due to strong balance sheet activity. Customer spreads have stabilized. |
| • | Net fees and commissions maintained the same trend as in previous quarters. |
| • | NTI is higher than in the same period last year as a result of capital gains from the sale of ALCO portfolios and the positive performance of the Global Markets unit over the half year. |
| • | Operating expenses increased but significantly below the growth rate of gross income and despite the incorporation of Spring Studio in the quarter. This is a California based company focused on design specialized around consumer experience. |
| • | Finally,impairment losses on financial assets increased year-over-year by 22.3% through the first six months of 2015 due in part to growth in activity, although the cost of risk remains at very low levels. |
| The United States | 25 |
Table of Contents
| ||||||||||
| Highlights | ||||||||||
• |
Strong growth in lending continues. | |||||||||
• |
Good performance of customer funds and good management of the cost of funding. | |||||||||
• |
Outstanding net interest income. | |||||||||
• |
Stable asset quality indicators. | |||||||||
| 26 | Business areas |
Table of Contents
Macro and industry trends
Turkey’s realGDP registered year-on-year growth in the first quarter of 2015 that was better than expected by the market, thanks to strong private consumption, which has offset the greater weakness of exports in the quarter. The outlook for the year as a whole remains favorable, despite the high level of inflation, the depreciation accumulated by the Turkish lira, and political uncertainty, which together significantly limit the Central Bank’s (CBRT) room for maneuver for carrying out further cuts in reference interest rates.
As regards thebanking sector, lending growth picked up steam in the second quarter of the year, posting a year-on-year rise of 25% in May according to information from CBRT, supported by growth in the corporate segment. Customer fund gathering in the private sector has increased by 20% (also according to information from CBRT as of May). The NPA ratio in the sector remains stable at around 3%. Lastly, the sector has sound capitalization and profitability levels.
Activity
All the comments below on rates of change will be expressed at a constant exchange rate, unless expressly stated otherwise.
Gross lending to customers remains strong (up 11.4% over the year and 3.7% in the quarter), supported by the positive performance of the mortgage loan portfolio (up 14.1% since December and 7.3% in the quarter), consumer lending (up 5.7% since 31-Dec-2014 and 2.2% since March) and credit cards (up 7.3% since the end of 2014 and 6.1% in the quarter). In all three, Garanti maintains its leading position with gains in market share in the quarter, based on the figures for the system published by the regulator (BRSA). There has been a moderation in the quarterly increase in the so-called general purpose loans (unsecured personal loans) in Garanti and lower demand for foreign-currency loans as a result of exchange-rate volatility.
The mainasset quality indicators remain stable. The NPA ratio increased by a mere 2 basis points since March 31 and the coverage ratio is up 0.9 percentage points, in both cases better than the average for the sector.
Customerdeposits continue to grow, with an increase of 2.8% in the quarter and 12.2% over the year. In Garanti, there has been moderate growth in Turkish lira-denominated customer funds and a significant increase in foreign-currency deposits
Financial statements and relevant business indicators
(Million euros and percentage)
Income statement(1) | 1H15 | D% | D% (2) | 1H14 | ||||||||||||
Net interest income | 425 | 35.5 | 30.7 | 314 | ||||||||||||
Net fees and commissions | 98 | 3.6 | (0.1 | ) | 95 | |||||||||||
Net trading income | (22 | ) | n.m. | n.m. | 26 | |||||||||||
Other income/expenses | 9 | 21.6 | 17.2 | 7 | ||||||||||||
Gross income | 510 | 15.6 | 11.5 | 442 | ||||||||||||
Operating expenses | (221 | ) | 18.9 | 14.7 | (186 | ) | ||||||||||
Personnel expenses | (112 | ) | 14.4 | 10.4 | (97 | ) | ||||||||||
General and administrative expenses | (91 | ) | 27.1 | 22.6 | (72 | ) | ||||||||||
Depreciation and amortization | (19 | ) | 9.6 | 5.7 | (17 | ) | ||||||||||
Operating income | 289 | 13.2 | 9.1 | 255 | ||||||||||||
Impairment on financial assets (net) | (71 | ) | 40.6 | 35.6 | (50 | ) | ||||||||||
Provisions (net) and other gains (losses) | 1 | n.m. | n.m. | (9 | ) | |||||||||||
Income before tax | 219 | 11.5 | 7.5 | 196 | ||||||||||||
Income tax | (44 | ) | 6.5 | 2.7 | (41 | ) | ||||||||||
Net income | 174 | 12.9 | 8.9 | 155 | ||||||||||||
Non-controlling interests | — | — | — | — | ||||||||||||
Net attributable profit | 174 | 12.9 | 8.9 | 155 | ||||||||||||
Balance sheet(1) | 30-06-15 | D% | D% (2) | 30-06-14 | ||||||||||||
Cash and balances with central banks | 2,317 | 5.0 | 8.6 | 2,206 | ||||||||||||
Financial assets | 4,298 | 4.3 | 7.8 | 4,122 | ||||||||||||
Loans and receivables | 15,037 | 14.8 | 18.7 | 13,096 | ||||||||||||
Loans and advances to customers | 13,796 | 16.7 | 20.6 | 11,824 | ||||||||||||
Loans and advances to credit institutions and other | 1,241 | (2.5 | ) | 0.9 | 1,272 | |||||||||||
Tangible assets | 183 | 1.0 | 4.4 | 181 | ||||||||||||
Other assets | 665 | 7.4 | 11.0 | 619 | ||||||||||||
|
|
|
|
|
|
|
| |||||||||
Total assets/liabilities and equity | 22,499 | 11.3 | 15.0 | 20,224 | ||||||||||||
|
|
|
|
|
|
|
| |||||||||
Deposits from central banks and credit institutions | 4,231 | 0.3 | 3.7 | 4,219 | ||||||||||||
Deposits from customers | 12,018 | 16.1 | 20.0 | 10,354 | ||||||||||||
Debt certificates | 1,258 | 10.4 | 14.2 | 1,139 | ||||||||||||
Subordinated liabilities | 23 | (3.3 | ) | (0.1 | ) | 24 | ||||||||||
Financial liabilities held for trading | 242 | 101.6 | 108.4 | 120 | ||||||||||||
Other liabilities | 3,725 | 5.0 | 8.6 | 3,548 | ||||||||||||
Economic capital allocated | 1,002 | 22.1 | 26.3 | 821 | ||||||||||||
Relevant business indicators | 30-06-15 | 31-03-15 | 30-06-14 | |||||||||
Loans and advances to customers (gross)(2) | 14,355 | 13,845 | 11,868 | |||||||||
Customer deposits under management(2-3) | 11,644 | 11,323 | 9,667 | |||||||||
Mutual funds | 352 | 365 | 374 | |||||||||
Pension funds | 563 | 572 | 444 | |||||||||
Efficiency ratio (%) | 43.4 | 44.0 | 42.2 | |||||||||
NPL ratio (%) | 2.7 | 2.6 | 2.7 | |||||||||
NPL coverage ratio (%) | 119 | 118 | 112 | |||||||||
Cost of risk (%) | 1.00 | 0.94 | 0.85 | |||||||||
| (1) | Financial statements with the revenues and expenses of the Garanti Group consolidated in proportion to the percentage of the Group’s stake. |
| (2) | Figures at constant exchange rate. |
| (3) | Excluding repos. |
| Turkey | 27 |
Table of Contents
(of lower cost than those in local currency), with the fund mix continuing to evolve toward a lower-cost structure.
Results
Turkey generated a net attributableprofit of €174m in the first half of the year, up 8.9% year-on-year, supported by:
| • | Better performance ofnet interest income than in the previous quarter. This heading increased by 8.5% in the last three months and 30.7% in year-on-year terms on the cumulative figure for the first half of the year, thanks to strong activity. Customer spreads remain stable. |
| • | Fees and commissions closely in line with the figure for the first half of 2014. The diversified revenue base from fees and commissions has |
mitigated the impact of the new regulation approved in October 2014, which limits the fees on consumer loans and credit cards. The quarter-on-quarter comparison is affected by one-off revenues posted in the previous quarter from the closing of several project finance deals. |
| • | NTI in the semester was affected by the performance of the wholesale financial markets. |
| • | Operating expenses have been negatively affected by the high level of inflation and higher reimbursements of fees and commissions to customers in the quarter. |
| • | Lastly,impairment losses on financial assets increased in the first half of the year, in line with the year-on-year growth in lending activity. |
| 28 | Business areas |
Table of Contents
| Highlights | ||||||||||
| • | Lending still growing at double-digit rates, in an environment of moderate economic growth. | |||||||||
| • | Increase in the portfolio biased toward wholesale segments. | |||||||||
| • | Sound and resilient earnings in the area. | |||||||||
| • | Good risk indicators that compare favorably with the banking system as a whole. | |||||||||
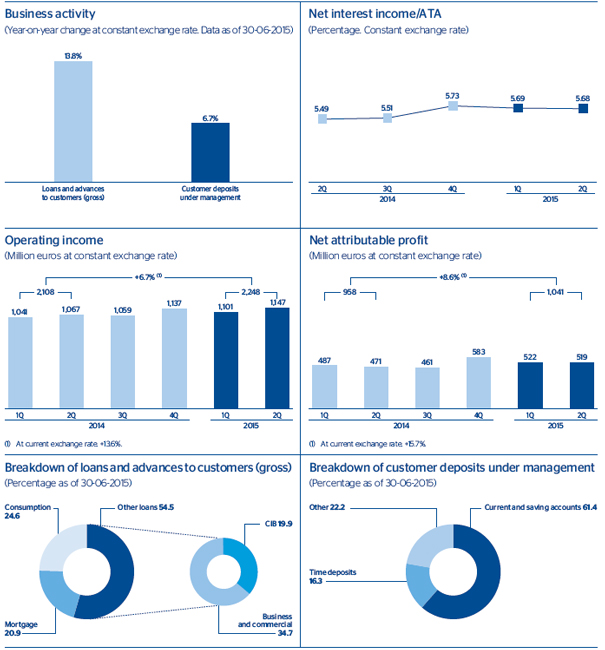
| Mexico | 29 |
Table of Contents
Financial statements and relevant business indicators
(Million euros and percentage)
Income statement | 1H15 | D% | D% (2) | 1H14 | ||||||||||||
Net interest income | 2,734 | 16.1 | 9.1 | 2,354 | ||||||||||||
Net fees and commissions | 605 | 8.0 | 1.4 | 560 | ||||||||||||
Net trading income | 109 | 1.4 | (4.8 | ) | 108 | |||||||||||
Other income/expenses | 110 | (2.2 | ) | (8.2 | ) | 112 | ||||||||||
Gross income | 3,558 | 13.5 | 6.6 | 3,134 | ||||||||||||
Operating expenses | (1,309 | ) | 13.4 | 6.5 | (1,155 | ) | ||||||||||
Personnel expenses | (580 | ) | 16.4 | 9.4 | (498 | ) | ||||||||||
General and administrative expenses | (621 | ) | 9.2 | 2.6 | (568 | ) | ||||||||||
Depreciation and amortization | (108 | ) | 23.1 | 15.6 | (88 | ) | ||||||||||
Operating income | 2,248 | 13.6 | 6.7 | 1,980 | ||||||||||||
Impairment on financial assets (net) | (852 | ) | 13.5 | 6.6 | (750 | ) | ||||||||||
Provisions (net) and other gains (losses) | (16 | ) | (60.3 | ) | (62.7 | ) | (42 | ) | ||||||||
Income before tax | 1,380 | 16.2 | 9.2 | 1,188 | ||||||||||||
Income tax | (339 | ) | 18.0 | 10.8 | (287 | ) | ||||||||||
Net income | 1,042 | 15.7 | 8.6 | 901 | ||||||||||||
Non-controlling interests | 0 | 15.5 | 8.5 | 0 | ||||||||||||
Net attributable profit | 1,041 | 15.7 | 8.6 | 900 | ||||||||||||
Balance sheet | 30-06-15 | D% | D% (1) | 30-06-14 | ||||||||||||
Cash and balances with central banks | 5,326 | 19.9 | 18.7 | 4,442 | ||||||||||||
Financial assets | 35,356 | 1.4 | 0.4 | 34,870 | ||||||||||||
Loans and receivables | 50,340 | 14.6 | 13.4 | 43,942 | ||||||||||||
Loans and advances to customers | 48,006 | 15.7 | 14.5 | 41,504 | ||||||||||||
Loans and advances to credit institutions and other | 2,334 | (4.3 | ) | (5.2 | ) | 2,438 | ||||||||||
Tangible assets | 1,899 | 34.6 | 33.2 | 1,411 | ||||||||||||
Other assets | 3,935 | 3.2 | 2.1 | 3,813 | ||||||||||||
|
|
|
|
|
|
|
| |||||||||
Total assets/liabilities and equity | 96,855 | 9.5 | 8.4 | 88,479 | ||||||||||||
|
|
|
|
|
|
|
| |||||||||
Deposits from central banks and credit institutions | 8,851 | 2.7 | 1.7 | 8,617 | ||||||||||||
Deposits from customers | 50,497 | 9.7 | 8.6 | 46,030 | ||||||||||||
Debt certificates | 5,448 | 25.4 | 24.1 | 4,345 | ||||||||||||
Subordinated liabilities | 4,466 | 18.4 | 17.2 | 3,770 | ||||||||||||
Financial liabilities held for trading | 7,252 | (0.5 | ) | (1.5 | ) | 7,291 | ||||||||||
Other liabilities | 15,092 | 10.7 | 9.6 | 13,627 | ||||||||||||
Economic capital allocated | 5,250 | 9.5 | 8.3 | 4,797 | ||||||||||||
Relevant business indicators | 30-06-15 | 31-03-15 | 30-06-14 | |||||||||
Loans and advances to customers (gross) (1) | 49,627 | 48,690 | 43,598 | |||||||||
Customer deposits under management (1-2) | 47,326 | 47,325 | 44,357 | |||||||||
Mutual funds | 20,260 | 20,797 | 18,362 | |||||||||
Pension funds | — | — | — | |||||||||
Efficiency ratio (%) | 36.8 | 36.9 | 36.8 | |||||||||
NPL ratio (%) | 2.8 | 2.8 | 3.4 | |||||||||
NPL coverage ratio (%) | 116 | 116 | 113 | |||||||||
Cost of risk (%) | 3.43 | 3.44 | 3.61 | |||||||||
| (1) | Figures at constant exchange rate. |
| (2) | Including all the repos. |
Macro and industry trends
TheMexican economy continues to grow steadily, sustained by the positive export sector, in an environment of inflation levels below 3%. The process of rises in reference interest rates will be linked to the Fed’s monetary normalization cycle, although it is expected to be slow.
As regards theexchange rate, the Mexican peso lost against the dollar and the euro in the quarter, in response to doubts about the impact of the stabilization of the oil price at low levels and the uncertainty about the effects of the Fed’s monetary policy on capital flows into the country. All the comments below on rates of change will be expressed at constant exchange rates, unless expressly stated otherwise.
Trends in the country’sfinancial system remain similar to the previous quarter: double-digit growth in the loan portfolio (information as of May 2015 from the National Banking and Securities Commission, CNBV), a high solvency level and improvement in the past-due portfolio ratio (NPA ratio under local criteria) to around 3%.
Activity
Lending continues to grow year-on-year at double-digit rates (13.8%). Year to date it grows 4.1%
Thewholesale portfolio has grown the most (up 20.8% year-on-year and up 3.9% since December) thanks to the positive progress in commercial and public sector loans (both segments show increases of more than 20% year-on-year and above 5% against the figure for December 2014). Finance for housing developers is beginning to grow, closing the first half of the year with an increase of 7.8% since the closing of 2014. As a result, BBVA in Mexico has managed to increase its market share in the commercial portfolio by more than 100 basis points in the first half of the year, according to the latest public information on local banks from the CNBV as at the close of May 2015.
Theretail portfolio has also grown (+7.5% year-on-year and +3.4% since 31-Dec-2014). The biggest rises have been in SMEs, which have grown 10.5% in the semester. Payroll and personal loans have performed well (up 11.2% in the semester), strongly supported by the strategy of pre-approved loans for the customer base. As a result, BBVA in Mexico has gained 81 basis points in market share since the end
| 30 | Business areas |
Table of Contents
of 2014 in the two portfolios. Lastly, origination of new mortgage loans has performed outstandingly (up 19.4% year-on-year, with public information as of the closing of May 2015 from the CNBV).
In terms ofcredit quality, the NPA and coverage ratios remained stable over the quarter. It is worth noting that, taking into account local data, the BBVA subsidiary in Mexico has posted better indicators than the average of its main competitors, according to the latest information available from the CNBV.
Total customerfunds have also performed well (up 7.5% year-on-year and up 5.2% since 31-Dec-2014). The best performers in customer funds are bank deposits, which have grown 6.7% in the semester thanks to the favorable performance of current and savings accounts (up 1.8%), and above all time deposits (up 18.1%). Lastly, assets under management by investment companies have grown 6.4% since the end of 2014.
Results
BBVA in Mexico has shown great resilience in its earnings in 2015, with an improvement in thenet attributable profit of 8.6% with respect to the figure for the same period of the previous year. This has all happened in an environment of moderate economic growth in the country.
Net interest income performed better than in the previous quarter. Its moderate progress in comparison with that of activity is mainly due to an increase in the portfolio that is biased toward wholesale segments (with lower yields, but also with a better risk profile) and more limited revenue derived from the Global Markets unit.
Net fees and commissions are slightly higher than in the same period in 2014, boosted by a rise in related transactions, above all credit cards, as well as cash management products geared toward the commercial segment.
There was a slight fall inNTI, compared with a very high figure obtained in the same period in 2014.
The decline inother income/expenses is due to the larger contribution in comparison with the same period of 2014 to the local deposit guarantee fund, the IPAB, linked to the increased volume of liabilities. However, under this heading there has been growth in the earnings generated by the insurance business as a result of its improved performance. Over the quarter this unit has launched a new product called Wibe, the first online digital channel for buying car insurance in Mexico.
Year-on-year growth inoperating expenses, due to the investment plans being executed in Mexico since 2013, has remained in check. Overall, the increase in both revenue and costs has kept the efficiency ratio at a very similar level to the same period the previous year and the first quarter of 2015.
Lastly,impairment losses on financial assets have increased slightly less than the loan portfolio, due partly to the change in the loan portfolio mix (with an increase in the weight of wholesale customers, with a better risk profile), and a favorable performance of corporate clients, developers and the portfolio of residential real-estate mortgages. This puts the cumulative cost of risk as of June 2015 at very similar levels to those of the previous quarter and far below the figure for the first half of 2014.
| Mexico | 31 |
Table of Contents
| ||||||||||
| Highlights | ||||||||||
| • | Strength in activity. | |||||||||
| • | Favorable performance of more recurring revenue. | |||||||||
| • | Costs conditioned by investment plans and high inflation in Argentina. | |||||||||
| • | Risk indicators are stable. | |||||||||

| 32 | Business areas |
Table of Contents
Macro and industry trends
South America is having to deal with a less favorable internationalenvironment than in recent years, above all due to falls in commodity prices and the slowdown in China. A gradual recovery in the rate of growth is expected in 2015, but with different rates in each country. The recent increase in inflation generated from the depreciation of currencies and idiosyncratic factors, such as increases in taxes or administered prices in some countries, suggest reference interest rates should remain stable in most of the region.
Thefinancial systems in the region remain sound in general, with good levels of capitalization and profitability and NPA ratios in check. In activity there has been a positive trend in lending and deposits, although the rates of growth are more moderate than in previous years.
Activity
All the rates of change given below refer to constant exchange rages, and do not include earnings and activity in Venezuela, unless expressly stated otherwise.
Gross lending to customers has remained strong since the start of the year, with growth since the end of December of 5.8%, thanks to the good performance of all the countries in the region, particularly Argentina, Colombia and Peru.
Bysegment, the individual business has performed well, boosted by growth in credit cards (14.0% since 31-Dec-2014), the mortgage portfolio (4.7% over the year) and consumer finance (4.4% in the semester). There was also a good performance in commercial lending (up 6.0% in the same timeframe).
Asset quality over the quarter showed stability of the NPA ratio and slight improvement of the coverage ratio.
Total customerfunds (both on and off-balance-sheet) have grown at a rate of 6.6% so far this year (up 6.2% for customer deposits under management), with current and savings accounts performing best (up 7.9%). There was also an outstanding 10.2% increase in mutual funds in the first six months of the year. By country, the best performance of total customer funds in the first six months of 2015 has been in Argentina (up 19.5%) and Peru (up 12.0%).
Financial statements and relevant business indicators
(Million euros and percentage)
| South America | South America excluding Venezuela | |||||||||||||||||||
Income statement | 1H15 | 1H15 | D% | D% (1) | 1H14 | |||||||||||||||
Net interest income | 1,652 | 1,558 | 18.0 | 11.3 | 1,320 | |||||||||||||||
Net fees and commissions | 360 | 346 | 20.5 | 11.4 | 287 | |||||||||||||||
Net trading income | 306 | 217 | 31.7 | 22.3 | 164 | |||||||||||||||
Other income/expenses | (22 | ) | 48 | 12.8 | 6.2 | 43 | ||||||||||||||
Gross income | 2,297 | 2,169 | 19.5 | 12.2 | 1,814 | |||||||||||||||
Operating expenses | (1,014 | ) | (981 | ) | 20.7 | 13.2 | (812 | ) | ||||||||||||
Personnel expenses | (527 | ) | (514 | ) | 21.0 | 13.1 | (425 | ) | ||||||||||||
General and administrative expenses | (434 | ) | (417 | ) | 21.6 | 14.3 | (343 | ) | ||||||||||||
Depreciation and amortization | (53 | ) | (49 | ) | 10.9 | 4.9 | (44 | ) | ||||||||||||
Operating income | 1,283 | 1,189 | 18.6 | 11.4 | 1,002 | |||||||||||||||
Impairment on financial assets (net) | (310 | ) | (300 | ) | 28.0 | 21.0 | (234 | ) | ||||||||||||
Provisions (net) and other gains (losses) | (45 | ) | (15 | ) | (19.3 | ) | (27.4 | ) | (18 | ) | ||||||||||
Income before tax | 927 | 874 | 16.6 | 9.4 | 749 | |||||||||||||||
Income tax | (272 | ) | (235 | ) | 23.3 | 16.2 | (190 | ) | ||||||||||||
Net income | 655 | 639 | 14.3 | 7.2 | 559 | |||||||||||||||
Non-controlling interests | (181 | ) | (174 | ) | 14.2 | 4.0 | (152 | ) | ||||||||||||
Net attributable profit | 474 | 465 | 14.4 | 8.4 | 407 | |||||||||||||||
Balance sheet | 30-06-15 | 30-06-15 | D% | D% (1) | 30-06-14 | |||||||||||||||
Cash and balances with central banks | 9,722 | 9,282 | 50.7 | 45.3 | 6,160 | |||||||||||||||
Financial assets | 9,736 | 9,472 | 27.6 | 27.9 | 7,422 | |||||||||||||||
Loans and receivables | 49,513 | 47,826 | 16.1 | 14.0 | 41,203 | |||||||||||||||
Loans and advances to customers | 45,018 | 43,856 | 14.1 | 12.3 | 38,450 | |||||||||||||||
Loans and advances to credit institutions and other | 4,495 | 3,969 | 44.2 | 36.8 | 2,753 | |||||||||||||||
Tangible assets | 767 | 731 | 21.0 | 16.6 | 604 | |||||||||||||||
Other assets | 1,701 | 1,628 | 22.8 | 19.5 | 1,325 | |||||||||||||||
|
|
|
|
|
|
|
|
|
| |||||||||||
Total assets/liabilities and equity | 71,441 | 68,939 | 21.6 | 19.4 | 56,714 | |||||||||||||||
|
|
|
|
|
|
|
|
|
| |||||||||||
Deposits from central banks and credit institutions | 6,407 | 6,399 | 50.4 | 43.4 | 4,255 | |||||||||||||||
Deposits from customers | 43,338 | 41,320 | 13.1 | 12.0 | 36,545 | |||||||||||||||
Debt certificates | 5,119 | 5,119 | 20.0 | 13.8 | 4,266 | |||||||||||||||
Subordinated liabilities | 2,056 | 2,056 | 62.9 | 60.1 | 1,262 | |||||||||||||||
Financial liabilities held for trading | 3,445 | 3,445 | 150.3 | 139.4 | 1,376 | |||||||||||||||
Other liabilities | 8,482 | 8,120 | 21.1 | 17.3 | 6,704 | |||||||||||||||
Economic capital allocated | 2,594 | 2,479 | 7.5 | 9.4 | 2,305 | |||||||||||||||
| Relevant business | South America | South America excluding Venezuela | ||||||||||||||
indicators | 30-06-15 | 30-06-15 | 31-03-15 | 30-06-14 | ||||||||||||
Loans and advances to customers (gross) (1) | 46,403 | 45,207 | 43,573 | 40,291 | ||||||||||||
Customer deposits under management (1-2) | 43,284 | 41,288 | 39,886 | 36,608 | ||||||||||||
Mutual funds | 4,328 | 4,327 | 4,399 | 3,161 | ||||||||||||
Pension funds | 5,381 | 5,381 | 5,411 | 3,828 | ||||||||||||
Efficiency ratio (%) | 44.2 | 45.2 | 45.9 | 44.8 | ||||||||||||
NPL ratio (%) | 2.3 | 2.3 | 2.3 | 2.1 | ||||||||||||
NPL coverage ratio (%) | 122 | 120 | 119 | 134 | ||||||||||||
Cost of risk (%) | 1.23 | 1.34 | 1.21 | 1.23 | ||||||||||||
| (1) | Figures at constant exchange rates. |
| (2) | Excluding repos and including specific marketable debt securities. |
| South America | 33 |
Table of Contents
Results
South America posted anet attributable profit in the first half of the 2015 of €465m (€474m including Venezuela), equivalent to a year-on-year growth of 8.4%. Highlights for the half-year:
| • | Positive performance ofnet interest income, which has grown year-on-year by 11.3% thanks to the strength of activity and maintenance of spreads. |
| • | Good rise innet fees and commissions (up 11.4%). |
| • | NTI is 22.3% higher than in the same period in 2014, due to the significant effect of the depreciation of the currencies against the U.S. dollar. |
| • | The trend inoperating expenses is strongly influenced by the investments made over recent years and the high inflation in |
Argentina. Even so, the efficiency ratio has improved compared with the first quarter of 2015 and is at similar levels to the first six months of 2014. |
| • | The rate of growth ofimpairment losses on financial assets is higher than the year-on-year increases in activity, partly due to a less favorable environment than in previous periods. |
| • | By country,Argentina has grown significantly in all the income lines thanks to the strength of activity and maintenance of spreads. InColombia earnings have been boosted by the good performance of gross income and by cost control.Peru has maintained strong gross income, supported by recurring revenue and NTI, as reflected in the net attributable profit.Chile has recorded in the first halft of the year the negative impact on tax due to the increased tax rate under the reform that came into force in January. |
South America. Relevant business indicators per country
(Million euros)
| Argentina | Chile | Colombia | Peru | Venezuela | ||||||||||||||||||||||||||||||||||||
| 30-06-15 | 30-06-14 | 30-06-15 | 30-06-14 | 30-06-15 | 30-06-14 | 30-06-15 | 30-06-14 | 30-06-15 | 30-06-14 | |||||||||||||||||||||||||||||||
Loans and advances to customers (gross) (1) | 4,741 | 3,699 | 12,871 | 12,387 | 11,505 | 10,037 | 13,149 | 11,836 | 1,196 | 522 | ||||||||||||||||||||||||||||||
Customer deposits under | 5,794 | 4,618 | 8,533 | 8,279 | 11,401 | 10,616 | 11,729 | 9,922 | 1,996 | 896 | ||||||||||||||||||||||||||||||
Mutual funds | 942 | 317 | 1,376 | 1,087 | 708 | 670 | 1,301 | 1,087 | 1 | 10 | ||||||||||||||||||||||||||||||
Efficiency ratio (%) | 51.5 | 51.2 | 48.0 | 46.1 | 39.3 | 41.0 | 35.4 | 35.8 | 26.3 | 42.6 | ||||||||||||||||||||||||||||||
NPL ratio (%) | 0.8 | 0.9 | 2.5 | 2.4 | 2.4 | 2.0 | 2.6 | 2.3 | 1.1 | 2.1 | ||||||||||||||||||||||||||||||
NPL coverage ratio (%) | 401 | 373 | 67 | 82 | 133 | 152 | 128 | 146 | 279 | 160 | ||||||||||||||||||||||||||||||
Cost of risk (%) | 1.66 | 1.43 | 1.09 | 0.97 | 1.50 | 1.48 | 1.46 | 1.39 | 0.35 | 1.92 | ||||||||||||||||||||||||||||||
| (1) | Figures at constant exchange rates. |
| (2) | Excluding repos and including specific marketable debt securities. |
South America. Data per country
(Million euros)
| Operating income | Net attributable profit | |||||||||||||||||||||||||||||||
Country | 1H15 | D% | D% at constant exchange rates | 1H14 | 1H15 | D% | D% at constant exchange rates | 1H14 | ||||||||||||||||||||||||
Argentina | 303 | 39.6 | 28.0 | 217 | 124 | 32.4 | 21.4 | 93 | ||||||||||||||||||||||||
Chile | 186 | 7.6 | (1.6 | ) | 173 | 74 | (4.4 | ) | (12.5 | ) | 78 | |||||||||||||||||||||
Colombia | 296 | 9.4 | 12.8 | 270 | 159 | 21.4 | 25.1 | 131 | ||||||||||||||||||||||||
Peru | 367 | 20.3 | 8.4 | 305 | 92 | 19.2 | 7.4 | 77 | ||||||||||||||||||||||||
Venezuela | 94 | (70.1 | ) | n.m. | 315 | 9 | (87.6 | ) | 87.3 | 74 | ||||||||||||||||||||||
Other countries (1) | 38 | 0.5 | (8.2 | ) | 37 | 16 | (41.1 | ) | (45.6 | ) | 27 | |||||||||||||||||||||
|
|
|
|
|
|
|
|
|
|
|
|
|
|
|
| |||||||||||||||||
Total | 1,283 | (2.6 | ) | 17.9 | 1,317 | 474 | (1.3 | ) | 9.3 | 481 | ||||||||||||||||||||||
|
|
|
|
|
|
|
|
|
|
|
|
|
|
|
| |||||||||||||||||
| (1) | Paraguay, Uruguay and Bolivia. Additionally, it includes eliminations and other charges. |
| 34 | Business areas |
Table of Contents
| Highlights | ||||||||||
| • | Lending activity conditioned by the maturity of wholesale operations. | |||||||||
| • | Year-on-year comparison affected by the dividend received from CNCB in 2014. | |||||||||
Macro and industry trends
Economic activity in theeuro zone in the quarter has been marked by the ECB’s asset purchase program and its impact on the currency’s depreciation (although over the quarter the euro appreciated against the U.S. dollar) and the reduction in funding costs as a result of the current environment of all-time low interest rates. The incipient recovery in the demand for new bank lending is reflected in a gradual improvement of household spending, which will contribute to GDP growth in 2015.
InChina economic activity continues to slow, although demand, tax and, particularly, monetary policies have room to achieve GDP growth of 7%, the level set as a target by the country’s authorities for 2015.
Activity
Decline ingross lending to customers in the area as a result of the maturity of relevant operations in the quarter for some of CIB’s wholesale customers.
Asset quality indicators have once again performed very well, both in the quarter and over the last 12 months.
Customerdeposits under management have increased significantly, 51.0% in year-on-year terms (up 5.9% in the semester), influenced by the good performance of deposits in the wholesale segment in Europe.
Results
Generation of a cumulativenet attributable profit of €43m, which is lower than the amount for the first half of 2014. This decline has been strongly influenced by the CNCB dividend collected in the same period in 2014. Moreover, the high volume of liquidity in the euro zone
Financial statements and relevant business indicators
(Million euros and percentage)
Income statement | 1H15 | D% | 1H14 | |||||||||
Net interest income | 85 | (10.3 | ) | 95 | ||||||||
Net fees and commissions | 90 | (6.2 | ) | 96 | ||||||||
Net trading income | 89 | (5.7 | ) | 95 | ||||||||
Other income/expenses | 0 | (99.9 | ) | 177 | ||||||||
Gross income | 265 | (42.7 | ) | 463 | ||||||||
Operating expenses | (176 | ) | 6.8 | (165 | ) | |||||||
Personnel expenses | (100 | ) | 10.0 | (91 | ) | |||||||
General and administrative expenses | (68 | ) | 0.5 | (68 | ) | |||||||
Depreciation and amortization | (7 | ) | 33.9 | (5 | ) | |||||||
Operating income | 89 | (70.1 | ) | 298 | ||||||||
Impairment on financial assets (net) | (28 | ) | (33.7 | ) | (42 | ) | ||||||
Provisions (net) and other gains (losses) | 5 | n.m. | (4 | ) | ||||||||
Income before tax | 66 | (73.7 | ) | 253 | ||||||||
Income tax | (23 | ) | (47.7 | ) | (44 | ) | ||||||
Net income | 43 | (79.3 | ) | 208 | ||||||||
Non-controlling interests | — | — | — | |||||||||
Net attributable profit | 43 | (79.3 | ) | 208 | ||||||||
Balance sheet | 30-06-15 | D% | 30-06-14 | |||||||||
Cash and balances with central banks | 277 | 45.2 | 191 | |||||||||
Financial assets | 3,134 | (28.4 | ) | 4,376 | ||||||||
Loans and receivables | 15,890 | (7.7 | ) | 17,214 | ||||||||
Loans and advances to customers | 15,070 | (3.6 | ) | 15,626 | ||||||||
Loans and advances to credit institutions and other | 820 | (48.4 | ) | 1,589 | ||||||||
Inter-area positions | — | — | — | |||||||||
Tangible assets | 51 | (35.5 | ) | 79 | ||||||||
Other assets | 600 | 104.7 | 293 | |||||||||
Total assets/liabilities and equity | 19,952 | (9.9 | ) | 22,153 | ||||||||
Deposits from central banks and credit institutions | 5,652 | 6.7 | 5,295 | |||||||||
Deposits from customers | 11,809 | 52.7 | 7,735 | |||||||||
Debt certificates | 0 | (4.7 | ) | — | ||||||||
Subordinated liabilities | 325 | (38.5 | ) | 529 | ||||||||
Inter-area positions | 444 | (92.7 | ) | 6,123 | ||||||||
Financial liabilities held for trading | 97 | (52.2 | ) | 202 | ||||||||
Other liabilities | 324 | 110.1 | 154 | |||||||||
Economic capital allocated | 1,301 | (38.5 | ) | 2,115 | ||||||||
| Rest of Eurasia | 35 |
Table of Contents
Financial statements and relevant business indicators
(Million euros and percentage)
Relevant business indicators | 30-06-15 | 31-03-15 | 30-06-14 | |||||||||
Loans and advances to customers (gross) | 15,742 | 16,868 | 16,364 | |||||||||
Customer deposits under management(1) | 11,707 | 12,858 | 7,631 | |||||||||
Mutual funds | 1,185 | 1,236 | 1,139 | |||||||||
Pension funds | 338 | 365 | 307 | |||||||||
Efficiency ratio (%) | 66.4 | 54.8 | 35.6 | |||||||||
NPL ratio (%) | 3.4 | 3.4 | 4.0 | |||||||||
NPL coverage ratio (%) | 86 | 82 | 79 | |||||||||
Cost of risk (%) | 0.34 | 0.55 | 0.46 | |||||||||
| (1) | Excluding repos. |
following the ECB’s actions has resulted in a narrowing of the spreads for new lending transactions, particularly in the wholesale
business, with the consequent negative effect on net interest income and also on income from fees and commissions.
| 36 | Business areas |
Table of Contents
The Corporate Center posted a positiveresult in the first half of 2015 of €230m, which compares with the loss recorded in the same period the previous year (-€755m). These figures are heavily conditioned by:
| • | The improved trend innet interest income basically due to lower costs of wholesale finance. |
| • | Excellent performance ofNTI, basically due to the posting of certain capital gains from the Holdings in Industrial and Financial Companies unit. |
| • | Receipt of the Telefónicadividend in the quarter. |
| • | Theearnings from corporate operations heading includes the capital gains of €705m net of taxes from various sale operations equivalent to 6.34% of BBVA Group’s stake in CNCB and €22m for the badwill generated in the Cx deal. |
Financial statements
(Million euros)
Income statement | 1H15 | D% | 1H14 | |||||||||
Net interest income | (225 | ) | (30.7 | ) | (325 | ) | ||||||
Net fees and commissions | (65 | ) | 13.2 | (57 | ) | |||||||
Net trading income | 148 | n.m. | (15 | ) | ||||||||
Other income/expenses | 80 | 28.7 | 62 | |||||||||
Gross income | (63 | ) | (81.3 | ) | (335 | ) | ||||||
Operating expenses | (542 | ) | 4.9 | (517 | ) | |||||||
Personnel expenses | (265 | ) | 20.7 | (220 | ) | |||||||
General and administrative expenses | (46 | ) | (30.8 | ) | (66 | ) | ||||||
Depreciation and amortization | (231 | ) | 0.0 | (231 | ) | |||||||
Operating income | (605 | ) | (29.0 | ) | (852 | ) | ||||||
Impairment on financial assets (net) | 5 | n.m. | (1 | ) | ||||||||
Provisions (net) and other gains (losses) | (53 | ) | (48.8 | ) | (103 | ) | ||||||
Income before tax | (652 | ) | (31.8 | ) | (957 | ) | ||||||
Income tax | 172 | (15.9 | ) | 205 | ||||||||
Net income from ongoing operations | (480 | ) | (36.1 | ) | (752 | ) | ||||||
Results from corporate operations(1) | 727 | n.m. | — | |||||||||
Net income | 247 | n.m. | (752 | ) | ||||||||
Non-controlling interests | (17 | ) | n.m. | (3 | ) | |||||||
Net attributable profit | 230 | n.m. | (755 | ) | ||||||||
Net attributable profit (excluding results from corporate operations) | (497 | ) | (34.1 | ) | (755 | ) | ||||||
| (1) | 2015 includes the capitral gains from the various sale operations equivalent to 6.34% of BBVA Group’s stake in CNCB and the badwill from Cx operation. |
Balance sheet | 30-06-15 | D% | 30-06-14 | |||||||||
Cash and balances with central banks | 13 | (35.5 | ) | 20 | ||||||||
Financial assets | 3,491 | 1.1 | 3,453 | |||||||||
Loans and receivables | 90 | 150.9 | 36 | |||||||||
Loans and advances to customers | 90 | 150.9 | 36 | |||||||||
Loans and advances to credit institutions and other | — | — | — | |||||||||
Inter-area positions | — | — | — | |||||||||
Tangible assets | 2,775 | 32.3 | 2,097 | |||||||||
Other assets | 22,645 | 35.4 | 16,721 | |||||||||
|
|
|
|
|
| |||||||
Total assets/liabilities and equity | 29,014 | 30.0 | 22,327 | |||||||||
|
|
|
|
|
| |||||||
Deposits from central banks and credit institutions | 0 | n.m. | 0 | |||||||||
Deposits from customers | 0 | 25.0 | 0 | |||||||||
Debt certificates | 5,900 | 27.8 | 4,619 | |||||||||
Subordinated liabilities | 4,780 | 6.1 | 4,504 | |||||||||
Inter-area positions | (12,505 | ) | (10.3 | ) | (13,939 | ) | ||||||
Financial liabilities held for trading | — | — | — | |||||||||
Other liabilities | 6,499 | 11.2 | 5,846 | |||||||||
Shareholders’ funds | 49,567 | 7.2 | 46,226 | |||||||||
Economic capital allocated | (25,228 | ) | 1.2 | (24,930 | ) | |||||||
| Corporate Center | 37 |
Table of Contents
(Quarterly averages)
| 2015 | 2014 | |||||||||||||||||||||||
| 2Q | 1Q | 4Q | 3Q | 2Q | 1Q | |||||||||||||||||||
Official ECB rate | 0.05 | 0.05 | 0.05 | 0.12 | 0.22 | 0.25 | ||||||||||||||||||
Euribor 3 months | (0.01 | ) | 0.05 | 0.08 | 0.16 | 0.30 | 0.30 | |||||||||||||||||
Euribor 1 year | 0.17 | 0.25 | 0.33 | 0.44 | 0.57 | 0.56 | ||||||||||||||||||
USA Federal rates | 0.25 | 0.25 | 0.25 | 0.25 | 0.25 | 0.25 | ||||||||||||||||||
TIIE (Mexico) | 3.30 | 3.30 | 3.29 | 3.29 | 3.67 | 3.79 | ||||||||||||||||||
CBRT (Turkey) | 8.26 | 7.99 | 8.40 | 8.40 | 9.79 | 9.22 | ||||||||||||||||||
Exchange rates
(Expressed in currency/euro)
| Year-end exchange rates | Average exchange rates | |||||||||||||||||||||||
| 30-06-15 | D% on 30-06-14 | D% on 31-03-15 | D% on 31-12-14 | 1H15 | D% on 1H14 | |||||||||||||||||||
Mexican peso | 17.5331 | 1.0 | (5.8 | ) | 1.9 | 16.8845 | 6.5 | |||||||||||||||||
U.S. dollar | 1.1189 | 22.1 | (3.8 | ) | 8.5 | 1.1155 | 22.9 | |||||||||||||||||
Argentinean peso | 10.1617 | 9.3 | (6.7 | ) | 2.2 | 9.8345 | 9.0 | |||||||||||||||||
Chilean peso | 710.23 | 5.9 | (5.1 | ) | 3.8 | 693.00 | 9.3 | |||||||||||||||||
Colombian peso | 2,890.17 | (11.1 | ) | (4.2 | ) | 0.6 | 2,770.08 | (3.0 | ) | |||||||||||||||
Peruvian new sol | 3.5527 | 7.3 | (6.2 | ) | 1.7 | 3.4576 | 11.0 | |||||||||||||||||
Venezuelan bolivar fuerte | 220.7506 | (93.4 | ) | (6.0 | ) | (93.4 | ) | 220.7506 | (93.4 | ) | ||||||||||||||
Turkish lira | 2.9953 | (3.3 | ) | (6.1 | ) | (5.5 | ) | 2.8623 | 3.7 | |||||||||||||||
| 38 | Annex |
Table of Contents
Other information: Corporate & Investment Banking
| Highlights | ||||||||||
| • | Growth of the loan book in most geographical areas. | |||||||||
| • | Good performance of new deposits. | |||||||||
| • | Favorable performance of revenue from the GTB, Corporate Finance and Global Markets units. | |||||||||
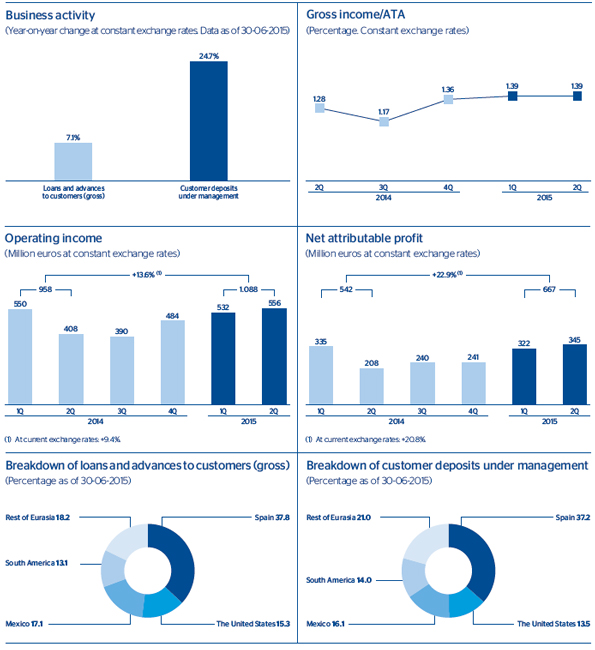
| Other information: Corporate & Investment Banking | 39 |
Table of Contents
Financial statements and relevant business indicators
(Million euros and percentage)
Income statement | 1H15 | D% | D%(1) | 1H14 | ||||||||||||
Net interest income | 703 | (6.4 | ) | 0.7 | 751 | |||||||||||
Net fees and commissions | 363 | (2.5 | ) | (6.1 | ) | 372 | ||||||||||
Net trading income | 447 | 64.2 | 69.2 | 272 | ||||||||||||
Other income/expenses | 66 | 36.3 | (4.1 | ) | 49 | |||||||||||
Gross income | 1,579 | 9.3 | 11.4 | 1,444 | ||||||||||||
Operating expenses | (491 | ) | 9.3 | 6.6 | (449 | ) | ||||||||||
Personnel expenses | (252 | ) | 6.6 | 2.1 | (236 | ) | ||||||||||
General and administrative expenses | (227 | ) | 11.7 | 11.8 | (204 | ) | ||||||||||
Depreciation and amortization | (11 | ) | 22.9 | 13.3 | (9 | ) | ||||||||||
Operating income | 1,088 | 9.4 | 13.6 | 995 | ||||||||||||
Impairment on financial assets (net) | (46 | ) | (60.3 | ) | (59.8 | ) | (117 | ) | ||||||||
Provisions (net) and other gains (losses) | 7 | n.m. | n.m. | (8 | ) | |||||||||||
Income before tax | 1,049 | 20.7 | 25.2 | 870 | ||||||||||||
Income tax | (309 | ) | 25.4 | 24.8 | (246 | ) | ||||||||||
Net income | 740 | 18.8 | 25.3 | 623 | ||||||||||||
Non-controlling interests | (74 | ) | 3.2 | 52.6 | (71 | ) | ||||||||||
Net attributable profit | 667 | 20.8 | 22.9 | 552 | ||||||||||||
Balance sheet | 30-06-15 | D% | D%(1) | 30-06-14 | ||||||||||||
Cash and balances with central banks | 2,681 | (33.2 | ) | (25.3 | ) | 4,015 | ||||||||||
Financial assets | 93,237 | 5.0 | 4.7 | 88,782 | ||||||||||||
Loans and receivables | 81,741 | 12.8 | 10.4 | 72,482 | ||||||||||||
Loans and advances to customers | 55,455 | 10.2 | 7.4 | 50,336 | ||||||||||||
Loans and advances to credit institutions and other | 26,285 | 18.7 | 17.3 | 22,146 | ||||||||||||
Inter-area positions | — | — | — | — | ||||||||||||
Tangible assets | 51 | 112.5 | 97.9 | 24 | ||||||||||||
Other assets | 3,045 | (28.8 | ) | (29.4 | ) | 4,277 | ||||||||||
|
|
|
|
|
|
|
| |||||||||
Total assets/liabilities and equity | 180,756 | 6.6 | 5.7 | 169,581 | ||||||||||||
|
|
|
|
|
|
|
| |||||||||
Deposits from central banks and credit institutions | 55,402 | (2.1 | ) | (2.5 | ) | 56,592 | ||||||||||
Deposits from customers | 51,364 | 12.8 | 19.1 | 45,519 | ||||||||||||
Debt certificates | 1,588 | n.m. | n.m. | (70 | ) | |||||||||||
Subordinated liabilities | 1,663 | 32.1 | 30.9 | 1,259 | ||||||||||||
Inter-area positions | 5,264 | (7.3 | ) | (42.4 | ) | 5,680 | ||||||||||
Financial liabilities held for trading | 56,572 | 8.7 | 8.5 | 52,035 | ||||||||||||
Other liabilities | 4,745 | 6.6 | 6.7 | 4,451 | ||||||||||||
Economic capital allocated | 4,159 | 1.1 | 0.4 | 4,115 | ||||||||||||
Relevant business indicators | 30-06-15 | 31-03-15 | 30-06-14 | |||||||||
Loans and advances to customers (gross) (1) | 56,405 | 57,088 | 52,690 | |||||||||
Customer deposits under management (1-2) | 37,092 | 39,104 | 29,750 | |||||||||
Mutual funds | 1,332 | 1,314 | 766 | |||||||||
Pension funds | — | — | — | |||||||||
Efficiency ratio (%) | 31.1 | 31.3 | 31.1 | |||||||||
NPL ratio (%) | 0.9 | 0.9 | 1.5 | |||||||||
NPL coverage ratio (%) | 133 | 119 | 83 | |||||||||
Cost of risk (%) | 0.39 | 0.17 | 0.47 | |||||||||
| (1) | Figures at constant exchange rates. |
| (2) | Including area’s repos in Mexico. |
Macro and industry trends
The most important macroeconomic and industry trends affecting the Group’s wholesale business in thefirst semester of 2015 have been:
| • | Increased volatility in the financial markets, above all the stock markets, due to the Greek crisis, uncertainty about the Fed’s interest rate rises and the economic slowdown in China. |
| • | More investor activity, boosted by a series of significant events (including the ECB’s bond purchase program, the end to the fixed exchange rate between the euro and the Swiss franc, appreciation of the dollar and uncertainty regarding Greece). |
Activity
All the comments below on rates of change are expressed at a constant exchange rate, unless expressly stated otherwise.
Lending grows 5.5% over the year. Since the end of December 2014 there has been an increase in the wholesale loan portfolio in Spain (up 7.2%), which leaves its volume at the same level as a year ago. This rise was positively influenced by more than 30 syndicated loan operations closed in the quarter in Spain. There has been a notable rise in Mexico, as commented in the corresponding section. It is worth noting that BBVA is a leader in the syndicated loan market by volume in Latin America.
In customerfunds, new deposits have performed well, with a rise of 12.2% in the semester, mainly due to Europe. The positive trend is largely the result of the development of solutions covering the transaction needs of customers and the incorporation of new functionalities and improvements in online banking by the Global Transaction Banking (GTB) unit.
Results
The following are the most important features of the results of thefirst half of 2015 for CIB:
Good performance bygross income, influenced by the positive figures from the GTB, Corporate Finance and Global Markets units. The Global Markets unit had outstanding revenue figures from the corporates segment in all products (up 41.0% year-on-year), as well as the foreign-currency business (up 78.0% year-on-year). By geographical areas, Europe had the best performance in the period.
| 40 | Annex |
Table of Contents
Operating expenses have grown by 6.6% in year-on-year terms, influenced by ongoing investment in technology, and also by the high level of inflation in some countries. Thus, the efficiency ratio accumulated to June is at similar level to that of the same period in 2014 and to the first quarter of 2015.
Lastly,impairment losses on financial assets for the second quarter of 2015 are in line with the first quarter of the year, and there has been a year-on-year fall of 59.8% in the cumulative total.
| Other information: Corporate & Investment Banking | 41 |
Table of Contents
Conciliation of the BBVA Group’s financial statements
These headings present the reconciliation of the Group’s financial statements with the Garanti Group using the equity method versus consolidation in proportion to the percentage of the BBVA Group’s stake in the Turkish entity. In terms of reporting to the market, this consolidation method is deemed better for evaluating the nature and financial effects of
the Garanti Group’s business activities, consistent with the information from previous periods, and more coherent in its effects on solvency. Moreover, the corporate operations heading in 2015 includes the capitral gains from the various sale operations equivalent to 6.34% of BBVA Group’s stake in CNCB and the badwill from Cx operation.
Consolidated income statement BBVA Group
(Million euros)
| Garanti Group consolidated in proportion to the percentage of the Group’s stake and with the heading “Results from corporate operations” | Garanti Group consolidated using the equity method | |||||||||||||||
| 1H15 | 1H14 | 1H15 | 1H14 | |||||||||||||
Net interest income | 7,521 | 7,038 | 7,096 | 6,724 | ||||||||||||
Net fees and commissions | 2,216 | 2,086 | 2,119 | 1,992 | ||||||||||||
Net trading income (1) | 1,425 | 1,176 | 1,446 | 1,151 | ||||||||||||
Dividend income | 236 | 371 | 236 | 370 | ||||||||||||
Income by the equity method | 21 | 1 | 195 | 155 | ||||||||||||
Other operating income and expenses | 135 | (305 | ) | 127 | (310 | ) | ||||||||||
Gross income | 11,554 | 10,368 | 11,219 | 10,082 | ||||||||||||
Operating expenses | (5,718 | ) | (5,275 | ) | (5,499 | ) | (5,091 | ) | ||||||||
Personnel expenses | (2,998 | ) | (2,734 | ) | (2,888 | ) | (2,638 | ) | ||||||||
General and administrative expenses | (2,130 | ) | (1,976 | ) | (2,039 | ) | (1,905 | ) | ||||||||
Depreciation and amortization | (590 | ) | (565 | ) | (572 | ) | (548 | ) | ||||||||
Operating income | 5,836 | 5,093 | 5,720 | 4,991 | ||||||||||||
Impairment on financial assets (net) | (2,208 | ) | (2,177 | ) | (2,137 | ) | (2,126 | ) | ||||||||
Provisions (net) | (394 | ) | (443 | ) | (392 | ) | (433 | ) | ||||||||
Other gains (losses) (2) | (188 | ) | (365 | ) | 708 | (365 | ) | |||||||||
Income before tax | 3,046 | 2,109 | 3,899 | 2,067 | ||||||||||||
Income tax | (815 | ) | (566 | ) | (941 | ) | (524 | ) | ||||||||
Net income from ongoing operations | 2,231 | 1,544 | 2,958 | 1,544 | ||||||||||||
Net income from discontinued operations | — | — | — | — | ||||||||||||
Results from corporate operations | 727 | — | — | — | ||||||||||||
Net income | 2,958 | 1,544 | 2,958 | 1,544 | ||||||||||||
Non-controlling interests | (200 | ) | (215 | ) | (200 | ) | (215 | ) | ||||||||
Net attributable profit | 2,759 | 1,328 | 2,759 | 1,328 | ||||||||||||
| (1) | Includes “Net trading income” and “Exchange rate differences (net)”. |
| (2) | Includes “Impairment losses on other assets (net)”, “Gains (losses) on derecognized assets not classified as non-recurrent assets held for sale” and “Gains (losses) in non-current assets held for sale not classified as discontinued operations”. |
| 42 | Annex |
Table of Contents
Consolidated balance sheet BBVA Group
(Million euros)
| Garanti Group consolidated in proportion to the percentage of the Group’s stake | Garanti Group consolidated using the equity method | |||||||
| 30-06-15 | 30-06-15 | |||||||
Cash and balances with central banks | 30,192 | 27,876 | ||||||
Financial assets held for trading | 82,693 | 82,499 | ||||||
Other financial assets designated at fair value | 3,499 | 3,003 | ||||||
Available-for-sale financial assets | 107,136 | 103,533 | ||||||
Loans and receivables | 415,020 | 399,984 | ||||||
Loans and advances to credit institutions | 29,074 | 27,929 | ||||||
Loans and advances to customers | 374,888 | 361,091 | ||||||
Debt securities | 11,058 | 10,963 | ||||||
Held-to-maturity investments | — | — | ||||||
Investments in entities accounted for using the equity method | 1,013 | 4,660 | ||||||
Tangible assets | 8,753 | 8,570 | ||||||
Intangible assets | 9,212 | 7,829 | ||||||
Other assets (1) | 31,553 | 31,250 | ||||||
|
|
|
| |||||
Total assets | 689,071 | 669,204 | ||||||
|
|
|
| |||||
Financial liabilities held for trading | 56,977 | 56,735 | ||||||
Other financial liabilities designated at fair value | 3,746 | 2,821 | ||||||
Financial liabilities at amortized cost | 546,480 | 528,123 | ||||||
Deposits from central banks and credit institutions | 94,763 | 90,533 | ||||||
Deposits from customers | 363,373 | 351,354 | ||||||
Debt certificates | 62,299 | 61,041 | ||||||
Subordinated liabilities | 16,126 | 16,103 | ||||||
Other financial liabilities | 9,919 | 9,092 | ||||||
Liabilities under insurance contracts | 10,333 | 10,322 | ||||||
Other liabilities (2) | 20,538 | 20,206 | ||||||
|
|
|
| |||||
Total liabilities | 638,074 | 618,207 | ||||||
|
|
|
| |||||
Non-controlling interests | 1,728 | 1,728 | ||||||
Valuation adjustments | (2,909 | ) | (2,909 | ) | ||||
Shareholders’ funds | 52,177 | 52,177 | ||||||
|
|
|
| |||||
Total equity | 50,997 | 50,997 | ||||||
|
|
|
| |||||
Total equity and liabilities | 689,071 | 669,204 | ||||||
|
|
|
| |||||
Memorandum item: | ||||||||
Contingent liabilities | 37,812 | 34,230 | ||||||
| (1) | Includes “Fair value changes of the hedge items in portfolio hedges of interest-rate risk”, “Hedging derivatives”, “Non-current assets held for sale”, “Reinsurance assets”, “Tax assets” and “Other assets”. |
| (2) | Includes “Hedging derivatives”, “Provisions”, “Tax liabilities” and “Other liabilities”. |
| Conciliation of the BBVA Group’s financial statements | 43 |
Table of Contents
BBVA INVESTOR RELATIONS
Headquarters
Ciudad BBVA. Calle Azul, 4
28050 Madrid
SPAIN
Telephone: +34 91 374 65 26
E-mail: bbvainvestorrelations@bbva.com
New York Office
1345 Avenue of the Americas, 44th floor
10105 New York, NY
Telephones: +1 212 728 24 16 / +1 212 728 16 60
More information at:
http://shareholdersandinvestors.bbva.com
Table of Contents

Table of Contents
SIGNATURE
Pursuant to the requirements of the Securities Exchange Act of 1934, the registrant has duly caused this report to be signed on its behalf by the undersigned, thereunto duly authorized.
| Banco Bilbao Vizcaya Argentaria, S.A. | ||||||
| Date: July 31, 2015 | By: | /s/ María Ángeles Peláez | ||||
| Name: | María Ángeles Peláez | |||||
| Title: | Authorized Representative | |||||