UNITED STATES
SECURITIES AND EXCHANGE COMMISSION
WASHINGTON, D.C. 20549
FORM 6-K
REPORT OF FOREIGN ISSUER
PURSUANT TO RULE 13a-16 OR 15d-16
UNDER THE SECURITIES EXCHANGE ACT OF 1934
For the month of July, 2015
Commission file number: 1-10110
BANCO BILBAO VIZCAYA ARGENTARIA, S.A.
(Exact name of Registrant as specified in its charter)
BANK BILBAO VIZCAYA ARGENTARIA, S.A.
(Translation of Registrant’s name into English)
Paseo de la Castellana, 81
28046 Madrid
Spain
(Address of principal executive offices)
Indicate by check mark whether the registrant files or will file annual reports under cover of Form 20-F or Form 40-F:
Form 20-F x Form 40-F ¨
Indicate by check mark if the registrant is submitting the Form 6-K in paper as permitted by Regulation S-T Rule 101(b)(1):
Yes ¨ No x
Indicate by check mark if the registrant is submitting the Form 6-K in paper as permitted by Regulation S-T Rule 101(b)(7):
Yes ¨ No x

2015 Second Quarter Results
Madrid, July 31st 2015
July 31st 2015
2015 Second Quarter Results 2
Disclaimer
This document is only provided for information purposes and does not constitute, nor must it be interpreted as, an offer to sell or exchange or acquire, or an invitation for offers to buy securities issued by any of the aforementioned companies. Any decision to buy or invest in securities in relation to a specific issue must be made solely and exclusively on the basis of the information set out in the pertinent prospectus filed by the company in relation to such specific issue. Nobody who becomes aware of the information contained in this report must regard it as definitive, because it is subject to changes and modifications.
This document contains or may contain forward looking statements (in the usual meaning and within the meaning of the US Private Securities Litigation Act of 1995) regarding intentions, expectations or projections of BBVA or of its management on the date thereof, that refer to miscellaneous aspects, including projections about the future earnings of the business. The statements contained herein are based on our current projections, although the said earnings may be substantially modified in the future by certain risks, uncertainty and other factors relevant that may cause the results or final decisions to differ from such intentions, projections or estimates. These factors include, without limitation, (1) the market situation, macroeconomic factors, regulatory, political or government guidelines, (2) domestic and international stock market movements, exchange rates and interest rates, (3) competitive pressures, (4) technological changes, (5) alterations in the financial situation, creditworthiness or solvency of our customers, debtors or counterparts. These factors could condition and result in actual events differing from the information and intentions stated, projected or forecast in this document and other past or future documents. BBVA does not undertake to publicly revise the contents of this or any other document, either if the events are not exactly as described herein, or if such events lead to changes in the information of this document.
This document may contain summarised information or information that has not been audited, and its recipients are invited to consult the documentation and public information filed by BBVA with stock market supervisory bodies, in particular, the prospectuses and periodical information filed with the Spanish Securities Exchange Commission (CNMV) and the Annual Report on form 20-F and information on form 6-K that are disclosed to the US Securities and Exchange Commission.
Distribution of this document in other jurisdictions may be prohibited, and recipients into whose possession this document comes shall be solely responsible for informing themselves about, and observing any such restrictions. By accepting this document you agree to be bound by the foregoing restrictions.

July 31st 2015
2015 Second Quarter Results 3
Garanti Bank Closing
(1) According to Bloomberg consensus

July 31st 2015
2015 Second Quarter Results 4
Priorities in a Changing Environment
1 2 3
New standard in Drive digital sales New business models
customer experience
4 5 6
Optimize capital Unrivaled efficiency A first class
allocation workforce
July 31st 2015
2015 Second Quarter Results 5
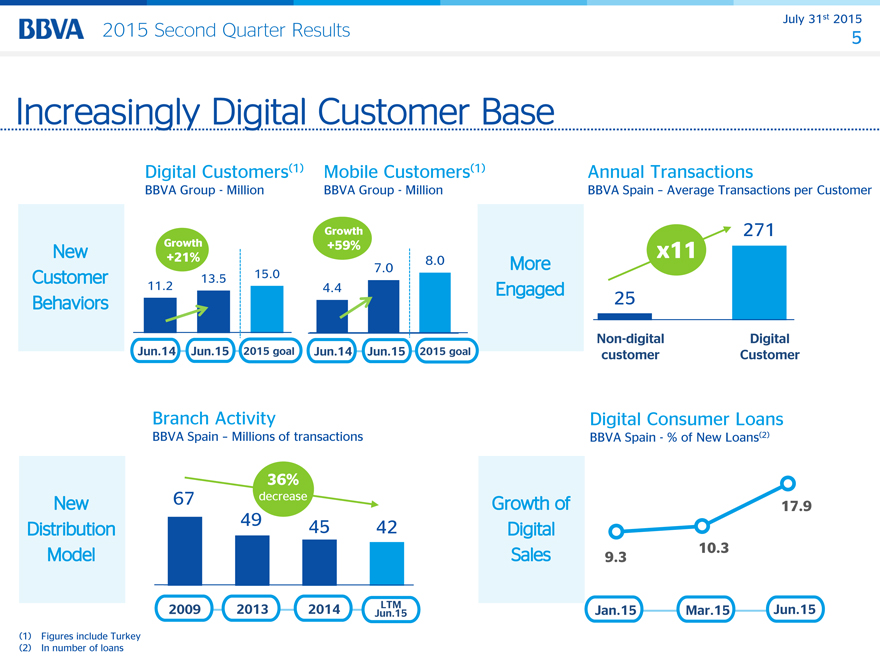
Digital Customers(1) Mobile Customers(1)
BBVA Group—Million BBVA Group—Million
Growth
Growth +59%
+21% 8.0
7.0
13.5 15.0
11.2 4.4
Jun.14 Jun.15 2015 goal Jun.14 Jun.15 2015 goal
Annual Transactions
BBVA Spain – Average Transactions per Customer
271
x11
25
Non-digital Digital
customer Customer
Branch Activity
BBVA Spain – Millions of transactions
36%
67 decrease
49 45 42
2009 2013 2014 Jun.LTM 15
Digital Consumer Loans
BBVA Spain—% of New Loans(2)
17.9
9.3 10.3
Jan.15 Mar.15 Jun.15
Figures include Turkey
In number of loans
July 31st 2015
2015 Second Quarter Results 6
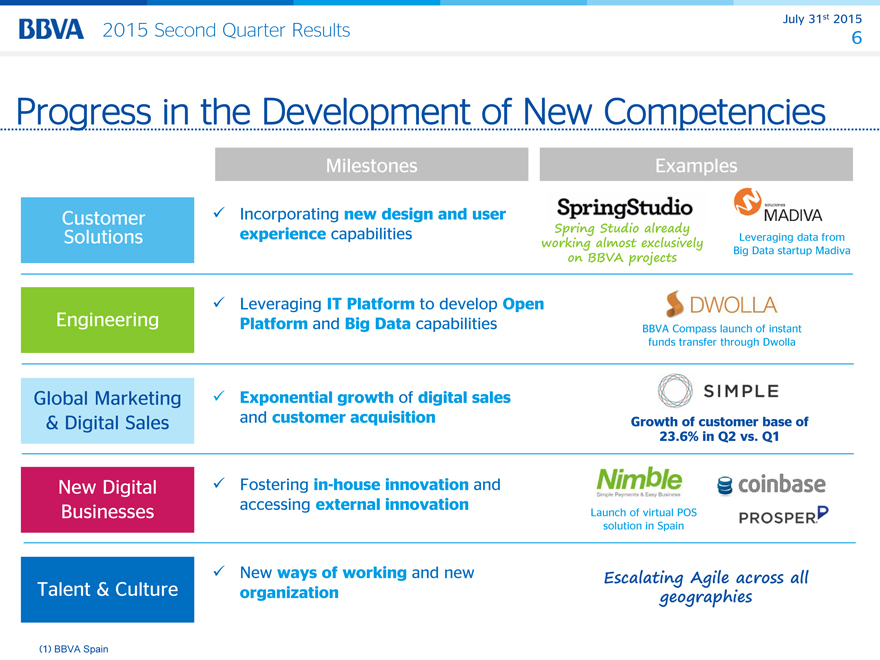
Progress in the Development of New Competencies
Milestones Examples
Customer Incorporating new design and user Spring Studio already
Solutions experience capabilities working almost exclusively Leveraging data from
on BBVA projects Big Data startup Madiva
Leveraging IT Platform to develop Open
Engineering Platform and Big Data capabilities BBVA Compass launch of instant
funds transfer through Dwolla
Global Marketing Exponential growth of digital sales
& Digital Sales and customer acquisition Growth of customer base of
23.6% in Q2 vs. Q1
New Digital Fostering in-house innovation and
Businesses accessing external innovation Launch of virtual POS
solution in Spain
New ways of working and new Escalating Agile across all
Talent & Culture organization geographies
(1) BBVA Spain
July 31st 2015
2015 Second Quarter Results 7
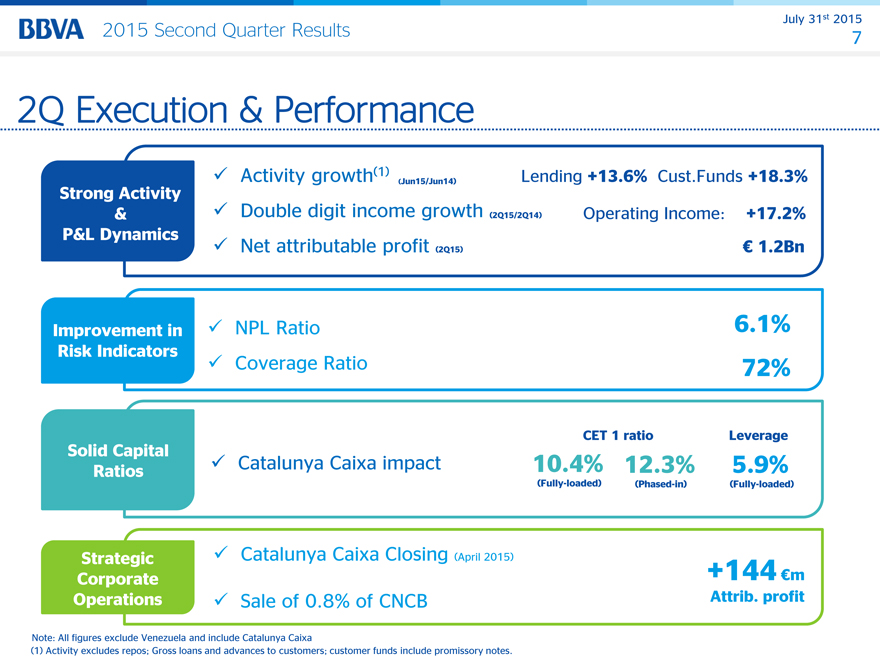
2Q Execution & Performance
Activity growth(1) (Jun15/Jun14) Lending +13.6% Cust.Funds +18.3%
Strong Activity
& Double digit income growth (2Q15/2Q14) Operating Income: +17.2%
P&L Dynamics
Net attributable profit (2Q15) € 1.2Bn
Improvement in NPL Ratio 6.1%
Risk Indicators
Coverage Ratio 72%
CET 1 ratio Leverage
Solid Capital
Ratios Catalunya Caixa impact 10.4% 12.3% 5.9%
(Fully-loaded) (Phased-in) (Fully-loaded)
Corporate Strategic Catalunya Caixa Closing (April 2015) +144 €m
Operations Sale of 0.8% of CNCB Attrib. profit
Note: All figures exclude Venezuela and include Catalunya Caixa
(1) Activity excludes repos; Gross loans and advances to customers; customer funds include promissory notes.
July 31st 2015
2015 Second Quarter Results 8
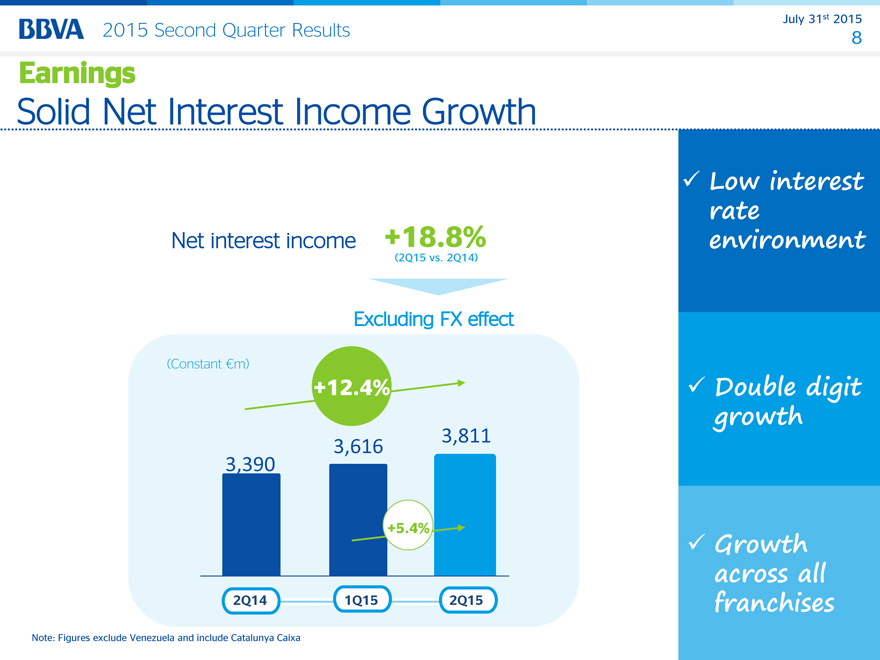
Earnings
Solid Net Interest Income Growth
Net interest income +18.8%
(2Q15 vs. 2Q14)
(Constant €m)
+12.4%
3,616 3,811
3,390
+5.4%
2Q14 1Q15 2Q15
Note: Figures exclude Venezuela and include Catalunya Caixa
Low interest
rate
environment
Double digit
growth
Growth
across all
franchises
July 31st 2015
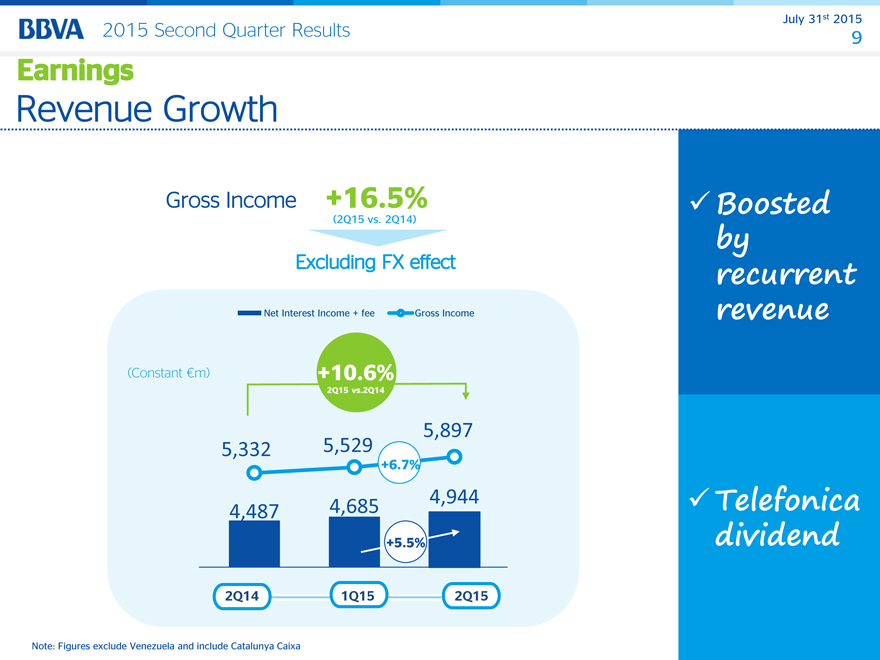
2015 Second Quarter Results 9
Earnings Revenue Growth
Gross Income +16.5%
(2Q15 vs. 2Q14)
Net Interest Income + fee Gross Income
(Constant €m) +10.6%
2Q15 vs.2Q14
5,897
5,332 5,529
+6.7%
4,487 4,685 4,944
+5.5%
2Q14 1Q15 2Q15
Boosted by recurrent revenue
Telefonica dividend
Note: Figures exclude Venezuela and include Catalunya Caixa
July 31st 2015
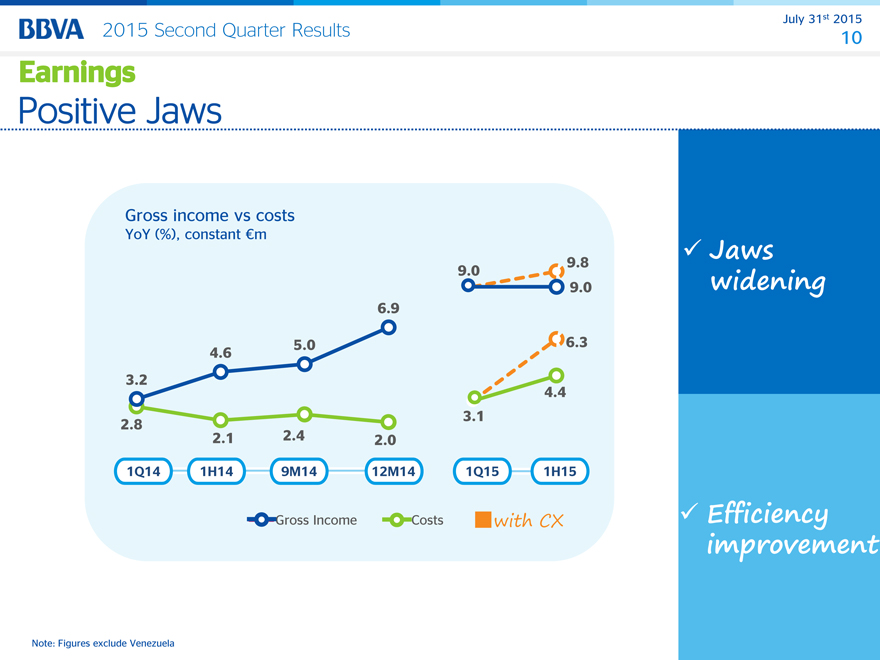
2015 Second Quarter Results 10
Earnings Positive Jaws
Gross income vs costs
YoY (%), constant €m
9.0 9.8
9.0
6.9
4.6 5.0 6.3
3.2
4.4
2.8 3.1
2.1 2.4 2.0
1Q14 1H14 9M14 12M14 1Q15 1H15
Gross Income Costs with CX
Jaws widening
Efficiency improvement
Note: Figures exclude Venezuela
July 31st 2015
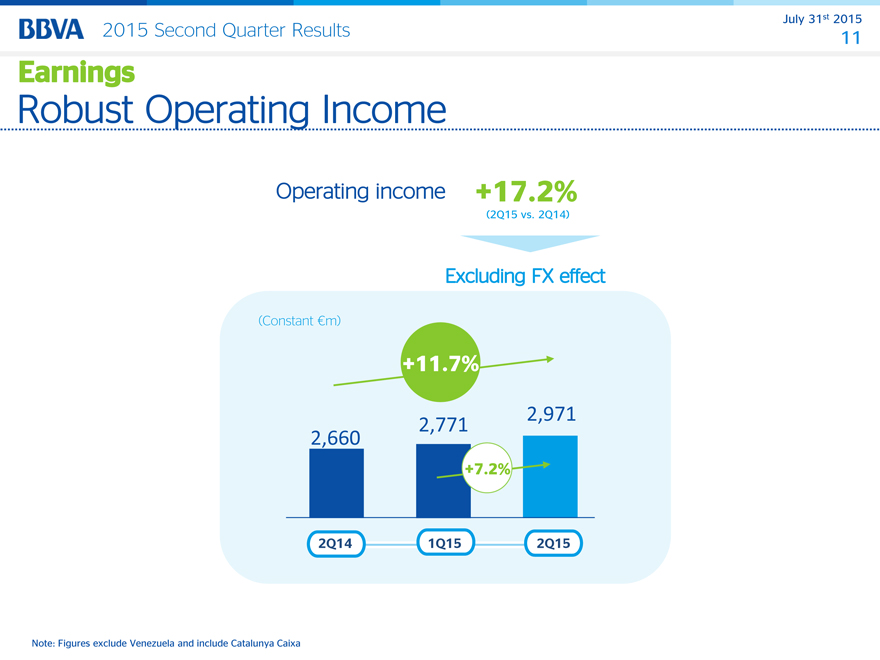
2015 Second Quarter Results 11
Earnings Robust Operating Income
Operating income +17.2%
(2Q15 vs. 2Q14)
(Constant €m)
+11.7%
2,771 2,971
2,660
+7.2%
2Q14 1Q15 2Q15
Note: Figures exclude Venezuela and include Catalunya Caixa
July 31st 2015
2015 Second Quarter Results 12
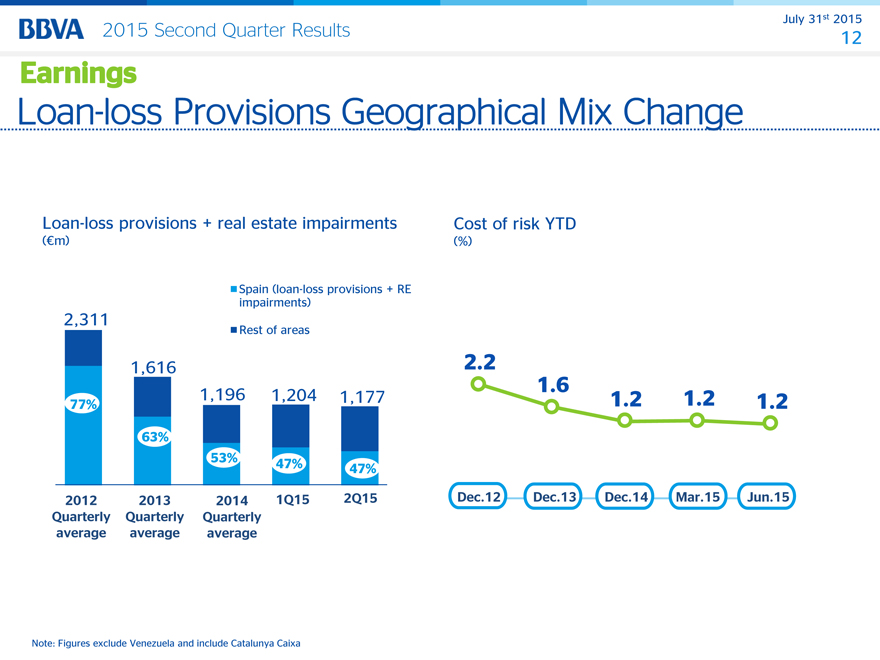
Earnings Loan-loss Provisions Geographical Mix Change
Loan-loss provisions + real estate impairments
(€m)
Spain (loan-loss provisions + RE
impairments)
2,311
Rest of areas
1,616
77% 1,196 1,204 1,177
63%
53%
47% 47%
2012 2013 2014 1Q15 2Q15
Quarterly Quarterly Quarterly
average average average
Cost of risk YTD
(%)
2.2
1.6 1.2 1.2 1.2
Dec.12 Dec.13 Dec.14 Mar.15 Jun.15
Note: Figures exclude Venezuela and include Catalunya Caixa
July 31st 2015
2015 Second Quarter Results 13
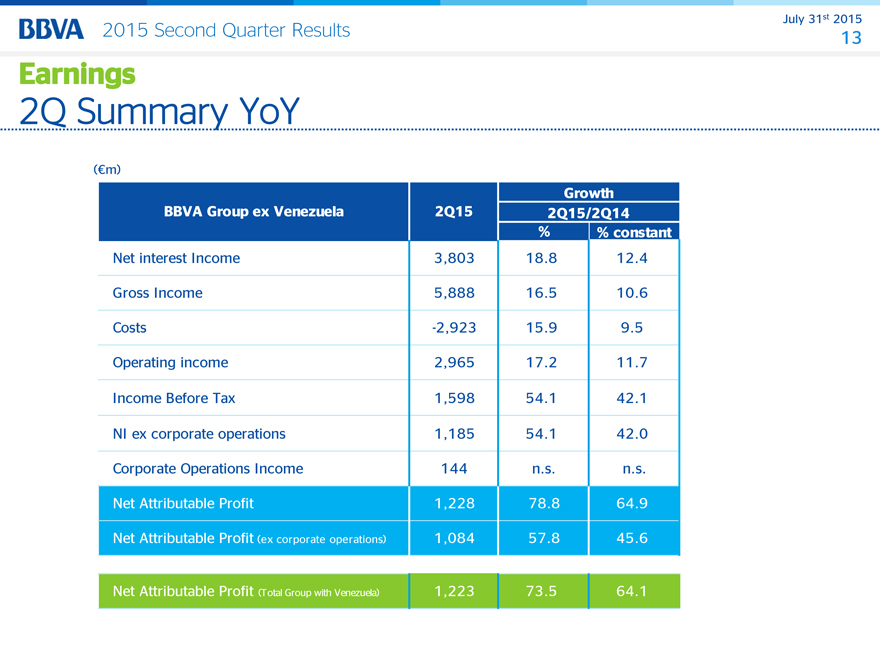
Earnings 2Q Summary YoY
(€m)
Growth
BBVA Group ex Venezuela 2Q15 2Q15/2Q14
% % constant
Net interest Income 3,803 18.8 12.4
Gross Income 5,888 16.5 10.6
Costs -2,923 15.9 9.5
Operating income 2,965 17.2 11.7
Income Before Tax 1,598 54.1 42.1
NI ex corporate operations 1,185 54.1 42.0
Corporate Operations Income 144 n.s. n.s.
Net Attributable Profit 1,228 78.8 64.9
Net Attributable Profit (ex corporate operations) 1,084 57.8 45.6
Net Attributable Profit (Total Group with Venezuela) 1,223 73.5 64.1
July 31st 2015
2015 Second Quarter Results 14
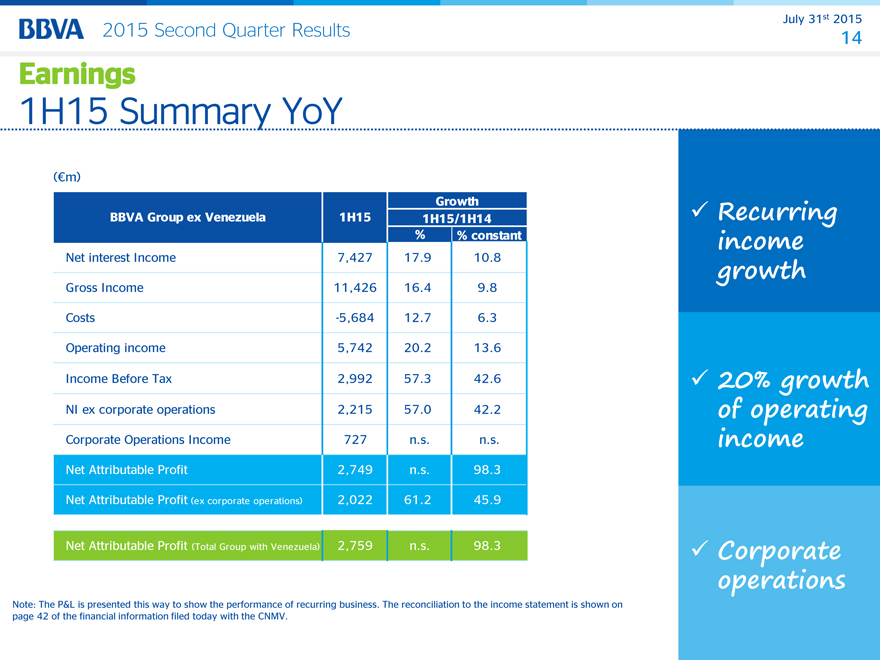
Earnings 1H15 Summary YoY
(€m)
Growth
BBVA Group ex Venezuela 1H15 1H15/1H14
% % constant
Net interest Income 7,427 17.9 10.8
Gross Income 11,426 16.4 9.8
Costs -5,684 12.7 6.3
Operating income 5,742 20.2 13.6
Income Before Tax 2,992 57.3 42.6
NI ex corporate operations 2,215 57.0 42.2
Corporate Operations Income 727 n.s. n.s.
Net Attributable Profit 2,749 n.s. 98.3
Net Attributable Profit (ex corporate operations) 2,022 61.2 45.9
Net Attributable Profit (Total Group with Venezuela) 2,759 n.s. 98.3
Note: The P&L is presented this way to show the performance of recurring business. The reconciliation to the income statement is shown on page 42 of the financial information filed today with the CNMV.
July 31st 2015
2015 Second Quarter Results 15
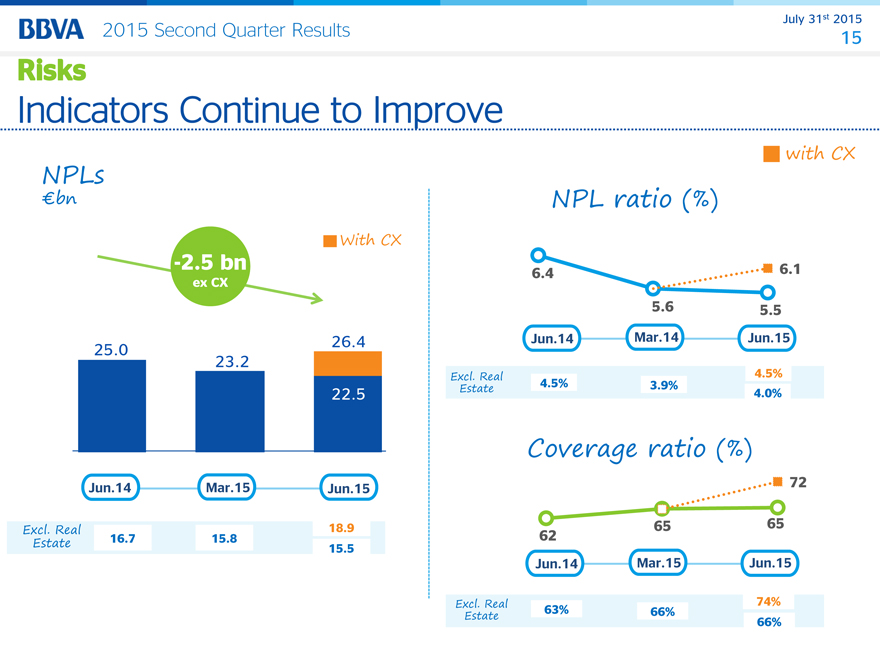
Risks
Indicators Continue to improve
NPLs
€bn
With CX
-2.5 bn
ex CX
25.0 26.4
23.2
22.5
Jun.14 Mar.15 Jun.15
Excl. Real 18.9
Estate 16.7 15.8 15.5
NPL ratio (%)
6.4 6.1
5.6 5.5
Jun.14 Mar.14 Jun.15
Excl. Real 4.5%
Estate 4.5% 3.9% 4.0%
Coverage ratio (%)
72
62 65 65
Jun.14 Mar.15 Jun.15
Excl. Real 74%
Estate 63% 66% 66%
with CX
July 31st 2015
2015 Second Quarter Results 16
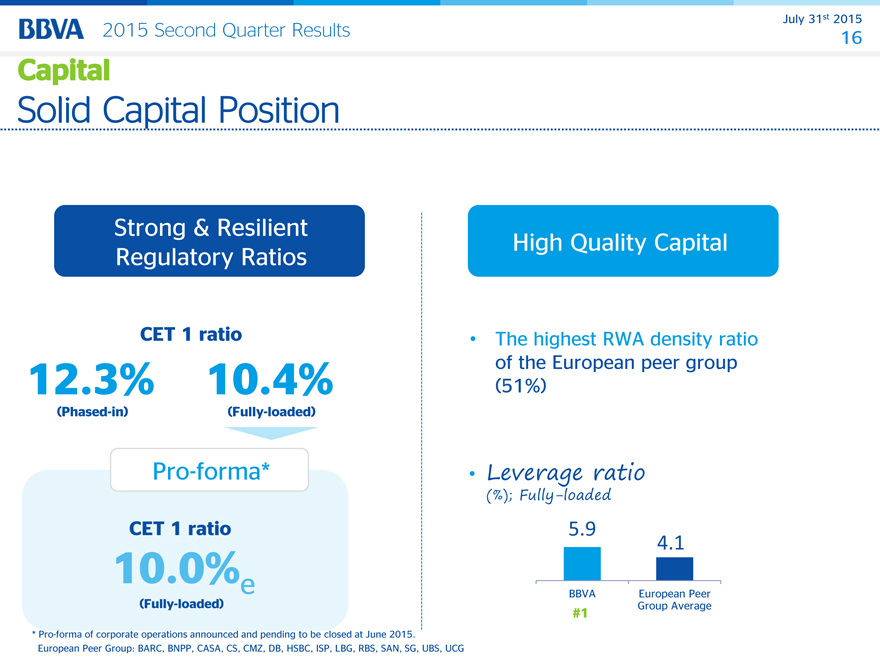
Capital
Solid Capital Positition
Strong & Resilient
Regulatory Ratios
CET 1 ratio
12.3% 10.4%
(Phased-in) (Fully-loaded)
Pro-forma*
CET 1 ratio
10.0%e
(Fully-loaded)
High Quality Capital
The highest RWA density ratio of the European peer group (51%)
Leverage ratio
(%); Fully-loaded
5.9 4.1
BBVA European Peer
#1 Group Average
Pro-forma of corporate operations announced and pending to be closed at June 2015.
European Peer Group: BARC, BNPP, CASA, CS, CMZ, DB, HSBC, ISP, LBG, RBS, SAN, SG, UBS, UCG
July 31st 2015
2015 Second Quarter Results 17
Business Areas
July 31st 2015
2015 Second Quarter Results 18
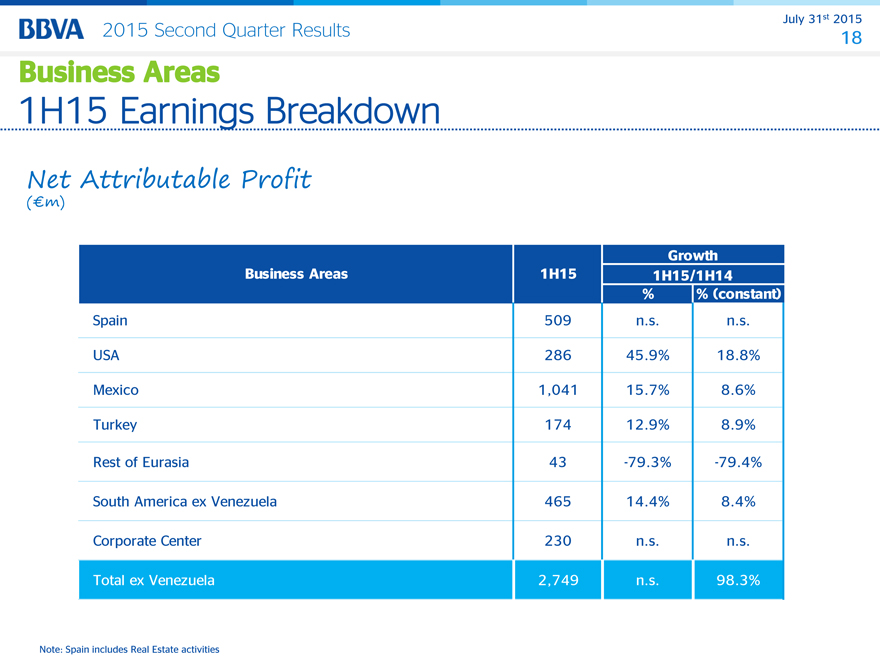
Business Areas
1H15 Earnings Breakdown
Net Attributable Profit
(€m)
Growth
Business Areas 1H15 1H15/1H14
% % (constant)
Spain 509 n.s. n.s.
USA 286 45.9% 18.8%
Mexico 1,041 15.7% 8.6%
Turkey 174 12.9% 8.9%
Rest of Eurasia 43 -79.3% -79.4%
South America ex Venezuela 465 14.4% 8.4%
Corporate Center 230 n.s. n.s.
Total ex Venezuela 2,749 n.s. 98.3%
Note: Spain includes Real Estate activities
2015 Second Quarter Results July 31st 2015
19
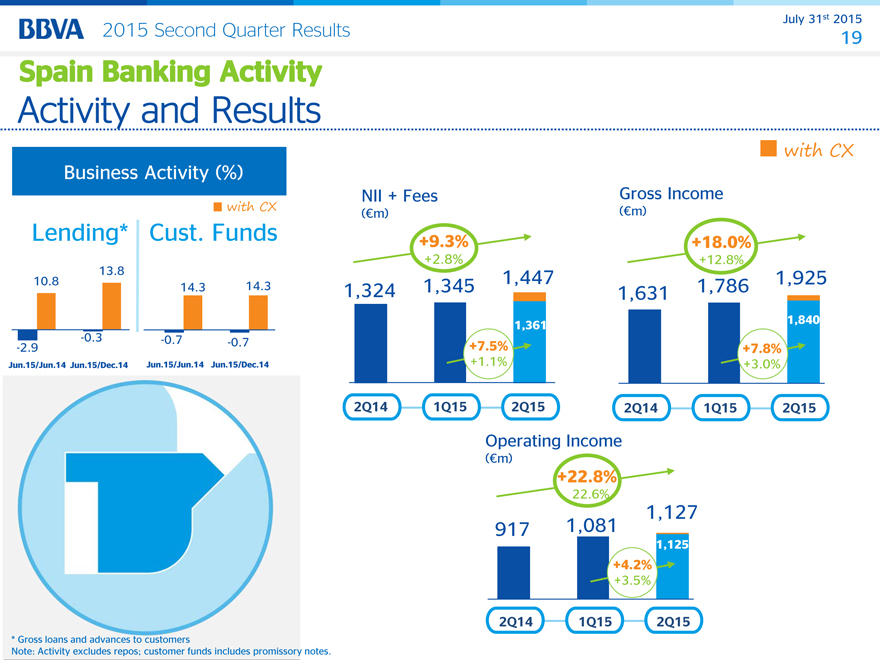
Spain Banking Activity
Activity and Results
Business Activity (%)
(%) with CX
Lending* Cust. Funds
13.8
10.8 14.3 14.3
-2.9 -0.3 -0.7 -0.7
with CX
NII + Fees Gross Income
(€m) (€m)
+9.3% +18.0%
+2.8% +12.8%
1,324 1,345 1,447 1,631 1,786 1,925
1,361 1,840
+7.5% +7.8%
+1.1% +3.0%
2Q14 1Q15 2Q15 2Q14 1Q15 2Q15
Operating Income
(€m)
+22.8%
+22.6%
1,127
917 1,081
1,125
+4.2%
+3.5%
2Q14 1Q15 2Q15
* Gross loans and advances to customers
Note: Activity excludes repos; customer funds includes promissory notes.
July 31st 2015
2015 Second Quarter Results 20
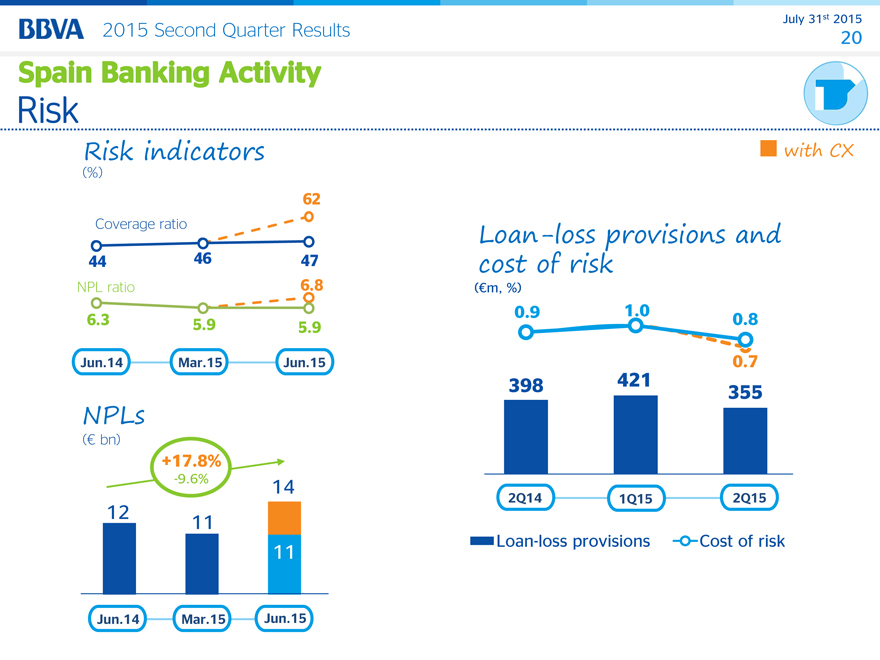
Spain Banking Activity
Risk
Risk indicators
(%)
62
Coverage ratio
44 46 47
NPL ratio 6.8
6.3 5.9 5.9
Jun.14 Mar.15 Jun.15
NPLs
(€ bn)
+17.8%
-9.6% 14
12 11
11
Jun.14 Mar.15 Jun.15
Loan-loss provisions and
cost of risk
(€m, %)
0.9 1.0 0.8
0.7
398 421 355
2Q14 1Q15 2Q15
Loan-loss provisions Cost of risk
July 31st 2015
2015 Second Quarter Results 21
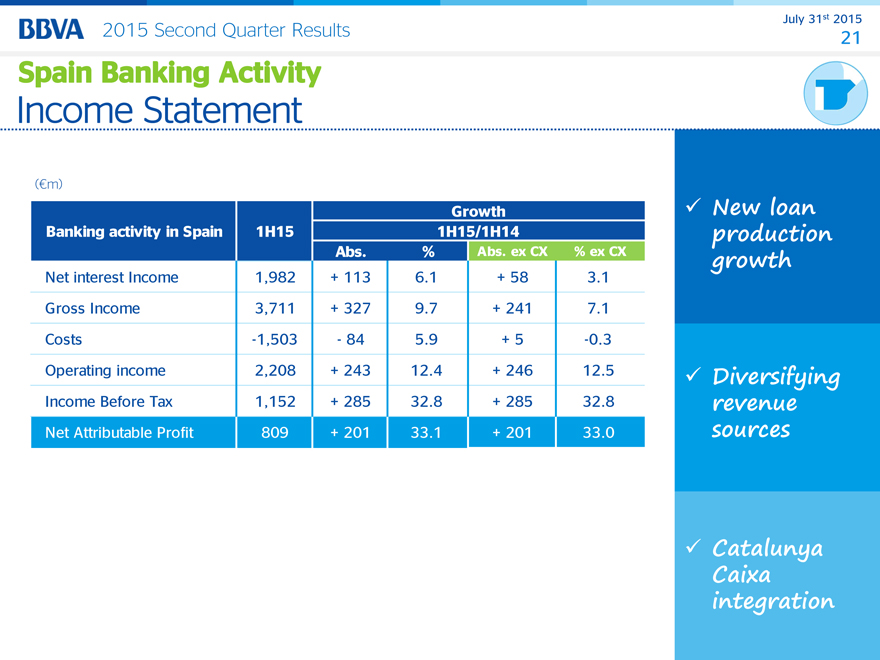
Spain Banking Activity
Income Statement
(€m)
Growth
Banking activity in Spain 1H15 1H15/1H14
Abs. % Abs. ex CX % ex CX
Net interest Income 1,982 + 113 6.1 + 58 3.1
Gross Income 3,711 + 327 9.7 + 241 7.1
Costs -1,503 —84 5.9 + 5 -0.3
Operating income 2,208 + 243 12.4 + 246 12.5
Income Before Tax 1,152 + 285 32.8 + 285 32.8
Net Attributable Profit 809 + 201 33.1 + 201 33.0
New loan production growth
Diversifying revenue sources
Catalunya Caixa integration
July 31 2015
2015 Second Quarter Results 22
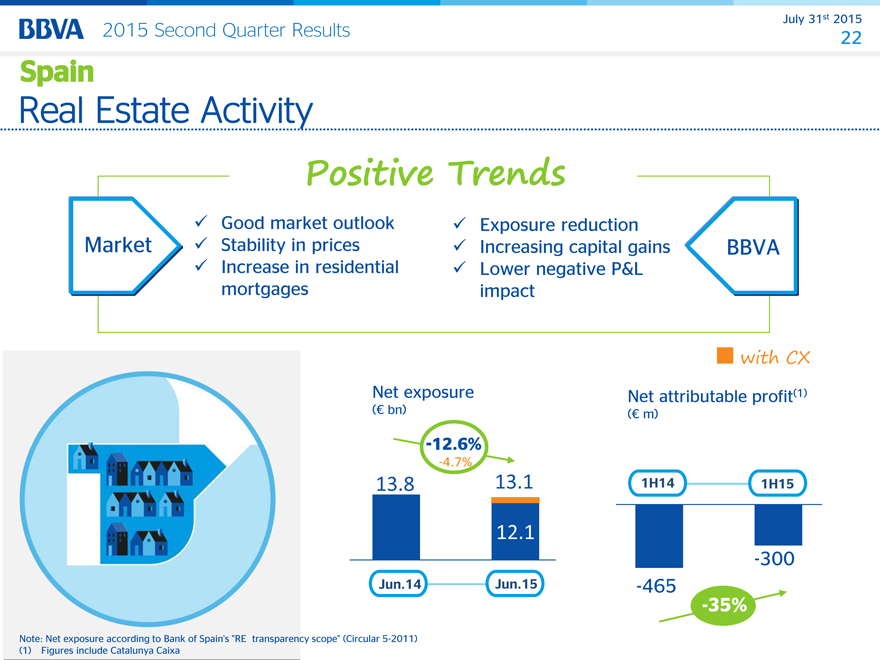
Spain Real Estate Activity
Positive Trends
Good market outlook Exposure reduction
Market Stability in prices Increasing capital gains BBVA
Increase in residential Lower negative P&L
mortgages impact
with CX
Net exposure Net attributable profit(1)
(€ bn) (€ m)
-12.6%
-4.7%
13.8 13.1 1H14 1H15
12.1
-300
Jun.14 Jun.15 -465
-35%
Note: Net exposure according to Bank of Spain’s “RE transparency scope” (Circular 5-2011) (1) Figures include Catalunya Caixa
July 31st 2015
2015 Second Quarter Results 23
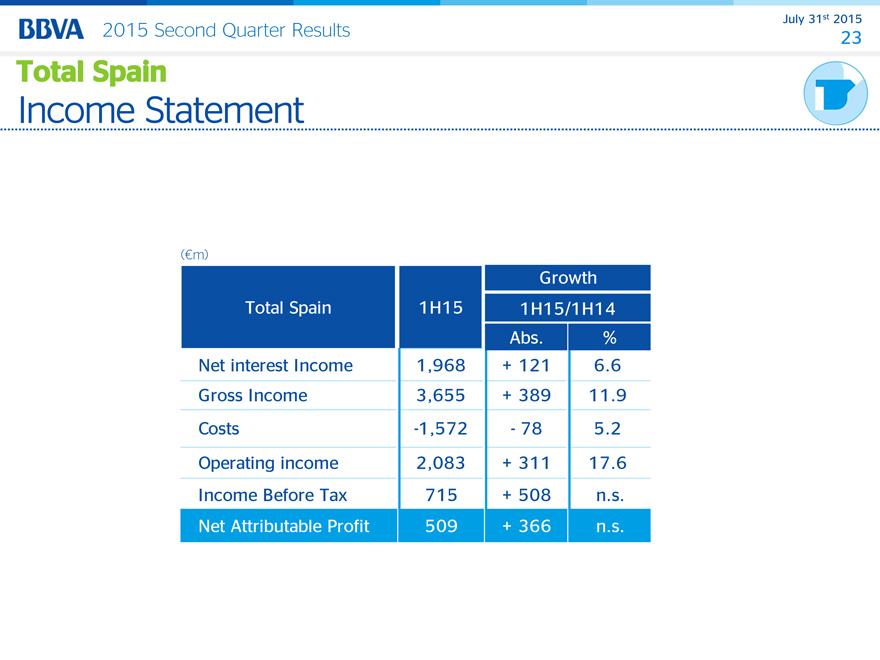
Total Spain
Income Statement
(€m)
Growth
Total Spain 1H15 1H15/1H14
Abs. %
Net interest Income 1,968 + 121 6.6
Gross Income 3,655 + 389 11.9
Costs -1,572 —78 5.2
Operating income 2,083 + 311 17.6
Income Before Tax 715 + 508 n.s.
Net Attributable Profit 509 + 366 n.s.
July 31st 2015
2015 Second Quarter Results 24
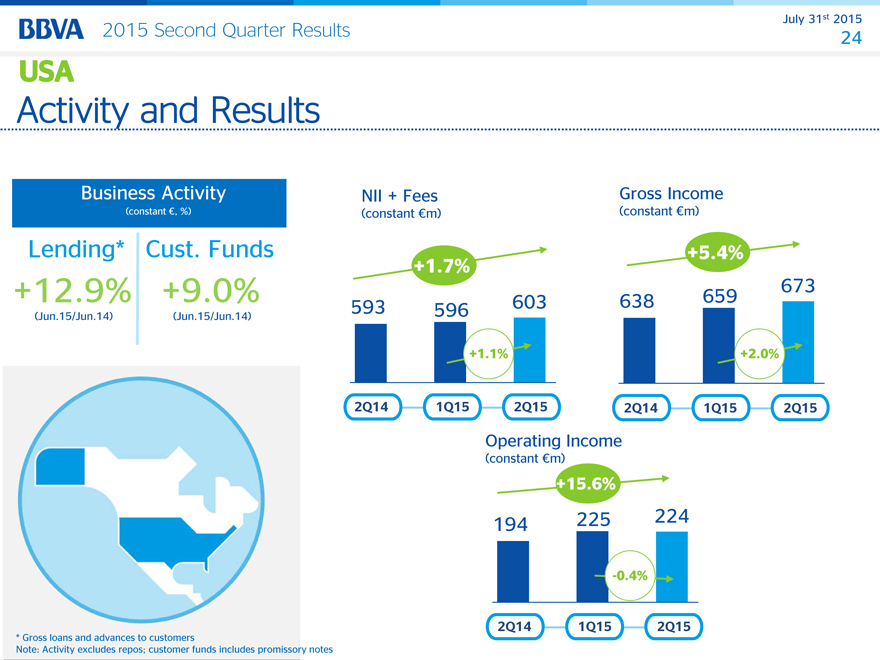
USA Total Spain Income Statement
Activity and Results
Business Activity
(constant €, %)
Lending* Cust. Funds
-2,2%
+12.9% +9.0%
(Jun.15/Jun.14) (Jun.15/Jun.14)
* Gross loans and advances to customers
Note: Activity excludes repos; customer funds includes promissory notes
NII + Fees Gross Income
(constant €m) (constant €m)
+1.7% +5.4%
673
593 596 603 638 659
+1.1% +2.0%
2Q14 1Q15 2Q15 2Q14 1Q15 2Q15
Operating Income
(constant €m)
+15.6%
194 225 224
-0.4%
2Q14 1Q15 2Q15
2015 Second Quarter Results July 31st 2015
25
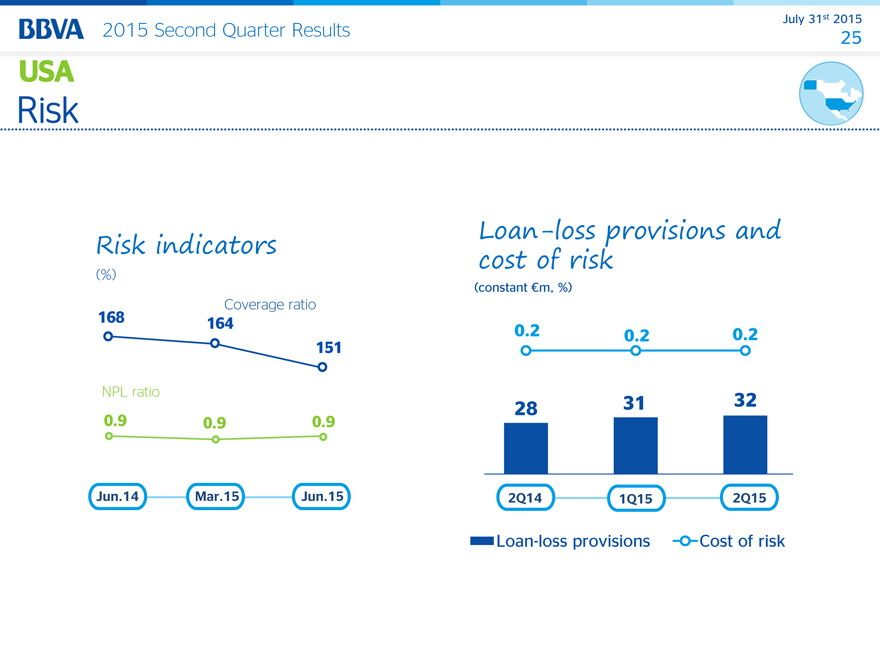
USA Activity and Results
Risk
Risk indicators
(%)
Coverage ratio
168 164
151
NPL ratio
0.9 0.9 0.9
Jun.14 Mar.15 Jun.15
Loan-loss provisions and
cost of risk
(constant €m, %)
0.2 0.2 0.2
28 31 32
2Q14 1Q15 2Q15
Loan-loss provisions Cost of risk
July 31st 2015
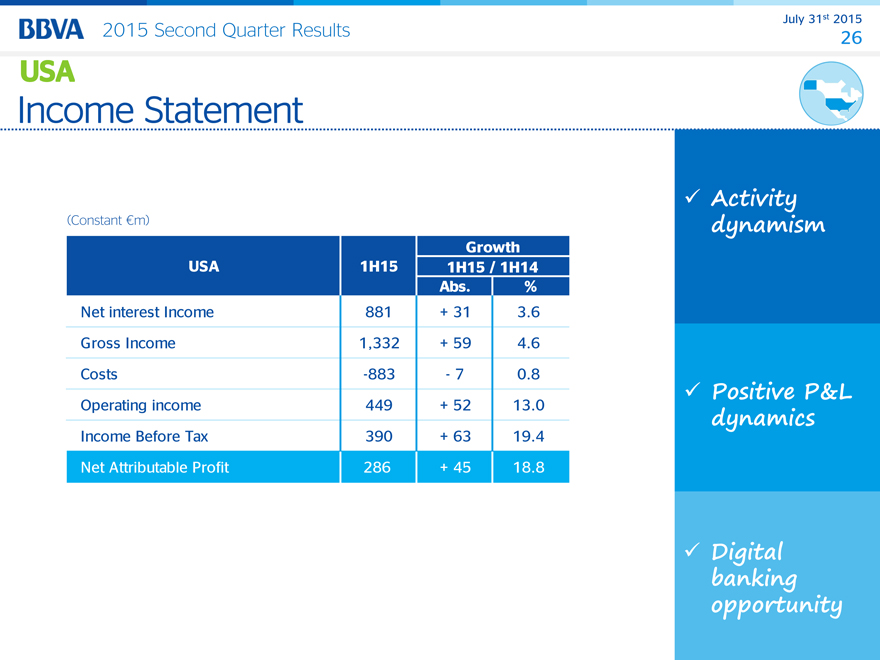
2015 Second Quarter Results 26
USA Risk
Income Statement
(Constant €m)
Growth
USA 1H15 1H15 / 1H14
Abs. %
Net interest Income 881 + 31 3.6
Gross Income 1,332 + 59 4.6
Costs -883 —7 0.8
Operating income 449 + 52 13.0
Income Before Tax 390 + 63 19.4
Net Attributable Profit 286 + 45 18.8
Activity dynamism
Positive P&L dynamics
Digital banking opportunity
July 31st 2015
income statement USA
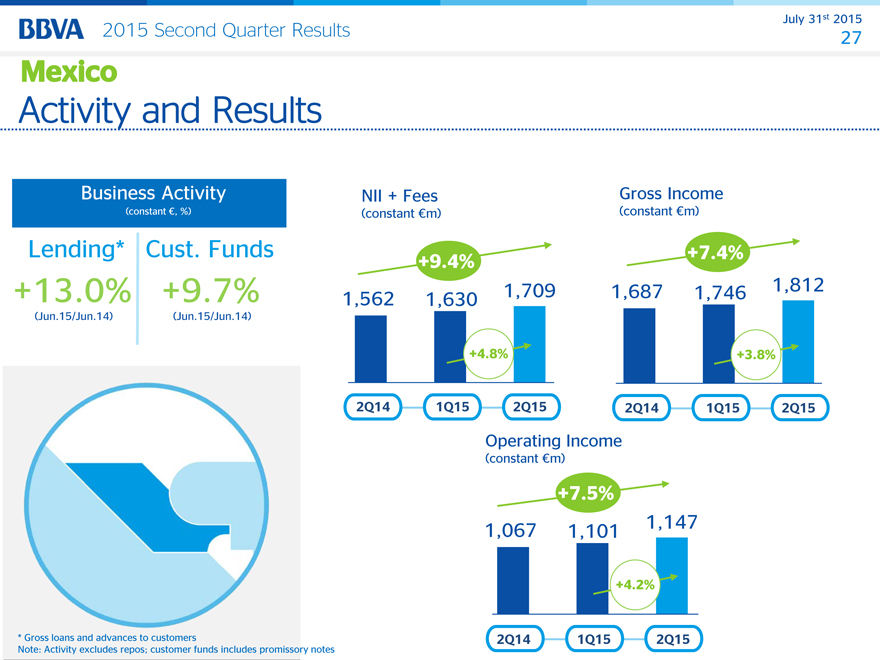
2015 Second Quarter Results 27
Business Activity
(constant €, %)
Lending* Cust. Funds
-2,2%
+13.0% +9.7%
(Jun.15/Jun. -2,2% 14) (Jun.15/Jun.14)
* Gross loans and advances to customers
Note: Activity excludes repos; customer funds includes promissory notes
NII + Fees Gross Income
(constant €m) (constant €m)
+9.4% +7.4%
1,562 1,630 1,709 1,687 1,746 1,812
+4.8% +3.8%
2Q14 1Q15 2Q15 2Q14 1Q15 2Q15
Operating Income
(constant €m)
+7.5%
1,067 1,101 1,147
+4.2%
2Q14 1Q15 2Q15
July 31st 2015
2015 Second Quarter Results 28
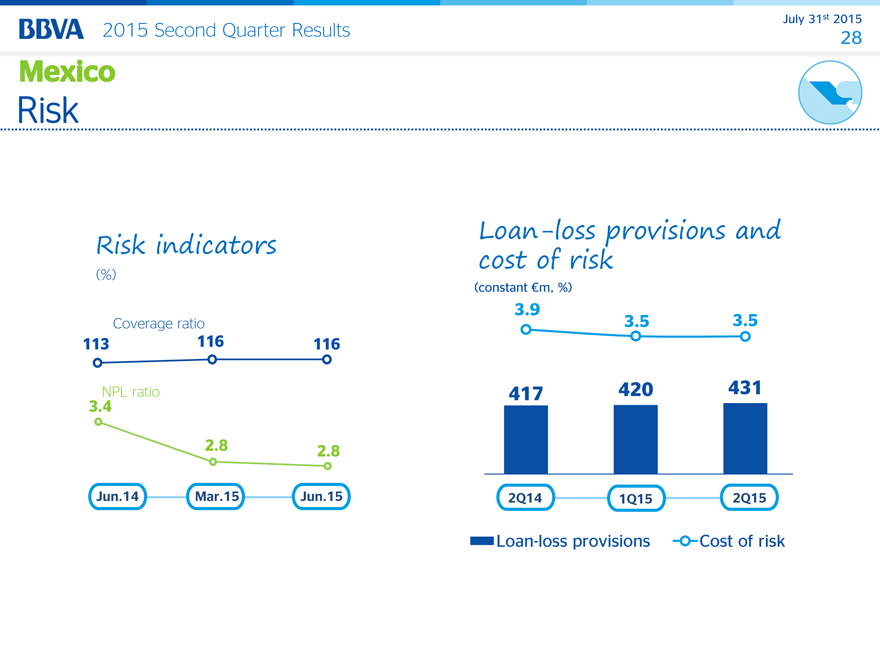
Risk indicators
(%) Mexico Activity and Results
Coverage ratio
113 116 116
NPL ratio
3.4
2.8 2.8
Jun.14 Mar.15 Jun.15
Loan-loss provisions and
cost of risk
(constant €m, %)
3.9 3.5 3.5
417 420 431
2Q14 1Q15 2Q15
Loan-loss provisions Cost of risk
July 31st 2015
2015 Second Quarter Results 29
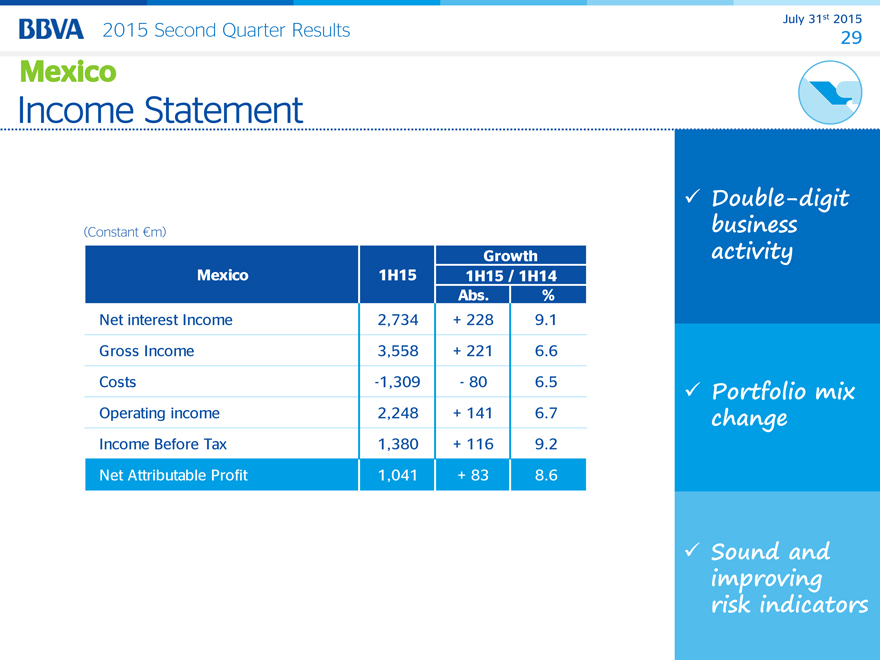
(Constant m)
Growth
Mexico 1H15 1H15 / 1H14
Abs. %
Net interest Income 2,734 + 228 9.1
Gross Income 3,558 + 221 6.6
Costs -1,309 - 80 6.5
Operating income 2,248 + 141 6.7
Income Before Tax 1,380 + 116 9.2
Net Attributable Profit 1,041 + 83 8.6
Double-digit business activity
Portfolio mix change
Sound and improving risk indicators
July 31st 2015
2015 Second Quarter Results 30
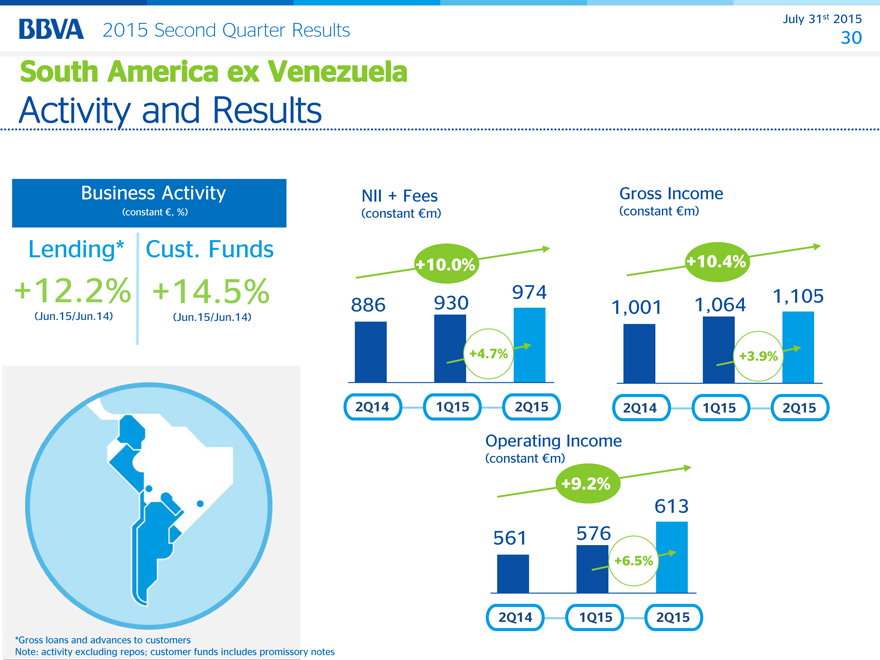
Business Activity
(constant €, %) Mexico income statement
Lending* Cust. Funds
-2,2%
+12.2% +14.5%
(Jun.15/Jun. -2,2% 14) (Jun.15/Jun.14)
*Gross loans and advances to customers
Note: activity excluding repos; customer funds includes promissory notes
NII + Fees Gross Income
(constant €m) (constant €m)
+10.0% +10.4%
886 930 974 1,001 1,064 1,105
+4.7% +3.9%
2Q14 1Q15 2Q15 2Q14 1Q15 2Q15
Operating Income
(constant €m)
+9.2%
613
561 576
+6.5%
2Q14 1Q15 2Q15
July 31st 2015
2015 Second Quarter Results 31
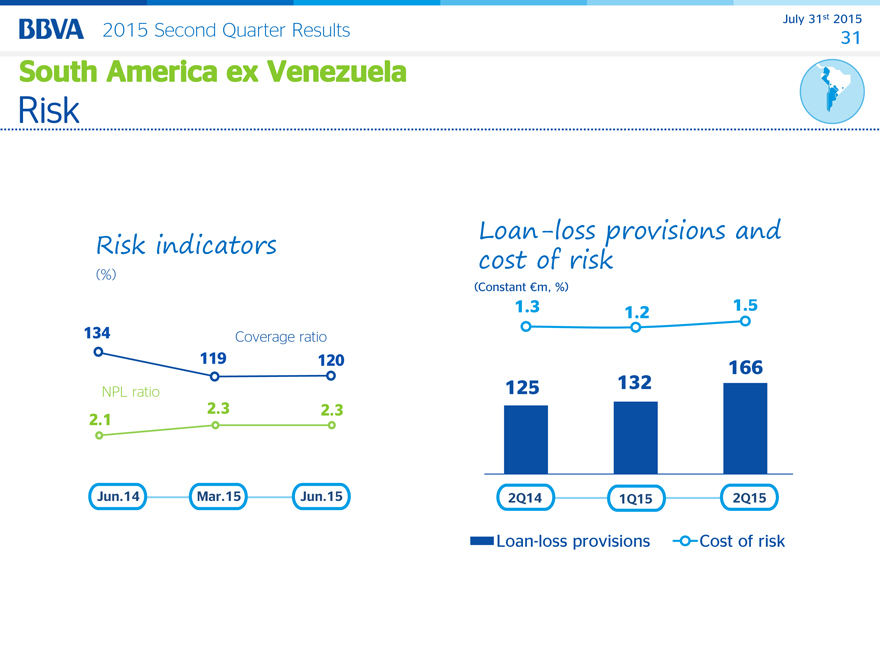
Risk indicators
South America ex Venezuela
Activity and Results
(%)
134 Coverage ratio
119 120
NPL ratio
2.1 2.3 2.3
Jun.14 Mar.15 Jun.15
Loan-loss provisions and
cost of risk
(Constant €m, %)
1.3 1.2 1.5
166
125 132
2Q14 1Q15 2Q15
Loan-loss provisions Cost of risk
July 31st 2015
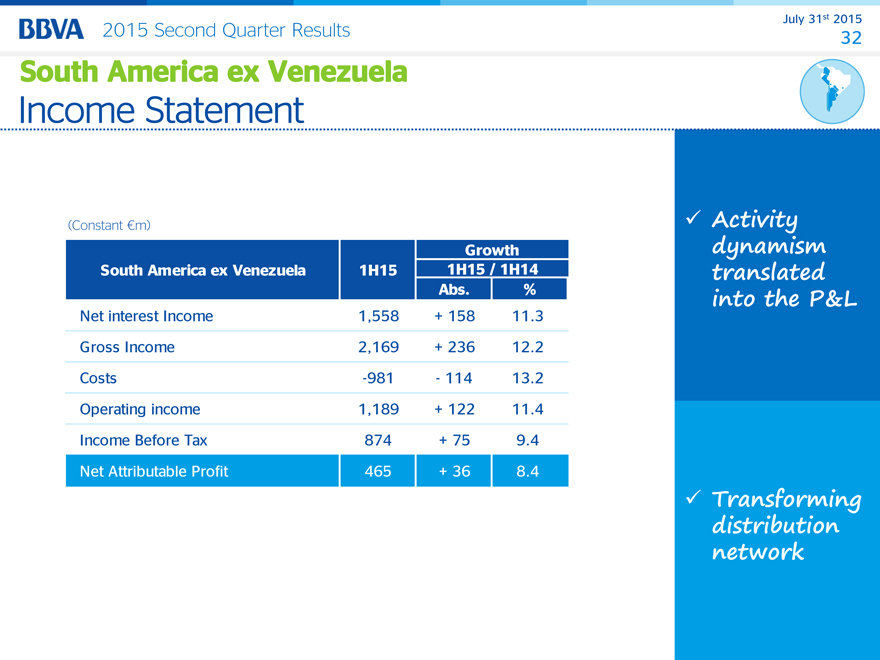
2015 Second Quarter Results 32
(Constant €m)
Growth
South America ex Venezuela 1H15 1H15 / 1H14
Abs. %
Net interest Income 1,558 + 158 11.3
Gross Income 2,169 + 236 12.2
Costs -981 —114 13.2
Operating income 1,189 + 122 11.4
Income Before Tax 874 + 75 9.4
Net Attributable Profit 465 + 36 8.4
Activity dynamism translated into the P&L
Transforming distribution network
July 31st 2015
2015 Second Quarter Results 33
South America ex Venezuela
income statement
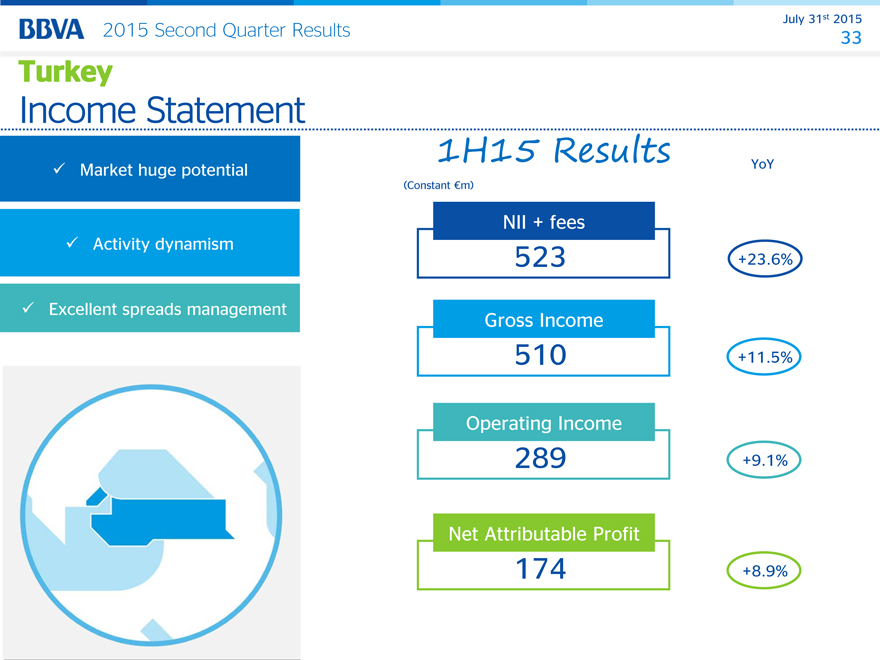
Market huge potential Activity dynamism
Excellent spreads management
YoY
(Constant €m)
NII + fees
523 +23.6%
Gross Income
510 +11.5%
Operating Income
289 +9.1%
Net Attributable Profit
174 +8.9%
July 31st 2015
2015 Second Quarter Results 34
Takeaways Turkey
income statement
July 31st 2015
2015 Second Quarter Results 35
Annex
July 31st 2015
2015 Second Quarter Results 36
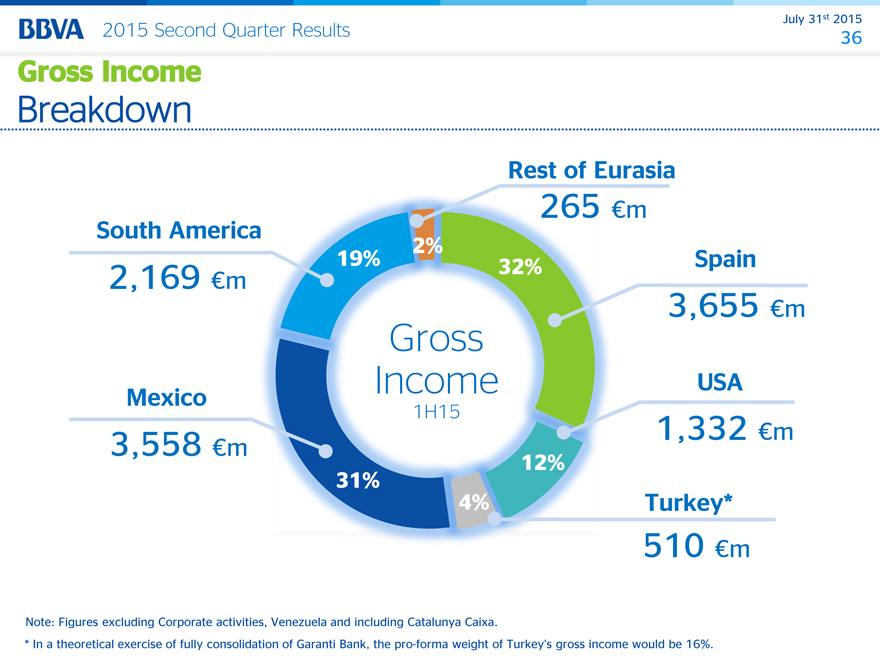
Rest of Eurasia
265 €m
South America 2%
2,169 €m 19% 32% Spain
3,655 €m
Gross
Mexico Income USA
1H15
3,558 €m 1,332 €m
12%
31%
4% Turkey*
510 €m
Note: Figures excluding Corporate activities, Venezuela and including Catalunya Caixa.
* In a theoretical exercise of fully consolidation of Garanti Bank, the pro-forma weight of Turkey’s gross income would be 16%.
July 31st 2015
2015 Second Quarter Results 37
Net attributable profit
€m
Businesses € +522 m
258 2,759
165 45 14 -27 83 36 4
201
588
63
1,328
1H14 €m FX Effect Cor. Banking RE activity USA Turkey Rest of Eurasia Mexico South America Venezuela Corporate 1H15 €m
Operation* activity spain Spain Ex VZA Center constant
YoY (%) 33.0 -35.4 18.8 8.9 -38.6 8.6 8.4 87.3 n.s.
* Includes impact of lower dividends received from CNCB .
July 31st 2015
2015 Second Quarter Results 38
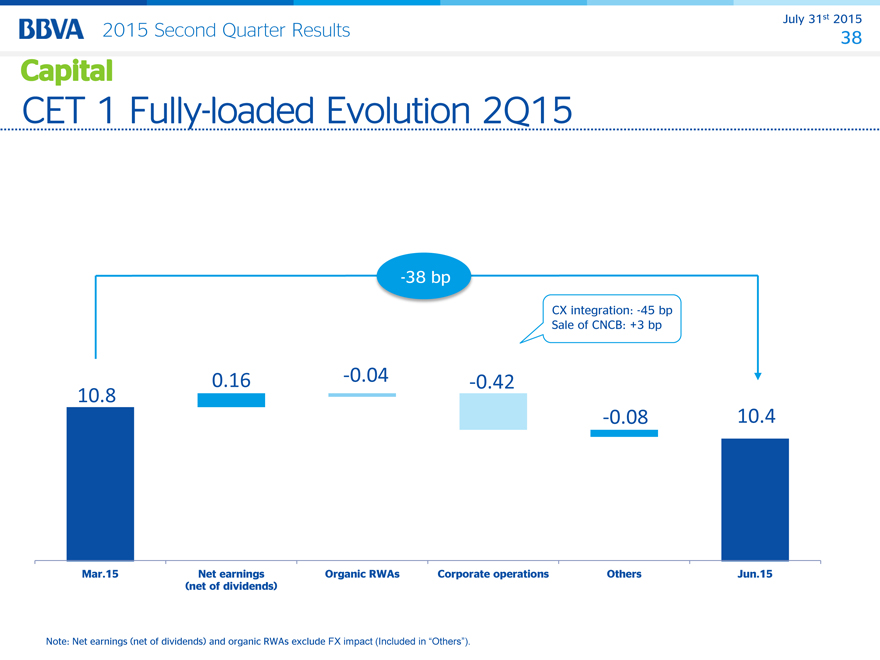
-38 bp
CX integration: -45 bp
Sale of CNCB: +3 bp
10.8 0.16 -0.04 -0.42
-0.08 10.4
Mar.15 Net earnings Organic RWAs Corporate operations Others Jun.15
(net of dividends)
July 31st 2015
2015 Second Quarter Results 39
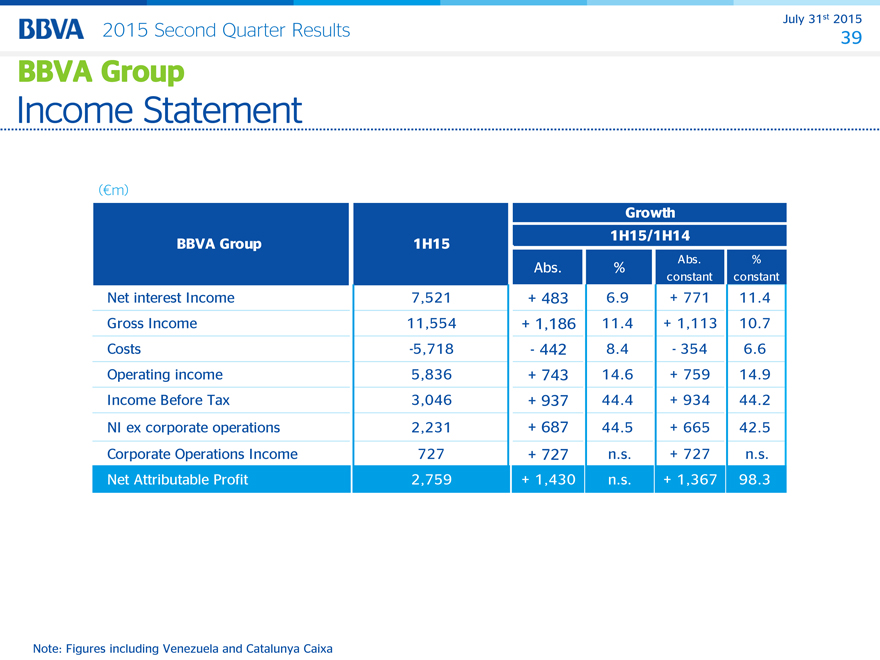
(€m)
Growth
BBVA Group 1H15 1H15/1H14
Abs. % Abs. %
constant constant
Net interest Income 7,521 + 483 6.9 + 771 11.4
Gross Income 11,554 + 1,186 11.4 + 1,113 10.7
Costs -5,718 —442 8.4 —354 6.6
Operating income 5,836 + 743 14.6 + 759 14.9
Income Before Tax 3,046 + 937 44.4 + 934 44.2
NI ex corporate operations 2,231 + 687 44.5 + 665 42.5
Corporate Operations Income 727 + 727 n.s. + 727 n.s.
Net Attributable Profit 2,759 + 1,430 n.s. + 1,367 98.3
Note: Figures including Venezuela and Catalunya Caixa
July 31st 2015
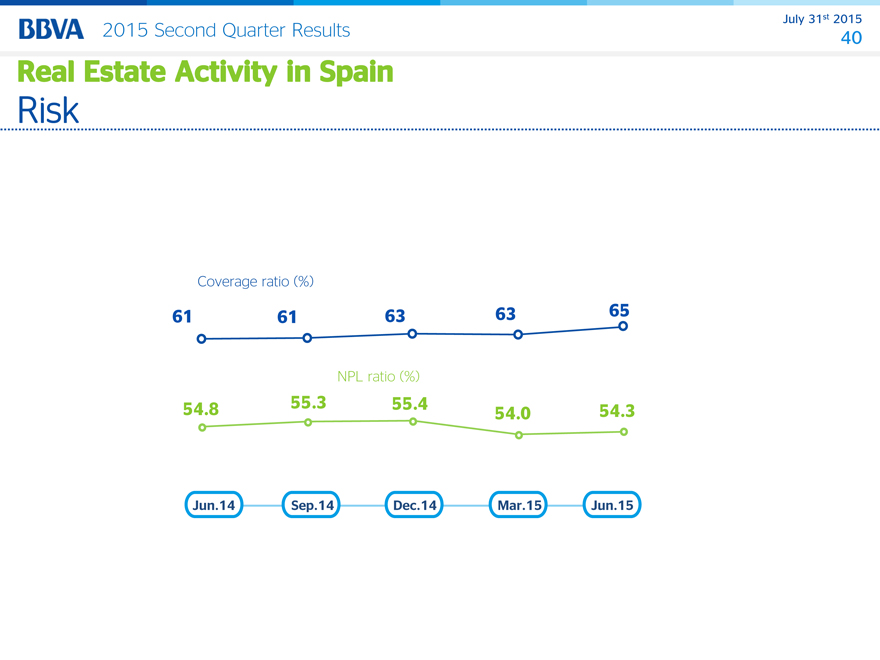
2015 Second Quarter Results 40
Coverage ratio (%)
61 61 63 63 65
NPL ratio (%)
54.8 55.3 55.4 54.0 54.3
Jun.14 Sep.14 Dec.14 Mar.15 Jun.15
July 31st 2015
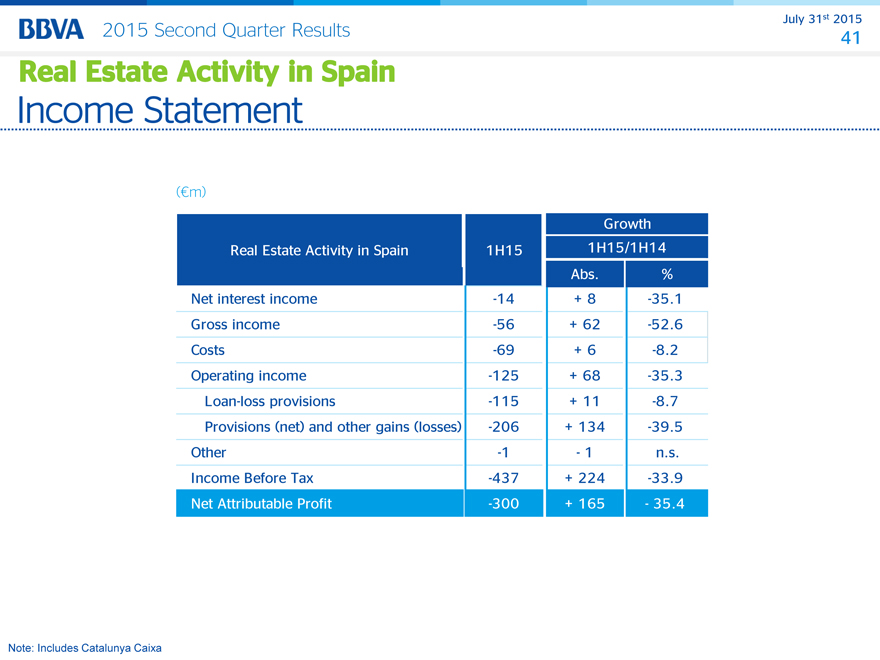
2015 Second Quarter Results 41
(€m)
Growth
Real Estate Activity in Spain 1H15 1H15/1H14
Abs. %
Net interest income -14 + 8 -35.1
Gross income -56 + 62 -52.6
Costs -69 + 6 -8.2
Operating income -125 + 68 -35.3
Loan-loss provisions -115 + 11 -8.7
Provisions (net) and other gains (losses) -206 + 134 -39.5
Other -1 —1 n.s.
Income Before Tax -437 + 224 -33.9
Net Attributable Profit -300 + 165 —35.4
Note: Includes Catalunya Caixa
July 31st 2015
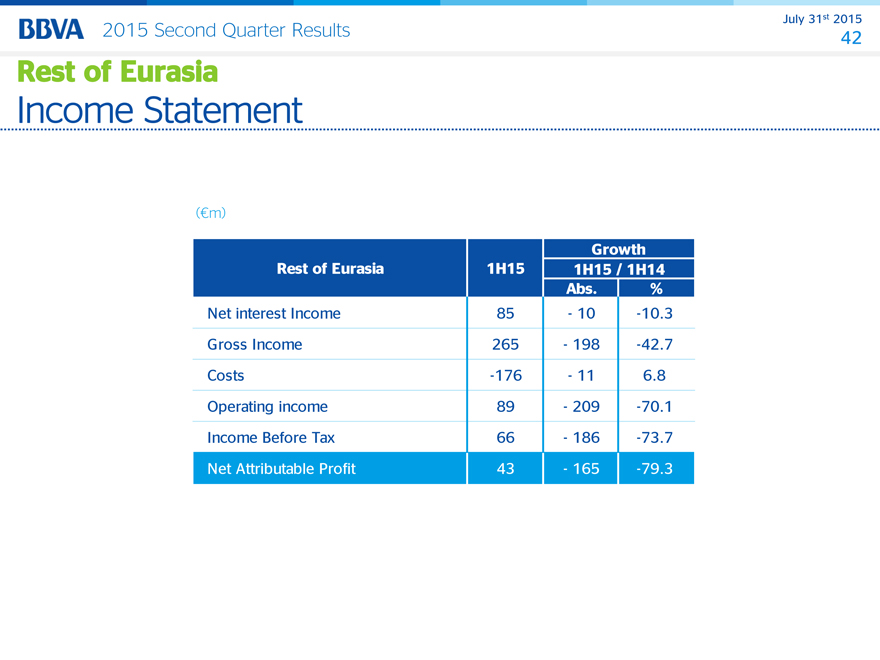
2015 Second Quarter Results 42
(€m)
Growth
Rest of Eurasia 1H15 1H15 / 1H14
Abs. %
Net interest Income 85 —10 -10.3
Gross Income 265 — 198 -42.7
Costs -176 —11 6.8
Operating income 89 — 209 -70.1
Income Before Tax 66 — 186 -73.7
Net Attributable Profit 43 — 165 -79.3
July 31st 2015
2015 Second Quarter Results 43
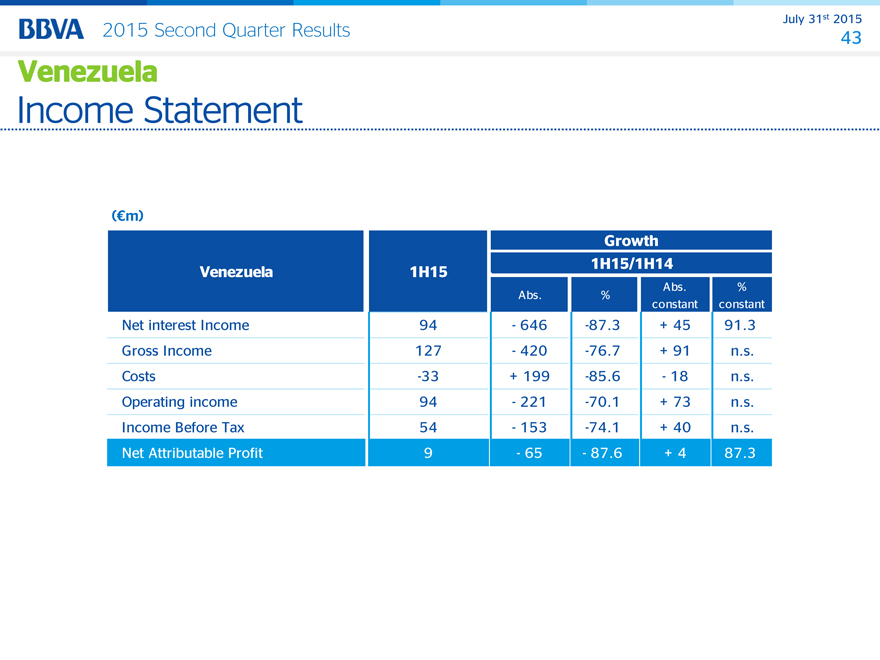
(€m)
Growth
Venezuela 1H15 1H15/1H14
Abs. %
Abs. %
constant constant
Net interest Income 94 — 646 -87.3 + 45 91.3
Gross Income N 127 — 420 -76.7 + 91 n.s.
Costs g -33 + 199 -85.6 —18 n.s.
Operating income 94 — 221 -70.1 + 73 n.s.
Income Before Tax 54 — 153 -74.1 + 40 n.s.
Net Attributable Profit B 9 —65 —87.6 + 4 87.3
July 31st 2015
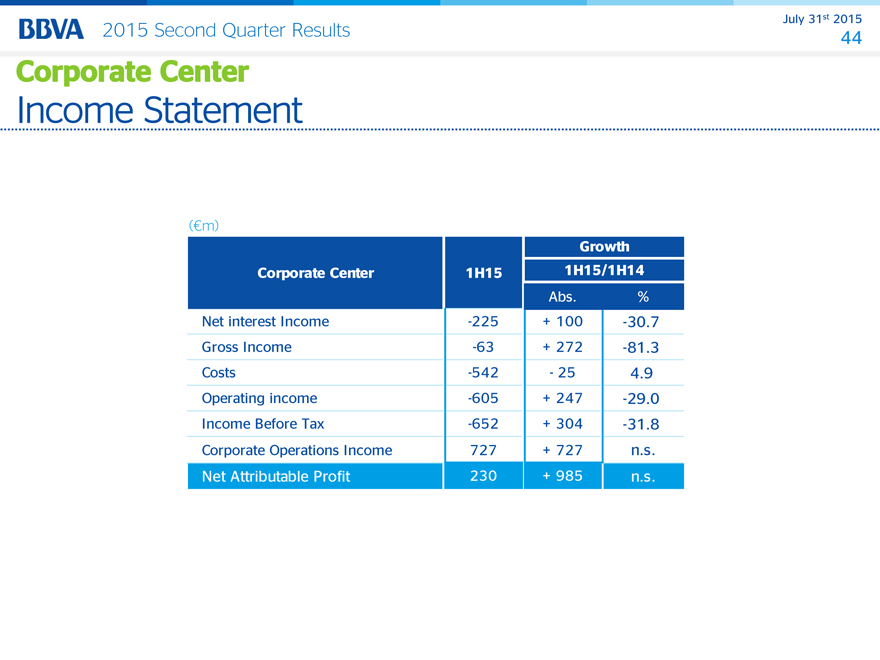
2015 Second Quarter Results 44
(€m)
Growth
Corporate Center 1H15 1H15/1H14
Abs. %
Net interest Income -225 + 100 -30.7
Gross Income -63 + 272 -81.3
Costs -542 —25 4.9
Operating income -605 + 247 -29.0
Income Before Tax -652 + 304 -31.8
Corporate Operations Income 727 + 727 n.s.
Net Attributable Profit 230 + 985 n.s.
July 31st 2015
2015 Second Quarter Results 45
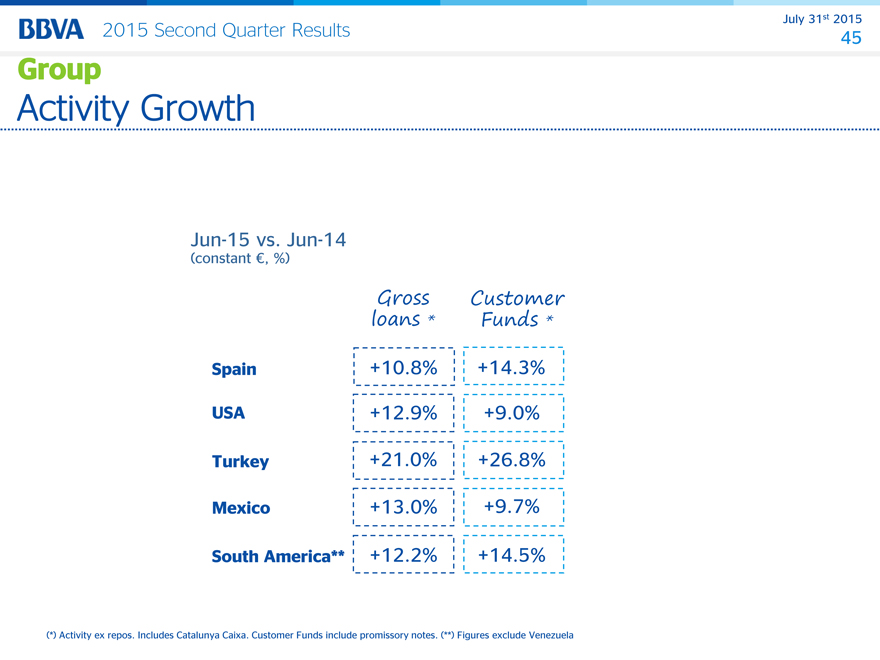
Jun-15 vs. Jun-14
(constant €, %)
Gross Customer
loans * Funds *
Spain +10.8% +14.3%
USA +12.9% +9.0%
Turkey +21.0% +26.8%
Mexico +13.0% +9.7%
South America** +12.2% +14.5%
(*) Activity ex repos. Includes Catalunya Caixa. Customer Funds include promissory notes. (**) Figures exclude Venezuela
July 31st 2015
2015 Second Quarter Results 46
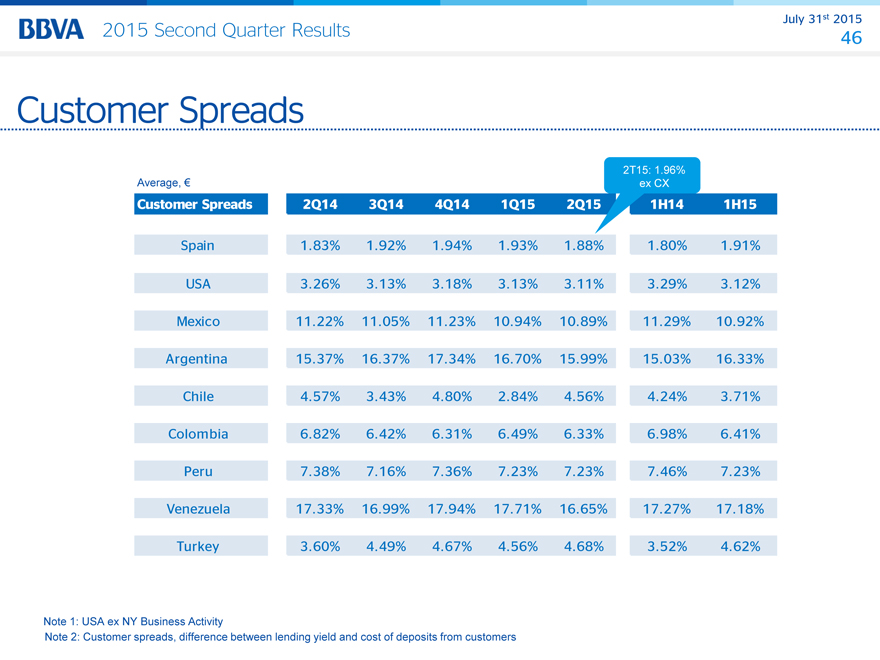
2T15: 1.96%
Average, € ex CX
Customer Spreads 2Q14 3Q14 4Q14 1Q15 2Q15 1H14 1H15
Spain 1.83% 1.92% 1.94% 1.93% 1.88% 1.80% 1.91%
USA 3.26% 3.13% 3.18% 3.13% 3.11% 3.29% 3.12%
Mexico 11.22% 11.05% 11.23% 10.94% 10.89% 11.29% 10.92%
Argentina 15.37% 16.37% 17.34% 16.70% 15.99% 15.03% 16.33%
Chile 4.57% 3.43% 4.80% 2.84% 4.56% 4.24% 3.71%
Colombia 6.82% 6.42% 6.31% 6.49% 6.33% 6.98% 6.41%
Peru 7.38% 7.16% 7.36% 7.23% 7.23% 7.46% 7.23%
Venezuela 17.33% 16.99% 17.94% 17.71% 16.65% 17.27% 17.18%
Turkey 3.60% 4.49% 4.67% 4.56% 4.68% 3.52% 4.62%
Note 1: USA ex NY Business Activity
Note 2: Customer spreads, difference between lending yield and cost of deposits from customers
SIGNATURE
Pursuant to the requirements of the Securities Exchange Act of 1934, the registrant has duly caused this report to be signed on its behalf by the undersigned, thereunto duly authorized.
| Banco Bilbao Vizcaya Argentaria, S.A. | ||||||
| Date: July 31 , 2015 | By: | /s/ María Ángeles Peláez | ||||
| Name: | María Ángeles Peláez | |||||
| Title: | Authorized Representative | |||||