UNITED STATES
SECURITIES AND EXCHANGE COMMISSION
WASHINGTON, D.C. 20549
FORM6-K
REPORT OF FOREIGN ISSUER
PURSUANT TO RULE13a-16 OR15d-16
UNDER THE SECURITIES EXCHANGE ACT OF 1934
For the month of October, 2018
Commission file number:1-10110
BANCO BILBAO VIZCAYA ARGENTARIA, S.A.
(Exact name of Registrant as specified in its charter)
BANK BILBAO VIZCAYA ARGENTARIA, S.A.
(Translation of Registrant’s name into English)
Calle Azul 4,
28050 Madrid
Spain
(Address of principal executive offices)
Indicate by check mark whether the registrant files or will file annual reports under cover of Form20-F or Form40-F:
Form20-F ☒ Form40-F ☐
Indicate by check mark if the registrant is submitting the Form6-K in paper as permitted by RegulationS-T Rule 101(b)(1):
Yes ☐ No ☒
Indicate by check mark if the registrant is submitting the Form6-K in paper as permitted by RegulationS-T Rule 101(b)(7):
Yes ☐ No ☒
 | Press release
10.30.2018 |
January-September 2018
BBVA earns €4.32 billion in the first nine months
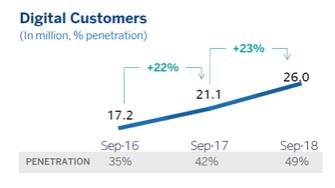
| • | Transformation:Digital and mobile customers as well as digital sales continued to grow across all geographies, with a positive impact on efficiency. Digital customers now account for 49% of the total, very close to theyear-end target of having half of the customers banking through digital channels |
| • | Income: Operating income improved (+5.8 percent at constant exchange rates), driven by a positive trend in recurring revenues and containment in operating expenses. BBVA’s ROE between January and September was 12.2 percent, with ROTE standing at 14.8 percent |
| • | Risks:The NPL ratio was 4.1 percent in September (4.4 percent in June). Coverage ratio reached 73 percent |
| • | Capital:Despite a complex environment, the fully-loaded CET1 ratio stood at 11.34 percent. During the first nine months of the year, the tangible book value per share plus dividends grew 7.2 percent to €5.95 |
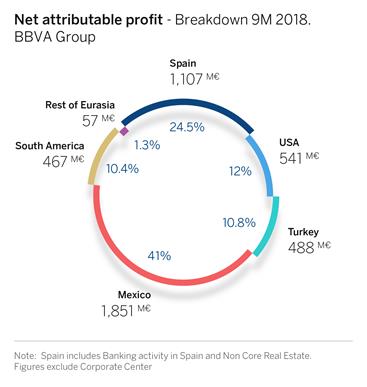
The BBVA Group posted a net attributable profit of €4.32 billion during the first nine months of 2018, up 25.3 percent from the same period a year earlier (+43 percent at constant exchange rates). A surge in recurring revenues, cost containment efforts, lower impairment losses and capital gains of €633 million from the sale of BBVA Chile have all contributed to this result.
“In spite of a challenging situation in Turkey and Argentina, the results we are presenting today reveal the strength of our business model and geographic diversification. These results are underpinned by the progress achieved in the bank’s transformation, a comfortable capital position and solid risk indicators,” BBVA CEO Carlos Torres Vila said.
Net interest income for the first nine months of the year stood at €12.9 billion(-2.3 percent yoy, +10.2 percent at constant exchange rates), while commissions and fees reached €3.65 billion(-1.4 percent yoy, +9.4 percent at constant exchange rates). Both line items – recurring revenues – reached €16.55 billion(-2.1 percent yoy, +10.1 percent at constant exchange rates), which drove the gross income to €17.6 billion(-6.9 percent yoy, +4.3 percent at constant exchange rates).
Operating expenses between between January and September dropped 7.1 percent on the back of cost-discipline efforts. Excluding currency effects, operating expenses rose 2.7 percent. The efficiency ratio stood at 49.6 percent, 52 basis points lower than in 2017 at constant exchange rates.Operating income was €8.88 billion(-6.8 percent with currency impact, +5.8 percent at constant exchange rates), driven by recurring revenues and containment in operating expenses.
The Group’snet attributable profit for the year through September was €4.32 billion, up 25.3 percent compared to the same period of 2017 (+43 percent at constant exchange rates).
| 10.30.2018 |
BBVA earned €1.67 billion inQ3-18 (+46.4 percent yoy, +70.5 percent at constant exchange rates). The quarterly figure includes capital gains on the sale of BBVA Chile and a negative impact (€-190 million) as a result of Argentina’s hyperinflation accounting adjustment.
Regardingprofitability, BBVA’s ROE between January and September reached 12.2 percent compared to 9.6 percent for the same period of 2017, while the Group’s ROTE stood at 14.8 percent versus 11.9 percent a year earlier. The bank remains focused on creating value for its shareholders. Despite the environment, during the first nine months of the year, the tangible book value per share plus dividends grew 7.2 percent to €5.95.
As forrisk indicators, the NPL ratio in September reached 4.1 percent (versus 4.4 percent inQ2-18), its lowest level since June 2012. Coverage ratio rose to 73 percent and the cost of risk was 0.90 percent.
In terms ofcapital adequacy, BBVA’s capital position remained solid. The fully-loaded CET1 ratio stood during the quarter at 11.34 percent, surpassing the11-percent target. The sale of the Group’s stake in BBVA Chile generated a positive impact on this ratio of 50 basis points. The leverage ratio as of September 30 was 6.6 percent fully-loaded, the highest among its European peer group.
| 10.30.2018 |
Inbalance sheet andactivity line items, the comparison was affected by the change in the scope of consolidation following the sale of BBVA Chile, which took place on July 6. Loans and advances to customers totaled €370.5 billion, (down 0.9 percent ytd), with customer deposits reaching €365.69 billion, up 0.5 percent.
An ongoing transformation
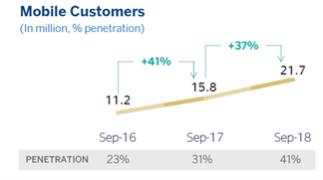
The BBVA Group’s transformation process continued, with an increase in its digital and mobile customer base, as well as in digital sales. This performance had a positive impact on efficiency. The number of digital customers increased to 26 million, up 23 percent in one year. The Group’s mobile customer base reached 21.7 million, 37 percent more than in September 2017. Digital customers now account for 49% of the total, very close to theyear-end target of having half of our customers banking through digital channels. Also, unit sales through digital channels during the first nine months of the year accounted for 39.5 percent of the total, compared to just 15.3 percent from two years ago.
Thekey developments in each business area are detailed below.
InBanking Activityin Spain, lending fell 2 percent since the end of 2017, mainly as a result of a reduction in mortgages, public sector and large corporates. The trend in consumer finance and credit cards remained very positive (+16.8 percent ytd). Customer funds grew (+0.9 percent) compared to Dec. 2017 whileoff-balance-sheet funds increased 3.4 percent, with net positive contributions to investment funds. In regards to P&L, the area’s net attributable profit in the first nine months of 2018 reached €1.17 billion, up 10.5 percent yoy, driven by the favorable behavior of commissions and fees (+8 percent yoy), as well as by the drop in operating expenses and provisions. The NPL ratio dropped to 5 percent from 5.2 percent in the quarter, as a result of the decrease in the balance ofnon-performing loans. The coverage ratio stood at 56 percent as of September 30.
| 10.30.2018 |
As for theNon-Core Real Estatearea, net real estate exposure decreased 29.8 percent in 12 months to €5.46 billion. On October 10,BBVA concluded the transfer of its real estate business in Spain to Cerberus Capital Management, which will allow the bank to reduce almost entirely its real estate exposure. The transaction is not reflected in Q3 financials. The area’s losses narrowed significantly to €-60 million in the first nine months of 2018, compared to €-274 million in the same period a year earlier.
Total earnings in Spain (Banking Activity plusNon-Core Real Estate) reached €1.11 billion, up 41.5 percent than the same period of 2017.
To better explain the business trends in the areas that use a currency other than the euro, the variation rates described below refer to constant exchange rates.
In theUnited States,lending increased 4.9 percent compared to December 2017, driven by consumer finance and business loans. In contrast, customer deposits dropped 3.3 percent. The area generated a net attributable profit of €541 million in the first nine months of the year, up 43.2 percent from the same period of 2017. The main levers were the double-digit increase in net interest income (+12.0 percent) and lower provisions. The NPL ratio was 1.1 percent and coverage stood at 101 percent.
In Mexico, BBVA retained its clear leadership position. Lending activity increased 6 percent since December, while deposits grew by 2.1 percent. The area’s performance in the first nine months of 2018 was very positive, with a net attributable profit of €1.85 billion, up 22.5 percent yoy. Gross income grew at a yoy rate of 8 percent, while operating expenses advanced at a lower pace (+3.7 percent yoy). Regarding asset quality indicators, the NPL ratio remained unchanged during the quarter at 2 percent, while the coverage ratio stood at 149 percent.
InTurkey, Garanti Bank Turkish-lira loans saw a slowdown, while the foreign-currency loans (in U.S. dollars) continued their downward trend. Between January and September, Turkey generated a net attributable profit of €488 million, up 18.1 percent yoy. The macroeconomic environment prompted an increase in impairment losses on financial assets and cost of risk (1.72 percent in September vs. 1.23 percent in June). The NPL ratio increased from 4.5 percent in June to 5.2 percent in September, with coverage of 76 percent.
InSouth America, BBVA completed the sale of its stake in BBVA Chile. With a constant perimeter – excluding BBVA Chile for comparison purposes – customer loans grew 6.4 percent since December 31, 2017 and customer funds, 9.2 percent. Regarding results, besides the change in scope of consolidation due to Chile, the accounting adjustment for hyperinflation in Argentina (€-190 million) also affected the account. The region posted a net attributable profit of €467 million(-5.6 percent), including both impacts. The NPL ratio stood at 4.3 percent and the coverage ratio was 101 percent.
| 10.30.2018 |
Contact details:
BBVA Corporate Communications
Tel. +34 91 537 61 14
comunicacion.corporativa@bbva.com
For more financial information about BBVA visit:
http://shareholdersandinvestors.bbva.com
For more BBVA news visit: https://www.bbva.com
About BBVA
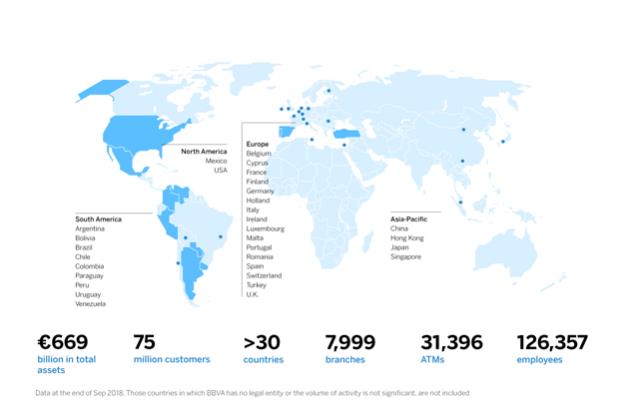
BBVA is a customer-centric global financial services group founded in 1857. The Group has a strong leadership position in the Spanish market, is the largest financial institution in Mexico, it has leading franchises in South America and the Sunbelt Region of the United States; and it is also the leading shareholder in Garanti, Turkey’s biggest bank for market capitalization. Its diversified business is focused on high-growth markets and it relies on technology as a key sustainable competitive advantage. Corporate responsibility is at the core of its business model. BBVA fosters financial education and inclusion, and supports scientific research and culture. It operates with the highest integrity, a long-term vision and applies the best practices.
BBVA Group highlights
BBVA Group highlights (Consolidated figures)
|
| |||||||||||||||
IFRS 9 | IAS 39 | |||||||||||||||
| 30-09-18 | r% | 30-09-17 | 31-12-17 | |||||||||||||
Balance sheet (Millions of Euros) | ||||||||||||||||
Total assets | 668,985 | (3.2) | 690,797 | 690,059 | ||||||||||||
Loans and advances to customers (gross) | 383,111 | (8.0) | 416,240 | 400,369 | ||||||||||||
Deposits from customers | 365,687 | (6.9) | 392,865 | 376,379 | ||||||||||||
Other customer funds | 132,798 | (3.6) | 137,724 | 134,906 | ||||||||||||
Total customer funds | 498,485 | (6.1) | 530,589 | 511,285 | ||||||||||||
Total equity | 51,097 | (6.1) | 54,400 | 53,323 | ||||||||||||
Income statement (Millions of Euros) | ||||||||||||||||
Net interest income | 12,899 | (2.3) | 13,202 | 17,758 | ||||||||||||
Gross income | 17,596 | (6.9) | 18,908 | 25,270 | ||||||||||||
Operating income | 8,875 | (6.8) | 9,522 | 12,770 | ||||||||||||
Profit/(loss) before tax | 6,012 | (0.0) | 6,015 | 6,931 | ||||||||||||
Net attributable profit | 4,323 | 25.3 | 3,449 | 3,519 | ||||||||||||
The BBVA share and share performance ratios | ||||||||||||||||
Number of shares (million) | 6,668 | 0.0 | 6,668 | 6,668 | ||||||||||||
Share price (euros) | 5.49 | (27.4) | 7.56 | 7.11 | ||||||||||||
Earning per share (euros)(1) | 0.62 | 26.7 | 0.49 | 0.48 | ||||||||||||
Book value per share (euros) | 6.94 | (2.4) | 7.11 | 6.96 | ||||||||||||
Tangible book value per share (euros) | 5.70 | (1.6) | 5.79 | 5.69 | ||||||||||||
Market capitalization (Millions of Euros) | 36,607 | (27.4) | 50,416 | 47,422 | ||||||||||||
Yield (dividend/price; %) | 4.4 | 3.8 | 4.2 | |||||||||||||
Significant ratios (%) | ||||||||||||||||
ROE (net attributable profit/average shareholders’ funds +/- average accumulated other comprehensive income) (2) | 12.2 | 9.6 | 7.4 | |||||||||||||
ROTE (net attributable profit/average shareholders’ funds excluding average intangible assets +/- average accumulated other comprehensive income)(2) | 14.8 | 11.9 | 9.1 | |||||||||||||
ROA (Profit or loss for the year/average total assets) | 0.95 | 0.82 | 0.68 | |||||||||||||
RORWA (Profit or loss for the year/average risk-weighted assets - RWA) | 1.82 | 1.53 | 1.27 | |||||||||||||
Efficiency ratio | 49.6 | 49.6 | 49.5 | |||||||||||||
Cost of risk | 0.90 | 0.94 | 0.89 | |||||||||||||
NPL ratio | 4.1 | 4.6 | 4.6 | |||||||||||||
NPL coverage ratio | 73 | 72 | 65 | |||||||||||||
Capital adequacy ratios (%) | ||||||||||||||||
CET1 fully-loaded | 11.3 | 11.2 | 11.1 | |||||||||||||
CET1phased-in(3) | 11.6 | 11.9 | 11.7 | |||||||||||||
Tier 1phased-in(3) | 13.3 | 13.1 | 13.0 | |||||||||||||
Total ratiophased-in(3) | 15.9 | 15.7 | 15.5 | |||||||||||||
Other information | ||||||||||||||||
Number of shareholders | 895,809 | (0.6) | 900,807 | 891,453 | ||||||||||||
Number of employees | 126,357 | (4.3) | 132,019 | 131,856 | ||||||||||||
Number of branches | 7,999 | (4.5) | 8,374 | 8,271 | ||||||||||||
Number of ATMs | 31,396 | 0.6 | 31,214 | 31,688 | ||||||||||||
General note: data as of30-09-17 and31-12-17 are presented for comparison purposes only.
(1) Adjusted by additional Tier 1 instrument remuneration.
(2) The ROE and ROTE ratios include, in the denominator, the Group’s average shareholders’ funds and take into account the item called “Accumulated other comprehensive income”, which forms part of the equity. Excluding this item, the ROE would stand at 10.0%, in January-September of 2018; 8.5%, in January-September of 2017; and 6.4%, in 2017; and the ROTE at 11.8%, 10.2% and 7.7%, respectively.
(3) As of September 30, 2018phased-in ratios include the temporary treatment on the impact of IFRS9 , calculated in accordance with Article 473 bis of Capital Resquirements Regulation (CRR). For 2017, the capital ratios are calculated under CRD IV from Basel III regulation, in which aphase-in of 80% is applied.
Consolidated income statement: quarterly evolution (Millions of Euros)
|
| |||||||||||||||||||||||||||
IFRS 9 | IAS 39 | |||||||||||||||||||||||||||
| 2018 | 2017 | |||||||||||||||||||||||||||
3Q
| 2Q
| 1Q
| 4Q
| 3Q
| 2Q
| 1Q
| ||||||||||||||||||||||
Net interest income | 4,256 | 4,355 | 4,288 | 4,557 | 4,399 | 4,481 | 4,322 | |||||||||||||||||||||
Net fees and commissions | 1,161 | 1,256 | 1,236 | 1,215 | 1,249 | 1,233 | 1,223 | |||||||||||||||||||||
Net trading income | 200 | 297 | 410 | 552 | 347 | 378 | 691 | |||||||||||||||||||||
Dividend income | 11 | 72 | 12 | 86 | 35 | 169 | 43 | |||||||||||||||||||||
Share of profit or loss of entities accounted for using the equity method | (3) | 6 | 8 | 5 | 6 | (2) | (5) | |||||||||||||||||||||
Other operating income and expenses | (102) | (10) | 142 | (54) | 154 | 77 | 108 | |||||||||||||||||||||
Gross income | 5,522 | 5,977 | 6,096 | 6,362 | 6,189 | 6,336 | 6,383 | |||||||||||||||||||||
Operating expenses | (2,779) | (2,963) | (2,979) | (3,114) | (3,075) | (3,175) | (3,137) | |||||||||||||||||||||
Personnel expenses | (1,438) | (1,560) | (1,566) | (1,640) | (1,607) | (1,677) | (1,647) | |||||||||||||||||||||
Other administrative expenses | (1,044) | (1,105) | (1,106) | (1,143) | (1,123) | (1,139) | (1,136) | |||||||||||||||||||||
Depreciation | (297) | (299) | (307) | (331) | (344) | (359) | (354) | |||||||||||||||||||||
Operating income | 2,743 | 3,014 | 3,117 | 3,248 | 3,115 | 3,161 | 3,246 | |||||||||||||||||||||
Impairment on financial assets not measured at fair value through profit or loss | (1,018) | (788) | (823) | (1,885) | (976) | (997) | (945) | |||||||||||||||||||||
Provisions or reversal of provisions | (121) | (86) | (99) | (180) | (201) | (193) | (170) | |||||||||||||||||||||
Other gains (losses) | (36) | 67 | 41 | (267) | 44 | (3) | (66) | |||||||||||||||||||||
Profit/(loss) before tax | 1,569 | 2,207 | 2,237 | 916 | 1,982 | 1,969 | 2,065 | |||||||||||||||||||||
Income tax | (428) | (602) | (611) | (499) | (550) | (546) | (573) | |||||||||||||||||||||
Profit/(loss) after tax from ongoing operations | 1,141 | 1,604 | 1,626 | 417 | 1,431 | 1,422 | 1,492 | |||||||||||||||||||||
Results from corporate operations(1) | 633 | — | — | — | — | — | — | |||||||||||||||||||||
Profit/(loss) for the year | 1,774 | 1,604 | 1,626 | 417 | 1,431 | 1,422 | 1,492 | |||||||||||||||||||||
Non-controlling interests | (100) | (295) | (286) | (347) | (288) | (315) | (293) | |||||||||||||||||||||
Net attributable profit | 1,674 | 1,309 | 1,340 | 70 | 1,143 | 1,107 | 1,199 | |||||||||||||||||||||
Net attributable profit excluding results from corporate operations | 1,040 | 1,309 | 1,340 | 70 | 1,143 | 1,107 | 1,199 | |||||||||||||||||||||
Earning per share (euros)(2) | 0.24 | 0.18 | 0.19 | (0.00) | 0.16 | 0.16 | 0.17 | |||||||||||||||||||||
(1) Includes net capital gains from the sale of BBVA Chile.
(2) Adjusted by additional Tier 1 instrument remuneration.
Consolidated income statement (Millions of Euros)
|
| IFRS 9 | IAS 39 | |||||||||||||||
| Jan.-Sep. 18 | r % | r % at constant exchange rates | Jan.-Sep. 17 | |||||||||||||
Net interest income | 12,899 | (2.3) | 10.2 | 13,202 | ||||||||||||
Net fees and commissions | 3,653 | (1.4) | 9.4 | 3,705 | ||||||||||||
Net trading income | 907 | (35.9) | (31.2) | 1,416 | ||||||||||||
Dividend income | 95 | (61.7) | (60.6) | 247 | ||||||||||||
Share of profit or loss of entities accounted for using the equity method | 11 | n.s. | n.s. | (1) | ||||||||||||
Other operating income and expenses | 30 | (91.1) | (89.3) | 339 | ||||||||||||
Gross income | 17,596 | (6.9) | 4.3 | 18,908 | ||||||||||||
Operating expenses | (8,721) | (7.1) | 2.7 | (9,386) | ||||||||||||
Personnel expenses | (4,563) | (7.5) | 2.3 | (4,931) | ||||||||||||
Other administrative expenses | (3,255) | (4.2) | 6.6 | (3,398) | ||||||||||||
Depreciation | (903) | (14.5) | (7.5) | (1,057) | ||||||||||||
Operating income | 8,875 | (6.8) | 5.8 | 9,522 | ||||||||||||
Impairment on financial assets not measured at fair value through profit or loss | (2,629) | (9.9) | (1.2) | (2,917) | ||||||||||||
Provisions or reversal of provisions | (307) | (45.7) | (43.1) | (564) | ||||||||||||
Other gains (losses) | 73 | n.s. | n.s. | (25) | ||||||||||||
Profit/(loss) before tax | 6,012 | (0.0) | 16.6 | 6,015 | ||||||||||||
Income tax | (1,641) | (1.7) | 12.8 | (1,670) | ||||||||||||
Profit/(loss) after tax from ongoing operations | 4,371 | 0.6 | 18.1 | 4,345 | ||||||||||||
Results from corporate operations(1) | 633 | - | - | - | ||||||||||||
Profit/(loss) for the year | 5,004 | 15.2 | 35.2 | 4,345 | ||||||||||||
Non-controlling interests | (682) | (23.9) | 0.4 | (896) | ||||||||||||
Net attributable profit | 4,323 | 25.3 | 43.0 | 3,449 | ||||||||||||
Net attributable profit excluding results from corporate operations | 3,689 | 7.0 | 22.0 | 3,449 | ||||||||||||
Earning per share (euros)(2) | 0.62 | 0.49 | ||||||||||||||
(1) Includes net capital gains from the sale of BBVA Chile.
(2) Adjusted by additional Tier 1 instrument remuneration.
SIGNATURE
Pursuant to the requirements of the Securities Exchange Act of 1934, the registrant has duly caused this report to be signed on its behalf by the undersigned, thereunto duly authorized.
| Banco Bilbao Vizcaya Argentaria, S.A. | ||||||
| Date: October 30, 2018 | ||||||
| By: | /s/ María Angeles Peláez Morón | |||||
| Name: | María Angeles Peláez Morón | |||||
| Title: | Authorized representative | |||||