Table of Contents
UNITED STATES
SECURITIES AND EXCHANGE COMMISSION
WASHINGTON, D.C. 20549
FORM6-K
REPORT OF FOREIGN ISSUER
PURSUANT TO RULE13a-16 OR15d-16
UNDER THE SECURITIES EXCHANGE ACT OF 1934
For the month of February, 2019
Commission file number:1-10110
BANCO BILBAO VIZCAYA ARGENTARIA, S.A.
(Exact name of Registrant as specified in its charter)
BANK BILBAO VIZCAYA ARGENTARIA, S.A.
(Translation of Registrant’s name into English)
Calle Azul 4,
28050 Madrid
Spain
(Address of principal executive offices)
Indicate by check mark whether the registrant files or will file annual reports under cover of Form20-F or Form40-F:
Form20-F ☒ Form40-F ☐
Indicate by check mark if the registrant is submitting the Form6-K in paper as permitted by RegulationS-T Rule 101(b)(1):
Yes ☐ No ☒
Indicate by check mark if the registrant is submitting the Form6-K in paper as permitted by RegulationS-T Rule 101(b)(7):
Yes ☐ No ☒
Table of Contents

Table of Contents
| 2 | ||||
| 3 | ||||
| 3 | ||||
| 6 | ||||
| 13 | ||||
| 15 | ||||
| 17 | ||||
| 21 | ||||
| 24 | ||||
| 25 | ||||
| 28 | ||||
| 31 | ||||
| 34 | ||||
| 38 | ||||
| 41 | ||||
| 45 | ||||
| 49 | ||||
| 51 | ||||
| 53 | ||||
Table of Contents
2
BBVA Group highlights
(Consolidated figures)
| IFRS 9 | IAS 39 | |||||||||||||||
| 31-12-18 | D % | 31-12-17 | 31-12-16 | |||||||||||||
Balance sheet (millions of euros) | ||||||||||||||||
Total assets | 676,689 | (1.9 | ) | 690,059 | 731,856 | |||||||||||
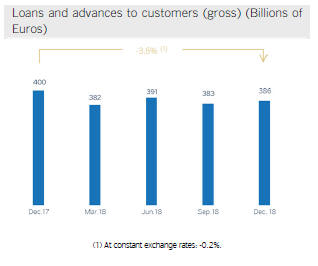
Loans and advances to customers (gross) | 386,225 | (3.5 | ) | 400,369 | 430,474 | |||||||||||
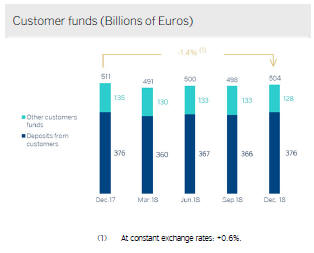
Deposits from customers | 375,970 | (0.1 | ) | 376,379 | 401,465 | |||||||||||
Other customer funds | 128,103 | (5.0 | ) | 134,906 | 132,092 | |||||||||||
Total customer funds | 504,073 | (1.4 | ) | 511,285 | 533,557 | |||||||||||
Total equity | 52,874 | (0.8 | ) | 53,323 | 55,428 | |||||||||||
Income statement (millions of euros) | ||||||||||||||||
Net interest income | 17,591 | (0.9 | ) | 17,758 | 17,059 | |||||||||||
Gross income | 23,747 | (6.0 | ) | 25,270 | 24,653 | |||||||||||
Operating income | 12,045 | (5.7 | ) | 12,770 | 11,862 | |||||||||||
Profit/(loss) before tax | 7,580 | 9.4 | 6,931 | 6,392 | ||||||||||||
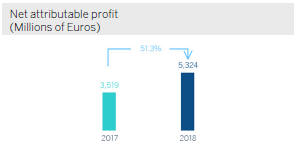
Net attributable profit | 5,324 | 51.3 | 3,519 | 3,475 | ||||||||||||
The BBVA share and share performance ratios | ||||||||||||||||
Number of shares (million) | 6,668 | — | 6,668 | 6,567 | ||||||||||||
Share price (euros) | 4.64 | (34.8 | ) | 7.11 | 6.41 | |||||||||||
Earning per share (euros)(1) | 0.76 | 55.9 | 0.48 | 0.49 | ||||||||||||
Book value per share (euros) | 7.12 | 2.2 | 6.96 | 7.22 | ||||||||||||
Tangible book value per share (euros) | 5.86 | 2.9 | 5.69 | 5.73 | ||||||||||||
Market capitalization (millions of euros) | 30,909 | (34.8 | ) | 47,422 | 42,118 | |||||||||||
Yield (dividend/price; %) | 5.4 | 4.2 | 5.8 | |||||||||||||
Significant ratios (%) | ||||||||||||||||
ROE (net attributable profit/average shareholders’ funds +/- average accumulated other comprehensive income)(2) | 11.6 | 7.4 | 7.3 | |||||||||||||
ROTE (net attributable profit/average shareholders’ funds excluding average intangible assets +/- average accumulated other comprehensive income)(2) | 14.1 | 9.1 | 9.2 | |||||||||||||
ROA (Profit or loss for the year/average total assets) | 0.91 | 0.68 | 0.64 | |||||||||||||
RORWA (Profit or loss for the year/average risk-weighted assets - RWA) | 1.74 | 1.27 | 1.19 | |||||||||||||
Efficiency ratio | 49.3 | 49.5 | 51.9 | |||||||||||||
Cost of risk | 1.01 | 0.89 | 0.85 | |||||||||||||
NPL ratio | 3.9 | 4.6 | 5.0 | |||||||||||||
NPL coverage ratio | 73 | 65 | 70 | |||||||||||||
Capital adequacy ratios (%) | ||||||||||||||||
CET1 fully-loaded | 11.3 | 11.1 | 10.9 | |||||||||||||
CET1 phased-in(3) | 11.6 | 11.7 | 12.2 | |||||||||||||
Tier 1 phased-in(3) | 13.2 | 13.0 | 12.9 | |||||||||||||
Total ratio phased-in(3) | 15.7 | 15.5 | 15.1 | |||||||||||||
Other information | ||||||||||||||||
Number of shareholders | 902,708 | 1.3 | 891,453 | 935,284 | ||||||||||||
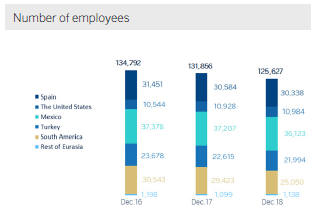
Number of employees | 125,627 | (4.7 | ) | 131,856 | 134,792 | |||||||||||
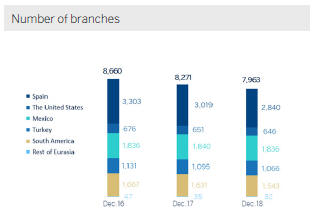
Number of branches | 7,963 | (3.7 | ) | 8,271 | 8,660 | |||||||||||
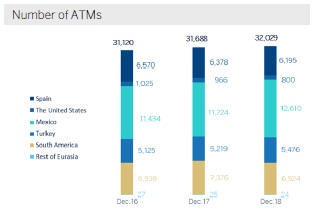
Number of ATMs | 32,029 | 1.1 | 31,688 | 31,120 | ||||||||||||
General note: data as of 31-12-17 and 31-12-16 are presented for comparison purposes only.
| (1) | Adjusted by additional Tier 1 instrument remuneration. |
| (2) | The ROE and ROTE ratios include, in the denominator, the Group’s average shareholders’ funds and take into account the item called “Accumulated other comprehensive income”, which forms part of the equity. Excluding this item, the ROE would stand at 10.1%, in 2018; 6.7%, in 2017; and 6.9%, in 2016; and the ROTE at 12.0%, 8.0% and 8.6%, respectively. |
| (3) | As of December, 31 2018 phased-in ratios include the temporary treatment on the impact of IFRS 9, calculated in accordance with Article 473 bis of Capital Requirements Regulation (CRR). The capital ratios are calculated under CRD IV from Basel III regulation, in which a phase-in of 80% is applied for 2017 and a phase-in of 60% for 2016. |
Table of Contents
3
Results
| • | Generalized growth in themore recurring revenue items for almost all business areas. |
| • | Containment trend inoperating expenses, whose performance is affected by exchange rates trends. |
| • | Lower amountof impairment on financial assets not measured at fair value through profit or loss(hereinafter, “impairment on financial assets”) affected by the negative impact of the recognition in the fourth quarter of 2017 of impairment losses, amounting €1,123m from BBVA’s stake in Telefónica, S.A. |
| • | The financial statements of the Group for 2018 include, on one hand, the negative impact derived from the accounting forhyperinflation in Argentina (-€266m) in the net attributable profit, and on the other hand, the positive impact on equity of €129m. |
| • | The result ofcorporate operations amounted to €633m and includes the capital gains (net of taxes) arising from thesale of BBVA’s equity stake inBBVA Chile. |
| • | The net attributableprofit was €5,324m, 51.3% higher than in 2017. |
| • | Net attributable profit excluding results from corporate operations stood at €4,691m, up 33.3% higher than the result reached in 2017. |
Balance sheet and business activity
| • | Lower volume ofloans and advances to customers (gross); however, by business areas, in the United States, Mexico, South America (excluding BBVA Chile) and Rest of Eurasia volumes increased. |
| • | Non-performing loans continue to reduce in 2018. |
| • | Withinoff-balance-sheet funds, mutual funds continue to perform positively. |
Solvency
| • | Thecapital position is above regulatory requirements. |
| • | BBVA has once again excelled in EU-wide bank stress tests thanks to its resilience in the face of potential economic shocks. According to the exercise results, under the adverse scenario, BBVA is the second bank among its European peers with lower negative impact in CET1 fully-loaded capital ratio and one of the few banks with the ability to generate an accumulated profit in the three-year period under analysis (2018, 2019, and 2020), under this scenario. |
Table of Contents
4
Risk management
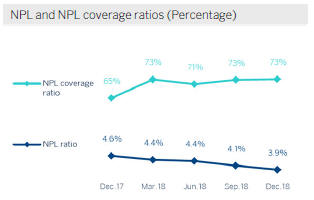
| • | Solid indicators of the maincredit-risk metrics: as of 31-December-2018, the NPL ratio closed at 3.9%, the NPL coverage ratio at 73% and the cumulative cost of risk at 1.01%. |
Transformation
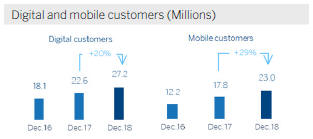
| • | The Group’sdigital and mobile customer base anddigital sales continue to increase in all the geographic areas where BBVA operates with a positive impact in efficiency. |
Appointments
| • | BBVA’s Board of Directors, in its meeting held on December 20, 2018, approved the succession plans for theGroup Executive Chairman and for the Chief Executive Officer and appointed Carlos Torres Vila as Executive Chairman of BBVA, replacing Francisco González Rodríguez and Onur Genç as member of the Board of Directors and as Chief Executive Officer of BBVA. The Board of Directors also approved organisational changes, which involve changes at the senior management level of BBVA Group. On December, 21st, BBVA received the required administrative authorisations to give full effect to the resolutions approved. |
Other matters of interest
| • | On December, 26th, BBVA reached an agreement with Voyager Investing UK Limited Partnership, an entity managed by Canada Pension Plan Investment Board (“CPPIB”) for the transfer of a credit portfolio mainly composed by non-performing and defaulted mortgage loans. The closing of the Transaction will be completed as soon as the relevant conditions are fulfilled, which is expected to occur within the second quarter of 2019. In addition, it is expected that the impact in the Group’s attributable profit, which is currently expected to be positive by €150m, net of taxes and other adjustments, and the impact in the Common Equity Tier 1 (fully-loaded), which is expected to be slightly positive. |
Table of Contents
5
| • | Impact of the initial implementation of IFRS 9: The figures corresponding to 2018 are prepared under International Financial Reporting Standard 9 (IFRS 9), which entered into force on January 1, 2018. This new accounting standard did not require the restatement of comparative information from prior periods, so the comparative figures shown for the year 2017 have been prepared in accordance with the IAS 39 (International Accounting Standard 39) regulation applicable at that time. The impacts derived from the first application of IFRS 9, as of January 1, 2018, were registered with a charge to reserves of approximately €900m (net of fiscal effect) mainly due to the allocation of provisions based on expected losses, compared to the model of losses incurred under the previous IAS 39. |
In capital, the impact derived from the first application of IFRS 9 has been a reduction of 31 basis points with respect to the fully-loaded CET1 ratio of December 2017.
| • | IFRS 16 came into effect on January 1, 2019, a standard on leases introduces a single lessee accounting model and will require lessees to recognize assets and liabilities of all lease contracts. The main impact in the Group is the recognition of the right-of-use assets and lease liabilities in an approximate amount of €3,600m mainly coming from the Group’s activity in Spain and lease of premises of its branch network. The estimated impact in terms of capital for the Group amounts to approximately -12 basis points in terms of CET1. |
| • | Banco Bilbao Vizcaya Argentaria, S.A. (“BBVA, S.A.”) stand-alone financial statements: BBVA has estimated that, mainly due to the depreciation of the Turkish lira, there is an impairment of its participation in Garanti Bank that only affects the stand-alone financial statements of BBVA, S.A. For this reason, a negative adjustment for a net amount of €1,517m has been registered in the income statement of BBVA, S.A. for the year 2018. Total equity for BBVA, S.A. as of December 31, 2018 has decreased by this same amount. The impact on the fully-loaded CET1 capital ratio of BBVA, S.A. is approximately -10 basis points. |
It is important to note that the recognition of this accounting impact in the stand-alone financial statements of BBVA, S.A. does not generate any impact on the Consolidated Group (neither on the attributed profit, total equity or capital ratios), it does not generate any additional cash outflow and will not affect the dividend distribution to shareholders.
Table of Contents
6
BBVA generated a net attributableprofit of €5,324m in 2018, which represents a year-on-year increase of 51.3% (+78.2% at constant exchange rates) that includes the results from corporate operations originated by the capital gains (net of taxes) from the sale of BBVA Chile. Moreover, at constant exchange rates, it is worth mentioning the good performance of recurring revenue, lower loan-loss impairments (affected by the negative impact of the recognition in the fourth quarter of 2017 of impairment losses, amounting €1,123m from BBVA stake in Telefónica, S.A.) and provisions, which offsets the lower contribution from net trading income (NTI) compared to the same period the previous year. Consolidated income statement: quarterly evolution (Millions of euros)
Consolidated income statement: quarterly evolution
(Million of euros)
| IFRS 9 | IAS 39 | |||||||||||||||||||||||||||||||
| 2018 | 2017 | |||||||||||||||||||||||||||||||
| 4Q | 3Q | 2Q | 1Q | 4Q | 3Q | 2Q | 1Q | |||||||||||||||||||||||||
Net interest income | 4,692 | 4,256 | 4,355 | 4,288 | 4,557 | 4,399 | 4,481 | 4,322 | ||||||||||||||||||||||||
Net fees and commissions | 1,226 | 1,161 | 1,256 | 1,236 | 1,215 | 1,249 | 1,233 | 1,223 | ||||||||||||||||||||||||
Net trading income | 316 | 200 | 297 | 410 | 552 | 347 | 378 | 691 | ||||||||||||||||||||||||
Dividend income | 62 | 11 | 72 | 12 | 86 | 35 | 169 | 43 | ||||||||||||||||||||||||
Share of profit or loss of entities accounted for using the equity method | (19 | ) | (3 | ) | 6 | 8 | 5 | 6 | (2 | ) | (5 | ) | ||||||||||||||||||||
Other operating income and expenses | (126 | ) | (102 | ) | (10 | ) | 142 | (54 | ) | 154 | 77 | 108 | ||||||||||||||||||||
Gross income | 6,151 | 5,522 | 5,977 | 6,096 | 6,362 | 6,189 | 6,336 | 6,383 | ||||||||||||||||||||||||
Operating expenses | (2,981 | ) | (2,779 | ) | (2,963 | ) | (2,979 | ) | (3,114 | ) | (3,075 | ) | (3,175 | ) | (3,137 | ) | ||||||||||||||||
Personnel expenses | (1,557 | ) | (1,438 | ) | (1,560 | ) | (1,566 | ) | (1,640 | ) | (1,607 | ) | (1,677 | ) | (1,647 | ) | ||||||||||||||||
Other administrative expenses | (1,119 | ) | (1,044 | ) | (1,105 | ) | (1,106 | ) | (1,143 | ) | (1,123 | ) | (1,139 | ) | (1,136 | ) | ||||||||||||||||
Depreciation | (305 | ) | (297 | ) | (299 | ) | (307 | ) | (331 | ) | (344 | ) | (359 | ) | (354 | ) | ||||||||||||||||
Operating income | 3,170 | 2,743 | 3,014 | 3,117 | 3,248 | 3,115 | 3,161 | 3,246 | ||||||||||||||||||||||||
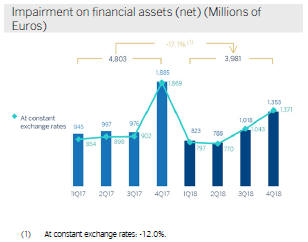
Impairment on financial assets not measured at fair value through profit or loss | (1,353 | ) | (1,018 | ) | (788 | ) | (823 | ) | (1,885 | ) | (976 | ) | (997 | ) | (945 | ) | ||||||||||||||||
Provisions or reversal of provisions | (66 | ) | (121 | ) | (86 | ) | (99 | ) | (180 | ) | (201 | ) | (193 | ) | (170 | ) | ||||||||||||||||
Other gains (losses) | (183 | ) | (36 | ) | 67 | 41 | (267 | ) | 44 | (3 | ) | (66 | ) | |||||||||||||||||||
Profit/(loss) before tax | 1,568 | 1,569 | 2,207 | 2,237 | 916 | 1,982 | 1,969 | 2,065 | ||||||||||||||||||||||||
Income tax | (421 | ) | (428 | ) | (602 | ) | (611 | ) | (499 | ) | (550 | ) | (546 | ) | (573 | ) | ||||||||||||||||
Profit/(loss) after tax from ongoing operations | 1,147 | 1,141 | 1,604 | 1,626 | 417 | 1,431 | 1,422 | 1,492 | ||||||||||||||||||||||||
Results from corporate operations(1) | — | 633 | — | — | — | — | — | — | ||||||||||||||||||||||||
Profit/(loss) for the year | 1,147 | 1,774 | 1,604 | 1,626 | 417 | 1,431 | 1,422 | 1,492 | ||||||||||||||||||||||||
Non-controlling interests | (145 | ) | (100 | ) | (295 | ) | (286 | ) | (347 | ) | (288 | ) | (315 | ) | (293 | ) | ||||||||||||||||
Net attributable profit | 1,001 | 1,674 | 1,309 | 1,340 | 70 | 1,143 | 1,107 | 1,199 | ||||||||||||||||||||||||
Net attributable profit excluding results from corporate operations | 1,001 | 1,040 | 1,309 | 1,340 | 70 | 1,143 | 1,107 | 1,199 | ||||||||||||||||||||||||
Earning per share (euros)(2) | 0.14 | 0.24 | 0.18 | 0.19 | (0.00 | ) | 0.16 | 0.16 | 0.17 | |||||||||||||||||||||||
General note: the data for the quarters of 2018 are presented as proforma which are considered as Alternative Performance Measures (APM), the accumulated effect being fully collected to reflect the impact derived from the accounting for hyperinflation in Argentina between 1-1-2018 and 30-9-2018 in the third quarter of 2018, without having been reexpressed the data shown in the previous table for the first and second quarter of 2018.
| (1) | Includes net capital gains from the sale of BBVA Chile. |
| (2) | Adjusted by additional Tier 1 instrument remuneration. |
Table of Contents
7
Consolidated income statement
(Millions of euros)
| IFRS 9 | IAS 39 | |||||||||||||||
| 2018 | D % | D % at constant exchange rates | 2017 | |||||||||||||
Net interest income | 17,591 | (0.9 | ) | 10.8 | 17,758 | |||||||||||
Net fees and commissions | 4,879 | (0.8 | ) | 8.9 | 4,921 | |||||||||||
Net trading income | 1,223 | (37.8 | ) | (33.9 | ) | 1,968 | ||||||||||
Dividend income | 157 | (52.9 | ) | (52.0 | ) | 334 | ||||||||||
Share of profit or loss of entities accounted for using the equity method | (7 | ) | n.s. | n.s. | 4 | |||||||||||
Other operating income and expenses | (96 | ) | n.s. | n.s. | 285 | |||||||||||
Gross income | 23,747 | (6.0 | ) | 4.3 | 25,270 | |||||||||||
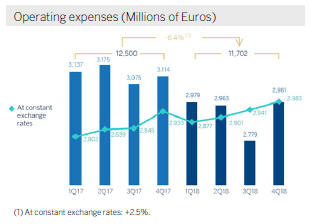
Operating expenses | (11,702 | ) | (6.4 | ) | 2.5 | (12,500 | ) | |||||||||
Personnel expenses | (6,120 | ) | (6.9 | ) | 2.0 | (6,571 | ) | |||||||||
Other administrative expenses | (4,374 | ) | (3.7 | ) | 6.1 | (4,541 | ) | |||||||||
Depreciation | (1,208 | ) | (12.9 | ) | (6.5 | ) | (1,387 | ) | ||||||||
Operating income | 12,045 | (5.7 | ) | 6.2 | 12,770 | |||||||||||
Impairment on financial assets not measured at fair value through profit or loss | (3,981 | ) | (17.1 | ) | (12.0 | ) | (4,803 | ) | ||||||||
Provisions or reversal of provisions | (373 | ) | (49.9 | ) | (47.1 | ) | (745 | ) | ||||||||
Other gains (losses) | (110 | ) | (62.1 | ) | (63.0 | ) | (292 | ) | ||||||||
Profit/(loss) before tax | 7,580 | 9.4 | 30.4 | 6,931 | ||||||||||||
Income tax | (2,062 | ) | (4.9 | ) | 9.2 | (2,169 | ) | |||||||||
Profit/(loss) after tax from ongoing operations | 5,518 | 15.9 | 40.6 | 4,762 | ||||||||||||
Results from corporate operations(1) | 633 | — | — | — | ||||||||||||
Profit/(loss) for the year | 6,151 | 29.2 | 56.7 | 4,762 | ||||||||||||
Non-controlling interests | (827 | ) | (33.5 | ) | (11.7 | ) | (1,243 | ) | ||||||||
Net attributable profit | 5,324 | 51.3 | 78.2 | 3,519 | ||||||||||||
Net attributable profit excluding results from corporate operations | 4,691 | 33.3 | 57.0 | 3,519 | ||||||||||||
Earning per share (euros)(2) | 0.76 | 0.48 | ||||||||||||||
| (1) | Includes net capital gains from the sale of BBVA Chile. |
| (2) | Adjusted by additional Tier 1 instrument remuneration. |
Unless expressly indicated otherwise, to better understand the changes in the main headings of the Group’s income statement, the year-on-year percentage changes provided below refer toconstant exchange rates.
Gross income
Gross income accumulated in the period grew by 4.3% year-on-year, supported by the positive performance of the more recurring items.
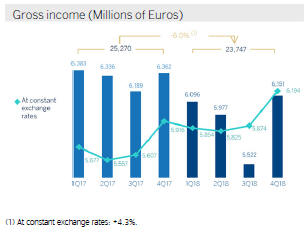
Table of Contents
8
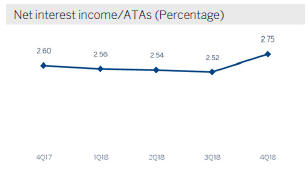
Net interest income grew by 10.8% year-on-year, leveraged mainly by higher contribution from inflation-linked bonds in Turkey. The other business areas, with the exception of Spain and Rest of Eurasia, also registered positive year-on-year changes, with Mexico, South America and the United States standing out, in this order, for its contribution. In the fourth quarter, net interest income grew by 5.2% in comparison with the previous quarter.
On the other hand, cumulativenet fees and commissions (up 8.9% year-on-year) also registered a favorable evolution highly driven by their diversification. The quarterly figure performed well (up 1.1% in the fourth quarter).
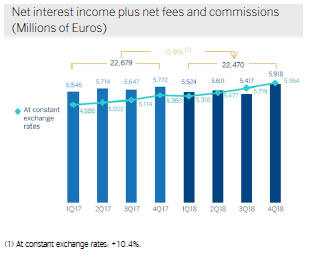
As a result, themore recurring revenue items (net interest income plus net fees and commissions) increased by 10.4% year-on-year (up 4.3% over the third quarter).
NTI in 2018 moderated in comparison with the previous year, when it was exceptionally high, largely due to the registration of the capital gains of €228m before taxes, from market sales of the stake in China Citic Bank (CNCB): €204m in the first quarter, from the sale of 1.7% stake, and €24m in the third quarter from the sale of the remaining 0.34%. There have also been lower sales of ALCO portfolios in Spain in the first nine months of 2018 compared to the same period of the previous year. By business areas, NTI had a good performance in South America and Turkey.
Other operating income and expenses closed at -€96m in 2018 compared to €285m in 2017, mainly due to negative impact of the hyperinflation in Argentina which meant -€323m in this line of the income statement. The change is also explained by the higher contribution, amounting to €44m, to the Single Resolution Fund (SRF) and Deposit Guarantee Fund (DGF) in Spain. The net contribution of the insurance business grew by 8.7% in cumulative terms (+15.4% in the fourth quarter).
Operating income
Operating expenses in 2018 registered an increase of 2.5%, year-on-year, well below the inflation rate recorded in the main countries where BBVA is present (down 6.4% at current exchange rates). Cost discipline has been maintained in all the Group’s areas through various efficiency plans. By business area the biggest year-on-year reductions were in Banking activity in Spain and Non Core Real Estate. In the United States, Mexico and Turkey the growth of operating expenses was lower than the growth of gross income.
Table of Contents
9
Breakdown of operating expenses and efficiency calculation
(Millions of euros)
| 2018 | D % | 2017 | ||||||||||
Personnel expenses | 6,120 | (6.9 | ) | 6,571 | ||||||||
Wages and salaries | 4,786 | (7.3 | ) | 5,163 | ||||||||
Employee welfare expenses | 869 | (4.6 | ) | 911 | ||||||||
Training expenses and other | 465 | (6.4 | ) | 497 | ||||||||
Other administrative expenses | 4,374 | (3.7 | ) | 4,541 | ||||||||
Property, fixtures and materials | 982 | (5.0 | ) | 1,033 | ||||||||
IT | 1,133 | 11.2 | 1,018 | |||||||||
Communications | 235 | (12.7 | ) | 269 | ||||||||
Advertising and publicity | 336 | (4.5 | ) | 352 | ||||||||
Corporate expenses | 109 | (0.8 | ) | 110 | ||||||||
Other expenses | 1,162 | (10.7 | ) | 1,301 | ||||||||
Levies and taxes | 417 | (8.6 | ) | 456 | ||||||||
Administration costs | 10,494 | (5.6 | ) | 11,112 | ||||||||
Depreciation | 1,208 | (12.9 | ) | 1,387 | ||||||||
Operating expenses | 11,702 | (6.4 | ) | 12,500 | ||||||||
Gross income | 23,747 | (6.0 | ) | 25,270 | ||||||||
Efficiency ratio (operating expenses/gross income; %) | 49.3 | 49.5 | ||||||||||
Table of Contents
10
As a consequence of this evolution of operating expenses, theefficiencyratio stood at 49.3% and theoperating income posted a year-on-year growth of 6.2% (+9.4% in the last quarter of 2018).
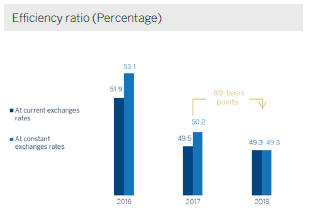

Table of Contents
11
Provisions and other
Impairment on financial assets in 2018 decreased by 12.0% in comparison with the figure for 2017, affected by the negative impact of the recognition in 2017 of impairment losses, amounting €1,123m from BBVA stake in Telefónica, S.A. as a result of the evolution of the price of the latter and in compliance with the requirements of the accounting standard IAS 39 which was in force at that point in time. By business area, they continued to fall in Spain, due to lower loan-loss provisioning requirements for large customers. In contrast, they increased, especially in Turkey, due to the deterioration of the macroeconomic scenario and some wholesale-customers and to a lesser extent in South America. On the other hand, Mexico stood in line with 2017.
The headingprovisions or reversal of provisions (hereinafter, provisions) was 47.1% lower than the figure of 2017, as a result of lower restructuring costs in 2018. The lineother gains (losses)showed a negative balance, due mainly to certain operations with an unfavorable effect from the Non Core Real Estate area, recorded in the last quarter.
The headingresults from corporate operations amounted to €633m and registered the capital gains (net of taxes) originated by the sale of BBVA’S equity stake in BBVA Chile.
Results
As a result of the above, the Group’snet attributable profit accumulated in 2018 reached an amount of €5,324m and continued to show a very positive year-on-year evolution (up 78.2% at constant exchange rates, up 51.3% at current exchange rates). Thenet attributable profit, excluding results from corporate operations, stood at €4,691m, or 33.3% higher than the amount recorded for the previous year, when operations of this kind were not carried out (up 57.0% at constant exchange rates).
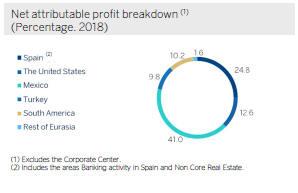
Bybusiness area, Banking activity in Spain generated a profit of €1,522m, Non Core Real Estate a loss of €78m, the United States contributed a profit of €735m, Mexico registered €2,384m, Turkey contributed a profit of €569m, South America €591m and the Rest of Eurasia €93m.
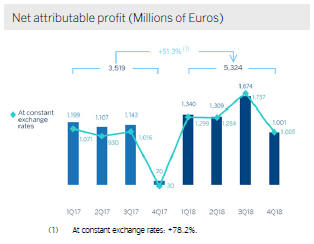
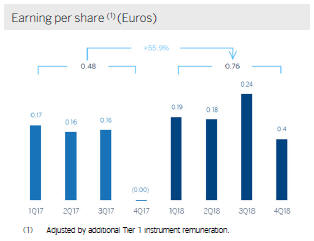
Table of Contents
12
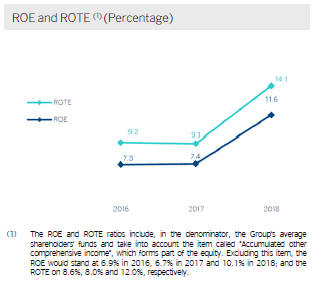
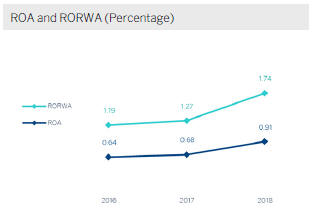
Table of Contents
13
Balance sheet and business activity
The year-on-year comparison of the Group’s balance sheet and business activity has been affected by thesale of BBVA Chile, completed in July 2018 and therefore as of December 31, 2018, was not included within BBVA’s perimeter.
Theevolution of the Group’s balance sheet and activity are presented below, from the opening balance sheet after the first implementation of IFRS 9 until the end of December 2018. These figures include the new categories comprised in the aforementioned standard.
Regarding the Group’s activity, the most significant aspects during this period are summarized below:
| • | Lower volume ofloans and advances to customers (gross); however, by business area, in the United States, Mexico, South America (excluding BBVA Chile) and Rest of Eurasia volumes increased. |
| • | Non-performing loans fell mainly due to a favorable trend in Spain and, to a lesser extent, in South America and Rest of Eurasia. |
| • | The headings ofother assets and other liabilities are affected by the sale of BBVA Chile completed in July 2018. Until then, these items included BBVA Chile’s balance sheet reclassified in the category of non-current assets and liabilities held for sale. |
| • | Indeposits from customers, time deposits showed a decrease, offset by an increase in demand deposits, particularly in Spain. |
| • | Inoff-balance-sheet funds, mutual funds continued to perform well. |
Consolidated balance sheet
(Millions of euros)
| 31-12-18 | D % | 01-01-18 | ||||||||||
Cash, cash balances at central banks and other demand deposits | 58,196 | 36.4 | 42,680 | |||||||||
Financial assets held for trading | 90,117 | (1.9 | ) | 91,854 | ||||||||
Non-trading financial assets mandatorily at fair value through profit or loss | 5,135 | 15.4 | 4,451 | |||||||||
Financial assets designated at fair value through profit or loss | 1,313 | 28.9 | 1,019 | |||||||||
Financial assets at fair value through accumulated other comprehensive income | 56,337 | (9.3 | ) | 62,115 | ||||||||
Financial assets at amortized cost | 419,660 | (0.5 | ) | 421,685 | ||||||||
Loans and advances to central banks and credit institutions | 13,103 | (26.0 | ) | 17,716 | ||||||||
Loans and advances to customers | 374,027 | 0.0 | 374,009 | |||||||||
Debt securities | 32,530 | 8.6 | 29,959 | |||||||||
Investments in subsidiaries, joint ventures and associates | 1,578 | (0.7 | ) | 1,589 | ||||||||
Tangible assets | 7,229 | 0.5 | 7,191 | |||||||||
Intangible assets | 8,314 | (1.8 | ) | 8,464 | ||||||||
Other assets | 28,809 | (40.4 | ) | 48,368 | ||||||||
|
|
|
|
|
| |||||||
Total assets | 676,689 | (1.8 | ) | 689,414 | ||||||||
|
|
|
|
|
| |||||||
Financial liabilities held for trading | 80,774 | (0.0 | ) | 80,783 | ||||||||
Other financial liabilities designated at fair value through profit or loss | 6,993 | 27.3 | 5,495 | |||||||||
Financial liabilities at amortized cost | 509,185 | 0.6 | 506,118 | |||||||||
Deposits from central banks and credit institutions | 59,259 | (14.0 | ) | 68,928 | ||||||||
Deposits from customers | 375,970 | 3.4 | 363,689 | |||||||||
Debt certificates | 61,112 | (0.9 | ) | 61,649 | ||||||||
Other financial liabilities | 12,844 | 8.4 | 11,851 | |||||||||
Liabilities under insurance and reinsurance contracts | 9,834 | 6.6 | 9,223 | |||||||||
Other liabilities | 17,029 | (51.9 | ) | 35,392 | ||||||||
|
|
|
|
|
| |||||||
Total liabilities | 623,814 | (2.1 | ) | 637,010 | ||||||||
|
|
|
|
|
| |||||||
Non-controlling interests | 5,764 | (17.7 | ) | 7,008 | ||||||||
Accumulated other comprehensive income | (7,215 | ) | 2.6 | (7,036 | ) | |||||||
Shareholders’ funds | 54,326 | 3.6 | 52,432 | |||||||||
|
|
|
|
|
| |||||||
Total equity | 52,874 | 0.9 | 52,404 | |||||||||
|
|
|
|
|
| |||||||
Total liabilities and equity | 676,689 | (1.8 | ) | 689,414 | ||||||||
Memorandum item: | ||||||||||||
Guarantees given | 47,574 | 5.2 | 47,668 | |||||||||
Table of Contents
14
Loans and advances to customers
(Millions of euros)
| IFRS 9 31-12-18 | D % | IAS 39 31-12-17 | ||||||||||
Public sector | 28,504 | (4.7 | ) | 29,921 | ||||||||
Individuals | 170,501 | 3.6 | 164,578 | |||||||||
Mortgages | 111,527 | (0.7 | ) | 112,274 | ||||||||
Consumer | 33,063 | 3.0 | 32,092 | |||||||||
Credit cards | 13,507 | (0.9 | ) | 13,630 | ||||||||
Other loans | 12,404 | 88.5 | 6,581 | |||||||||
Business | 170,872 | (8.4 | ) | 186,479 | ||||||||
Non-performing loans | 16,348 | (15.7 | ) | 19,390 | ||||||||
Loans and advances to customers (gross) | 386,225 | (3.5 | ) | 400,369 | ||||||||
Loan-loss provisions | (12,199 | ) | (4.3 | ) | (12,748 | ) | ||||||
Loans and advances to customers | 374,027 | (3.5 | ) | 387,621 | ||||||||
Customer funds
(Millions of euros)
| IFRS 9 31-12-18 | D % | IAS 39 31-12-17 | ||||||||||
Deposits from customers | 375,970 | (0.1 | ) | 376,379 | ||||||||
Of which current accounts | 260,573 | 8.2 | 240,750 | |||||||||
Of which time deposits | 108,313 | (6.4 | ) | 115,761 | ||||||||
Other customer funds | 128,103 | (5.0 | ) | 134,906 | ||||||||
Mutual funds and investment companies | 61,393 | 0.7 | 60,939 | |||||||||
Pension funds | 33,807 | (0.5 | ) | 33,985 | ||||||||
Other off-balance sheet funds | 2,949 | (4.3 | ) | 3,081 | ||||||||
Customer portfolios | 29,953 | (18.8 | ) | 36,901 | ||||||||
Total customer funds | 504,073 | (1.4 | ) | 511,285 | ||||||||
Table of Contents
15
Capital base
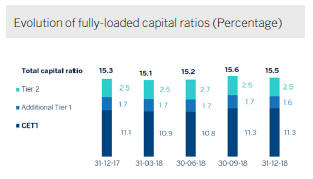
Thefully-loaded CET1 ratio stood at 11.3% for the period ended December 31, 2018. In the third quarter of 2018, the sale of the stake in BBVA Chile generated a positive impact on the fully-loaded CET1 ratio of 50 basis points. Additionally, the transfer of BBVA’s real estate business in Spain to Cerberus had a positive impact on the ratio, although it was not material. It is noted that this ratio includes the impact of -31 basis points for first application of IFRS 9, which came into force January 1, 2018. In this context, the Parliament and the European Commission have established transitional arrangements that are voluntary for the institutions, adapting the impact of IFRS 9 on capital adequacy ratios. The Group has informed the supervisory body of its adherence to these arrangements.
Risk-weighted assets (RWA) have decreased in the year, mainly due to the sale of BBVA Chile and the depreciations of currencies against the euro. During 2018, the Group carried out three securitizations whose impact, through the release of risk weighted assets, was a positive in the amount of €971m. In addition, BBVA received European Central Bank (ECB) authorization to update the RWA calculation by structural exchange rate risk under the standard model.
Capital base
(Millions of euros)
| CRD IV phased-in | CRD IV fully-loaded | |||||||||||||||||||||||
| 31-12-18 (1) | 31-12-17 | 30-09-18 | 31-12-18 (1) | 31-12-17 | 30-09-18 | |||||||||||||||||||
Common Equity Tier 1 (CET 1) | 40,311 | 42,341 | 39,662 | 39,569 | 40,061 | 38,925 | ||||||||||||||||||
Tier 1 | 45,945 | 46,980 | 45,765 | 45,044 | 46,316 | 44,868 | ||||||||||||||||||
Tier 2 | 8,754 | 9,134 | 8,847 | 8,859 | 8,891 | 8,670 | ||||||||||||||||||
Total Capital (Tier 1 + Tier 2) | 54,699 | 56,114 | 54,612 | 53,903 | 55,207 | 53,538 | ||||||||||||||||||
Risk-weighted assets | 348,254 | 361,686 | 343,051 | 348,795 | 361,686 | 343,271 | ||||||||||||||||||
CET1 (%) | 11.6 | 11.7 | 11.6 | 11.3 | 11.1 | 11.3 | ||||||||||||||||||
Tier 1 (%) | 13.2 | 13.0 | 13.3 | 12.9 | 12.8 | 13.1 | ||||||||||||||||||
Tier 2 (%) | 2.5 | 2.5 | 2.6 | 2.5 | 2.5 | 2.5 | ||||||||||||||||||
Total capital ratio (%) | 15.7 | 15.5 | 15.9 | 15.5 | 15.3 | 15.6 | ||||||||||||||||||
General note: as of December 31 and September 30 of 2018, the main difference between the phased-in and fully loaded ratios arises from the temporary treatment of the impact of IFRS 9, to which the BBVA Group has adhered voluntarily (in accordance with Article 473bis of the CRR).
| (1) | Preliminary data. Excludes the February 2014 issuance of 1,500 million euros from AT1 and which will be amortized in advance in February 2019. |
Regarding capitalissues, during the first part of the year, the Group computed a new issuance in the amount of US$1,000m, carried out in November 2017, of contingent convertible bonds that may be converted into ordinary shares (CoCos) as an AT1 instrument. In May, another AT1 instrument for US$1,500m issued in 2013 was redeemed early. During the second part of the year, in September, the Group carried out a new issuance of contingent convertible bonds for €1,000m and more recently, in January 2019, announced that it would exercise the early redemption option for the AT1 instrument for €1,500m issued in February 2014.
The Group has continued with its program to meet theMREL requirements, published in May 2018, by closing two public issuances of non-preferred senior debt for a total of €2,500m. The Group estimates that it is currently in line with this MREL requirement.
Table of Contents
16
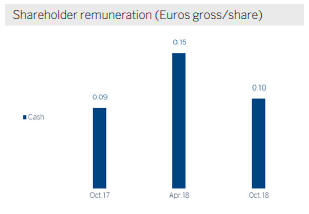
Regardingshareholder remuneration, on October, 10th BBVA paid a cash dividend with a gross amount of €0.10 per share against the 2018 fiscal year account. In addition, on April 10, 2018, BBVA paid a final dividend against the 2017 fiscal year account for an amount of €0.15 gross per share, also in cash. Both distributions are consistent with the Group’s shareholder remuneration policy, which consists of maintaining a pay-out ratio of 35-40% of recurring profit.
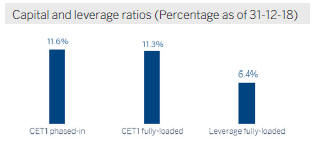
As of December 31, 2018, thephased-in CET1 ratio stood at 11.6%, taking into account the impact of the initial implementation of IFRS 9.Tier 1 capital stood at 13.2% andTier 2 at 2.5% resulting in atotal capital ratio of 15.7%. These levels are above the requirements established by the regulator in its SREP letter and the systemic buffers applicable in 2018 for BBVA Group. Since January 1, 2018, the requirement has been established at 8.438% for the phased-in CET1 ratio and 11.938% for the total capital ratio. The change with respect to 2017 is due to the steady implementation of the capital conservation buffers and the capital buffer applicable to other systemically important banks. The regulatory requirement for 2018 in fully-loaded terms remained unchanged (CET1 of 9.25% and total ratio of 12.75%) compared with the previous year.
Finally, the Group’sleverage ratio maintained a solid position, at 6.4% fully-loaded (6.5% phased-in), which is still the highest of its peer group.
Ratings
During the first half of the year 2018, Moody’s, S&P and DBRS upgraded one notch BBVA’s rating to A3, A- and A (high), respectively. During the second half of 2018, the three leading agencies Moody’s, S&P and Fitch reaffirmed the rating given to BBVA (A3, A- and A-, respectively), although both S&P and Fitch placed its perspective in negative due to the evolution of the economy in Turkey (both agencies) and Mexico (Fitch). At present, all agencies assign to BBVA a category “A” rating, which did not occur since mid-2012, thus recognizing the strength and robustness of BBVA’s business model.
Ratings
Rating agency | Long term | Short term | Outlook | |||||||||
| DBRS | A (high) | R-1 (middle) | Stable | |||||||||
| Fitch | A- | F-2 | Negative | |||||||||
| Moody’s(1) | A3 | P-2 | Stable | |||||||||
| Scope Ratings | A+ | S-1+ | Stable | |||||||||
| Standard & Poor’s | A- | A-2 | Negative | |||||||||
| (1) | Additionally, Moody’s assigns an A2 rating to BBVA’s long term deposits. |
Table of Contents
17
Credit risk
BBVA Group’s risk metrics continued to perform well along 2018:
| • | Credit risk decreased by 3.6% throughout 2018 or -0.4% isolating the impact of the sale of BBVA Chile (-1.8% and +1.3%, respectively, at constant exchange rates), mainly due to lower activity in Non Core Real Estate and contraction in Turkey and South America due to the exchange rates evolution. During the fourth quarter credit risk increased by +1.3% (+0.6% at constant exchange rates). |
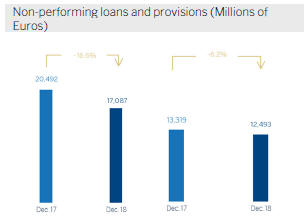
| • | Thebalance of non-performing loans decreased throughout 2018 by -16.6% (-11.1% in constant terms), highlighting the good performance of the Banking activity in Spain and Non Core Real Estate. Wholesale customers in Turkey and the United States deteriorated, having a negative impact in its balance of non-performing loans. In the last quarter of 2018 there was a decrease of 3.4% at current exchange rates (-0.5% at constant exchange rates). |
| • | TheNPL ratio stood at 3.9% as of December 31, 2018, a reduction of 19 basis points with respect to September 30, 2018 and of 61 basis points throughout the year. |
| • | Loan-loss provisions decreased by 6.2% during the last 12 months (-0.3% at constant exchange rates) whereas the decrease over the quarter amounted to 3.1% (-2.5% at constant exchange rates). |
| • | NPL coverage ratio closed at 73% with an improvement of 812 basis points over the year and 26 basis points in the last 3 months. |
| • | The cumulativecost of risk through December 2018 was 1.01%, +13 basis points higher than the figure for 2017. |
Credit risk(1)
(Millions of euros)
| 31-12-18 | 30-09-18 | 30-06-18 (2) | 31-03-18 (2) | 31-12-17 (2) | ||||||||||||||||
Credit risk | 433,799 | 428,318 | 451,587 | 442,446 | 450,045 | |||||||||||||||
Non-performing loans | 17,087 | 17,693 | 19,654 | 19,516 | 20,492 | |||||||||||||||
Provisions | 12,493 | 12,890 | 13,954 | 14,180 | 13,319 | |||||||||||||||
NPL ratio (%) | 3.9 | 4.1 | 4.4 | 4.4 | 4.6 | |||||||||||||||
NPL coverage ratio (%) | 73 | 73 | 71 | 73 | 65 | |||||||||||||||
| (1) | Include gross loans and advances to customers plus guarantees given. |
| (2) | Figures without considering the classification of non-current assets held for sale. |
Table of Contents
18
Non-performing loans evolution
(Millions of euros)
| 4Q178 (1) | 3Q18 | 2Q18(2) | 1Q18(2) | 4Q17(2) | ||||||||||||||||
Beginning balance | 17,693 | 19,654 | 19,516 | 20,492 | 20,932 | |||||||||||||||
Entries | 3,005 | 2,168 | 2,596 | 2,065 | 3,757 | |||||||||||||||
Recoveries | (1,548 | ) | (1,946 | ) | (1,655 | ) | (1,748 | ) | (2,142 | ) | ||||||||||
Net variation | 1,456 | 222 | 942 | 317 | 1,616 | |||||||||||||||
Write-offs | (1,681 | ) | (1,606 | ) | (863 | ) | (913 | ) | (1,980 | ) | ||||||||||
Exchange rate differences and other | (382 | ) | (576 | ) | 59 | (380 | ) | (75 | ) | |||||||||||
Period-end balance | 17,087 | 17,693 | 19,654 | 19,516 | 20,492 | |||||||||||||||
Memorandum item: | ||||||||||||||||||||
Non-performing loans | 16,348 | 17,045 | 18,627 | 18,569 | 19,753 | |||||||||||||||
Non performing guarantees given | 739 | 649 | 1,027 | 947 | 739 | |||||||||||||||
| (1) | Preliminary data. |
| (2) | Figures without considering the classification of non-current assets held for sale. |
Structural risks
Liquidity and funding
Management ofliquidity and funding in BBVA aims to finance the recurring growth of the banking business at suitable maturities and costs, using a wide range of instruments that provide access to a large number of alternative sources of financing, always in compliance with current regulatory requirements.
Due to its subsidiary-based management model, BBVA Group is one of the few large European banks that follows the MPE resolutionstrategy (“Multiple Point of Entry”): the parent company sets the liquidity and risk policies, but the subsidiaries are self-sufficient and responsible for the managing their liquidity (taking deposits or accessing the market with their own rating), without funds transfer or financing occurring between either the parent company and the subsidiaries or between different subsidiaries. This principle limits the spread of a liquidity crisis among the Group’s different areas and ensures that the cost of liquidity and funding is correctly reflected in the price formation process.
The financial soundness of the Group’s banks continues to be based on the funding of lending activity, fundamentally through the use of stable customer funds. During 2018,liquidity conditions remained comfortable across BBVA Group’s global footprint:
| • | In the Eurozone, the liquidity situation is still comfortable, reducing the credit gap and growth in customer deposits. |
| • | In the United States, the liquidity situation is adequate. The credit gap increased during the year due to the dynamism of consumer and commercial credit as well as to the cost-containment strategy for deposits, in an environment of competition in prices and rising rates. |
| • | In Mexico, the liquidity position is sound as the environment has improved after the electoral process and the new commercial agreement with the United States. The credit gap has widened year-to-date due to deposits growing less than lending. |
| • | The liquidity situation in Turkey is stable, showing a reduction in the credit gap as a result of deposits growing faster than lending. |
| • | In South America, the liquidity situation remains comfortable in all geographies. In Argentina, despite the volatility of the markets which has been reducing at the end of the year, the liquidity situation is adequate. |
The wholesalefunding markets in the geographic areas where the Group operates continued to be stable, with the exception of Turkey where the volatility increased during the third quarter, having stabilized in the fourth quarter with the renewal of the maturities of syndicated loans of different entities.
The mainoperations carried out by the entities that form part of the BBVA Group during 2018 were:
| • | BBVA, S.A. completed three operations: an issuance of senior non-preferred debt for €1.5 billion, with a floating coupon at 3-month Euribor plus 60 basis points and a maturity of five years. It also carried out the largest issuance made by a financial institution in the Eurozone of the so-called “green bonds” (€1 billion). It was a 7-year senior non-preferred debt issuance, which made BBVA the first Spanish bank to carry out this type of issuance. The high demand allowed the price to be lowered to mid-swap plus 80 basis points. Finally, BBVA carried out an issuance of preferred securities contingently convertible into newly issued ordinary shares of BBVA (CoCos). This transaction was, for the first time, available to Spanish institutional investors and it was |
Table of Contents
19
| registered with the CNMV for an amount of €1 billion, an annual coupon of 5.875% for the first five years and amortization option from the fifth year. Additionally, it closed a private issuance of Tier 2 subordinated debt for US$300m, with a maturity of 15 years, with a coupon of 5.25%. |
| • | In the United States, BBVA Compass issued in June a senior debt bond for US$1.15 billion in two tranches, both at three years: US$700m at a fixed rate with a reoffer yield of 3.605%, and US$450m at a floating rate of 3-month Libor plus 73 basis points. |
| • | In Mexico, BBVA Bancomer completed an international issuance of subordinated Tier 2 debt of US$1 billion. The instrument was issued at a price equivalent to Treasury bonds plus 265 basis points at a maturity of 15 years, with a ten-year call (BBVA Bancomer 15NC10). In addition, two new Banking Securities Certificates were issued for 7 billion Mexican pesos in two tranches, one of them being the first green bond issued by a private bank in Mexico (3.5 billion Mexican pesos at three years at TIIE28 + 10 basis points). |
| • | In Turkey, Garanti issued the first private bond in emerging markets for US$75m over six years, to support women’s entrepreneurship, and renewed the financing of two syndicated loans. |
| • | On the other hand, in South America, in Chile, Forum issued senior debt on the local market for an amount equivalent to €108m and BBVA Peru issued a three-year senior debt in the local market for an aggregate amount of €53m. |
As of December 31, 2018, the liquidity coverage ratio (LCR) in BBVA Group remained comfortably above 100% in the period and stood at 127%. For the calculation of the ratio it is assumed that there is no transfer of liquidity among subsidiaries; i.e. no kind of excess liquidity levels in the subsidiaries abroad are considered in the calculation of the consolidated ratio. When considering this excess liquidity levels, the ratio would stand at 154% (27 percentage points above 127%). All the subsidiaries remained comfortably above 100% (Eurozone, 145%; Mexico, 154%; Turkey, 209%; and the United States, 143%).
Foreign exchange
Foreign-exchange risk management of BBVA’s long-term investments, basically stemming from its franchises abroad, aims to preserve the Group’s capital adequacy ratios and ensure the stability of its income statement.
The year2018was notable for the depreciation against the euro of the Turkish lira (down 25.0%) and the Argentine peso (down 47.8%), while the Mexican peso (+5.2%) and the U.S. Dollar (+4.7%) appreciated. BBVA has maintained its policy of actively hedging its main investments in emerging countries, covering on average between 30% and 50% of the earnings for the year and around 70% of the excess of CET1 capital ratio. In accordance with this policy, the sensitivity of the CET1 ratio to a depreciation of 10% of the main emerging currencies (Mexican peso or Turkish lira) against the euro remains at around a negative two basis points for each of these currencies. In the case of the dollar, the sensitivity is approximately a positive eleven basis points to a depreciation of 10% of the dollar against the euro, as a result of RWAs denominated in U.S. Dollar outside the United States. The coverage level of the expected earnings for 2019, at the closing of January, 2019 is, 85% for Mexico and 30% for Turkey.
Interest rates
The aim of managinginterest-rate risk is to maintain a sustained growth of net interest income in the short and medium-term, irrespective of interest-rate fluctuations, while controlling the impact on capital through the valuation of the portfolio of financial assets at fair value with changes reflected in other accumulated comprehensive income.
The Group’s banks have fixed-income portfolios to manage their balance-sheet structure. During 2018, the results of this management were satisfactory, with limited risk strategies in all the Group’s banks. Their capacity of resilience to market events has allowed them to face the cases of Italy and Turkey.
After the formation of the new government in Italy, the reaction of the market to the budget negotiation process has contributed to the sustained pressure on the Italian debt, however without significant impact on the capital ratio.
In Turkey, an excessive economic growth have given rise to inflationary tensions that, together with the level of current account deficits, have weakened the Turkish Lira. In this context, the Central Bank of Turkey (CBRT) has raised rates to contain the depreciation of the currency. Risk management and bond portfolio with a high component of inflation-linked bonds have stabilized the net interest income and limited impact on the capital ratio.
Finally, it is worth noting the followingmonetary policies pursued by the different central banks in the main geographical areas where BBVA operates:
| • | No relevant changes in the Eurozone, where interest rates remain at 0% and the deposit facility rate at -0.40%. |
| • | In the United States the upward trend in interest rates continues. The increases of 25 basis points each in March, June, September and December, left the rate at 2.50%. |
| • | In Mexico, after making two increases in the first half of the year, Banxico raised them again twice in the fourth quarter from 7.75% to 8.25%. |
Table of Contents
20
| • | In Turkey, after the increases in the first three quarters of the year, the central bank maintained the average interest rate at 24.00% in the fourth quarter. |
| • | In South America, the monetary authorities of Colombia and Peru have maintained their reference rates flat throughout the quarter, considering in its decision the behavior of inflation next to the established goals, as well as the dynamics of domestic demand. In Argentina, the adopted measures at the beginning of the quarter in terms of monetary policy (increase in reserve requirements and the reference rate) in order not to increase the monetary base and curb inflation which have delivered their results, with a certain deceleration in inflation. |
Economic capital
Consumption ofeconomic risk capital (ERC) at the close of December 2018, in consolidated terms, was €31,177m, equivalent to a decline of 0.8% compared to September 2018. Variation within exact time period and at constant exchange rates was down 2.1%, which is mainly explained by structural risk associated with the transfer of the real estate assets of BBVA in Spain to Cerberus Capital Management, L.P. (Cerberus). There were also less relevant decreases in credit risk and equity (goodwill).
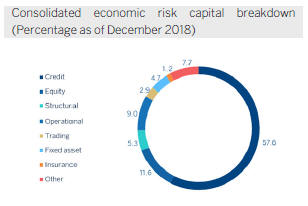
Table of Contents
| 21 |
Global economic growth maintained a robust growth of approximately 3.6% in 2018, although slowed more than expected during the second half of 2018, due to both the poorer performance seen by retailers and the industrial sector along with a strong increase in financial tensions, especially in the developed economies, as a result of higher uncertainty. Poorer economic figures in Europe and China was accompanied by downwards trends in Asian countries and a cyclical deterioration in the United States. In this context, both the Federal Reserve (Fed) and the ECB have been more cautious and patient in the path towards monetary policy normalization and their decisions going forward will depend on the performance of the economy. The main short-term risk continues to be protectionism, not only because of the direct impact of the commercial channel, but also because its indirect effect on confidence and on financial volatility. Additionally, there are concerns about the intensity of the adjustment on economic activity during the following quarters, both in the United States and in China.
Moststock-market indices showed a downward trend during 2018. In Europe, the Stoxx 50 and the Euro Stoxx 50 fell by 13.1% and 14.3%, respectively. On the other hand, in Spain, the Ibex 35 lost 15.0% over the same period. Finally, in the United States the S&P 500 index fell 6.2% in the last twelve months, mainly due to the decline in the last quarter (down 14.0%).
In particular, thebanking sector indices were notably more negative during 2018 than these general indices. The European Stoxx Banks index, which includes British banks, lost 28.0%, and the Eurozone bank index, the Euro Stoxx Banks, was down 33.3%, while in the United States the S&P Regional Banks index declined 20.5% in comparison at the close of 2017.
TheBBVA share closed 2018 at €4.64, a fall of 34.8% for this year.
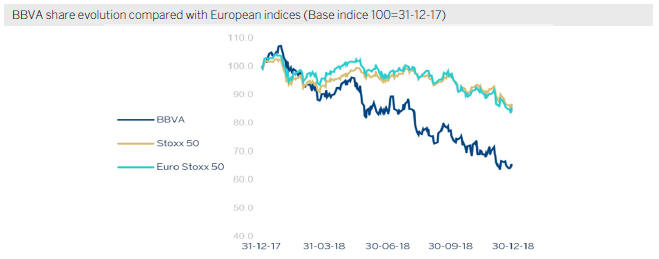
Table of Contents
| . 22 |
The BBVA share and share performance ratios
| 31-12-18 | 31-12-17 | |||||||
Number of shareholders | 902,708 | 891,453 | ||||||
Number of shares issued | 6,667,886,580 | 6,667,886,580 | ||||||
Daily average number of shares traded | 35,909,997 | 35,820,623 | ||||||
Daily average trading (million euros) | 213 | 252 | ||||||
Maximum price (euros) | 7.73 | 7.93 | ||||||
Minimum price (euros) | 4.48 | 5.92 | ||||||
Closing price (euros) | 4.64 | 7.11 | ||||||
Book value per share (euros) | 7.12 | 6.96 | ||||||
Tangible book value per share (euros) | 5.86 | 5.69 | ||||||
Market capitalization (million euros) | 30,909 | 47,422 | ||||||
Yield (dividend/price; %)(1) | 5.4 | 4.2 | ||||||
| (1) | Calculated by dividing shareholder remuneration over the last twelve months by the closing price of the period. |
Regardingshareholder remuneration, on October 10, BBVA paid in cash a gross amount of €0.10 per share on account of the 2018 fiscal year. This payment is consistent with the shareholder remuneration policy announced by Relevant Event of February 1, 2017, that envisages, subject to the pertinent approvals by the corresponding corporate bodies, the payment of two dividends in cash, foreseeably on October and April of each year. It is expected to be proposed for the consideration of the competent governing bodies a cash payment in a gross amount of euro 0.16 per share to be paid in April 2019 as final dividend for 2018.
As of December 31, 2018, the number of BBVAshares remained at 6,668 million, and the number ofshareholderswas 902,708. By type of investor, residents in Spain held 44.82% of the share capital, while the remaining 55.18% was owned by non-resident shareholders.
Shareholder structure
(31-12-2018)
| Shareholders | Shares | |||||||||||||||
Number of shares | Number | % | Number | % | ||||||||||||
Up to 150 | 179,213 | 19.9 | 12,701,058 | 0.2 | ||||||||||||
151 to 450 | 179,572 | 19.9 | 49,210,098 | 0.7 | ||||||||||||
451 to 1800 | 284,225 | 31.5 | 278,003,301 | 4.2 | ||||||||||||
1,801 to 4,500 | 136,369 | 15.1 | 388,215,619 | 5.8 | ||||||||||||
4,501 to 9,000 | 63,647 | 7.1 | 401,194,972 | 6.0 | ||||||||||||
9,001 to 45,000 | 53,104 | 5.9 | 921,740,895 | 13.8 | ||||||||||||
More than 45,001 | 6,578 | 0.7 | 4,616,820,637 | 69.2 | ||||||||||||
|
|
|
|
|
|
|
| |||||||||
Total | 902,708 | 100.0 | 6,667,886,580 | 100.0 | ||||||||||||
|
|
|
|
|
|
|
| |||||||||
BBVAshares are included on the main stock-market indices, including the Ibex 35, Euro Stoxx 50 and Stoxx 50, with a weighting of 7.0%, 1.4% and 0.9% respectively. They also form part of several sector indices, including the Euro Stoxx Banks, with a weighting of 8.3%, and the Stoxx Banks, with a weighting of 3.8%.
Table of Contents
| 23 |
Finally, BBVA maintains a significant presence on a number of internationalsustainability indices or ESG (environmental, social and governance) indices, which evaluate the performance of companies in this area. In September 2018, BBVA joined the Dow Jones Sustainability Index (DJSI), benchmark in the market, which measures the performance of nearly 3,400 listed companies in environmental, social and corporate governance matters. Among the aspects most valued in BBVA’s analysis are the fiscal strategy, the information security and cybersecurity policies, the management of environmental risks and opportunities, financial inclusion and, above all, Pledge 2025 announced this year (see responsible banking section).
Main sustainability indices on which BBVA is listed as of 31-12-2018
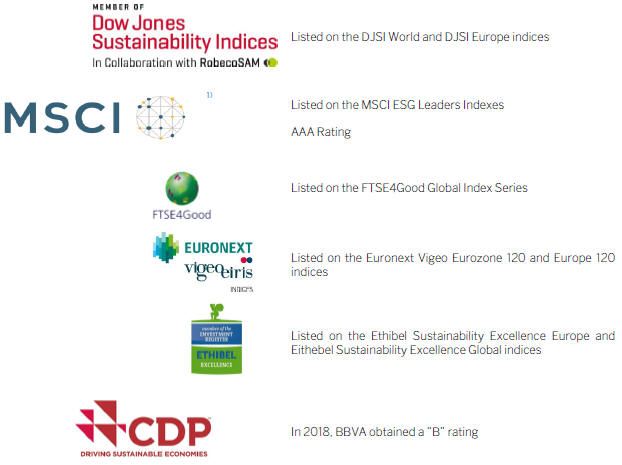
| (1) | The inclusion of BBVA in any MSCI index, and the use of MSCI logos, trademarks, service marks or index names herein, do not constitute a sponsorship, endorsement or promotion of BBVA by MSCI or any of its affiliates. The MSCI indices are the exclusive property of MSCI. MSCI and the MSCI index names and logos are trademarks or service marks of MSCI or its affiliates. |
Table of Contents
| 24 |
BBVA has a differential bankingmodel that we refer to as responsible banking, based on seeking out a return adjusted to principles, strict legal compliance, best practices and the creation of long-term value for all stakeholders. The four pillars of BBVA’s responsible banking model are as follows.
| • | Balanced relationships with its customers, based on transparency, clarity and responsibility. |
| • | Sustainable finance to combat climate change, respect human rights and achieve the United Nations Sustainable Development Goals (SDGs). |
| • | Responsible practices with employees, suppliers and other stakeholders. |
| • | Community investment to promote social change and create opportunities for all. |
In recognition of its responsible banking model and of BBVA’s efforts to advance sustainability issues, in September 2018 BBVA joined theDow Jones Sustainability Index (DJSI), as mentioned in the section of the BBVA share.
In line with the European Commission Action Plan on sustainable finance, BBVA announced in 2018 itsPledge 2025, the Bank’s climate change and sustainable development strategy to meet the United Nations Sustainable Development Goals and the Paris Agreement on Climate Change. It is an eight year pledge (2018-2025) based on financing, managing and involving. BBVA is pledging to mobilize €100 billion in green and sustainable finance, infrastructures and agribusiness, social entrepreneurship and financial inclusion. In its pledge to manage environmental and social resources and minimize the potential direct and indirect negative impacts, BBVA has pledged that by 2025, 70% of energy bought by the Group will be renewable, thus reducing its CO2 emissions by 68% compared to 2015. In addition, BBVA is pledged to engage all its stakeholders to boost the contribution of the financial sector to sustainable development.
To foster this contribution, BBVA presented in April 2018 theSDG-linked bond framework, under which it may issue the so called green bonds, social bonds or sustainable bonds. The existence of this framework is one of the characteristic elements of sustainable issuances.
Additionally, in the third quarter of 2018, BBVA Asset Management launched a global asset allocation fund managed under a Socially Responsible Investment (SRI) criteria.BBVA Futuro Sostenible, has a defensive risk profile, and completes the range of investment solutions with socially responsible criteria offered by BBVA Group fund manager.BBVA Futuro Sostenible is the first fund in Spain with a complete approach to SRI.
| • | Integration of SRI criteria for all asset classes with investment in the best companies and governments with environmental, social and corporate governance criteria. |
| • | Lower carbon footprint than the benchmark. |
| • | Impact investment based on the SDGs. |
| • | Distribution of a quarter of the management commission in solidarity projects. |
| • | Exclusion of companies that do not comply with the United Nations Global Compact, controversial sectors and worst companies and governments that do not meet our criteria of minimum standards in corporate, environmental and social governance. |
Regarding responsible practices, BBVA published at the beginning of 2018 itsHuman Rights Commitment, an action plan that covers all the areas of the Group and its ecosystem. For BBVA, respect for the dignity of people and their rights is an essential condition for action and is very closely linked to the challenge that it has assumed of fostering and preserving the well-being of the communities in which it operates. This commitment is based on the UN Guiding Principles on Business and Human Rights.
In November 2018, BBVA joined in launching thePrinciples for Responsible Banking at the United Nations Environment Programme Finance Initiative (UNEP FI) global roundtable in Paris. These principles were announced by 28 large financial institutions from around the world, including BBVA and Garanti -BBVA Group subsidiary in Turkey-, with the aim of transforming the financial industry to be an engine in the achievement of a sustainable future and the commit to aligning their business activities with the Sustainable Development Goals (SDGs) and the Paris Climate Agreement.
Table of Contents
| 25 |
This section presents and analyzes the most relevant aspects of the Group’s different business areas. Specifically, it shows a summary of the income statement and balance sheet, the business activity figures and the most significant ratios in each of them.
At the closing of 2018 thereporting structure of BBVA Group’s business areas remained basically the same even if its composition differs from the one presented in 2017 due to the sale of BBVA Chile announced on November 28, 2017, and which was closed on July 6, 2018. This operation, which has affected the composition of the business area of South America, will be detailed in the following sections as well as the rest of the Group’s business areas:
| • | Banking activity in Spainincludes the Retail Network in Spain, Corporate and Business Banking (CBB), Corporate & Investment Banking (CIB), BBVA Seguros and Asset Management units in Spain. It also includes the new loan production to developers or loans that are no longer in difficulties as well as the portfolios, funding and structural interest-rate positions of the euro balance sheet. |
| • | Non Core Real Estate covers the specialized management in Spain of loans to developers in difficulties and real-estate assets mainly coming from foreclosed assets, originated from both, residential mortgages, as well as loans to developers. On November 29, 2017, BBVA Group signed an agreement with Cerberus Capital Management, L.P. (Cerberus) for the creation of a joint venture in which the real-estate business area of BBVA in Spain would be transferred. At a later stage, 80% of this entity would be sold to a subsidiary of Cerberus (Divarian). On October 10, 2018, the stated operation was closed and, at the close of 2018, the participation in Divarian which BBVA maintains at 20%, is recorded in the Corporate Center. |
| • | The United States includes the Group’s business activity in the country through the BBVA Compass group and the BBVA New York branch. |
| • | Mexico basically includes all the banking and insurance businesses carried out by the Group in the country. Since 2018 it has also included the BBVA Bancomer branch in Houston (in previous years located in the United States). Consequently, the figures from previous years have been reworked to incorporate this change and show comparable series. |
| • | Turkey includes the activity of the Garanti group. |
| • | South America basically includes BBVA’s banking and insurance businesses in the region. On July 6, 2018, the sale of BBVA Chile to The Bank of Nova Scotia (Scotiabank) was completed which affects the comparability of the results, the balance sheet, the activity and the most significant ratios of this business area with prior periods. |
| • | The Rest of Eurasia includes the Group’s retail and wholesale business activity in the rest of Europe and Asia. |
In addition to the above, all the areas include a remainder made up basically of other businesses and a supplement that includes deletions and allocations not assigned to the units making up the above areas.
Lastly, theCorporate Center is an aggregate that contains the rest of the items that have not been allocated to the business areas, as it corresponds to the Group’s holding function. It includes: the costs of the head offices that have a corporate function; management of structural exchange-rate positions; specific issues of equity instruments to ensure adequate management of the Group’s global solvency; portfolios and their corresponding results, whose management is not linked to customer relations, such as industrial holdings; certain tax assets and liabilities; funds due to commitments with employees; goodwill and other intangibles. At the close of 2018, the participation in Davarian, which BBVA maintains at 20%, is included in this unit.
In addition to this geographical breakdown, supplementary information is provided for all thewholesale businesses carried out by BBVA, i.e. Corporate & Investment Banking (CIB), in the geographical areas where it operates. This aggregate business is considered relevant to better understand the Group because of the characteristics of the customers served, the type of products offered and the risks assumed.
Finally, as usual, in the case of the Americas, Turkey and CIB areas, the results of applying constantexchange rates are given in addition to the year-on-year variations at current exchange rates.
Theinformation by areas is based on units at the lowest level and/or companies making up the Group, which are assigned to the different areas according to the main geographical area in which they carry out their activity.
Table of Contents
26
Major income statement items by business area
(Millions of euros)
| Business areas | ||||||||||||||||||||||||||||||||||||||||
| BBVA Group | Banking activity in Spain | Non Core Real Estate | The United States | Mexico | Turkey | South America | Rest of Eurasia | S Business areas | Corporate Center | |||||||||||||||||||||||||||||||
2018 | ||||||||||||||||||||||||||||||||||||||||
Net interest income | 17,591 | 3,672 | 32 | 2,276 | 5,568 | 3,135 | 3,009 | 175 | 17,867 | (276 | ) | |||||||||||||||||||||||||||||
Gross income | 23,747 | 5,943 | 38 | 2,989 | 7,193 | 3,901 | 3,701 | 415 | 24,179 | (432 | ) | |||||||||||||||||||||||||||||
Operating income | 12,045 | 2,680 | (28 | ) | 1,127 | 4,825 | 2,658 | 2,011 | 124 | 13,397 | (1,352 | ) | ||||||||||||||||||||||||||||
Profit/(loss) before tax | 7,580 | 2,017 | (129 | ) | 919 | 3,294 | 1,448 | 1,307 | 144 | 9,000 | (1,420 | ) | ||||||||||||||||||||||||||||
Net attributable profit | 5,324 | 1,522 | (78 | ) | 735 | 2,384 | 569 | 591 | 93 | 5,818 | (494 | ) | ||||||||||||||||||||||||||||
2017 | ||||||||||||||||||||||||||||||||||||||||
Net interest income | 17,758 | 3,738 | 71 | 2,119 | 5,476 | 3,331 | 3,200 | 180 | 18,115 | (357 | ) | |||||||||||||||||||||||||||||
Gross income | 25,270 | 6,180 | (17 | ) | 2,876 | 7,122 | 4,115 | 4,451 | 468 | 25,196 | 73 | |||||||||||||||||||||||||||||
Operating income | 12,770 | 2,790 | (116 | ) | 1,025 | 4,671 | 2,612 | 2,444 | 160 | 13,585 | (815 | ) | ||||||||||||||||||||||||||||
Profit/(loss) before tax | 6,931 | 1,854 | (656 | ) | 748 | 2,984 | 2,147 | 1,691 | 177 | 8,944 | (2,013 | ) | ||||||||||||||||||||||||||||
Net attributable profit | 3,519 | 1,374 | (490 | ) | 486 | 2,187 | 826 | 861 | 125 | 5,368 | (1,848 | ) | ||||||||||||||||||||||||||||
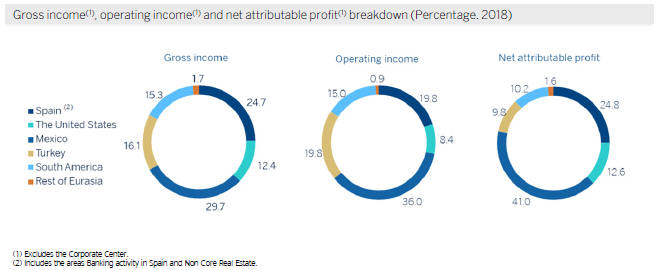
Table of Contents
27
Major balance-sheet items and risk-weighted assets by business area
(Millions of euros)
| Business areas | ||||||||||||||||||||||||||||||||||||||||||||
| BBVA Group | Banking activity in Spain | Non Core Real Estate | The United States | Mexico | Turkey | South America | Rest of Eurasia | S Business areas | Corporate Center | AyPNCV variation (1) | ||||||||||||||||||||||||||||||||||
31-12-18 | ||||||||||||||||||||||||||||||||||||||||||||
Loans and advances to customers | 374,027 | 169,856 | 582 | 60,808 | 51,101 | 41,478 | 34,469 | 15,731 | 374,027 | — | — | |||||||||||||||||||||||||||||||||
Deposits from customers | 375,970 | 180,891 | 36 | 63,891 | 50,530 | 39,905 | 35,842 | 4,876 | 375,970 | — | — | |||||||||||||||||||||||||||||||||
Off-balance sheet funds | 98,150 | 62,557 | 2 | — | 20,647 | 2,894 | 11,662 | 388 | 98,150 | — | — | |||||||||||||||||||||||||||||||||
Total assets/liabilities and equity | 676,689 | 335,294 | 4,163 | 82,057 | 96,455 | 66,250 | 52,385 | 18,000 | 654,605 | 22,084 | — | |||||||||||||||||||||||||||||||||
Risk-weighted assets | 348,254 | 100,950 | 3,022 | 64,146 | 53,359 | 56,486 | 42,736 | 15,449 | 336,149 | 12,105 | — | |||||||||||||||||||||||||||||||||
31-12-17 | ||||||||||||||||||||||||||||||||||||||||||||
Loans and advances to customers | 387,621 | 183,172 | 3,521 | 53,718 | 45,768 | 51,378 | 48,272 | 14,864 | 400,693 | — | (13,072 | ) | ||||||||||||||||||||||||||||||||
Deposits from customers | 376,379 | 177,763 | 13 | 60,806 | 49,964 | 44,691 | 45,666 | 6,700 | 385,604 | — | (9,225 | ) | ||||||||||||||||||||||||||||||||
Off-balance sheet funds | 98,005 | 62,054 | 4 | — | 19,472 | 3,902 | 12,197 | 376 | 98,005 | — | — | |||||||||||||||||||||||||||||||||
Total assets/liabilities and equity | 690,059 | 319,417 | 9,714 | 75,775 | 94,061 | 78,694 | 74,636 | 17,265 | 669,562 | 20,497 | — | |||||||||||||||||||||||||||||||||
Risk-weighted assets | 361,686 | 108,141 | 9,692 | 58,688 | 44,941 | 62,768 | 55,975 | 15,150 | 355,354 | 6,332 | — | |||||||||||||||||||||||||||||||||
| (1) | Includes non-current assets and liabilities held for sale (AyPNCV for its acronym in Spanish) of the BBVA Chile and real estate operations. |
Interest rates
(Quarterly averages. Percentage)
| 2018 | 2017 | |||||||||||||||||||||||||||||||
| 4Q | 3Q | 2Q | 1Q | 4Q | 3Q | 2Q | 1Q | |||||||||||||||||||||||||
Official ECB rate | 0.00 | 0.00 | 0.00 | 0.00 | 0.00 | 0.00 | 0.00 | 0.00 | ||||||||||||||||||||||||
Euribor 3 months | (0.32 | ) | (0.32 | ) | (0.33 | ) | (0.33 | ) | (0.33 | ) | (0.33 | ) | (0.33 | ) | (0.33 | ) | ||||||||||||||||
Euribor 1 year | (0.14 | ) | (0.17 | ) | (0.19 | ) | (0.19 | ) | (0.19 | ) | (0.16 | ) | (0.13 | ) | (0.10 | ) | ||||||||||||||||
USA Federal rates | 2.28 | 2.01 | 1.81 | 1.58 | 1.30 | 1.25 | 1.05 | 0.80 | ||||||||||||||||||||||||
TIIE (Mexico) | 8.26 | 8.11 | 7.88 | 7.84 | 7.42 | 7.37 | 7.04 | 6.41 | ||||||||||||||||||||||||
CBRT (Turkey) | 24.00 | 19.29 | 14.82 | 12.75 | 12.17 | 11.97 | 11.80 | 10.10 | ||||||||||||||||||||||||
Exchange rates
(Expressed in currency/euro)
| Year-end exchange rates | Average exchange rates | |||||||||||||||||||
| 31-12-18 | D % on 31-12-17 | D % on 30-09-18 | 2018 | D % on 2017 | ||||||||||||||||
Mexican peso | 22.4921 | 5.2 | (3.2 | ) | 22.7046 | (6.1 | ) | |||||||||||||
U.S. dollar | 1.1450 | 4.7 | 1.1 | 1.1810 | (4.3 | ) | ||||||||||||||
Argentine peso | 43.2900 | (47.8 | ) | 5.7 | 43.2900 | (56.7 | ) | |||||||||||||
Chilean peso | 795.54 | (7.2 | ) | (3.8 | ) | 757.00 | (3.2 | ) | ||||||||||||
Colombian peso | 3,745.32 | (4.3 | ) | (7.6 | ) | 3,484.32 | (4.3 | ) | ||||||||||||
Peruvian sol | 3.8621 | 0.5 | (1.2 | ) | 3.8787 | (5.1 | ) | |||||||||||||
Turkish lira | 6.0588 | (25.0 | ) | 15.0 | 5.7058 | (27.8 | ) | |||||||||||||
Table of Contents
28
| ||||||||||
| Highlights | ||||||||||
• |
Activity growth in high profitable segments. | |||||||||
• |
Good performance of net fees and commissions. | |||||||||
• |
Operating expenses decline during all quarters. | |||||||||
• |
Solid asset-quality indicators: lower impairments and provisions. | |||||||||
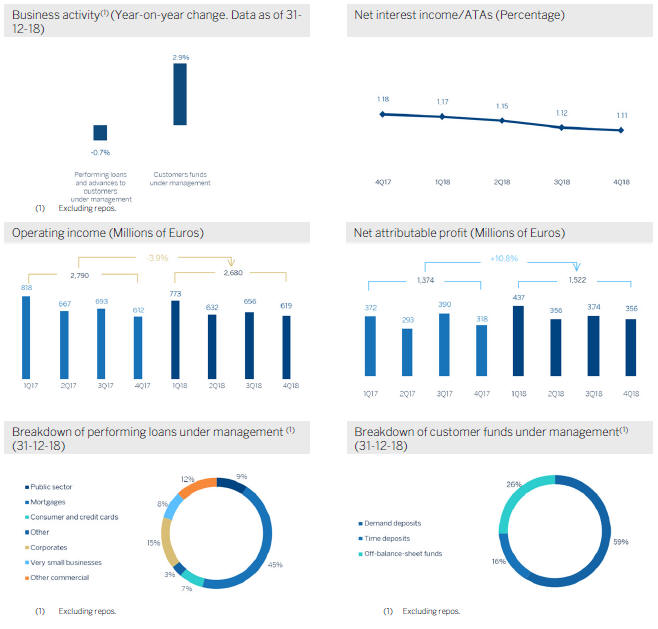
Table of Contents
29
Financial statements and relevant business indicators
(Millions of euros and percentage)
Income statement | IFRS 9 2018 | D % | IAS 39 2017 | |||||||||
Net interest income | 3,672 | (1.8 | ) | 3,738 | ||||||||
Net fees and commissions | 1,681 | 7.7 | 1,561 | |||||||||
Net trading income | 466 | (16.1 | ) | 555 | ||||||||
Other operating income and expenses | 124 | (62.0 | ) | 327 | ||||||||
of which Insurance activities(1) | 485 | 12.0 | 433 | |||||||||
Gross income | 5,943 | (3.8 | ) | 6,180 | ||||||||
Operating expenses | (3,262 | ) | (3.8 | ) | (3,390 | ) | ||||||
Personnel expenses | (1,862 | ) | (2.9 | ) | (1,917 | ) | ||||||
Other administrative expenses | (1,113 | ) | (3.6 | ) | (1,154 | ) | ||||||
Depreciation | (288 | ) | (9.8 | ) | (319 | ) | ||||||
Operating income | 2,680 | (3.9 | ) | 2,790 | ||||||||
Impairment on financial assets not measured at fair value through profit or loss | (371 | ) | (34.6 | ) | (567 | ) | ||||||
Provisions or reversal of provisions and other results | (292 | ) | (20.9 | ) | (369 | ) | ||||||
Profit/(loss) before tax | 2,017 | 8.8 | 1,854 | |||||||||
Income tax | (492 | ) | 3.1 | (477 | ) | |||||||
Profit/(loss) for the year | 1,525 | 10.8 | 1,377 | |||||||||
Non-controlling interests | (3 | ) | 7.1 | (3 | ) | |||||||
Net attributable profit | 1,522 | 10.8 | 1,374 | |||||||||
| (1) | Includes premiums received net of estimated technical insurance reserves. |
Balance sheets | IFRS 9 31-12-18 | D % | IAS 39 31-12-17 | |||||||||
Cash, cash balances at central banks and other demand deposits | 27,841 | 106.8 | 13,463 | |||||||||
Financial assets designated at fair value | 100,094 | 25.9 | 79,501 | |||||||||
of which loans and advances | 28,451 | n.s. | 1,312 | |||||||||
Financial assets at amortized cost | 193,936 | (12.4 | ) | 221,391 | ||||||||
of which loans and advances to customers | 169,856 | (7.3 | ) | 183,172 | ||||||||
Inter-area positions | 7,314 | n.s. | 1,806 | |||||||||
Tangible assets | 1,263 | 44.1 | 877 | |||||||||
Other assets | 4,846 | 103.6 | 2,380 | |||||||||
Total assets/liabilities and equity | 335,294 | 5.0 | 319,417 | |||||||||
Financial liabilities held for trading and designated at fair value through profit or loss | 66,255 | 80.0 | 36,817 | |||||||||
Deposits from central banks and credit institutions | 44,043 | (29.2 | ) | 62,226 | ||||||||
Deposits from customers | 180,891 | 1.8 | 177,763 | |||||||||
Debt certificates | 30,451 | (8.6 | ) | 33,301 | ||||||||
Inter-area positions | — | — | — | |||||||||
Other liabilities | 5,756 | n.s. | 391 | |||||||||
Economic capital allocated | 7,898 | (11.5 | ) | 8,920 | ||||||||
Relevant business indicators | 31-12-18 | D % | 31-12-17 | |||||||||
Performing loans and advances to customers under management(1) | 166,131 | (0.7 | ) | 167,291 | ||||||||
Non-performing loans | 9,101 | (16.0 | ) | 10,833 | ||||||||
Customer deposits under management(1) | 181,119 | 3.6 | 174,822 | |||||||||
Off-balance sheet funds(2) | 62,557 | 0.8 | 62,054 | |||||||||
Risk-weighted assets | 100,950 | (6.6 | ) | 108,141 | ||||||||
Efficiency ratio (%) | 54.9 | 54.9 | ||||||||||
NPL ratio (%) | 4.6 | 5.5 | ||||||||||
NPL coverage ratio (%) | 57 | 50 | ||||||||||
Cost of risk (%) | 0.21 | 0.32 | ||||||||||
| (1) | Excluding repos. |
| (2) | Includes mutual funds, pension funds and other off-balance sheet funds. |
Table of Contents
30
Macro and industry trends
According to the latest information from the National Institute of Statistics (INE for its acronym in Spanish), the Spanisheconomy grew 0.6% on a quarterly basis during the the third quarter of 2018, consolidating a solid growth throughout the year but at a more moderate pace than the two previous years. The most recent indicators show that this progress of the GDP has continued in the last quarter of 2018, supported by robust domestic factors related to the improvement of the labor market and favorable financial conditions. Both monetary and fiscal policy continue to support growth, while the depreciation of the euro and demand in the euro zone must continue to support exports. All in all, the economy could have grown around 2.5% in 2018.
Regarding the Spanishbanking system and according to October 2018 data from the Bank of Spain (latest published data), the total volume of lending to the private sector (household and corporate) continued to decline year-on-year (down 3.0%). Non-performing loans in the sector decreased significantly (down 28.2% year-on-year as of October 2018) driven by the completion of several transactions of non-performing loans and real-estate assets during 2018. At the end of October, the sector’s NPL ratio was 6.08%, that is 26.0% below the figure registered in the previous year.
Activity
The most relevant aspects related to the area’s activity during 2018 were:
| • | Lending (performing loans under management) closed in line with the figure at the end of December 2017 (down 0.7% year-on-year), mainly due to the reduction in the mortgage portfolio (down 3.6%) and other commercial portfolios (-11.2%). In contrast, consumer financing and credit cards maintained a very positive performance (during the course of the year up 21.9%), which, together with the good evolution of the SME portfolio (+6.5%), offset the reduction of mortgage loans. In the last three months of 2018 there has been a transfer of outstanding portfolio of performing loans from Non Core Real Estate to Banking Activity in Spain, amounting to €60m, which, in addition to the e one completed in the first semester amounts to a total of €260m in the year. |
| • | Inasset quality, the non-performing loans balance showed a downward trend over the year that positively affected the area’s NPL ratio, which reduced to 4.6% from the 5.5% as of 31-December-2017. The NPL coverage ratio closed at 57%, 660 basis points above the closing of 2017. |
| • | Customerdeposits under management grew by 3.6% compared to the close of December 2017 (up 3.5% in the last quarter of 2018). By products, there was a decline in time deposits (down 20.4% year-on-date), that has by far offset by the increase in demand deposits (up 12.7%), which as of December represent approximately 80% of total liabilities. |
| • | Theoff-balance-sheetfunds showed a slight increase with respect to the figure registered twelve months before (+0.8%), despite of the unfavorable evolution of the markets, especially in the last quarter. |
Results
The net attributableprofit generated by the Banking Activity in Spain in 2018 reached €1,522m, which represents a year-on-year increase of 10.8%, strongly supported by the favorable performance of commissions, a strict control of operating expenses and provisions. The highlights of the area’s income statement are:
| • | Net interest income showed a decline of 1.8% year-on-year although it increased slightly in the fourth quarter of 2018 (+1.2%). The smaller contribution from targeted longer-term refinancing operations (TLTRO) explained most of this evolution. |
| • | Positive performance ofnet fees and commissions (up 7.7% year-on-year), which offset by far the decline in net interest income. There was a significant contribution from asset management fees and banking commissions. |
| • | Lower contribution fromNTI compared to the same period of previous year (down 16.1%), associated with lower ALCO portfolio sales in 2018. |
| • | Reduction inother income/expenses (down 62.0% year-on-year). One of the aspects explaining this is the greater contribution made to the DGF and SRF compared to 2017. Also, net earnings from the insurance business showed an increase of 12.0%. |
| • | Operating expenses declined by 3.8% and theefficiency ratio closed at 54.9%, in line with the figure registered at the close of 2017. |
| • | Decline inimpairment losses on financial assets (down 34.6% year-on-year) explained by lower gross additions to NPLs and loan-loss provisions for large customers. As a result, the cumulative cost of risk stood at 0.21% as of December 31, 2018. |
| • | Lastly,provisions (net) and other gains (losses) showed a year-on-year decline of 20.9%, mainly favoured by lower restructuring costs. |
Table of Contents
31
| ||||||||||
| Highlights | ||||||||||
• |
Continued positive trend in the Spanish real-estate market, although with a more moderate growth rate. | |||||||||
• |
Minimum levels of the net real-estate exposure. | |||||||||
• |
Closing of the sale agreement of the participation in Testa. | |||||||||
• |
Significant reduction in net losses in the area. | |||||||||
Industry trends
The Spanish real estate market continues to show a growth trend, somewhat more moderated. The macroeconomic context continues to be favorable for residential demand: interest rates remain at minimum levels and the economy is still generating jobs. However, the uncertainty regarding economic policy could affect the decision of households and entrepreneurs of the sector.
| • | Investment in housing accelerated its growth in the third quarter of 2018, after the slowdown registered in the previous quarter. According to data from the National Quarterly Accounting Office of the INE investment in housing grew by 1.6% between July and September, an evolution that, once again, exceeded the economy as a whole. |
| • | Between January and November, 526,840 homes were sold in Spain, a year-on-year increase of 8.5%, according to information from the General Council of Spanish Notaries (CIEN). |
| • | Housingprices accelerated in the third quarter of 2018 to 7.2% in year-on-year terms (INE figures), exceeding the figures registered in the two previous quarters. |
| • | The interest rate applied to new loan operations remains at 2.3% and thecost of mortgage financing remains at relatively low levels. As a result, new home loans grew by 17.1% in the first eleven months of the year. |
| • | Finally, the evolution of theconstruction activity continued to be robust, in response to the increase in residential demand. According to data from the Ministry of Public Works, nearly 84,000 new housing construction permits were approved in the first ten months of the year 2018, 23.2% more than in the same period of 2017. |
Activity
The net real-estateexposure amounted to €2,498m as of 31-December-2018, which means a very significant reduction in year-on-year terms (-61.1%).
With regards to the loans to developers, in the last three months of 2018 outstanding performing loans to developers for an amount of €60m were transferred from Non Core Real Estate to Banking Activity in Spain, that together with the transfer already made during the first half of 2018 stood at €260m in the year. In addition, the agreement with the Canada Pension Plan Investment Board (CPPIB) for the sale of non-performing and written-off loans to developers for a gross amount of approximately €1 billion was closed in July.
Having received the regulatory authorizations, BBVA closed on October 10, 2018 the operation of the transfer of its real-estate business in Spain to Cerberus Capital Management, L.P. (Cerberus). The closing of this operation implies the sale of 80% of the share capital of Divarian, the joint venture to which the real-estate business had been transferred, however the effective transfer of some real estate owned assets (“REOs”) is subject to the fulfillment of certain conditions and in the meanwhile, BBVA will continue to manage those assets. As of December 31, 43,900 assets with a value 2,828 million euros would have been transferred to Divarian. 17,485 assets with a value of approximately €900m are pending transfer, subject to specific authorizations in process of obtaining them.
As of December 31, 2018 the participation in Divarian which BBVA maintains at 20%, is recorded in Corporate Center.
In addition, on December 21, 2018 BBVA reached an agreement with Blackstone for the sale of its participation of its 25.24% stake in Testa for €478m.
Table of Contents
32
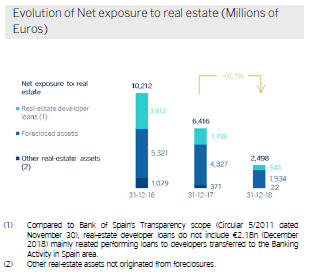
Coverage of real-estate exposure
(Millions of Euros as of 31-12-18)
| Gross Value | Provisions | Net exposure | % Coverage | |||||||||||||
Real-estate developer | 1,006 | 465 | 541 | 46 | % | |||||||||||
Performing | 174 | 23 | 150 | 13 | % | |||||||||||
Finished properties | 145 | 18 | 127 | 13 | % | |||||||||||
Construction in progress | 14 | 3 | 11 | 23 | % | |||||||||||
Land | 14 | 1 | 13 | 8 | % | |||||||||||
Without collateral and other | 1 | — | — | 46 | % | |||||||||||
NPL | 832 | 442 | 390 | 53 | % | |||||||||||
Finished properties | 361 | 160 | 201 | 44 | % | |||||||||||
Construction in progress | 23 | 11 | 13 | 45 | % | |||||||||||
Land | 392 | 237 | 156 | 60 | % | |||||||||||
Without collateral and other | 55 | 35 | 21 | 62 | % | |||||||||||
Foreclosed assets | 4,310 | 2,376 | 1,934 | 55 | % | |||||||||||
Finished properties | 3,037 | 1,501 | 1,536 | 49 | % | |||||||||||
Construction in progress | 209 | 131 | 78 | 63 | % | |||||||||||
Land | 1,064 | 744 | 320 | 70 | % | |||||||||||
Other real-estate assets(2) | 25 | 3 | 22 | 11 | % | |||||||||||
Real-estate exposure | 5,341 | 2,843 | 2,498 | 53 | % | |||||||||||
| (1) | Compared to Bank of Spain’s Transparency scope (Circular 5/2011 dated November 30), real-estate developer loans do not include €2.1 Bn (December 2018) mainly related performing loans to developers transferred to the Banking activity in Spain area. |
| (2) | Other real-estate assets not originated from foreclosures. |
Total real-estate exposure, including loans to developers, foreclosures and other assets, had acoverage ratio of 53% at the close of December 2018. The coverage ratio of foreclosed assets stood at 55%.
Non-performing loan balances showed a downward trend along the year, thanks to lower NPL entries and the recovery of activity over the quarter. The NPL coverage ratio was maintained at 53%.
Results
At the close of December 2018 this business area posted a cumulative loss in 2018 of €78m, which represents a positive evolution compared to a loss of €490m in the same period the previous year.
Table of Contents
33
Financial statements
(Millions of euros)
| IFRS 9 | IAS 39 | |||||||||||
Income statement | 2018 | D % | 2017 | |||||||||
Net interest income | 32 | (55.8 | ) | 71 | ||||||||
Net fees and commissions | 1 | (56.7 | ) | 3 | ||||||||
Net trading income | 64 | n.s. | 0 | |||||||||
Other operating income and expenses | (59 | ) | (35.7 | ) | (91 | ) | ||||||
Gross income | 38 | n.s. | (17 | ) | ||||||||
Operating expenses | (65 | ) | (33.9 | ) | (99 | ) | ||||||
Personnel expenses | (39 | ) | (23.3 | ) | (51 | ) | ||||||
Other administrative expenses | (22 | ) | (28.1 | ) | (30 | ) | ||||||
Depreciation | (5 | ) | (73.3 | ) | (18 | ) | ||||||
Operating income | (28 | ) | (76.1 | ) | (116 | ) | ||||||
Impairment on financial assets not measured at fair value through profit or loss | (12 | ) | (91.0 | ) | (138 | ) | ||||||
Provisions or reversal of provisions and other results | (89 | ) | (77.8 | ) | (403 | ) | ||||||
Profit/(loss) before tax | (129 | ) | (80.3 | ) | (656 | ) | ||||||
Income tax | 52 | (68.8 | ) | 166 | ||||||||
Profit/(loss) for the year | (78 | ) | (84.2 | ) | (491 | ) | ||||||
Non-controlling interests | (0 | ) | n.s. | 1 | ||||||||
Net attributable profit | (78 | ) | (84.2 | ) | (490 | ) | ||||||
Balance sheet | IFRS 9 31-12-18 | D % | IAS 39 31-12-17 | |||||||||
Cash, cash balances at central banks and other demand deposits | 14 | 19.8 | 12 | |||||||||
Financial assets designated at fair value | 1,358 | n.s. | 9 | |||||||||
of which loans and advances | 1,368 | n.s. | — | |||||||||
Financial assets at amortized cost | 582 | (83.5 | ) | 3,521 | ||||||||
of which loans and advances to customers | 582 | (83.5 | ) | 3,521 | ||||||||
Inter-area positions | — | — | — | |||||||||
Tangible assets | 30 | n.s. | 0 | |||||||||
Other assets | 2,179 | (64.7 | ) | 6,172 | ||||||||
Total assets/liabilities and equity | 4,163 | (57.1 | ) | 9,714 | ||||||||
Financial liabilities held for trading and designated at fair value through profit or loss | — | — | — | |||||||||
Deposits from central banks and credit institutions | 36 | n.s. | 0 | |||||||||
Deposits from customers | 36 | 187.5 | 13 | |||||||||
Debt certificates | 239 | (69.6 | ) | 785 | ||||||||
Inter-area positions | 2,691 | (53.4 | ) | 5,775 | ||||||||
Other liabilities | 205 | n.s. | — | |||||||||
Economic capital allocated | 956 | (69.6 | ) | 3,141 | ||||||||
Memorandum item: | ||||||||||||
Risk-weighted assets | 3,022 | (68.8 | ) | 9,692 | ||||||||
Table of Contents
34
| ||||||||||
| Highlights | ||||||||||
• |
Lending growth supported by business financing and retail segments. | |||||||||
• |
Good performance of net interest income and provisions. | |||||||||
• |
Improvement in efficiency. | |||||||||
• |
Net attributable profit affected by the tax reform at the end of 2017. | |||||||||
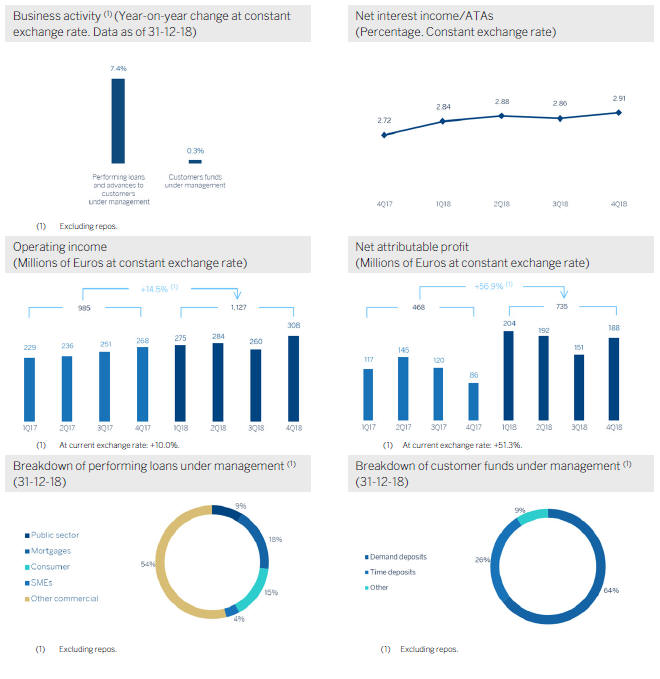
Table of Contents
35
Financial statements and relevant business indicators
(Millions of euros and percentage)
| IFRS 9 | IAS 39 | |||||||||||||||
Income statement | 2018 | D % | D % (1) | 2017 | ||||||||||||
Net interest income | 2,276 | 7.4 | 12.1 | 2,119 | ||||||||||||
Net fees and commissions | 596 | (7.5 | ) | (3.8 | ) | 644 | ||||||||||
Net trading income | 109 | (1.9 | ) | 0.9 | 111 | |||||||||||
Other operating income and expenses | 9 | n.s. | 256.4 | 2 | ||||||||||||
Gross income | 2,989 | 3.9 | 8.3 | 2,876 | ||||||||||||
Operating expenses | (1,862 | ) | 0.6 | 4.9 | (1,851 | ) | ||||||||||
Personnel expenses | (1,051 | ) | (1.6 | ) | 2.7 | (1,067 | ) | |||||||||
Other administrative expenses | (633 | ) | 6.0 | 10.5 | (598 | ) | ||||||||||
Depreciation | (178 | ) | (4.6 | ) | (0.4 | ) | (187 | ) | ||||||||
Operating income | 1,127 | 10.0 | 14.5 | 1,025 | ||||||||||||
Impairment on financial assets not measured at fair value through profit or loss | (225 | ) | (6.8 | ) | (2.6 | ) | (241 | ) | ||||||||
Provisions or reversal of provisions and other results | 16 | n.s. | n.s. | (36 | ) | |||||||||||
Profit/(loss) before tax | 919 | 22.9 | 27.6 | 748 | ||||||||||||
Income tax | (184 | ) | (29.8 | ) | (26.9 | ) | (262 | ) | ||||||||
Profit/(loss) for the year | 735 | 51.3 | 56.9 | 486 | ||||||||||||
Non-controlling interests | — | — | — | — | ||||||||||||
Net attributable profit | 735 | 51.3 | 56.9 | 486 | ||||||||||||
Balance sheets | IFRS 9 31-12-18 | D % | D % (1) | IAS 39 31-12-17 | ||||||||||||
Cash, cash balances at central banks and other demand deposits | 4,835 | (32.3 | ) | (35.3 | ) | 7,138 | ||||||||||
Financial assets designated at fair value | 10,481 | (5.3 | ) | (9.6 | ) | 11,068 | ||||||||||
of which loans and advances | 156 | 179.2 | n.s. | 56 | ||||||||||||
Financial assets at amortized cost | 63,539 | 16.1 | 10.9 | 54,705 | ||||||||||||
of which loans and advances to customers | 60,808 | 13.2 | 8.1 | 53,718 | ||||||||||||
Inter-area positions | — | — | — | — | ||||||||||||
Tangible assets | 668 | 1.5 | (3.1 | ) | 658 | |||||||||||
Other assets | 2,534 | 14.8 | 9.6 | 2,207 | ||||||||||||
|
|
|
|
|
|
|
| |||||||||
Total assets/liabilities and equity | 82,057 | 8.3 | 3.4 | 75,775 | ||||||||||||
Financial liabilities held for trading and designated at fair value through profit or loss | 234 | 68.2 | 60.6 | 139 | ||||||||||||
Deposits from central banks and credit institutions | 3,370 | (5.9 | ) | (10.1 | ) | 3,580 | ||||||||||
Deposits from customers | 63,891 | 5.1 | 0.3 | 60,806 | ||||||||||||
Debt certificates | 3,599 | 78.4 | 70.3 | 2,017 | ||||||||||||
Inter-area positions | 2,528 | 127.8 | 117.5 | 1,110 | ||||||||||||
Other liabilities | 5,395 | (0.7 | ) | (5.2 | ) | 5,431 | ||||||||||
Economic capital allocated | 3,040 | 12.9 | 7.8 | 2,693 | ||||||||||||
Table of Contents
36
Relevant business indicators | 31-12-18 | D% | D % (1) | 31-12-17 | ||||||||||||
Performing loans and advances to customers under management(2) | 60,784 | 12.5 | 7.4 | 54,036 | ||||||||||||
Non-performing loans | 802 | 15.1 | 9.9 | 696 | ||||||||||||
Customer deposits under management(2) | 63,888 | 5.1 | 0.3 | 60,806 | ||||||||||||
Off-balance sheet funds(3) | — | — | — | — | ||||||||||||
Risk-weighted assets | 64,146 | 9.3 | 4.4 | 58,688 | ||||||||||||
Efficiency ratio (%) | 62.3 | 64.4 | ||||||||||||||
NPL ratio (%) | 1.3 | 1.2 | ||||||||||||||
NPL coverage ratio (%) | 85 | 104 | ||||||||||||||
Cost of risk (%) | 0.39 | 0.43 | ||||||||||||||
| (1) | Figures at constant exchange rate. (2) Excluding repos. |
| (3) | Includes mutual funds, pension funds and other off-balance sheet funds. |
Macro and industry trends
According to the latest available information from the Bureau of Economic Analysis (BEA), in the third quarter of 2018, annualized USGDP growth moderated from 4.2% to 3.4% as a result of the moderation of non-residential investment and the drop in exports after the strong rebound in the previous quarter. Furthermore, private consumption remains robust, supported by the dynamism of the labor market and the growth in wages, as well as public spending, driven by a more expansive fiscal policy. According to the most recent indicators growth could reach approximately 2.9% during 2018. Despite the strength of domestic demand and an unemployment rate below 4% last year, coreinflation (PCE) remained relatively stable at approximately 2% in 2018, while the fall of prices of energy products was reflected in a strong moderation of headline inflation to 1.9% in November from rates close to 3% in the middle of the year. The Fed continued with the normalization process, with four increases of 25 basis points each in 2018 (up to the 2.25%-2.50% range).
The persistence of the expansive cycle in the country, together with the resurgence of uncertainty and financial volatility, associated with a combination of factors (among them, the fear of an escalating protectionism and a greater perception of risk on the vulnerability of emerging markets) have substantially revalued thedollar since the second quarter of 2018, which appreciated by around 7% during the year, with December closing data of the effective exchange rate weighted by the importance of its main trading partners.
The general situation of the country’sbanking system continued to be favorable. According to the latest available data from the Fed through November 2018, the total volume of bank credit in the system increased by 5.0% over the same month of the previous year, with a particularly positive performance in commercial loans (up 17.0% year-on-year), while real estate loans (including the mortgage loans) stayed flattish in the last twelve months. On the other hand, deposits remained basically at the same level as the prior year (down 0.6%). Lastly, non-performing loans continued their downward trend, with an NPL ratio of 1.58% at the end of the third quarter of 2018.
Activity
Unless expressly stated otherwise, all the comments below on rates of change, for both activity and earnings, will be given at constant exchange rate. These rates, together with changes at current exchange rate, can be seen in the attached tables of financial statements and relevant business indicators.
The most relevant aspects related to the area’s activity in 2018 were:
| • | Lending activity in the area (performing loans under management) showed an increase by 7.4% year-on-year. |
| • | Byportfolio, higher interest rates continued affecting negatively the mortgages and loans to developers (construction real estate). By contrast, the consumer and credit card loans, which have higher margins and are therefore more profitable, increased by 28.2% year-on-year. Both other commercial (up 7.0%) and corporates also performed well (up 12.3%). |
| • | Regarding therisk indicators, slight rebound of the NPL ratio in the quarter, which stood at 1.3% from 1.1% registered as of 30-September-2018, due to the deterioration of certain singular clients. On the other hand, the NPL coverage ratio closed at 85%. |
| • | Customerdeposits under management closed in line with the figure of December 2017 (+0.3%), affected by the deposit-gathering campaigns, with an increase the time deposits (+2.2%) and a decrease in the demand deposits (-4.0%). |
Table of Contents
37
Results
The United States generated a cumulative net attributableprofit of €735m during 2018, 56.9% higher than the one registered twelve months earlier, due mainly to the increase in net interest income, lower provisions and lower tax expenses. Also worth noting are the following:
| • | Net interest income continued to perform positively, with the cumulative figure up by 12.1% year-on-year and 2.9% over the last quarter of 2018. This was due partly to the Fed’s interest-rate hikes, but also the measures adopted by BBVA Compass to improve loan yields and contain the increase in the cost of deposits (improved deposit mix and wholesale funding). |
| • | Net fees and commissions declined by 3.8% year-on-year, due to a lower contribution from markets, investment banking and money transfers. |
| • | Operating expenses grew by 4.9% year-on-year, mainly due to greater activity related to the growth of consumer loans. This increase is lower than that shown by the gross margin (+8.3%), as a result, the efficiency ratio improved. |
| • | Impairment losses on financial assets fell by 2.6% in the last twelve months, due to the lower provisioning requirements in those portfolios affected by the 2017 hurricanes. As a result, the cumulative cost of risk through 31-December-2018 declined to 0.39%. |
| • | Lastly,income tax declined as a result of a reduction in the effective tax rate following the tax reform approved at the end of 2017, which in addition generated a one-off charge in the amount of €78m due to the valuation of deferred tax assets. |
Table of Contents
38
| ||||||||||
| Highlights | ||||||||||
• |
Good performance of the activity, with growth in all segments. | |||||||||
• |
Expenses continue to grow below the rate of gross income. | |||||||||
• |
Double-digit year-on-year growth in net attributable profit. | |||||||||
• |
Good asset quality indicators. | |||||||||
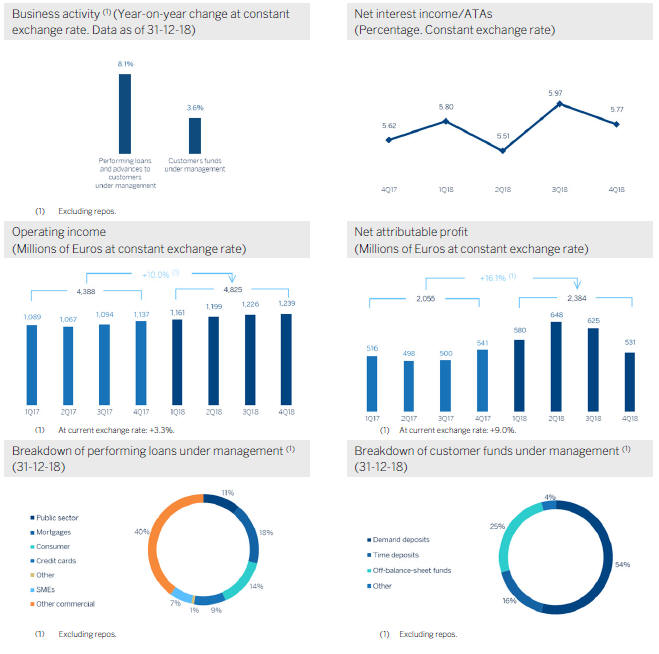
Table of Contents
39
Financial statements and relevant business indicators
(Millions of euros and percentage)
| IFRS 9 | IAS 39 | |||||||||||||||
Income statement | 2018 | D % | D % (1) | 2017 | ||||||||||||
Net interest income | 5,568 | 1.7 | 8.2 | 5,476 | ||||||||||||
Net fees and commissions | 1,205 | (1.2 | ) | 5.1 | 1,219 | |||||||||||
Net trading income | 223 | (10.4 | ) | (4.6 | ) | 249 | ||||||||||
Other operating income and expenses | 197 | 11.2 | 18.3 | 177 | ||||||||||||
Gross income | 7,193 | 1.0 | 7.5 | 7,122 | ||||||||||||
Operating expenses | (2,368 | ) | (3.4 | ) | 2.8 | (2,452 | ) | |||||||||
Personnel expenses | (1,024 | ) | (2.6 | ) | 3.7 | (1,051 | ) | |||||||||
Other administrative expenses | (1,091 | ) | (4.7 | ) | 1.5 | (1,145 | ) | |||||||||
Depreciation | (253 | ) | (1.3 | ) | 5.1 | (256 | ) | |||||||||
Operating income | 4,825 | 3.3 | 10.0 | 4,671 | ||||||||||||
Impairment on financial assets not measured at fair value through profit or loss | (1,555 | ) | (5.8 | ) | 0.2 | (1,651 | ) | |||||||||
Provisions or reversal of provisions and other results | 24 | n.s. | n.s. | (35 | ) | |||||||||||
Profit/(loss) before tax | 3,294 | 10.4 | 17.5 | 2,984 | ||||||||||||
Income tax | (909 | ) | 14.0 | 21.4 | (797 | ) | ||||||||||
Profit/(loss) for the year | 2,385 | 9.0 | 16.1 | 2,187 | ||||||||||||
Non-controlling interests | (0 | ) | 9.1 | 16.1 | (0 | ) | ||||||||||
Net attributable profit | 2,384 | 9.0 | 16.1 | 2,187 | ||||||||||||
| IFRS 9 | IAS 39 | |||||||||||||||
Balance sheets | 31-12-18 | D % | D %(1) | 31-12-17 | ||||||||||||
Cash, cash balances at central banks and other demand deposits | 8,274 | (6.3 | ) | (11.0 | ) | 8,833 | ||||||||||
Financial assets designated at fair value | 26,022 | (9.1 | ) | (13.6 | ) | 28,627 | ||||||||||
of which loans and advances | 72 | (95.4 | ) | (95.6 | ) | 1,558 | ||||||||||
Financial assets at amortized cost | 57,709 | 21.0 | 15.0 | 47,691 | ||||||||||||
of which loans and advances to customers | 51,101 | 11.7 | 6.1 | 45,768 | ||||||||||||
Tangible assets | 1,788 | 2.2 | (2.8 | ) | 1,749 | |||||||||||
Other assets | 2,663 | (62.8 | ) | (64.7 | ) | 7,160 | ||||||||||
|
|
|
|
|
|
|
| |||||||||
Total assets/liabilities and equity | 96,455 | 2.5 | (2.5 | ) | 94,061 | |||||||||||
|
|
|
|
|
|
|
| |||||||||
Financial liabilities held for trading and designated at fair value through profit or loss | 18,028 | 91.7 | 82.2 | 9,405 | ||||||||||||
Deposits from central banks and credit institutions | 683 | (88.3 | ) | (88.9 | ) | 5,853 | ||||||||||
Deposits from customers | 50,530 | 1.1 | (3.9 | ) | 49,964 | |||||||||||
Debt certificates | 8,566 | 17.1 | 11.4 | 7,312 | ||||||||||||
Other liabilities | 14,508 | (17.7 | ) | (21.8 | ) | 17,627 | ||||||||||
Economic capital allocated | 4,140 | 6.2 | 0.9 | 3,901 | ||||||||||||
Relevant business indicators | 31-12-18 | D % | D %(1) | 31-12-17 | ||||||||||||
Performing loans and advances to customers under management(2) | 51,387 | 13.7 | 8.1 | 45,196 | ||||||||||||
Non-performing loans | 1,138 | 1.3 | (3.7 | ) | 1,124 | |||||||||||
Customer deposits under management(2) | 49,740 | 10.3 | 4.9 | 45,093 | ||||||||||||
Off-balance sheet funds(3) | 20,647 | 6.0 | 0.8 | 19,472 | ||||||||||||
Risk-weighted assets | 53,359 | 18.7 | 12.9 | 44,941 | ||||||||||||
Efficiency ratio (%) | 32.9 | 34.4 | ||||||||||||||
NPL ratio (%) | 2.1 | 2.3 | ||||||||||||||
NPL coverage ratio (%) | 154 | 123 | ||||||||||||||
Cost of risk (%) | 3.07 | 3.24 | ||||||||||||||
| (1) | Figures at constant exchange rate. |
| (2) | Excluding repos. |
| (3) | Includes mutual funds, pension funds and other off-balance sheet funds. |
Table of Contents
40
Macro and industry trends
The quarterlyGDP growth in Mexico was 0.8% in the third quarter of 2018, measured in figures adjusted by seasonality. This expansion, after a growth by 1.1% in the first quarter and a slight contraction of 0.1% in the second quarter, is mainly explained by the expansion of services and the manufacturing sector. On the demand side, the main contribution to growth in the third quarter has been from consumption. While private investment has shown new signs of weakness. The trade agreement reached by Mexico, the United States and Canada, as well as the reduction in uncertainty regarding the economic policy of the administration of Andrés Manuel López Obrador, who assumed the presidency of the country on December 1, could help to maintain in the following periods the dynamism observed in the third quarter.
With respect toinflation, the increase observed in recent months seems to be transitory, since it is mainly due to the increase in energy prices, while core inflation remains relatively stable. This, together with contained inflation pressures, suggests that additional interest rate hikes by Banxico might not be necessary for the remainder of the year.
For yet another quarter, the Mexicanbanking system showed excellent levels of solvency and asset quality. According to the latest available information from the Mexican National Banking and Securities Commission (CNBV) in November 2018, activity remained as strong as in previous quarters, with year-on-year growth in the volume of lending and deposits (demand and time deposits) at 10.6% and 8.4%, respectively. Both the NPL ratio (2.2%) and NPL coverage ratio (150%) were stable. Finally, solvency in the system is at a comfortable level, with a capital adequacy ratio of 15.65% as of the end of October 2018.
Activity
Unless expressly stated otherwise, all the comments below on rates of change, for both activity and earnings, will be given at constant exchange rate. These rates, together with changes at current exchange rate, can be seen in the attached tables of financial statements and relevant business indicators.
The most relevant aspects related to the area’s activity year in 2018 were:
| • | Year-on-year increase inlending (performing loans and advances to customers under management) of 8.1%. BBVA maintains its leading position in the country, with a market share of 22.6% in outstanding performing loans, according to local figures from the CNBV at the end of November 2018. |
| • | By portfolios: thewholesale portfolio, which represents 51.8% of total lending, increased by 9.4% in year-on-year terms, driven mainly by medium-sized companies and the corporates segment. As for theretail portfolio, it increased by 6.7% (including SMEs), which was heavily supported by consumer loans (payroll, personal and auto), which rose by 8.7%. |
| • | With respect to theasset quality indicators, the NPL ratio closed at 2.1% from the 2.3% registered twelve months earlier. The NPL coverage ratio closed at 154%. |
| • | Total customerfunds (customer deposits under management, mutual funds and other off-balance sheet funds) showed a year-on-year increase of 3.6%, with remarkable growth in demand deposits (+7.6%), in time deposits (+4.0%) and mutual funds (+2.6%). |
| • | A profitable funding mix: low-cost accounts represent 77% of total customer deposits under management. |
Results
BBVA in Mexico posted in 2018 a net attributableprofit of €2,384m, a year-on-year increase of 16.1%. The main highlights in the evolution of income statement in Mexico is summarized below:
| • | Positive performance of thenet interest income, which showed a year-on-year growth of +8.2%, highly aligned with lending activity (+8.1%). |
| • | Good performance ofnet fees and commissions, which showed an increase of 5.1% as a result of increased activity in mutual funds, as well as a higher volume of transactions with on-line banking and credit card customers. |
| • | NTI registered a decrease (-4.6%) due to the unfavorable performance of the Global Markets unit during 2018. |
| • | Theother income/expenses line registered year-on-year growth of 18.3%, mainly due to the positive performance of the insurance activity. |
| • | Operating expenses continued to grow at a very controlled pace (up +2.8% year-on-year) and below the area’sgross income growth (+7.5%). As a result, the efficiency ratio has continued to improve and stood at 32.9% as of December 31, 2018. |
| • | Adequate risk management has been reflected in the change in theimpairment losses on financial assets line item, which remains at the same level as 2017 (+0.2% year-on-year), despite the loan growth during the year, mainly explained by a change in the mix of the loan portfolio. As a result, the cumulative cost of risk in the area closed at 3.07% versus 3.24% as of December 2017. |
| • | The positive evolution in theother gains (losses) line, that included the extraordinary income from the sale of BBVA Bancomer’s stake in a real-estate development and the capital gain from the sale of a corporate building by Bancomer. |
Table of Contents
41
| ||||||||||
| Highlights | ||||||||||
• |
Activity impacted by the evolution of exchange rates. | |||||||||
• |
Good performance of recurring revenue items, as a result of the inflation-linked bonds performance. | |||||||||
• |
Operating expenses growth below inflation. | |||||||||
• |
Risk indicators affected by the update of the macroeconomic scenario and certain negative impacts of the portfolio of wholesale customers. | |||||||||
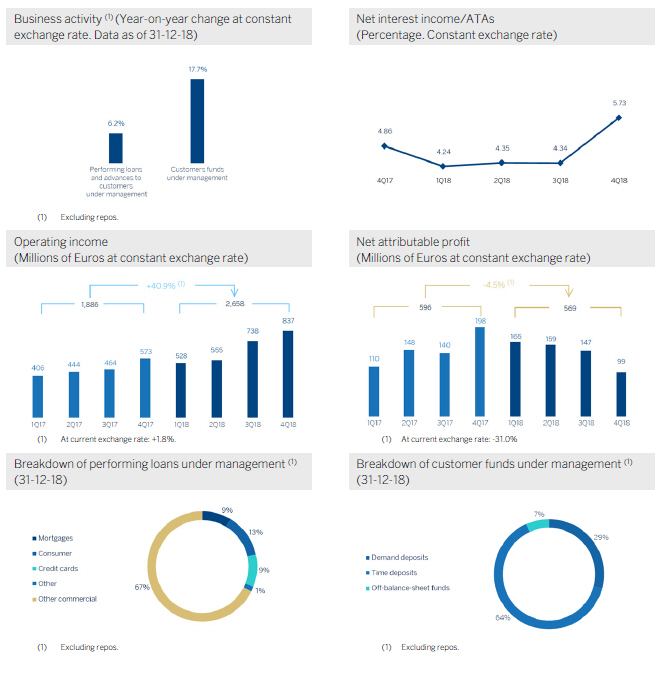
Table of Contents
42
Financial statements and relevant business indicators
(Millions of euros and percentage)
Income statement | IFRS 9 2018 | D % | D %(1) | IAS 39 2017 | ||||||||||||
Net interest income | 3,135 | (5.9 | ) | 30.3 | 3,331 | |||||||||||
Net fees and commissions | 686 | (2.4 | ) | 35.1 | 703 | |||||||||||
Net trading income | 11 | (24.2 | ) | 5.0 | 14 | |||||||||||
Other operating income and expenses | 70 | 3.4 | 43.1 | 67 | ||||||||||||
Gross income | 3,901 | (5.2 | ) | 31.3 | 4,115 | |||||||||||
Operating expenses | (1,243 | ) | (17.3 | ) | 14.5 | (1,503 | ) | |||||||||
Personnel expenses | (656 | ) | (17.9 | ) | 13.6 | (799 | ) | |||||||||
Other administrative expenses | (449 | ) | (14.6 | ) | 18.2 | (526 | ) | |||||||||
Depreciation | (138 | ) | (22.4 | ) | 7.5 | (178 | ) | |||||||||
Operating income | 2,658 | 1.8 | 40.9 | 2,612 | ||||||||||||
Impairment on financial assets not measured at fair value through profit or loss | (1,202 | ) | 165.3 | 267.4 | (453 | ) | ||||||||||
Provisions or reversal of provisions and other results | (8 | ) | (33.7 | ) | (8.2 | ) | (12 | ) | ||||||||
Profit/(loss) before tax | 1,448 | (32.5 | ) | (6.6 | ) | 2,147 | ||||||||||
Income tax | (294 | ) | (31.0 | ) | (4.5 | ) | (426 | ) | ||||||||
Profit/(loss) for the year | 1,154 | (32.9 | ) | (7.1 | ) | 1,720 | ||||||||||
Non-controlling interests | (585 | ) | (34.6 | ) | (9.5 | ) | (895 | ) | ||||||||
|
|
|
|
|
|
|
| |||||||||
Net attributable profit | 569 | (31.0 | ) | (4.5 | ) | 826 | ||||||||||
|
|
|
|
|
|
|
| |||||||||
Balance sheets | IFRS 9 31-12-18 | D % | D %(1) | IAS 39 31-12-17 | ||||||||||||
Cash, cash balances at central banks and other demand deposits | 7,853 | 94.6 | 159.3 | 4,036 | ||||||||||||
Financial assets designated at fair value | 5,506 | (14.2 | ) | 14.3 | 6,419 | |||||||||||
of which loans and advances | 410 | n.s. | n.s. | — | ||||||||||||
Financial assets at amortized cost | 50,315 | (22.7 | ) | 3.0 | 65,083 | |||||||||||
of which loans and advances to customers | 41,478 | (19.3 | ) | 7.6 | 51,378 | |||||||||||
Tangible assets | 1,059 | (21.2 | ) | 5.1 | 1,344 | |||||||||||
Other assets | 1,517 | (16.3 | ) | 11.6 | 1,811 | |||||||||||
|
|
|
|
|
|
|
| |||||||||
Total assets/liabilities and equity | 66,250 | (15.8 | ) | 12.2 | 78,694 | |||||||||||
|
|
|
|
|
|
|
| |||||||||
Financial liabilities held for trading and designated at fair value through profit or loss | 1,852 | 185.9 | 281.0 | 648 | ||||||||||||
Deposits from central banks and credit institutions | 6,734 | (39.8 | ) | (19.8 | ) | 11,195 | ||||||||||
Deposits from customers | 39,905 | (10.7 | ) | 19.0 | 44,691 | |||||||||||
Debt certificates | 5,964 | (28.5 | ) | (4.8 | ) | 8,346 | ||||||||||
Other liabilities | 9,267 | (18.1 | ) | 9.1 | 11,321 | |||||||||||
Economic capital allocated | 2,529 | 1.4 | 35.2 | 2,493 | ||||||||||||
Relevant business indicators | 31-12-18 | D % | D %(1) | 31-12-17 | ||||||||||||
Performing loans and advances to customers under management(2) | 40,996 | (20.3 | ) | 6.2 | 51,438 | |||||||||||
Non-performing loans | 2,876 | 12.7 | 50.1 | 2,553 | ||||||||||||
Customer deposits under management(2) | 39,897 | (10.4 | ) | 19.4 | 44,539 | |||||||||||
Off-balance sheet funds(3) | 2,894 | (25.8 | ) | (1.2 | ) | 3,902 | ||||||||||
Risk-weighted assets | 56,486 | (10.0 | ) | 19.9 | 62,768 | |||||||||||
Efficiency ratio (%) | 31.9 | 36.5 | ||||||||||||||
NPL ratio (%) | 5.3 | 3.9 | ||||||||||||||
NPL coverage ratio (%) | 81 | 85 | ||||||||||||||
Cost of risk (%) | 2.44 | 0.82 | ||||||||||||||
| (1) | Figures at constant exchange rate. |
| (2) | Excluding repos. |
| (3) | Includes mutual funds, pension funds and other off-balance sheet funds. |
Table of Contents
43
Macro and industry trends
According to the most recent figures from the Turkish Statistical Institute, Turkey’s year-on-yeareconomic growth was 1.6% in the third quarter of 2018, supported by the considerable positive external demand contribution, while domestic demand, including inventories, hindered growth.
Year-on-year inflation experienced a rapid correction as it declined from 24.5% in September to 20.3% in December, as a result of tax reductions in certain items, price discount campaigns, the contraction in oil prices and the appreciation of the Turkish lira by around 20% in the last four months of 2018.
Throughout the year, the Central Bank (CBRT) increased its fundinginterest rate by 1.125 basis points. However, in its December meeting the CBRT decided to keep it at 24.0%. With this decision, the CBRT strengthened its message against the easing expectations of the market, saying that risks on price stability continue to prevail despite the recent improvement in inflation outlook due to the developments in import prices and domestic demand conditions. Regarding fiscal policy stance, the government’s budget targets were met at the end of 2018 with the support of one-off revenues.
Regarding the evolution of the Turkishfinancial sector, year-on-year credit growth has continued to decelerate during the last quarter of 2018, mainly due to business lending. By the last week of December 2018, the year-on-year total lending growth rate (adjusted for the depreciation of the lira effect) fell to 3.1%. On the other hand, customer deposits have also shown sign of a slowdown. The year-on-year total deposits growth rate fell to 6.2% (adjusted for the depreciation of the lira effect). Turkish-lira deposits grew by 10.6% and foreign-currency deposits (mainly in U.S. dollars) contracted by 7.6%. Lastly, the NPL ratio closed at 3.66% for December 28th (an increase of 59 basis points in the last quarter).
Activity
Unless expressly stated and communicated otherwise, rates of changes explained ahead, both for activity and for income will be presented at constant exchange rates. These rates, together with changes at current exchange rates, can be observed in the attached tables of the financial statements and relevant business indicators.
The most relevant aspects related to the area’s activity year-to-date as of December 31, 2018 have been:
| • | Lending activity(performing loans under management) grew by 6.2% in the year driven by the evolution of exchange rates (down 11.2% in the quarter). On the one hand, Garanti Bank continued to reduce its exposure in foreign-currency loans (in U.S. dollars) in all quarters of 2018 in line with its corporate strategy; while on the other hand, Turkish-lira loan growth decelerated in the third quarter and decreased significantly in the last |
quarter of 2018.
| • | Bysegments, contraction has accelerated in the fourth quarter in all types of loans except auto loans and credit cards, which grew above the sector. On the contrary, the contraction in consumer and mortgage loans accelerated in the quarter in line with the sector and there was a contraction in Turkish-lira business banking loans which is in line with the private banks. |
| • | In terms ofasset quality, the NPL ratio increased to 5.3% due to the macroeconomic conditions and the inflow of certain doubtful clients. The NPL coverage ratio stood at 81%. |
| • | Customerdeposits (60% of total liabilities in the area as of December 31, 2018) remained the main source of funding for the Turkish’s balance sheet and grew by 19.4% in 2018 mainly supported by the growth of Garanti Bank Turkish-lira deposits. On the other hand, shrinkage in foreign-currency customer deposits (in U.S. dollars) continued due to higher interest rates in Turkish-lira deposits. |
| • | All funding and liquidity ratios remained within comfort levels, and Garanti maintained itssolvency levels well above requirements. |
Results
In 2018, Turkey generated a cumulative attributableprofit of €569m, a year-on-year decline of 4.5%. The most significant aspects of the year-on-year evolution in the income statement were as follows:
| • | Positive performance ofnet interest income (up to 30.3%) despite the pressure on customer spreads, mainly due to the significant income from inflation-linked bonds, whose contribution, compared to previous year, is more than double. |
| • | Income from net fees and commissions grew by 35.1%. This significant increase was mainly driven by the positive performance in payment systems, advances, money transfers and other commissions. |
| • | Increase inNTI (by 5.0%) where the high performance of global markets, asset and liabilities management and derivatives offsets the Turkish lira depreciation. |
| • | Gross income was up 31.3% in 2018 compared to 2017, thanks to the increase in core banking activities and the aforementioned higher inflation-linked bonds contribution. |
Table of Contents
44
| • | Operating expenses increased by 14.5%, below the average inflation rate (16.2%) and well below the year-on-year growth rate in gross income. As a result of strict cost-control discipline, the efficiency ratio declined to 31.9%. |
| • | Impairment on financial assets increased in year-on-year terms by 267.4%, mainly denominated by big ticket provisions coming from the wholesale-customer portfolio and also the macroeconomic scenario update. As a result, the cumulative cost of risk of the area increased to 2.44%. |
Table of Contents
45
| Highlights | ||||||||||
| • | Activity affected by the sale of BBVA Chile. | |||||||||
| • | In other countries, the activity evolves at a good pace. | |||||||||
| • | Argentina hyperinflation adjustment impacts in every item of the income statement. | |||||||||
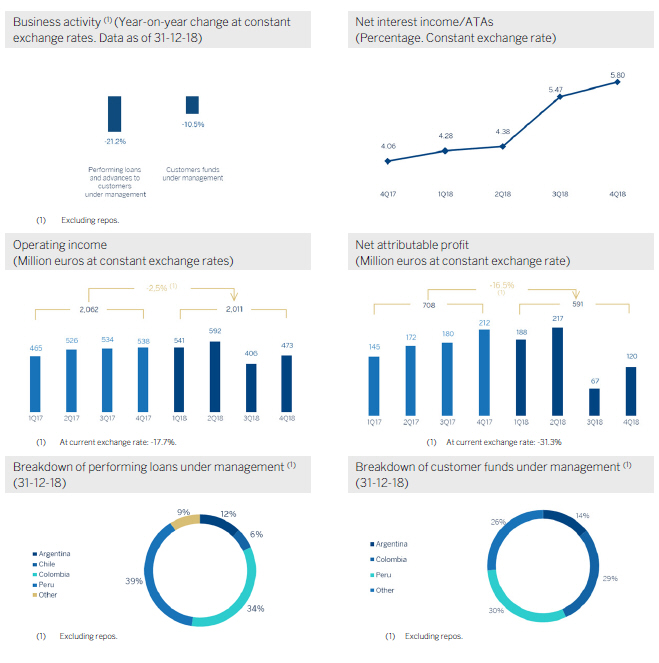
Table of Contents
46
Financial statements and relevant business indicators
(Millions of euros and percentage)
| IFRS 9 | IAS 39 | |||||||||||||||
Income statement | 2018 | D % | D % (1) | 2017 | ||||||||||||
Net interest income | 3,009 | (6.0) | 12.8 | 3,200 | ||||||||||||
Net fees and commissions | 631 | (11.4) | 10.9 | 713 | ||||||||||||
Net trading income | 405 | (15.7) | 5.2 | 480 | ||||||||||||
Other operating income and expenses | (344) | n.s. | n.s. | 59 | ||||||||||||
Gross income | 3,701 | (16.9) | 1.9 | 4,451 | ||||||||||||
Operating expenses | (1,690) | (15.8) | 7.7 | (2,008) | ||||||||||||
Personnel expenses | (846) | (18.3) | 5.9 | (1,035) | ||||||||||||
Other administrative expenses | (719) | (15.5) | 7.4 | (851) | ||||||||||||
Depreciation | (125) | 3.2 | 24.7 | (121) | ||||||||||||
Operating income | 2,011 | (17.7) | (2.5) | 2,444 | ||||||||||||
Impairment on financial assets not measured at fair value through profit or loss | (638) | (1.9) | 5.2 | (650) | ||||||||||||
Provisions or reversal of provisions and other results | (65) | (36.3) | (15.5) | (103) | ||||||||||||
Profit/(loss) before tax | 1,307 | (22.7) | (5.1) | 1,691 | ||||||||||||
Income tax | (475) | (2.2) | 23.9 | (486) | ||||||||||||
Profit/(loss) for the year | 833 | (30.9) | (16.3) | 1,205 | ||||||||||||
Non-controlling interests | (241) | (29.9) | (15.9) | (345) | ||||||||||||
Net attributable profit | 591 | (31.3) | (16.5) | 861 | ||||||||||||
| IFRS 9 | IAS 39 | |||||||||||||||
Balance sheets | 31-12-18 | D % | D %(1) | 31-12-17 | ||||||||||||
Cash, cash balances at central banks and other demand deposits | 8,987 | (0.6) | 11.0 | 9,039 | ||||||||||||
Financial assets designated at fair value | 5,634 | (51.5) | (47.0) | 11,627 | ||||||||||||
of which loans and advances | 129 | n.s. | n.s. | 3 | ||||||||||||
Financial assets at amortized cost | 36,649 | (28.4) | (21.3) | 51,207 | ||||||||||||
of which loans and advances to customers | 34,469 | (28.6) | (21.6) | 48,272 | ||||||||||||
Tangible assets | 813 | 12.1 | 33.3 | 725 | ||||||||||||
Other assets | 302 | (85.2) | (83.9) | 2,038 | ||||||||||||
Total assets/liabilities and equity | 52,385 | (29.8) | (22.7) | 74,636 | ||||||||||||
Financial liabilities held for trading and designated at fair value through profit or loss | 1,357 | (51.9) | (48.4) | 2,823 | ||||||||||||
Deposits from central banks and credit institutions | 3,076 | (59.3) | (57.9) | 7,552 | ||||||||||||
Deposits from customers | 35,842 | (21.5) | (13.0) | 45,666 | ||||||||||||
Debt certificates | 3,206 | (55.5) | (53.0) | 7,209 | ||||||||||||
Other liabilities | 6,551 | (23.0) | (10.4) | 8,505 | ||||||||||||
Economic capital allocated | 2,355 | (18.3) | (7.5) | 2,881 | ||||||||||||
Relevant business indicators | 31-12-18 | D % | D %(1) | 31-12-17 | ||||||||||||
Performing loans and advances to customers under management(2) | 34,518 | (28.2) | (21.2) | 48,068 | ||||||||||||
Non-performing loans | 1,747 | (7.3) | (3.2) | 1,884 | ||||||||||||
Customer deposits under management(3) | 35,984 | (21.7) | (13.2) | 45,970 | ||||||||||||
Off-balance sheet funds(4) | 11,662 | (4.4) | (1.1) | 12,197 | ||||||||||||
Risk-weighted assets | 42,736 | (23.7) | (14.4) | 55,975 | ||||||||||||
Efficiency ratio (%) | 45.7 | 45.1 | ||||||||||||||
NPL ratio (%) | 4.3 | 3.4 | ||||||||||||||
NPL coverage ratio (%) | 97 | 89 | ||||||||||||||
Cost of risk (%) | 1.44 | 1.32 | ||||||||||||||
| (1) | Figures at constant exchange rates. |
| (2) | Excluding repos. |
| (3) | Excluding repos and including specific marketable debt securities. |
| (4) | Includes mutual funds, pension funds and other off-balance sheet funds. |
Table of Contents
47
South America. Data per country
(Million of euros)
| IFRS 9 | IAS 39 | IFRS 9 | IAS 39 | |||||||||||||||||||||||||||||
| Operating income | Net attributable profit | |||||||||||||||||||||||||||||||
Country | 2018 | D % | D % (1) | 2017 | 2018 | D % | D % (1) | 2017 | ||||||||||||||||||||||||
Argentina | 179 | (65.7 | ) | (20.6 | ) | 522 | (29 | ) | n.s. | n.s. | 219 | |||||||||||||||||||||
Chile | 289 | (31.2 | ) | (28.9 | ) | 421 | 137 | (27.1 | ) | (24.7 | ) | 188 | ||||||||||||||||||||
Colombia | 645 | 0.3 | 4.8 | 644 | 229 | 11.6 | 16.6 | 206 | ||||||||||||||||||||||||
Peru | 736 | 1.3 | 6.7 | 726 | 195 | 8.4 | 14.3 | 180 | ||||||||||||||||||||||||
Other countries(2) | 161 | 23.0 | 29.7 | 131 | 59 | (13.6 | ) | (8.2 | ) | 68 | ||||||||||||||||||||||
|
|
|
|
|
|
|
|
|
|
|
|
|
|
|
| |||||||||||||||||
Total | 2,011 | (17.7 | ) | (2.5 | ) | 2,444 | 591 | (31.3 | ) | (16.5 | ) | 861 | ||||||||||||||||||||
|
|
|
|
|
|
|
|
|
|
|
|
|
|
|
| |||||||||||||||||
(1) Figures at constant exchange rates.
(2) Venezuela, Paraguay, Uruguay and Bolivia. Additionally, it includes eliminations and other charges.
South America. Relevant business indicators per country
(Millions of euros)
| Argentina | Chile | Colombia | Peru | |||||||||||||||||||||||||||||
| 31-12-18 | 31-12-17 | 31-12-18 | 31-12-17 | 31-12-18 | 31-12-17 | 31-12-18 | 31-12-17 | |||||||||||||||||||||||||
Performing loans and advances to customers under management(1)(2) | 4,221 | 2,982 | 2,045 | 13,542 | 11,835 | 11,385 | 13,351 | 13,021 | ||||||||||||||||||||||||
Non-performing loans and guarantees given(1) | 87 | 24 | 58 | 390 | 768 | 643 | 709 | 648 | ||||||||||||||||||||||||
Customer deposits under management(1)(3) | 5,986 | 3,531 | 10 | 8,975 | 12,543 | 11,702 | 12,843 | 12,263 | ||||||||||||||||||||||||
Off-balance sheet funds(1)(4) | 783 | 654 | — | 1,201 | 1,287 | 1,070 | 1,666 | 1,589 | ||||||||||||||||||||||||
Risk-weighted assets | 8,036 | 9,364 | 2,243 | 14,398 | 12,672 | 12,299 | 15,760 | 14,879 | ||||||||||||||||||||||||
Efficiency ratio (%) | 73.0 | 56.1 | 42.1 | 45.2 | 36.3 | 36.0 | 35.4 | 35.6 | ||||||||||||||||||||||||
NPL ratio (%) | 2.0 | 0.8 | 2.8 | 2.6 | 6.0 | 5.3 | 4.0 | 3.8 | ||||||||||||||||||||||||
NPL coverage ratio (%) | 111 | 198 | 93 | 60 | 100 | 88 | 93 | 100 | ||||||||||||||||||||||||
Cost of risk (%) | 1.60 | 0.61 | 0.81 | 0.76 | 2.16 | 2.59 | 0.98 | 1.14 | ||||||||||||||||||||||||
| (1) | Figures at constant exchange rates. |
| (2) | Excluding repos. |
| (3) | Excluding repos and including specific marketable debt securities. |
| (4) | Includes mutual funds, pension funds and other off-balance sheet funds. |
Macro and industry trends
Theactivity of the South American economies has exhibited, in general, a positive performance in the third quarter of 2018, mainly in the Andean countries, supported by a relatively expansive monetary policy. In contrast, economic activity in Argentina contracted once again, although significantly less than in the second quarter, in an environment in which stabilization signs are beginning to appear after the financial tensions that were previously present, and in which restrictive economic policies continue to be maintained. In the rest of the countries in the region, consumption continues to recover, supported by relatively low levels of inflation, and also investment, driven by the increase in domestic demand and the recovery of confidence.
Inflationin the region remains generally under control, at levels close to the objectives of the respective central banks. In this sense, an end to the lax monetary policy phase could be coming, and gradual increases in interest rates by the monetary authorities could begin in the coming months. As with the case of economic activity, the situation in Argentina contrasts with that of the other countries in the region. Despite recent signs of moderation, inflation remains high, in a context in which the restrictive tone of monetary policy is implemented through the nominal stability of monetary aggregates.
Regarding thebanking systems within BBVA’s regional footprint, the macroeconomic backdrop and low levels of banking penetration in these countries in aggregate terms (obviously with differences between countries) led to strong results in the main indicators of profitability and solvency, while non-performing loans remained under control. In addition, there has been sustained growth in lending and deposits.
Table of Contents
48
Activity
On 6-July-2018, after obtaining all required authorizations, BBVA completed thesale to The Bank of Nova Scotia of its direct and indirect stake in Banco Bilbao Vizcaya Argentaria, Chile (BBVA Chile) as well as in other companies of its group in Chile whose operations are complementary to the banking business (particularly, BBVA Seguros Vida, S.A.). The impacts of this transaction were reflected in the financial statements of the BBVA Group for the third quarter of 2018. In addition, as it was announced to the market through relevant event on December 19, 2018 BBVA has decided to initiate a strategic review of alternatives for its automobile financing business in Chile mainly carried out by the company Forum Servicios Financieros, S.A. (“Forum”). Despite Forum being a highly attractive business, BBVA’s sale of its banking business in Chile, advises the initiation of this review process.
Unless expressly stated otherwise, all the comments below on rates of change, for both activity and earnings, will be provided at constant exchange rates, and will be impacted by the divestment in BBVA Chile. These rates, together with changes at current exchange rates, can be found in the attached tables of financial statements and relevant business indicators.
The most relevant aspects related to the area’s activity in 2018 were:
| • | Lending (performing loans under management) in South America was 21.2% below the same period the previous year. Excluding BBVA Chile from the comparison, loans to customers grew by 8.6% since 31-12-2017. By country, the most significant increase was in Argentina (up 41.6% year-on-year) together with the improvement in lending in Colombia and Peru. By portfolios, excluding BBVA Chile from the comparison, performance was especially positive in the mortgage, consumer and business banking segments. |
| • | Regardingasset quality of the portfolio, the NPL ratio, as of 31-December-2018 stood at 4.3%, in line with the previous quarter, while the NPL coverage ratio decreased to 97% (101% as of 30-September-2018). |
| • | Customerfunds decreased by 13.2%, although on a comparable basis, i.e. excluding BBVA Chile from the comparison, they grew by 10.7%. Off-balance-sheet funds, on a comparable basis, increased by 10.1% year-on-year. By country there was a positive trend in Argentina, Colombia and to a lesser extent in Peru, with a total customer funds increase of +61.8, +8.3 and +4.7%, respectively. |
Results
South America generated a net attributable profit of €591m, which represents year-on-year variation of -16.5% (-31.3% at current exchange rates). This evolution is affected by the negative impact of accounting for hyperinflation in Argentina in the net attributable profit of the area (€-266m) as well as by the change in the perimeter originated from the sale of BBVA Chile. Excluding these two impacts, the most recurrent income (net interest income and commissions) and NTI increased by 11.7% in year-on-year terms, which offsets the increase of the impairment losses on financial assets (up 5.2% compared to the close of 2017). As a result, the cumulative cost of risk at the close of December stood at 1.44%.
By country, the trends in 2018 were as follows:
| • | InArgentina, there was year-on-year growth in gross income of 29.2%. This increase was based both on the performance of recurring revenue (boosted by higher volumes of business) and the positive performance of NTI (mainly due to exchange rates). The aforementioned in combination with the increase in impairment losses on financial assets and the negative effect of hyperinflation adjustment posted a net attributable profit of -€29m. |
| • | InColombia, the increase in earnings was based on the good performance of net interest income (due to a positive performance in activity and customer spreads) and higher net fees and commissions, which boosted gross income (up 5.3%). The aforementioned, together with the reduction of impairment losses on financial assets, this led to a year-on-year increase of 16.6% in the net attributable profit. |
| • | InPeru, net attributable profit increased by 14.3% year-on-year, leveraged by the good performance of net interest income (increase in lending), higher net fees and commissions and a good performance of the impairment losses on financial assets. |
Table of Contents
49
| ||||||||||
| Highlights | ||||||||||
• |
Positive trend in lending activity. | |||||||||
• |
Performance of deposits strongly influenced by the environment of negative interest rates. | |||||||||
• |
Despite de control costs, earnings affected by decrease in revenues. | |||||||||
• |
Improvement of the NPL and NPL coverage ratios. | |||||||||
Financial statements and relevant business indicators
(Millions of euros and percentage)
| IFRS 9 | IAS 39 | |||||||||||
Income statement | 2018 | D % | 2017 | |||||||||
Net interest income | 175 | (2.5 | ) | 180 | ||||||||
Net fees and commissions | 138 | (15.9 | ) | 164 | ||||||||
Net trading income | 101 | (17.3 | ) | 123 | ||||||||
Other operating income and expenses | (0 | ) | n.s. | 1 | ||||||||
Gross income | 415 | (11.4 | ) | 468 | ||||||||
Operating expenses | (291 | ) | (5.6 | ) | (308 | ) | ||||||
Personnel expenses | (136 | ) | (12.8 | ) | (156 | ) | ||||||
Other administrative expenses | (149 | ) | 5.4 | (141 | ) | |||||||
Depreciation | (6 | ) | (44.2 | ) | (11 | ) | ||||||
Operating income | 124 | (22.5 | ) | 160 | ||||||||
Impairment on financial assets not measured at fair value through profit or loss | 24 | 4.0 | 23 | |||||||||
Provisions or reversal of provisions and other results | (3 | ) | (40.4 | ) | (6 | ) | ||||||
Profit/(loss) before tax | 144 | (18.5 | ) | 177 | ||||||||
Income tax | (51 | ) | (2.6 | ) | (52 | ) | ||||||
Profit/(loss) for the year | 93 | (25.2 | ) | 125 | ||||||||
Non-controlling interests | — | — | — | |||||||||
Net attributable profit | 93 | (25.2 | ) | 125 | ||||||||
| IFRS 9 | IAS 39 | |||||||||||
Balance sheets | 31-12-18 | D % | 31-12-17 | |||||||||
Cash, cash balances at central banks and other demand deposits | 273 | (68.9 | ) | 877 | ||||||||
Financial assets designated at fair value | 504 | (49.1 | ) | 991 | ||||||||
of which loans and advances | — | — | — | |||||||||
Financial assets at amortized cost | 16,930 | 12.8 | 15,009 | |||||||||
of which loans and advances to customers | 15,731 | 5.8 | 14,864 | |||||||||
Inter-area positions | — | — | — | |||||||||
Tangible assets | 39 | 10.4 | 36 | |||||||||
Other assets | 254 | (27.8 | ) | 352 | ||||||||
Total assets/liabilities and equity | 18,000 | 4.3 | 17,265 | |||||||||
Financial liabilities held for trading and designated at fair value through profit or loss | 42 | (6.3 | ) | 45 | ||||||||
Deposits from central banks and credit institutions | 1,316 | (44.3 | ) | 2,364 | ||||||||
Deposits from customers | 4,876 | (27.2 | ) | 6,700 | ||||||||
Debt certificates | 213 | (39.9 | ) | 354 | ||||||||
Inter-area positions | 9,977 | 76.8 | 5,643 | |||||||||
Other liabilities | 819 | (34.2 | ) | 1,246 | ||||||||
Economic capital allocated | 757 | (17.1 | ) | 913 | ||||||||
Table of Contents
50
Relevant business indicators | 31-12-18 | D % | 31-12-17 | |||||||||
Performing loans and advances to customers under management(1) | 16,553 | 7.7 | 15,362 | |||||||||
Non-performing loans | 430 | (22.7 | ) | 556 | ||||||||
Customer deposits under management(1) | 4,876 | (27.2 | ) | 6,700 | ||||||||
Off-balance sheet funds(2) | 388 | 3.2 | 376 | |||||||||
Risk-weighted assets | 15,449 | (0.3 | ) | 15,150 | ||||||||
Efficiency ratio (%) | 70.2 | 65.9 | ||||||||||
NPL ratio (%) | 1.7 | 2.4 | ||||||||||
NPL coverage ratio (%) | 83 | 74 | ||||||||||
Cost of risk (%) | (0.11 | ) | (0.16 | ) | ||||||||
| (1) | Excluding repos. |
| (2) | Includes mutual funds, pension funds and other off-balance sheet funds. |
Macroeconomic environment
Growth in the Eurozone moderated in the third quarter of 2018 to 0.2% quarterly from 0.4% in the second quarter, according to the latest Eurostat information. This performance is mainly explained by a worse exports evolution, while the contribution of domestic demand remained stable despite the lower growth of private consumption. Domestic fundamentals remain solid, with an improvement in the labor market which, together with the moderation in prices, continues to support the growth of private spending, while favorable financial conditions and the absorption of the economy’s idle capacity will continue to sustain the recovery of investment. For its part, the depreciation of the euro from the second quarter of 2018 will continue to support the competitiveness of exports. As a result, GDP growth could have been somewhat below 2% in 2018, after a total of 2.5% in 2017.
Headlineinflation moderated to 1.6% in December after the strong rebound since mid-year due to the significant deceleration in the prices of energy products, while core inflation remained relatively stable at low levels (1.1%). In this context, the ECB announced the completion of asset purchases in December of 2018, although it will continue to reinvest in those that reach their maturity term and will maintain interest rates at low levels until, at least, the summer of 2019. The recent increase in downside risks to growth will keep the ECB cautious.
Activity and results
This business area basically includes the Group’s retail and wholesale business in Europe (excluding Spain) and Asia.
The key aspects of the activity and results as of 31-December-2018 in this area were:
| • | Lending (performing loans under management) showed a year-on-year change of 7.7%. |
| • | Credit risk indicators improved in the last twelve months: the NPL ratio closed at 1.7% (2.4% as of the close of 2017) and the NPL coverage ratio closed at 83% (74% as of 31-December-2017). |
| • | Customerdeposits under management were still strongly influenced by the negative interest rate environment in the region and showed a decline of 27.2%. |
| • | Regardingresults, gross income declined (-11.4% year-on-year): Europe (excluding Spain) fell by 13.6% and Asia grew by 11.0%. On the other hand, operating expenses continued to fall (down 5.6%), due to tight control of personnel costs. Impairments on financial assets recorded a release of provisions that were 4.0% higher than the previous year, as a result of lower loan-loss provisions in Europe. As a result, the cumulative net attributable profit of 2018 stood at €93 million (down 25.2% year-on-year). |
Table of Contents
51
The Corporate Center basically includes the costs of the head offices that have a corporate function; management of structural exchange-rate positions; certain issuances of equity instruments to ensure adequate management of the Group’s global solvency; portfolios and their corresponding earnings, whose management is not linked to customer relationships, such as industrial holdings; certain tax assets and liabilities; funds due to commitments with employees; goodwill and other intangibles. As of the end of 2018, the area includes the 20% participation that BBVA maintains in Divarian.
Financial statements
(Millions of euros and percentage)
| IFRS 9 | IAS 39 | |||||||||||
Income statement | 2018 | D % | 2017 | |||||||||
Net interest income | (276 | ) | (22.8 | ) | (357 | ) | ||||||
Net fees and commissions | (59 | ) | (32.1 | ) | (86 | ) | ||||||
Net trading income | (155 | ) | n.s. | 436 | ||||||||
Other operating income and expenses | 57 | (29.2 | ) | 80 | ||||||||
Gross income | (432 | ) | n.s. | 73 | ||||||||
Operating expenses | (920 | ) | 3.6 | (888 | ) | |||||||
Personnel expenses | (507 | ) | 2.4 | (496 | ) | |||||||
Other administrative expenses | (199 | ) | 106.3 | (96 | ) | |||||||
Depreciation | (214 | ) | (27.8 | ) | (297 | ) | ||||||
Operating income | (1,352 | ) | 65.9 | (815 | ) | |||||||
Impairment on financial assets not measured at fair value through profit or loss | (2 | ) | (99.8 | ) | (1,125 | ) | ||||||
Provisions or reversal of provisions and other results | (65 | ) | (10.8 | ) | (73 | ) | ||||||
Profit/(loss) before tax | (1,420 | ) | (29.5 | ) | (2,013 | ) | ||||||
Income tax | 290 | 75.0 | 166 | |||||||||
Profit/(loss) after tax from ongoing operations | (1,130 | ) | (38.8 | ) | (1,847 | ) | ||||||
Results from corporate operations (1) | 633 | — | — | |||||||||
Profit/(loss) for the year | (497 | ) | (73.1 | ) | (1,847 | ) | ||||||
Non-controlling interests | 3 | n.s. | (1 | ) | ||||||||
Net attributable profit | (494 | ) | (73.3 | ) | (1,848 | ) | ||||||
Net attributable profit excluding results from corporate operations | (1,127 | ) | (39.0 | ) | (1,848 | ) | ||||||
| (1) | Includes net capital gains from the sale of BBVA Chile. |
| IFRS 9 | IAS 39 | |||||||||||
Balance sheets | 31-12-18 | D % | 31-12-17 | |||||||||
Cash, cash balances at central banks and other demand deposits | 119 | n.s. | 5 | |||||||||
Financial assets designated at fair value | 3,304 | 31.5 | 2,514 | |||||||||
of which loans and advances | — | — | — | |||||||||
Financial assets at amortized cost | — | — | — | |||||||||
of which loans and advances to customers | — | — | — | |||||||||
Inter-area positions | (7,314 | ) | n.s. | (1,501 | ) | |||||||
Tangible assets | 1,567 | (17.2 | ) | 1,893 | ||||||||
Other assets | 24,406 | 38.8 | 17,585 | |||||||||
|
|
|
|
|
| |||||||
Total assets/liabilities and equity | 22,084 | 7.7 | 20,497 | |||||||||
|
|
|
|
|
| |||||||
Financial liabilities held for trading and designated at fair value through profit or loss | — | — | — | |||||||||
Deposits from central banks and credit institutions | — | — | — | |||||||||
Deposits from customers | — | — | — | |||||||||
Debt certificates | 8,874 | 1.2 | 8,772 | |||||||||
Inter-area positions | (15,195 | ) | (7.3 | ) | (16,384 | ) | ||||||
Other liabilities | 153 | (65.5 | ) | 443 | ||||||||
Economic capital allocated | (21,674 | ) | (13.1 | ) | (24,941 | ) | ||||||
Shareholders’ funds | 49,927 | (5.1 | ) | 52,606 | ||||||||
Table of Contents
52
The Corporate Center registered a net attributableloss of €494m during 2018, which positively compares with a loss of €1,848m in 2017. By entries, the most relevant are the following:
| • | Negative contribution fromNTI, compared to the capital gains recorded, in the amount of €436m before taxes as of the end of 2017, from the market sales of the stakes in CNCB (€204m in the first quarter, for the sale of 1.7%, and €24m in the third quarter for the sale of the remaining 0.34%). |
| • | Lowerimpairment on financial assets, as in 2017 this line registered the recognition of impairment losses of €1,123m from BBVA’s stake in Telefónica, S.A. |
| • | Theresults from corporate operations includes the capital gains (net of taxes) originated by the sale ofBBVA Chile, which amounts to €633m. Excluding this effect, the attributable profit without corporate operations, amounted to -€1,127m, representing a loss 39.0% lower than the amount registered twelve months earlier. |
Table of Contents
53
Other information: Corporate & Investment Banking
| Highlights | ||||||||||
| • | Continued environment of pressure on margins and excess liquidity. | |||||||||
| • | Better year-on-year performance of lending. | |||||||||
| • | Good performance of net interest income. | |||||||||
| • | Net attributable profit impacted by higher provisions. | |||||||||
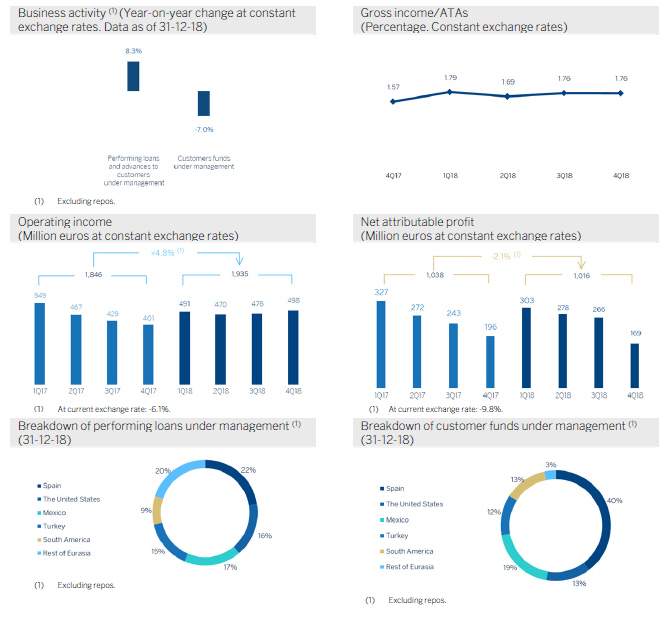
Table of Contents
54
Financial statements and relevant business indicators
(Millions of euros and percentage)
| IFRS 9 | IAS 39 | |||||||||||||||
Income statement | 2018 | D % | D % (1) | 2017 | ||||||||||||
Net interest income | 1,441 | 5.0 | 16.2 | 1,372 | ||||||||||||
Net fees and commissions | 692 | (10.5 | ) | (2.3 | ) | 774 | ||||||||||
Net trading income | 849 | (2.5 | ) | 6.4 | 871 | |||||||||||
Other operating income and expenses | (40 | ) | n.s. | n.s. | 112 | |||||||||||
Gross income | 2,941 | (6.0 | ) | 2.9 | 3,128 | |||||||||||
Operating expenses | (1,007 | ) | (5.8 | ) | (0.7 | ) | (1,068 | ) | ||||||||
Personnel expenses | (450 | ) | (11.3 | ) | (7.9 | ) | (508 | ) | ||||||||
Other administrative expenses | (448 | ) | (1.2 | ) | 6.9 | (453 | ) | |||||||||
Depreciation | (109 | ) | 1.1 | 2.6 | (108 | ) | ||||||||||
Operating income | 1,935 | (6.1 | ) | 4.8 | 2,060 | |||||||||||
Impairment on financial assets not measured at fair value through profit or loss | (340 | ) | 131.6 | 175.0 | (147 | ) | ||||||||||
Provisions or reversal of provisions and other results | (36 | ) | (14.7 | ) | (12.2 | ) | (42 | ) | ||||||||
Profit/(loss) before tax | 1,558 | (16.7 | ) | (7.3 | ) | 1,871 | ||||||||||
Income tax | (362 | ) | (25.9 | ) | (17.7 | ) | (489 | ) | ||||||||
Profit/(loss) for the year | 1,196 | (13.5 | ) | (3.6 | ) | 1,382 | ||||||||||
Non-controlling interests | (180 | ) | (29.4 | ) | (11.0 | ) | (255 | ) | ||||||||
Net attributable profit | 1,016 | (9.8 | ) | (2.1 | ) | 1,127 | ||||||||||
| (1) | Figures at constant exchange rates. |
| IFRS 9 | IAS 39 | |||||||||||||||
Balance sheets | 31-12-18 | D % | D %(1) | 31-12-17 | ||||||||||||
Cash, cash balances at central banks and other demand deposits | 5,084 | 21.0 | 15.1 | 4,200 | ||||||||||||
Financial assets designated at fair value | 92,394 | 26.8 | 26.4 | 72,878 | ||||||||||||
of which loans and advances | 28,870 | n.s. | n.s. | 648 | ||||||||||||
Financial assets at amortized cost | 65,120 | (30.7 | ) | (28.9 | ) | 93,948 | ||||||||||
of which loans and advances to customers | 58,718 | (13.0 | ) | (10.4 | ) | 67,529 | ||||||||||
Inter-area positions | — | — | — | — | ||||||||||||
Tangible assets | 29 | (17.3 | ) | (14.0 | ) | 35 | ||||||||||
Other assets | 2,119 | (9.5 | ) | (7.3 | ) | 2,342 | ||||||||||
|
|
|
|
|
|
|
| |||||||||
Total assets/liabilities and equity | 164,747 | (5.0 | ) | (3.9 | ) | 173,403 | ||||||||||
|
|
|
|
|
|
|
| |||||||||
Financial liabilities held for trading and designated at fair value through profit or loss | 81,312 | 65.7 | 65.9 | 49,060 | ||||||||||||
Deposits from central banks and credit institutions | 14,805 | (67.4 | ) | (67.7 | ) | 45,427 | ||||||||||
Deposits from customers | 40,026 | (18.0 | ) | (15.9 | ) | 48,792 | ||||||||||
Debt certificates | 1,117 | 113.7 | 112.9 | 523 | ||||||||||||
Inter-area positions | 20,155 | (7.1 | ) | (2.3 | ) | 21,687 | ||||||||||
Other liabilities | 3,915 | 0.2 | (0.5 | ) | 3,908 | |||||||||||
Economic capital allocated | 3,416 | (14.7 | ) | (12.8 | ) | 4,007 | ||||||||||
| (1) | Figures at constant exchange rates. |
| IFRS 9 | IAS 39 | |||||||||||||||
Relevant business indicators | 31-12-18 | D % | D %(1) | 31-12-17 | ||||||||||||
Performing loans and advances to customers under management(2) | 58,783 | 4.4 | 8.3 | 56,315 | ||||||||||||
Customer deposits under management(2) | 40,007 | (9.3 | ) | (6.7 | ) | 44,095 | ||||||||||
Off-balance sheet funds(3) | 993 | (26.9 | ) | (15.4 | ) | 1,357 | ||||||||||
Efficiency ratio (%) | 34.2 | 34.1 | ||||||||||||||
| (1) | Figures at constant exchange rates. |
| (2) | Excluding repos. |
| (3) | Includes mutual funds, pension funds and other off-balance sheet funds. |
Table of Contents
55
Financial market trends
In the fourth quarter of the year, there was a correction of high riskfinancial assets. This time, developed countries, in particular the United States, suffered the majority of the adjustment. At first, the downward movement was initiated by a revaluation of the assets at higher interest rates. However, the fear of deceleration of developed economies ended up accentuating the trend. Doubts concerning the disengagement process between the United Kingdom and the European Union, and trade tensions between China and the United States, along with the clash between the European Commission and the Italian government, also contributed to the increasing caution in financial markets. In this environment, the implied volatility in equity and interest rates returned to high levels, close to those reached in the first quarter of 2018. Investors sought refuge in sovereign bonds, which led to a significant decline in debt yields, both in the United States, where they remained at January 2018 levels, as well as in Germany, where they retreated to October 2016 levels.
The central banks continued with their processes of normalization ofmonetary policies. The Fed raised its benchmark interest rate for the fourth time in the year, to 2.25-2.50%, in December, and maintained the strategy of balance sheet reduction. The ECB, in turn, kept interest rates unchanged, but confirmed the end of the financial assets purchase program in December 2018; however, it will continue to be present in the market through the program for the reinvestment of the principal maturities of its asset portfolio. The economic slowdown and uncertainty caused by Brexit weighed on the euro, which ended the quarter slightly depreciated. The Turkish lira reversed part of the depreciation suffered in the third quarter of 2018. Conversely, the volatility of the Mexican peso remained.
Activity
All the comments below regardingrates of change, for both activity and earnings, will be given at constant exchange rate, unless expressly stated otherwise. These rates, together with changes at the current exchange rate, can be seen in the attached tables of financial statements and relevant business indicators.
The most relevant aspects related to the area’s activity in 2018 were:
| • | The market conditions remain unchanged, with margins squeezed and excess liquidity.Lending (performing loans under management) grew by 8.3% during the year. |
| • | Positive trend in customerfunds which stood in line with the previous quarter (+0.1%), although the year-on-year comparison is negative (-7.0%). |
| • | In themergers & acquisitions (M&A) business, activity in the Spanish market in 2018 has been positive showing a growth in the number of operations, driven by the rebound of foreign investors. The High liquidity levels, the attractive financing conditions and the economic growth situation in Spain are expected to continue to stimulate the market during 2019. |
| • | In theEquity Capital Markets Unit (ECM), the last quarter of the year has been marked by high levels of volatility that have made it more difficult to complete the operations expected in the primary market. The market for IPOs has suffered especially throughout Europe during 2018, the Spanish market is not an exception to this trend, since significant operations have been canceled or postponed in the last part of the year. Despite the deterioration in the market environment, BBVA has been one of the most active banks measured by the number of primary transactions in the primary Spanish equity market, excluding ABBs and convertibles. |
| • | In 2018, BBVA has consolidated its leadership in thegreen and sustainable loans, while at the same time it has continued betting on innovation, setting new milestones, particularly with the application of blockchain technology to corporate loans, also using its own platform. |
| • | In the market of theGreen Loans, BBVA has been the most active bank globally leading 25 transactions (of the 32 investees) not only in Spain, but also in Mexico, Italy, the United States, Turkey and Peru, highlighting the globalization of this market in strong growth. |
| • | In terms ofinnovative solutions for its customers, BBVA has been the first entity to apply blockchain technology to the field of corporate financing with 4 formalized operations. |
Results
CIB registered a net attributable profit of €1,016m in 2018, a 2.1% less than in 2017. The highlights of the year-on-year changes in the income statement in this aggregate are summarized below:
| • | Positive performance ofnet interest income (+16.2% year-on-year), specially in the second half of the year, driven by good performance in the United States, South America and Turkey. |
| • | Net fees and commissions showed a decrease, due to lower activity volume in Corporate Finance. |
| • | Rise inNTI (up 6.4%), that, nevertheless does not offset the lower contribution from other operating income and expenses. |
| • | As a result of the above, thegross income registered an increase of 2.9%, year-on-year. |
| • | Operating expenses closed in line with 2017 (-0.7%), thanks to an adequate management of discretionary costs, which offsets those affected by inflation on emerging economies and by investment in technology. |
| • | Finally,impairment losses on financial assets increased (+175,0%), mainly as a result of higher provision needs, especially in Turkey. |
Table of Contents
SIGNATURE
Pursuant to the requirements of the Securities Exchange Act of 1934, the registrant has duly caused this report to be signed on its behalf by the undersigned, thereunto duly authorized.
| Banco Bilbao Vizcaya Argentaria, S.A. | ||||||
| Date: February 1, 2019 | By: | /s/ María Angeles Peláez Morón | ||||
| Name: | María Angeles Peláez Morón | |||||
| Title: | Authorized representative | |||||