Table of Contents
UNITED STATES SECURITIES AND EXCHANGE
COMMISSION
WASHINGTON, D.C. 20549
FORM6-K
REPORT OF FOREIGN ISSUER PURSUANT TO RULE 13a-16 OR 15d-16
UNDER THE SECURITIES EXCHANGE ACT OF 1934
For the month of March, 2019
Commission file number:1-10110
BANCO BILBAO VIZCAYA ARGENTARIA, S.A.
(Exact name of Registrant as specified in its charter)
BANK BILBAO VIZCAYA ARGENTARIA, S.A.
(Translation of Registrant’s name into English)
Calle Azul 4,
28050 Madrid
Spain
(Address of principal executive offices)
Indicate by check mark whether the registrant files or will file annual reports under cover of Form20-F or Form40-F:
Form20-F X Form40-F
Indicate by check mark if the registrant is submitting the Form6-K in paper as permitted by RegulationS-T Rule 101(b)(1):
Yes No X
Indicate by check mark if the registrant is submitting the Form6-K in paper as permitted by RegulationS-T Rule 101(b)(7):
Yes No X
Table of Contents
Table of Contents
| The English language version of this report is a free translation from the original, which was prepared in Spanish. All possible care has been taken, to ensure that the translation is an accurate presentation of the original. However, in all matters of interpretation, views or opinion expressed in the original language version of the document in Spanish take precedence over the translation. |
| 1 | ||||
| 3 | ||||
Correspondence between the sections of Pillar III and the Group’s Consolidated Annual Report | 7 | |||
| 10 | ||||
| 14 | ||||
| 16 | ||||
| 19 | ||||
| 19 | ||||
| 21 | ||||
| 26 | ||||
| 30 | ||||
| 30 | ||||
| 37 | ||||
1.3. Exemptions from capital requirements at the individual orsub-consolidated level | 37 | |||
| 38 | ||||
| 38 | ||||
| 41 | ||||
| 44 | ||||
| 45 | ||||
| 47 | ||||
2.6. Procedure employed in the internal capital adequacy assessment process | 50 | |||
| 51 | ||||
| 52 | ||||
| 63 | ||||
| 138 | ||||
| 155 | ||||
| 159 | ||||
| 160 | ||||
Table of Contents

| 163 | ||||
| 176 | ||||
| 185 | ||||
| 185 | ||||
| 187 | ||||
| 187 | ||||
| 188 | ||||
| 188 | ||||
5.2. Description of the different types of employees included in the Identified Staff | 192 | |||
| 193 | ||||
| 199 | ||||
| 200 | ||||
| 201 | ||||
5.7. Ratios between the fixed and variable remuneration of Identified Staff | 201 | |||
5.8. Quantitative information on remuneration of the Identified Staff | 202 | |||
| 206 | ||||
| 207 | ||||
| 208 | ||||
| 2 |
Table of Contents
ACRONYM
| DESCRIPTION
| |
ALM (Asset - Liability Management) | Mechanism for managing structural balance-sheet risk for possible mismatch between assets and liabilities and for various factors (interest rate, exchange rate, liquidity, etc.) | |
AMA | Advanced method approach used by the entity for calculating the consolidated capital requirements by operational risk | |
AT1 (Additional Tier 1) | Additional Tier 1 capital consists of hybrid instruments, basically CoCos and preferred securities | |
Basel III | Set of proposals for reforming banking regulation, published starting December 16, 2010 and to be implemented in a phased approach | |
BCBS (Basel Committee on Banking Supervision) | An international forum for cooperation in banking supervision, whose mission is to enhance the quality of banking supervision at global level | |
BIS (Bank for International Settlements) | An independent international organization that promotes international financial and monetary cooperation and acts as a bank for central banks | |
CCF (Credit Conversion Factor) | The ratio between the actual amount available for a commitment that could be used and therefore, would be outstanding at the time of default, and the actual amount available for the commitment | |
CCP (Central Counterparty Clearing House) | Entity which stands between the counterparty entities, acting as a buyer against the sellers and as a seller against the buyers | |
CDS (Credit Default Swap) | A financial derivative between a Beneficiary and Guarantor by which the Beneficiary pays the Guarantor a premium in exchange for receiving protection in the case of credit events for a determined period of time | |
CET 1 (Common Equity Tier 1) | The entity’s highest-quality capital | |
Counterparty Credit Risk | This is a risk that arises from the possibility of losses derived from positions in derivatives and repos | |
Credit Risk | This is a risk arising from the possibility that one party to a financial instrument contract will fail to meet its contractual obligations for reasons of insolvency or inability to pay, and cause a financial loss for the other party | |
CRM (Credit Risk Mitigation) | A technique used to reduce the credit risk associated with one or more of the entity’s current exposures | |
CRR / CRD IV | Solvency Regulation on prudential requirements of credit institutions and investment firms (Regulation EU 575/2013) | |
CVA (Credit Valuation Adjustment) | Value Adjustments for counterparty credit risk | |
DLGD (Downturn Loss Given Default) | Loss given default at a period of stress in the economic cycle | |
D-SIB (Domestic Systemically Important Bank) | Other systemically important institutions (O-SIIs) | |
EAD (Exposure at default) | Maximum loss at the counterparty’s time of default | |
EBA (European Banking Authority) | Independent institution responsible for promoting the stability of the financial system, the transparency of markets and financial products, and protecting depositors and investors | |
EC (Economic Capital) | The amount of capital considered necessary to cover unexpected losses if actual losses are greater than expected losses | |
ECAI (External Credit Assessment Institutions) | The external credit assessment institution designated by the entity | |
EL (Expected Loss) | Ratio between the amount that is expected the amount that is expected to be lost in an exposure, due to potential default by a counterparty or dilution over aone-year period, and the amount outstanding at the time of default | |
| 3 |
Table of Contents
ACRONYM
| DESCRIPTION
| |
FSB (Financial Stability Board) | An international body that aims to increase the efficiency and stability of the international financial sector, supervising it and making recommendations | |
FTD (First to default) | Derivative in which the two parties negotiate protection against the first default of any of the entities in the basket | |
GRM | Global Risk Management | |
GRMC | Global Risk Management Committee | |
G-SIBs (Global Systemically Important Banks) | Financial institutions that due to their large size, importance in the market and connection to each other, could trigger a serious crisis in the international financial system if they face economic problems | |
IAA (Internal Assessment Approach) | Method of internal assessment used for the calculation of securitisation exposures in the investment portfolio | |
ICAAP (Internal Capital Adequacy Assessment Process) | Internal Capital Adequacy Assessment Process | |
ILAAP (Internal Liquidity Adequacy Assessment Process) | Internal Liquidity Adequacy Assessment Process | |
IMA (Internal Model Approach) | Approach that uses internal models to calculate the exposure originated by market risk | |
IMM (Internal Model Method) | Internal model method used to calculate exposure originated by counterparty risk | |
IRB (Internal Rating-Based approach) | Internal model method used to calculate exposure originated by credit risk. This method may be broken down into two types: FIRB (Foundation IRB) and AIRB (Advanced IRB) | |
IRC (Incremental Risk Capital) | Change applied to the exposure by market risk calculated using the internal method that quantifies the risk not captured by the VaR model, specifically in migration and default events | |
LCR | Liquidity coverage ratio | |
LDA (Loss Distribution Approach) | Aggregate Loss Distribution Model: this methodology estimates the distribution of losses by operational event by convoluting the frequency distribution and the loss given default distribution of these events | |
LDP | Low Default Portfolios | |
LGD (Loss Given Default) | Loss in the event of default | |
LGD BE (Loss Given Default Best Estimate) | Loss in the “current” default portfolio | |
Liquidity Risk | The risk of an entity finding it difficult to meet its payment commitments fully and in due time; or when to meet them it has to resort to finance under burdensome terms which may harm the bank’s image or reputation | |
LMUs (Liquidity Management Units) | These are financial self-sufficient entities in BBVA Group created with the aim of preventing and limiting liquidity risk, and avoiding possible contagion from a crisis affecting only one or more of these entities | |
LR (Leverage Ratio) | This measurement estimates the relative amount of assets,off-balance-sheet obligations and contingent obligations to be paid, delivered or guaranteed, including an entity’s obligations derived from finance received, commitments acquired, derivatives contracts or repurchase agreements, but excluding the obligations that may only be executed during the entity’s liquidation, which are financed with TIER 1 capital | |
LRLGD | Long-Run Loss Given Default | |
LtSCD (Loan to Stable Customer Deposits) | A ratio that measures the relation between net lending and stable customer deposits | |
Market Risk | This is a risk due the possibility that there may be losses in the value of positions held due to movements in the market variables that affect the | |
| 4 |
Table of Contents
ACRONYM
| DESCRIPTION
| |
valuation of financial products and assets in trading activity | ||
MREL (Minimum Required Eligible Liabilities) | Minimum requirement for own funds and eligible liabilities | |
OE (Original Exposure) | The gross amount the entity may lose if the counterparty does not comply with its contractual payment obligations, not taking into account the effect of guarantees or improvements in credit or mitigate credit risk mitigation operations | |
Operational Risk | The risk of losses caused by human errors, inadequate or faulty internal processes, system failures or external events, including external fraud, natural disasters, and faulty service provided by third parties. BBVA includes legal risk in this definition, but excludes strategic and/or business risk and reputational risk | |
ORX (Operational Risk Exchange) | Database of external operational losses | |
PD (Probability of Default) | Probability that a counterparty will default during aone-year period | |
PD-TTC (PD Through the Cycle) | Probability of default over the course of the economic cycle | |
PIT(Point-In-Time) | Approach for calculating provisions by which the PD and LGD parameters must be adapted at each moment in time | |
QCCP (Qualifying central counterparty) | A central counterparty that has either been authorized under Article 14 of Regulation (EU) No. 648/2012, or recognized under Article 25 of this regulation | |
RW (Risk Weight) | Level of risk applied to exposures (%) | |
RWAs (Risk-Weighted Assets) | The entity’s exposure to risk weighted by a percentage obtained by the applicable rule (the Standardized Approach) or internal models | |
SFTs | Securities financing transactions | |
SREP (Supervisory Review and Evaluation Process) | Supervisory Review and Evaluation Process | |
Structural Risk | This risk is subdivided into structural interest-rate risk (movements in interest rates that cause alterations in an entity’s net interest income and book value); and structural exchange-rate risk (exposure to variations in exchange rates originating in BBVA Group’s foreign companies and in the provision of funds to foreign branches financed in a different currency to that of the investment) | |
Synthetic securitisation | Type of operation where the loan portfolio is not typically transferred to a fund; on the contrary, the credit remains in the balance sheet of the corresponding entity, but this transfers the default risk to a third party. The objective of this type of instrument is the transmission of balance risk and capital release. Usually, the assignment of risk is usually made through a derivative (CDS) or through a financial guarantee | |
TIER I (First-level capital) | Capital made up of instruments that can absorb losses when the entity is in operation. It is composed of CET1 and AT1 | |
TIER II (Second-level capital) | Additional capital formed by instruments, basically subordinated debt, revaluation reserves and hybrid instruments, which will absorb losses when the entity is not a going concern | |
TLAC (Total Loss Absorbing Capacity) | A regulatory framework approved by the FSB with the aim of guaranteeing that G-SIBs hold a minimum level of instruments and liabilities to ensure that the essential functions of the entity may be maintained in the resolution procedures and immediately afterward, without endangering taxpayers’ funds or financial stability | |
Traditional securitisation | Operation whereby an entity is capable of transforming a series of heterogeneous and illiquid financial assets into homogeneous liquid instruments (usually debentures or bonds) that can be traded on the market, thereby transferring the risk of the assets in most cases while capturing liquidity | |
| 5 |
Table of Contents
ACRONYM
| DESCRIPTION
| |
VaR (Value at Risk) | The measurement model that forecast the maximum loss that can be incurred by the entity’s trading portfolios stemming from market price fluctuations in a specific time horizon and at a specific level of confidence | |
| 6 |
Table of Contents
Correspondence between the sections of Pillar III and the Group’s Consolidated Annual Report
The information included in this Report may be supplemented with the financial information contained in the Group’s Consolidated Annual Financial Statements. For this purpose, the following table presents the correspondence between the sections of the Pillar III Report and the Group’s Consolidated Annual Financial Statements.
Section
| Subsection
| Group’s Consolidated Financial Statements | Pillar III | |||
| Regulatory Environment | N/A | Introduction | ||||
| Introduction | Contents of the 2018 Prudential Relevance Report | N/A | Introduction | |||
| Composition of Capital | Note 32 | Introduction | ||||
| Corporate name and differences between the consolidated group for the purposes of the solvency regulations and accounting criteria | ||||||
| Corporate name and scope of application | Note 1.1 | 1.1.1 | ||||
| Differences in the consolidated group for the purposes of the solvency regulations and accounting criteria | N/A | 1.1.2 | ||||
General Information Requirements | Reconciliation of the Public Balance Sheet from the accounting perimeter to the regulatory perimeter | Note 32 | 1.1.3 | |||
| Main changes to the Group’s scope of consolidation in 2018 | Note 3 | 1.1.4 | ||||
| Identification of dependent institutions with capital resources below the minimum requirement. Possible impediments to capital transfer | N/A | 1.2 | ||||
| Exemptions from capital requirements at the individual orsub-consolidated level | N/A | 1.3 | ||||
Characteristics of the eligible capital resources | N/A | 2.1 | ||||
Amount of capital | Note 32 | 2.2 | ||||
| Capital Resources | IFRS9 transitional arrangements | N/A | 2.3 | |||
Bank risk profile | Note 7 | 2.4 | ||||
Breakdown of minimum capital requirements by risk type | N/A | 2.5 | ||||
Procedure employed in the internal capital adequacy assessment process | N/A | 2.6 | ||||
General risk control and management model | ||||||
| Risks | Governance and organization | Note 7.1.1 | 3.1.1 | |||
Risk Appetite Framework | Note 7.1.2 | 3.1.2 |
| 7 |
Table of Contents
Section
| Subsection
| Group’s Consolidated Financial Statements | Pillar III
| |||
Decisions and processes | Note 7.1.3 | 3.1.3 | ||||
Assessment, monitoring and reporting | Note 7.1.4 | 3.1.4 | ||||
Infrastructure | Note 7.1.5 | 3.1.5 | ||||
Risk culture | Note 7.1.6 | 3.1.6 | ||||
Credit and counterparty credit risk | ||||||
Scope and nature of the credit risk measurement and reporting systems | Note 7.3 | 3.2.1 | ||||
Definitions and accounting methodologies | Notes 2.2.1 | 3.2.2 | ||||
Information on credit risk | N/A | 3.2.3 | ||||
Information on the standardized approach | N/A | 3.2.4 | ||||
Information on the IRB approach | N/A | 3.2.5 | ||||
Information on credit counterparty credit risk | 7.4.3 | 3.2.6 | ||||
Information on securitisations | N/A | 3.2.7 | ||||
Hedging and risk reduction policies. Supervision strategies and processes | Note 7.3.3 | 3.2.8 | ||||
Information on credit risk mitigation techniques | N/A | 3.2.9 | ||||
RWA density by geographical area | N/A | 3.2.10 | ||||
Market risk | ||||||
Scope and nature of the market risk measurement and reporting systems | Note 7.4 | 3.3.1 | ||||
Differences in the trading book for the purposes of applying the solvency regulations and accounting criteria | N/A | 3.3.2 | ||||
Standardized approach | N/A | 3.3.3 | ||||
Internal models | Note 7.4.1 | 3.3.4 | ||||
Structural risk in the equity portfolio | ||||||
Scope and nature of the structural risk in the equity portfolio measurement and reporting systems | Note 7.4.2 | 3.4.1 | ||||
Differentiation between portfolios held for sale and those held for strategic purposes | N/A | 3.4.2 | ||||
Book value and exposure of equity investments and capital instruments contained in above portfolios | N/A | 3.4.3 | ||||
Risk-weighted assets of equity investments and capital instruments | N/A | 3.4.4 | ||||
Profit and loss and adjustments for valuation of equity investments and capital instruments | Notes 41 and 49 | 3.4.5 | ||||
| Structural exchange-rate risk |
| 8 |
Table of Contents
Section
| Subsection
| Group’s Consolidated Financial Statements | Pillar III
| |||
Scope and nature of the exchange-rate risk measurement and reporting systems | Note 7.4.2 | 3.5.1 | ||||
Interest-rate risk | ||||||
Evolution, monitoring and reporting | Note 7.4.2 | 3.6.1 | ||||
Nature of interest-rate risk and key hypothesis | N/A | 3.6.2 | ||||
Variations in interest risks | Note 7.4.2 | 3.6.3 | ||||
Liquidity risk | ||||||
Liquidity and funding strategy and planning | Note 7.5.1 | 3.7.1 | ||||
Governance and monitoring | Note 7.5.1 | 3.7.2 | ||||
Liquidity and funding performance in 2018 | Note 7.5.1 | 3.7.3 | ||||
Liquidity and funding prospects | N/A | 3.7.4 | ||||
LCR disclosure | Note 7.5.1 | 3.7.5 | ||||
Assets committed in finance transactions | Note 7.5.2 | 3.7.6 | ||||
Operational risk | ||||||
Operational risk definition | Note 7.6 | 3.8.1 | ||||
Operational risk management model | Note 7.6 | 3.8.2 | ||||
Operational risk governance | N/A | 3.8.3 | ||||
Methods used for calculating capital requirements | N/A | 3.8.4 | ||||
| Group’s operational risk profile | N/A | 3.8.5 | ||||
| Remuneration | Information on remuneration | Note 54 | 5 | |||
Information on the Corporate Governance system | Information on the Corporate Governance system | Annual Corporate Governance Report | 6 | |||
| Subsequent events | Subsequent events | Note 56 | 7 |
| 9 |
Table of Contents
Table 1. | Geographical breakdown of relevant credit exposures for the calculation of the countercyclical capital buffer | |
Table 2. | CC2 - Reconciliation of the regulatory capital with Public Balance Sheet | |
Table 3 | EU Ll1 - Differences between the accounting and regulatory scopes of consolidation and the mapping of the financial statements categories with regulatory risk categories | |
Table 4. | EU LI2 - Main sources of the differences between regulatory original exposure amounts and carrying values in financial statements | |
Table 5. | Credit and Counterparty Risk headings of the Public Balance Sheet for OE, EAD and RWAs | |
Table 6. | Amount of capital (CC1) | |
Table 7. | Reconciliation of the Public Balance Sheet from the accounting perimeter to the regulatory perimeter | |
Table 8. | IFRS9-FL - Summary of the own funds, main capital and leverage ratios with and without the application of IFRS9 transitional arrangement or similar Expected Credit Losses (ECL) | |
Table 9. | EU OV1 Overview of RWAs | |
Table 10. | Capital requirements by risk type and exposure class | |
Table 11. | Credit Risk exposure | |
Table 12. | EUCRB-B – Total and average net amount of exposures (including counterparty credit risk) | |
Table 13. | EUCRB-C – Geographical breakdown of exposures (including counterparty credit risk) | |
Table 14. | EUCR1-C – Credit quality of exposures by geography (including counterparty credit risk) | |
Table 15. | EUCR1-A – Credit quality of exposures by exposure class and instrument (excluding counterparty credit risk) | |
Table 16. | EUCRB-D – Concentration of exposures by industry or counterparty types (excluding counterparty credit risk) | |
Table 17. | EUCR1-B – Credit quality of exposures by industry or counterparty types (excluding counterparty credit risk) | |
Table 18. | EUCRB-E – Maturity of exposures (excluding counterparty credit risk) | |
Table 19. | EUCR1-D – Ageing ofpast-due exposures | |
Table 20. | EUCR2-A – Changes in the stock of general and specific credit risk adjustments | |
Table 21. | EUCR2-B – Changes in the stock of defaulted and impaired loans and debt securities | |
| 10 |
Table of Contents
Table 22. | EUCR1-E –Non-performing exposures and forborne exposures | |
Table 23. | EU CR4 – Standardised approach – Credit risk exposure and credit risk mitigation effects | |
Table 24. | Standardised approach: Exposure values before the application of credit risk mitigation techniques | |
Table 25. | EU CR5 – Standardised approach | |
Table 26. | RWA flow statements of credit risk exposures under the standardised approach | |
Table 27. | Models authorized by the supervisor for use in the calculation of capital requirements | |
Table 28. | Master Scale of BBVA’s rating | |
Table 29. | EU CR6 – IRB approach – Credit risk exposures by exposure class and PD range | |
Table 30. | EU CR9 – IRB approach – Backtesting of PD per exposure class | |
Table 31. | EU CR8 – RWA flow statements of credit risk exposures under the IRB approach | |
Table 32. | EU CR10 (1) – IRB: specialised lending | |
Table 33. | EU CR10 (2) – IRB: Equity | |
Table 34. | Positions subject to counterparty credit risk in terms of OE, EAD and RWAs | |
Table 35. | Amounts of counterparty risk in the trading book | |
Table 36. | EUCCR5-A – Impact of netting and collateral held on exposure values | |
Table 37. | EU CCR1 – Analysis of CCR exposure by approach | |
Table 38. | EU CCR3 – Standardised approach – CCR exposures by regulatory portfolio and risk | |
Table 39. | EU CCR4 – IRB approach – CCR exposures by portfolio and PD scale | |
Table 40. | EUCCR5-B – Composition of collateral for exposures to CCR | |
Table 41. | EU CCR6 – Credit derivatives exposures | |
Table 42. | EU CCR2 – CVA capital charge | |
Table 43. | Variations in terms of RWAs of CVA | |
Table 44. | EU CCR8 – Exposures to CCPs | |
Table 45. | SEC1: Securitisation exposures in the investment portfolio | |
Table 46. | SEC4: Exposure to securitisation in the banking portfolio and associated regulatory capital requirements (Bank that acts as an investor) | |
| 11 |
Table of Contents
Table 47. | SEC3: Exposure to securitisation in the banking portfolio and associated regulatory capital requirements (Bank that acts as originator or sponsor) | |
Table 48. | Breakdown of securitized balances by type of asset | |
Table 49. | Outstanding balance corresponding to the underlying assets of the Group’s originated Securitisations, in which risk transfer criteria are not fulfilled | |
Table 50. | Exposure covered with financial guarantees and other collateral calculated using the standardised and advanced approaches | |
Table 51. | Exposure covered by personal guarantees. Standardised and advanced approach | |
Table 52. | EU CR3 – CRM techniques – Overview | |
Table 53. | Breakdown of RWA density by geographical area and approach | |
Table 54. | EU MR1 – Market risk under the standardised approach | |
Table 55. | Prudent Valuation Adjustments | |
Table 56. | EU MR3 – IMA values for trading portfolios | |
Table 57. | Trading Book. VaR without smoothing by risk factors | |
Table 58. | EUMR2-A – Market risk under the IMA | |
Table 59. | EUMR2-B – RWA flow statements of market risk exposures under the IMA | |
Table 60. | Trading Book. Impact on earnings in Lehman scenario | |
Table 61. | Trading Book. Stress resampling | |
Table 62. | Breakdown of book value, EAD and RWAs of equity investments and capital instruments | |
Table 63. | Exposure in equity investments and capital instruments | |
Table 64. | Breakdown of RWAs, equity investments and capital instruments by applicable approach | |
Table 65. | Variation in RWAs for Equity Risk | |
Table 66. | Realized profit and loss from sales and settlements of equity investments and capital instruments | |
Table 67. | Valuation adjustments for latent revaluation of equity investments and capital instruments | |
Table 68. | Variations in interest rates. Impact on net interest income and economic value | |
Table 69. | Loan to Stable Customer Deposits (LtSCD) | |
| 12 |
Table of Contents
Table 70. | LCR main LMU | |
Table 71. | Liquidity inflows. Residual maturities by contractual periods | |
Table 72. | Liquidity outflows. Residual maturities by contractual periods | |
Table 73. | Maturity of wholesale issues of Balance Euro by nature | |
Table 74. | Maturity of wholesale issues of Bancomer by nature | |
Table 75. | Maturity of wholesale issues of Compass by nature | |
Table 76. | Maturity of wholesale issues of Garanti by nature | |
Table 77. | Maturity of wholesale issues of South America by nature | |
Table 78. | EU LIQ1: LCR disclosure template | |
Table 79. | Committed assets over total assets rate | |
Table 80. | Mortgage-covered bonds | |
Table 81. | Public-covered bonds | |
Table 82. | Internationalization-covered bonds | |
Table 83. | Encumbered and unencumbered Assets | |
Table 84. | Collateral received | |
Table 85. | Sources of encumbrance | |
Table 86. | Regulatory capital for Operational Risk | |
Table 87. | LRSum - Summary reconciliation of accounting assets and exposure corresponding to the Leverage Ratio | |
Table 88. | Composition of the Remuneration Committee | |
Table 89. | Settlement and payment system for annual variable remuneration | |
Table 90. | Total remuneration of Identified Staff in 2018 | |
Table 91. | Extraordinary remuneration of the Identified Staff in 2018 | |
Table 92. | Deferred variable remuneration from periods prior to 2018 | |
Table 93. | Remunerations of identified staff in 2018 by activity areas | |
Table 94. | Number of individuals with total remuneration in excess of€1 million in 2018 | |
| 13 |
Table of Contents
Chart 1. | Capital Requirements (fully loaded) | |
Chart 2. | Capital Ratio Evolution during 2018 | |
Chart 3. | Distribution of RWAs by risk type under Pillar I | |
Chart 4. | Breakdown of RWAs by exposure category and method | |
Chart 5. | BBVA’s Group Core Metrics | |
Chart 6. | Structure of Group’s BBVA Risk Appetite Framework | |
Chart 7. | Distribution by geographical area of Exposure to Credit Risk | |
Chart 8. | Advanced Measurement Approach: EAD by obligor category | |
Chart 9. | Advanced Measurement Approach: Weighted average PD by EAD | |
Chart 10. | Advanced Measurement Approach: Weighted average LGD by EAD | |
Chart 11. | Advanced Measurement Approach: RWAs by obligor category | |
Chart 12. | Comparative analysis of expected loss: retail mortgages | |
Chart 13. | Comparative analysis of expected loss: consumer finance | |
Chart 14. | Comparative analysis of expected loss: credit cards | |
Chart 15. | Comparative analysis of expected loss: automobiles | |
Chart 16. | Comparative analysis of expected loss: SMEs and Real Estate Developers | |
Chart 17. | Comparative analysis of expected loss: Mexico credit cards | |
Chart 18. | Comparative analysis of expected loss: Mexico corporates | |
Chart 19. | Functions performed in the securitization process and Group’s level of involvement | |
Chart 20. | Trading book. Trends in VaR without smoothing | |
Chart 21. | Trading book. Market Risk Model Validation for BBVA S.A. Hypothetical Backtesting | |
| 14 |
Table of Contents
Chart 22. | Trading book. Market Risk Model Validation for BBVA S.A. Real Backtesting | |
Chart 23. | Trading book. Market Risk Model Validation for BBVA Bancomer. Hypothetical Backtesting | |
Chart 24. | Trading book. Market Risk Model Validation for BBVA Bancomer. Real Backtesting | |
Chart 25. | Operational risk management process | |
Chart 26. | Corporate Assurance Governance Structure | |
Chart 27. | Operational Risk Profile of BBVA Group | |
Chart 28. | Operational Risk profile by risk and country | |
Chart 29. | Trends in the leverage ratio | |
| 15 |
Table of Contents
BBVA is a customer-centric global financial services group founded in 1857. BBVA is present in more than 30 countries. It is a solid leader in Spain, and the biggest financial institution in Mexico; it has franchises that are leaders in South America and the Sunbelt region of the United States; and is the largest shareholder in the Turkish bank Garanti.
Its diversified business is focused on high-growth markets, and it views technology as a key sustainable competitive advantage.
Business strategy and model
During 2018, BBVA made significant progress on its transformation, firmly underpinned by the Group’s Purpose, and the six Strategic Priorities, as fundamental pillars of the Organization’s strategy.
Our vision and aspiration
BBVA is developing a transformation process needed in order to adapt itself to the new environment within the financial industry, characterized by trends validating the Group’s strategic vision. In other words, a reconfiguration of the financial services industry is taking place. Those trends are:
| · | A complex macroeconomic environment, characterized by strong regulatory pressure, low interest rates, high currency volatility, and geopolitical risks. |
| · | A highly regulated banking industry, that is, traditional banking subject to a large number of legal regulations, both globally and locally. |
| · | A shift in the needs and expectations of customers who demand higher value-added services that enable them to achieve their objectives, with a simple, transparent and immediate relationship model similar to the one they already enjoy with a number of other highly digitized industries. |
| · | Certain data that is evolving into a strategic asset. Given the large amount of data stored within organizations, the ability to interpret and make value proposals to customers is considered to be critical, provided there is customer consent under all circumstances. |
| · | Certain technological giants, with business models based on data that create ecosystems where the lines between different types of businesses are being blurred. |
| · | Greater competition because of the arrival of new players who focus on the most profitable aspects of the value chain. |
In this context, the main objective of the Group’s transformation strategy –its aspiration– is to strengthen the relationship with the clients.
Progress in BBVA’s transformation journey
BBVA advanced in fulfilment of its Purpose in 2018: to bring the age of opportunity to everyone, this is reflected in the tagline: Creating Opportunities. We want to help our customers make better financial decisions and attain their life goals; we want to be more than a bank, we want to be an engine of opportunities and have a positive impact on peoples’ lives and companies’ businesses.
In this respect, important steps were taken in the development of the six Strategic Priorities of the Group throughout the year in order to continue its advances in the transformation process. These advances were reflected in the results of key performance indicators
(KPIs).
| 16 |
Table of Contents
Strategic priorities
| 1. | The best customer experience |
BBVA Group’s main focus is based on providing a new standard in customer experience that stands out for its simplicity, transparency and swiftness, further empowering its customers while offering them personalized advice.
| 2. | Digital sales |
BBVA’s relationship model is evolving to adapt to the growing multi-channel customer profile, which is why it is essential to foster digitalization. For this purpose, it is developing an important digital offering including products and services that let customers use the most convenient channel for them.
| 3. | New business models |
Throughout 2018, BBVA continued to consolidate itself as one of the leading banks in terms of digital transformation and activity in the entrepreneurship ecosystem. The Group is actively participating in the disruption of the financial industry in order to incorporate key findings into the Bank’s value proposition, through both the search for new digital business models as well as the leveraging of the FinTech ecosystem.
| 4. | Optimize capital allocation |
The objective of this priority is to improve the profitability and sustainability of the business while simplifying and focusing it on the most relevant activities. Throughout 2018, efforts continued to promote the correct allocation of capital and this is allowing the Group to continue improving in terms of solvency.
| 5. | Unrivalled efficiency |
In an environment of lower profitability for the financial industry, efficiency has become an essential priority in BBVA’s transformation plan. This priority is based on building a new organizational model that is as agile, simple and automated as possible.
| 6. | A first class workforce |
BBVA Group’s most important asset is its people; therefore, a first class workforce is one of the six Strategic Priorities, which entails attracting, selecting, training, developing and retainingtop-class talent.
BBVA Group has developed new people management models and new ways of working which have enabled the Bank to keep transforming its operational model, but have also promoted cultural transformation and have favoured the ability to become a purpose-driven company, or, in other words, a company where staff guide their actions according to the Values, and are genuinely inspired and motivated by the same Purpose.
Highlights
BBVA Group’s net attributable profit for 2018,€5,32 billion, includes the capital gains from the sale of BBVA Chile.
Once more, there was a notably good performance of the more recurring revenue, and control of operating expenses.
Management of liquidity and funding in BBVA aims to finance the recurring growth of the banking business at suitable maturities and costs, using a wide range of instruments that
| 17 |
Table of Contents
provide access to a large number of alternative sources of finance, always in compliance with current regulatory requirements.
The level of the BBVA Group’s liquidity coverage ratio (LCR) remained comfortably above 100% throughout 2018, without including liquidity transfers between subsidiaries; in other words, no kind of excess liquidity in the subsidiaries abroad is considered in the calculation of the consolidated ratio. As of December 31, 2018, the LCR stood at 127%. Although this requirement is only established at Group level, the minimum level is easily exceeded in all the subsidiaries.
BBVA Group’s risk quality metrics have continued to perform positively throughout the year. Since the end of 2017,non-performing loans continued their declining trend, been reduced 16.6% and the Group’snon-performing loan ratio recorded a further improvement strongly influenced by the decline innon-performing loans.
As regards solvency, BBVA Group’s fully-loaded CET1 ratio stood at 11.3% at the end of December 2018, in line with the target of 11%. This ratio has increased by 30 basis points since the end of 2017, leveraged on organic earning generation and reduction of risk weighted asset capital consumption.
The following sections present details related to the Group’s solvency. The Management Report, which is attached to the BBVA Group Consolidated Financial Statements, presents the main indicators of the Group’s activity and profitability.
| 18 |
Table of Contents
Regulatory environment in 2018
Contents of the 2018 Prudential Relevance Report
Composition of Capital
Regulatory environment in 2018
As a Spanish credit institution, BBVA is subject to Directive 2013/36/EU of the European Parliament and of the Council dated June 26, 2013, on access to the activity of credit institutions and investment firms (“Directive CRD IV”) amending Directive 2002/87/EC and repealing Directives 2006/48/EC and 2006/49/EC by means of which the EU began, as of January 1 2014, to implement the capital reforms agreed within the framework of Basel III, thus establishing a period of gradual implementation for certain requirements until January 1 2019.
The major regulation governing the solvency of credit institutions is Regulation (EU) No 575/2013 of the European Parliament and of the Council dated June 26, 2013, on prudential requirements for credit institutions and investment firms, amending Regulation (EU) No 648/2012 (“CRR” and, jointly with Directive CRD IV and any other CRD IV implementation measure, “CRD IV”), which is complemented by several binding Regulatory Technical Standards that apply directly to EU member states, there being no need to implement national measures.
Directive CRD IV was transposed to Spanish national law by means of RoyalDecree-Law 14/2013 dated November 29(“RD-L 14/2013”), Law 10/2014, Royal Decree 84/2015 dated February 13 (“RD 84/2015”), Bank of Spain Circular 2/2014 dated January 31 and Circular 2/2016 dated February 2 (“Bank of Spain Circular 2/2016”).
Regulatory changes
BIS III Reform: in order to strike a balance between risk sensitivity, simplicity and comparability, the Basel Committee has reformed the Basel III framework. The main amendments are focused on internal models, the standard credit risk method, the market risk framework, operational risk and capital floors in the advanced measurement approach based on the standardized approach. The reform has been approved by the Basel Committee meeting on December 8, 2017, with an implementation date of January 1, 2022. In the case of capital floors, its introduction is gradual over a period of 5 years, from a floor of 50% on January 1, 2022 to 72.5% on January 1, 2027. The Committee also introduced an additional leverage ratio for global systemically important banks(G-SIBs).
CE reforms and provisions: in Europe, on November 23, 2016 the European Commission published a new reform package amending both the prudential banking regime (CRR) and the resolution regime (Bank Recovery and Resolution Directive, BRRD). This revision includes the implementation of international standards into European legislation (regulation later than 2010 adopted by the Basel Committee – except for standards approved in December, 2017 – and the total loss absorbing capacity (TLAC)), the final design of the Minimum Requirement for own funds and Eligible Liabilities (MREL) along with a package of technical improvements. At the same time, a proposal of directive has also been put forward to harmonize the hierarchy of senior debt creditors within the European Union. This directive was approved in December 2017.
| 19 |
Table of Contents
As of today discussions continue within the European Council and Parliament with the aim of reaching an agreement on the texts that will be the subject of negotiation between the European Commission, the European Council and the European Parliament. In this respect, in December 2018 they reached an agreement on the main points of the reform. However, on December 27, 2017 the Official Journal of the European Union (OJEU) published the agreement reached by the fast-track procedure relating to the following three aspects of the reform:
| 1. | A transitional period of 5 years (2018-2022) during which the banks will be allowed to mitigate partially the negative impact of the increased provisions under the new IFRS 9 accounting standard on their CET1 capital, in accordance with the provisions of Regulation (EU) 2017/2395 (article 473bis of Regulation (EU) No. 575/2013), to which BBVA Group has adhered voluntarily. In this regard and during that transitional period, information detailing the impact of not applying those transitory arrangements will be reported. For these purposes, EBA has published guidelines that specify the uniform format that should be used to disclose the information required during the transitional period (EBA/GL/2018/01). |
In this report, thephased-in capital ratios as of December 2018 are calculated taking into account the aforementioned transitional IFRS 9 treatment, whereas the fully loaded capital ratios incorporate the full impact of these new accounting regulations.
| 2. | An additional period of three years (2018-2020) during which exposure with respect to central governments or central banks of the Member States denominated and financed in a currency of another Member State remains exempt from calculation of threshold to large exposures. |
| 3. | Creation of a new category of subordinated senior debt in the hierarchy of bank creditors that will be eligible for the purposes of TLAC. |
Reform of the securitisation framework: with respect to securitisations, the European Commission published a proposal in 2015 aimed to facilitate the development of a securitisation market in Europe. The package consisted of two draft Regulations:
| 1. | Securitisation Regulation: combines the rules applicable to all the securitisations including high-quality securitisation (simple, transparent and standardized (STS) securitisation), which is now dispersed across several legal provisions. This rationalizes and simplifies the existing rules and establishes a general system for defining STS securitisation. |
| 2. | Text modifying the CRR with respect to the capital requirements for securitisation positions. Gives a more risk-sensitive treatment to STS securitisations. |
These two regulations were published in the OJEU on December 28, 2017, with an application date of January 1, 2019 for securitisations issued as of that date. For securitisations made before January 2019, entities will continue to apply the current regime until December 31, 2019.
Management and framework of NPLs: in July 2017, the European Council published a package of measures to addressnon-performing loan assets (NPL) in Europe. For this purpose, the European Central Bank (ECB) has established supervisory expectations for Pillar II on prudential provisions fornon-performing loan exposures classified as such as of April 1, 2018. Its application date is from 2021 SREP exercise onwards (“Supervisory Review and Examination Process”). The supervisory expectations on prudential provisions applicable to stock(non-performing loan exposures classified as such before April 1, 2018) will be treated by the ECB within the individual dialog with each bank.
Meanwhile, the EC is working on a Pillar I proposal for a regulation modifying the CRR with regard to the minimum coverage of losses arising fromnon-performing loan exposures.
| 20 |
Table of Contents
After a negotiation period between the EC, the European Council and the European Parliament, an agreement has been reached in December 2018 that is expected to be applicable throughout 2019. With regard to transparency, the European Banking Authority (EBA) has released guidelines on the NPLs information disclosure that will apply as of December 31, 2019, and guidelines regarding the NPLs management that will be applicable as of June 30, 2019.
Changes in the Pillar III disclosure framework: the Basel Pillar III framework is being revised by the Basel Committee on Banking Supervision (BCBS), which has divided the process into three phases.
| · | Phase I: the disclosure requirements of the first phase of review were published in January 2015, and they replace the disclosure requirements published in 2014 (modified in July 2009). It includes standardized templates related to credit and market risks, as well as the distinction between the accounting perimeter and regulatory perimeter. |
| · | Phase II: on a second phase, the BCBS has reviewed the disclose requirements collected on the Basel rules that are currently in force and has consolidated them under the document “Disclosure requirements for the Third Pillar – consolidated and enhanced framework”, published in March 2017. It includes standardized templates related to countercyclical buffer, prudent valuation, LCR, etc. |
| · | Phase III: as of December, 11, 2018, BCBS has published the requirements of the third phase of revision of the Pillar 3 framework under the document “Disclosure requirements for the Third Pillar – updated framework”, which includes, among others, new information disclosure requirements derived from the conclusion of the Basel III reforms. |
The disclosure requirements for the first phase of the review of Pillar 3 entered into force in December 2017, while the disclosure requirements for the second phase have different implementation dates, with the first phase coinciding with the close of 2017. Furthermore, the implementation date of the third phase is, in general, on January 1, 2022, with the exception of certain forms that have been moved forward to the end of 2020.
Contents of the 2018 Prudential Relevance Report
Article 13 of the CRR establishes that the parent entities of the European Union are subject based on their consolidated situation to the disclosure requirements contained in the Part Eight of the CRR.
This report includes the prudential information of BBVA consolidated group as of December 31, 2018. This report has been prepared in compliance with the requirements set by Part Eight of the CRR, as well as any applicable guideline published by the European Banking Authority.
Furthermore, the data published in the Prudential Relevance Report (Pillar III) was prepared in accordance with internal control processes described in the “Corporate Policies for Preparing Financial and Annual Information in the BBVA Group”. These policies ensure that the information included in Pillar III is subject to the internal control framework defined by the Group, as well as adequate internal and external revision (by an independent expert), in compliance with the Guidelines on disclosure requirements under Part Eight of Regulation (EU) No.575/2013 (EBA/GL/2016/11).
In general, the following EBA guidelines are highlighted:
| · | Guidelines on materiality, proprietary information, and confidentiality, and on the frequency of disclosure of information according to Article 432, sections 1 and 2, and Article 433 of Regulation (EU) No. 575/2013 (EBA/GL/2014/14). These guidelines detail the process and the criteria to be followed regarding the principles |
| 21 |
Table of Contents
of materiality, proprietary information, confidentiality and the right to omit information. They also provide guidance for entities to evaluate the need to publish information more frequently than the annual. The Executive Commission of the Bank of Spain adopted these guidelines in February 2015. |
| · | Guidelines on disclosure requirements under Part Eight of Regulation (EU) No. 575/2013 (EBA/GL/2016/11). These guidelines provide guidance in relation to the information that entities must disclose in application of the corresponding articles of the Part Eight and with the presentation of said information. The Executive Commission of the Bank of Spain adopted these guidelines in October 2017. |
| · | Guidelines on LCR disclosure to complement the information on liquidity risk management in accordance with Article 435 of Regulation (EU) No. 575/2013 (EBA/GL/2017/01). These guidelines specify the general framework for the disclosure of information on risk management under Article 435 of Regulation (EU) No. 575/20132 in relation to liquidity risk, establishing a harmonised structure for the disclosure of the information required by Article 435, point 1 of said Regulation. The Executive Commission of the Bank of Spain adopted these guidelines in July 2017. |
| · | Guidelines on disclosure of encumbered and unencumbered assets in accordance with Article 443 of Regulation (EU) No. 575/2013 (EBA/GL/2014/03). The Executive Commission of the Bank of Spain adopted these guidelines in September 2014. |
| · | Guidelines on uniform disclosure of information under Article 473a of Regulation (EU) No 575/2013 with regard to the transitional provisions for mitigating the impact on own funds from the introduction of IFRS 9 (EBA/GL/2018/01). The Executive Committee of the Bank of Spain has adopted these guidelines in February 2018. |
| · | Guidelines on appropriate remuneration policies under Articles 74, paragraph 3, and 75, paragraph 2, of Directive 2013/36/EU and disclosure of information under Article 450 of Regulation (EU) No 575/2013 (EBA/GL/2015/22). The Executive Commission of the Bank of Spain adopted these guidelines in July 2016. |
Annex V of this report, available on the Group’s website, gathers the correspondence of the articles of Part Eight CRR on information disclosure with the different headings of the document (or other public documents) where the required information is located.
In an exercise of transparency, as of December 31, 2018, BBVA includes the following standard templates on disclosure of information recommended by the different regulators. They can be seen in the following table:
| 22 |
Table of Contents
Disclosure requirements
Template | Guidelines on disclosure requirements EBA/GL/2016/11 | Pillar III Section | ||
| EU-OV1 | Overview of RWAs | 2.5 | ||
| EU-LI1 | Differences between the accounting and regulatory scopes of consolidation and the mapping of financial statement categories with regulatory risk categories | 1.1.3 | ||
| EU-LI2 | Main sources of the differences between the regulatory exposure amounts and carrying values in financial statements | 1.1.3 | ||
| EU-LI3 | Outline of the differences in the scopes of consolidation (entity by entity) | Pillar III Annexes | ||
| EU-INS1 | Non-deducted participations in insurance undertakings | N/A | ||
| EU-CR1-A | Credit quality of exposures by exposure class and instrument | 3.2.3.4 | ||
| EU-CRB-B | Total and average net amount of exposures | 3.2.3.2 | ||
| EU-CRB-C | Geographical breakdown of exposures | 3.2.3.3 | ||
| EU-CR1-C | Credit quality of exposures by geography | 3.2.3.3 | ||
| EU-CRB-D | Concentration of exposures by industry or counterparty types | 3.2.3.5 | ||
| EU-CR1-B | Credit quality of exposures by industry or counterparty types | 3.2.3.5 | ||
| EU-CRB-E | Maturity of exposures | 3.2.3.6 | ||
| EU-CR1-D | Ageing ofpast-due exposures | 3.2.3.6 | ||
| EU-CR2-A | Changes in the stock of general and specific credit risk adjustments | 3.2.3.8 | ||
| EU-CR2-B | Changes in the stock of defaulted and impaired loans and debt securities | 3.2.3.8 | ||
| EU-CR1-E | Non-performing exposures and forborne exposures | 3.2.3.9 | ||
| EU-CR4 | Standardized approach: credit risk exposure and credit risk mitigation effects | 3.2.4.3 | ||
| EU-CR5 | Standardized approach | 3.2.4.3 | ||
| EU-CR6 | IRB approach: credit risk exposures by exposure class and PD range | 3.2.5.2 | ||
| EU-CR9 | IRB approach: backtesting of PD per exposure class | 3.2.5.2 | ||
| EU-CR8 | RWA flow statements of credit risk exposures under the IRB approach | 3.2.5.2 | ||
| EU-CR10 (1) | IRB: specialized lending | 3.2.5.4 | ||
| EU-CR10 (2) | IRB: equity | 3.2.5.5 | ||
| EU-CCR5-A | Impact of netting and collateral held on exposure values | 3.2.6.2 | ||
| EU-CCR1 | Analysis of counterparty credit risk exposures by approach | 3.2.6.2 | ||
| EU-CCR3 | Standardized approach: counterparty credit risk exposures by regulatory portfolio and risk | 3.2.6.2.1 | ||
| EU-CCR4 | IRB approach: counterparty credit risk exposure by portfolio and PD scale | 3.2.6.2.2 | ||
| EU-CCR5-B | Composition of collateral for exposures to counterparty credit risk | 3.2.6.2.3 | ||
| EU-CCR7 | RWA flow statements of CCR exposures under the IMM | N/A |
| 23 |
Table of Contents
| EU-CCR6 | Credit derivatives exposures | 3.2.6.2.4 | ||
| EU-CCR2 | Credit valuation adjustment (CVA) capital charge | 3.2.6.3 | ||
| EU-CCR8 | Exposures to central counterparty clearing houses | 3.2.6.4 | ||
| EU-CR3 | Credit risk mitigation techniques overview | 3.2.8.3 | ||
| EU-MR1 | Market risk under the standardized approach | 3.3.3 | ||
| EU-MR3 | IMA values for trading portfolios | 3.3.4.2.2 | ||
| EU-MR2-A | Market risk under the internal model approach (IMA) | 3.3.4.2.2 | ||
| EU-MR2-B | RWA flow statements of market risk exposures under the IMA approach | 3.3.4.2.2 | ||
| EU-MR4 | Trading book. Validation of the Market Risk Measurement Model | 3.3.4.2.3 | ||
Template | Guidelines on disclosure of liquidity information (EBA/GL/2017/01) | Pillar III Section | ||
| EU- LIQ1 | Guidelines on disclosure of Liquidity information | 3.7.5 | ||
Template | RTS on Asset Encumbrance Disclosure (EBA/RTS/2017/03) | Pillar III Section | ||
| Encumbered and unencumbered assets | 3.7.6 | |||
| Collateral received | 3.7.6 | |||
| Sources of encumbrance | 3.7.6 | |||
Template | Guidelines with regard to the transitional provisions for mitigating the impact on own funds from IFRS9 (EBA/GL/ 2018/01) | Pillar III Section | ||
| IFRS9 - FL | Comparison of own funds and capital leverage ratios of entities with and without the application of the transitional arrangements of IFRS9 or similar Expected Credit Losses (ECL) | 2.3 | ||
Template | Guidelines on prudent valuation adjustments (EBA/RTS/2014/06) | Pillar III Section | ||
| Prudent Valuation Adjustments | 3.3.4.2.1 | |||
Template | Leverage Ratio - Commission Implementing Regulation (EU) 2016/200 | Pillar III Section | ||
| LRSum | Summary of the reconciliation of accounting assets and exposure corresponding to the Leverage Ratio | 4.1 | ||
| LRCom | Common Leverage Ratio disclosure table | Pillar III Annexes | ||
| LRSpl | Breakdown of balance-sheet exposures | Pillar III Annexes | ||
| 24 |
Table of Contents
Template | Own Fund requirements - Commission Implementing Regulation (EU) 1424/2013 | Pillar III Section | ||
| Template for presenting the main characteristics of capital instruments | Pillar III Annexes | |||
| Template with information on temporary own funds | Pillar III Annexes | |||
Template | Anticyclical capital buffer Commission Delegated Regulation (EU) 2015/1555 | Pillar III Section | ||
| Distribution by geographic areas of the credit exposure for calculation of the countercyclical capital buffer | Introduction | |||
| Amount of the countercyclical capital buffer specific to each entity | Introduction | |||
Template | Disclose requirements for the Third Pillar – consolidated and enhanced framework | Pillar III Section | ||
| SEC1 | Securitisation exposure in the investment portfolio | 3.2.7.5 | ||
| SEC4 | Exposure to securitisation in the banking portfolio and associated regulatory capital requirements (bank that acts as investor) | 3.2.7.6 | ||
| SEC3 | Exposure to securitisation in the banking portfolio and associated regulatory capital requirements (bank that acts as originator or sponsor) | 3.2.7.7.2 | ||
Template | Disclosure requirements for the Third Pillar – updated framework | Pillar III Section | ||
| CC1 | Template with information on temporary own funds (CC1) | Pillar III Annexes | ||
| CC2 | Reconciliation of the regulatory capital with the Public Balance Sheet | 1.1.3 | ||
| 25 |
Table of Contents
Capital requirements
The regulations require institutions to have a higher and better quality capital level, increase capital deductions and review the requirements associated with certain assets. Unlike the previous framework, the minimum capital requirements are complemented with requirements for capital buffers and others relating to liquidity and leverage. Bank capital under CRD IV mainly comprises of the elements described in section 2.1 herein.
The most relevant aspects affecting the elements making up minimum capital requirements and risk-weighted assets are detailed in greater depth in section 2.4 of this document.
In this regard, article 92 of the CRR establishes that credit institutions must maintain at all times the following own funds requirements:
| a) | Common Equity Tier 1 capital ratio of 4.5%, obtained as Common Equity Tier 1 capital expressed as a percentage along the total amount of risk-weighted assets. |
| b) | Tier 1 capital ratio of 6%, calculated as the percentage between the Tier 1 capital expressed as a percentage along the total amount of risk-weighted assets. |
| c) | Total capital ratio of 8%, expressed as the percentage of the own funds along the total amount risk-weighted assets. |
Notwithstanding the application of the Pillar 1 requirement, CRD IV allows competent authorities to require that credit institutions maintain more own funds than the Pillar 1 requirements to cover risks other than those already covered by the Pillar 1 requirement (this power of the competent authority is commonly known as Pillar 2).
Furthermore, in accordance with CRD IV, credit institutions must comply with the “combined requirement of capital buffers” from 2016 onwards. The “combined buffer requirement” has incorporated five new capital buffers: (i) the capital conservation buffer; (ii) the buffer for global systemically important banks (the“G-SIB buffer”); (iii) the countercyclical capital buffer specific to each bank; (iv) the buffer for other systemically important financial institutions (the“D-SIB buffer”); and (v) the buffer against systemic risks. The “combined capital buffer requirement” must be met with Common Equity Tier 1 capital (“CET1”) in addition to that which is provided to meet the minimum capital required by “Pillar 1” and “Pillar 2”.
Both the capital conservation buffer as well as theG-SIB buffer (where appropriate) will apply to credit institutions, as it establishes a percentage over 0%.
The buffer for global systemically important banks applies to those institutions on the list of global systemically important banks, which is updated annually by the Financial Stability Board (“FSB”). Given that BBVA is not considered asG-SIB since November 2015 (effective January 1, 2017), this buffer does not apply to BBVA.
For more details on the quantitative indicators for assessing the global systemically important banks, see the document“G-SIBs Information” in the sectionShareholders and Investors / Financial Information on the BBVA Group website.
The Bank of Spain has extensive discretionary powers as regards the countercyclical capital buffer peculiar to each bank, the buffer for other systemically important financial institutions (which are those institutions considered to be systemically important local financial institutions“D-SIB”) and the buffer against systemic risks (to prevent or avoid systemic or macroprudential risks). The European Central Bank (ECB) has the powers to issue recommendations in this respect following the entry into force on November, 4, 2014 of the Single Supervisory Mechanism (SSM).
| 26 |
Table of Contents
In December 2015, the Bank of Spain agreed to set the countercyclical capital buffer that applies to credit exposures in Spain at 0% as of January 1 2017. These percentages will be reviewed every quarter, as the Bank of Spain decided in December 2018 to keep the countercyclical capital buffer at 0% for the first quarter of 2019.
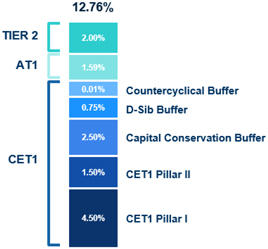
As far as BBVA is concerned, after the supervisory review and evaluation process (“SREP”) conducted in 2018, ECB has notified on February, 14, 2019, that BBVA Group , as of March, 1, 2019 maintain aphased-in, fully loaded ratio (given that the transitional period of capital buffers has ended in December 2018) (i) CET1 of 9.26% at the consolidated level and 8.53% at the individual level and (ii) a total capital ratio of 12.76% at the consolidated level and 12.03% at the individual level.
The consolidated total capital requirement includes: i) the minimum capital requirement of Common Equity Tier 1 (CET1) of Pillar 1 (4.5%); ii) the capital requirement of Additional Tier 1 (AT1) of Pillar 1 (1.5%); iii) the capital requirement of Tier 2 of Pillar 1 (2%); iv) the CET1 requirement of Pillar 2 (1.5%), which remains at the same level as established after the last SREP; v) the capital conservation buffer (2.5% of CET1); vi) the capital buffer for Other Systemically Important Institutions(O-SIIs) (0.75% of CET1); and vii) the countercyclical capital buffer (0.01% of CET1).
CHART 1. Capital Requirements (Fully loaded)
As of December 31, 2018, BBVA maintains fully loaded CET1 ratio and total ratio of 11.3% and 15.5%, respectively (inphased-in terms, CET1 and total ratio of 11.6% and 15.7%, respectively) reinforcing its equity position in the Group.
The following table presents the distribution by geographic areas of the credit exposure for calculation of the countercyclical capital buffer:
| 27 |
Table of Contents
TABLE 1. Distribution by geographic areas of the credit exposure for calculation of the countercyclical capital buffer
| Million euros | ||||||||||||||||||||||||||||||||||||||||||||||||
| General credit | Trading book exposure | Securitisation | Own funds requirements | |||||||||||||||||||||||||||||||||||||||||||||
Exposure value for | Exposure value for IRB | Sum of long and short position | Trading book exposure value for internal models | Exposure value for SA | Exposures value for IRB | Of which: General credit | Of which: Trading book exposures | Of which: Securitisation | Total | Own funds requirements weights | Countercyclical capital buffer rate | |||||||||||||||||||||||||||||||||||||
| Geographical breakdown | ||||||||||||||||||||||||||||||||||||||||||||||||
| Sweden | 36 | 193 | – | 5 | – | – | 6 | 0 | – | 7 | 0.0% | 2.0% | ||||||||||||||||||||||||||||||||||||
| Norway | 20 | 16 | – | 10 | – | – | 1 | 0 | – | 1 | 0.0% | 2.0% | ||||||||||||||||||||||||||||||||||||
| Slovakia | 6 | 153 | – | – | – | – | 17 | – | – | 17 | 0.1% | 1.3% | ||||||||||||||||||||||||||||||||||||
| Iceland | 0 | 0 | – | – | – | 0 | 0 | – | 0 | 0.0% | 1.3% | |||||||||||||||||||||||||||||||||||||
| Lithuania | 0 | 0 | – | – | – | – | 0 | – | – | 0 | 0.0% | 0.5% | ||||||||||||||||||||||||||||||||||||
| United Kingdom | 526 | 5,214 | 8 | 116 | – | – | 198 | 4 | – | 202 | 1.0% | 1.0% | ||||||||||||||||||||||||||||||||||||
| Czech Republic | 2 | 5 | – | – | – | – | 0 | – | – | – | 0.0% | 1.0% | ||||||||||||||||||||||||||||||||||||
| Hong Kong | 51 | 1,175 | – | – | – | – | 16 | – | – | 16 | 0.1% | 1.9% | ||||||||||||||||||||||||||||||||||||
| Total countries with countercyclical capital buffer stablished | 641 | 6,757 | 8 | 131 | – | – | 239 | 5 | – | 243 | 1.2% | |||||||||||||||||||||||||||||||||||||
| Peru | 20,485 | 568 | 3,579 | – | – | – | 940 | 2 | – | 943 | 4.5% | – | ||||||||||||||||||||||||||||||||||||
| Germany | 268 | 4,370 | 1 | 74 | – | – | 165 | 2 | – | 167 | 0.8% | – | ||||||||||||||||||||||||||||||||||||
| Argentina | 8,174 | 209 | 1,452 | 0 | – | – | 340 | 14 | – | 353 | 1.7% | – | ||||||||||||||||||||||||||||||||||||
| Spain | 30,606 | 167,840 | 31 | 7 | – | 5,593 | 5,230 | 5 | 431 | 5,666 | 27.2% | – | ||||||||||||||||||||||||||||||||||||
| United States | 80,901 | 13,231 | 6,741 | 73 | 4,595 | – | 4, 448 | 8 | 368 | 4,824 | 23.2% | – | ||||||||||||||||||||||||||||||||||||
| France | 974 | 6,906 | 0 | 86 | – | – | 220 | 4 | – | 224 | 1.1% | – | ||||||||||||||||||||||||||||||||||||
| Italy | 248 | 6,358 | – | 23 | – | – | 209 | 1 | – | 210 | 1.0% | – | ||||||||||||||||||||||||||||||||||||
| Mexico | 43,202 | 37,528 | 50 | 254 | 28 | – | 3,200 | 24 | 2 | 3,226 | 15.5% | – | ||||||||||||||||||||||||||||||||||||
| Portugal | 4,448 | 663 | 11 | 1 | – | – | 273 | 0 | – | 273 | 1.3% | – | ||||||||||||||||||||||||||||||||||||
Turkey | 56,603 | 566 | 11,347 | 0 | – | – | 2,829 | 2 | – | 2,831 | 13.6% | – | ||||||||||||||||||||||||||||||||||||
| Colombia | 14,291 | 622 | 36,276 | 3 | – | – | 761 | 7 | – | 768 | 3.7% | – | ||||||||||||||||||||||||||||||||||||
| Total countries without countercyclical capital buffer but with own funds requirements greater than 1% | 260,200 | 238,859 | 59,489 | 521 | 4,623 | 5,593 | 18,616 | 67 | 800 | 19,484 | 93.6% | |||||||||||||||||||||||||||||||||||||
| Other areas | 12,344 | 15,032 | 145 | 194 | – | – | 1,084 | 5 | – | 1,090 | 5.2% | – | ||||||||||||||||||||||||||||||||||||
| Total countries without countercyclical capital buffer but with own funds requirements less than 1% | 12,344 | 15,032 | 145 | 194 | – | – | 1,084 | 5 | – | 1,090 | 5.2% | |||||||||||||||||||||||||||||||||||||
| Total | 273,186 | 260,649 | 59,642 | 846 | 4,623 | 5,593 | 19,939 | 78 | 800 | 20,817 | 100% | |||||||||||||||||||||||||||||||||||||
(1) Credit exposures exclude exposures to Central Governments or Central Banks, Regional Governments or Local Authorities, Public sector entities, Multilateral Development Banks, International Organizations and Institutions in accordance with art. 140.4 of Directive 2013/36/EU.
| Million euros | ||||
| Total risk exposure amount | 348,264 | |||
| Institution specific countercyclical buffer rate(2) | 0.01% | |||
| Institution specific countercyclical buffer requirement | 45 | |||
(2) Countercyclical buffer calculated as of December 2018 in accordance with Commission Delegated Regulation (EU) 2015/1555
| 28 |
Table of Contents
Leverage Ratio
In order to provide the financial system with a metric that serves as a backstop to capital levels, irrespective of the credit risk, a measure complementing all the other capital indicators has been incorporated into Basel III and transposed to the solvency regulations. This measure, the leverage ratio, can be used to estimate the percentage of the assets financed with Tier 1 capital.
Although the carrying amount of the assets used in this ratio is adjusted to reflect the bank’s current or potential leverage with a given balance-sheet position, the leverage ratio is intended to be an objective measure that may be reconciled with the financial statements.
As of December 31, 2018, BBVA Group had a Leverage Ratio of 6.4% (fully loaded), and aphased-in ratio of 6.5%, above the minimum requirement set at 3%, and continuing to compare very favourably with the rest of its peer group.
| 29 |
Table of Contents
| 1. | General information requirements |
| 1.1. | Corporate name and differences between the consolidated group for the purposes of the solvency regulations and accounting criteria |
| 1.1.1. | Corporate name and scope of application |
| 1.1.2. | Differences in the consolidated group for the purposes of the solvency regulations and accounting criteria |
| 1.1.3. | Reconciliation of the Public Balance Sheet from the accounting perimeter to the regulatory perimeter |
| 1.1.4. | Main changes to the Group’s scope of consolidation in 2018 |
| 1.2. | Identification of dependent institutions with capital resources below the minimum requirement. Possible impediments to capital transfer |
| 1.3. | Exemptions from capital requirements at the individual orsub-consolidated level |
| 1.1. | Corporate name and differences between the consolidated group for the purposes of the solvency regulations and accounting criteria |
| 1.1.1. | Corporate name and scope of application |
Banco Bilbao Vizcaya Argentaria, S.A. (hereinafter “the Bank” or “BBVA”) is aprivate-law entity subject to the laws and regulations governing banking entities operating in Spain. It carries out its activity through branches and agencies across the country and abroad.
The Bylaws and other public information are available for consultation at its registered address (Plaza San Nicolás, 4 Bilbao) and on its corporate website (www.bbva.com).
The Solvency Regulations are applicable at the consolidated level for the whole Group.
| 1.1.2. | Differences in the consolidated group for the purposes of the solvency regulations and accounting criteria |
BBVA Group’s Consolidated Annual Report are presented in accordance with the International Financial Reporting Standards as adopted by the European Union(“EU-IFRS”) in effect as of December 31, 2018, taking into consideration Bank of Spain Circular 4/2017, and its successive amendments, and other provisions of the regulatory financial reporting framework applicable to the Group in Spain.
The BBVA Group’s Consolidated Annual Report for 2018 are posted according to the models included in Circular 3/2018 of the Spanish Securities and Investment Board, with the aim of adapting the content of public financial information of credit institutions to the terminology and formats of financial statements established as mandatory by the European Union for credit institutions.
Based on accounting criteria, companies are considered to form part of a consolidated group when the controlling institution holds or can hold, directly or indirectly, control of them. An institution is understood to control another entity when it is exposed, or is entitled to, variable returns because of its involvement in the subsidiary and has the capacity to influence those returns through the power it exercises on the subsidiary. For such control to exist, the following aspects must be fulfilled:
| 30 |
Table of Contents
| a) | Power: an investor has power over a subsidiary when it has current rights that provide it with the capacity to direct its relevant activities, i.e. those that significantly affect the returns of the subsidiary. |
| b) | Returns: an investor is exposed, or is entitled to variable returns, as a result of its involvement in the subsidiary when the returns obtained by the investor for such involvement may vary based on the economic performance of the subsidiary. Investor returns may be positive only, negative only or both positive and negative. |
| c) | Relationship between power and returns: An investor has control over a subsidiary when it not only has power over the subsidiary and is exposed, or is entitled to, variable returns for its involvement in the subsidiary, but also has the capacity to use its power to influence the returns it obtains due to its involvement in the subsidiary. |
Therefore, in drawing up the Group’s Consolidated Annual Report, all dependent companies and consolidated structured entities have been consolidated by applying the full consolidation method.
Jointly-controlled entities, as well as joint ventures (those over which joint control arrangements are in place), are valued using the equity method.
The list of all the companies forming part of BBVA Group is included in the appendices to the Group’s Consolidated Annual Report.
For the purposes of solvency regulations, the following subsidiaries form part of the consolidated group, as defined in article 18 of CRR:
| · | Credit institutions |
| · | Investment firms |
| · | Financial institutions |
A financial institution is a company, different than an institution (credit institution or investment firm), whose main activity consists of acquiring holdings or performing one or more of the following activities:
| ○ | Loans, including in particular consumer finance, credit agreements relating to immovable property, recourse andnon-recourse factoring, and financing of commercial transactions (including forfaiting) |
| ○ | Financial leasing |
| ○ | Payment services |
| ○ | Issuing and managing other payment channels (e.g. traveller’s cheques and bank cheques) |
| ○ | Granting of guarantees and commitments |
| ○ | Trading on their own account or on behalf of customers on any of the following instruments: |
| - | Money market instruments (cheques, bills, certificates of deposit etc.) |
| - | Foreign currency |
| - | Financial futures and options |
| 31 |
Table of Contents
| - | Foreign-exchange or interest-rate instruments |
| - | Marketable securities |
| ○ | Participating in the issuance of securities and the provision of corresponding services |
| ○ | Advising companies with regard to capital structure, industrial strategy and related matters, as well as advice and services for mergers and acquisitions of companies |
| ○ | Brokerage in the interbank markets |
| ○ | Managing or advising on equity management |
| ○ | Custody and administration of marketable securities |
| ○ | Issuance of electronic money |
This definition includes financial holding companies, mixed financial holding companies, payment institutions and asset management firms, but excludes pure industrial holding companies, insurance companies, insurance holding companies and mixed insurance holding companies.
| · | Auxiliary services companies: a company whose main activity is holding or management of property, management of computing services or any other similar activity of an auxiliary nature with regard to the main activity of one or more institutions (credit institution or investment firm). |
Therefore, for the purposes of calculating solvency requirements, and hence the drawing up of this Prudential Relevance Report, the scope of consolidated entities is different from the scope defined for the purposes of drawing up the Group’s Consolidated Financial Statements.
The effect of the difference between the two regulations is basically due to:
| · | The difference between the balances contributed by entities (largely insurance entities) that are consolidated in the Group’s Consolidated Annual Report by the full consolidation method and consolidated for the purposes of solvency by applying the equity method. |
| · | The inclusion of the balance from institutions (mainly financial) that are consolidated by the equity method at the accounting level but for purposes of solvency by the proportional integration method. |
The details of these companies are available in Annexes of the file Pillar III 2018 Annexes, available in the section forShareholders and Investors/Financial Information on the Group’s website.
| 32 |
Table of Contents
| 1.1.3 | Reconciliation of the Public Balance Sheet from the accounting perimeter to the regulatory perimeter |
This section includes an exercise in transparency aimed at offering a clear view of the process of reconciliation between the book balances reported in the Public Balance Sheet (attached to the Group’s Consolidated Annual Report) and the book balances this report uses (regulatory scope), revealing the main differences between both scopes.
Table 2: CC2 – Reconciliation of the regulatory capital with Public balance sheet
| Million Euros | ||||||||||||
Public Balance Sheet Headings | Public Balance Sheet | Regulatory balance sheet | Referece to template CCl | |||||||||
| Cash, cash balances at central banks and other demand deposits | 58,196 | 58,296 | ||||||||||
| Financial assets held for trading | 90,117 | 91,394 | ||||||||||
| Non-trading financial assets mandatorily at fair value through profit or loss | 5,135 | 2,367 | ||||||||||
| Financial assets designated at fair value through profit or loss | 1,313 | – | ||||||||||
| Financial assets at fair value through accumulated other comprehensive income | 56,337 | 42,019 | ||||||||||
| Financial assets at amortized cost | 419,660 | 413,974 | ||||||||||
| Hedging derivatives | 2,892 | 2,805 | ||||||||||
| Fair value changes of the hedged items in portfolio hedges of interest rate risk | (21) | (21) | ||||||||||
| Investments in subsidiaries, joint ventures and associates | 1,578 | 4,085 | ||||||||||
| Assets under insurance and reinsurance contracts | 366 | – | ||||||||||
| Tangible assets | 7,229 | 6,940 | ||||||||||
| Intangible assets | 8,314 | 8,203 | g) | |||||||||
| Tax assets | 18,100 | 17,722 | ||||||||||
Of which: deferred tax assets | 1,260 | 1,260 | h) | |||||||||
| Other assets | 5,472 | 7,334 | ||||||||||
| Non-current assets and disposal groups held for sale | 2,001 | 2,001 | ||||||||||
| Total Assets | 676,689 | 657,119 | ||||||||||
| Financial liabilities held for trading | 80,774 | 81,140 | ||||||||||
| Other financial liabilities designated at fair value through profit or loss | 6, 993 | 2, 858 | ||||||||||
| Financial liabilities at amortized cost | 509,185 | 504,968 | p) q) t) | |||||||||
| Hedging derivatives | 2, 680 | 2, 468 | ||||||||||
| Fair value changes of the hedged items in portfolio hedges of interest rate risk | – | – | ||||||||||
| Liabilities under insurance and reinsurance contracts | 9, 834 | – | ||||||||||
| Provisions | 6,772 | 6, 189 | ||||||||||
| Current tax liabilities and deferred tax liabilities (DTL) | 3,276 | 2,568 | ||||||||||
Of which: deferred tax liabilities | 1,275 | 1,275 | ||||||||||
| Other liabilities | 4,301 | 4,228 | ||||||||||
| Liabilities included in disposal groups clasified as held for sale | 2 | |||||||||||
| Total liabilities | 623,814 | 604,420 | ||||||||||
| Capital | 3,267 | 3,267 | a) | |||||||||
| Share premium | 23,992 | 23,992 | a) | |||||||||
| Equity instruments issued other than capital | – | – | b) | |||||||||
| Other equity | 50 | 50 | b) | |||||||||
| Retained earnings | 23,018 | 22,848 | b) | |||||||||
| Revaluation reserves | 3 | 3 | b) | |||||||||
| Other reserves | (58) | 92 | b) | |||||||||
| Less: treasury shares | (296) | (296) | 1) | |||||||||
| Profit or loss atributable to owners of the parent | 5,324 | 5,292 | e) | |||||||||
| Less: interim dividend | (975) | (975) | e) | |||||||||
| Accumulated other comprehensive income (loss) | (7,215) | (7,285) | c) i) k) | |||||||||
| Minority interest(non-controlling interest) | 5,764 | 5,709 | ||||||||||
| Total Equity | 52,874 | 52,698 | ||||||||||
| Total Equity and total liabilities | 676,689 | 657,119 | ||||||||||
The main differences between the public balance sheet and the regulatory balance sheet are due to withdrawals from the balance generated by insurance, real estate and financial entities that are consolidated through the application of the equity method for the amount of-EUR 20.19 billion; and balance entries generated by entities that are consolidated using the proportional integration method for an amount of +EUR 0.62 billion.
| 33 |
Table of Contents
The following table also shows the risks to which each one of the items on the regulatory balance sheet is exposed:
TABLE 3: EU LI1 – Differences between the accounting and regulatory scopes of consolidation and the mapping between of the financial statement categories and with regulatory risk categories
| Million Euros | ||||||||||||||||||||||||||||
| Carrying values of items | ||||||||||||||||||||||||||||
| Carrying values as reported in published financial statements | Carrying Values under scope of regulatory consolidation(1) | Subject to credit risk framework | Subject to counterparty credit risk framework | Subject to the framework | Subject to the market risk framework | Not subject to capital requirements or | ||||||||||||||||||||||
| Assets | ||||||||||||||||||||||||||||
| Cash, cash balances at central banks and other demand deposits | 58,196 | 58,296 | 58,296 | – | – | – | – | |||||||||||||||||||||
| Financial assets held for trading (2) | 90,117 | 91,394 | – | 59,912 | – | 91,394 | – | |||||||||||||||||||||
| Financial assets designated at fair value through profit or loss | 6,449 | 2,367 | 2,293 | – | 3 | 2,293 | – | |||||||||||||||||||||
| Financial assets designated at fair value through other comprehensive income | 56,337 | 42,019 | 38,210 | – | 3,320 | 186 | 201 | |||||||||||||||||||||
| Financial assets at amortized cost | 419,660 | 413,974 | 406,868 | 390 | 6,893 | 155 | ||||||||||||||||||||||
| Hedging derivatives | 2,892 | 2,805 | – | 2,805 | – | 2,805 | – | |||||||||||||||||||||
| Fair value changes of the hedged items in portfolio hedges of interest rate risk | (21) | (21) | – | – | – | – | (21) | |||||||||||||||||||||
| Investments in subsidiaries, joint ventures and associates | 1,578 | 4,085 | 4,021 | – | – | – | 64 | |||||||||||||||||||||
| Insurance or reinsurance assets | 366 | – | – | – | – | – | ||||||||||||||||||||||
| Tangible assets | 7,229 | 6,940 | 6,940 | – | – | – | – | |||||||||||||||||||||
| Intangible assets | 8,314 | 8,203 | – | – | – | – | 8,203 | |||||||||||||||||||||
| Tax assets(3) | 18,100 | 17,722 | 16,259 | – | – | – | 1,463 | |||||||||||||||||||||
| Other assets(4) | 5, 472 | 7,334 | 5,302 | – | – | – | 2,032 | |||||||||||||||||||||
| Non-current assets and disposal groups held for sale | 2,001 | 2,001 | 2,001 | – | – | – | – | |||||||||||||||||||||
| Total assets | 676,689 | 657,119 | 540,189 | 63,108 | 10,216 | 96,678 | 12,098 | |||||||||||||||||||||
| Liabilities | ||||||||||||||||||||||||||||
| Financial liabilities held for trading(2) | 80,774 | 81,140 | – | 36,647 | – | 81,140 | – | |||||||||||||||||||||
| Financial liabilities designated at fair value through profit or loss | 6,993 | 2,858 | – | – | – | – | 2,858 | |||||||||||||||||||||
| Financial liabilities at amortized cost | 509,185 | 504,968 | – | 6,177 | – | – | 498,791 | |||||||||||||||||||||
| Hedging derivatives | 2,680 | 2,468 | – | – | – | 2,468 | – | |||||||||||||||||||||
| Fair value changes of the hedged items in portfolio hedges of interest rate risk | – | – | – | – | – | – | – | |||||||||||||||||||||
| Liabilities under insurance contracts | 9,834 | – | – | – | – | – | – | |||||||||||||||||||||
| Provisions | 6,772 | 6,191 | 636 | – | – | – | 5,555 | |||||||||||||||||||||
| Tax liabilities(3) | 3,276 | 2,568 | 1,275 | – | – | 1,293 | ||||||||||||||||||||||
| Other liabilities | 4,301 | 4,228 | – | – | – | – | 4,228 | |||||||||||||||||||||
| Liabilities included in disposal groups classified as held for sale | – | – | – | – | – | – | – | |||||||||||||||||||||
| Total Liabilities | 623,814 | 604,420 | 1,910 | 42,824 | – | 83,608 | 512,725 | |||||||||||||||||||||
(1) For the purpose of the table, when a single item is associated with the capital requirements according to more than one risk framework, it is showed in all the columns corresponding to the capital requirements to which it is associated. As a result, the sum of the values of the columns by type of risk may be greater than the carrying value according to the scope of regulatory consolidation
(2) Due to the new accounting classification of financial assets and liabilities after the introduction of IFRS9, SFTs have been reclassified out of financial assets and liabilities at amortized cost and into financial assets and liabilities measured at fair value held for trading (Note 2.2.1 of the Group’s Consolidated Annual Financial Statements)
(3) Deferred tax assets amount to 3,004 Million Euros, which deducted from deferred tax liabilities (article 38 of CRR), consume 250% RWAs, according to Article 48 of CRR
(4) The amount of other assets includes 2,032 million Euros corresponding to Insurance or reinsurance assets are not subject to capital requirements
A table summarizing the main sources of the differences between the amount of exposure in regulatory terms (EAD) and the book balances according to the Financial Statements is presented below.
TABLE 4: EU LI2 - Main sources of the differences between the regulatory exposure amounts and the carrying values in financial statements
| Million Euros | ||||||||||||||||||||
| Items subject to: | ||||||||||||||||||||
| Total | Credit risk framework | Counterparty credit risk framework | Securitisation framework | Market risk framework | ||||||||||||||||
| Asset carrying value amount under scope of regulatory consolidation | 710,191 | 540,189 | 63,108 | 10,216 | 96,678 | |||||||||||||||
| Liabilities carrying value amount under regulatory scope of consolidation | 124,521 | (1,910) | 42,824 | – | 83,608 | |||||||||||||||
| Total net amount under regulatory scope of consolidation | (135,472) | 59,860 | (14,835) | (211) | (180,286) | |||||||||||||||
| Amount ofoff-balance-sheet | 179,826 | 179,826 | – | – | – | |||||||||||||||
| Counterparty risk in derivatives (includes theadd-on) | 14,280 | – | 14,280 | – | – | |||||||||||||||
| Differences due to netting standards (netting, long/short positions) | (212,814) | (3,413) | (29,116) | – | (180,286) | |||||||||||||||
| Accounting Provisions(1) | 4,898 | 4, 898 | – | – | – | |||||||||||||||
| Corresponding amount of credit risk mitigation techniques (CRM) | (1,076) | (865) | (211) | – | ||||||||||||||||
| Corresponding amount of credit conversion factors (CCF) | (120,955) | (120,955) | – | – | – | |||||||||||||||
| Other | 369 | 369 | – | – | – | |||||||||||||||
| Exposure amounts considered for regulatory purposes | 699,240 | 598,139 | 91,096 | 10,005 | – | |||||||||||||||
(1) Includes provisions for exposures to credit risk via advanced method. The provisions of the credit risk exposures via standard method amounting to 8,022 million euros are not included.
| 34 |
Table of Contents
The following table breaks down the credit risk and counterparty amounts by the items of the Public Balance Sheet by exposure and risk-weighted assets.
TABLE 5: Credit and counterparty risk headings of the Public Balance Sheet for OE, EAD and RWAs
| Million Euros | ||||||||||||
| Credit Risk(4) | ||||||||||||
| Public Balance Sheet Headings | OE (1) | EAD (2) | RWAs (3) | |||||||||
| Cash, cash balances at central banks and other demand deposits | 58,296 | 58, 296 | 4,080 | |||||||||
| Financial assets held for trading | 54,151 | 49,613 | 7,674 | |||||||||
| Financial assets designated at fair value through profit or loss | 2, 618 | 2,618 | 1,713 | |||||||||
| Available-for-sale assets | 41,148 | 40,229 | 7,585 | |||||||||
| Loans and receivables | 603,097 | 468,833 | 232,534 | |||||||||
| Investments in subsidiaries, joint ventures and associates | 3, 972 | 3,972 | 10,336 | |||||||||
| Tangible assets | 6, 940 | 6,940 | 6,931 | |||||||||
| Tax assets | 14,984 | 14,984 | 16,920 | |||||||||
| Other assets | 4,755 | 4,749 | 4,005 | |||||||||
| Non-current assets and disposal groups held for sale | 2, 001 | 2,001 | 1,698 | |||||||||
| Assets sold under a purchase agreement | 40,869 | 47,005 | 3,328 | |||||||||
| Total Assets + Liabilities | 832,830 | 699,240 | 296,805 | |||||||||
(1) OE: Original Exposure
(2) EAD: OE net of provisions, adjustments and CRM
(3) RWAs: EAD after taking into account risk-weights
(4) Excluding funds for CCP defaults
| 35 |
Table of Contents
| 1.1.4. | Main changes to the Group’s scope of consolidation in 2018 |
Ongoing divestments
Sale of BBVA, S.A.‘s stake in BBVA Chile
On November 28, 2017, BBVA received a binding offer (the “Offer”) from The Bank of Nova Scotia group (“Scotiabank”) to buy its shareholding in Banco Bilbao Vizcaya Argentaria Chile, S.A. (“BBVA Chile”) as well as in other Group companies in Chile with activities related to the mentioned banking business (including, BBVA Seguros Vida, S.A.). BBVA’s total direct and indirect share in BBVA Chile is approximately 68.19% of its share capital. On December 5, 2017, BBVA announced the acceptance of the Offer and signed the sale agreement, which was completed on July 6, 2018.
The total amount in cash was approximately 2.2 billion USD, with a net capital gain of 633 million EUR, recorded in the year 2018.
Agreement for the creation of a joint venture and transfer of the real-estate business in Spain
On November 29, 2017, BBVA reached an agreement with a subsidiary of Cerberus Capital Management, L.P. (“Cerberus”), for the creation of a joint venture to which it will transfer BBVA’s real-estate business in Spain (the “Business”).
The Business includes: (i) foreclosed real-estate owned (hereinafter, the “REOs”), for a
gross value of approximately€13 billion, based on a starting point of the situation of the REOs as of June 26, 2017; and (ii) the assets and employees needed for the autonomous management of the Business. For the purpose of the agreement with Cerberus, the whole Business has been valued at approximately€5 billion.
On October 10, 2018, once all mandatory authorisations were obtained, the transfer of the real estate business of BBVA in Spain was finalised. The transaction closing led to the sale of 80% of the share capital of the company Divarian Propiedad, S.A. to an entity managed by Cerberus.
Divarian is the company to which the BBVA Group previously provided contributions to, although the effective transfer of certain REOs is subject to compliance with certain conditions. The final amount to be paid by Cerberus will be adjusted according to the REOs that are finally contributed.
The transaction does not have a significant effect on the attributable profit of the BBVA Group, nor on Common Equity Tier 1 (fully loaded) as of December 31, 2018.
| 36 |
Table of Contents
| 1.2. | Identification of dependent institutions with capital resources below the minimum requirement. Possible impediments to capital transfer |
As of December, 31, 2018, there is no institution in the Group with own funds below the regulatory minimum requirement.
The Group operates mainly in Spain, Mexico, the United States, Turkey and South America. The Group’s banking subsidiaries around the world are subject to supervision and regulation (with respect to issues such as compliance with a minimum level of regulatory capital) by a number of regulatory bodies.
The obligation to comply with these capital requirements may affect the capacity of these banking subsidiaries to transfer funds (e.g. via dividends) to the parent company.
In some jurisdictions in which the Group operates, the regulations lay down that dividends may only be paid with the funds available by regulation for this purpose.
| 1.3. | Exemptions from capital requirements at the individual or sub-consolidated level |
In accordance with the exemption from capital requirements compliance for Spanish credit institutions belonging to a consolidated group (at individual or subconsolidated level) established in the CRR, the Group obtained exemption from the supervisor on December 30, 2009 for the following companies (this exemption was ratified through ECB decision 1024/2013):
| · | Banco Industrial de Bilbao, S.A. |
| · | Banco Occidental, S.A. |
In addition, for Establecimiento Financiero de Crédito de Portugal (BBVA IFIC, S.A.), the BCE has decided not to apply individual prudential or liquidity requirements.
Moreover, Banco Bilbao Vizcaya Argentaria Portugal S.A. has been merged by absorption by BBVA S.A., and it will continue operating in Portugal through a branch. As a result of this merger, BBVA Portugal S.A. ceases to have legal personality and, therefore, is not subject to supervision.
| 37 |
Table of Contents
| 2. | Own funds and Capital |
| 2.1. | Characteristics of the eligible capital resources |
| 2.2. | Amount of capital |
| 2.3. | IFRS9 Transitional Arrangements |
| 2.4. | Bank risk profile |
| 2.5. | Breakdown of minimum capital requirements by risk type |
| 2.6. | Procedure employed in the internal capital adequacy assessment process |
| 2.1. | Characteristics of the eligible capital resources |
The following are considered for the purpose of calculating the minimum capital requirements under the solvency regulations: the elements and instruments corresponding to Tier 1 capital, which is defined as the sum of Common Equity Tier 1 capital (CET1) and additional Tier 1 capital (AT1), as defined in Part Two, Title I, Chapters I to III of the CRR, as well as their corresponding deductions, in accordance with articles 36 and 56, respectively.
Also considered are the elements of Tier 2 capital defined in Part Two of Chapter IV, section I of the CRR. The deductions defined as such in section II of the same Chapter are also considered.
In line with the stipulations of the solvency regulation, Common Equity Tier 1 capital essentially comprises the following elements:
| a) | Capital and share premium: this includes the elements described in article 26 section 1, articles 27, 28 and 29 of the CRR and the EBA list referred to in article 26 section 3 of the CRR. |
| b) | Accumulated gains, other reserves and other equity: in accordance with article 26. 1 c), the gains that may be used immediately and with no restriction to hedge any risks or losses are included. |
| c) | Other accumulated income: in accordance with article 26. 1, d), under this heading will be classified mainly the exchange-rate differences and the valuation adjustments associated with the financial assets at fair value through accumulated other comprehensive income portfolio. |
| d) | Minority shareholdings: includes the sum of Common Equity 1 capital instruments of a subsidiary that arise in the process of its global consolidation and are attributable to natural or legal third persons, according to article 84 and subsequent articles of CRR. |
| e) | Provisional benefits: the independently verified benefits are included, net of any possible expense or foreseeable dividend previously authorized by the supervisor (following the treatment provided for in Article 5 of Decision (EU) 2015/656 of the ECB. |
Capital is, moreover, adjusted mainly through the following deductions:
| f) | Additional value adjustments: the adjustments originated by the prudent valuation of the positions at fair value are included, as set out in article 105 of the CRR. |
| 38 |
Table of Contents
| g) | Intangible assets: these are included net of the corresponding tax liabilities, as set out in article 36, section 1, letter b) and article 37 of the CRR. It mainly includes goodwill, software and other intangible assets. |
| h) | Deferred tax assets: these are understood to be assets for deferred taxes that depend on future returns, excluding those deriving from temporary differences (net of the corresponding tax liabilities when the conditions established in article 38.3 of the CRR are met), as per article 36.1 c) and article 38 of the CRR, mainly loss carryforwards (LCFs). |
The application of the deduction of deferred tax assets (LCFs) will be carried out progressively during a transitional period that ends in December 2018, as established under current regulation.
| i) | Reserves at fair value connected to losses or gains by cash flow hedging: includes value adjustments of cash flow hedging of financial instruments not valued at fair value, including expected cash flows in accordance with article 33 a) of the CRR. |
| j) | Expected losses versus credit risk adjustments in the advanced model: the losses arising from the calculation of risk-weighted exposures through the method based on internal ratings are included, as set out in article 36.1 d) of the CRR. |
| k) | Profit or losses at fair value: these are derived from the entity’s credit risk itself, in accordance with article 33 b) of the CRR. |
| l) | Direct and indirect holdings of own instruments (treasury stock): includes the shares and other securities booked as own funds that are held by any of the Group’s consolidated entities, together with those held bynon-consolidated entities belonging to the economic Group, as set out in article 33. 1 f) and article 42 of the CRR. It mainly includes finance for own shares, synthetic treasury stock and own securities. |
| m) | Securitisation: securitisations that receive a risk weighting of 1,250% are included, as set out in article 36.1 k) ii) of the CRR. |
| n) | Transitional Common Equity Tier 1 capital: considered as such are unrealized fair value gains and losses, in accordance with articles 467 and 468 of the CRR, as well as all the fair value gains and losses arising from the institution’s own credit risk related to derivative liabilities (DVA) under article 33 c). |
| o) | Qualifying deductions of common equity Tier 1: this includes the deductions that exceed the additional Tier 1 capital, as described in article 36.1 b) of the CRR. |
Additionally, as detailed in the “Regulatory Environment” section, the Entity has decided to apply the transitional arrangements to mitigate the impact on equity of the introduction of IFRS 9, which allows the impact to be recognized progressively during a transitional period of 5 years (2018-2022).
Other deductions that may be applicable are significant stakes in financial institutions and assets for deferred taxes arising from temporary differences that exceed the 10% limit of the CET1, and the deduction for exceeding the overall 17.65% limit of the CET1 according to article 48.2 of the CRR.
As of 31 December 2018, the Group no longer holds interests in financial entities that are not subject to deduction for exceeding the indicated limits (article 49 of the CRR) and, therefore, the standard template of the EBA INS1 shall not be applicable.
| 39 |
Table of Contents
In addition, the Group includes as total eligible capital the additional Tier 1 capital instruments defined in article 51, 85 and 484 of the CRR, including the corresponding adjustments, in accordance with article 472 of the CRR:
| p) | Equity instruments and issue premiums classified as liabilities: this heading includes the perpetual contingent convertible securities that meet the conditions set out in article 51 and 52.1 of the CRR. |
| q) | Elements referred to in article 484.4 of the CRR: this section includes the preferred securities issued by the Group. |
| r) | Qualifying Tier 1 capital included in the consolidated additional capital issued by affiliates and held by third parties: included as additional consolidated Tier 1 capital is the amount of Tier 1 capital from the subsidiaries, calculated in accordance with article 85 of the CRR. |
| s) | Temporary adjustments of additional Tier 1 capital: this includes the adjustments considered in article 472 of the CRR as measures established for gradual adoption of the new capital ratios. |
Finally, the Group also includes Tier 2 as eligible capital. Combined with what is indicated in Article 87 of the CRR, it is made up of the following elements:
| t) | Equity instruments and Tier 2 share premiums: understood as the funding that, for credit seniority purposes, comes behind all the common creditors. The issues, moreover, have to fulfil a number of conditions which are laid out in article 63 of the CRR. |
| u) | Amounts of the eligible elements, under article 484: Tier 2 capital includes the subordinated debt received by the Group that does not meet the conditions set out in article 63 of the CRR, but is acceptable in the transitional regulatory capital under article 484 of the CRR. |
| v) | Qualifying capital instruments included in the consolidated Tier 2 capital issued by subsidiaries and held by third parties: these instruments are included under articles 87 and 88 of the CRR. |
| w) | Adjustment for credit risk: a calculation is made of the surplus resulting between the allowances for impairment losses on assets and provisions for risks related to exposures calculated as per the IRB Approach on the expected losses, for the part that is below 0.6% of the risk-weighted exposures calculated according to this method. |
The Annex available on the Group’s website presents the Group’s issuance of perpetual contingent convertible securities and issuance of preference shares, which as explained above, form part of additional Tier 1 capital.
This Annex also details the Group’s issues of subordinated debt as of December 31, 2018, calculated as Tier 2 capital.
| 40 |
Table of Contents
| 2.2. | Amount of capital |
The table below shows the amount of total eligible capital, net of deductions, for the different items making up the capital base as of December 31, 2018 and December 31, 2017, in accordance with the disclosure requirements for information relating to temporary capital set out by Implementing Regulation (EU) No. 1423/2013 of the Commission dated December 20, 2013:
TABLE 6: Amount of capital (CC1)
| Million Euros | ||||||||||
| Reference to template CC2(1) | 12-31-2018 | 12-31-2017 | ||||||||
| a) | Capital and share premium | 27,259 | 27,259 | |||||||
| b) | Retained earnings, other reserves and other equity(2) | 23,857 | 25,511 | |||||||
| c) | Other accumulated earnings | (7,285) | (8,717) | |||||||
| d) | Minority interests | 3, 809 | 5, 446 | |||||||
| e) | Net interim attributable profit | 3,246 | 1,436 | |||||||
| Ordinary Tier 1 Capital before other reglamentary adjustments | 50,887 | 50,935 | ||||||||
| f) | Additional value adjustments | (356) | (332) | |||||||
| g) | Intangible assets | (8,199) | (6,627) | |||||||
| h) | Deferred tax assets | (1,260) | (755) | |||||||
| i) | Fair value reserves related to gains o losses on cash flow hedges | 35 | (193) | |||||||
| j) | Expected losses in equity | – | (2 0) | |||||||
| k) | Profit or losses on liabilities measured at fair value | (116) | – | |||||||
| l) | Direct and indirect holdings of own instruments | (432) | (278) | |||||||
| m) | Securitisations tranches at 1250% | (34) | (39) | |||||||
| n) | Temporary CET1 adjustments | (150) | (324) | |||||||
| o) | Admisible CET1 deductions | (61) | (26) | |||||||
| Total Common Equity Tier 1 regulatory adjustments | (10,573) | (8,594) | ||||||||
| Common Equity Tier 1 (CET1) | 40,313 | 42,341 | ||||||||
| p) | Equity instruments and share premium classified as liabilities | 4,863 | 5,751 | |||||||
| q) | Items referred in Article 486 (4) of the CRR | 142 | 142 | |||||||
| r) | Qualifying Tier 1 capital included in consolidated AT1 capital | |||||||||
| (including minority interests not included in row d) issued by subsidiaries and held by third parties) | 629 | 403 | ||||||||
| Additional Tier 1 before reglamentary adjustments | 5,634 | 6,296 | ||||||||
| s) | Temporary adjustments Tier 1 | – | (1,657) | |||||||
| Total reglamentary adjustments of Additional Tier 1 | – | (1,657) | ||||||||
| Additional Tier 1 (AT1) | 5,634 | 4,639 | ||||||||
| Tier 1 (Common Equity Tier 1+Additional Tier 1) | 45,947 | 46,980 | ||||||||
| t) | Equity instruments and share premium | 3,768 | 1,759 | |||||||
| u) | Amount of the admissible items, pursuant to Article 486 | – | – | |||||||
| v) | Admissible shareholders’ funds instruments included in consolidated | 4,409 | 6,438 | |||||||
| Tier 2 issued by subsidiaries and held by third parties | ||||||||||
| -Of which: instruments issued by subsidiaries subject to ex-subsidiary stage | 37 | 317 | ||||||||
| w) | Credit risk adjustments | 579 | 601 | |||||||
| Tier 2 | before reglamentary adjustments | 8,756 | 8,798 | |||||||
| Tier 2 | reglamentary adjustments | – | – | |||||||
| Tier 2 | 8,756 | 8,798 | ||||||||
| Total Capital (Total capital = Tier 1 + Tier 2) | 54,703 | 55,778 | ||||||||
| Total RWA’s | 348,264 | 362,875 | ||||||||
| GET 1 | (phased-in) | 11.6% | 11.7% | |||||||
| CET 1 | (fully loaded) | 11.3% | 11.0% | |||||||
| TIER 1 | (phased-in) | 13.2% | 12.9% | |||||||
| TIER 1 | (fully loaded) | 12.9% | 12.8% | |||||||
| Total Capital(phased-in) | 15.7% | 15.4% | ||||||||
| Total Capital (fully loaded) | 15.5% | 15.1% | ||||||||
(1) Reference to regulatory balance sheet headings (CC2), where the different entries were reflected
(2) With the aim of enhance the robustness of the consolidated financial statements, as of December, 31, 2018, the Group has made an accounting policy change that consists in the record on a sole accounting entry of “Retained earnings”, of both the booking entries for the reevaluation of monetary assets due to hyperinflation effects, and of the conversion differences generated in the translation of the public statements of the subsidiaries in hyperinflationary economies.
Both impacts were being previously recorded in “Other Comprehensive Income”. The Group has made this change on accounting policies since, according to NIC8, it provides more reliable and relevant information about the hyperinflationary economies. For more information, see note 1.3 of the Consolidated Financial Statements as of 2018.
As of December 31, 2018, the Tier 1phased-in Capital (CET1) stood at 11.6% (the fully loaded ratio was 11.3%). Excluding the phasing calendar effect in the computability of
| 41 |
Table of Contents
minority interests and deductions –which increases from 80% in 2017 to 100% in the year 2018–, and including the positive impact of the sale of the BBVA Chile share (+50 basis points), thephased-in CET1 ratio increased by +48 basis points, marked by the generation of the net result of payment of dividends and instruments AT1 payments, and a contained evolution of risk-weighted assets.
Additionally, thephased-in CET1 ratio takes into account the impact of the first implementation of the IFRS 9 standard. In this context, the European Commission and Parliament have established temporary arrangements that are voluntary for the institutions, adapting the impact of IFRS 9 on capital adequacy ratios. The Group has informed the supervisory body of its adherence to these arrangements.
Additionally, transfer of BBVA’s real estate business in Spain to Cerberus had no material impact on the ratio (check section 1.1.4.).
At the Tier 1 level, thephased-in ratio is 13.2%, standing out the computation of two new issues of preferred shares, potentially convertible into ordinary shares (CoCos), rated as Additional Tier 1 for an amount of 1 billion USD and 1 billion EUR, respectively. Likewise, 1.5 billion USD issue of AT1, which was cancelled early in May, and another for 1.5 billion euros, for which BBVA announced in January 2019 that it will exercise the early redemption option have been stopped from being computed. The net impact of these emissions on thephased-in Tier 1 capital ratio is-26 basis points.
At the Tier 2 level, the Group received authorization in the third quarter from the regulator for the calculation of a subordinated issue of 300 million dollars made in May and the cancellation of the issues made by BBVA Chile after the sale of the share in this entity. The totalphased-in ratio is 15.7%, taking into account the effects mentioned above.
Additionally, the Group has continued with its program to fulfil with MREL requirements by closing two public issues ofnon-preferred senior debt, for a total of 2.5 billion EUR. In terms of MREL (minimum requirement for own funds and eligibility liabilities), as of January 1, 2020, the requirement that BBVA must reach shall be a volume of equity and eligible liabilities corresponding to 15.08% of the total liabilities and equity of its resolution group (BBVA S.A. and its subsidiaries, which belong to the same European resolution group), with data as of December 31, 2016 (28.04% expressed in RWA terms). The Group is currently in line with this MREL requirement.
CHART 2: Fully loaded CET1 ratio by year
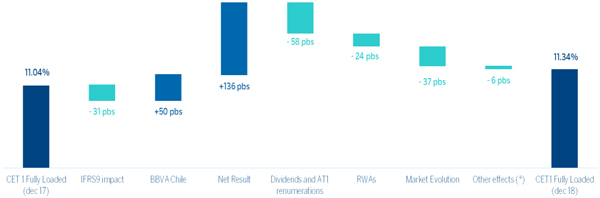
| (1) | Other effects mainly include the variation on eligible minority interests and other regulatory deductions. |
These capital levels are above the requirements established by the ECB in its SREP letter and the systemic buffers applicable to BBVA Group for the CET1 ratio in 2018.
On the other hand, risk-weighted assets (RWA) decreased during the year, mainly due to the sale of BBVA Chile and the depreciation of currencies against the euro. The Group has
| 42 |
Table of Contents
performed three securitisations during the year, including one traditional in June, of a portfolio of consumer finance automobiles loans for an amount of 800 million euros and two other synthetic ones in March and December, for which the European Investment Fund (EIF, a subsidiary of the European Investment Bank) granted a financial guarantee. The positive impact of the three securitisations on capital via the release of risk-weighted assets was 971 million euros. In addition, during the first semester, BBVA received authorisation from the European Central Bank (ECB) to update the calculation of the RWA for structural exchange rate risk under the standard model.
Annex III, available on the Group’s website, shows the features of the main capital instruments, in accordance with Implementing Regulation (EU) No. 1423/2013 of the Commission dated December 20, 2013.
The process followed is shown below, the process following for, based on the shareholders’ equity reported in the Group’s Consolidated Annual Report and by applying the deductions and adjustments shown in the table below, the regulatory capital figure eligible for solvency purposes is arrived at:
TABLE 7: Reconciliation of the Public Balance Sheet from the accounting perimeter to the regulatory perimeter
Million Euros
| ||||||||
| Eligible capital own funds | 12/31/2018 | 12/31/2017 | ||||||
| Capital | 3,267 | 3,267 | ||||||
| Share premium | 23,992 | 23,992 | ||||||
| Retained earnings, revaluation reserves and other reserves | 22,963 | 25,443 | ||||||
| Other equity | 50 | 54 | ||||||
| Less: Treasuy shares | (296) | (96) | ||||||
| Profit or loss attributable to owners of the parent | 5,324 | 3,519 | ||||||
| Less: dividend | (975) | (1,043) | ||||||
| Shareholders’ equity | 54,326 | 55,136 | ||||||
| Accumulated other comprehensive income (Loss) | (7,215) | (8,792) | ||||||
| Minority interests(Non-controlling interest) | 5,764 | 6,979 | ||||||
| Total equity | 52,874 | 53,323 | ||||||
| Intangible assets | (8,199) | (6,627) | ||||||
| Financing holdings of CET1 | (27) | (48) | ||||||
| Indirect holdings of CET1 | (109) | (134) | ||||||
| Deductions | (8,335) | (6,809) | ||||||
| Temporary CET 1 adjustments | - | (273) | ||||||
| Capital gains from theAvailable-for-sale debt instruments portfolio | - | (256) | ||||||
| Capital gains from theAvailable-for-sale equity portfolio | - | (17) | ||||||
| Differences from solvency and accounting level | (176) | (189) | ||||||
| Equity not eligible at solvency level | (176) | (462) | ||||||
| Other adjustments and deductions | (4,049) | (3,711) | ||||||
| Common Equity Tier1 (CET1) | 40,313 | 42,341 | ||||||
| Additional Tier1 before Regulatory Adjustments | 5,634 | 6,296 | ||||||
| Total Regulatory Adjustments of Aditional Tier 1 | - | (1,657) | ||||||
| Tier 1 | 45,947 | 46,980 | ||||||
| Tier 2 | 8,756 | 8,798 | ||||||
| Total Capital (Tier 1 + Tier 2) | 54,703 | 55,778 | ||||||
| Total Minimum equity required(1) | 41,619 | 40,370 | ||||||
(1) Calculated over the minimum total capital applicable at each period
| 43 |
Table of Contents
| 2.3. | IFRS9 Transitional Arrangements |
Following the guidelines of the EBA (EBA/GL/2018/01), the following is a summary of own funds, principal capital ratios, leverage ratio with and without the application of the transitional provisions of IFRS 9 or ECL analogous.
TABLE 8.IFRS9-FL: Summary of the own funds, main capital and leverage ratios with and without the application of IFRS9 transitional arrangements or similar Expected Credit Losses (ECL)
Million euros
| ||||||||||||||||
| Own funds (million euros) | 12-31-2018 | 09-30-2018(1) | 06-30-2018 | 03-31-2018 | ||||||||||||
| CET1 Capital | 40,313 | 38,995 | 39,550 | 39,858 | ||||||||||||
| CET1 Capital without IFRS9 transitional arrangement or similar ECL | 39,449 | 38,131 | 38,685 | 38,753 | ||||||||||||
| Tier 1 Capital (T1) | 45,947 | 45,098 | 45,717 | 45,987 | ||||||||||||
| Tier 1 Capital (T1) without IFRS9 transitional arrangement or similar ECL | 45,083 | 44,233 | 44,852 | 44,882 | ||||||||||||
| Total Capital | 54,703 | 53,933 | 54,958 | 54,384 | ||||||||||||
| Total Capital without IFRS9 transitional arrangement or similar ECL | 53,839 | 53,069 | 54,094 | 53,276 | ||||||||||||
| Risk-weighted assets (million euros) | ||||||||||||||||
| Total Risk-weighted assets | 348,264 | 343,053 | 356,887 | 358,941 | ||||||||||||
Total Risk-weighted assets without IFRS9 transitional arrangement or similar ECL
|
| 348,804
|
|
| 343,272
|
|
| 357,107
|
|
| 358,262
|
| ||||
| Capital ratio | ||||||||||||||||
| CET1 Capital (as a percentage of total exposure to risk) | 11.6% | 11.4% | 11.1% | 11.1% | ||||||||||||
| CET1 Capital (as a percentage of total exposure to risk) without IFRS9 transitional arrangement or similar ECL | 11.3% | 11.1% | 10.8% | 10.8% | ||||||||||||
| Tier 1 Capital (T1) (as a percentage of total exposure to risk) | 13.2% | 13.1% | 12.8% | 12.8% | ||||||||||||
| Tier 1 Capital (T1) (as a percentage of total exposure to risk) without IFRS9 transitional arrangement or similar ECL | 12.9% | 12.9% | 12.6% | 12.5% | ||||||||||||
| Total Capital (as a percentage of total exposure to risk) | 15.7% | 15.7% | 15.4% | 15.2% | ||||||||||||
| Total Capital (as a percentage of total exposure to risk) without IFRS9 transitional arrangement or similar ECL | 15.4% | 15.5% | 15.1% | 14.9% | ||||||||||||
| Leverage Ratio | ||||||||||||||||
| Total exposure related to leverage ratio | 705,299 | 690,607 | 711,046 | 707,638 | ||||||||||||
| Leverage Ratio | 6.5% | 6.5% | 6.4% | 6.5% | ||||||||||||
| Leverage ratio without 1FRS9 transitional arrangements or similar ECL | 6.4% | 6.4% | 6.3% | 6.3% | ||||||||||||
(1) The application of article 5 of Decision (EU) 2015/656 of the European Central Bank of 4 February, 2015, implies the inclusion of a dividend of€2,142 million which is the outcome of applying thepay-out ratio of 2017 to the interim profits of September 30, 2018, instead of€1,476 million that reflects the shareholders remuneration’s policy announced by BBVA Group.
Applying the pay-out announced by the Group, the phased-in CET1 ratio as of September 2018 comes to 11.6% (11.3% fully loaded)
| 44 |
Table of Contents
| 2.4. | Bank risk profile |
BBVA Group has a general Risk Management and Control Model (hereinafter, the “Model”) adapted to its business model, organization and the geographic areas in which it operates. It allows it to operate within the framework of the control and risk management strategy defined by the Bank’s company bodies and adapt to an economic and regulatory environment, addressing management globally and adapted to the circumstances at any particular time. The Model establishes a system of risk management that is adapted to the entity’s risk profile and strategy.
The risks inherent in the business that make up the risk profile of BBVA Group are as follows:
| · | Credit and dilution risk: credit risk arises from the probability that one party to a financial instrument will fail to meet its contractual obligations for reasons of insolvency or inability to pay and cause a financial loss for the other party. This includes counterparty risk, issuer credit risk, liquidation risk and country risk. |
| · | Counterparty risk: the credit risk corresponding to derivative instruments, repurchase and resale transactions, securities or commodities lending or borrowing transactions and deferred settlement transactions. |
| · | Credit valuation adjustment (CVA) risk: Its aim is to reflect the impact on the fair value of the counterparty’s credit risk, resulting from OTC derivative instruments that are not credit derivatives recognized for the purpose of reducing the amount of credit exposures. |
| · | Market risk: Market risk originates in the possibility that there may be losses in the value of positions held due to movements in the market variables that affect the valuation of financial products and assets in trading activity (trading portfolio). This includes risk with respect to the position in debt and equity instruments, exchange rate risk and commodity risk. |
| · | Operational risk: the risk which can cause of losses due to human errors, inadequate or defective internal processes, inadequate conduct towards customers or markets, failures, interruptions or deficiencies of systems or communications, inadequate management of data, legal risks and, finally, as a consequence of external events, including cyberattacks, fraud committed by third parties, disasters and poor service provided by suppliers. This definition includes legal risk, but excludes strategic and/or business risk and reputational risk. |
| · | Structural risks: these are divided into structural interest-rate risk (movements in interest rates that cause alterations in an entity’s net interest income and equity value) and structural exchange-rate risk (exposure to variations in exchange rates originating in the Group’s foreign companies and in the provision of funds to foreign branches financed in a different currency from that of the investment). |
| · | Liquidity risk: risk of an entity having difficulties in duly meeting its payment commitments, and where it does not have to resort to funding under burdensome terms, which may harm the Group’s image or reputation. |
| · | Reputational risk: considered to be the potential loss in earnings as a result of events that may negatively affect the perception of the Group’s different stakeholders. |
| 45 |
Table of Contents
The chart below shows the total risk-weighted assets broken down by type of risk (where the credit risk encompasses the counterparty risk) as of December 31, 2018 and December 31, 2017:
CHART 3: Distribution of RWAs by risk type under Pillar I
|
|
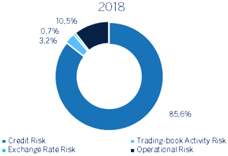
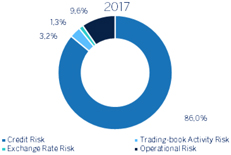
(*) Credit Risk includes Risk by CVA adjustment
| 46 |
Table of Contents
| 2.5. | Breakdown of minimum capital requirements by risk type |
In this section, an overview of risk weighted assets and capital requirements in accordance with article 92 of the CRR are shown.
The total for capital requirements are shown below, broken down by type of risk as of December 31, 2018 and December 31, 2017.
TABLE 9: EU OV1 - Overview of RWAs
| Million Euros | ||||||||||||
| RWA(1) | Minimum Capital (3) | |||||||||||
| 12-31-2018 | 12-31-2017 | 12-31-2018 | ||||||||||
| Credit Risk (excluding CCR) | 274,256 | 286,368 | 21,940 | |||||||||
| Of which the standardised approach(4) | 188,158 | 198,715 | 15,053 | |||||||||
| Of which the foundation IRB (FIRB) approach (6) | 5,421 | 7021 | 433.68 | |||||||||
| Of which the advanced IRB (AIRB) approach | 77,733 | 76,556 | 6,219 | |||||||||
| Of which equity IRB under the simple risk-weighted approach(5) | 2,944 | 4,076 | 235 | |||||||||
| CCR | 8,483 | 9,459 | 679 | |||||||||
| Of which mark to market | 7,065 | 7,844 | 565 | |||||||||
| Of which original exposure | 0 | - | - | |||||||||
| Of which the standardised approach | 0 | - | - | |||||||||
| Of which the Internal model method (IMM) | 0 | - | - | |||||||||
| Of which risk exposure amount for contributions to the default fund of a CCP | 41 | 49 | 3 | |||||||||
| Of which CVA | 1,377 | 1,566 | 110 | |||||||||
| Settlement Risk | - | - | - | |||||||||
| Securitisation exposures in the banking book (after the cap) | 2,623 | 1,751 | 210 | |||||||||
| Of which IRB approach | 1673 | 827 | 134 | |||||||||
| Of which IRB supervisory formula approach (SFA) | 0 | - | - | |||||||||
| Of which internal assessment approach (IAA) | 0 | - | - | |||||||||
| Of which standardised approach | 950 | 924 | 76 | |||||||||
| Market Risk | 13,316 | 16,018 | 1,065 | |||||||||
| Of which the standardised approach | 5,048 | 7,408 | 404 | |||||||||
| Of which IMA | 8,268 | 8,611 | 661 | |||||||||
| Operational Risk | 36,725 | 34,755 | 2,938 | |||||||||
| Of which basic indicator approach | 5,908 | 6,204 | 473 | |||||||||
| Of which the standardised approach | 9,341 | 10,102 | 747 | |||||||||
| Of which IRB approach | 21,476 | 18,449 | 1,718 | |||||||||
| Amounts below the thresholds for deduction (subject to 250% risk weight) | 12,862 | 14,525 | 1,029 | |||||||||
| Floor Adjustment | - | - | - | |||||||||
| Total | 348,264 | 362,875 | 27,861 | |||||||||
(1) Risk-weighted assets according to the transitional period (phased-in).
(2) Calculated on the total capital requirement of 8% (Article 92 CRR).
(3) Under CET 1 requirements (8.4504%) after the supervisory evaluation process (SREP), the requirements amount to EUR 29.43 billion. Under Total Capital requirements (11.9504%), the requirements amount to EUR 41.62 billion.
(4) Deferred tax assets arising from temporary differences, which are not deducted from own funds (subject to a risk weight of 250%) are excluded, in accordance with Article 48.4 CRR. This amount is up to EUR 6,549 million and EUR 6,778 million at 31 December 2018 and 31 December 2017, respectively.
(5) Equity, calculated under the simple risk-weighted approach and internal model method, is included. Significant investments in financial sector entities and insurers that are not deducted from eligible own funds (subject to a risk weight of 250%) are excluded, in accordance with Article 48.4 CRR. This amount rises to EUR 6,314 million and EUR 7,747 million as of 31 December 2018 and 31 December 2017, respectively.
(6) Exposures under the FIRB method correspond to Specialised Lending, for which the Group has opted for the method of supervisory slotting criteria, in line with article 153.5 of CRR.
| 47 |
Table of Contents
The table below shows the risk-weighted assets broken down by risk and the capital requirements broken down by type of risk and categories of exposure, as of December 31 2018 and December 31 2017:
TABLE 10: Capital requirements by risk type and exposure class
| Million Euros | ||||||||||||||||
| Capital requirements(2) | RWA’s(1) | |||||||||||||||
| Exposure Class and risk type | 12-31-2018 | 12-31-2017 | 12-31-2018 | 12-31-2017 | ||||||||||||
| Credit Risk | 15,817 | 16,684 | 197,715 | 208,554 | ||||||||||||
| Central governments or central banks | 2, 445 | 2,381 | 30,560 | 29,759 | ||||||||||||
| Regional governments or local authorities | 113 | 100 | 1,416 | 1,252 | ||||||||||||
| Public sector entities | 57 | 52 | 714 | 654 | ||||||||||||
| Multilateral development banks | 1 | 1 | 10 | 14 | ||||||||||||
| International organisations | – | – | – | – | ||||||||||||
| Institutions | 496 | 463 | 6,203 | 5,793 | ||||||||||||
| Corporates | 7,159 | 7,328 | 89,481 | 91,600 | ||||||||||||
| Retail | 2, 941 | 3,134 | 36,768 | 39,177 | ||||||||||||
| Secured by mortgages on immovable property | 1,237 | 1,569 | 15,466 | 19,609 | ||||||||||||
| Exposures in default | 333 | 420 | 4,159 | 5,248 | ||||||||||||
| Exposures associated with particularly high risk | 132 | 296 | 1,652 | 3,694 | ||||||||||||
| Covered bonds | – | – | – | – | ||||||||||||
| Claims on institutions and corporates with a short-term credit assesment | 0 | 0 | 2 | 5 | ||||||||||||
| Collective investments undertakings | 5 | 2 | 57 | 24 | ||||||||||||
| Other exposures | 898 | 938 | 11,229 | 11,725 | ||||||||||||
| Securitisation exposures | 76 | 74 | 950 | 924 | ||||||||||||
| Securitisation exposures | 76 | 74 | 950 | 924 | ||||||||||||
| Total credit risk by standardised approach | 15,893 | 16,758 | 198,665 | 209,478 | ||||||||||||
| Credit Risk | 6,498 | 6,673 | 81,222 | 83,408 | ||||||||||||
| Central governments or central banks | 54 | 94 | 677 | 1,172 | ||||||||||||
| Institutions | 429 | 474 | 5,366 | 5,931 | ||||||||||||
| Corporates | 4, 441 | 4,531 | 55,513 | 56,643 | ||||||||||||
Of which: Specialised lending | 950 | 804 | 11,877 | 10,056 | ||||||||||||
Of which: SMEs | 506 | 646 | 6,330 | 8,077 | ||||||||||||
Of which: Others | 2, 984 | 3,081 | 37,305 | 38,510 | ||||||||||||
| Retail | 1,573 | 1,573 | 19,667 | 19,661 | ||||||||||||
Of which: Secured by real estate property | 591 | 661 | 7,385 | 8,268 | ||||||||||||
Of which: Qualifying revolving | 555 | 541 | 6,938 | 6,764 | ||||||||||||
Of which: Other SMEs | 140 | 129 | 1,752 | 1,612 | ||||||||||||
Of which: OtherNon-SMEs | 287 | 241 | 3,592 | 3,017 | ||||||||||||
| Equity | 1,220 | 1,342 | 15,246 | 16,775 | ||||||||||||
| On the basis of method: | ||||||||||||||||
Of which: Simple approach | 647 | 765 | 8,085 | 9,562 | ||||||||||||
Of which: PD/LGD approach | 479 | 396 | 5,989 | 4,953 | ||||||||||||
Of which: Intern models | 94 | 181 | 1,172 | 2,261 | ||||||||||||
| On the basis of nature: | ||||||||||||||||
Of which: Listed instruments | 439 | 433 | 5,493 | 5,412 | ||||||||||||
Of which: Not listed instruments in sufficiently diversified portfolios | 780 | 909 | 9,753 | 11,363 | ||||||||||||
| Securitisation exposures | 134 | 66 | 1,673 | 827 | ||||||||||||
| Securitisation exposures | 134 | 66 | 1,673 | 827 | ||||||||||||
| Total credit risk by irb approach | 7,851 | 8,081 | 98,141 | 101,009 | ||||||||||||
| Total contributions to the default fund of a ccp | 3 | 4 | 41 | 49 | ||||||||||||
| Total credit risk | 23,748 | 24,843 | 296,846 | 310,536 | ||||||||||||
| Settlement risk | – | – | – | – | ||||||||||||
| Standardised approach: | 222 | 226 | 2,776 | 2,829 | ||||||||||||
Of which: Price Risk by fixed income exposures | 155 | 197 | 1,940 | 2,461 | ||||||||||||
Of which: Price Risk by Securitisation exposures | 1 | 2 | 13 | 20 | ||||||||||||
Of which: Price Risk by correlation | 54 | 11 | 670 | 142 | ||||||||||||
Of which: Price Risk by stocks and shares | 11 | 16 | 136 | 197 | ||||||||||||
Of which: Commodities Risk | 1 | 1 | 18 | 9 | ||||||||||||
| IRB: Market Risk | 661 | 689 | 8,268 | 8,611 | ||||||||||||
| Total trading book risk | 884 | 915 | 11,044 | 11,439 | ||||||||||||
| Foreing exchange risk (standardised approach) | 182 | 366 | 2,271 | 4,579 | ||||||||||||
| CVA risk | 110 | 125 | 1,377 | 1,566 | ||||||||||||
| Operational risk | 2,938 | 2,780 | 36,725 | 34,755 | ||||||||||||
| Capital requirements | 27,861 | 29,030 | 348,264 | 362,875 | ||||||||||||
(1) Risk-weighted assets according to the transitional period(phased-in)
(2) Calculated on the total capital requirements of 8% (Article 92 CRR)
A breakdown of the percentage of RWAs calculated according to the standardised approach and advanced approach for each exposure class for credit, counterparty and securitisation risk is shown below.
| 48 |
Table of Contents
CHART 4: Breakdown of RWAs by exposure class and approach
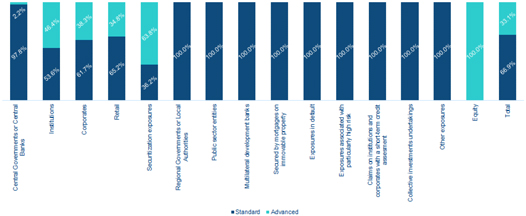
(1) Table 27 of the report sets out the models and portfolios authorized by the supervisor for the purpose of their use in calculating own funds.
(2) RWAs in the equity portfolio are calculated according to the methods indicated in article 155 of the CRR
| 49 |
Table of Contents
| 2.6. | Procedure employed in the internal capital adequacy assessment process |
The Group carries out the internal capital assessment process in accordance with the Capital Requirements Directive 2013/36/EU, in the ECB guide for the ICAAP process published on March 2018, and guidelines on collection of information relating to ICAAP for the purpose of the supervisory review and evaluation process (SREP) published by the European Banking Authority in February 2017.
As part of the internal capital assessment process, the Group assesses and quantifies all the risks that may significantly affect its capital position and extracts a conclusion on its capital adequacy from a holistic medium-term perspective.
The Group applies a proportionate approach that aims to ensure the bank’s survival and continuous compliance with all the legal and internal requirements. As well as the regulatory and accounting perspectives, the Group bases its analysis on its capital adequacy position in a sound internal approach that assesses its capital position from an economic point of view that integrates both the quantification of risk capital needs covered in the Basel Pillar I and the needs due to risks not included in it.
The following are some of the points are assessed within the internal capital adequacy assessment process:
| · | Business and strategy model, describing both the changes planned by the bank in the current business model and its underlying activities such as the relationship between the business strategy and internal capital adequacy assessment. |
| · | Internal governance, risk management and the control framework, reviewing the processes and mechanisms that ensure that the bank has a sound and integrated framework for managing present and future material risks. |
| · | Risk appetite framework, describing the correspondence between this framework and the bank’s business strategy and model. |
| · | Identification and assessment of risks (including credit, operational, market, liquidity and other asset and liability risks) and quantification of the capital necessary to cover them, with a quantitative reconciliation between the Pillar I and Pillar II approaches. |
| · | Planning of capital under baseline and stress scenarios, projecting the capital base of the Group, the parent and its main subsidiaries over the next three years and analysing capital sufficiency in accordance with the regulatory requirements and the internal objectives set out by the entity for the close of the period, also dealing with the planned capital actions. |
This internal capital adequacy assessment process concludes with submission to the supervisor of an annual report on the process. The report pays a key role in the review and evaluation methodology applied by the Single Supervisory Mechanism, and is an important element for determining capital requirements under Pillar II.
| 50 |
Table of Contents
| 3. | Risks |
| 3.1. | General Risk Management and Control Model |
| 3.1.1. | Governance and organization |
| 3.1.2. | Risk Appetite Framework |
| 3.1.3. | Decisions and processes |
| 3.1.4. | Assessment, monitoring and reporting |
| 3.1.5. | Infrastructure |
| 3.1.6. | Risk culture |
| 3.2. | Credit and counterparty risk |
| 3.2.1. | Scope and nature of the Credit Risk measurement and reporting systems for capital framework purposes |
| 3.2.2. | Definitions and accounting methodologies |
| 3.2.3. | Information on credit risks |
| 3.2.4. | Information on the standardized approach |
| 3.2.5. | Information on the IRB approach |
| 3.2.6. | Information on counterparty risk |
| 3.2.7. | Information on securitisations |
| 3.2.8. | Risk protection and reduction policies. Supervision strategies and processes |
| 3.2.9. | Information on credit risk mitigation techniques |
| 3.2.10. | RWA density by geographic area |
| 3.3. | Market risk |
| 3.3.1. | Scope and nature of the market risk measurement and reporting systems |
| 3.3.2. | Differences in the trading book for the purposes of applying the solvency regulations and accounting criteria |
| 3.3.3. | standardized approach |
| 3.3.4. | Internal models |
| 3.4. | Structural risk in the equity portfolio |
| 3.4.1. | Scope and nature of the structural risk in the equity portfolio measurement and reporting systems |
| 3.4.2. | Differentiation between portfolios held for sale and those held for strategic purposes |
| 3.4.3. | Book value and exposure of equity investments and capital instruments contained in above portfolios |
| 3.4.4. | Risk-weighted assets of equity investments and capital instruments |
| 3.4.5. | Profit and loss and adjustments for valuation of equity investments and capital instruments |
| 51 |
Table of Contents
3.5. Structural exchange-rate risk
3.5.1. Scope and nature of the exchange-rate risk measurement and reporting systems
3.6. Interest-Rate Risk
3.6.1. Scope and nature of the interest-rate risk measurement and reporting systems
3.6.2. Nature of interest-rate risk and key hypotheses
3.6.3. Variations in interest rates
3.7. Liquidity Risk
3.7.1. Liquidity and Funding Strategy and Planning
3.7.2. Governance and monitoring
3.7.3. Liquidity and funding performance in 2018
3.7.4. Liquidity and funding outlook
3.7.5. LCR Disclosure
3.7.6. Assets committed in finance transactions
3.8. Operational Risk
3.8.1. Definition of Operational Risk
3.8.2. Operational Risk management model
3.8.3. Operational Risk Government
3.8.4. Methods used for calculating equity
3.8.5. Operational risk profile
| 3.1. | General Risk Management and Control Model |
The BBVA Group has an overall risk management and control model (hereinafter ‘the model’) tailored to its business model, its organization and the geographies in which it operates, This model allows BBVA Group to develop its activity in accordance with the risk strategy and risk controls and management policies defined by the governing bodies of the Bank and to adapt to a changing economic and regulatory environment, tackling risk management globally and adapted to the circumstances at all times. The model establishes a system of appropriate risk management regarding risk profile and strategy of the Group.
This Model is applied comprehensively in the Group and is made up of the basic elements set out below:
| · | Governance and organization |
| · | Risk Appetite Framework |
| · | Decisions and processes |
| · | Assessment, monitoring and reporting |
| · | Infrastructure |
The Group promotes the development of a risk culture that ensures consistent application of the risk management and control model in the Group, and that guarantees that the risk function is understood and assimilated at all levels of the organization.
| 52 |
Table of Contents
| 3.1.1. | Governance and organization |
BBVA Group’s risk governance model is characterized by a special involvement of its corporate bodies, both in setting the risk strategy and in the ongoing monitoring and supervision of its implementation.
Thus, as developed below, the corporate bodies are the ones that approve this risk strategy and corporate policies for the different types of risk. The risk function is responsible at management level for their implementation and development, and reporting to the governing bodies.
The responsibility for the daily management of the risks lies on the businesses which abide in the development of their activity to meet the policies, rules, procedures, infrastructures and controls, which are defined by the function risk on the basis of the framework set by the governing bodies.
To perform this task properly, the risk function in the BBVA Group is configured as a single, global function with an independent role from commercial areas.
| 3.1.1.1. | Corporate bodies |
The BBVA Board of Directors (hereinafter also referred to as “the Board”) approves the risk strategy and oversees the internal management and control systems. Specifically, in relation to the risk strategy, the Board approves the Group’s risk appetite statement, the core metrics (and their statements) and the main metrics by type of risk, as well as the general risk management and control model.
The Board of Directors is also responsible for approving and monitoring the strategic and business plan, the annual budget and management goals, as well as the investment and funding policy, in a consistent way and in line with the approved Risk Appetite Framework. For this reason, the processes for defining the Risk Appetite Framework proposals and the strategic and budgetary planning at Group level are coordinated by the executive areas for submission to the Board.
To ensure that the Risk Appetite Framework is integrated into management, on the basis established by the Board of Directors, the Executive Committee approves the metrics by type of risk in relation to profitability and income recurrence and the Group’s basic structure of limits at geographic area, risk type, asset type and portfolio level. This Committee also approves specific corporate policies for each type of risk.
Lastly, the Board of Directors has set up a committee specializing in risks, the Risk Committee, that assists the Board and the Executive Committee in determining the Group’s risk strategy and the risk limits and policies, respectively, analysing and assessing beforehand the proposals submitted to those bodies. In 2018, the Risk Committee has held 21 meetings and 20 meetings are planned for 2019.
The Board of Directors has the exclusive authority to amend the Group’s risk strategy and its elements, including the Risk Appetite Framework metrics within its scope of decision, while the Executive Committee is responsible for amending the metrics by type of risk within its scope of decision and the Group’s basic structure of limits (core limits), when applicable. In both cases, the amendments follow the same decision-making process described above, so the proposals for amendment are submitted by the executive area (Chief Risk Officer, “CRO”) and analysed by the Risk Committee, for later submission to the Board of Directors or to the Executive Committee, as appropriate.
| 53 |
Table of Contents
Moreover, the Risk Committee, the Executive Committee and the Board itself conduct proper monitoring of the risk strategy implementation and of the Group’s risk profile. The risks function regularly reports on the development of the Group’s Risk Appetite Framework metrics to the Board and to the Executive Committee, after their analysis by the Risk Committee, whose role in this monitoring and control work is particularly relevant.
| 3.1.1.2. | The risk function: CRO. Committees organization and structure |
The head of the risk function at executive level is the Group’s CRO, who carries out his functions independently and with the necessary authority, rank, experience, knowledge and resources. He is appointed by the Board as a member of its senior management and has direct access to its corporate bodies (Board, Executive Standing Committee and Risk Committee), to whom he reports regularly on the status of risks in the Group.
The CRO is supported in the exercise of his functions by a structure consisting of cross-sectional risk units in the corporate area and the specific risk units in the geographical and/or business areas of the Group. Each of the latter units is headed by a Chief Risk Officer for the geographical and/or business area who, within his/her area of responsibility, carries out risk management and control functions and is responsible for applying the corporate policies and rules approved at Group level in a consistent manner, adapting them if necessary to local requirements and reporting to the local corporate bodies.
The Chief Risk Officers of the geographical and/or business areas report both to the Group’s CRO and to the head of their geographical and/or business area. The aim of this dual reporting system is to ensure that the local risk management function is independent from the operating functions and enable its alignment with the Group’s corporate risk policies and goals.
As explained above, the risk management function consists of risk units from the corporate area, which carry out cross-sectional functions, and risk units from the geographical and/or business areas.
| · | The corporate area’s risk units develop and submit to the Group CRO the proposal for the Group’s Risk Appetite Framework, the corporate policies, rules and global procedures and infrastructures within the framework approved by the corporate bodies; they ensure their application and report either directly or through the CRO to the Bank’s corporate bodies. Their functions include: |
| ○ | Management of the different types of risks at Group level, in accordance with the strategy defined by the corporate bodies. |
| ○ | Planning of risks in line with the Risk Appetite Framework principles defined by the Group. |
| ○ | Monitoring and control of the Group’s risk profile in relation to the Risk Appetite Framework approved by the Bank’s corporate bodies, providing precise and reliable information with the frequency and in the format required. |
| ○ | Prospective analyses to enable an evaluation of compliance with the risk appetite framework in stress scenarios and the analysis of risk mitigation mechanisms. |
| ○ | Management of the technological and methodological developments required for implementing the Model in the Group. |
| ○ | Design of the Group’s Internal Control model and definition of the methodology, corporate criteria and procedures for identifying and prioritizing the risk inherent in each unit’s activities and processes. |
| ○ | Validation of the models used and the results obtained by them to verify whether they are appropriate to the different uses to which they are applied. |
| 54 |
Table of Contents
| · | The risk units in the business units develop and present to the Chief Risk Officer of the geographical and/or business area the risk appetite framework proposal applicable in each geographical and/or business area, independently and always within the Group’s strategy/Risk Appetite Framework. They also ensure that the corporate policies and rules are approved and applied consistently at a Group level, adapting them if necessary to local requirements; that they are provided with appropriate infrastructures for management and control of their risks, within the global risk infrastructure framework defined by the corporate areas; and that they report to their corporate bodies and/or to senior management, as appropriate. |
The local risk units thus work with the corporate area risk units in order to adapt to the risk strategy at Group level and share all the information necessary for monitoring the development of their risks.
The risk function has a decision-making process to perform its functions, underpinned by a structure of committees, where the Global Risk Management Committee (GRMC) acts as thetop-level committee within the risk function. It proposes, examines and, where applicable, approves, among others, the internal risk regulatory framework and the procedures and infrastructures needed to identify, assess, measure and manage the material risks faced by the Group in carrying out its business, and the determination of risk limits by portfolio. The members of this Committee are the Group’s CRO, the Heads of the main Areas of the GRM Front, the Heads of GRM Corporate Discipline Units and the Head of Risk Management Group of GRM.
The GRMC carries out its functions assisted by various support committees which include:
| · | Global Credit Risk Management Committee: it is responsible for analysing and decision-making related to wholesale credit risk admission. |
| · | Wholesale Credit Risk Management Committee: its purpose is the analysis and decision-making regarding the admission of wholesale credit risk of certain customer segments of the BBVA Group. |
| · | Work Out Committee: its purpose is to be informed about decisions taken under the delegation framework regarding risk proposals concerning clients on Watch List and clients classified as NPL of certain customer segments of the BBVA Group, as well the sanction of proposals regarding entries, exits and changes of Watch List, entries and exits innon-performing unlikely to pay and turns to written off. |
| · | Asset Allocation Committee: the executive authority responsible for analyzing and deciding on credit risk issues related to processes aimed at achieving a portfolios combination and composition that, under the restrictions imposed by the Risk Appetite framework, allows to maximize the risk adjusted return on equity. |
| · | Risk Models Management Committee: it ensures an appropriate decision-making process regarding the planning, development, implementation, use, validation and monitoring of the models required to achieve an appropriate management of the Model Risk in the BBVA Group. |
| · | Global Market Risk Unit Global Committee (CGGMRU): it is responsible for formalizing, supervising and communicating the monitoring of trading desk risk in all the Global Markets business units, as well as coordinating and approving GMRU key decisions activity, and developing and proposing to GRMC the corporate regulation of the unit. |
| · | Corporate Committee on Admission of Operational Risk and Product Governance: it identifies, analyzes and assesses the operational risks associated initiatives related with new business, products or services, outsourcing, process transformation and new systems, prior to its launch. As well, it will verify that Product Governance normative requirements are met and will decide about the insurance scheme (global policies). |
| 55 |
Table of Contents
| · | Retail Credit Risk Committee: it ensures for the analysis, discussion and decision support on all issues regarding the retail credit risk management that impact or potentially do in the practices, processes and corporate metrics established in the Policies, Rules and Operating Frameworks. |
| · | Asset Management Global Risk Steering Committee: its purpose is to develop and coordinate the strategies, policies, procedures, and infrastructure necessary to identify, assess, measure and manage the material risks facing the bank in the operation of businesses linked to BBVA Asset Management. |
| · | Global Insurance Risk Committee: its purpose is to guarantee and promote the alignment and the communication between all the Insurance Risk Units in the BBVA Group. It will do this by promoting the application of standardized principles, policies, tools and risk metrics in the different regions with the aim of maintaining proper integration of insurance risk management in the Group. |
| · | Operations Committee (COPOR): its purpose is to analyse and make decision in relation to the operations of the various geographies in which Global Markets is present. |
Each geographical and/or business area has its own risk management committee (or committees), with objectives and contents similar to those of the corporate area, which perform their duties consistently and in line with corporate risk policies and rules, whose decisions are reflected in the corresponding minutes.
Under this organizational scheme, the risk management function ensures that the risk strategy, the regulatory framework, and standardized risk infrastructures and controls are integrated and applied across the entire Group. It also benefits from the knowledge and proximity to customers in each geographical and/or business area, and transmits the corporate risk culture to the Group’s different levels. Moreover, this organization enables the risks function to conduct and report to the corporate bodies integrated monitoring and control of the entire Group’s risks.
| 3.1.1.3. | Internal Risk Control and Internal Validation |
The Group has a specific Internal Risk Control unit. Its main function is to ensure that there is an adequate internal regulatory framework, a process and measures defined for each type of risk identified in the Group (and for those other types of risk that may potentially affect the Group). It controls their application and operation, as well as ensuring integration of the risk strategy into the Group’s management. In this regard, the Internal Risk Control unit verifies the performance of their duties by the units that develop the risk models, manage the processes and execute the controls. Its scope of action is global, from the geographical point of view and the type of risks.
The Group’s Head of Internal Risk Control is responsible for the function and reports on its activities and informs of its work plans to the CRO and to the Board’s Risks Committee, assisting it in any matters where requested. For these purposes the Internal Risk Control department has a Technical Secretary’s Office, which offers the Committee the technical support it needs to better perform its duties.
In addition, the Group has an Internal Validation unit, which reviews the performance of its duties by the units that develop the risk models and of those that use them in management. Its functions include review and independent validation at internal level of the models used for management and control of risks in the Group.
| 3.1.2. | Risk Appetite Framework |
The Group’s Risk Appetite Framework, approved by the corporate bodies, determines the risks (and their level) that the Group is willing to assume to achieve its business objectives
| 56 |
Table of Contents
considering an organic evolution of its business. These are expressed in terms of solvency, profitability and liquidity and funding, which are reviewed periodically as well as in case of material changes to the entity’s business or relevant corporate transactions. The definition of the risk appetite has the following goals:
| · | To express the maximum levels of risk it is willing to assume, at both Group and geographical and/or business area level. |
| · | To establish a set of guidelines for action and a management framework for the medium and long term that prevent actions from being taken (at both Group and geographical and/or business area level) that could compromise the future viability of the Group. |
| · | To establish a framework for relations with the geographical and/or business areas that, while preserving their decision-making autonomy, ensures they act consistently, avoiding uneven behavior. |
| · | To establish a common language throughout the organization and develop a compliance-oriented risk culture. |
| · | Alignment with the new regulatory requirements, facilitating communication with regulators, investors and other stakeholders, thanks to an integrated and stable risk management framework. |
Risk appetite framework is expressed through the following elements:
| · | Risk Appetite Statement:includes the general principles of the Group’s risk strategy and the target risk profile. The Group’s Risk Appetite Statement in 2018 is as follows: |
BBVA Group’s Risk Policy is aimed to promote a multichannel and responsible universal banking model, based on principles, targeting sustainable growth, risk adjusted profitability and recurrent value creation. To achieve these objectives, the Risk Management Model is oriented to maintain a moderate risk profile that allows the Group to keep strong financial fundamentals in adverse environments preserving our strategic goals, maintaining a prudent management, an integral view of risks, and a portfolio diversification by geography, asset class and client segment, focusing on keeping a long term relationship with our customers.
| · | Core metrics:based on the risk appetite statement, statements are established to set down the general risk management principles in terms of solvency, liquidity and funding, profitability and income recurrence. |
| ○ | Solvency: a sound capital position, maintaining resilient capital buffer from regulatory and internal requirements that supports the regular development of banking activity even under stress situations. As a result, BBVA proactively manages its capital position, which is tested under different stress scenarios from a regular basis. |
| ○ | Liquidity and funding: A sound balance-sheet structure to sustain the business model. Maintenance of an adequate volume of stable resources, a diversified wholesale funding structure, which limits the weight of short term funding and ensures the access to the different funding markets, optimizing the costs and preserving a cushion of liquid assets to overcome a liquidity survival period under stress scenarios. |
| ○ | Profitability and income recurrence: A sound margin-generation capacity supported by a recurrent business model based on the diversification of assets, a stable funding and a customer focus; combined with a moderate risk profile that limits the credit losses even under stress situations; all focused on allowing income stability and maximizing the risk-adjusted profitability. |
| 57 |
Table of Contents
The core metrics define, in quantitative terms, the principles and the target risk profiles set out in the risk appetite statement and are in line with the strategy of the Group. Each metric has three thresholds (traffic-light approach) ranging from a standard business management to higher deterioration levels: Management reference, Maximum appetite and Maximum capacity.. BBVA Group’s core metrics in 2018 are those specified in the following chart:
CHART 4: BBVA Group’s Core Metrics
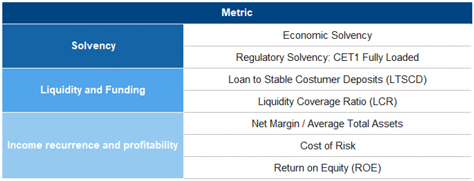
| · | Metrics by type of risk:based on the core metrics, statements are established for each type of risk reflecting the main principles governing the management of that risk and several metrics are calibrated, compliance with which enables compliance with the core metrics and the risk appetite statement of the Group. The metrics by type of risk have a maximum appetite threshold.. |
| · | The basic structure of limits (Core limits):the purpose of the basic limits structure or core limits is to shape the Risk Appetite Framework at geographical area risk type, asset type and portfolio level, ensuring that the management of risks on an ongoing basis is within the thresholds set forth for by type of risk. |
In addition to this framework, there’s a level of management limits that is defined and managed by the risk function developing the core limits, in order to ensure that the anticipatory management of risks by subcategories or by subportfolios complies with that core limits and, in general, with the Risk Appetite Framework.
The basic scheme of BBVA’s Risk Appetite Framework is outlined in the following chart:
CHART 6: Scheme of BBVA Group Risk Appetite Framework
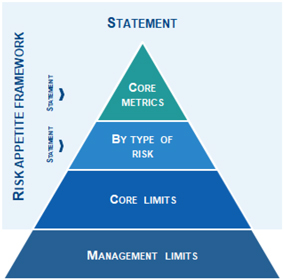
| 58 |
Table of Contents
The corporate risk area works with the various geographical and/or business areas to define their risk appetite framework, which will be coordinated with and integrated into the Group’s risk appetite to ensure that its profile fits as defined.
The Risk Appetite Framework is integrated into the management and the processes for defining the Risk Appetite Framework proposals and strategic and budgetary planning at Group level are coordinates.
As explained above, the core metrics of BBVA Risk Appetite Framework measure Groups performance in terms of solvency, liquidity and funding, profitability and income recurrence; most of the core metrics are accounting related or regulatory metrics which are published regularly to the market in the BBVA Group annual report and in the quarterly financial reports. During 2018, the Group risk profile evolved in line with the Risk Appetite metrics..
| 3.1.3. | Decisions and processes |
The transfer of the Risk Appetite Framework to ordinary management is underpinned by three basic aspects:
| - | A standardized set of regulations |
| - | Risk planning |
| - | A comprehensive management of risks throughout their life cycle |
| 3.1.3.1. | Standardized regulatory framework |
The corporate risk area is responsible for the definition and proposal of the corporate policies, specific rules, procedures and schemes of delegation based on which risk decisions should be taken within the Group.
This process aims for the following objectives:
| · | Hierarchy and structure: well-structured information through a clear and simple hierarchy creating relations between documents that depend on each other. |
| · | Simplicity: an appropriate and sufficient number of documents. |
| · | Standardization: a standardized name and content of document. |
| · | Accessibility: ability to search for, and easy access to, documentation through the corporate risk management library. |
The approval of corporate policies for all types of risks is the responsibility of the corporate bodies of the Bank, while the corporate risk area endorses the remaining regulations.
Risk units of geographical and / or business areas comply with this set of regulations and, where necessary, adapt it to local requirements for the purpose of having a decision process that is appropriate at local level and aligned with the Group policies. If such adaptation is necessary, the local risk area must inform the corporate area of GRM, who must ensure the consistency of the regulatory body at the Group level and, therefore, if necessary, give prior approval to the modifications proposed by the local risk areas..
| 3.1.3.2. | Risk planning |
Risk planning ensures that the risk appetite framework is integrated into management through a cascade process for establishing limits and profitability adjusted to the risk profile, in which the function of the corporate area risk units and the geographical and/or business areas is to guarantee the alignment of this process with the Group’s Risk Appetite Framework in terms of solvency, liquidity and funding, profitability and income recurrence.
| 59 |
Table of Contents
There are tools in place that allow the Risk Appetite Framework defined at aggregate level to be assigned and monitored by business areas, legal entities, types of risk, concentrations and any other level considered necessary.
The risk planning process is aligned and taken into consideration within the rest of the Group’s planning framework so as to ensure consistency.
| 3.1.3.3. | Comprehensive management |
All risks must be managed comprehensively during their life cycle, and be treated differently depending on the type.
The risk management cycle is composed of five elements:
| · | Planning: with the aim of ensuring that the Group’s activities are consistent with the target risk profile and guaranteeing solvency in the development of the strategy. |
| · | Assessment: a process focused on identifying all the risks inherent to the activities carried out by the Group. |
| · | Formalization: includes the risk origination, approval and formalization stages. |
| · | Monitoring and reporting: continuous and structured monitoring of risks and preparation of reports for internal and/or external (market, investors, etc.) consumption. |
| · | Active portfolio management: focused on identifying business opportunities in existing portfolios and new markets, businesses and products. |
| 3.1.4. | Assessment, monitoring and reporting |
Assessment, monitoring and reporting is a cross-cutting element that ensure the Model has a dynamic and proactive vision to enable compliance with the risk appetite framework approved by the corporate bodies, even in adverse scenarios. The materialization of this process has the following objectives:
| · | Assess compliance with the risk appetite framework at the present time, through monitoring of the core metrics, metrics by type of risk and the basic structure of limits. |
| · | Assess compliance with the risk appetite framework in the future, through the projection of the risk appetite framework variables, in both a baseline scenario determined by the budget and a risk scenario determined by the stress tests. |
| · | Identify and assess the risk factors and scenarios that could compromise compliance with the risk appetite framework, through the development of a risk repository and an analysis of the impact of those risks. |
| · | Act to mitigate the impact in the Group of the identified risk factors and scenarios, ensuring this impact remains within the target risk profile. |
| · | Supervise the key variables that are not a direct part of the risk appetite framework, but that condition its compliance. These can be either external or internal. |
This process is integrated in the activity of the risk units, both of the corporate area and in the business units, and it is carried out during the following phases:
| 60 |
Table of Contents
| · | Identification of the risk factors that can compromise the performance of the Group or of the geographical and/or business areas in relation to the defined risk thresholds. |
| · | Assessment of the impact of the materialization of the risk factors on the metrics that define the Risk Appetite Framework based on different scenarios, including stress scenarios. |
| · | Response to unwanted situations and proposals for readjustment to enable a dynamic management of the situation, even before it takes place. |
| · | Monitoring of the Group’s risk profile and of the identified risk factors, through internal, competitor and market indicators, among others, to anticipate their future development. |
| · | Reporting: Complete and reliable information on the development of risks for the corporate bodies and senior management, with the frequency and completeness appropriate to the nature, significance and complexity of the reported risks. The principle of transparency governs al reporting of risk information. |
| 3.1.5. | Infrastructure |
The infrastructure is an element that must ensure that the Group has the human and technological resources needed for effective management and supervision of risks in order to carry out the functions set out in the Group’s risk Model and the achievement of their objectives.
With respect to human resources, the Group risk function has an adequate workforce, in terms of number, skills, knowledge and experience.
With regards to technology, the Group risk function ensures the integrity of management information systems and the provision of the infrastructure needed for supporting risk management, including tools appropriate to the needs arising from the different types of risks for their admission, management, assessment and monitoring.
The principles that govern the Group risk technology are:
| · | Standardization: the criteria are consistent across the Group, thus ensuring that risk handling is standardized at geographical and/or business area level. |
| · | Integration in management: the tools incorporate the corporate risk policies and are applied in the Group’sday-to-day management. |
| · | Automation of the main processes making up the risk management cycle. |
| · | Appropriateness: provision of adequate information at the right time. |
Through the “Risk Analytics” function, the Group has a corporate framework in place for developing the measurement techniques and models. It covers all the types of risks and the different purposes and uses a standard language for all the activities and geographical/business areas and decentralized execution to make the most of the Group’s global reach. The aim is to continually evolve the existing risk models and generate others that cover the new areas of the businesses that develop them, so as to reinforce the anticipation and proactiveness that characterize the Group’s risk function.
Also the risk units of geographical and / or business areas have sufficient means from the point of view of resources, structures and tools to develop a risk management in line with the corporate model..
| 61 |
Table of Contents
| 3.1.6. | Risk culture |
The BBVA Group promotes the development of a risk culture based on the observance and understanding of values, attitudes, and behaviors that allow the compliance with the regulations and frameworks that contribute to an appropriate risk management.
At BBVA the Risk Governance Model is characterized by a special involvement of social bodies, as they define the risk culture that permeates the rest of the organization and has the following main elements:
| · | Our Purpose which defines our reason to be and with our values and behaviors guide the performance of our organization and the people who are part of it. |
| · | The Risk Appetite Framework which determines the risks and levels of risks that the Group is willing to assume in order to fulfill its goals. |
| · | The Code of Conduct establishes the behavior guidelines that we must follow to adjust our behavior to the BBVA values. |
The Risk Culture at BBVA is based on these levers:
| · | Communication: the BBVA Group promotes the dissemination of the principles and values that should govern the conduct and risk management in a comprehensive and consistent manner. To do this, the most appropriate channels of communication are used, to allow for the Risk culture to be integrated into the business activities at all levels of the organization. |
| · | Training: the BBVA Group favors the understanding of the values, risk management model, and the code of conduct in all scenarios, ensuring standards in skills and knowledge. |
| · | Motivation: the BBVA Group aims to define incentives for BBVA employees that support the risk culture at all levels. Among these incentives, the role of the Compensation policy and incentive programs stand out, as well as implementation of risk culture control mechanisms, including the complaint channels and the disciplinary committees. |
| · | Monitoring: the BBVA Group pursues at the highest levels of the organization a continuous evaluation and monitoring of the risk culture to guarantee its implementation and identification of areas for improvement. |
| 62 |
Table of Contents
| 3.2. | Credit and counterparty risk |
| 3.2.1. | Scope and nature of the Credit Risk measurement and reporting systems for capital framework purposes |
Credit risk arises from the probability that one party to a financial instrument will fail to meet its contractual obligations for reasons of insolvency or inability to pay and cause a financial loss for the other party.
It is the most important risk for the Group and includes counterparty risk, issuer risk, settlement risk and country risk management.
BBVA Group has a risk strategy determined by the Board of Directors of the parent company, which establishes the Group’s Risk Appetite statement and the core and main metrics by type of risk in which it is materialized, as well as the General Risk Management and Control Model.
On the basis of what is approved by the Board of Directors, BBVA’s Executive Committee establishes the Corporate Policies and specific limits for each type of risk, to enable the Group to take up a position within the parameters established by the Board.
The Risk Committee assists the Board of Directors to determine the Group’s risk policy and the Executive Committee to determine the limits and risk policy strategy, analysing and assessing in advance the proposals submitted to these governing bodies.
The Risk Committee, Executive Committee and the Board itself conduct proper monitoring of the risk strategy implementation and of the Group’s risk profile.
Based on the risk strategy determined by the Board of Directors, and following the report of the Risk Committee, the Executive Committee values and, where appropriate, approves as part of the basic limits structure, the proposed Asset Allocation core limit with the determined level of disaggregation. The limits are established annually, at maximum levels of exposure by type of portfolio.
The asset allocation limits to portfolios, businesses and risks will be defined taking into account the established metrics in terms of exposure and composition of portfolios, and must be geared to maximizing the Group’s added generation of recurring economic earnings, subject to a framework of restrictions resulting from the definition of the target risk profile.
The Corporate Risk Area will establish risk concentration thresholds: individual, per portfolio and sector. Individual concentration will be limited to its impact on solvency (CET1). The portfolio and sector concentration will be in terms of EAD, under the cuts by retail portfolio/wholesale sector. Herfindahl indices are used for the individual portfolio concentration index, taking the 1,000 first counterparties in terms of EAD, as well as the sum of the exposure of the 20 biggest counterparties in relation to the solvency impact.
The Business Areas must work in line with the global vision and defined metrics, optimizing each of the portfolios for which they are responsible in terms of risk/return, within the Group’s limits and policies.
The existing gaps with respect to the target portfolio must be identified at global level and transmitted to the Business Areas, establishing plans at global and local level to adapt the risk to the predefined target profile and taking into account the future expected performance of the portfolios.
For managing risks and capital, BBVA quantifies its credit risk using two main metrics: expected loss (“EL”) and economic capital (“EC”). Expected loss reflects the average value of losses and is considered a business cost. Economic capital is the amount of capital considered necessary to cover unexpected losses if actual losses are greater than expected losses.
| 63 |
Table of Contents
These risk metrics are combined with information on profitability in value-based management, thus building the profitability-risk binomial into decision-making, from the definition of business strategy to approval of individual loans, price setting, assessment ofnon-performing portfolios, incentives to areas in the Group, etc.
There are three essential parameters in the process of calculating the EL and EC measurements: the probability of default (“PD”), loss given default (“LGD”) and exposure at default (“EAD”), mainly based on the estimate of credit conversion factors (“CCF”). They are generally estimated using the available historical information and are assigned to operations and customers according to their particular characteristics.
In this context, the credit rating tools (ratings and scorings) assess the risk in each customer/transaction according to their credit quality by assigning them a score, which is used to assign risk metrics together with other additional information: transaction seasoning, loan to value ratio, customer segment, etc.
Section 3.2.5.1 of this document details the definitions, methods and data used by the Group to determine the capital requirements for estimating and validating the parameters of probability of default (PD), loss given default (LGD) and exposure at default (EAD).
| 3.2.2. | Definitions and accounting methodologies |
The impairment accounting impairment model is applied to financial assets valued at amortized cost and to financial assets measured at fair value with changes in accumulated other comprehensive income, except for investments in equity instruments and contracts for financial guarantees and loan commitments unilaterally revocable by BBVA. Likewise, all financial instruments measured at fair value with change through profit or loss are excluded from the impairment model.
For more information about the accounting impairment model, and other accounting definitions (according to article 442 of CRR), refer to note 2.2.1 of the Group’s Consolidated Financial Statements.
| 3.2.3. | Information on credit risks |
| 3.2.3.1. | Credit risk exposure |
Pursuant to article 5 of the CRR, with respect to the bank capital requirements for credit risk, exposure is understood to be any asset item and all items included in the Group’s memorandum accounts involving credit risk and not deducted from the Group’s bank capital. Accordingly, mainly loans and receivables are included, with their corresponding undrawn balances, letters of credit and guarantees, debt securities and capital instruments, cash and deposits in central banks and credit institutions, assets purchased or sold under a repurchase agreement (asset and liability repos), financial derivatives (nominal) and fixed assets.
The credit risk exposure specified in the following sections of this document is broken down into the standardised credit risk approach (section 3.2.4), advanced credit risk approach (section 3.2.5) and counterparty risk (section 3.2.6), securitisation credit risk (section 3.2.7), and structural risk in the equity portfolio (section 3.4).
In addition to the exposure to risk at the time of default and the risk-weighted assets, the table below shows the original exposure, the exposure net of provisions and the exposure applying the conversion factors under the standardized and advanced measurement approaches as of December 31, 2018 and December 31, 2017 (including counterparty risk):
| 64 |
Table of Contents
TABLE 11: Credit risk exposure
| Million euros | ||||||||||||||||||||||||||||||||||||
12/31/2018 Exposure Class | Original Exposure (1) | Provisions | Net exposure of provisions (3) | On-balance exposure after credit risk mitigation techniques (4a) | Off-balance exposure techniques(4b) | Exposure in value (5) | EAD (6) | RWA (7) | RWA density (8=(7)/(6)) | |||||||||||||||||||||||||||
| Central governments or central banks | 122,473 | (33) | 122,440 | 138,637 | 4,893 | 143,530 | 139,186 | 30,560 | 22.0% | |||||||||||||||||||||||||||
| Regional governments or local authorities | 10,208 | (23) | 10,184 | 6,419 | 485 | 6,904 | 6,649 | 1,416 | 21.3% | |||||||||||||||||||||||||||
| Public sector entities | 991 | (9) | 982 | 1,759 | 132 | 1,890 | 1,810 | 714 | 39.5% | |||||||||||||||||||||||||||
| Multilateral development banks | 265 | () | 265 | 453 | 24 | 477 | 453 | 10 | 2.2% | |||||||||||||||||||||||||||
| International organisations | – | – | – | – | – | – | – | – | – | |||||||||||||||||||||||||||
| Institutions | 35,874 | (14) | 35,859 | 17,441 | 13,618 | 31,059 | 19,315 | 6,203 | 32.1% | |||||||||||||||||||||||||||
| Corporates | 125,314 | (1,181) | 124,133 | 75,549 | 41,762 | 117,311 | 91,400 | 89,481 | 97.9% | |||||||||||||||||||||||||||
| Retail | 86,939 | (1,722) | 85,217 | 50,062 | 30,743 | 80,805 | 52,465 | 36,768 | 70.1% | |||||||||||||||||||||||||||
| Secured by mortgages on immovable property | 40,917 | (302) | 40,615 | 40,389 | 145 | 40,534 | 40,458 | 15,466 | 38.2% | |||||||||||||||||||||||||||
| Exposures in default | 8,609 | (4,649) | 3,960 | 3,367 | 449 | 3,816 | 3,612 | 4,159 | 115.1% | |||||||||||||||||||||||||||
| Exposures associated with particularly high risk | 1,168 | (51) | 1,117 | 1,101 | 1 | 1,102 | 1,101 | 1,652 | 150.0% | |||||||||||||||||||||||||||
| Covered bonds | – | – | – | – | – | – | – | – | – | |||||||||||||||||||||||||||
| Claims on institutions and corporates with a short-term credit assesment | 3 | () | 3 | 3 | – | 3 | 3 | 2 | 65.9% | |||||||||||||||||||||||||||
| Collective investments undertakings | 76 | (1) | 75 | 45 | 24 | 69 | 57 | 57 | 100.0% | |||||||||||||||||||||||||||
| Other exposures | 18,100 | (36) | 18,064 | 27,502 | 1,727 | 29,229 | 28,452 | 11,229 | 39.5% | |||||||||||||||||||||||||||
| Securitisation exposures | 4,623 | – | 4,623 | 4,623 | – | 4,623 | 4,623 | 950 | 20.5% | |||||||||||||||||||||||||||
| Total Standardised approach | 455,561 | (8,022) | 447,539 | 367,348 | 94,003 | 461,351 | 389,584 | 198,665 | 51.0% | |||||||||||||||||||||||||||
| Central governments or central banks | 10,698 | (5) | 12,213 | 495 | 12,708 | 12,459 | 677 | 5.4% | ||||||||||||||||||||||||||||
| Institutions | 100,329 | (58) | 76,740 | 5,523 | 82,263 | 79,992 | 5,366 | 6.7% | ||||||||||||||||||||||||||||
| Corporates | 135,616 | (2,176) | 75,295 | 58,254 | 133,549 | 103,991 | 55,513 | 53.4% | ||||||||||||||||||||||||||||
Corporates (SMEs) | 19,894 | (1,103) | 14,530 | 3,766 | 18,297 | 16,231 | 11,877 | 73.2% | ||||||||||||||||||||||||||||
Corporates: Specialised lending | 7,706 | (73) | 7,304 | 403 | 7,706 | 7,536 | 6,330 | 84.0% | ||||||||||||||||||||||||||||
Corporates: Others | 108,016 | (999) | 53,461 | 54,085 | 107,545 | 80,224 | 37,305 | 46.5% | ||||||||||||||||||||||||||||
| Retail | 118,211 | (2,660) | 97,055 | 21,065 | 118,120 | 101,011 | 19,667 | 19.5% | ||||||||||||||||||||||||||||
Of which: secured by immovable property | 81,472 | (1,330) | 76,963 | 4,484 | 81,446 | 77,186 | 7,385 | 9.6% | ||||||||||||||||||||||||||||
Of which: Secured by mortgages on immovable property | 22,167 | (584) | 6,525 | 15,642 | 22,167 | 9,682 | 6,938 | 71.7% | ||||||||||||||||||||||||||||
Of which: Others | 14,571 | (745) | 13,568 | 939 | 14,507 | 14,142 | 5,344 | 37.8% | ||||||||||||||||||||||||||||
Retail: Other SMEs | 4,132 | (281) | 3,240 | 840 | 4,079 | 3,746 | 1,752 | 46.8% | ||||||||||||||||||||||||||||
Retail: Other Non-SMEs | 10,440 | (464) | 10,328 | 100 | 10,427 | 10,396 | 3,592 | 34.6% | ||||||||||||||||||||||||||||
| Securitisation exposures | 5,593 | – | 5,382 | – | 5,382 | 5,382 | 1,673 | 31.1% | ||||||||||||||||||||||||||||
| Total IRB approach | 370,447 | (4,898) | 266,685 | 85,336 | 352,021 | 302,834 | 82,895 | 27.4% | ||||||||||||||||||||||||||||
| Total credit risk dilution and delivery | 826,008 | (12,920) | 447,539 | 634,033 | 179,340 | 813,373 | 692,418 | 281,560 | 40.7% | |||||||||||||||||||||||||||
| Equity | 6,822 | – | 6,822 | – | 6,822 | 6,822 | 15,246 | 223.5% | ||||||||||||||||||||||||||||
| Simple Approach | 3,238 | – | 3,238 | – | 3,238 | 3,238 | 8,085 | 249.7% | ||||||||||||||||||||||||||||
| Not listed instruments in sufficiently diversified portfolios | 2,974 | – | 2,974 | – | 2,974 | 2,974 | 7,277 | 244.6% | ||||||||||||||||||||||||||||
| Listed in exchange-traded markets | 263 | – | 263 | – | 263 | 263 | 809 | 307.0% | ||||||||||||||||||||||||||||
| PD/LGD Approach | 3,201 | – | 3,201 | – | 3,201 | 3,201 | 5,989 | 187.1% | ||||||||||||||||||||||||||||
| Intern Models | 383 | – | 383 | – | 383 | 383 | 1,172 | 306.2% | ||||||||||||||||||||||||||||
| Total credit risk | 832,829 | (12,920) | 447,539 | 640,855 | 179,340 | 820,194 | 699,240 | 296,805 | 42.4% | |||||||||||||||||||||||||||
(1) Gross exposure of provisions before credit risk mitigation techniques, excluding contributions to the default of a CCP
(2) Includes provisions and adjustments due to impairment of financial assets and contingent risks and commitments.
(3) Exposures are only adjusted by provisions in those cases that are calculated by standardized approach. Equity exposure is presented net of impairment.
(4a)(4b) Eligible credit mitigation techniques are included, either on-balance or off-balance, according to Chapter 4 of CRR. For securitization exposures, includes credit risk mitigation by personal warranties.
(5) It corresponds to the exposure in the adjusted value by eligible credit mitigation techniques.
(6) Exposure to credit risk at default, calculated as (4a)+((4b)*CCF)
| 65 |
Table of Contents
| Million euros | ||||||||||||||||||||||||||||||||||||
12/31/2017 Exposure Class | Original Exposure (1) | Provisions | Net exposure of provisions (3) | On-balance exposure after credit risk mitigation techniques (4a) | Off-balance exposure after credit risk mitigation techniques (4b) | Exposure in the adjusted value (5) | EAD (6) | RWA’s (7) | RWA density (8=(7)/(6)) | |||||||||||||||||||||||||||
| Central governments or central banks | 122,404 | (48) | 122,356 | 135,156 | 15,397 | 150,553 | 135,914 | 29,759 | 21.9% | |||||||||||||||||||||||||||
| Regional governments or local authorities | 10,140 | (8) | 10,133 | 5,978 | 821 | 6,799 | 6,516 | 1,252 | 19.2% | |||||||||||||||||||||||||||
| Public sector entities | 1,556 | (4) | 1,552 | 1,635 | 854 | 2,490 | 1,701 | 654 | 38.4% | |||||||||||||||||||||||||||
| Multilateral development banks | 93 | (1) | 93 | 191 | 21 | 212 | 191 | 14 | 7.2% | |||||||||||||||||||||||||||
| International organisations | 1 | – | 1 | 1 | �� | 1 | 1 | – | – | |||||||||||||||||||||||||||
| Institutions | 22,176 | (17) | 22,159 | 14,875 | 3,088 | 17,963 | 16,289 | 5,793 | 35.6% | |||||||||||||||||||||||||||
| Corporates | 132,075 | (1,613) | 130,461 | 77,564 | 42,493 | 120,057 | 93,319 | 91,600 | 98.2% | |||||||||||||||||||||||||||
| Retail | 92,773 | (1,246) | 91,527 | 53,441 | 33,393 | 86,834 | 55,645 | 39,177 | 70.4% | |||||||||||||||||||||||||||
| Secured by mortgages on immovable property | 49,883 | (339) | 49,545 | 48,416 | 511 | 48,927 | 48,740 | 19,609 | 40.2% | |||||||||||||||||||||||||||
| Exposures in default | 9,753 | (4,645) | 5,108 | 4,384 | 536 | 4,920 | 4,684 | 5,248 | 112.1% | |||||||||||||||||||||||||||
| Exposures associated with particularly high risk | 2,557 | (68) | 2,489 | 2,463 | 1 | 2,464 | 2,463 | 3,694 | 150.0% | |||||||||||||||||||||||||||
| Covered bonds | – | – | – | – | – | – | – | – | – | |||||||||||||||||||||||||||
| Claims on institutions and corporates with a short-term credit assesment | 25 | – | 25 | 25 | – | 25 | 25 | 5 | 20.0% | |||||||||||||||||||||||||||
| Collective investments undertakings | 34 | () | 34 | 9 | 26 | 34 | 24 | 24 | 100.0% | |||||||||||||||||||||||||||
| Other exposures | 21,200 | (34) | 21,166 | 27,897 | 2,574 | 30,471 | 29,274 | 11,725 | 40.1% | |||||||||||||||||||||||||||
| Securitisation exposures | 4,314 | – | 4,314 | 4,314 | – | 4,314 | 4,314 | 924 | 21.4% | |||||||||||||||||||||||||||
| Total standardised approach | 468,985 | (8,023) | 460,963 | 376,350 | 99,714 | 476,064 | 399,100 | 209,478 | 52.5% | |||||||||||||||||||||||||||
| Central governments or central banks | 6,817 | (4) | 7,801 | 660 | 8,461 | 8,131 | 1,172 | 14.4% | ||||||||||||||||||||||||||||
| Institutions | 97,127 | (71) | 72,271 | 5,446 | 77,717 | 75,314 | 5,931 | 7.9% | ||||||||||||||||||||||||||||
| Corporates | 134,011 | (3,447) | 73,875 | 58,182 | 132,057 | 103,323 | 56,643 | 54.8% | ||||||||||||||||||||||||||||
Corporates (SMEs) | 18,015 | (1,821) | 14,089 | 3,555 | 17,644 | 15,651 | 10,056 | 64.3% | ||||||||||||||||||||||||||||
Corporates: Specialised lending | 9,325 | (109) | 8,370 | 955 | 9,325 | 9,111 | 8,077 | 88.6% | ||||||||||||||||||||||||||||
Corporates: Others | 106,670 | (1,518) | 51,416 | 53,672 | 105,088 | 78,561 | 38,510 | 49.0% | ||||||||||||||||||||||||||||
| Retail | 117,747 | (2,339) | 97,721 | 19,922 | 117,643 | 101,576 | 19,662 | 19.4% | ||||||||||||||||||||||||||||
Of which: secured by immovable property | 84,366 | (1,192) | 79,848 | 4,497 | 84,345 | 80,073 | 8,268 | 10.3% | ||||||||||||||||||||||||||||
Of which: Secured by mortgages on immovable property | 20,625 | (527) | 6,023 | 14,603 | 20,625 | 9,154 | 6,764 | 73.9% | ||||||||||||||||||||||||||||
Of which: Others | 12,756 | (620) | 11,851 | 823 | 12,674 | 12,350 | 4,629 | 37.5% | ||||||||||||||||||||||||||||
Retail: Other SMEs | 3,857 | (198) | 2,975 | 805 | 3,780 | 3, 464 | 1,612 | 46.5% | ||||||||||||||||||||||||||||
Retail: OtherNon-SMEs | 8,899 | (421) | 8,876 | 18 | 8,894 | 8, 885 | 3,017 | 34.0% | ||||||||||||||||||||||||||||
| Securitisation exposures | 757 | – | 757 | – | 757 | 757 | 827 | 109.2% | ||||||||||||||||||||||||||||
| Total IRB approach | 356,459 | (5,861) | 252,425 | 84,211 | 336,636 | 289,101 | 84,235 | 29.1% | ||||||||||||||||||||||||||||
| Total credit risk dilution and delivery | 825,445 | (13,884) | 460,963 | 628,775 | 183,925 | 812,700 | 688,201 | 293,713 | 42.7% | |||||||||||||||||||||||||||
| Equity(7) | 7,798 | – | 7,798 | – | 7,798 | 7,798 | 16,775 | 215.1% | ||||||||||||||||||||||||||||
| Simple Approach | 3,881 | – | 3,881 | – | 3,881 | 3,881 | 9,562 | 246.4% | ||||||||||||||||||||||||||||
| Not listed instruments in sufficiently diversified portfolios | 3,705 | – | 3,705 | – | 3,705 | 3,705 | 8,989 | 242.6% | ||||||||||||||||||||||||||||
| Listed in exchange-traded markets | 176 | – | 176 | – | 176 | 176 | 573 | 326.5% | ||||||||||||||||||||||||||||
| PD/LGD Approach | 3,390 | – | 3,390 | – | 3,390 | 3,390 | 4,953 | 146.1% | ||||||||||||||||||||||||||||
| Intern Models | 527 | – | 527 | – | 527 | 527 | 2,261 | 429.0% | ||||||||||||||||||||||||||||
| Total credit risk | 833,242 | (13,884) | 460,963 | 636,573 | 183,925 | 820,498 | 695,999 | 310,487 | 44.6% | |||||||||||||||||||||||||||
(1) Gross exposure of provisions before credit risk mitigation techniques, excluding contributions to the default of a CCP
(2) Includes provisions and adjustments due to impairment of financial assets and contingent risks and commitments.
(3) Exposures are only adjusted by provisions in those cases that are calculated by standardized approach. Equity exposure is presented net of accounting provisions.
(4a)(4b) Eligible credit mitigation techniques are included, eitheron-balance oroff-balance, according to Chapter 4 of CRR. For securitization exposures, includes credit risk mitigation by personal warranties.
(5) It corresponds to the exposure in the adjusted value by eligible credit mitigation techniques.
(6) Exposure to credit risk at default, calculated as (4a)+((4b)*CCF)
(7) Equity exposure as of December, 31, 2017, includes the impairment of Telefónica, S.A. for an amount of 1,123 million euros
| 66 |
Table of Contents
| 3.2.3.2. | Average value of the exposures during 2018 and 2017 |
The table below shows the average value of exposure to credit risk in 2018 and 2017, for both the advanced measurement and standardized approaches for each one of the exposure categories:
TABLE 12: EU CRB-B - Total and average net amount of exposures (includes counterparty credit risk)
| Million euros | ||||||||||||||||
| Exposure Class | 12/31/2018 | 12/31/2017 | ||||||||||||||
| Net value of exposures at the end of the period (4Q) (1) | Average net exposures over the period | Net value of exposures at the end of the period (4Q) (1) | Average net exposures over the period | |||||||||||||
| Central governments or central banks | 10,693 | 7,461 | 6,813 | 5,591 | ||||||||||||
| Institutions | 100,271 | 96,062 | 97,056 | 88,605 | ||||||||||||
| Corporates | 133,440 | 131,251 | 130,564 | 131,251 | ||||||||||||
Of which: Specialised lending | 7,633 | 8,305 | 9,216 | 10,075 | ||||||||||||
Of which: SMEs | 18,790 | 15,952 | 16,195 | 16,367 | ||||||||||||
| Retail | 115,551 | 115,232 | 115,408 | 116,630 | ||||||||||||
Secured by real estate property | 80,142 | 81,180 | 83,174 | 84,417 | ||||||||||||
Qualifying revolving | 21,583 | 21,248 | 20,098 | 21,090 | ||||||||||||
Other retail | 13,826 | 12,804 | 12,136 | 11,123 | ||||||||||||
SMEs | 3,851 | 3,648 | 3,659 | 3,325 | ||||||||||||
Non–SMEs | 9,975 | 9,156 | 8,477 | 7,797 | ||||||||||||
| Equity | 6,822 | 7,068 | 7,798 | 8,217 | ||||||||||||
| Total IRB approach | 366,777 | 357,074 | 357,639 | 350,294 | ||||||||||||
| Central governments or central banks | 122,440 | 115,638 | 122,356 | 122,111 | ||||||||||||
| Regional governments or local authorities | 10,184 | 10,289 | 10,133 | 7,718 | ||||||||||||
| Public sector entities | 982 | 953 | 1,552 | 2,849 | ||||||||||||
| Multilateral development banks | 265 | 131 | 93 | 101 | ||||||||||||
| International organisations | 0 | 1 | 1 | 2 | ||||||||||||
| Institutions | 35,859 | 32,090 | 22,159 | 25,831 | ||||||||||||
| Corporates | 124,133 | 125,610 | 130,461 | 130,715 | ||||||||||||
Of which: SMEs | 21,890 | 20,285 | 21,002 | 22,061 | ||||||||||||
| Retail | 85,217 | 90,028 | 91,527 | 87,309 | ||||||||||||
Of which: SMEs | 26,558 | 29,031 | 24,258 | 26,000 | ||||||||||||
| Secured by mortgages on immovable property | 40,615 | 44,530 | 49,545 | 52,696 | ||||||||||||
Of which: SMEs | 3,495 | 5,983 | 9,009 | 9,161 | ||||||||||||
| Exposures in default | 3,960 | 3,911 | 5,108 | 4,973 | ||||||||||||
| Exposures associated with particularly high risk | 1,117 | 2,041 | 2,489 | 2,602 | ||||||||||||
| Covered bonds | – | – | – | – | ||||||||||||
| Claims on institutions and corporates with a short-term credit assesment | 3 | 8 | 25 | 197 | ||||||||||||
| Collective investments undertakings | 75 | 72 | 34 | 86 | ||||||||||||
| Equity exposures | – | – | – | – | ||||||||||||
| Other exposures | 18,064 | 19,844 | 21,166 | 22,492 | ||||||||||||
| Total standardised approach | 442,917 | 445,143 | 456,649 | 459,681 | ||||||||||||
| Total | 809,694 | 802,217 | 814,288 | 809,976 | ||||||||||||
(1) The table above shows the original exposure net of credit risk adjustments reported in COREP statements of Credit Risk and Equity excluding securitization exposures
| 3.2.3.3. | Distribution by geographic area |
The following chart shows the distribution by geographic areas of the original exposure net of provisions, by the obligor’s country. The distribution includes exposure to credit and counterparty risk, as well as the equity exposures.
| 67 |
Table of Contents
TABLE 13: EUCRB-C –Geographical breakdown of exposures (including counterparty credit risk)
Million euros
| 12/31/2018 | Net EO of provisions(2) | |||||||||||||||||||||||||||||||
| Exposure Class (1) | Spain | Turkey | Eurasia | Mexico | USA | South America | Other areas | Total | ||||||||||||||||||||||||
| Central governments or central banks | 11 | 0 | (0) | 130 | 4,958 | 447 | 5,146 | 10,693 | ||||||||||||||||||||||||
| Institutions | 41,262 | 12 | 51,824 | 458 | 3,100 | 719 | 2,896 | 100,271 | ||||||||||||||||||||||||
| Corporates | 59,773 | 508 | 32,082 | 20,429 | 12,889 | 2,008 | 5,752 | 133,440 | ||||||||||||||||||||||||
| Retail | 99,329 | 2 | 431 | 15,526 | 40 | 72 | 152 | 115,551 | ||||||||||||||||||||||||
| Equity | 4,804 | 56 | 381 | 800 | 292 | 361 | 127 | 6, 822 | ||||||||||||||||||||||||
| Total IRB approach | 205,177 | 577 | 84,718 | 37,344 | 21,280 | 3,607 | 14,073 | 366,777 | ||||||||||||||||||||||||
| Central governments or central banks | 64,761 | 14,408 | 9, 621 | 18,078 | 6,968 | 8,519 | 85 | 122,440 | ||||||||||||||||||||||||
| Regional governments or local authorities | 53 | 33 | 103 | 2,342 | 7,486 | 168 | – | 10,184 | ||||||||||||||||||||||||
| Public sector entities | 0 | 35 | 0 | 200 | 0 | 747 | – | 982 | ||||||||||||||||||||||||
| Multilateral development banks | – | – | 169 | – | – | 96 | – | 265 | ||||||||||||||||||||||||
| International organisations | 0 | 0 | 0 | – | – | – | – | 0 | ||||||||||||||||||||||||
| Institutions | 11,694 | 2,446 | 7,718 | 7,576 | 2,157 | 3,580 | 689 | 35,859 | ||||||||||||||||||||||||
| Corporates | 7,259 | 26,299 | 5, 813 | 14,024 | 50,243 | 19,172 | 1,323 | 124,133 | ||||||||||||||||||||||||
| Retail | 12,989 | 22,005 | 2,063 | 14,197 | 17,036 | 16,895 | 32 | 85,217 | ||||||||||||||||||||||||
| Secured by mortgages on immovable property | 3,586 | 4,738 | 2,386 | 9, 555 | 10,719 | 9,525 | 107 | 40,615 | ||||||||||||||||||||||||
| Exposures in default | 662 | 1,449 | 218 | 342 | 585 | 699 | 5 | 3, 960 | ||||||||||||||||||||||||
| Exposures associated with particularly high risk | 113 | 110 | 0 | 363 | 199 | 332 | – | 1,117 | ||||||||||||||||||||||||
| Covered bonds | – | – | – | – | – | – | – | – | ||||||||||||||||||||||||
| Claims on institutions and corporates with a short-term | 0 | – | – | 0 | – | 3 | – | 3 | ||||||||||||||||||||||||
| Collective investments undertakings | 8 | – | 24 | 0 | 32 | – | 12 | 75 | ||||||||||||||||||||||||
| Equity exposures | – | – | – | – | – | – | – | – | ||||||||||||||||||||||||
| Other exposures | 5,990 | 2,002 | 383 | 4,722 | 2,089 | 2,879 | (0) | 18,064 | ||||||||||||||||||||||||
| Total standardised approach | 107,115 | 73,525 | 28,499 | 71,399 | 97,513 | 62,614 | 2,253 | 442,917 | ||||||||||||||||||||||||
| Total | 312,292 | 74,102 | 113,217 | 108,743 | 118,793 | 66,221 | 16,326 | 809,694 | ||||||||||||||||||||||||
(1) Geographical areas have been determined based on the country of the counterparty.
(2) The table above shows original exposure net of credit risk adjustments reported in COREP statements of Credit Risk and Equity excluding securitisation exposures.
Million euros
| 12/31/2017 | Net EO of provisions(2) | |||||||||||||||||||||||||||||||
| Exposure Class (1) | Spain | Turkey | Eurasia | Mexico | USA | South America | Other areas | Total | ||||||||||||||||||||||||
| Central governments or central banks | 594 | – | 431 | 135 | 4,231 | 974 | 448 | 6, 813 | ||||||||||||||||||||||||
| Institutions | 44,341 | 26 | 48,044 | 505 | 2,543 | 540 | 1,056 | 97,056 | ||||||||||||||||||||||||
| Corporates | 61,137 | 499 | 36,571 | 18,512 | 10,291 | 2,246 | 1,307 | 130,564 | ||||||||||||||||||||||||
| Retail | 101,320 | 1 | 576 | 13,371 | 41 | 65 | 34 | 115,408 | ||||||||||||||||||||||||
| Equity | 5,771 | 157 | 263 | 811 | 201 | 468 | 126 | 7,798 | ||||||||||||||||||||||||
| Total IRB approach | 213,164 | 683 | 85,886 | 33,333 | 17,308 | 4,294 | 2,972 | 357,639 | ||||||||||||||||||||||||
| Central governments or central banks | 63,669 | 16,533 | 11,186 | 14,475 | 6,037 | 10,456 | – | 122,356 | ||||||||||||||||||||||||
| Regional governments or local authorities | 687 | 31 | 84 | 2,030 | 7,135 | 166 | – | 10,133 | ||||||||||||||||||||||||
| Public sector entities | 2 | 75 | 29 | 756 | – | 689 | – | 1, 552 | ||||||||||||||||||||||||
| Multilateral development banks | – | 5 | 36 | – | 3 | 48 | – | 93 | ||||||||||||||||||||||||
| International organisations | – | – | 1 | – | – | – | – | 1 | ||||||||||||||||||||||||
| Institutions | 1,265 | 2,467 | 6, 867 | 6,033 | 1,826 | 3,509 | 193 | 22,159 | ||||||||||||||||||||||||
| Corporates | 3,326 | 31,413 | 8,300 | 15,076 | 46,746 | 24,941 | 660 | 130,461 | ||||||||||||||||||||||||
| Retail | 13,354 | 25,767 | 1, 928 | 12,008 | 14,656 | 23,790 | 23 | 91,527 | ||||||||||||||||||||||||
| Secured by mortgages on immovable property | 4,751 | 8,506 | 2,332 | 10,685 | 9,360 | 13,851 | 60 | 49,545 | ||||||||||||||||||||||||
| Exposures in default | 1,401 | 1, 583 | 516 | 471 | 296 | 839 | 2 | 5, 108 | ||||||||||||||||||||||||
| Exposures associated with particularly high risk | 170 | 147 | – | 418 | 1,055 | 700 | – | 2,489 | ||||||||||||||||||||||||
| Covered bonds | – | – | – | – | – | – | – | – | ||||||||||||||||||||||||
| Claims on institutions and corporates with a short-term credit assesment | – | – | 16 | 8 | – | – | – | 25 | ||||||||||||||||||||||||
| Collective investments undertakings | 1 | – | 26 | – | 8 | – | – | 34 | ||||||||||||||||||||||||
| Equity exposures | – | – | – | – | – | – | – | – | ||||||||||||||||||||||||
| Other exposures | 9,227 | 1,988 | 350 | 4,846 | 1,718 | 3,037 | – | 21,166 | ||||||||||||||||||||||||
| Total standardised approach | 97,853 | 88,516 | 31,670 | 66,807 | 88,840 | 82,026 | 937 | 456,649 | ||||||||||||||||||||||||
| Total | 311,017 | 89,199 | 117,556 | 100,140 | 106,147 | 86,320 | 3,909 | 814,288 | ||||||||||||||||||||||||
(1) Geographical areas have been determined based on the country of the counterparty.
(2) The table above shows original exposure net of credit risk adjustments reported in COREP statements of Credit Risk and Equity excluding securitisation exposures.
| 68 |
Table of Contents
It also shows graphically the distribution of original exposure by geographic area, revealing the Group’s high level of geographical diversification, which constitutes one of the key levers for its strategic growth.
CHART 7: Distribution by geographical area of credit risk exposure
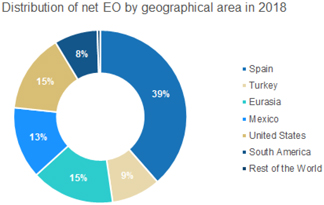
The next table shows the distribution by geographical area of the defaulted and impaired exposures of financial assets and contingent risks, as well as the adjustments for credit risk:
TABLE 14: EUCR1-C - Credit quality of exposure by geography (including counterparty credit risk)
Million euros
| Gross Original exposure (1) | ||||||||||||||||||||||||
| 12/31/2018 | Defaulted exposures | Non-defaulted exposures | Credit risk adjustment | Accumulated write-offs | Credit risk adjustment charges of the period | Net values | ||||||||||||||||||
| Spain | 10,280 | 307,956 | (5,943) | 24,328 | 3,019 | 312,292 | ||||||||||||||||||
| Turkey | 2, 556 | 73,473 | (1,928) | 377 | (718) | 74,102 | ||||||||||||||||||
| Eurasia | 817 | 113,179 | (779) | 304 | (96) | 113,217 | ||||||||||||||||||
| Mexico | 1, 162 | 109,226 | (1,645) | 2,272 | (631) | 108,743 | ||||||||||||||||||
| USA | 883 | 118,455 | (545) | 3,857 | 55 | 118,793 | ||||||||||||||||||
| South America | 1, 885 | 66,392 | (2,056) | 1, 169 | (653) | 66,221 | ||||||||||||||||||
| Other areas | 86 | 16,263 | (23) | 49 | (11) | 16,326 | ||||||||||||||||||
| Total | 17,670 | 804,943 | (12,920) | 32,355 | 964 | 809,694 | ||||||||||||||||||
(1) The table above shows original exposure net of credit risk adjustments reported in COREP statements of Credit Risk and Equity excluding securitisation exposures. |
| |||||||||||||||||||||||
| Million euros |
| |||||||||||||||||||||||
| Gross Original exposure (1) | ||||||||||||||||||||||||
| 12/31/2017 | Defaulted exposures | Non-defaulted exposures | Credit risk adjustment | Accumulated write-offs | Credit risk adjustment charges of the period | Net values | ||||||||||||||||||
| Spain | 14,074 | 305,906 | (8,963) | 23,133 | 837 | 311,017 | ||||||||||||||||||
| Turkey | 2,341 | 88,067 | (1,209) | 40 | 842 | 89,199 | ||||||||||||||||||
| Eurasia | 1,079 | 117,159 | (682) | 288 | 232 | 117,556 | ||||||||||||||||||
| Mexico | 1,125 | 100,029 | (1,014) | 2,065 | 473 | 100,140 | ||||||||||||||||||
| USA | 958 | 105,790 | (601) | 3, 408 | 395 | 106,147 | ||||||||||||||||||
| South America | 2,039 | 85,684 | (1,403) | 1,171 | 388 | 86,320 | ||||||||||||||||||
| Other areas | 68 | 3, 852 | (12) | 51 | 73 | 3,909 | ||||||||||||||||||
| Total | 21,685 | 806,487 | (13,884) | 30,156 | 3,240 | 814,288 | ||||||||||||||||||
(*) CCR is included, whose corrections for impairment as of December, 31, 2017 amounted to 10 million euros
(1) The table above shows original exposure net of credit risk adjustments reported in COREP statements of Credit Risk and Equity excluding securitisation exposures.
| 3.2.3.4. | Credit quality of exposure by exposure class and instrument |
Below is the value of the exposures by exposure class, broken down into defaulted andnon-defaulted exposures as of December 31, 2018: This table excludes exposures subject to the Counterparty Risk framework under Part 3, Title II, Chapter IV of the CRR, as well as
| 69 |
Table of Contents
exposures subject to the Securitisation framework as defined in Part 3, Title II, chapter V of the CRR.
TABLE 15: EUCR1-A - Credit quality of exposures by exposure class and instrument (excluding counterparty credit risk)
Million euros
| Gross Original exposure (4) | ||||||||||||||||||||||||
| 12/31/2018 | Defaulted exposures | Non-defaulted exposures | Credit risk adjustment | Accumulated write-offs | Credit risk adjustment charges of the period | Net values (3) | ||||||||||||||||||
| Central governments or central banks | 80 | 5,786 | 5 | 10 | 1 | 5,862 | ||||||||||||||||||
| Institutions | 161 | 32,477 | 58 | 19 | (5) | 32,581 | ||||||||||||||||||
| Corporates | 4,017 | 128,116 | 2,176 | 5,402 | (1,271) | 129,957 | ||||||||||||||||||
Of which: Specialised lending | 161 | 6,510 | 73 | 1,635 | (36) | 6,597 | ||||||||||||||||||
Of which: SMEs | 2,006 | 17,774 | 1,103 | - | (717) | 18,677 | ||||||||||||||||||
Of which: Others | 1,851 | 103,832 | 999 | 3,767 | (518) | 104,683 | ||||||||||||||||||
| Retail | 4,778 | 113,425 | 2,660 | 2, 056 | 321 | 115,544 | ||||||||||||||||||
Secured by real estate property | 3,672 | 77,800 | 1,330 | 1,170 | 138 | 80,142 | ||||||||||||||||||
Qualifying revolving | 199 | 21,968 | 584 | 51 | 57 | 21,583 | ||||||||||||||||||
Other retail | 907 | 13,657 | 745 | 835 | 126 | 13,819 | ||||||||||||||||||
SMEs | 418 | 3,707 | 281 | 142 | 83 | 3,844 | ||||||||||||||||||
Non-SMEs | 489 | 9,950 | 464 | 692 | 43 | 9,975 | ||||||||||||||||||
| Equity | - | 6,822 | - | - | - | 6,822 | ||||||||||||||||||
| Total IRB approach | 9,037 | 286,627 | 4,898 | 7,487 | (954) | 290,765 | ||||||||||||||||||
| Central governments or central banks | 8 | 114,627 | 33 | 9 | (15) | 114,593 | ||||||||||||||||||
| Regional governments or local authorities | - | 10,203 | 23 | 21 | 16 | 10,180 | ||||||||||||||||||
| Public sector entities | 0 | 990 | 9 | 20 | 4 | 981 | ||||||||||||||||||
| Multilateral development banks | - | 265 | 0 | - | (1) | 265 | ||||||||||||||||||
| International organisations | 0 | 0 | - | - | - | 0 | ||||||||||||||||||
| Institutions | 25 | 28,139 | 14 | 11 | (2) | 28,124 | ||||||||||||||||||
| Corporates | 3,484 | 122,816 | 1,181 | 16,315 | (432) | 121,635 | ||||||||||||||||||
| Retail | 3,486 | 86,916 | 1,722 | 3, 596 | 476 | 85,194 | ||||||||||||||||||
| Secured by mortgages on immovable property | 1, 416 | 40,917 | 302 | 2,733 | (37) | 40,615 | ||||||||||||||||||
| Exposures in default(1) | 8,588 | - | 4,649 | - | 4 | 3, 939 | ||||||||||||||||||
Exposures associated with particularly high risk(2) | 30 | 1,138 | 51 | 147 | (17) | 1,117 | ||||||||||||||||||
| Covered bonds | - | - | - | - | - | - | ||||||||||||||||||
| Claims on institutions and corporates with a short-term credit assesment | - | 3 | 0 | - | 0 | 3 | ||||||||||||||||||
| Collective investments undertakings | - | 69 | 1 | 9 | 0 | 69 | ||||||||||||||||||
| Equity exposures | - | - | - | - | - | - | ||||||||||||||||||
| Other exposures | 170 | 18,100 | 36 | 2, 009 | 3 | 18,064 | ||||||||||||||||||
| Total standardised approach | 8,618 | 424,184 | 8,022 | 24,869 | (1) | 424,781 | ||||||||||||||||||
| Total | 17,655 | 710,810 | 12,920 | 32,355 | (955) | 715,546 | ||||||||||||||||||
| Of which: Loans | 16,882 | 376,575 | 12,201 | 32,355 | (1,355) | 381,256 | ||||||||||||||||||
| Of which: Debt securities | 21 | 70,260 | 44 | - | (3) | 70,237 | ||||||||||||||||||
| Of which:Off-balance sheet exposures | 752 | 179,296 | 639 | - | 366 | 179,409 | ||||||||||||||||||
| Of which: Others | - | 84,679 | 36 | - | 37 | 84,644 | ||||||||||||||||||
(1) Exposures in default are additionally broken down by their respective original categories.
(2) Exposures associated with particularly high risk that are in default are reported in the column Exposures in default, since they are not included in the total amount of the exposures in default of the COREP of Credit Risk by standardised approach.
(3) Net exposure is calculated as follows:
- Net exposure by standardised approach =Non-defaulted exposures - Credit risk adjustment; except Exposures in default and Items associated with particularly high risk that are calculated as exposures by IRB approach do;
- Net exposure by IRB approach = Exposures in default +Non-defaulted exposures - Credit risk adjustment
(4) The table above shows gross original exposure of COREP statements of Credit Risk and Equity exposures by standardised and IRB approach.
| 70 |
Table of Contents
| Million euros | ||||||||||||||||||||||||
12/31/2017 | Gross Original exposure (4) | |||||||||||||||||||||||
Defaulted exposures | Non-defaulted exposures | Credit risk adjustment | Accumulated write-offs | Credit risk adjustment charges of the period | Net values (3) | |||||||||||||||||||
| Central governments or central banks | 96 | 5,567 | 4 | – | (74) | 5,660 | ||||||||||||||||||
| Institutions | 194 | 33,965 | 62 | 15 | 3 | 34,097 | ||||||||||||||||||
| Corporates | 6,207 | 124,490 | 3, 447 | 5,087 | (1,831) | 127,250 | ||||||||||||||||||
Of which: Specialised lending | 331 | 7,814 | 109 | 3,497 | (57) | 8,036 | ||||||||||||||||||
Of which: SMEs | 3,485 | 14,382 | 1,821 | 6 | (924) | 16,046 | ||||||||||||||||||
Of which: Others | 2,392 | 102,294 | 1,518 | 1,583 | (850) | 103,168 | ||||||||||||||||||
| Retail | 5, 397 | 112,342 | 2, 339 | 1, 609 | (238) | 115,400 | ||||||||||||||||||
Secured by real estate property | 4, 479 | 79,887 | 1,192 | 772 | (403) | 83,174 | ||||||||||||||||||
Qualifying revolving | 168 | 20,457 | 527 | 51 | 15 | 20,098 | ||||||||||||||||||
Other retail | 750 | 11,998 | 620 | 785 | 150 | 12,128 | ||||||||||||||||||
SMEs | 367 | 3,483 | 199 | 100 | 61 | 3, 651 | ||||||||||||||||||
Non-SMEs | 383 | 8, 515 | 421 | 685 | 89 | 8,477 | ||||||||||||||||||
| Equity | – | 7,798 | – | – | – | 7,798 | ||||||||||||||||||
| Total IRB approach | 11,894 | 284,163 | 5,852 | 6,711 | (2,140) | 290,204 | ||||||||||||||||||
| Central governments or central banks | 141 | 116,594 | 48 | 9 | 13 | 116,546 | ||||||||||||||||||
| Regional governments or local authorities | 9 | 10,108 | 8 | 13 | 4 | 10,100 | ||||||||||||||||||
| Public sector entities | – | 1, 551 | 4 | 19 | (27) | 1,547 | ||||||||||||||||||
| Multilateral development banks | – | 93 | 1 | – | – | 93 | ||||||||||||||||||
| International organisations | – | 1 | – | – | – | 1 | ||||||||||||||||||
| Institutions | 79 | 15,048 | 17 | 23 | (32) | 15,031 | ||||||||||||||||||
| Corporates | 4,033 | 126,707 | 1,613 | 15,303 | (1,259) | 125,094 | ||||||||||||||||||
| Retail | 2,917 | 92,709 | 1,246 | 3, 565 | 592 | 91,463 | ||||||||||||||||||
| Secured by mortgages on immovable property | 2,107 | 49,883 | 339 | 2,466 | 29 | 49,545 | ||||||||||||||||||
| Exposures in default (1) | 9,753 | – | 4,645 | – | (261) | 5,107 | ||||||||||||||||||
| Exposures associated with particularly high risk (2) | 40 | 2, 518 | 67 | 153 | (74) | 2,490 | ||||||||||||||||||
| Covered bonds | – | – | – | – | – | – | ||||||||||||||||||
| Claims on institutions and corporates with a short-term credit assesment | – | 24 | – | – | (2) | 24 | ||||||||||||||||||
| Collective investments undertakings | 2 | 34 | – | 9 | – | 34 | ||||||||||||||||||
| Equity exposures | – | – | – | – | – | – | ||||||||||||||||||
| Other exposures | 465 | 21,200 | 34 | 1,856 | (91) | 21,166 | ||||||||||||||||||
| Total standardised approach | 9,792 | 436,472 | 8,022 | 23,445 | (1,107) | 438,242 | ||||||||||||||||||
| Total | 21,685 | 720,635 | 13,875 | 30,156 | 3,247 | 728,446 | ||||||||||||||||||
| Of which: Loans | 20,333 | 393,252 | 13,565 | 30,156 | (2,415) | 400,020 | ||||||||||||||||||
| Of which: Debt securities | 76 | 73,498 | 47 | – | (146) | 73,527 | ||||||||||||||||||
| Of which:Off-balance sheet exposures | 1,276 | 184,129 | 263 | – | (686) | 185,142 | ||||||||||||||||||
| Of which: Others | – | 69,756 | – | – | – | 69,756 | ||||||||||||||||||
(1) Exposures in default are additionally broken down by their respective categories of origin.
(2) Exposures associated with particularly high risk that are in default are reported in the column Exposures in default, since they are not included in the total amount of the exposures in default of the COREP of Credit Risk by standardised approach.
(3) Net exposure is calculated as follows:
- Net exposure by standardised approach =Non-defaulted exposures - Credit risk adjustment; except Exposures in default and Items associated with particularly high risk that are calculated as exposures by IRB approach do;
- Net exposure by IRB approach = Exposures in default +Non-defaulted exposures - Credit risk adjustment
(4) The table above shows gross original exposure of COREP statements of Credit Risk and Equity exposures by standardised and IRB approach.
| 3.2.3.5. | Distribution by sector |
The following table shows the distribution of original exposure by economic sector (standardised and advanced measurement approach) of original exposure net of provisions for financial assets and contingency risks, excluding counterparty risk, and including equity:
| 71 |
Table of Contents
TABLE 16: EUCRB-D - Concentration of exposures by industry or counterparty types (excluding counterparty credit risk)
Million euros
| 12/31/2018 | Farming, forestry | Mining and quarrying | Manufacturing Industry | Energy supply | Water supply | Construction | Wholesale retail | Transport and storage | Accommodation and food service activities | Information and communication | Financial insurance | Real estate activities | Professional, scientific and technical activities | Administrative and support service activities | Public defense, compulsory | Education | Human health Services and social work activities | Arts, entertainment recreation | Other services | Household activities as employers of domestic staff; Activities of households as products of goods and services for own use | Extraterritorial activities | Individuals activity | Total(1) | |||||||||||||||||||||||||||||||||||||||||||||||||||||||||||||||||||||
| Central governments or central banks | – | – | 0 | – | – | – | – | – | – | – | 2,315 | – | – | – | 3,547 | 0 | – | – | – | – | 0 | – | 5,862 | |||||||||||||||||||||||||||||||||||||||||||||||||||||||||||||||||||||
| Institutions | 2 | – | 259 | 486 | 284 | 731 | 18 | 1,716 | 8 | 27 | 10,781 | 425 | 189 | 29 | 17,488 | 1 | 79 | 28 | 5 | – | 26 | – | 32,581 | |||||||||||||||||||||||||||||||||||||||||||||||||||||||||||||||||||||
| Corporates | 1,045 | 5,249 | 39,078 | 15,269 | 1,426 | 10,245 | 15,779 | 4,342 | 3,956 | 5,450 | 9,049 | 6,109 | 5,713 | 2,813 | 1,869 | 250 | 1,024 | 693 | 595 | 3 | 0 | – | 129,957 | |||||||||||||||||||||||||||||||||||||||||||||||||||||||||||||||||||||
| Retail | 616 | 44 | 1,970 | 121 | 57 | 1,946 | 4,033 | 1,455 | 1,451 | 465 | 231 | 468 | 1,721 | 641 | 1 | 234 | 684 | 305 | 6,395 | 7 | – | 92,698 | 115,544 | |||||||||||||||||||||||||||||||||||||||||||||||||||||||||||||||||||||
| Equity | – | – | – | – | – | 809 | 0 | – | – | 2,981 | 2,329 | 5 | 0 | – | 26 | – | – | – | 672 | – | – | – | 6,822 | |||||||||||||||||||||||||||||||||||||||||||||||||||||||||||||||||||||
| Total IRB approach | 1,663 | 5,294 | 41,307 | 15,876 | 1,767 | 13,731 | 19,830 | 7,512 | 5,415 | 8,922 | 24,704 | 7,006 | 7,623 | 3,483 | 22,932 | 486 | 1,787 | 1,025 | 7,667 | 11 | 26 | 92,698 | 290,765 | |||||||||||||||||||||||||||||||||||||||||||||||||||||||||||||||||||||
| Central governments or central banks | 0 | – | 0 | 0 | – | 0 | 5 | 0 | 0 | 0 | 39,188 | 0 | 0 | 0 | 74,387 | 0 | 1 | 0 | 1,011 | – | 0 | – | 114,593 | |||||||||||||||||||||||||||||||||||||||||||||||||||||||||||||||||||||
| Regional governments or local authorities | (0) | – | 7 | 32 | 74 | 48 | 4 | 139 | (0) | 0 | 69 | 36 | 0 | 19 | 7,769 | 545 | 1,167 | 3 | 267 | – | 0 | – | 10,180 | |||||||||||||||||||||||||||||||||||||||||||||||||||||||||||||||||||||
| Public sector entities | – | – | 288 | 350 | 25 | 0 | 1 | 2 | 0 | – | 78 | – | 0 | 0 | 218 | 16 | 0 | 0 | 1 | – | – | – | 981 | |||||||||||||||||||||||||||||||||||||||||||||||||||||||||||||||||||||
| Multilateral development banks | – | – | – | – | – | – | – | – | – | – | 222 | – | – | – | 44 | – | – | – | – | – | – | – | 265 | |||||||||||||||||||||||||||||||||||||||||||||||||||||||||||||||||||||
| International organisations | – | – | – | – | – | – | – | – | – | – | – | – | – | – | – | – | 0 | – | 0 |
| – |
| 0 | – | 0 | |||||||||||||||||||||||||||||||||||||||||||||||||||||||||||||||||||
| Institutions | 2 | 0 | 728 | 0 | – | 1,732 | 92 | 5,280 | 2 | 18 | 19,073 | 56 | 195 | 46 | 154 | 0 | 176 | 0 | 571 | – | – | – | 28,124 | |||||||||||||||||||||||||||||||||||||||||||||||||||||||||||||||||||||
| Corporates | 3,078 | 2,624 | 31,037 | 7,032 | 645 | 4,152 | 14,993 | 6, 506 | 3,450 | 3.416 | 11,538 | 13,878 | 3,038 | 2,210 | 204 | 743 | 5,085 | 733 | 7,229 | 42 | 0 | – | 121,635 | |||||||||||||||||||||||||||||||||||||||||||||||||||||||||||||||||||||
| Retail | 4,166 | 281 | 4,729 | 304 | 57 | 2,737 | 10,539 | 1,900 | 1,235 | 486 | 738 | 860 | 2,434 | 1,151 | 299 | 1,197 | 1,428 | 287 | 4,786 | 9 | – | 45,571 | 85,194 | |||||||||||||||||||||||||||||||||||||||||||||||||||||||||||||||||||||
| Secured by mortgages on immovable property | 801 | 229 | 1,970 | 658 | 10 | 941 | 3,147 | 541 | 1,192 | 200 | 325 | 17,649 | 1,562 | 944 | 258 | 1,072 | 1,084 | 120 | 3,810 | 2 | – | 4,101 | 40,615 | |||||||||||||||||||||||||||||||||||||||||||||||||||||||||||||||||||||
| Exposures in default | 111 | 58 | 91 | 301 | 7 | 492 | 657 | 183 | 165 | 32 | 41 | 287 | 134 | 70 | 26 | 32 | 63 | 24 | 584 | 0 | 0 | 582 | 3,939 | |||||||||||||||||||||||||||||||||||||||||||||||||||||||||||||||||||||
| Exposures associated with particularly high risk | 1 | 0 | 1 | 0 | 0 | 292 | 14 | 0 | 32 | 0 | 118 | 494 | 3 | 4 | – | 0 | 1 | 0 | 25 | 0 | – | 131 | 1,117 | |||||||||||||||||||||||||||||||||||||||||||||||||||||||||||||||||||||
| Covered bonds | – | – | – | – | – | – | – | – | – | – | – | | – | | – | – | – | – | – | – | – | – | – | – | – | |||||||||||||||||||||||||||||||||||||||||||||||||||||||||||||||||||
| Claims on institutions and corporates with a short-term credit assesment | – | – | – | – | – | – | – | – | – | – | 3 | – | – | – | – | – | – | – | – | – | – | – | 3 | |||||||||||||||||||||||||||||||||||||||||||||||||||||||||||||||||||||
| Collective investments undertakings | – | – | – | – | – | – | – | – | – | – | 69 | – | – | – | – | – | – | – | – | – | – | – | 69 | |||||||||||||||||||||||||||||||||||||||||||||||||||||||||||||||||||||
| Equity exposures | – | – | – | – | – | – | – | – | – | – | – | – | – | – | – | – | – | – | – | – | – | – | – | |||||||||||||||||||||||||||||||||||||||||||||||||||||||||||||||||||||
| Other exposures | 0 | – | 0 | 0 | – | 0 | 0 | 0 | – | 1 | 10,104 | 922 | 56 | – | 0 | 0 | 0 | – | 6,981 | – | | – | | – | 18,064 | |||||||||||||||||||||||||||||||||||||||||||||||||||||||||||||||||||
| Total standardised approach | 8,158 | 3,192 | 38,853 | 8, 677 | 818 | 10,394 | 29,453 | 14,551 | 6,076 | 4,153 | 81,565 | 34,182 | 7,422 | 4,445 | 83,359 | 3,605 | 9, 005 | 1,167 | 25,264 | 53 | 0 | 50,385 | 424,781 | |||||||||||||||||||||||||||||||||||||||||||||||||||||||||||||||||||||
| Total | 9,822 | 8,486 | 80,160 | 24,554 | 2,585 | 24,125 | 49,283 | 22,064 | 11,491 | 13,075 | 106,269 | 41,189 | 15,045 | 7,929 | 106,291 | 4,091 | 10,792 | 2,192 | 32,931 | 64 | 26 | 143,083 | 715,546 | |||||||||||||||||||||||||||||||||||||||||||||||||||||||||||||||||||||
(1) The table above shows original exposure net of credit risk adjustments reported in COREP statements of Credit Risk and Equity excluding securitisation exposures.
Million euros
| 12/31/2017 | Farming, forestry | Mining and quarrying | Manufacturing Industry | Energy supply | Water supply | Construction | Wholesale retail | Transport and storage | Accommodation and food service activities | Information and communication | Financial insurance | Real estate activities | Professional, activities | Administrative and support service activities | Public defense, compulsory | Education | Human health Services and social work activities | Arts, entertainment recreation | Other services | Household activities as employers of domestic staff; Activities of households as products of goods and services for own use | Extraterritorial activities | Individuals activity | Total(1) | |||||||||||||||||||||||||||||||||||||||||||||||||||||||||||||||||||||
| Central governments or central banks | – | – | – | – | – | – | – | – | – | – | 4,281 | – | – | – | 1,378 | 0 | – | – | – | – | 0 |
| – |
| 5,660 | |||||||||||||||||||||||||||||||||||||||||||||||||||||||||||||||||||
| Institutions | 9 | 1 | 382 | 481 | 221 | 413 | 23 | 1,784 | 6 | 6 | 10,486 | 222 | 95 | 42 | 19,713 | 4 | 83 | 3 | 107 | – | 15 | – | 34,097 | |||||||||||||||||||||||||||||||||||||||||||||||||||||||||||||||||||||
| Corporates | 1,755 | 4,873 | 34,298 | 13,210 | 924 | 12,469 | 16,070 | 4, 744 | 5,270 | 6,614 | 10, 024 | 5,347 | 6,105 | 2,695 | 63 | 185 | 882 | 937 | 687 | 2 | 94 | – | 127,250 | |||||||||||||||||||||||||||||||||||||||||||||||||||||||||||||||||||||
| Retail | 624 | 47 | 1,833 | 119 | 54 | 1,881 | 3,809 | 1,412 | 1,464 | 462 | 231 | 460 | 1,658 | 662 | – | 224 | 660 | 300 | 5,510 | 9 | – | 93,983 | 115,400 | |||||||||||||||||||||||||||||||||||||||||||||||||||||||||||||||||||||
| Equity | 0 | – | 68 | 46 | 3 | 309 | – | – | – | 3,548 | 2, 974 | 279 | 7 | (84) | 28 | – | – | 5 | 614 | – | – | – | 7,798 | |||||||||||||||||||||||||||||||||||||||||||||||||||||||||||||||||||||
| Total IRB approach | 2,388 | 4,921 | 36,582 | 13,856 | 1,202 | 15,073 | 19,902 | 7,939 | 6,740 | 10,630 | 27,996 | 6,309 | 7,865 | 3,314 | 21,182 | 413 | 1,626 | 1,246 | 6,918 | 11 | 109 | 93,983 | 290,204 | |||||||||||||||||||||||||||||||||||||||||||||||||||||||||||||||||||||
| central governments or central banks | 0 | – | 1 | 8 | 18 | – | 1 | – | – | – | 40, 793 | – | 0 | – | 74,648 | 0 | 1 | – | 1,076 | – | 0 | – | 116,546 | |||||||||||||||||||||||||||||||||||||||||||||||||||||||||||||||||||||
| Regional governments or local authorities | 0 | 0 | 50 | 33 | 65 | 49 | 7 | 266 | 0 | 0 | 114 | 48 | 30 | 1 | 7,463 | 595 | 1,297 | 17 | 65 | – | 0 | – | 10,100 | |||||||||||||||||||||||||||||||||||||||||||||||||||||||||||||||||||||
| Public sector entities | 1 | 65 | 310 | 148 | 51 | 0 | 2 | 13 | 0 | – | – | 1 | 7 | 0 | 895 | 22 | 1 | 0 | 30 | – | – | – | 1,547 | |||||||||||||||||||||||||||||||||||||||||||||||||||||||||||||||||||||
| Multilateral development banks | – | – | – | – | – | – | – | – | – | – | 44 | – | – | – | 48 | – | – | – | – | – | – | – | 93 | |||||||||||||||||||||||||||||||||||||||||||||||||||||||||||||||||||||
| International Organisations | – | – | – | – | – | – | – | – | – | – | – | – | – | – | – | – | 0 | – | 0 | – | 1 | – | 1 | |||||||||||||||||||||||||||||||||||||||||||||||||||||||||||||||||||||
| institutions | 9 | – | 6 | 7 | – | 13 | 31 | 0 | – | 21 | 12,078 | 254 | 163 | 15 | 1,601 | 3 | 48 | – | 784 | – | – | – | 15,031 | |||||||||||||||||||||||||||||||||||||||||||||||||||||||||||||||||||||
| corporates | 1.558 | 5,764 | 31,176 | 7,951 | 698 | 4,071 | 15,417 | 7,559 | 3,248 | 3,269 | 7,037 | 10,497 | 3,141 | 2,144 | 6,938 | 853 | 4,829 | 701 | 8,205 | 37 | 0 | – | 125,094 | |||||||||||||||||||||||||||||||||||||||||||||||||||||||||||||||||||||
| Retail | 1,523 | 444 | 5,338 | 328 | 76 | 2,883 | 11,815 | 2,159 | 1,229 | 540 | 1,344 | 1,372 | 2,858 | 660 | – | 634 | 1,919 | 381 | 5,108 | 14 | – | 50,839 | 91,463 | |||||||||||||||||||||||||||||||||||||||||||||||||||||||||||||||||||||
| Secured by mortgages on immovable property | 509 | 548 | 2,378 | 1,054 | 27 | 1,553 | 3,871 | 929 | 1,396 | 382 | 2,372 | 18,644 | 2,154 | 269 | – | 779 | 1,696 | 210 | 3,664 | 3 | – | 7,105 | 49,545 | |||||||||||||||||||||||||||||||||||||||||||||||||||||||||||||||||||||
| Exposures in default | 79 | 141 | 249 | 42 | 16 | 448 | 347 | 135 | 123 | 20 | 11 | 250 | 274 | 38 | 14 | 18 | 51 | 32 | 1,324 | 0 | 0 | 1,495 | 5,107 | |||||||||||||||||||||||||||||||||||||||||||||||||||||||||||||||||||||
| Exposures associated with particularly high risk | 1 | 0 | 2 | 0 | 0 | 2,158 | 9 | 2 | 2 | 0 | 166 | 88 | 4 | 6 | 0 | 0 | 1 | 0 | 5 | – | – | 47 | 2,489 | |||||||||||||||||||||||||||||||||||||||||||||||||||||||||||||||||||||
| Covered bonds | – | – | – | – | – | – | – | – | – | – | – | – | – | – | – | – | – | – | – | – | – | – | – | |||||||||||||||||||||||||||||||||||||||||||||||||||||||||||||||||||||
| Claims on institutions and corporates with a short- term credit assesment | – | – | – | – | – | – | – | – | – | – | 25 | – | – | – | – | – | – | – | – | – | – | – | 25 | |||||||||||||||||||||||||||||||||||||||||||||||||||||||||||||||||||||
| Collective investments undertakings | – | – | – | – | – | – | – | – | – | – | 34 | – | – | 0 | – | – | – | – | – | – | – | – | 34 | |||||||||||||||||||||||||||||||||||||||||||||||||||||||||||||||||||||
| Equity exposures | – | – | – | – | – | – | – | – | – | – | – | – | – | – | – | – | – | – | – | – | – | | – | | – | |||||||||||||||||||||||||||||||||||||||||||||||||||||||||||||||||||
| Other exposures | 1 | 0 | 11 | – | 0 | 1 | 10 | 6 | 0 | 0 | 14,522 | 1 | 0 | 3 | 0 | 0 | 0 | – | 6,609 | – | | – | | – | 21,166 | |||||||||||||||||||||||||||||||||||||||||||||||||||||||||||||||||||
| Total standardised approach | 3,680 | 6,962 | 39,520 | 9, 573 | 950 | 11,176 | 31,511 | 11,069 | 5,998 | 4,232 | 78,541 | 31,155 | 8,632 | 3,137 | 91,608 | 2,904 | 9,843 | 1,340 | 26,869 | 54 | 2 | 59,486 | 438,242 | |||||||||||||||||||||||||||||||||||||||||||||||||||||||||||||||||||||
| Total | 6,069 | 11,883 | 76,102 | 23,429 | 2,152 | 26,248 | 51,413 | 19,008 | 12,738 | 14,862 | 106,537 | 37,464 | 16,496 | 6,451 | 112,789 | 3,318 | 11,469 | 2,587 | 33,787 | 65 | 111 | 153,468 | 728,446 | |||||||||||||||||||||||||||||||||||||||||||||||||||||||||||||||||||||
(1) The table above shows original exposure net of credit risk adjustments reported in COREP statements of Credit Risk and Equity excluding securitisation exposures.
| 72 |
Table of Contents
The next table shows the distribution by counterparty of the defaulted and impaired exposures of financial assets and contingent risks, as well as their corresponding adjustments for credit risk:
TABLE 17: EUCR1-B - Credit quality of exposures by industry or counterparty types (excluding counterparty credit risk)
Million euros
Gross Original Exposure (1) | Credit risk of the period | Net values | ||||||||||||||||||
| 12/31/2018 | Defaulted exposures | Non-defaulted exposures | Credit risk adjustment | |||||||||||||||||
| Agriculture, forestry and fishing | 288 | 9,837 | 303 | 119 | 9,822 | |||||||||||||||
| Mining and quarrying | 140 | 8,427 | 81 | (54) | 8,486 | |||||||||||||||
| Manufacturing | 1,429 | 80,167 | 1,437 | (78) | 80,160 | |||||||||||||||
| Electricity, gas, steam and air conditioning supply | 565 | 24,433 | 444 | 181 | 24,554 | |||||||||||||||
| Water supply | 27 | 2,595 | 37 | 10 | 2,585 | |||||||||||||||
| Construction | 1,871 | 23,509 | 1,255 | (1,127) | 24,125 | |||||||||||||||
| Wholesale and retail trade | 2,464 | 48,416 | 1,597 | 106 | 49,283 | |||||||||||||||
| Transport and storage | 664 | 21,879 | 480 | 29 | 22,064 | |||||||||||||||
| Accommodation and food service activities | 538 | 11,267 | 313 | (2) | 11,491 | |||||||||||||||
| Information and communication | 985 | 12,326 | 235 | 63 | 13,075 | |||||||||||||||
| Financial activities and insurance | 338 | 106,181 | 250 | 27 | 106,269 | |||||||||||||||
| Real estate activities | 960 | 40,898 | 669 | (149) | 41,189 | |||||||||||||||
| Professional, scientific and technical activities | 467 | 14,926 | 347 | (132) | 15,045 | |||||||||||||||
| Administrative and support service activities | 262 | 7,882 | 215 | 35 | 7,929 | |||||||||||||||
| Public administration and defence, compulsory social security | 259 | 106,150 | 118 | 56 | 106,291 | |||||||||||||||
| Education | 111 | 4,141 | 161 | 100 | 4,091 | |||||||||||||||
| Human health services and social work activities | 159 | 10,809 | 176 | 20 | 10,792 | |||||||||||||||
| Arts, entertainment and recreation | 102 | 2,148 | 58 | (3) | 2,192 | |||||||||||||||
| Other services | 843 | 32,793 | 705 | (305) | 32,931 | |||||||||||||||
| Household activities as employers of domestic staff; Activities of households as products of goods and services for own use | 1 | 64 | 1 | (0) | 64 | |||||||||||||||
| Extraterritorial organizations activities | 0 | 26 | 0 | 0 | 26 | |||||||||||||||
| Individuals without business activity | 5,183 | 141,937 | 4,037 | 149 | 143,083 | |||||||||||||||
| Total | 17,655 | 710,810 | 12,920 | (955) | 715,546 | |||||||||||||||
(1) The table above shows original exposure net of credit risk adjustments reported in COREP statements of Credit Risk and Equity excluding securitisation exposures.. |
| |||||||||||||||||||
| Million euros | ||||||||||||||||||||
| Gross Original Exposure (1) | Credit risk adjustment | Credit risk adjustment charges | Net values | |||||||||||||||||
12/31/2017
| Defaulted exposures | Non-defaulted exposures | ||||||||||||||||||
| Agriculture, forestry and fishing | 252 | 6,001 | 184 | (150) | 6,069 | |||||||||||||||
| Mining and quarrying | 247 | 11,770 | 135 | 132 | 11,883 | |||||||||||||||
| Manufacturing | 1,561 | 76,056 | 1,515 | 112 | 76,102 | |||||||||||||||
| Electricity, gas, steam and air conditioning supply | 251 | 23,441 | 263 | (294) | 23,429 | |||||||||||||||
| Water supply | 50 | 2,128 | 27 | (13) | 2,152 | |||||||||||||||
| Construction | 5,870 | 22,761 | 2,382 | 65 | 26,248 | |||||||||||||||
| Wholesale and retail trade | 2,133 | 50,771 | 1,491 | (572) | 51,413 | |||||||||||||||
| Transport and storage | 587 | 18,872 | 451 | (107) | 19,008 | |||||||||||||||
| Accommodation and food service activities | 587 | 12,466 | 315 | (318) | 12,738 | |||||||||||||||
| Information and communication | 133 | 14,901 | 172 | (189) | 14,862 | |||||||||||||||
| Financial activities and insurance | 182 | 106,578 | 223 | (236) | 106,537 | |||||||||||||||
| Real estate activities | 1,158 | 37,124 | 818 | (462) | 37,464 | |||||||||||||||
| Professional, scientific and technical activities | 768 | 16,207 | 479 | (331) | 16,496 | |||||||||||||||
| Administrative and support service activities | 265 | 6,367 | 180 | (139) | 6,451 | |||||||||||||||
| Public administration and defence, compulsory social security | 217 | 112,635 | 62 | 3 | 112,789 | |||||||||||||||
| Education | 65 | 3,313 | 61 | (29) | 3,318 | |||||||||||||||
| Human health services and social work activities | 156 | 11,469 | 156 | (102) | 11,469 | |||||||||||||||
| Arts, entertainment and recreation | 122 | 2,526 | 61 | (41) | 2,587 | |||||||||||||||
| Other services | 640 | 34,157 | 1,010 | 147 | 33,787 | |||||||||||||||
| Household activities as employers of domestic staff; Activities of households as products of goods and services for own use | 2 | 64 | 1 | (2) | 65 | |||||||||||||||
| Extraterritorial organizations activities | 1 | 111 | – | (1) | 111 | |||||||||||||||
| Individuals without business activity | 6,439 | 150,918 | 3,888 | (722) | 153,468 | |||||||||||||||
| Total | 21,686 | 720,635 | 13,875 | (3,247) | 728,446 | |||||||||||||||
(1) The table above shows original exposure net of credit risk adjustments reported in COREP statements of Credit Risk and Equity excluding securitisation exposures..
| 3.2.3.6. | Distribution by residual maturity |
The following table shows the distribution of original exposure net of credit risk adjustments by residual maturity of financial assets and contingency risks, broken down by exposure
| 73 |
Table of Contents
class under the standardised and advanced measurement approaches, excluding counterparty risk and including equity positions:
TABLE 18: EUCRB-E - Maturity of exposures (excluding counterparty credit risk)
Million euros
| Net exposure value(1) | ||||||||||||||||||||||||
| 12/31/2018 | On demand | < 1 year | > 1 year < 5 years | > 5 years | No stated maturity | Total | ||||||||||||||||||
| Central governments or central banks | 9 | 319 | 2,886 | 303 | 2,345 | 5,862 | ||||||||||||||||||
| Institutions | 205 | 7,219 | 8,707 | 11,098 | 5,353 | 32,581 | ||||||||||||||||||
| Corporates | 246 | 42,572 | 55,537 | 21,199 | 10,403 | 129,957 | ||||||||||||||||||
| Retail | 12 | 2,200 | 6,174 | 85,153 | 22,005 | 115,544 | ||||||||||||||||||
| Equity | – | – | – | – | 6,822 | 6,822 | ||||||||||||||||||
| Total IRB approach | 471 | 52,309 | 73,305 | 117,752 | 46,927 | 290,765 | ||||||||||||||||||
| Central governments or central banks | 11,308 | 37,868 | 16,741 | 47,789 | 887 | 114,593 | ||||||||||||||||||
| Regional governments or local authorities | 0 | 805 | 1,737 | 7,631 | 6 | 10,180 | ||||||||||||||||||
| Public sector entities | 7 | 770 | 144 | 17 | 43 | 981 | ||||||||||||||||||
| Multilateral development banks | 211 | 38 | 16 | – | – | 265 | ||||||||||||||||||
| International organisations | – | – | – | 0 | 0 | 0 | ||||||||||||||||||
| Institutions | 5,113 | 12,757 | 5,261 | 754 | 4,240 | 28,124 | ||||||||||||||||||
| Corporates | 10,635 | 37,301 | 50,879 | 20,520 | 2,300 | 121,635 | ||||||||||||||||||
| Retail | 2,611 | 28,222 | 30,134 | 15,993 | 8,233 | 85,194 | ||||||||||||||||||
| Secured by mortgages on immovable property | 304 | 4,689 | 4,517 | 31,094 | 12 | 40,615 | ||||||||||||||||||
| Exposures in default | 24 | 893 | 21 | 1,877 | 1,126 | 3,939 | ||||||||||||||||||
| Exposures associated with particularly high risk | – | 273 | 222 | 622 | 0 | 1,117 | ||||||||||||||||||
| Covered bonds | – | – | – | – | – | – | ||||||||||||||||||
| Claims on institutions and corporates with a short-term credit assesment | 1 | 1 | – | – | 1 | 3 | ||||||||||||||||||
| Collective investments undertakings | – | 47 | 20 | 1 | 1 | 69 | ||||||||||||||||||
| Equity exposures | – | – | – | – | – | – | ||||||||||||||||||
| Other exposures | 1,467 | 4,654 | 30 | 8 | 11,906 | 18,064 | ||||||||||||||||||
| Total standardised approach | 31,681 | 128,319 | 109,722 | 126,305 | 28,753 | 424,781 | ||||||||||||||||||
| Total | 32,151 | 180,628 | 183,027 | 244,058 | 75,681 | 715,546 | ||||||||||||||||||
(1) The table above shows original exposure net of credit risk adjustments reported in COREP statements of Credit Risk and Equity excluding securitisation exposures.
Million euros
| Net exposure value(1) | ||||||||||||||||||||||||
12/31/2017
| On demand | < 1 year | > 1 year < 5 years | > 5 years | No stated maturity | Total | ||||||||||||||||||
| Central governments or central banks | 5 | 569 | 423 | 504 | 4,159 | 5,660 | ||||||||||||||||||
| Institutions | 394 | 9,657 | 8,704 | 10,839 | 4,504 | 34,097 | ||||||||||||||||||
| Corporates | 351 | 45,794 | 47,627 | 23,922 | 9,555 | 127,250 | ||||||||||||||||||
| Retail | 18 | 1,801 | 6,041 | 86,998 | 20,541 | 115,400 | ||||||||||||||||||
| Equity | – | – | – | – | 7,798 | 7,798 | ||||||||||||||||||
| Total IRB approach | 768 | 57,821 | 62,795 | 122,263 | 46,557 | 290,204 | ||||||||||||||||||
| Central governments or central banks | 19,933 | 45,409 | 12,628 | 38,286 | 289 | 116,546 | ||||||||||||||||||
| Regional governments or local authorities | 97 | 484 | 1,505 | 7,990 | 25 | 10,100 | ||||||||||||||||||
| Public sector entities | 706 | 630 | 168 | 42 | 1 | 1,547 | ||||||||||||||||||
| Multilateral development banks | – | 55 | 37 | – | – | 93 | ||||||||||||||||||
| International organisations | – | 1 | – | – | – | 1 | ||||||||||||||||||
| Institutions | 4,707 | 5,479 | 3,852 | 769 | 224 | 15,031 | ||||||||||||||||||
| Corporates | 10,478 | 39,071 | 52,262 | 21,850 | 1,433 | 125,094 | ||||||||||||||||||
| Retail | 3,505 | 37,647 | 25,214 | 15,956 | 9,141 | 91,463 | ||||||||||||||||||
| Secured by mortgages on immovable property | 2,080 | 6,073 | 8,785 | 32,604 | 2 | 49,545 | ||||||||||||||||||
| Exposures in default | 70 | 578 | 450 | 2,025 | 1,985 | 5,107 | ||||||||||||||||||
| Exposures associated with particularly high risk | – | 1,227 | 1,080 | 182 | 1 | 2,489 | ||||||||||||||||||
| Covered bonds | – | – | – | – | – | – | ||||||||||||||||||
| Claims on institutions and corporates with a short-term credit assesment | 1 | 24 | – | – | 25 | |||||||||||||||||||
| Collective investments undertakings | – | – | 20 | 8 | 6 | 34 | ||||||||||||||||||
| Equity exposures | – | – | – | – | – | – | ||||||||||||||||||
| Other exposures | 1,821 | 5,328 | 38 | – | 13,978 | 21,166 | ||||||||||||||||||
| Total standardised approach | 43,398 | 142,006 | 106,039 | 119,713 | 27,086 | 438,242 | ||||||||||||||||||
| Total | 44,166 | 199,827 | 168,834 | 241,976 | 73,643 | 728,446 | ||||||||||||||||||
(1) The table above shows original exposure net of credit risk adjustments reported in COREP statements of Credit Risk and Equity excluding securitisation exposures.
The following table shows the distribution by gross carrying amount of the loans and debt securities by residual maturity
TABLE 19: EUCR1-D - Ageing ofpast-due exposures
| 74 |
Table of Contents
Million euros
| 12/31/2018 | Gross carrying values (1) | |||||||||||||||||||||||
| < 30 days | > 30 days < 60 days | > 60 days < 90 days | > 90 days< 180 days | >180 days < 1 year | > 1 year | |||||||||||||||||||
| Loans (2) | 9,737 | 5,556 | – | 1,347 | 1,876 | 4,207 | ||||||||||||||||||
| Debt securities | – | – | – | 8 | – | – | ||||||||||||||||||
| Total exposures | 9,737 | 5,556 | – | 1,355 | 1,876 | 4,207 | ||||||||||||||||||
(1) Accounting gross carrying values.
(2) Includes gross carrying value of reverse repo transactions.
Million euros
| 12/31/2017 | Gross carrying values (1) | |||||||||||||||||||||||
| < 30 days | > 30 days < 60 days | > 60 days < 90 days | > 90 days < 180 days | > 180 days < 1 year | > 1 year | |||||||||||||||||||
| Loans (2) | 3,432 | 759 | 503 | – | – | – | ||||||||||||||||||
| Debt securities | – | – | – | – | – | – | ||||||||||||||||||
| Total exposures | 3,432 | 759 | 503 | – | – | – | ||||||||||||||||||
(1) Accounting gross carrying values.
(2) Includes gross carrying value of reverse repo transactions.
| 3.2.3.7. | Total impairment losses for the period |
The following table shows details of impairment losses and allowances on financial assets and contingent risks and commitments, as well as derecognition of losses recognised previously in asset write-offs recorded directly in the income statement in 2018 and 2017:
TABLE 20: EUCR2-A - Changes in the stock of general and specific credit risk adjustments
Million euros
Accumulated credit
risk adjustment(1)
| Opening balance | 13,884 | |||
| Increases due to amounts set aside for estimated loan losses during the period | 7,040 | |||
| Decreases due to amounts reversed for estimated loan losses during the period | (4,105) | |||
| Decreases due to amounts taken against accumulated credit risk adjustments | (4,461) | |||
| Transfers between credit risk adjustments | 1,527 | |||
| Impact of exchange rate differences | (481) | |||
| Business combinations, including acquisitions and disposals of subsidiaries | (340) | |||
| IFRS9 Impact | 1,288 | |||
| Other adjustments | (1,432) | |||
| Closing balance | 12,920 | |||
| Recoveries on credit risk adjustments recorded directly to the statement of profit or loss | (573) | |||
| Specific credit risk adjustments directly recorded to the statement of profit or loss | 3,107 |
(1) Credit risk adjustments of on balance sheet items (including CCR) and credit risk adjustments of contingent commitments (off balance sheet items)
In addition, a movement in the stock ofnon-performing exposures in the balance sheet between December 31, 2018 and December 31, 2017 is shown below:
TABLE 21: EUCR2-B - Changes in the stock of defaulted and impaired loans and debt securities
Million euros
Gross carrying value
defaulted exposures(2)
| Opening balance (1) | 19,783 | |||
| Loans and debt securities that have defaulted or impaired since the last reporting period | 5,569 | |||
| Returned to non-defaulted status | (3,427) | |||
| Amounts written off | (5,076) | |||
| Other changes | 469 | |||
| Closing balance | 17,319 |
(1) Counterparty credit risk is included, but securitization exposures are excluded
(2) Accounting gross carrying values
| 75 |
Table of Contents
| 3.2.3.8. | Non-performing exposures and restructured and refinanced exposures |
Below is a table with a general overview of thenon-performing exposures and restructured and refinanced exposures:
TABLE 22: EUCR1-E -Non-performing exposures and forborne exposures
Million euros
| Gross carrying values of performing and non-performing exposures(1) | Accumulated impairment and provisions due to credit risk | Collaterals and financial guarantees received | ||||||||||||||||||||||||||||||||||||||||||||||||||
Of which: but past due > 30 days y < 90 | Of which: performing forborne | Of which: non-performing | On performing exposures | On non- performing | On non performing | Of which: forborne | ||||||||||||||||||||||||||||||||||||||||||||||
| 12/31/2018 | Total | Of which: defaulted | Of which: impaired | Of which: forborne | Of which: forborne | Of which: forborne | ||||||||||||||||||||||||||||||||||||||||||||||
| Debt Securities | 67,757 | – | – | 36 | 36 | 36 | – | (48) | – | (16) | – | – | – | |||||||||||||||||||||||||||||||||||||||
| Loans and advance | 451,810 | 4,227 | 7,165 | 16,357 | 16,357 | 16,357 | 10.003 | (4,451) | (683) | (7,760) | (4.202) | 5,570 | 8,427 | |||||||||||||||||||||||||||||||||||||||
| Off-Balance Sheet Exposures | 170,070 | – | 138 | 987 | 987 | – | 87 | (419) | (5) | (217) | (21) | 113 | – | |||||||||||||||||||||||||||||||||||||||
(1) Accounting gross carrying values
Million euros
Gross carrying values of performing and non-performing exposures(1) | Accumulated impairment and provisions due to credit risk | Collaterals and financial guarantees received | ||||||||||||||||||||||||||||||||||||||||||||||||||
Of which: but past days y < 90 days | Of which: performing forborne | Of which: non-performing | On performing exposures | On non- performing | On non performing | Of which: forborne | ||||||||||||||||||||||||||||||||||||||||||||||
| 12/31/2017 | Total | Of which: defaulted | Of which: impaired | Of which: forborne | Of which: forborne | Of which: forborne | ||||||||||||||||||||||||||||||||||||||||||||||
| Debt Securities | 70,701 | – | – | 66 | 66 | 66 | – | (21) | – | 28 | – | – | – | |||||||||||||||||||||||||||||||||||||||
| Loans and advance | 470,040 | 1,262 | 9,193 | 19,396 | 19,396 | 19,396 | 12,127 | (4,097) | (378) | (8,670) | (4,616) | 7,478 | 11,253 | |||||||||||||||||||||||||||||||||||||||
| Off-Balance Sheet Exposures | 185,405 | – | 110 | 1,276 | 1,276 | – | 142 | (327) | – | (251) | (29) | 128 | 18 | |||||||||||||||||||||||||||||||||||||||
(1) Accounting gross carrying values
| 3.2.4. | Information on the standardized approach |
| 3.2.4.1. | Identification of external rating agencies |
The external credit assessment institutions (ECAIs) appointed by the Group to determine the risk weightings applicable to its exposures are the following:Standard & Poor’s,Moody’s,Fitch andDBRS.
The exposures for which the ratings of eachECAI are used are those corresponding to the wholesale portfolios, involving “Sovereigns and central banks” in developed countries, and “Financial Institutions”.
In cases where a counterparty has ratings from differentECAIs, the Group follows the procedure laid down in Article 138 of the Solvency Regulations, which specifies the order of priority to be used in the assignment of ratings.
When two different credit ratings made by designatedECAIs are available for a rated exposure, the higher risk weighting will be applied. However, when there are more than two credit ratings for the same rated exposure, use is to be made of the two credit ratings that provide the lowest risk weightings. If the two lowest risk weightings coincide, then that weighting will be applied; if they do not coincide, the higher of the two will be applied.
The correspondence between the alphanumeric scale of each agency used and the risk categories used by the Group are defined in theFinal Draft Implementing Technical Standards on the mapping of ECAIs’ credit assessment under Article 136(1) and (3) of Regulation (UE) No. 575/2013; complying with the provisions of Article 136 of the CRR.
| 76 |
Table of Contents
| 3.2.4.2. | Assignment of the credit ratings of public share issues |
The number of cases and the amount of these assignments are not relevant for the Group in terms of admission and management of issuer credit risk.
| 3.2.4.3. | Exposure values before and after the application of credit risk mitigation techniques |
The original net exposure amounts for provisions and value adjustments, exposure after risk mitigation techniques, and RWA density for each exposure category by the standardized approach, are shown below, excluding securitisation and counterparty risk exposure which is presented in section 3.2.6 of this Report.
| 77 |
Table of Contents
TABLE 23: EU CR4 –standardized approach: credit risk exposure and credit risk mitigation effects
Million euros
| 12/31/2018 | Exposures before CCF and CRM (1) | Exposures post-CCF and CRM(2) | RWA (3) and RWA Density | |||||||||||||||||||||
| Exposure Class | On-balance sheet amount | Off-balance sheet amount | On-balance sheet amount | Off-balance sheet amount | RWA | RWA Density | ||||||||||||||||||
| Central governments or central banks | 111,247 | 3,346 | 137,615 | 549 | 30,247 | 22% | ||||||||||||||||||
| Regional governments or local authorities | 9, 683 | 497 | 6, 414 | 230 | 1,415 | 21% | ||||||||||||||||||
| Public sector entities | 824 | 157 | 1,757 | 51 | 714 | 39% | ||||||||||||||||||
| Multilateral development banks | 242 | 24 | 453 | – | 10 | 2% | ||||||||||||||||||
| International Organizations | 0 | 0 | 0 | 0 | _ | _ | ||||||||||||||||||
| Institutions | 14,236 | 13,888 | 14,236 | 1 874 | 4,991 | 31% | ||||||||||||||||||
| Corporates | 78,195 | 43,440 | 74,105 | 15,,851 | 88,046 | 98% | ||||||||||||||||||
| Retail | 54,130 | 31,064 | 50,039 | 2,403 | 36,753 | 70% | ||||||||||||||||||
| Secured by mortgages on immovable property | 40,470 | 146 | 40,389 | 68 | 15,466 | 38% | ||||||||||||||||||
| Exposures in default | 3, 487 | 453 | 3,346 | 245 | 4,127 | 115% | ||||||||||||||||||
| Exposures associated with particularly high risk | 1,116 | 1 | 1,101 | 0 | 1,652 | 150% | ||||||||||||||||||
| Covered bonds | – | – | – | – | – | – | ||||||||||||||||||
| Institutions and corporates with a short term credit assessment | 3 | – | 3 | – | 2 | 66% | ||||||||||||||||||
| Collective Investment Undertakings | 44 | 24 | 44 | 12 | 57 | 100% | ||||||||||||||||||
| Equity | – | – | – | – | – | – | ||||||||||||||||||
| Other Items | 18,064 | _ | 17,959 | 950 | 11,229 | 59% | ||||||||||||||||||
| Total | 331,743 | 93,038 | 347,461 | 22,236 | 194,707 | 53% | ||||||||||||||||||
(1) Net OE: Original Exposure net of credit risk adjustments
(2) EAD: Net Original Exposure of provisions, value adjustments after CRM and CCF
(3) RWAs: EAD after applying risk-weights.
Million euros
| 12/31/2017 | Exposures before CCF and CRM (1) | Exposures post-CCF and CRM (2) | RAW (3) and RWA Density | |||||||||||||||||||||
| Exposure Class | On-balance sheet amount | Off-balance sheet amount | On-balance sheet amount | Off-balance sheet amount | RWA | RWA Density | ||||||||||||||||||
| Central governments or central banks | 102,533 | 14,013 | 130,796 | 758 | 29,571 | 22% | ||||||||||||||||||
| Regional governments or local authorities | 9,257 | 843 | 5,948 | 538 | 1,246 | 19% | ||||||||||||||||||
| Public sector entities | 723 | 824 | 1,631 | 66 | 653 | 38% | ||||||||||||||||||
| Multilateral development banks | 72 | 21 | 191 | – | 14 | 7% | ||||||||||||||||||
| International Organizations | 1 | – | 1 | – | – | – | ||||||||||||||||||
| Institutions | 11,541 | 3,490 | 10,793 | 1,414 | 4,440 | 36% | ||||||||||||||||||
| Corporates | 80,252 | 44,841 | 76,054 | 15,755 | 90,120 | 98% | ||||||||||||||||||
| Retail | 57,755 | 33,708 | 53,391 | 2,204 | 39,146 | 70% | ||||||||||||||||||
| Secured by mortgages on immovable property | 49,031 | 513 | 48,416 | 324 | 19,609 | 40% | ||||||||||||||||||
| Exposures in default | 4,571 | 536 | 4,384 | 299 | 5,247 | 112% | ||||||||||||||||||
| Exposures associated with particularly high risk | 2,488 | 1 | 2,463 | – | 3,694 | 150% | ||||||||||||||||||
| Covered bonds | – | – | – | – | – | – | ||||||||||||||||||
| Institutions and corporates with a short term credit assessment | 25 | – | 25 | – | 5 | 20% | ||||||||||||||||||
| Collective Investment Undertakings | 9 | 26 | 9 | 15 | 24 | 100% | ||||||||||||||||||
| Equity | – | – | – | – | – | – | ||||||||||||||||||
| Other Items | 21,166 | – | 20,979 | 1,376 | 11,725 | 52% | ||||||||||||||||||
| Total | 339,425 | 98,817 | 355,080 | 22,750 | 205,493 | 54% | ||||||||||||||||||
(1) Net OE: Original Exposure net of credit risk adjustments
(2) EAD: Net Original Exposure of provisions, value adjustments after CRM and CCF
(3) RWAs: EAD after applying risk-weights.
In addition, the following tables present the amounts of net exposure, before and after the application of credit risk mitigation techniques, for different risk weightings and for the different exposure categories that correspond to the standardized approach for each exposure class for credit, counterparty and securitisation risk. method, excluding securitisation positions and counterparty credit risk exposure.
Exposure net of provisions and after applying CCF and CRM corresponding to counterparty risk are shown in tableEU-CCR3 of section 3.2.6 of this report.
| 78 |
Table of Contents
TABLE 24: Standardized approach: exposure values before the application of credit risk mitigation techniques
12/31/2018 Exposure Class | Risk Weight | Total credit exposures amount (pre CCF and pre-CRM | Million Euros of which: unrated (1) | |||||||||||||||||||||||||||||||||||||||||||||||||||||||||||||||||||||
| 0% | 2% | 4% | 10% | 20% | 35% | 50% | 70% | 75% | 100% | 150% | 250% | 370% | 1250% | Others | Deducted | |||||||||||||||||||||||||||||||||||||||||||||||||||||||||
| Central Government or central banks | 82,586 | – | – | – | 4,318 | – | 4,652 | – | – | 19,977 | 56 | 3,004 | – | – | – | – | 114,593 | 48,775 | ||||||||||||||||||||||||||||||||||||||||||||||||||||||
| Regional government or local authorities | 204 | – | – | – | 9,836 | – | 49 | – | – | 91 | – | – | – | – | – | – | 10,180 | 10,180 | ||||||||||||||||||||||||||||||||||||||||||||||||||||||
| Public sector entities | 1 | – | – | – | 200 | – | 454 | – | – | 325 | 0 | – | – | – | – | – | 981 | 588 | ||||||||||||||||||||||||||||||||||||||||||||||||||||||
| Multilateral development banks | 222 | – | – | – | – | – | 20 | – | – | 24 | – | – | – | – | – | – | 265 | 265 | ||||||||||||||||||||||||||||||||||||||||||||||||||||||
| International Organizations | 0 | – | – | – | – | – | – | – | – | – | – | – | – | – | – | – | 0 | – | ||||||||||||||||||||||||||||||||||||||||||||||||||||||
| Institutions | �� | – | 3,192 | – | – | 19,808 | – | 2,551 | – | – | 2,574 | 0 | – | – | – | – | – | 28,124 | 26,702 | |||||||||||||||||||||||||||||||||||||||||||||||||||||
| Corporates | – | – | – | – | 102 | – | 1,237 | – | – | 119,909 | 386 | – | – | – | – | – | 121,635 | 120,975 | ||||||||||||||||||||||||||||||||||||||||||||||||||||||
| Retail | – | – | – | – | – | – | – | – | 85,194 | – | – | – | – | – | 85,194 | 77,678 | ||||||||||||||||||||||||||||||||||||||||||||||||||||||||
| Secured by mortgages on immovable property | – | – | – | – | – | 33,035 | 6,178 | – | 493 | 909 | – | – | – | – | – | – | 40,615 | 38,246 | ||||||||||||||||||||||||||||||||||||||||||||||||||||||
| Exposures in default | – | – | – | – | – | – | – | – | – | 2,725 | 1,215 | – | – | – | – | – | 3,939 | 3,400 | ||||||||||||||||||||||||||||||||||||||||||||||||||||||
| Exposures associated with particularly high risk | – | – | – | – | – | – | – | – | – | – | 1,117 | – | – | – | – | – | 1,117 | 632 | ||||||||||||||||||||||||||||||||||||||||||||||||||||||
| Covered bonds | – | – | – | – | – | – | – | – | – | – | – | – | – | – | – | – | – | – | ||||||||||||||||||||||||||||||||||||||||||||||||||||||
| Institutions and corporates with a short-term | – | – | – | – | – | – | – | – | – | – | – | – | – | – | – | – | – | – | ||||||||||||||||||||||||||||||||||||||||||||||||||||||
| credit assessment | – | – | – | – | 1 | – | – | – | – | 2 | – | – | – | – | – | – | 3 | 1 | ||||||||||||||||||||||||||||||||||||||||||||||||||||||
| Collective investment undertakings | – | – | – | – | – | – | – | – | – | 69 | – | – | – | – | – | – | 69 | 69 | ||||||||||||||||||||||||||||||||||||||||||||||||||||||
| Other Items | 5,595 | – | – | – | – | – | – | – | – | 12,469 | 0 | – | – | – | – | – | 18,064 | 17,926 | ||||||||||||||||||||||||||||||||||||||||||||||||||||||
| Equity | – | – | – | – | – | – | – | – | – | – | – | – | – | – | – | – | – | |||||||||||||||||||||||||||||||||||||||||||||||||||||||
| Total | 88,608 | 3,192 | – | – | 34,265 | 33,035 | 15,142 | – | 85,687 | 159,074 | 2,774 | 3,004 | – | – | – | – | 424,781 | 345,456 | ||||||||||||||||||||||||||||||||||||||||||||||||||||||
(1) Of which: Unrated refers to exposures for which no credit rating from designated ECAIs is available
12/31/2017 Exposure Class | Risk Weight | Total credit exposures amount (pre CCF and pre-CRM | Million Euros of which: unrated (1) | |||||||||||||||||||||||||||||||||||||||||||||||||||||||||||||||||||||
| 0% | 2% | 4% | 10% | 20% | 35% | 50% | 70% | 75% | 100% | 150% | 250% | 370% | 1250% | Others | Deducted | |||||||||||||||||||||||||||||||||||||||||||||||||||||||||
| Central Government or central banks | 74,193 | – | – | – | 14,826 | – | 4, 865 | – | – | 19,361 | 590 | 2,711 | – | – | – | – | 116,546 | 48,926 | ||||||||||||||||||||||||||||||||||||||||||||||||||||||
| Regional government or local authorities | 803 | – | – | – | 9,157 | – | 67 | – | – | 73 | – | – | – | – | – | – | 10,100 | 10,093 | ||||||||||||||||||||||||||||||||||||||||||||||||||||||
| Public sector entities | 2 | – | – | – | 918 | – | 254 | – | – | 343 | 30 | – | – | – | – | – | 1,547 | 1,344 | ||||||||||||||||||||||||||||||||||||||||||||||||||||||
| Multilateral development banks | 44 | – | – | – | – | – | 27 | – | – | 21 | – | – | – | – | – | – | 93 | 93 | ||||||||||||||||||||||||||||||||||||||||||||||||||||||
| International Organizations | 1 | – | – | – | – | – | – | – | – | – | – | – | – | – | – | – | 1 | 0 | ||||||||||||||||||||||||||||||||||||||||||||||||||||||
| Institutions | – | 497 | – | – | 9,250 | – | 2, 926 | – | – | 2,359 | – | – | – | – | – | – | 15,031 | 13,755 | ||||||||||||||||||||||||||||||||||||||||||||||||||||||
| Corporates | – | – | – | – | 358 | – | 309 | – | – | 124,134 | 293 | – | – | – | – | – | 125,094 | 124,690 | ||||||||||||||||||||||||||||||||||||||||||||||||||||||
| Retail | – | – | – | – | – | – | – | – | 91,463 | 91, 463 | – | – | – | – | – | – | 91,463 | 91,309 | ||||||||||||||||||||||||||||||||||||||||||||||||||||||
| Secured by mortgages on immovable property | – | – | – | – | – | 38,149 | 7,596 | – | 642 | 3,158 | – | – | – | – | – | – | 49,545 | 49,536 | ||||||||||||||||||||||||||||||||||||||||||||||||||||||
| Exposures in default | – | – | – | – | – | – | – | – | – | 3,751 | 1,356 | – | – | – | – | – | 5,107 | 5,103 | ||||||||||||||||||||||||||||||||||||||||||||||||||||||
| Exposures associated with particularly high risk | – | – | – | – | – | – | – | – | – | – | 2,489 | – | – | – | – | – | 2, 489 | 2, 489 | ||||||||||||||||||||||||||||||||||||||||||||||||||||||
| Covered bonds | – | – | – | – | – | – | – | – | – | – | – | – | – | – | – | – | – | – | ||||||||||||||||||||||||||||||||||||||||||||||||||||||
| Institutions and corporates with a short–term | – | – | – | – | 25 | – | – | – | – | 0 | – | – | – | – | – | – | 25 | 25 | ||||||||||||||||||||||||||||||||||||||||||||||||||||||
| Collective investment undertakings | – | – | – | – | – | – | – | – | – | 34 | – | – | – | – | – | – | 34 | 34 | ||||||||||||||||||||||||||||||||||||||||||||||||||||||
| Other Items | 5,371 | – | – | – | 5 | – | – | – | – | 15,783 | – | – | – | – | 6 | – | 21,166 | 21,060 | ||||||||||||||||||||||||||||||||||||||||||||||||||||||
| Equity | – | – | – | – | – | – | – | – | – | – | – | – | – | – | – | – | – | – | ||||||||||||||||||||||||||||||||||||||||||||||||||||||
| Total | 80,415 | 497 | – | – | 34,539 | 38,149 | 16,043 | – | 92,105 | 169,018 | 4,758 | 2,711 | – | – | 6 | – | 438,242 | 368,457 | ||||||||||||||||||||||||||||||||||||||||||||||||||||||
(1) Of which: Unrated refers to exposures for which no credit rating from designated ECAIs is available
| 79 |
Table of Contents
TABLE 25: EU CR5 –Standardised approach: Exposure values after the application of credit risk mitigation techniques
12/31/2018 Exposure Class | Risk Weight | Total | Million Euros of which: unrated (1) | |||||||||||||||||||||||||||||||||||||||||||||||||||||||||||||||||||||
| 0% | 2% | 4% | 10% | 20% | 35% | 50% | 70% | 75% | 100% | 150% | 250% | 370% | 1250% | Others | Deducted | |||||||||||||||||||||||||||||||||||||||||||||||||||||||||
| Central Government or central banks | 108,890 | – | – | – | 1,462 | – | 4,783 | – | – | 19,969 | 56 | 3,004 | – | – | – | – | 138,164 | 52,283 | ||||||||||||||||||||||||||||||||||||||||||||||||||||||
| Regional government or local authorities | 7 | – | – | – | 6,497 | – | 49 | – | – | 91 | – | – | – | – | – | – | 6,644 | 6,644 | ||||||||||||||||||||||||||||||||||||||||||||||||||||||
| Public sector entities | 47 | – | – | – | 1,084 | – | 362 | – | – | 316 | – | – | – | – | – | 1,809 | 570 | |||||||||||||||||||||||||||||||||||||||||||||||||||||||
| Multilateral development banks | 433 | – | – | – | – | – | 20 | – | – | – | – | – | – | – | – | – | 453 | 242 | ||||||||||||||||||||||||||||||||||||||||||||||||||||||
| International Organizations | 0 | – | – | – | – | – | – | – | – | – | – | – | – | – | – | – | 0 | – | ||||||||||||||||||||||||||||||||||||||||||||||||||||||
| Institutions | – | 3,123 | – | – | 8,782 | – | 2,066 | – | – | 2,139 | – | – | – | – | – | – | 16,110 | 15,183 | ||||||||||||||||||||||||||||||||||||||||||||||||||||||
| Corporates | – | – | – | – | 66 | – | 1,149 | – | – | 88,359 | 381 | – | – | – | – | – | 89,956 | 89,294 | ||||||||||||||||||||||||||||||||||||||||||||||||||||||
| Retail | – | – | – | – | – | – | – | – | 52,442 | – | – | – | – | – | – | – | 52,442 | 45,361 | ||||||||||||||||||||||||||||||||||||||||||||||||||||||
| Secured by mortgages on immovable property | – | – | – | – | – | 33,013 | 6,077 | – | 469 | 899 | – | – | – | – | – | – | 40,458 | 38,107 | ||||||||||||||||||||||||||||||||||||||||||||||||||||||
| Exposures in default | – | – | – | – | – | – | – | – | – | 2,519 | 1,072 | – | – | – | – | – | 3,591 | 3,111 | ||||||||||||||||||||||||||||||||||||||||||||||||||||||
| Exposures associated with particularly high risk | – | – | – | – | – | – | – | – | – | – | 1,101 | – | – | – | – | – | 1,101 | 631 | ||||||||||||||||||||||||||||||||||||||||||||||||||||||
| Covered bonds | – | – | – | – | – | – | – | – | – | – | – | – | – | – | – | – | – | – | ||||||||||||||||||||||||||||||||||||||||||||||||||||||
| Institutions and corporates with a short-term credit assessment | – | – | – | – | 1 | – | – | – | – | 2 | – | – | – | – | – | – | 3 | 1 | ||||||||||||||||||||||||||||||||||||||||||||||||||||||
| Collective investment undertakings | – | – | – | – | – | – | – | – | – | 57 | – | – | – | – | – | – | 57 | 57 | ||||||||||||||||||||||||||||||||||||||||||||||||||||||
| Other Items | 7,680 | – | – | – | – | – | – | – | – | 11,228 | – | – | – | – | – | – | 18,909 | 18,772 | ||||||||||||||||||||||||||||||||||||||||||||||||||||||
| Equity | – | – | – | – | – | – | – | – | – | – | – | – | – | – | – | – | – | – | ||||||||||||||||||||||||||||||||||||||||||||||||||||||
| Total | 117,057 | 3,123 | – | – | 17,892 | 33,013 | 14,506 | – | 52,911 | 125,578 | 2,612 | 3,004 | – | – | – | – | 369,696 | 270,283 | ||||||||||||||||||||||||||||||||||||||||||||||||||||||
(1) Of which: Unrated refers to exposures for which no credit rating from designated ECAIs is available
12/31/2017 Exposure Class | Risk Weight | Total | Million Euros Of which: | |||||||||||||||||||||||||||||||||||||||||||||||||||||||||||||||||||||
| 0% | 2% | 4% | 10% | 20% | 35% | 50% | 70% | 75% | 100% | 150% | 250% | 370% | 1250% | Others | Deducted | |||||||||||||||||||||||||||||||||||||||||||||||||||||||||
| Central Government or central banks | 102,481 | – | – | – | 2,197 | – | 4,214 | – | – | 19,361 | 590 | 2,711 | – | – | – | – | 131,554 | 53,518 | ||||||||||||||||||||||||||||||||||||||||||||||||||||||
| Regional government or local authorities | 651 | – | – | – | 5,695 | – | 67 | – | – | 73 | – | – | – | – | – | – | 6,486 | 6,486 | ||||||||||||||||||||||||||||||||||||||||||||||||||||||
| Public sector entities | 75 | – | – | – | 1,097 | – | 211 | – | – | 283 | 30 | – | – | – | – | – | 1,697 | 635 | ||||||||||||||||||||||||||||||||||||||||||||||||||||||
| Multilateral development banks | 163 | – | – | – | – | – | 27 | – | – | – | – | – | – | – | – | – | 191 | 72 | ||||||||||||||||||||||||||||||||||||||||||||||||||||||
| International Organizations | 1 | – | – | – | – | – | – | – | – | – | – | – | – | – | – | – | 1 | – | ||||||||||||||||||||||||||||||||||||||||||||||||||||||
| Institutions | – | 356 | – | – | 8,630 | – | 1,027 | – | – | 2,193 | – | – | – | – | – | – | 12,207 | 11,561 | ||||||||||||||||||||||||||||||||||||||||||||||||||||||
| Corporates | 351 | 298 | 90,870 | 290 | 91,808 | 91,427 | ||||||||||||||||||||||||||||||||||||||||||||||||||||||||||||||||||
| Retail | – | – | – | – | – | – | – | – | 55,595 | – | – | – | – | – | – | – | 55,595 | 55,435 | ||||||||||||||||||||||||||||||||||||||||||||||||||||||
| Secured by mortgages on immovable property | – | – | – | – | – | 37,695 | 7,427 | – | 630 | 2,989 | – | – | – | – | – | – | 48,740 | 48,732 | ||||||||||||||||||||||||||||||||||||||||||||||||||||||
| Exposures in default | – | – | – | – | – | – | – | – | – | 3,555 | 1,128 | – | – | – | – | – | 4,683 | 4,681 | ||||||||||||||||||||||||||||||||||||||||||||||||||||||
| Exposures associated with particularly high risk | – | – | – | – | – | – | – | – | – | – | 2,463 | – | – | – | – | – | 2,463 | 2,463 | ||||||||||||||||||||||||||||||||||||||||||||||||||||||
| Covered bonds | – | – | – | – | – | – | – | – | – | – | – | – | – | – | – | – | – | – | ||||||||||||||||||||||||||||||||||||||||||||||||||||||
| Institutions and corporates with a short-term credit assessment | – | – | – | – | 25 | – | – | – | – | – | – | – | – | – | – | – | 25 | 24 | ||||||||||||||||||||||||||||||||||||||||||||||||||||||
| Collective investment undertakings | – | – | – | – | – | – | – | – | – | 24 | – | – | – | – | – | – | 24 | 24 | ||||||||||||||||||||||||||||||||||||||||||||||||||||||
| Other Items | 10,630 | – | – | – | 5 | – | – | – | – | 11,714 | – | – | – | – | 6 | – | 22,356 | 22,241 | ||||||||||||||||||||||||||||||||||||||||||||||||||||||
| Equity | – | – | – | – | – | – | – | – | – | – | – | – | – | – | – | – | – | – | ||||||||||||||||||||||||||||||||||||||||||||||||||||||
| Total | 114,002 | 356 | – | – | 18,000 | 37,695 | 13,272 | – | 56,225 | 131,062 | 4,501 | 2,711 | – | – | 6 | – | 377,830 | 297,297 | ||||||||||||||||||||||||||||||||||||||||||||||||||||||
(1) Of which: Unrated refers to exposures for which no credit rating from designated ECAIs is available
| 80 |
Table of Contents
The following table presents the main variations in the period in terms of RWAs for the credit and counterparty credit risk standardised approach:
TABLE 26: RWA flow statement of credit risk exposures under the Standardized Approach
| Million Euros | ||||||||||||||||||||
| Credit Risk | Counterparty Credit Risk | |||||||||||||||||||
| RWA amounts | Capital Requirements | RWA amounts | Capital Requirements | |||||||||||||||||
| RWAs as of December 31, 2017 | 205,493 | 16,439 | 3,060 | 245 | ||||||||||||||||
| Asset size | 11,278 | 902 | 620 | 50 | ||||||||||||||||
| Asset quality | 454 | 36 | (11) | (1) | ||||||||||||||||
| Model updates | – | – | – | – | ||||||||||||||||
| Methodology and policy | – | – | – | – | ||||||||||||||||
| Acquisitions and disposals | (12,822) | (1,026) | (565) | (45) | ||||||||||||||||
| Foreign exchange movements | (9,859) | (789) | (97) | (8) | ||||||||||||||||
| Other | 164 | 13 | – | – | ||||||||||||||||
| RWAs as of December 31, 2018 | 194,707 | 15,577 | 3,008 | 241 | ||||||||||||||||
Throughout 2018, risk-weighted assets of credit risk measured using the standard method decreased by approximately EUR 10.79 billion, predominantly due to the sale of the Group’s stake in BBVA Chile, which was closed in the third quarter of 2018; and the depreciation of various currencies against the euro, primarily, the Turkish lira. Besides, the amount included in the asset size is affected by the inflationary impact on the Group’s exposures in Argentina and Venezuela.
| 3.2.5. | Information on the IRB approach |
| 3.2.5.1. | General information |
| 3.2.5.1.1. | Authorization by the supervisor to use the IRB model |
The following is a list of the models authorized by the supervisor for use in the calculation of capital requirements.
TABLE 27: Models authorized by the supervisor for use in the calculation of capital requirements
| Institution Portfolio | Portfolio | Number of models | Model description | |||
| Financial institutions | 4 | 1 Rating, 1 PD model, 1 LGD model, 1 EAD model | ||||
| Public institutions | 5 | 1 Rating, 1 PD model, 2 LGD models, 1 EAD model | ||||
| Specialized finance | 2 | 1 Slotting criteria, 1 EAD model | ||||
| Developers | 4 | 1 Rating, 1 PD model, 1 LGD model, 1 EAD model | ||||
| Small Corporates | 5 | 1 Rating, 1 PD model, 2 LGD models, 1 EAD model | ||||
BBVA S.A. | Medium-sized Corporates | 5 | 1 Rating, 1 PD model, 2 LGD models, 1 EAD model | |||
| Large Corporates | 5 | 1 Rating, 1 PD model, 2 LGD models, 1 EAD model | ||||
| Mortgages | 6 | 2 Scorings, 2 PD models, 1 LGD model, 1 EAD model | ||||
| Consumer finance | 5 | 2 Scorings, 2 PD models, 1 LGD model | ||||
| Credit cards | 10 | 2 Scorings, 2 PD models, 3 LGD models, 3 EAD models | ||||
| Automobiles | 4 | 2 Scorings, 1 PD model, 1 LGD model | ||||
BBVA Ireland | Financial institutions | 4 | 1 Rating, 1 PD model, 1 LGD model, 1 EAD model | |||
| Large Corporates | 5 | 1 Rating, 1 PD model, 2 LGD models, 1 EAD model | ||||
| Retail Revolving (Credit Cards) | 11 | 4 Scorings, 5 PD models, 1 LGD model, 1 EAD model | ||||
BBVA Bancomer | Large Corporates | 5 | 1 Rating, 1 PD model, 2 LGD models, 1 EAD model | |||
| Medium-sized Corporates | 5 | 1 Rating, 1 PD model, 2 LGD models, 1 EAD model | ||||
| BBVA Group | Equity | 1 | 1 capital model |
The main types of rating models used in the IRB portfolios are ratings for wholesale portfolios and proactive and reactive scorings in the case of retail portfolios.
The rating models give contracts/customers a score that orders customers according to their credit quality. This score is determined by the characteristics of the transactions, economic and financial conditions of the customer, information on payment behaviour, credit bureau, etc.
| 81 |
Table of Contents
The approval of the models by the supervisor includes both own estimations of the probability of default (PD), loss given default (LGD) and the internal estimation of credit conversion factors (CCFs).
The Group maintains its calendar established for receiving approval for additional Advanced Internal Models in different risk classes and geographical areas.
| 3.2.5.1.2. | Structure of internal rating systems and relationship between internal and external ratings |
The Group has rating tools for each one of the exposure categories listed in the Basel Accord.
The retail portfolio has scoring tools for determining the credit quality of transactions on the basis of information on the transaction itself and on the customer. The scoring models are algorithms calculated using statistical methods that score each transaction. This score reflects the transaction’s level of risk and is in direct relation to its probability of default (PD).
These decision models are the basic tool for deciding who should receive a loan and the amount to be granted, thereby contributing to both the arrangement and management of retail-type loans.
For the wholesale portfolio, the Group has rating tools that, unlike scorings, do not assess transactions but rather customers. The Group has different tools for rating the various customer segments: small companies, corporates, government and other government agencies, etc. In those wholesale portfolios where the number of defaults is very low (sovereign risks, corporates, financial institutions) the internal information is supplemented by the benchmarks of external rating agencies.
The PD estimates made by the Group are transferred to the Master Scale that is shown below, enabling a comparison to be made with the scales used by external agencies. This is shown below.
TABLE 28: Master Scale of BBVA’s rating
| External rating | Internal rating | Probability of default (basic points) | ||||||||||||
| Standard & Poor’s List | Reduced List (23 groups) | Average | Minimum from >= Maximum | |||||||||||
| AAA | AAA | 1 | – | 2 | ||||||||||
| AA+ | AA+ | 2 | 2 | 3 | ||||||||||
| AA | AA | 3 | 3 | 4 | ||||||||||
| AA– | AA– | 4 | 4 | 5 | ||||||||||
| A+ | A+ | 5 | 5 | 6 | ||||||||||
| A | A | 8 | 6 | 9 | ||||||||||
| A– | A– | 10 | 9 | 11 | ||||||||||
| BBB+ | BBB+ | 14 | 11 | 17 | ||||||||||
| BBB | BBB | 20 | 17 | 24 | ||||||||||
| BBB– | BBB– | 31 | 24 | 39 | ||||||||||
| BB+ | BB+ | 51 | 39 | 67 | ||||||||||
| BB | BB | 88 | 67 | 116 | ||||||||||
| BB– | BB– | 150 | 116 | 194 | ||||||||||
| B+ | B+ | 255 | 194 | 335 | ||||||||||
| B | B | 441 | 335 | 581 | ||||||||||
| B– | B– | 785 | 581 | 1,061 | ||||||||||
| CCC+ | CCC+ | 1,191 | 1,061 | 1,336 | ||||||||||
| CCC | CCC | 1,500 | 1,336 | 1,684 | ||||||||||
| CCC– | CCC– | 1,890 | 1,684 | 2,121 | ||||||||||
| CC+ | CC+ | 2,381 | 2,121 | 2,673 | ||||||||||
| CC | CC | 3,000 | 2,673 | 3,367 | ||||||||||
| CC– | CC– | 3,780 | 3,367 | 4,243 | ||||||||||
| 82 |
Table of Contents
| 3.2.5.1.3. | Use of internal estimations for purposes other than the calculation of capital requirements |
The Group’s internal estimations are a vital component of management based on value creation, giving rise to criteria for assessing the risk-returntrade-off.
These measures have a broad range of uses, from the adoption of strategic business decisions through to the individual admission of transactions.
Specifically, internal estimates are used in everyday business in support of credit-risk management through their inclusion in admission and monitoring processes, as well as in the pricing of transactions.
The management use of performance metrics that consider expected loss, economic capital and risk-adjusted return enables the monitoring of portfolios and the assessment ofnon-performing positions, among others.
| 3.2.5.1.4. | Process for managing and recognizing the effects of credit risk mitigation |
Mitigation is an iterative process whose purpose is to recognize the benefits of the existence of collateral and guarantees, ordering them from the highest to the lowest credit quality.
The Group uses risk mitigation techniques for exposures pertaining to the wholesale portfolio by replacing the obligor’s PD with that of the guarantor, in those cases in which the latter is eligible and its PD is lower than the obligor’s. In retail admission processes, the scoring contains the effect of the guarantor, and the recovery flows that are forthcoming throughout the cycle reflect the recoveries related to the guarantees associated with the contracts. This means that the effect of the guarantees is taken into account in the actual estimation of the loss given default for retail portfolios.
| 3.2.5.1.5. | Control mechanisms for internal rating systems |
The Group has a management framework for rating systems that includes all the phases of its life cycle: from the time when a need that triggers the construction or modification of a model is identified, until its use and monitoring.
An appropriate monitoring allows detection of unexpected behaviour, identification of incorrect use and even anticipation when changes in the risk profile of the portfolios or products require corrective action to be taken. The monitoring of the risk rating systems is made with a frequency that is appropriate to the nature of the model, the availability of new data, modelling techniques and the importance of its use in management. This is analysed from a twofold perspective: performance and use.
The monitoring of the performance has the aim of detecting deficiencies in the performance of the rating systems for risk anticipating its deterioration over time. It permits the determination whether they operate correctly, helping to verify that the components of the model operate as expected. The framework for monitoring performance can identify weaknesses and identify plans of action needed to ensure correct operation. This analytic framework, a fundamental component of the planning of risk models, establishes the minimum criteria that must be taken into account, as well as the metrics and thresholds to alert undesired behaviour.
The monitoring of the use aims to check that the model is used generally, for the planned uses, and appropriately. This control mechanism allows continued detection of deviations from the planned use of models, as well as the establishment of action plans for their correction.
| 83 |
Table of Contents
Additionally, the Group has an independent area of the developers of the rating systems and the departments responsible for its monitoring, whose main function is to carry effective contrasts to the internal models, in order to guarantee their accuracy, robustness and stability.
This review process is not restricted at the time of approval, or when updating the models, but rather is framed within such a plan that allows for a periodic evaluation of them, resulting in the issuance of recommendations and mitigating actions for the identified deficiencies.
The various aspects to be improved are detected during the review process are reflected in the validation reports by setting recommendations. These reports are presented to the established Risk Committees, together with the state of the action plans associated with the recommendations, to ensure their resolution and the proper operation of the rating systems at any time.
| 3.2.5.1.6. | Description of the internal rating process |
There follows a description of the internal classification processes according to each customer category:
| • | Central Banks and Central Governments: for this segment, the assignment of ratings is made by the Risk units appointed for this purpose, which periodically analyse this type of customers, rating them according to the parameters included in the corresponding rating model. There are 3 different methods currently in use for assigning country ratings: (i) ratings from external agencies, used for developed nations, emerging countries with elevated incomes and emerging countries where the Group has little risk; (ii) internal rating based on a proprietary tool used for emerging countries where the Group has an appreciable risk; and lastly (iii) the country risk ratings published by the Belgian export credit agency (which manages the quantitative model used by the OECD to assign its country risk ratings) for countries of marginal importance for the Group that have no external ratings. Sovereign ratings are generated in local and foreign currency for all the tools, as well as a transfer rating, which evaluates the risk of inconvertibility/transfer restrictions. |
In the case of emerging countries with presence of BBVA subsidiaries or branches, the rating in local currency is adjusted to that obtained by the emerging countries tool under the authorization of the Risk Committee assigned for this purpose.
| • | Institutions: the rating of Public Institutions is generally provided by the risk units responsible for their approval, on a yearly basis, coinciding with the review of customer risk or with the reporting of their accounts. |
In the case of financial institutions, the Risk unit responsible makes a regular classification of these customers, continuously monitoring them on domestic and international markets. External ratings are a key factor in assigning ratings for financial institutions.
| • | Large Companies: includes the rating of exposures with corporate business groups. The result is affected both by indicators of business risk (evaluation of the competitive environment, business positioning, regulation, etc.) and financial risk indicators (size of the group by sales, cash generation, levels of debt, financial flexibility, etc.). |
In accordance with the characteristics of the large companies segment, the rating model is global in nature, with specific algorithms by sector of activity and geographical adaptations. The rating of these customers is generally calculated
| 84 |
Table of Contents
within the framework of the annual risk review process, or the admission of new operations.
The responsibility for the assessment lies with the units originating the risk, while those approving it validate it when the decision is taken.
| • | Medium-sized companies: this segment also takes into account quantitative factors derived from economic and financial information, and qualitative factors that are related to the age of the company, the sector, management quality, etc. and alert factors derived from risk monitoring. |
As in the Corporate segment, the rating tends to run parallel to the admission process, so the responsibility for rating lies with the unit proposing the risk, while the decision-making level is in charge of validating it.
| • | Small Businesses: as in the case ofmedium-sized companies, this segment also takes into account quantitative factors derived from economic and financial information, and qualitative factors that are related to the age of the company, the sector, management quality, etc. and alert factors derived from risk monitoring. Similarly, the rating tends run parallel with the admission process, so the responsibility for rating is with the unit proposing the risk, while the decision-making level is in charge of validating it. |
| • | Specialised Lending: for classifying this segment, the Group has chosen to apply the supervisory slotting criteria approach, as included in the Basel Accord of June 2004 and in the Solvency Regulation (CRR article 153.5). |
| • | Developers: The rating of real-estate developers covers the rating of both the customers who are developers and the individual real-estate projects. Its use makes it easier to monitor and rate projects during their execution phase, as well as enriching the admission processes. |
| • | BBVA Bancomer companies: this segment also takes into account quantitative factors derived from economic and financial information and bureau information, as well as qualitative factors related to the age of the company, the sector, the quality of its management, etc. The rating tends to run parallel to the admission process, so that responsibility for the rating is with the unit originating the risk, while the decision-making body validates it. |
In general in the wholesale area, the rating of customers is not limited to admission, as the ratings are updated according to new information available at any time (economic and financial data, changes in the company, external factors, etc.)
| • | Retail: this has been broken down into each one of the exposure categories referred to by the correlations provided for in the sections defined in the Solvency Regulation. |
One of the most important processes in which scoring is fully integrated at the highest level and in all decision-making areas is the Group’s process for approving retail transactions. Scoring is an important factor for the analysis and resolution of transactions and it is a mandatory requirement to include it in decision-making on risk in those segments for which it has been designed. In the process of marketing and approving retail transactions, the manager is responsible for marketing management, the credit quality and the profitability, in other words, the customer’s integrated management, attending to the processes of admission, monitoring and control.
The rating process is as follows for each specific category of retail exposure:
| a. | Mortgages, consumer finance and retail credit cards - Spain: the manager collects data on the customer (personal, financial, banking |
| 85 |
Table of Contents
relationship information) and on the transaction (LTV, amount, maturity, destination etc.) and calculates the rating of the transaction with the scoring. The decision of whether it is approved is made based on the results of applying the model. |
| b. | Consumer Finance Autos Spain: the financing request may enter through the call centre or be directly recorded in web application by our authorized dealers. The necessary information on the customer (personal, financial information, authorization of the consultation to the external bureau of credit) and on the transaction (maturity, amount, etc.) is recorded to rate the transaction with the scoring. Once the validity of the information provided is obtained, the decision of whether to approve it is made based on the results of applying the model. |
| c. | Retail Revolving (BBVA Bancomer credit cards): the manager or specialist party gathers the necessary information on the customer (personal, financial information and authorization of the consult from the external bureau of credit) and on the transaction (limit requested) to rate the transaction with the scoring. There are additional processes for validating and checking this information through the back office or operational support areas. The decision of whether it is approved is made based on the results of applying the model. |
Behavioural: every month all the active cards are rated according to their transactional behaviour and payment status. |
Proactive: each month all the customers who have asset positions in credit cards, consumer finance or mortgages and liabilities positions are rated, based on information on internal behaviour and flows. |
| d. | Proactive - Spain: each month all the customers who have asset positions in credit cards, consumer finance or mortgages and first and second in liability seniority, are rated according to information on their behaviour. |
| • | Equity: for its portfolio position registered as equity, the Group is applying the rating obtained for customers as a result of their rating in the lending process. |
| 3.2.5.1.7. | Definitions, methods and data for estimating and validating risk parameters |
The estimation of the parameters is based on the uniform definition of default established at Group level. Specifically, for a contract or customer to be considered in a situation of default, the provisions of current regulations must be met.
Specifically, there are two approaches within the Group for considering default and estimating parameters:
| • | The contract-level approach is applied within the sphere of retail risk. Each customer transaction is dealt with as an independent unit in terms of credit risk. Therefore,non-compliance with credit obligations to the bank is handled at the transaction level, regardless of the behaviour of the customer with respect to other obligations. |
| • | The customer-level approach is applied to the remainder of the portfolio. The significant unit for defining default is the customer’s sum of contracts, which become defaulted jointly when the customer defaults. |
In addition, to avoid including defaults for small amounts in the estimations, defaulted volumes are to pass through a materiality filter that depends on the type of customer and transaction.
| 86 |
Table of Contents
Estimating parameters
In the case of Spain and Mexico, the Group has an RAR information system that reflects exposure to credit risk in the Group’s different portfolios included in advanced internal models.
This information system guarantees the availability of historical data recorded by the Group, which are used to estimate the parameters of Probability of Default (PD), Loss Given Default (LGD) and Credit Conversion Factors (CCF). These are then used to calculate the regulatory capital using the advanced measurement approach, economic capital and expected loss by credit risk.
Other sources of information for the Bank may be used in addition, depending on any new needs detected in the estimation process. Internal estimations of the PD, LGD and CCF parameters are made for all the Group’s portfolios.
In the case of low default portfolios (LDP), in which the number of defaults tends to be insufficient for obtaining empirical estimates, use is made of data from external agencies that are merged with the internal information available and expert criteria.
The following shows the estimation methodologies used for the PD, LGD and CCF risk parameters, for the purpose of calculating the capital requirements.
| • | Probability of default (PD) |
The methodology used for estimating the PD in those cases that have a mass of internal data of sufficient size is based on the creation of pools of exposures. The pools proposed with a view to calibration are defined by pooling contracts together seeking to achieve intra-group uniformity in terms of credit quality and differentiation with all the other risk groups. The largest possible number of pools is defined in order to allow a suitable discrimination of risk.
The fundamental metric used for making these groupings is the score, being supplemented by other metrics relevant to PD that are proven to be sufficiently discriminating depending on the portfolio.
Once the pools of exposures have been defined, the average empirical PD recorded for each one is obtained and adjusted to the cycle. This metric provides stable estimates over the course of the economic cycle, referred to asPD-TTC (through the cycle). This calculation considers the portfolio’s track record and provides long-term levels of PD.
In low default portfolios the empirical PDs observed by external credit assessment institutions are used to obtain the PD of internal risk groups.
Finally, in customer-focused portfolios there is a Master Scale, which is simply a standard and uniform rule for credit levels that makes it possible to make comparisons of credit quality in the Group’s different portfolios.
| • | Loss given default (LGD) |
As a general rule, the method used to estimate LGD in portfolios with a sufficient number of defaults is Workout LGD. Here, the LGD of a contract is obtained as a quotient of the sum of all the financial flows recorded during the recovery process that takes place when a transaction defaults and the transaction’s exposure at the time of default.
This estimate is made by considering all the historical data recorded in internal systems. When making the estimates, there are transactions that have already defaulted but for which the recovery process is still ongoing. The loss given default recorded at the time of the estimate is therefore higher than it will ultimately be. The necessary adjustments are made in these cases so as not to distort the estimate.
| 87 |
Table of Contents
These estimates are made by defining uniform risk groups in terms of the nature of the operations that determine loss given default. They are made in such a way that there are enough groups for each one to be distinguishable and receive a different estimate.
In keeping with the guidelines set out by the regulation, the estimates are made by distinguishing between wholesale and retail exposures.
There is insufficient historical experience to make a robust estimate in low default portfolios using the Workout LGD method, so external sources of information are used, combined with internal data to provide the portfolio with a representative rate of loss given default.
The loss given default rates estimated according to the internal databases the Group holds are conditioned to the moment of the cycle of the data window used, since loss given default varies over the economic cycle. Hence, the following concepts can be defined:long-run loss given default (LRLGD), downturn loss given default (DLGD), and best-estimate loss given default (LGD BE).
LRLGD is calculated by making an adjustment to capture the difference between the loss given default obtained empirically with the available sample and the average loss given default observed throughout the economic cycle if the observation of the cycle is complete.
In addition, the LGD observed in a period of stress in the economic cycle, the downturn loss given default (DLGD) is determined.
These estimates are made for those portfolios whose loss given default is noticeably sensitive to the cycle. The different ways in which the recovery cycles can conclude are determined for each portfolio where this LGD in conditions of stress has not yet been observed, and the level these parameters would have in a downturn situation are estimated.
Finally, LGD BE is determined according to the LGD observed in the BE period, which aims to cover the defaults closest in time to the present, in other words those that have been produced at a time of the economic cycle that is similar to the present and that also correspond to a very similar portfolio to the present one.
However, for defaulted transactions, the LGD at the worst time will be the LGD BE plus a stress, which is measured based on the own volatility of the LGD.
•Credit conversion factor (CCF)
As with the two preceding parameters, the exposure at the moment of default is another of the necessary inputs for calculating expected loss and regulatory capital. A contract’s exposure usually coincides with its balance. However, this does not hold true in all cases.
For example, for those products with explicit limits, such as credit cards or credit lines, the exposure should incorporate the potential increase in the balance that may be recorded up to the time of default.
In observance of regulatory requirements, exposure is calculated as the drawn balance, which is the real risk at any specific moment, plus a percentage (CCF) of the undrawn balance, which is the part that the customer can still use until the available limit is reached. Therefore, the CCF is defined as the percentage of the undrawn balance that is expected to be used before default occurs.
CCF is estimated by using the cohort approach1, analysing how the exposure varies from apre-established reference date through to the moment of default, obtaining the average performance according to the relevant metrics.
| 1 | A cohort is a twelve-month window that has a reference date (end of each month) and contains all delinquent transactions whose date of noncompliance occurs within said cohort. All operations must have a contract date prior to the reference date. |
| 88 |
Table of Contents
Different approaches are used for wholesale and retail type exposures. The contract approach analyses the exposure’s evolution until the contract’s moment of breach of contract, whereas the customer approach analyses changes in the exposure through to the time of default by the customer.
Once again, in low default portfolios there is insufficient historical experience to make a reliable calculation with the Workout LGD method defined. In this case, too, use is made of external sources that are combined with internal data to provide a representative CCF of the portfolio.
| 3.2.5.2. | Exposure values by category and PD range |
The following table presents the information on credit risk as of December 31, 2018 (excluding counterparty risk, which is set out in detail in Table CCR4 in section 3.2.6.2.2) using the internal ratings-based (IRB) approach, by obligor grade for the different categories of exposure:
| 89 |
Table of Contents
TABLE 29: EU CR6 - IRB approach: Credit risk exposure by exposure class and PD range
| PD Scale as of 12-31-18(1) | Original on-balance sheet gross exposure | Off-balance sheet exposures pre CCF | Average CCF(2) | EAD post CRM and post-CCF | Average PD(3) | Number of obligors | Average LGD(4) | Average Maturity (days)(5) | RWAs | RWA Density | EL | Value adjustments and provisions | ||||||||||||||||||||||||||||||||||||
| Prudential portfolios for FIRB approach(6) | 6,268 | 403 | 97.4% | 6,500 | – | 427 | – | 5,421 | 83.4% | 140 | (73) | |||||||||||||||||||||||||||||||||||||
| Corporate - Specialized lending | 6,268 | 403 | 97.4% | 6,500 | – | 427 | – | – | 5,421 | 83.4% | 140 | (73) | ||||||||||||||||||||||||||||||||||||
| Prudential portfolios for AIRB approach | 198,988 | 86,385 | 42.3% | 218,321 | 4.7% | 11,541,170 | 36.0% | 77,733 | 35.6% | 3,101 | (4,825) | |||||||||||||||||||||||||||||||||||||
| Central governments or central banks | 5,729 | 137 | 49.6% | 7,627 | 0.3% | 106 | 27.3% | 61 | 451 | 5.9% | 5 | (5) | ||||||||||||||||||||||||||||||||||||
| 0,00<0,15 | 5,294 | 19 | 49.4% | 7,350 | 0.0% | 29 | 26.7% | 64 | 354 | 4.8% | 1 | () | ||||||||||||||||||||||||||||||||||||
| 0,15<0,25 | 12 | 13 | 50.0% | 136 | 0.2% | 9 | 43.6% | 62 | 3 | 2.2% | 0 | () | ||||||||||||||||||||||||||||||||||||
| 0,25<0,50 | 8 | 0 | 50.1% | 33 | 0.3% | 5 | 44.0% | 41 | 2 | 7.3% | 0 | (1) | ||||||||||||||||||||||||||||||||||||
| 0,50<0,75 | – | 0 | 43.1% | 0 | 0.5% | 1 | 12.4% | 58 | 0 | 18.2% | - | – | ||||||||||||||||||||||||||||||||||||
| 0,75<2,50 | 128 | 2 | 49.1% | 5 | 1.1% | 16 | 34.1% | 40 | 3 | 62.4% | 0 | () | ||||||||||||||||||||||||||||||||||||
| 2,50<10,00 | 213 | 88 | 50.1% | 83 | 4.9% | 34 | 49.9% | 65 | 83 | 100.1% | 2 | (2) | ||||||||||||||||||||||||||||||||||||
| 10,00<100,00 | 1 | 7 | 50.6% | 4 | 21.2% | 2 | 18.9% | 5 | 4 | 97.4% | 0 | () | ||||||||||||||||||||||||||||||||||||
| 100,00 (Default) | 73 | 8 | 50.0% | 16 | 100.0% | 10 | 10.2% | 89 | 2 | 13.0% | 2 | (1) | ||||||||||||||||||||||||||||||||||||
| Institutions | 25,687 | 6,952 | 58.9% | 12,482 | 0.5% | 1,890 | 40.6% | 38 | 3,576 | 28.6% | 26 | (58) | ||||||||||||||||||||||||||||||||||||
| 0,00<0,15 | 18,715 | 5,100 | 60.6% | 9,886 | 0.1% | 1,033 | 41.2% | 40 | 1,967 | 19.9% | 3 | (17) | ||||||||||||||||||||||||||||||||||||
| 0,15<0,25 | 2,292 | 785 | 50.6% | 853 | 0.2% | 185 | 40.7% | 48 | 327 | 38.3% | 1 | (8) | ||||||||||||||||||||||||||||||||||||
| 0,25<0,50 | 3,180 | 707 | 56.5% | 643 | 0.3% | 194 | 30.5% | 33 | 251 | 39.1% | 1 | (3) | ||||||||||||||||||||||||||||||||||||
| 0,50<0,75 | 431 | 125 | 51.1% | 278 | 0.5% | 107 | 36.3% | 25 | 171 | 61.5% | 1 | (1) | ||||||||||||||||||||||||||||||||||||
| 0,75<2,50 | 719 | 176 | 53.6% | 653 | 1.4% | 168 | 42.6% | 36 | 623 | 95.3% | 4 | (2) | ||||||||||||||||||||||||||||||||||||
| 2,50<10,00 | 149 | 52 | 75.9% | 95 | 3.2% | 138 | 42.6% | 27 | 129 | 135.7% | 1 | (4) | ||||||||||||||||||||||||||||||||||||
| 10,00<100,00 | 42 | 6 | 56.8% | 41 | 20.1% | 34 | 43.9% | 44 | 102 | 245.7% | 4 | (3) | ||||||||||||||||||||||||||||||||||||
| 100,00 (Default) | 160 | 2 | 89.8% | 32 | 100.0% | 31 | 38.1% | 49 | 7 | 20.3% | 12 | (19) | ||||||||||||||||||||||||||||||||||||
| Corporate SMEs | 15,964 | 3,816 | 45.2% | 16,117 | 13.5% | 43,270 | 47.1% | 48 | 11,781 | 73.1% | 869 | (1,103) | ||||||||||||||||||||||||||||||||||||
| 0,00<0,15 | 1,240 | 711 | 44.1% | 1,897 | 0.1% | 5,312 | 51.7% | 57 | 526 | 27.7% | 1 | (5) | ||||||||||||||||||||||||||||||||||||
| 0,15<0,25 | 628 | 251 | 43.8% | 893 | 0.2% | 2,380 | 53.6% | 47 | 352 | 39.4% | 1 | (3) | ||||||||||||||||||||||||||||||||||||
| 0,25<0,50 | 1,268 | 354 | 45.8% | 1,528 | 0.3% | 4,170 | 51.8% | 50 | 753 | 49.3% | 2 | (5) | ||||||||||||||||||||||||||||||||||||
| 0,50<0,75 | 2,832 | 591 | 42.1% | 2,845 | 0.5% | 6,032 | 48.7% | 44 | 2,019 | 71.0% | 7 | (16) | ||||||||||||||||||||||||||||||||||||
| 0,75<2,50 | 3,815 | 955 | 47.5% | 3,552 | 1.2% | 9, 977 | 46.8% | 44 | 3,067 | 86.3% | 19 | (41) | ||||||||||||||||||||||||||||||||||||
| 2,50<10,00 | 3,769 | 850 | 45.4% | 3,124 | 4.3% | 10,420 | 44.5% | 44 | 3,858 | 123.5% | 59 | (179) | ||||||||||||||||||||||||||||||||||||
| 10,00<100,00 | 473 | 36 | 46.5% | 354 | 15.3% | 1, 408 | 42.8% | 55 | 692 | 195.5% | 23 | (25) | ||||||||||||||||||||||||||||||||||||
| 100,00 (Default) | 1,938 | 68 | 50.1% | 1,924 | 100.0% | 3,571 | 39.3% | 51 | 514 | 26.7% | 756 | (830) | ||||||||||||||||||||||||||||||||||||
| Corporate Non-SMEs | 51,288 | 54,395 | 49.5% | 77,891 | 2.6% | 14,120 | 44.4% | 57 | 36,273 | 46.6% | 455 | (999) | ||||||||||||||||||||||||||||||||||||
| 0,00<0,15 | 21,005 | 30,232 | 49.1% | 36,913 | 0.1% | 3,137 | 44.9% | 56 | 10,353 | 28.0% | 18 | (20) | ||||||||||||||||||||||||||||||||||||
| 0,15<0,25 | 5,722 | 8,093 | 48.3% | 9,854 | 0.2% | 1, 611 | 45.5% | 64 | 4,342 | 44.1% | 9 | (10) | ||||||||||||||||||||||||||||||||||||
| 0,25<0,50 | 10,836 | 8,875 | 52.1% | 15,947 | 0.3% | 2,509 | 45.3% | 64 | 9,016 | 56.5% | 23 | (22) | ||||||||||||||||||||||||||||||||||||
| 0,50<0,75 | 4,438 | 3,331 | 48.6% | 5,866 | 0.5% | 1,595 | 46.1% | 53 | 4,152 | 70.8% | 14 | (33) | ||||||||||||||||||||||||||||||||||||
| 0,75<2,50 | 4,897 | 2,157 | 48.1% | 4,985 | 1.1% | 2,210 | 42.6% | 53 | 4,500 | 90.3% | 24 | (30) | ||||||||||||||||||||||||||||||||||||
| 2,50<10,00 | 2,612 | 1,474 | 51.8% | 2,556 | 3.8% | 2, 335 | 45.1% | 47 | 3,545 | 138.7% | 44 | (122) | ||||||||||||||||||||||||||||||||||||
| 10,00<100,00 | 109 | 51 | 53.3% | 44 | 15.7% | 106 | 46.3% | 43 | 90 | 206.0% | 3 | (3) | ||||||||||||||||||||||||||||||||||||
| 100,00 (Default) | 1,669 | 181 | 46.8% | 1,726 | 100.0% | 617 | 18.6% | 66 | 275 | 15.9% | 320 | (760) | ||||||||||||||||||||||||||||||||||||
| 90 |
Table of Contents
| PD Scale as of 12-31-18(1) | Original on-balance sheet gross exposure | Off-balance sheet exposures pre CCF | Average CCF(2) | EAD post CRM and post-CCF | Average PD(3) | Number of obligors | Average LGD(4) | Average Maturity (days)(5) | RWAs | RWA Density | EL | Value adjustments and provisions | ||||||||||||||||||||||||||||||||||||
| Retail - Mortgage exposures | 76,986 | 4,487 | 5.0% | 77,186 | 5.2% | 1,081,481 | 17.1% | – | 7,385 | 9.6% | 579 | (1,330) | ||||||||||||||||||||||||||||||||||||
| 0,00<0,15 | 57,198 | 3,197 | 5.0% | 57,345 | 0.0% | 847,236 | 15.7% | – | 1,290 | 2.2% | 5 | (9) | ||||||||||||||||||||||||||||||||||||
| 0,15<0,25 | 3,448 | 41 | 5.0% | 3,448 | 0.2% | 40,743 | 22.0% | – | 323 | 9.4% | 2 | (2) | ||||||||||||||||||||||||||||||||||||
| 0,25<0,50 | 2,865 | 416 | 5.0% | 2,885 | 0.3% | 39,782 | 26.2% | – | 460 | 15.9% | 2 | (3) | ||||||||||||||||||||||||||||||||||||
| 0,50<0,75 | 2,086 | 251 | 5.0% | 2,098 | 0.5% | 27,413 | 25.8% | – | 450 | 21.5% | 3 | (3) | ||||||||||||||||||||||||||||||||||||
| 0,75<2,50 | 3,762 | 330 | 5.0% | 3,777 | 1.1% | 45,962 | 23.0% | – | 1, 195 | 31.7% | 9 | (53) | ||||||||||||||||||||||||||||||||||||
| 2,50<10,00 | 3,402 | 209 | 5.0% | 3,409 | 4.7% | 39,564 | 20.3% | – | 2,222 | 65.2% | 32 | (317) | ||||||||||||||||||||||||||||||||||||
| 10,00<100,00 | 553 | 42 | 5.0% | 555 | 18.2% | 6,854 | 22.6% | – | 703 | 126.8% | 23 | (47) | ||||||||||||||||||||||||||||||||||||
| 100,00 (Default) | 3,672 | 0 | 5.2% | 3,670 | 100.0% | 33,927 | 13.7% | – | 742 | 20.2% | 504 | (896) | ||||||||||||||||||||||||||||||||||||
| Retail - Other exposures SMEs | 3,278 | 847 | 60.3% | 3,739 | 13.9% | 139,374 | 55.8% | – | 1,749 | 46.8% | 297 | (281) | ||||||||||||||||||||||||||||||||||||
| 0,00<0,15 | 216 | 197 | 58.8% | 332 | 0.1% | 19,029 | 56.1% | – | 42 | 12.6% | 0 | () | ||||||||||||||||||||||||||||||||||||
| 0,15<0,25 | 109 | 53 | 60.0% | 141 | 0.2% | 5,659 | 56.3% | – | 27 | 18.9% | 0 | () | ||||||||||||||||||||||||||||||||||||
| 0,25<0,50 | 199 | 89 | 59.3% | 251 | 0.3% | 9,560 | 56.9% | – | 63 | 25.3% | 0 | () | ||||||||||||||||||||||||||||||||||||
| 0,50<0,75 | 314 | 117 | 59.7% | 381 | 0.5% | 14,012 | 55.6% | – | 127 | 33.4% | 1 | (1) | ||||||||||||||||||||||||||||||||||||
| 0,75<2,50 | 786 | 208 | 61.4% | 902 | 1.2% | 29,712 | 55.5% | – | 448 | 49.6% | 6 | (5) | ||||||||||||||||||||||||||||||||||||
| 2,50<10,00 | 1,031 | 146 | 63.7% | 1,101 | 4.6% | 40,657 | 55.9% | – | 740 | 67.2% | 28 | (32) | ||||||||||||||||||||||||||||||||||||
| 10,00<100,00 | 216 | 27 | 56.9% | 221 | 19.5% | 8,724 | 51.2% | – | 207 | 93.4% | 22 | (20) | ||||||||||||||||||||||||||||||||||||
| 100,00 (Default) | 408 | 10 | 47.3% | 410 | 100.0% | 12,021 | 58.1% | – | 96 | 23.3% | 238 | (221) | ||||||||||||||||||||||||||||||||||||
| Retail - Other exposures Non-SMEs | 10,331 | 109 | 68.6% | 10,396 | 6.0% | 903,183 | 54.2% | – | 3,592 | 34.6% | 303 | (464) | ||||||||||||||||||||||||||||||||||||
| 0,00<0,15 | 4,563 | 5 | 38.2% | 4,565 | 0.1% | 349,519 | 53.6% | – | 415 | 9.1% | 1 | (2) | ||||||||||||||||||||||||||||||||||||
| 0,15<0,25 | 513 | 7 | 22.0% | 514 | 0.2% | 55,419 | 58.4% | – | 126 | 24.4% | 1 | (1) | ||||||||||||||||||||||||||||||||||||
| 0,25<0,50 | 895 | 20 | 23.2% | 899 | 0.3% | 89,487 | 58.5% | – | 313 | 34.8% | 2 | (2) | ||||||||||||||||||||||||||||||||||||
| 0,50<0,75 | 841 | 25 | 26.0% | 845 | 0.5% | 69,829 | 56.2% | – | 380 | 44.9% | 3 | (3) | ||||||||||||||||||||||||||||||||||||
| 0,75<2,50 | 1,204 | 8 | 33.9% | 1,206 | 1.2% | 120,718 | 55.4% | – | 751 | 62.3% | 8 | (9) | ||||||||||||||||||||||||||||||||||||
| 2,50<10,00 | 1,678 | 41 | 129.1% | 1,729 | 4.5% | 156,305 | 52.6% | – | 1,394 | 80.6% | 41 | (89) | ||||||||||||||||||||||||||||||||||||
| 10,00<100,00 | 149 | 2 | 23.6% | 149 | 21.8% | 15,943 | 52.8% | – | 182 | 122.6% | 17 | (15) | ||||||||||||||||||||||||||||||||||||
| 100,00 (Default) | 489 | 0 | – | 489 | 100.0% | 45,963 | 47.1% | – | 32 | 6.5% | 230 | (344) | ||||||||||||||||||||||||||||||||||||
| Retail - qualifying revolving (QRRE) | 6,525 | 15,642 | 20.2% | 9,682 | 6.7% | 9,357,746 | 73.3% | – | 6,938 | 71.7% | 537 | (584) | ||||||||||||||||||||||||||||||||||||
| 0,00<0,15 | 1,037 | 4,630 | 27.1% | 2,292 | 0.0% | 3,013,540 | 47.7% | – | 32 | 1.4% | 0 | (1) | ||||||||||||||||||||||||||||||||||||
| 0,15<0,25 | 15 | 36 | 31.2% | 26 | 0.2% | 48,972 | 51.2% | – | 2 | 5.8% | 0 | () | ||||||||||||||||||||||||||||||||||||
| 0,25<0,50 | 109 | 143 | 28.2% | 149 | 0.3% | 191,439 | 50.6% | – | 12 | 8.0% | 0 | () | ||||||||||||||||||||||||||||||||||||
| 0,50<0,75 | 399 | 1,449 | 13.3% | 591 | 0.5% | 458,275 | 77.3% | – | 108 | 18.2% | 2 | (5) | ||||||||||||||||||||||||||||||||||||
| 0,75<2,50 | 1,323 | 4,355 | 14.7% | 1,965 | 1.2% | 1,406,510 | 81.2% | – | 719 | 36.6% | 19 | (32) | ||||||||||||||||||||||||||||||||||||
| 2,50<10,00 | 2,450 | 4,507 | 18.9% | 3,303 | 5.3% | 3,074,446 | 82.9% | – | 3,561 | 107.8% | 146 | (173) | ||||||||||||||||||||||||||||||||||||
| 10,00<100,00 | 994 | 522 | 31.4% | 1,157 | 21.3% | 1,013,184 | 83.0% | – | 2,495 | 215.6% | 205 | (215) | ||||||||||||||||||||||||||||||||||||
| 100,00 (Default) | 199 | 0 | 19.9% | 199 | 100.0% | 151,380 | 82.6% | – | 10 | 5.2% | 164 | (159) | ||||||||||||||||||||||||||||||||||||
| Equity | 3,201 | – | – | 3,201 | 1.1% | – | 88.8% | – | 5,989 | 187.1% | 30 | – | ||||||||||||||||||||||||||||||||||||
| 0,00<0,15 | 1,966 | – | – | 1,966 | 0.1% | – | 89.8% | – | 2,354 | 119.7% | 2 | – | ||||||||||||||||||||||||||||||||||||
| 0,15<0,25 | 118 | – | – | 118 | 0.2% | – | 65.0% | – | 124 | 105.0% | 0 | – | ||||||||||||||||||||||||||||||||||||
| 0,25<0,50 | 0 | – | – | 0 | 0.3% | – | 65.0% | – | 0 | 123.8% | 0 | – | ||||||||||||||||||||||||||||||||||||
| 0,50<0,75 | – | – | – | – | 0.0% | – | 0.0% | – | – | – | – | – | ||||||||||||||||||||||||||||||||||||
| 0,75<2,50 | 508 | – | – | 508 | 0.9% | – | 90.0% | – | 1,287 | 253.4% | 4 | – | ||||||||||||||||||||||||||||||||||||
| 2,50<10,00 | 608 | – | – | 608 | 4.4% | – | 89.3% | – | 2,222 | 365.6% | 24 | – | ||||||||||||||||||||||||||||||||||||
| 10,00<100,00 | – | – | – | – | 0.0% | – | 0.0% | – | – | 0.0% | 0 | – | ||||||||||||||||||||||||||||||||||||
| 100,00 (Default) | – | – | – | – | 0.0% | – | 0.0% | – | – | 0.0% | – | – | ||||||||||||||||||||||||||||||||||||
| Total standardized Approach | 205,256 | 86,788 | 46.3% | 224,822 | 4.7% | 11,541,597 | 36.0% | 83,154 | 37.0% | 3,241 | (4,898) | |||||||||||||||||||||||||||||||||||||
(1) PD intervals recommended by EBA guidelines on Pillar III disclosure requirements (Eighth Part of CRR).
(2) Calculated as EAD after CCF foroff-balance exposures over totaloff-balance exposure before CCF.
(3) Corresponds to PD byEAD-weighted debtor category.
(4) Corresponds to LGD byEAD-weighted debtor category.
(5) Corresponds to theEAD-weighted debtor expiration in days.
(6) Exposures under the FIRB method correspond to Specialized Lending, for which the Group has opted for the method of supervisory slotting criteria, in line with article 153.5 of CRR.
| 91 |
Table of Contents
| PD Scale as of 12-31-17(1) | Original on-balance sheet gross exposure | Off-balance sheet exposures pre CCF | Average CCF(2) | EAD post CRM and post-CCF | Average PD(3) | Number of obligors | Average LGD(4) | Average Maturity (days)(5) | RWAs | RWA Density | EL | Value adjustments and provisions | ||||||||||||||||||||||||||||||||||||
| Prudential portfolios for FIRB approach(6) | 7,190 | 955 | 77.6% | 7,931 | – | 500 | – | 7,021 | 88.5% | 234 | (109) | |||||||||||||||||||||||||||||||||||||
| Corporate - Specialized lending | 7,190 | 955 | 77.6% | 7,931 | – | 500 | – | – | 7,021 | 88.5% | 234 | (109) | ||||||||||||||||||||||||||||||||||||
| Prudential portfolios for AIRB approach | 206,089 | 85,560 | 42.5% | 224,504 | 6.0% | 11,479,545 | 34.8% | 83,577 | 37.2% | 4,635 | (6,975) | |||||||||||||||||||||||||||||||||||||
| Central governments or central banks | 5,288 | 376 | 49.9% | 6,977 | 0.4% | 134 | 27.9% | 67 | 409 | 5.9% | 5 | (4) | ||||||||||||||||||||||||||||||||||||
| 0,00<0,15 | 4,543 | 136 | 49.9% | 6,466 | 0.0% | 37 | 26.9% | 69 | 179 | 2.8% | 1 | (2) | ||||||||||||||||||||||||||||||||||||
| 0,15<0,25 | 96 | 72 | 50.0% | 183 | 0.2% | 20 | 42.7% | 59 | 18 | 9.8% | 0 | () | ||||||||||||||||||||||||||||||||||||
| 0,25<0,50 | 77 | 1 | 39.0% | 121 | 0.3% | 6 | 48.8% | 60 | 48 | 40.1% | 0 | () | ||||||||||||||||||||||||||||||||||||
| 0,50<0,75 | 117 | 0 | 0.0% | 88 | 0.6% | 6 | 38.0% | 94 | 35 | 39.4% | 0 | () | ||||||||||||||||||||||||||||||||||||
| 0,75<2,50 | 9 | 25 | 50.0% | 4 | 1.5% | 9 | 35.5% | 50 | 3 | 73.8% | 0 | () | ||||||||||||||||||||||||||||||||||||
| 2,50<10,00 | 356 | 125 | 50.1% | 89 | 4.7% | 40 | 40.2% | 74 | 121 | 136.4% | 2 | (1) | ||||||||||||||||||||||||||||||||||||
| 10,00<100,00 | 1 | 9 | 50.2% | 5 | 21.2% | 2 | 20.0% | 5 | 5 | 103.1% | 0 | () | ||||||||||||||||||||||||||||||||||||
| 100,00 (Default) | 88 | 8 | 50.0% | 21 | 100.0% | 14 | 9.9% | 59 | 0 | 0.7% | 2 | (1) | ||||||||||||||||||||||||||||||||||||
| Institutions | 27,398 | 6,761 | 55.9% | 12,560 | 1.0% | 1,869 | 40.8% | 44 | 3,988 | 31.8% | 55 | (62) | ||||||||||||||||||||||||||||||||||||
| 0,00<0,15 | 18,770 | 4,486 | 55.5% | 9,991 | 0.1% | 948 | 41.4% | 47 | 2,262 | 22.6% | 3 | (7) | ||||||||||||||||||||||||||||||||||||
| 0,15<0,25 | 3,506 | 908 | 62.8% | 752 | 0.2% | 196 | 37.0% | 44 | 291 | 38.6% | 1 | (1) | ||||||||||||||||||||||||||||||||||||
| 0,25<0,50 | 3,587 | 816 | 54.0% | 743 | 0.3% | 200 | 33.6% | 39 | 324 | 43.6% | 1 | (1) | ||||||||||||||||||||||||||||||||||||
| 0,50<0,75 | 510 | 158 | 62.9% | 336 | 0.5% | 121 | 36.6% | 33 | 214 | 63.8% | 1 | () | ||||||||||||||||||||||||||||||||||||
| 0,75<2,50 | 466 | 346 | 50.8% | 461 | 1.2% | 183 | 44.2% | 40 | 515 | 111.7% | 2 | (1) | ||||||||||||||||||||||||||||||||||||
| 2,50<10,00 | 326 | 43 | 53.2% | 147 | 3.7% | 146 | 48.0% | 42 | 250 | 170.0% | 3 | (4) | ||||||||||||||||||||||||||||||||||||
| 10,00<100,00 | 40 | 3 | 50.8% | 42 | 19.7% | 28 | 45.5% | 40 | 107 | 255.0% | 4 | (2) | ||||||||||||||||||||||||||||||||||||
| 100,00 (Default) | 193 | 1 | 86.5% | 88 | 100.0% | 47 | 47.0% | 42 | 26 | 29.2% | 41 | (46) | ||||||||||||||||||||||||||||||||||||
| Corporate SMEs | 14,260 | 3,606 | 43.9% | 15,502 | 22.7% | 43,278 | 47.7% | 48 | 9,935 | 64.1% | 1,666 | (1,821) | ||||||||||||||||||||||||||||||||||||
| 0,00<0,15 | 1,147 | 621 | 43.5% | 1,835 | 0.1% | 5,134 | 51.9% | 56 | 520 | 28.3% | 1 | (4) | ||||||||||||||||||||||||||||||||||||
| 0,15<0,25 | 566 | 274 | 42.9% | 1,015 | 0.2% | 2,308 | 47.8% | 43 | 381 | 37.5% | 1 | (2) | ||||||||||||||||||||||||||||||||||||
| 0,25<0,50 | 1,031 | 362 | 43.3% | 1,402 | 0.3% | 4,106 | 51.8% | 47 | 704 | 50.2% | 2 | (6) | ||||||||||||||||||||||||||||||||||||
| 0,50<0,75 | 1,331 | 373 | 45.2% | 1,505 | 0.5% | 5,310 | 49.7% | 46 | 896 | 59.5% | 4 | (6) | ||||||||||||||||||||||||||||||||||||
| 0,75<2,50 | 3,132 | 974 | 45.3% | 3,201 | 1.2% | 10,460 | 47.2% | 46 | 2,623 | 81.9% | 18 | (18) | ||||||||||||||||||||||||||||||||||||
| 2,50<10,00 | 3,344 | 764 | 43.5% | 2,943 | 4.2% | 10,329 | 43.5% | 42 | 3,369 | 114.5% | 53 | (194) | ||||||||||||||||||||||||||||||||||||
| 10,00<100,00 | 413 | 63 | 42.5% | 309 | 16.1% | 1,523 | 39.9% | 62 | 501 | 162.1% | 20 | (14) | ||||||||||||||||||||||||||||||||||||
| 100,00 (Default) | 3,296 | 174 | 41.0% | 3,291 | 100.0% | 4,108 | 47.6% | 63 | 942 | 28.6% | 1,568 | (1,577) | ||||||||||||||||||||||||||||||||||||
| Corporate Non-SMEs | 50,757 | 53,929 | 50.6% | 76,577 | 3.5% | 13,759 | 42.1% | 55 | 37,614 | 49.1% | 800 | (1,518) | ||||||||||||||||||||||||||||||||||||
| 0,00<0,15 | 17,194 | 26,765 | 49.2% | 30,981 | 0.1% | 2,647 | 43.3% | 59 | 8,885 | 28.7% | 15 | (34) | ||||||||||||||||||||||||||||||||||||
| 0,15<0,25 | 5,071 | 7,709 | 48.5% | 9,200 | 0.2% | 1,432 | 43.4% | 56 | 3,687 | 40.1% | 8 | (12) | ||||||||||||||||||||||||||||||||||||
| 0,25<0,50 | 8,859 | 8,240 | 51.0% | 13,089 | 0.3% | 2,277 | 43.2% | 62 | 6,927 | 52.9% | 18 | (28) | ||||||||||||||||||||||||||||||||||||
| 0,50<0,75 | 7,693 | 7,907 | 57.8% | 11,311 | 0.5% | 2,280 | 41.7% | 54 | 7,395 | 65.4% | 23 | (18) | ||||||||||||||||||||||||||||||||||||
| 0,75<2,50 | 5,567 | 1,872 | 45.4% | 5,420 | 1.0% | 2,548 | 40.3% | 45 | 4,806 | 88.7% | 22 | (19) | ||||||||||||||||||||||||||||||||||||
| 2,50<10,00 | 3,539 | 1,157 | 55.8% | 3,650 | 3.4% | 1,721 | 40.3% | 44 | 4,486 | 122.9% | 50 | (93) | ||||||||||||||||||||||||||||||||||||
| 10,00<100,00 | 596 | 126 | 50.0% | 646 | 13.1% | 105 | 31.4% | 23 | 957 | 148.1% | 28 | (17) | ||||||||||||||||||||||||||||||||||||
| 100,00 (Default) | 2,239 | 153 | 44.5% | 2,279 | 100.0% | 749 | 27.9% | 49 | 470 | 20.6% | 635 | (1,297) | ||||||||||||||||||||||||||||||||||||
| 92 |
Table of Contents
| PD Scale as of 12-31-17(1) | Original on-balance sheet gross exposure | Off-balance sheet exposures pre CCF | Average CCF(2) | EAD post CRM and post-CCF | Average PD(3) | Number of obligors | Average LGD(4) | Average Maturity (days)(5) | RWAs | RWA Density | EL | Value adjustments and provisions | ||||||||||||||||||||||||||||||||||||
| Retail - Mortgage exposures | 79,867 | 4,499 | 5.0% | 80,073 | 6.1% | 1,102,494 | 17.7% | – | 8,268 | 10.3% | 907 | (1,192) | ||||||||||||||||||||||||||||||||||||
| 0,00<0,15 | 58,258 | 3,219 | 5.0% | 58,412 | 0.0% | 852,045 | 16.2% | – | 1,333 | 2.3% | 5 | (6) | ||||||||||||||||||||||||||||||||||||
| 0,15<0,25 | 3,609 | 49 | 5.0% | 3,611 | 0.2% | 41,780 | 22.6% | – | 347 | 9.6% | 2 | (2) | ||||||||||||||||||||||||||||||||||||
| 0,25<0,50 | 2,740 | 410 | 5.0% | 2,760 | 0.3% | 38,939 | 25.2% | – | 423 | 15.3% | 2 | (3) | ||||||||||||||||||||||||||||||||||||
| 0,50<0,75 | 2,097 | 242 | 5.0% | 2,108 | 0.5% | 28,012 | 25.3% | – | 443 | 21.0% | 3 | (3) | ||||||||||||||||||||||||||||||||||||
| 0,75<2,50 | 4,066 | 333 | 5.0% | 4,081 | 1.1% | 49,623 | 23.0% | – | 1,305 | 32.0% | 10 | (15) | ||||||||||||||||||||||||||||||||||||
| 2,50<10,00 | 3,981 | 205 | 5.0% | 3,988 | 4.8% | 45,473 | 20.6% | – | 2,642 | 66.3% | 38 | (240) | ||||||||||||||||||||||||||||||||||||
| 10,00<100,00 | 637 | 41 | 5.0% | 639 | 17.9% | 7,550 | 23.1% | – | 826 | 129.3% | 26 | (26) | ||||||||||||||||||||||||||||||||||||
| 100,00 (Default) | 4,478 | 0 | 5.1% | 4,474 | 100.0% | 39,072 | 18.4% | – | 949 | 21.2% | 821 | (898) | ||||||||||||||||||||||||||||||||||||
| Retail - Other exposures SMEs | 3,037 | 812 | 60.8% | 3,456 | 13.4% | 121,952 | 54.4% | – | 1,608 | 46.5% | 241 | (198) | ||||||||||||||||||||||||||||||||||||
| 0,00<0,15 | 196 | 175 | 58.9% | 299 | 0.1% | 16,665 | 54.8% | – | 37 | 12.3% | 0 | () | ||||||||||||||||||||||||||||||||||||
| 0,15<0,25 | 90 | 53 | 61.1% | 122 | 0.2% | 5,308 | 55.9% | – | 23 | 18.6% | 0 | () | ||||||||||||||||||||||||||||||||||||
| 0,25<0,50 | 186 | 80 | 60.9% | 234 | 0.3% | 9, 094 | 56.1% | – | 58 | 25.0% | 0 | () | ||||||||||||||||||||||||||||||||||||
| 0,50<0,75 | 284 | 116 | 60.4% | 350 | 0.5% | 12,120 | 54.7% | – | 116 | 33.2% | 1 | (1) | ||||||||||||||||||||||||||||||||||||
| 0,75<2,50 | 702 | 200 | 63.3% | 811 | 1.2% | 26,454 | 54.2% | – | 394 | 48.6% | 5 | (3) | ||||||||||||||||||||||||||||||||||||
| 2,50<10,00 | 1,019 | 151 | 61.1% | 1,073 | 4.6% | 36,181 | 55.1% | – | 713 | 66.4% | 27 | (16) | ||||||||||||||||||||||||||||||||||||
| 10,00<100,00 | 207 | 25 | 57.6% | 209 | 19.8% | 7,592 | 51.5% | – | 197 | 94.5% | 21 | (13) | ||||||||||||||||||||||||||||||||||||
| 100,00 (Default) | 354 | 12 | 52.5% | 359 | 100.0% | 8,538 | 52.0% | – | 70 | 19.6% | 186 | (165) | ||||||||||||||||||||||||||||||||||||
| Retail - Other exposures Non-SMEs | 8,879 | 19 | 53.5% | 8,885 | 5.7% | 821,034 | 53.1% | – | 3,017 | 34.0% | 209 | (421) | ||||||||||||||||||||||||||||||||||||
| 0,00<0,15 | 3,981 | 10 | 57.5% | 3,987 | 0.1% | 306,838 | 53.5% | – | 358 | 9.0% | 1 | (3) | ||||||||||||||||||||||||||||||||||||
| 0,15<0,25 | 435 | 1 | 53.5% | 436 | 0.2% | 47,482 | 56.7% | – | 103 | 23.7% | 0 | (1) | ||||||||||||||||||||||||||||||||||||
| 0,25<0,50 | 727 | 1 | 57.4% | 728 | 0.3% | 76,924 | 58.6% | – | 254 | 34.9% | 1 | (2) | ||||||||||||||||||||||||||||||||||||
| 0,50<0,75 | 581 | 1 | 66.5% | 581 | 0.6% | 60,010 | 58.3% | – | 273 | 47.0% | 2 | (3) | ||||||||||||||||||||||||||||||||||||
| 0,75<2,50 | 1,039 | 2 | 60.1% | 1,038 | 1.2% | 115,016 | 54.8% | – | 640 | 61.7% | 7 | (9) | ||||||||||||||||||||||||||||||||||||
| 2,50<10,00 | 1,596 | 4 | 44.7% | 1,597 | 4.3% | 160,905 | 49.5% | – | 1,204 | 75.4% | 34 | (101) | ||||||||||||||||||||||||||||||||||||
| 10,00<100,00 | 138 | 0 | 56.9% | 136 | 21.6% | 17,374 | 50.9% | – | 161 | 117.8% | 15 | (14) | ||||||||||||||||||||||||||||||||||||
| 100,00 (Default) | 383 | 1 | – | 383 | 100.0% | 36,485 | 38.8% | – | 25 | 6.5% | 149 | (288) | ||||||||||||||||||||||||||||||||||||
| Retail - qualifying revolving (QRRE) | 6,023 | 14,603 | 21.4% | 9,154 | 6.6% | 9,374,525 | 72.9% | – | 6,764 | 73.9% | 505 | (527) | ||||||||||||||||||||||||||||||||||||
| 0,00<0,15 | 942 | 4,804 | 29.3% | 2,348 | 0.0% | 3,132,253 | 48.1% | – | 33 | 1.4% | 0 | (1) | ||||||||||||||||||||||||||||||||||||
| 0,15<0,25 | 16 | 48 | 34.0% | 32 | 0.2% | 67,924 | 51.6% | – | 2 | 5.9% | 0 | () | ||||||||||||||||||||||||||||||||||||
| 0,25<0,50 | 160 | 355 | 20.9% | 234 | 0.3% | 247,187 | 63.4% | – | 26 | 11.0% | 1 | () | ||||||||||||||||||||||||||||||||||||
| 0,50<0,75 | 376 | 1,745 | 11.6% | 578 | 0.5% | 542,379 | 76.8% | – | 108 | 18.7% | 2 | (2) | ||||||||||||||||||||||||||||||||||||
| 0,75<2,50 | 989 | 3,059 | 15.0% | 1,449 | 1.2% | 1,234,690 | 80.0% | – | 540 | 37.3% | 14 | (12) | ||||||||||||||||||||||||||||||||||||
| 2,50<10,00 | 2,414 | 4,057 | 20.0% | 3,224 | 5.4% | 2,872,090 | 83.7% | – | 3,549 | 110.1% | 147 | (137) | ||||||||||||||||||||||||||||||||||||
| 10,00<100,00 | 959 | 533 | 30.3% | 1,120 | 21.6% | 1,131,749 | 83.5% | – | 2,498 | 222.9% | 203 | (233) | ||||||||||||||||||||||||||||||||||||
| 100,00 (Default) | 168 | 0 | 17.8% | 168 | 100.0% | 146,253 | 82.0% | – | 9 | 5.3% | 137 | (142) | ||||||||||||||||||||||||||||||||||||
| Equity | 3,390 | – | – | 3,390 | 0.5% | – | 80.9% | – | 4,953 | 146.1% | 12 | (1,123) | ||||||||||||||||||||||||||||||||||||
| 0,00<0,15 | 2,174 | – | – | 2,174 | 0.1% | – | 89.9% | – | 2,604 | 119.8% | 3 | – | ||||||||||||||||||||||||||||||||||||
| 0,15<0,25 | 86 | – | – | 86 | 0.2% | – | 65.0% | – | 88 | 103.0% | 0 | – | ||||||||||||||||||||||||||||||||||||
| 0,25<0,50 | 1 | – | – | 1 | 0.3% | – | 65.0% | – | 1 | 123.8% | 0 | – | ||||||||||||||||||||||||||||||||||||
| 0,50<0,75 | 4 | – | – | 4 | 0.5% | – | 65.0% | – | 5 | 152.2% | 0 | – | ||||||||||||||||||||||||||||||||||||
| 0,75<2,50 | 1,108 | – | – | 1,108 | 1.3% | – | 65.0% | – | 2,212 | 199.6% | 9 | – | ||||||||||||||||||||||||||||||||||||
| 2,50<10,00 | 18 | – | – | 18 | 2.6% | – | 65.0% | – | 41 | 236.0% | 0 | – | ||||||||||||||||||||||||||||||||||||
| 10,00<100,00 | – | – | – | – | 0.0% | – | – | – | – | – | – | – | ||||||||||||||||||||||||||||||||||||
| 100,00 (Default) | – | – | – | – | 0.0% | – | – | – | – | – | – | – | ||||||||||||||||||||||||||||||||||||
| Total Standardized Approach | 213,278 | 86,515 | 43.7% | 232,435 | 6.0% | 11,480,045 | 34.8% | 90,598 | 39.0% | 4,869 | (7,084) | |||||||||||||||||||||||||||||||||||||
(1) PD intervals recommended by EBA guidelines on Pillar III disclosure requirements (Eighth Part of CRR).
(2) Calculated as EAD after CCF foroff-balance exposures over totaloff-balance exposure before CCF.
(3) Corresponds to PD byEAD-weighted debtor category.
(4) Corresponds to LGD byEAD-weighted debtor category.
(5) Corresponds to theEAD-weighted debtor expiration in days.
(6) Exposures under the FIRB method correspond to Specialized Lending, for which the Group has opted for the method of supervisory slotting criteria, in line with article 153.5 of CRR.
(7) Equity exposure as of December, 31, 2017, includes the impairment of Telefónica, S.A. for an amount of 1,123 million euros
| 93 |
Table of Contents
The information contained in the above tables is set out below in graphic format (including counterparty risk):
CHART 8: Advanced measurement approach: EAD by obligor category
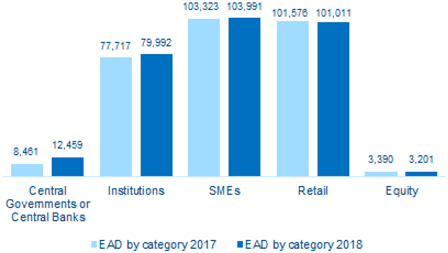
CHART 9: Advanced measurement approach: Average weighted PD by EAD
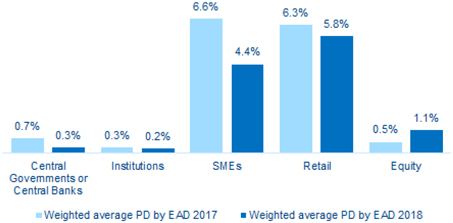
| 94 |
Table of Contents
CHART 10: Advanced measurement approach: Average weighted LGD by EAD
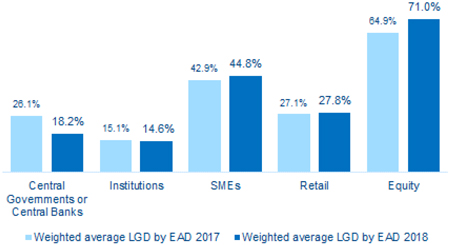
CHART 11: Advanced measurement approach: RWAs by obligor category
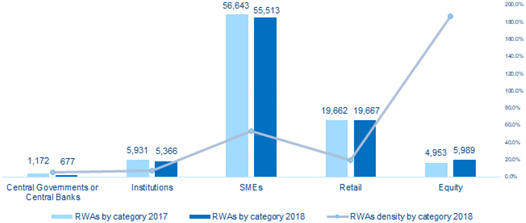
| 95 |
Table of Contents
The table below shows a comparison of the PDs used in IRB models with the effective default rates of the Group’s obligors for credit and counterparty risks. The table aims to provide backtesting data to validate the reliability of PD calculations.
Specifically, the table compares the PD used in advanced approach models with the effective default rates of obligors.
Backtesting data is provided in the tables separately by geographies with advanced model approaches and the following are the criteria adopted in order to comply with the EBA standard template:
| · | Portfolio: the breakdown of the portfolios corresponds to that recommended by the supervisor, excluding the equity positions. |
| · | PD scale: corresponds to the master rating scale in section 3.2.5.1.2 (Table 28). |
| · | External rating equivalent: uses the equivalence between the PDs and the external ratings described in section 3.2.5.1.2. |
| · | Weighted PD and arithmetic average PD by obligors: uses the PD after mitigation, i.e. which associated with guarantors. |
| · | Number of obligors: presents the obligors at the close of the year and at the close of the previous year. |
| · | Defaulted obligors: for the purpose of guaranteeing the traceability of the table, columns “g” and “h” of the standard table have been combined to report the information on transactions/customers that defaulted at some time in the last 12 months, so that the defaulted obligors in the last year are shown for each PD range. |
| · | Average historical annual default rate: this presents the annual default rate of the last five years. |
| 96 |
Table of Contents
Table of Contents
TABLE 30: EU CR9 - IRB approach: Backtesting of PD per exposure class
BBVA S.A.
PD Range | External rating equivalent | Weighted average PD | Arithmetic average PD by obligors | Number of 12-31-2018 | obligors 12-31-2017 | Defaulted obligors in the year | Average historical annual default rate | |||||||||||||||||||
| Central governments or central banks |
| |||||||||||||||||||||||||
| 0.00<0.02 | AAA | 0.0% | 0.0% | 3 | 4 | – | 0.0% | |||||||||||||||||||
| 0.02<0.03 | AA+ | 0.0% | 0.0% | 2 | 2 | – | 0.0% | |||||||||||||||||||
| 0.03<0.04 | AA | 0.0% | 0.0% | – | – | – | 0.0% | |||||||||||||||||||
| 0.04<0.05 | AA– | 0.0% | 0.0% | 1 | 9 | – | 0.0% | |||||||||||||||||||
| 0.05<0.06 | A+ | 0.1% | 0.1% | 5 | 6 | – | 0.0% | |||||||||||||||||||
| 0.06<0.09 | A | 0.1% | 0.1% | 1 | – | – | 0.0% | |||||||||||||||||||
| 0.09<0.11 | A– | 0.1% | 0.1% | 2 | 8 | – | 0.0% | |||||||||||||||||||
| 0.11<0.17 | BBB+ | 0.1% | 0.1% | 5 | 9 | – | 0.0% | |||||||||||||||||||
| 0.17<0.24 | BBB | 0.2% | 0.2% | 3 | 20 | – | 0.0% | |||||||||||||||||||
| 0.29<0.39 | BBB– | 0.3% | 0.3% | 4 | 7 | – | 0.0% | |||||||||||||||||||
| 0.39<0.67 | BB+ | 0.5% | 0.5% | 1 | 7 | – | 0.0% | |||||||||||||||||||
| 0.67<1.16 | BB | 0.9% | 0.9% | 3 | 2 | – | 0.0% | |||||||||||||||||||
| 1.16<1.94 | BB– | 1.5% | 1.5% | 5 | 7 | – | 50.0% | |||||||||||||||||||
| 1.94<3.35 | B+ | 2.5% | 2.5% | 3 | 13 | – | 14.3% | |||||||||||||||||||
| 3.35<5.81 | B | 4.4% | 4.4% | 7 | 20 | – | 0.0% | |||||||||||||||||||
| 5.81<11.61 | B– | 6.7% | 7.6% | 4 | 8 | 2 | 20.0% | |||||||||||||||||||
| 11.61<100.00 | C | 21.2% | 21.2% | 3 | 2 | – | 0.0% | |||||||||||||||||||
| 100.00 (default) | D | 100.0% | 100.0% | 5 | 14 | – | 0.0% | |||||||||||||||||||
| Institutions |
| |||||||||||||||||||||||||
| 0.00<0.02 | AAA | 0.0% | 0.0% | 8 | 9 | 1 | 0.0% | |||||||||||||||||||
| 0.02<0.03 | AA+ | 0.0% | 0.0% | 11 | 9 | – | 0.0% | |||||||||||||||||||
| 0.03<0.04 | AA | 0.0% | 0.0% | 29 | 22 | – | 0.0% | |||||||||||||||||||
| 0.04<0.05 | AA– | 0.0% | 0.0% | 90 | 78 | – | 0.0% | |||||||||||||||||||
| 0.05<0.06 | A+ | 0.1% | 0.1% | 274 | 244 | – | 0.0% | |||||||||||||||||||
| 0.06<0.09 | A | 0.1% | 0.1% | 245 | 238 | – | 0.0% | |||||||||||||||||||
| 0.09<0.11 | A– | 0.1% | 0.1% | 532 | 479 | 8 | 0.1% | |||||||||||||||||||
| 0.11<0.17 | BBB+ | 0.1% | 0.1% | 1,178 | 1,190 | 10 | 0.3% | |||||||||||||||||||
| 0.17<0.24 | BBB | 0.2% | 0.2% | 634 | 754 | 9 | 0.1% | |||||||||||||||||||
| 0.29<0.39 | BBB– | 0.3% | 0.3% | 336 | 360 | 5 | 0.5% | |||||||||||||||||||
| 0.39<0.67 | BB+ | 0.5% | 0.5% | 209 | 226 | – | 0.9% | |||||||||||||||||||
| 0.67<1.16 | BB | 0.9% | 0.9% | 88 | 107 | – | 2.6% | |||||||||||||||||||
| 1.16<1.94 | BB– | 1.5% | 1.5% | 186 | 170 | – | 0.0% | |||||||||||||||||||
| 1.94<3.35 | B+ | 2.5% | 2.5% | 74 | 76 | 2 | 1.7% | |||||||||||||||||||
| 3.35<5.81 | B | 4.4% | 4.4% | 36 | 31 | 1 | 4.1% | |||||||||||||||||||
| 5.81<11.61 | B– | 7.9% | 7.9% | 35 | 42 | 2 | 0.0% | |||||||||||||||||||
| 11.61<100.00 | C | 20.1% | 21.0% | 24 | 22 | – | 0.0% | |||||||||||||||||||
| 100.00 (default) | D | 100.0% | 100.0% | 91 | 91 | – | 0.0% | |||||||||||||||||||
| 98 |
Table of Contents
BBVA S.A.
PD Range | External rating equivalent | Weighted average PD | Arithmetic average PD by obligors | Number of 12-31-2018 | obligors 12-31-2017 | Defaulted obligors in | Average historical annual default rate | |||||||||||||||||||
| Corporate - SMEs |
| |||||||||||||||||||||||||
| 0.00<0.02 | AAA | 0.0% | 0.0% | 85 | 104 | – | 0.0% | |||||||||||||||||||
| 0.02<0.03 | AA+ | 0.0% | 0.0% | 24 | 18 | – | 0.0% | |||||||||||||||||||
| 0.03<0.04 | AA | 0.0% | 0.0% | 17 | 12 | – | 0.0% | |||||||||||||||||||
| 0.04<0.05 | AA– | 0.0% | 0.0% | 33 | 40 | – | 0.0% | |||||||||||||||||||
| 0.05<0.06 | A+ | 0.1% | 0.1% | 11 | 13 | – | 0.0% | |||||||||||||||||||
| 0.06<0.09 | A | 0.1% | 0.1% | 25 | 26 | – | 0.0% | |||||||||||||||||||
| 0.09<0.11 | A– | 0.1% | 0.1% | 2,361 | 2,814 | 5 | 0.1% | |||||||||||||||||||
| 0.11<0.17 | BBB+ | 0.1% | 0.1% | 1,919 | 2,469 | 4 | 0.2% | |||||||||||||||||||
| 0.17<0.24 | BBB | 0.2% | 0.2% | 1,812 | 2,342 | 3 | 0.1% | |||||||||||||||||||
| 0.29<0.39 | BBB– | 0.3% | 0.3% | 2,798 | 4,029 | 10 | 0.3% | |||||||||||||||||||
| 0.39<0.67 | BB+ | 0.5% | 0.5% | 3,427 | 5,146 | 18 | 0.6% | |||||||||||||||||||
| 0.67<1.16 | BB | 0.9% | 0.9% | 3,253 | 5,420 | 49 | 1.1% | |||||||||||||||||||
| 1.16<1.94 | BB– | 1.5% | 1.5% | 2,828 | 4,910 | 60 | 1.7% | |||||||||||||||||||
| 1.94<3.35 | B+ | 2.6% | 2.6% | 2,849 | 4,469 | 81 | 2.6% | |||||||||||||||||||
| 3.35<5.81 | B | 4.4% | 4.4% | 1,807 | 2,979 | 91 | 5.7% | |||||||||||||||||||
| 5.81<11.61 | B– | 8.3% | 9.3% | 2,330 | 2,961 | 102 | 8.1% | |||||||||||||||||||
| 11.61<100.00 | C | 15.7% | 21.7% | 1,028 | 1,553 | 130 | 18.1% | |||||||||||||||||||
| 100.00 (default) | D | 100.0% | 100.0% | 2,495 | 4,191 | – | 0.0% | |||||||||||||||||||
| Corporate -Non-SMEs |
| |||||||||||||||||||||||||
| 0.00<0.02 | AAA | 0.0% | 0.0% | 1 | – | – | 0.0% | |||||||||||||||||||
| 0.02<0.03 | AA+ | 0.0% | 0.0% | 24 | 26 | – | 0.0% | |||||||||||||||||||
| 0.03<0.04 | AA | 0.0% | 0.0% | 23 | 30 | – | 0.0% | |||||||||||||||||||
| 0.04<0.05 | AA– | 0.0% | 0.1% | 21 | 21 | – | 0.0% | |||||||||||||||||||
| 0.05<0.06 | A+ | 0.1% | 0.1% | 41 | 43 | – | 0.0% | |||||||||||||||||||
| 0.06<0.09 | A | 0.1% | 0.1% | 258 | 296 | 2 | 1.0% | |||||||||||||||||||
| 0.09<0.11 | A– | 0.1% | 0.1% | 797 | 977 | 4 | 0.2% | |||||||||||||||||||
| 0.11<0.17 | BBB+ | 0.1% | 0.1% | 1,121 | 1,570 | 5 | 0.5% | |||||||||||||||||||
| 0.17<0.24 | BBB | 0.2% | 0.2% | 1,103 | 1,504 | 6 | 0.3% | |||||||||||||||||||
| 0.29<0.39 | BBB– | 0.3% | 0.3% | 1,465 | 2,218 | 5 | 0.5% | |||||||||||||||||||
| 0.39<0.67 | BB+ | 1.0% | 0.5% | 875 | 1,991 | 11 | 1.2% | |||||||||||||||||||
| 0.67<1.16 | BB | 0.9% | 0.9% | 647 | 1,190 | 4 | 1.1% | |||||||||||||||||||
| 1.16<1.94 | BB– | 1.5% | 1.6% | 434 | 711 | 11 | 1.9% | |||||||||||||||||||
| 1.94<3.35 | B+ | 2.6% | 2.7% | 481 | 678 | 8 | 3.3% | |||||||||||||||||||
| 3.35<5.81 | B | 4.4% | 4.7% | 190 | 369 | 17 | 9.2% | |||||||||||||||||||
| 5.81<11.61 | B– | 8.0% | 9.5% | 135 | 185 | 11 | 10.3% | |||||||||||||||||||
| 11.61<100.00 | C | 15.9% | 17.2% | 55 | 72 | 10 | 24.7% | |||||||||||||||||||
| 100.00 (default) | D | 100.0% | 100.0% | 360 | 551 | – | 0.0% | |||||||||||||||||||
| 99 |
Table of Contents
BBVA S.A.
PD Range | External rating equivalent | Weighted average PD | Arithmetic average PD by obligors | Number of 12-31-2018 | obligors 12-31-2017 | Defaulted obligors in | Average historical annual default rate | |||||||||||||||||||
| Retail - Mortgage exposures |
| |||||||||||||||||||||||||
| 0.00<0.02 | AAA | 0.0% | 0.0% | 424,862 | 425,773 | 98 | 0.0% | |||||||||||||||||||
| 0.02<0.03 | AA+ | 0.0% | 0.0% | 85,594 | 91,467 | 82 | 0.1% | |||||||||||||||||||
| 0.03<0.04 | AA | 0.0% | 0.0% | 15,557 | 15,066 | 25 | 0.1% | |||||||||||||||||||
| 0.04<0.05 | AA– | 0.0% | 0.0% | 134,256 | 137,763 | 110 | 0.1% | |||||||||||||||||||
| 0.05<0.06 | A+ | 0.1% | 0.1% | 11,754 | 12,625 | 3 | 0.0% | |||||||||||||||||||
| 0.06<0.09 | A | 0.1% | 0.1% | 83,183 | 79,387 | 135 | 0.2% | |||||||||||||||||||
| 0.09<0.11 | A– | 0.1% | 0.1% | 32,424 | 32,317 | 63 | 0.1% | |||||||||||||||||||
| 0.11<0.17 | BBB+ | 0.1% | 0.1% | 59,594 | 57,647 | 136 | 0.2% | |||||||||||||||||||
| 0.17<0.24 | BBB | 0.2% | 0.2% | 40,742 | 41,780 | 168 | 0.4% | |||||||||||||||||||
| 0.29<0.39 | BBB– | 0.3% | 0.3% | 39,778 | 38,939 | 141 | 0.4% | |||||||||||||||||||
| 0.39<0.67 | BB+ | 0.5% | 0.5% | 27,410 | 28,012 | 146 | 0.8% | |||||||||||||||||||
| 0.67<1.16 | BB | 0.8% | 0.8% | 25,358 | 26,559 | 239 | 1.2% | |||||||||||||||||||
| 1.16<1.94 | BB– | 1.7% | 1.4% | 20,598 | 23,064 | 354 | 2.1% | |||||||||||||||||||
| 1.94<3.35 | B+ | 2.7% | 2.7% | 15,015 | 16,889 | 537 | 4.7% | |||||||||||||||||||
| 3.35<5.81 | B | 4.2% | 4.2% | 9,750 | 11,762 | 767 | 10.2% | |||||||||||||||||||
| 5.81<11.61 | B- | 7.2% | 7.2% | 14,798 | 16,822 | 1,579 | 13.6% | |||||||||||||||||||
| 11.61<100.00 | C | 18.2% | 18.7% | 6, 852 | 7,550 | 1,296 | 30.1% | |||||||||||||||||||
| 100.00 (default) | D | 100.0% | 100.0% | 33,927 | 39,072 | – | 0.0% | |||||||||||||||||||
| Retail - Other exposures SMEs |
| |||||||||||||||||||||||||
| 0.00<0.02 | AAA | – | – | – | – | – | – | |||||||||||||||||||
| 0.02<0.03 | AA+ | – | – | – | – | – | – | |||||||||||||||||||
| 0.03<0.04 | AA | – | – | – | – | – | – | |||||||||||||||||||
| 0.04<0.05 | AA– | – | – | – | – | – | – | |||||||||||||||||||
| 0.05<0.06 | A+ | – | – | – | – | – | – | |||||||||||||||||||
| 0.06<0.09 | A | – | – | – | – | – | – | |||||||||||||||||||
| 0.09<0.11 | A– | 0.1% | 0.1% | 12,121 | 11,473 | 6 | 0.0% | |||||||||||||||||||
| 0.11<0.17 | BBB+ | 0.1% | 0.1% | 7,017 | 5,331 | 2 | 0.0% | |||||||||||||||||||
| 0.17<0.24 | BBB | 0.2% | 0.2% | 5,708 | 5,349 | 10 | 0.0% | |||||||||||||||||||
| 0.29<0.39 | BBB– | 0.3% | 0.3% | 9,379 | 9,193 | 36 | 0.0% | |||||||||||||||||||
| 0.39<0.67 | BB+ | 0.5% | 0.5% | 13,901 | 12,242 | 46 | 0.0% | |||||||||||||||||||
| 0.67<1.16 | BB | 0.9% | 0.9% | 14,516 | 13,614 | 84 | 0.0% | |||||||||||||||||||
| 1.16<1.94 | BB– | 1.5% | 1.5% | 15,168 | 13,238 | 130 | 0.0% | |||||||||||||||||||
| 1.94<3.35 | B+ | 2.6% | 2.6% | 15,041 | 14,627 | 282 | 1.7% | |||||||||||||||||||
| 3.35<5.81 | B | 4.4% | 4.4% | 13,639 | 12,355 | 336 | 0.0% | |||||||||||||||||||
| 5.81<11.61 | B– | 8.1% | 8.1% | 11,875 | 9,971 | 472 | 0.0% | |||||||||||||||||||
| 11.61<100.00 | C | 19.6% | 19.9% | 8,742 | 7,795 | 946 | 0.0% | |||||||||||||||||||
| 100.00 (default) | D | 100.0% | 100.0% | 11,259 | 8,653 | – | 0.0% | |||||||||||||||||||
| 100 |
Table of Contents
BBVA S.A.
PD Range | External rating equivalent | Weighted average PD | Arithmetic average PD by obligors | Number of 12-31-2018 | obligors 12-31-2017 | Defaulted | Average historical annual default rate | |||||||||||||||||||
| Retail - Other exposuresNon-SMEs |
| |||||||||||||||||||||||||
| 0.00<0.02 | AAA | 0.0% | 0.0% | 127,422 | 109,370 | 41 | 0.0% | |||||||||||||||||||
| 0.02<0.03 | AA+ | 0.0% | 0.0% | 13,725 | 12,758 | 13 | 0.0% | |||||||||||||||||||
| 0.03<0.04 | AA | 0.0% | 0.0% | 30,967 | 30,512 | 4 | 0.0% | |||||||||||||||||||
| 0.04<0.05 | AA– | 0.0% | 0.0% | 938 | 782 | 2 | 0.1% | |||||||||||||||||||
| 0.05<0.06 | A+ | 0.1% | 0.1% | 16,432 | 14,125 | 15 | 0.0% | |||||||||||||||||||
| 0.06<0.09 | A | 0.1% | 0.1% | 58,448 | 52,443 | 49 | 0.1% | |||||||||||||||||||
| 0.09<0.11 | A– | 0.1% | 0.1% | 23,608 | 20,076 | 39 | 0.1% | |||||||||||||||||||
| 0.11<0.17 | BBB+ | 0.1% | 0.1% | 77,990 | 66,777 | 235 | 0.2% | |||||||||||||||||||
| 0.17<0.24 | BBB | 0.2% | 0.2% | 55,305 | 47,482 | 246 | 0.4% | |||||||||||||||||||
| 0.29<0.39 | BBB– | 0.3% | 0.3% | 86,456 | 76,925 | 495 | 0.4% | |||||||||||||||||||
| 0.39<0.67 | BB+ | 0.6% | 0.6% | 65,409 | 60,011 | 614 | 0.7% | |||||||||||||||||||
| 0.67<1.16 | BB | 0.9% | 0.9% | 62,770 | 60,232 | 867 | 0.7% | |||||||||||||||||||
| 1.16<1.94 | BB– | 1.5% | 1.5% | 54,836 | 54,792 | 1,113 | 1.7% | |||||||||||||||||||
| 1.94<3.35 | B+ | 2.6% | 2.6% | 57,172 | 58,578 | 1,432 | 1.1% | |||||||||||||||||||
| 3.35<5.81 | B | 4.5% | 4.5% | 65,823 | 72,510 | 2,622 | 3.6% | |||||||||||||||||||
| 5.81<11.61 | B– | 7.4% | 7.4% | 25,615 | 29,825 | 1,682 | 7.5% | |||||||||||||||||||
| 11.61<100.00 | C | 22.0% | 22.0% | 15,842 | 17,376 | 4,107 | 26.1% | |||||||||||||||||||
| 100.00 (default) | D | 100.0% | 100.0% | 45,874 | 36,485 | – | 0.0% | |||||||||||||||||||
| Retail - qualifying revolving (QRRE) |
| |||||||||||||||||||||||||
| 0.00<0.02 | AAA | 0.0% | 0.0% | 2,247,434 | 2,329,553 | 662 | 0.0% | |||||||||||||||||||
| 0.02<0.03 | AA+ | 0.0% | 0.0% | 192,205 | 200,306 | 211 | 0.1% | |||||||||||||||||||
| 0.03<0.04 | AA | 0.0% | 0.0% | 76,175 | 74,047 | 124 | 0.1% | |||||||||||||||||||
| 0.04<0.05 | AA– | 0.0% | 0.0% | 94,398 | 103,172 | 131 | 0.1% | |||||||||||||||||||
| 0.05<0.06 | A+ | 0.1% | 0.1% | 58,936 | 62,530 | 113 | 0.1% | |||||||||||||||||||
| 0.06<0.09 | A | 0.1% | 0.1% | 122,460 | 126,848 | 340 | 0.2% | |||||||||||||||||||
| 0.09<0.11 | A– | 0.1% | 0.1% | 69,750 | 64,513 | 146 | 0.2% | |||||||||||||||||||
| 0.11<0.17 | BBB+ | 0.1% | 0.1% | 152,190 | 171,283 | 760 | 0.3% | |||||||||||||||||||
| 0.17<0.24 | BBB | 0.2% | 0.2% | 48,987 | 67,924 | 248 | 0.3% | |||||||||||||||||||
| 0.29<0.39 | BBB– | 0.3% | 0.3% | 191,447 | 195,989 | 1,266 | 0.5% | |||||||||||||||||||
| 0.39<0.67 | BB+ | 0.5% | 0.5% | 130,075 | 137,800 | 1,377 | 0.9% | |||||||||||||||||||
| 0.67<1.16 | BB | 0.9% | 0.9% | 155,087 | 168,930 | 2,651 | 1.2% | |||||||||||||||||||
| 1.16<1.94 | BB– | 1.6% | 1.5% | 69,194 | 71,915 | 1,530 | 1.9% | |||||||||||||||||||
| 1.94<3.35 | B+ | 2.6% | 2.6% | 120,340 | 121,293 | 4,030 | 2.5% | |||||||||||||||||||
| 3.35<5.81 | B | 4.4% | 4.4% | 63,878 | 64,420 | 2,662 | 3.7% | |||||||||||||||||||
| 5.81<11.61 | B– | 7.3% | 7.3% | 46,252 | 46,855 | 2,963 | 5.3% | |||||||||||||||||||
| 11.61<100.00 | C | 15.0% | 15.5% | 30,412 | 33,622 | 4,056 | 10.1% | |||||||||||||||||||
| 100.00 (default) | D | 100.0% | 100.0% | 52,908 | 33,994 | – | 0.0% | |||||||||||||||||||
| Corporate - Specialized lending |
| |||||||||||||||||||||||||
| 101 |
Table of Contents
BANCOMER
PD Range | External rating equivalent | Weighted average PD | Arithmetic average PD by obligors | Number of 12-31-2018 | obligors 12-31-2017 | Defaulted the year | Average historical annual default rate | |||||||||||||||||||||||
| Corporate - SMEs |
| |||||||||||||||||||||||||||||
| 0.00<0.02 | AAA | – | – | 1 | – | – | – | |||||||||||||||||||||||
| 0.02<0.03 | AA+ | – | – | – | – | – | – | |||||||||||||||||||||||
| 0.03<0.04 | AA | – | – | – | – | – | – | |||||||||||||||||||||||
| 0.04<0.05 | AA– | – | – | – | – | – | – | |||||||||||||||||||||||
| 0.05<0.06 | A+ | – | – | – | – | – | – | |||||||||||||||||||||||
| 0.06<0.09 | A | – | – | – | – | – | – | |||||||||||||||||||||||
| 0.09<0.11 | A– | – | – | – | – | – | – | |||||||||||||||||||||||
| 0.11<0.17 | BBB+ | 0.1% | 0.1% | 1 | – | – | 0.0% | |||||||||||||||||||||||
| 0.17<0.24 | BBB | 0.2% | 0.2% | 35 | 138 | – | 0.0% | |||||||||||||||||||||||
| 0.29<0.39 | BBB– | 0.3% | 0.3% | 675 | 358 | – | 0.0% | |||||||||||||||||||||||
| 0.39<0.67 | BB+ | 0.5% | 0.5% | 1,448 | 517 | – | 0.0% | |||||||||||||||||||||||
| 0.67<1.16 | BB | 0.9% | 0.9% | 591 | 492 | – | 0.0% | |||||||||||||||||||||||
| 1.16<1.94 | BB– | 1.5% | 1.4% | 391 | 338 | – | 0.0% | |||||||||||||||||||||||
| 1.94<3.35 | B+ | 2.6% | 2.5% | 302 | 249 | – | 0.0% | |||||||||||||||||||||||
| 3.35<5.81 | B | 4.2% | 4.0% | 192 | 111 | – | 0.0% | |||||||||||||||||||||||
| 5.81<11.61 | B– | 7.3% | 8.1% | 481 | 63 | – | 0.0% | |||||||||||||||||||||||
| 11.61<100.00 | C | 14.8% | 14.1% | 135 | 30 | – | 0.0% | |||||||||||||||||||||||
| 100.00 (default) | D | 100.0% | 100.0% | 880 | – | – | 0.0% | |||||||||||||||||||||||
| Corporate -Non-SMEs |
| |||||||||||||||||||||||||||||
| 0.00<0.02 | AAA | – | – | – | – | – | – | |||||||||||||||||||||||
| 0.02<0.03 | AA+ | – | – | – | – | – | – | |||||||||||||||||||||||
| 0.03<0.04 | AA | – | – | – | – | – | – | |||||||||||||||||||||||
| 0.04<0.05 | AA– | – | – | – | – | – | – | |||||||||||||||||||||||
| 0.05<0.06 | A+ | 0.1% | 0.0% | 6 | 2 | – | 0.0% | |||||||||||||||||||||||
| 0.06<0.09 | A | 0.1% | 0.0% | 29 | 15 | – | 0.0% | |||||||||||||||||||||||
| 0.09<0.11 | A– | 0.1% | 0.1% | 16 | 14 | – | 0.0% | |||||||||||||||||||||||
| 0.11<0.17 | BBB+ | 0.0% | 0.1% | 87 | 66 | – | 0.0% | |||||||||||||||||||||||
| 0.17<0.24 | BBB | 0.2% | 0.2% | 209 | 124 | – | 0.0% | |||||||||||||||||||||||
| 0.29<0.39 | BBB– | 0.3% | 0.3% | 3,374 | 348 | 3 | 0.0% | |||||||||||||||||||||||
| 0.39<0.67 | BB+ | 0.5% | 0.5% | 4,683 | 513 | 5 | 0.9% | |||||||||||||||||||||||
| 0.67<1.16 | BB | 0.9% | 0.9% | 1,784 | 439 | 10 | 2.0% | |||||||||||||||||||||||
| 1.16<1.94 | BB– | 1.5% | 1.5% | 1,808 | 393 | 13 | 1.5% | |||||||||||||||||||||||
| 1.94<3.35 | B+ | 2.6% | 2.6% | 1,100 | 301 | 12 | 1.2% | |||||||||||||||||||||||
| 3.35<5.81 | B | 4.3% | 4.3% | 431 | 172 | 15 | 3.1% | |||||||||||||||||||||||
| 5.81<11.61 | B– | 7.8% | 8.0% | 7,356 | 95 | 17 | 1.2% | |||||||||||||||||||||||
| 11.61<100.00 | C | 17.2% | 15.4% | 135 | 36 | 2 | 1.7% | |||||||||||||||||||||||
| 100.00 (default) | D | 100.0% | 100.0% | 143 | 216 | 14 | 47.1% | |||||||||||||||||||||||
| 102 |
Table of Contents
BANCOMER
PD Range | External rating equivalent | Weighted average PD | Arithmetic average PD by obligors | Number of 12-31-2018 | obligors 12-31-2017 | Defaulted obligors in the year | Average historical annual default rate | |||||||||||||||||||
| Retail - qualifying revolving (QRRE) |
| |||||||||||||||||||||||||
| 0.00<0.02 | AAA | – | – | – | – | – | – | |||||||||||||||||||
| 0.02<0.03 | AA+ | – | – | – | – | – | – | |||||||||||||||||||
| 0.03<0.04 | AA | – | – | – | – | – | – | |||||||||||||||||||
| 0.04<0.05 | AA– | – | – | – | – | – | – | |||||||||||||||||||
| 0.05<0.06 | A+ | – | – | – | – | – | – | |||||||||||||||||||
| 0.06<0.09 | A | – | – | – | – | – | – | |||||||||||||||||||
| 0.09<0.11 | A– | – | – | – | – | – | – | |||||||||||||||||||
| 0.11<0.17 | BBB+ | – | – | – | 1 | – | – | |||||||||||||||||||
| 0.17<0.24 | BBB | – | – | – | – | – | – | |||||||||||||||||||
| 0.29<0.39 | BBB– | – | – | – | 51,198 | – | 0.1% | |||||||||||||||||||
| 0.39<0.67 | BB+ | 0.5% | 0.5% | 328,226 | 404,579 | 777 | 0.2% | |||||||||||||||||||
| 0.67<1.16 | BB | 0.9% | 0.9% | 684,538 | 452,764 | 2,292 | 0.4% | |||||||||||||||||||
| 1.16<1.94 | BB– | 1.6% | 1.6% | 497,696 | 541,081 | 4,149 | 0.8% | |||||||||||||||||||
| 1.94<3.35 | B+ | 2.6% | 2.6% | 635,913 | 692,988 | 8,682 | 1.2% | |||||||||||||||||||
| 3.35<5.81 | B | 4.5% | 4.5% | 800,168 | 803,451 | 14,869 | 1.7% | |||||||||||||||||||
| 5.81<11.61 | B– | 7.9% | 8.1% | 1,408,862 | 1,143,083 | 25,300 | 1.9% | |||||||||||||||||||
| 11.61<100.00 | C | 21.4% | 20.4% | 982,794 | 1,098,127 | 42,675 | 3.4% | |||||||||||||||||||
| 100.00 (default) | D | 100.0% | 100.0% | 98,562 | 112,259 | 13,610 | 1.7% | |||||||||||||||||||
BBVA IRELAND
PD Range | External rating equivalent | Weighted average PD | Arithmetic average PD by obligors | Number of 12-31-2018 | obligors 12-31-2017 | Defaulted obligors in the year | Average historical annual default rate | |||||||||||||||||||
| Institutions |
| |||||||||||||||||||||||||
| 0.11<0.17 | BBB+ | 0.1% | 0.1% | 1 | – | 0 | 0.0% | |||||||||||||||||||
| Corporate -Non-SMEs |
| |||||||||||||||||||||||||
| 0.11<0.17 | BBB+ | 0.1% | 0.1% | 1 | 5 | 0 | 0.0% | |||||||||||||||||||
| 0.24<0.39 | BBB- | 0.3% | 0.3% | 1 | 5 | 0 | 0.0% | |||||||||||||||||||
| 103 |
Table of Contents
The following table presents the main variations in the year in terms of RWAs for the Credit Risk and Counterparty advanced measurement approach:
TABLE 31: EU CR8 - RWA flow statements of credit risk exposures under the IRB approach
| Million Euros | ||||||||||||||||
| Credit Risk | Counterparty Credit Risk | |||||||||||||||
| RWA amounts | Capital Requirements | RWA amounts | Capital Requirements | |||||||||||||
| RWAs as of December 31, 2017 | 78,624 | 6,290 | 4,784 | 383 | ||||||||||||
| Asset size | (999) | (80) | 258 | 21 | ||||||||||||
| Asset quality | (365) | (29) | (1,024) | (82) | ||||||||||||
| Model updates | (1,430) | (114) | – | – | ||||||||||||
| Methodology and policy | – | – | – | – | ||||||||||||
| Acquisitions and disposals | – | – | – | – | ||||||||||||
| Foreign exchange movements | 1,319 | 105 | 38 | 3 | ||||||||||||
| Other | 17 | 1 | – | – | ||||||||||||
| RWAs as of December 31, 2018 | 77,166 | 6,173 | 4,056 | 325 | ||||||||||||
Of particular note in the evolution of credit risk-weighted assets measured using internal models in 2018 were:
| · | The update to some of the model’s parameters. In this regard, the PD parameter wasre-estimated in the BBVA SA Corporates portfolio (introducing three additional years of defaults in the historical series), reducing RWAs by EUR 2.16 billion. |
In addition, a more restrictive downturn LGD was used for the Large Corporates portfolio at BBVA Bancomer, resulting in an increase of approximately EUR 1.20 billion in RWAs. By comparison, it improved the model’s discriminatory capacity in the ratings, which reduced RWAs by approximately EUR 470 million. |
| · | The deleveraging occurring in the portfolios under the IRB model in Spain, and the effect of releasing RWAs—which caused the new securitizations that took place in 2018, and an improvement to the bank’s risk profile—reduced RWAs by EUR 1.36 billion. |
| · | In regard to the exchange rate, it should be noted that exposures in US dollars and Mexican pesos increased due to the appreciation of these currencies against the euro. |
| 3.2.5.3. | Comparative analysis of the estimations made |
The following charts compare the expected loss adjusted to the cycle calculated according to the Group’s internal estimates for the main portfolios approved by the European Central Bank, with the effective loss incurred between 2001 and 2018. They also present the average effective loss between 2001 and 2018 in accordance with the following:
| · | Expected loss: expected regulatory loss calculated with the internal estimates based on calibrations in force as of 2018, and adapted to the economic cycle, i.e. the annual average expected loss in an economic cycle. |
| · | Observed loss: effective loss calculated as the ratio of gross additions to NPA over the average observed exposure multiplied by the estimated point in time severity2. |
2The LGD (PIT) methodology allows for a better measurement of observed losses. For more recent years, given that the recovery processes have not concluded, the best estimate of final LGD is included.
| 104 |
Table of Contents
| · | Average: effective average loss (2001-2018), which is the average of effective losses for each year (light blue solid line). |
The effective loss is the annual loss incurred. It must be less than the expected loss adjusted to the cycle in the best years of an economic cycle and greater during years of crisis.
The comparison has been made for the portfolios of Mortgages, Consumer Finance, Credit Cards (2004-2018 window) and Autos (retail), and SMEs and Developers (2008-2018 window), all of them in Spain and Portugal. In Mexico, the comparison has been carried out for the Credit Card portfolio (2006-2018 window), SMEs, and Large Companies (2006-2018 window). Regarding the categories of Institutions (Public and Financial Institutions) and Corporates, historical experience shows that there is such a small number of defaulted exposures (Low Default Portfolios) that it is not statistically significant, and hence the reason the comparison is not shown.
The charts show that during the years of biggest economic growth, in general the effective loss was significantly lower than the expected loss adjusted to the cycle calculated using internal models.
The contrary was the case after the start of the crisis. This is in line with the major economic slowdown and the financial difficulties of households and companies, above all in the case of developers and construction companies.
The fact that in some portfolios the average observed loss is greater than the estimated loss is consistent with the fact that the observed time window may be worse than what would be expected in a complete economic cycle. In fact, this window has fewer expansive years than crisis years. This is not representative of a complete economic cycle.
Retail Mortgages:
Starting in 2007, the effective losses are above the expected loss adjusted to the cycle, as they are losses incurred in years of crisis. The effective losses are in line with that adjusted to the cycle.
CHART 12: Comparative analysis of expected loss: Retail mortgages
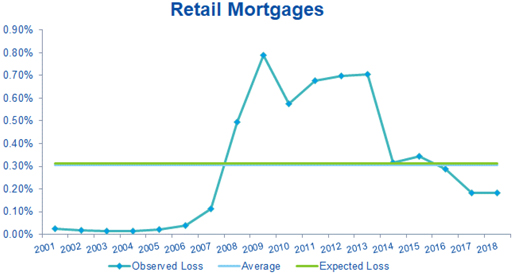
| 105 |
Table of Contents
Consumer finance:
The chart shows that during the years of biggest economic growth the effective loss was lower than the expected loss adjusted to the cycle. The contrary was the case starting in 2007. This is in line with the major economic slowdown and the financial difficulties of households. In any case, the comparison between the expected loss adjusted to the cycle and effective loss shows conservative levels.
CHART 13: Comparative analysis of expected loss: Consumer finance
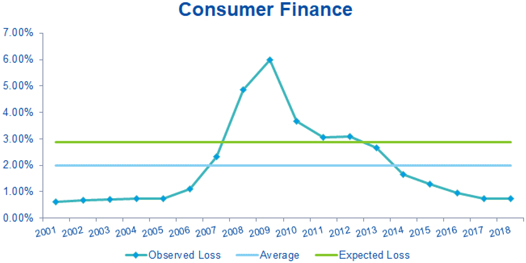
Credit cards:
As in the case of Mortgages and Consumer Finance, the observed loss is lower than the Expected Loss adjusted to the cycle calculated using internal models at best periods of the cycle, and higher during its worst periods.
CHART 14: Comparative analysis of expected loss: Credit cards
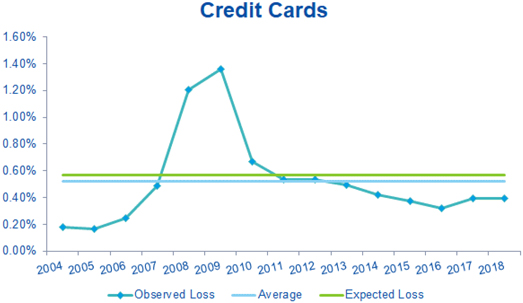
| 106 |
Table of Contents
Automobiles:
In the case of the Automobile portfolio, the expected loss adjusted to the cycle continues to be higher than the average effective losses for the last fifteen years, which suggests the conservative nature of the estimate.
CHART 15: Comparative analysis of expected loss: Automobiles
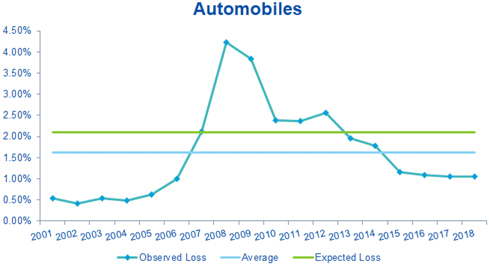
SMEs and Developers:
Due to a methodological change in the estimate of LGD, only the expected loss for the 2008-2018 window is shown for the SME and Developer portfolios. It can be seen that since 2009 the observed losses are much higher than the average expected losses in the cycle. This is because the major difficulties suffered by companies in the years of crisis, particularly those in the Construction and Developer businesses. The chart also shows that the average expected loss of the cycle is below the average observed losses. The reason is the use of an observation window which is unrepresentative of a complete economic cycle (the estimate would include comparatively more years of crisis than of economic growth).
CHART 16: Comparative analysis of expected loss: SMEs and Developers
| 107 |
Table of Contents
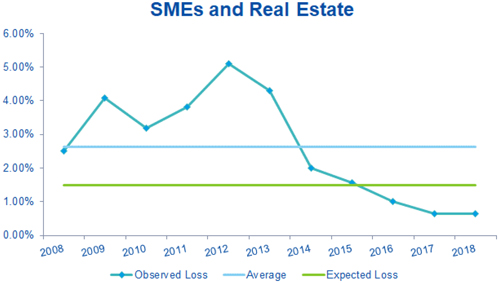
Mexico Credit Cards:
In the case of the main Bancomer card portfolio the average Expected Loss of the cycle is slightly in line with the average of observed losses.
CHART 17: Comparative analysis of expected loss: Mexico Credit Cards
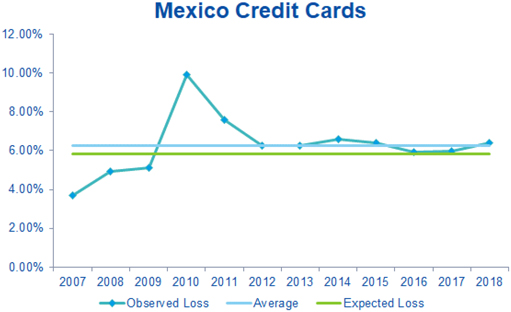
Mexico Corporates:
As with the credit cards portfolio, the Mexico corporates portfolio shows conservative levels of expected loss adjusted to the cycle if it is compared with the average observed loss.
CHART 18: Comparative analysis of expected loss: Mexico Corporates
| 108 |
Table of Contents
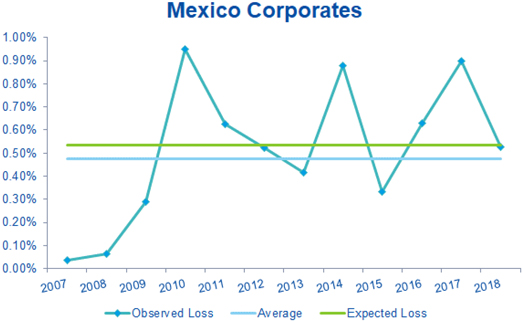
3.2.5.4 Risk weightings of specialized lending exposures
The solvency regulation stipulates that the consideration of specialized lending companies is to apply to legal entities with the following characteristics:
| · | The exposure is to an entity created specifically to finance and/or operate physical assets. |
| · | The contractual arrangements give the lender a substantial degree of control over the assets and income they generate. |
| · | The primary source of repayment of the obligation is the income generated by the assets being financed, rather than the independent capacity of the borrower. |
The following table presents the exposures assigned to each one of the risk weightings of the specialised lending exposures (including counterparty risk) as of December 31, 2018:
TABLE 32: EU CR10 (1) - IRB: Specialised lending
| Million Euros | ||||||||||||||||||||||||
Specialized lending | ||||||||||||||||||||||||
Regulatory categories Remaining Maturity | On-balance sheet amount(2) | Off-balance sheet amount (2) | RW | Exposure Amount (3) | RWAs | Expected Losses | ||||||||||||||||||
| Category 1 Less than 2.5 years | – | – | 50% | – | – | – | ||||||||||||||||||
| Category 1 Equal to or more than 2.5 years | 2,994 | 709 | 70% | 3,664 | 2,565 | 15 | ||||||||||||||||||
| Category 2 Less than 2.5 years | 315 | 52 | 70% | 351 | 246 | 1 | ||||||||||||||||||
| Category 2 Equal to or more than 2.5 years | 1,791 | 434 | 90% | 2,128 | 1,915 | 17 | ||||||||||||||||||
| Category 3 Less than 2.5 years | 243 | 15 | 115% | 251 | 288 | 7 | ||||||||||||||||||
| Category 3 Equal to or more than 2.5 years | 681 | 175 | 115% | 851 | 979 | 24 | ||||||||||||||||||
| Category 4 Less than 2.5 years | 12 | 1 | 250% | 14 | 34 | 1 | ||||||||||||||||||
| Category 4 Equal to or more than 2.5 years | 83 | 39 | 250% | 122 | 304 | 10 | ||||||||||||||||||
| Category 5 Less than 2.5 years | 110 | 6 | – | 113 | – | 57 | ||||||||||||||||||
| Category 5 Equal to or more than 2.5 years | 39 | 8 | – | 44 | – | 22 | ||||||||||||||||||
| Total Less than 2.5 years | 680 | 74 | 728 | 568 | 66 | |||||||||||||||||||
| Total Equal to or more than 2.5 years | 5,588 | 1,364 | 6,808 | 5,763 | 87 | |||||||||||||||||||
(1) Corresponds to the amount of the exposures net of provisions.
(2) Corresponds to the value ofoff-balance sheet exposure, regardless of credit conversion factors (CCF), or the effect of the Credit Risk Mitigation (CRM) techniques.
(3) Corresponds to exposure value after CRM and CCF.
| 109 |
Table of Contents
| Million Euros | ||||||||||||||||||||||||
| Specialized lending | ||||||||||||||||||||||||
Regulatory categories Remaining Maturity | On-balance sheet amount(2) | Off-balance sheet amount(2) | RW | Exposure Amount (3) | RWAs | Expected Losses | ||||||||||||||||||
| Category 1 Less than 2.5 years | – | – | 50% | – | – | – | ||||||||||||||||||
| Category 1 Equal to or more than 2.5 years | 2,966 | 842 | 70% | 3,771 | 2,640 | 15 | ||||||||||||||||||
| Category 2 Less than 2.5 years | 423 | 246 | 70% | 567 | 397 | 2 | ||||||||||||||||||
| Category 2 Equal to or more than 2.5 years | 2,050 | 497 | 90% | 2,489 | 2,240 | 20 | ||||||||||||||||||
| Category 3 Less than 2.5 years | 349 | 18 | 115% | 380 | 437 | 11 | ||||||||||||||||||
| Category 3 Equal to or more than 2.5 years | 904 | 312 | 115% | 1,211 | 1,392 | 33 | ||||||||||||||||||
| Category 4 Less than 2.5 years | 18 | 6 | 250% | 24 | 61 | 2 | ||||||||||||||||||
| Category 4 Equal to or more than 2.5 years | 227 | 137 | 250% | 364 | 910 | 29 | ||||||||||||||||||
| Category 5 Less than 2.5 years | 143 | 20 | – | 153 | – | 77 | ||||||||||||||||||
| Category 5 Equal to or more than 2.5 years | 109 | 58 | – | 152 | – | 76 | ||||||||||||||||||
| Total Less than 2.5 years | 934 | 290 | 1,125 | 895 | 91 | |||||||||||||||||||
| Total Equal to or more than 2.5 years | 6,256 | 1,846 | 7,986 | 7,181 | 173 | |||||||||||||||||||
(1) Corresponds to the amount of the exposures net of provisions.
(2) Corresponds to the value ofoff-balance sheet exposure, regardless of credit conversion factors (CCF), or the effect of the Credit Risk Mitigation (CRM) techniques.
(3) Corresponds to exposure value after CRM and CCF.
| 110 |
Table of Contents
| 3.2.5.5. | Equity exposures by calculation method |
The following table presents equity exposures by internal, PD/LGD and simple method (in this case, broken down by risk weighting) methods as of December 31, 2018 and December 31, 2017.
TABLE 33: EU CR10 (2) - IRB: Equity
Million Euros
| 12/31/2018 | Equity under the IRB approach | |||||||||||||||||||
| Categories | On-balance sheet amount (3) | Off-balance sheet amount (2) | Exposure RW Amount (3) | RWAs | Capital Requirements | |||||||||||||||
| Simple method – Private Equity | 343 | – 190% | 343 | 651 | 52 | |||||||||||||||
| Simple method – Exchange-traded equity | 309 | – 290% | 309 | 8 97 | 72 | |||||||||||||||
| Simple method – Other Equity Exposures | 61 | – 370% | 61 | 224 | 18 | |||||||||||||||
| Exposures subject to 261% risk weight | 2,525 | – 250% | 2,525 | 6,314 | 505 | |||||||||||||||
| Internal model | 383 | 383 | 1,172 | 94 | ||||||||||||||||
| PD/LGD method | 3,201 | – | 3,201 | 5,989 | 479 | |||||||||||||||
| Total | 6,822 | 6,822 | 15,246 | 1,220 | ||||||||||||||||
(1) Corresponds to the amount of the exposures net of provisions. (2) Corresponds to the value ofoff-balance sheet exposure, regardless of credit conversion factors (CCF), or the effect of the Credit Risk Mitigation (CRM) techniques. (3) Corresponds to exposure value after CRM and CCF.
|
| |||||||||||||||||||
| Million Euros |
| |||||||||||||||||||
| 12/31/2017 | Equity under the IRB approach | |||||||||||||||||||
| Categories | On-balance sheet amount (3) | Off-balance sheet amount (2) | Exposure RW Amount (3) | RWAs | Capital Requirements | |||||||||||||||
| Simple method – Private Equity | 525 | – 190% | 525 | 998 | 80 | |||||||||||||||
| Simple method – Exchange-traded equity | 170 | – 290% | 170 | 4 93 | 39 | |||||||||||||||
| Simple method – Other Equity Exposures | 88 | – 370% | 88 | 324 | 26 | |||||||||||||||
| Exposures subject to 261% risk weight | 3,098 | – 250% | 3,099 | 7,747 | 620 | |||||||||||||||
| Internal model | 527 | 527 | 2,261 | 181 | ||||||||||||||||
| PD/LGD method | 3,390 | – | 3,390 | 4,953 | 396 | |||||||||||||||
| Total | 7,798 | 7,798 | 16,775 | 1,342 | ||||||||||||||||
(1) Corresponds to the amount of the exposures net of provisions.
(2) Corresponds to the value ofoff-balance sheet exposure, regardless of credit conversion factors (CCF), or the effect of the Credit Risk Mitigation (CRM) techniques.
(3) Corresponds to exposure value after CRM and CCF.
In addition, section 3.4 shows detailed information on structural equity risk.
| 3.2.6. | Information on counterparty risk |
Counterparty exposure involves that part of the original exposure corresponding to derivative instruments, repurchase and resale transactions, securities lending transactions and deferred settlement transactions.
| 3.2.6.1. | Policies for managing counterparty risk |
| 3.2.6.1.1. | Methodology: allocation of internal capital and limits to exposures subject to counterparty risk |
The Group has an economic model for calculating internal capital through exposure to counterparty risk in treasury operations. This model has been implemented in the Risk unit systems in Market areas. It is used to estimate the credit exposures for each of the counterparties for which the entity operates.
The generation of exposures is undertaken in a manner that is consistent with those used for the monitoring and control of credit risk limits. The time horizon is divided up into intervals, and the market risk factors (interest rates, exchange rates, etc.) underlying the instruments that determine their valuation are simulated for each interval.
| 111 |
Table of Contents
The exposures are generated from 500 different scenarios using the Monte Carlo method for risk factors (subject to counterparty risk) and applying the corresponding mitigating factors by counterparty (i.e. applying collateral and/or netting arrangements as applicable).
The correlations, loss given defaults, internal ratings and associated probabilities of default are consistent with the Group’s economic model for general credit risk.
The capital by counterparty is then calculated using the exposure profile and taking into account the analytical formula adopted by Basel. This figure is modified by an adjustment factor for the possible maturity subsequent to one year of the operations in a similar vein to the general approach adopted by Basel for the treatment of credit risk.
Counterparty limits are specified within the financial programs authorized for each subsidiary within the line item of treasury limits. It stipulates both the limit and the maximum maturity for the transaction.
The businesses that generate counterparty risk are subject to risk limits that control both bilateral risk and risk with CCPs. When setting these limits for each business area and segment, and to ensure their correct application, the corresponding capital consumption and revenue generated by this operation are taken into account.
There is also a risk committee that analyses individually the most significant transactions to assess (among other aspects) the relationship between profitability and risk.
The consumption of transactions within the limits is measured in terms ofmark-to-market valuation plus the potential risk with Monte Carlo Simulation methodology (95% confidence level) and bearing in mind possible mitigating factors (such as netting, break clauses and collateral contracts).
Management of consumption by lines in the Markets area is carried out through a corporate platform that enables online monitoring of the limits and availabilities established for the different counterparties and customers. This control is completed by independent units of the business area to guarantee proper segregation of functions.
| 3.2.6.1.2. | Policies for ensuring the effectiveness of collateral and establishing the value adjustments for impairment to cover this risk |
The Group negotiates agreements with its customers to mitigate counterparty risk within the legal frameworks applicable in each of the countries where it operates. These agreements regulate the exchange of guarantees as a mechanism to reduce exposure derived from transactions that generate counterparty risk.
The assets covered by these agreements include cash, as well as financial assets with a high asset quality. In addition, the agreements with customers include mechanisms that allow the immediate replacement of the collateral if its quality is impaired (for example, a reduction in the market value or adverse changes in the asset rating).
Mitigation by netting transactions and by collateral only reduces the consumption of limits and capital if there is a positive opinion on their immediate effectiveness in case of the counterparty’s default or insolvency.
The MENTOR tool has been specifically designed to store and process the collateral contracts concluded with counterparties. This application enables the existence of collateral to be taken into account at the transaction level (useful for controlling and monitoring the status of specific operations) as well as at the counterparty level. Furthermore, said tool feeds the applications responsible for estimating counterparty risk by providing all the necessary parameters for considering the impact of mitigation in the portfolio due to the agreements signed.
| 112 |
Table of Contents
Likewise, there is also an application that reconciles and adjusts the positions serving the Collateral and Risks units.
In order to guarantee the effectiveness of collateral contracts, the Group carries out a daily monitoring of the market values of the operations governed by such contracts and of the deposits made by the counterparties. Once the amount of the collateral to be delivered or received is obtained, the collateral demand (margin call), or the demand received, is carried out at the intervals established in the contract, usually daily.
If significant variations arise from the process of reconciliation between the counterparties, after reconciliation in economic terms, they are reported by the Collateral unit to the Risks unit for subsequent analysis and monitoring. Within the control process, the Collateral unit issues a daily report on the guarantees which includes a description by counterparty of the exposure and collateral, making special reference to those guarantee deficits at or beyond the set warning levels.
Financial assets and liabilities may be the object of netting, in other words presentation for a net amount in the balance sheet, only when the Group’s entities comply with the provisions of IAS 32 - Paragraph 42, and thus have the legally obliged right to offset the amounts recognized, and the intention to settle the net amount or to divest the asset and pay the liability at the same time.
In addition, the Group has assets and liabilities on the balance sheet that are not netted and for which there are master netting agreements, but for which there is neither the intention nor the right to settle. The most common types of events that trigger netting of reciprocal obligations include the bankruptcy of the credit institution in question, swiftly accumulating indebtedness, default, restructuring or the winding up of the entity.
In the current market context, derivatives are arranged under a variety of framework contracts, with the most general being those developed by theInternational Swaps and Derivatives Association (ISDA), and for the Spanish market the Framework Agreement for Financial Transactions (FAFT). Practically all portfolio derivative operations have been concluded under these master contracts, including in them the netting clauses referred to in the above point as Master Netting Agreements, considerably reducing the credit exposure in these instruments. In addition, in the contracts concluded with professional counterparties, annexes are included with collateral agreements called Credit Support Annexes (CSA), thus minimizing exposure to a possible counterparty insolvency.
At the same time, the Group has a high volume of assets bought and sold under repurchase agreements traded through clearing houses that use mechanisms to reduce counterparty risk, as well as through various master contracts in bilateral operations, the most common being the Global Master Repurchase Agreement (GMRA), which is published by the International Capital Market Association (ICMA). This tends to have clauses added relating to the exchange of collateral within the main body of the master contract itself.
| 3.2.6.1.3. | Policies on the risk of adverse effects due to correlations |
Derivatives contracts may give rise to potential adverse correlation effects between the exposure to the counterparty and its credit quality(wrong-way-exposures).
The Group has specific policies for treating these kinds of exposures, which establish:
| · | How to identify transactions subject to adverse correlation risk. |
| · | A specific admission procedure transaction by transaction. |
| · | Measurements appropriate to the risk profile with adverse correlation. |
| · | Control and monitoring of the transaction. |
| 113 |
Table of Contents
| 3.2.6.1.4. | Impact of collateral in the event of a downgrade in credit quality |
In derivatives transactions, as a general policy the Group does not subscribe collateral contracts that involve an increase in the amount to be deposited in the event of the Group being downgraded.
The general criteria applied to date with banking counterparties is to establish a zero threshold within collateral contracts, irrespective of the mutual rating; provision will be made as collateral of any difference that arises throughmark-to-market valuation.
During 2018, in addition, with the entry into force of the regulatory requirements for the exchange of margins for derivatives not offset in clearing house, all signed collateral annexes are adequate to the characteristics required by the regulation, including the establishment of a zero threshold.
| 3.2.6.2. | Amounts of counterparty risk |
The original exposure for the counterparty risk of derivatives, according to Chapter 6 of the CRR, can be calculated using the following methods: original risk,mark-to-market valuation, standardized and internal models.
The Group calculates the value of exposure to risk through themark-to-market method, obtained as the aggregate of the positivemark-to-market value after contractual netting agreements plus the potential future risk of each transaction or instrument.
Below is a breakdown of the amount in terms of original exposure, EAD and RWAs:
TABLE 34: Positions subject to counterparty credit risk in terms of OE, EAD and RWAs
Million Euros
| Exposure Class and risk types | 2018 | |||||||||||||||||||||||||||||||||||||||||||||||
Securities financing | Derivatives and transactions with deferred settlement | From contractual netting between products | Total | |||||||||||||||||||||||||||||||||||||||||||||
| OE | EAD | RWAs | OE | EAD | RWAs | OE | EAD | RWAs | OE | EAD | RWAs | |||||||||||||||||||||||||||||||||||||
| Central governments or central banks | 7,616 | 746 | 299 | 3 | 3 | 3 | 227 | 272 | 11 | 7,846 | 1,022 | 313 | ||||||||||||||||||||||||||||||||||||
| Regional governments or local authorities | – | – | – | 3 | 3 | 1 | 1 | 1 | 0 | 5 | 5 | 1 | ||||||||||||||||||||||||||||||||||||
| Public sector entities | – | – | – | 1 | 1 | – | – | – | 1 | 1 | 0 | |||||||||||||||||||||||||||||||||||||
| Multilateral Development Banks | – | – | – | – | – | – | – | – | – | – | – | – | ||||||||||||||||||||||||||||||||||||
| Institutions | 4,364 | 834 | 178 | 1,694 | 1,382 | 485 | 1,676 | 989 | 549 | 7,735 | 3,205 | 1,212 | ||||||||||||||||||||||||||||||||||||
| Corporates | 1,237 | 208 | 208 | 769 | 769 | 767 | 493 | 468 | 460 | 2,498 | 1, 444 | 1,435 | ||||||||||||||||||||||||||||||||||||
| Retail | 0 | 0 | 0 | 16 | 16 | 11 | 7 | 7 | 4 | 23 | 23 | 15 | ||||||||||||||||||||||||||||||||||||
| Secured by mortgages on immovable property | – | – | – | – | – | – | – | – | – | – | – | – | ||||||||||||||||||||||||||||||||||||
| Exposures in default | – | – | – | 21 | 21 | 31 | 0 | 0 | 0 | 21 | 21 | 31 | ||||||||||||||||||||||||||||||||||||
| Exposures associated with particularly high risk | – | – | – | – | – | – | – | – | – | – | – | – | ||||||||||||||||||||||||||||||||||||
| Covered bonds | – | – | – | – | – | – | – | – | – | – | – | – | ||||||||||||||||||||||||||||||||||||
Short-term claims on institutions and corporate | – | – | – | – | – | – | – | – | – | – | – | – | ||||||||||||||||||||||||||||||||||||
| Collective investments undertakings | 7 | 0 | 0 | 0 | 0 | 0 | – | – | – | 7 | 0 | 0 | ||||||||||||||||||||||||||||||||||||
| Other exposures | – | 8,517 | – | – | 312 | – | – | 714 | – | – | 9,543 | – | ||||||||||||||||||||||||||||||||||||
| Total credit risk by standardised approach | 13,224 | 10,306 | 685 | 2,508 | 2,508 | 1,298 | 2,404 | 2,451 | 1,025 | 18,136 | 15,265 | 3,008 | ||||||||||||||||||||||||||||||||||||
| Central governments or central banks | 4,814 | 4,814 | 217 | 18 | 18 | 9 | – | – | – | 4,831 | 4,831 | 226 | ||||||||||||||||||||||||||||||||||||
| Institutions | 50,179 | 50,179 | 425 | 1,926 | 1,926 | 453 | 15,585 | 15,405 | 913 | 67,690 | 67,510 | 1,790 | ||||||||||||||||||||||||||||||||||||
| Corporates | 17 | 17 | 0 | 795 | 795 | 548 | 2,671 | 2,671 | 1,489 | 3,483 | 3,483 | 2,037 | ||||||||||||||||||||||||||||||||||||
Of which: SMEs | – | – | – | 36 | 36 | 30 | 78 | 78 | 66 | 114 | 114 | 96 | ||||||||||||||||||||||||||||||||||||
Of which: companies of specialized finance | – | – | – | 266 | 266 | 201 | 770 | 770 | 708 | 1,036 | 1,036 | 909 | ||||||||||||||||||||||||||||||||||||
Of which: other | 17 | 17 | 0 | 494 | 494 | 317 | 1,823 | 1,823 | 715 | 2,333 | 2,333 | 1.032 | ||||||||||||||||||||||||||||||||||||
| Retail | – | – | – | 3 | 3 | 1 | 4 | 4 | 2 | 7 | 7 | 3 | ||||||||||||||||||||||||||||||||||||
Of which:Secured by real estate collateral | – | – | – | – | – | – | – | – | – | – | – | – | ||||||||||||||||||||||||||||||||||||
Of which: Qualifying revolving retail | – | – | – | – | – | – | – | – | – | – | – | – | ||||||||||||||||||||||||||||||||||||
Of which: Other retail assets | – | – | – | 3 | 3 | 1 | 4 | 4 | 2 | 7 | 7 | 3 | ||||||||||||||||||||||||||||||||||||
Other corporates: SMEs | – | – | – | 3 | 3 | 1 | 4 | 4 | 2 | 7 | 7 | 3 | ||||||||||||||||||||||||||||||||||||
Other corporates: No SMEs | – | – | – | 0 | 0 | 0 | 0 | 0 | 0 | 0 | 0 | 0 | ||||||||||||||||||||||||||||||||||||
| Total credit risk by IRB approach | 55,010 | 55,010 | 643 | 2,742 | 2,742 | 1,011 | 18,260 | 18,080 | 2,403 | 76,012 | 75,832 | 4,056 | ||||||||||||||||||||||||||||||||||||
| Total credit risk | 68,234 | 65,316 | 1,327 | 5,250 | 5,250 | 2,309 | 20,664 | 20,530 | 3,428 | 91,148 | 91,096 | 7,065 | ||||||||||||||||||||||||||||||||||||
| 114 |
Table of Contents
Million Euros
| Exposure Class and risk types | 2017 | |||||||||||||||||||||||||||||||||||||||||||||||
Securities financing transactions | Derivatives and transactions with deferred settlement | From contractual netting between products | Total | |||||||||||||||||||||||||||||||||||||||||||||
| OE | EAD | RWAs | OE | EAD | RWAs | OE | EAD | RWAs | OE | EAD | RWAs | |||||||||||||||||||||||||||||||||||||
| Central governments or central banks | 5, 455 | 3,915 | 180 | 7 | 8 | 4 | 348 | 436 | 4 | 5,810 | 4,360 | 188 | ||||||||||||||||||||||||||||||||||||
| Regional governments or local authorities | 1 | – | – | 1 | – | – | 31 | 30 | 6 | 33 | 30 | 6 | ||||||||||||||||||||||||||||||||||||
| Public sector entities | – | – | – | – | – | – | 4 | 4 | 1 | 4 | 4 | 1 | ||||||||||||||||||||||||||||||||||||
| Multilateral Development Banks | – | – | – | – | – | – | – | – | – | – | – | |||||||||||||||||||||||||||||||||||||
| Institutions | 2,681 | 470 | 249 | 2,173 | 2,173 | 339 | 2,275 | 1,440 | 765 | 7,128 | 4,082 | 1,353 | ||||||||||||||||||||||||||||||||||||
| Corporates | 4,038 | 212 | 202 | 791 | 791 | 785 | 538 | 508 | 494 | 5,367 | 1,511 | 1,480 | ||||||||||||||||||||||||||||||||||||
| Retail | 15 | 2 | 1 | 31 | 31 | 20 | 17 | 17 | 11 | 64 | 50 | 31 | ||||||||||||||||||||||||||||||||||||
| Secured by mortgages on immovable property | – | – | – | – | – | – | – | – | – | – | – | – | ||||||||||||||||||||||||||||||||||||
| Exposures in default | – | – | – | – | – | – | – | – | – | – | – | 1 | ||||||||||||||||||||||||||||||||||||
| Exposures associated with particularly high risk | – | – | – | – | – | – | – | – | – | – | – | – | ||||||||||||||||||||||||||||||||||||
| Covered bonds | – | – | – | – | – | – | – | – | – | – | – | – | ||||||||||||||||||||||||||||||||||||
| Short-term claims on institutions and corporate | – | – | – | – | – | – | – | – | – | – | – | – | ||||||||||||||||||||||||||||||||||||
| Collective investments undertakings | – | – | – | – | – | – | – | – | – | – | – | – | ||||||||||||||||||||||||||||||||||||
| Other exposures | – | 6,051 | – | – | – | – | – | 867 | – | – | 6,918 | – | ||||||||||||||||||||||||||||||||||||
| Total credit risk by standardised approach | 12.190 | 10,649 | 632 | 3,003 | 3,003 | 1,147 | 3,214 | 3,304 | 1,282 | 18,407 | 16,956 | 3,060 | ||||||||||||||||||||||||||||||||||||
| central governments or central banks | 1,075 | 1,075 | 750 | 19 | 19 | 13 | 59 | 59 | – | 1,154 | 1,154 | 763 | ||||||||||||||||||||||||||||||||||||
| Institutions | 46,133 | 46,133 | 337 | 1,967 | 1,966 | 661 | 14,869 | 14,655 | 945 | 62,968 | 62,754 | 1,943 | ||||||||||||||||||||||||||||||||||||
| Corporates | 13 | 13 | – | 490 | 490 | 329 | 2,811 | 2,311 | 1,744 | 3,314 | 3,314 | 2,074 | ||||||||||||||||||||||||||||||||||||
Of which; SMEs | – | – | – | 55 | 55 | 39 | 94 | 94 | 82 | 149 | 149 | 121 | ||||||||||||||||||||||||||||||||||||
Of which: companies of specialized finance | – | – | – | 278 | 278 | 218 | 903 | 903 | 838 | 1,180 | 1,180 | 1,056 | ||||||||||||||||||||||||||||||||||||
Of which: other | 13 | 13 | – | 158 | 158 | 73 | 1,814 | 1,814 | 824 | 1,935 | 1,985 | 897 | ||||||||||||||||||||||||||||||||||||
| Retail | – | – | – | 4 | 4 | 2 | 4 | 4 | 2 | 8 | 8 | – | ||||||||||||||||||||||||||||||||||||
Of which: Secured by real estate collateral | – | – | – | – | – | – | – | – | – | – | – | – | ||||||||||||||||||||||||||||||||||||
Of which: Qualifying revolving retail | – | – | – | – | – | – | – | – | – | – | – | – | ||||||||||||||||||||||||||||||||||||
Of which: Other retail assets | – | – | – | 4 | 4 | 2 | 4 | 4 | 2 | 8 | 8 | 4 | ||||||||||||||||||||||||||||||||||||
Other corporates: SMEs | – | – | – | 4 | 4 | 2 | 4 | 4 | 2 | 8 | 8 | 4 | ||||||||||||||||||||||||||||||||||||
Other corporates: No SMEs | – | – | – | – | – | – | – | – | – | – | – | – | ||||||||||||||||||||||||||||||||||||
| Total credit risk by IRB approach | 47,221 | 47,221 | 1,087 | 2 . 480 | 2, 479 | 1,005 | 17,743 | 17,529 | 2,691 | 67,444 | 67,230 | 4,784 | ||||||||||||||||||||||||||||||||||||
| Total credit risk | 59,411 | 57,870 | 1,720 | 5,483 | 5,483 | 2,152 | 20,957 | 20,833 | 3,973 | 85,851 | 84,186 | 7,844 | ||||||||||||||||||||||||||||||||||||
From the amounts shown in the table above, those referring to the counterparty risk in the trading book are shown below:
TABLE 35: Amounts of counterparty risk in the trading book
Million Euros
Counterparty Risk Trading Book Activities | 2018 | 2017 | ||||||||||||||
| Mtm Method | Internal Models | (IMM) Mtm Method | Internal Models (IMM) | |||||||||||||
| Standardised Approach | 193 | 194 | ||||||||||||||
| Advanced Approach | 323 | 296 | ||||||||||||||
| Total | 516 | 490 | ||||||||||||||
The Group currently has a totally residual amount of capital requirements for trading-book activity liquidation risk.
The following table presents the amounts in million euros involved in the counterparty risk of derivatives as of December 31, 2018 and December 31, 2017:
TABLE 36: EUCCR5-A - Impact of netting and collateral held on exposure values(1)
Million Euros
| 12/31/2018 | Gross positive fair value or net carrying amount | Netting benefits | Netted current credit exposure | Collateral held | Net credit exposure | |||||||||||||
| Derivatives(2) | 35,34 9 | (23,940) | 11,409 | (6,219) | 5,190 | |||||||||||||
| SFTs(3) | 27,758 | (35) | 27,723 | (25,359) | 2,364 | |||||||||||||
| Cross-product netting | – | – | – | – | – | |||||||||||||
| Total | 63,108 | (23,941) | 39,167 | (31,578) | 7,554 | |||||||||||||
(1) SFTs include both relative amount of recognized financial instruments and collaterals that are not netted on balance sheet but reduce credit risk.
Collaterals of derivatives correspond only to those that mitigate for capital purpose.
(2) Positive mark to market of derivatives is included.
(3) Includes solely the amount of reverse repo transactions.
| 115 |
Table of Contents
Million Euros
| 12/31/2017 | Gross positive fair value or net carrying amount | Netting benefits | Netted current credit exposure | Collateral held | Net credit exposure | |||||||||||||||
| Derivatives(2) | 42,125 | (29,327) | 12,798 | (6,028) | 6,770 | |||||||||||||||
| SFTs(3) | 25,979 | (644) | 25,335 | (26,219) | (884) | |||||||||||||||
| Cross-product netting | – | – | – | – | – | |||||||||||||||
| Total | 68,104 | (29,972) | 38,133 | (32,247) | 5,886 | |||||||||||||||
(1) SFTs include both relative amount of recognized financial instruments and collaterals that are not netted on balance sheet but reduce credit risk.
Collaterals of derivatives correspond only to those that mitigate for capital purpose.
(2) Positive mark to market of derivatives is included.
(3) Includes solely the amount of reverse repo transactions
Below, there is a complete overview of the methods used to calculate the regulatory requirements for counterparty credit risk and the main parameters of each method (excluding requirements for CVA and exposures offset through a CCP, which are shown in tables CCR2 and CCR8, respectively).
TABLE 37: EU CCR1 - Analysis of counterparty credit risk exposure by approach
Million Euros
| 12-31-2018 | 12-31-2017 | |||||||||||||||||||||||||||||||
Replacement Cost / Current market value | Potential future credit exposure | EAD post- CRM | RWAs | Replacement Cost / Current market value | Potential future credit exposure | EAD post- CRM | RWAs | |||||||||||||||||||||||||
| Mark to market | 11,082 | 11,020 | 20,278 | 5,569 | 12,514 | 10,254 | 21,213 | 6,001 | ||||||||||||||||||||||||
| Internal Model Method (for derivatives and SFTs) | – | – | – | – | – | – | ||||||||||||||||||||||||||
| Simple Approach for credit risk mitigation (for SFTs) | – | – | – | – | – | – | – | – | ||||||||||||||||||||||||
| Comprehensive Approach for credit risk mitigation (for SFTs) | – | – | 61,331 | 1,180 | – | – | 56,937 | 1,643 | ||||||||||||||||||||||||
| VaR for SFTs | – | – | – | – | – | – | – | – | ||||||||||||||||||||||||
| Total | 11,082 | 11,020 | 81,609 | 6,749 | 12,514 | 10,254 | 78,150 | 7,644 | ||||||||||||||||||||||||
| 3.2.6.2.1. | Counterparty risk by standardized approach |
The following table presents a breakdown of exposure to counterparty credit risk (following mitigation and CCF techniques) calculated using the standardized method, by exposure class and risk weighting:
| 116 |
Table of Contents
Table of Contents
TABLE 38: EU CCR3 - Standardized approach: counterparty credit risk exposures by regulatory portfolio and risk
| Million Euros | ||||||||||||||||||||||||||||||||||||||||||||||||||||
| Risk weight | Of which: unrated | |||||||||||||||||||||||||||||||||||||||||||||||||||
| Exposure Class | 0% | 2% | 4% | 10% | 20% | 50% | 70% | 75% | 100% | 150% | Others | Total | ||||||||||||||||||||||||||||||||||||||||
| Central governments or central banks | 649 | – | – | – | 71 | 8 | – | – | 295 | – | – | 1,022 | 193 | |||||||||||||||||||||||||||||||||||||||
| Regional government or local authorities | – | – | – | – | 4 | – | – | – | – | – | 5 | 5 | ||||||||||||||||||||||||||||||||||||||||
| Public sector entities | – | – | – | – | 1 | – | – | – | – | – | 1 | 1 | ||||||||||||||||||||||||||||||||||||||||
| Multilateral development banks | – | – | – | – | – | – | – | – | – | – | – | – | – | |||||||||||||||||||||||||||||||||||||||
| International organisations | – | – | – | – | – | – | – | – | – | – | – | – | – | |||||||||||||||||||||||||||||||||||||||
| Institutions | – | 275 | 98 | – | 1,622 | 664 | – | – | 546 | – | – | 3,205 | 3,170 | |||||||||||||||||||||||||||||||||||||||
| Corporates | – | – | – | – | 1 | 12 | – | – | 1,428 | 2 | – | 1,444 | 1,423 | |||||||||||||||||||||||||||||||||||||||
| Retail | – | – | – | – | – | – | – | 23 | – | – | – | 23 | 23 | |||||||||||||||||||||||||||||||||||||||
| Institutions and corporates with a short term credit assessment | – | – | – | – | – | – | – | – | – | – | – | – | – | |||||||||||||||||||||||||||||||||||||||
| Other items | 9,543 | – | – | – | – | – | – | – | 21 | – | 9,564 | 9,564 | ||||||||||||||||||||||||||||||||||||||||
| Total | 10,192 | 275 | 98 | – | 1,699 | 685 | – | 23 | 2,269 | 23 | – | 15,265 | 14,380 | |||||||||||||||||||||||||||||||||||||||
(1) Of which: Unrated refers to exposures for which no credit rating from a designated ECAIs is available |
| |||||||||||||||||||||||||||||||||||||||||||||||||||
| Million Euros | ||||||||||||||||||||||||||||||||||||||||||||||||||||
| Risk weight | Of which: unrated | |||||||||||||||||||||||||||||||||||||||||||||||||||
| Exposure Class | 0% | 2% | 4% | 10% | 20% | 50% | 70% | 75% | 100% | 150% | Others | Total | ||||||||||||||||||||||||||||||||||||||||
| Central governments or central banks | 4,058 | – | – | – | – | 226 | – | – | 75 | – | – | 4,360 | 3,619 | |||||||||||||||||||||||||||||||||||||||
| Regional government or local authorities | – | – | – | – | 30 | – | – | – | – | – | – | 30 | 8 | |||||||||||||||||||||||||||||||||||||||
| Public sector entities | – | – | – | – | 4 | – | – | – | – | – | – | 4 | 4 | |||||||||||||||||||||||||||||||||||||||
| Multilateral development banks | – | – | – | – | – | – | – | – | – | – | – | – | – | |||||||||||||||||||||||||||||||||||||||
| International organisations | – | – | – | – | – | – | – | – | – | – | – | – | – | |||||||||||||||||||||||||||||||||||||||
| Institutions | – | 1,099 | 72 | – | 1,778 | 322 | – | – | 812 | – | – | 4,082 | 3,937 | |||||||||||||||||||||||||||||||||||||||
| Corporates | – | – | – | – | 3 | 46 | – | – | 1,458 | 4 | – | 1,511 | 1,505 | |||||||||||||||||||||||||||||||||||||||
| Retail | – | – | – | – | – | – | – | 50 | – | – | – | 50 | 50 | |||||||||||||||||||||||||||||||||||||||
| Institutions and corporates with a short term credit assessment | – | – | – | – | – | – | – | – | – | – | – | – | – | |||||||||||||||||||||||||||||||||||||||
| Other items | 6,918 | – | – | – | – | – | – | – | – | – | – | 6,918 | 6,918 | |||||||||||||||||||||||||||||||||||||||
| Total | 10,976 | 1,099 | 72 | – | 1,816 | 594 | – | 50 | 2,345 | 5 | – | 16,955 | 16,043 | |||||||||||||||||||||||||||||||||||||||
(1) Of which: Unrated refers to exposures for which no credit rating from a designated ECAIs is available
| 118 |
Table of Contents
| 3.2.6.2.2. | Counterparty risk by advanced measurement approach |
The following table presents the relevant parameters used to calculate the capital requirements for counterparty credit risk in the IRB models as of December 31, 2018:
TABLE 39: EU CCR4 – IRB approach: counterparty credit risk exposure by portfolio and PD scale
Million Euros
| PD scale as of 12-31-18 (1) | EAD post-CRM | Average PD (2) | Number of Obligors | Average LGD (3) | Average Maturity (days) (4) | RWAs | RWA Density | |||||||||||||||||||||
| Prudential Portfolio – FIRB method (5) | 1,036 | – | 331 | – | 909 | 87.8% | ||||||||||||||||||||||
| Corporate - Specialized lending | 1,036 | – | 331 | – | – | 909 | 87.8% | |||||||||||||||||||||
| Prudential Portfolio – AIRB method | 74,796 | 0.2% | 6,946 | 10.4% | 3,147 | 4.2% | ||||||||||||||||||||||
| Central governments or central banks | 4,831 | 0.2% | 6 | 3.8% | 38 | 226 | 4.7% | |||||||||||||||||||||
| 0,00 to <0,15 | 4,643 | 0.1% | 2 | 2.3% | 1 | 14 | 0.3% | |||||||||||||||||||||
| 0,15 to <0,25 | 17 | 0.2% | 1 | 40.0% | 115 | 8 | 45.9% | |||||||||||||||||||||
| 0,25 to <0,50 | – | – | – | – | – | – | – | |||||||||||||||||||||
| 0,50 to <0,75 | – | – | – | – | – | – | – | |||||||||||||||||||||
| 0,75 to <2,50 | – | – | – | – | – | – | – | |||||||||||||||||||||
| 2,50 a <10,00 | 172 | 4 .4% | 3 | 40.0% | 37 | 204 | 118.5% | |||||||||||||||||||||
| 10,00 to <100,00 | – | – | – | – | – | – | – | |||||||||||||||||||||
| 100,00 (Default) | – | – | – | – | – | – | – | |||||||||||||||||||||
| Institutions | 67,510 | 0.2% | 2,362 | 9.8% | 22 | 1,790 | 2.7% | |||||||||||||||||||||
| 0,00 to <0,15 | 54,373 | 0.1% | 1,879 | 11.5% | 23 | 1,422 | 2.6% | |||||||||||||||||||||
| 0,15 to <0,25 | 4,514 | 0.2% | 184 | 2.8% | 23 | 86 | 1.9% | |||||||||||||||||||||
| 0,25 to <0,50 | 4,786 | 0.3% | 90 | 2.0% | 15 | 85 | 1.8% | |||||||||||||||||||||
| 0,50 to <0,75 | 1175 | 0.5% | 33 | 5.3% | 29 | 74 | 6.3% | |||||||||||||||||||||
| 0,75 to <2,50 | 2199 | 1.3% | 157 | 2.4% | 16 | 90 | 4.1% | |||||||||||||||||||||
| 2,50 a <10,00 | 460 | 2.7% | 14 | 3.1% | 11 | 33 | 7.1% | |||||||||||||||||||||
| 10,00 to <100,00 | 2 | 21.2% | 5 | 20.0% | 59 | 1 | 42.0% | |||||||||||||||||||||
| 100,00 (Default) | – | – | – | – | – | – | – | |||||||||||||||||||||
| Corporate - SMEs | 114 | 15.7% | 1,814 | 41.2% | 64 | 96 | 84 . 3% | |||||||||||||||||||||
| 0,00 to <0,15 | 9 | 0.1% | 313 | 40.1% | 47 | 2 | 19.2% | |||||||||||||||||||||
| 0,15 to <0,25 | 5 | 0.2% | 139 | 42.4% | 61 | 1 | 27.3% | |||||||||||||||||||||
| 0,25 to <0,50 | 4 | 0.3% | 190 | 40.6% | 68 | 1 | 35.2% | |||||||||||||||||||||
| 0,50 to <0,75 | 5 | 0.5% | 276 | 40.5% | 69 | 3 | 54.4% | |||||||||||||||||||||
| 0,75 to <2,50 | 39 | 1.3% | 444 | 41.4% | 59 | 41 | 103.8% | |||||||||||||||||||||
| 2,50 a <10,00 | 36 | 4.5% | 340 | 41.2% | 75 | 43 | 120.3% | |||||||||||||||||||||
| 10,00 to <100,00 | 0 | 18.6% | 33 | 40.3% | 83 | 0 | 167.6% | |||||||||||||||||||||
| 100,00 (Default) | 16 | 100.0% | 79 | 41.3% | 79 | 5 | 30.5% | |||||||||||||||||||||
| Corporate - Non-SMEs | 2,333 | 0.3% | 1,591 | 40.2% | 66 | 1,032 | 44.2% | |||||||||||||||||||||
| 0,00 to <0,15 | 1,290 | 0.1% | 589 | 38.8% | 62 | 343 | 26.6% | |||||||||||||||||||||
| 0,15 to <0,25 | 228 | 0.2% | 259 | 41.0% | 58 | 87 | 38.0% | |||||||||||||||||||||
| 0,25 to <0,50 | 331 | 0.3% | 357 | 43.9% | 82 | 237 | 71.7% | |||||||||||||||||||||
| 0,50 to <0,75 | 407 | 0.5% | 139 | 40.8% | 51 | 284 | 69.9% | |||||||||||||||||||||
| 0,75 to <2,50 | 47 | 1.1% | 166 | 43.0% | 70 | 45 | 97.1% | |||||||||||||||||||||
| 2,50 a <10,00 | 30 | 2.9% | 60 | 43.9% | 77 | 35 | 115.9% | |||||||||||||||||||||
| 10,00 to <100,00 | 0 | 11.9% | 3 | 42.7% | 81 | 0 | 208.0% | |||||||||||||||||||||
| 100,00 (Default) | 1 | 100.0% | 18 | 44.0% | 84 | 0 | 13.5% | |||||||||||||||||||||
| Retail - Other SMEs | 7 | 33.3% | 1,135 | 40.4% | – | 3 | 39.2% | |||||||||||||||||||||
| 0,00 to <0,15 | 0 | 0.1% | 116 | 40.0% | – | – | 9.2% | |||||||||||||||||||||
| 0,15 to <0,25 | 0 | 0.2% | 55 | 40.0% | – | – | 13.3% | |||||||||||||||||||||
| 0,25 to <0,50 | 0 | 0.3% | 57 | 40.0% | – | – | 18.4% | |||||||||||||||||||||
| 0,50 to <0,75 | 0 | 0.5% | 139 | 40.0% | – | – | 23.9% | |||||||||||||||||||||
| 0,75 to <2,50 | 0 | 1.2% | 232 | 40.0% | – | - | 34.5% | |||||||||||||||||||||
| 2,50 a <10,00 | 2 | 5.9% | 345 | 40.0% | – | 1 | 47.2% | |||||||||||||||||||||
| 10,00 to <100,00 | 2 | 20.6% | 104 | 40.0% | – | 1 | 65.6% | |||||||||||||||||||||
| 100,00 (Default) | 2 | 100.0% | 87 | 41.6% | – | – | 13.5% | |||||||||||||||||||||
| Retail - Other Non-SMEs | 0 | 4.5% | 38 | 40.0% | – | – | 56.5% | |||||||||||||||||||||
| 0,00 to <0,15 | 0 | 0.1% | 16 | 40.0% | – | – | 6.7% | |||||||||||||||||||||
| 0,15 to <0,25 | – | – | – | – | – | – | – | |||||||||||||||||||||
| 0,25 to <0,50 | – | – | – | – | – | – | – | |||||||||||||||||||||
| 0,50 to <0,75 | – | – | – | – | – | – | – | |||||||||||||||||||||
| 0,75 to <2,50 | 0 | 0.9% | 11 | 40.0% | – | – | 50.0% | |||||||||||||||||||||
| 2,50 a <10,00 | 0 | 5.2% | 9 | 40.0% | – | – | 62.7% | |||||||||||||||||||||
| 10,00 to <100,00 | – | – | 2 | – | – | – | – | |||||||||||||||||||||
| 100,00 (Default) | – | – | – | – | – | – | – | |||||||||||||||||||||
| Total Advanced Approach | 75,832 | 0.2% | 7,277 | 10,4% | 4,056 | 5.3% | ||||||||||||||||||||||
(1) PD intervals recommended by EBA guidelines on Pilar III disclosure requirements (Eighth Part of CRR).
(2) Corresponds to PD byEAD-weighted debtor category.
(3) Corresponds to LGD byEAD-weighted debtor category.
(4) Corresponds to theEAD-weighted debtor expiration in days.
(5) Exposures under the FIRB method correspond to Specialised Lending, for which the Group has opted for the method of supervisory slotting criteria, in line with article 153.5 of CRR.
| 119 |
Table of Contents
Million Euros
PD scale as of 12-31-17 (1) | EAD0 post-CRM | Average PD (2) | Number of Obligors | Average LGD (3) | Average Maturity (days) (4) | RWAs | RWA Density | |||||||||||||||||||||
| Prudential Portfolio– FIRB method(5) | 1,180 | – | 361 | – | 1,056 | 89.5% | ||||||||||||||||||||||
| Corporate - Specialized lending | 1,180 | – | 361 | – | – | 1,056 | 89.5% | |||||||||||||||||||||
| Prudential Portfolio– AIRB method | 66,049 | 0.2% | 7,958 | 26.0% | 3,728 | 5.6% | ||||||||||||||||||||||
| Central governments or central banks | 1,154 | 2.6% | 4 | 15.3% | 48 | 763 | 66.1% | |||||||||||||||||||||
| 0,00 to <0,15 | 59 | 0.0% | 1 | 1.2% | 1 | 0 | 0.0% | |||||||||||||||||||||
| 0,15 to <0,25 | – | – | – | – | – | – | – | |||||||||||||||||||||
| 0,25 to <0,50 | 19 | 0.3% | 1 | 40.0% | 150 | 13 | 65.9% | |||||||||||||||||||||
| 0,50 to <0,75 | 446 | 0.5% | 1 | 0.0% | 37 | – | 0.0% | |||||||||||||||||||||
| 0,75 to <2,50 | – | – | – | 0.0% | – | – | 0.0% | |||||||||||||||||||||
| 2,50 a <10,00 | 630 | 4.4% | 1 | 26.7% | 4 | 750 | 119.1% | |||||||||||||||||||||
| 10,00 to <100,00 | – | – | – | – | – | – | – | |||||||||||||||||||||
| 100,00 (Default) | – | – | – | – | – | – | – | |||||||||||||||||||||
| Institutions | 62,754 | 0.2% | 2,082 | 26.2% | 31 | 1,943 | 3.1% | |||||||||||||||||||||
| 0,00 to <0,15 | 52,512 | 0.1% | 1,651 | 26.6% | 32 | 1,572 | 3.0% | |||||||||||||||||||||
| 0,15 to <0,25 | 2,698 | 0.2% | 145 | 24.4% | 23 | 90 | 3.3% | |||||||||||||||||||||
| 0,25 to <0,50 | 5,620 | 0.3% | 77 | 25.4% | 21 | 87 | 1.5% | |||||||||||||||||||||
| 0,50 to <0,75 | 206 | 0.5% | 28 | 16.4% | 32 | 30 | 14.3% | |||||||||||||||||||||
| 0,75 to <2,50 | 800 | 1.1% | 154 | 23.7% | 30 | 85 | 10.7% | |||||||||||||||||||||
| 2,50 a <10,00 | 913 | 3.9% | 22 | 22.1% | 45 | 77 | 8.4% | |||||||||||||||||||||
| 10,00 to <100,00 | 5 | 21.2% | 4 | 22.3% | 71 | 3 | 67.7% | |||||||||||||||||||||
| 100,00 (Default) | – | 100.0% | 1 | – | – | – | – | |||||||||||||||||||||
| Corporate - SMEs | 149 | 12.3% | 2,514 | 39.6% | 547 | 121 | 81.4% | |||||||||||||||||||||
| 0,00 to <0,15 | 10 | 0.1% | 362 | 36.1% | 54 | 2 | 18.0% | |||||||||||||||||||||
| 0,15 to <0,25 | 9 | 0.2% | 172 | 40.3% | 42 | 2 | 25.8% | |||||||||||||||||||||
| 0,25 to <0,50 | 8 | 0.3% | 281 | 40.4% | 67 | 3 | 34.3% | |||||||||||||||||||||
| 0,50 to <0,75 | 11 | 0.5% | 353 | 40.4% | 52 | 5 | 47.3% | |||||||||||||||||||||
| 0,75 to <2,50 | 48 | 1.1% | 700 | 38.9% | 72 | 44 | 91.1% | |||||||||||||||||||||
| 2,50 a <10,00 | 46 | 4.7% | 503 | 40.4% | 80 | 58 | 126.0% | |||||||||||||||||||||
| 10,00 to <100,00 | 2 | 16.0% | 60 | 35.2% | 94 | 2 | 147.7% | |||||||||||||||||||||
| 100,00 (Default) | 15 | 100.0% | 83 | 40.5% | 85 | 5 | 33.3% | |||||||||||||||||||||
| Corporate - Non-SMEs | 1,985 | 0.3% | 1,444 | 41.3% | 73 | 897 | 45.2% | |||||||||||||||||||||
| 0,00 to <0,15 | 1,072 | 0.1% | 434 | 40.1% | 68 | 286 | 26.7% | |||||||||||||||||||||
| 0,15 to <0,25 | 231 | 0.2% | 199 | 39.8% | 66 | 82 | 35.3% | |||||||||||||||||||||
| 0,25 to <0,50 | 203 | 0.3% | 301 | 44.0% | 75 | 111 | 54.5% | |||||||||||||||||||||
| 0,50 to <0,75 | 404 | 0.5% | 225 | 43.9% | 83 | 338 | 83.6% | |||||||||||||||||||||
| 0,75 to <2,50 | 56 | 1.1% | 185 | 43.5% | 95 | 54 | 96.0% | |||||||||||||||||||||
| 2,50 a <10,00 | 17 | 4.3% | 79 | 41.4% | 70 | 25 | 147.7% | |||||||||||||||||||||
| 10,00 to <100,00 | 0 | 20.5% | 3 | 44.0% | 85 | 1 | 229.9% | |||||||||||||||||||||
| 100,00 (Default) | 1 | 100.0% | 18 | 43.3% | 66 | 0 | 37.2% | |||||||||||||||||||||
| Retail - Other SMEs | 8 | 14.3% | 1,889 | 38.1% | – | 4 | 47.3% | |||||||||||||||||||||
| 0,00 to <0,15 | 0 | 0.1% | 139 | 36.0% | – | 0 | 9.2% | |||||||||||||||||||||
| 0,15 to <0,25 | 0 | 0.2% | 41 | 40.0% | – | 0 | 11.4% | |||||||||||||||||||||
| 0,25 to <0,50 | 0 | 0.3% | 99 | 40.0% | – | 0 | 17.4% | |||||||||||||||||||||
| 0,50 to <0,75 | 0 | 0.4% | 122 | 28.6% | – | 0 | 23.4% | |||||||||||||||||||||
| 0,75 to <2,50 | 1 | 1.2% | 398 | 40.0% | – | 1 | 35.4% | |||||||||||||||||||||
| 2,50 a <10,00 | 2 | 4.6% | 772 | 37.8% | – | 1 | 46.9% | |||||||||||||||||||||
| 10,00 to <100,00 | 3 | 16.9% | 203 | 40.0% | – | 2 | 66.8% | |||||||||||||||||||||
| 100,00 (Default) | 1 | 100.0% | 115 | 26.7% | – | 0 | 13.2% | |||||||||||||||||||||
| Retail - Other Non-SMEs | 0 | 1.6% | 25 | 26.2% | – | 0 | 55.4% | |||||||||||||||||||||
| 0,00 to <0,15 | 0 | 0.1% | 5 | 26.7% | – | – | – | |||||||||||||||||||||
| 0,15 to <0,25 | – | – | – | – | – | – | – | |||||||||||||||||||||
| 0,25 to <0,50 | – | – | 1 | – | – | – | – | |||||||||||||||||||||
| 0,50 to <0,75 | – | – | 1 | – | – | – | – | |||||||||||||||||||||
| 0,75 to <2,50 | 0 | 0.7% | 8 | 20.0% | – | 0 | 50.0% | |||||||||||||||||||||
| 2,50 a <10,00 | 0 | 1.7% | 8 | 26.7% | – | 0 | 56.6% | |||||||||||||||||||||
| 10,00 to <100,00 | – | – | 2 | – | – | – | – | |||||||||||||||||||||
| 100,00 (Default) | – | – | – | – | – | – | – | |||||||||||||||||||||
| Total Advance Approach | 67,229 | 0.2% | 8,319 | 26.0% | 4,784 | 7.1% | ||||||||||||||||||||||
(1) PD intervals recommended by EBA guidelines on Pilar III disclosure requirements (Eighth Part of CRR).
(2) Corresponds to PD byEAD-weighted debtor category.
(3) Corresponds to LGD byEAD-weighted debtor category.
(4) Corresponds to theEAD-weighted debtor expiration in days.
(5) Exposures under the FIRB method correspond to Specialised Lending, for which the Group has opted for the method of supervisory slotting criteria, in line with article 153.5 of CRR.
| 3.2.6.2.3. | Composition of collateral for counterparty risk exposures |
A table with a breakdown of all the types of collateral contributed or received by the Group to strengthen or reduce exposure to counterparty credit risk related to derivate transactions and securities financing transactions as of December 31, 2018 and December 31, 2017 is presented below:
| 120 |
Table of Contents
TABLE 40: EUCCR5-B - Composition of collateral for exposures to counterparty credit risk(1)
Million Euros
| 12/31/2018 | Collateral used in derivative transactions | Collateral used in SFTs | ||||||||||||||||||||||
| Fair Value of Collateral received | Fair Value of posted Collateral | Fair Value of Collateral received | Fair Value of posted Collateral | |||||||||||||||||||||
| Segregated (2) | Unsegregated (3) | Segregated (2) | Unsegregated (3) | |||||||||||||||||||||
| Cash– domestic currency | 5 | 2,707 | 10 | 1 | 24,690 | 25,882 | ||||||||||||||||||
| Cash– other currencies | 0 | 1,146 | 12 | 88 | 13,900 | 1,841 | ||||||||||||||||||
| Domestic sovereign debt | – | – | – | – | 6,950 | 14,996 | ||||||||||||||||||
| Other sovereign debt | – | 6 | – | – | 8,760 | 16,301 | ||||||||||||||||||
| Government agency debt | – | – | – | – | 267 | 162 | ||||||||||||||||||
| Corporate bonds | – | 710 | – | – | 2,106 | 4,647 | ||||||||||||||||||
| Equity securities | – | – | – | – | – | 1,807 | ||||||||||||||||||
| Other collateral | – | 1,645 | – | – | 7,276 | 886 | ||||||||||||||||||
| Total | 5 | 6,214 | 21 | 88 | ||||||||||||||||||||
(1) Credit risk mitigation techniques are considered eligible according to title II, chapter 4, section 2 of CRR
(2) Refers to collateral that is held in a bankruptcy-remote manner.
(3) Refers to collateral that is not held in a bankruptcy-remote manner.
Million Euros
| 12/31/2017 | Collateral used in derivative transactions | Collateral used in SFTs | ||||||||||||||||||||||
| Fair Value of Collateral received | Fair Value of posted Collateral | Fair Value of | Fair Value of | |||||||||||||||||||||
| Segregated (2) | Unsegregated (3) | Segregated (2) | Unsegregated (3) | Collateral received | posted Collateral | |||||||||||||||||||
| Cash– domestic currency | 4 | 2,353 | 7 | – | 29,053 | 24,244 | ||||||||||||||||||
| Cash– other currencies | 0 | 1,549 | 6 | 160 | 11,025 | 1,735 | ||||||||||||||||||
| Domestic sovereign debt | – | – | – | – | 10,852 | 17,000 | ||||||||||||||||||
| Other sovereign debt | – | 12 | – | – | 5,591 | 8,938 | ||||||||||||||||||
| Government agency debt | – | 4 | – | 4 | 330 | 477 | ||||||||||||||||||
| Corporate bonds | – | 468 | – | – | 3,891 | 10,088 | ||||||||||||||||||
| Equity securities | – | 0 | – | – | – | 3,207 | ||||||||||||||||||
| Other collateral | – | 1,638 | – | – | 5,554 | 447 | ||||||||||||||||||
| Total | 5 | 6,024 | 13 | 163 | ||||||||||||||||||||
(1) Credit risk mitigation techniques are considered eligible according to title II, chapter 4, section 2 of CRR
(2) Refers to collateral that is held in a bankruptcy-remote manner.
(3) Refers to collateral that is not held in a bankruptcy-remote manner.
| 3.2.6.2.4. | Credit derivative transactions |
The table below shows the amounts corresponding to transactions with credit derivatives, broken down into purchased and sold derivatives:
TABLE 41: EU CCR6 - Credit derivatives exposures
Million Euros
| 12/31/2018 | Credit derivative hedges | Other credit derivatives | ||||||||||
| Protection Bought | Protection Sold | |||||||||||
| Notionals | 11,248 | 14,204 | – | |||||||||
| Single-name credit default swaps | 4,925 | 5,622 | – | |||||||||
| Index credit default swaps | 5,824 | 6,421 | – | |||||||||
| Total return swaps | – | 2,161 | – | |||||||||
| Credit options | 500 | – | – | |||||||||
| Other credit derivatives | – | – | – | |||||||||
| Fair Values | (118) | (59) | – | |||||||||
| Positive fair value (asset) | 68 | 164 | – | |||||||||
| Negative fair value (liability) | (186) | (223) | – | |||||||||
Million Euros
| 12/31/2017 | Credit derivative hedges | Other credit derivatives | ||||||||||
| Protection Bought | Protection Sold | |||||||||||
| Notionals | 13,848 | 16,333 | – | |||||||||
| Single-name credit default swaps | 5,374 | 5,929 | – | |||||||||
| Index credit default swaps | 8,374 | 8,265 | – | |||||||||
| Total return swaps | – | 2,039 | – | |||||||||
| Credit options | 100 | 100 | – | |||||||||
| Other credit derivatives | – | – | – | |||||||||
| Fair Values | (451) | 423 | – | |||||||||
| Positive fair value (asset) | 48 | 441 | – | |||||||||
| Negative fair value (liability) | (499) | (18) | – | |||||||||
As ofyear-end 2018 and 2017, the Group did not use credit derivatives in brokerage activities as collateral.
| 121 |
Table of Contents
| 3.2.6.3. | CVA charge requirements |
The surcharge for CVA in Capital refers to the additional surcharge in capital on account of the unexpected CVA adjustment loss, for which there are two approaches:
| • | Standardised Approach (Art. 384 CRR): application of a standard regulatory formula. The formula applied is an analytical approximation to the calculating of the CVA VaR by supposing that the counterparty spreads depend on a single systematic risk factor and on its own idiosyncratic factor, both variables distributed by independent normal distributions, assuming a 99% confidence level. |
| • | Advanced Approach (Art 383 CRR): based on the market risk VaR approach, which requires a calculation of the “CVA VaR”, assuming the same confidence level (99%) and time horizon (10 days), as well as a stressed scenario. As of December 31, 2018 and December 31, 2017, the Group has no surcharge for CVA calculated under the advanced approach. |
Procedures for calculating the valuation of adjustments and reserves
Credit valuation adjustments (CVA) and debit valuations adjustments (DVA) are incorporated into derivative valuations of both assets and liabilities, to reflect the impact on fair value of the counterparty credit risk and own credit risk, respectively. (See Note 8 of the Group’s Consolidated Financial Statements for more information).
The amounts in million euros involved in the adjustments by credit risk as of December 31, 2018 and December 31, 2017 are below:
TABLE 42: CCR2 - Credit valuation adjustment (CVA) capital charge
Million Euros
| 12/31/2018 | Exposure value | RWA | ||||||
| Total portfolios subject to the advanced method | – | – | ||||||
(i) VaR component (included 3x multiplier) | – | – | ||||||
(ii) SVaR component (included 3x multiplier) | – | – | ||||||
All portfolios subject to the standardised method | 7,445 | 1,377 | ||||||
| Total subject to the CVA capital charge | 7,445 | 1,377 | ||||||
Million Euros
| 12/31/2017 | Exposure value | RWA | ||||||
Total portfolios subject to the advanced method | – | – | ||||||
| (i) VaR component (included 3x multiplier) | – | – | ||||||
| (ii) SVaR component (included 3x multiplier) | – | – | ||||||
| All portfolios subject to the standardised method | 7,865 | 1,566 | ||||||
| Total subject to the CVA capital charge | 7,865 | 1,566 | ||||||
The variations in terms of RWAs during the period are below:
TABLE 43: Variations in terms of RWAs of CVA
| Million Euros | ||||||||
| CVA | ||||||||
| RWAs as of December 31, 2017 |
| 1,566 | ||||||
| Effects | Asset size | (189) | ||||||
| RWAs as of December 31, 2018 |
| 1,377 | ||||||
As of December 2018, CVA’s risk-weighted assets remain stable compared to December 2017.
| 122 |
Table of Contents
| 3.2.6.4. | Exposures to central counterparty entities |
The following table presents a complete overview of the exposures to central counterparty entities by type of exposure (arising from transactions, margins, contributions to the guarantee fund) and their corresponding capital requirements:
TABLE 44: CCR8 - Exposures to central counterparty clearing houses
Million Euros
| 12-31- 2018 | 12-31-2017 | |||||||||||||||
| EAD post CRM | RWA | EAD post CRM | RWA | |||||||||||||
| Exposures to QCCPs (total) | 191 | 186 | ||||||||||||||
| Exposures for trades at QCCPs (excluding initial margin and default fund contributions); of which | 6,219 | 146 | 5,903 | 119 | ||||||||||||
| (i) OTC Derivatives | 98 | 4 | 482 | 11 | ||||||||||||
| (ii) Exchange-traded derivatives | 275 | 5 | 689 | 14 | ||||||||||||
| (iii) Securities financing transactions (SFTs) | 754 | 15 | 824 | 16 | ||||||||||||
| (iv) Netting sets where cross-product netting has been approved | 5,092 | 122 | 3,909 | 78 | ||||||||||||
| Segregated initial margin | 959 | 1,558 | ||||||||||||||
| Non-segregated initial margin | 169 | 3 | 155 | 18 | ||||||||||||
| Pre-funded default fund contributions | 71 | 41 | 87 | 49 | ||||||||||||
| Alternative calculation of own funds requirements for exposures | – | – | ||||||||||||||
| Exposures to non-QCCPs (total) | 174 | 84 | ||||||||||||||
| Exposures for trades at non-QCCPs (excluding initial margin and default to contributions; of which | 484 | 169 | 132 | 80 | ||||||||||||
| (i) OTC Derivatives | 30 | 30 | 17 | 17 | ||||||||||||
| (ii) Exchange-traded derivatives | 7 | 7 | 6 | 3 | ||||||||||||
| (iii) Securities financing transactions (SFTs) | 448 | 132 | 109 | 60 | ||||||||||||
| (iv) Netting sets where cross-product netting has been approved | – | – | – | – | ||||||||||||
| Segregated initial margin | 108 | 110 | ||||||||||||||
| Non-segregated initial margin | 100 | 4 | 4 | 4 | ||||||||||||
| Pre-funded default fund contributions | 0 | 0 | – | – | ||||||||||||
| Unfunded default fund contributions | – | – | – | – | ||||||||||||
| 3.2.7. | Information on securitisations |
| 3.2.7.1. | General characteristics of securitisations |
| 3.2.7.1.1. | Purpose of securitisation |
The Group’s current policy on securitisation considers a program of recurrent issuance, with a deliberate diversification of securitised assets that adjusts their volume to the Bank’s capital requirements and to market conditions.
This program is complemented by all the other finance and equity instruments, thereby diversifying the need to resort to wholesale markets.
The definition of the strategy and the execution of the operations, as with all other wholesale finance and capital management, are supervised by the Assets & Liabilities Committee, with the pertinent internal authorisations obtained directly from the Board of Directors or from the Executive Committee.
The main aim of securitisation is to serve as an instrument for the efficient management of the balance sheet, above all as a source of liquidity at an efficient cost, obtaining liquid assets through eligible collateral, as a complement to other financial instruments. In addition, there is another objectives associated with the use of securitisation instruments, such as freeing up of regulatory capital by transferring risks of a third party portfolio, as well as, freeing of potential excess over the expected loss, provided it is allowed by the volume of the first-loss tranche and risk transfer.
The main risks inherent to securitisation operations are detailed below.
| 123 |
Table of Contents
| 1. | Default risk |
Consists in the obligor not paying at the due date and in the correct way the contractual obligations assumed (for example, potentialnon-payment of instalments).
In the particular case of securitisations, the entities provide information to investors on the situation of the securitised loan portfolio. In this respect, it is worth noting that transactions transferred to the Securitisation Fund do not include defaults, or at most, if there is one, in no case do they exceed 30 days ofnon-payment, demonstrating the high quality of transactions that are securitised. The rating agencies take this element closely into account when analysing the credit risk of transactions.
BBVA monitors the changes in these indicators with the aim of establishing specific action plans in the different products, in order to correct any deviations that are leading to deterioration in credit quality.
Monthly information is available on all these indicators to monitor them, in some cases daily. It includes flows of additions, recoveries, irregular investment and thenon-performing loan ratio. The information is obtained through different applications and reports prepared in the Risks area.
BBVA’s philosophy of recovery for unpaid loans consists of defining an operating system that allows a speedy and efficient correction of the irregular situation. It is based on a highly personalised management, with a key role being played by the Recovery Manager and his close and ongoing relationship with the debtor.
The main guarantee is always the mortgage on the asset that is the object of acquisition and finance, or on the primary residence. In addition, there are frequent personal guarantees issued by the holders of the loan or the guarantors, which reinforce the repayment of the debt and quality of the risk. The rights to collection before insurance companies are also subrogated in favour of the Bank in cases where there is damage to the mortgaged building due to fire or other duly stipulated causes.
| 2. | Early repayment risk |
This derives from the potential total or partial prepayment by the obligor of the amounts corresponding to the securitised loans, which could imply that the maturity of the securitisation bonds calculated at the time of the issue is shorter than the maturity of the loans transferred to the Fund.
This risk is basically manifested due to the variations of market interest rates, but despite its importance it is not the only determining factor; to this have to be added other more personal elements, such as inheritance, divorce, change of residence, etc.
In the specific case of our securitisations, this risk is very limited, as the maturity date of the securitisation bond issue is set according to the maturity of the last loan of the portfolio used.
| 3. | Liquidity risk |
At times it is noted that a possible limited liquidity of the markets in which the bonds are traded could constitute a risk derived from the securitisation processes.
Although it is true that an entity may not undertake to contract in the secondary market one of the bonds issued by the Securitisation Fund, and thus provide liquidity to the funds, the securitisation process itself consists of converting illiquid assets that form part of the Bank’s balance sheet into liquid assets in the form of securitisation bonds, which give the possibility for trading and transferring them in a regulated market. This would not be the case if they were not subject to the securitisation process.
| 124 |
Table of Contents
In addition, understanding liquidity risk as the possible time mismatch between the maturities of the collections generated by the loans and the payments the bonds originate, BBVA has not so far made any securitisation issues in which there is a divergence between collections and payments. The entities that have programs for commercial paper issuance, in which this risk is typically present, mitigate it with the use of liquidity lines that are included in the structure of the Fund.
| 3.2.7.1.2. | Functions performed by the securitisation process and degree of involvement |
The Group’s degree of involvement in its securitisation funds is not usually restricted to the mere role of assignor and administrator of the securitised portfolio.
CHART 19: Functions carried out in the securitisation process and degree of involvement of the Group
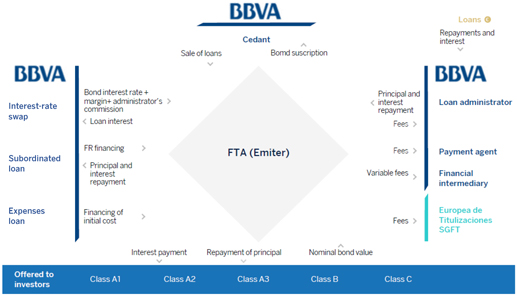
As seen in the above chart, the Group has usually taken additional roles such as:
| · | Payment Agent. |
| · | Provider of the treasury account. |
| · | Provider of the subordinated loan and of the loan forstart-up costs, with the former being the one that finances the first-loss tranche, and the latter financing the fund’s fixed expenditure. |
| · | Administrative agent of the securitised portfolio |
The Group has not assumed the role of sponsor of securitisations originated by third-party institutions.
It is worth noting that the Group has maintained a consistent line in the generation of securitisation operations since the credit crunch, which began in July 2007.
In addition, the Group has performed three Synthetic Securitisations to date, introducing this new operation as an additional source of regulatory capital release.
| 125 |
Table of Contents
| 3.2.7.1.3. | Methods used for the calculation of risk-weighted exposures in its securitisation activity |
The methods used to calculate risk-weighted exposures in securitisations are:
| · | The standard securitisation method: when this method is used for securitised exposures, in full or in a predominant manner if it involves a mixed portfolio. |
| · | The IRB securitisation approach: when internal models are used for securitised exposures, in full or in a predominant manner. Within the alternatives of the IRB approach, the model based on external rating is used. |
| 3.2.7.2. | Accounting treatment of traditional securitisation |
| 3.2.7.2.1. | Criteria for removing or maintaining assets subject to securitisation on the balance sheet |
The accounting procedure for the transfer of financial assets depends on the manner in which the risks and benefits associated with securitised assets are transferred to third parties.
Financial assets are only removed from the consolidated balance sheet when the cash flows they generate have dried up or when their implicit risks and benefits have been substantially transferred out to third parties.
The Group is considered to substantially transfer the risks and benefits when these account for the majority of the overall risks and benefits of the securitised assets.
When the risks and benefits of transferred assets are substantially conveyed to third parties, the financial asset transferred is deregistered from the consolidated balance sheet, and any right or obligation retained or created as a result of the transfer is simultaneously recognised.
In many situations, it is clear whether the entity has substantially transferred all the risks and benefits associated with the transfer of an asset or not. However, when it is not sufficiently clear if the transfer took place or not, the entity evaluates its exposure before and after the transfer by comparing the variation in the amounts and the calendar of the net cash flows of the transferred asset. Therefore, if the exposure to the variation in the current value of the net cash flows of the financial asset does not significantly change as a result of the transfer, it is understood that the entity has not substantially transferred all the risks and benefits associated with the ownership of the asset.
When the risks and/or benefits associated with the financial asset transferred are substantially retained, the asset transferred is not deregistered from the consolidated balance sheet and continues to be valued according to the same criteria applied prior to the transfer.
In the specific case of securitisation funds to which Group institutions transfer their loan-books, existing contractual rights other than voting rights are to be considered with a view to analysing their possible consolidation. It is also necessary to consider the design and purpose of each fund, as well as the following factors (among others):
| · | Evidence of the practical ability to direct the relevant activities of the funds according to the specific needs of the business (including the decisions that may arise in particular circumstances only). |
| 126 |
Table of Contents
| · | Possible existence of special relations with the funds. |
| · | The Group’s implicit or explicit commitments to back the funds. |
| · | Whether the Group has the capacity to use its power over the funds to influence the amount of the returns to which it is exposed. |
Thus, there are cases where the Group is highly exposed to the existing variable returns and retains decision-making powers over the institution, either directly or through an agent. In these cases, the securitisation funds are consolidated with the Group.
| 3.2.7.2.2. | Criteria for the recognition of earnings in the event of the removal of assets from the balance sheet |
In order for the Group to recognize the result generated on the sale of financial instruments, the sale has to involve the corresponding removal from the accounts, which requires the fulfilment of the requirements governing the substantial transfer of risks and benefits as described in the preceding point.
The result will be reflected on the income statement, being calculated as the difference between the book value and the net value received including any new additional assets obtained minus any liabilities assumed.
When the amount of the financial asset transferred matches the total amount of the original financial asset, the new financial assets, financial liabilities and liabilities for the provision of services, as appropriate, that are generated as a result of the transfer will be recorded according to their fair value.
| 3.2.7.2.3. | Key hypothesis for valuing risks and benefits retained on securitised assets |
The Group considers that a substantial withholding is made of the risks and benefits of securitisations when the subordinated bonds of issues are kept and/or it grants subordinated finance to the securitisation funds that mean substantially retaining the credit losses expected from the loans transferred.
| 3.2.7.3. | Risk transfer in securitisation activities |
A securitisation fulfils the criterion of significant and effective transfer of risk, and therefore falls within the solvency framework of the securitisations, when it meets the conditions laid down in Articles 244.2 and 243.2 of the CRR.
| 3.2.7.4. | Accounting treatment of synthetic securitisation |
Unlike traditional securitisations, synthetic securitisations are treated either as financial guarantees or as credit derivatives. Both instruments protect the holder against credit risk.
In the particular case of the synthetic securitisations performed by the Group to date, both of these meet the requirements of the accounting regulations for their recognition as collateral. These contracts require the issuer to make specific payments to reimburse the holder for any losses incurred when a specific debtor breaches its payment obligation, in accordance with the conditions of a debt instrument, either original or amended.
| 127 |
Table of Contents
In this regard, it should be noted that there are three characteristics that are evaluated to determine whether a contract should be considered a financial guarantee; a) reference obligation is a debt instrument, b) the holder is compensated for a loss incurred and c) the holder is not compensated for an amount greater than the loss incurred.
The consideration as a financial guarantee entails accrual of the commission paid for it during the term of it.
| 3.2.7.5. | Securitisation exposure in the investment portfolio and financial instruments held for trading |
The table below shows the amounts in terms of EAD of investment and trading book by type of exposure:
TABLE 45: SEC1 - Securitisation exposure in the investment portfolio
Million Euros
| 12/31/2018 | Bank acts as originator | Bank acts as sponsor | Bank acts as investor | |||||||||||||||||||||||||||||||||
| Traditional | Synthetic | Subtotal | Traditional | Synthetic | Subtotal | Traditional | Synthetic | Subtotal | ||||||||||||||||||||||||||||
| Retail (total)- of which | 789 | – | 789 | – | – | – | 4,912 | – | 4,912 | |||||||||||||||||||||||||||
| Residential mortgage | – | – | – | – | – | – | 4,748 | – | 4,748 | |||||||||||||||||||||||||||
| Credit card | – | – | – | – | – | – | 165 | – | 165 | |||||||||||||||||||||||||||
| Other retail exposures | 789 | – | 789 | – | – | – | – | – | – | |||||||||||||||||||||||||||
| Re-Securitisation | – | – | – | – | – | – | – | – | – | |||||||||||||||||||||||||||
| wholesale (total)- of which | 95 | 3,917 | 4,012 | 291 | – | 291 | ||||||||||||||||||||||||||||||
| Loans to corporates | 53 | 3,917 | 3,970 | – | – | – | 49 | – | 49 | |||||||||||||||||||||||||||
| Commercial mortgage | – | – | – | – | – | – | 1 | – | 1 | |||||||||||||||||||||||||||
| Lease and receivables | 42 | – | 42 | – | – | – | – | – | – | |||||||||||||||||||||||||||
| Other wholesale | – | – | – | – | – | – | 241 | – | 241 | |||||||||||||||||||||||||||
| Re-Securitisation | – | – | – | – | – | – | – | – | – | |||||||||||||||||||||||||||
Million Euros
| 12/31/2017 | Bank acts as originator | Bank acts as sponsor | Bank acts as investor | |||||||||||||||||||||||||||||||||
| Traditional | Synthetic | Subtotal | Traditional | Synthetic | Subtotal | Traditional | Synthetic | Subtotal | ||||||||||||||||||||||||||||
| Retail (total)- of which | – | – | – | – | – | – | 4,635 | – | 4,635 | |||||||||||||||||||||||||||
| Residential mortgage | – | – | – | – | – | – | 4,447 | – | 4,447 | |||||||||||||||||||||||||||
| Credit card | – | – | – | – | – | – | 188 | – | 188 | |||||||||||||||||||||||||||
| Other retail exposures | – | – | – | – | – | – | – | – | – | |||||||||||||||||||||||||||
| Re-Securitisation | – | – | – | – | – | – | – | – | – | |||||||||||||||||||||||||||
| wholesale (total)- of which | 97 | 2,391 | 2,488 | 338 | 338 | |||||||||||||||||||||||||||||||
| Loans to corporates | 56 | 2,391 | 2,447 | – | – | – | 51 | – | 51 | |||||||||||||||||||||||||||
| Commercial mortgage | – | – | – | – | – | – | 1 | – | 1 | |||||||||||||||||||||||||||
| Lease and receivables | 42 | – | 42 | – | – | – | – | – | – | |||||||||||||||||||||||||||
| Other wholesale | – | – | – | – | – | – | 285 | – | 285 | |||||||||||||||||||||||||||
| Re-Securitisation | – | – | – | – | – | – | – | – | – | |||||||||||||||||||||||||||
As of December 31, 2018 and December 31, 2017, the Group has no securitisation exposure in the held for trading portfolio.
| 3.2.7.6. | Investment securitisations |
The table below shows the amounts in terms of EAD and RWAs of investment securitisation positions by type of exposure, tranches and weighting ranges corresponding to the securitisations and their corresponding capital requirements as of December 31,
2018 and December 31, 2017.
| 128 |
Table of Contents
TABLE 46: SEC4 - Securitisation exposure in the banking portfolio and associated regulatory capital requirements (bank that acts as investor)
Million Euros
| 12/31/2018 | Exposure values (by RW bands) | Exposure values (by regulatory | RWA (by regulatory approach) | Capital requirement after cap | ||||||||||||||||||||||||||||||||||||||||||||||||||||||||||||||||
| £20% RW | >20% to 50% RW | >50% to 100% RW | >100% to <1250% RW | 1250% RW | IRB RBA (including IAA) | IRB SFA | SA/ SSFA | 1250% | IRB RBA (including IAA) | IRB SFA | SA/ SSFA | 1250% | IRB RBA (including | IRB SFA | SA/ | 1250% | ||||||||||||||||||||||||||||||||||||||||||||||||||||
| Total Exposures | 4.983 | 179 | 6 | 1 | 34 | 577 | – | 4,592 | 34 | 66 | – | 950 | – | 5 | – | 76 | – | |||||||||||||||||||||||||||||||||||||||||||||||||||
| Traditional Securitisation | 4.983 | 179 | 6 | 1 | 34 | 577 | 0 | 4,592 | 34 | 66 | – | 950 | – | 5 | – | 76 | – | |||||||||||||||||||||||||||||||||||||||||||||||||||
| Of Which Securitisation | 4,983 | 179 | 6 | 1 | 34 | 577 | – | 4,592 | 34 | 66 | – | 950 | – | 5 | – | 76 | – | |||||||||||||||||||||||||||||||||||||||||||||||||||
| Of which retail underlying | 4,783 | 88 | 6 | 1 | 34 | 519 | – | 4,359 | 34 | 55 | – | 889 | – | 4 | – | 71 | – | |||||||||||||||||||||||||||||||||||||||||||||||||||
| Of which wholesale | 200 | 91 | – | – | – | 58 | – | 233 | – | 11 | – | 61 | – | 1 | – | 5 | – | |||||||||||||||||||||||||||||||||||||||||||||||||||
| Of which re-Securitisation | – | – | – | – | – | – | – | – | – | – | – | – | – | – | – | – | – | |||||||||||||||||||||||||||||||||||||||||||||||||||
| Of which senior | – | – | – | – | – | – | – | – | – | – | – | – | – | – | – | – | – | |||||||||||||||||||||||||||||||||||||||||||||||||||
| Of which non-senior | – | – | – | – | – | – | – | – | – | – | – | – | – | – | – | – | – | |||||||||||||||||||||||||||||||||||||||||||||||||||
| Synthetic securitisation | – | – | – | – | – | – | – | – | – | – | – | – | – | – | – | – | – | |||||||||||||||||||||||||||||||||||||||||||||||||||
| Of which securitisation | – | – | – | – | – | – | – | – | – | – | – | – | – | – | – | – | – | |||||||||||||||||||||||||||||||||||||||||||||||||||
| Of which retail underlying | – | – | – | – | – | – | – | – | – | – | – | – | – | – | – | – | – | |||||||||||||||||||||||||||||||||||||||||||||||||||
| Of which wholesale | – | – | – | – | – | – | – | – | – | – | – | – | – | – | – | – | – | |||||||||||||||||||||||||||||||||||||||||||||||||||
| Of which re-Securitisation | – | – | – | – | – | – | – | – | – | – | – | – | – | – | – | – | – | |||||||||||||||||||||||||||||||||||||||||||||||||||
| Of which senior | – | – | – | – | – | – | – | – | – | – | – | – | – | – | – | – | – | |||||||||||||||||||||||||||||||||||||||||||||||||||
| Of which non-senior | – | – | – | – | – | – | – | – | – | – | – | – | – | – | – | – | – | |||||||||||||||||||||||||||||||||||||||||||||||||||
| Million Euros | ||||||||||||||||||||||||||||||||||||||||||||||||||||||||||||||||||||
| 12/31/2017 | Exposure values (by RW bands) | Exposure values (by regulatory | RWA (by regulatory approach) | Capital requirement after cap | ||||||||||||||||||||||||||||||||||||||||||||||||||||||||||||||||
| £20% RW | >20% to 50% RW | >50% to 100% RW | >100% to <1250% RW | 1250% RW | IRB RBA (including IAA) | IRB SFA | SA/ SSFA | 1250% | IRB RBA (including IAA) | IRB SFA | SA/ SSFA | 1250% | IRB RBA (including | IRB SFA | SA/ | 1250% | ||||||||||||||||||||||||||||||||||||||||||||||||||||
| Total Exposures | 4,475 | 432 | 20 | 6 | 39 | 655 | – | 4,279 | 39 | 146 | – | 924 | – | 12 | – | 74 | – | |||||||||||||||||||||||||||||||||||||||||||||||||||
| Traditional Securitisation | 4,475 | 432 | 20 | 6 | 39 | 655 | – | 4,279 | 39 | 146 | – | 924 | – | 12 | – | 74 | – | |||||||||||||||||||||||||||||||||||||||||||||||||||
| Of which Securitisation | 4,475 | 432 | 20 | 6 | 39 | 655 | – | 4,279 | 39 | 146 | – | 924 | – | 12 | – | 74 | – | |||||||||||||||||||||||||||||||||||||||||||||||||||
| Of which retail underlying | 4,247 | 328 | 15 | 6 | 39 | 574 | – | 4,022 | 39 | 124 | – | 856 | – | 10 | – | 68 | – | |||||||||||||||||||||||||||||||||||||||||||||||||||
| Of which wholesale | 228 | 105 | 5 | – | 1 | 81 | – | 256 | 1 | 23 | – | 68 | – | 2 | – | 6 | – | |||||||||||||||||||||||||||||||||||||||||||||||||||
| Of which re-securitisation | – | – | – | – | – | – | – | – | – | – | – | – | – | – | – | – | – | |||||||||||||||||||||||||||||||||||||||||||||||||||
| Of which senior | – | – | – | – | – | – | – | – | – | – | – | – | – | – | – | – | – | |||||||||||||||||||||||||||||||||||||||||||||||||||
| Of which non-senior | – | – | – | – | – | – | – | – | – | – | – | – | – | – | – | – | – | |||||||||||||||||||||||||||||||||||||||||||||||||||
| Synthetic Securitisation | – | – | – | – | – | – | – | – | – | – | – | – | – | – | – | – | – | |||||||||||||||||||||||||||||||||||||||||||||||||||
| Of which Securitisation | – | – | – | – | – | – | – | – | – | – | – | – | – | – | – | – | – | |||||||||||||||||||||||||||||||||||||||||||||||||||
| Of which retail underlying | – | – | – | – | – | – | – | – | – | – | – | – | – | – | – | – | – | |||||||||||||||||||||||||||||||||||||||||||||||||||
| Of which wholesale | – | – | – | – | – | – | – | – | – | – | – | – | – | – | – | – | – | |||||||||||||||||||||||||||||||||||||||||||||||||||
| Of which re-Securitisation | – | – | – | – | – | – | – | – | – | – | – | – | – | – | – | – | – | |||||||||||||||||||||||||||||||||||||||||||||||||||
| Of which senior | – | – | – | – | – | – | – | – | – | – | – | – | – | – | – | – | – | |||||||||||||||||||||||||||||||||||||||||||||||||||
| Of which non-senior | – | – | – | – | – | – | – | – | – | – | – | – | – | – | – | – | – | |||||||||||||||||||||||||||||||||||||||||||||||||||
| 3.2.7.7. | Originated securitisations |
| 3.2.7.7.1. | Rating agencies used |
The external credit assessment institutions (ECAI) that have been involved in the Group’s issues that fulfil the criteria of risk transfer and fall within the securitisations solvency framework are, generally, Fitch, Moody’s, S&P and DBRS. The types of securitisation exposure for which each agency is used are, with no differentiation between the different agencies, all the asset types that tend to be used as residential mortgage loans, loans to SMEs and small companies, consumer finance and autos and leasing.
In all the SSPEs, the agencies have assessed the risk of the entire issuance structure:
| · | Awarding ratings to all bond tranches. |
| · | Establishing the volume of the credit enhancement. |
| · | Establishing the necessary triggers (early termination of the restitution period, pro-rata amortisation of AAA classes,pro-rata amortisation of series subordinated to AAA and amortisation of the reserve fund, amongst others). |
In each and every one of the issues, in addition to the initial rating, the agencies carry out regular quarterly monitoring.
| 3.2.7.7.2. | Positions on originated securitisations |
The table below shows the amounts in terms of EAD and RWAs of investment securitisation positions originated by type of exposure, tranches and weighting ranges corresponding to the securitisations and their corresponding capital requirements as of December 31, 2018 and December 31, 2017.
| 129 |
Table of Contents
TABLE 47: SEC3 - Securitisation exposure in the banking portfolio and associated regulatory capital requirements (bank that acts as originator or sponsor)
Million Euros
| Exposure values (by RW bands) | Exposure values (by regulatory approach) | RWA (by regulatory approach) | Capital requirement after cap | |||||||||||||||||||||||||||||||||||||||||||||||||||||||||||||||||
| £20% RW | >20% to 50% RW | >50% to 100% RW | >100% to <1250% RW | 1250% RW | IRB RBA (including IAA) | IRB SFA | SA/ SSFA | 1250% | IRB RBA (including IAA) | IRB SFA | SA/ SSFA | 1250% (1) | IRB RBA (including | IRB SFA | SA/ | 1250% | ||||||||||||||||||||||||||||||||||||||||||||||||||||
| Total Exposures | 4,573 | 33 | 0 | 1 | 195 | 785 | 3,821 | – | 195 | 86 | 267 | – | 1,253 | 7 | 21 | – | 100 | |||||||||||||||||||||||||||||||||||||||||||||||||||
| Traditional Securitisation | 752 | 33 | 0 | 1 | 99 | 785 | – | – | 99 | 86 | – | – | 56 | 7 | – | – | 4 | |||||||||||||||||||||||||||||||||||||||||||||||||||
| Of Which Securitisation | 752 | 33 | 0 | 1 | 99 | 785 | – | – | 99 | 86 | – | – | 56 | 7 | – | – | 4 | |||||||||||||||||||||||||||||||||||||||||||||||||||
| Of which retail underlying | 752 | 33 | – | 1 | 4 | 785 | – | – | 4 | 86 | – | – | 10 | 7 | – | – | 1 | |||||||||||||||||||||||||||||||||||||||||||||||||||
| Of which wholesale | – | – | 0 | – | 95 | 0 | – | – | 95 | 0 | – | – | 46 | – | – | 4 | ||||||||||||||||||||||||||||||||||||||||||||||||||||
| Of which re-Securitisation | – | – | – | – | – | – | – | – | – | – | – | – | – | – | – | – | – | |||||||||||||||||||||||||||||||||||||||||||||||||||
| Of which senior | – | – | – | – | – | – | – | – | – | – | – | – | – | – | – | – | – | |||||||||||||||||||||||||||||||||||||||||||||||||||
| Of which non-senior | – | – | – | – | – | – | – | – | – | – | – | – | – | – | – | – | – | |||||||||||||||||||||||||||||||||||||||||||||||||||
| Synthetic securitisation | 3,821 | – | – | – | 96 | – | 3,821 | – | 96 | – | 267 | – | 1,197 | – | 21 | – | 96 | |||||||||||||||||||||||||||||||||||||||||||||||||||
| Of which securitisation | 3,821 | – | – | – | 96 | – | 3,821 | – | 96 | – | 267 | – | 1,197 | – | 21 | – | 96 | |||||||||||||||||||||||||||||||||||||||||||||||||||
| Of which retail underlying | – | – | – | – | – | – | – | – | – | – | – | – | – | – | – | – | – | |||||||||||||||||||||||||||||||||||||||||||||||||||
| Of which wholesale | 3,821 | – | – | – | 96 | – | 3,821 | – | 96 | – | 267 | – | 1,197 | – | 21 | – | 96 | |||||||||||||||||||||||||||||||||||||||||||||||||||
| Of which re-Securitisation | – | – | – | – | – | – | – | – | – | – | – | – | – | – | – | – | – | |||||||||||||||||||||||||||||||||||||||||||||||||||
| Of which senior | – | – | – | – | – | – | – | – | – | – | – | – | – | – | – | – | – | |||||||||||||||||||||||||||||||||||||||||||||||||||
| Of which non-senior | – | – | – | – | – | – | – | – | – | – | – | – | – | – | – | – | – | |||||||||||||||||||||||||||||||||||||||||||||||||||
(1) As of December 31st, 2018, securitisation exposures with a RW of 1250% are calculated under the IRB RBA method.
| Million Euros | ||||||||||||||||||||||||||||||||||||||||||||||||||||||||||||||||||||
| 12/31/2017 | Exposure values (by RW bands) | Exposure values (by regulatory approach) | RWA (by regulatory approach) | Capital requirement after cap | ||||||||||||||||||||||||||||||||||||||||||||||||||||||||||||||||
| £20% RW | >20% to 50% RW | >50% to 100% RW | >100% to <1250% RW | 1250% RW | IRB RBA (including IAA) | IRB SFA | SA/ SSFA | 1250% | IRB RBA (including IAA) | IRB SFA | SA/ SSFA | 1250% (1) | IRB RBA (including | IRB SFA | SA/ | 1250% | ||||||||||||||||||||||||||||||||||||||||||||||||||||
| Total Exposures | 2,343 | – | 2 | – | 143 | 2,346 | – | – | 143 | 132 | – | – | 549 | – | 11 | – | 44 | |||||||||||||||||||||||||||||||||||||||||||||||||||
| Traditional Securitisation | – | – | 2 | – | 95 | 2 | – | – | 95 | – | – | – | 72 | – | – | – | 6 | |||||||||||||||||||||||||||||||||||||||||||||||||||
| Of which Securitisation | – | – | 2 | – | 95 | 2 | – | – | 95 | – | – | – | 72 | – | – | – | 6 | |||||||||||||||||||||||||||||||||||||||||||||||||||
| Of which retail underlying | – | – | – | – | – | – | – | – | – | – | – | – | – | – | – | – | – | |||||||||||||||||||||||||||||||||||||||||||||||||||
| Of which wholesale | – | – | 2 | – | 95 | 2 | 95 | – | 72 | – | – | – | 6 | |||||||||||||||||||||||||||||||||||||||||||||||||||||||
| Of which re-securitisation | – | – | – | – | – | – | – | – | – | – | – | – | – | – | – | – | – | |||||||||||||||||||||||||||||||||||||||||||||||||||
| Of which senior | – | – | – | – | – | – | – | – | – | – | – | – | – | – | – | – | – | |||||||||||||||||||||||||||||||||||||||||||||||||||
| Of which non-senior | – | – | – | – | – | – | – | – | – | – | – | – | – | – | – | – | – | |||||||||||||||||||||||||||||||||||||||||||||||||||
| Synthetic Securitisation | 2,343 | – | – | – | 48 | – | 2,343 | – | 48 | – | 132 | – | 477 | – | 11 | – | 38 | |||||||||||||||||||||||||||||||||||||||||||||||||||
| Of which Securitisation | 2,343 | – | – | – | 48 | – | 2,343 | – | 48 | – | 132 | – | 477 | – | 11 | – | 38 | |||||||||||||||||||||||||||||||||||||||||||||||||||
| Of which retail underlying | – | – | – | – | – | – | – | – | – | – | – | – | – | – | – | – | – | |||||||||||||||||||||||||||||||||||||||||||||||||||
| Of which wholesale | 2,343 | – | – | – | 48 | – | 2,343 | – | 48 | – | 132 | 477 | – | 11 | – | 38 | ||||||||||||||||||||||||||||||||||||||||||||||||||||
| Of which re-Securitisation | – | – | – | – | – | – | – | – | – | – | – | – | – | – | – | – | – | |||||||||||||||||||||||||||||||||||||||||||||||||||
| Of which senior | – | – | – | – | – | – | – | – | – | – | – | – | – | – | – | – | – | |||||||||||||||||||||||||||||||||||||||||||||||||||
| Of which non-senior | – | – | – | – | – | – | – | – | – | – | – | – | – | – | – | – | – | |||||||||||||||||||||||||||||||||||||||||||||||||||
(1) As of December 31st, 2017, securitisation exposures with a RW of 1250% are calculated under the IRB RBA method.
The Group carried out three securitisations in 2018, including a traditional one in June, a portfolio of self-employed consumer finance for EUR 0.80 billion and two synthetic ones in March and December, amounting to EUR 1.95 billion and EUR 1 billion, respectively (in terms of exposure), in relation to which the European Investment Fund (EIF) granted a financial guarantee on the mezzanine tranche. These operations played a role in the risk-weighted asset release of EUR 0.97 million (+0.89 billion of assets weighted by securitisation risk net of-1.86 billion due to a reduction in consumption of the underlying loans).
| 3.2.7.7.3. | Breakdown of securitised balances by type of asset |
The table below shows the outstanding exposure, impaired and past due exposures and impairment losses registered during the period, related to underlying assets of originated securitisations in which the risk transfer criteria are met, broken down by asset type as at 31 December 2018 and 31 December 2017.
TABLE 48. Breakdown of securitized balances by type of asset
Million Euros
12/31/2018 Type of asset | Current balance | Of which: Non- performing Exposures (1) | Total impairment losses for the period | |||||||||
| Commercial and residential mortgages | – | – | – | |||||||||
| Credit cards | – | – | – | |||||||||
| Financial leasing | 43 | 5 | 4 | |||||||||
| Lending to corporates and SMEs | 3,647 | 19 | 2 | |||||||||
| Consumer finance | 746 | 2 | 3 | |||||||||
| Receivables | – | – | – | |||||||||
| Securitisation balances | – | – | – | |||||||||
| Others | – | – | – | |||||||||
| Total | 4,435 | 26 | 9 | |||||||||
(1) Includes the total amount ofnon-performing exposures
Million Euros
12/31/2017 Type of asset | Current balance | Of which: Non- performing Exposures (1) | Total impairment losses for the period | |||||||||
| Commercial and residential mortgages | 1 | – | – | |||||||||
| Credit cards | – | – | – | |||||||||
| Financial leasing | 64 | 7 | 4 | |||||||||
| Lending to corporates and SMEs | 2,238 | 16 | 3 | |||||||||
| Consumer finance | – | – | – | |||||||||
| Receivables | – | – | – | |||||||||
| Securitisation balances | – | – | – | |||||||||
| Others | – | – | – | |||||||||
| Total | 2,304 | 23 | 7 | |||||||||
(1) Includes the total amount ofnon-performing exposures
| 130 |
Table of Contents
BBVA structured all operations initiated since 2006 (not including the operations of the merged companies, Unnim and Catalunya Banc).
The following is the outstanding balance corresponding to the underlying assets of securitisations initiated by the Group, in which the risk transfer criteria are not met and which, therefore, do not fall within the solvency framework for securitisations, but rather for which the Capital calculation of the exposures is carried out as if it had not been securitised:
TABLE 49. Outstanding balance corresponding to the underlying assets of the Group’s originated Securitisations, in which risk transfer criteria are not fulfilled
Million Euros
| Current Balance | ||||||||
| Type of asset | 2018 | 2017 | ||||||
| Commercial and residential mortgages | 26,277 | 28,576 | ||||||
| Credit cards | – | – | ||||||
| Financial leasing | – | 3 | ||||||
| Lending to corporates and SMEs | 261 | 357 | ||||||
| Consumer finance | 2, 356 | 3, 036 | ||||||
| Receivables | – | – | ||||||
| securitisation balances | – | – | ||||||
| Mortgage-covered bonds | – | – | ||||||
| Others | – | – | ||||||
| Total | 28,894 | 31,971 | ||||||
| 3.2.8. | Risk protection and reduction policies. Supervision strategies and processes |
In most cases, maximum exposure to credit risk is reduced by collateral, credit enhancements and other actions, which mitigate the Group’s exposure. The BBVA Group applies a credit risk hedging and mitigation policy derived from an approach to the banking business focused on relationship banking.
The existence of guarantees could be a necessary but not sufficient instrument for accepting risks, as the assumption of risks by the Group requires the verification of the debtor’s capacity for repayment, or that the debtor can generate sufficient resources to allow the amortization of the risk incurred under the agreed terms.
The policy of accepting risks is therefore, organized into two different levels in BBVA Group:
| · | Analysis of the financial risk of the operation, based on the debtor’s capacity for repayment or generation of funds. |
| · | When applicable, analysis of the guarantees to determine its capacity to mitigate the risk and the constitution of adequate guarantees to mitigate the risks, in any of the generally accepted forms: monetary, secured, personal or hedge guarantees. |
This is carried out through a prudent risk policy that consists in the analysis of the financial risk, based on the capacity of reimbursement or generation of resources of the borrower, the analysis of the guarantee assessing, among others, the efficiency, the robustness and the risk, the adequacy of the guarantee with the operation and other aspects such as the location, currency, concentration or the existence of limitations. Additionally, the necessary tasks for the constitution of guarantees must be carried out - in any of the generally accepted forms (collaterals, personal guarantees and financial hedge instruments) - appropriate to the risk assumed.
| 131 |
Table of Contents
The procedures for the management and valuation of collateral are set out in the Credit Risk Management Policies Retail and Wholesale, which establish the basic principles for credit risk management, including the management of collateral arranged in transactions with customers. The criteria for the systematic, standardized and effective treatment of collateral in credit transaction procedures in BBVA Group’s wholesale and retail banking are included in the Specific Collateral Rules.
The methods used to value the collateral are in line with the best market practices and imply the use of appraisal of real-estate collateral, the market price in market securities, the trading price of shares in mutual funds, etc. All collateral assigned must be properly drawn up and entered in the corresponding register in the official formats and legal organizations.
The following is a description of the main types of collateral for each financial instrument class:
| · | Financial assets held for trading: the guarantees or credit enhancements obtained directly from the issuer or counterparty are implicit in the clauses of the instrument (mainly personal guarantees). |
| · | Derivatives and hedge accounting derivatives: in derivatives, credit risk is minimized through contractual netting agreements, where positive- and negative-value derivatives with the same counterparty are offset for their net balance. There may likewise be other kinds of guarantees, depending on the counterparty’s solvency and the nature of the transaction (mainly collaterals). |
| · | Financial assets designated at fair value through profit or loss andavailable-for-sale financial assets: guarantees or credit enhancements obtained directly from the issuer or counterparty are inherent in the structure of the instrument (mainly personal guarantees). |
| · | Loans and receivables: |
| ○ | Loans and advances to credit institutions: these usually only have the counterparty’s personal guarantee. |
| ○ | Loans and advances to customers: most of these operations are backed by personal guarantees extended by the counterparty. There may also be collateral to secure loans and advances to customers (such as mortgages, cash guarantees, pledged securities and other collateral), or to obtain other credit enhancements (bonds, hedging, etc.). |
| ○ | Debt securities: guarantees or credit enhancements obtained directly from the issuer or counterparty are inherent in the structure of the instrument. |
| · | Financial guarantees, other contingent risks and drawable by third parties: these have the counterparty’s personal guarantee. |
| 3.2.9. | Information on credit risk mitigation techniques |
| 3.2.9.1. | Hedging based on netting operations on and off the balance sheet |
Within the limits established by the rules on netting in each one of its operating countries, the Group negotiates with its customers the assignment of the derivatives business to master agreements (e.g., ISDA or CMOF) that include the netting ofoff-balance-sheet transactions.
The clauses of each agreement determine in each case the transactions subject to netting.
| 132 |
Table of Contents
The mitigation of counterparty risk exposure stemming from the use of mitigation techniques (netting plus the use of collateral agreements) leads to a reduction in overall exposure (current market value plus potential risk).
As pointed out above, financial assets and liabilities may be the object of netting, in other words, presentation for a net amount on the balance sheet, only when the Group’s entities comply with the provisions of IAS 32 - Paragraph 42, and thus, have the legal right to offset the amounts recognized, and the intention to settle the net amount or to divest the asset and pay the liability at the same time.
| 3.2.9.2. | Hedging based on collateral |
| 3.2.9.2.1. | Management and valuation policies and procedures |
The procedures for management and valuation of collateral are included in the Collateral Rules, or in the Policies for Retail and Wholesale Credit Risk.
These Policies lay down the basic principles of credit-risk management, which includes the management of the collateral assigned in transactions with customers.
Accordingly, the risk management model jointly values the existence of a suitable cash flow generation by the obligor that enables them to service the debt, together with the existence of suitable and sufficient guarantees that ensure the recovery of the credit when the obligor’s circumstances render them unable to meet their obligations.
The valuation of the collateral is governed by prudential principles and thoroughness, carried out with the necessary information to determine it and prudential extreme in the use of appraisal valuation, assessments of independent experts, market price for shares, quoted value of shares in a mutual fund, etc.
The milestones, under which the valuations of the collaterals must be updated, in accordance with local regulation, are established under these prudential principles.
With respect to the entities that carry out the valuation of the collateral, principles are in place in accordance with local regulations that govern their level of relationship and dependence with the Group and some associated control processes. These valuations will be updated by statistical methods, indices or appraisals of goods, inquiries to internal or external sources, etc., which shall be carried out under the generally accepted standards in each market and in accordance with local regulations.
All collateral assigned must be recorded in the associated contracts, properly instrumented and recorded in the corresponding official register under the applicable formats.
| 3.2.9.2.2. | Types of collaterals |
As collateral for the purpose of calculating equity, the Group uses the coverage established in the solvency regulations. The following are the main collaterals available in the Group:
| · | Mortgage collateral: the collateral is the property upon which the loan is arranged. |
| · | Financial collateral: their object is any one of the following financial assets, as per articles 197 and 198 of the solvency regulation. |
| ○ | Cash deposits, deposit certificates or similar securities. |
| ○ | Debt securities issued for the different categories. |
| 133 |
Table of Contents
| ○ | Shares or convertible bonds. |
| · | Other property and rights used as collateral: the following property and rights are considered acceptable as collateral as per article 200 of the solvency regulation. |
| ○ | Cash deposits, deposit certificates or similar instruments held in third-party institutions other than the lending credit institution, when these are pledged in favour of the latter. |
| ○ | Life insurance policies pledged in favour of the lending credit institution. |
| ○ | Debt securities issued by other institutions provided that these securities are to be repurchased at apre-set price by the issuing institutions at the request of the holder of the securities. |
The value of the exposure hedged with financial collateral and other collateral calculated using the standardized and advanced approaches, and the counterparty risk, is as follows:
TABLE 50: Exposure covered with financial guarantees and other collateral calculated using the standardized and advanced approaches
Million Euros
| 2018 | 2017 | |||||||||||||||
| Exposures Classes | Exposure covered by financial guarantees | Exposure covered by other elligible collateral | Exposure covered by financial guarantees | Exposure covered by other elligible collateral | ||||||||||||
| Central governments or central banks | 7,199 | – | 2,662 | – | ||||||||||||
| Regional governments or local authorities | 24 | – | 91 | – | ||||||||||||
| Public sector entities | 2 | – | 15 | 29 | ||||||||||||
| Multilateral Development Banks | – | – | – | – | ||||||||||||
| International Organizations | – | – | – | – | ||||||||||||
| Institutions | 4,594 | 114 | 4,097 | 106 | ||||||||||||
| Corporates | 3, 626 | 824 | 9,165 | 1,388 | ||||||||||||
| Retail | 880 | 1,157 | 870 | 1,287 | ||||||||||||
| Secured by mortgages on inmovable property | 29 | 26 | 518 | 58 | ||||||||||||
| Exposures in default | 19 | 1 | 16 | – | ||||||||||||
| Exposures associated with particularly high risk | 1 | – | 1 | – | ||||||||||||
| Covered bonds | – | – | – | – | ||||||||||||
| Short-term claims on institutions and corporate | – | – | – | – | ||||||||||||
| Collective investments undertakins | 6 | – | – | – | ||||||||||||
| Other exposures | – | – | – | – | ||||||||||||
| Total guarantees value under standardised approach | 16,382 | 2,121 | 17,435 | 2,867 | ||||||||||||
| Central governments or central banks | 4, 377 | – | 713 | – | ||||||||||||
| Institutions | 52,714 | 97 | 48,818 | 141 | ||||||||||||
| Retail | 71 | 822 | 77 | 854 | ||||||||||||
| Corporates | 997 | 6,789 | 1,296 | 8,397 | ||||||||||||
| Total guarantees value under IRB approach | 58,159 | 7,708 | 50,904 | 9,392 | ||||||||||||
| Total | 74,541 | 9,829 | 68,340 | 12,259 | ||||||||||||
| 3.2.9.3. | Hedging based on personal guarantees |
According to the solvency regulations, unfunded credit protection consists of personal guarantees, including those arising from credit insurance, that have been granted by the providers of coverage defined in articles 201 and 202 of the solvency regulation.
In the category of Retail exposure under the advanced measurement approach, guarantees impact on the PD and do not reduce the amount of the credit risk in EAD.
The total value of the exposure covered with personal guarantees is as follows (including counterparty risk):
| 134 |
Table of Contents
TABLE 51: Exposure covered by personal guarantees. Standardized and advanced approach
Million Euros
| Exposure covered by personal guarantees | ||||||||
| Exposures Classes | 2018 | 2017 | ||||||
| Central governments or central banks | – | – | ||||||
| Regional governments or local authorities | 3,260 | 3,247 | ||||||
| Public sector entities | 62 | 12 | ||||||
| Multilateral Development Banks | – | – | ||||||
| International organizations | – | – | ||||||
| Institutions | 388 | 508 | ||||||
| Corporates | 3,305 | 3,100 | ||||||
| Retail | 2,394 | 2,537 | ||||||
| Secured by mortgages on immovable property | 26 | 42 | ||||||
| Exposures in default | 124 | 172 | ||||||
| Exposures associated with particularly high risk | 14 | 24 | ||||||
| Covered bonds | – | – | ||||||
| Short-term claims on institutions and corporate | – | – | ||||||
| Collective investments undertakings | – | – | ||||||
| Other exposures | 1,242 | 4,069 | ||||||
| Total personal guarantees value under standardised approach | 10,818 | 13,710 | ||||||
| Central governments or central banks | 486 | 621 | ||||||
| Institutions | 18,450 | 20,091 | ||||||
| Retail | 93 | 106 | ||||||
| Corporates | 10,726 | 8,058 | ||||||
| Of which: SMEs | 2,923 | 2,057 | ||||||
| Of which: SMEs subject to corrector factor | – | – | ||||||
| Of which: others | 7,803 | 6,002 | ||||||
| Total personal guarantees value under IRB approach | 29,755 | 28,876 | ||||||
| Total | 40,572 | 42,586 | ||||||
An overview of the level of use of each of the credit risk mitigation techniques employed by the Group as of December 31, 2018 is presented below:
TABLE 52: EU CR3 - Credit risk mitigation techniques overview(1)
Million Euros
| 12/31/2018 | Exposures unsecured - carrying amount | Exposures secured - Carrying amount | Exposures secured by collateral | Exposures secured by financial guarantees | Exposures secured by credit derivatives | |||||||||||||||
| Total Loans | 306,244 | 106,712 | 40,717 | 24,552 | – | |||||||||||||||
| Total debt securities | 54,463 | 15,780 | 8,517 | 6,584 | – | |||||||||||||||
| Total exposures | 360,707 | 122,492 | 49,234 | 31,137 | – | |||||||||||||||
| Of which: defaulted | 6,964 | 1,613 | 850 | 349 | – | |||||||||||||||
(1) Includes reverse repo transactions and excludes securitization exposures. |
| |||||||||||||||||||
| Million Euros | ||||||||||||||||||||
| 12/31/2017 | Exposures unsecured - carrying amount | Exposures secured - Carrying amount | Exposures secured by collateral | Exposures secured by financial guarantees | Exposures secured by credit derivatives | |||||||||||||||
| Total Loans | 344,164 | 87,537 | 37,616 | 27,161 | – | |||||||||||||||
| Total debt securities | 56,288 | 17,239 | 6,051 | 7, 692 | – | |||||||||||||||
| Total exposures | 400,451 | 104,777 | 43,666 | 34,853 | – | |||||||||||||||
| Of which: defaulted | 8,842 | 2,221 | 1,376 | 374 | – | |||||||||||||||
(1) Includes reverse repo transactions and excludes securitization exposures.
| 3.2.9.4. | Risk concentration |
BBVA has established the measurement, monitoring and reporting criteria for the analysis of large credit exposures that could represent a risk of concentration, with the aim of guaranteeing their alignment with the risk appetite defined in the Group.
In particular, measurement and monitoring criteria are established for large exposures at the level of individual concentrations, concentrations of retail portfolios and wholesale sectors.
A quarterly measurement and monitoring process has been established for reviewing the risks of concentration.
The main measures to prevent risk concentration in BBVA are:
| · | At both BBVA Group level and the subsidiaries belonging to the banking group, there are details affecting the customers (groups) that present the biggest exposure (greater than 10% of fully-loaded CET1; in the subsidiaries the figure of |
| 135 |
Table of Contents
the banks’ own funds is used). If a customer presents a level of concentration that exceeds the thresholds, the maintenance of this exposure must be justified every year in writing, or the measures to reduce the exposure be explained (for example, cancellation of risks). |
| · | As an additional support to management, the level of portfolio concentration is calculated using the Herfindahl index. The level of concentration at Group level is “very low”. |
| · | The measures for reducing credit risk do not have a significant impact on the level of BBVA Group’s major exposure, and they are used solely as a mechanism for mitigating intra-group risk (standby letters of credit issued by BBVA in favour of the banking Group’s subsidiaries). |
| · | The typical sector concentration is based on the grouping of risks according to the economic activity carried out. BBVA uses a classification that groups activities into 15 sectors. All of them are at BBVA Group level, under the acceptable thresholds. |
| · | In retail portfolios, the analysis is carried out atsub-portfolio level (mortgages andnon-mortgage retail). Both are under the acceptable thresholds at BBVA Group level. |
3.2.10. RWA density by geographical area
A summary of the average weighting percentages by exposure category existing in the main geographical areas in which the Group operates is shown below for credit risk and counterparty exposure, for the purpose of obtaining an overview of the Group’s risk profile in terms of RWAs.
TABLE 53: Breakdown of RWA density by geographical area and approach
Million Euros
| 12/31/2018 | RWA density(1) (2) | |||||||||||||||||||||||||||||||
| Category of exposure | Total | Spain (3) | Turkey | Eurasia | Mexico | USA | South America | Rest of the World | ||||||||||||||||||||||||
| Central governments or central banks | 22.0% | 16.4% | 53.1% | 3.7% | 13.8% | 4.4% | 65.5% | – | ||||||||||||||||||||||||
| Regional governments or local authorities | 21.3% | – | 69.6% | 20.4% | 25.6% | 20.0% | 55.5% | – | ||||||||||||||||||||||||
| Public sector entities | 39.5% | – | 39.2% | – | 47.9% | 19.7% | 66.4% | – | ||||||||||||||||||||||||
| Multilateral Development Banks | 2.2% | – | – | – | – | – | 13.9% | – | ||||||||||||||||||||||||
| International organizations | – | – | – | – | – | – | – | – | ||||||||||||||||||||||||
| Institutions | 32.1% | 19.7% | 55.4% | 24.2% | 43.5% | 17.3% | 34.5% | 70.0% | ||||||||||||||||||||||||
| Corporates | 97.9% | 92.4% | 99.6% | 94.7% | 91.9% | 99.1% | 97.4% | 100.0% | ||||||||||||||||||||||||
| Retail | 70.1% | 66.3% | 67.5% | 71.8% | 70.2% | 73.5% | 72.2% | 71. 4% | ||||||||||||||||||||||||
| Secured by mortgages on immovable property | 38.2% | 31.2% | 42.7% | 37.3% | 37.8% | 37.3% | 40.5% | 41.7% | ||||||||||||||||||||||||
| Exposures in default | 115.1% | 124.5% | 110.4% | 116.4% | 100.1% | 132.9% | 104.2% | 100.7% | ||||||||||||||||||||||||
| Exposures associated with particularly high risk | 150.0% | 150.0% | 150.0% | 150.0% | 150.0% | 150.0% | 150.0% | 150.0% | ||||||||||||||||||||||||
| Covered bonds | – | – | – | – | – | – | – | – | ||||||||||||||||||||||||
| Short-term claims on institutions and corporate | 65.9% | – | – | – | 20.1% | – | 68.1% | – | ||||||||||||||||||||||||
| Collective investments undertakings | 100.0% | 100.0% | – | 100.0% | 100.0% | 100.0% | – | 100.0% | ||||||||||||||||||||||||
| Other exposures | 39.5% | 70.4% | 43.3% | 135.8% | 17.8% | 54.9% | 35.1% | 1.0% | ||||||||||||||||||||||||
| Securitisation exposures | 20.5% | – | – | – | 50.0% | 20.4% | – | – | ||||||||||||||||||||||||
| Total credit risk by standardised approach | 51.0% | 28.3% | 72.8% | 42.8% | 36.8% | 64.4% | 69.0% | 73.7% | ||||||||||||||||||||||||
| Central governments or central banks | 5.4% | 5.1% | 1.4% | 2.7% | 10.0% | 2.5% | 36.7% | 24.2% | ||||||||||||||||||||||||
| Institutions | 6.7% | 9.8% | 108.5% | 4.6% | 23.0% | 10.8% | 18.7% | 21.5% | ||||||||||||||||||||||||
| Corporates | 53.4% | 54.2% | 75.1% | 43.0% | 74.0% | 34.7% | 49.0% | 51.8% | ||||||||||||||||||||||||
| Retail | 19.5% | 13.4% | 28.8% | 27.5% | 96.4% | 20.7% | 24.9% | 30.2% | ||||||||||||||||||||||||
| Securitisation exposures | 31.1% | 31.1% | – | – | – | – | – | – | ||||||||||||||||||||||||
| Total credit risk by IRB approach | 27.4% | 25.2% | 55.4% | 16.1% | 78.8% | 20.8% | 37.3% | 37.3% | ||||||||||||||||||||||||
| Total credit risk dilution and delivery | 40.7% | 26.4% | 72.6% | 22.5% | 49.8% | 57.3% | 67.4% | 46.2% | ||||||||||||||||||||||||
(1) Does not include equity exposures.
(2) Calculated as RWAs/EAD.
(3) In Spain, Central Governments or Central Banks exposures includes deferred tax assets net of deferred tax liabilities.
| 136 |
Table of Contents
Million Euros
| 12/31/2017 | RWA density(1) (2) | |||||||||||||||||||||||||||||||
| Category of exposure | Total | Spain (3) | Turkey | Eurasia | Mexico | USA | South America | Rest of the World | ||||||||||||||||||||||||
| Central governments or central banks | 22.0% | 18.0% | 41.0% | 3.0% | 10.0% | 5.0% | 65.0% | – | ||||||||||||||||||||||||
| Regional governments or local authorities | 19.0% | 1.0% | 22.0% | 20.0% | 10.0% | 20.0% | 63.0% | – | ||||||||||||||||||||||||
| Public sector entities | 38.0% | – | 55.0% | 1.0% | 20.0% | 19.0% | 67.0% | – | ||||||||||||||||||||||||
| Multilateral Development Banks | 7.0% | – | – | – | – | – | 50.0% | – | ||||||||||||||||||||||||
| International organizations | – | – | – | – | – | – | – | – | ||||||||||||||||||||||||
| Institutions | 36.0% | 49.0% | 47.0% | 36.0% | 29.0% | 22.0% | 35.0% | 72.0% | ||||||||||||||||||||||||
| Corporates | 98.0% | 98.0% | 99.0% | 96.0% | 77.0% | 100.0% | 97.0% | 100.0% | ||||||||||||||||||||||||
| Retail | 70.0% | 67.0% | 68.0% | 72.0% | 75.0% | 71.0% | 71.0% | 75.0% | ||||||||||||||||||||||||
| Secured by mortgages on immovable property | 40.0% | 38.0% | 46.0% | 39.0% | 43.0% | 37.0% | 38.0% | 47.0% | ||||||||||||||||||||||||
| Exposures in default | 112.0% | 119.0% | 100.0% | 102.0% | 106.0% | 135.0% | 102.0% | 100.0% | ||||||||||||||||||||||||
| Exposures associated with particularly high risk | 150.0% | 150.0% | 150.0% | 151.0% | 150.0% | 150.0% | 150.0% | – | ||||||||||||||||||||||||
| Covered bonds | – | – | – | – | – | – | – | – | ||||||||||||||||||||||||
| Short-term claims on institutions and corporate | 20.0% | 20.0% | – | 18.0% | 25.0% | – | – | – | ||||||||||||||||||||||||
| Collective investments undertakings | 100.0% | 100.0% | – | 100.0% | – | 100.0% | – | – | ||||||||||||||||||||||||
| Other exposures | 40.0% | 89.0% | 30.0% | 31.0% | 17.0% | 71.0% | 29.0% | 2.0% | ||||||||||||||||||||||||
| Securitisation exposures | 21.0% | – | – | – | 50.0% | 21.0% | – | – | ||||||||||||||||||||||||
| Total credit risk by standardised approach | 52.0% | 35.0% | 67.0% | 39.0% | 33.0% | 66.0% | 68.0% | 76.0% | ||||||||||||||||||||||||
| Central governments or central banks | 14.0% | 31.0% | 2.0% | 7.0% | 11.0% | 1.0% | 55.0% | 19.0% | ||||||||||||||||||||||||
| Institutions | 8.0% | 14.0% | 58.0% | 4.0% | 16.0% | 16.0% | 20.0% | 13.0% | ||||||||||||||||||||||||
| Corporates | 55.0% | 57.0% | 51.0% | 48.0% | 64.0% | 40.0% | 58.0% | 59.0% | ||||||||||||||||||||||||
| Retail | 19.0% | 14.0% | 29.0% | 25.0% | 106.0% | 19.0% | 23.0% | 17.0% | ||||||||||||||||||||||||
| Securitisation exposures | 26.0% | 26.0% | – | – | – | – | – | – | ||||||||||||||||||||||||
| Total credit risk by IRB approach | 29.0% | 27.0% | 40.0% | 20.0% | 73.0% | 23.0% | 51.0% | 34.0% | ||||||||||||||||||||||||
| Total credit risk dilution and delivery | 43.0% | 30.0% | 67.0% | 25.0% | 45.0% | 59.0% | 67.0% | 42.0% | ||||||||||||||||||||||||
(1) Does not include equity exposures.
(2) Calculated as RWAs/EAD.
(3) In Spain, Central Governments or Central Banks exposures includes deferred tax assets net of deferred tax liabilities.
| 137 |
Table of Contents
| 3.3. | Market risk |
| 3.3.1. | Scope and nature of the market risk measurement and reporting systems |
Market risk originates in the possibility that there may be losses in the value of positions held due to movements in the market variables that affect the valuation of financial products and assets in trading activity.
The main risks generated may be classified into the following groups:
| · | Interest-rate risk: they arise as a result of exposure to the movement in the different interest-rate curves on which there is trading. Although the typical products generating sensitivity to movements in interest rates are money market products (deposits, futures on interest rates, call money swaps, etc.) and the traditional interest-rate derivatives (swaps, interest-rate options such as caps, floors, swaptions, etc.), practically all the financial products have some exposure to movements in interest rates due to the effect of the financial discount in valuing them. |
| · | Equity Risk: arises as a result of movements in the price of shares. This risk is generated in spot positions in shares or any derivative products whose underlying asset is a share or an equity index. Dividend risk is asub-risk of equity risk, as an input of any equity option. Its variability may affect the valuation of positions and thus it is a factor that generates risk on the books. |
| · | Exchange-rate risk: it occurs due to a movement in the exchange rates of the currencies in which the position is held. As in the case of equity risk, this risk is generated in the spot foreign-currency positions, as well as any derivative product whose underlying is an exchange rate. |
In addition, the quanto effect (transactions where the underlying and the nominal of the transaction are denominated in different currencies) means that in certain transactions where the underlying is not a currency an exchange-rate risk is generated that has to be measured and monitored.
| · | Credit spread risk: credit spread is an indicator of an issuer’s credit quality. The spread risk takes place due to variations in the levels of spread in corporate or government issuers and affects both bond and credit derivative positions. |
| · | Volatility risk: this occurs as a result of variations in the levels of implied volatility in the price of different market instruments in which derivatives are traded. This risk, unlike the others, is exclusively a component of derivative transactions and is defined as a risk of first-order convexity that is generated in all the possible underlying transactions where there are products with an optionality that require a volatility input for their valuation. |
The metrics developed to control and monitor market risk in BBVA Group are aligned with best practices in the market and are implemented consistently across all the local market risk units.
Measurement procedures are established in terms of the possible impact of negative market conditions on the trading book of the Group’s Global Markets units, both under ordinary circumstances and in situations of heightened risk factors.
The standard metric used to measure market risk is Value at Risk (VaR), which indicates the maximum losses that may be incurred in the portfolios at a given confidence level (99%) and time horizon (one day).
Chapter 3.3.4 explains in more detail the risk measurement models used in BBVA Group, focused on internal models approved by the supervisor for BBVA S.A. and BBVA
| 138 |
Table of Contents
Bancomer for the purpose of calculating the capital for positions in the trading book. For the rest of the geographic areas (South America and Compass), the calculation of capital for the risk positions in the trading book is carried out using the standard model.
Analysis of the Group’s RWA structure demonstrates that 4% corresponds to Market Risk (including the foreign-exchange risk).
| 3.3.2. | Differences in the trading book for the purposes of applying the solvency regulations and accounting criteria |
According to the solvency regulation, the trading book shall be made up of all the positions in financial instruments and commodities that the credit institution holds for the purpose of trading or that act as hedging for other elements in this book.
With respect to this portfolio, the rule also refers to the need to establish clearly defined policies and procedures.
For this purpose, regulatory trading book activities defined by BBVA Group include the positions managed by the Group’s Trading units, for which market risk limits are set and then monitored daily. Moreover, they comply with the other requirements defined in the solvency regulations.
The definition of the accounting negotiation portfolio is included in Note 2.2.1. of the Group’s Consolidated Annual Accounts.
| 3.3.3. | Standardised approach |
RWAs weighted for market risk under the standardised approach (excluding exchange-rate risk) account for 25% of the total of market risk weighted assets.
The amounts in terms of RWAs and capital requirements by market risk calculated under the standardized approach as of December 31, 2018 and December 31, 2017 are presented below:
TABLE 54: EUMR1- Market risk under the standardised approach
| Million Euros | ||||||||
| 12/31/2018 | RWAs | Capital Requirements | ||||||
| Outright Products | ||||||||
| Interest Rate Risk | 1,940 | 155 | ||||||
| Equity Risk | 136 | 11 | ||||||
| Foreign Exchange Risk | 2,271 | 182 | ||||||
| Commodity Risk | 18 | 1 | ||||||
| Options | ||||||||
| Simplified approach | – | – | ||||||
| Delta-plus method | – | – | ||||||
| Scenario approach | – | – | ||||||
| Securitisation | 13 | 1 | ||||||
| Correlation trading portfolio | 670 | 54 | ||||||
| Total | 5,048 | 404 | ||||||
| 139 |
Table of Contents
| Million Euros | ||||||||
| 12/31/2017 | RWAs | Capital Requirements | ||||||
| Outright Products | ||||||||
| Interest Rate Risk | 2,461 | 197 | ||||||
| Equity Risk | 197 | 16 | ||||||
| Foreign Exchange Risk | 4,579 | 366 | ||||||
| Commodity Risk | 9 | 1 | ||||||
| Options | ||||||||
| Simplified approach | – | – | ||||||
| Delta–plus method | – | – | ||||||
| Scenario approach | – | – | ||||||
| Securitisation | 20 | 2 | ||||||
| Correlation trading portfolio | 142 | 11 | ||||||
| Total | 7,408 | 593 | ||||||
| 3.3.4. | Internal models |
| 3.3.4.1. | Scope of application |
For the purposes of calculating capital as approved by the supervisor, the scope of application of the internal market risk model extends to BBVA S.A. and BBVA Bancomer Trading Floors.
As explained in Note 7.4 of the Group’s Consolidated Financial Statements, most of the items on the Group’s consolidated balance sheet subject to market risk are positions whose principal metric used to measure their market risk is VaR.
This Note specifies the accounting headings of the consolidated balance sheets as of December 31, 2018 and as of December 31, 2017 in the geographic areas with an Internal Model where there is market risk in the trading activity subject to this measurement.
| 3.3.4.2. | Characteristics of the models used |
The measurement procedures are established in terms of the possible impact of negative market conditions, both under ordinary circumstances and in situations of tension, on the trading book of the Group’s Global Markets units.
The standard metric used to measure market risk is Value at Risk (VaR), which indicates the maximum losses that may be incurred in the portfolios at a given confidence level (99%) and time horizon (one day).
This statistic is widely used in the market and has the advantage of summarizing in a single metric the risks inherent in trading activity, taking into account the relations between all of them, and providing the forecast of the losses that the trading book might incur as a result of price variations in equity markets, interest rates, exchange rates and credit. In addition, for certain positions, other risks also need to be considered, such as credit spread risk, basis risk, volatility and correlation risk.
With respect to the risk measurement models used in BBVA Group, the supervisor has authorised the use of the internal model for the calculation of capital for the risk positions in the trading book of BBVA, S.A. and BBVA Bancomer which, together, account for around 62% of the market risk of the Group’s trading book.
BBVA users a single model to calculate the regulatory requirements by risk, taking into account the correlation between the assets and thus recognizing the diversifying effect of the portfolios. The model used estimates the VaR in accordance with the “historical simulation” methodology, which involves estimating the losses and gains that would have
| 140 |
Table of Contents
been incurred in the current portfolio if the changing market conditions that occurred over a given period of time were repeated. Based on this information, it infers the maximum foreseeable loss in the current portfolio with a given level of confidence.
Absolute and relative returns are used in simulating the potential variation of the risk factors, depending on the type of risk factor. Relative returns are used in the case of equity and foreign currency; while absolute returns are used in the case of spreads and interest rates.
The decision on the type of return to apply is made according to the risk factor metric subject to variation. The relative return is used in the case of price risk factors, while for interest-rate risk factors it is absolute returns.
The model has the advantage of accurately reflecting the historical distribution of the market variables and of not requiring any specific distribution assumption. The historical period used in this model is two years.
VaR figures are estimated following two methodologies:
| · | VaR without smoothing, which awards equal weight to the daily information for the previous two years. This is currently the official methodology for measuring market risks for the purpose of monitoring compliance with risk limits. |
| · | VaR with smoothing, which weighs more recent market information more heavily. This model adjusts the historical information of each market variable to reflect the differences between historical volatility and current volatility. This metric is supplementary to the one above. |
VaR with smoothing adapts itself more swiftly to the changes in financial market conditions, whereas VaR without smoothing is, in general, a more stable metric that will tend to exceed VaR with smoothing when the markets show less volatile trends, but be lower when they present upturns in uncertainty.
Furthermore, and following the guidelines established by Spanish and European regulators, BBVA incorporates additional VaR metrics to fulfil the regulatory requirements issued by the supervisor for the purpose of calculating capital for the trading book. Specifically, the new measures incorporated in the Group since December 2011 (which follow the guidelines set out by Basel 2.5) are as follows:
| · | VaR: in regulatory terms, the charge for VaR Stress is added to the charge for VaR and the sum of both (VaR and VaR Stress) is calculated. This quantifies the losses associated with movements in the risk factors inherent in market operations (interest rate, FX, RV, credit, etc.). |
Both VaR and VaR Stress are rescaled by a regulatory multiplier set at three and by the square root of ten to calculate the capital charge.
| · | Specific Risk: Incremental Risk Capital (IRC). Quantification ofnon-performing risk and downgrade risk in the rating of some positions held in the portfolio, such as bonds and credit derivatives. The specific risk capital IRC is a charge exclusively for those geographical areas with an approved internal model (BBVA S.A. and Bancomer). |
The capital charge is determined based on the associated losses (at 99.9% over a time horizon of 1 year under the assumption of constant risk) resulting from the rating migration and/or default of the asset’s issuer. Also included is the price risk in sovereign positions for the indicated items. |
The calculation methodology is based on the Monte Carlo simulation of the impact of defaults and rating transitions on the portfolio of positions subject to incremental
| 141 |
Table of Contents
risk capital. The model defining the transition and default process of a counterparty is based on the changes in a counterparty’s credit quality. Under a Mertonone-factor model, which underlies the Basel or Creditmetrics model, this credit quality will correspond to the value of the issuer’s assets, depending on a systemic factor that is common to all the issuers, and an idiosyncratic factor specific to each.
All that is needed to simulate the rating transition and default process of the issuers is to simulate the systemic factor and idiosyncratic component. Once the underlying variable is available, the final rating can be obtained. The simulation of the individual credit quality of the issuers allows the losses by systemic risk and idiosyncratic risk to be obtained.
Transition matrixes
The transition matrix used for calculation is estimated based on the external information of the rating transitions provided by the rating agencies. Specifically, the information provided by the Standard & Poor’s agency is used.
The appropriateness of using information on external transitions is justified by:
| · | The internal ratings for the Sovereign, Emerging Sovereign Country (ESC), Financial Institution (FI) and Corporate segments (which constitute the core positions subject to incremental risk capital) are aligned with the external ratings. By way of example, the internal rating system for financial institutions is based on an algorithm that uses external ratings. |
| · | The rating agencies provide sufficient historical information to cover a complete economic cycle (rating transition information is available dating back to year 1981) and obtain a long-term transition matrix in the same way as the calculation of the regulatory capital for credit risk in the banking book long-term probabilities of default are required. |
This historical depth is not available for the internal rating systems. |
Although external data are used for determining the transitions between ratings, to establish the default, probabilities are used assigned by the BBVA master scale, which ensures consistency with the probabilities used for the calculations of capital in the Banking Book.
The transition matrix is recalibrated every year, based on information on transitions provided by Standard & Poor’s. A procedure has been defined to readjust the transitions in accordance with the probability of default assigned by the master scale.
Liquidity horizons
The calculation of incremental risk capital used by BBVA explicitly includes the use of positions with a hypothesis of a constant level of risk and liquidity horizons of less than one year.
The establishment of liquidity horizons follows the guidelines/criteria established by Basel in its guidelines for computing capital for incremental risk.
First, a criterion of management capacity for positions has been used for positions through liquid instruments that can hedge their inherent risks. The main instrument for hedging the price risk for rating transitions and defaults is the Credit Default Swap (CDS). The existence of this hedging instrument serves as a justification for considering a short liquidity horizon.
| 142 |
Table of Contents
However, in addition to considering the existence of a liquid CDS, a distinction has to be made according to the issuer’s rating (this factor is also mentioned in the aforementioned guidelines). Specifically, between investment grade issuers or those with a rating equal to or aboveBBB-, and issuers below this limit.
According to these criteria, the issuers are mapped to standard liquidity horizons of 3, 6 or 12 months.
Correlation
The calculation methodology is based on a single-factor model, in which there is one factor common to all the counterparties. The coefficient of the model is determined by the correlation curves established by Basel for companies, financial institutions and sovereigns based on the probability of default.
The use of the Basel correlation curve ensures consistency with the calculation of regulatory capital under the IRB approach for the positions on the banking book.
| · | Specific Risk: Securitizations and Correlation Portfolios. Capital charge for the securitizations and the correlation portfolio for potential losses associated with the rating level of a given credit structure (rating). Both are calculated using the standardized approach. The perimeter of the correlation portfolios is referred toFirst-to-default (FTD) type market operations and/or market CDO tranches, and only for positions with an active market and hedging capacity. |
Validity tests are performed periodically on the risk measurement models used by the Group. They estimate the maximum loss that could have been incurred in the positions assessed with a given level of probability (backtesting), as well as measurements of the impact of extreme market events on the risk positions held (stress testing).
Backtesting is performed at the trading desk level as an additional control measure in order to carry out a more specific monitoring of the validity of the measurement models.
The current structure for managing market risk includes monitoring market risk limits, which consists of a system of limits based on Value at Risk (VaR), economic capital (based on VaR measurements) and VaRsub-limits, as well as stop-loss limits for each of the Group’s business units. The global limits are approved by the Executive Committee on an annual basis, once they have been analysed by the GRMC and the Risk Committee. This limits structure is developed by identifying specific risks by type, trading activity and trading desk. The market risk unit maintains consistency between the limits. The control structure in place is supplemented by limits on loss and a system of alert signals to anticipate the effects of adverse situations in terms of risk and/or result.
The review of the quality of the inputs used by the evaluation processes is based on checking the data against other sources of information accepted as standard. These checks detect errors in the historical series such as repetitions, data outside the range, missing data, etc. As well as these periodic checks of the historical data loaded, the daily data that feed these series are subject to a data quality process to guarantee their integrity.
The choice of proxies is based on the correlation detected between the performance of the factor to be entered and the proxy factor. A Simple Linear Regression model is used, selecting the proxy that best represents the determination coefficient (R2) within the whole period for which the performance of both series is available. Next, the performance of the factor on the necessary dates is reconstructed, using the beta parameter estimated in the simple linear regression.
| 143 |
Table of Contents
| 3.3.4.2.1. | Methodology and valuation and description of the independent price verification process |
The fair value is the price that would be received for selling an asset or paid for transferring a liability in an orderly transaction between market participants. It is therefore a market-based measurement, and not specific to each entity.
The fair value is reached without making any deduction in transaction costs that might be incurred due to sale or disposal by other means.
The process of determining fair value established in the Group ensures that assets and liabilities are valued correctly. At level of geographic areas, BBVA has established a structure of New Product Committees responsible for validating and approving new products or classes of assets and liabilities before their contracting. The committee members are the local areas, independent of the business, who are responsible for their valuation (see Note 7 of the Group’s Consolidated Annual Report).
These areas are responsible for ensuring as a prior step to approval that the technical and human capacities are in place, and that sufficient sources of information are available to value the assets and liabilities, in accordance with the criteria established by the Global Valuation Area and using models validated and approved by the Risk Analytics Area, which answers to Global Risk Management.
In addition, for assets and liabilities in which significant elements of uncertainty are detected in the inputs or parameters of the models used, which may affect their valuation, criteria are established to measure this uncertainty and limits are set on activity based on them. Finally, valuations obtained in this way are, as far as possible, checked against other sources, such as the valuations obtained by the business teams or other market participants.
In the initial entry, the best evidence of fair value is the list price on an active market. When these prices are not available, recent transactions on the same instrument will be consulted or the valuation will be made using mathematical measurement models that are sufficiently tried and trusted by the international financial community. In subsequent valuations, fair value will be obtained by one of the following methods:
| · | Level 1: measurement using observable quoted prices for the financial instrument in question, referring to market assets (as defined by the Group’s internal policies), secured from independent sources. |
| · | Level 2: measurement that applies techniques whose significant variables are observable market data. |
| · | Level 3: measurement that applies techniques that use significant variables not obtained from market observable data. Model selection and validation was undertaken by control areas outside the market units. |
Not all the financial assets and liabilities are accounted at fair value; when it is not possible to reliably estimate a capital instrument’s fair value, it will be valued at its cost.
In addition, for all instruments measured at a fair value, the Group calculates Prudent Valuation Adjustments, (PVAs). The table below shows a breakdown of elements for the calculation of PVA.
| 144 |
Table of Contents
TABLE 55. Prudent Valuation Adjustments(1)
Million Euros
| Equity | Interest Rates | FX | Credit | Commodities | Diversification Adjustment | Total | Of which: in the trading book | Of which: in the banking book | ||||||||||||||||||||||||||||
| Close-out uncertainty, of which: | 130 | 349 | 29 | 7 | – | (197) | 317 | 174 | 143 | |||||||||||||||||||||||||||
| Mid-market value | 41 | 155 | 5 | 2 | – | (104) | 100 | 56 | 45 | |||||||||||||||||||||||||||
| Close-out cost | 41 | 104 | 23 | 5 | – | 93) | 80 | 66 | 14 | |||||||||||||||||||||||||||
| Concentration | 48 | 90 | – | – | – | – | 137 | 53 | 85 | |||||||||||||||||||||||||||
| Early termination | – | 1 | – | – | – | – | 1 | 1 | – | |||||||||||||||||||||||||||
| Model risk | 11 | 5 | – | 2 | – | (12) | 6 | 12 | (7) | |||||||||||||||||||||||||||
| Operational risk | – | 6 | – | – | – | – | 6 | – | 6 | |||||||||||||||||||||||||||
| Investing and funding costs | – | 18 | – | – | ||||||||||||||||||||||||||||||||
| Unearned credit spreads | – | 6 | – | – | ||||||||||||||||||||||||||||||||
| Future administrative costs | – | 3 | – | – | – | – | 3 | 3 | 3 | |||||||||||||||||||||||||||
| Other | – | – | – | – | – | – | – | – | – | |||||||||||||||||||||||||||
| Total Adjustment | 141 | 363 | 29 | 9 | – | (210) | 356 | 191 | 144 | |||||||||||||||||||||||||||
(1) Template based on Technical Regulation EBA/RTS/2014/06, breaking down the composition of the Prudent Valuation Adjustments which is aligned with BCBS PV1 Template
| 3.3.4.2.2. | Market risk in 2018 |
During 2018, the average VaR was 21 million euros, lower than in 2017, with a peak during the year of 26 million euros on March 16.
The following values (maximum, minimum, average and at year end within the statement period) are given based on the different model types used for calculating the capital requirement:
TABLE 56: EU MR3 - IMA values for trading portfolios
| Million Euros | ||||||
IMA values for trading portfolios (2018)(1) | ||||||
| VaR (10 day 99%) | ||||||
| 1 | Maximum value | 84 | ||||
| 2 | Average value | 55 | ||||
| 3 | Minimum value | 38 | ||||
| 4 | Period value | 56 | ||||
SVaR (10 day 99%) | ||||||
| 5 | Maximum value | 202 | ||||
| 6 | Average value | 139 | ||||
| 7 | Minimum value | 87 | ||||
| 8 | Period value | 136 | ||||
Incremental Risk Charge (99.9%) | ||||||
| 9 | Maximum value | 127 | ||||
| 10 | Average value | 92 | ||||
| 12 | Minimum value | 61 | ||||
| 13 | Period value | 91 | ||||
(1) Data as of second semester 2018
| 145 |
Table of Contents
| Millions euros | ||||||
IMA values for trading portfolios (2017)(1) | ||||||
VaR (10 day 99%) | ||||||
| 1 | Maximum value | 75 | ||||
| 2 | Average value | 55 | ||||
| 3 | Minimum value | 41 | ||||
| 4 | Period value | 57 | ||||
SVaR (10 day 99%) | ||||||
| 5 | Maximum value | 180 | ||||
| 6 | Average value | 116 | ||||
| 7 | Minimum value | 80 | ||||
| 8 | Period value | 127 | ||||
Incremental Risk Charge (99.9%) | ||||||
| 9 | Maximum value | 165 | ||||
| 10 | Average value | 116 | ||||
| 12 | Minimum value | 77 | ||||
| 13 | Period value | 92 | ||||
(1) Data as of second semester 2017
VaR without smoothing by risk factor for the Group is below:
CHART 20: Trading Book. VaR without smoothing
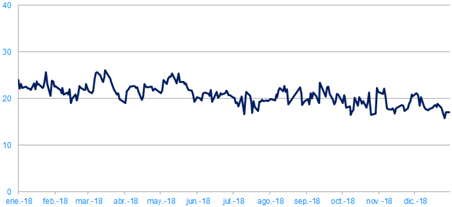
TABLE 57: Trading Book. VaR without smoothing by risk factors
Million Euros
| VaR by risk factors | Interest-rate and spread risk | Exchange – rate risk | Equity risk | Vega / correlation risk | Diversification effect(1) | Total | ||||||||||||||||||||||||
| December 2018 |
| |||||||||||||||||||||||||||||
| Average VaR for the | 20 | 6 | 4 | 9 | (20) | 21 | ||||||||||||||||||||||||
| Maximum VaR for the | 23 | 7 | 6 | 11 | (21) | 26 | ||||||||||||||||||||||||
| Minimum VaR for the | 17 | 6 | 4 | 7 | (18) | 16 | ||||||||||||||||||||||||
| VaR at the end of the period | 19 | 5 | 3 | 7 | (17) | 17 | ||||||||||||||||||||||||
| December 2017 |
| |||||||||||||||||||||||||||||
| Average VaR for the | 25 | 10 | 3 | 13 | (23) | 27 | ||||||||||||||||||||||||
| Maximum VaR for the | 27 | 11 | 2 | 12 | (19) | 34 | ||||||||||||||||||||||||
| Minimum VaR for the | 23 | 7 | 4 | 14 | (26) | 22 | ||||||||||||||||||||||||
| VaR at the end of the period | 23 | 7 | 4 | 14 | (26) | 22 | ||||||||||||||||||||||||
(1) The diversification effect is the difference between the sum of the risk factors measured individually and the total VaR figure that reflects the implicit correlation between all the variables and scenarios used in the measurement.
By type of market risk assumed by the Group’s trading portfolio, the main risk factor in the Group continues to be that linked to interest rates, with a weight of 55% of the total at the end of 2018 (this figure includes the spread risk), increasing the relative weight compared to the close of 2017 (48%). On the other hand, the foreign exchange risk represents 14%, maintaining the same proportion with respect to December 2017 (14%), while equity risk
| 146 |
Table of Contents
and volatility and correlation risk decreased, with a weight of 31% at the end of 2018 (vs. 38% at the end of 2017).
In accordance with article 455 e) of the CRR, corresponding to the breakdown of information on internal market risk models, the elements comprising the shareholders’ equity requirements referred to in articles 364 and 365 of the CRR are presented below.
TABLE 58: EUMR2-A - Market risk under the internal model approach (IMA)
Million Euros
| 31/12/2018 | RWAs | Capital Requirements | ||||||
| VaR | 2,015 | 161 | ||||||
| Previous day’s VaR | 705 | 56 | ||||||
| Average of the daily VaR on each of the preceding sixty business days (VaRavg) x multiplication factor | 2,015 | 161 | ||||||
| SVaR | 5,112 | 409 | ||||||
| Latest SVaR | 1,704 | 136 | ||||||
| Average of the SVaR during the preceding sixty business days (sVaRavg) x multiplication factor (mc) | 5,112 | 409 | ||||||
| Incremental risk charge – IRC | 1,141 | 91 | ||||||
| Most recent IRC value | 1,141 | 91 | ||||||
| Average of the IRC number over the preceding 13 weeks | 1,121 | 90 | ||||||
| Comprehensive Risk Measure– CRM | – | – | ||||||
| Most recent risk number for the correlation trading portfolio over the preceding 13 weeks | – | – | ||||||
| Average of the risk number for the correlation trading portfolio over the preceding 13 weeks | – | – | ||||||
| 8% of the own funds requirement in SA on most recent risk number for the correlation trading portfolio | – | – | ||||||
| Others | – | – | ||||||
| Total | 8,268 | 661 | ||||||
| Million Euros | ||||||||
| 31/12/2017 | RWAs | Capital Requirements | ||||||
| VaR | 2,232 | 179 | ||||||
| Previous day’s VaR | 716 | 57 | ||||||
| Average of the daily VaR on each of the preceding sixty business days (VaRavg) x multiplication factor | 2,232 | 179 | ||||||
| SVaR | 5,138 | 411 | ||||||
| Latest SVaR | 1,590 | 127 | ||||||
| Average of the SVaR during the preceding sixty business days (sVaRavg) x multiplication factor (mc) | 5,138 | 411 | ||||||
| Incremental risk charge – IRC | 1,240 | 99 | ||||||
| Most recent IRC value | 1,147 | 92 | ||||||
| Average of the IRC number over the preceding 13 weeks | 1,240 | 99 | ||||||
| Comprehensive Risk Measure – CRM | – | – | ||||||
| Most recent risk number for the correlation trading portfolio over the preceding 13 weeks | – | – | ||||||
| Average of the risk number for the correlation trading portfolio over the preceding 13 weeks | – | – | ||||||
| 8% of the own funds requirement in SA on most recent risk number for the correlation trading portfolio | – | – | ||||||
| Others | – | – | ||||||
| Total | 8,611 | 689 | ||||||
| 147 |
Table of Contents
Below are the main changes in the market RWAs, calculated using the method based on internal models:
TABLE 59: EUMR2-B - RWA flow statement of market risk exposure under the IMA
Million Euros
RWA flow statements of market risk exposure under IMA | VaR | SVaR | IRC | CRM | Other | Total RWAs | Total Capital Requirements | |||||||||||||||||||||
| RWAs as of December 31, 2017 | 2,232 | 5,138 | 1,240 | – | – | 8,611 | 689 | |||||||||||||||||||||
| Movement in risk levels | (254) | (152) | (116) | – | – | (523) | (42) | |||||||||||||||||||||
| Model updates/changes | – | – | – | – | – | – | – | |||||||||||||||||||||
| Methodology and policy | – | – | – | – | – | – | – | |||||||||||||||||||||
| Acquisitions and disposals | – | – | – | – | – | – | – | |||||||||||||||||||||
| Foreign Exchange movements | 38 | 126 | 17 | – | – | 180 | 14 | |||||||||||||||||||||
| Other | – | – | – | – | – | – | – | |||||||||||||||||||||
| RWAs as of December 31, 2018 | 2,015 | 5,112 | 1,141 | – | – | 8,268 | 661 | |||||||||||||||||||||
Slight decrease in Market Risk Regulatory Capital in BBVA Group(-4% vs dec’17) with decrease in BBVA S.A. offset by increase in BBVA Bancomer S.A.:
| · | Decrease in Market Risk Regulatory Capital in BBVA S.A.(-18% vs dec’17) mainly driven by the drop in VaR and Stress VaR Capital, because of the reduction in equity and credit position. |
| · | Increase in Market Risk Regulatory Capital in BBVA Bancomer S.A. (+17.5% vs dec’17) mainly in Stress VaR Capital, due to the increase in fixed income positions. |
| 3.3.4.2.3. | Stress testing |
All the tasks associated with stress, methodologies, scenarios of market variables or reports are undertaken in coordination with the Group’s Risk Areas.
Several different stress-test exercises are performed on BBVA Group’s trading portfolios. Both local and global historical scenarios are used, which replicate the behaviour of a past extreme event, for example, the collapse of Lehman Brothers or the “Tequila crisis”. These stress exercises are supplemented with simulated scenarios which aim to generate scenarios that have a significant impact on the different portfolios, but without being restricted to a specific historical scenario.
Lastly, for certain portfolios or positions, fixed stress test exercises are also prepared that have a significant impact on the market variables that affect those positions.
Historical scenarios
The baseline historical stress scenario in BBVA Group is that of Lehman Brothers, whose sudden collapse in September 2008 had a significant impact on the behaviour of financial markets at a global level. The following are the most relevant effects of this historical scenario:
| 1) | Credit shock: reflected mainly in the increase in credit spreads and downgrades of credit ratings. |
| 2) | Increased volatility in most financial markets (giving rise to much variation in the prices of the different assets (currencies, equity, debt)). |
| 3) | Liquidity shock in the financial systems, reflected in major fluctuations in interbank curves, particularly in the shortest sections of the euro and dollar curves. |
| 148 |
Table of Contents
TABLE 60: Trading Book. Impact on earnings in Lehman scenario
| Million Euros | ||||||
| Impact on earnings in Lehman scenario | ||||||
| 12-31-2018 | 12-31-2017 | |||||
| GM | Europe, NY & Asia | (28) | (38) | |||
| GM | Bancomer | (2) | (5) | |||
| GM | Argentina | (1) | (6) | |||
| GM | Chile | – | (3) | |||
| GM | Colombia | (2) | (3) | |||
| GM | Peru | (4) | (2) | |||
| GM | Venezuela | – | – | |||
Simulated scenarios
Unlike the historical scenarios, which are fixed and, thus, do not adapt to the composition of portfolio risks at any given time, the scenario used to perform the economic stress exercises is based on the resampling method. This methodology uses dynamic scenarios that are recalculated regularly according to the main risks held in the trading portfolios. A simulation exercise is carried out in a data window that is sufficiently extensive to include different periods of stress (data are taken from January 1, 2008 until today), using a resampling of the historical observations. This generates a distribution of losses and gains that allows an analysis of the most extreme events occurring within the selected historical window.
The advantage of this methodology is that the stress period is notpre-established, but rather a function of the portfolio held at any given time; and the large number of simulations (10,000) means that the expected shortfall analysis can include richer information than that available in scenarios included in the VaR calculation.
The main characteristics of this methodology are the following:
| a) | The simulations generated respect the data correlation structure. |
| b) | It provides flexibility in terms of including new risk factors. |
| c) | It enables a great deal of variability to be introduced (which is desirable for considering extreme events) |
The impact of the stress tests by simulated scenarios (Stress VaR 95% at 20 days, Expected Shortfall 95% at 20 days and Stress VaR 99% at 1 day) is shown below.
TABLE 61: Trading Book. Stress resampling
Million Euros
| Europe | Bancomer | Peru | Venezuela | Argentina | Colombia | Compass | Turkey | |||||||||
| Expected impact | (99) | (33) | (11) | – | (5) | (6) | (1) | – |
| Stress VaR | Expected Shortfall | Stress Period | Stress VaR 1D | |||||||||||||
| 2018 | 95 20 D | 95 20 D | 99% Resampling | |||||||||||||
| Total | ||||||||||||||||
| GM Europe, NY and Asia | (67) | (99) | | 02/01/2008 - 02/12/2009 | | (26) | ||||||||||
| GM Bancomer | (33) | (22) | | 09/05/2008 - 06/05/2010 | | (8) | ||||||||||
| 149 |
Table of Contents
| 3.3.4.2.4. | Backtesting |
Introduction
Theex-post or Backtesting validation is based on the comparison of the periodic results of the portfolio with the market risk measures from the established measurement system. The validity of a VaR model is particularly dependent on whether the empirical reality of the results does not enter into direct contradiction with what is expected in the model. If the observed results were sufficiently adjusted to that predicted by the model, it would be rated as good, and if the discrepancy was notable, revisions would be required in order to correct possible errors or modifications and to improve quality.
In order to determine whether the results have been sufficiently adjusted to the risk measurements, it is necessary to establish objective criteria, which are specified in a series of validation tests performed with a given methodology. In establishing the most appropriate methodology, the criteria recommended by Basel have been largely followed as they are considered appropriate.
Validation test
In the comparison between results and risk measurements, a key element of interest is the confidence that the losses do not exceed the VaR risk measurements made more than a number of times determined by the level of confidence adopted in the model. The validation test presented below, which focuses on contrasting this aspect, emphasises on rejecting that the risk measurement model is underestimating the risk that is actually being borne.
For the establishment of a hypothesis test, we start from the observed results and try to infer whether there is enough evidence to reject the model (the null hypothesis that the trust of the model is established is not met).
In cases where the model functions properly, the VaR measurement indicates that a portfolio value variation in a given time horizon will not exceed the value obtained in a percentage of times determined by the level of confidence. In other words, the probability of having a loss that is higher than the VaR measurement – what we will call an exception – will be 1%, and the probability that the exception will not occur will be 99%.
| GREEN Zone: model acceptance zone | It is characterised as being an area where there is a high probability of accepting an appropriate model and a low probability of accepting an inappropriate model It is defined by the set for which the cumulative probability being true the null hypothesis is less than 95%. It covers a number between zero and four exceptions.
| |
YELLOW zone: ambiguous zone | Possible results for both an appropriate and an inappropriate model. It begins from when the cumulative probability being true the null hypothesis is greater or equal to 95% (it must be less than 99.99%). It covers a number between five and nine exceptions.
| |
RED zone: model rejection zone | High probability that the model is inappropriate and unlikely to reject if appropriate. It is defined by having the level of significance less than 0.1% or, in other words, the cumulative probability being true the null hypothesis is greater than or equal to 99.99%. It corresponds to a number of exceptions greater or equal than ten.
|
Having at least aone-year historical series of both results and risk estimates on a daily basis is advisable to perform this test.
The used criterion perfectly adapts to the supervisory authorities’ priority, which is avoiding situations where excessive risks for which the entity is not prepared would jeopardise its
| 150 |
Table of Contents
survival. However, the use of risk measurements as a tool for managing positions entails a concern that the risk measurements are adjusted to the real risk from both sides: there is concern not only that the risk is being underestimated, but also that it may be overestimating.
At the close of December 31, 2018, the model is in the green zone of acceptance of the model.
Backtesting results
Regulatory backtesting is comprised of two types: Hypothetical Backtesting and Actual Backtesting:
| ● | Hypothetical Backtesting is defined as the contrast of the Hypothetical P&L on the estimated VaR, the day before the performance of said result. Actual Backtesting is defined as the contrast with the Actual P&L on the same estimated VaR, the day before the performance of said result. |
| ● | Actual Backtesting was implemented and entered into force on January 1, 2013, as a result of the transposition in the national legal order through the CBE 4/2011 of November 30, of the CRD III that introduces Basel 2.5 in the European Union. The results that are used for the construction of both types of Backtesting are based on the actual results of the management tools. |
According to Article 369 of the CRB of the ECB, the P&L used in Backtesting should have a sufficient level of granularity in order to be shown at the“top-of-house” level, differentiating between Hypothetical and Actual P&L. In addition to the above, the historical Backtesting series will include a minimum of one year.
Actual P&L
The Actual P&L contains the complete management results, including the intraday operation and the daily andnon-daily valuation adjustments, discounting the results of the franchises and commissions of each day of each table.
The valuation functions and the parameters of the valuation models used in the calculation of the Actual P&L are the same as those used in the calculation of the Economic P&L.
At the close of December 31, 2018, the actual negative P&L of May/29/2018 exceeded the VaR within the last 250top-of-house level observations in BBVA S.A., thus presenting an Exception in the BBVA S.A Actual Backtesting.
At the close of December 31, 2018, the actual negative P&L of Oct/04/2018 exceeded the VaR within the last 250 observations at thetop-of-house level at BANCOMER, thus presenting an Exception in the Actual BANCOMER Backtesting.
Hypothetical P&L
The Hypothetical P&L contains the management results without the P&L of the daily activity, namely, excluding intraday operations, premiums, and commissions. The data is provided by the management systems and are broken down by table, in adherence with the Volcker Rule on table distribution.
The valuation functions and the parameters assigned to the valuation models used in the calculation of the Hypothetical P&L are the same as those used in the calculation of the Actual P & L.
The P&L figures used in both Backtesting types exclude Credit Valuation Adjustments (CVA), Debt Valuation Adjustments (DVA) and Additional Valuation Adjustments (AVA). As well as any change in value resulting from migrations from rating to default, except those
| 151 |
Table of Contents
reflected in prices by the market itself, since the changes in value due to migration from rating to default are included in the Counterparty Credit Risk metrics.
At the close of December 31, 2018, the Hypothetical P&L negative of May/29/2018 exceeded the VaR within the last 250top-of-house level observations in BBVA SA, thereby presenting an Exception in the BBVA S.A. Hypothetical Backtesting.
At the close of December 31, 2018, the Hypothetical P&L negative of Oct/04/2018 exceeded the VaR within the last 250 observations at thetop-of-house level in BBVA BANCOMER, thus presenting an Exception in the BBVA BANCOMER Hypothetical Backtesting.
Backtesting perimeter and internal model exceptions
The calculation scope of VaR and P&L (Hypothetical and Actual) is limited to the totality of the Trading Book portfolios of the Global Markets Internal Model of BBVA SA and BBVA Bancomer.
All the positions belonging to the Banking Book, the portfolios under the Standard Model and the trading activity with Hedge Funds (this activity was excluded from the Internal Model in its original approval) are thus excluded from this scope of application.
It is considered that there is an exception at the Top of House level, where the following two circumstances are present in the same internal model and date:
| · | The Hypothetical P&L and/or the Actual P&L are negative |
| · | With an amount equal to or greater than the maximum between VaR without smoothing and VaR with smoothing as calculated on the previous day |
For the purposes of computing the number of exceptions of the Regulatory Backtesting, only exceptions will be taken into account within a moving window of 250 consecutive Business Days at the Top of House level in each respective internal model.
At the close of December 31, 2018, there is an exception in Actual Backtesting and in Hypothetical Backtesting in the last 250 BBVA S.A. observations.
At the close of December 31, 2018, there is an exception in Actual Backtesting and in Hypothetical Backtesting in the last 250 BBVA BANCOMER observations.
CHART 21: Trading Book. Validation of the Market Risk Measurement model for BBVA S.A. Hypothetical backtesting (EU - MR4)
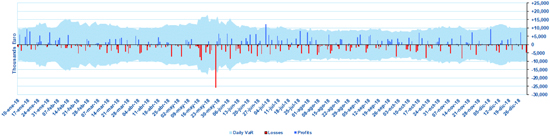
| 152 |
Table of Contents
CHART 22: Trading Book. Validation of the Market Risk Measurement model for BBVA S.A. Real backtesting (EU - MR4)
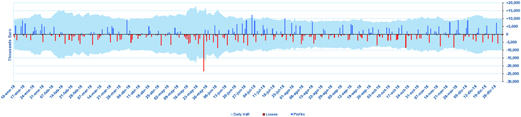
CHART 23: Trading Book. Validation of the Market Risk Measurement model for BBVA Bancomer. Hypothetical backtesting (EU - MR4)
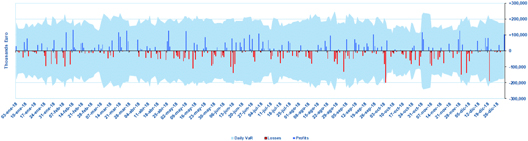
CHART 24: Trading Book. Validation of the Market Risk Measurement model for BBVA Bancomer. Real backtesting (EU - MR4)
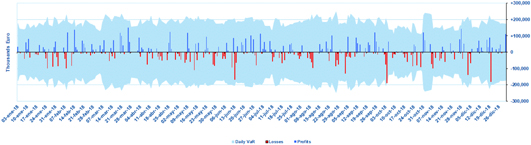
| 153 |
Table of Contents
| 3.3.4.3. | Characteristics of the risk management system |
The Group has a risk management system in place which is appropriate for the volume of risks managed, complying with the functions set out in the Corporate Policy on Market Risks in Market Activities.
The risk units must have:
| · | A suitable organization (means, resources and experience) in line with the nature and complexity of the business. |
| · | Segregation of functions and independence in decision-making. |
| · | Performance under integrity and good governance principles, driving the best practices in the industry and complying with the rules, both internal (policies, procedures) and external (regulation, supervision, guidelines). |
| · | The existence of channels for communication with the relevant corporate bodies at local level according to their corporate governance system, as well as with the Corporate Area. |
| · | All market risks existing in the business units that carry out their activity in markets must be adequately identified, measured and assessed, and procedures must be in place for their control and mitigation. |
| · | The Global Market Risk Unit (GMRU), as the unit responsible for managing market risk at Group level, must promote the use of objective and uniform metrics for measuring the different types of risks. |
| 154 |
Table of Contents
| 3.4. | Structural risk in the equity portfolio |
| 3.4.1. | Scope and nature of the structural risk in the equity portfolio measurement and reporting systems |
The BBVA Group’s exposure to structural risk in the equity portfolio basically results from the stakes held in industrial and financial companies, with medium/long-term investment horizons. It includes staked held that the Group consolidates, although their variations in value have no immediate effect on equity in this case.
This exposure is adjusted to the net positions held in derivatives on those positions as underlying assets, which are used to modulate portfolio sensitivity to potential price variations.
The GRM corporate area acts as an independent unit that is responsible for monitoring and analysing risks, promoting the integration of risk metrics into management and providing tools that can anticipate potential deviations from targets.
It also monitors the level of compliance with the limits set by the Executive Committee. It reports on these levels regularly to the Global Risk Management Committee (GRMC), the Board’s Risk Committee and the Executive Committee, particularly in the case of overruns of the limits set.
The mechanisms of risk control and limitation hinge on the key aspects of exposure, earnings and economic capital. The structural equity risk management metrics designed by GRM according to the corporate model contribute to effective risk monitoring by estimating the sensitivity figures and the capital necessary to cover possible unexpected losses due to the variations in the value of the companies making up the Group’s equity portfolio, at a confidence level that corresponds to the institution’s target rating, and taking into account the liquidity of the positions and the statistical behaviour of the assets under consideration.
To carry out a morein-depth analysis, stress tests and sensitivity analyses are carried out from time to time against different simulated scenarios, using both past crisis situations and forecasts by BBVA Research as the base. This checks that the risks are limited and that the tolerance levels set for the Group are not endangered.
On a quarterly basis, backtesting is carried out on the risk measurement model used.
| 3.4.2. | Differentiation between portfolios held for sale and those held for strategic purposes |
| 3.4.2.1. | Portfolios held for sale |
The portfolio held for sale is accounted, mainly, in the entry “Financial assets at fair value through other comprehensive income”. In the case of capital instruments, this portfolio will include the capital instruments of institutions that are not strategic, which are not classified as the Group’s subsidiaries, associates, or jointly controlled businesses, and that have not been included in the fair value through profit or loss category.
The financial instruments contained in theavailable-for-sale financial assets portfolio are valued at their fair value both in their initial entry and on subsequent valuations.
The changes in value are recorded in equity unless objective evidence exists that the fall in value is due to asset impairment, in which case the amounts recorded will bewritten-off from equity and moved directly to the income statement.
| 155 |
Table of Contents
| 3.4.2.2. | Portfolios held for strategic purposes |
The portfolio held for strategic purposes is included for accounting purposes under the heading of Investments in joint ventures and associates. An investment in capital instruments is considered strategic when it has been made with the intent of setting up or maintaining a long-term operating relationship with the subsidiary, although there is no significant influence on it, if at least one of the following situations is in place:
| · | Representation on the Board of Directors or equivalent management body in the subsidiary. |
| · | Participation in the policy setting process, including those related to dividends and other payouts. |
| · | The existence of significant transactions between the investing institution and the subsidiary. |
| · | The exchange of senior management staff. |
| · | The supply of expert information of an essential nature. |
| 3.4.3. | Book value and exposure of equity investments and capital instruments contained in above portfolios |
The accompanying table shows the book value, exposure and RWAs of held to collect and sale portfolios and portfolios held for strategic purposes:
TABLE 62: Breakdown of book value, EAD and RWAs of equity investments and capital instruments
Million Euros
| Equity investments and capital instruments (1) | ||||||||||||||||||||||||||||||||
| 2018 | 2017 | |||||||||||||||||||||||||||||||
| Book value | OE | EAD | RWAs | Book value | OE | EAD | RWAs | |||||||||||||||||||||||||
| Portfolio available for sale | 2,850 | 2,850 | 2,850 | 4,910 | 3,084 | 3,084 | 3,084 | 5,779 | ||||||||||||||||||||||||
| Portfolio held for strategic purposes | 3,972 | 3,972 | 3,972 | 10,336 | 4,715 | 4,715 | 4,715 | 10,996 | ||||||||||||||||||||||||
| Total | 6,822 | 6,822 | 6,822 | 15,246 | 7,798 | 7,798 | 7,798 | 16,775 | ||||||||||||||||||||||||
(1) The ‘Other financial assets with changes in P&L’ portfolio has no balance.
The accompanying table shows the types, nature and amounts of the original exposures in equity investments listed or unlisted on a stock market, with an item differentiating sufficiently diversified portfolios and other unlisted instruments:
TABLE 63: Exposure in equity investments and capital instruments
Million Euros
| Nature of Exposure(1) | ||||||||||||||||
| 2018 | 2017 | |||||||||||||||
| Non-derivatives | Derivatives | Non-derivatives | Derivatives | |||||||||||||
| Exchange-traded instruments | 2.850 | 231 | 2.403 | 428 | ||||||||||||
| Non-exchange traded instruments | 3.741 | – | 4.967 | – | ||||||||||||
| Included in sufficiently diversified portfolios | 3.741 | – | 4.967 | – | ||||||||||||
| Other instruments | – | – | – | – | ||||||||||||
| Total | 6.590 | 231 | 7.370 | 428 | ||||||||||||
(1) Depending on their nature, equity instruments not included in Trading Book Activity will be separated into derivatives andnon-derivatives. The amount shown refers to original exposure, i.e. gross exposure of value corrections through asset impairment and provisions, before applying risk mitigation techniques.
| 156 |
Table of Contents
| 3.4.4. | Risk-weighted assets of equity investments and capital instruments |
Below is a breakdown of the RWAs by applicable method corresponding to equity investments and capital instruments as of December 31, 2018 and December 31, 2017:
TABLE 64: Breakdown of RWAs, equity investments and capital instruments by applicable approach
Million Euros
| RWA’s | ||||||||||||||||||
| Concept | Internal Models | Simple method | PD/LGD method | Total | ||||||||||||||
| 12/31/2018 | Portfolio held for sale | 1,172 | 1,395 | 2,343 | 4,910 | |||||||||||||
| Portfolio held for strategic | – | 6,691 | 3,646 | 10,336 | ||||||||||||||
| 12/31/2017 | Portfolio held for sale | 2,261 | 924 | 2,594 | 5,779 | |||||||||||||
| Portfolio held for strategic | – | 8,637 | 2,359 | 10,996 | ||||||||||||||
Described below are the trend and main changes in capital use for the positions subject to Equity Credit Risk as of December 31, 2018:
TABLE 65: Variation in RWAs for Equity Risk
| Million Euros | ||||||
| Equity Risk | ||||||
| RWAs as of December 31, 2017 | 16,775 | |||||
Effects | Asset size | (2,034) | ||||
| Acquisitions and disposals | 455 | |||||
| Foreign exchange movements | 50 | |||||
| Other | – | |||||
| RWAs as of | December 31, 2018 | 15,246 | ||||
During 2018, BBVA Group’s equity risk-weighted assets have reduced by EUR 1.53 billion compared to December 2017 (reduction of 9.1%).
This variation can essentially be explained by the reduced exposure in insurance companies as a result of the distribution of benefits through dividends incurred by these companies over the course of the year. In this respect, it should be taken into account that investments in the Group’s insurance companies consolidate within the prudential perimeter using the equity method.
Apart from that, the Group has continued to manage its portfolio of equity holdings with the sale of its stakes in Merlin Properties Socimi, S.A., Testa Residencial Socimi S.A.U. and Chilean companies that the Group maintained through BBVA Chile, which, jointly, has resulted in a reduction of approximately EUR 1.70 billion risk-weighted assets.
In addition, within the framework of the transfer of the Group’s real estate business in Spain to Cerberus Capital Management, L.P., BBVA maintains 20% of the capital of the joint company Divarian Propiedad S.A., which represents an increase in risk-weighted assets of approximately EUR 2.20 billion (see section 1.1.4).
| 3.4.5. | Profit and loss and adjustments for valuation of equity investments and capital instruments |
Below is a breakdown as of December 31, 2018 and December 31, 2017 of the gains and losses from the sale and settlement of shares and equity instruments, and by type of portfolio applicable, as well as the valuation adjustments for the latent revaluation of shares and equity instruments.
| 157 |
Table of Contents
TABLE 66: Realized profit and loss from sales and settlements of equity investments and capital instruments
Million Euros
| 2018 | 2017 | |||||||||||||||||||||||
| Losses | Gains | Net | Losses | Gains | Net | |||||||||||||||||||
| Portfolio available for sale | 1,796 | 1,560 | (236) | 758 | 1,601 | 843 | ||||||||||||||||||
| Portfolio held for strategic purposes | 23 | 35 | 13 | 32 | 35 | 3 | ||||||||||||||||||
TABLE 67: Valuation adjustments for latent revaluation of equity investments and capital instruments
| Million Euros | ||||
| Valuation adjustments for latent revaluation | ||||
| FVOCI | ||||
| Balance Sheet Dec 2017 | 85 | |||
| Transactions | (240) | |||
| Balance Sheet Dec 2018 | (155) | |||
| 158 |
Table of Contents
| 3.5. | Structural exchange-rate risk |
| 3.5.1. | Scope and nature of the exchange-rate risk measurement and reporting systems |
In the BBVA Group, structural exchange-rate risk arises mainly from the consolidation of holdings in subsidiaries with functional currencies other than the euro. Its management is centralized in order to optimize the joint handling of permanent foreign currency exposures, taking into account the diversification.
The GRM corporate area acts as an independent unit that is responsible for monitoring and analysing risks, promoting the integration of risk metrics into management and providing tools that can anticipate potential deviations from targets.
It also monitors the level of compliance of established risk limits, and reports regularly to the Global Risk Management Committee (GRMC), the Board of Directors’ Risk Committee and the Executive Committee, particularly in the case of excess or tension in the levels of risk assumed.
The corporate unit of ALM Global Management (Finance), through ALCO, designs and executes the hedging strategies with the main purpose of controlling the potential negative effects of exchange-rate fluctuations on capital ratios, as well as assuring the equivalent value in euros of the foreign-currency earnings of the Group’s subsidiaries, considering the transactions according to market expectations and their costs.
The risk monitoring metrics included in the system of limits are integrated into management and supplemented with additional assessment indicators. Within the corporate scope, they are based on probabilistic metrics that measure the maximum deviation in capital, CET1 (“Common Equity Tier 1”) ratio, and attributed profit. Probabilistic metrics enable an estimation of the overall impact of the exposure on the various currencies, considering the broad variability in listed currencies and their correlations.
The suitability of these risk assessment metrics is reviewed on a regular basis through backtesting exercises. A structural exchange-rate risk control is supplemented with an analysis of scenarios and stress with a view to proactively identifying possible future threats to the future compliance of risk appetite levels to enable the adoption, as the case may be, of the pertinent preventive actions. The scenarios are based on historical and risk model-simulated situations, and the risk scenarios provided by BBVA Research.
The level of exposure to structural exchange-rate risk in the Group has remained relatively stable since the close of 2017. The hedging policy aims to maintain the sensitivity of the capital ratio and the Group’s earnings to changes in the exchange rates of emerging currencies, and is focused mainly on the Mexican peso and Turkish lira. The risk mitigation level of the capital adequacy ratio by the carrying amount of BBVA Group’s holdings in these currencies has remained at around 70%, and the hedging for management purposes of emerging-currency earnings in 2018 amounted to 82%, focused on the Mexican peso and Turkish lira. At the close of the year, the sensitivity of the CET1 ratio to a 1% change in the euro’s exchange rate against each foreign currency is: US dollar: +1.1 bps; Mexican peso-0.2 bps; Turkish lira-0.2 bps; remaining currencies:-0.2 bps.
FX risk under the standardized model has been reduced by EUR 2.307 billion RWA, mainly due to the updating of the methodology for calculating capital requirements, once it has received authorization from the European Central Bank.
| 159 |
Table of Contents
| 3.6. | Interest-Rate Risk |
| 3.6.1 | Scope and nature of the interest-rate risk measurement and reporting systems |
The aim of managing balance-sheet interest rate risk is to maintain BBVA Group’s exposure to variations in interest rates at levels in line with its strategy and target risk profile.
Movements in interest rates lead to changes in a bank’s net interest income and book value, which constitute a key source of asset and liability interest-rate risk.
The extent of these impacts will depend on the bank’s exposure to changes in interest rates. This exposure is mainly the result of the time difference between the different maturity and repricing terms of the assets and liabilities on the banking book and theoff- balance-sheet positions.
A financial institution’s exposure to adverse changes in market rates is a risk inherent in the banking business, while at the same time representing an opportunity to generate value. Therefore, the structural interest rate risk should be managed effectively and have a reasonable relation both to the bank’s capital base and the expected economic result. This function is handled by the Global ALM unit, within the Financial Management area. Through the Asset and Liability Committee (ALCO) it aims to guarantee the generation of recurrent earnings and preserve the entity’s solvency.
In pursuance of this, the ALCO develops strategies based on its market expectations, within the risk profile defined by BBVA Group’s management bodies and balance the expected results and the level of risk assumed.
BBVA has a transfer pricing system, which centralizes the Bank’s interest-rate risk on ALCO’s books and is designed to facilitate proper balance-sheet risk management.
The corporate GRM area is responsible for controlling and monitoring structural interest- rate risk, acting as an independent unit to guarantee that the risk management and control functions are properly segregated. This policy is in line with the Basel Committee on Banking Supervision recommendations. It constructs the structural interest-rate risk measurements used by the Group’s management, as well as designing models and measurement systems and developing monitoring, information and control systems. At the same time, the Global Risk Management Committee (GRMC) carries out the function of risk control and analysis reporting to the main governing bodies, such as the Executive Committee and the Board of Director’s Risk Committee.
BBVA’s structural interest-rate risk management procedure has a sophisticated set of metrics and tools that enable its risk profile to be monitored precisely. The model is based on a series of deeply analysed assumptions designed to characterize the balance sheet more accurately. Interest-rate risk measurement includes probabilistic metrics as well as calculations of the sensitivity to different parallel shifts in the market interest-rate curves.
There is regular measurement of the Entity’s banking book income at risk (IaR) and economic capital, defined as the maximum adverse deviations in net interest income and economic value, respectively, for a particular confidence level and time horizon.
These deviations are obtained by applying a simulation model of interest-rate curves that takes into account other sources of risks apart from directional movements, such as changes in the slope and curvature, and also the diversification between currencies and business units.
The risk measurement model is supplemented by analysis of specific scenarios and stress tests. Stress tests have taken on particular importance in recent years. The analysis of extreme scenarios has been enhanced for this purpose in the event of a possible breakthrough in both current interest-rate levels and historical correlations and volatility. At
| 160 |
Table of Contents
the same time, the evaluation of scenarios by the Economic Research Department has been maintained.
| 3.6.2 | Nature of interest rate risk and key hypotheses |
The Group’s exposure to variations in market interest rates is one of the main financial risks linked to the pursuit of its banking operations.
Repricing risk, which stems from the difference between the periods for reviewing interest rates or the maturity of investment transactionsvis-à-vis their financing, constitutes the basic interest-rate risk to be considered. Nonetheless, other risks such as the exposure to changes in the slope and shape of interest rate curves, the indexation to different interest rate curves and the risk of optionality present in certain banking transactions are also taken into consideration by risk control mechanisms.
The sensitivity measurements of the Group’s net interest income and economic value in the face of variations in market interest rates are supplemented with forecast and stress scenarios and risk measurements using curve simulation processes, thereby allowing an assessment of the impact of changes on the slope, curvature and parallel movements of varying magnitude.
Especially important in the measurement of structural interest rate risk, which is carried out every month, is the establishment of hypotheses on the changes and performance of certain items on the balance sheet, especially those involving products with no explicit or contractual due date.
The hypotheses that characterize these balance sheet items, which differ from their contractual conditions, must be understandable for the areas and bodies involved in risk management and control, and must be duly justified and documented. The modelling of these assumptions must be conceptually reasonable and consistent with the evidence based on historical experience.
The most significant of these hypotheses are those established on current and savings accounts, since they largely condition risk levels given the volume they represent within the liabilities of the Group’s financial institutions.
A prior step to the study of these liabilities necessarily involves “account segmentation.” To do so, the balances on the balance sheet are broken down by products, analysed separately and subsequently grouped according to their common features, especially with regard to the type of customer and the criteria on the remuneration of each account, independently of the accounting standards on grouping.
A first stage involves analysing the relationship between the trends in market interest rates and the interest rates of those accounts with no contractual due date. This relationship is established by the models which allow a determination of what the percentage impact of the variations in market interest rates is on the account’s remuneration and with what delay it occurs, for each type of account and customer and according to the interest-rate levels.
Subsequently, an analysis is made of the changes over time of the balances in each category in order to establish their overall trend against the seasonal variations in the balance. It is assumed that these seasonal variations mature in the very short term, whereas the trend in the balance is assigned a long-term maturity. This prevents oscillations in the level of risks caused by momentary variations in balances, thus favouring the stability of balance-sheet management. This breakdown of amounts is made by the regressions that best adjust historical changes to the balance over time.
Group companies have opted for different procedures to determine the maturity of transactional liabilities, taking into account the varying nature of markets and the availability
| 161 |
Table of Contents
of historical data. In the corporate model, a descriptive analysis of the data is used to calculate the average contractual period of the accounts and the conditioned probability of maturity for the life cycle of the product. A theoretical distribution of maturities of the trend balance is then estimated for each of the products, based on the average life of the stock and the conditioned probability.
A further aspect to be considered in the model’s hypotheses is the analysis of the prepayments (implicit optionality) associated with certain positions, especially with the loan-book, mortgage portfolios and customer deposits. Changes in market interest rates, together with other variables, may create incentives for the Bank’s customers to cancel loans or deposits early, thus modifying the future behaviour of the balances on the balance sheet with respect to forecasts, in accordance with the contractual calendar of maturities.
The analysis of historical information relating to prepayments, and to other variables such as interest rates, allows an estimate of future repayments and their behaviour linked to these variables.
The approval and updating of structural interest risk behaviour models are subject to corporate governance under the scope of GRM-Analytics. Along these lines, they must be properly inventoried and catalogued, and comply with the requirements for their development, updating and management of the changes included in the internal procedures. Likewise, they are subject to the corresponding internal validations based on their relevance and the established monitoring requirements.
| 3.6.3 | Variations in interest rates |
The following tables present the average levels of interest-rate risk in terms of the sensitivity of net interest income and economic value for the Group’s main financial institutions in 2018.
TABLE 68: Variations in interest rates. Impact on net interest income and economic value
| Impact on net interest income (1) | Impact on economic value (2) | |||||||||||||||
| Interest rate sensitivity analyses at December 2018 | Increase of 100 basis points | Decrease of 100 basis points | Increase of 100 basis points | Decrease of 100 basis points | ||||||||||||
| Europe (3) | + (5% – 10%) | – (5% – 10%) | + (0% – 5%) | – (0% – 5%) | ||||||||||||
| Mexico | + (0% – 5%) | – (0% – 5%) | + (0% – 5%) | – (0% – 5%) | ||||||||||||
| USA | + (5% – 10%) | – (5% – 10%) | – (5% – 10%) | + (0% – 5%) | ||||||||||||
| Turkey | + (0% – 5%) | – (0% – 5%) | – (0% – 5%) | + (0% – 5%) | ||||||||||||
| South America | + (0% – 5%) | – (0% – 5%) | – (0% – 5%) | + (0% – 5%) | ||||||||||||
| BBVA Group | + (0% – 5%) | – (0% – 5%) | – (0% – 5%) | – (0% – 5%) | ||||||||||||
(1) Percentage of the projected “1 year” interest margin of each unit.
(2) Percentage of Core Capital per unit.
(3) In Europe, it is considered that rate will move further downward to levels more negative than the current ones.
The BBVA Group’s balance sheet hold a positive and moderate exposure to rise in interest rates caused primarily by the euro and USD balance sheets. However, in Europe, the decline in rates is still bounded as a result of interest rate levels very close or even below zero, thus preventing the occurrence of extremely adverse scenarios.
| 162 |
Table of Contents
| 3.7 | Liquidity Risk |
| 3.7.1 | Liquidity and Funding Strategy and Planning |
BBVA Group is a multinational financial institution whose business is focused mainly on retail and commercial banking activities. In addition to the retail business model, which forms the core of its business, the Group engages in corporate and investment banking, through the global CIB (Corporate & Investment Banking) division.
Liquidity and Funding planning is drawn up as part of the strategic processes for the Group’s budgetary and business planning, to ensure recurring growth of the banking business with suitable maturities and costs over a wide and diverse range of instruments.
The Group’s Funding and Liquidity strategy is based on the following pillars:
| · | The principle of the funding self-sufficiency of its subsidiaries, meaning that each of the Liquidity Management Units (LMUs) must cover its funding needs independently on the markets where it operates. This avoids possible contagion due to a crisis affecting one or more of the Group’s LMUs. |
| · | Stable customer deposits as the main source of funding in all the LMUs, in accordance with the Group’s business model. |
| · | Diversification of the sources of wholesale funding, in terms of maturity, market, instruments, counterparties and currencies, with recurring access to the markets. |
| · | Compliance with regulatory requirements, ensuring the availability of ample liquidity buffers, as well as sufficient instruments as required by regulations with the capacity to absorb losses. |
| · | Compliance with the internal Liquidity Risk and Funding metrics, while adhering to the Risk Appetite level established for each LMU at any time. |
Liquidity and funding risk management aims to ensure that in the short term a bank does not have any difficulties in meeting its payment commitments in due time and form, and that it does not have to make use of funding under burdensome terms, or conditions that deteriorate its image or reputation.
In the medium term the aim is to ensure that the Group’s financing structure is ideal and that it is moving in the right direction with respect to the economic situation, the markets and regulatory changes.
This management of structural and liquidity funding is based on the principle of financial self-sufficiency of the entities that make it up. This approach helps prevent and limit
liquidity risk by reducing the Group’s vulnerability during periods of high risk. This
decentralized management prevents possible contagion from a crisis affecting only one or a few Group entities, which must act independently to meet their liquidity requirements in the markets where they operate.
As one aspect of this strategy, BBVA Group is organized into eleven LMUs composed of the parent and the banking subsidiaries in each geographical area, plus their dependent branches.
In addition, the policy for managing liquidity and funding risk is also based on the model’s robustness and on the planning and integration of risk management into the budgeting process of each LMU, according to the appetite for funding risk it decides to assume in its business.
| 163 |
Table of Contents
| 3.7.2 | Governance and monitoring |
The responsibility for Liquidity and Funding management in normal business activity lies with the Finance area as a first line of defense in managing the risks inherent to this activity, in accordance with the principles established by the European Banking Authority EBA and in line with the most demanding standards, policies, procedures and controls in the framework established by the governing bodies. The Finance department, through the Balance-Sheet Management area, plans and executes the funding of the structural long-term gap of each LMU and proposes to the Assets and Liabilities Committee (ALCO) the actions to be taken on this matter, in accordance with the policies and limits established by the Executive Committee (EC).
The corporate Global Risk Management (GRM) area is as a second line of defense responsible for ensuring that liquidity and funding risk in the Group is managed according to the strategy approved by the Board of Directors. It is also responsible for identifying, measuring, monitoring and controlling this risk, reporting to the proper governing bodies, and providing the Group’s vision from the risk perspective.
To carry out this work adequately, the risk function in the Group has been set up as a single, global function that is independent of the management areas. This guarantees the separation of functions between the Liquidity and Funding Risk management area (Balance-Sheet Management) and the area that measures and controls risk (GRM-Structural Risks).
In addition, the Group has an Internal Risk Control unit that conducts an independent review of Liquidity and Funding Risk control and management, independently of the functions performed in this area by Internal Audit.
As a third line of defense in the Group’s internal control model, Internal Audit is in charge of reviewing specific controls and processes in accordance with an annual work plan.
Finance & Accounting (A&S), in its regulatory liquidity reporting function, coordinates the processes necessary to meet any requirements that may be generated at corporate and regulatory level, with the areas responsible for this reporting in each LMU, thereby ensuring the integrity of the information supplied.
As the core management element, the Group’s liquidity and funding risk objectives are determined through the Liquidity Coverage Ratio (LCR) and through theLoan-to-Stable Customer Deposits (LtSCD) ratio.
The LCR ratio is a regulatory metric that aims to guarantee the resilience of entities in a scenario of liquidity tension within a time horizon of 30 days. Within its risk appetite framework and system of limits and alerts, BBVA has established a required LCR compliance level for the entire Group and for each individual LMU. The required internal levels aim to comply efficiently and sufficiently in advance with the implementation of the 2018 regulatory requirement at a level above 100%.
The LtSCD ratio measures the relationship between net lending and stable customer funds. The aim is to preserve a stable funding structure in the medium term for each LMU making up BBVA Group, taking into account that maintaining an adequate volume of stable customer funds is key to achieving a sound liquidity profile. These stable resources in each LMU are calculated by analysing the performance of the balances in the different customer segments identified as eligible to provide stability to the funding structure; prioritizing customer loyalty and applying greater haircuts to the funding lines for less stable customers. In order to establish the target (maximum) levels of LtSCD in each LMU and provide an optimal funding structure reference in terms of risk appetite, the corporate Structural Risks unit of GRM identifies and assesses the economic and financial variables that condition the funding structures in the different geographical areas.
The second core element in liquidity and funding risk management aims to achieve a proper diversification of the funding structure, avoiding excessive reliance on short-term
| 164 |
Table of Contents
funding by establishing a maximum level for the short-term funds raised, including both wholesale funding and customer funds. The residual maturity profile of long-term wholesale funding has no significant concentrations, which matches the schedule of planned issues to the best possible financial conditions of markets, as shown in the chart below. Finally, concentration risk is monitored at LMU level, with the aim of ensuring a correct diversification of both the counterparty and type of instrument.
The third core element is promoting the short-term resistance of the liquidity risk profile, guaranteeing that each UGL has sufficient collateral to deal with the risk of the close of wholesale markets. Basic capacity is the short-term liquidity risk management and control metric that is defined as the relationship between the available explicit assets and the maturities of wholesale liabilities and volatile funds, at different terms, with special relevance being given to30-day maturities.
Stress tests are carried out as a fundamental element of the liquidity and funding risk monitoring scheme. They enable deviations from the liquidity targets and limits set in the appetite to be anticipated, and establish tolerance ranges in the different management areas. They also play a major role in the design of the Liquidity Contingency Plan and the definition of specific measures to be adopted to rectify the risk profile if necessary.
For each scenario, it is checked whether the LMU has a sufficient stock of liquid assets to guarantee its capacity to meet the liquidity commitments/outflows in the different periods analysed. The analysis considers four scenarios: one central and three crisis-related (systemic crisis; unexpected internal crisis with a considerable rating downgrade and/or affecting the ability to issue in wholesale markets and the perception of business risk by the banking intermediaries and the Entity’s customers; and a mixed scenario, as a combination of the two aforementioned scenarios). Each scenario considers the following factors: existing market liquidity, customer behaviour and sources of funding, the impact of rating downgrades, market values of liquid assets and collateral, and the interaction between liquidity requirements and the development of the LMU’s asset quality.
Together with the results of the stress tests and the risk metrics, the early warning indicators play an important role within the corporate model and the Liquidity Contingency Plan. They are mainly indicators of the funding structure, in relation to asset encumbrance, counterparty concentration, flights of customer deposits, unexpected use of credit facilities, and of the market, which help anticipate possible risks and capture market expectations.
In order to implement this principle of anticipation, limits are set on an annual basis for the main management metrics that form part of the budgeting process for liquidity balance and finance. This framework of limits contributes to the planning of the joint future performance of:
| ○ | The loan book, considering the types of assets and their degree of liquidity, as well as their validity as collateral in collateralized funding. |
| ○ | Stable customer funds, based on the application of a methodology for establishing which segments and customer balances are considered to be stable or volatile funds based on the principle of sustainability and recurrence of these funds. |
| ○ | Projection of the credit gap, in order to require a degree of self-funding that is defined in terms of the difference between the loan-book and stable customer funds. |
| ○ | Incorporating the planning of securities portfolios into the banking book, which include both fixed-interest and equity securities, and are classified asavailable-for-sale orheld-to-maturity portfolios, and additionally on trading portfolios. |
| ○ | The structural gap projection, as a result of assessing the funding needs generated both from the credit gap and by the securities portfolio in the banking book, together with the rest ofon-balance-sheet wholesale funding needs, excluding |
| 165 |
Table of Contents
trading portfolios. This gap therefore needs to be funded with customer funds that are not considered stable or on wholesale markets.
As a result of these funding needs, BBVA Group plans the target wholesale funding structure according to the tolerance set in each LMU target.
Thus, once the structural gap has been identified and after resorting to wholesale markets, the amount and composition of wholesale structural funding is established in subsequent years, in order to maintain a diversified funding mix and guarantee that there is not a high reliance on short-term funding (short-term wholesale funding plus volatile customer funds).
In practice, the execution of the principles of planning and self-funding at the different LMUs results in the Group’s main source of funding being customer deposits, which consist mainly of demand deposits, savings deposits and time deposits.
As sources of funding, customer deposits are complemented by access to the interbank market and the domestic and international capital markets in order to address additional liquidity requirements, implementing domestic and international programs for the issuance of commercial paper and medium and long-term debt.
The process of analysis and assessment of the liquidity and funding situation and of the inherent risks is a process carried out on an ongoing basis in BBVA Group, with the participation of all the Group areas involved in liquidity and funding risk management. This process is carried out at both local and corporate level. It is incorporated into the decision-making process for liquidity and funding management, with integration between the risk appetite strategy and establishment and the planning process, the funding plan and the limits scheme.
A statement of the level of appropriateness of the liquidity risk management mechanisms is included as part of the Internal Liquidity Adequacy Assessment Process (ILAAP) approved by the Board of Directors in April 2018:
“From the self-assessment conducted as part of this process, it can be concluded that the liquidity and funding management model is robust, with amedium-low liquidity risk profile and no significant gaps that could prompt a need to take measures or utilize liquid resources other than those that are already considered within the approved Risk Appetite Framework for 2018 and within the liquidity and funding plan.”
| 3.7.3 | Liquidity and funding performance in 2018 |
During 2018, BBVA Group has maintained a robust and dynamic funding structure with a clearly retail nature, where customer resources represent the main source of funding.
Thus, the performance of the indicators show that the robustness of the funding structure remained steady during 2018, in the sense that all LMUs held self-funding levels with stable customer resources above the requirements.
TABLE 69:Loan-to-Stable Customer Deposits (LtSCD)
| LtSCD by LMU | ||||||||
| December 2018 | December 2017 | |||||||
| Group (Weighted average) | 106% | 110% | ||||||
| Eurozone | 101% | 108% | ||||||
| Bancomer | 114% | 109% | ||||||
| Compass | 119% | 109% | ||||||
| Garanti | 110% | 122% | ||||||
| Other LMUs | 99% | 108% | ||||||
| 166 |
Table of Contents
With respect to LCR, the Group has maintained a liquidity buffer at both consolidated and individual level in 2018. This has maintained the ratio easily above 100%, with the consolidated ratio as of December 2018 standing at 127%.
Although this requirement is only established at Group level and banks in the Eurozone, the minimum level required is easily exceeded in all the subsidiaries. It should be noted that the construction of the Consolidated LCR does not assume the transfer of liquidity between the subsidiaries, so no excess of liquidity is transferred from these entities abroad to the consolidated ratio. If the impact of these highly liquid assets is considered to be excluded, the LCR would be 154%, or +27% above the required level.
TABLE 70: LCR main LMUs
| Million Euros | ||||||||
| LCR main LMU | December 2018 | December 2017 | ||||||
| Group (Weighted average) | 127% | 128% | ||||||
| Eurozone | 145% | 151% | ||||||
| Bancomer | 154% | 148% | ||||||
| Compass(1) | 143% | 144% | ||||||
| Garanti | 209% | 134% | ||||||
| Other LMU | Broadly>100% | Broadly>100% | ||||||
(1) Calculated according local regulation (Fed Modified LCR).
In addition, the stress tests conducted on a regular basis reveal that BBVA maintains a sufficient buffer of liquid assets (stress buffer) to deal with the estimated liquidity outflows in a scenario resulting from the combination of a systemic crisis and an unexpected internal crisis, during a period of longer than 3 months in general for the different LMUs, including in the scenario a significant downgrade of the Bank’s rating by up to three notches.
Below is a matrix of residual maturities by contractual periods based on the supervisory prudential information as of December 31, 2018:
TABLE 71: Liquidity inflows. Residual maturities by contractual periods
Million Euros
| Demand | Up to 1 Month | 1 to 3 Months | 3 to 6 Months | 6 to 9 Months | 9 to 13 Months | 1 to 2 Years | 2 to 3 Years | 3 to 5 Years | Over 5 Years | Total | ||||||||||||||||||||||||||||||||||
| ASSETS | ||||||||||||||||||||||||||||||||||||||||||||
| Cash, cash balances at central banks and other demand deposits | 9,550 | 40,599 | – | – | – | – | – | – | – | – | 50,149 | |||||||||||||||||||||||||||||||||
| Deposits in credit entities | 801 | 3,211 | 216 | 141 | 83 | 152 | 133 | 178 | 27 | 1,269 | 6,211 | |||||||||||||||||||||||||||||||||
| Deposits in other financial institutions | 1 | 1,408 | 750 | 664 | 647 | 375 | 1,724 | 896 | 1,286 | 2,764 | 10,515 | |||||||||||||||||||||||||||||||||
| Reverse repo, securities borrowing and margin lending | – | 21,266 | 1,655 | 1,158 | 805 | 498 | 205 | 1,352 | 390 | 210 | 27,539 | |||||||||||||||||||||||||||||||||
| Loans and Advances | 132 | 19,825 | 25,939 | 23,265 | 15,347 | 16,433 | 42,100 | 32,336 | 53,386 | 120,571 | 349,334 | |||||||||||||||||||||||||||||||||
| Securities’ portfolio settlement | – | 1,875 | 4,379 | 5,990 | 2,148 | 6,823 | 8,592 | 12,423 | 11,533 | 42,738 | 96,501 | |||||||||||||||||||||||||||||||||
TABLE 72: Liquidity outflows. Residual maturities by contractual periods
Million Euros
| Demand | Up to 1 Month | 1 to 3 Months | 3 to 6 Months | 6 to 9 Months | 9 to 13 Months | 1 to 2 Years | 2 to 3 Years | 3 to 5 Years | Over 5 Years | Total | ||||||||||||||||||||||||||||||||||
| Liabilities | ||||||||||||||||||||||||||||||||||||||||||||
| Wholesale funding | 1 | 2,678 | 1,652 | 2,160 | 2,425 | 2,736 | 7,225 | 8,578 | 16,040 | 26,363 | 69,858 | |||||||||||||||||||||||||||||||||
| Deposits in financial institutions | 7,107 | 5,599 | 751 | 1,992 | 377 | 1,240 | 1,149 | 229 | 196 | 904 | 19,544 | |||||||||||||||||||||||||||||||||
| Deposits in other financial institutions | 10,680 | 4,327 | 1,580 | 458 | 302 | 309 | 781 | 304 | 825 | 1,692 | 21,258 | |||||||||||||||||||||||||||||||||
| Customer deposits | 252,630 | 44,866 | 18,514 | 10,625 | 6,217 | 7,345 | 5,667 | 2,137 | 1,207 | 1,310 | 350,518 | |||||||||||||||||||||||||||||||||
| Security pledge funding | 40 | 46,489 | 2,219 | 2,274 | 114 | 97 | 22,911 | 526 | 218 | 1,627 | 76,515 | |||||||||||||||||||||||||||||||||
| Derivatives (net) | – | (75) | (523) | (68) | (5) | (117) | 498 | (91) | (67) | (392) | (840) | |||||||||||||||||||||||||||||||||
The financing structure shows that the loan portfolio is mostly financed by customer deposits, mostly retail (66%). The demand tranche of outflows mainly contains the current accounts of retail customers whose performance has historically shown high stability and low concentration. On the basis of an annual behavioural analysis carried out at each of the Group entities, this type of account is considered stable in the long term and, for
| 167 |
Table of Contents
liquidity risk purposes, 78% with residual behavioural maturity over a period of more than 5 years.
In the Liquidity Management Unit (LMU) Euro, there is a solid liquidity and financing situation, where activity has continued to generate liquidity through a narrowing of the Credit Gap. In addition, in 2018 the LMU Euro made 3 public issues amounting to€3.5 billion: Senior Non Preferred (SNP) for 5 years for€1.5 billion, inaugural7-year SNP Green Bond for€1.0 billion and AT for€1.0 billion, which has made it possible to obtain long-term financing at favourable price conditions. These public operations have been complemented by a private issue of T2 amounting to $300 million.
In Mexico, the liquidity position continues to be solid despite market volatility. The credit gap widened in 2018 as a result of lower growth in deposits, mainly due to outflows in unprofitable USD. In 2018 BBVA Mexico made a Tier II issue on the international market for USD 1Bn, as well as a local market issue for MXN 7.0 billion in two tranches: 3 and 5 years, the3-year tranche being in Green Bond format (the first Green Bond issued by a private bank).
In the United States, the containment of the cost of liabilities has led to a slight increase in the credit gap. In 2018, BBVA Compass has successfully issued3-year senior debt in the amount of $1.15 billion.
In Turkey we closed the year with an adequate liquidity situation, after a beginning of the second half affected by currency volatility, but with BBVA showing a good performance renewing wholesale funding maturities in 2018. The main operations of the year were two syndicated loans for $2.3 billion, the first green bond for $75 million over 6 years and securitizations of collection rights (DPR) for $375 million over 7 years.
Argentina was affected by market volatility, but with no significant impact on the entity’s liquidity situation. BBVA Frances maintains a solid liquidity position characterized by a high volume of reserve requirements.
The liquidity situation is comfortable in the other geographic areas with full access to local capital markets.
In this context of improved access to the market, BBVA has maintained its objectives of, on the one hand, strengthening the funding structure of the Group’s various franchises based on growing its self-funding from stable customer funds, and on the other, guaranteeing a sufficient buffer of fully available liquid assets, diversifying the different sources of funding and optimizing the generation of collateral to deal with situations of tension in the markets.
| 3.7.4 | Liquidity prospects |
BBVA Group is entering 2019 with a comfortable liquidity status across its entire global footprint. The funding structure, based on stable deposits, and slanting toward the long term as well as proven access capacity to capital markets enables to comfortably meet the moderate volume of maturities expected for the upcoming quarters.
A breakdown of wholesale issue maturities of the most significant units of the Group by the nature of the issues.
| 168 |
Table of Contents
TABLE 73: Maturity of wholesale issues of Balance Euro by nature
| Million Euros | ||||||||||||||||||||
| Type of issuance | 2019 | 2020 | 2021 | After | Total | |||||||||||||||
| Senior debt | 1,540 | 1,155 | 1,924 | 9,681 | 14,300 | |||||||||||||||
| Mortgage-covered bonds | 380 | 2,264 | 3,169 | 9,394 | 15,207 | |||||||||||||||
| Public-covered bonds | – | – | – | 500 | 500 | |||||||||||||||
Regulatory capital instruments(1)
| 3,327 | 1,500 | 1,000 | 4,712 | 10,539 | |||||||||||||||
| Other long term financial | – | – | – | – | – | |||||||||||||||
| Total | 5,247 | 4,919 | 6,093 | 24,287 | 40,546 | |||||||||||||||
(1) Regulatory capital instruments are classified in this table by terms according to their contractual maturity or nearest amortization option.
TABLE 74: Maturity of wholesale issues of Bancomer by nature
| Million Euros | ||||||||||||||||||||
| Type of issuance | 2019 | 2020 | 2021 | After | Total | |||||||||||||||
| Senior debt | 178 | 579 | 200 | 1,558 | 2,515 | |||||||||||||||
| Mortgage-covered bonds | – | – | – | – | – | |||||||||||||||
| Public–covered bonds | – | – | – | – | – | |||||||||||||||
Regulatory capital instruments(1)
| – | 873 | 1,092 | 2,358 | 4,323 | |||||||||||||||
| Other long term financial | – | – | – | 49 | 49 | |||||||||||||||
| Total | 178 | 1,452 | 1,292 | 3,965 | 6,887 | |||||||||||||||
(1) Regulatory capital instruments are classified in this table by terms according to their contractual maturity or nearest amortization option.
TABLE 75: Maturity of wholesale issues of Compass by nature
| Million Euros | ||||||||||||||||||||
| Type of issuance | 2019 | 2020 | 2021 | After | Total | |||||||||||||||
| Senior debt | 524 | – | 1,004 | 655 | 2,183 | |||||||||||||||
| Mortgage-covered bonds | – | – | – | – | – | |||||||||||||||
| Public-covered bonds | – | – | – | – | – | |||||||||||||||
Regulatory capital instruments(1)
| – | 199 | 18 | 673 | 891 | |||||||||||||||
| Other long term financial instruments | – | – | – | – | – | |||||||||||||||
| Total | 524 | 199 | 1,023 | 1,328 | 3,074 | |||||||||||||||
(1) Regulatory capital instruments are classified in this table by terms according to their contractual maturity or nearest amortization option.
TABLE 76: Maturity of wholesale issues of Garanti by nature
| Million Euros | ||||||||||||||||||||
| Type of issuance | 2019 | 2020 | 2021 | After | Total | |||||||||||||||
| Senior debt | 1,274 | – | 446 | 1,052 | 2,772 | |||||||||||||||
| Mortgage-covered bonds | – | – | – | 302 | 302 | |||||||||||||||
| Public-covered bonds | – | – | – | – | – | |||||||||||||||
Regulatory capital instruments(1)
| – | – | – | 655 | 655 | |||||||||||||||
| Other long term financial instruments | 350 | 376 | 366 | 2,131 | 3,223 | |||||||||||||||
| Total | 1,624 | 376 | 812 | 4,140 | 6,952 | |||||||||||||||
(1) Regulatory capital instruments are classified in this table by terms according to their contractual maturity or nearest amortization option.
| 169 |
Table of Contents
TABLE 77: Maturity of wholesale issues of South America by nature
| Million Euros | ||||||||||||||||||||
| Type of issuance | 2019 | 2020 | 2021 | After | Total | |||||||||||||||
| Senior debt | 361 | 364 | 311 | 1,110 | 2,145 | |||||||||||||||
| Mortgage-covered bonds | – | – | – | – | – | |||||||||||||||
| Public-covered bonds | – | – | – | – | – | |||||||||||||||
Regulatory capital instruments(1)
| – | – | 46 | 973 | 1,019 | |||||||||||||||
| Other long term financial instruments | – | – | – | – | – | |||||||||||||||
| Total | 361 | 364 | 356 | 2,082 | 3,164 | |||||||||||||||
(1) Regulatory capital instruments are classified in this table by terms according to their contractual maturity or nearest amortization option.
For 2019, the main goals of BBVA Group’s funding strategy is to maintain the strength of the funding structure and the diversification of the different sources of funding, ensuring the availability of sufficient levels of collateral, both for complying with regulatory ratios and for the rest of the internal metrics for monitoring liquidity risk, including stress scenarios.
| 170 |
Table of Contents
| 3.7.5 | LCR disclosure |
The table below shows the consolidated LCR disclosure as of December 31, 2018, pursuant to Article 435 of Regulation (EU) No. 575/2013. These figures are calculated as simple averages of observations made at the end of each month over the twelve months previous to each quarter, starting in September 2017. No transfer of liquidity is assumed between subsidiaries, and therefore no excess liquidity is transferred from the entities abroad to the consolidated figures displayed in the following table:
TABLE 78:EU-LIQ1 - Guidelines on disclosure of Liquidity information
| Million Euros | ||||||||||||||||||||||||||||||||
| Total unweighted value | Total weighted value (average) | |||||||||||||||||||||||||||||||
| March | June | September | December | March | June | September | December | |||||||||||||||||||||||||
| End of the quarter | 03-31-18 | 30-06-18 | 09-31-18 | 12-31-18 | 03-31-18 | 30-06-18 | 09-31-18 | 12-31-18 | ||||||||||||||||||||||||
| Number of data points used in the calculation of averages |
| |||||||||||||||||||||||||||||||
| High–quality liquid assets |
| |||||||||||||||||||||||||||||||
| Total high–quality liquid assets (HQLA) | 89,330 | 88,139 | 87,426 | 87,252 | ||||||||||||||||||||||||||||
| Cash–outflows |
| |||||||||||||||||||||||||||||||
| Retail deposits and deposits from, small business customers, of which: | 201,452 | 201,731 | 201,501 | 202,627 | 14,909 | 14,823 | 14,674 | 14,695 | ||||||||||||||||||||||||
Stable deposits | 130,678 | 132,178 | 134,053 | 135,983 | 6,534 | 6, 609 | 6,703 | 6,799 | ||||||||||||||||||||||||
Less stable deposits | 70,774 | 69,553 | 67,448 | 66, 644 | 8,375 | 8,214 | 7,972 | 7,896 | ||||||||||||||||||||||||
| Unsecured wholesale funding | 122,158 | 122,777 | 123,549 | 124,685 | 53,038 | 53,064 | 53,272 | 53,415 | ||||||||||||||||||||||||
Operational deposits (all counterparties) and deposits in networks of | 49,363 | 50,449 | 51,221 | 52,009 | 10,997 | 11,238 | 11,474 | 11,714 | ||||||||||||||||||||||||
Non–operational deposits (all counterparties) | 70,496 | 69,776 | 69,861 | 70,519 | 39,742 | 39,274 | 39,331 | 39,544 | ||||||||||||||||||||||||
Unsecured debt | 2,299 | 2,552 | 2,467 | 2,157 | 2,299 | 2,552 | 2,467 | 2,157 | ||||||||||||||||||||||||
| Secured wholesale funding | 3, 381 | 3,593 | 3,736 | 3,761 | ||||||||||||||||||||||||||||
| Additional requirements | 114,387 | 111,320 | 109,935 | 108,673 | 17,941 | 17,180 | 16,772 | 16,235 | ||||||||||||||||||||||||
Outflows related to derivative exposures and other collateral requirements | 8,702 | 8,318 | 8,010 | 7,717 | 8,610 | 8,240 | 7,931 | 7,639 | ||||||||||||||||||||||||
Outflows related to loss of funding on debt products | 405 | 230 | 224 | 90 | 405 | 230 | 224 | 90 | ||||||||||||||||||||||||
Credit and liquidity facilities | 105,280 | 102,772 | 101,701 | 100,866 | 8,926 | 8,710 | 8,617 | 8,506 | ||||||||||||||||||||||||
| Other contractual funding obligations | 10,826 | 11,717 | 12,080 | 12,441 | 2,004 | 2,135 | 2,045 | 1,840 | ||||||||||||||||||||||||
| Other contingent funding obligations | 1,603 | 1,635 | 1,744 | 1,835 | 1,603 | 1,635 | 1,744 | 1,835 | ||||||||||||||||||||||||
| Total cash outflows | 92,876 | 92,430 | 92,243 | 91,781 | ||||||||||||||||||||||||||||
| Cash – inflows |
| |||||||||||||||||||||||||||||||
| Secured lending (e.g. reverse repos) | 11,776 | 12,429 | 12,987 | 13,584 | 509 | 612 | 630 | 697 | ||||||||||||||||||||||||
| Inflows from fully performing exposures | 27,611 | 28,713 | 29,917 | 30,625 | 16,473 | 17,406 | 18,615 | 19,433 | ||||||||||||||||||||||||
| Other cash inflows | 5,076 | 4,776 | 4,196 | 3,645 | 5,076 | 4,776 | 4,196 | 3,645 | ||||||||||||||||||||||||
| (Difference between total weighted inflows and total weighted outflows arising from transactions in third countries where there are transfer restrictions or which are denominated in non-convertible currencies) | ||||||||||||||||||||||||||||||||
| (Excess inflows from a related specialised credit institutions) | ||||||||||||||||||||||||||||||||
| Total cash inflows | 44,463 | 45,918 | 47,100 | 47,854 | 22,058 | 22,794 | 23,441 | 23,775 | ||||||||||||||||||||||||
| Fully exempt inflows | ||||||||||||||||||||||||||||||||
| Inflows subject to 90% cap | ||||||||||||||||||||||||||||||||
| Inflows subject to 75% cap | 44,463 | 45,918 | 47,100 | 47,853 | 22,059 | 22,794 | 23,441 | 23,775 | ||||||||||||||||||||||||
| Total adjusted value | ||||||||||||||||||||||||||||||||
| Liquidity buffer | 89,330 | 88,139 | 87,426 | 87,252 | ||||||||||||||||||||||||||||
| Total net cash outflows | 70,819 | 69,637 | 68,802 | 68,005 | ||||||||||||||||||||||||||||
| Liquidity coverage ratio (%) | 126.2% | 126.6% | 127.1% | 128.4% | ||||||||||||||||||||||||||||
(1) Includes the value of collaterals that the entity should contribute in case of a credit downgrade in accordance to article 449. d) of CRR.
Establishing an independent control framework for the Euro, Compass, Mexico and Turkey LMUs complies with the corporate Liquidity and Funding requirements for the four main currencies in which BBVA Group operates: the Euro, Dollar, Mexican Peso and Turkish Lira.
Except for the dollar, the significant currencies at Group level are managed in their entirety by the entities resident in the jurisdictions of each, covering their funding needs in the local markets in which they operate.
There are specific regulatory requirements for the LMUs that operate in dollarized economies (Argentina, Peru, Bancomer and Turkey) that limit the level of risk of each subsidiary.
With respect to the sustainability of wholesale funding as a source of funding depends on the level of diversification. Specifically, to ensure an appropriate level of diversification of counterparties, specific concentration thresholds are established to be adhered to at all times by each LMU. As of December 31, 2018, excepting exposures to central counterparty entities and the ECB TLTROII (Targeted Longer-Term Refinancing Operations) on the euro balance-sheet, BBVA Group does not have counterparties with balances greater than 1% of the Group’s total liabilities, and the weight of the 10 biggest counterparties by balance account for 5% in all.
| 171 |
Table of Contents
| 3.7.6 | Assets committed in finance transactions |
With respect to the management of encumbered liquid assets3, all the LMUs maintain suitable positions that not only cover the minimum survival periods established for stress scenarios, but also in relation tonon-collateralised wholesale liabilities, which are ultimately those most affected by the encumbered asset ratio.
All the Group’s LMUs have implemented procedures and controls to ensure that the risks associated with the management of guarantees and the charge on assets are correctly identified, controlled and managed in compliance with the Corporate Liquidity and Funding Risk Policy, particularly: i) a system for monitoring and control of the asset encumbrance risk indicators; ii) regular assessment of stress scenarios as a result of the risk levels reached; and iii) a contingency plan with measures for action according to the level of criticality and immediacy of the situation
The impact on the business model of the level of asset encumbrance, as well as its importance for the Group’s funding model, is limited; because the funding is based on stable customer deposits, reducing dependence of short-term funding, and because a robust funding structure is maintained, with a moderate level of encumbered assets.
The ratio of encumbered assets over the total assets for the three main LMUs as of December 31, 2018 is:
TABLE 79: Committed assets over total assets rate
| 12-31-2018 | ||||
| BBVA Group | 19% | |||
| LMU Euro | 25% | |||
| LMU Mexico | 13% | |||
| LMU Compass | 12% | |||
| LMU Garanti | 7% | |||
BBVA Group has mainly the following sources of pledges:
| · | Covered bonds: |
The issue of covered bonds constitutes one of the main sources of finance guaranteed with a high level of protection for the holders. The issues are backed by assets on the balance sheet that may be pooled and that have a joint guarantee from the Entity, which will back the issue if the underlying assets cannot meet the payments. The products through which this type of finance is implemented are mortgage-covered bonds, public-covered bonds and internationalization bonds.
| · | Assets sold under repurchase agreements: |
The collateralized finance transactions through repurchase agreements form part of short-term funding sources. These transactions play an important role among the Group’s encumbered assets.
| · | Assets pledged with central banks |
3 An asset is considered encumbered if it is subject to any form of agreement with the aim of ensuring, collateralizing or improving the credit quality of a transaction, and may not be freely withdrawn.
In any case, the consideration of a committed asset is not based on an explicit legal definition, such as the transfer of a title, but rather on an economic criterion so that any asset that is subject to any given restriction against use or replacement with another asset is considered as pledged.
| 172 |
Table of Contents
The role of central banks as last-resort liquidity providers is also one of the basic contingent funding resources in the event of stress on finance markets. In this regard, in accordance with the principles established for management of collateral, the Group’s strategy consists of maintaining broad credit facilities with the central banks concerned by pledging assets as collateral in geographical areas where these instruments are used as part of monetary policy. The impact of this source of funding is very low in BBVA Group.
| · | Management of collateral agreements |
The use of collateral constitutes one of the most effective techniques for mitigating exposure to the credit risk resulting from derivative transactions or operational procedures with repos or securities loans. The assets currently used as collateral are: cash, fixed-income and letters of credit.
| · | Securitisations |
The issuance of securitisations represents one of the main potential sources of risk of assets pledged in the balance sheet. Depending on the type of assets supporting the securitisation, the following classes are issued: mortgage (RMBS), consumer loans and loans to SMEs. The impact of this source of pledge is very low in the BBVA Group.
The projects subject to overcollateralisation are:
| ○ | Mortgage-covered bonds |
These are mortgage bonds issued with first-rank mortgage loan collateral constituted in favour of the bank. In the case of BBVA S.A., which accounts for more than 95% of the issuance of mortgage-covered bonds in the Group, the bonds have to be overcollateralised at 125% of their nominal value, and the amount of loans that back them may not be more than 80% of the value of the collateral. The other geographic areas that issue these types of product (to a residual extent) are Garanti Bank.
| ○ | Public-covered bonds |
Public-covered bonds are similar to mortgage-covered bonds. They are backed by loans and credit granted by the issuer to central and regional governments, local authorities and autonomous bodies that answer to them, as well as other public-sector entities in the European Economic Area. In this case, the issues have to be overcollateralised at 143% of their nominal value. BBVA S.A. accounts for 100% of this type of issuance.
| ○ | Internationalisation bonds |
These are securities guaranteed by loans and credit linked to the finance of contracts for the export of goods and services or the internationalisation of companies. The level of overcollateralisation is the same as for public-covered bonds. BBVA S.A. accounts for 100% of this type of issuance. The weight of these issues is extremely residual.
Within the Group there are units responsible for the execution, monitoring and control of issues of this type, as well as the calculation of the capacity for additional issuance, with the aim of ensuring that the Entity is not over-issued and complies with the established limits of the Encumbered Asset Ratio.
The following table shows assets contributed as collateral (loans) underlying the issue of mortgage-covered bonds, public-covered bonds and internationalisation bonds, as well as the total issued and excess capacity of issue as of December 31, 2018:
| 173 |
Table of Contents
TABLE 80: Mortgage-covered bonds
| Million Euros | ||||
| Withheld | 9,093 | |||
| Withheld applied | 7,010 | |||
| Withheld not applied | 2,083 | |||
| Issued to Market | 15,207 | |||
| Total mortgage–covered bonds issued | 24,301 | |||
| Eligible collateral to consider | 44,424 | |||
| Maximum to issue | 35,539 | |||
| Capacity to issue | 11,239 | |||
TABLE 81: Public-covered bonds
| Million Euros | ||||
| Withheld | 7,040 | |||
| Withheld applied | 4,790 | |||
| Withheld not applied | 2,250 | |||
| Issued to Market | 500 | |||
| Total mortgage–covered bonds issued | 7,540 | |||
| Eligible collateral to consider | 15,145 | |||
| Maximum to issue | 10,602 | |||
| Capacity to issue | 3,062 | |||
TABLE 82: Internationalization-covered bonds
| Million Euros | ||||
| Withheld | 1,500 | |||
| Withheld applied | 750 | |||
| Withheld not applied | 750 | |||
| Issued to Market | – | |||
| Total internationalization–covered bonds issued | 1,500 | |||
| Eligible collateral to consider | 3,365 | |||
| Maximum to issue | 2,356 | |||
| Capacity to issue | 856 | |||
The collateral received that, as of December 31, 2018, is committed (provided as collateral or security with respect to certain liabilities) and those unencumbered are shown below. It should be noted that the value used for the purpose of this disclosure is the carrying amount and fair value, for both the assets on the balance sheet and the encumbered and unencumbered guarantees received. The balances are calculated as annual medians using as a sample the four quarters of the last year.
| 174 |
Table of Contents
TABLE 83: Encumbered and unencumbered assets
Million Euros
Carrying value of encumbered assets | Fair value of encumbered assets | Carrying value of unencumbered assets | Fair value of unencumbered assets | |||||||||||||
| Institution’s assets | 108,134 | 555,065 | ||||||||||||||
| Equity instruments | 2,115 | 6,064 | ||||||||||||||
| Debt securities | 31,212 | 31,288 | 64,913 | 64,947 | ||||||||||||
Of which: covered bonds | 9 | 9 | 527 | 517 | ||||||||||||
Of which: ABSs | 17 | 17 | 1,011 | 9,998 | ||||||||||||
Of which: issued by general governments | 27,200 | 27,295 | 51,778 | 51,777 | ||||||||||||
Of which: issued by financial | 3,502 | 3,475 | 7,725 | 7,752 | ||||||||||||
Of which: issued bynon-financial | 1,549 | 1,542 | 2,759 | 2,766 | ||||||||||||
| Other assets | 75,187 | 482,148 | ||||||||||||||
TABLE 84: Collateral received
Million Euros
| Fair value of encumbered collateral received or own debt securities issued | Fair value of collateral received or own debt securities issued available for encumbrance | |||||||
| Collateral received | 23,734 | 7,232 | ||||||
| Loans on demand | – | 5 | ||||||
| Equity instruments | 165 | 105 | ||||||
| Debt securities | 23,384 | 7,078 | ||||||
Of which: covered bonds | 177 | 325 | ||||||
Of which: ABSs | – | – | ||||||
Of which: issued by general governments | 21,863 | 4,543 | ||||||
Of which: issued by financial corporations | 983 | 2,312 | ||||||
Of which: issued bynon-financial corporations | 657 | 135 | ||||||
| Loans and advances other than loans on demand | 149 | 7 | ||||||
| Other collateral received | – | 11 | ||||||
| Own debt securities issued other than own mortgage-covered | 11 | 94 | ||||||
| Own mortgage-covered bonds and ABSs issued and not yet pledged | – | 15,636 | ||||||
| Total assets, collateral received and own debt securities issued | 131,738 | – | ||||||
The sources of pledges as of December 31, 2018 are as follows:
TABLE 85: Sources of encumbrance
Million Euros
| Matching liabilities, contingent liabilities or securities lent | Assets, collateral received and own securities issued other than mortgage– covered bonds, public–covered bonds and ABSs encumbered | |||||||
| Carrying amount of selected | 112,875 | 128,142 | ||||||
| Derivatives | 9,026 | 9,454 | ||||||
| Repos and other collateralized | 85,633 | 96,253 | ||||||
| Debt securities | 19,035 | 23,315 | ||||||
| Other sources of encumbrance | 2,346 | 3,060 | ||||||
The assets without an associated liability reflected in the table below correspond mainly to pledges issued by VISA guarantee and pledges for operating in certain markets. The collateral received off the balance sheet is mostly reverse repurchase agreements, of which more than 90% are sovereign securities.
| 175 |
Table of Contents
| 3.8 | Operational risk |
| 3.8.1 | Operational Risk definition |
BBVA defines operational risk (“OR”) as that which may cause losses due to human error, inadequate or defective internal processes, inadequate conduct towards customers or markets, failures, interruptions, or deficiencies of systems or communications, inadequate management of data, legal risks and, finally, as a consequence of external events, including cyberattacks, fraud committed by third parties, natural disasters, and poor service provided by suppliers.
Operational risk management is oriented to the identification of its root causes, preventing its occurrence and mitigating the possible consequences, through the establishment of control frameworks and mitigation plans, in order to minimize the losses deriving from it and its impact on the Group’s recurrent revenue generation and profit. Operational risk management is integrated into the global risk management structure of the BBVA Group.
Operational Risk Management Principles
The BBVA Group prefers to apply advanced models of operational risk management, independently of the regulatory capital calculation model that it applies at any given time. The management of operational risk in the BBVA Group must:
| · | Be aligned with the Risk Appetite Framework approved by the Management Board. |
| · | Cover all management needs that BBVA may have arising as a result of compliance with regulations, norms, or industry standards, as well as decisions or positions of the governing bodies of the Group. |
| · | Anticipate the potential operational risks to which the Group would be exposed as a result of the appearance or modification of new products, activities, processes or systems and decisions of outsourcing or contracting services. |
| · | Establish the methodologies, procedures and indicators that allow periodically monitoring andre-evaluating the relevant operational risks to which the Group is exposed in order to adopt the appropriate mitigation measures in each case, once the risk identified and the cost of the mitigation have been considered (cost/profit analysis), preserving the solvency of the Group all the time. |
| · | Investigate the causes of operational events suffered by the Group, from the analysis of operational losses that may cause them and establish measures for their reduction. |
| · | Analyse the relevant public events for operational risk in other entities of the financial sector, or other sectors, and promote, where appropriate, the implementation of the necessary measures to avoid their occurrence in the Group. |
| · | Identify, analyse and try to quantify events of low probability of occurrence and high impact in order to assess potential mitigation measures. |
| · | Have effective governance, in which the functions and responsibilities of the Areas and Bodies that intervene in the management of the OR are clearly defined. |
Regardless of the adoption of measures and controls to avoid or reduce both the frequency and the severity of OR events, BBVA always allocates sufficient capital to address any expected or unexpected losses that may occur.
| 176 |
Table of Contents
| 3.8.2 | Operational Risk management model |
The operational risk management cycle at BBVA is similar to that adopted for similar risks, and contains the following elements:
Chart 25. Operational Risk Management Processes

| 3.8.2.1 | Planning |
Operational risk is part of the risk appetite framework of the Group and involves metrics of three classes:
| · | Economic Capital calculated from the database of operational losses of the Group and the industry, including the corresponding effects of diversification, and the complementary estimation of potential and emerging risks through stress scenarios designed for the main types of risks. The economic capital is calculated for the main banks of the group periodically and simulation capabilities are available to foresee the impact of changes in the risk profile or new potential events. |
| · | IRO metrics (losses for operational risk versus gross margin) with breakdown by geography, business areas and types of risks. The estimation of the IRO limits is based on the analysis of expected/unexpected loss, based on long-term statistical series, and is complemented by the potential events identified in the watch list. |
| · | Additionally, work is being done on the implementation of a more granular common scheme of metrics that covers the main typologies of operational risks in the whole group. |
| 177 |
Table of Contents
| 3.8.2.2 | Operational risk admission |
The main objectives of the operational risk admission are:
| · | To anticipate any potential operational risks to which the Group would be exposed as a result of the appearance of new initiatives or modifications of legislation in force; |
| · | To ensure that its implementation is performed once the appropriate mitigation measures have been adopted in each case, among which the assurance of risks will be considered, when so determined. |
The admission process covers any initiative (new business, product, outsourcing, process transformation, new systems, etc.) that incorporates a significant level of operational risk that could significantly modify the Group’s risk profile. These operational risks must, therefore, be managed within the framework of the Group’s risk appetite.
The Corporate Policy for Management and Control of Operational Risk establishes the specific framework for the admission of Operational Risk that is specified in different Committees, both at corporate level and in various Business Areas, which follow a multi-tiered structure based on the risk level of the proposed initiatives. These committees are composed of representatives of the second line of defense (specialists of each type of non-financial risks, who validate the proposed mitigation and control framework) and first line of defense (proponent units), who are responsible for this admission process.
This process is supported by corporate workflow tools that allow the participation of the first line of defense to be documented, as a proponent of the initiatives and the control framework associated with them, and of the second line of defense, to make any challenges or penalties related to them.
| 3.8.2.3 | Operational risk monitoring |
The objective in this phase is to control that the objective operational risk profile of the group remains within the authorized limits. Operational risk monitoring is differentiated into two independent areas:
| · | Monitoring of the admission processof the operational risk, with the purpose of verifying that the admitted risk levels are kept within authorized limits, and that the control methods indicated are effective. |
| · | Monitoring of the “stock” of operational risk associated with processes, aimed at performing a periodic reassessment to confirm that the residual risks and the target risk are reasonably aligned, or, alternatively, to implement action plans to redirect the gaps to the desired level. The “stock” must be updated with a minimum annual periodicity. |
The methodology applied in this stage is the following:
| · | Establishment of the perimeter of the management model, which identifies the companies and activities that may give rise to significant operational risks. |
| · | Identification of potential and actual operational risks based on the review of the processes and the current rules and regulations. |
| · | Prioritization of operational risks, with the objective of separating critical risks fromnon-critical risks. |
| 178 |
Table of Contents
| · | For critical risks, the identification, documentation and testing of the mitigating and controlling factors that contribute to their reduction are performed, and, based on their effectiveness, the residual risk is calculated, a level of objective risk is established and action plans are established in the cases in which the residual risk exceeds it. |
| · | Additionally, there is a set of indicators that are used to measure the evolution over time of both operational risks and the effectiveness of mitigating factors and controls, which facilitate the preventive management of those. |
| · | OR management will be performed in a coordinated manner with other risks considering those credit or market events that may have an operational origin. |
This process is supported by a Corporate Governance, Risk & Compliance tool that allows local tracking of the OR as well as aggregation at the corporate level of the same.
Additionally, in line with the best practices and recommendations of BIS, BBVA has collection procedures for operational losses that have occurred both in the different entities of the Group and in other financial groups, with the appropriate level of detail to enable an effective analysis that provides information useful for management. For this, a corporate tool implemented in all the countries of the Group is used.
| 3.8.2.4 | Mitigation of the operational risk |
In the last two years, a series of transversal plans have been promoted in terms of operational risk for the BBVA Group as a whole, in order to promote the anticipatory management of these risks.
To this end, attention focuses have been identified from events, self-evaluations and recommendations from auditors and supervisors in different geographies, both within the Group and the industry, analysing best practices in these areas and promoting comprehensive action plans to reinforce and homogenize the control environment.
One of the main plans has been the outsourcing management, as it is an item of increasing importance in the Group, both within the sector and in the current regulatory environment. Various initiatives have been launched within this plan, which can be summarized as:
| · | Reinforcement of the admission process of these initiatives, their control frameworks and their monitoring; |
| · | New internal regulations incorporating the best practices of the industry; |
| · | Integration in the control model of three lines of defense: roles and responsibilities in each of the phases of its life cycle; |
| · | Risk management of both the service and the provider; |
| · | Review of governance, which is integrated into the operational risk, and scaling criteria; |
| · | Adaptation of the management tool to the new requirements; |
| · | Process of internal communication and training between the externalizing units and senior management, including these issues within the agenda of the main control committees of the Group. |
This plan will continue to be promoted in 2019 with a focus on reviewing the most significant outsourcing stock.
| 179 |
Table of Contents
| 3.8.2.4.1 | Operational risk assurance |
Assurance is one of the possible options for the management of operational risk to which the Group is exposed, and has two different purposes in particular:
| · | Coverage of extreme situations linked to recurring events, whose mitigation is difficult or partial by other means. |
| · | Coverage ofnon-recurring events that, if they occur, could have a high economic impact. |
In 2018, a specific corporate procedure was approved for insurance management aimed at mitigating the Group’s operational risks. This provides a general framework that regulates these activities in the group and allows the systematization of risk assurance decisions, better align coverage with the risks covered and strengthen governance in the decision making of insurance policies.
| 3.8.3 | Governance of the Operational risk |
The governance model for operational risk in BBVA group is based on two components:
| · | Control model of three lines of defense, in accordance with the best industry practices, and through which compliance with the most advanced standards in terms of internal control of operational risks is guaranteed. |
| · | Scheme of Corporate Assurance Committees and Committees of Internal Control and Operational Risk at the level of the different business areas. |
The Corporate Assurance establishes a committee structure, both at the local and corporate level, which provides Senior Management with a comprehensive and homogeneous view of the most relevant operational risks. The objective is to facilitate agile and anticipatory decision-making for the mitigation or assumption of the main risks, both locally as well as in the consolidated Group.
CHART 26. Corporate Assurance Governance Structure
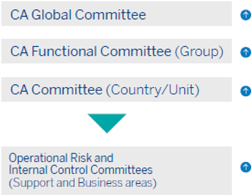
Each geography has a Corporate Assurance Committee chaired by the Country Manager and whose main functions are:
| · | Monitoring the evolution of risks and their degree of alignment to the defined strategies and policies and to overall risk appetite; |
| 180 |
Table of Contents
| · | Analysing and assess the controls and measures planned to mitigate the impact of the identified risks, in the event they materialize; |
| · | Taking decisions on risk assumption proposals that are transferred by the working groups or that arise in the Committee itself; |
| · | Promoting transparency, encouraging the proactive participation of the three lines of defense in the exercise of their responsibilities and the rest of the organization in this matter |
At the Holding level, there is a Global Corporate Assurance Committee, chaired by the Group CEO, whose main functions are similar to those previously described, but which are applicable to the most relevant matters pertaining to certain locations holding areas.
The business and support areas have an Internal Control and Operational Risk Committee, whose objective is to ensure the correct implementation of the operational risk management model in their area and to promote the active management of this risk, taking decisions of mitigation in case of identification of control weaknesses and monitoring them.
Additionally, theNon-Financial Risk unit periodically reports to the Risk Committee of the Board of Directors on the operational risk management situation in the Group.
| 3.8.4 | Methods used to calculate capital |
As set out in Regulation (EU) 575/2013 of the European Parliament and of the Council, for calculating the regulatory capital for operational risk under Basel I, Advanced Measurement Approaches (AMA) are used for a very significant part of the banking perimeter4. Specifically, this method is used in Spain and Mexico, which accumulate most of the Group’s assets.
Except for the cases of Garanti and Bolivia, for which the basic approach is applied, the standardized approach is used to calculate capital in the rest of the geographic areas.
| 3.8.4.1 | Description of the Advanced Measurement Approaches |
The advanced internal model quantifies capital at a confidence level of 99.9% following the LDA (Loss Distribution Approach) methodology. This methodology estimates the distribution of losses by operational event by convoluting the frequency distribution and the loss given default distribution of these events.
The calculations are made using internal data on the Group’s historic losses as its main source of information. To enrich the data from this internal database and to take into account the impact of possible events not yet considered therein, external databases (ORX consortium) are used as well as operational risk scenarios.
The distribution of losses is constructed for each of the different types of operational risk, which are defined as per Basel Accord cells; i.e. a cross between business line and risk type. In those cases in which there is not sufficient data for a sound analysis, it becomes necessary to undertake cell aggregations, and to do so the business line is chosen as the axis.
| 4 | In March 2010, BBVA Group received authorization from the supervisor to apply advanced approaches for calculating regulatory capital by operational Risk in Spain and Mexico. |
| 181 |
Table of Contents
In certain cases, a greater disaggregation of the Basel cell has been selected. The objective consists of identifying statistically homogenous groups and a sufficient amount of data for proper modelling. The definition of these groupings is regularly reviewed and updated.
Solvency regulations establish that regulatory capital for operational risk is determined as the sum of individual estimates by type of risk, but allowing the option of incorporating the effect of the correlation among them. This impact has been taken into consideration in BBVA estimates with a conservative approach.
The model of calculating capital in both Spain and Mexico incorporates factors that reflect the business environment and situation of internal control systems. Thus the calculation obtained is higher or lower according to how these factors change in anticipating the result.
The Group has insurance policies that basically cover the risk of cyberattacks, natural and/or provoked disasters and external and internal fraud. For the purpose of calculating capital by the AMA the mitigating effect of the insurance contracted is not included.
The following table below shows the operational risk capital requirements broken down according to the calculation models used and by geographic area, to provide a global vision of capital consumption for this type of risk:
TABLE 86: Regulatory capital for Operational Risk
Million Euros
| Capital | RWAs | |||||||||||||||
| Regulatory capital for operational risk | 2018 | 2017 | 2018 | 2017 | ||||||||||||
| Advanced | 1,718 | 1,476 | 21,475 | 18,449 | ||||||||||||
Spain | 1,364 | 1,181 | 17,050 | 14,767 | ||||||||||||
Mexico | 354 | 255 | 4,425 | 3,682 | ||||||||||||
| Standardised | 765 | 808 | 9,563 | 10,102 | ||||||||||||
| Basic | 473 | 496 | 5,913 | 6,204 | ||||||||||||
| BBVA Group total | 2,956 | 2,780 | 36,950 | 34,755 | ||||||||||||
The main variations in the capital requirements for operational risk are due to:
| · | Advanced approaches: Increase of 183 million in Spain, basically due to the greater impact of the losses registered following the judgment in 2016 of the Court of Justice of the European Union referring to the application of floor clauses in mortgage loans. Increase of 59 million in Mexico as a result of the exchange rate difference and the increase in the trend in the sanctions imposed by the regulators in effect for the last three years. |
| · | Basic and standard approaches: Declines in the standard and basic approaches produced by the exchange-rate variations and by the sale of Chile, as well as the Portugal merger. |
| 182 |
Table of Contents
| 3.8.5 | The Group’s Operational Risk profile |
BBVA’s operational risk profile is shown below by class of risk after assessing the risks, resulting in the following distribution:
CHART 27: BBVA Group’s Operational Risk profile
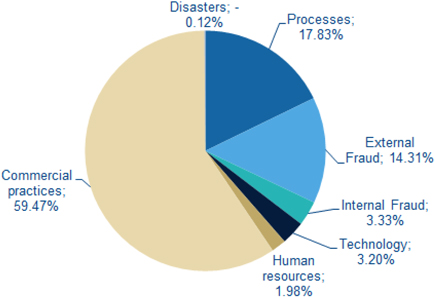
The following charts illustrate the distribution of historical operational losses by risk class and country.
CHART 28: Operational Risk profile by risk and country
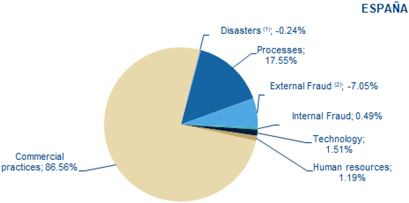
(1)An amount greater than the loss that occurred this year has been recovered by insurance of events of previous years.
(2)Recovery of 25 million EUR from the Madoff event that exceeds the total losses due to external fraud that has occurred this year
| 183 |
Table of Contents
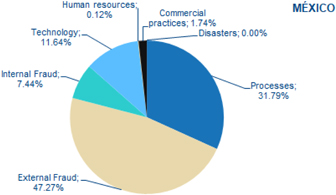
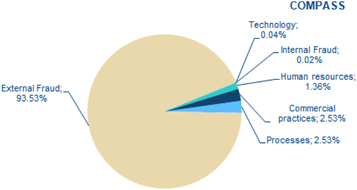
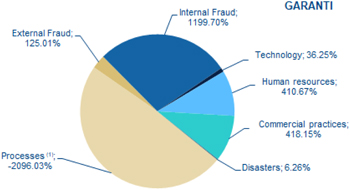
(1) Provisions recorded in previous years have been released for two relevant events (RUSF and Arbitration Committee) for an amount greater than the loss that occurring during this year
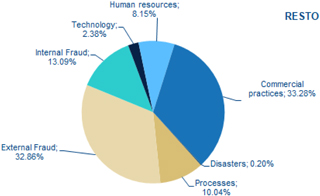
| 184 |
Table of Contents
4.1. Leverage Ratio definition and composition
4.2. Trends in the ratio
4.3. Governance
| 4.1. | Leverage Ratio definition and composition |
The leverage ratio (LR) is a regulatory measure (not risk-based) complementing capital designed to guarantee the soundness and financial strength of institutions in terms of indebtedness.
In January 2014, the Basel Committee on Banking Supervision published the final version of the “Basel III leverage ratio framework and disclosure requirements”, which has been included through a delegated act that amends the definition of leverage ratio in the CRR regulation.
Pursuant to article 451, section 2 of the CRR, on June 15, 2015 the EBA published the final draft of the Implementing Technical Standard (ITS) on leverage ratio disclosures for breaking down the leverage ratio, which has been applied in this report.
The leverage ratio is defined as the quotient of eligible Tier 1 capital and exposure.
Described below are the elements making up the leverage ratio, in accordance with the “EBA Final Draft Implementing Technical Standards on disclosure of the leverage ratio under Article 451(2) of Regulation (EU) No. 575/2013 (Capital Requirements Regulation – CRR) - Second submission following the EC’s Delegated Act specifying the LR5,” published by the EBA on June 15, 2015:
| · | Tier 1 capital (letter h in the following table): section 2.2. of this Document presents details of the eligible capital, which has been calculated based on the criteria defined in the CRR. |
| · | Exposure: as set out in article 429 of the CRR, the exposure measurement generally follows the carrying amount subject to the following considerations: |
| ○ | On-balance-sheet exposures other than derivatives are included net of allowances and accounting valuation adjustments. |
| ○ | Measurement of the Group’s total exposure is composed of the total assets as per financial statements adjusted for reconciliation between the accounting perimeter and the prudential perimeter. |
Total exposure for the purpose of calculating the Group’s leverage ratio is composed of the sum of the following items:
5http://www.eba.europa.eu/regulation-and-policy/leverage-ratio/draft-implementing-technical-standards-its-on-disclosure-for-
leverage-ratio/-/regulatory-activity/press-release
| 185 |
Table of Contents
| · | On-balance asset positions: book balance of assets corresponding to the financial statements, excluding the derivative headings. |
| · | Adjustments for reconciliation between the accounting perimeter and the solvency perimeter: the balance resulting from the difference between the accounting balance sheet and the regulatory balance sheet is included. |
| · | Exposure in derivatives: the exposure referring to the EAD used in the measurement of capital use for counterparty risk, which includes both the replacement cost(market-to-market) and the future potential credit exposure(add-on). The cost of replacement is reported adjusted by the margin of variation in cash and by effective notional amounts. |
| · | Securities financing transactions (SFTs): in addition to the exposure value, an addition for counterparty risk determined as set out in article 429 of the CRR in included. |
| · | Off-balance-sheet items: these correspond to risks and contingent liabilities and commitments associated with collateral, which are mainly available. A minimum floor of 10% is applied to the conversion factors (CCF), in line with article 429.10 a) of the CRR. |
| · | The exposures of the Group’s financial institutions and insurance companies that are consolidated at accounting but not at regulatory level. |
| · | Tier 1 deductions: all those amounts of assets that have been deducted in the determination of the eligible Tier 1 capital are deducted, in order not to duplicate exposures. The main deductions are intangible assets, loss carry forwards and other deductions defined in article 36 of the CRR and indicated in section 2.1 of this report. |
The table below shows a breakdown of the items making up the leverage ratio as of December 31, 2018 and December 31, 2017:
TABLE 87: LRSum - Summary of the reconciliation of accounting assets and exposure corresponding to the Leverage Ratio
Million Euros
| ||||||||||||||||
| Summary table of accounting assets and leverage ratio exposure conciliation | 12-31-18 Phased-in | 12-31-18 Fully Loaded | 12-31-17 Phased.-in | 12-31-17 Loaded | ||||||||||||
| (a) Total assets as published financial statements | 676,689 | 676,683 | 690,059 | 690,059 | ||||||||||||
| (b) Adjustment for entities which are consolidated for accounting purposes but are outside the scope of regulatory consolidation | (19,326) | (19,326) | (17,079) | (17,079) | ||||||||||||
(Adjustment for fiduciary assets recognised on the balance sheet pursuant to the operative accounting framework but excluded from the leverage ratio exposure measure in accordance with Article 429 (13) of Regulation (EU) No 575/2013) | – | – | – | – | ||||||||||||
| (c) Adjustments for derivative financial instruments | (7,410) | (7,410) | (14,772) | (14,772) | ||||||||||||
| (d) Adjustments for securities financing transactions “SFTs” | 2,949 | 2,949 | (1,248) | (1,248) | ||||||||||||
| (e) Adjustment for off-balance sheet items(1) | 61,409 | 61,409 | 62,441 | 62,441 | ||||||||||||
| (f) (Adjustment for intragroup exposures excluded from the leverage ratio exposure measure in accordance with Article 429 (14) of Regulation (EU) No 575/2013) | – | – | – | – | ||||||||||||
| (g) Other adjustments | (9,012) | (10,080) | (9,643) | (9,920) | ||||||||||||
| Leverage ratio total exposure measure | 705,299 | 704,231 | 709,758 | 709,480 | ||||||||||||
| h) Capital Tier 1 | 45,947 | 45,047 | 46,980 | 46,316 | ||||||||||||
| Leverage ratio total exposure measure | 705,299 | 704,231 | 709,758 | 709,480 | ||||||||||||
| Leverage ratio | 6.5% | 6.4% | 6.6% | 6.5% | ||||||||||||
(1) This corresponds tooff-balance sheet exposure after application of the conversion factors obtained in accordance with Article 429, paragraph 7 of the CRR.
As can be seen, the Group maintains a phased leverage ratio of 6.5% and a fully-loaded ratio of 6.4%, well above the minimum level required.
| 186 |
Table of Contents
| 4.2. | Trends in the ratio |
Thephased-in leverage ratio decreased by 11 basis points during the year. As indicated in section 2.2., Tier 1 was reduced by approximately EUR 1 billion, resulting in an impact on leverage of-16 basis points. On the other hand, exposures were reduced by approximately 5.5 billion (+5 basis points), mainly derived from the sale of the Group’s interest in BBVA Chile.
As of December 2018, thephased-in ratio was 6.6% (6.5% in fully-loaded terms), easily above the minimum required of 3%. The leverage level reflects the nature of the business model that is geared toward the retail sector.
CHART 29: Leverage ratio evolution
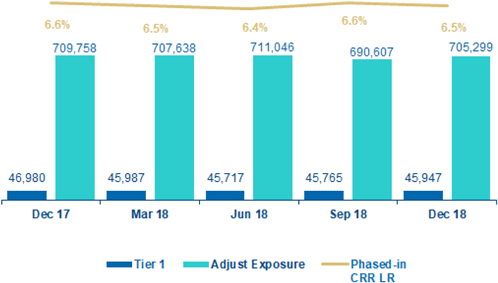
| 4.3. | Governance |
The activities making up the Group’s regulatory reporting include monthly measurement and control of the leverage ratio by assessing and monitoring this measurement in its more restrictive version (fully-loaded), to guarantee that leverage remains far from the minimum levels (which could be considered risk levels), without undermining the return on investment.
The estimates and the development of the leverage ratio are reported on a regular basis to different governing bodies and committees to guarantee an adequate control of the entity’s leverage levels and ongoing monitoring of the main capital indicators.
In line with the risk appetite framework and structural risk management, the Group operates by establishing limits and operational measures to achieve a sustainable development and growth of the balance sheet, maintaining at all times tolerable risk levels. This can be seen in the fact that the regulatory leverage level itself is well above the minimum required levels.
| 187 |
Table of Contents
5. Information on remuneration
|
5.1. Information on the decision-making process to establish the remuneration policy for Identified Staff
5.2. Description of the different types of employees included in the Identified Staff
5.3. Key features of the remuneration system
5.4. Information on the link between the remuneration of Identified Staff and the performance of the Group
5.5. Description of the criteria used to take into consideration present and future risks in the remuneration processes
5.6. Main parameters and reasons for any component of the possible variable remuneration plans and othernon-cash benefits
5.7. Ratios between the fixed and variable remuneration of Identified Staff
5.8. Quantitative information on the remuneration of Identified Staff
|
|
In accordance with Article 85 of Act 10/2014, of 26 June, on the regulation, supervision and solvency of credit institutions (hereinafter “Act 10/2014”), and article 93 of Royal Decree 84/2015, dated February 13, which implements said Act, and pursuant to the provisions of Bank of Spain Circular 2/2016, dated February 2, to credit institutions, on supervision and solvency, completing the adaptation of the Spanish legal system to Directive 2013/36/EU and Regulation (EU) No. 575/2013 (hereinafter “Bank of Spain Circular 2/2016”), credit institutions shall provide the public and update, at least once a year,inter alia, information regarding their remuneration policy and practices as established in part eight of Regulation 575/2013/EU, in relation to the categories of personnel whose professional activities have a significant impact on the Group’s risk profile (hereinafter, the “Identified Staff” or “Risk Takers”).
| 5.1. | Information on the decision-making process used to establish remuneration policy for the Identified Staff |
In accordance with the provisions contained in BBVA’s Bylaws, the Regulations of the Board of Directors empower the Board of Directors (hereinafter, the “Board”), among others, to approve the remuneration policy of directors, for submission to the General Meeting, that of senior managers and those employees whose professional activities have a significant impact on the risk profile of the Group, as well as the determination of the remuneration ofnon-executive directors and, in the case of executive directors, remuneration for their executive functions and remaining conditions to be respected in their contracts.
| 188 |
Table of Contents
The Board Regulations likewise include the internal rules and procedures of the Board and its Committees, which provide assistance in matters within its remit. Among these, the Remunerations Committee is the body that assists the Board in remuneration matters, as set out in the Board Regulations, ensuring compliance with the remuneration policy established.
In accordance with Article 36 of the Board Regulations, the duties of the Remunerations Committee are as follows:
| 1. | Propose directors’ remuneration policy to the Board, for its submission to the General Meeting, as regards its items, amounts, and parameters for its determination and its vesting, likewise submitting the corresponding report, in the terms established by applicable law at any time. |
| 2. | Determine, so that they can be reflected in their contracts, the extent and amount of individual remuneration, entitlements and other economic rewards, as well as other contractual conditions of executive directors, submitting the appropriate proposals to the Board. |
| 3. | Yearly submit a proposal to the Board regarding the annual report on the remuneration of the Bank’s directors, which will in turn be submitted to the Annual General Shareholders’ Meeting, in accordance with the applicable legislation. |
| 4. | Propose the remuneration policy for senior managers and other Identified Staff members, for its submission to the Board. |
| 5. | Propose the basic conditions of senior managers’ contracts to the Board, and directly supervise the remuneration of senior managers in charge of risk management and compliance functions within the Company. |
| 6. | Oversee observance of the remuneration policy established by the Company and periodically review the remuneration policy applied to members of the Identified Staff, including executive directors and senior managers. |
| 7. | Verify the information on directors and senior managers’ remuneration contained in the different corporate documents, including the annual report on the remuneration of directors. |
| 8. | Any other duties that may have been allocated under the Regulations or attributed by a Board resolution or by applicable legislation. |
As atyear-end 2018, the Remunerations Committee is composed of five members, all of themnon-executive directors, with the majority being independent, including the Chair. The names, positions and status of the members of the Remunerations Committee are detailed in the following table:
TABLE 88: Composition of the Remunerations Committee
| Name and surname(s) | Position | Status | ||||||
| Belén Garijo López | Chair | Independent | ||||||
| Tomás Alfaro Drake | Member | External | ||||||
| Carlos Loring Martinez de Irujo | Member | External | ||||||
| Lourdes Máiz Carro | Member | Independent | ||||||
| Ana Peralta Moreno | Member | Independent | ||||||
The Remunerations Committee performs its functions with full operational autonomy, meeting as often as necessary to carry out its duties, led by its Chair, having met on 5 occasions during 2018.
| 189 |
Table of Contents
In order to adequately perform its duties, the Commission uses advisory services provided by the Bank’sin-house staff and can further count on the external advice as necessary to establish criteria regarding matters within its remit. To this end, during 2018, the Commission has relied on the information and advice provided by the leading global consulting firm on compensation of directors and senior managers, Willis Towers Watson.
In addition, the Board’s Risk Committee participates in the establishment of the remuneration policy, ensuring that it is compatible with adequate and effective risk management and that it offers no incentives to assume risks beyond the level tolerated by the Group. As atyear-end 2018, the Risk Committee includes one of the members of the Remunerations Committee.
Since 2011, BBVA has a specific remuneration system applicable to members of the Identified Staff, designed within the framework of applicable regulations to credit institutions (in particular, Directive 2010/76/EU (“CRD III”), the superseding and implementing regulations) and considering best practices and recommendations at the local and international levels in this matter.
As regards the members of the Board of Directors, BBVA has a specific remuneration policy applicable to its directors (the “BBVA Directors’ Remuneration Policy”) which distinguishes between the remuneration system applicable tonon-executive directors and that applicable to executive directors, in accordance with the provisions of the BBVA Bylaws. The remuneration system for executive directors corresponds, in general, to that applicable to the members of the Identified Staff, of which they are a part of, incorporating certain specific characteristics derived from their status as directors. The remuneration system ofnon-executive directors6 is based on the criteria of responsibility, dedication and incompatibilities inherent to the position they hold, and consists exclusively of fixed elements, not receiving variable remuneration.
As indicated above, the Remunerations Committee has, among its functions, that of proposing to the Board, for submission to the General Meeting, the remuneration policy of directors, as regards their concepts and their amounts, parameters for its determination and distribution system. It likewise submits the corresponding report, in the terms established at any point in time by applicable law.
The BBVA Directors’ Remuneration Policy applicable during 2018 was approved by the General Meeting in 2017, and is available on the Bank’s corporate website (www.bbva.com).
With regard to the rest of the Identified Staff, it is likewise the responsibility of the Remunerations Committee to propose the remuneration policy of senior managers and other employees who are members of the BBVA Group’s Identified Staff.
The latest update of the remuneration policy applicable to the BBVA Group’s Identified Staff, including the Senior Management, took place in 2017, in order to adapt it to the requirements established in Bank of Spain Circular 2/2016 and the European Banking Authority Guidelines on sound remuneration policies, dated 27 June 2016.
This policy is integrated within the remuneration policy applicable in general to the entire staff of BBVA and the subsidiaries that form part of its consolidated group (the “BBVA Group Remuneration Policy”) and includes, in a specific chapter, the special characteristics of the remuneration system applicable to Identified Staff, as well as their Identification Procedure. All in accordance with what is established in the applicable regulations, as detailed in the following sections.
| 6 | Regardingnon-executive directors, these are defined as Risk Takers by virtue of the provisions of Article 3 of Delegated Regulation 604/2014, although, as detailed in section 5.3, below, they are subject to a specific remuneration system, different from that applicable to executive directors, and do not receive variable remuneration. |
| 190 |
Table of Contents
The BBVA Group Remuneration Policy, approved by the Board upon the proposal of the Remunerations Committee, is coordinated at the corporate level by BBVA’s Talent and Culture department, and the Bank’s control functions actively and regularly cooperate in its design and oversight, in accordance with the attributions conferred by applicable regulations.
The remuneration system applicable to Identified Staff members aims to deepen the alignment of BBVA’s remuneration practices with applicable regulations, good governance recommendations, and best practices in the matter. This system is generally applicable to the executive directors of BBVA, as members of said Staff, although they are subject to the provisions of BBVA Directors’ Remuneration Policy approved by the General Meeting and not to the Group Policy, as has been detailed.
Over the course of financial year 2018, the Remunerations Committee has analysed the remuneration proposals necessary for the development and implementation of these remuneration policies, and, in particular, for the implementation of the special system for the settlement and payment of the annual variable remuneration of Identified Staff members.
Thus, the Remunerations Committee has analysed the adequacy of the annual performance indicators used for the calculation of the annual variable remuneration for executive directors during 2018 and their corresponding weightings, as well as the targets and scales of achievement associated with these indicators, submitting the corresponding resolutions to the Board for approval.
Furthermore, the Commission has analysed the minimum thresholds of Attributed Profit and Capital Ratio established asex ante adjustments to the variable remuneration of the Identified Staff, as well as their corresponding scales, established to determine the accrual of annual variable remuneration of executive directors for financial year 2018 and the rest of the Identified Staff.
Likewise, the Remunerations Committee has determined, for its submission to the Board, the multi-year performance indicators established asex-post adjustments, applicable to the deferred annual variable remuneration for financial year 2018 of the executive directors and the rest of the Identified Staff, including Senior Management. For this purpose, the Remunerations Committee counted on the previous analysis carried out by the Board’s Risk Committee, which ensured the adequacy of the aforementioned with the Bank’s risk profile.
On the other hand, within the framework of the function attributed to the Remunerations Committee for the observance and periodic review of the remuneration policy applicable to the Identified Staff, it has carried out the review of the 2017 BBVA Group Remuneration Policy, in accordance with applicable regulations and recommendations. To this end, this review has analysed the BBVA Group’s Remuneration Policy, which includes the remuneration policy of the Identified Staff, as well as their identification process, based on the central and independent internal review carried out by the Bank’s Internal Audit department, with the foregoing duly reported to the Board.
The Commission has also received information on the application of the Identification Process for Risk Takers in the BBVA Group in 2018 from the Bank’s technical areas, in accordance with the criteria established under the applicable regulations and the internal criteria established by the Bank, including both the number of persons identified and the information regarding the excluded members, duly reporting the aforementioned to the Board.
In addition, in 2018 the Remunerations Committee has submitted the proposal to the Board, for its submission to the 2018 General Shareholders’ Meeting, regarding the increase of the maximum variable remuneration level of up to 200% of the fixed component of the total remuneration for a certain group of employees whose professional activities have a significant impact on the Group’s risk profile. Likewise, the Commission submitted
| 191 |
Table of Contents
to the Board the Report that accompanies this agreement and which was made available to the Bank’s shareholders.
Lastly, in accordance with the proposal raised by the Remunerations Committee, the Board approved the Annual Report on Remuneration of the Directors of BBVA, according to the model established by the National Securities Market Commission, which is annually submitted to an advisory vote on the Board General Meeting of Shareholders, pursuant to Article 541 of the Corporate Enterprises Act, and which is available on the Bank’s corporate website (www.bbva.com) from the date on which the General Meeting was convened.
The Annual Report on the Remuneration of Directors of BBVA contains a description of the basic principles of the remuneration policy of the Bank as regards Board members, both executive andnon-executive, as well as a detailed presentation of the various elements and amounts that make up their remuneration.
All of the issues discussed above, along with other matters within its remit, are detailed in the Remunerations Committee Activity Report for financial year 2018, published on the Bank’s corporate website at the time the General Meeting was convened (www.bbva.com).
Thus, as indicated above, BBVA has a decision-making system in the field of remuneration, which features the Remunerations Committee as its central element, in charge of determining the remuneration policy applicable to the Identified Staff, and submitting the corresponding resolutions for approval by the Board. All of the above ensures an adequate decision-making process in the field of remuneration.
The members of the Remunerations Committee who have held such position during financial year 2018 have received a total amount of€268 thousand for their membership. In addition, the Annual Report on the Remuneration of BBVA Directors pertaining to said year includes the individual remuneration of each director.
| 5.2. | Description of the different types of employees included in the Identified Staff |
In accordance with the BBVA Group Remuneration Policy, the selection of the persons who make up the Group’s Identified Staff is part of an annual process, the determination of which is based on the qualitative and quantitative criteria established by Delegated Regulation (EU) No 604/2014 of 4 March 2014 supplementing Directive 2013/36/EU of the European Parliament and of the Council with regard to regulatory technical standards with respect to qualitative criteria and appropriate quantitative criteria to identify categories of staff whose professional activities have material impact on an institution’s risk profile (the “Delegated Regulation 604/2014”). This process also includes internal criteria established by BBVA, complementary to those indicated in said Regulation, in compliance with Rule 38 of Circular 2/2016 of the Bank of Spain (hereinafter, the “Identification Process”).
The qualitative criteria established in the Identification Process are defined based on the responsibility of the position (for example, members of BBVA’s management body, members of BBVA’s Senior Management, personnel responsible for control functions and other key functions or significant business units within the Group), as well as on the basis of the staff’s capacity or responsibility to assume or manage risks.
The quantitative criteria establish that employees have a significant impact on the Group’s risk profile based on total remuneration granted, unless BBVA determines that, in fact, the activity of such personnel has no significant impact on the risk profile, in accordance with the provisions contained in Article 4 of Delegated Regulation 604/2014.
The Identification Process is updated during the year and takes all BBVA Group personnel into consideration, allowing the inclusion of personnel in the Identified Staff who meet or are likely to meet the qualitative criteria established under Article 3 of Delegated Regulation 604/2014 for at least three months in a given financial year.
| 192 |
Table of Contents
All the companies that form part of the BBVA Group will actively participate in the Identification Process carried out by BBVA, providing all information necessary in order to adequately identify the personnel having a significant impact on the Group’s risk profile.
In accordance with the detailed Identification Process, a total of 578 Risk Takers were identified atyear-end 2018, including:
| · | Members of BBVA’s Board of Directors.7 |
| · | Members of BBVA’s Senior Management. |
| · | Risk Takers by function: collective defined by the functions that correspond to the qualitative criteria established under Article 3 of Delegated Regulation 604/2014, between points 4 and 15, both inclusive, as well as those Risk Takers identified according to Bank’s internal criteria. |
| · | Risk Takers by remuneration: composed of those employees who met the quantitative criteria of Article 4 of the aforementioned Delegated Regulation 604/2014. |
The total number of Risk Takers identified in financial year 2018 has remained at a level similar to the previous year, in which the total number of members identified amounted to 572 persons, with the figure thus not having experienced significant changes.
Notwithstanding the foregoing, BBVA will adapt the definition of the Identified Staff, including the categories of professionals deemed necessary at any time, in accordance with the requirements established for that purpose in applicable regulations.
| 5.3. | Key features of the remuneration system |
As detailed in section 5.1, at the proposal of the Remunerations Committee, the Board approved the Remuneration Policy of the BBVA Group in 2017, which includes the remuneration system applicable to Identified Staff, as well as the Identification Process detailed in section 5.2 above.
The BBVA Group Remuneration Policy is geared towards the recurrent generation of value for the Group, seeking, at the same time, alignment of the interests of its employees and shareholders with sound risk management.
This policy is one of the elements designed by the Board as part of BBVA’s corporate governance system to ensure proper management of the Group, and is based on the following principles:
| · | the creation of long-term value; |
| · | rewarding the achievement of results based on sound and responsible risk-assumption; |
| · | attracting and retaining the best professionals; |
| · | reward the level of responsibility and professional track record; |
| · | ensuring internal equity and external competitiveness and; and |
| · | ensuring transparency of the remuneration model. |
| 7 | Regardingnon-executive directors, these are defined as Risk Takers by virtue of the provisions of Article 3 of Delegated Regulation 604/2014, although, as detailed in section 5.3, below, they are subject to a specific remuneration system, different from that applicable to executive directors, and do not receive variable remuneration. |
| 193 |
Table of Contents
BBVA has defined the Group Remuneration Policy on the basis of the general principles outlined above, taking into consideration the need to comply with legal requirements for credit institutions and those applicable in the different sectors in which it carries out its business, as well as alignment with best market practices, while including items devised to reduce exposure to excessive risks and adjust remuneration to the targets, values and long-term interests of the Group. To this end, the Policy is guided by the following premises:
| ✓ | it is compatible with and promotes sound and effective risk-management, not offering incentives to take risks that exceed levels tolerated by the BBVA Group; |
| ✓ | it is in line with BBVA Group’s business strategy, objectives, values and long-term interests and will include measures to avoid conflicts of interest; |
| ✓ | it provides a clear distinction between the criteria for the establishment of fixed remuneration and variable remuneration; |
| ✓ | it promotes equal treatment for all staff, not discriminating due to gender or other personal characteristics; and |
| ✓ | it seeks to ensure that remuneration is not based exclusively or primarily on quantitative criteria and that it takes into account adequate qualitative criteria, which reflect compliance with the applicable regulations. |
In accordance with the above, the remuneration model of general application to the entire staff is implemented through the following elements:
| a) | A fixed remuneration, which takes into account levels of responsibility, functions performed, and the professional trajectory of each employee, as well as the principles of internal equity and the value of the function in the market, constituting a relevant part of the total compensation. |
The award and the amount of the fixed remuneration are based on predetermined andnon-discretionary objective criteria.
| b) | Variable remuneration, constituted by those payments or benefits additional to the fixed remuneration, monetary or not, based on variable parameters. Variable remuneration shall not limit the ability of the Group to strengthen its capital base in any way in accordance with regulatory requirements and shall take into account current and future risks as well as the necessary capital and liquidity costs reflecting sustainable income and adapted to risk. |
Guaranteed variable remuneration, in any of its forms, will not be part of the Group’s variable remuneration models. BBVA may only grant guaranteed variable remuneration on an exceptional basis, and solely within the framework of the conditions established under applicable regulations.
Within this generally applicable remuneration model, the BBVA Group Remuneration Policy includes certain special characteristics applicable, on the one hand, to personnel who exercise supervisory functions and, on the other hand, to personnel involved in the provision of services to clients. Thus:
| i. | Personnel who perform control functions are independent of the business units that they supervise, have the necessary authority, and are remunerated according to the achievement of certain objectives related to their functions, regardless of the results of the business areas that they supervise. |
In order to reinforce the independence and objectivity of these functions, the fixed components of their remuneration have a greater weight than that of the variable components, the latter being related, for the most part, to the objectives of the function.
| 194 |
Table of Contents
In addition, the remuneration of BBVA senior managers in independent control functions, including compliance and risk management functions, is directly overseen by the BBVA Remunerations Committee, as in the case of the remaining members of Senior Management.
| ii. | In designing and establishing the remuneration of the personnel involved in the provision of services to clients, care must be taken to protect their interests and the quality of the services provided, so that: |
| · | responsible business conduct and fair treatment of clients is encouraged; |
| · | no incentives are established that could induce staff to put their own interests or those of the BBVA Group in a possible opposition to the interests of their clients; |
| · | remuneration is not linked primarily or exclusively with the sale of a product or a particular category or type of products, such as certain products that are more profitable for the entity or the employee, where there are others more appropriate with customer needs; or that such objective is assigned as the one with greatest weight in the determination of remuneration; and |
| · | an adequate balance is maintained between the fixed and variable components of remuneration. |
Based on the principles and premises mentioned above, and in compliance with the regulatory requirements established in Act 10/2014 and its implementing regulations, BBVA has defined the particularities of the remuneration policy applicable to Identified Staff, designing an incentive system specifically oriented to maintain the alignment of their remuneration with risks, as well as with the Group’s long-term objectives and interests. The result is a remuneration scheme for the Identified Staff based on the following fundamental characteristics:
| · | Balance between the fixed components and the variable components of the overall remuneration, in line with that established in the applicable regulations, allowing a fully flexible policy regarding the payment of variable components, which may cause them to be reduced, depending on the situation, up to their entirety. The proportion between the two components has been established taking into account the type of functions carried out by each beneficiary (business, support or supervision) and, consequently, their impact on the risk profile, adapted in each case to the reality existing in the different countries or functions. |
| · | The variable remuneration of the members of the Identified Staff will be based on an effective management of the risks and linked to the degree of achievement of previously established financial andnon-financial objectives, as defined at the Group, Area and Individual level, taking into account current and future risks assumed and the Group’s long-term interests. |
| · | Variable remuneration of Identified Staff members for each financial year shall not accrue, or will accrue in a reduced amount, should certain level of profits and capital ratios not be achieved. It will also be subject toex ante adjustments, so that it shall be reduced at the time of the performance assessment in the event of negative performance of the Group’s results or other parameters such as the level of achievements of budgeted targets. |
| · | The annual variable remuneration for each Identified Staff member shall be calculated on the basis of: (i) annual performance indicators for the Group, area and individual (financial andnon-financial); (ii) scales of achievement, as per the weightings allocated to each indicator; and (iii) a “target” annual variable |
| 195 |
Table of Contents
remuneration, representing the amount of annual variable remuneration if 100% of thepre-established targets are met. The resulting amount shall constitute the annual variable remuneration of each beneficiary (hereinafter the “Annual Variable Remuneration”). |
In the event of termination of contractual relationship of an Identified Staff member before the closing of the financial year to which the Annual Variable Remuneration corresponds, the member will have the right to receive the proportional amount of said Annual Variable Remuneration,pro-rated for the length of service provided in the financial year and subject, in any case, to the same settlement and payment system applicable had the member remained active, in accordance with the rules set out below. The above shall not be applicable to cases where the termination of contractual relationship is due to a voluntary resignation or lawful dismissal, where the right to receive the Annual Variable Remuneration shall not accrue.
| · | The Annual Variable Remuneration for Identified Staff members shall be subject to specific rules for settlement and payment, specifically: |
| ○ | 60% of the Annual Variable Remuneration will be paid, if conditions are met, in the year following that to which it corresponds (the “Upfront Portion”). For executive directors, members of the Senior Management and Identified Staff members with particularly high variable remuneration, the Upfront Portion will be 40% of the Annual Variable Remuneration. The remaining portion will be deferred in time (hereinafter, the “Deferred Component”). |
| ○ | The deferral period will be 5 years for executive directors and members of Senior Management, and 3 years for the remaining Risk Takers. |
| ○ | 50% of the Annual Variable Remuneration, both of the Upfront Portion and Deferred Component, shall be established in BBVA shares. As regards executive directors and Senior Management, a larger proportion of the Deferred Component shall be established in shares (60%). |
| ○ | Shares received as Annual Variable Remuneration shall be withheld for aone-year period after delivery, except for the transfer of those shares required to honor the payment of taxes. |
As regards executive directors, the Remuneration Policy for BBVA Directors additionally includes a commitment of the executive directors not to transfer a number of shares equivalent to twice their annual fixed remuneration for a period of, at least, three years from the time of their vesting, on top of the generalone-year retention period applicable to all the shares. The aforementioned shall not apply to the transfer of those shares required to honor the payment of taxes.
| ○ | The Deferred Component of the Annual Variable Remuneration may be reduced in its entirety, but never increased, based on the result of multi-year performance indicators aligned with the Group’s core risk management and control metrics related to the solvency, capital, liquidity, profitability or to the share performance and the recurring results of the Group, measured over a period of three years. |
These multi-year performance indicators are approved by the Board at the proposal of the Remunerations Committee, following an analysis by the Risk Committee, which ensures they are appropriate to align deferred remuneration with sound risk management.
| 196 |
Table of Contents
These multi-year performance indicators to which the Deferred Component of Annual Variable Remuneration for 2018 will be subject, approved by the Board at the proposal of the Remunerations Committee, are as follows:
TABLE 89. Settlement and payment system for Annual Variable Remuneration
| Indicator | Weight | |||
| Economic Adequacy (Economic Equity/Economic Capital at Risk) | 20% | |||
| Common Equity Tier (CET ) 1 Fully Loaded | 20% | |||
| Liquidity Coverage Ratio (LCR) | 10% | |||
| Loan to Stable Customer Deposits (LtSCD) | 10% | |||
| Return on Equity (ROE) | 20% | |||
| (Operating Income - Loan-loss provisions) / Average Total Assets | 10% | |||
| Total Shareholder Return (TSR) | 10% | |||
These multi-year performance indicators have certain scales of achievement associated, approved by the Board at the proposal of the Remunerations Committee. Thus, if the targets set for each indicator in the3-year measurement period from the start of the deferral period are not achieved, the Deferred Component of Annual Variable Remuneration for 2018 may be reduced, even in its entirety, but never increased.
In the case of executive directors and Senior Management, the Deferred Component of Annual Variable Remuneration payable subject to the multi-year performance indicators shall be delivered, if the conditions are met, according to the following schedule: 60% after the third year of deferral, 20% after the fourth year of deferral and 20% after the fifth year of deferral.
| ○ | Resulting cash portions of the Deferred Component of Annual Variable Remuneration finally vested, subject to the multi-year performance indicators, shall be updated in accordance with the Consumer Price Index, measured as theyear-on-year change in prices, or any other established for such purposes by the Board of Directors. |
| ○ | The entire Annual Variable Remuneration shall be subject to malus and clawback arrangements during the whole deferral and withholding period, under the terms indicated below. |
| ○ | No personal hedging strategies or insurance may be used in connection with remuneration or liability that may undermine the effects of alignment with sound risk management. |
| ○ | The variable component of the remuneration for a financial year shall be limited to a maximum amount of 100% of the fixed component of total remuneration, unless the General Meeting resolves to increase this percentage up to a maximum of 200%. As explained in detail in section 5.7 of this report, the General Shareholders’ Meeting held on March 16, 2018 authorized a raise of the maximum limit to 200%, for a maximum of 238 Risk Takers. |
In addition, as indicated above, up to 100% of the Annual Variable Remuneration of each Identified Staff member corresponding to each financial year shall be subject to malus and clawback arrangements, both linked to a downturn in financial performance of the Bank as a whole, or of a specific unit or area, or of exposures generated by an Identified Staff member, when such downturn in financial performance arises from any of the following circumstances:
| a) | Misconduct, fraud or serious infringement of the Code of Conduct and other applicable internal rules by an Identified Staff member. |
| 197 |
Table of Contents
| b) | Regulatory sanctions or judicial convictions due to events that could be attributed to a specific unit or to the staff responsible for such events. |
| c) | Significant failure of risk management committed by the Bank or by a business or risk control unit, to which the willful misconduct or gross negligence of an Identified Staff member contributed. |
| d) | Restatement of the Bank’s annual accounts, except where such restatement is due to a change in applicable accounting legislation |
For these purposes, the Bank will compare the performance assessment carried out for the Identified Staff member with the ex post behavior of some of the criteria that contributed to achieve the targets. Both malus and clawback will apply to the Annual Variable Remuneration of the financial year in which the event giving rise to application of the arrangement occurred, and they shall be in force during the entire period of deferral and retention applicable to the Annual Variable Remuneration.
Notwithstanding the foregoing, in the event that these scenarios give rise to a dismissal or termination of contract of the Identified Staff member due to serious and guilty breach of duties, malus arrangements may apply to the entire deferred Annual Variable Remuneration pending payment at the date of the dismissal or termination of contract, in light of the extent of the damage caused.
In any case, the variable remuneration is paid or vests only if it is sustainable according to the Group’s situation as a whole, and justified on the basis of the performance of the Bank, the business unit and of the Identified Staff member concerned.
Regarding payments for the early termination of contracts for Identified Staff members, in accordance with the provisions of the BBVA Group Remuneration Policy and in line with the applicable regulations, they shall be based on the results obtained over time. In no case shall bad results or inappropriate conduct be rewarded, and payments shall not be awarded in cases where there have been clear and serious infringements that justify the immediate termination of contract or the dismissal of the Identified Staff member. As regards BBVA directors, the Bank has no commitments to pay severance indemnity.
As regards the pension policy, it shall be compatible with the entity’s long-term business strategy, objectives, values and interests. In accordance with the foregoing, BBVA has a pension system in place, arranged on the basis of geographic areas and coverage offered to different groups of employees. In general, the Bank’s pension schemes are defined-contribution. The contributions to pension schemes of the Group’s employees are made within the framework of applicable labor law and individual or group agreements applicable in each entity, sector or geographic area. BBVA will determine the characteristics of the pension commitments with the different professional categories of employees, including the pensionable salary.
The basis for the calculation of the benefits (commitments for retirement, death and disability) reflect fixed annual amounts; no temporary fluctuations exist derived from variable components or individual results.
As regards executive directors and members of the Senior Management, they are subject to the specificities included in applicable regulations regarding “discretionary pension benefits.” Thus, 15% of the annual contributions agreed to cover the pension commitments will be based on variable components and be considered “discretionary pension benefits”, subject to the conditions established in the applicable regulations and remuneration policies. Detailed information on the implementation of pension commitments accrued in the year ended may be consulted in Note 54 of the Annual Report corresponding to the Consolidated Financial Statements of the Bank for 2018, available on the Bank’s corporate website (www.bbva.com).
| 198 |
Table of Contents
As regardsnon-executive directors, the Remuneration Policy for BBVA Directors distinguishes between the remuneration system applicable to executive directors and the system applicable tonon-executive directors, as set out in the Bank’s Bylaws. A detailed description of the remuneration system fornon-executive BBVA directors is included in the mentioned Policy, and the implementation of this system has been explained in the Annual Report on the Remuneration of BBVA Directors corresponding to 2018. Both documents are available on the Bank’s corporate website (www.bbva.com).
As set out in those documents,non-executive directors do not receive variable remuneration; they receive a fixed annual amount in cash for holding the position of director and as members of the various committees, with greater weight allocated to the role as chair of each committee, and the amount depending on the nature and duties of the functions attributed to each committee.
In addition, the Bank has a remuneration system in shares with deferred delivery for itsnon-executive directors, approved by the General Meeting, which also constitutes fixed remuneration. It comprises an annual allocation tonon-executive directors, as part of their remuneration, of a number of “theoretical shares” of the Bank that will be delivered, where appropriate, after they leave directorship for any reason other than serious breach of their duties. The number of “theoretical shares” annually allotted to eachnon-executive director will be equivalent to 20% of their total remuneration in cash received the previous year, calculated according to the average closing prices of the BBVA share during the 60 trading sessions prior to the dates of the Annual General Shareholders’ Meetings that approve the financial statements for each year.
| 5.4. | Information on the link between the remuneration of Identified Staff and the performance of the Group |
As explained in the above sections, the BBVA Group Remuneration Policy includes the entitlement by Identified Staff members to an Annual Variable Remuneration, payment of which is subject toex ante adjustments and the amount of which is calculated according to compliance with the objectives established at the start of the year for each of the annual performance indicators, in accordance with the scales and weightings associated to each indicator. Thus, the amount of variable remuneration received by Identified Staff is linked to the results of the BBVA Group and varies in accordance with them.
Thus, the application of the scales of achievement defined for each indicator, on the basis on the targets established, has determined the amount of the Annual Variable Remuneration for executive directors. For the remaining Identified Staff members, along with the result of the Group’s annual performance indicators, the amount of Annual Variable Remuneration has been determined in accordance with the level of achievement of the financial andnon-financial strategic targets set for the area and for each individual, according to the weightings associated with each indicator which, as was already indicated, have been set according to the type of function carried out by each beneficiary (business, support or control).
During financial year 2018, the BBVA Group generated an Attributable Profit of€5,324 million, an increase of 51.3% over the previous year. Said attributed profit includes the result of corporate transactions generated by capital gains and other associated expenses from the sale of BBVA Chile for an amount of€623 million, net of taxes.
For the calculation of the result of the annual financial performance indicators that are part of the remuneration system applicable to the Identified Staff, as indicated in section 5.3 of this report, the aforementioned impact was not considered in the determination of the Annual Variable Remuneration for 2018, in light of it being caused by operations or circumstances that were considered by the Bank to be outside the ordinary management of the Group. In this regard, the results and evolution of the annual performance indicators established for the determination of the Annual Variable Remuneration for 2018 of the executive directors, which are also included as Group indicators for the remaining members of the Identified Staff, has been positive, representing increases with respect to
| 199 |
Table of Contents
the previous year in the four financial indicators (Attributed Profit, RORC, RAROEC and Efficiency Ratio). Of particular note is the good performance of recurring revenue, and lower loan-loss provisions, which offset the lower contribution from net trading income (NTI) compared to the same period the previous year.
Despite increases in the four financial indicators compared to the previous year, the attainment levels of Attributable Profit, RORC and Efficiency Ratio have been below the target established for the year. This is mainly a result of economic instability in Turkey and Argentina, whose behaviour is affected by the changes of exchange rates and the negative impact of hyperinflation accounting in Argentina.
Regarding the Customer Satisfaction indicator (IreNe), which is part of thenon-financial indicators, an improvement has been observed in almost all regions compared to the other competing financial institutions, resulting in a level of achievement of 99.1.
Accordingly, the Annual Variable Remuneration of the members of the Identified Staff is linked to the Group’s financial andnon-financial results, all within the framework and in accordance with the rules of the remuneration system detailed in section 5.3 of this report.
| 5.5. | Description of the criteria used to take into consideration present and future risks in the remuneration processes |
In line with what is detailed in section 5.3 of this report, the remuneration policy applicable to Risk Takers in 2018 has featured the following elements:
| - | Balance between the fixed components and the variable components of total remuneration. |
| - | Ex-ante adjustments, which have been verified prior to the determination of the Annual Variable Remuneration. |
| - | Use of indicators for the evaluation of results, incorporating current and future risk adjustments. Among the financial indicators defined at the Group level are RAROEC, an indicator that takes present and future risks into account and considers profit obtained in relation to the economic capital necessary to obtain those benefits, and which applies to all employees in general. In addition, this indicator is also included at the area level in the business areas. |
| - | When measuring the performance of financial andnon-financial indicators, consideration is given to both individual management aspects and to the targets set at the area and Group levels. |
| - | Upon measurement of performance of staff members performing control functions, greater weighting is given to objectives related to their specific functions, to strengthen the independence and objectivity of these functions. |
| - | At least 50% of Annual Variable Remuneration is established in shares (60% in the case of the Deferred Component of the executive directors and Senior Management). |
| - | Deferral clauses, designed so that a substantial portion of variable remuneration - 60% in the case of executive directors, Senior Management and Risk Takers with particularly high variable remuneration, 40% for the remaining cases – is deferred in time, thus taking into account the economic cycle and the business risks. The deferral period established for 2018 Annual Variable Remuneration is 5 years for executive directors and Senior Management, and 3 years for the remaining Risk Takers. |
| - | Inclusion of multi-year performance indicators, measured for the3-year period from the start of the deferral period, to which weightings have been attributed, and for |
| 200 |
Table of Contents
which scales of achievement have been established, so that in the event that the targets set for each indicator are not obtained, the Deferred Component of the Annual Variable Remuneration may be reduced, even in its entirety, yet never increased.
| - | Obligatory withholding periods of any shares delivered as Annual Variable Remuneration, so that beneficiaries may not freely dispose of them until one year after their delivery date, except for those that should be divested to pay tax obligations. |
| - | Prohibition of the use of personal hedging strategies or insurance related to remuneration and liability. |
| - | Limitation of the variable component of remuneration for the year to 100% of the fixed component of the total remuneration, except for the maximum of 238 employees for whom BBVA’s General Meeting held on March 16, 2018, authorized the application of a maximum ratio of 200%, as explained in detail in section 5.7 of this report. |
| - | Submission of the entire Annual Variable Remuneration to malus and clawback arrangements during the whole deferral and withholding period, under the terms indicated in section 5.3 of this report. |
| 5.6. | Main parameters and reasons for any component of the possible variable remuneration plans and othernon-cash benefits |
The main parameters of and motivation behind the components of the variable remuneration plans of the Identified Staff have been set out in the previous sections of this report.
| 5.7. | Ratios between the fixed and variable remuneration of Identified Staff |
As specified in section 5.3 above, in the total remuneration for Identified Staff the fixed and variable components must be appropriately balanced, in line with applicable regulations, to ensure a policy that is fully flexible with regard to payment of the variable components, allowing for such components to be reduced even in their entirety, where appropriate.
The proportion between both components is established taking into account the type of functions developed by each beneficiary (business, support or control) and, as a result, their impact on the risk profile, adapted in each case to the existing reality in the different countries where the Identified Staff members carry out their activity or functions.
For these purposes, the Bank has defined “target” ratios between fixed and target variable remuneration, which take into account both the function carried out by each Identified Staff member and the impact on the risk profile.
Notwithstanding the above, pursuant to applicable law, the variable component of Identified Staff members’ remuneration for a financial year shall be limited to a maximum amount of 100% of the fixed component of total remuneration, except for the functions for which the General Meeting agrees to raise this percentage to a maximum of 200%.
For these purposes, the General Meeting held on 16 March 2018 agreed to raise the maximum level of the variable component of remuneration up to a maximum of 200% of the fixed component of the total remuneration for certain members of the Identified Staff, all according to the Report issued by the Board for these purposes on 12 February 2018. Thus, the Bank submitted the following resolution to the General Meeting:
“For the purposes of the provisions of Article 34.1 g) of Act 10/2014 of June 26, on the regulation, supervision and solvency of credit institutions, to approve a maximum level
| 201 |
Table of Contents
of variable remuneration of up to 200% of the fixed component of total remuneration for a group of employees whose professional activities have significant impact on the Group’s risk profile, enabling subsidiaries of Banco Bilbao Vizcaya Argentaria, S.A., to likewise apply said maximum level to their professionals, pursuant to the Recommendations Report issued in this regard by the Board of Directors of Banco Bilbao Vizcaya Argentaria, S.A., on 12 February 2018, and which has been made available to shareholders as of the date on which this General Meeting was convened”.
This resolution was approved by the General Meeting for a maximum of 238 Risk Takers, with a favourable vote of 97.96% on 64.38% of the capital present or represented at said General Meeting.
The proposal submitted to the General Meeting included the detailed recommendation of the Board, explaining the reasons and scope of the decision proposed to the General Meeting and included the number of persons affected, as well as the expected effect on the maintenance of a sound capital base, taking into account the considerations established by the competent authority as regards dividend distribution policies.
As reflected in the Report of the Board, the persons for whom the higher level of remuneration was requested for financial year 2018 had one of the following functions:
| · | Executive members of BBVA’s Board of Directors. |
| · | Members of BBVA’s Senior Management. |
| · | Personnel who perform their functions in the business areas of Spain, the United States, Mexico, Turkey, countries of South America, and Corporate and Investment Banking (CIB). |
| · | Personnel who perform their functions in corporate support areas, which include members of the Identified Staff who work on a global basis for the Group as a whole, without being assigned to a particular business area. |
| 5.8. | Quantitative information on remuneration of the Identified Staff |
Afteryear-end 2018, and in accordance with the results obtained (described in section 5.4 above), the Annual Variable Remuneration for Identified Staff members corresponding to said year was calculated.
In accordance with the settlement and payment system established for 2018 Annual Variable Remuneration of Identified Staff members:
| · | The Upfront Portion will be paid, where applicable, in 2019, 40% in the case of executive directors, members of Senior Management and Identified Staff members with variable remuneration of particularly high amounts, and 60% for the remaining Identified Staff members. |
| · | The Deferred Component will be subject to the multi-year performance indicators mentioned in section 5.3 of this report, to be paid, if conditions are met, in 2022. For executive directors and members of the Senior Management, the Deferred Component will be paid, where applicable, according to the following schedule: 60% in 2022; 20% in 2023 and the remaining 20% in 2024. |
This gives rise, among others, to the amounts that are detailed in the following table, broken down by types of employees:
| 202 |
Table of Contents
TABLE 90: Total remuneration of Identified Staff in 2018 (Thousand Euro or number of shares)
| Remuneration for Identified Staff in 2018 | Executive Directors{1) | Non- executive Directors | Senior Management(2) | Rest of Identified Staff | Total Identified Staff | |||||||||||||||
| Number of beneficiaries of fixed remuneration | 3 | 12 | 15 | 548 | 578 | |||||||||||||||
| Amount of total fixed remuneration for 2018(3) | 5,530 | 3,867 | 17,005 | 200,884 | 227,285 | |||||||||||||||
| Number of beneficiaries of variable remuneration | 3 | 0 | 15 | 505 | 523 | |||||||||||||||
| Amount of total variable remuneration for 2018(4) | 5,431 | 0 | 7,074 | 75,663 | 88,167 | |||||||||||||||
In cash | 2,389 | 0 | 3,112 | 37,831 | 43,333 | |||||||||||||||
Number of BBVA shares | 638,098 | 0 | 833,880 | 8,028,391 | 9,500,369 | |||||||||||||||
Variable remuneration corresponding to 2018 payable in 2019 | 2,172 | 0 | 2,829 | 44,689 | 49,691 | |||||||||||||||
In cash | 1,086 | 0 | 1,415 | 22,345 | 24,845 | |||||||||||||||
Number of BBVA shares | 227,891 | 0 | 297,809 | 4,741,516 | 5,267,216 | |||||||||||||||
Outstanding deferred variable remuneration corresponding to 2018(5) | 3,258 | 0 | 4,244 | 30,974 | 38,476 | |||||||||||||||
In cash | 1,303 | 0 | 1,698 | 15,487 | 18,488 | |||||||||||||||
Number of BBVA shares | 410,207 | 0 | 536,071 | 3,286,875 | 4,233,153 | |||||||||||||||
(1) Includes the 2018 remuneration of Carlos Torres Vila, Jose Manuel Gonzalez-Paramo Martinez-Murillo and Francisco Gonzalez Rodriguez. The current CEO, Onur Genp, appointed by the Board of Directors on December 20th, 2018, has not received any remuneration for his tenure in 2018, being his remuneration included in “Other Identified Staff”. Note 54 of the Annual Report of BBVA’s Consolidated Financial Statements details individualized information for each one of them.
(2) Includes information of the members of Senior Management, excluding executive directors, that had such condition until December 20th, 2018. Members of Senior Management appointed by the Board of Directors on December 20th, 2018, (5 members) have not received any remuneration for such condition and their remuneration is included under “Rest of Identified Staff”. Note 54 of the Annual Report of BBVA’s Consolidated Financial Statements details the aggregated information of each of these group’s remuneration.
(3) Fixed compensation received in 2018, including cash and in kind, except as regards benefit schemes.
In the case of executive directors and members of the Senior Management, contributions made by the Bank in 2018 in relation to agreed upon benefit schemes are detailed in Note 54 of the Annual Report of BBVA’s Consolidated Financial Statements.
In the case ofnon-executive directors, their remuneration system includes, in addition, a fixed remuneration with deferred delivery of shares after leave of directorship. Information regarding such system, including the number of “theoretical shares” allocated in 2018 (corresponding to 20% their fixed compensation received the previous year), is displayed in Note 54 of the Annual Report of BBVA’s Consolidated Financial Statements.
(4) According to applicable regulations, 15% of annual contributions agreed to cover retirement contingencies of executive directors and members of the Senior Management will be based on variable remuneration. Detailed information regarding the implementation of benefit-scheme entitlements in 2018 can be found in Note 54 of the Annual Report of BBVA’s Consolidated Financial Statements.
(5) The variable remuneration corresponding to 2018 that is deferred and outstanding is subject to multi-year performance indicators related to the Risk Appetite Framework and shareholder profitability that can reduce, even in its entirety (but never increase), the outstanding deferred amounts.
TABLE 91: Extraordinary remuneration of the Identified Staff in 2018 (Thousand Euro)
| Extraordinary remuneration | Executive Directors | Non- directors | Senior Management | Rest of Identified Staff | Total Identified Staff | |||||||||||||||
| Number of beneficiaries of guaranteed bonuses | - | - | - | 1 | 1 | |||||||||||||||
| Total amount of guarantees bonuses granted in 2018 | - | - | - | 92 | 92 | |||||||||||||||
| Number of beneficiaries of hiring incentives | - | - | - | 2 | 2 | |||||||||||||||
| Total amount of hiring incentives paid in 2018 | - | - | - | 319 | 319 | |||||||||||||||
| Number of beneficiaries of severance indemnity | - | - | - | 23 | 23 | |||||||||||||||
| Total amount of severance indemnity paid in 2018(1) | - | - | - | 13,208 | 13,208 | |||||||||||||||
Paid in 2018 | - | - | - | 10,098 | 10,098 | |||||||||||||||
Deferred amount | - | - | - | 3,110 | 3,110 | |||||||||||||||
(1) At the time of disengagement of severance indemnity beneficiaries,non-competition agreements have been signed with some staff members, for a total amount of 10,917 thousand euro, which will be paid periodically over the course of thenon-competition period. In line with applicable regulations, neither legal indemnity amounts nor the aforementioned amounts linked tonon-competition agreements have been taken into account for the purposes of calculating the fixed/variable ratio, the application of deferral and payment in instruments.
Of the total indemnities paid, the highest paid to a single member amounts to€2,620 thousand.
In addition, in accordance with Rule 40.1 of Circular 2/2016 of the Bank of Spain, indication is given that, of the 23 cases of payments for early termination of contracts, there is one case in which the amount paid has exceeded two annuities of the fixed remuneration.
In 2018, payment has also been made of the amounts deferred from years prior to 2018. The following table shows the amounts paid in both cash and shares, as well as the amounts that remain outstanding as at December 31, 2018:
| 203 |
Table of Contents
TABLE 92: Deferred variable remuneration from periods prior to 2018 (Thousand Euro or number of shares)
| Deferred variable remuneration for years prior to 2018 for the Identified Staff | Executive Directors (3) | Non- executive | Senior Management | Rest of Identified Staff | Total Identified Staff | |||||||||||||||
| Vested(1) | ||||||||||||||||||||
In cash | 470 | - | 573 | 7,104 | 8,147 | |||||||||||||||
Number of BBVA shares | 52,834 | - | 64,853 | 821,126 | 938,813 | |||||||||||||||
| Outstanding(2) | ||||||||||||||||||||
In cash | 4,510 | - | 7,123 | 61,715 | 73,348 | |||||||||||||||
Number of BBVA shares | 774,779 | - | 1,189,564 | 9,471,193 | 11,435,536 | |||||||||||||||
Implicit ex-post adjustments applied in the year | - | - | - | - | - | |||||||||||||||
Explicit ex-post adjustments applied in the year | - | - | - | - | - | |||||||||||||||
(1) Includes deferred amounts of variable remuneration from previous years paid in 2018 and their update (last third of the 2014 deferred variable remuneration).
(2) Includes deferred variable remuneration corresponding to years prior to 2018 pending payment at December 31st 2018 (full deferred variable remuneration for 2015, 2016 and 2017).
(3) The amounts of deferred variable remuneration corresponding to previous years, paid in 2018, are detailed, individually for each executive director, in Note 54 of the Annual Report of BBVA’s Consolidated Financial Statements. As regards outstanding deferred variable remuneration at the end of 2018, the amounts corresponding to each executive director are as follows:
- The entire 2015 deferred annual variable remuneration: 897 thousand euro and 135,299 BAE shares in the case of Francisco Gonzalez Rodriguez; 530 thousand euro and 79,956 BAE shares in the case of Carlos Torres Vila: and 98 thousand euro and 14,815 BAE shares in the case of Jose Manuel Gonzalez-Paramo Martinez- Murillo.
- The entire 2016 deferred annual variable remuneration: 734 thousand euro and 114,204 BAE shares in the case of Francisco Gonzalez Rodriguez; 591 thousand euro and 91,915 BAE shares in the case of Carlos Torres Vila and 89 thousand euro and 13,768 BAE shares in the case of Jose Manuel Gonzalez-Paramo Martinez-Murillo.
- The entire 2017 deferred annual variable remuneration: 792 thousand euro and 163.680 BAE shares in the case of Francisco Gonzalez Rodriguez; 675 thousand euro and 139.488 BAE shares in the case of Carlos Torres Vila and 105 thousand euro and 21.654 BAE shares in the case of Jose Manuel Gonzalez-Paramo Martinez- Murillo.
The following table shows the total remuneration of the Identified Staff in 2018 by activity area:
TABLE 93: Remunerations of Identified Staff in 2018 by activity areas (Thousand Euro)
| Activity area | Number of people | 2018 total remuneration(1) | Average variable/fixed ratio | |||||||||
| Executive Directors(2) | 3 | 10,960 | 87% | |||||||||
| Non-executive Directors | 12 | 3,867 | 0% | |||||||||
| Senior Management(3) | 15 | 24,078 | 41% | |||||||||
| Commercial Banking(4) | 184 | 107,519 | 41% | |||||||||
| Investment Banking(5) | 90 | 51,333 | 55% | |||||||||
| Asset Management(6) | 25 | 12,636 | 61% | |||||||||
| Corporate functions(7) | 130 | 66,584 | 31% | |||||||||
| Control functions(8) | 119 | 38,474 | 21% | |||||||||
| Others(9) | - | - | - | |||||||||
| Total Identified Staff | 578 | 315,452 | - | |||||||||
(1) Fixed remuneration paid in 2018 and variable remuneration accrued in 2018.
(2) Includes the 2018 compensation received by Carlos Torres Vila, Jose Manuel Gonzalez-Paramo Martinez-Murillo and Francisco Gonzalez Rodriguez. The current CEO, Onur Genp, appointed by the Board of Directors on December 20th, 2018, has not received any compensation for his tenure in 2018. Note 54 of the Annual Report of BBVA’s Consolidated Financial Statements displays individualized information for each one of them.
(3) Includes information of the members of Senior Management, excluding executive directors, that had such condition until
(4) Includes Retail, Business, Corporate and Insurance activities.
(5) Includes trading and other Investment Banking activities.
(6) Includes Asset Management and Private Banking activities.
(7) Includes support areas of the BAE Group and business support areas (Finance, Legal, Human Resources, etc.)
(8) Includes Risk Management, Internal Audit and Compliance activities.
(9) Rest of activities not included in previous categories.
| 204 |
Table of Contents
On the other hand, the number of employees with a remuneration equal to or greater than€1 million is as follows:
TABLE 94: Number of individuals with total remuneration in excess of €1 million in 2018
| Total remuneration in 2018(1) | Number of individuals | |||
| Between 6 million and 7 million euro | ||||
| Between 5 million and 6 million euro | 1 | |||
| Between 4.5 million and 5 million euro | 1 | |||
| Between 4 million and 4.5 million euro | 0 | |||
| Between 3.5 million and 4 million euro | 1 | |||
| Between 3 million and 3.5 million euro | 0 | |||
| Between 2.5 million and 3 million euro | 2 | |||
| Between 2 million and 2.5 million euro | 3 | |||
| Between 1.5 million and 2 million euro | 7 | |||
| Between 1 million and 1.5 million euro | 30 | |||
| Total | 46 | |||
(1) Sum of fixed compensation for the year 2018 and variable compensation accrued in 2018. The deferred component of variable compensation is subject to multi-year indicators and targets which could reduce (never increase) such deferred component and, therefore, total compensation for the year 2018.
| 205 |
Table of Contents
6. Information on the Corporate Governance system
In addition to the information that has been dealt with in this Report, and as regards the remaining information on the corporate governance system of Part Eight of the CRR, readers are referred to the 2018 Annual Corporate Governance Report, which forms part of the Management Report that accompanies the BBVA Group’s Consolidated Financial Statements and to BBVA’s Board of Directors selection, appointment, rotation and diversity policy, both documents being accessible on the corporate website (www.bbva.com).
| 206 |
Table of Contents
On 15 January, the irrevocable decision was announced for early amortisation on 19 February 2019 of the issuance of potentially convertible preferred shares (additional Tier 1 capital instruments) performed by the Bank on 19 February 2014 for an amount of EUR 1.5 billion, coinciding with the First Reset Date of said issuance, and at such point that the corresponding authorisation has been obtained by the Regulator.
At its meeting held on 31 January 2019, the Board of Directors agreed to issue bonds convertible into ordinary BBVA shares, excluding thepre-emptive subscription right, under the power delegated by the General Shareholders’ Meeting of the Company held on 17 March 2017, in the fifth point on the agenda, which is currently pending execution.
On 1 February, it was announced that a cash payment of EUR 0.16 gross per share in April as a supplementary dividend for fiscal year 2018 was expected to be submitted for consideration by the corresponding government bodies.
The results of the supervisory review and evaluation process (SREP) were announced on 14 February.
On 19 February, the irrevocable decision was announced to redeem the issuance of subordinated bonds (Subordinated Notes) on 11 April 2019 that has been computed as Tier 2 capital for an amount of 1.5 billion, coinciding with the Optional Amortisation date of said issue, and at such point that the corresponding authorisation has been obtained by the European Central Bank.
There have been no other events from 1 January 2019 until the date of preparation of this report that were not mentioned in this report and that might significantly affect the results of the Group or its financial position.
| 207 |
Table of Contents
Annex I. EU – LI3. Outline of the differences in the scopes of consolidation and non – deducted participations in insurance undertakings
| Company | Method of accounting consolidation | Method of regulatory consolidation | Deducted | Activity | Participation | Consolidated Cost | ||||||
| ALTURA MARKETS SOCIEDAD DE VALORES SA | Equity method | Proportional consolidation | N/A | Securities Dealer | 50% | 69 | ||||||
| ANIDA PROYECTOS INMOBILIARIOS, S.A. DE C.V. | Fully consolidation | Equity method | N/A | Real Estate | 100% | 47 | ||||||
| BAHIA SUR RESORT S.C. | Fully consolidation | Equity method | N/A | Real Estate | 100% | 1 | ||||||
| BBVA AGENCIA DE SEGUROS COLOMBIA LTDA | Fully consolidation | Equity method | No | Insurance | 100% | 0 | ||||||
| BBVA BANCOMER SEGUROS SALUD SA DE CV | Fully consolidation | Equity method | No | Insurance | 100% | 11 | ||||||
| BBVA BROKER CORREDURIA DE SEGUROS Y REASEGUROS SA | Fully consolidation | Equity method | No | Insurance | 100% | 12 | ||||||
| BBVA BROKER SA | Fully consolidation | Equity method | No | Insurance | 100% | 7 | ||||||
| BBVA COMPASS INSURANCE AGENCY, INC | Fully consolidation | Equity method | No | Insurance | 100% | 38 | ||||||
| BBVA CONSOLIDAR SEGUROS SA | Fully consolidation | Equity method | No | Insurance | 100% | 26 | ||||||
| BBVA CONSULTORIA, S.A. | Fully consolidation | Equity method | N/A | Services | 100% | 2 | ||||||
| BBVA DISTRIBUIDORA DE SEGUROS S.R.L. | Fully consolidation | Equity method | No | Insurance | 100% | 5 | ||||||
| BBVA MEDIACION OPERADOR DE BANCA-SEGUROS VINCULADO, S | Fully consolidation | Equity method | No | Insurance | 100% | 22 | ||||||
| BBVA RE DAC | Fully consolidation | Equity method | No | Insurance | 100% | 43 | ||||||
| BBVA SEGUROS COLOMBIA SA | Fully consolidation | Equity method | No | Insurance | 100% | 38 | ||||||
| BBVA SEGUROS DE VIDA COLOMBIA SA | Fully consolidation | Equity method | No | Insurance | 100% | 116 | ||||||
| BBVA SEGUROS SA DE SEGUROS Y REASEGUROS | Fully consolidation | Equity method | No | Insurance | 100% | 1,293 | ||||||
| BBVA SERVICIOS, S. A. | Fully consolidation | Equity method | N/A | Commercial | 100% | 7 | ||||||
| BEEVA TEC OPERADORA, S.A. DE C.V. | Fully consolidation | Equity method | N/A | Services | 100% | 0 | ||||||
| CATALONIA GEBIRA, S.L. | Fully consolidation | Equity method | N/A | Real Estate | 100% | 0 | ||||||
| COMPASS INSURANCE TRUST | Fully consolidation | Equity method | No | Insurance | 100% | 0 | ||||||
| COPROMED SA DE CV | Fully consolidation | Equity method | N/A | Services | 100% | 0 | ||||||
| COVAULT, INC | Fully consolidation | Equity method | N/A | Services | 100% | 1 | ||||||
| DISTRITO CASTELLANA NORTE, S.A. | Fully consolidation | Equity method | N/A | Real Estate | 76% | 96 | ||||||
| EL ENCINAR METROPOLITANO, S.A. | Fully consolidation | Equity method | N/A | Real Estate | 99% | 0 | ||||||
| F/11395 FIDEICOMISO IRREVOCABLE DE ADMINISTRACTION CON | Fully consolidation | Equity method | N/A | Real Estate | 42% | 0 | ||||||
| F/253863 EL DESEO RESIDENCIAL | Fully consolidation | Equity method | N/A | Real Estate | 65% | 0 | ||||||
| F/403035-9 BBVA HORIZONTES RESIDENCIAL | Fully consolidation | Equity method | N/A | Real Estate | 65% | 0 | ||||||
| FIDEICOMISOF/403112-6 DE ADMINISTRACION DOS LAGOS | Fully consolidation | Equity method | N/A | Real Estate | 100% | 0 | ||||||
| FIDEICOMISO HARES BBVA BANCOMERF/47997-2 | Fully consolidation | Equity method | N/A | Real Estate | 100% | 7 | ||||||
| FIDEICOMISO SCOTIABANK INVERLAT S A F100322908 | Fully consolidation | Equity method | N/A | Real Estate | 100% | 0 | ||||||
| FINANCEIRA DO COMERCIO EXTERIOR SAR. | Fully consolidation | Equity method | No | Financial | 100% | 0 | ||||||
| FUTURO FAMILIAR, S.A. DE C.V. | Fully consolidation | Equity method | N/A | Services | 100% | 1 | ||||||
| GARANTI EMEKLILIK VE HAYAT AS | Fully consolidation | Equity method | No | Insurance | 85% | 124 | ||||||
| GARANTI FILO SIGORTA ARACILIK HIZMETLERI A.S. | Fully consolidation | Equity method | No | Insurance | 100% | 1 | ||||||
| GARANTI FILO YONETIM HIZMETLERI A.S. | Fully consolidation | Equity method | N/A | Services | 100% | 1 | ||||||
| GARANTI KULTUR AS | Fully consolidation | Equity method | N/A | Services | 100% | 0 | ||||||
| GARRAF MEDITERRANIA, S.A. | Fully consolidation | Equity method | N/A | Real Estate | 100% | 2 | ||||||
| HABITATGES JUVIPRO, S.L. | Fully consolidation | Equity method | N/A | Real Estate | 100% | 1 | ||||||
| HOLAMUNO AGENTE DE SEGUROS VINCULADO, S.L.U. | Fully consolidation | Equity method | No | Insurance | 100% | 0 | ||||||
| INMESP DESARROLLADORA, S.A. DE C.V. | Fully consolidation | Equity method | N/A | Real Estate | 100% | 33 | ||||||
| INPAU, S.A. | Fully consolidation | Equity method | N/A | Real Estate | 100% | 25 | ||||||
| INVERSIONES P.H.R.4, C.A. | Fully consolidation | Equity method | N/A | Real Estate | 60% | 0 | ||||||
| INVERSIONES PLATCO CA | Equity method | Proportional consolidation | N/A | Financial | 50% | 1 | ||||||
| MADIVA SOLUCIONES, S.L. | Fully consolidation | Equity method | N/A | Services | 100% | 6 | ||||||
| MOTORACTIVE MULTISERVICES SRL | Fully consolidation | Equity method | N/A | Services | 100% | 1 | ||||||
| MULTIASISTENCIA OPERADORA S.A. DE C.V. | Fully consolidation | Equity method | No | Insurance | 100% | 0 | ||||||
| MULTIASISTENCIA SERVICIOS S.A. DE C.V. | Fully consolidation | Equity method | No | Insurance | 100% | 0 | ||||||
| MULTIASISTENCIA, S.A. DE C.V. | Fully consolidation | Equity method | No | Insurance | 100% | 17 | ||||||
| OPERADORA DOS LAGOS S.A. DE C.V. | Fully consolidation | Equity method | N/A | Services | 100% | 0 | ||||||
| PENSIONES BBVA BANCOMER, S.A. DE C.V., GRUPO FINANCIE | Fully consolidation | Equity method | No | Insurance | 100% | 201 | ||||||
| PERSONAL DATA BANK SLU | Fully consolidation | Equity method | N/A | Services | 100% | 0 | ||||||
| PROMOCIONES Y CONSTRUCCIONES CERBAT, S.L.U. | Fully consolidation | Equity method | N/A | Real Estate | 100% | 8 | ||||||
| PRO-SALUD, C.A. | Fully consolidation | Equity method | N/A | Services | 59% | 0 | ||||||
| PSA FINANCE ARGENTINA COMPAÑIA FINANCIERA SA | Equity method | Proportional consolidation | No | Financial | 50% | 10 | ||||||
| PUERTO CIUDAD LAS PALMAS, S.A. | Fully consolidation | Equity method | N/A | Real Estate | 97% | 0 | ||||||
| RESIDENCIAL CUMBRES DE SANTA FE, S.A. DE C.V. | Fully consolidation | Equity method | N/A | Real Estate | 100% | 2 | ||||||
| SEGUROS BBVA BANCOMER SA DE CV GRUPO FINANCIERO BBVA | Fully consolidation | Equity method | No | Insurance | 100% | 412 | ||||||
| SEGUROS PROVINCIAL CA | Fully consolidation | Equity method | No | Insurance | 100% | 3 | ||||||
| SERVICIOS CORPORATIVOS DE SEGUROS, S.A. DE C.V. | Fully consolidation | Equity method | N/A | Services | 100% | 6 | ||||||
| SERVICIOS TECNOLOGICOS SINGULARES, S.A. | Fully consolidation | Equity method | N/A | Services | 100% | 0 | ||||||
| TRIFOI REAL ESTATE SRL | Fully consolidation | Equity method | N/A | Real Estate | 100% | 1 | ||||||
| URBANIZADORA SANT LLORENC SA | Fully consolidation | Equity method | N/A | Real Estate | 61% | 0 | ||||||
| Total companies registered by equity method in regulatory scope | 2,621 | |||||||||||
| Total companies registered by equity method in accounting scope but by proportional consolidation in regulatory scope | 80 | |||||||||||
| Total | 2,701 | |||||||||||
| 208 |
Table of Contents
Table of Contents
Annex II. Own funds template
12/31/2018 Phase-in (1) | Transitional adjustments (2) | 12/31/2018 Fully-loaded (3) = (1) + (2) | Regulation (UE) N°575/2013 Reference to article | Reference to CC2 template | ||||||
| 1. Capital instruments and the related share premium accounts | 27,259 | – | 27,259 | 26 (1), 27, 28, 29, list of EBA 26 (3) | (a) | |||||
of which: Own shares | 27,259 | – | 27,259 | List 26 (3) of EBA | ||||||
Capital | 3,267 | – | 3,267 | |||||||
Share Premium | 23,992 | – | 23,992 | |||||||
| 2. Retained earnings | 23,857 | (865) | 22,993 | 26 (1) (c) | (b) | |||||
| 3. Accumulated other comprehensive income and any other reserves (in order to include unrealized losses or gains, in accordance with applicable accounting standards) | (7,285) | – | (7,285) | 26 (1) | (c) | |||||
| 3.a. Funds for general banking risk | – | – | – | 26 (1) (f) | ||||||
| 4. Amount of qualifying items referred to in Article 484 (3) and the related share premium accounts subject to phase out from CET1 | – | – | – | 486 (2) | ||||||
| Exempt public sector capital contributions until January 1st 2019 | – | – | – | 483 (2) | ||||||
| 5. Minority interests (amount allowed in consolidated CET 1) | 3,809 | 325 | 4,134 | 84,479,480 | (d) | |||||
5.a. Independently reviewed interim profits net of any foreseeable charge or dividend
| 3,246 | – | 3,246 | 26 (2) | (e) | |||||
| 6. Common Equity Tier 1 (CET1) capital before regulatory adjustments | 50,887 | (540) | 50,347 | |||||||
| Common Equity Tier 1 (CET1) capital: regulatory adjustments | ||||||||||
| 7. Additional value adjustments (negative amount) | (356) | – | (356) | 34, 105 | f) | |||||
| 8. Intangible assets (net of related tax liability) (negative amount) | (8,199) | – | (8,199) | 36 (1) (b), 37, 472 (4) | g) | |||||
| 9. Empty set in the EU | – | – | – | |||||||
| 10. Deferred tax assets that rely on future profitability excluding those arising from temporary difference (net of related tax liability where the conditions in Article 38 (3) are met) (negative amount) | (1,260) | (203) | (1,463) | 36 (1) (C), 38, 472 (5) | h) | |||||
| 11. Fair value reserves related to gains or losses on cash flow hedges | 35 | – | 35 | 33 (a) | i) | |||||
| 12. Negative amounts resulting from the calculation of expected loss amounts (equity) | – | – | – | 36 (1) (d), 40, 159, 472 (6) | j) | |||||
| 13. Any increase in equity that results from securitised assets (negative amount) | – | – | – | 32 (1) | ||||||
| 14. Gains or losses on liabilities valued at fair value resulting from changes in own credit standing | (116) | – | (116) | 33 (b) | k) | |||||
| 15. Defined-benefit pension fund assets (negative amount) | – | – | – | 36 (1) (e), 41, 472 (7) | ||||||
| 16.Direct and indirect holdings by an institution of own CET1 instruments (negative amount) | (432) | – | (432) | 36 (1) (f), 42, 472 (8) | l) | |||||
| 17. Direct, indirect and synthetic holdings of the CET1 instruments of financial sector entities where those entities have reciprocal cross holdings with the institution designed to inflate artificially the own funds of the institution (negative amount) | – | – | – | 36 (1) (g), 44,472 (9) | ||||||
| 18. Direct, indirect and synthetic holdings of the CET1 instruments of financial sector entities where the institution does not have a significant investment in those entities (amount above 10% threshold and net of eligible short positions) (negative amount) | – | – | – | 36 (1) (h), 43, 45, 46, 49 (2) (3), 79, 472 (10) | ||||||
| 19. Direct, indirect and synthetic holdings of the CET1 instruments of financial sector entities where the institution has a significant investment in those entities (amount above 10% threshold and net of eligible short positions) (negative amount) | – | – | – | 36 (1) (i), 43, 45, 47, 48 (1) (b), 49 (1) a (3), 79, 470, 472 (11) | ||||||
| 20. Empty set in the EU | – | – | – | |||||||
| 20.a.Exposure amount of the following items which qualify for a RW of 1250%, where the institution opts for the deduction alternative | (34) | – | (34) | 36 (1) (k) | ||||||
| 20.b. of which: qualifying holdings outside the financial sector (negative amount) | – | – | – | 36 (1) (k) (i), 89 a 91 | ||||||
| 20.c. of which: securitisation positions (negative amount) | (34) | (34) | 36 (1) (k) (ii), 243 (1) (b), 244 (1) (b), 258 | m) | ||||||
| 20.d. of which: free deliveries (negative amount) | – | – | – | 36 (1) (k) (iii), 379 (3) | ||||||
| 21. Deferred tax assets arising from temporary difference (amount above 10 % threshold, net of related tax liability where the conditions in Article 38 (3) are met) (negative amount) | – | – | – | 36 (1) (c), 38, 48 (1) (a), 470, 472 (5) | ||||||
| 22. Amount exceeding the 15% threshold (negative amount) | – | – | – | 48 (1) | ||||||
| 23. of which: direct and indirect holdings by the institution of the CET1 instruments of financial sector entities where the institution has a significant investment in those entities | – | – | – | 36 (1) (i), 48 (1) (b), 470, 472 (11) | ||||||
| 24. Empty set in the EU | – | – | – | |||||||
| 25. of which: deferred tax assets arising from temporary difference | – | – | – | 36 (1) (C), 38, 48 (1) (a), 470, 472 (5) | ||||||
| 25.a Losses for the current financial year (negative amount) | – | – | – | 36 (1) (a), 472 (3) | ||||||
| 25.b Foreseeable tax charges relating to CET1 items (negative amount) | – | – | – | 36 (1) (1) | ||||||
| 26. Regulatory adjustments applied to Common Equity Tier 1 in respect of amounts subject topre-CRR treatment | (150) | – | (150) | |||||||
| 26.a Regulatory adjustments relating to unrealised gains and losses pursuant to Articles 467 and 468 | (150) | – | (150) | 467, 468 | ||||||
Of which: unrealised losses under Article 467 | – | – | – | |||||||
Of which: unrealised gains under Article 468 | (150) | – | (150) | n) | ||||||
| 26.b Amount to be deducted from or added to Common Equity Tier 1 capital with regard to additional filters and deductions required pre CRR | – | – | – | 481 | ||||||
| 27. Qualifying AT1 deductions that exceeds the AT1 capital of the institution (negative amount) | – | – | – | 36 (1) (j) | ||||||
| 27. a. Other CET1 deductions | (61) | – | (61) | o) | ||||||
| 28. Total regulatory adjustments to Common Equity Tier 1 (CET1) | (10,573) | (203) | (10,776) | |||||||
| 29. Common Equity Tier 1 (CET1) capital | 40,313 | (742) | 39,571 | |||||||
| Additional Tier 1 (AT1) capital: instruments | ||||||||||
| 30. Capital instruments and the related share premium accounts | 4,863 | – | 4,863 | 51, 52 | ||||||
| 31. of which: classified as equity under applicable accounting standards | – | – | – | |||||||
| 32. of which: classified as liabilities under applicable accounting standards | 4,863 | – | 4,863 | p) | ||||||
| 33. Amount of qualifying items referred to in Article 484 (4) and the related share premium accounts subject to phase out from AT1 | 142 | (142) | – | 486 (3) | q) | |||||
| Exempt public sector capital contributions until 1st January 2018 | – | – | – | 486 (3) | ||||||
| 34. Qualifying Tier 1 capital included in consolidated AT1 capital (including minority interest not included in row 5) issued by subsidiaries and held by third parties | 629 | (17) | 613 | 85, 86, 480 | r) | |||||
| 35. of which: instruments issued by subsidiaries subject tophase-out | – | – | – | 486 (3) | ||||||
| 36. Additional Tier 1 (AT1) capital before regulatory adjustments | 5,634 | (158) | 5,475 | |||||||
| Additional Tier 1 (AT1) capital: regulatory adjustments | s) | |||||||||
| 37. Direct and indirect holdings by an institution of own AT1 instruments (negative amount) | – | – | – | 52 (1) (b), 56 (a), 57, 475 (2) | ||||||
| 38. Holdings of the AT1 instruments of financial sector entities where those entities have reciprocal cross holdings with the institution designed to inflate artificially the own funds of the institution (negative amount) | – | – | – | 56 (b), 58, 475 (3) | ||||||
| 39. Direct, indirect and synthetic holdings of the AT1 instruments off financial sector entities where the institution does not have a significant investment in those entities (amount above 10% threshold and net of eligible short positions) (negative amount) | – | – | – | 56 (c), 59, 60, 79, 475 (4) | ||||||
40. Direct, indirect and synthetic holdings of the AT1 instruments of financial sector entities where the institution has a significant investment in those entities (amount above 10% threshold and net of eligible short positions) (negative amount)
| – | – | – | 56 (d), 59, 79, 475 (4) | ||||||
41. Regulatory adjustments applied to Additional Tier 1 capital in respect of amounts subject topre-CRR treatment and transitional treatments subject tophase-out as prescribed in Regulation (EU) No 585/2013 (ie. CRR residual amounts)
| – | – | – | |||||||
41.a. Residual amounts deducted from Additional Tier 1 capital with regard to deduction from Common Equity Tier 1 capital during the transitional period pursuant to article 472 of Regulation (EU) No 575/2013
| – | – | – | 472, 472 (3) (a), 472 (4), 472 (6), 472 (8) (a), 472 (9), 472 (10) (a), 472 (11) (a) | ||||||
Of which items to be itemised on aline-by-line basis, e. g. significant provisional net losses, intangible assets, insufficient provisions against expected losses, etc. | – | – | – | |||||||
| 41.b Residual amounts deducted from Additional Tier 1 capital with regard to deduction from Tier 2 capital during the transitional period pursuant to article 475 of Regulation (EU) No 575/2013 | – | – | – | 477, 477 (3), 477 (4) (a) | ||||||
Of which items to be detailed on aline-by-line basis, e. g. reciprocal holdings of tier 2 capital instruments, direct holdings ofnon-significant investments in the capital of other financial sector entities, etc. | – | – | – | |||||||
| 41.c Amounts to be deducted from added to Additional Tier 1 capital with regard to additional filters and deductions requiredpre-CRR | – | – | – | 467, 468, 481 | ||||||
From which: possible filter for unrealized losses | – | – | – | 467 | ||||||
From which: possible filter for unrealized benefits | – | – | – | 468 | ||||||
From which... | – | – | – | 481 | ||||||
42. Qualifying T2 deductions that exceed the T2 capital of the institution (negative amount)
| – | – | – | 56 (e | ||||||
| 43 Total regulatory adjustments to Additional Tier 1 (AT1) capital | – | – | – | |||||||
| 44 Additional Tier 1 (AT1) capital | 5,634 | (158) | 5,475 | |||||||
| 45Tier 1 capital (T1 = CET1 + AT1) | 45,947 | (901) | 45,047 | |||||||
| 210 |
Table of Contents
12/31/2018 Phase-in (1) | Transitional adjustments (2) | 12/31/2018 Fully-loaded (3) = (1) + (2) | Regulation (UE) N°575/2013 Reference to article | Reference to CC2 template | ||||||
| Tier 2 (T2) capital: instruments and provisions | ||||||||||
| 46. Capital instruments and the related share premium accounts | 3,768 | (177) | 3,591 | 62, 63 | t) | |||||
| 47. Amount of qualifying items referred to in Article 484 (5) and the related share premium accounts subject to phase out from T2 | – | 142 | 142 | 486 (4) | u) | |||||
| Exempt public sector capital contributions until 1st January 2018 | – | – | – | 483 (4) | ||||||
| 48. Qualifying own funds instruments included in consolidated T2 capital (including minority interest and AT1 instruments not included in rows 5 or 34) issued by subsidiaries and held by third party | 4,409 | 140 | 4,549 | 87, 88, 480 | v) | |||||
| 49. of which: instruments issued by subsidiaries subject tophase-out | 37 | (37) | – | 486 (4) | ||||||
| 50. Credit risk adjustments | 579 | – | 579 | 62 (c) y (d) | w) | |||||
| 51. Tier 2 (T2) capital before regulatory adjustment | 8,756 | 105 | 8,861 | |||||||
| Tier 2 (T2) capital: regulatory adjustments | ||||||||||
| 52. Direct and indirect holdings by an institution of own T2 instruments and subordinated loans (negative amount) | – | – | – | 63 (b) (i), 66 (a), 67, 477 (2) | ||||||
| 53.Direct and indirect holdings by an institution of own T2 instruments and subordinated loans (negative amount) | – | – | – | 66 (b), 68, 477 (3) | ||||||
| 54. Direct, indirect and synthetic holdings of the T2 instruments and subordinated loans of financial sector entities where the institution does not have a significant investment in those entities (amount above 10 % threshold and net of eligible short positions) (negative amount) | – | – | – | 66 (c), 69, 70, 79, 477 (4) | ||||||
| 54.a Of which new holdings not subject to transitional arrangements | – | – | – | |||||||
| 54.b Of which holdings existing before 1 January 2013 and subject to transitional arrangements | – | – | – | |||||||
| 55. Direct, indirect and synthetic holdings of the T2 instruments and subordinated loans of financial sector entities where the institution has a significant investment in those entities (net of eligible short positions) (negative amounts) | – | – | – | 66 (d), 69, 79, 477 (4) | ||||||
| 56. Regulatory adjustments applied to tier 2 in respect of amounts subject topre-CRR treatment and transitional treatments subject to phase out as prescribed in Regulation (EU) No 575/2013 (i.e. CRR residual amounts) | – | – | – | |||||||
| 56.a Residual amounts deducted from Tier 2 capital with regard to deduction from Common Equity Tier 1 capital during the transitional period pursuant to article 472 of Regulation (EU) No 575/2013 | – | – | – | 472, 472 (3) (a), 472 (4), 472 (6), 472 (8) (a), 472 (9), 472 (10) (a), 472 (11) (a) | ||||||
Of which: items to be detailed on aline-by-line basis, e. g. significant provisional net losses, intangible assets, insufficient provisions against expected losses, etc. | – | – | – | |||||||
| 56.b Residual amounts deducted from Tier 2 capital with regard to deduction from Additional Tier 1 capital during the transitional period pursuant to article 475 of Regulation (EU) No 575/2013 | – | – | – | 475, 475 (2) (a), 475 (3), 475 (4) (a) | ||||||
Of which: elements to be itemised on aline-by-line basis, e. g. reciprocal holdings of additional tier 1 capital instruments, direct holdings ofnon-significant investments in the capital of other financial sector entities, etc. | – | – | – | |||||||
| 56.c Amounts to be deducted from or added to Tier 2 capital with regard to additional filters and deductions requiredpre-CRR | – | – | – | 467, 468, 481 | ||||||
From which: possible filter for unrealized losses | – | – | – | 467 | ||||||
From which: possible filter for unrealized benefits | – | – | – | 468 | ||||||
| 57 Total regulatory adjustments to Tier 2 (T2) capital | – | – | – | |||||||
| 58. Tier 2 (T2) capital | 8,756 | 105 | 8,861 | |||||||
| 59. Total capital (TC = T1 + T2) | 54,703 | (796) | 53,907 | |||||||
| 59.a Risk weighted assets in respect of amounts subject topre-CRR treatment and transitional treatments subject to phase out as prescribed in Regulation (EU) No 575/2013 (i.e. CRR residual amount) | – | – | – | |||||||
Of which: . . . items not deducted from ordinary Tier 1 capital (EU Regulation No 575/2013, residual amounts) (items to be itemised line by line, e. g. deferred tax assets that depend on future net future returns on related tax liabilities, own ordinary Tier 1 indirect capital holdings, etc.). | – | – | – | 472, 472 (5), 472 (8) (b), 472 (10) (b), 472 (11) (b) | ||||||
Of which: . . .non-deducted items of additional Tier 1 capital elements (EU Regulation No 575/2013, residual amounts) (items to be itemised on aline-by-line basis, e. g. reciprocal holdings of Tier 2 capital instruments, direct holdings ofnon-significant investments in the capital of other financial sector entities, etc.). | – | – | – | 475, 475 (2) (b), 475 (2) (c), 475 (4) (b) | ||||||
Elements not deducted from Tier 2 capital elements (EU Regulation No 575/2013, residual amounts) (items to be itemised line by line, e. g. indirect holdings of Tier 2 equity instruments,non-significant indirect holdings of investments in the capital of other financial sector entities, indirect holdings of significant investments in the capital of other financial sector entities, etc.). | – | – | – | 477, 477 (2) (b), 477 (2) (c), 477 (4) (b) | ||||||
| 60. Total risk-weighted assets | 348,264 | 540 | 348,804 | |||||||
| Capital ratios and capital buffers | ||||||||||
| 61. Common Equity Tier 1 [as a percentage of total risk exposure amount) | 11.58% | – | – | 92 (2) (a), 465 | ||||||
| 62. Tier 1 (as a percentage of total risk exposure amount) | 13.19% | – | – | 92 (2) (b), 465 | ||||||
| 63. Total capital (as a percentage of total risk exposure amount) | 15.71% | – | – | 92 (2) (c) | ||||||
| 64. Institution specific buffer requirement (CET1 requirement in accordance with article 92 (1) (a) plus capital conservation and countercyclical buffer requirements plus a systemic risk buffer, plus systemically important institution buffer expressed as a percentage of total risk exposure amount) | 6.95% | – | – | DRC 128, 129 y 130 | ||||||
| 65. of which: capital conservation buffer requirement | 1.88% | – | – | |||||||
| 66. of which: countercyclical buffer requirement | 0.01% | – | – | |||||||
| 67. of which: systemic risk buffer requirement | 0.00% | – | – | |||||||
| 67.a. of which: Global Systemically Important Institution(G-SII) or Other Systemically Important Institution(O-SII) buffer | 0.56% | – | – | DRC 131 | ||||||
| 68.Common Equity Tier 1 available to meet buffers (as a percentage of risk exposure amount) (*) | 7.08% | – | – | DRC 128 | ||||||
| Capital ratios and capital buffers | ||||||||||
| 72. Direct and indirect holdings of the capital of financial sector entities where the institution does not have a significant investment in those entities (amount below 10% threshold and net of eligible short positions | 1,602 | – | 1,602 | 36 (1) (h), 45, 46, 472 (10), 56 (c), 59, 60, 475 (4), 66 (c), 69, 70, 477 (4) | ||||||
| 73. Direct and indirect holdings of the CET1 instruments of financial sector entities where the institution has a significant investment in those entities (amount below 10% threshold and net of eligible short positions | 2,525 | – | 2,525 | 36 (1) (i), 45, 48, 470, 472 (11) | ||||||
| 74.Empty set in the EU | – | – | – | |||||||
| 75. Deferred tax assets arising from temporary difference (amount below 10 % threshold, net of related tax liability where the conditions in Article 38 (3) are met) | 2,619 | 384 | 3,004 | 36 (1) (c), 38, 48, 470, 472 (5) | ||||||
| Applicable caps on the inclusion of provisions in Tier 2 | – | |||||||||
| 76. Credit risk adjustments included in T2 in respect of exposures subject to standardised approach (prior to the application of the cap) | – | – | – | 62 | ||||||
| 77. Cap on inclusion of credit risk adjustments in T2 under standardised approach | – | – | – | 62 | ||||||
| 78. Credit risk adjustments included in T2 in respect of exposures subject to internal rating-based approach (prior to the application of the cap) | 854 | 765 | 1,619 | 62 | ||||||
| 79. Cap for inclusion of credit risk adjustments in T2 under internal ratings-based approach | 579 | – | 579 | 62 | ||||||
| Capital instruments subject tophasing-out provisions (applicable only between 1st January 2013 and 1st January 2022) | ||||||||||
| 80. Current cap on CET1 instruments subject tophase-out arrangements | – | – | – | 484 (3), 486 (2) y (5) | ||||||
| 81. Amount excluded from CET1 due to cap (excess over cap after redemptions and maturities) | – | – | – | 484 (3), 486 (2) y (5) | ||||||
| 82. Current cap on AT1 instruments subject tophase-out arrangements | 1,836 | – | 1,836 | 484 (4), 486 (3) y (5) | ||||||
| 83. Amount excluded from AT1 due to cap (excess over cap after redemptions and maturities) | – | – | – | 484 (4), 486 (3) y (5) | ||||||
| 84. Current cap on T2 instruments subject tophase-out arrangements | 1,294 | – | 1,294 | 484 (5), 486 (4) y (5) | ||||||
| 85. Amount excluded from T2 due to cap (excess over cap after redemptions and maturities) | – | – | – | 484 (5), 486 (4) y (5) | ||||||
(*) CET1 available to meet capital buffer requirements calculated as the minimum 4.5% requirement on RWAs | ||||||||||
(1) Own funds template published in accordance with Commission Regulation (EU) No 680/2014, broken down capital composition by CCI standard template published by BCBS | ||||||||||
| 211 |
Table of Contents
Annex III. Capital instruments main features template (issuances)
| 1. Issuer | Banco Bilbao Vizcaya Argentaria SA | Banco Bilbao Vizcaya Argentaria SA | Banco Bilbao Vizcaya Argentaria SA | BBVA S.A. | BBVA S.A. | |||||
| 2. Unique identifier (e.g. CUSIP, ISIN or Bloomberg identifier for private placement | XS1033661866(1) | XS1190663952 | XS1394911496 | XS1619422865 | US05946KAF84 | |||||
| 3. Governing law (s) of the instrument | Spanish | Spanish | Spanish | Spanish | New York | |||||
| Regulatory treatment | ||||||||||
| 4. Transitional CRR rules | Additional Tier 1 | Additional Tier 1 | Additional Tier 1 | Additional Tier 1 | Additional Tier 1 | |||||
| 5. Post-transitional CRR rules | Additional Tier 1 | Additional Tier 1 | Additional Tier 1 | Additional Tier 1 | Additional Tier 1 | |||||
| 6. Eligible atsolo/(sub-) consolidated/solo &(sub-) consolidated | At solo &(sub-) consolidated | At solo &(sub-) consolidated | At solo &(sub-)consolidated | At solo &(sub-) consolidated | At solo &(sub-) consolidated | |||||
| 7. Instrument type (types to be specified by each jurisdiction) | Contingent Convertible | Contingent Convertible | Contingent Convertible | Contingent Convertible | Contingent Convertible | |||||
| 8. Amount recognized in regulatory capital (currency in million, as of most recent reporting date) | – | 1,500 | 1,000 | 500 | 873 | |||||
| 9. Nominal amount of instrument | 1,500 Mill EUR | 1,500 Mill EUR | 1,000 Mill EUR | 500 Mill EUR | 1,000 Mill USD | |||||
| 9.a. Issue price | 100.00% | 100.00% | 100.00% | 100.00% | 100.00% | |||||
| 9.b. Redemption price | The Liquidation Preference plus, if applicable, an amount equal to accrued and unpaid Distributions for the then current Distribution Period to the date fixed for redemption of the Preferred Securities | The Liquidation Preference plus, if applicable, an amount equal to accrued and unpaid Distributions for the then current Distribution Period to the date fixed for redemption of the Preferred Securities | The Liquidation Preference plus, if applicable, an amount equal to accrued and unpaid Distributions for the then current Distribution Period to the date fixed for redemption of the Preferred Securities | The Liquidation Preference plus, if applicable, an amount equal to accrued and unpaid Distributions for the then current Distribution Period to the date fixed for redemption of the Preferred Securities | The Liquidation Preference plus, if applicable, an amount equal to accrued and unpaid Distributions for the then current Distribution Period to the date fixed for redemption of the Preferred Securities | |||||
| 10. Accounting classification | Liability – amortized cost | Liability – amortized cost | Liability – amortized cost | Liability – amortized cost | Liability – amortized cost | |||||
| 11. Original date of issuance | 02/11/2014 | 01/18/2015 | 04/07/2016 | 05/24/2017 | 11/16/2017 | |||||
| 12. Perpetual or dated | Perpetual | Perpetual | Perpetual | Perpetual | Perpetual | |||||
| 13. Original maturity date | N/A | N/A | N/A | N/A | N/A | |||||
| 14. Issuer call subject to prior supervisory approval | Yes | Yes | Yes | Yes | Yes | |||||
| 15. Optional call date, contingent call dates, and redemption amount | Issuer call date: 02/19/2019; also subject to both Regulatory and Tax call | Issuer call date: 02/18/2020; also subject to both Regulatory and Tax call | Issuer call date 04/14/2021; also subject to both Regulatory and Tax call | Issuer call date 05/24/2022 (fully or partial) also subject to both Regulatory and Tax call | Issuer call date: 11/16/2027 (fully) also subject to both Regulatory and Tax call | |||||
| 16. Subsequent call dates, if applicable | At any time on or after the first reset date | At any time on or after the first reset date | At any time on or after the first reset date | At any time on or after the first reset date | At any time on or after the first reset date | |||||
| Coupons / dividends | ||||||||||
| 17. Fixed or floating dividend/coupon | Fixed to floating (since call date) | Fixed to floating (since call date) | Fixed to floating (since call date) | Fixed for5-year periods resettable | Initially fixed for 10 years, then fixed resettable in5-year periods. | |||||
| 18. Coupon rate and any related index | 7.0%; EUSA5 + 6.155% | 6.75%; EUSA5 + 6.604% | 8.875%; EUSA5 +9.177% | 5.875%; EUSA5 + 5.779% | 6.125% quarterly (10 initial years); 5 yearMid-Swap + 3.870% | |||||
| 19. Existence of a dividend stopper | No | No | No | No | No |
| 212 |
Table of Contents
| 20.a. Fully discretionary, partially discretionary or mandatory (in terms of timing | Fully dicretionary | Fully dicretionary | Fully dicretionary | Fully dicretionary | Fully dicretionary | |||||
| 20.b. Fully discretionary, partially discretionary or mandatory (in terms of amount) | Fully dicretionary | Fully dicretionary | Fully dicretionary | Fully dicretionary | Fully dicretionary | |||||
| 21. Existence of step up or other incentive to redeem | No | No | No | No | No | |||||
| 22. Noncumulative or cumulative | Noncumulative | Noncumulative | Noncumulative | Noncumulative | Noncumulative | |||||
| 23. Convertible ornon-convertible | Convertible | Convertible | Convertible | Convertible | Convertible | |||||
| 24. If convertible, conversion trigger (s) | CET1 5.125%; At solo &(sub-) consolidated | CET1 5.125%; At solo &(sub-) consolidated | CET1 5.125%; At solo &(sub-) consolidated | CET1 <5.125%; At solo &(sub-) consolidated | CET1 <5.125%; At solo &(sub-) consolidated | |||||
| 25. If convertible, fully or partially | Always Fully | Always Fully | Always Fully | Fully | Fully | |||||
| 26. If convertible, conversion rate | Floating | Floating | Floating | Floating | Floating | |||||
27. If convertible, mandatory or optional conversion | Mandatory | Mandatory | Mandatory | Mandatory | Mandatory | |||||
| 28. If convertible, specify instrument type convertible into | Tier 1 | Tier 1 | Tier 1 | Tier 1 | Tier 1 | |||||
| 29. If convertible, specify issuer of instrument it converts into | Banco Bilbao Vizcaya Argentaria SA | Banco Bilbao Vizcaya Argentaria SA | Banco Bilbao Vizcaya Argentaria SA | Banco Bilbao Vizcaya Argentaria, S.A. | Banco Bilbao Vizcaya Argentaria, S.A. | |||||
| 30. Write-down features | N/A | N/A | N/A | N/A | N/A | |||||
| 31. If write-down, write-down trigger (s) | N/A | N/A | N/A | N/A | N/A | |||||
| 32. If write-down, full or partial | N/A | N/A | N/A | N/A | N/A | |||||
| 33. If write-down, permanent or temporary | N/A | N/A | N/A | N/A | N/A | |||||
| 34. If temporary write-down, description ofwrite-up mechanism | N/A | N/A | N/A | N/A | N/A | |||||
| 35. Position in subordination hierarchy in liquidation (specify instrument type immediately senior to instrument) | Senior to common shares and reserves and pari passu with preferred shares | Senior to common shares and reserves and pari passu with preferred shares | Senior to common shares and reserves and pari passu with preferred shares | Senior to common shares and reserves and pari passu with preferred shares | Senior to common shares and reserves and pari passu with preferred shares | |||||
| 36.Non-compliant transitioned features | No | No | No | No | No | |||||
| 37. If yes, specify non-compliant features | N/A | N/A | N/A | N/A | N/A |
(1)On December 21st, 2018 BBVA recieved from the ECB authorization to execute the call option of the issue with ISIN XS1033661866, therefore, from December 31st, 2018 the issue does no longer compute as additional Tier 1 capital for 1,5000 million euros
| 213 |
Table of Contents
1. Issuer | BBVA S.A. | BBVA International Preferred SA Unipersonal | CaixaSabadell Preferents S.A. Sociedad Unipersonal | Caixa Terrassa Societat de Participacions Preferents, S.A. | ||||
| 2. Unique identifier (e.g. CUSIP, ISIN or Bloomberg identifier for private placement | ES0813211002 | XS0308305803 | ES0101339028 | XS0225115566 | ||||
| 3. Governing law(s) of the instrument | Spanish | Spanish | Spanish | Spanish | ||||
| Regulatory treatment | ||||||||
| 4. Transitional CRR rules | Additional Tier 1 | Tier 1 | Tier 1 | Tier 1 | ||||
| 5. Post-transitional CRR rules | Additional Tier 1 | Tier 2 | Tier 2 | Tier 2 | ||||
| 6. Eligible atsolo/(sub-)consolidated/solo &(sub-) consolidated | At solo &(sub-) consolidated | At solo &(sub-) consolidated | At solo &(sub-) consolidated | At solo &(sub-) consolidated | ||||
| 7. Instrument type (types to be specified by each jurisdiction) | Contingent Convertible | Preferred Shares | Preferred Shares | Preferred Shares | ||||
| 8. Amount recognized in regulatory capital (currency in million, as of most recent reporting date) | 990 | 35 | 55 | 52 | ||||
| 9. Nominal amount of instrument | 1000 Mill EUR | 400 Mill GBP | 90 Mill EUR | 75 Mill EUR | ||||
| 9.a. Issue price | 100.00% | 100.00% | 100.00% | 100.00% | ||||
| 9.b. Redemption price | The Liquidation Preference plus, if applicable, an amount equal to accrued and unpaid Distributions for the then current Distribution Period to the date fixed for redemption of the Preferred Securities | The Liquidation Preference plus, if applicable, an amount equal to accrued and unpaid Distributions for the then current Distribution Period to the date fixed for redemption of the Preferred Securities | The Liquidation Preference plus, if applicable, an amount equal to accrued and unpaid Distributions for the then current Distribution Period to the date fixed for redemption of the Preferred Securities | The Liquidation Preference plus, if applicable, an amount equal to accrued and unpaid Distributions for the then current Distribution Period to the date fixed for redemption of the Preferred Securities | ||||
| 10. Accounting classification | Liability - amortized cost | Liability – amortized cost | Liability – amortized cost | Liability – amortized cost | ||||
| 11. Original date of issuance | 09/24/2018 | 07/19/2007 | 07/14/2006 | 08/10/2005 | ||||
| 12. Perpetual or dated | Perpetual | Perpetual | Perpetual | Perpetual | ||||
| 13. Original maturity date | N/A | N/A | N/A | N/A | ||||
| 14. Issuer call subject to prior supervisory approval | Yes | Yes | Yes | Yes | ||||
| 15. Optional call date, contingent call dates, and redemption amount | Issuer call date: 09/24/2023 (fully) also subject to both Regulatory and Tax call | Issuer call date: 07/19/2012; also subject to both Regulatory and Tax call | Issuer call date: 07/14/2016 | Issuer call date: 08/10/2011 | ||||
| 16. Subsequent call dates, if applicable | At any time on or after the first reset date | On any distribution payment date falling on or after the first call date | On any distribution payment date falling on or after the first call date | On any distribution payment date falling on or after the first call date | ||||
| Coupons / dividends | ||||||||
| 17. Fixed or floating dividend/coupon | Fixed for5-year periods resettable | Fixed to floating (since call date) | Variable | Fixed to floating (since call date) | ||||
| 18. Coupon rate and any related index | 5.875%; EUR 5 year mid Swaps + 5.66% | 7.093%; 3M GBP LIBOR+0.875% | 3M EURIBOR + 1.95% | 8%; 10Y CMS +0.10% (cap: 10%) | ||||
| 19. Existence of a dividend stopper | No | Yes | Yes | Yes | ||||
| 214 |
Table of Contents
| 20.a. Fully discretionary, partially discretionary or mandatory (in terms of timing) | Fully dicretionary | Mandatory | Mandatory | Mandatory | ||||
| 20.b. Fully discretionary, partially discretionary or mandatory (in terms of amount) | Fully dicretionary | Mandatory | Mandatory | Mandatory | ||||
| 21. Existence of step up or other incentive to redeem | No | No | No | No | ||||
| 22. Noncumulative or cumulative | Noncumulative | Noncumulative | Noncumulative | Noncumulative | ||||
| 23. Convertible ornon-convertible | Convertible | Non-convertible | Non-convertible | Non-convertible | ||||
| 24. If convertible, conversion trigger (s) | CET1 <5.125%; At solo &(sub-) consolidated | N/A | N/A | N/A | ||||
| 25. If convertible, fully or partially | Fully | N/A | N/A | N/A | ||||
| 26. If convertible, conversion rate | Floating | N/A | N/A | N/A | ||||
| 27. If convertible, mandatory or optional conversion | Mandatory | N/A | N/A | N/A | ||||
| 28. If convertible, specify instrument type convertible into | Tier 1 | N/A | N/A | N/A | ||||
| 29. If convertible, specify issuer of instrument it converts into | Banco Bilbao Vizcaya Argentaria, S.A. | N/A | N/A | N/A | ||||
| 30. Write-down features | N/A | N/A | N/A | N/A | ||||
| 31. If write-down, write-down trigger (s) | N/A | N/A | N/A | N/A | ||||
| 32. If write-down, full or partial | N/A | N/A | N/A | N/A | ||||
| 33. If write-down, permanent or temporary | N/A | N/A | N/A | N/A | ||||
| 34. If temporary write-down, description ofwrite-up mechanism | N/A | N/A | N/A | N/A | ||||
| 35. Position in subordination hierarchy in liquidation (specify instrument type immediately senior to instrument) | Senior to common shares and reserves and pari passu with preferred shares | Senior to common shares and reserves and pari passu with Additional Tier 1 instruments | Senior to common shares and reserves and pari passu with Additional Tier 1 instruments | Senior to common shares and reserves and pari passu with Additional Tier 1 instruments | ||||
| 36.Non-compliant transitioned features | No | Yes | Yes | Yes | ||||
| 37. If yes, specifynon-compliant features | N/A | No trigger, no discretionary | No trigger, no discretionary | No trigger, no discretionary |
| 215 |
Table of Contents
| 1. Issuer | BBVA S.A. | BBVA S.A. | BBVA S.A. | BBVA S.A. | BBVA S.A. | |||||
| 2. Unique identifier (e.g. CUSIP, ISIN or Bloomberg identifier for private placement | XS1055241373 | XS1562614831 | XS1569874503 | XS1579039006 | XS1587857498 | |||||
| 3. Governing law (s) of the instrument | English | English | English | English | English | |||||
| Regulatory treatment | ||||||||||
| 4. Transitional CRR rules | Tier 2 | Tier 2 | Tier 2 | Tier 2 | Tier 2 | |||||
| 5. Post-transitional CRR rules | Tier 2 | Tier 2 | Tier 2 | Tier 2 | Tier 2 | |||||
| 6. Eligible at solo/(sub-) consolidated/solo & (sub-) consolidated | At solo &(sub-) consolidated | At solo &(sub-) consolidated | At solo &(sub-) consolidated | At solo &(sub-) consolidated | At solo &(sub-) consolidated | |||||
| 7. Instrument type (types to be specified by each jurisdiction) | Subordinated debt | Tier 2 instrument | Tier 2 instrument | Tier 2 instrument | Tier 2 instrument | |||||
| 8. Amount recognized in regulatory capital (currency in million, as of most recent reporting date) | 1,496 | 1,000 | 165 | 53 | 105 | |||||
| 9. Nominal amount of instrument | 1,500 Mill EUR | 1,000 Mill EUR | 165 Mill EUR | 53.4 mill EUR | 120 Mill USD | |||||
| 9.a. Issue price | 100.00% | 99.99% | 100.00% | 100.00% | 100.00% | |||||
| 9.b. Redemption price | 100.00% | 100.00% | 100.00% | 100.00% | 100.00% | |||||
| 10. Accounting classification | Liability – amortized cost | Liability – amortized cost | Liability – amortized cost | Liability – amortized cost | Liability – amortized cost | |||||
| 11. Original date of issuance | 04/11/2014 | 02/10/2017 | 02/24/2017 y 03/14/2017 | 03/16/2017 | 03/31/2017 | |||||
| 12. Perpetual or dated | Dated | Dated | Dated | Dated | Dated | |||||
| 13. Original maturity date | 04/11/2024 | 02/10/2027 | 02/24/2032 | 03/16/2027 | 03/31/2032 | |||||
| 14. Issuer call subject to prior supervisory approval | Yes | No | No | No | Yes | |||||
| 15. Optional call date, contingent call dates, and redemption amount | Issuer call date: 11/04/2019; also subject to both Regulatory and Tax call | Only subject to both Regulatory and Tax call (entirely) | Only subject to both Regulatory and Tax call (entirely) | Only subject to both Regulatory and Tax call (entirely) | Issuer call date: 03/31/2027 also subject to both Regulatory and Tax call, only on full amortization | |||||
| 16. Subsequent call dates, if applicable | No | N/A | N/A | N/A | After 03/31/2027 on any coupon payment date | |||||
| Coupons / dividends | ||||||||||
| 17. Fixed or floating dividend/coupon | Fixed to floating (since call date) | Fixed | Fixed | Fixed (until 03/16/2019) and floating since that day | Fixed | |||||
| 18. Coupon rate and any related index | 3.5%; 6M EURIBOR + 255bps | 0.035 | 0.04 | 3% and afterwards annually resettable at CMS (10 years) +1.30% | 0.057 | |||||
| 19. Existence of a dividend stopper | No | No | No | No | No |
| 216 |
Table of Contents
20.a. Fully discretionary, partially discretionary or mandatory (in terms of timing | Mandatory | Mandatory | Mandatory | Mandatory | Mandatory | |||||
| 20.b. Fully discretionary, partially discretionary or mandatory (in terms of amount) | Mandatory | Mandatory | Mandatory | Mandatory | Mandatory | |||||
| 21. Existence of step up or other incentive to redeem | No | No | No | No | No | |||||
| 22. Noncumulative or cumulative | Cumulative | Cumulative | Cumulative | Cumulative | Cumulative | |||||
| 23. Convertible ornon-convertible | Non-convertible | Non-convertible | Non-convertible | Non-convertible | Non-convertible | |||||
| 24. If convertible, conversion trigger (s) | N/A | N/A | N/A | N/A | N/A | |||||
| 25. If convertible, fully or partially | N/A | N/A | N/A | N/A | N/A | |||||
| 26. If convertible, conversion rate | N/A | N/A | N/A | N/A | N/A | |||||
| 27. If convertible, mandatory or optional conversion | N/A | N/A | N/A | N/A | N/A | |||||
| 28. If convertible, specify instrument type convertible into | N/A | N/A | N/A | N/A | N/A | |||||
| 29. If convertible, specify issuer of instrument it converts into | N/A | N/A | N/A | N/A | N/A | |||||
| 30. Write-down features | N/A | N/A | NO | NO | NO | |||||
| 31. If write-down, write-down trigger (s) | N/A | N/A | N/A | N/A | N/A | |||||
| 32. If write-down, full or partial | N/A | N/A | N/A | N/A | N/A | |||||
| 33. If write-down, permanent or temporary | N/A | N/A | N/A | N/A | N/A | |||||
| 34. If temporary write-down, description ofwrite-up mechanism | N/A | N/A | N/A | N/A | N/A | |||||
| 35. Position in subordination hierarchy in liquidation (specify instrument type immediately senior to instrument) | Senior to preferred shares, Additional Tier 1 instruments an Upper Tier 2 instruments (perpectual) | Senior to common shares, reserves and other Additional Tier 1 instruments Pari passu to other issues from T2 (whether or not they compute in capital) Junior to Tier 3 and senior obligations both preferred obligations both preferred andnon-preferred | Senior to common shares, reserves and other Additional Tier 1 instruments Pari passu to other issues from T2 (whether or not they compute in capital) Junior to Tier 3 and senior obligations both preferred andnon-preferred | Senior to common shares, reserves and other Additional Tier 1 instruments Pari passu to other issues from T2 (whether or not they compute in capital) Junior to Tier 3 and senior obligations both preferred andnon-preferred | Senior to common shares, reserves and other Additional Tier 1 instruments Pari passu to other issues from T2 (whether or not they compute in capital) Junior to Tier 3 and senior obligations both preferred andnon-preferred | |||||
| 36.Non-compliant transitioned features | No | No | No | No | No | |||||
| 37. If yes, specifynon-compliant features | N/A | N/A | N/A | N/A | N/A | |||||
| 217 |
Table of Contents
| 1. Issuer | BBVA S.A. | BBVA S.A. | BBVA S.A. | BBVA, SA | BBVA S.A. | BBVA, SA | ||||||
| 2. Unique identifier (e.g. CUSIP, ISIN or Bloomberg identifier for private placement | XS1615673701 | XS1615674261 | XS1824263260 | ES0213211131 | XS0361684391 | ES0213211115 | ||||||
| 3. Governing law (s) of the instrument | English | English | English excluding status provisions of the notres under spanish legislation | Spanish | English | English | ||||||
| Regulatory treatment | ||||||||||||
| 4. Transitional CRR rules | Tier 2 | Tier 2 | Tier 2 | Tier 2 | Tier 2 | Tier 2 | ||||||
| 5. Post-transitional CRR rules | Tier 2 | Tier 2 | Tier 2 | Tier 2 | Tier 2 | Not admissible | ||||||
| 6. Eligible at solo/(sub-) consolidated/solo &(sub-) consolidated | At solo &(sub-) consolidated | At solo &(sub-) consolidated | At solo &(sub-) consolidated | At solo &(sub-) consolidated | At solo &(sub-) consolidated | At solo &(sub-) consolidated | ||||||
| 7. Instrument type (types to be specified by each jurisdiction) | Tier 2 instrument | Tier 2 instrument | Subordinated debt | Subordinated debt | Subordinated debt | Subordinated debt | ||||||
| 8. Amount recognized in regulatory capital (currency in million, as of most recent reporting date) | 18 | 150 | 262 | 89 | 44 | 125 | ||||||
| 9. Nominal amount of instrument | 20 Mill CHF | 150 Mill EUR | 300 Mill USD | 100 Mill EUR | 50 Mill EUR | 125 Mill EUR | ||||||
| 9.a. Issue price | 100.00% | 100.00% | 99.23% | 99.77% | 100.00% | 99.65% | ||||||
| 9.b. Redemption price | 100.00% | 100.00% | 100.00% | 100.00% | 100.00% | 100.00% | ||||||
| 10. Accounting classification | Liability – amortized cost | Liability – amortized cost | Liability – amortized cost | Liability – amortized cost | Liability – amortized cost | Liability – amortized cost | ||||||
| 11. Original date of issuance | 05/24/2017 | 05/24/2017 | 05/29/2018 | 07/04/2008 | 05/19/2008 | 03/03/2008 | ||||||
| 12. Perpetual or dated | Dated | Dated | Dated | Dated | Dated | Dated | ||||||
| 13. Original maturity date | 05/24/2027 | 05/24/2027 | 05/29/2033 | 07/04/2023 | 05/19/2023 | 03/03/2033 | ||||||
| 14. Issuer call subject to prior supervisory approval | No | No | No | Yes | Yes | Yes | ||||||
| 15. Optional call date, contingent call dates, and redemption amount | Only subject to both Regulatory and Tax call (entirely) | Only subject to both Regulatory and Tax call (entirely) | Subject to Tax Call (partial or entirely) and Regulatory call | No | No optional call date; Tax call | Issuer call date: 03/03/2028 | ||||||
| 16. Subsequent call dates, if applicable | N/A | N/A | NA | NA | Anytime from the fifth year | Issuance call date and on each interest payment day thereafter | ||||||
| Coupons / dividends | ||||||||||||
| 17. Fixed or floating dividend/coupon | Fixed | Fixed | Fixed | Fixed | Fixed to specified index | Fixed to floating (since call date) | ||||||
| 18. Coupon rate and any related index | 0.016 | 0.02541 | 0.0525 | 0.062 | 4.75% the first two years; linked to CPI afterwards | 6.025%; from 03/03/28 3M EURIBOR+1.78% | ||||||
| 19. Existence of a dividend stopper | No | No | No | No | No | No |
| 218 |
Table of Contents
20.a. Fully discretionary, partially discretionary or mandatory (in terms of timing) | Mandatory | Mandatory | Mandatory | Mandatory | Mandatory | Mandatory | ||||||
| 20.b. Fully discretionary, partially discretionary or mandatory (in terms of amount) | Mandatory | Mandatory | Mandatory | Mandatory | Mandatory | Mandatory | ||||||
| 21. Existence of step up or other incentive to redeem | No | No | No | No | No | Yes | ||||||
| 22. Noncumulative or cumulative | Cumulative | Cumulative | Cumulative | Cumulative | Cumulative | Cumulative | ||||||
| 23. Convertible ornon-convertible | Non-convertible | Non-convertible | Non-convertible | Non-convertible | Non-convertible | Non-convertible | ||||||
| 24. If convertible, conversion trigger (s) | N/A | N/A | N/A | N/A | N/A | N/A | ||||||
| 25. If convertible, fully or partially | N/A | N/A | N/A | N/A | N/A | N/A | ||||||
| 26. If convertible, conversion rate | N/A | N/A | N/A | N/A | N/A | N/A | ||||||
| 27. If convertible, mandatory or optional conversion | N/A | N/A | N/A | N/A | N/A | N/A | ||||||
| 28. If convertible, specify instrument type convertible into | N/A | N/A | N/A | N/A | N/A | N/A | ||||||
| 29. If convertible, specify issuer of instrument it converts into | N/A | N/A | N/A | N/A | N/A | N/A | ||||||
| 30. Write-down features | NO | NO | N/A | N/A | N/A | N/A | ||||||
| 31. If write-down, write-down trigger (s) | N/A | N/A | N/A | N/A | N/A | N/A | ||||||
| 32. If write-down, full or partial | N/A | N/A | N/A | N/A | N/A | N/A | ||||||
| 33. If write-down, permanent or temporary | N/A | N/A | N/A | N/A | N/A | N/A | ||||||
| 34. If temporary write-down, description ofwrite-up mechanism | N/A | N/A | N/A | N/A | N/A | N/A | ||||||
| 35. Position in subordination hierarchy in liquidation (specify instrument type immediately senior to instrument) | Senior to common shares, reserves and other Additional Tier 1 instruments Pari passu to other issues from T2 (whether or not they compute in capital) Junior to Tier 3 and senior obligations both preferred andnon-preferred | Senior to common shares, reserves and other Additional Tier 1 instruments Pari passu to other issues from T2 (whether or not they compute in capital) Junior to Tier 3 and senior obligations both preferred andnon-preferred | Senior to common shares, reserves and other Additional Tier 1 instruments Pari passu to other issues from T2 (whether or not they compute in capital) Junior to Tier 3 and senior obligations both preferred andnon-preferred | Senior to preferred shares, Additional Tier 1 instruments an Upper Tier 2 instruments (perpetual) | Senior to preferred shares, Additional Tier 1 instruments an Upper Tier 2 instruments (perpetual) | Senior to preferred shares, Additional Tier 1 instruments an Upper Tier 2 instruments (perpetual) | ||||||
| 36.Non-compliant transitioned features | No | No | No | No | No | Yes | ||||||
| 37. If yes, specifynon-compliant features | N/A | N/A | N/A | N/A | N/A | Existence ofstep-up |
| 219 |
Table of Contents
| 1. Issuer | BBVA S.A. | BBVA Global Finance LTD | BBVA S.A. | BBVA S.A. | BBVA S.A. | |||||
| 2. Unique identifier (e.g. CUSIP, ISIN or Bloomberg identifier for private placement | XS0291892262 | US055291AC24 | ES0214974026 | ES0214973077 | ES0214974075 | |||||
| 3. Governing law (s) of the instrument | English | New York | Spanish | Spanish | Spanish | |||||
| Regulatory treatment | ||||||||||
| 4. Transitional CRR rules | Tier 2 | Tier 2 | Tier 2 | Tier 2 | Tier 2 | |||||
| 5. Post–transitional CRR rules | Tier 2 | Tier 2 | Tier 2 | Not admissible | Not admissible | |||||
| 6. Eligible at solo/(sub–) consolidated/solo & (sub–) consolidated | At solo & (sub–) consolidated | At solo & (sub–) consolidated | At solo & (sub–) consolidated | At solo & (sub–) consolidated | At solo & (sub–) consolidated | |||||
| 7. Instrument type (types to be specified by each jurisdiction) | Subordinated debt | Subordinated debt | Perpetual subordinated debt | Subordinated debt | Perpetual subordinated debt | |||||
| 8. Amount recognized in regulatory capital (currency in million, as of most recent reporting date) | 44 | 166 | 0.050 | 5 | 48 | |||||
| 9. Nominal amount of instrument | 100 Mill EUR | 200 Mill USD | 6 Mill EUR | 35 Mill EUR | 75 Mill EUR | |||||
| 9.a. Issue price | 100.00% | 98.21% | 100.00% | 100.00% | 100.00% | |||||
| 9.b. Redemption price | 100.00% | 100.00% | 100.00% | 100.00% | 100.00% | |||||
| 10. Accounting classification | Liability – amortized cost | Liability – amortized cost | Liability – amortized cost | Liability – amortized cost | Liability – amortized cost | |||||
| 11. Original date of issuance | 04/04/2007 | 12/04/1995 | 06/30/1990 | 06/10/2009 | 03/01/2007 | |||||
| 12. Perpetual or dated | Dated | Dated | Perpetual | Dated | Perpetual | |||||
| 13. Original maturity date | 04/04/2022 | 12/01/2025 | Sin Vencimiento | 06/10/2024 | Sin Vencimiento | |||||
| 14. Issuer call subject to prior supervisory approval | Yes | Yes | Yes | Yes | Yes | |||||
| 15. Optional call date, contingent call dates, and redemption amount | No optional call date; Tax call | No optional call date; Tax call | Issuer call date: 03/06/2010 | Issuer call date: 10/06/2019 | Issuer call date: 03/01/2027 | |||||
| 16. Subsequent call dates, if applicable | Anytime from the fifth year | Anytime from 12/11/2000 | Issuance call date and on each interest payment day thereafter | Issuance call date and on each interest payment day thereafter | Issuance call date and on each interest payment day thereafter | |||||
| Coupons / dividends | ||||||||||
| 17. Fixed or floating dividend/coupon | Floating | Fixed | Fixed | Fixed to floating (since call date) | Floating | |||||
| 18. Coupon rate and any related index | CMS 10YR + 0.03% | 0.07 | 0.025 | 7.50% up to 06/09/11; from 06/10/11 up to 06/09/19: 3M EURIBOR +5.25%; from 06/10/19 up to 06/10/24: 3M EURIBOR +6% | 3M EURIBOR + 1.30% up to 03/01/2027; from 03/01/2027 3M EURIBOR + 2.80% | |||||
| 19. Existence of a dividend stopper | No | No | No | No | No |
| 220 |
Table of Contents
20.a. Fully discretionary, partially discretionary or mandatory (in terms of timing) | Mandatory | Mandatory | Mandatory | Mandatory | Mandatory | |||||
| 20.b. Fully discretionary, partially discretionary or mandatory (in terms of amount) | Mandatory | Mandatory | Mandatory | Mandatory | Mandatory | |||||
| 21. Existence of step up or other incentive to redeem | No | No | No | Yes | Yes | |||||
| 22. Noncumulative or cumulative | Cumulative | Cumulative | Cumulative | Cumulative | Cumulative | |||||
| 23. Convertible ornon-convertible | Non-convertible | Non-convertible | Non-convertible | Non-convertible | Non-convertible | |||||
| 24. If convertible, conversion trigger (s) | N/A | N/A | N/A | N/A | N/A | |||||
| 25. If convertible, fully or partially | N/A | N/A | N/A | N/A | N/A | |||||
| 26. If convertible, conversion rate | N/A | N/A | N/A | N/A | N/A | |||||
| 27. If convertible, mandatory or optional conversion | N/A | N/A | N/A | N/A | N/A | |||||
| 28. If convertible, specify instrument type convertible into | N/A | N/A | N/A | N/A | N/A | |||||
| 29. If convertible, specify issuer of instrument it converts into | N/A | N/A | N/A | N/A | N/A | |||||
| 30. Write-down features | N/A | N/A | N/A | N/A | N/A | |||||
| 31. If write-down, write-down trigger (s) | N/A | N/A | N/A | N/A | N/A | |||||
| 32. If write-down, full or partial | N/A | N/A | N/A | N/A | N/A | |||||
| 33. If write-down, permanent or temporary | N/A | N/A | N/A | N/A | N/A | |||||
| 34. If temporary write-down, description ofwrite-up mechanism | N/A | N/A | N/A | N/A | N/A | |||||
| 35. Position in subordination hierarchy in liquidation (specify instrument type immediately senior to instrument) | Senior to preferred shares, Additional Tier 1 instruments an Upper Tier 2 instruments (perpetual) | Senior to preferred shares, Additional Tier 1 instruments an Upper Tier 2 instruments (perpetual) | Senior to preferred shares and Additional Tier 1 instruments | Senior to preferred shares, Additional Tier 1 instruments an Upper Tier 2 instruments (perpetual) | Senior to preferred shares and Additional Tier 1 instruments | |||||
| 36.Non-compliant transitioned features | No | No | No | Yes | Yes | |||||
| 37. If yes, specifynon-compliant features | N/A | N/A | N/A | Existence ofstep-up | Existence ofstep-up |
| 221 |
Table of Contents
| 1. Issuer | BBVA S.A. | BBVA S.A. | BBVA S.A. | |||
| 2. Unique identifier (e.g. CUSIP, ISIN or Bloomberg identifier for private placement | ES0214973051 | ES0214974059 | ES0214974067 | |||
| 3. Governing law (s) of the instrument | Spanish | Spanish | Spanish | |||
| Regulatory treatment | ||||||
| 4. Transitional CRR rules | Not admissible | Not admissible | Not admissible | |||
| 5. Post-transitional CRR rules | Not admissible | Not admissible | Not admissible | |||
| 6. Eligible atsolo/(sub-) consolidated/solo &(sub-) consolidated | At solo &(sub-) consolidated | At solo &(sub-) consolidated | At solo &(sub-) consolidated | |||
| 7. Instrument type (types to be specified by each jurisdiction) | Subordinated debt | Subordinated debt | Subordinated debt | |||
| 8. Amount recognized in regulatory capital (currency in million, as of most recent reporting date) | – | – | – | |||
| 9. Nominal amount of instrument | 50 Mill EUR | 50 Mill EUR | 75 Mill EUR | |||
| 9.a. Issue price | 100.00% | 99.66% | 100.00% | |||
| 9.b. Redemption price | 100.00% | 100.00% | 100.00% | |||
| 10. Accounting classification | Liability – amortized cost | Liability – amortized cost | Liability – amortized cost | |||
| 11. Original date of issuance | 01/28/2005 | 08/09/2006 | 08/09/2006 | |||
| 12. Perpetual or dated | Dated | Dated | Dated | |||
| 13. Original maturity date | 01/28/2020 | 08/09/2021 | 08/09/2021 | |||
| 14. Issuer call subject to prior supervisory approval | Yes | Yes | Yes | |||
| 15. Optional call date, contingent call dates, and redemption amount | Issuer call date: 01/28/2015 | Issuer call date: 08/09/2016 | Issuer call date: 08/09/2016 | |||
| 16. Subsequent call dates, if applicable | Issuance call date and on each interest payment day thereafter | Issuance call date and on each year thereafter | Issuance call date and on each year thereafter | |||
| Coupons / dividends | ||||||
| 17. Fixed or floating dividend/coupon | Floating | Fixed to floating (since call date) | Floating | |||
| 18. Coupon rate and any related index | 3M EURIBOR + 1.02% from 01/28/15 | 4.70%; 3M EURIBOR + 1.08% from issuer call date | 3M EURIBOR + 0.58%; 3M EURIBOR + 1.08 % from issuer call date | |||
| 19. Existence of a dividend stopper | No | No | No |
| 222 |
Table of Contents
| 20.a. Fully discretionary, partially discretionary or mandatory (in terms of timing) | Mandatory | Mandatory | Mandatory | |||
| 20.b. Fully discretionary, partially discretionary or mandatory (in terms of amount) | Mandatory | Mandatory | Mandatory | |||
| 21. Existence of step up or other incentive to redeem | No | Yes | Yes | |||
| 22. Noncumulative or cumulative | Cumulative | Cumulative | Cumulative | |||
| 23. Convertible ornon-convertible | Non-convertible | Non-convertible | Non-convertible | |||
| 24. If convertible, conversion trigger (s) | N/A | N/A | N/A | |||
| 25. If convertible, fully or partially | N/A | N/A | N/A | |||
| 26. If convertible, conversion rate | N/A | N/A | N/A | |||
| 27. If convertible, mandatory or optional conversion | N/A | N/A | N/A | |||
| 28. If convertible, specify instrument type convertible into | N/A | N/A | N/A | |||
| 29. If convertible, specify issuer of instrument it converts into | N/A | N/A | N/A | |||
| 30. Write-down features | N/A | N/A | N/A | |||
| 31. If write-down, write-down trigger (s) | N/A | N/A | N/A | |||
| 32. If write–down, full or partial | N/A | N/A | N/A | |||
| 33. If write–down, permanent or temporary | N/A | N/A | N/A | |||
| 34. If temporary write–down, description ofwrite-up mechanism | N/A | N/A | N/A | |||
| 35. Position in subordination hierarchy in liquidation (specify instrument type immediately senior to instrument) | Senior to preferred shares, Additional Tier 1 instruments an Upper Tier 2 instruments (perpetual) | Senior to preferred shares, Additional Tier 1 instruments an Upper Tier 2 instruments (perpetual) | Senior to preferred shares, Additional Tier 1 instruments an Upper Tier 2 instruments (perpetual) | |||
| 36.Non-compliant transitioned features | Yes | Yes | Yes | |||
| 37. If yes, specifynon-compliant features | Existence ofstep-up | Existence ofstep-up | Existence ofstep-up |
| 223 |
Table of Contents
| 1. Issuer | BBVA BANCOMER SA | BBVA BANCOMER SA | BBVA BANCOMER SA | |||
| 2. Unique identifier (eg ISIN) | US05533UAF57 | US05533UAB44 | US05533AAA07 | |||
| 3. Governing law(s) of the instrument | New York. Do not Include trigger event determination, capital events, regulatory enviroment under mexican legislation. Ranking and subordination are also under mexican legislation | New York | New York | |||
| Regulatory treatment | ||||||
| 4. Transitional CRR rules | Tier 2 | Tier 2 | Tier 2 | |||
| 5. Post-transitional CRR rules | Tier 2 | Tier 2 | Tier 2 | |||
| 6. Eligible at solo/(sub–) consolidated/solo & (sub–) consolidated | At solo & (sub–) consolidated | At solo & (sub–) consolidated | At solo & (sub–) consolidated | |||
| 7. Instrument type (types to be specified by each jurisdiction) | Tier 2 instrument | Tier 2 instrument | Tier 1 Instrument | |||
| 8. Amount recognised in regulatory capital (currency in million, as of most recent reporting date) | 559 | 307 | 147 | |||
| 9. Nominal amount of instrument | 1,000 Mill USD | 1,250 Mill USD | 1,000 Mill USD | |||
| 9.a. Issue price | 99.505% | 98.65% | 100.00% | |||
| 9.b. Redemption price | 100.00% | 100.00% | 100.00% | |||
| 10. Accounting classification | Liability – amortised cost | Liability – amortised cost | Liability – amortised cost | |||
| 11. Original date of issuance | 01/18/2018 | 03/10/2011 | 04/22/2010 | |||
| 12. Perpetual or dated | Dated | Dated | Dated | |||
| 13. Original maturity date | 01/18/2033 | 03/10/2021 | 04/22/2020 | |||
| 14. Issuer call subject to prior supervisory approval | No | No | No | |||
| 15. Optional call date, contingent call dates, and redemption amount | January 18th, 2028 (total or partial). Also subject to Regulatory call and Tax call (fully) | Only subject to Regulatory call and Tax call (fully) | Only subject to Regulatory call and Tax call (fully) | |||
| 16. Subsequent call dates, if applicable | NA | NA | NA | |||
| Coupons / dividends | ||||||
| 17. Fixed or floating dividend/coupon | Reset fixed | Fixed | Fixed | |||
| 18. Coupon rate and any related index | 5.125%. From optional date of Treasury Yield call + 265 bps | 6.5% | 7.25% | |||
| 19. Existence of a dividend stopper | Yes, if a trigger event occurs | Yes | Yes |
| 224 |
Table of Contents
| 20.a. Fully discretionary, partially discretionary or mandatory (in terms of timing) | Mandatory | Partially discretionary | Partially discretionary | |||
| 20.b. Fully discretionary, partially discretionary or mandatory (in terms of amount) | Mandatory | Partially discretionary | Partially discretionary | |||
| 21. Existence of step up or other incentive to redeem | No | No | No | |||
| 22. Noncumulative or cumulative | Cumulative | Cumulative | Noncumulative | |||
| 23. Convertible ornon-convertible | Non-convertible | Non-convertible | Non-convertible | |||
| 24. If convertible,conversion trigger (s) | N/A | N/A | N/A | |||
| 25. If convertible,fully or partially | N/A | N/A | N/A | |||
| 26. If convertible,conversion rate | N/A | N/A | N/A | |||
| 27. If convertible,mandatory or optional conversion | N/A | N/A | N/A | |||
| 28. If convertible,specify instrument type convertible into | N/A | N/A | N/A | |||
| 29. If convertible,specify issuer of instrument it converts into | N/A | N/A | N/A | |||
| 30. Write-down features | Yes, if a trigger event occurs | N/A | N/A | |||
| 31. If write-down, write-down trigger (s) | (*) A Trigger Event will be deemed to have occurred if: (i) the CNBV publishes a determination, in its official publication of capitalization levels for Mexican Banks, that the issuer’s Fundamental Capital is equal to or below 4.5%; (ii) the Issuer does not comply with the Mexican Banking Law and other regulation or (iii) the Banking Stability Committee determines that financial assistance is required by the Issuer to avoid revocation of the Issuer’s license for its failure to comply with corrective measures. | N/A | N/A | |||
| 32. If write-down, full or partial | Fully or partially | N/A | N/A | |||
| 33. If write-down, permanent or temporary | Permanent | N/A | N/A | |||
| 34. If temporary write-down, description ofwrite-up mechanism | N/A | N/A | N/A | |||
| 35. Position in subordination hierarchy in liquidation (specify instrument type immediately senior to instrument) | The Notes constitute Preferred Debt, and (i) will be subordinate and junior in right of payment and in liquidation to all of the present and future Senior Debt, (ii) will rank pari passu without preference among themselves and with all of the present and future other unsecured subordinated preferred debt and (iii) will be senior to subordinatednon-preferred debt and all classes of equity or capital stock. | The Notes constitute Preferred Debt, and (i) will be subordinate and junior to all of the present and future senior debt, (ii) will rank pari passu without preference among themselves and with all of the present and future other unsecured subordinated preferred debt and (iii) will be senior to subordinated non–preferred debt and all classes of equity or capital stock. | Constitute Subordinated Non–Preferred Indebtedness and will rank (1) junior to the Senior Indebtedness and Subordinated Preferred Indebtedness, (2) pari passu among themselves and with all the other Subordinated Non–Preferred Indebtedness, and (3) senior only to all classes of capital stock | |||
| 36.Non-compliant transitioned features | No | No | No | |||
| 37. If yes, specifynon-compliant features | N/A | N/A | N/A |
| 225 |
Table of Contents
| 1. Issuer | BBVA BANCOMER SA | BBVA BANCOMER SA | BBVA BANCOMER SA | |||
| 2. Unique identifier (eg ISIN) | US05533UAC27 | US05533UAC27 | US05533UAE82 | |||
| 3. Governing law(s) of the instrument | New York | New York | New York | |||
| Regulatory treatment | ||||||
| 4. Transitional CRR rules | Tier 2 | Tier 2 | Tier 2 | |||
| 5. Post–transitional CRR rules | Tier 2 | Tier 2 | Tier 2 | |||
| 6. Eligible at solo/(sub–) consolidated/solo & (sub–) consolidated | At solo & (sub–) consolidated | At solo & (sub–) consolidated | At solo & (sub–) consolidated | |||
| 7. Instrument type (types to be specified by each jurisdiction) | Tier 2 instrument | Tier 2 instrument | Tier 2 instrument | |||
| 8. Amount recognised in regulatory capital (currency in million, as of most recent reporting date) | 420 | 210 | 112 | |||
| 9. Nominal amount of instrument | 1,000 Mill USD | 500 Mill USD | 200 Mill USD | |||
| 9.a. Issue price | 99.97% | 109,89%+ accured interest from July 19, 2012 to September 28, 2012 | 99.79% | |||
| 9.b. Redemption price | 100.00% | 100.00% | 100.00% | |||
| 10. Accounting classification | Liability – amortised cost | Liability–amortised cost | Liability–amortised cost | |||
| 11. Original date of issuance | 07/19/2012 | 09/28/2012 | 11/12/2014 | |||
| 12. Perpetual or dated | Dated | Dated | Dated | |||
| 13. Original maturity date | 09/30/2022 | 09/30/2022 | 11/12/2029 | |||
| 14. Issuer call subject to prior supervisory approval | No | No | Yes | |||
| 15. Optional call date, contingent call dates, and redemption amount | Only subject to Regulatory call and Tax call (fully) | Only subject to Regulatory call and Tax call (fully) | 11/12/2024 fully or partially, (also subject to Regulatory call and Tax call, only with full amortization) | |||
| 16. Subsequent call dates, if applicable | NA | NA | No | |||
| Coupons / dividends | ||||||
| 17. Fixed or floating dividend/coupon | Fixed | Fixed | Fixed | |||
| 18. Coupon rate and any related index | 6.75% | 6.75% | 5.35% | |||
| 19. Existence of a dividend stopper | Yes | Yes | Yes | |||
| 226 |
Table of Contents
| 20.a. Fully discretionary, partially discretionary or mandatory (in terms of timing) | Mandatory | Mandatory | Mandatory | |||
| 20.b. Fully discretionary, partially discretionary or mandatory (in terms of amount) | Mandatory | Mandatory | Mandatory | |||
| 21. Existence of step up or other incentive to redeem | No | No | No | |||
| 22. Noncumulative or cumulative | Cumulative | Cumulative | Cumulative | |||
| 23. Convertible or non–convertible | Non–convertible | Non–convertible | Non–convertible | |||
| 24. If convertible, conversion trigger (s) | N/A | N/A | N/A | |||
| 25. If convertible, fully or partially | N/A | N/A | N/A | |||
| 26. If convertible, conversion rate | N/A | N/A | N/A | |||
| 27. If convertible, mandatory or optional conversion | N/A | N/A | N/A | |||
| 28. If convertible, specify instrument type convertible into | N/A | N/A | N/A | |||
| 29. If convertible, specify issuer of instrument it converts into | N/A | N/A | N/A | |||
| 30. Write–down features | N/A | N/A | Yes, if a trigger event occurs | |||
| 31. If write–down, write-down trigger (s) | N/A | N/A | (*) A Trigger Event will be deemed to have occurred if: (i) the CNBV publishes a determination, in its official publication of capitalization levels for Mexican Banks, that the issuer’s Fundamental Capital is equal to or below 4.5%; (ii) the Issuer does not comply with the Mexican Banking Law and other regulation or (iii) the Banking Stability Committee determines that financial assistance is required by the Issuer to avoid revocation of the Issuer’s license for its failure to comply with corrective measures. | |||
| 32. If write–down, full or partial | N/A | N/A | Fully or partially | |||
| 33. If write–down, permanent or temporary | N/A | N/A | N/A | |||
| 34. If temporary write–down, description of write–up mechanism | N/A | N/A | N/A | |||
| 35. Position in subordination hierarchy in liquidation (specify type immediately senior to instrument) | The Notes constitute subordinated preferred debt and (i) will rank junior to all present and future senior debt, (ii) will rank pari passu with all other present or future unsecured subordinated preferred debt, and (iii) will be senior to unsecured subordinated non–preferred debt and all classes of capital stock. | The Notes constitute subordinated preferred debt and (i) will rank junior to all present and future senior debt, (ii) will rank pari passu with all other present or future unsecured subordinated preferred debt, and (iii) will be senior to unsecured subordinated non–preferred debt and all classes of capital stock. | The Notes constitute Preferred debt, and (i) will be subordinate and junior in right of payment and in liquidation to all of the present and future Senior Indebtedness, (ii) will rank pari passu without preference among themselves and with all of the present and future other unsecured subordinated preferred indebtedness and (iii) will be senior to subordinatednon-preferred indebtedness and all classes of equity or capital stock. | |||
| 36. Non–compliant transitioned features | No | No | No | |||
| 37. If yes, specify non–compliant features | N/A | N/A | N/A |
| 227 |
Table of Contents
| 1. Issuer | Compass Bank | Compass Bank | Compass Bank | Phoenix Loan Holdings REIT Pfd (Class B) | ||||
| 2. Unique identifier (eg ISIN) | US20449EBT29 | US20449EEE23 | US20453KAA34 | 71909W201 | ||||
| 3. Governing law(s) of the instrument | New York | New York | New York | New York | ||||
| Regulatory treatment | ||||||||
| 4. Transitional CRR rules | Tier 2 | Tier 2 | Tier 2 | Tier 2 | ||||
| 5. Post-transitional CRR rules | Tier 2 | Tier 2 | Tier 2 | Tier 2 | ||||
| 6. Eligible at solo/(sub-) consolidated/ solo &(sub-) consolidated | At solo &(sub-) consolidated | At solo &(sub-) consolidated | At solo &(sub-) consolidated | At solo &(sub-) consolidated | ||||
| 7. Instrument type (types to be specified by each jurisdiction) | Tier 2 instrument | Tier 2 instrument | Tier 2 instrument | Level 1 (phase out until 2018) | ||||
| 8. Amount recognised in regulatory capital (currency in million, as of most recent reporting date) | 50 | 62 | 611 | 18 | ||||
| 9. Nominal amount of instrument | 300 Mill USD | 275 Mill USD | 700 Mill USD | 21 Mill USD | ||||
| 9.a. Issue price | 99.82% | 99.67% | 99.02% | 125.00% | ||||
| 9.b. Redemption price | NO | NO | Redemption price equal to 100% of the principal amount of the Notes to be redeemed, plus accrued interest on the Notes to the redemption date. | 100% of principal redeemed | ||||
| 10. Accounting classification | Liability – amortised cost | Liability – amortised cost | Liability – amortised cost | Liability – amortised cost | ||||
| 11. Original date of issuance | 03/21/2005 | 03/16/2006 | 04/10/2015 | 11/28/2000 | ||||
| 12. Perpetual or dated | Dated | Dated | Dated | Perpetual | ||||
| 13. Original maturity date | 04/01/2020 | 04/01/2026 | 04/10/2025 | Sin Vencimiento | ||||
| 14. Issuer call subject to prior supervisory approval | No | No | Yes | Yes | ||||
| 15. Optional call date, contingent call dates, and redemption amount | N/A | N/A | 03/10/2025 | 06/15/2021 | ||||
| 16. Subsequent call dates, if applicable | No | No | No | Anytime from the first call | ||||
| Coupons / dividends | ||||||||
| 17. Fixed or floating dividend/coupon | Fixed | Fixed | Fixed | Fixed | ||||
| 18. Coupon rate and any related index | 5.50% | 5.90% | 3.33% | 9.88% | ||||
| 19. Existence of a dividend stopper | No | No | No | No |
| 228 |
Table of Contents
| 20.a. Fully discretionary, partially discretionary or mandatory (in terms of timing) | Mandatory | Mandatory | Mandatory | Discretionary | ||||
| 20.b. Fully discretionary, partially discretionary or mandatory (in terms of amount) | Mandatory | Mandatory | Mandatory | Discretionary | ||||
| 21. Existence of step up or other incentive to redeem | No | No | No | No | ||||
| 22. Noncumulative or cumulative | Cumulative | Cumulative | Cumulative | Noncumulative | ||||
| 23. Convertible ornon-convertible | Non-convertible | Non-convertible | Non-convertible | Non-convertible | ||||
| 24. If convertible, conversion trigger (s) | N/A | N/A | N/A | N/A | ||||
| 25. If convertible, fully or partially | N/A | N/A | N/A | N/A | ||||
| 26. If convertible, conversion rate | N/A | N/A | N/A | N/A | ||||
| 27. If convertible, mandatory or optional conversion | N/A | N/A | N/A | N/A | ||||
| 28. If convertible, specify instrument type convertible into | N/A | N/A | N/A | N/A | ||||
| 29. If convertible, specify issuer of instrument it converts into | N/A | N/A | N/A | N/A | ||||
| 30. Write-down features | N/A | N/A | N/A | N/A | ||||
| 31. If write-down, write-down trigger (s) | N/A | N/A | N/A | N/A | ||||
| 32. If write-down, full or partial | N/A | N/A | N/A | N/A | ||||
| 33. If write-down, permanent or temporary | N/A | N/A | N/A | N/A | ||||
| 34. If temporary write-down, description ofwrite-up mechanism | N/A | N/A | N/A | N/A | ||||
| 35. Position in subordination hierarchy in liquidation (specify instrument type immediately senior to instrument) | Senior creditors | Senior creditors | Senior creditors | Senior creditors | ||||
| 36.Non-compliant transitioned features | No | No | No | No | ||||
| 37. If yes, specifynon-compliant features | N/A | N/A | N/A | N/A |
| 229 |
Table of Contents
| 1. Issuer | BBVA Colombia SA | BBVA Colombia SA | BBVA Colombia SA | BBVA Colombia SA | BBVA Colombia SA | |||||
| 2. Unique identifier (e.g. CUSIP, ISIN or Bloomberg identifier for private placement | BBVAIP190921 | BBVAIP190926 | BBVAIP190223 | BBVAIP190228 | EK6295332 | |||||
| 3. Governing law(s) of the instrument | Colombia | Colombia | Colombia | Colombia | Colombia | |||||
| Regulatory treatment | ||||||||||
| 4. Transitional CRR rules | Tier 2 | Tier 2 | Tier 2 | Tier 2 | Tier 2 | |||||
| 5. Post-transitional CRR rules | Tier 2 | Tier 2 | Tier 2 | Tier 2 | Tier 2 | |||||
| 6. Eligible at solo/(sub-) consolidated/solo &(sub-) consolidated | At solo &(sub-) consolidated | At solo &(sub-) consolidated | At solo &(sub-) consolidated | At solo &(sub-) consolidated | At solo &(sub-) consolidated | |||||
| 7. Instrument type (types to be specified by each jurisdiction) | Tier 2 Instrument | Tier 2 Instrument | Tier 2 Instrument | Tier 2 Instrument | Tier 2 Instrument | |||||
| 8. Amount recognized in regulatory capital (currency in million, as of most recent reporting date) | 15 | 42 | 44 | 44 | 43 | |||||
| 9. Nominal amount of instrument | 106.000 Mill COP | 156.000 Mill COP | 200.000 Mill COP | 165.000 Mill COP | 160.000 Mill COP | |||||
| 9.a. Issue price | 100.00% | 100.00% | 100.00% | 100.00% | 100.00% | |||||
| 9.b. Redemption price | Bullet Bonds; 100% | Bullet Bonds; 100% | Bullet Bonds; 100% | Bullet Bonds; 100% | Bullet Bonds; 100% | |||||
| 10. Accounting classification | Liability – amortized cost | Liability – amortized cost | Liability – amortized cost | Liability – amortized cost | Liability – amortized cost | |||||
| 11. Original date of issuance | 09/19/2011 | 09/19/2011 | 02/19/2013 | 02/19/2013 | 11/26/2014 | |||||
| 12. Perpetual or dated | Dated | Dated | Dated | Dated | Dated | |||||
| 13. Original maturity date | 09/19/2021 | 09/19/2026 | 02/19/2023 | 02/19/2028 | 11/26/2034 | |||||
| 14. Issuer call subject to prior supervisory approval | No | No | No | No | No | |||||
| 15. Optional call date, contingent call dates, and redemption amount | N/A | N/A | N/A | N/A | N/A | |||||
| 16. Subsequent call dates, if applicable | N/A | N/A | N/A | N/A | N/A | |||||
| Coupons / dividends | ||||||||||
| 17. Fixed or floating dividend/coupon | Floating | Floating | Floating | Floating | Floating | |||||
| 18. Coupon rate and any related index | CPI + 4.45% | CPI + 4.70% | CPI + 3.60% | CPI + 3.89% | CPI + 4.38% | |||||
| 19. Existence of a dividend stopper | No | No | No | No | No |
| 230 |
Table of Contents
| 20.a. Fully discretionary, partially discretionary or mandatory (in terms of timing) | Mandatory | Mandatory | Mandatory | Mandatory | Mandatory | |||||
| 20.b. Fully discretionary, partially discretionary or mandatory (in terms of amount) | Mandatory | Mandatory | Mandatory | Mandatory | Mandatory | |||||
| 21. Existence of step up or other incentive to redeem | No | No | No | No | No | |||||
| 22. Noncumulative or cumulative | Noncumulative | Noncumulative | Noncumulative | Noncumulative | Noncumulative | |||||
| 23. Convertible orNon-convertible | Non-convertible | Non-convertible | Non-convertible | Non-convertible | Non-convertible | |||||
| 24. If convertible, conversion trigger (s) | N/A | N/A | N/A | N/A | N/A | |||||
| 25. If convertible, fully or partially | N/A | N/A | N/A | N/A | N/A | |||||
| 26. If convertible, conversion rate | N/A | N/A | N/A | N/A | N/A | |||||
| 27. If convertible, mandatory or optional conversion | N/A | N/A | N/A | N/A | N/A | |||||
| 28. If convertible, specify instrument type convertible into | N/A | N/A | N/A | N/A | N/A | |||||
| 29. If convertible, specify issuer of instrument it converts into | N/A | N/A | N/A | N/A | N/A | |||||
| 30. Write-down features | N/A | N/A | N/A | N/A | N/A | |||||
| 31. If write-down, write-down trigger (s) | N/A | N/A | N/A | N/A | N/A | |||||
| 32. If write-down, full or partial | N/A | N/A | N/A | N/A | N/A | |||||
| 33. If write-down, permanent or temporary | N/A | N/A | N/A | N/A | N/A | |||||
| 34. If temporary write-down, description ofwrite-up mechanism | N/A | N/A | N/A | N/A | N/A | |||||
| 35. Position in subordination hierarchy in liquidation (specify instrument type immediately senior to instrument) | Subordinated liabilities other than securities in parity rank immediately superior | Subordinated liabilities other than securities in parity rank immediately superior | Subordinated liabilities other than securities in parity rank immediately superior | Subordinated liabilities other than securities in parity rank immediately superior | Subordinated liabilities other than securities in parity rank immediately superior | |||||
| 36.Non-compliant transitioned features | No | No | No | No | No | |||||
| 37. If yes, specifyNon-compliant features | N/A | N/A | N/A | N/A | N/A |
| 231 |
Table of Contents
| 1. Issuer | BBVA Colombia SA | BBVA Colombia SA | BBVA Continental | BBVA Continental | BBVA Continental | |||||
| 2. Unique identifier (e.g. CUSIP, ISIN or Bloomberg identifier for private placement) | COB13CBB0088 | USP1024TAN92 | PEP11600D029 | PEP11600D037 | PEP11600D052 | |||||
| 3. Governing law(s) of the instrument | Colombia | Colombia | Peru | Peru | Peru | |||||
| Regulatory treatment | ||||||||||
| 4. Transitional CRR rules | Tier 2 | Tier 2 | Tier 2 | Tier 2 | Tier 2 | |||||
| 5. Post-transitional CRR rules | Tier 2 | Tier 2 | Non admissible | Tier 2 | Tier 2 | |||||
| 6. Eligible atsolo/(sub-) consolidated/solo &(sub-) consolidated | At solo & (sub-) consolidated | At solo & (sub-) consolidated | At solo & (sub-) consolidated | At solo & (sub-) consolidated | At solo & (sub-) consolidated | |||||
| 7. Instrument type (types to be specified by each jurisdiction) | Tier 2 Instrument | Tier 2 Instrument | Tier 2 Instrument | Tier 2 Instrument | Tier 2 Instrument | |||||
| 8. Amount recognized in regulatory capital (currency in million, as of most recent reporting date) | 24 | 349 | 10 | 7 | 7 | |||||
| 9. Nominal amount of instrument | 90.000 Mill COP | 400 Mill USD | 20 Mill USD | 55 Mill PEN | 50 Mill PEN | |||||
| 9.a. Issue price | 100.00% | 99.91% | 99.38% | 100.00% | 100.00% | |||||
| 9.b. Redemption price | Bullet Bonds; 100% | 100% | There is amortization option with a 0% premium. | No redemption option | No redemption option | |||||
| 10. Accounting classification | Liability – amortized cost | Liability – amortized cost | Liability – amortized cost | Liability – amortized cost | Liability – amortized cost | |||||
| 11. Original date of issuance | 11/26/2014 | 04/21/2015 | 05/14/2007 | 06/18/2007 | 11/19/2007 | |||||
| 12. Perpetual or dated | Dated | Dated | Dated | Dated | Dated | |||||
| 13. Original maturity date | 11/26/2029 | 04/21/2025 | 05/14/2027 | 06/18/2032 | 11/19/2032 | |||||
| 14. Issuer call subject to prior supervisory approval | No | Yes | Sí | No | No | |||||
| 15. Optional call date, contingent call dates, and redemption amount | N/A | 21/04/2020; Tax call | Issuer call date: 14/05/2022, also subject to Regulatory call. | Subject to Regulatory call. | Subject to Regulatory call. | |||||
| 16. Subsequent call dates, if applicable | N/A | The tax call can be exercised at any time after 21/04/2020 | At anytime from the call date | �� | N/A | N/A | ||||
| Coupons / dividends | ||||||||||
| 17. Fixed or floating dividend/coupon | Floating | Fixed | Fixed | Floating | Floating | |||||
| 18. Coupon rate and any related index | CPI + 4.50% | 4.88% | 6% (up to 30th coupon) – (annual increase of 0.5% from the thirty first coupon – call date) | VAC (semester)/VAC (initial)*3.4688% | VAC (semester)/VAC (initial)*3.5625% | |||||
| 19. Existence of a dividend stopper | No | No | No | No | No | |||||
| 232 |
Table of Contents
| 20.a. Fully discretionary, partially discretionary or mandatory (in terms of timing) | Mandatory | Mandatory | N/A | N/A | N/A | |||||
| 20.b. Fully discretionary, partially discretionary or mandatory (in terms of amount) | Mandatory | Mandatory | N/A | N/A | N/A | |||||
| 21. Existence of step up or other incentive to redeem | No | No | Yes | No | No | |||||
| 22. Noncumulative or cumulative | Noncumulative | Noncumulative | N/A | N/A | N/A | |||||
| 23. Convertible orNon-convertible | Non-convertible | Non-convertible | N/A | N/A | N/A | |||||
| 24. If convertible, conversion trigger (s) | N/A | N/A | N/A | N/A | N/A | |||||
| 25. If convertible, fully or partially | N/A | N/A | N/A | N/A | N/A | |||||
| 26. If convertible, conversion rate | N/A | N/A | N/A | N/A | N/A | |||||
| 27. If convertible, mandatory or optional conversion | N/A | N/A | N/A | N/A | N/A | |||||
| 28. If convertible, specify instrument type convertible into | N/A | N/A | N/A | N/A | N/A | |||||
| 29. If convertible, specify issuer of instrument it converts into | N/A | N/A | N/A | N/A | N/A | |||||
| 30. Write-down features | N/A | N/A | NO | NO | NO | |||||
| 31. If write-down, write-down trigger (s) | N/A | N/A | N/A | N/A | N/A | |||||
| 32. If write-down, full or partial | N/A | N/A | N/A | N/A | N/A | |||||
| 33. If write-down, permanent or temporary | N/A | N/A | N/A | N/A | N/A | |||||
| 34. If temporary write-down, description ofwrite-up mechanism | N/A | N/A | N/A | N/A | N/A | |||||
| 35. Position in subordination hierarchy in liquidation (specify instrument type immediately senior to instrument) | Subordinated liabilities other than securities in parity rank immediately superior | Subordinated liabilities other than securities in parity rank immediately superior | Senior liabilities other than securities in parity rank immediately superior | Senior liabilities other than securities in parity rank immediately superior | Senior liabilities other than securities in parity rank immediately superior | |||||
| 36.Non-compliant transitioned features | No | No | Yes | No | No | |||||
| 37. If yes, specifyNon-compliant features | N/A | N/A | Subsidiary issue Not subject to EUCRD-IV | N/A | N/A |
| 233 |
Table of Contents
| 1. Issuer | BBVA Continental | BBVA Continental | BBVA Continental | BBVA Continental | BBVA Continental | |||||
| 2. Unique identifier (e.g. CUSIP, ISIN or Bloomberg identifier for private placement) | PEP11600D060 | PEP11600D078 | PEP11600D086 | PEP11600D094 | Credit Suisse TIER 1 | |||||
| 3. Governing law(s) of the instrument | Peru | Peru | Peru | Peru | New York | |||||
| Regulatory treatment | ||||||||||
| 4. Transitional CRR rules | Tier 2 | Tier 2 | Tier 2 | Tier 2 | Tier 2 | |||||
| 5. Post-transitional CRR rules | Tier 2 | Tier 2 | Tier 2 | Tier 2 | Non admissible | |||||
| 6. Eligible at solo/(sub-) consolidated/solo & (sub-) consolidated | At solo & (sub-) consolidated | At solo & (sub-) consolidated | At solo & (sub-) consolidated | At solo & (sub-) consolidated | At solo & (sub-) consolidated | |||||
| 7. Instrument type (types to be specified by each jurisdiction) | Tier 2 Instrument | Tier 2 Instrument | Tier 2 Instrument | Tier 2 Instrument | Tier 2 Instrument | |||||
| 8. Amount recognized in regulatory capital (currency in million, as of most recent reporting date) | 9 | 6 | 6 | 4 | 105 | |||||
| 9. Nominal amount of instrument | 20 Mill USD | 45 Mill PEN | 50 Mill PEN | 30 Mill PEN | 200 Mill USD | |||||
| 9.a. Issue price | 100.00% | 100.00% | 100.00% | 100.00% | 100.00% | |||||
| 9.b. Redemption price | No redemption option | Sin opción de amortización | No redemption option | No redemption option | There is amortization option with a 0% premium. | |||||
| 10. Accounting classification | Liability – amortized cost | Liability – amortized cost | Liability – amortized cost | Liability – amortized cost | Liability – amortized cost | |||||
| 11. Original date of issuance | 02/28/2008 | 07/08/2008 | 09/09/2008 | 12/15/2008 | 10/07/2010 | |||||
| 12. Perpetual or dated | Dated | Dated | Dated | Dated | Dated | |||||
| 13. Original maturity date | 02/28/2028 | 07/08/2023 | 09/09/2023 | 12/15/2033 | 10/07/2040 | |||||
| 14. Issuer call subject to prior supervisory approval | No | No | No | No | Yes | |||||
| 15. Optional call date, contingent call dates, and redemption amount | Subject to Regulatory call. | Subject to Regulatory call. | Subject to Regulatory call. | Subject to Regulatory call. | Issuer call date: 07/10/2020, also subject to Regulatory call | |||||
| 16. Subsequent call dates, if applicable | N/A | N/A | N/A | N/A | At anytime from the call date | |||||
| Coupons / dividends | ||||||||||
| 17. Fixed or floating dividend/coupon | Fixed | Floating | Floating | Floating | Fixed to Floating | |||||
| 18. Coupon rate and any related index | 6.47% | VAC (semester)/VAC (initial)*3.0625% | VAC (semester)/VAC (initial)*3.0938% | VAC (semester)/VAC (initial)*4.1875% | 7.375% (ten years), L3M + 6.802% (next ten years) | |||||
| 19. Existence of a dividend stopper | No | No | No | No | N/A |
| 234 |
Table of Contents
| 20.a. Fully discretionary, partially discretionary or mandatory (in terms of timing) | N/A | N/A | N/A | N/A | N/A | |||||
| 20.b. Fully discretionary, partially discretionary or mandatory (in terms of amount) | N/A | N/A | N/A | N/A | N/A | |||||
| 21. Existence of step up or other incentive to redeem | No | No | No | No | Yes | |||||
| 22. Noncumulative or cumulative | N/A | N/A | N/A | N/A | Noncumulative | |||||
| 23. Convertible orNon-convertible | N/A | N/A | N/A | N/A | N/A | |||||
| 24. If convertible, conversion trigger (s) | N/A | N/A | N/A | N/A | N/A | |||||
| 25. If convertible, fully or partially | N/A | N/A | N/A | N/A | N/A | |||||
| 26. If convertible, conversion rate | N/A | N/A | N/A | N/A | N/A | |||||
| 27. If convertible, mandatory or optional conversion | N/A | N/A | N/A | N/A | N/A | |||||
| 28. If convertible, specify instrument type convertible into | N/A | N/A | N/A | N/A | N/A | |||||
| 29. If convertible, specify issuer of instrument it converts into | N/A | N/A | N/A | N/A | N/A | |||||
| 30. Write-down features | NO | NO | NO | NO | NO | |||||
| 31. If write-down, write-down trigger (s) | N/A | N/A | N/A | N/A | N/A | |||||
| 32. If write-down, full or partial | N/A | N/A | N/A | N/A | N/A | |||||
| 33. If write-down, permanent or temporary | N/A | N/A | N/A | N/A | N/A | |||||
| 34. If temporary write-down, description ofwrite-up mechanism | N/A | N/A | N/A | N/A | N/A | |||||
| 35. Position in subordination hierarchy in liquidation (specify instrument type immediately senior to instrument) | Senior liabilities other than securities in parity rank immediately superior | Senior liabilities other than securities in parity rank immediately superior | Senior liabilities other than securities in parity rank immediately superior | Senior liabilities other than securities in parity rank immediately superior | Senior liabilities other than securities in parity rank immediately superior | |||||
| 36.Non-compliant transitioned features | No | No | No | No | No | |||||
| 37. If yes, specifyNon-compliant features | N/A | N/A | N/A | N/A | N/A |
| 235 |
Table of Contents
| 1. Issuer | BBVA Continental | BBVA Continental | Banco Bilbao Vizcaya Argentaria Paraguay S.A. | Banco Bilbao Vizcaya Argentaria Paraguay S.A. | BBVA Uruguay SA | |||||
| 2. Unique identifier (e.g. CUSIP, ISIN or Bloomberg identifier for private placement) | PEP11600D102 | US05537GAD79-USP16236AG98 | PYBBV01F3798 | PYBBV02F5511 | N/A | |||||
| 3. Governing law(s) of the instrument | Peru | New York | Paraguay | Paraguay | Uruguay | |||||
| Regulatory treatment | ||||||||||
| 4. Transitional CRR rules | Tier 2 | Tier 2 | Tier 2 | Tier 2 | Tier 2 | |||||
| 5. Post-transitional CRR rules | Tier 2 | Tier 2 | Tier 2 | Tier 2 | Tier 2 | |||||
| 6. Eligible at solo/(sub-) consolidated/solo & (sub-) consolidated | At solo & (sub-) consolidated | At solo & (sub-) consolidated | At solo & (sub-) consolidated | At solo & (sub-) consolidated | At solo & (sub-) consolidated | |||||
| 7. Instrument type (types to be specified by each jurisdiction) | Tier 2 Instrument | Tier 2 Instrument | Tier 2 Instrument | Tier 2 Instrument | Tier 2 Instrument | |||||
| 8. Amount recognized in regulatory capital (currency in million, as of most recent reporting date) | 21 | 137 | 8 | 13 | 13 | |||||
| 9. Nominal amount of instrument | 45 Mill USD | 300 Mill USD | 20 Mill USD | 25 Mill USD | 15 Mill USD | |||||
| 9.a. Issue price | 100.00% | 99.32% | 100.00% | 100.00% | 100.00% | |||||
| 9.b. Redemption price | There is amortization option with a 0% premium. | BBVA may, with the approval of the SBS, redeem the Notes, fully or partially, at the revision date, at a redemption price equal to 100% of the Nominal value of the Notes that are amortized plus accrued and unpaid interests over the Nominal of the Notes | 100% | 100% | 100% | |||||
| 10. Accounting classification | Liability – amortized cost | Liability – amortized cost | Liability – amortized cost | Liability – amortized cost | Liability – amortized cost | |||||
| 11. Original date of issuance | 10/02/2013 | 09/22/2014 | 11/19/2014 | 11/24/2015 | 12/19/2014 | |||||
| 12. Perpetual or dated | Dated | Dated | Dated | Dated | Dated | |||||
| 13. Original maturity date | 10/02/2028 | 09/22/2029 | 11/05/2021 | 11/18/2022 | 12/19/2024 | |||||
| 14. Issuer call subject to prior supervisory approval | Yes | Yes | N/A | N/A | Yes | |||||
| 15. Optional call date, contingent call dates, and redemption amount | Issuer call date: 10/02/2023, also subject to Regulatory call | Issuer call date: 09/22/2024, also subject to Regulatory call | N/A | N/A | At issuer’s discretion after 5 years from issue date, minimum USD 1MM | |||||
| 16. Subsequent call dates, if applicable | At anytime from the call date | N/A | N/A | N/A | At issuer’s discretion after 5 years from issue date, minimum USD 1MM | |||||
| Coupons / dividends | ||||||||||
| 17. Fixed or floating dividend/coupon | Fixed | Fixed | Fixed | Fixed | Floating | |||||
| 18. Coupon rate and any related index | 6.53% | 5.25% | 6.75% | 6.70% | LIBOR 90d + 4.35% | |||||
| 19. Existence of a dividend stopper | No | No | No | No | No |
| 236 |
Table of Contents
| 20.a. Fully discretionary, partially discretionary or mandatory (in terms of timing) | N/A | N/A | Mandatory | Mandatory | Mandatory | |||||
| 20.b. Fully discretionary, partially discretionary or mandatory (in terms of amount) | N/A | N/A | Mandatory | Mandatory | Mandatory | |||||
| 21. Existence of step up or other incentive to redeem | No | No | No | No | No | |||||
| 22. Noncumulative or cumulative | N/A | N/A | N/A | N/A | N/A | |||||
| 23. Convertible orNon-convertible | N/A | N/A | Convertible | Convertible | Non-convertible | |||||
| 24. If convertible, conversion trigger (s) | N/A | N/A | TIER 1 <8% o TIER 2 <12% or Accumulated losses >Paid-in Capital | TIER 1 <8% o TIER 2 <12% or Accumulated losses >Paid-in Capital | N/A | |||||
| 25. If convertible, fully or partially | N/A | N/A | Partialy | Partialy | N/A | |||||
| 26. If convertible, conversion rate | N/A | N/A | 100% | 100% | N/A | |||||
| 27. If convertible, mandatory or optional conversion | N/A | N/A | Mandatory | Mandatory | N/A | |||||
| 28. If convertible, specify instrument type convertible into | N/A | N/A | Ordinary Tier 1 | Ordinary Tier 1 | N/A | |||||
| 29. If convertible, specify issuer of instrument it converts into | N/A | N/A | Banco Bilbao Vizcaya Argentaria Paraguay S.A. | Banco Bilbao Vizcaya Argentaria Paraguay S.A. | N/A | |||||
| 30. Write-down features | NO | NO | N/A | N/A | N/A | |||||
| 31. If write-down, write-down trigger (s) | N/A | N/A | N/A | N/A | N/A | |||||
| 32. If write-down, full or partial | N/A | N/A | N/A | N/A | N/A | |||||
| 33. If write-down, permanent or temporary | N/A | N/A | N/A | N/A | N/A | |||||
| 34. If temporary write-down, description ofwrite-up mechanism | N/A | N/A | N/A | N/A | N/A | |||||
| 35. Position in subordination hierarchy in liquidation (specify instrument type immediately senior to instrument) | Senior liabilities other than securities in parity rank immediately superior | Senior liabilities other than securities in parity rank immediately superior | Senior liabilities other than securities in parity rank immediately superior | Senior liabilities other than securities in parity rank immediately superior | Senior liabilities other than securities in parity rank immediately superior | |||||
| 36.Non-compliant transitioned features | Yes | No | No | No | No | |||||
| 37. If yes, specifyNon-compliant features | Subsidiary issue Not subject to EUCRD-IV | N/A | N/A | N/A | N/A |
| 237 |
Table of Contents
| 1. Issuer | Turkiye Garanti Bankasi | |
| 2. Unique identifier (e.g. CUSIP, ISIN or Bloomberg identifier for private placement | XS1617531063 | |
| 3. Governing law(s) of the instrument | English and, regarding subordination, Turkish | |
| Regulatory treatment | ||
| 4. Transitional CRR rules | Tier 2 | |
| 5. Post-transitional CRR rules | Tier 2 | |
| 6. Eligible at solo/(sub-) consolidated/solo & (sub-) consolidated | At solo & (sub-) consolidated | |
| 7. Instrument type (types to be specified by each jurisdiction) | Tier 2 instrument | |
| 8. Amount recognized in regulatory capital (currency in million, as of most recent reporting date) | 290 | |
| 9. Nominal amount of instrument | 750 mills USD | |
| 9.a. Issue price | 100.00% | |
| 9.b. Redemption price | 100.00% | |
| 10. Accounting classification | Liability – amortized cost | |
| 11. Original date of issuance | 05/23/2017 | |
| 12. Perpetual or dated | Dated | |
| 13. Original maturity date | 05/24/2027 | |
| 14. Issuer call subject to prior supervisory approval | Yes | |
| 15. Optional call date, contingent call dates, and redemption amount | 05/24/2022 fully (also subject to Regulatory call and Tax call, only full amortization) | |
| 16. Subsequent call dates, if applicable | No | |
| Coupons / dividends | ||
| 17. Fixed or floating dividend/coupon | Fixed | |
| 18. Coupon rate and any related index | 6.13% | |
| 19. Existence of a dividend stopper | No |
| 238 |
Table of Contents
| 20.a. Fully discretionary, partially discretionary or mandatory (in terms of timing) | Mandatory | |
| 20.b. Fully discretionary, partially discretionary or mandatory (in terms of amount) | Mandatory | |
| 21. Existence of step up or other incentive to redeem | No | |
| 22. Noncumulative or cumulative | Cumulative | |
| 23. Convertible orNon-convertible | Non-convertible | |
| 24. If convertible, conversion trigger (s) | N/A | |
| 25. If convertible, fully or partially | N/A | |
| 26. If convertible, conversion rate | N/A | |
| 27. If convertible, mandatory or optional conversion | N/A | |
| 28. If convertible, specify instrument type convertible into | N/A | |
| 29. If convertible, specify issuer of instrument it converts into | N/A | |
| 30. Write-down features | No | |
| 31. If write-down, write-down trigger (s) | N/A | |
| 32. If write-down, full or partial | N/A | |
| 33. If write-down, permanent or temporary | N/A | |
| 34. If temporary write-down, description ofwrite-up mechanism | N/A | |
| 35. Position in subordination hierarchy in liquidation (specify instrument type immediately senior to instrument) | Constitute Non-Preferred Debt and will rank (1) junior to the Senior Debt and Preferred Debt, (2) pari passu among themselves and with all the other Non-Preferred Debt, (3) senior only to all classes of equity capital | |
| 36.Non-compliant transitioned features | No | |
| 37. If yes, specifyNon-compliant features | N/A |
| 239 |
Table of Contents
Annex IV. Leverage ratio common disclosure
| 31/12/2018 | 31/12/2018 | 31/12/2017 | 31/12/2017 | |||||||||||||||
| Phase-in | Fully-loaded | Phase-in | Fully-loaded | |||||||||||||||
| On-balance sheet exposures (excluding derivatives and SFTs) | ||||||||||||||||||
| 1 | On-balance sheet items (excluding derivatives, SFTs and fiduciary assets, but including collateral) | 594,012 | 594,012 | 605,325 | 605,325 | |||||||||||||
| 2 | (Asset amounts deducted in determining Tier 1 capital) | (9,012) | (10,080) | (9,643) | (9,920) | |||||||||||||
| 3 | Total on-balance sheet exposures (excluding derivatives, SFTs and fiduciary assets) (sum of line) | 584,999 | 583,932 | 595,682 | 595,405 | |||||||||||||
| Derivative exposures | ||||||||||||||||||
| 4 | Replacement cost associated with all derivatives transactions (ie net of eligible cash variation margin) | 8,997 | 8,997 | 11,397 | 11,397 | |||||||||||||
| 5 | Add-on amounts for PFE associated with all derivatives transactions(mark-to-market method) | 14,280 | 14,280 | 13,586 | 13,586 | |||||||||||||
| EU-5a | Exposure determined under Original Exposure Method | – | – | – | – | |||||||||||||
| 6 | Gross-up for derivatives collateral provided where deducted from the balance sheet assets pursuant to the applicable accounting framework | – | – | – | – | |||||||||||||
| 7 | (Deductions of receivables assets for cash variation margin provided in derivatives transactions) | (2,067) | (2,067) | (2,730) | (2,730) | |||||||||||||
| 8 | (Exempted CCP leg of client-cleared trade exposures) | ( ) | ( ) | – | – | |||||||||||||
| 9 | Adjusted effective notional amount of written credit derivatives | 14,204 | 14,204 | 16,333 | 16,333 | |||||||||||||
| 10 | (Adjusted effective notional offsets andadd-on deductions for written credit derivatives) | (7,474) | (7,474) | (11,234) | (11,234) | |||||||||||||
| 11 | Total derivatives exposures (sum of lines 4 to 10) | 27,939 | 27,939 | 27,353 | 27,353 | |||||||||||||
| Securities financing transaction exposures | ||||||||||||||||||
| 12 | Gross SFT assets (with no recognition of netting), after adjusting for sales accounting transactions | 28,002 | 28,002 | 25,529 | 25,529 | |||||||||||||
| 13 | (Netted amounts of cash payables and cash receivables of gross SFT assets) | (2,188) | (2,188) | (3,906) | (3,906) | |||||||||||||
| 14 | Counterparty credit risk exposure for SFT assets | 5,137 | 5,137 | 2,658 | 2,658 | |||||||||||||
| EU-14a | Derogation for SFTs: Counterparty credit risk exposure in accordance with Article 429b (4) and 222 of Regulation (EU) No 575/2013 | – | – | – | – | |||||||||||||
| 15 | Agent transaction exposures | – | – | – | – | |||||||||||||
| EU-15A | (Exempted CCP leg of client-cleared SFT exposure) | – | – | – | – | |||||||||||||
| 16 | Total securities financing transaction exposures (sum of lines 12 to 15a) | 30,951 | 30,951 | 24,281 | 24,281 | |||||||||||||
| Otheroff-balance sheet exposures | ||||||||||||||||||
| 17 | Off-balance sheet exposures at gross notional amount | 156,535 | 156,535 | 177,024 | 177,024 | |||||||||||||
| 18 | (Adjustments for conversion to credit equivalent amounts) | (95,126) | (95,126) | (114,583) | (114,583) | |||||||||||||
| 19 | Other off-balance sheet exposures (sum of lines 17 to 18) | 61,409 | 61,409 | 62,441 | 62,441 | |||||||||||||
| Exempted exposures in accordance with CRR Article 429 (7) and (14) (on and off balance sheet) | ||||||||||||||||||
| EU-19a | (Exemption of intragroup exposures (solo basis) in accordance with Article 429(7) of Regulation (EU) No 575/2013 (on and off balance sheet)) | – | – | – | – | |||||||||||||
| EU-19b | (Exposures exempted in accordance with Article 429 (14) of Regulation (EU) No 575/2013 (on and off balance sheet)) | – | – | – | – | |||||||||||||
| Capital and total exposures | ||||||||||||||||||
| 20 | Tier 1 capital | 45,947 | 45,047 | 46,980 | 46,316 | |||||||||||||
| 21 | Total leverage ratio exposures (sum of lines 3, 11, 16, 19, EU-19a and EU-19b) | 705,299 | 704,231 | 709,758 | 709,480 | |||||||||||||
| Leverage ratio | ||||||||||||||||||
| 22 | Leverage ratio | 6.51% | 6.40% | 6.62% | 6.53% | |||||||||||||
| Choice on transitional arrangements and amount of derecognised fiduciary items | ||||||||||||||||||
| EU-23 | Choice on transitional arrangements for the definition of the capital measure | Transitional | Fully phased in | Transitional | Fully phased in | |||||||||||||
EU-24
| Amount of derecognised fiduciary items in accordance with Article 429 (11) of Regulation (EU) NO 575/2013 | – | – | – | – | |||||||||||||
| 31/12/2018 | 31/12/2018 | 31/12/2017 | 31/12/2017 | |||||||||||||||
| Phase-in | Fully-loaded | Phase-in | Fully-loaded | |||||||||||||||
| EU-1 | Totalon-balance sheet exposures (excluding derivatives, SFTs, and exempted exposures), of which: | 594,012 | 594,012 | 605,325 | 605,325 | |||||||||||||
| EU-2 | Trading book exposures | 70,779 | 70,779 | 71,806 | 71,806 | |||||||||||||
| EU-3 | Banking book exposures, of which: | 523,233 | 523,233 | 533,520 | 533,520 | |||||||||||||
| EU-4 | Covered bonds | 35 | 35 | 111 | 111 | |||||||||||||
| EU-5 | Exposures treated as sovereigns | 117,076 | 117,076 | 107,826 | 107,826 | |||||||||||||
| EU-6 | Exposures to regional governments, MDB, international organisations and PSE NOT treated as sovereigns | 10,577 | 10,577 | 9,959 | 9,959 | |||||||||||||
| EU-7 | Institutions | 40,897 | 40,897 | 43,156 | 43,156 | |||||||||||||
| EU-8 | Secured by mortgages of immovable properties | 113,505 | 113,505 | 124,417 | 124,417 | |||||||||||||
| EU-9 | Retail exposures | 72,714 | 72,714 | 74,416 | 74,416 | |||||||||||||
| EU-10 | Corporate | 125,690 | 125,690 | 125,418 | 125,418 | |||||||||||||
| EU-11 | Exposures in default | 8,999 | 8,999 | 12,247 | 12,247 | |||||||||||||
| EU-12 | Other exposures (eg equity, securitisations, and othernon-credit obligation assets) | 33,740 | 33,740 | 35,968 | 35,968 | |||||||||||||
| 240 |
Table of Contents
Annex V. Regulatory compliance
| CRR Article | Description | Pillar III Section | ||
General principles of disclosure | ||||
Art. 431 - Scope of disclosure requirements | Scope of application of the disclosure requirements and publication of data that transmit a comprehensive image of the institution’s risk profile | Prudential Relevance Report 2018 Basel Pillar III. | ||
Art. 432 -Non-material, proprietary or confidential information | Omission of disclosures considered not material or confidential and the reasons for classifying them as such. | BBVA Group has not made use of the exemption for disclosures considered proprietary or confidential. | ||
Art. 433 - Frequency of disclosure | Information must be published at least on an annual basis in conjunction with the date of publication of the financial statements. | BBVA Group publishes information more frequently than once a year, as defined in Title V of the Guidelines on Disclosure Requirements, in accordance with Part Eight of the CRR, in the section on Shareholders and Investors / Financial Information on the BBVA Group website. | ||
Art. 434 - Means of disclosures | Requirement to disclose information in one medium, or if published in two or more media, a reference to the information in the other media must be included within each medium. Compliance by publication of equivalent data in accordance with other requirements (accounting, public price, etc.). | BBVA Group publishes the Prudential Relevance Report 2018 - Basel Pillar III in a single report, supplemented with the Annexes in the same section on the Group’s website. In addition, the Report may be supplemented with financial information in the Group’s Consolidated Annual Financial Statements (see “Correspondence of the Pillar III sections to the Group’s Annual Consolidated Annual Financial Statements”). | ||
Technical criteria on transparency and disclosure of information. | ||||
Art. 435.1 - Risk management objectives and policies for each separate category of risk | a) Strategies and processes to manage those risks. | Section 3.1 Section 3.3.4.3 Section 3.8.2 | ||
b) Structure and organisation of the risk management function. | Section 3.1.1 | |||
c) Scope and nature of risk reporting and measurement systems. | Section 3.2.1 | |||
d) Policies, strategies and processes for hedging and mitigating risk. | Section 3.2.10 | |||
e) Declaration approved by the management body on the adequacy of risk management arrangements. | Section 3.1.2 | |||
f) Statement approved by the management body describing the institution’s risk profile. | Section 3.1.2 | |||
Art. 435.2 - Disclosure, including regular, at least annual updates, regarding governance arrangements: | a) Members of the management body. | Section 6 | ||
b) Recruitment policy for the selection of members of the management body and their actual knowledge, skills and expertise. | Section 6 | |||
c) Policy on diversity with regard to selection of members of the management body. | Section 6 | |||
d) setting up a risk committee. | Section 3.1.1.1 | |||
e) Description of the information flow. | Section 3.1.1.2 | |||
Art. 436 - Scope of application | a) Name of institution. | Section 1.1.1 | ||
b) Differences in the basis of consolidation for accounting and prudential purposes: | Section 1.1.2 | |||
| 241 |
Table of Contents
| CRR Article | Description | Pillar III Section | ||
i) fully consolidated. ii) proportionally consolidated. III) deducted from own funds. iv) neither consolidated nor deducted. | ||||
c) Any impediment to the prompt transfer of own funds or repayment of liabilities among the parent undertaking and its subsidiaries. | Section 1.2 | |||
d) The aggregate amount by which the actual own funds are less than required in all the subsidiaries not included in the consolidation, and the name or names of such subsidiaries. | Section 1.2 | |||
e) If applicable, the use of provisions in prudential or individual liquidity requirements. | Section 1.3 | |||
a) A full reconciliation of Common Equity Tier 1 items, Additional Tier 1 items, Tier 2 items and filters and deductions applied pursuant to Articles 32 to 35, 36, 56, 66 and 79 to own funds of the institution and the balance sheet in the audited financial statements of the institution. | Section 2.2 | |||
b) A description of the main features of the Common Equity Tier 1 and Additional Tier 1 instruments, and Tier 2 instruments issued by the institution. | Section 2.1 | |||
c) The full terms and conditions of all Common Equity Tier 1, Additional Tier 1 and Tier 2 instruments. | Annex II (see document “Pillar III 2018 Annexes”) | |||
Art. 437 - Own funds | d) separate disclosure of the nature and amounts of the following: i) each prudential filter applied pursuant to Articles 32 to 35; ii) each deduction made pursuant to Articles 36, 56 and 66; iii) items not deducted in accordance with Articles 47, 51, 56, 66 and 79; | Section 2.2 | ||
e) A description of all restrictions applied to the calculation of own funds in accordance with this Regulation and the instruments, prudential filters and deductions to which those restrictions apply. | Section 2.2 | |||
f) where applicable, a comprehensive explanation of the basis on which capital ratios are calculated, when determined on a basis other than that laid down in the CRR. | N/A | |||
Art. 438 - Capital requirements Institutions shall disclose the following information regarding the compliance by the institution with the requirements laid down in Article 92 of this Regulation and in Article 73 of Directive | a) The institution’s approach to assessing the adequacy of its internal capital to support current and future activities. | Section 2.6 | ||
b) Upon demand from the relevant competent authority, the result of the institution’s internal capital adequacy assessment process (ICAAP). | Regulatory environment in 2018 Section 2.6 | |||
c) Capital requirements by the standardised approach broken down | Section 2.5 |
| 242 |
Table of Contents
| CRR Article | Description | Pillar III Section | ||
2013/36/EU: | by exposure classes. | |||
d) Capital requirements by the IRB approach broken down by risk classes. | Section 2.5 | |||
e) Own funds requirements calculated by position and market risk. | Section 2.5 | |||
f) Own funds requirements by operational risk. | Section 2.5 | |||
Disclosure requirement for exposure in specialised finance and equity in the investment portfolio by the simplified approach. | Section 2.5 | |||
Art. 439 - Exposure to counterparty credit risk | a) Methodology used to assign internal credit and capital limits for counterparty credit exposures. | Section 3.2.6.1.1 | ||
b) Discussion of policies for securing collateral and establishing credit reserves. | Section 3.2.6.1.2 | |||
c) Analysis of policies with respect towrong-way risk exposures. | Section 3.2.6.1.3 | |||
d) Analysis of the impact of the amount of collateral the institution would have to provide given a downgrade in its credit rating. | Section 3.2.6.1.4 | |||
e) Gross positive fair value of contracts, netting benefits, netted current credit exposure, collateral held and net derivatives credit exposure. | Section 3.2.6.2 | |||
f) Value of exposure under themark-to-market method, original exposure, standardised method and internal models. | Section 3.2.6.2 | |||
g) Notional value of credit derivative hedges, and the distribution of current credit exposure by types of credit exposure. | Section 3.2.6.2.4 | |||
h) The notional amounts of credit derivative transactions. | Section 3.2.6.2.4 | |||
i) Estimate ofa if applicable. | N/A | |||
Art. 440 - Capital buffers | a) The geographical distribution of credit exposures relevant for the calculation of the countercyclical capital buffer. | Regulatory environment in 2018 Section 2.6 | ||
b) Amount of its institution specific countercyclical capital buffer. | Regulatory environment in 2018 Section 2.6 | |||
Art. 441 - Indicators of global systemic importance | Disclosure of systemically important indicators. | Regulatory environment in 2018 | ||
Art. 442 - Credit risk adjustments | a) Definitions for accounting purposes ofpast-due and impaired. | Section 3.2.2.1 | ||
b) Description of the approaches and methods adopted for determining specific and general credit risk adjustments. | Section 3.2.2.2 | |||
c) The total amount of exposures after accounting offsets and without taking into account the effects of credit risk mitigation, and the average amount of the exposures over the period broken down by different types of exposure classes. | Section 3.2.3.2 |
| 243 |
Table of Contents
| CRR Article | Description | Pillar III Section | ||
d) The geographic distribution of the exposures, broken down in significant areas by material exposure classes. | Section 3.2.3.3 | |||
e) Distribution of exposures by industry or counterparty type, broken down by exposure classes. | Section 3.2.3.5 | |||
f) Residual maturity breakdown of all the exposures, broken down by exposure classes. | Section 3.2.3.6 | |||
g) By significant industry, the amount of: impaired exposures and past due exposures, credit risk adjustments and charges for credit risk adjustments during the reporting period. | Section 3.2.3.5 | |||
h) The amount of the impaired exposures and past due exposures, credit risk adjustments, and charges for credit risk adjustments during the period by geographic area. | Section 3.2.3.3 | |||
i) Reconciliation of changes in the credit risk adjustments. | Section 3.2.3.8 | |||
Specific credit risk adjustments and recoveries recorded directly to the income statement shall be disclosed separately. | Section 3.2.3.8 | |||
Art. 443 - Unencumbered assets | Disclosure of unencumbered assets. | Section 3.7.6 | ||
| Art. 444 - Use of ECAIs | a) The names of the nominated ECAIs and export credit agencies and the reasons for any changes. | Section 3.2.4 | ||
b) Exposure classes for which each ECAI is used. | Section 3.2.4 | |||
c) Description of the process used to transfer the issuer and issue credit assessments onto items not included in the trading book. | Section 3.2.4 | |||
d) Association of the external rating of each nominated ECAI or export credit agency with the credit quality steps prescribed in the CRR. | Section 3.2.4 | |||
e) Exposure values and the exposure values after credit risk mitigation associated with each credit quality step prescribed in the CRR. | Section 3.2.4.3 Section 3.2.6.2.1 | |||
Art. 445 - Exposure to market risk | Disclosure of position, foreign-exchange, settlement and commodity risk and large exposures. | Section 3.3.1 | ||
Art. 446 - Operational risk | Scope of the approaches for the assessment of own fund requirements for operational risk. | Section 3.8.6 | ||
Art. 447 - Exposures in equities not included in the trading book. | a) The differentiation between exposures based on their objectives, and an overview of the accounting techniques and valuation methodologies used. | Section 3.4.2 Section 3.4.3 | ||
b) The balance-sheet value, the fair value and, for those exchange-traded, a comparison to the market price where it is materially different from the fair value. | Section 3.4.3 | |||
c) The types, nature and amounts of exchange-traded exposures private | Section 3.4.3 |
| 244 |
Table of Contents
| CRR Article | Description | Pillar III Section | ||
equity exposures in sufficiently diversified portfolios, and other exposures. | ||||
d) Cumulative realised gains or losses arising from sales and liquidations in the period. | Section 3.4.5 | |||
e) Total unrealised gains or losses, the total latent revaluation gains or losses, and any of these amounts included in the original or additional own funds. | Section 3.4.5 | |||
Art. 448 - Exposure to interest-rate risk on positions not included in the trading book | a) The nature of the interest-rate risk and the key assumptions, and frequency of measurement of interest-rate risk. | Section 3.6.1 Section 3.6.2 | ||
b) Variation in earnings, economic value or other relevant measure used by the management for upward and downward rate shocks according to management’s method for measuring the interest-rate risk, broken down by currency. | Section 3.6.3 | |||
Art. 449 - Exposure to securitisation positions | a) Description of the institution’s objectives in relation to securitisation activity. | Section 3.2.7.1.1 | ||
b) The nature of other risks, including liquidity risk inherent in securitised assets. | Section 3.2.7.1.1 | |||
c) The type of risks in terms of seniority of underlying securitisation positions and in terms of assets underlying those latter securitisation positions assumed and retained with re-securitisation activity. | BBVA group does not have re-securitised assets. | |||
d) The different roles played by the institution in the securitisation process. | Section 3.2.7.1.2 | |||
e) The extent of the institution’s involvement in each of the roles referred to in point (d). | Section 3.2.7.1.2 | |||
f) A description of the processes in place to monitor changes in the credit risk and market risk of securitisation exposures, including how the behavior of the underlying assets impacts securitisation exposures and a description of now these processes differ for re- securitisation exposures. | Section 3.2.7.1.1 | |||
g) A description of the institution’s policy governing the use of hedging and unfunded protection to mitigate the risks of retained securitisation and re-securitisation exposures, including identification of material hedge counterparties by relevant type of risk exposure. | Section 3.2.7.1.1 | |||
h) The approaches to calculating risk weighted exposure amounts that the institution follows for its securitisation activities, including the types of securitisation exposures to which each approach applies. | Section 3.2.7.1.3 |
| 245 |
Table of Contents
| CRR Article | Description | Pillar III Section | ||
i) the types of SSPE that the institution, as sponsor, uses to securitise third-party exposures. | BBVA Group does not act as sponsor in any securitisation transaction. | |||
j) A summary of the institution’s accounting policies for securitisation activities. | Section 3.2.7.2 | |||
k) The names of the ECAIs used for securitisations and the types of exposure for which each agency is used. | Section 3.2.7.7.1 | |||
l) Description of the Internal Assessment Approach (IAA). | BBVA Group does not use the IAA. | |||
m) Explanation of significant changes to any of the quantitative disclosures since the last period of reference. | Section 3.2.7 | |||
n) separately for the trading and thenon-trading book, the following information broken down by exposure type: i) the total amount of outstanding exposures securitised by the institution. ii) the aggregate amount of on-balance-sheet securitisation positions retained or purchased andoff-balance-sheet exposures. iii) the aggregate amount of assets awaiting securitisation. iv) for securitised facilities subject to the early amortisation treatment, the aggregate exposures and aggregate capital requirements. v) the amount of securitisation positions that are deducted from own funds or risk-weighted at 1 250%. vi) a summary of the securitisation activity of the current period. | Section 3.2.7.4 | |||
o) separately for the trading and thenon-trading book, the following information: i) the aggregate amount of securitisation positions retained or purchased and the associated capital requirements, broken down into risk- weight bands. ii) the aggregate amount of re-securitisation exposures retained or purchased broken down according to the exposure before and after hedging/insurance and the exposure to financial guarantors. | Section 3.2.7.5 | |||
p) The amount ofimpaired/past-due assets and losses recognised by the institution during the current period, both broken down by exposure type. | Section 3.2.7.7.2 | |||
q) The total outstanding exposures securitised by the institution and subject to a capital requirement for market risk, broken down into traditional and synthetic securitisations and by exposure type. | This type of transactions are not in place in BBVA Group | |||
r) Where applicable, whether the institution has provided support within the terms of Article 248(1) of | This type of transactions are not in place in BBVA Group |
| 246 |
Table of Contents
| CRR Article | Description | Pillar III Section | ||
the CRR, and the impact on own funds. | ||||
Art. 450 - Remuneration policy | a) Information concerning the decision-making process used for determining the remuneration policy. | Section 5.1 | ||
b) Information on the link between pay and performance. | Section 5.4 | |||
c) The most important design characteristics of the remuneration system. | Section 5.3 | |||
d) The ratios between the fixed and variable remuneration. | Section 5.7 | |||
e) Information on the performance criteria on which the entitlement to shares, options or variable components of remuneration is based. | Section 5.5 | |||
f) The main parameters and rationale for any variable component scheme and any othernon-cash benefits. | Section 5.6 | |||
g) Aggregate quantitative information on remuneration, broken down by business area. | Section 5.8 | |||
h) Aggregate quantitative information on remuneration, broken down by senior management and members of staff whose actions have a material impact on the risk profile of the institution. | See details by Section | |||
i) The amounts of remuneration for the financial year, split into fixed and variable remuneration, and the number of beneficiaries | Section 5.8 | |||
ii) The amounts and forms of variable remuneration, split into cash, shares, share-linked instruments and other types. | Section 5.8 | |||
iii) The amounts of outstanding deferred remuneration, split into vested and unvested positions. | Section 5.8 | |||
iv) Amounts of deferred remuneration awarded during the financial year, paid out and reduced through performance adjustments. | Section 5.8 | |||
v) Newsign-on and severance payments made during the financial year, and the number of beneficiaries of such payments. | Section 5.8 | |||
vi) The amounts of severance payments awarded ruing the financial year, number of beneficiaries and highest such award to a single person. | Section 5.8 | |||
i) The number of individuals being remunerated EUR 1 million or more per financial year, for remuneration between EUR 1 million and EUR 5 million broken down into pay bands of EUR 500 000, and for of EUR 5 million and above broken down into pay bands of EUR 1 million. | Section 5.8 | |||
j) Upon demand from the Member State or competent authority, the | Section 5.8 |
| 247 |
Table of Contents
| CRR Article | Description | Pillar III Section | ||
total remuneration for each member of the management body or senior management. | ||||
For institutions of systemic importance, the information referred to in this Article shall also be made available to the public at the level of members of the management body of the institution. | Section 5.8 | |||
a) The leverage ratio. | Section 4.1 | |||
b) A breakdown of the total exposure measure as well as its reconciliation with the relevant information disclosed in published financial statements. | Section 4.1 | |||
Art. 451 - Leverage | c) Where applicable, the amount of derecognised fiduciary items. | BBVA Group does not use derecognised fiduciary items in its calculation of the leverage ratio. | ||
d) A description of the processes used to manage the risk of excessive leverage. | Section 4.3 | |||
e) A description of the factors that had an impact on the leverage ratio during the period. | Section 4.2 | |||
a) The competent authority’s permission of the approach or approved transition. | Section 3.2.5.1.1 | |||
b) An explanation and review of: | see details by Section | |||
i) The structure of internal rating systems and relation between internal and external ratings. | Section 3.2.5.1.2 | |||
ii) The use of internal estimates other than for calculating risk-weighted exposure amounts. | Section 3.2.5.1.3 | |||
iii) The process for managing and recognizing credit risk mitigation. | Section 3.2.5.1.4 | |||
iv) The control mechanisms for rating systems. | Section 3.2.5.1.5 | |||
c) A description of the internal ratings process, provided separately for the different exposure classes. | Section 3.2.5.1 | |||
Art. 452 - Use of the IRB Approach to credit risk | d) The exposure values for each of the exposure classes, separately for the AIRB and FIRB approaches. | Section 3.2.5.2 | ||
e) For each of the exposure classes and across a sufficient number of obligor grades (including default) to allow a meaningful differentiation of credit risk, institutions shall disclose the sum of sum of outstanding loans and exposure values for undrawn commitments, where applicable; and the exposure-weighted average risk weight. | Section 3.2.5.2 | |||
f) For the retail exposure class, the disclosures outlined in the above point, to allow for a meaningful differentiation of credit risk (if applicable, on a pooled basis). | Section 3.2.5.2 | |||
g) The actual specific credit risk adjustments in the preceding period, and an explanation of them. | Section 3.2.5 | |||
h) A description of the factors that | Section 3.2.5 |
| 248 |
Table of Contents
| CRR Article | Description | Pillar III Section | ||
impacted on the loss experience in the preceding period. | ||||
i) The institution’s estimates against actual outcomes over a period sufficient to allow for a meaningful assessment of the performance of the internal rating processes for each exposure class. | Section 3.2.5.3 | |||
j) For all exposure classes calculated according to the internal rating approaches, disclose risk-weighted average PD and LGD in percentage for each relevant geographic location, where applicable. | Section 3.2.5.2 | |||
a) The policies and processes for on-andoff-balance-sheet netting. | Section 3.2.6.1.2 | |||
b) The policies and processes for collateral valuation and management. | Section 3.2.6.1.2 | |||
c) A description of the main types of collateral taken by the institution. | Section 3.2.8.2.2 | |||
d) The main types of guarantor and credit derivative counterparty and their creditworthiness. | Section 3.2.8.2.2 | |||
Art. 453 - Use of credit risk mitigation techniques | e) Information about market or credit risk concentrations within the credit mitigation taken. | Section 3.2.8.4 | ||
f) For institutions calculating risk-weighted exposure amounts under the Standardised Approach or the IRB Approach, the total exposure value that is covered by collateral calculating the risk-weighted exposures. | Section 3.2.8.2.2 | |||
g)The total exposure that is covered by guarantees or credit derivatives. | Section 3.2.5.5 Section 3.2.8.3 | |||
Art. 454 - Use of the Advanced Measurement Approaches to operational risk | Description of the use of insurances and other risk transfer mechanisms for the purpose of mitigation of this risk. | Section 3.8.7.1 | ||
Art. 455 - Use of Internal Market Risk Models | a) For eachsub-portfolio covered: i) The characteristics of the models used. ii) A description of the processes followed to measure incremental default and migration risk. iii) A description of stress testing applied to thesub-portfolio. iv) The approaches used for backtesting and validating internal models and modeling processes. | Section 3.3.4.2.3 Section 3.3.4.2.4 | ||
b) The scope of permission by the competent authority. | Section 3.3.4.1 | |||
c) A description of the extent and methodologies to determine the classification of the trading portfolio, in compliance with the requirements of the CRR. | Section 3.3 | |||
d) The highest, the lowest and the mean of thevalue-at-risk (VaR), the stressedvalue-at-risk (SVaR) and risk numbers for incremental default risk. | Section 3.3.4.2.2 |
| 249 |
Table of Contents
| CRR Article | Description | Pillar III Section | ||
e) The elements for the own funds requirements. | Section 3.3.4.2.2 | |||
f) The weighted average liquidity horizon for eachsub-portfolio covered by the internal models. | Section 3.3.4.2 | |||
g) A comparison of the daily end-of-day value-at-risk to the one-day changes of the portfolio’s value by the end of the subsequent business day. | Section 3.3.4.2.4 |
| 250 |
Table of Contents
SIGNATURE
Pursuant to the requirements of the Securities Exchange Act of 1934, the registrant has duly caused this report to be signed on its behalf by the undersigned, thereunto duly authorized.
| �� | Banco Bilbao Vizcaya Argentaria, S.A. | |||||||
| Date: March 15, 2019 | ||||||||
| By: /s/ Juan Carlos García Céspedes | ||||||||
| ||||||||
| Name: Juan Carlos García Céspedes | ||||||||
| Title: Authorized representative | ||||||||