UNITED STATES
SECURITIES AND EXCHANGE COMMISSION
WASHINGTON, D.C. 20549
FORM6-K
REPORT OF FOREIGN ISSUER
PURSUANT TO RULE13a-16 OR15d-16
UNDER THE SECURITIES EXCHANGE ACT OF 1934
For the month of April, 2019
Commission file number:1-10110
BANCO BILBAO VIZCAYA ARGENTARIA, S.A.
(Exact name of Registrant as specified in its charter)
BANK BILBAO VIZCAYA ARGENTARIA, S.A.
(Translation of Registrant’s name into English)
Calle Azul 4,
28050 Madrid
Spain
(Address of principal executive offices)
Indicate by check mark whether the registrant files or will file annual reports under cover of Form20-F or Form40-F:
Form20-F ☒ Form40-F ☐
Indicate by check mark if the registrant is submitting the Form6-K in paper as permitted by RegulationS-T Rule 101(b)(1):
Yes ☐ No ☒
Indicate by check mark if the registrant is submitting the Form6-K in paper as permitted by RegulationS-T Rule 101(b)(7):
Yes ☐ No ☒

Index
BBVA Group highlights
BBVA Group highlights
(Consolidated figures)
| | | | | | | | | | | | | | | | |
| | | 31-03-19 | | | D % | | | 31-03-18 | | | 31-12-18 | |
Balance sheet (millions of euros) | | | | | | | | | | | | | | | | |
Total assets | | | 691,200 | | | | 0.8 | | | | 685,688 | | | | 676,689 | |
Loans and advances to customers (gross) | | | 393,321 | | | | 3.0 | | | | 381,683 | | | | 386,225 | |
Deposits from customers | | | 378,527 | | | | 5.1 | | | | 360,213 | | | | 375,970 | |
Total customer funds | | | 481,754 | | | | 4.9 | | | | 459,113 | | | | 474,120 | |
Total equity | | | 53,547 | | | | 2.9 | | | | 52,043 | | | | 52,874 | |
Income statement (millions of euros) | | | | | | | | | | | | | | | | |
Net interest income | | | 4,420 | | | | 3.1 | | | | 4,287 | | | | 17,591 | |
Gross income | | | 6,069 | | | | 0.7 | | | | 6,026 | | | | 23,747 | |
Operating income | | | 3,147 | | | | 3.2 | | | | 3,050 | | | | 12,045 | |
Net attributable profit | | | 1,164 | | | | (9.8 | ) | | | 1,290 | | | | 5,324 | |
The BBVA share and share performance ratios | | | | | | | | | | | | | | | | |
Number of shares (million) | | | 6,668 | | | | — | | | | 6,668 | | | | 6,668 | |
Share price (euros) | | | 5.09 | | | | (20.8 | ) | | | 6.43 | | | | 4.64 | |
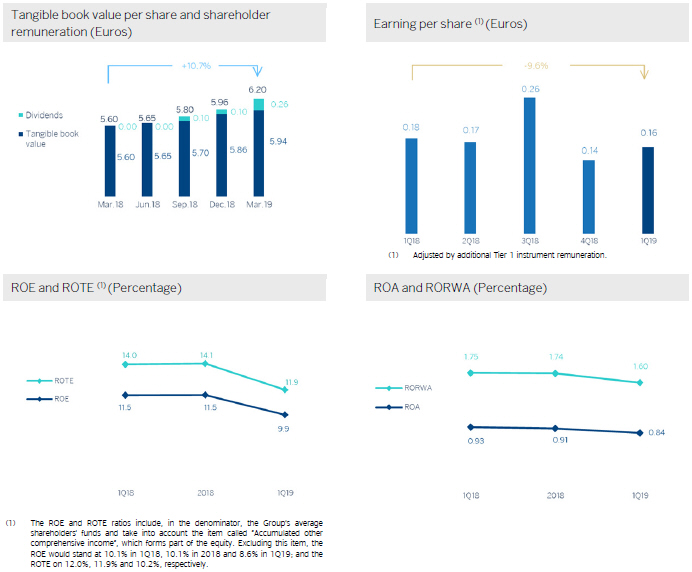
Earning per share (euros)(1) | | | 0.16 | | | | (9.7 | ) | | | 0.18 | | | | 0.76 | |
Book value per share (euros) | | | 7.20 | | | | 5.4 | | | | 6.83 | | | | 7.12 | |
Tangible book value per share (euros) | | | 5.94 | | | | 6.1 | | | | 5.60 | | | | 5.86 | |
Market capitalization (millions of euros) | | | 33,960 | | | | (20.8 | ) | | | 42,868 | | | | 30,909 | |
Yield (dividend/price; %) | | | 4.9 | | | | | | | | 3.4 | | | | 5.4 | |
Significant ratios (%) | | | | | | | | | | | | | | | | |
ROE (net attributable profit/average shareholders’ funds +/-average accumulated other comprehensive income)(2) | | | 9.9 | | | | | | | | 11.5 | | | | 11.5 | |
ROTE (net attributable profit/average shareholders’ funds excluding average intangible assets +/- average accumulated other comprehensive income)(2) | | | 11.9 | | | | | | | | 14.0 | | | | 14.1 | |
ROA (Profit or loss for the year/average total assets) | | | 0.84 | | | | | | | | 0.93 | | | | 0.91 | |
RORWA (Profit or loss for the year/average risk-weighted assets -RWA) | | | 1.60 | | | | | | | | 1.75 | | | | 1.74 | |
Efficiency ratio | | | 48.1 | | | | | | | | 49.4 | | | | 49.3 | |
Cost of risk | | | 1.06 | | | | | | | | 0.85 | | | | 1.01 | |
NPL ratio | | | 3.9 | | | | | | | | 4.4 | | | | 3.9 | |
NPL coverage ratio | | | 74 | | | | | | | | 73 | | | | 73 | |
Capital adequacy ratios (%) | | | | | | | | | | | | | | | | |
CET1 fully-loaded | | | 11.3 | | | | | | | | 10.9 | | | | 11.3 | |
CET1phased-in(3) | | | 11.6 | | | | | | | | 11.1 | | | | 11.6 | |
Total ratiophased-in(3) | | | 15.2 | | | | | | | | 15.4 | | | | 15.7 | |
Other information | | | | | | | | | | | | | | | | |
Number of clients (million) | | | 75.7 | | | | 2.9 | | | | 73.6 | | | | 74.8 | |
Number of shareholders | | | 892,316 | | | | 0.2 | | | | 890,146 | | | | 902,708 | |
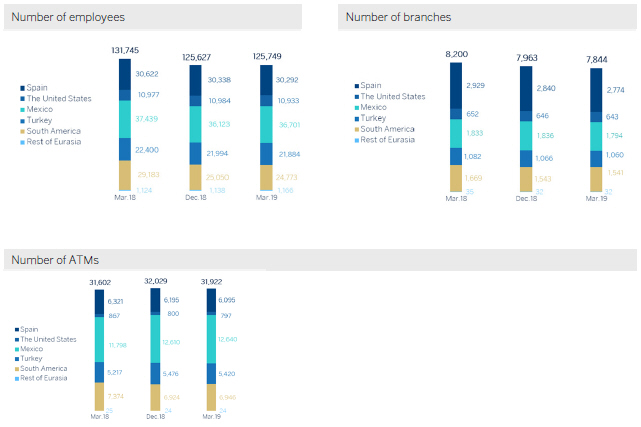
Number of employees | | | 125,749 | | | | (4.6 | ) | | | 131,745 | | | | 125,627 | |
Number of branches | | | 7,844 | | | | (4.3 | ) | | | 8,200 | | | | 7,963 | |
Number of ATMs | | | 31,922 | | | | 1.0 | | | | 31,602 | | | | 32,029 | |
General note: the application of accounting for hyperinflation in Argentina was performed for the first time in September 2018 with accounting effects on January 1, 2018, recording the impact of the nine months in the third quarter. In order to make the 2019 information comparable to 2018, the income statements and balance sheets of the first three quarters of 2018 have been reexpressed to reflect these impacts.
| (1) | Adjusted by additional Tier 1 instrument remuneration. |
| (2) | The ROE and ROTE ratios include, in the denominator, the Group’s average shareholders’ funds and take into account the item called “Accumulated other comprehensive income”, which forms part of the equity. Excluding this item, the ROE would stand at 8.6%, in the first quarter of 2019; 10.1%, in 2018; and 10.1%, in the first quarter of 2018; and the ROTE at 10.2%, 11.9% and 12.0%, respectively. |
| (3) | As of March 31, 2019,phased-in ratios include the temporary treatment on the impact of IFRS 9, calculated in accordance with Article 473 bis of the Capital Requirements Regulation (CRR). |
Group information
Relevant events
Results
| • | | In the first quarter of 2019, the overall growth ofrecurring income is maintained, with a positive evolution in terms of net interest income in most business areas. |
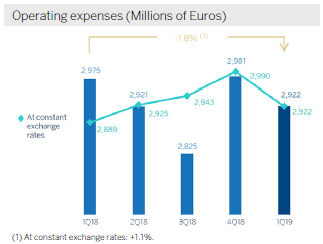
| • | | The trend of containingoperating expenses and improving the efficiency ratio compared to the same period of the previous year continues. |
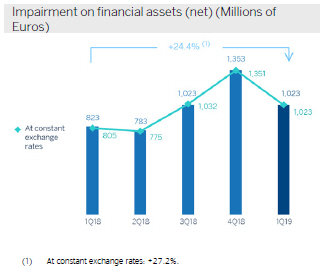
| • | | Higher impairment on financial assets (up 24.4%year-on-year), mainly as a result of the higher reserve requirements due to the impairment of specific portfolios and the updating of the macroeconomic scenarios in the United States and Turkey, were not offset by the lower needs in Spain. Nevertheless, the impairment on financial assets decreased by 24.3% compared to the last quarter of 2018. |
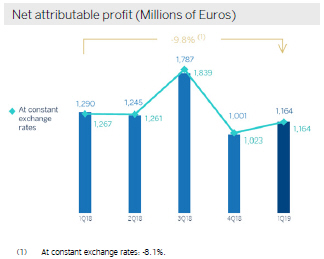
| • | | As a result, the net attributableprofitwas €1,164 million, 9.8% less than in the same period of the previous year. |
Balance sheet and business activity
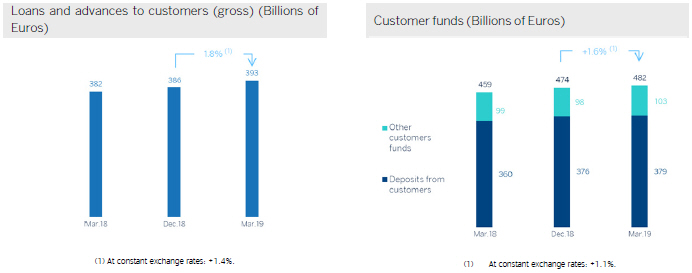
| • | | As of March 31, 2019, the number ofloans and advances to customers (gross) recorded a 1.8% growth with respect to December 31, 2018, with improved levels of activity in all business areas. |
| • | | Withinoff-balance-sheet funds, good development of investment funds and pension funds in the quarter. |
Solvency
| • | | Capital position above regulatory requirements, with a fully loaded CET1ratioat 11.3%, similar to the level at the end of December 2018, which absorbs the 11 basis points impact as a result of the implementation of IFRS 16 on January 1, 2019. |
Risk management
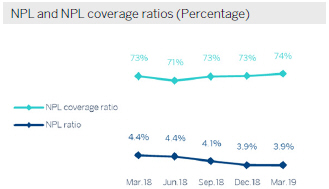
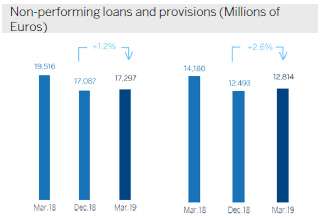
| • | | Although theNon-performing loans showed a slight rebound in the quarter (up 1.2%), the indicators of the maincredit-risk metrics remain solid: as of March 31, 2019, the NPL stood at 3.9%, coverage at 74% and the accumulated cost of risk at 1.06%. |
Digital customers
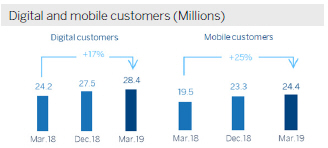
| • | | The Group’sdigital and mobile customer base anddigital sales continue to increase in all the geographic areas where BBVA operates with a positive impact on efficiency. |
Dividends
| • | | On April 10, 2019, there was a gross cash payment of €0.16 per share, corresponding to the supplementarydividend for 2018 that was approved at the General Shareholders’ Meeting held on March 15. |
Other matters of interest
| • | | IFRS 16 ‘Leases’ came into effect on January 1, 2019, a standard on leases that introduces a single lessee accounting model and will require lessees to recognize assets and liabilities of all lease contracts. The main impacts on the Group are the recognition of assets byright-of-use and liabilities per lease, amounting to €3,419m and €3,472m, respectively, and the above stated impact in terms of capital, both as of the effective date. |
| • | | In 2019, the balance sheets, income statements and ratios of the first three quarters of 2018 have been reexpressed for the Group and the business area of South America to reflect the impacts derived from the hyperinflation in Argentina as a result of the application of IAS 29 on the income and expenses as well as the assets and liabilities, in order to make the financial information of 2019 comparable to the one of 2018. This is due to the impact been registered for the first time in the third quarter 2018, with accounting effects as from January 1, 2018. |
Results
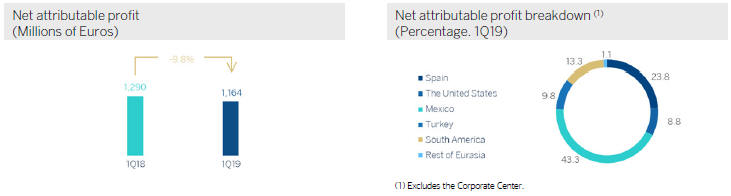
In the first quarter of 2019, BBVA Group obtained a net attributableprofit of €1,164m. This figure represents an increase of 16.2% compared to the one obtained in the last quarter of 2018, although it is 9.8% lower than in the same
quarter in the previous year(-8.1% at constant exchange rates). The good performance of recurring revenue items, particularly net interest income, as well as the evolution of operating expenses growing below gross income stand out.
Consolidated income statement: quarterly evolution
(Millions of euros)
| | | | | | | | | | | | | | | | | | | | |
| | | 2019 | | | | | | 2018 | | | | | | | |
| | | 1Q | | | 4Q | | | 3Q | | | 2Q | | | 1Q | |
Net interest income | | | 4,420 | | | | 4,692 | | | | 4,309 | | | | 4,302 | | | | 4,287 | |
Net fees and commissions | | | 1,214 | | | | 1,226 | | | | 1,173 | | | | 1,244 | | | | 1,236 | |
Net trading income | | | 426 | | | | 316 | | | | 212 | | | | 285 | | | | 410 | |
Other operating income and expenses | | | 8 | | | | (83 | ) | | | 38 | | | | 6 | | | | 92 | |
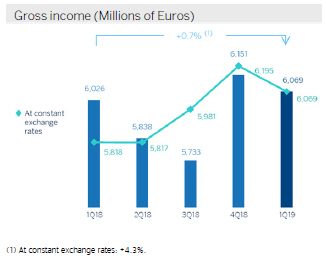
Gross income | | | 6,069 | | | | 6,151 | | | | 5,733 | | | | 5,838 | | | | 6,026 | |
Operating expenses | | | (2,922 | ) | | | (2,981 | ) | | | (2,825 | ) | | | (2,921 | ) | | | (2,975 | ) |
Personnel expenses | | | (1,553 | ) | | | (1,557 | ) | | | (1,459 | ) | | | (1,539 | ) | | | (1,565 | ) |
Other administrative expenses | | | (977 | ) | | | (1,119 | ) | | | (1,061 | ) | | | (1,087 | ) | | | (1,106 | ) |
Depreciation | | | (392 | ) | | | (305 | ) | | | (304 | ) | | | (295 | ) | | | (304 | ) |
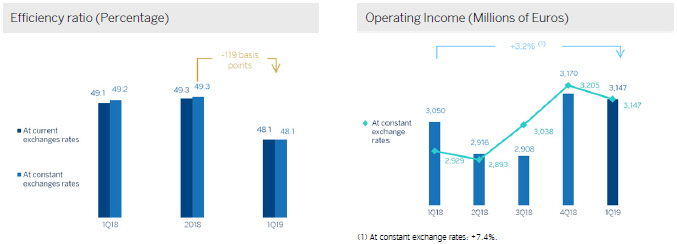
Operating income | | | 3,147 | | | | 3,170 | | | | 2,908 | | | | 2,916 | | | | 3,050 | |
Impairment on financial assets not measured at fair value through profit or loss | | | (1,023 | ) | | | (1,353 | ) | | | (1,023 | ) | | | (783 | ) | | | (823 | ) |
Provisions or reversal of provisions | | | (144 | ) | | | (66 | ) | | | (123 | ) | | | (85 | ) | | | (99 | ) |
Other gains (losses) | | | (22 | ) | | | (183 | ) | | | (36 | ) | | | 67 | | | | 41 | |
Profit/(loss) before tax | | | 1,957 | | | | 1,568 | | | | 1,727 | | | | 2,115 | | | | 2,170 | |
Income tax | | | (559 | ) | | | (421 | ) | | | (419 | ) | | | (605 | ) | | | (617 | ) |
Profit/(loss) after tax from ongoing operations | | | 1,398 | | | | 1,147 | | | | 1,308 | | | | 1,510 | | | | 1,553 | |
Results from corporate operations(1) | | | — | | | | — | | | | 633 | | | | — | | | | — | |
Profit/(loss) for the year | | | 1,398 | | | | 1,147 | | | | 1,941 | | | | 1,510 | | | | 1,553 | |
Non-controlling interests | | | (234 | ) | | | (145 | ) | | | (154 | ) | | | (265 | ) | | | (262 | ) |
Net attributable profit | | | 1,164 | | | | 1,001 | | | | 1,787 | | | | 1,245 | | | | 1,290 | |
Net attributable profit excluding results from corporate operations | | | 1,164 | | | | 1,001 | | | | 1,154 | | | | 1,245 | | | | 1,290 | |
Earning per share (euros)(2) | | | 0.16 | | | | 0.14 | | | | 0.26 | | | | 0.17 | | | | 0.18 | |
General note: the application of accounting for hyperinflation in Argentina was performed for the first time in September 2018 with accounting effects on January 1, 2018, recording the impact of the 9 months in the third quarter. In order to make the 2019 information comparable to 2018, the income statements for the first three quarters of 2018 have been reexpressed to reflect the impacts of inflation on their income and expenses.
| (1) | Includes net capital gains from the sale of BBVA Chile. |
| (2) | Adjusted by additional Tier 1 instrument remuneration. |
Consolidated income statement
(Millions of euros)
| | | | | | | | | | | | | | | | |
| | | 1Q19 | | | D % | | | D % at constant
exchange rates | | | 1Q18 | |
Net interest income | | | 4,420 | | | | 3.1 | | | | 6.7 | | | | 4,287 | |
Net fees and commissions | | | 1,214 | | | | (1.8 | ) | | | 1.3 | | | | 1,236 | |
Net trading income | | | 426 | | | | 3.9 | | | | 8.4 | | | | 410 | |
Other operating income and expenses | | | 8 | | | | (91.3 | ) | | | (90.2 | ) | | | 92 | |
Gross income | | | 6,069 | | | | 0.7 | | | | 4.3 | | | | 6,026 | |
Operating expenses | | | (2,922 | ) | | | (1.8 | ) | | | 1.1 | | | | (2,975 | ) |
Personnel expenses | | | (1,553 | ) | | | (0.8 | ) | | | 2.1 | | | | (1,565 | ) |
Other administrative expenses | | | (977 | ) | | | (11.6 | ) | | | (8.6 | ) | | | (1,106 | ) |
Depreciation | | | (392 | ) | | | 28.9 | | | | 31.2 | | | | (304 | ) |
Operating income | | | 3,147 | | | | 3.2 | | | | 7.4 | | | | 3,050 | |
Impairment on financial assets not measured at fair value through profit or loss | | | (1,023 | ) | | | 24.4 | | | | 27.2 | | | | (823 | ) |
Provisions or reversal of provisions | | | (144 | ) | | | 45.1 | | | | 52.7 | | | | (99 | ) |
Other gains (losses) | | | (22 | ) | | | n.s. | | | | n.s. | | | | 41 | |
Profit/(loss) before tax | | | 1,957 | | | | (9.8 | ) | | | (5.3 | ) | | | 2,170 | |
Income tax | | | (559 | ) | | | (9.4 | ) | | | (5.7 | ) | | | (617 | ) |
Profit/(loss) after tax from ongoing operations | | | 1,398 | | | | (10.0 | ) | | | (5.1 | ) | | | 1,553 | |
Results from corporate operations | | | — | | | | — | | | | — | | | | — | |
Profit/(loss) for the year | | | 1,398 | | | | (10.0 | ) | | | (5.1 | ) | | | 1,553 | |
Non-controlling interests | | | (234 | ) | | | (10.8 | ) | | | 13.9 | | | | (262 | ) |
Net attributable profit | | | 1,164 | | | | (9.8 | ) | | | (8.1 | ) | | | 1,290 | |
Net attributable profit excluding results from corporate operations | | | 1,164 | | | | (9.8 | ) | | | (8.1 | ) | | | 1,290 | |
Earning per share (euros)(1) | | | 0.16 | | | | | | | | | | | | 0.18 | |
General note: the application of accounting for hyperinflation in Argentina was performed for the first time in September 2018 with accounting effects on January 1, 2018, recording the impact of the 9 months in the third quarter. In order to make the 2019 information comparable to 2018, the income statements for the first three quarters of 2018 have been reexpressed to reflect the impacts of inflation on their income and expenses.
| (1) | Adjusted by additional Tier 1 instrument remuneration. |
Unless expressly indicated otherwise, to better understand the changes in the main headings of the Group’s income statement, theyear-on-year percentage changes provided below refer toconstant exchange rates.
Gross income
Gross income increased by 4.3%year-on-year, supported by the positive performance of net interest income.
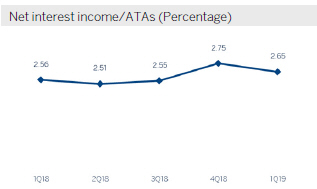
Net interest income registered a growth of 6.7%year-on-year, with increases in all business areas due to lower financing costs, except for Spain and Rest of Eurasia, which are more influenced by the interest rate situation in the Eurozone.
On the other hand, cumulativenet fees and commissions (up 1.3%year-on-year) also increased, thanks to their adequate diversification.
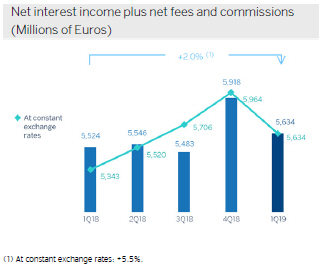
As a result, themore recurring revenue items (net interest income plus net fees and commissions) increased by 5.5%year-on-year.
NTI between January and March 2019 was 8.4% higher than the figure obtained in the same quarter of 2018, supported byone-off transactions and in general by gains deriving from securities portfolio management, particularly in the United States and South America.
Other operating income and expenses decreased by 90.2%year-on-year, mainly as a result of higher levels of inflation. However, the net contribution of the insurance business grew by 10.3%year-on-year.
Operating income
Operating expenses in the first quarter of 2019 registered a growth of 1.1%year-on-year, considerably below the inflation rate recorded in the main countries where BBVA is present (down 1.8% at current exchange rates). The Group continues to apply strict cost discipline in all areas of the Group.
As a consequence of this evolution of operating expenses, theefficiency ratio continued to improve and stood at 48.1%, below the level reached at the end of 2018 (49.3%), whileoperating income registered an increase of 7.4%year-on-year.
Provisions and other
Impairment on financial assets not measured at fair value through profit or loss(impairment on financial assets) in the first three months of 2019 decreased by 24.3% compared to the fourth quarter of 2018, while it increased 27.2% compared to the first quarter of the same year. By business areas, there were higher loan-loss provisions in the United States due to the deterioration of some specific customers in the commercial portfolio and some write-offs in consumer, and in Turkey due to the deterioration of wholesale client portfolios. In addition, both countries are also located in geographic areas affected by the update of the macroeconomic outlook. On the contrary, Spain recognized lower loan-loss provisions, and Mexico remained at similar levels compared to the first quarter of last year.
Finally, the headingprovisions or reversal of provisions(hereinafter, “provisions”) was 52.7% above the figure recognized in the same quarter of 2018.
Results
As a result of the above,the Group’s net attributable profit in the first quarter of 2019 was 8.1% below that obtained in the same period of the previous year, characterized by stable levels of recurring revenue that were negatively impacted by higher loan-loss provisions.
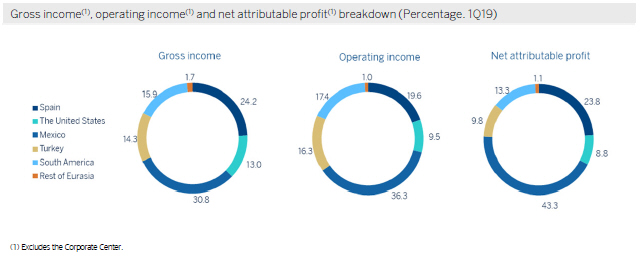
Bybusiness area, Spain generated net attributable profit of €345m, the United States €127m, Mexico recognized a profit of €627m, Turkey contributed €142m, South America €193m, and Rest of Eurasia €16m.
Balance sheet and business activity
The most relevantaspects of the Group’s balance sheet and business activity as of March 31, 2019 is summarized below:
| • | | Loans and advances to customers (gross) registered a growth of 1.8% in the quarter (up 1.4% at constant exchange rates), in all business areas, especially in Turkey, South America and Rest of Eurasia. |
| • | | Non-performing loans continued to decreaseyear-on-year (down 11.4%), thanks to the positive performance showed, especially in Spain and, to a lesser extent, Rest of Eurasia. However, there was a slight rebound of 1.2% in the quarter due to increases in the United States, Turkey and, to a lesser extent, South America. |
| • | | In terms of customerdeposits, time deposits decreased by 3.3% in the quarter (down 12.6%year-on-year), offset by an increase of 2.7% in demand deposits in the quarter (up 10.7%year-on-year), particularly in Spain and, to a lesser extent, the United States. |
| • | | Withinoff-balance sheet funds, both investment funds and pension funds showed a positive trend in this quarter. |
| • | | In tangible assets, the balance as of March 31, 2019 is affected by the impact of the implementation of IFRS 16 “Leases”, which entails an increase of 44.0% compared to the end of the previous fiscal year. |
Consolidated balance sheet
(Millions of euros)
| | | | | | | | | | | | | | | | |
| | | 31-03-19 | | | D % | | | 31-12-18 | | | 31-03-18 | |
Cash, cash balances at central banks and other demand deposits | | | 50,059 | | | | (14.0 | ) | | | 58,196 | | | | 43,167 | |
Financial assets held for trading | | | 92,366 | | | | 2.5 | | | | 90,117 | | | | 94,745 | |
Non-trading financial assets mandatorily at fair value through profit or loss | | | 5,535 | | | | 7.8 | | | | 5,135 | | | | 4,360 | |
Financial assets designated at fair value through profit or loss | | | 1,311 | | | | (0.2 | ) | | | 1,313 | | | | 1,330 | |
Financial assets at fair value through accumulated other comprehensive income | | | 60,204 | | | | 6.9 | | | | 56,337 | | | | 59,212 | |
Financial assets at amortized cost | | | 433,008 | | | | 3.2 | | | | 419,660 | | | | 417,646 | |
Loans and advances to central banks and credit institutions | | | 15,787 | | | | 20.5 | | | | 13,103 | | | | 17,751 | |
Loans and advances to customers | | | 380,799 | | | | 1.8 | | | | 374,027 | | | | 367,986 | |
Debt securities | | | 36,421 | | | | 12.0 | | | | 32,530 | | | | 31,909 | |
Investments in subsidiaries, joint ventures and associates | | | 1,587 | | | | 0.6 | | | | 1,578 | | | | 1,395 | |
Tangible assets | | | 10,408 | | | | 44.0 | | | | 7,229 | | | | 7,238 | |
Intangible assets | | | 8,383 | | | | 0.8 | | | | 8,314 | | | | 8,203 | |
Other assets | | | 28,338 | | | | (1.6 | ) | | | 28,809 | | | | 48,392 | |
Total assets | | | 691,200 | | | | 2.1 | | | | 676,689 | | | | 685,688 | |
Financial liabilities held for trading | | | 80,818 | | | | 0.1 | | | | 80,774 | | | | 86,767 | |
Other financial liabilities designated at fair value through profit or loss | | | 7,846 | | | | 12.2 | | | | 6,993 | | | | 6,075 | |
Financial liabilities at amortized cost | | | 520,464 | | | | 2.2 | | | | 509,185 | | | | 497,298 | |
Deposits from central banks and credit institutions | | | 64,427 | | | | 8.7 | | | | 59,259 | | | | 63,031 | |
Deposits from customers | | | 378,527 | | | | 0.7 | | | | 375,970 | | | | 360,213 | |
Debt certificates | | | 62,365 | | | | 2.1 | | | | 61,112 | | | | 60,866 | |
Other financial liabilities | | | 15,144 | | | | 17.9 | | | | 12,844 | | | | 13,188 | |
Liabilities under insurance and reinsurance contracts | | | 10,577 | | | | 7.6 | | | | 9,834 | | | | 9,624 | |
Other liabilities | | | 17,948 | | | | 5.4 | | | | 17,029 | | | | 33,881 | |
Total liabilities | | | 637,653 | | | | 2.2 | | | | 623,814 | | | | 633,645 | |
Non-controlling interests | | | 5,718 | | | | (0.8 | ) | | | 5,764 | | | | 6,665 | |
Accumulated other comprehensive income | | | (6,656 | ) | | | (7.8 | ) | | | (7,215 | ) | | | (6,195 | ) |
Shareholders’ funds | | | 54,485 | | | | 0.3 | | | | 54,326 | | | | 51,573 | |
Total equity | | | 53,547 | | | | 1.3 | | | | 52,874 | | | | 52,043 | |
Total liabilities and equity | | | 691,200 | | | | 2.1 | | | | 676,689 | | | | 685,688 | |
Memorandum item: | | | | | | | | | | | | | | | | |
Guarantees given | | | 46,406 | | | | (2.3 | ) | | | 47,574 | | | | 47,519 | |
General note: the application of accounting for hyperinflation in Argentina was performed for the first time in September 2018 with accounting effects on January 1, 2018, recording the impact of the nine months in the third quarter. In order to make the 2019 information comparable to 2018, the balance sheet of the first three quarters of 2018 has been reexpressed to reflect the impacts of inflation on its assets and liabilities.
Loans and advances to customers
(Millions of euros)
| | | | | | | | | | | | | | | | |
| | | 31-03-19 | | | D % | | | 31-12-18 | | | 31-03-18 | |
Public sector | | | 29,138 | | | | 2.2 | | | | 28,504 | | | | 28,176 | |
Individuals | | | 171,947 | | | | 0.8 | | | | 170,501 | | | | 169,541 | |
Mortgages | | | 111,772 | | | | 0.2 | | | | 111,528 | | | | 112,979 | |
Consumer | | | 36,159 | | | | 3.5 | | | | 34,939 | | | | 33,335 | |
Credit cards | | | 13,644 | | | | 1.0 | | | | 13,507 | | | | 13,263 | |
Other loans | | | 10,371 | | | | (1.5 | ) | | | 10,527 | | | | 9,963 | |
Business | | | 175,678 | | | | 2.8 | | | | 170,872 | | | | 165,398 | |
Non-performing loans | | | 16,559 | | | | 1.3 | | | | 16,348 | | | | 18,569 | |
Loans and advances to customers (gross) | | | 393,321 | | | | 1.8 | | | | 386,225 | | | | 381,683 | |
Loan-loss provisions | | | (12,522 | ) | | | 2.7 | | | | (12,199 | ) | | | (13,697 | ) |
Loans and advances to customers | | | 380,799 | | | | 1.8 | | | | 374,027 | | | | 367,986 | |
Customer funds
(Millions of euros)
| | | | | | | | | | | | | | | | |
| | | 31-03-19 | | | D % | | | 31-12-18 | | | 31-03-18 | |
Deposits from customers | | | 378,527 | | | | 0.7 | | | | 375,970 | | | | 360,213 | |
Of which current accounts | | | 267,614 | | | | 2.7 | | | | 260,573 | | | | 239,360 | |
Of which time deposits | | | 104,698 | | | | (3.3 | ) | | | 108,313 | | | | 113,469 | |
Other customer funds | | | 103,227 | | | | 5.2 | | | | 98,150 | | | | 98,900 | |
Mutual funds and investment companies | | | 64,928 | | | | 5.8 | | | | 61,393 | | | | 62,819 | |
Pension funds | | | 35,071 | | | | 3.7 | | | | 33,807 | | | | 33,604 | |
Otheroff-balance sheet funds | | | 3,228 | | | | 9.5 | | | | 2,949 | | | | 2,477 | |
Total customer funds | | | 481,754 | | | | 1.6 | | | | 474,120 | | | | 459,113 | |
Solvency
Capital base
BBVA’sfully-loaded CET1 ratio stood at 11.3% at the end of March 2019. This ratio includes the impact of-11 basis points for the first application of the IFRS 16 standard, which entered into force on January 1, 2019. Excluding this effect, the ratio increased by +12 basis points, supported by the recurring organic capital generation and the positive evolution of the markets.
Risk-weighted assets (RWAs) fully-loaded increased in the quarter by €12,368m, due to the implementation of IFRS 16, the evolution of foreign currencies, mainly the appreciation of the US dollar and the growth of the activity in emerging economies.
Capital base
(Millions of euros)
| | | | | | | | | | | | | | | | | | | | | | | | |
| | | CRD IVphased-in | | | CRD IV fully-loaded | |
| | | 31-03-19 (1)
| | | 31-12-18 | | | 31-03-18 | | | 31-03-19 (1)
| | | 31-12-18 | | | 31-03-18 | |
Common Equity Tier 1 (CET 1) | | | 41,756 | | | | 40,313 | | | | 39,858 | | | | 40,983 | | | | 39,571 | | | | 38,899 | |
Tier 1 | | | 47,427 | | | | 45,947 | | | | 45,987 | | | | 46,511 | | | | 45,047 | | | | 44,795 | |
Tier 2 | | | 7,336 | | | | 8,756 | | | | 8,397 | | | | 7,288 | | | | 8,861 | | | | 8,423 | |
Total Capital (Tier 1 + Tier 2) | | | 54,764 | | | | 54,703 | | | | 54,384 | | | | 53,799 | | | | 53,907 | | | | 53,218 | |
Risk-weighted assets | | | 360,689 | | | | 348,264 | | | | 358,941 | | | | 361,173 | | | | 348,804 | | | | 358,315 | |
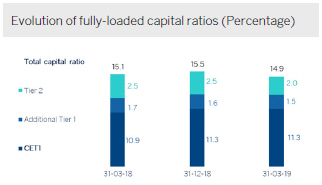
CET1 (%) | | | 11.6 | | | | 11.6 | | | | 11.1 | | | | 11.3 | | | | 11.3 | | | | 10.9 | |
Tier 1 (%) | | | 13.1 | | | | 13.2 | | | | 12.8 | | | | 12.9 | | | | 12.9 | | | | 12.5 | |
Tier 2 (%) | | | 2.0 | | | | 2.5 | | | | 2.3 | | | | 2.0 | | | | 2.5 | | | | 2.4 | |
Total capital ratio (%) | | | 15.2 | | | | 15.7 | | | | 15.2 | | | | 14.9 | | | | 15.5 | | | | 14.9 | |
General note: the main difference between thephased-in and fully loaded ratios arises from the temporary treatment of the impact of IFRS9, to which the BBVA Group has adhered voluntarily (in accordance with Article 473bis of the CRR).
Regarding capitalissuances, BBVA S.A. conducted two capital issuances: the issuance of preferred securities that may be converted into ordinary BBVA shares (CoCos), registered in the Spanish Securities Market Commission (CNMV) for €1,000m, with an annual coupon of 6.0% and an amortization option from the fifth year; and a Tier 2 subordinated debt issue of €750m, with a maturity period of 10 years, amortization option in the fifth year, and a coupon of 2.575%. These issuances, pending receipt of ECB computability authorization, are not included in the capital ratios as of March 2019, but would have an impact of +28 basis points in Tier 1 and +21 basis points in Tier 2.
In the first quarter of 2019, the Group continued with its program to meet theminimum requirement for own funds and eligible liabilities (MREL) published in May 2018, closing the public issuance of seniornon-preferred debt for a total of €1,000m. BBVA estimates that complies with the MREL requirement.
In addition, early amortization options were implemented for two issuances: the issuance of contingent convertible bond (CoCos) for €1,500m with a coupon of 7% issued in February 2014, and another Tier 2 subordinated debt issuance for €1,500m with a coupon of 3.5% issued in April 2014 and amortized in April 2019.
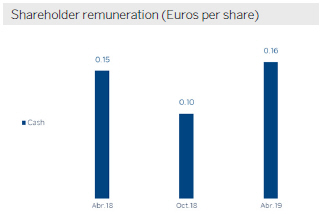
Regarding shareholder remuneration, on April 10, 2019, BBVA paid a final cash dividend of €0.16 per share for the fiscal year 2018, in line with the Group’s dividend policy of maintaining apay-out ratio of35-40% of recurring profit. During the first quarter, this final dividend does not have any impact on the solvency ratio of the Group, as it is already incorporated as of December 2018.
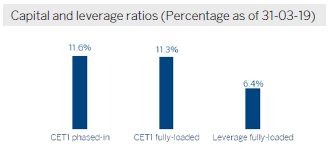
Thephased-in CET1ratio stood at 11.6% as of March 31, 2019, taking into account the impact of the IFRS 9 standard. Tier 1 capital stood at 13.1% and Tier 2 at 2.0%, resulting in atotal capital ratio of 15.2%.
These levels are above the requirements established by the supervisor in its SREP letter, applicable in 2019. Since March
1, 2019, at consolidated level, this requirement has been established at 9.26% for the CET1 ratio and 12.76% for the total capital ratio. Its variation compared to 2018 is explained by the end of the transitional period for implementation of capital conservation buffers and the capital buffer applicable to Other Systemically Important Institutions, as well as the progression of the countercyclical capital buffer. For its part, the CET1 of Pillar 2 (P2R) requirement remains unchanged at 1.5%.
Finally, the Group’sleverage ratio maintained a solid position, at 6.4% fully-loaded (6.6%phased-in), which is still the highest among its peer group.
Ratings
At present, all agencies assign to BBVA a category “A” rating, with no variation in the first three months of 2019. These ratings are detailed in the following table: Ratings
| | | | | | | | | | | | |
Rating agency | | Long term | | | Short term | | | Outlook | |
| DBRS | | | A (high) | | | | R-1 (middle) | | | | Stable | |
| Fitch | | | A- | | | | F-2 | | | | Negative | |
| Moody’s(1) | | | A3 | | | | P-2 | | | | Stable | |
| Scope Ratings | | | A+ | | | | S-1+ | | | | Stable | |
| Standard & Poor’s | | | A- | | | | A-2 | | | | Negative | |
| (1) | Additionally, Moody’s assigns an A2 rating to BBVA’s long term deposits. |
Risk management
Credit risk
BBVA Group’s risk metrics show the following evolution in the first quarter of 2019:
| • | | Credit risk increased by 1.2% in the quarter at current exchange rates (up 0.6% at constant exchange rates), with generalized growth in all areas except Turkey, which remains flat, impacted by the exchange rate evolution (up 2.1% at constant rates). The United States, which was positively impacted by the dollar evolution, grew 1.0% at current exchange rates and contracted 0.9% at constant exchange rates. |
| • | | Balance ofnon-performing loans registered a decrease of 11.4%year-on-year, although they increased by 1.2% in the quarter (0.6% in constant terms). Good performance in Spain during the first quarter (down 2.8%) which does not offset the increase of NPLs in other areas, especially the United States and Turkey. |
| • | | TheNPL ratio stood at 3.9% as of March 31, 2019, stable with respect to the ratio registered at the end of December 2018. However, it decreased by 47 basis points compared to the end of March 2018. |
| • | | Loan-loss provisionsincreased by 2.6% in the quarter (2.4% at constant exchange rates). |
| • | | TheNPL coverage ratio stood at 74% at the end of the quarter, an improvement of 97 basis points in the first three months of 2019 and 142 basis points higher than the end of March 2018. |
| • | | The accumulatedcost of risk as of March 31, 2019 was 1.06%, which is a slight increase of 5 basis points compared to the end of 2018. |
Credit risk(1)
(Millions of euros)
| | | | | | | | | | | | | | | | | | | | |
| | | 31-03-19 | | | 31-12-18 | | | 30-09-18 | | | 30-06-18 (2)
| | | 31-03-18 (2)
| |
Credit risk | | | 439,152 | | | | 433,799 | | | | 428,318 | | | | 451,587 | | | | 442,446 | |
Non-performing loans | | | 17,297 | | | | 17,087 | | | | 17,693 | | | | 19,654 | | | | 19,516 | |
Provisions | | | 12,814 | | | | 12,493 | | | | 12,890 | | | | 13,954 | | | | 14,180 | |
NPL ratio (%) | | | 3.9 | | | | 3.9 | | | | 4.1 | | | | 4.4 | | | | 4.4 | |
NPL coverage ratio (%) | | | 74 | | | | 73 | | | | 73 | | | | 71 | | | | 73 | |
| (1) | Include gross loans and advances to customers plus guarantees given. |
| (2) | Figures without considering the classification ofnon-current assets held for sale. |
Non-performing loans evolution
(Millions of euros)
| | | | | | | | | | | | | | | | | | | | |
| | | 1Q19(1)
| | | 4Q18 | | | 3Q18 | | | 2Q18(2)
| | | 1Q18(2)
| |
Beginning balance | | | 17,087 | | | | 17,693 | | | | 19,654 | | | | 19,516 | | | | 20,492 | |
Entries | | | 2,342 | | | | 3,019 | | | | 2,168 | | | | 2,596 | | | | 2,060 | |
Recoveries | | | (1,408 | ) | | | (1,560 | ) | | | (1,946 | ) | | | (1,655 | ) | | | (1,748 | ) |
Net variation | | | 934 | | | | 1,459 | | | | 222 | | | | 942 | | | | 311 | |
Write-offs | | | (769 | ) | | | (1,693 | ) | | | (1,606 | ) | | | (863 | ) | | | (923 | ) |
Exchange rate differences and other | | | 45 | | | | (372 | ) | | | (576 | ) | | | 59 | | | | (365 | ) |
Period-end balance | | | 17,297 | | | | 17,087 | | | | 17,693 | | | | 19,654 | | | | 19,516 | |
Memorandum item: | | | | | | | | | | | | | | | | | | | | |
Non-performing loans | | | 16,559 | | | | 16,348 | | | | 17,045 | | | | 18,627 | | | | 18,569 | |
Non performing guarantees given | | | 738 | | | | 739 | | | | 649 | | | | 1,027 | | | | 947 | |
| (2) | Figures without considering the classification ofnon-current assets held for sale. |
Structural risks
Liquidity and funding
Management ofliquidity and funding in BBVA aims to finance the recurring growth of the banking business at suitable maturities and costs, using a wide range of instruments that provide access to a large number of alternative sources of financing, always in compliance with current regulatory requirements.
Due to its subsidiary-based management model, BBVA is one of the few major European banks that follows the Multiple Point of Entry (MPE) resolutionstrategy: the parent company sets the liquidity and risk policies, but the subsidiaries are self-sufficient and responsible for managing their own liquidity (taking deposits or accessing the market with their own rating), without fund transfer or financing occurring between either the parent company and the subsidiaries, or between different subsidiaries. This strategy limits the spread of a liquidity crisis among the Group’s different areas, and ensures that the cost of liquidity and financing is correctly reflected in the price formation process.
The financial soundness of the Group’s banks continues to be based on the funding of lending activity, fundamentally through the use of stable customer funds. During the first quarter of 2019,liquidity conditions remained comfortable across all countries in which the BBVA Group operates:
| • | | In the Eurozone, the liquidity situation remains comfortable, and the credit gap was stable throughout the first quarter. |
| • | | In the United States, the liquidity situation is adequate. The credit gap decreased in the quarter, due mainly to the increase in deposits as a result of the deposit growth campaigns launched and seasonal fluctuations in the first quarter of the year. |
| • | | In Mexico, a solid liquidity position has been maintained. The credit gap increased slightly in the first quarter of the year, affected by the seasonal outflow of deposits, while the loan portfolio remained virtually flat in the quarter. |
| • | | In Turkey, positive liquidity situation, with an adequate buffer against a possible liquidity stress scenario. The overall credit gap remained virtually flat, with the larger gap in Turkish lira due to the increase in loans being offset by a reduction in the credit gap in foreign currency, due to an increase in deposits. |
| • | | In South America, the liquidity situation remains comfortable throughout the region. In Argentina, despite market volatility, the liquidity situation remains adequate. |
The BBVA Group’s liquidity coverage ratio (LCR) remained comfortably above 100% throughout the first quarter of 2019, and stood at 127% as of March 31, 2019. All subsidiaries remained comfortably above 100% (Eurozone, 144%; Mexico, 151%; Turkey, 208%; and the United States, 145%). For the calculation of the ratio, it is assumed that there is no transfer of liquidity among subsidiaries; i.e. no kind of excess liquidity levels in foreign subsidiaries are considered in the calculation of the consolidated ratio. When considering these excess liquidity levels, the ratio would stand at 155% (28 percentage points above 127%).
Wholesalefinancing markets in which the Group operates remained stable, even in the case of Turkey, where the higher volatility at the end of March due to the local elections did not affect its financing.
The maintransactionscarried out by the entities of the BBVA Group during the first quarter of 2019 were as follows:
| • | | BBVA S.A. issued seniornon-preferred debt for €1 billion, with a fixed-rate coupon of 1.125% over a five-year period; an issue of preferred securities which may be converted into ordinary BBVA shares (CoCos), registered in the Spanish Securities Market Commission (CNMV) for €1 billion, with an annual coupon of 6.0% and an amortization option from the fifth year; and a Tier 2 subordinated debt issue for €750m, with a maturity period of 10 years, amortization option in the fifth year and a coupon of 2.575%. |
| • | | In addition, early amortization options have been implemented for the issue of CoCos for €1.5 billion with a coupon of 7% issued in February 2014, and another for Tier 2 subordinated debt for €1.5 billion with a 3.5% coupon issued in April 2014 and amortized in April 2019. |
| • | | In Turkey, Garanti issued a five-year Diversified Payment Rights (DPR) for US$150m. |
| • | | Finally, BBVA in Argentina issued negotiable instruments on the local market for an amount equivalent to €33m, while in Chile, Forum issued a bond on the local market for an amount equivalent to €108m. |
Foreign exchange
Foreign exchangerisk management of BBVA’s long-term investments, principally stemming from its overseas franchises, aims to preserve the Group’s adequacy capital ratios and to ensure the stability of its income statement.
In the first quarterof 2019, the Turkish lira (down 4.5%) and the Argentine peso (down 11.6%) depreciated against the euro, while the Mexican peso (up 3.7%) and the US dollar (up 1.9%) appreciated compared to the end of 2018. BBVA has maintained its policy of actively hedging its main investments in emerging markets, covering on average between 30% and 50% of annual earnings and around 70% of the CET1 capital ratio excess. Based on this policy, the sensitivity of the CET1 ratio to the depreciation of 10% against the euro by the main emerging-market currencies stood at-3 basis points for the Mexican peso and-2 basis points for the Turkish lira. In the case of the US dollar, the sensitivity is approximately +11 basis points to a depreciation of 10% against the euro, as a result of RWAs denominated in US dollars outside the United States. At the end of March 2019, the coverage level for expected earnings in 2019 stood at 75% for Mexico and 30% for Turkey.
Interest rates
The aim of managinginterest-raterisk is to maintain sustained growth of net interest income in the short- and medium-term, irrespective of interest rate fluctuations, while controlling the impact on capital through the valuation of the portfolio of financial assets at fair value through profit or loss.
The Group’s banks maintain fixed-income portfolios to manage their balance sheet structure. In the first quarter of 2019, the results of this management were satisfactory, with limited risk strategies maintained in all the Group’s banks.
In Turkey, there was an increase in market volatility prior to the local elections held on March 31, which led the Central Bank of the Republic of Turkey (CBRT) to raise the cost of financing to stabilize the Turkish lira. However, this did not have any impact on the balance sheet structure. In this context, the management of the customer spread was very positive, thanks to the efforts made to reduce the cost of funding, which enabled good net interest income growth in the quarter, despite a lower contribution of inflation-linked bonds compared to previous quarters.
Finally, with regard to themonetary policies pursued by central banks in the main countries where BBVA operates, in the first quarter of 2019, it should be noted that:
| • | | The interest rate of 0% and deposit facility rate of-0.40% were maintained in the Eurozone. The ECB indicated at its meeting in March that it would delay rate increases until at least December 2019, lowering its growth and inflation forecasts for the year. In addition, it announced a new round of liquidity injections (TLDRO III) starting from September. |
| • | | In the United States, the Fed decided to pause the normalization process in the face of increased downside risks, mainly due to the weakness of the global economy, and the absence of inflationary pressures, keeping interest rates stable at 2.5% at its March meeting. |
| • | | In Mexico, Banxico decided to maintain its monetary policy rate at 8.25%, considering that this position is consistent with meeting its target inflation rate. |
| • | | In Turkey, the Central Bank of the Republic of Turkey (CBRT) maintained rates at 24.00% during the first quarter, raising the average cost of financing to 25.50% at the end of March to stabilize the Turkish lira, before returning to 24.00% at the beginning of April. |
| • | | In South America, the monetary authorities of Colombia and Peru maintained their respective reference rates during the quarter the same as at the end of 2018, while in Argentina, interest rates rose to 68.16% at the end of the quarter, with the aim of avoiding an increase in the monetary base and halting the rise in inflation. |
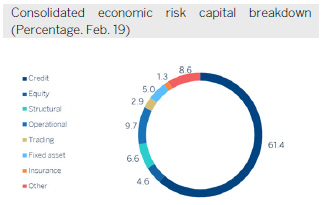
Economic capital
Economic risk capital (ERC) consumption at the end of February 2019, in consolidated terms, stood at €28,722 million, a decrease of 7.9% compared to the end of December 2018 (down 8.4% at constant exchange rates). This decrease is mainly focused on eliminating ERC consumption through goodwill and equity, as this will be considered a deduction of assets used in the calculation of the Group’s solvency.
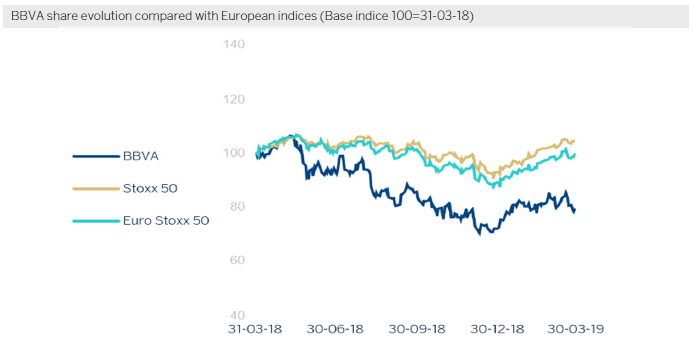
The BBVA share
The majorstock marketindices improved during the first quarter of 2019. In Europe, the Stoxx 50 and Euro Stoxx 50 rose 12.9% and 11.7%, respectively, while in Spain the Ibex 35 index rose 8.2%. Over the same period in the United States, the S&P 500 index rose 13.1%, marking the largest quarterly increase since the third quarter of 2009.
Banking sectorperformance in particular was also positive in the quarter, although to a lesser extent than the general market indices. Furthermore, the Stoxx European Banks index, which includes the United Kingdom, rose 4.5%, while the Euro Stoxx Banks index for the eurozone rose 7.1%. In the United States, the S&P Regional Banks Select Industry Index grew 9.6% in comparison to the close of the 2018.
On the other hand, theBBVA share performed slightly better than those of the European banking sector and Ibex 35 during the first quarter of 2019, with the share price increasing 9.9% to €5.09 at the close of the quarter.
| | | | |
| The BBVA share and share performance ratios |
| | | | | | | | |
| | | 31-03-19 | | | 31-12-18 | |
Number of shareholders | | | 892,316 | | | | 902,708 | |
Number of shares issued | | | 6,667,886,580 | | | | 6,667,886,580 | |
Daily average number of shares traded | | | 23,536,617 | | | | 35,909,997 | |
Daily average trading (millions of euros) | | | 122 | | | | 213 | |
Maximum price (euros) | | | 5.55 | | | | 7.73 | |
Minimum price (euros) | | | 4.51 | | | | 4.48 | |
Closing price (euros) | | | 5.09 | | | | 4.64 | |
Book value per share (euros) | | | 7.20 | | | | 7.12 | |
Tangible book value per share (euros) | | | 5.94 | | | | 5.86 | |
Market capitalization (millions of euros) | | | 33,960 | | | | 30,909 | |
Yield (dividend/price; %)(1) | | | 4.9 | | | | 5.4 | |
| (1) | Calculated by dividing shareholder remuneration over the last twelve months by the closing price of the period. |
Regardingshareholder remuneration, on April 10, 2019 BBVA paid in cash a gross amount of €0.16 per share as a final dividend for the 2018 fiscal year, which represents a 7% increase compared to April 2018. Thus, the total dividend for the 2018 fiscal year amount to €0.26 gross per share, with a payoutof 37% of net attributable profit, excluding the gains of the sale of BBVA Chile. BBVA will continue to pay out between 35% and 40% of its yearly earnings in dividends, with 100% cash remuneration.
As of March 31, 2019, the number of BBVAshares remained at 6,668 million, held by 892,316shareholders, of whom 44.73% are Spanish residents and the other 55.27% arenon-residents.
Shareholder structure
(31-03-2019)
| | | | | | | | | | | | | | | | |
| | | Shareholders | | | Shares | |
Number of shares | | Number | | | % | | | Number | | | % | |
Up to 150 | | | 177,281 | | | | 19.9 | | | | 12,565,086 | | | | 0.2 | |
151 to 450 | | | 177,739 | | | | 19.9 | | | | 48,727,280 | | | | 0.7 | |
451 to 1800 | | | 280,798 | | | | 31.5 | | | | 274,676,758 | | | | 4.1 | |
1,801 to 4,500 | | | 134,826 | | | | 15.1 | | | | 384,055,358 | | | | 5.8 | |
4,501 to 9,000 | | | 62,727 | | | | 7.0 | | | | 395,229,468 | | | | 5.9 | |
9,001 to 45,000 | | | 52,468 | | | | 5.9 | | | | 910,481,356 | | | | 13.7 | |
More than 45,001 | | | 6,477 | | | | 0.7 | | | | 4,642,151,274 | | | | 69.6 | |
| | | | | | | | | | | | | | | | |
Total | | | 892,316 | | | | 100.0 | | | | 6,667,886,580 | | | | 100.0 | |
| | | | | | | | | | | | | | | | |
BBVAshares are included on the main stock market indices, including the Ibex 35, Euro Stoxx 50 and Stoxx 50, with a weighting of 7.0%, 1.4% and 0.9% respectively at the close of March 2019. They also form part of several sector indices, including the Euro Stoxx Banks, with a weighting of 8.5%, and the Stoxx Banks, with a weighting of 4.0%.
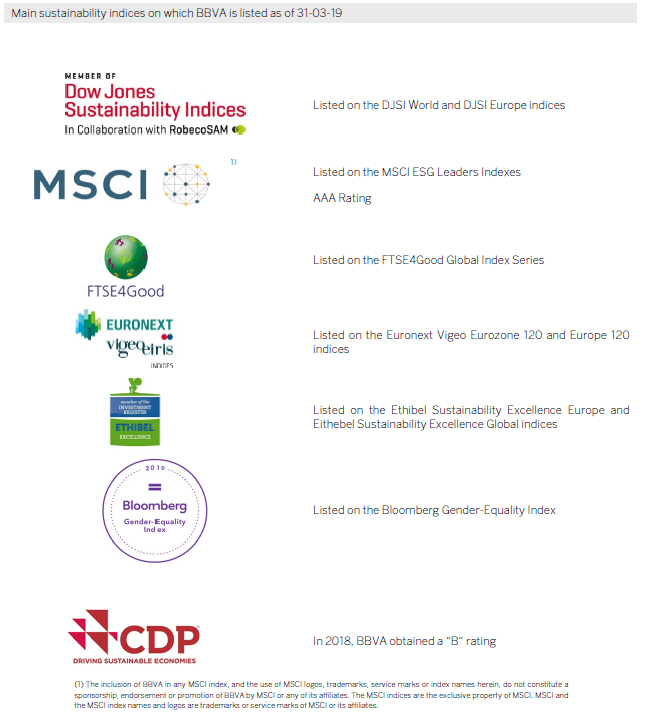
Finally, BBVA maintains a significant presence on a number of internationalsustainability indices or ESG (Environmental, Social and Governance) indices, which evaluate companies’ performance in these areas. This presence is summarized in the following table:
Responsible banking
At BBVA we have a differential bankingmodel, that we refer to as responsible banking, based on seeking out a return adjusted to principles, strict legal compliance, best practices and the creation of long-term value for all stakeholders. The four pillars of BBVA’s responsible banking model are as follows:
| • | | Balanced relationships with its customers, based on transparency, clarity and responsibility. |
| • | | Sustainable finance to combat climate change, respect human rights and achieve the United Nations Sustainable Development Goals (SDGs). |
| • | | Responsible practices with employees, suppliers and other stakeholders. |
| • | | Community investment to promote social change and create opportunities for all. |
In 2018, BBVA announced its2025 Pledge. This sets out the Bank’s strategy for climate change and sustainable development, working toward meeting the United Nations Sustainable Development Goals (SDGs) and the Paris Agreement on climate change. The pledge is an eight-year commitment based on three lines of action:
| • | | To finance: BBVA is pledging to mobilize €100 billion in green and social finance, sustainable infrastructures and agribusiness, social entrepreneurship and financial inclusion. |
| • | | To manage the environmental and social risks associated with the Group’s activity in order to minimize its potential direct and indirect negative impacts. BBVA pledges that 70% of energy used by the Group will be renewable by 2025, increasing to 100% in 2030, as well as to reduce CO2 emissions by 68% compared to 2015. |
| • | | To engage all stakeholders to collectively promote the financial sector’s contribution to sustainable development. |
In 2018, the first year of the Pledge, €11,815m was mobilized forsustainable financing. In the first quarter of 2019, BBVA continued to be very active in sustainable corporate financing, mainly in loans with profit margins linked to the borrower’s performance in terms of ESG (Environmental, Social and Governance) criteria, certified by an independent expert. BBVA was also part of the working group preparing Sustainability Linked Loan Principles (SLLP), the new market standards for this financial instrument,which were published in March.
In terms of mitigating social and environmental risks, in the first quarter of 2019, BBVA updated its sector norms setting out the due diligence to be performed in accordance with four
sectors of special environmental and social impact: mining, energy, infrastructure andagribusiness. These standards provide clear guidance on the procedures to follow when managing customers and transactions in these sectors. As a result of discussions with stakeholders and in order to meet expectations, stricter restrictions have been incorporated:
| • | | In the energy sector, the coal threshold for BBVA customers’ energy mix has beenreduced from 40% to 35%. |
| • | | Transporting of tar sands has been explicitly added to the list of prohibited activities, as well as to the existing exploration and production activities. BBVA’s exposure in financing projects of exploration, production and transportation of tar sands was zero by the close of the first quarter of 2019, and no projects of this nature are being considered. |
| • | | In the energy and agriculture sectors, reference to biofuels as an alternative in the fight against climate change, which appeared in a previous version of the standards, has been removed. |
| • | | New restrictions relating to tobacco advertising have been incorporated. |
As part of its objective to engage its stakeholders, BBVA continues to participate in various initiatives at the heart of sectoral associations such as the AEB (Asociación Española de Banca — Spanish banking association) or the EBF (European Banking Federation), where the Bank presides over the sustainable finance group and participates in working groups related to this matter, as well as collaborating in consultations on taxonomy, regulation, disclosure and other objectives of the European Commission action plan on sustainable finance.
Regarding responsible practice, BBVA updated its action plan on human rights matters in February 2019, which, combined with the renewed human rights commitment, allows closer monitoring of actions identified during a due diligence process conducted due to the potential special impact on human rights.
In terms of community investment, BBVA allocated €104.5m to social initiatives in 2018, which benefited more than 8 million people. This figure represents approximately 2% of the net attributable profit for that financial year. Through social programs, BBVA acts as an engine of opportunities for people, and seeks to have a positive impact on their lives, with regard to vulnerable people in particular. BBVA’s investment in social programs is channelled through its local banks within the Group, and through its corporate foundations.
Business areas
This section presents and analyzes the most relevant aspects of the Group’s different business areas. Specifically, for each one of them, it shows a summary of the income statement and balance sheet, the business activity figures and the most significant ratios.
In 2019, BBVA Group’s business areasreporting structure of the BBVA Group’s business areas differs from the one presented at the end of the 2018, as a result of the integration of theNon-Core Real Estate business area into Banking Activity in Spain, now reported as “Spain”. In order to make the 2019 information comparable to 2018, the figures for both areas have been reexpressed. BBVA Group’s business areas are summarized below:
| • | | Spain mainly includes the banking and insurance businesses that the Group carries out in Spain. |
| • | | The United States includes the Group’s business activity in the country through BBVA Compass group and BBVA’s New York branch. |
| • | | Mexico includes the Group’s banking and insurance businesses in this country as well as the activity of BBVA Bancomer’s branch in Houston. |
| • | | Turkey reports the activity of Garanti group that is mainly carried out in this country and, to a lesser extent, in Romania and the Netherlands. |
| • | | South America basically includes the Group’s banking and insurance businesses in the region. |
| • | | Rest of Eurasia includes the banking business activity carried out by the Group in Europe, excluding Spain, and in Asia. |
The Corporate Center contains the Group’s holding function, including: the costs of the head offices with a corporate function; management of structural exchange rate positions; some equity instruments issuances to ensure an adequate management of the Group’s global solvency. It also includes portfolios whose management is not linked to customer relationships, such as industrial holdings; certain tax assets and liabilities; funds due to commitments to employees; goodwill and other intangible assets.
Theinformation by business area is based on units at the lowest level and/or companies that comprise the e Group, which are assigned to the different areas according to the main region or company group in which they carry out their activity.
As usual, in the case of the different business areas in America and Turkey, the results of applying constantexchange rates are given as well as theyear-on-year variations at current exchange rates.
Major income statement items by business area
(Millions of euros)
| | | | | | | | | | | | | | | | | | | | | | | | | | | | | | | | | | | | |
| | | | | | Business areas | | | | | | | |
| | | BBVA Group | | | Spain | | | The
United
States | | | Mexico | | | Turkey | | | South
America | | | Rest of
Eurasia | | | S
Business
areas | | | Corporate
Center | |
31-03-19 | | | | | | | | | | | | | | | | | | | | | | | | | | | | | | | | | | | | |
Net interest income | | | 4,420 | | | | 882 | | | | 615 | | | | 1,500 | | | | 695 | | | | 760 | | | | 39 | | | | 4,491 | | | | (71 | ) |
Gross income | | | 6,069 | | | | 1,497 | | | | 804 | | | | 1,902 | | | | 884 | | | | 985 | | | | 103 | | | | 6,176 | | | | (107 | ) |
Operating income | | | 3,147 | | | | 683 | | | | 331 | | | | 1,268 | | | | 571 | | | | 606 | | | | 34 | | | | 3,493 | | | | (346 | ) |
Profit/(loss) before tax | | | 1,957 | | | | 482 | | | | 160 | | | | 877 | | | | 368 | | | | 417 | | | | 23 | | | | 2,327 | | | | (370 | ) |
Net attributable profit | | | 1,164 | | | | 345 | | | | 127 | | | | 627 | | | | 142 | | | | 193 | | | | 16 | | | | 1,450 | | | | (286 | ) |
31-03-18(1)(2) | | | | | | | | | | | | | | | | | | | | | | | | | | | | | | | | | | | | |
Net interest income | | | 4,287 | | | | 927 | | | | 524 | | | | 1,317 | | | | 753 | | | | 791 | | | | 43 | | | | 4,355 | | | | (67 | ) |
Gross income | | | 6,026 | | | | 1,588 | | | | 699 | | | | 1,711 | | | | 996 | | | | 1,008 | | | | 126 | | | | 6,127 | | | | (102 | ) |
Operating income | | | 3,050 | | | | 744 | | | | 264 | | | | 1,138 | | | | 641 | | | | 523 | | | | 54 | | | | 3,365 | | | | (314 | ) |
Profit/(loss) before tax | | | 2,170 | | | | 577 | | | | 252 | | | | 782 | | | | 519 | | | | 345 | | | | 71 | | | | 2,546 | | | | (376 | ) |
Net attributable profit | | | 1,290 | | | | 404 | | | | 196 | | | | 567 | | | | 200 | | | | 157 | | | | 48 | | | | 1,572 | | | | (282 | ) |
| (1) | The impact derived from the accounting for hyperinflation in Argentina for the first nine months of 2018 was recorded for the first time in the third quarter of the year, with accounting effects on January 1, 2018. In order to make the 2019 information comparable to 2018, the income statements for the first three quarters of the 2018 fiscal year have been reexpressed to reflect the impacts of inflation on their income and expenses. |
| (2) | The income statements for 2018 were reexpressed due to changes in the reallocation of some expenses related to global projects and activities between the Corporate Center and the business areas incorporated in 2019. |
Major balance-sheet items and risk-weighted assets by business area
(Millions of euros)
| | | | | | | | | | | | | | | | | | | | | | | | | | | | | | | | | | | | | | | | |
| | | | | | | | | | | | Business areas | | | | | | | | | | | | | | | | |
| | | BBVA
Group | | | Spain | | | The
United
States | | | Mexico | | | Turkey | | | South
America | | | Rest of
Eurasia | | | S
Business
areas | | | Corporate
Center | | | Deletions | |
31-03-19 | | | | | | | | | | | | | | | | | | | | | | | | | | | | | | | | | | | | | | | | |
Loans and advances to customers | | | 380,799 | | | | 170,893 | | | | 61,403 | | | | 53,480 | | | | 42,025 | | | | 35,691 | | | | 18,257 | | | | 381,748 | | | | 551 | | | | (1,500 | ) |
Deposits from customers | | | 378,527 | | | | 181,723 | | | | 65,165 | | | | 50,904 | | | | 40,544 | | | | 37,236 | | | | 5,065 | | | | 380,638 | | | | 280 | | | | (2,391 | ) |
Off-balance sheet funds | | | 103,227 | | | | 64,225 | | | | — | | | | 22,744 | | | | 3,370 | | | | 12,481 | | | | 407 | | | | 103,227 | | | | — | | | | — | |
Total assets/liabilities and equity | | | 691,200 | | | | 356,552 | | | | 85,160 | | | | 101,738 | | | | 67,130 | | | | 57,031 | | | | 20,582 | | | | 688,193 | | | | 16,075 | | | | (13,068 | ) |
Risk-weighted assets | | | 360,689 | | | | 107,935 | | | | 64,969 | | | | 54,794 | | | | 58,526 | | | | 44,964 | | | | 16,004 | | | | 347,191 | | | | 13,498 | | | | — | |
31-12-18(1) | | | | | | | | | | | | | | | | | | | | | | | | | | | | | | | | | | | | | | | | |
Loans and advances to customers | | | 374,027 | | | | 170,438 | | | | 60,808 | | | | 51,101 | | | | 41,478 | | | | 34,469 | | | | 16,598 | | | | 374,893 | | | | 990 | | | | (1,857 | ) |
Deposits from customers | | | 375,970 | | | | 183,414 | | | | 63,891 | | | | 50,530 | | | | 39,905 | | | | 35,842 | | | | 4,876 | | | | 378,456 | | | | 36 | | | | (2,523 | ) |
Off-balance sheet funds | | | 98,150 | | | | 62,559 | | | | — | | | | 20,647 | | | | 2,894 | | | | 11,662 | | | | 388 | | | | 98,150 | | | | — | | | | — | |
Total assets/liabilities and equity | | | 676,689 | | | | 354,901 | | | | 82,057 | | | | 97,432 | | | | 66,250 | | | | 54,373 | | | | 18,834 | | | | 673,848 | | | | 16,281 | | | | (13,440 | ) |
Risk-weighted assets | | | 348,264 | | | | 104,125 | | | | 64,175 | | | | 53,177 | | | | 56,486 | | | | 42,724 | | | | 15,464 | | | | 336,151 | | | | 12,113 | | | | — | |
| (1) | The impact derived from the accounting for hyperinflation in Argentina for the first nine months of 2018 was recorded for the first time in the third quarter of the year, with accounting effects on January 1, 2018. In order to make the 2019 information comparable to the 2018, the balance sheets of the first three quarters of the 2018 have been reexpressed to reflect the impacts of inflation on their assets and liabilities. |
Since 2019, a column has been added, which includes thedeletions and balance sheet adjustments between different business areas, especially in terms of the relationship between the areas in which the parent company operates, i.e. Spain, Rest of Eurasia and Corporate Center. In previous years, these deletions were allocated to the different areas, mainly in Banking Activity in Spain. Accordingly, the figures from the previous year have been reexpressed to show comparable series.
Macro and industry trends
World GDP grew by 3.8% in 2018, despite the slowdown in the second half of the year. In the first quarter of 2019,global growth moderated due to manufacturing and trade weaknesses. However, the service sector and employment remain robust. The cyclical slowdown in the United States and China’s moderation trend have been accompanied by an unexpected slowdown in Europe, affected by global trade tensions and idiosyncratic factors (such as regulatory changes in the automobile sector, protests in France and, mainly, Brexit).
In light of greater cyclical weakness and in the absence of inflationary pressures, main central banks have reacted with more accommodativemonetary policies. The United States Federal Reserve (Fed), after raising benchmark interest rates to 2.50% in December, has signaled a pause that is likely to continue until the end of 2019, and will put an end to the reduction in its balance earlier than expected. The European Central Bank, after completing the asset purchase program in December and in the face of weak economic activity, has announced a new round of liquidity auctions, delaying the interest rates increase, which is no longer expected untilmid-2020 at the earliest. Furthermore, the Chinese authorities have been adopting fiscal and monetary stimuli following recent signs of weakening activity. Thus, interest rates will remain low for longer in the developed economies, allowing emerging countries to gain room for maneuver. These stimuli are a factor supporting growth, but amoderation on growth rates is expected for the coming quarters.
Spain
The Spanish economy grew by 2.6% in 2018, above the euro area (1.8%). In the first quarter of 2019, growth remains strong due to the good performance of public and private consumption, while exports and investment in machinery and equipment are slowing down. In the coming quarters the economy will grow at a lower pace due to the exhaustion of the fiscal stimulus and the global weakness, while uncertainty about economic policy will continue to have a negative impact on activity.
Regarding the banking sector, the system’sde-leveraging and the improvement of asset quality indicators (NPL of 5.8% in January 2019) continued. Profitability remains under pressure (ROE at the close of 2018 stands at 5.4%) due to the low interest rate environment and lower business volumes. Spanish banks continue to have high levels of solvency and liquidity.
United States
The United States grew 2.9% in 2018, its unemployment rate fell below 4% and the Fed increased rates to 2.50%. Growth is being moderated by increased interest rates, the global slowdown, the exhaustion of the fiscal stimulus and political uncertainty. Some financial indicators show an increase in the risk of recession, but the economy maintains a good growth rate, especially in consumption. The pause in interest rate rises is a supporting factor.
The most recent bank activity figures show that credit and deposits are growing at rates of 5.2% and 3.3% respectively. Delinquencies continued to fall. In the fourth quarter of 2018, the NPL ratio was 1.57%.
Mexico
As of the end of 2018, the economy closed with a rate of growth of 2%. In the first months of 2019, the service sector was resilient and private consumption gave positive signs following the weakness of the fourth quarter of 2018. However, private investment remains weak while the manufacturing sector and exports are moderating. The central bank continues with its restrictive bias; however, good figures for inflation and the exchange rate would allow interest rates to be cut to mitigate the foreseeable slowdown in growth.
The banking system continues to grow inyear-on-year terms. With figures as of February 2019, loans and deposits grew by 9.4% and 8.5%, respectively, showing growth in all segments. Delinquencies remain contained (2.11%, compared to 2.20% twelve months earlier) while capital indicators remain at comfortable levels.
Turkey
The economy grew 2.6% in 2018, after registering two consecutive quarters of decline. Consumption and investment registered a sharp contraction, partially offset by external demand. Although activity kept falling at the beginning of the year, it seems to have reached a bottom. Interest rates will remain high until exchange rate pressure is resolved and inflation moderates. The Government has announced a new economic plan, some of the measures include the capitalization of the banking system and the strengthening of the asset quality.
As of the end of the first quarter of 2019, the banking system showed high growth rates. Total credit in the system (adjusted for the exchange rate effect) grew 18.1% with growth in all portfolios, driven especially by public banks after the government’s package of measures to support SMEs. The NPL ratio of the system is 4.1%.
Argentina
The economy registered a sharp contraction in 2018 (GDP fell by 2.5%) following the exchange rate crisis and a severe drought. But the end of the first quarter presents signs of a lukewarm recovery in activity, while the IMF has approved an additional US$ 10.8 billion loan after favorably completing the third review of its support program. Inflation remains high and with strong inertia due to the impact of exchange rate depreciation, despite a more contractionary monetary policy. In the financial system, loans and deposits are growing at high rates, with a notable influence of the high inflation. As of January 2019, profitability indicators are very high (ROE: 37% and ROA: 4.2%) and delinquencies remain contained, with a NPL ratio of 3.2%.
Colombia
The Colombian economy grew by 2.6% in 2018. Growth continued in the first quarter of 2019, supported by private consumption and public spending, while investment has not taken off. With weak demand and low inflation (about 3%), the central bank has held interest rates at 4.25% and it is not expected to increase them in the short term. In Colombia, as of January 2019, the system’s total credit grew by 5.9%year-on-year, with a NPL ratio of 4.7%. Since January 2018, total deposits increased 4.7%.
Peru
After growing by 4% in 2018, growth is moderating mainly explained by the primary sector, construction and the recent fall in public investment. The central bank has held interest rates at 2.75%, which implies an expansionary bias for monetary policy. Interest rates are expected to rise in the coming months. The banking system presents moderateyear-on-year growth rates in loans and deposits (+9.3% and +5.7% respectively, as of January 2019), with reasonably high profitability levels (ROE: 18.5%, ROA: 2.7%).
End of period interest rates
(Percentage)
| | | | | | | | | | | | | | | | | | | | |
| | | 2019
1Q | | | 4Q | | | 2018
3Q | | | 2Q | | | 1Q | |
Official ECB rate | | | 0.00 | | | | 0.00 | | | | 0.00 | | | | 0.00 | | | | 0.00 | |
Euribor 3 months | | | (0.31 | ) | | | (0.31 | ) | | | (0.32 | ) | | | (0.32 | ) | | | (0.33 | ) |
Euribor 1 year | | | (0.11 | ) | | | (0.13 | ) | | | (0.17 | ) | | | (0.18 | ) | | | (0.19 | ) |
USA Federal rates | | | 2.43 | | | | 2.40 | | | | 2.18 | | | | 1.91 | | | | 1.67 | |
TIIE (Mexico) | | | 8.52 | | | | 8.41 | | | | 8.11 | | | | 7.93 | | | | 7.83 | |
CBRT (Turkey) | | | 25.50 | | | | 24.06 | | | | 24.01 | | | | 17.77 | | | | 12.75 | |
Exchange rates
(Expressed in currency/euro)
| | | | | | | | | | | | | | | | | | | | |
| | | Year-end exchange rates | | | | | | Average exchange rates | |
| | | 31-03-19 | | | D % on
31-03-18 | | | D % on
31-12-18 | | | 1Q19 | | | D % on
1Q18 | |
Mexican peso | | | 21.6910 | | | | 3.8 | | | | 3.7 | | | | 21.8057 | | | | 5.6 | |
U.S. dollar | | | 1.1235 | | | | 9.7 | | | | 1.9 | | | | 1.1358 | | | | 8.2 | |
Argentine peso | | | 48.9734 | | | | (49.3 | ) | | | (11.6 | ) | | | 48.9734 | | | | (49.3 | ) |
Chilean peso | | | 765.20 | | | | (2.5 | ) | | | 4.0 | | | | 757.96 | | | | (2.3 | ) |
Colombian peso | | | 3,585.02 | | | | (4.5 | ) | | | 4.5 | | | | 3,561.35 | | | | (1.5 | ) |
Peruvian sol | | | 3.7275 | | | | 6.7 | | | | 3.6 | | | | 3.7738 | | | | 5.4 | |
Turkish lira | | | 6.3446 | | | | (22.8 | ) | | | (4.5 | ) | | | 6.1102 | | | | (23.2 | ) |
| | | | | | | | | | |
Spain | | | | | | |
| | | | | | | | | | |
| | | Highlights | | | | | | |
| | • | | Positive trend of activity, especially in high profitable segments. | | | | | | |
| | • | | Net Interest income affected by lower ALCO contribution and the impact of IFRS 16. | | | | | | |
| | • | | Significant reduction in operating expenses. | | | | | | |
| | • | | Continues improvement in Credit risk indicators. | | | | | | |
Financial statements and relevant business indicators
(Millions of euros and percentage)
| | | | | | | | | | | | |
Income statement | | 1Q19 | | | D % | | | 1Q18 | |
Net interest income | | | 882 | | | | (4.9 | ) | | | 927 | |
Net fees and commissions | | | 414 | | | | 0.3 | | | | 412 | |
Net trading income | | | 108 | | | | (35.2 | ) | | | 167 | |
Other operating income and expenses | | | 94 | | | | 14.0 | | | | 82 | |
of which Insurance activities(1) | | | 130 | | | | 13.5 | | | | 114 | |
Gross income | | | 1,497 | | | | (5.7 | ) | | | 1,588 | |
Operating expenses | | | (814 | ) | | | (3.5 | ) | | | (844 | ) |
Personnel expenses | | | (472 | ) | | | (1.6 | ) | | | (480 | ) |
Other administrative expenses | | | (223 | ) | | | (22.5 | ) | | | (287 | ) |
Depreciation | | | (119 | ) | | | 55.7 | | | | (77 | ) |
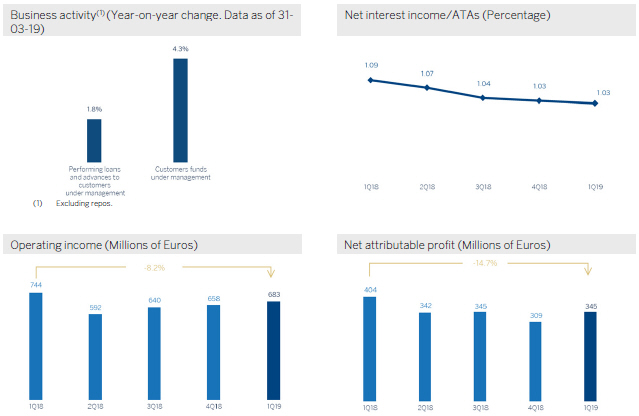
Operating income | | | 683 | | | | (8.2 | ) | | | 744 | |
Impairment on financial assets not measured at fair value through profit or loss | | | (78 | ) | | | (37.9 | ) | | | (125 | ) |
Provisions or reversal of provisions and other results | | | (123 | ) | | | 194.7 | | | | (42 | ) |
Profit/(loss) before tax | | | 482 | | | | (16.5 | ) | | | 577 | |
Income tax | | | (137 | ) | | | (20.7 | ) | | | (172 | ) |
Profit/(loss) for the year | | | 345 | | | | (14.7 | ) | | | 405 | |
Non-controlling interests | | | (1 | ) | | | (7.4 | ) | | | (1 | ) |
Net attributable profit | | | 345 | | | | (14.7 | ) | | | 404 | |
| (1) | Includes premiums received net of estimated technical insurance reserves. |
| | | | | | | | | | | | |
Balance sheets | | 31-03-19 | | | D % | | | 31-12-18 | |
Cash, cash balances at central banks and other demand deposits | | | 18,875 | | | | (33.9 | ) | | | 28,545 | |
Financial assets designated at fair value | | | 113,735 | | | | 6.0 | | | | 107,320 | |
of which loans and advances | | | 30,715 | | | | 1.6 | | | | 30,222 | |
Financial assets at amortized cost | | | 199,111 | | | | 1.9 | | | | 195,467 | |
of which loans and advances to customers | | | 170,893 | | | | 0.3 | | | | 170,438 | |
Inter-area positions | | | 13,173 | | | | (6.1 | ) | | | 14,026 | |
Tangible assets | | | 3,530 | | | | 172.9 | | | | 1,294 | |
Other assets | | | 8,129 | | | | (1.5 | ) | | | 8,249 | |
Total assets/liabilities and equity | | | 356,552 | | | | 0.5 | | | | 354,901 | |
Financial liabilities held for trading and designated at fair value through profit or loss | | | 70,283 | | | | (1.1 | ) | | | 71,033 | |
Deposits from central banks and credit institutions | | | 46,697 | | | | 1.7 | | | | 45,914 | |
Deposits from customers | | | 181,723 | | | | (0.9 | ) | | | 183,414 | |
Debt certificates | | | 31,490 | | | | 0.4 | | | | 31,352 | |
Inter-area positions | | | — | | | | — | | | | — | |
Other liabilities | | | 17,756 | | | | 22.3 | | | | 14,519 | |
Economic capital allocated | | | 8,602 | | | | (0.8 | ) | | | 8,670 | |
| | | |
Relevant business indicators | | 31-03-19 | | | D % | | | 31-12-18 | |
Performing loans and advances to customers under management(1) | | | 166,802 | | | | 0.2 | | | | 166,396 | |
Non-performing loans | | | 9,794 | | | | (2.8 | ) | | | 10,073 | |
Customer deposits under management(1) | | | 181,283 | | | | (0.9 | ) | | | 182,984 | |
Off-balance sheet funds(2) | | | 64,225 | | | | 2.7 | | | | 62,559 | |
Risk-weighted assets | | | 107,935 | | | | 3.7 | | | | 104,125 | |
Efficiency ratio (%) | | | 54.4 | | | | | | | | 55.9 | |
NPL ratio (%) | | | 4.9 | | | | | | | | 5.1 | |
NPL coverage ratio (%) | | | 58 | | | | | | | | 57 | |
Cost of risk (%) | | | 0.18 | | | | | | | | 0.21 | |
| (2) | Includes mutual funds, pension funds and otheroff-balance sheet funds. |
Activity
The most relevant aspects related to the area’s activity during the first quarter of 2019 were:
| • | | As of March 31, 2019Lending (performing loans under management) stood at a similar level than the one registered on December 31, 2018 (up 0.2%). We highlight the positive evolution of consumer loans and credit cards (up 3.4%) as well as lending tomedium-sized enterprises (up 2.1%) that offset the reduction in mortgage loans (down 0.5%). Inyear-on-year terms, lending activity grew by 1.8%. |
| • | | In terms of asset quality,non-performing loans showed a downward trend over the quarter, with a positive effect on the NPL ratio which stood at 4.9% as of March 31, 2019 (5.1% as of December 31, 2018), mainly explained by a lower level of NPLs in the mortgage portfolios. The NPL coverage ratio stood at 58%, above the closing of 2018. |
| • | | Regarding customerdeposits under management, it is important to highlight the good performance of demand deposits, which increased by 2.5% in the quarter (up 13.3%year-on-year), representing more than 80% of total deposits by March 2019. On the other hand, time deposits continued their downward trend (down 13.2% in the quarter, down 19.1%year-on-year). Overall, total deposits remained flat during the quarter while increasing by 5.2% in the last twelve months. |
| • | | Off-balance sheet funds showed a mild recovery (up 2.7% since December 31, 2018 and up 1.9%year-on-year), particularly evident in investment funds as a result of a good market performance during the quarter. |
Results
In the first quarter of 2019, the net attributable profit of BBVA in Spain stood at €345m, a 14.7% decline compared to the same quarter of 2018 but an increase of 11.7% compared to the previous quarter. The main highlights of the area’s income statement are:
| • | | Net interest income decreased by 4.9%year-on-year, strongly influenced by a lower contribution from the ALCO portfolio and the effect of the implementation of IFRS 16. |
| • | | Net fees and commissions remained stableyear-on-year (up 0.3%). |
| • | | LowerNTI contribution (down 35.2% compared to the same quarter of 2018) due to uneven market performance in the quarter and lower portfolio sales. |
| • | | Growth inother operating income and expenses (up 14.0%year-on-year) was mainly due to the good performance of net earnings from the insurance business which showed an increase of 13.5%. |
| • | | Operating expenses decreased by 3.5% in the last twelve months, remaining flat over the last three months. Thus, theefficiencyratio stood at 54.4%, improving compared to the end of 2018. |
| • | | Decline in impairment on financial assets (down 37.9%year-on-year) as a result of lower loan-loss provisions of real-estate developer loans previously allocated to the former Non Core Real Estate area. As a result, the cumulative cost of risk stood at 0.18% as of March 31, 2019. |
| • | | Finally,provisions (net) and other gains (losses) showed ayear-on-year increase due mainly to the positive valuation of assets in the former Non Core Real Estate area during the first quarter of last year. |
| | | | | | | | | | |
The United States | | | | | | |
| | | | | | | | | | |
| | | Highlights | | | | | | |
| | • | | Good performance in consumer and commercial segments activity. | | | | | | |
| | • | | Net interest income increase, main lever of results and of customer spreads. | | | | | | |
| | • | | Operating expenses growth below the inflation rate, efficiency improvement. | | | | | | |
| | • | | Net attributable profit affected by impairment on financial assets associated to the macroeconomic environment, to specific customers and to write-offs in consumer. | | | | | | |
Financial statements and relevant business indicators
(Millions of euros and percentage)
| | | | | | | | | | | | | | | | |
Income statement | | 1Q19 | | | D % | | | D % (1) | | | 1Q18 | |
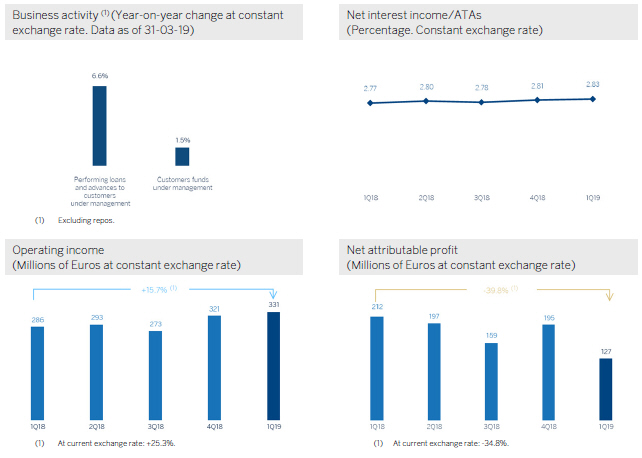
Net interest income | | | 615 | | | | 17.4 | | | | 8.4 | | | | 524 | |
Net fees and commissions | | | 151 | | | | 2.1 | | | | (5.7 | ) | | | 148 | |
Net trading income | | | 41 | | | | 67.3 | | | | 54.0 | | | | 24 | |
Other operating income and expenses | | | (3 | ) | | | n.s. | | | | n.s. | | | | 3 | |
Gross income | | | 804 | | | | 15.1 | | | | 6.3 | | | | 699 | |
Operating expenses | | | (473 | ) | | | 8.8 | | | | 0.5 | | | | (434 | ) |
Personnel expenses | | | (278 | ) | | | 10.4 | | | | 1.9 | | | | (252 | ) |
Other administrative expenses | | | (140 | ) | | | (0.6 | ) | | | (8.2 | ) | | | (141 | ) |
Depreciation | | | (55 | ) | | | 31.1 | | | | 21.2 | | | | (42 | ) |
Operating income | | | 331 | | | | 25.3 | | | | 15.7 | | | | 264 | |
Impairment on financial assets not measured at fair value through profit or loss | | | (162 | ) | | | n.s. | | | | n.s. | | | | (20 | ) |
Provisions or reversal of provisions and other results | | | (10 | ) | | | n.s. | | | | n.s. | | | | 8 | |
Profit/(loss) before tax | | | 160 | | | | (36.6 | ) | | | (41.4 | ) | | | 252 | |
Income tax | | | (32 | ) | | | (42.6 | ) | | | (47.0 | ) | | | (56 | ) |
Profit/(loss) for the year | | | 127 | | | | (34.8 | ) | | | (39.8 | ) | | | 196 | |
Non-controlling interests | | | — | | | | — | | | | — | | | | — | |
Net attributable profit | | | 127 | | | | (34.8 | ) | | | (39.8 | ) | | | 196 | |
| | | | |
Balance sheets | | 31-03-19 | | | D % | | | D %(1) | | | 31-12-18 | |
Cash, cash balances at central banks and other demand deposits | | | 6,550 | | | | 35.5 | | | | 32.9 | | | | 4,835 | |
Financial assets designated at fair value | | | 9,330 | | | | (11.0 | ) | | | (12.7 | ) | | | 10,481 | |
of which loans and advances | | | 236 | | | | 51.1 | | | | 48.2 | | | | 156 | |
Financial assets at amortized cost | | | 65,629 | | | | 3.3 | | | | 1.3 | | | | 63,539 | |
of which loans and advances to customers | | | 61,403 | | | | 1.0 | | | | (0.9 | ) | | | 60,808 | |
Inter-area positions | | | — | | | | — | | | | — | | | | — | |
Tangible assets | | | 952 | | | | 42.5 | | | | 39.8 | | | | 668 | |
Other assets | | | 2,700 | | | | 6.5 | | | | 4.5 | | | | 2,534 | |
Total assets/liabilities and equity | | | 85,160 | | | | 3.8 | | | | 1.8 | | | | 82,057 | |
Financial liabilities held for trading and designated at fair value through profit or loss | | | 305 | | | | 30.0 | | | | 27.6 | | | | 234 | |
Deposits from central banks and credit institutions | | | 4,710 | | | | 39.8 | | | | 37.1 | | | | 3,370 | |
Deposits from customers | | | 65,165 | | | | 2.0 | | | | 0.1 | | | | 63,891 | |
Debt certificates | | | 3,364 | | | | (6.5 | ) | | | (8.3 | ) | | | 3,599 | |
Inter-area positions | | | 1,737 | | | | (9.9 | ) | | | (11.6 | ) | | | 1,926 | |
Other liabilities | | | 6,198 | | | | 9.6 | | | | 7.6 | | | | 5,654 | |
Economic capital allocated | | | 3,682 | | | | 8.8 | | | | 6.8 | | | | 3,383 | |
| | | | | | | | | | | | | | | | |
Relevant business indicators | | 31-03-19 | | | D % | | | D % (1) | | | 31-12-18 | |
Performing loans and advances to customers under management(2) | | | 61,405 | | | | 1.0 | | | | (0.9 | ) | | | 60,784 | |
Non-performing loans | | | 904 | | | | 12.7 | | | | 10.6 | | | | 802 | |
Customer deposits under management(2) | | | 65,163 | | | | 2.0 | | | | 0.1 | | | | 63,888 | |
Off-balance sheet funds(3) | | | — | | | | — | | | | — | | | | — | |
Risk-weighted assets | | | 64,969 | | | | 1.2 | | | | (0.7 | ) | | | 64,175 | |
Efficiency ratio (%) | | | 58.8 | | | | | | | | | | | | 62.2 | |
NPL ratio (%) | | | 1.4 | | | | | | | | | | | | 1.3 | |
NPL coverage ratio (%) | | | 85 | | | | | | | | | | | | 85 | |
Cost of risk (%) | | | 1.06 | | | | | | | | | | | | 0.39 | |
| (1) | Figures at constant exchange rate. |
| (3) | Includes mutual funds, pension funds and otheroff-balance sheet funds. |
Activity
Unless expressly stated otherwise, all the comments below on rates of change, for both activity and earnings, will be given at constant exchange rate. These rates, together with changes at current exchange rate, can be seen in the attached tables of financial statements and relevant business indicators.
The most relevant evolution to the area’s activity in the first quarter of 2019 was:
| • | | Lending activity (performing loans under management) increased by 6.6%year-on-year, even though the activity showed a slight decrease of 0.9% compared to the last quarter of 2018. |
| • | | Thecommercial portfolio showed a positive evolutionyear-on-year (up 6.8% and up 0.3% in the quarter), while the higher interest rates continued to affect mortgages (up 3.3%year-on-year, down 0.5% in the quarter). Regardingretail portfolios, credit cards and indirect consumer loan portfolios, which are increasingly being granted through digital channels and have higher margins, increased by 22.2%(year-on-year) and remained flat in the quarter. |
| • | | Regarding the risk indicators, the NPL ratio increased slightly in the quarter, and stood at 1.4% from 1.3% registered at the end of December 2018, due to the deterioration related to commercial clients. The NPL coverage ratio closed at 85%. |
| • | | Even though the competition for deposits remains intense, customerdeposits under management remained at the same level of December 2018 (up 1.5%year-on-year), mainly due to the increase in demand deposits (up 1.0% in the quarter, up 0.3%year-on-year) which offsets the slight decrease in time deposits (down 2.5% in the quarter, up 5.3%year-on-year). |
Results
The United States generated a cumulative net attributable profit of €127m through March 2019, 39.8% lower than the one registered twelve months earlier, due mainly to higher impairments on financial assets registered in the quarter.
The most relevant aspects of the evolution of the results is summarized below:
| • | | Net interest income continued to perform positively, with an increase of 8.4%year-on-year, in an environment in which no interest rate hikes are foreseen. |
| • | | Net fees and commissions declined by 5.7%year-on-year, mainly due to those related to investment banking and a lower contribution from markets. |
| • | | Higher contribution fromNTI due to the good performance associated with higher ALCO portfolio sales in the first quarter of 2019. |
| • | | Operating expensesgrew slightly by 0.5%year-on-year, mainly due to a good performance by savings in personnel expenses. This increase is lower than that shown by the gross income (6.3%), as a result, the efficiency ratio improved. |
| • | | Impairment on financial assets increased in the last twelve months, due to the macro scenario adjustment, to provisions for some specific customers in the commercial portfolio and some write-offs in consumer. In addition, the first quarter of 2018 was positively impacted by the release of provisions related to the Hurricanes the previous year. As a result, the cumulative cost of risk through March 31, 2019 increased to 1.06%. |
| | | | | | | | | | |
Mexico | | | | | | |
| | | | | | | | | | |
| | | Highlights | | | | | | |
| | | | | |
| | • | | Lending growth, supported by commercial, consumer and mortgages. | | | | | | |
| | | | | |
| | • | | Positive trend of net interest income in line with activity. | | | | | | |
| | | | | |
| | • | | Operating expenses influenced by the increase of the contribution to the BBVA Bancomer Foundation. | | | | | | |
| | | | | |
| | • | | Good asset quality indicators. | | | | | | |
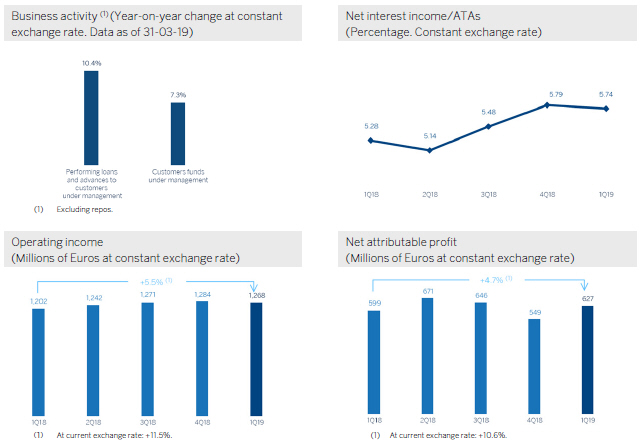
Financial statements and relevant business indicators
(Millions of euros and percentage)
| | | | | | | | | | | | | | | | |
Income statement | | 1Q19 | | | D % | | | D % (1) | | | 1Q18 | |
Net interest income | | | 1,500 | | | | 13.9 | | | | 7.8 | | | | 1,317 | |
Net fees and commissions | | | 300 | | | | 6.9 | | | | 1.2 | | | | 281 | |
Net trading income | | | 63 | | | | (7.4 | ) | | | (12.3 | ) | | | 67 | |
Other operating income and expenses | | | 40 | | | | (11.1 | ) | | | (15.9 | ) | | | 45 | |
Gross income | | | 1,902 | | | | 11.2 | | | | 5.3 | | | | 1,711 | |
Operating expenses | | | (634 | ) | | | 10.7 | | | | 4.8 | | | | (573 | ) |
Personnel expenses | | | (269 | ) | | | 9.2 | | | | 3.3 | | | | (246 | ) |
Other administrative expenses | | | (281 | ) | | | 5.8 | | | | 0.1 | | | | (266 | ) |
Depreciation | | | (84 | ) | | | 38.9 | | | | 31.5 | | | | (60 | ) |
Operating income | | | 1,268 | | | | 11.5 | | | | 5.5 | | | | 1,138 | |
Impairment on financial assets not measured at fair value through profit or loss | | | (395 | ) | | | 4.7 | | | | (0.9 | ) | | | (377 | ) |
Provisions or reversal of provisions and other results | | | 4 | | | | (82.1 | ) | | | (83.1 | ) | | | 21 | |
Profit/(loss) before tax | | | 877 | | | | 12.2 | | | | 6.2 | | | | 782 | |
Income tax | | | (250 | ) | | | 16.7 | | | | 10.4 | | | | (214 | ) |
Profit/(loss) for the year | | | 627 | | | | 10.6 | | | | 4.7 | | | | 567 | |
Non-controlling interests | | | (0 | ) | | | 14.1 | | | | 8.0 | | | | (0 | ) |
Net attributable profit | | | 627 | | | | 10.6 | | | | 4.7 | | | | 567 | |
| | | | |
Balance sheets | | 31-03-19 | | | D % | | | D %(1) | | | 31-12-18 | |
Cash, cash balances at central banks and other demand deposits | | | 8,678 | | | | 4.9 | | | | 1.2 | | | | 8,274 | |
Financial assets designated at fair value | | | 26,193 | | | | 0.7 | | | | (2.9 | ) | | | 26,022 | |
of which loans and advances | | | 216 | | | | 198.9 | | | | 188.2 | | | | 72 | |
Financial assets at amortized cost | | | 60,754 | | | | 5.3 | | | | 1.5 | | | | 57,709 | |
of which loans and advances to customers | | | 53,480 | | | | 4.7 | | | | 0.9 | | | | 51,101 | |
Tangible assets | | | 2,029 | | | | 13.5 | | | | 9.5 | | | | 1,788 | |
Other assets | | | 4,083 | | | | 12.2 | | | | 8.2 | | | | 3,639 | |
Total assets/liabilities and equity | | | 101,738 | | | | 4.4 | | | | 0.7 | | | | 97,432 | |
Financial liabilities held for trading and designated at fair value through profit or loss | | | 17,747 | | | | (1.6 | ) | | | (5.1 | ) | | | 18,028 | |
Deposits from central banks and credit institutions | | | 3,533 | | | | n.s. | | | | n.s. | | | | 683 | |
Deposits from customers | | | 50,904 | | | | 0.7 | | | | (2.8 | ) | | | 50,530 | |
Debt certificates | | | 9,071 | | | | 5.9 | | | | 2.1 | | | | 8,566 | |
Other liabilities | | | 16,545 | | | | 6.8 | | | | 3.0 | | | | 15,485 | |
Economic capital allocated | | | 3,938 | | | | (4.9 | ) | | | (8.3 | ) | | | 4,140 | |
| | | | | | | | | | | | | | | | |
Relevant business indicators | | 31-03-19 | | | D % | | | D % (1) | | | 31-12-18 | |
Performing loans and advances to customers under management (2) | | | 54,174 | | | | 5.4 | | | | 1.7 | | | | 51,387 | |
Non-performing loans | | | 1,182 | | | | 3.8 | | | | 0.1 | | | | 1,138 | |
Customer deposits under management(2) | | | 50,829 | | | | 2.2 | | | | (1.4 | ) | | | 49,740 | |
Off-balance sheet funds(3) | | | 22,744 | | | | 10.2 | | | | 6.2 | | | | 20,647 | |
Risk-weighted assets | | | 54,794 | | | | 3.0 | | | | (0.6 | ) | | | 53,177 | |
Efficiency ratio (%) | | | 33.3 | | | | | | | | | | | | 33.3 | |
NPL ratio (%) | | | 2.0 | | | | | | | | | | | | 2.1 | |
NPL coverage ratio (%) | | | 159 | | | | | | | | | | | | 154 | |
Cost of risk (%) | | | 2.93 | | | | | | | | | | | | 3.07 | |
| (1) | Figures at constant exchange rate. |
| (3) | Includes mutual funds, pension funds and otheroff-balance sheet funds. |
Activity
Unless expressly stated, all the comments below on exchange rates, for both activity and results, will be given at constant exchange rate. These rates, together with changes at current exchange rate, can be seen in the accompanying tables of financial statements and relevant business indicators.
The most relevant aspects related to the area’s activity in the first quarter of 2019 were:
| • | | Lending (performing loans under management) registered a 1.7% growth during the first three months of the year (up 10.4%year-on-year). That allows BBVA in Mexico to maintain its leading position in the country, with a market share of 22.3% in performing loans, according to local figures as of February 2019, from the CNBV (National Banking and Securities Commission). |
| • | | The wholesaleportfolio, which represents 50% of total lending, fell by 2.1% in the quarter due to theyear-end seasonal effect.Year-on-year, it grew by 9.9% as a result of the performance in businesses financing. On the other hand, theretail portfolio (including SMEs) rose by 2.4% in the quarter, mainly driven by consumer loans (payroll and personal loans) which increased by 6.7%. |
| • | | Asset qualityindicators remained at similar levels to those of the previous quarter:the NPL ratio closed at 2.0% (2.1% as of December 31, 2018), and coverage ratio at 159% (154% as of December 31, 2018). |
| • | | Total customerfunds (customer deposits under management, mutual funds and otheroff-balance sheet funds) showed an increase of 0.8% in the quarter, mainly due to the seasonal effect at the end of 2018 (up 7.3%year-on-year). Both time deposits and investment funds increased during the quarter (3.1% and 6.3% respectively). The bank maintains a profitable funding mix, wherelow-cost deposits represent 76% of total customer deposits under management. |
Results
During the first quarter of 2019, BBVA in Mexico showed a net attributableprofitof €627m, ayear-on-year increase of 4.7%. The most relevant aspects in the evolution of the income statement are summarized below:
| • | | Positive performance of thenet interest income, which showed ayear-on-year increase of 7.8%, lower than growth in activity (10.4%) due to a slight deterioration of customer spreads. |
| • | | Net fees and commissions showed a moderate growth (up 1.2%year-on-year). |
| • | | TheNTI showed a 12.3% decrease, mainly due to a lower contribution under this heading from the Global Markets unit. |
| • | | Other operating income and expenses registered ayear-on-year decrease of 15.9%, due to higher expenses derived from the deposit guarantee fund, as well as lower results from the insurance business. |
| • | | Theoperating expensesincreased by 4.8%, compared to the same period from the previous year, strongly influenced by the effect of doubling the contribution to BBVA Bancomer’s Foundation to strengthen community support in 2019.Gross incomeregistered an increase of 5.3%. As a result, the efficiency ratio stood at 33.3% as of March 31, 2019. |
| • | | The good evolution of the risk indicators was reflected in the decrease of 0.9%year-on-year ofimpairment on financial assets. The cost of risk stood at 2.93%, improving from 3.18% in the same period of the previous year or when compared to the 3.07% cumulative figure as of the end of 2018. |
| • | | Provisions (net) and other gains (losses) showed an unfavorable comparison in the first quarter of 2018 due to extraordinary income derived from the sale of the stake on a real estate development by BBVA in Mexico. |
Turkey
| | | | | | | | | | |
| | | | | | | | | | |
| | | Highlights | | | | | | |
| | | | | |
| | • | | Positive trend in lending. | | | | | | |
| | | | | |
| | • | | Good performance of net interest income, as a result of the inflation-linked bonds performance. | | | | | | |
| | | | | |
| | • | | Operating expenses growth below the inflation rate. | | | | | | |
| | | | | |
| | • | | Net attributable profit affected by the impairment on financial assets associated to the macroeconomic environment. | | | | | | |
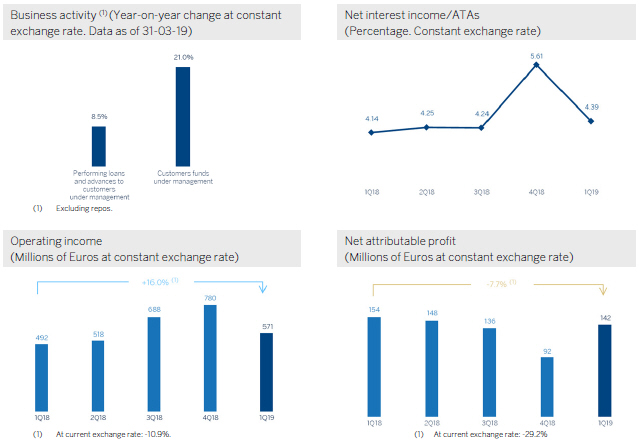
Financial statements and relevant business indicators
(Millions of euros and percentage)
| | | | | | | | | | | | | | | | |
Income statement | | 1Q19 | | | D % | | | D %(1) | | | 1Q18 | |
Net interest income | | | 695 | | | | (7.7 | ) | | | 20.2 | | | | 753 | |
Net fees and commissions | | | 194 | | | | (3.4 | ) | | | 25.8 | | | | 201 | |
Net trading income | | | (11 | ) | | | n.s. | | | | n.s. | | | | 20 | |
Other operating income and expenses | | | 6 | | | | (74.5 | ) | | | (66.8 | ) | | | 23 | |
Gross income | | | 884 | | | | (11.3 | ) | | | 15.5 | | | | 996 | |
Operating expenses | | | (313 | ) | | | (12.0 | ) | | | 14.7 | | | | (355 | ) |
Personnel expenses | | | (171 | ) | | | (3.3 | ) | | | 26.0 | | | | (177 | ) |
Other administrative expenses | | | (97 | ) | | | (29.4 | ) | | | (8.1 | ) | | | (138 | ) |
Depreciation | | | (44 | ) | | | 9.5 | | | | 42.6 | | | | (40 | ) |
Operating income | | | 571 | | | | (10.9 | ) | | | 16.0 | | | | 641 | |
Impairment on financial assets not measured at fair value through profit or loss | | | (202 | ) | | | 33.9 | | | | 74.5 | | | | (151 | ) |
Provisions or reversal of provisions and other results | | | (1 | ) | | | n.s. | | | | n.s. | | | | 29 | |
Profit/(loss) before tax | | | 368 | | | | (29.1 | ) | | | (7.7 | ) | | | 519 | |
Income tax | | | (79 | ) | | | (30.0 | ) | | | (8.8 | ) | | | (113 | ) |
Profit/(loss) for the year | | | 289 | | | | (28.9 | ) | | | (7.4 | ) | | | 406 | |
Non-controlling interests | | | (147 | ) | | | (28.6 | ) | | | (7.0 | ) | | | (206 | ) |
Net attributable profit | | | 142 | | | | (29.2 | ) | | | (7.7 | ) | | | 200 | |
| | | | |
Balance sheets | | 31-03-19 | | | D % | | | D %(1) | | | 31-12-18 | |
Cash, cash balances at central banks and other demand deposits | | | 7,171 | | | | (8.7 | ) | | | (4.4 | ) | | | 7,853 | |
Financial assets designated at fair value | | | 5,598 | | | | 1.7 | | | | 6.5 | | | | 5,506 | |
of which loans and advances | | | 410 | | | | 0.2 | | | | 4.9 | | | | 410 | |
Financial assets at amortized cost | | | 51,656 | | | | 2.7 | | | | 7.5 | | | | 50,315 | |
of which loans and advances to customers | | | 42,025 | | | | 1.3 | | | | 6.1 | | | | 41,478 | |
Tangible assets | | | 1,164 | | | | 9.9 | | | | 15.0 | | | | 1,059 | |
Other assets | | | 1,541 | | | | 1.6 | | | | 6.4 | | | | 1,517 | |
Total assets/liabilities and equity | | | 67,130 | | | | 1.3 | | | | 6.1 | | | | 66,250 | |
Financial liabilities held for trading and designated at fair value through profit or loss | | | 1,792 | | | | (3.2 | ) | | | 1.3 | | | | 1,852 | |
Deposits from central banks and credit institutions | | | 6,950 | | | | 3.2 | | | | 8.1 | | | | 6,734 | |
Deposits from customers | | | 40,544 | | | | 1.6 | | | | 6.4 | | | | 39,905 | |
Debt certificates | | | 6,335 | | | | 6.2 | | | | 11.2 | | | | 5,964 | |
Other liabilities | | | 8,786 | | | | (5.2 | ) | | | (0.7 | ) | | | 9,267 | |
Economic capital allocated | | | 2,723 | | | | 7.7 | | | | 12.7 | | | | 2,529 | |
| | | | | | | | | | | | | | | | |
Relevant business indicators | | 31-03-19 | | | D % | | | D %(1) | | | 31-12-18 | |
Performing loans and advances to customers under management (2) | | | 41,388 | | | | 1.0 | | | | 5.7 | | | | 40,996 | |
Non-performing loans | | | 3,138 | | | | 9.1 | | | | 14.3 | | | | 2,876 | |
Customer deposits under management(2) | | | 40,540 | | | | 1.6 | | | | 6.4 | | | | 39,897 | |
Off-balance sheet funds(3) | | | 3,370 | | | | 16.4 | | | | 21.9 | | | | 2,894 | |
Risk-weighted assets | | | 58,526 | | | | 3.6 | | | | 8.5 | | | | 56,486 | |
Efficiency ratio (%) | | | 35.4 | | | | | | | | | | | | 32.0 | |
NPL ratio (%) | | | 5.7 | | | | | | | | | | | | 5.3 | |
NPL coverage ratio (%) | | | 78 | | | | | | | | | | | | 81 | |
Cost of risk (%) | | | 1.82 | | | | | | | | | | | | 2.44 | |
| (1) | Figures at constant exchange rate. |
| (3) | Includes mutual funds, pension funds and otheroff-balance sheet funds. |
Activity
Unless expressly stated and communicated otherwise, rates of changes explained ahead, both for activity and for income, will be presented at constant exchange rates. These rates, together with changes at current exchange rates, can be observed in the attached tables of the financial statements and relevant business indicators.
The most relevant aspects related to the area’s activityyear-to-date as of March 31, 2019 were:
| • | | Lendingactivity (performing loans under management) grew by 5.7% in the quarter (up 8.5% year-on-year). Turkish-lira loan growth accelerated in this quarter by 7.2%, which grew above the sector after the deceleration observed during the last quarter of 2018. On the other hand, foreign-currency loans (in U.S. dollars) remained stable in this quarter. |
| • | | Bysegments, Garanti significantly outperformed in Turkish Lira Business Banking loans on a quarterly basis, thanks to the newly launchedCGF- Credit Guarantee Fund (loans which are provided with Treasury-backed Credit Guarantee) to support SMEs and commercials. On the other hand, there is a decrease in consumer loans and mortgages during the quarter. In addition, credit cards remained stable in the quarter in line with the evolution of this segment as shown by the country’s private banks. |
| • | | In terms of asset quality, the NPL ratio stood at 5.7%, with lower provisions than those registered in the previous quarter due to a lower deterioration of the retail and wholesale portfolios. The NPL coverage ratio stood at 78%. |
| • | | Customerdeposits(60% of total liabilities in the area as of March 31, 2019) remained the main source of funding for the balance sheet and grew by 6.4% in the quarter mainly supported by the growth of foreign currency deposits (in US dollars). |
Results
In the first quarter of 2019, Turkey generated a cumulative net attributableprofitof €142m representing a decrease of 7.7%year-on-year (up 54.8% in comparison with the previous quarter). The most significant aspects of theyear-on-year evolution in the income statement are the following:
| • | | Positive performance of netinterest income (up 20.2%) mainly thanks to the significant income from inflation-linked bonds. Even though the customer spreads decreased slightly compared to the same quarter of last year, it is worth mentioning the good recovery compared to the last quarter due to declining cost of funding. |
| • | | Income from net fees and commissions grew by 25.8%. This significant increase was mainly driven by the positive performance in payment systems and money transfers. |
| • | | Decrease inNTIdue to the unfavorable performance of the markets, which was not offset by the asset and liabilities management and derivative gains. |
| • | | Gross income grew 15.5%year-on-year, thanks to the increase in core banking activities and the aforementioned higher inflation-linked bonds contribution. |
| • | | Operating expensesincreased by 14.7%, well below the average inflation rate (18.7%) and below theyear-on-year growth rate in gross income. As a result of strict cost-control discipline, the efficiency ratio remained at low levels (35.4%). |
| • | | Impairment on financial assets increasedyear-on-year by 74.5% although it fell by 63.2% with respect to the previous quarter, mainly due to lower macro scenario adjustments and less deterioration of wholesale portfolios. As a result of the above, the cost of risk decreased 62 basis points in the quarter, which stood at 1.82%. |
| | | | | | | | | | |
South America | | | | | | |
| | | | | | | | | | |
| | | Highlights | | | | | | |
| | | | | |
| | • | | Activity continues to grow at a good pace. | | | | | | |
| | | | | |
| | • | | Good performance of net interest income. | | | | | | |
| | | | | |
| | • | | Net attributable profit impacted by Argentina’s hyperinflation adjustment. | | | | | | |
| | | | | |
| | • | | Positive trend in net attributable profit of the main countries in the region: Argentina, Colombia and Peru. | | | | | | |
| | | | | | | | | | |
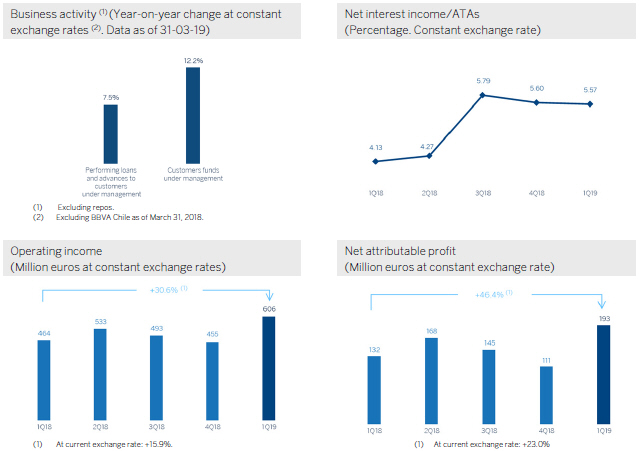
Financial statements and relevant business indicators
(Millions of euros and percentage)
| | | | | | | | | | | | | | | | |
Income statement | | 1Q19 | | | D % | | | D % (1)
| | | 1Q18 | |
Net interest income | | | 760 | | | | (3.9 | ) | | | 7.7 | | | | 791 | |
Net fees and commissions | | | 135 | | | | (17.4 | ) | | | (5.9 | ) | | | 163 | |
Net trading income | | | 206 | | | | 84.9 | | | | 121.1 | | | | 112 | |
Other operating income and expenses | | | (116 | ) | | | 100.0 | | | | 77.0 | | | | (58 | ) |
Gross income | | | 985 | | | | (2.3 | ) | | | 12.4 | | | | 1,008 | |
Operating expenses | | | (379 | ) | | | (21.9 | ) | | | (8.2 | ) | | | (485 | ) |
Personnel expenses | | | (195 | ) | | | (20.9 | ) | | | (6.0 | ) | | | (246 | ) |
Other administrative expenses | | | (142 | ) | | | (32.6 | ) | | | (21.5 | ) | | | (211 | ) |
Depreciation | | | (41 | ) | | | 53.6 | | | | 74.9 | | | | (27 | ) |
Operating income | | | 606 | | | | 15.9 | | | | 30.6 | | | | 523 | |
Impairment on financial assets not measured at fair value through profit or loss | | | (177 | ) | | | 6.1 | | | | 10.2 | | | | (167 | ) |
Provisions or reversal of provisions and other results | | | (12 | ) | | | 14.6 | | | | 80.5 | | | | (11 | ) |
Profit/(loss) before tax | | | 417 | | | | 20.7 | | | | 40.5 | | | | 345 | |
Income tax | | | (138 | ) | | | 3.7 | | | | 16.2 | | | | (133 | ) |
Profit/(loss) for the year | | | 279 | | | | 31.4 | | | | 56.6 | | | | 213 | |
Non-controlling interests | | | (86 | ) | | | 55.1 | | | | 85.8 | | | | (56 | ) |
Net attributable profit | | | 193 | | | | 23.0 | | | | 46.4 | | | | 157 | |
| | | | |
Balance sheets | | 31-03-19 | | | D % | | | D % (1)
| | | 31-12-18 | |
Cash, cash balances at central banks and other demand deposits | | | 8,830 | | | | (1.7 | ) | | | (0.4 | ) | | | 8,987 | |
Financial assets designated at fair value | | | 6,861 | | | | 21.8 | | | | 20.3 | | | | 5,634 | |
of which loans and advances | | | 125 | | | | (2.9 | ) | | | (7.0 | ) | | | 129 | |
Financial assets at amortized cost | | | 37,986 | | | | 3.6 | | | | 2.4 | | | | 36,649 | |
of which loans and advances to customers | | | 35,691 | | | | 3.5 | | | | 2.2 | | | | 34,469 | |
Tangible assets | | | 972 | | | | 19.6 | | | | 20.2 | | | | 813 | |
Other assets | | | 2,382 | | | | 4.0 | | | | 2.1 | | | | 2,290 | |
Total assets/liabilities and equity | | | 57,031 | | | | 4.9 | | | | 4.1 | | | | 54,373 | |
Financial liabilities held for trading and designated at fair value through profit or loss | | | 2,325 | | | | 71.3 | | | | 64.9 | | | | 1,357 | |
Deposits from central banks and credit institutions | | | 3,154 | | | | 2.5 | | | | (0.1 | ) | | | 3,076 | |
Deposits from customers | | | 37,236 | | | | 3.9 | | | | 3.5 | | | | 35,842 | |
Debt certificates | | | 3,388 | | | | 5.7 | | | | 2.1 | | | | 3,206 | |
Other liabilities | | | 8,501 | | | | (0.4 | ) | | | (0.9 | ) | | | 8,539 | |
Economic capital allocated | | | 2,429 | | | | 3.1 | | | | 2.6 | | | | 2,355 | |
| | | | | | | | | | | | | | | | |
Relevant business indicators | | 31-03-19 | | | D % | | | D % (1) | | | 31-12-18 | |
Performing loans and advances to customers under management(2) | | | 35,434 | | | | 2.7 | | | | 1.3 | | | | 34,518 | |
Non-performing loans | | | 1,827 | | | | 4.6 | | | | 1.9 | | | | 1,747 | |
Customer deposits under management(3) | | | 37,341 | | | | 3.8 | | | | 3.4 | | | | 35,984 | |
Off-balance sheet funds(4) | | | 12,481 | | | | 7.0 | | | | 5.4 | | | | 11,662 | |
Risk-weighted assets | | | 44,964 | | | | 5.2 | | | | 4.9 | | | | 42,724 | |
Efficiency ratio (%) | | | 38.4 | | | | | | | | | | | | 46.2 | |
NPL ratio (%) | | | 4.4 | | | | | | | | | | | | 4.3 | |
NPL coverage ratio (%) | | | 96 | | | | | | | | | | | | 97 | |
Cost of risk (%) | | | 1.94 | | | | | | | | | | | | 1.44 | |
| (1) | Figures at constant exchange rates. |
| (3) | Excluding repos and including specific marketable debt securities. |
| (4) | Includes mutual funds, pension funds and otheroff-balance sheet funds. |
South America. Data per country
(Millions of euros)
| | | | | | | | | | | | | | | | | | | | | | | | | | | | | | | | |
| | | Operating income | | | Net attributable profit | |
Country | | 1Q19 | | | D % | | | D % (1) | | | 1Q18 | | | 1Q19 | | | D % | | | D % (1) | | | 1Q18 | |
Argentina | | | 174 | | | | 181.3 | | | | n.s. | | | | 62 | | | | 60 | | | | n.s. | | | | n.s. | | | | 1 | |
Chile | | | 35 | | | | (67.2 | ) | | | (66.4 | ) | | | 108 | | | | 17 | | | | (63.4 | ) | | | (62.5 | ) | | | 46 | |
Colombia | | | 169 | | | | 6.2 | | | | 7.8 | | | | 159 | | | | 58 | | | | (6.4 | ) | | | (5.0 | ) | | | 62 | |
Peru | | | 194 | | | | 19.2 | | | | 13.0 | | | | 162 | | | | 43 | | | | 21.3 | | | | 15.1 | | | | 35 | |
Other countries(2) | | | 35 | | | | 8.7 | | | | 11.5 | | | | 32 | | | | 16 | | | | 25.9 | | | | 31.1 | | | | 13 | |
Total | | | 606 | | | | 15.9 | | | | 30.6 | | | | 523 | | | | 193 | | | | 23.0 | | | | 46.4 | | | | 157 | |
| (1) | Figures at constant exchange rates. |
| (2) | Venezuela, Paraguay, Uruguay and Bolivia. Additionally, it includes eliminations and other charges. |
South America. Relevant business indicators per country
(Millions of euros)
| | | | | | | | | | | | | | | | | | | | | | | | | | | | | | | | |
| | | Argentina | | | Chile | | | Colombia | | | Peru | |
| | | 31-03-19 | | | 31-12-18 | | | 31-03-19 | | | 31-12-18 | | | 31-03-19 | | | 31-12-18 | | | 31-03-19 | | | 31-12-18 | |
Performing loans and advances to customers under management(1)(2) | | | 3,891 | | | | 3,731 | | | | 2,117 | | | | 2,127 | | | | 12,199 | | | | 12,365 | | | | 14,290 | | | | 13,833 | |
Non-performing loans and guarantees given(1) | | | 90 | | | | 77 | | | | 68 | | | | 60 | | | | 776 | | | | 803 | | | | 748 | | | | 735 | |
Customer deposits under management(1)(3) | | | 5,683 | | | | 5,291 | | | | 11 | | | | 11 | | | | 12,799 | | | | 13,104 | | | | 14,356 | | | | 13,306 | |
Off-balance sheet funds(1)(4) | | | 1,033 | | | | 692 | | | | — | | | | — | | | | 1,449 | | | | 1,344 | | | | 1,714 | | | | 1,726 | |
Risk-weighted assets | | | 7,963 | | | | 8,036 | | | | 2,361 | | | | 2,243 | | | | 13,671 | | | | 12,680 | | | | 17,129 | | | | 15,739 | |
Efficiency ratio (%) | | | 37.6 | | | | 73.7 | | | | 32.0 | | | | 42.1 | | | | 35.6 | | | | 37.1 | | | | 36.7 | | | | 36.0 | |
NPL ratio (%) | | | 2.2 | | | | 2.0 | | | | 3.1 | | | | 2.8 | | | | 5.8 | | | | 6.0 | | | | 4.0 | | | | 4.0 | |
NPL coverage ratio (%) | | | 110 | | | | 111 | | | | 89 | | | | 93 | | | | 98 | | | | 100 | | | | 95 | | | | 93 | |
Cost of risk (%) | | | 2.13 | | | | 1.60 | | | | 2.34 | | | | 0.81 | | | | 2.30 | | | | 2.16 | | | | 1.60 | | | | 0.98 | |
| (1) | Figures at constant exchange rates. |
| (3) | Excluding repos and including specific marketable debt securities. |
| (4) | Includes mutual funds, pension funds and otheroff-balance sheet funds. |
Activity and results
Unless expressly stated otherwise, all the comments below on rates of change, for both activity and results, will be given at constant exchange rates. These rates, together with changes at current exchange rates, can be found in the attached tables of financial statements and relevant business indicators.
The most relevant aspects related to the area’s activity in the first quarter of 2019 were:
| | • | | Lending (performing loans under management) increased by 1.3% compared to the closing of the previous year. By segments, the performance was especially positive in credit cards and enterprises. |
| | • | | Inasset quality, the NPL ratio stood at 4.4% at March 31, 2019 in line with the previous quarter, as well as the coverage ratio which stood at 96% (97% at December 31, 2018). |
| | • | | Customer deposits increased 3.4% whileoff-balance sheet funds grew 5.4% during the quarter. |
Regarding results, South America generated a cumulative net attributableprofit of €193m in the first quarter of 2019, representing ayear-on-year growth of 46.4% (23.0% at current exchange rates). This performance was negatively affected by the negative effect of the hyperinflation in Argentina on the region’s net attributable profit (down €49m). The highlights of the income statement in the quarter were:
| | • | | The more recurring revenue items rose 5.4% (down 6.2% in current), especially due to the growth ofnet interest income (up 7.7%year-on-year, down 3.9% in current). |
| | • | | Good performance of financial transactions, obtaining some NTI which increased at a rate of 121.1%year-on-year (up 84.9% in current). |
| | • | | Higher requirements forimpairment on financial assets (up 10.2%year-on-year, up 6.1% current). As a result, the cumulative cost of risk as of March 2019 stood at 1.94%. |
Excluding BBVA Chile from the 2018 comparison (the sale was completed in July 2018), the net attributable profit increased 50.9% in the first quarter of 2019, at current exchange rates, compared to the same figure in the previous year.
The most significant countries in the business area,Argentina,Colombia and Peru, showed the following activity and results evolution during the first quarter of 2019:
Argentina
| | • | | Growth of 4.3% in the quarterinlending activity mainly explained by the performance of consumer, credit cards and mortgages retail portfolios. As for asset quality, there was a slight increase in the NPL ratio to close at t 2.2% as of March 31, 2019. |
| | • | | Customer deposits increased 7.4%, whileoff-balance sheet funds increased by 49.2%, both compared to 2018 year end figures. |
| | • | | The net attributableprofit stood at €60m, based both on the positive performance of the more recurring revenue items (driven by a greater contribution of the securities portfolio and an improvement in the customer spread) as well as in the positive impact arising from the stake sale in Prisma Medios de Pago S.A (€50m net of taxes). |
Colombia
| | • | | Lending activity decreased by 1.3% in the quarter (up 2.1%year-on-year) due to consumer and enterprises while mortgages and credit cards remained flat. In terms of asset quality, the NPL ratio fell to 5.8% in the quarter due to thewritten-off a wholesale customer. |
| | • | | Although customer deposits fell 2.3%during the first quarter of 2019, they increased by 2.7% inyear-on-year terms. |
| | • | | Goodyear-on-year performance of netinterest income, which grew 2.7% (up1.2% at current exchange rate) as a result of higher activity volumes and good management of customer spreads. This evolution of net interest income, together with a positive contribution from the NTI as a result of the profits steaming from the management of securities portfolio, along with a reduction in operating expenses, resulted in an increase of 7.8% intheoperating income compared to the previous year. Net attributableprofit stood at €58m, ayear-on year reduction of 5.0%, derived from higher provisions due to the impact of write-offs mainly from the aforementioned customer. |
Peru
| | • | | In the quarter, lending activitygrew by 3.3%, explained by the good performance of both the retail (consumer, credit cards and mortgages) and wholesale portfolios.Asset quality indicators remained stable with respect the closing of 2018, with a NPL ratio of 4.0% and a coverage ratio of 95%. |
| | • | | Customerdeposits increased 7.9% in the first quarter of 2019 (up 14.5%year-on-year), supported by time deposits (up 20.3%). |
| | • | | Net attributableprofit was €43m, representing ayear-on year increase of 15.1% due to the good performance of the more recurring revenue items, i.e. net interest income plus net fees and commissions (up15.0% and up 5.8%, respectively). This evolution offsets the slight increase on operating expenses and on the impairment on financial assets. |
Rest of Eurasia
Highlights
| | • | | Good performance in lending activity. |
| | • | | Positive trend of operating expenses. |
| | • | | Net attributable profit affected by the decline in income in an environment of negative interest rates. |
| | • | | Improvement in risk indicators. |
Financial statements and relevant business indicators
(Millions of euros and percentage)
| | | | | | | | | | | | |
Income statement | | 1Q19 | | | D % | | | 1Q18 | |
Net interest income | | | 39 | | | | (8.0 | ) | | | 43 | |
Net fees and commissions | | | 36 | | | | (7.6 | ) | | | 39 | |
Net trading income | | | 27 | | | | (39.0 | ) | | | 44 | |
Other operating income and expenses | | | 2 | | | | 141.5 | | | | 1 | |
Gross income | | | 103 | | | | (17.8 | ) | | | 126 | |
Operating expenses | | | (70 | ) | | | (2.6 | ) | | | (71 | ) |
Personnel expenses | | | (34 | ) | | | (3.8 | ) | | | (35 | ) |
Other administrative expenses | | | (31 | ) | | | (9.6 | ) | | | (35 | ) |
Depreciation | | | (4 | ) | | | 185.3 | | | | (2 | ) |
Operating income | | | 34 | | | | (37.8 | ) | | | 54 | |
Impairment on financial assets not measured at fair value through profit or loss | | | (10 | ) | | | n.s. | | | | 17 | |
Provisions or reversal of provisions and other results | | | (1 | ) | | | 1.2 | | | | (1 | ) |
Profit/(loss) before tax | | | 23 | | | | (67.6 | ) | | | 71 | |
Income tax | | | (7 | ) | | | (69.3 | ) | | | (22 | ) |
Profit/(loss) for the year | | | 16 | | | | (66.9 | ) | | | 48 | |
Non-controlling interests | | | — | | | | — | | | | — | |
Net attributable profit | | | 16 | | | | (66.9 | ) | | | 48 | |
| | | | | | | | | | | | |
Balance sheets | | 31-03-19 | | | D % | | | 31-12-18 | |
Cash, cash balances at central banks and other demand deposits | | | 212 | | | | (11.1 | ) | | | 238 | |
Financial assets designated at fair value | | | 503 | | | | (0.1 | ) | | | 504 | |
of which loans and advances | | | — | | | | — | | | | — | |
Financial assets at amortized cost | | | 19,520 | | | | 9.7 | | | | 17,799 | |
of which loans and advances to customers | | | 18,257 | | | | 10.0 | | | | 16,598 | |
Inter-area positions | | | — | | | | — | | | | — | |
Tangible assets | | | 99 | | | | 150.5 | | | | 39 | |
Other assets | | | 247 | | | | (2.8 | ) | | | 254 | |
Total assets/liabilities and equity | | | 20,582 | | | | 9.3 | | | | 18,834 | |
Financial liabilities held for trading and designated at fair value through profit or loss | | | 42 | | | | 0.9 | | | | 42 | |
Deposits from central banks and credit institutions | | | 929 | | | | (26.9 | ) | | | 1,271 | |
Deposits from customers | | | 5,065 | | | | 3.9 | | | | 4,876 | |
Debt certificates | | | 197 | | | | (7.7 | ) | | | 213 | |
Inter-area positions | | | 13,220 | | | | 15.9 | | | | 11,406 | |
Other liabilities | | | 343 | | | | 26.9 | | | | 270 | |
Economic capital allocated | | | 786 | | | | 3.9 | | | | 757 | |
| | | | | | | | | | | | |
Relevant business indicators | | 31-03-19 | | | D % | | | 31-12-18 | |
Performing loans and advances to customers under management(1) | | | 18,218 | | | | 10.1 | | | | 16,553 | |
Non-performing loans | | | 430 | | | | (0.1 | ) | | | 430 | |
Customer deposits under management(1) | | | 5,065 | | | | 3.9 | | | | 4,876 | |
Off-balance sheet funds(2) | | | 407 | | | | 5.0 | | | | 388 | |
Risk-weighted assets | | | 16,004 | | | | 3.5 | | | | 15,464 | |
Efficiency ratio (%) | | | 67.3 | | | | | | | | 69.3 | |
NPL ratio (%) | | | 1.6 | | | | | | | | 1.7 | |
NPL coverage ratio (%) | | | 84 | | | | | | | | 83 | |
Cost of risk (%) | | | 0.24 | | | | | | | | (0.11 | ) |
| (2) | Includes mutual funds, pension funds and otheroff-balance sheet funds. |
Activity and results
The most relevant aspects of the activity and results of the area during the first quarter of 2019 were:
| | • | | Lending activity (performing loans under management) registered an increase of 10.0% in the first quarter of the year, and a growth of 20.3%year-on-year. |
| | • | | Credit riskindicators improved slightly in the first three months of the year: the NPL ratio closed at 1.6% (1.7% at the close of December 2018) and the NPL coverage ratio closed at 84% (83% as of December 31, 2019). |
| | • | | Compared to the previous quarter,customerdeposits under management increased by 3.9%, although they remained strongly influenced by the region’s negative interest rate environment and showed ayear-on-year decrease of 6.5%. |
| | • | | Regardingresults, gross income declined 17.8%year-on-year (down 19.3% Rest of Europe and down 7.1% in Asia), concentrated in Global Markets as a result of lower commercial activity. Operatingexpenses continued to fall due to the tight control of personnel and other administrative expenses. TheImpairment on financial assets registered an increase with respect to the same quarter of the previous year. The comparison is affected by the reversal of provisions in the first quarter of 2018 due to lower loan-loss provisions in Europe. As a result, the cumulativenet attributable profit for the first three months of 2019 stood at €16m (down 66.9%year-on-year). |
Corporate Center
TheCorporate Center contains the Group’s holding function, including: the costs of the head offices with a corporate function; management of structural exchange rate positions; some f equity instruments issuances to ensure an adequate management of the Group’s global solvency. It also includes portfolios whose management is not linked to customer relationships, such as industrial holdings; certain tax assets and liabilities; funds due to commitments to employees; goodwill and other intangible assets.
Financial statements
(Millions of euros and percentage)
| | | | | | | | | | | | |
Income statement | | 1Q19 | | | D % | | | 1Q18 | |
Net interest income | | | (71 | ) | | | 4.9 | | | | (67 | ) |
Net fees and commissions | | | (15 | ) | | | 104.9 | | | | (7 | ) |
Net trading income | | | (7 | ) | | | (70.2 | ) | | | (24 | ) |
Other operating income and expenses | | | (14 | ) | | | n.s. | | | | (3 | ) |
Gross income | | | (107 | ) | | | 5.1 | | | | (102 | ) |
Operating expenses | | | (239 | ) | | | 12.7 | | | | (212 | ) |
Personnel expenses | | | (133 | ) | | | 3.9 | | | | (128 | ) |
Other administrative expenses | | | (63 | ) | | | 122.1 | | | | (28 | ) |
Depreciation | | | (43 | ) | | | (22.5 | ) | | | (56 | ) |
Operating income | | | (346 | ) | | | 10.2 | | | | (314 | ) |
Impairment on financial assets not measured at fair value through profit or loss | | | (1 | ) | | | n.s. | | | | (0 | ) |
Provisions or reversal of provisions and other results | | | (23 | ) | | | (63.0 | ) | | | (62 | ) |
Profit/(loss) before tax | | | (370 | ) | | | (1.7 | ) | | | (376 | ) |
Income tax | | | 84 | | | | (11.3 | ) | | | 94 | |
Profit/(loss) after tax from ongoing operations | | | (286 | ) | | | 1.6 | | | | (282 | ) |
Results from corporate operations | | | — | | | | — | | | | — | |
Profit/(loss) for the year | | | (286 | ) | | | 1.6 | | | | (282 | ) |
Non-controlling interests | | | (0 | ) | | | (89.7 | ) | | | (0 | ) |
Net attributable profit | | | (286 | ) | | | 1.5 | | | | (282 | ) |
Net attributable profit excluding results from corporate operations | | | (286 | ) | | | 1.5 | | | | (282 | ) |
| | | |
Balance sheets | | 31-03-19 | | | D % | | | 31-12-18 | |
Cash, cash balances at central banks and other demand deposits | | | 745 | | | | 1.8 | | | | 732 | |
Financial assets designated at fair value | | | 2,732 | | | | (0.2 | ) | | | 2,738 | |
of which loans and advances | | | — | | | | — | | | | — | |
Financial assets at amortized cost | | | 2,293 | | | | (13.9 | ) | | | 2,665 | |
of which loans and advances to customers | | | 551 | | | | (44.3 | ) | | | 990 | |
Inter-area positions | | | (13,173 | ) | | | (6.1 | ) | | | (14,026 | ) |
Tangible assets | | | 2,254 | | | | 43.2 | | | | 1,573 | |
Other assets | | | 21,224 | | | | (6.1 | ) | | | 22,598 | |
Total assets/liabilities and equity | | | 16,075 | | | | (1.3 | ) | | | 16,281 | |
Financial liabilities held for trading and designated at fair value through profit or loss | | | 18 | | | | (53.0 | ) | | | 39 | |
Deposits from central banks and credit institutions | | | 740 | | | | 0.9 | | | | 733 | |
Deposits from customers | | | 280 | | | | n.s. | | | | 36 | |
Debt certificates | | | 8,521 | | | | 3.8 | | | | 8,212 | |
Inter-area positions | | | (25,746 | ) | | | 12.9 | | | | (22,808 | ) |
Other liabilities | | | 1,080 | | | | (45.3 | ) | | | 1,975 | |
Economic capital allocated | | | (22,159 | ) | | | 1.5 | | | | (21,833 | ) |
Shareholders’ funds | | | 53,341 | | | | 6.8 | | | | 49,927 | |
The Corporate Center registered a net attributableloss of €286m in the first quarter of 2019, compared with a loss of €282m (up 1.5%) in the same period of 2018.
Alternative Performance Measures (APMs)
BBVA presents its results in accordance with the International Financial Reporting Standards(EU-IFRS). However, it also considers that some Alternative Performance Measures (APMs) provide useful additional financial information that should be taken into account when evaluating performance. These APMs are also used when making financial, operational and planning decisions within the Entity. The Group firmly believes that they give a true and fair view of its financial information. These APMs are generally used in the financial sector as indicators for monitoring the assets, liabilities and economic and financial situation of entities.
BBVA Group’s APMs are given below. They are presented in accordance with the European Securities and Markets Authority (ESMA) guidelines, published on October 5, 2015 (ESMA/2015/1415en). These guidelines are aimed at promoting the usefulness and transparency of APMs included in prospectuses or regulated information in order to protect investors in the European Union. In accordance with the indications given in the guidelines, BBVA Group’s APMs:
| | • | | Include clear and readable definitions of the APMs (paragraphs21-25). |
| | • | | Disclose the reconciliations to the most directly reconcilable line item, subtotal or total presented in the financial statements of the corresponding period, separately identifying and explaining the material reconciling items (paragraphs26-32). |
| | • | | Are standard measures generally used in the financial industry, so their use provides comparability in the analysis of performance between issuers (paragraphs33-34). |
| | • | | Do not have greater preponderance than measures directly stemming from financial statements (paragraphs35-36). |
| | • | | Are accompanied by comparatives for previous periods (paragraphs37-40). |
| | • | | Are consistent over time (paragraphs41-44). |
Constant exchange rates
When comparing two dates or periods in this management report, the impact of changes in the exchange rates against the euro of the currencies of the countries in which BBVA operates is sometimes excluded, assuming that exchange rates remain constant. This is done for the amounts in the income statement by using the average exchange rate against the euro in the most recent period for each currency of the geographies where the Group operates, and applying it to both periods; for amounts in the balance sheet and activity, the closing exchange rates in the most recent period are used.
Book value per share
The book value per share determines the value of a company on its books for each share held. It is calculated as follows:
|
| Shareholders’ funds + Accumulated other comprehensive income |
| Number of shares outstanding – Treasury shares |
Explanation of the formula: The figures for both “shareholders’ funds” and “accumulated other comprehensive income” are taken from the balance sheet. Shareholders’ funds are adjusted to take into account the execution of the “dividend-option” at the closing dates on which it was agreed to deliver this type of dividend prior to the publication of the Group’s results. The denominator includes the final number of outstanding shares excluding own shares (treasury shares). The denominator is also adjusted to include the capital increase resulting from the execution of the “dividend options” explained above. Both the numerator and the denominator take into accountperiod-end balances.
Relevance of its use: It shows the company’s book value for each share issued. It is a generally used ratio, not only in the banking sector but also in others.
Book value per share
| | | | | | | | | | | | | | | | |
| | | | | | | 31-03-19 | | | 31-12-18 | | | 31-03-18 | |
Numerator (million euros) | | + | | Shareholders’ funds | | | 54,485 | | | | 54,326 | | | | 51,573 | |
| | + | | Dividend-option adjustment | | | — | | | | — | | | | — | |
| | + | | Accumulated other comprehensive income | | | (6,656 | ) | | | (7,215 | ) | | | (6,195 | ) |
Denominator | | + | | Number of shares outstanding | | | 6,668 | | | | 6,668 | | | | 6,668 | |
(million euros) | | + | | Dividend-option | | | — | | | | — | | | | — | |
| | - | | Treasury shares | | | 27 | | | | 47 | | | | 27 | |
= | | | | Book value per share (euros / share) | | | 7.20 | | | | 7.12 | | | | 6.83 | |
Tangible book value per share
The tangible book value per share determines the value of the company on its books for each share held by shareholders in the event of liquidation. It is calculated as follows:
Shareholders’ funds + Accumulated other comprehensive income – Intangible assets
Number of shares outstanding – Treasury shares
Explanation of the formula: The figures for “shareholders’ funds”, “accumulated other comprehensive income” and “intangible assets” are all taken from the balance sheet. Shareholders’ funds are adjusted to take into account the execution of the “dividend-option” at the closing dates on which it was agreed to deliver this type of dividend prior to the publication of the Group’s results. The denominator includes the final number of shares outstanding excluding own shares (treasury shares). The denominator is also adjusted to include the result of the capital increase resulting from the execution of the “dividend options” explained above. Both the numerator and the denominator take into accountperiod-end balances.
Relevance of its use: It shows the company’s book value for each share issued, after deducting intangible assets. It is a generally used ratio, not only in the banking sector but also in others.
Tangible book value per share
| | | | | | | | | | | | | | | | | | |
| | | | | | | | | 31-03-19 | | | 31-12-18 | | | 31-03-18 | |
| | | | + | | Shareholders’ funds | | | 54,485 | | | | 54,326 | | | | 51,573 | |
Numerator | | (million euros) | | + | | Dividend-option adjustment | | | — | | | | — | | | | — | |
| | | | + | | Accumulated other comprehensive income | | | (6,656 | ) | | | (7,215 | ) | | | (6,195 | ) |
| | | | - | | Intangible assets | | | 8,383 | | | | 8,314 | | | | 8,203 | |
| | | | + | | Number of shares outstanding | | | 6,668 | | | | 6,668 | | | | 6,668 | |
Denominator | | (million euros) | | + | | Dividend-option | | | — | | | | — | | | | — | |
| | | | - | | Treasury shares | | | 27 | | | | 47 | | | | 27 | |
= | | | | Tangible book value per share (euros / share) | | | 5.94 | | | | 5.86 | | | | 5.60 | |
Dividend yield
This is the remuneration given to the shareholders in the last twelve calendar months, divided by the closing price for the period. It is calculated as follows:
S Dividend per share over the last twelve months
Closing price
Explanation of the formula: The remuneration per share takes into account the gross amounts per share paid out over the last twelve months, both in cash and through the flexible remuneration system called “dividend option”.
Relevance of its use: This ratio is generally used by analysts, shareholders and investors for companies that are traded on the stock market. It compares the dividend paid out by a company every year with its market price at a specific date.
Dividend yield
| | | | | | | | | | | | | | |
| | | | | 31-03-19 | | | 31-12-18 | | | 31-03-18 | |
Numerator (euros) | | S Dividends | | | 0.25 | | | | 0.25 | | | | 0.22 | |
Denominator (euros) | | Closing price | | | 5.09 | | | | 4.64 | | | | 6.43 | |
= | | Dividend yield | | | 4.9 | % | | | 5.4 | % | | | 3.4 | % |
Non-performing loan (NPL) ratio
This is the ratio between the risks classified for accounting purposes asnon-performing loans and the total credit risk balance for customers and contingent risks. It is calculated as follows:
Non – performing loans
Total credit risk
Explanation of the formula:“Non-performing loans” include those related to loans and advances to customers (gross) and those related to contingent risk, excluding thenon-performing loans of credit institutions and securities. “Total credit risk” includes both pending and contingent risk. Their calculation is based on the headings in the first table on “Risk management” section of this report.
Relevance of its use: This is one of the main indicators used in the banking sector to monitor the current situation and changes in credit risk quality, and specifically the relationship between risks classified in the accounts asnon-performing loans and the total balance of credit risk, with respect to customers and contingent liabilities.
Non-Performing Loans (NPLs) ratio
| | | | | | | | | | | | | | | | |
| | | | | | | 31-03-19 | | | 31-12-18 | | | 31-03-18 | |
Numerator | | (million euros) | | NPLs | | | 17,297 | | | | 17,087 | | | | 19,516 | |
Denominator | | (million euros) | | Credit Risk | | | 439,152 | | | | 433,799 | | | | 442,446 | |
| | = | | Non-Performing Loans (NPLs) ratio | | | 3.9 | % | | | 3.9 | % | | | 4.4 | % |
NPL coverage ratio
This ratio reflects the degree to which the impairment ofnon-performing loans has been covered in the accounts via loan-loss provisions. It is calculated as follows:.
Provisions
Non – performing loans
Explanation of the formula:“Non-performing loans” include those related to lending activity and those related to contingent risk, excludingnon-performing loans from credit institutions and securities. “Provisions” are loan-loss provisions, for both customer loans and contingent risk. Their calculation is based on the headings in the first table on “Risk management” section of this report.
Relevance of its use: This is one of the main indicators used in the banking sector to monitor the situation and changes in the quality of credit risk, reflecting the degree to which the impairment ofnon-performing loans has been covered in the accounts via loan-loss provisions.
NPL coverage ratio
| | | | | | | | | | | | | | |
| | | | | 31-03-19 | | | 31-12-18 | | | 31-03-18 | |
Numerator (million euros) | | Provisions | | | 12,814 | | | | 12,493 | | | | 14,180 | |
Denominator (million euros) | | NPLs | | | 17,297 | | | | 17,087 | | | | 19,516 | |
= | | NPL coverage ratio | | | 74 | % | | | 73 | % | | | 73 | % |
Cost of risk
This ratio indicates the current situation and changes in credit-risk quality through the annual cost in terms of impairment losses (accounting loan-loss provisions, included in the “impairment on financial assets not measured at fair value through profit or loss” line) of each unit of loans and advances to customers (gross). It is calculated as follows:
Annualized loan – loss provisions
Average loans and advances to customers (gross)
Explanation of the formula: “Annualized loan-loss provisions” are calculated by accumulating and annualizing the loan-loss provisions of each month of the period under analysis, to standardize the comparison between different periods. For example, loan-loss provisions for six months (180 days)are divided by 180 to obtain daily loan-loss provisions and multiplied by 365 to obtain the annualized figure. This calculation uses the calendar days of the period under consideration.
“Loans and advances to customers (gross)” refers to the portfolio of financial assets at amortized cost of the Group’s consolidated balance sheet. The average of loans and advances to customers (gross) is calculated by using the average of theperiod-end balances of each month of the period analyzed plus the previous month.
Relevance of its use: This is one of the main indicators used in the banking sector to monitor the situation and changes in the quality of credit risk through the cost over the year.
Cost of risk
| | | | | | | | | | | | | | |
| | | | | 31-03-19 | | | 31-12-18 | | | 31-03-18 | |
Numerator (million euros) | | Annualized loan-loss provisions | | | 4,107 | | | | 3,964 | | | | 3,370 | |
Denominator (million euros) | | Average loans and advances to customers (gross) | | | 388,634 | | | | 392,037 | | | | 396,979 | |
= | | Cost of risk | | | 1.06 | % | | | 1.01 | % | | | 0.85 | % |
Efficiency ratio
This measures the percentage of gross income consumed by an entity’s operating expenses. It is calculated as follows:
Operating expenses
Gross income
Explanation of the formula: Both “operating expenses” and “gross income” are taken from the Group’s consolidated income statement. Operating expenses are the sum of the administration costs (personnel expenses plus other administrative expenses) plus depreciation. Gross income is the sum of net interest income, net fees and commissions, net trading income dividend income, share of profit or loss of entities accounted for using the equity method, and other operating income and expenses. For a more detailed calculation of this ratio, the graphs on “Results” section of this report should be consulted, one of them with calculations with figures at current exchange rates and another with the data at constant exchange rates.
Relevance of its use: This ratio is generally used in the banking sector. It is also a ratio linked to one of the Group’s six Strategic Priorities.
Efficiency ratio
| | | | | | | | | | | | | | |
| | | | | Jan.-Mar.2019 | | | Jan.-Dec.2018 | | | Jan.-Mar.2018 | |
Numerator (million euros) | | Operating expenses | | | (2,922 | ) | | | (11,702 | ) | | | (2,975 | ) |
Denominator (million euros) | | Gross income | | | 6,069 | | | | 23,747 | | | | 6,026 | |
= | | Efficiency ratio | | | 48.1 | % | | | 49.3 | % | | | 49.4 | % |
ROE
The ROE (return on equity) ratio measures the return obtained on an entity’s shareholders’ funds plus accumulated other comprehensive income. It is calculated as follows:
Annualized net attributable profit
Average shareholders’ funds + Average accumulated other comprehensive income
Explanation of the formula: “Annualized net attributable profit” is taken directly from the Group’s consolidated income statement. If the metric is presented on a date before the close of the fiscal year, the numerator must be annualized. If extraordinary items (results from corporate operations) are included in the net attributable profit for the months covered, they are eliminated from the figure before it is annualized, and then added to the metric once it has been annualized.
“Average shareholders’ funds” are the weighted moving average of the shareholders’ funds at the end of each month of the period analyzed, adjusted to take into account the execution of the “dividend-option” at the closing dates on which it was agreed to deliver this type of dividend prior to the publication of the Group’s results.
“Average accumulated other comprehensive income” is the moving weighted average of accumulated other comprehensive income, which is part of the equity on the Entity’s balance sheet and is calculated in the same way as average shareholders’ funds (above).
Relevance of its use: This ratio is very commonly used not only in the banking sector but also in other sectors to measure the return obtained on shareholders’ funds.
ROE
| | | | | | | | | | | | | | | | |
| | | | | | | Jan.-Mar.2019 | | | Jan.-Dec.2018 | | | Jan.-Mar.2018 | |
Numerator (million euros) | | | | Annualized net attributable profit | | | 4,720 | | | | 5,324 | | | | 5,233 | |
| | + | | Average shareholder’s funds | | | 54,793 | | | | 52,877 | | | | 52,057 | |
Denominator (million euros) | | + | | Average accumulated other comprehensive income | | | (6,921 | ) | | | (6,743 | ) | | | (6,374 | ) |
= | | | | ROE | | | 9.9 | % | | | 11.5 | % | | | 11.5 | % |
ROTE
The ROTE (return on tangible equity) ratio measures the return on an entity’s shareholders’ funds, plus accumulated other comprehensive income, and excluding intangible assets. It is calculated as follows:
Annualized net attributable profit
Average shareholders’ funds + Average accumulated other comprehensive income – Average intangible assets
Explanation of the formula: The numerator (annualized net attributable profit) and the items in the denominator “average intangible assets” and “average accumulated other comprehensive income” are the same items and are calculated in the same way as explained for ROE.
“Average intangible assets” are the intangible assets on the balance sheet, including goodwill and other intangible assets. The average balance is calculated in the same way as explained for shareholders’ funds in ROE.
Relevance of its use: This metric is generally used not only in the banking sector but also in other sectors to measure the return obtained on shareholders’ funds, not including intangible assets.
ROTE
| | | | | | | | | | | | | | | | |
| | | | | | | Jan.-Mar.2019 | | | Jan.-Dec.2018 | | | Jan.-Mar.2018 | |
Numerator (million euros) | | | | Annualized net attributable profit | | | 4,720 | | | | 5,324 | | | | 5,233 | |
| | + | | Average shareholder’s funds | | | 54,793 | | | | 52,877 | | | | 52,057 | |
Denominator (million euros) | | + | | Average accumulated other comprehensive income | | | (6,921 | ) | | | (6,743 | ) | | | (6,374 | ) |
| | - | | Average intangible assets | | | 8,322 | | | | 8,296 | | | | 8,281 | |
= | | | | ROTE | | | 11.9 | % | | | 14.1 | % | | | 14.0 | % |
ROA
The ROA (return on assets) ratio measures the return obtained on an entity’s assets. It is calculated as follows:
Annualized profit for the year
Average total assets
Explanation of the formula: “Annualized profit for the year” is taken directly from the Group’s consolidated income statement. If the metric is presented on a date before the close of the fiscal year, the numerator must be annualized. If extraordinary items (results from corporate operations) are included in the net attributable profit for the months covered, they are eliminated from the figure before it is annualized and then added to the metric once it has been annualized.
“Average total assets” are taken from the Group’s consolidated balance sheet. The average balance is calculated in the same way as explained for shareholders’ funds in ROE.
Relevance of its use: This ratio is generally used not only in the banking sector but also in other sectors to measure the return obtained on assets.
ROA
| | | | | | | | | | | | | | |
| | | | | Jan.-Mar.2019 | | | Jan.-Dec.2018 | | | Jan.-Mar.2018 | |
Numerator (million euros) | | Annualized profit for the year | | | 5,669 | | | | 6,151 | | | | 6,298 | |
Denominator (million euros) | | Average total assets | | | 676,423 | | | | 678,998 | | | | 679,759 | |
= | | ROA | | | 0.84 | % | | | 0.91 | % | | | 0.93 | % |
RORWA
The RORWA (return on risk-weighted assets) ratio measures the accounting return obtained on average risk-weighted assets. It is calculated as follows:
Annualized profit for the year
Average risk – weighted assets
Explanation of the formula: “Annualized profit for the year” is the same figure as explained for ROA.
“Average risk-weighted assets”(RWA) is the moving weighted average of the risk-weighted assets at the end of each month of the period under analysis and is calculated in the same way as explained for shareholders’ funds in ROERelevance of its use: This ratio is generally used in the banking sector to measure the return obtained on RWA.
RORWA
| | | | | | | | | | | | | | |
| | | | | Jan.-Mar.2019 | | | Jan.-Dec.2018 | | | Jan.-Mar.2018 | |
Numerator (million euros) | | Annualized profit for the year | | | 5,669 | | | | 6,151 | | | | 6,298 | |
Denominator (million euros) | | Average RWA | | | 355,139 | | | | 353,204 | | | | 360,028 | |
= | | RORWA | | | 1.60 | % | | | 1.74 | % | | | 1.75 | % |
Other customer funds
This includesoff-balance sheet funds, these are, mutual funds, pension funds and otheroff-balance sheet funds.
Explanation of the formula: It is theperiod-end sum on a given date of the mutual funds, pension funds and otheroff-balance sheet funds; as displayed in the table on “Balance sheet and business activity” section of this report.
Relevance of its use: This metric is generally used in the banking sector, as apart fromon-balance sheet funds, financial institutions manage other types of customer funds, such as mutual funds, pension funds, otheroff-balance sheet funds, etc.
Other customer funds
| | | | | | | | | | | | | | | | | | |
Million euros | | | | | | | | 31-03-19 | | | 31-12-18 | | | 31-03-18 | |
| | | | + | | Mutual funds | | | 64,928 | | | | 61,393 | | | | 62,819 | |
| | | | + | | Pension Funds | | | 35,071 | | | | 33,807 | | | | 33,604 | |
| | | | + | | Otheroff-balance sheet funds | | | 3,228 | | | | 2,949 | | | | 2,477 | |
| | = | | | | Other customer funds | | | 103,227 | | | | 98,150 | | | | 98,900 | |
SIGNATURE
Pursuant to the requirements of the Securities Exchange Act of 1934, the registrant has duly caused this report to be signed on its behalf by the undersigned, thereunto duly authorized.
| | | | | | |
| | | | Banco Bilbao Vizcaya Argentaria, S.A. |
| | | |
| Date: April 29, 2019 | | | | By: | | /s/ María Angeles Peláez Morón |
| | | | Name: María Angeles Peláez Morón |
| | |
| | | | Title: Authorized representative |