Table of Contents
UNITED STATES
SECURITIES AND EXCHANGE COMMISSION
WASHINGTON, D.C. 20549
FORM6-K
REPORT OF FOREIGN ISSUER
PURSUANT TO RULE13a-16 OR15d-16
UNDER THE SECURITIES EXCHANGE ACT OF 1934
For the month of October, 2019
Commission file number:1-10110
BANCO BILBAO VIZCAYA ARGENTARIA, S.A.
(Exact name of Registrant as specified in its charter)
BANK BILBAO VIZCAYA ARGENTARIA, S.A.
(Translation of Registrant’s name into English)
Calle Azul 4,
28050 Madrid
Spain
(Address of principal executive offices)
Indicate by check mark whether the registrant files or will file annual reports under cover of Form20-F or Form40-F:
Form20-F ☒ Form40-F ☐
Indicate by check mark if the registrant is submitting the Form6-K in paper as permitted by RegulationS-T Rule 101(b)(1):
Yes ☐ No ☒
Indicate by check mark if the registrant is submitting the Form6-K in paper as permitted by RegulationS-T Rule 101(b)(7):
Yes ☐ No ☒
Table of Contents

Table of Contents
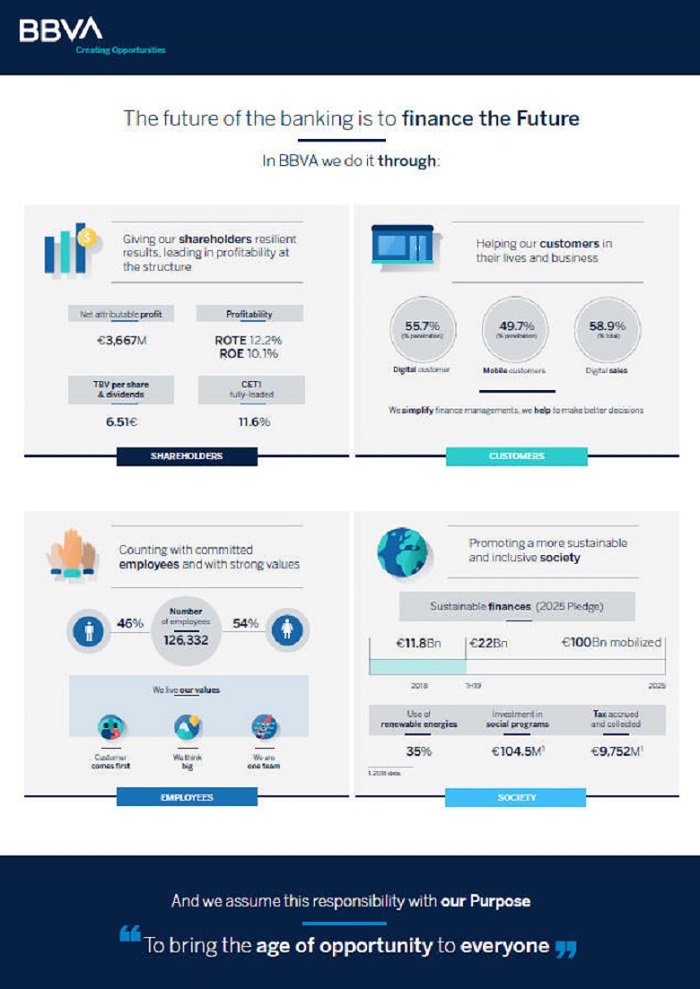
Table of Contents
| 2 | ||||
| 3 | ||||
| 5 | ||||
| 5 | ||||
| 8 | ||||
| 14 | ||||
| 16 | ||||
| 18 | ||||
| 22 | ||||
| 25 | ||||
| 27 | ||||
| 30 | ||||
| 33 | ||||
| 36 | ||||
| 39 | ||||
| 42 | ||||
| 46 | ||||
| 48 | ||||
| 50 | ||||
Table of Contents
 | 2 |
BBVA GROUP HIGHLIGHTS(CONSOLIDATED FIGURES)
| 30-09-19 | D % | 30-09-18 | 31-12-18 | |||||||||||||
Balance sheet (millions of euros) | ||||||||||||||||
Total assets | 709,017 | 6.0 | 668,985 | 676,689 | ||||||||||||
Loans and advances to customers (gross) | 391,273 | 2.1 | 383,111 | 386,225 | ||||||||||||
Deposits from customers | 379,333 | 3.7 | 365,687 | 375,970 | ||||||||||||
Total customer funds | 485,159 | 4.0 | 466,683 | 474,120 | ||||||||||||
Total equity | 57,029 | 11.6 | 51,097 | 52,874 | ||||||||||||
Income statement (millions of euros) | ||||||||||||||||
Net interest income | 13,475 | 4.5 | 12,899 | 17,591 | ||||||||||||
Gross income | 18,124 | 3.0 | 17,596 | 23,747 | ||||||||||||
Operating income | 9,304 | 4.8 | 8,875 | 12,045 | ||||||||||||
Net attributable profit | 3,667 | (15.2 | ) | 4,323 | 5,324 | |||||||||||
The BBVA share and share performance ratios | ||||||||||||||||
Number of shares (million) | 6,668 | — | 6,668 | 6,668 | ||||||||||||
Share price (euros) | 4.78 | (12.9 | ) | 5.49 | 4.64 | |||||||||||
Earning per share (euros)(1) | 0.51 | (17.8 | ) | 0.62 | 0.76 | |||||||||||
Book value per share (euros) | 7.63 | 9.9 | 6.94 | 7.12 | ||||||||||||
Tangible book value per share (euros) | 6.35 | 11.4 | 5.70 | 5.86 | ||||||||||||
Market capitalization (millions of euros) | 31,876 | (12.9 | ) | 36,607 | 30,909 | |||||||||||
Yield (dividend/price; %) | 5.4 | 4.4 | 5.4 | |||||||||||||
Significant ratios (%) | ||||||||||||||||
ROE (net attributable profit/average shareholders’ funds +/- average accumulated other comprehensive income)(2) | 10.1 | 12.1 | 11.5 | |||||||||||||
ROTE (net attributable profit/average shareholders’ funds excluding average intangible assets +/- average accumulated other comprehensive income)(2) | 12.2 | 14.8 | 14.1 | |||||||||||||
ROA (Profit or loss for the year/average total assets) | 0.84 | 0.95 | 0.91 | |||||||||||||
RORWA (Profit or loss for the year/average risk-weighted assets - RWA) | 1.60 | 1.82 | 1.74 | |||||||||||||
Efficiency ratio | 48.7 | 49.6 | 49.3 | |||||||||||||
Cost of risk | 1.01 | 0.90 | 1.01 | |||||||||||||
NPL ratio | 3.9 | 4.1 | 3.9 | |||||||||||||
NPL coverage ratio | 75 | 73 | 73 | |||||||||||||
Capital adequacy ratios (%) | ||||||||||||||||
CET1 fully-loaded | 11.6 | 11.3 | 11.3 | |||||||||||||
CET1phased-in(3) | 11.8 | 11.6 | 11.6 | |||||||||||||
Total ratiophased-in(3) | 16.2 | 15.9 | 15.7 | |||||||||||||
Other information | ||||||||||||||||
Number of clients (million) | 77.3 | 3.3 | 74.8 | 74.8 | ||||||||||||
Number of shareholders | 884,412 | (1.3 | ) | 895,809 | 902,708 | |||||||||||
Number of employees | 126,332 | (0.0 | ) | 126,357 | 125,627 | |||||||||||
Number of branches | 7,798 | (2.5 | ) | 7,999 | 7,963 | |||||||||||
Number of ATMs | 32,830 | 2.6 | 31,999 | 32,635 | ||||||||||||
| (1) | Adjusted by additional Tier 1 instrument remuneration. |
| (2) | The ROE and ROTE ratios include, in the denominator, the Group’s average shareholders’ funds and take into account the item called “Accumulated other comprehensive income”, which forms part of the equity. Excluding this item, the ROE would stand at 8.8%, in January-September of 2019; 10.1%, in 2018; and 10.6%, in January-September of 2018; and the ROTE at 10.4%, 11.9% and 12.6%, respectively. |
| (3) | As of September 30, 2019,phased-in ratios include the temporary treatment on the impact of IFRS 9, calculated in accordance with Article 473 bis of the Capital Requirements Regulation (CRR). |
Table of Contents
| 3 |
Results
| • | In the January–September period of 2019, the overall growth inrecurring revenue items is maintained, with a positive evolution in terms of net interest income in most business areas. |
| • | The trend of containingoperating expenses continued, improving the efficiency ratio compared to the same period of the previous year. |
| • | As a result of the above,operating income increased 4.8%year-on-year. |
| • | Impairment on financial assets increased by 12.7%year-on-year, mainly as a result of the higher loan-loss provisions in the United States. |
| • | Finally, net attributable profit stood at €3,667m, a 15.2% lower than in the January–September period of 2018. Excluding the corporate operations from the 2018 comparison, the net attributable profit closed in line with the same period of the previous year. |
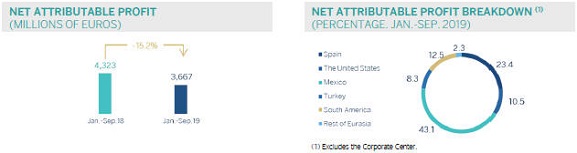
NET ATTRIBUTABLE PROFIT (MILLIONS OF EUROS) NET ATTRIBUTABLE PROFIT BREAKDOWN (1) (PERCENTAGE. JAN.-SEP. 2019) (1) Excludes the Corporate Center.
Balance sheet and business activity
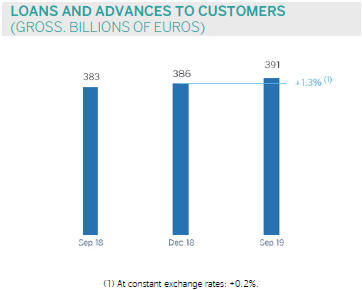
| • | As of September 30, 2019,loans and advances to customers (gross) grew by 1.3% compared to December 31, 2018, with improved levels in the business areas of Mexico and, to a lesser extent, South America and Rest of Eurasia. |
| • | Strong performance ofcustomer funds (up 2.3% compared to December 31, 2018) thanks to the positive evolution in demand deposits, mutual funds and pension funds. |
Solvency
| • | Thefully loaded CET1 ratio stood at 11.6% as of September 30, 2019, up 22 basis points in the first nine months of the year, due to recurring organic capital generation. Thus, this ratio is positioned within the range of this capital target defined for the Group. |
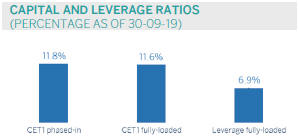
CAPITAL AND LEVERAGE RATIOS (PERCENTAGE AS OF 30-09-19)
Table of Contents
| 4 |
Risk management
| • | Positive performance of therisk metrics.Non-performing loans remained flat from January to September 2019. The NPL ratio stood at 3.9%, the NPL coverage ratio was 75% and the cost of risk 1.01%, all figures as of September 30, 2019. |
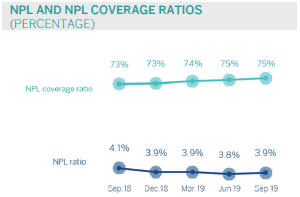
NPL AND NPL COVERAGE RATIOS (PERCENTAGE)
Transformation
| • | The unification of the BBVAbrand in all the countries in which BBVA operates, announced in June 2019, is now a visible reality in most of the Group’s digital and physical environments. |
| • | The Group’sdigital and mobile customerbase continues to grow, as well as itsdigital sales. |

DIGITAL AND MOBILE CUSTOMERS (MILLIONS)
Dividends
| • | On October 15, there was a gross cash payment of €0.10 per share, corresponding to the dividend for 2019 that was approved at the Board of Directors Meeting held on October 2. |
Other matters of interest
| • | On August 7, 2019, BBVA reached an agreement with Banco GNB Paraguay S.A., for the sale of its shareholding, direct and indirect, in Banco Bilbao Vizcaya Argentaria Paraguay, S.A. (BBVA Paraguay), which amounts to 100% of its share capital. As a result of the above, all items in BBVA Paraguay’s balance sheet have been reclassified into the category of‘Non-current assets (liabilities) and disposal groups held for sale’ (hereinafter NCA&L). |
| • | On January 1, 2019,IFRS 16 ‘Leases’ entered into force, which requires the lessee to recognize the assets and liabilities arising from the rights and obligations of lease agreements. The main impacts are the recognition of an asset through the right of use and a liability based on future payment obligations. The impact of the first implementation was €3,419m and €3,472m, respectively, resulting in a decrease of 11 basis points of the CET1 capital ratio. |
| • | In order to ensure that the information for 2019 is comparable to that of 2018, the balance sheets, income statements and ratios of the first three quarters of 2018 financial year for the Group and the South America business area have been restated to reflect the impact of the hyperinflation in Argentina as a result of the application ofIAS 29 “Financial Reporting in Hyperinflationary Economies”. This impact was first registered in the third quarter of 2018, but with accounting effects as of January 1, 2018. |
Table of Contents
| 5 |
Global growth continued to slow to rates slightly below 3.0% in annual terms in recent quarters, significantly below the 3.7% expansion registered in 2018. Growing trade protectionism and high uncertainty are having a negative impact on economic activity, mainly on exports and investment, adding to the cyclical moderation of the U.S. and eurozone economies. The announced countercyclical policies, led by central banks, will not be able to fully compensate for the impact of multiple sources of uncertainty. Thus, world growth forecasts stand at around 3.2% in 2019.
In terms of monetary policy, the main central banks have announced further relaxation measures in recent months. In the United States, the Federal Reserve (Fed) cut interest rates by 50 basis points between July and September to 2% and left the door open for new cuts if necessary. In the eurozone, the European Central Bank (ECB) announced in September a package of monetary measures to support the economy and the financial system, including: (i) a deposit facility interest rate cut of 10 basis points, leaving them at-0.50%; (ii) the adoption of a phased interest rate system for such deposit facility (tiering of deposit system); (iii) a new debt purchase program of €20,000m per month; and (iv) an improvement in financing conditions for banks in the ECB’s liquidity auctions. In China, in addition to fiscal stimulus decisions and exchange rate depreciation, a cut in reserve requirements for banks was recently announced and official or monetary interest rates have been reduced. Accordingly,interest rates will remain low in major economies, enabling more flexibility to emerging countries for maneuver.
Spain
The latest data confirms that GDP continues to grow at a faster pace than in the rest of the eurozone, but has slowed to 0.4% quarterly in the second quarter from an average growth of around 0.7% since 2014. This shows a moderation in domestic demand, in both private consumption and investment, as well as some fading out of some stimulus and the negative impact of uncertainty.
With regard to the banking system, both the deleveraging of the system and the improvement in asset quality indicators continue (the NPL ratio stood at 5.2% in July 2019). Profitability remained under pressure (ROE of 4.8% in the first half of 2019) due to low interest rates and lower business volumes. Spanish banks maintain comfortable levels of capital adequacy and liquidity.
The United States
In the second quarter of 2019, growth decreased to 2% in annualized quarterly rates from 3.1% in the first quarter; a gradual moderation is expected for the rest of the year. The strength of consumption continues to contrast with weak investment, negatively affected by political uncertainty and lower global growth, coupled with unfavorable performance of net exports and inventories. In the absence of inflationary pressures, the Fed may lower interest rates further, which would be in addition to the cuts made between July and August 2019, which would be a factor that could contribute to prevent further slowdown in the face of rising uncertainty and the extension of still-unresolved trade disputes.
The most recent banking activity data (August 2019) shows that loans and deposits in the system grew at rates of 5.4% and 4.0%, respectively. NPLs continued to decrease, with thenon-performing loan ratio stood at 1.45% in the second quarter of 2019.
Mexico
The economy stagnated in the first half of the year and there are no signs of recovery in the short term, especially in terms of investment. There are a number of factors behind this behavior: the delay in the ratification of the new trade agreement with the United States and Canada, the continued uncertainty due to external and internal factors, the deceleration of the manufacturing sector in the United States, as well as the slowdown in employment and private consumption. In this context, inflation moderated significantly frommid-year to 3% in September, which led the central bank to initiate the cycle of interest rate decreases, with two 25 basis points cuts in August and September to 7.75%. There are likely to be further cuts in the future to alleviate the slowdown in growth and the persisting uncertainty.
The banking system continues to growyear-on-year terms. According to data from August 2019, loans and deposits grew by 7.9% and 7.3% respectively, with increases in all portfolios.Non-performing loans remained under control (NPL ratio of 3.2%, compared to 3.3% twelve months earlier) and capital indicators remain at comfortable levels.
Table of Contents
| 6 |
Turkey
The Turkish economy technically moved out of recession in the first quarter of 2019, growing at a quarterly rate of 1.6% and the recovery continued in the second quarter with growth of 1.2%. The correction of domestic demand seems to be coming to an end, although going forward the strong contribution from foreign demand is likely to moderate. The economy is expected to grow by 0.3% in 2019. The slowdown in inflation continued in recent months, dropping to below 10% in September. In this context, the central bank cut the interest rate by 425 basis points in July and another 325 basis points in September to 16.5%.
As of August 2019, total loan volumes in the system decreased 6.1%year-on-year (up 0.6% in local currency and down 14.6% in foreign currency) while the system’s NPL ratio stood at 4.6%.
Argentina
Following the outcome of the primary elections inmid-August, capital outflows led to sharp exchange rate depreciation, a situation that the government attempted to alleviate with highly restrictive monetary policy and with capital control measures. All this resulted in a sharp rise in inflation, a fall in real wages and hence in consumption and investment. The external sector will be the sole support for the activity, prompted by the depreciation impact on exports along with a considerable adjustment of imports. Moving forward, there is uncertainty about the measures and policies that will be implemented after the elections to combat the crisis.
In the financial system, loans and deposits grew at high rates, albeit with the notable influence of high inflation. Profitability indicators are very high (ROE: 41.1% and ROA: 4.5% in July 2019) whilenon-performing loans increased to show a NPL ratio of 4.7% in July 2019.
Colombia
The economy continues to recover, with average annual growth of about 3.0% in the first two quarters of the year, after growing 2.6% in all 2018. Recovery is still driven by consumption, whilenon-construction investment is being consolidated. Moving forward, some moderation of private consumption is expected in light of the deterioration of the labor market and weakened confidence, although this will be partly offset by higher expenditure linked to the increase in immigration, while investment in construction should begin to show signs of recovery. However, growth is expected to remain relatively stable at about 3% in the coming quarters. Colombia’s monetary authority maintained the benchmark rate at 4.25% during the quarter.
The total loans system grew by 7.7%year-on-year in July 2019, with a NPL ratio of 4.7%. Total deposits increased by 6.9%year-on-year in the same period.
Peru
Activity continued to slow in the second quarter of the year, reflected in an average annual growth of under 2% in the first half of the year from rates of around 4% in 2018. This weak growth responds to the unfavorable performance of primary activities, which remains negative due to temporary factors. The latest indicators suggest that annual growth could rise slightly above 3% on average in the second half of the year. However, the risk remains that the recent increase in political uncertainty will end up weighing on confidence in the coming quarters. In this context, with inflation below the target of 2%, the central bank lowered the interest rate by 25 basis points to 2.5% in August and, despite not having made any changes in the last months, the possibility of an additional decrease in the future remains.
The banking system is showing moderateyear-on-year growth rates in loans and deposits (up 7.1% and up 9.5% respectively in July 2019), with reasonably high levels of profitability (ROE: 18.8%) and containednon-performing loans (NPL ratio: 2.6%).
Table of Contents
| 7 |
INTEREST RATES(PERCENTAGE)
| 30-09-19 | 30-06-19 | 31-03-19 | 31-12-18 | 30-09-18 | 30-06-18 | 31-03-18 | ||||||||||||||||||||||
Official ECB rate | 0.00 | 0.00 | 0.00 | 0.00 | 0.00 | 0.00 | 0.00 | |||||||||||||||||||||
Euribor 3 months(1) | (0.42 | ) | (0.33 | ) | (0.31 | ) | (0.31 | ) | (0.32 | ) | (0.32 | ) | (0.33 | ) | ||||||||||||||
Euribor 1 year(1) | (0.34 | ) | (0.19 | ) | (0.11 | ) | (0.13 | ) | (0.17 | ) | (0.18 | ) | (0.19 | ) | ||||||||||||||
USA Federal rates | 1.90 | 2.40 | 2.43 | 2.40 | 2.18 | 1.91 | 1.67 | |||||||||||||||||||||
TIIE (Mexico)(1) | 8.20 | 8.51 | 8.52 | 8.41 | 8.11 | 7.93 | 7.83 | |||||||||||||||||||||
CBRT (Turkey) | 16.31 | 23.86 | 25.50 | 24.06 | 24.01 | 17.77 | 12.75 | |||||||||||||||||||||
| (1) | Calculated as the month average. |
EXCHANGE RATES(EXPRESSED IN CURRENCY/EURO)
| Year-end exchange rates | Average exchange rates | |||||||||||||||||||
| 30-09-19 | D % on 30-09-18 | D % on 31-12-18 | Jan.-Sep. 19 | D % on Jan.-Sep. 18 | ||||||||||||||||
Mexican peso | 21.4522 | 1.5 | 4.8 | 21.6315 | 5.1 | |||||||||||||||
U.S. dollar | 1.0889 | 6.3 | 5.2 | 1.1236 | 6.3 | |||||||||||||||
Argentine peso | 62.4130 | (26.7 | ) | (30.6 | ) | 62.4130 | (26.7 | ) | ||||||||||||
Chilean peso | 790.19 | (3.1 | ) | 0.7 | 770.44 | (2.6 | ) | |||||||||||||
Colombian peso | 3,769.78 | (8.2 | ) | (0.6 | ) | 3,639.63 | (5.3 | ) | ||||||||||||
Peruvian sol | 3.6805 | 3.6 | 4.9 | 3.7378 | 4.2 | |||||||||||||||
Turkish lira | 6.1491 | 13.3 | (1.5 | ) | 6.3401 | (13.1 | ) | |||||||||||||
Table of Contents
| 8 |
The BBVA Group generated a net attributableprofitof €3,667m during the first nine months of 2019. This figure is 15.2% lower compared to the same period of the previous year (down 15.6% at constant exchange rates), which included the result of corporate operations generated by the capital gains (net of taxes) from the sale of BBVA Chile. Excluding the corporate operations from the 2018 comparison, the net attributable profit closed in line with the same period of the previous year (down 0.6% at current exchange rates, down 1.2% at constant exchange rates). In the third quarter of 2019, net attributable profit increased by 0.5% at constant exchange rates compared to the second quarter of the year (down 4.2% at current exchange rates). The good performance of net fees and commissions and, primarily, the strong performance of net trading income (NTI) in the quarter explain this increase.
CONSOLIDATED INCOME STATEMENT: QUARTERLY EVOLUTION(MILLIONS OF EUROS)
| 2019 | 2018 | |||||||||||||||||||||||||||
| 3Q | 2Q | 1Q | 4Q | 3Q | 2Q | 1Q | ||||||||||||||||||||||
Net interest income | 4,488 | 4,566 | 4,420 | 4,692 | 4,309 | 4,302 | 4,287 | |||||||||||||||||||||
Net fees and commissions | 1,273 | 1,256 | 1,214 | 1,226 | 1,173 | 1,244 | 1,236 | |||||||||||||||||||||
Net trading income | 351 | 116 | 426 | 316 | 212 | 285 | 410 | |||||||||||||||||||||
Other operating income and expenses | 22 | (18 | ) | 8 | (83 | ) | 38 | 6 | 92 | |||||||||||||||||||
Gross income | 6,135 | 5,920 | 6,069 | 6,151 | 5,733 | 5,838 | 6,026 | |||||||||||||||||||||
Operating expenses | (2,946 | ) | (2,952 | ) | (2,922 | ) | (2,981 | ) | (2,825 | ) | (2,921 | ) | (2,975 | ) | ||||||||||||||
Personnel expenses | (1,572 | ) | (1,578 | ) | (1,553 | ) | (1,557 | ) | (1,459 | ) | (1,539 | ) | (1,565 | ) | ||||||||||||||
Other administrative expenses | (971 | ) | (976 | ) | (977 | ) | (1,119 | ) | (1,062 | ) | (1,087 | ) | (1,106 | ) | ||||||||||||||
Depreciation | (403 | ) | (398 | ) | (392 | ) | (305 | ) | (304 | ) | (295 | ) | (304 | ) | ||||||||||||||
Operating income | 3,189 | 2,968 | 3,147 | 3,170 | 2,908 | 2,917 | 3,050 | |||||||||||||||||||||
Impairment on financial assets not measured at fair value through profit or loss | (1,187 | ) | (753 | ) | (1,023 | ) | (1,353 | ) | (1,023 | ) | (783 | ) | (823 | ) | ||||||||||||||
Provisions or reversal of provisions | (113 | ) | (117 | ) | (144 | ) | (66 | ) | (123 | ) | (85 | ) | (99 | ) | ||||||||||||||
Other gains (losses) | (4 | ) | (3 | ) | (22 | ) | (183 | ) | (36 | ) | 67 | 41 | ||||||||||||||||
Profit/(loss) before tax | 1,886 | 2,095 | 1,957 | 1,568 | 1,727 | 2,116 | 2,170 | |||||||||||||||||||||
Income tax | (488 | ) | (577 | ) | (559 | ) | (421 | ) | (419 | ) | (605 | ) | (617 | ) | ||||||||||||||
Profit/(loss) after tax from ongoing operations | 1,398 | 1,519 | 1,398 | 1,147 | 1,307 | 1,511 | 1,553 | |||||||||||||||||||||
Results from corporate operations(1) | — | — | — | — | 633 | — | — | |||||||||||||||||||||
Profit/(loss) for the year | 1,398 | 1,519 | 1,398 | 1,147 | 1,941 | 1,511 | 1,553 | |||||||||||||||||||||
Non-controlling interests | (173 | ) | (241 | ) | (234 | ) | (145 | ) | (154 | ) | (265 | ) | (262 | ) | ||||||||||||||
Net attributable profit | 1,225 | 1,278 | 1,164 | 1,001 | 1,787 | 1,245 | 1,290 | |||||||||||||||||||||
Net attributable profit excluding results from corporate operations | 1,225 | 1,278 | 1,164 | 1,001 | 1,154 | 1,245 | 1,290 | |||||||||||||||||||||
Earning per share (euros)(2) | 0.17 | 0.17 | 0.16 | 0.14 | 0.26 | 0.17 | 0.18 | |||||||||||||||||||||
General note: the application of accounting for hyperinflation in Argentina was performed for the first time in September 2018 with accounting effects on January 1, 2018, recording the impact of the 9 months in the third quarter. In order to make the 2019 information comparable to the 2018, the income statements for the first three quarters of 2018 have been reexpressed to reflect the impacts of inflation on their income and expenses.
| (1) | Includes net capital gains from the sale of BBVA Chile. |
| (2) | Adjusted by additional Tier 1 instrument remuneration. |
Table of Contents
| 9 |
CONSOLIDATED INCOME STATEMENT(MILLIONS OF EUROS)
| Jan.-Sep. 19 | D % | D % at constant exchange rates | Jan.-Sep. 18 | |||||||||||||
Net interest income | 13,475 | 4.5 | 5.2 | 12,899 | ||||||||||||
Net fees and commissions | 3,743 | 2.4 | 2.9 | 3,653 | ||||||||||||
Net trading income | 893 | (1.5 | ) | (0.3 | ) | 907 | ||||||||||
Other operating income and expenses | 13 | (90.8 | ) | (90.3 | ) | 136 | ||||||||||
Gross income | 18,124 | 3.0 | 3.8 | 17,596 | ||||||||||||
Operating expenses | (8,820 | ) | 1.1 | 1.4 | (8,721 | ) | ||||||||||
Personnel expenses | (4,703 | ) | 3.1 | 3.5 | (4,563 | ) | ||||||||||
Other administrative expenses | (2,924 | ) | (10.2 | ) | (9.9 | ) | (3,255 | ) | ||||||||
Depreciation | (1,193 | ) | 32.1 | 31.9 | (903 | ) | ||||||||||
Operating income | 9,304 | 4.8 | 6.1 | 8,875 | ||||||||||||
Impairment on financial assets not measured at fair value through profit or loss | (2,964 | ) | 12.7 | 14.5 | (2,629 | ) | ||||||||||
Provisions or reversal of provisions | (373 | ) | 21.7 | 24.3 | (307 | ) | ||||||||||
Other gains (losses) | (29 | ) | n.s. | n.s. | 73 | |||||||||||
Profit/(loss) before tax | 5,938 | (1.2 | ) | (0.3 | ) | 6,012 | ||||||||||
Income tax | (1,623 | ) | (1.1 | ) | (0.9 | ) | (1,641 | ) | ||||||||
Profit/(loss) after tax from ongoing operations | 4,315 | (1.3 | ) | (0.0 | ) | 4,371 | ||||||||||
Results from corporate operations(1) | — | — | — | 633 | ||||||||||||
Profit/(loss) for the year | 4,315 | (13.8 | ) | (12.8 | ) | 5,004 | ||||||||||
Non-controlling interests | (648 | ) | (5.0 | ) | 7.1 | (682 | ) | |||||||||
Net attributable profit | 3,667 | (15.2 | ) | (15.6 | ) | 4,323 | ||||||||||
Net attributable profit excluding results from corporate operations | 3,667 | (0.6 | ) | (1.2 | ) | 3,689 | ||||||||||
Earning per share (euros)(2) | 0.51 | 0.62 | ||||||||||||||
| (1) | Includes net capital gains from the sale of BBVA Chile. |
| (2) | Adjusted by additional Tier 1 instrument remuneration. |
Unless expressly indicated otherwise, to better understand the changes in the main headings of the Group’s income statement, theyear-on-year percentage changes provided below refer toconstant exchange rates and the quarterly changes are for the quarter ending with respect to the previous quarter.
Gross income
Gross income showed ayear-on-year growth of 3.8%, supported by the favorable performance of net interest income and, to a lesser extent, the growth of net fees and commissions.
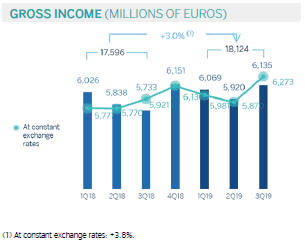
Net interest income grew by 5.2%year-on-year and 1.3% compared to the previous quarter. By business area and onyear-on-year basis, it is important to highlight the good performance of Mexico, South America and Turkey.
GROSS INCOME (MILLIONS OF EUROS) (1) At constant exchange rates: +3.8%.
Table of Contents
| 10 |
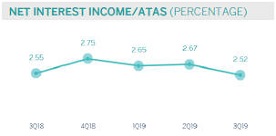
NET INTEREST INCOME/ATAS (PERCENTAGE)
Cumulativenet fees and commissions registered a positive performance with a growth of 2.9%year-on-year, influenced by their appropriate diversification. In the third quarter they grew by 2.8%.
As a result,recurring revenue items (net interest income plus net fees and commissions) increased by 4.7%year-on-year (up 1.7% over the quarter).
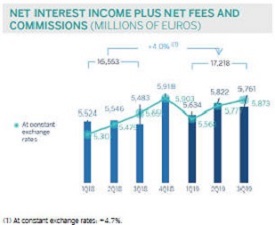
NET INTEREST INCOME PLUS NET FEES AND COMMISSIONS (MILLIONS OF EUROS) (1) At constant exchange rates: +4.7%.
NTI closed in line with the figures registered from January to September 2018 (down 0.3%), mainly explained by a lower contribution from the Global Markets unit and ALCO, partially offset by capital gains coming from the sale, in the first quarter of the year, of Prisma Medios de Pago, S.A. in Argentina. There was a greater contribution from NTI in the third quarter due to the good performance of foreign exchange transactions, especially in South America.
Theother operating income and expenses improved in the third quarter, compared to the negative balance of the second quarter, as a result of BBVA’s annual contribution in Spain to the Single Resolution Fund (SRF), which amounted to €144m. In theyear-on-year comparison, the higher contribution to the SRF (€20m higher than in 2018), and especially the higher adjustment for hyperinflation in Argentina, explain the decrease of 90.3% compared to the same period of 2018, despite the higher net contribution coming from the insurance business (up 6.9%year-on-year).
Operating income
Operating expenses for the first nine months of 2019 increased by 1.4% compared to the same period of the previous year (1.1% at current exchange rates) with a variation below inflation levels registered in most of the countries where BBVA operates. During this period, the continued cost reductions in Spain stand out, as a result of the expense control plans. The decrease in South America was explained by the change in the perimeter resulting from the sale of BBVA Chile in the third quarter of 2018.
Table of Contents
| 11 |
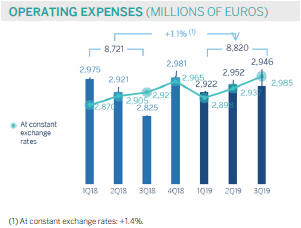
OPERATING EXPENSES (MILLIONS OF EUROS) (1) At constant exchange rates: +1.4%.
Theefficiencyratio continued to improve as a result of expenses growing below gross income, which stood at 48.7% in the third quarter, significantly below the level reached at the end of September 2018 (49.6%). As a result of the aforementioned,operating income registered ayear-on-year growth of 6.1%.
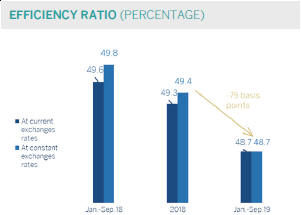 | 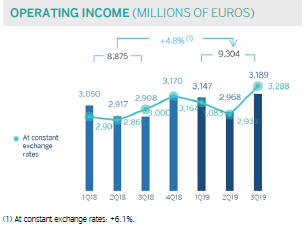 |
EFFICIENCY RATIO (PERCENTAGE) OPERATING INCOME (MILLIONS OF EUROS) (1) At constant exchange rates: +6.1%.
Provisions and other
The impairment on financial assets not measured at fair value through profit or loss (impairment on financial assets) for the first nine months of the year, showed an increase of 14.5%. By business area, the United States recorded higher loan-loss provisions for specific customers in the commercial portfolio and increased write-offs in consumer loans, in Turkey it is explained by the deterioration of retail customers portfolio, and in Mexico, mainly due to the consumer portfolio increase and impact of the deterioration in the macro scenario. On the other hand, Spain registered a decrease of 63.0%year-on-year for lower loan-loss provisions, mainly due to the positive effect of the sale ofnon-performing and write-offs portfolio, especially those carried out in the second quarter of 2019.
Table of Contents
| 12 |
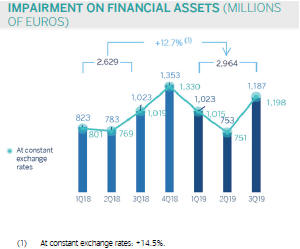
IMPAIRMENT ON FINANCIAL ASSETS (MILLIONS OF EUROS) (1) At constant exchange rates: +14.5%.
Provisions or reversal of provisions (provisions) was 24.3% higher compared to the same period of 2018, due to higher provisions for guarantees and contingent commitments. Other gains (losses) registered a loss of €29m, compared to a positive contribution of €73m in September 2018, as a result of capital gains from certain sales of subsidiaries in Mexico, Turkey and the former business area of Non Core Real Estate carried out in 2018.
Theresults from corporate operations at the end of September 2018 stood at €633m and registered the capital gains (net of taxes) resulting from the sale of BBVA Chile stake.
Results
As a result of the above, the Group’snet attributable profit during the first nine months of 2019 stood at €3,667m, 15.6% lower than in the same period of the previous year (down 15.2% at current exchange rates), featured by higher levels of recurring revenues but negatively impacted by higher loan-loss provisions requirements and the absence of corporate operations in the period.
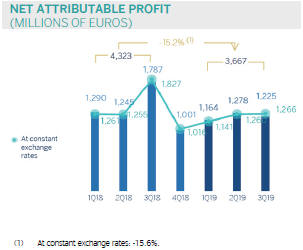
NET ATTRIBUTABLE PROFIT (MILLIONS OF EUROS) (1) At constant exchange rates: -15.6%.
Bybusiness areas, and in millions of euros, during the first nine months of the year Spain generated 1,064, the United States contributed 478, Mexico registered a profit of 1,965, Turkey contributed 380, South America registered a profit of 569 and Rest of Eurasia contributed 103.
Table of Contents
| 13 |
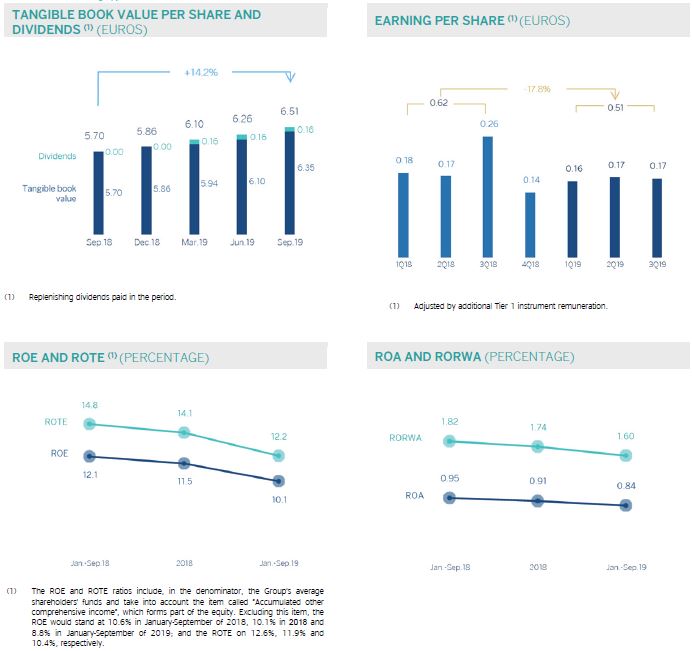
TANGIBLE BOOK VALUE PER SHARE AND DIVIDENDS (1) (EUROS) (1) Replenishing dividends paid in the period. EARNING PER SHARE (1) (EUROS) (1) Adjusted by additional Tier 1 instrument remuneration. ROE AND ROTE (1) (PERCENTAGE) ROA AND RORWA (PERCENTAGE) (1) The ROE and ROTE ratios include, in the denominator, the Group's average shareholders' funds and take into account the item called "Accumulated other comprehensive income", which forms part of the equity. Excluding this item, the ROE would stand at 10.6% in January-September of 2018, 10.1% in 2018 and 8.8% in January-September of 2019; and the ROTE on 12.6%, 11.9% and 10.4%, respectively.
Table of Contents
| 14 |
Balance sheet and business activity
The most relevantaspects of the Group’s balance sheet and business activity as of September 30, 2019 are summarized below:
| • | Loans and advances to customers (gross) increased by 1.3% during the first nine months of 2019, with increases in the business areas of Mexico, and, to a lesser extent, South America and Rest of Eurasia. |
| • | Non-performing loans increased by 2.3% in the quarter and is in line with the balance as of December 31, 2018. This quarterly increase is the result of the higher balance registered in Turkey. Theyear-on-year comparison fell by 3.4%, mainly due to the sales ofnon-performing loan portfolios in Spain. |
| • | In customerdeposits, overall good performance in the third quarter in both time deposits and demand deposits (up 1.4% and 0.5%, respectively). In theyear-on-year comparison and compared to the balance as of December 31, 2018, the fall in time deposits was more than offset by the increase in demand deposits balances. |
| • | Off-balance sheet funds grew by 7.8% compared to December 31, 2018, thanks to the good performance of both mutual funds and pension funds. |
| • | Intangible assets, the balance as of September 30, 2019 was primarily affected by the implementation of IFRS 16 “Leases,” which led to a growth of 41.2% compared to the end of the previous financial year. |
| • | The figure forother assets/other liabilities at the end of September 2019 includes the assets and liabilities of BBVA Paraguay, which have been classified asnon-current assets and liabilities held for sale in the consolidated public balance sheet, once the BBVA Group made public through a relevant event to the Spanish Securities Market Commission (hereinafter CNMV for its acronym in Spanish) the sales agreement, aforementioned in the relevant events section. |
CONSOLIDATED BALANCE SHEET(MILLIONS OF EUROS)
| 30-09-19 | D % | 31-12-18 | 30-09-18 | |||||||||||||
Cash, cash balances at central banks and other demand deposits | 40,932 | (29.7 | ) | 58,196 | 44,800 | |||||||||||
Financial assets held for trading | 110,874 | 23.0 | 90,117 | 90,405 | ||||||||||||
Non-trading financial assets mandatorily at fair value through profit or loss | 5,209 | 1.4 | 5,135 | 4,692 | ||||||||||||
Financial assets designated at fair value through profit or loss | 1,400 | 6.6 | 1,313 | 1,302 | ||||||||||||
Financial assets at fair value through accumulated other comprehensive income | 63,275 | 12.3 | 56,337 | 61,602 | ||||||||||||
Financial assets at amortized cost | 437,792 | 4.3 | 419,660 | 417,893 | ||||||||||||
Loans and advances to central banks and credit institutions | 19,655 | 50.0 | 13,103 | 15,355 | ||||||||||||
Loans and advances to customers | 378,775 | 1.3 | 374,027 | 370,496 | ||||||||||||
Debt securities | 39,363 | 21.0 | 32,530 | 32,042 | ||||||||||||
Investments in subsidiaries, joint ventures and associates | 1,550 | (1.8 | ) | 1,578 | 972 | |||||||||||
Tangible assets | 10,208 | 41.2 | 7,229 | 6,688 | ||||||||||||
Intangible assets | 8,508 | 2.3 | 8,314 | 8,213 | ||||||||||||
Other assets | 29,269 | 1.6 | 28,809 | 32,417 | ||||||||||||
Total assets | 709,017 | 4.8 | 676,689 | 668,985 | ||||||||||||
Financial liabilities held for trading | 92,407 | 14.4 | 80,774 | 81,810 | ||||||||||||
Other financial liabilities designated at fair value through profit or loss | 9,583 | 37.0 | 6,993 | 6,782 | ||||||||||||
Financial liabilities at amortized cost | 518,215 | 1.8 | 509,185 | 501,439 | ||||||||||||
Deposits from central banks and credit institutions | 60,554 | 2.2 | 59,259 | 62,339 | ||||||||||||
Deposits from customers | 379,333 | 0.9 | 375,970 | 365,687 | ||||||||||||
Debt certificates | 63,324 | 3.6 | 61,112 | 62,022 | ||||||||||||
Other financial liabilities | 15,003 | 16.8 | 12,844 | 11,390 | ||||||||||||
Liabilities under insurance and reinsurance contracts | 10,834 | 10.2 | 9,834 | 9,994 | ||||||||||||
Other liabilities | 20,949 | 23.0 | 17,029 | 17,862 | ||||||||||||
Total liabilities | 651,988 | 4.5 | 623,814 | 617,888 | ||||||||||||
Non-controlling interests | 6,299 | 9.3 | 5,764 | 5,100 | ||||||||||||
Accumulated other comprehensive income | (6,114 | ) | (15.3 | ) | (7,215 | ) | (7,358 | ) | ||||||||
Shareholders’ funds | 56,844 | 4.6 | 54,326 | 53,355 | ||||||||||||
Total equity | 57,029 | 7.9 | 52,874 | 51,097 | ||||||||||||
Total liabilities and equity | 709,017 | 4.8 | 676,689 | 668,985 | ||||||||||||
Memorandum item: | ||||||||||||||||
Guarantees given | 45,655 | 1.0 | 47,574 | 45,207 | ||||||||||||
Table of Contents
| 15 |
LOANS AND ADVANCES TO CUSTOMERS (GROSS. BILLIONS OF EUROS) (1) At constant exchange rates: +0.2%.
LOANS AND ADVANCES TO CUSTOMERS(MILLIONS OF EUROS)
| 30-09-19 | D % | 31-12-18 | 30-09-18 | |||||||||||||
Public sector | 27,782 | (2.5 | ) | 28,504 | 28,702 | |||||||||||
Individuals | 173,744 | 1.9 | 170,501 | 169,594 | ||||||||||||
Mortgages | 110,958 | (0.5 | ) | 111,528 | 112,278 | |||||||||||
Consumer | 35,144 | 0.6 | 34,939 | 34,190 | ||||||||||||
Credit cards | 14,469 | 7.1 | 13,507 | 12,527 | ||||||||||||
Other loans | 13,173 | 25.1 | 10,527 | 10,598 | ||||||||||||
Business | 173,410 | 1.5 | 170,872 | 167,771 | ||||||||||||
Non-performing loans | 16,337 | (0.1 | ) | 16,348 | 17,045 | |||||||||||
Loans and advances to customers (gross) | 391,273 | 1.3 | 386,225 | 383,111 | ||||||||||||
Loan-loss provisions | (12,499 | ) | 2.5 | (12,199 | ) | (12,614 | ) | |||||||||
Loans and advances to customers | 378,775 | 1.3 | 374,027 | 370,496 | ||||||||||||
 | 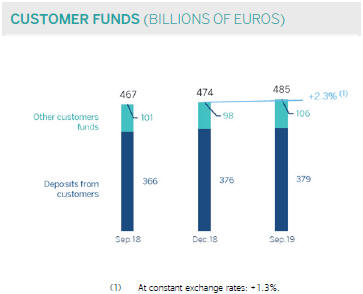 |
CUSTOMER FUNDS (BILLIONS OF EUROS) (1) At constant exchange rates: +1.3%.
CUSTOMER FUNDS(MILLIONS OF EUROS)
| 30-09-19 | D % | 31-12-18 | 30-09-18 | |||||||||||||
Deposits from customers | 379,333 | 0.9 | 375,970 | 365,687 | ||||||||||||
Current accounts | 272,729 | 4.7 | 260,573 | 251,666 | ||||||||||||
Time deposits | 100,147 | (7.5 | ) | 108,313 | 107,458 | |||||||||||
Other deposits | 6,457 | (8.9 | ) | 7,084 | 6,564 | |||||||||||
Other customer funds | 105,826 | 7.8 | 98,150 | 100,995 | ||||||||||||
Mutual funds and investment companies | 66,748 | 8.7 | 61,393 | 64,081 | ||||||||||||
Pension funds | 36,179 | 7.0 | 33,807 | 33,715 | ||||||||||||
Otheroff-balance sheet funds | 2,899 | (1.7 | ) | 2,949 | 3,199 | |||||||||||
Total customer funds | 485,159 | 2.3 | 474,120 | 466,683 | ||||||||||||
Table of Contents
| 16 |
Capital base
BBVA’sfully loaded CET1 ratio stood at 11.6% as of the end of September 2019, isolating the impact of the first IFRS 16 implementation which came into effect on January 1, 2019(-11 basis points) represents a growth of 33 basis points compared to December 2018. This increase is supported by the recurring organic capital generated and the impacts on the capital ratio of the positive evolution of the markets registered, mainly during the first six months of the year.
Risk-weighted assets (RWA) increased at current euros by approximately €19,800m in the first nine months of 2019 as a result of the growth of activity, mainly in the emerging markets, the incorporation of regulatory impacts (IFRS 16 implementation and TRIM — Targeted Review of Internal Models) for approximately €7,300m (which have had an impact on the CET1 ratio of-24 basis points); additionally, the impact of appreciation, particularly the U.S. Dollar and Mexican Peso, has increased the RWA by approximately €5,300m. Finally, in the second quarter of the year, the European Commission recognized Argentina as a country whose supervisory and regulatory1 requirements are considered equivalent, which has a positive impact on the RWA evolution.
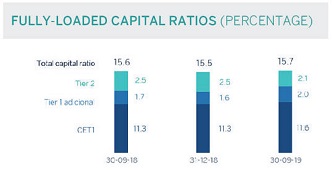
FULLY-LOADED CAPITAL RATIOS (PERCENTAGE)
CAPITAL BASE(MILLIONS OF EUROS)
| CRD IVphased-in | CRD IV fully-loaded | |||||||||||||||||||||||
| 30-09-19 (1) (2) | 31-12-18 | 30-09-18 | 30-09-19 (1) (2) | 31-12-18 | 30-09-18 | |||||||||||||||||||
Common Equity Tier 1 (CET 1) | 43,423 | 40,313 | 39,662 | 42,626 | 39,571 | 38,925 | ||||||||||||||||||
Tier 1 | 51,029 | 45,947 | 45,765 | 50,103 | 45,047 | 44,868 | ||||||||||||||||||
Tier 2 | 8,638 | 8,756 | 8,847 | 7,798 | 8,861 | 8,670 | ||||||||||||||||||
Total Capital (Tier 1 + Tier 2) | 59,668 | 54,703 | 54,612 | 57,901 | 53,907 | 53,538 | ||||||||||||||||||
Risk-weighted assets | 368,136 | 348,264 | 343,051 | 368,630 | 348,804 | 343,271 | ||||||||||||||||||
CET1 (%) | 11.8 | 11.6 | 11.6 | 11.6 | 11.3 | 11.3 | ||||||||||||||||||
Tier 1 (%) | 13.9 | 13.2 | 13.3 | 13.6 | 12.9 | 13.1 | ||||||||||||||||||
Tier 2 (%) | 2.3 | 2.5 | 2.6 | 2.1 | 2.5 | 2.5 | ||||||||||||||||||
Total capital ratio (%) | 16.2 | 15.7 | 15.9 | 15.7 | 15.5 | 15.6 | ||||||||||||||||||
| (1) | As of September 30, 2019, the difference between thephased-in and fully-loaded ratios arises from the temporary traetment of certain capital items, mainly of the impact of IFRS9, to which the BBVA Group has adhered voluntarily (in accordance with article 473bis of the CRR). |
| (2) | Provisional data. |
In terms of capitalissuances, BBVA S.A. conducted three public capital issuances: the issuance of preferred securities that may be converted into ordinary BBVA shares (CoCos), registered with the Spanish Securities Market Commission (CNMV) for €1,000m, at an annual coupon of 6.0% and an amortization option after five years of being issued; another issuance of CoCos, registered with the Securities Exchange Commission (SEC), for US$1,000m and a coupon of 6.5% with an amortization option after five and a half years; and a Tier 2 subordinated debt issuance of €750m, with a maturity period of 10 years, an amortization option after five years of being issued and a coupon of 2.575%2. In the first nine months of the year the Group continued its funding program to meet theMREL (minimum requirement for own funds and eligible liabilities) requirements published in May 2018, by closing three public issuances of seniornon-preferred debt for a total of €3,000m, one of which, for €1,000m, was a green bond.
| 1 | On April 1, 2019, the Official Journal of the European Union published Commission Implementing Decision (EU) No 2019/536, which includes Argentina within the list of third countries and territories whose supervisory and regulatory requirements are considered equivalent for the purposes of the treatment of exposures in accordance with Regulation (EU) No 575/2013. |
| 2 | These issuances are calculated as capital instruments (as additional Tier 1 the first two and as Tier 2 the last one) without prior authorization required, all in accordance with the Royal Decree 309/2019, of April 26, which partially implements Law 5/2019, of March 15, regulating real estate loan agreements and adopting other financial measures. |
Table of Contents
| 17 |
Additionally, the early amortization options on three issuances were exercised: one for CoCos, for €1,500m with a coupon of 7% issued in February 2014; another issuance of Tier 2 subordinated debt, for €1,500m with a coupon of 3.5% issued in April 2014 and amortized in April 2019; and a further Tier 2 debt issued in June 2009 by Caixa d’Estalvis de Sabadell with an outstanding nominal amount of €4,878,000, amortized in June 2019.
In terms of the Group’s remaining subsidiaries, Mexico carried out the issuance of a Tier 2 debt instrument for US$750m with a maturity period of 15 years with an early amortization option in the tenth year and a coupon of 5.875%. The funds obtained were used to carry out a partial repurchase of two subordinated issuances (US$250m with maturity in 2020 and US$500m with maturity in 2021).
Regardingshareholder remuneration, on October 15 a gross cash dividend was paid for the financial year 2019 of €0.10 per share, in line with the Group’s dividend policy of maintaining apay-out ratio of35-40% of recurring profit.
Thephased-in CET1 ratio stood at 11.8% as of September 30, 2019, taking into account the effect of the IFRS 9 standard.Tier 1 stood at 13.9% andTier 2 at 2.3%, resulting in atotal capital ratio of 16.2%.
These levels are above the requirements established by the supervisor in its SREP letter (Supervisory Review and Evaluation Process), applicable in 2019. Since March 1, 2019, at the consolidated level, this requirement has been established at 9.26% for the CET1 ratio and 12.76% for the total capital ratio. Its variation compared to 2018 is explained by the end of the transitional period for the implementation of the capital conservation buffer and the capital buffer applicable to Other Systemically Important Institutions, as well as the progression of the countercyclical capital buffer. For its part, the CET1 Pillar 2 requirement (P2R) remains unchanged at 1.5%.
Finally, the Group’s maintained a solidleverageratio of 6.9% fully-loaded (7.0%phased-in), the highest among its peergroup.
Ratings
During the first nine months of the year, Moody’s, S&P, DBRS and Scope confirmed the rating they assign to BBVA’s senior preferred debt (A3,A-, A (high) and A+ respectively). Fitch increased this rating by a notch in July 2019, considering that BBVA’s loss-absorbing capital buffers (such as seniornon-preferred debt) are sufficient to materially reduce the risk of default. In these actions, the agencies highlighted the Group’s diversification and self-sufficient franchise model, with subsidiaries responsible for managing their own liquidity. These ratings, together with their outlooks, are shown in the following table:
RATINGS
Rating agency | Long term (1) | Short term | Outlook | |||||||||
DBRS | A (high) | R-1 (middle) | Stable | |||||||||
Fitch | A | F-1 | Negative | |||||||||
Moody’s | A3 | P-2 | Stable | |||||||||
Scope Ratings | A+ | S-1+ | Stable | |||||||||
Standard & Poor’s | A- | A-2 | Negative | |||||||||
| (1) | Ratings assigned to long term senior preferred debt. Additionally, Moody’s and Fitch assign A2 and A rating respectively, to BBVA’s long term deposits. |
Table of Contents
| 18 |
Credit risk
Between the period of January-September of 2019, BBVA Group’s risk metrics performed well:
| • | Credit risk increased slightly by 0.7% in the third quarter at current exchange rates. At constant exchange rates, it contracted-0.7%, where the decrease in Spain and Turkey was not offset by the growth in the rest of the business areas. |
| • | The balance ofnon-performing loans remained flat between January and September of 2019, however it decreased by 3.4% inyear-on-year terms, primarily due to the sale ofnon-performing loans portfolios in Spain. |
| • | The NPL ratiostood at 3.9% as of September 30, 2019, which represents a decrease of 4 basis points compared to the end of December 2018 (- 23 basis pointsyear-on-year). |
| • | Loan-loss provisions increased by 3.2% in the last nine months (up 2.6% at constant exchange rates). |
| • | TheNPL coverage ratio closed at 75% in the first nine months, which was an improvement of 231 basis points compared to the close of 2018 and 257 basis pointsyear-on-year. |
| • | The accumulatedcost of risk as of September 2019 stood at 1.01%, in line with the figure at the end of 2018. |
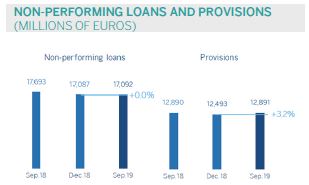
NON-PERFORMING LOANS AND PROVISIONS (MILLIONS OF EUROS)
CREDIT RISK(1)(MILLIONS OF EUROS)
| 30-09-19 (2) | 30-06-19 | 31-03-19 | 31-12-18 | 30-09-18 | ||||||||||||||||
Credit risk | 438,177 | 434,955 | 439,152 | 433,799 | 428,318 | |||||||||||||||
Non-performing loans | 17,092 | 16,706 | 17,297 | 17,087 | 17,693 | |||||||||||||||
Provisions | 12,891 | 12,468 | 12,814 | 12,493 | 12,890 | |||||||||||||||
NPL ratio (%) | 3.9 | 3.8 | 3.9 | 3.9 | 4.1 | |||||||||||||||
NPL coverage ratio (%) | 75 | 75 | 74 | 73 | 73 | |||||||||||||||
| (1) | Include gross loans and advances to customers plus guarantees given. |
| (2) | Figures without considering the classification ofnon-current assets held for sale (NCA&L). |
NON-PERFORMING LOANS EVOLUTION(MILLIONS OF EUROS)
| 3Q19 (1) (2) | 2Q19 | 1Q19 | 4Q18 | 3Q18 | ||||||||||||||||
Beginning balance | 16,706 | 17,297 | 17,087 | 17,693 | 19,654 | |||||||||||||||
Entries | 2,563 | 2,458 | 2,353 | 3,019 | 2,168 | |||||||||||||||
Recoveries | (1,423 | ) | (1,531 | ) | (1,409 | ) | (1,560 | ) | (1,946 | ) | ||||||||||
Net variation | 1,140 | 927 | 944 | 1,459 | 222 | |||||||||||||||
Write-offs | (992 | ) | (958 | ) | (775 | ) | (1,693 | ) | (1,606 | ) | ||||||||||
Exchange rate differences and other | 238 | (561 | ) | 41 | (372 | ) | (576 | ) | ||||||||||||
Period-end balance | 17,092 | 16,706 | 17,297 | 17,087 | 17,693 | |||||||||||||||
Memorandum item: | ||||||||||||||||||||
Non-performing loans | 16,337 | 15,999 | 16,559 | 16,348 | 17,045 | |||||||||||||||
Non performing guarantees given | 755 | 707 | 738 | 739 | 649 | |||||||||||||||
| (1) | Preliminary data. |
| (2) | Figures without considering the classification ofnon-current assets held for sale (NCA&L). |
Table of Contents
| 19 |
Structural risks
Liquidity and funding
Management ofliquidity and funding at BBVA aims to finance the recurring growth of the banking business at suitable maturities and costs, using a wide range of instruments that provide access to a large number of alternative sources of financing, always in compliance with current regulatory requirements.
Due to its subsidiary-based management model, BBVA is one of the few major European banks that follows the Multiple Point of Entry (MPE) resolutionstrategy:theparent company sets the liquidity policies, but the subsidiaries are self-sufficient and responsible for managing their own liquidity(taking deposits or accessing the market with their own rating), without fund transfers or financing occurring between either the parent company and the subsidiaries, or between different subsidiaries. This strategy limits the spread of a liquidity crisis among the Group’s different areas, and ensures that the cost of liquidity and financing is correctly reflected in the price formation process.
The financial soundness of the BBVA Group’s banks continues to be based on the funding of lending activity, fundamentally through the use of stable customer funds. During the first nine months of 2019, liquidityconditions remained comfortable across all countries in which the BBVA Group operates:
| • | In the eurozone, the liquidity situation remains comfortable, with a slight increase in the credit gapover the first nine months of the year. BBVA did not participate in the first auction of the European Central Bank’s long-term lending program, known as TLTRO III, which took place in September. The possibility of being involved in the next auction in December will be assessed by the bank as part of its quarterly process of updating the financing plan. |
| • | In the United States, the liquidity situation is solid. In the first nine months of this year, there has been a decrease in the credit gapdue primarily to the increase in deposits as a result of deposit-taking campaigns, and a slowdown in lending activity. It should be noted that recent tensions in the very short-term American repo market, which forced the Federal Reserve to intervene and inject liquidity, have had no impact on BBVA USA due to its limited dependence on this type of operation and the maintenance of an adequate liquiditybuffer. |
| • | In Mexico, the credit gapincreased in the first nine months of the year due to higher growth in lending activity than deposits, although the liquidity position remains strong. |
| • | In Turkey, the good liquidity situation continues despite the wholesale funding maturities seen during the year, with an adequate buffer againsta possible liquidity stress scenario. A reduction in loans and growth in deposits led to the credit gapimproving in the first nine months of the year in terms of the balance sheet in foreign currency, while in terms of local currency the credit gap increased due to higher growth in loans than deposits. |
| • | In South America, the liquidity situation remains comfortable throughout the region. In Argentina, the volatility generated in the markets following the results of the primary elections produced an outflow of deposits in dollars in the banking system (gradually decreasing in recent weeks), which BBVA Argentina successfully managed as a result of its solid liquidity position, as shown by its comfortable liquidity ratios. |
The BBVA Group’sliquidity coverage ratio (LCR) remained comfortably above 100% during the first nine months of 2019, and stood at 127% as of September 30, 2019. It comfortably exceeded 100% in all subsidiaries (eurozone 144%, Mexico 135%, the United States 144% and Turkey 174%). For the calculation of the ratio, it is assumed that there is no transfer of liquidity among subsidiaries; i.e. no kind of excess liquidity levels in foreign subsidiaries are considered in the calculation of the consolidated ratio. When considering these excess liquidity levels, the BBVA Group’s LCR would stand at 152% (25 percentage points above 127%).
TheNet Stable Funding Ratio (NSFR), defined as the ratio between the amount of stable funding available and the amount of stable funding required, is one of the Basel Committee’s essential reforms, and requires banks to maintain a stable funding profile in relation to the composition of their assets andoff-balance-sheet activities. This ratio should be at least 100% at all times. BBVA Group’s, NSFR ratio, calculated according to Basel requirements, remained above 100% throughout the first nine months of 2019 and stood at 122% as of September 30, 2019. It comfortably exceeded 100% in all subsidiaries (eurozone 115%, Mexico 129%, the United States 114% and Turkey 150%).
The wholesalefinancing markets in which the Group operates remained stable.
The maintransactions carried out in the first nine months of 2019 by entities of the BBVA Group were:
| • | BBVA, S.A. completed three seniornon-preferreddebt issuances, the first for€1,000m with a fixed-rate annual coupon of 1.125% and a maturity period of five years; the second a green bond (its second after the first issuance in May 2018), also for €1,000m, with an annual coupon of 1% and a maturity period of seven years; and the third in September for €1,000m with a maturity period of five years and a final interest rate of midswap +80 basis points, with a coupon of 0.375%, this being the lowest achieved by a seniornon-preferred debt issuance in Spain and the lowest paid by BBVA for senior debt (preferred andnon-preferred). |
Table of Contents
| 20 |
| • | Regarding capital issuances, BBVA, S.A. carried out three public issuances: an issuance of preferred securities that may be converted into ordinary BBVA shares (CoCos), registered in the Spanish Securities Market Commission (CNMV) for €1,000m with an annual coupon of 6.0% and amortization option from the fifth year; another issuance of CoCos, registered in the Security Exchange Commission (SEC), for $1,000m with a coupon of 6.5% and amortization option after five and a half years; and a Tier 2 subordinated debt issuance for €750m, with a maturity period of ten years, an amortization option in the fifth year and a coupon of 2.575%. |
| • | Additionally, during the first nine months, the early amortization option for the issuance of CoCos for €1,500m with a coupon of 7%, issued in February 2014, was exercised; and a Tier 2 subordinated debt issuance for €1,500m with a coupon of 3.5%, issued in April 2014, was amortized. In June 2019, BBVA, S.A., as the successor to Unnim Banc, S.A.U., exercised the early amortization of the issuance of subordinated bonds, originally issued by Caixa d’Estalvis de Sabadell, for an outstanding nominal amount of €4,878,000. |
| • | In the United States, BBVA USA completed a public issuance of US$600m in senior format in the third quarter of the year, with a maturity period of five years and a coupon of 2.5%. The purpose of this issuance was to renew a maturity for the same amount. |
| • | In Mexico, €458m of senior debt was issued in the local market in the second quarter of theyear, in two tranches: €229m with a maturity period of three years at the Interbank Equilibrium Interest Rate (TIIE) +28 basis points, and €229m with a maturity period of eight years at the Mbono rate +80 basis points, obtaining the lowest cost of funds in history in the local market in both maturities. In the third quarter, a Tier 2 issuance of US$750m was issued with a maturity period of 15 years including an early amortization option in the tenth year and a coupon of 5.875%. The funds obtained were used to carry out a partial repurchase of two subordinated issuances that were no longer being calculated in capital (250m with maturity in 2020 and 500m with maturity in 2021). |
| • | In Turkey, in the first quarter Garanti BBVA issued a Diversified Payment Rights (DPR) securitization for US$150m with a maturity period of five years. It also renewed syndicated loans for US$784m. |
| • | In South America, in the third quarter BBVA Peru issued senior bonds with amaturity period of three years for an equivalent amount of €50m. In previous quarters, BBVA Argentina issued negotiable instruments on the local market for an amount equivalent to €25m, while Forum in Chile issued a bond on the local market for an amount equivalent to €107m. |
Foreign exchange
Foreign exchangerisk management of BBVA’s long-term investments, principally stemming from its overseas franchises, aims to preserve the Group’s capital adequacy ratios and ensure the stability of its income statement.
In the first nine months of2019, the Argentine peso (down 30.6%) and the Turkish lira (down 1.5%) depreciated against the euro, while the Mexican peso (up 4.8%) and the US dollar (up 5.2%) appreciated compared to the closing rates at December 31, 2018. BBVA has maintained its policy of actively hedging its main investments in emerging markets, covering on average between 30% and 50% of annual earnings and around 70% of the CET1 capital ratio excess. Based on this policy, the sensitivity of the CET1 ratio to a depreciation of 10% against the euro of the main emerging-market currencies stands at-3 basis points for the Mexican peso and-2 basis points for the Turkish lira. In the case of the US dollar, the sensitivity to a depreciation of 10% against the euro is approximately +9 basis points, as a result of RWAs denominated in US dollars outside the United States. At the close of September, the coverage level for expected earnings for 2019 stood at 76% for Mexico and 75% for Turkey.
Interest rate
The aim of managinginterest rate risk is to limit the sensitivity of the balance sheet to interest rate fluctuations. BBVA carries out this work through an internal procedure following the guidelines established by the European Banking Authority (EBA), measuring the sensitivity of net interest income and economic value to determine the potential impact of a range of scenarios on the Group’s different balance sheets.
The model is based on assumptions intended to realistically replicate the performance of the balance sheet. Of particular relevance are assumptions about the performance of accounts with no explicit maturity and prepayment estimates. These assumptions are reviewed and adapted at least once a year to consider any changes in the performance.
BBVA maintains, at the aggregate level, a favorable position in net interest income in the face of an increase in interest rates, as well as a moderate risk profile, in line with its objective, through effective management of structural risk of the balance sheet risk.
By area, the main aspects of the balance sheets are:
| • | Spain and the United States have balance sheets characterized by a high proportion of variable-rate loans in their portfolios (basically, mortgages in Spain and corporate loans in both countries) and liabilities composed mainly of customer deposits. The ALCO portfolios act as a hedge of the bank’s balance sheet, reducing its sensitivity to interest rate fluctuations. |
Table of Contents
| 21 |
| • | In Mexico there is a better equilibrium between balance sheet items referenced to fixed and variable interest rates. Among the most sensitive assets to interest rates fluctuations, the corporate portfolio stands out, while consumer loans and mortgages are mostly fixed rate. The ALCO portfolio is used to neutralize the longer duration of customer deposits. |
| • | In Turkey, the interest rate risk (broken down into Turkish lira and U.S. dollars) is very limited: on the asset side, the sensitivity of loans, mostly fixed rate but with relatively short maturities, and the ALCO portfolio, including inflation-linked bonds, is balanced by the sensitivity of deposits, which arere-priced over short maturities on the liability side. |
| • | In South America, interest rate risk remains low because the fixed/variable composition and maturities are very similar for assets and liabilities in most countries in the region. Likewise, in balance sheets with several currencies, interest rate risk management is also carried out for each of the currencies, showing a very low level of risk. |
Economic capital
Economic risk capital (ERC) consumption reached €29,183m at the end of August 2019 in consolidated terms, equivalent to an increase of 1.2% compared to the end of May 2019. The variation, in the same period and at constant exchange rates was up 1.9%. This increase was primarily due to credit risk and exchange rate.
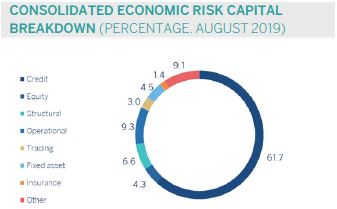
CONSOLIDATED ECONOMIC RISK CAPITAL BREAKDOWN (PERCENTAGE. AUGUST 2019)
Table of Contents
| 22 |
The mainstock marketindexes performed strongly during the first nine months of 2019, thanks particularly to the positive start in the first quarter. In Europe, the Stoxx Europe 600 index increased by 12.9% between January and September, although it fell slightly in the third quarter(-1.3% compared to June 2019). In Spain, the rise of the Ibex 35 during the same period was more moderate at 8.3%, remaining practically flat in the third quarter (+0.5%). In the United States, the main stock indexes maintain the high growth rates observed throughout the year. The S&P 500 Index rose 18.7% in the first nine months of the year, although this increase has slowed in the third quarter (+ 1.2%).
With regard to the Europeanbanking sectorindexes, particularly in Europe, its performance in the first nine months of the year was worse than the general market indexes, and the positive start of the first quarter was offset by the decline in the second and third quarters of the year. The Stoxx Europe 600 Banks index, which includes banks in the United Kingdom and the Euro Stoxx Banks index for the Eurozone remained flat during the year(-0.4% and +0.8% respectively, as of September 2019), while in the United States, the S&P Regional Banks Select Industry Index upgraded 12.9% compared to the close of the 2018 financial year.
For its part, theBBVA share registered a better performance compared to the European banking sector during the first nine months of the year, with the share price increasing by 3.1% and closing September 2019 at €4.78.
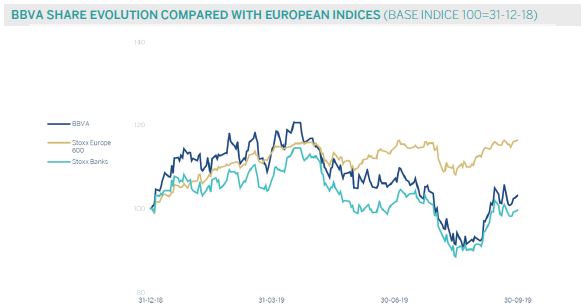
BBVA SHARE EVOLUTION COMPARED WITH EUROPEAN INDICES (BASE INDICE 100=31-12-18)
THE BBVA SHARE AND SHARE PERFORMANCE RATIOS
| 30-09-19 | 31-12-18 | |||||||
Number of shareholders | 884,412 | 902,708 | ||||||
Number of shares issued | 6,667,886,580 | 6,667,886,580 | ||||||
Daily average number of shares traded | 28,631,263 | 35,909,997 | ||||||
Daily average trading (millions of euros) | 144 | 213 | ||||||
Maximum price (euros) | 5.68 | 7.73 | ||||||
Minimum price (euros) | 4.19 | 4.48 | ||||||
Closing price (euros) | 4.78 | 4.64 | ||||||
Book value per share (euros) | 7.63 | 7.12 | ||||||
Tangible book value per share (euros) | 6.35 | 5.86 | ||||||
Market capitalization (millions of euros) | 31,876 | 30,909 | ||||||
Yield (dividend/price; %)(1) | 5.4 | 5.4 | ||||||
| (1) | Calculated by dividing shareholder remuneration over the last twelve months by the closing price of the period. |
Table of Contents
| 23 |
Regardingshareholder remunerationin 2019, on October 15, BBVA paid a cash interim dividend of €0.10 (gross) per share on account of the 2019 dividend. This payment isin line with the policy announced in the Relevant Event released on February 1, 2017, in which BBVA plans to distribute between 35% and 40% of annual earnings in dividends. This shareholder remuneration policy, will consist of two cash payments, the aforementioned in October and the foreseen in April 2020, all subject to the appropriate approvals by the relevant governing bodies.
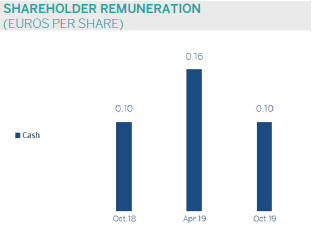
SHAREHOLDER REMUNERATION (EUROS PER SHARE)
As of September 30, 2019, the number of BBVAshares remained at 6.668 billion, held by 884,412shareholders, of which 43.59% are Spanish residents and the remaining 56.41% arenon-residents.
SHAREHOLDER STRUCTURE(30-09-19)
| Shareholders | Shares | |||||||||||||||
Number of shares | Number | % | Number | % | ||||||||||||
Up to 150 | 174,725 | 19.8 | 12,353,130 | 0.2 | ||||||||||||
151 to 450 | 174,662 | 19.7 | 47,919,315 | 0.7 | ||||||||||||
451 to 1800 | 277,401 | 31.4 | 271,773,883 | 4.1 | ||||||||||||
1,801 to 4,500 | 135,514 | 15.3 | 386,115,280 | 5.8 | ||||||||||||
4,501 to 9,000 | 63,147 | 7.1 | 397,898,075 | 6.0 | ||||||||||||
9,001 to 45,000 | 52,561 | 5.9 | 911,679,986 | 13.7 | ||||||||||||
More than 45,001 | 6,402 | 0.7 | 4,640,146,911 | 69.6 | ||||||||||||
|
|
|
|
|
|
|
| |||||||||
Total | 884,412 | 100.0 | 6,667,886,580 | 100.0 | ||||||||||||
|
|
|
|
|
|
|
| |||||||||
BBVAshares are included on the main stock market indexes, including the Ibex 35, and the Stoxx Europe 600 index, with a weighting of 6.5% and 0.4%, respectively at the closing of September of 2019. They are also included on several sector indexes, including Stoxx Europe 600 Banks, which includes the United Kingdom, with a weighting of 4.0% and the Euro Stoxx Banks index for the Eurozone with a weighting of 8.4%.
Finally, BBVA maintains a significant presence on a number of internationalsustainability indexes or Environmental, Social and Governance (ESG) indexes, which evaluates companies’ performance in these areas. In September, BBVA continued to be included in the Dow Jones Sustainability Index (DJSI), the markets leading benchmark index, which measures the economic, environmental and social performance of the most valuables companies by market capitalization of the world (in the DJSI World and DJSI Europe), achieving the highest score in financial inclusion and occupational health and safety and the highest score in climate strategy, environmental reporting and corporate citizenship and philanthropy.
Table of Contents
| 24 |
MAIN SUSTAINABILITY INDICES ON WHICH BBVA IS LISTED AS OF30-09-19
Listed on the DJSI World and DJSI Europe indices Listed on the MSCI ESG Leaders Indexes AAA Rating Listed on the FTSE4Good Global Index Series Listed on the Euronext Vigeo Eurozone 120 and Europe 120 Indices Listed on the Ethibel Sustainability Excellence Europe and Eithebel Sustainability Excellence Global indices Listed on the Bloomberg Gender-Equality Index In 2018, BBVA obtained a "B" rating (1) The inclusion of BBVA in any MSCI index, and the use of MSCI logos, trademarks, service marks or index names herein, do not constitute a sponsorship, endorsement or promotion of BBVA by MSCI or any of its affiliates. The MSCI indices are the exclusive property of MSCI. MSCI and the MSCI index names and logos are trademarks or service marks of MSCI or its affiliates.
Table of Contents
| 25 |
At BBVA we have adifferential bankingmodel that we refer to as responsible banking, based on seeking out the profitability adjusted to principles, strict legal compliance, best practices and the creation of long-term value for all stakeholders. The fourpillars of BBVA’s responsible banking model are as follows:
| • | Balanced relationships with its customers, based on transparency, clarity and responsibility. |
| • | Sustainable finance to combat climate change, respect human rights and achieve the United Nations Sustainable Development Goals (SDGs). |
| • | Responsible practices with employees, suppliers and other stakeholders. |
| • | Community investment to promote social change and create opportunities for all. |
In 2018, BBVA announced its2025 Pledge. This sets out the Bank’s strategy for climate change and sustainable development, working toward meeting the United Nations Sustainable Development Goals (SDGs) and the Paris Agreement on climate change. The pledge is an eight-year commitment based on three lines of action:
| • | To finance: BBVA is pledging to mobilize €100 billion in green and social financing, sustainable infrastructure and agribusiness, social entrepreneurship and financial inclusion. |
| • | To manage the environmental and social risks associated with the Group’s activity in order to minimize its potential direct and indirect negative impacts. BBVA pledges that 70% of energy used by the Group will be renewable by 2025, reaching 100% by 2030, and to reduce direct CO2 emissions by 68% with respect to 2015. |
| • | To engage all stakeholders to collectively promote the financial sector’s contribution to sustainable development. |
The figure forsustainable financemobilized since the launch of the Pledge amounts to €22,000m (figure as of June 2019, latest available data). Additionally, BBVA published the first monitoring report on its first green bond, issued in 2018, which has contributed to reduce around 275,000 tons of CO2 in its first year.
In Spain, BBVA is positioned at the forefront of sustainable products, being one of the most active financial entities regarding this issue. In this sense, the Bank is developing products which offer sustainable solutions for all customers (individuals, SMEs, large companies and institutions), i.e., products that seek to respond to a growing demand from society, which is increasingly aware of the fight against climate change. Among them, the highlighted lines are, loan for promotion of high energy-efficient housing with a bonus on the differential of the mortgage and loans for all customers wishing to purchase electric or hybrid cars.
As part of its objective to engage its stakeholders, BBVA signed in September the Principles of Responsible Banking, promoted by the Financial Initiative of the United Nations Environment Program (UNEP FI) at the United Nations General Assembly held in New York on September 22. It is a joint response of 130 banking entities and the UN to align the banking business with long-term objectives which integrate social and environmental challenges.
In addition, the Bank joined theCollective Commitment to Climate Action launched by 31 international financial institutions within the framework of the United Nations climate summit, which was held in New York on September 23. This statement was born within the Principles of Responsible Banking which intends to its promoters determination to align their portfolios to reflect and finance thelow-carbon, climate-resilient economy required to limit global warming to well-below 2, striving for 1.5 degrees Celsius. Also, these 31 international financial institutions will pursue a set of common goals to help facilitate the economic transition necessary to achieve climate neutrality; and they have committed to work together and support each other in developing each bank’s capabilities and the necessary methodologies to measure climate impact and alignment with global and local climate goals. For BBVA and all signatory institutions, this commitment aims to align its products and services with a collective strategy in the face of the climate crisis.
Regardingresponsible practices with employees, BBVA launched the Be Yourself proposal, carried out by its employees to work on diversity. This project aims to achieve a diverse and inclusive work environment, and has been presented by the working group to the rest of the employees with the support of the senior management of the Bank and a group of speakers who have discussed about the challenges and difficulties that LGTBI people face.
Within the framework ofcommunity investment, education for society has an important weight. From 2008 to 2018, BBVA allocated more than €80 million to financial education programs worldwide that benefited more than 13 million people.
In July 2019, BBVA hosted in Madrid the third edition of theEduFin Summit 2019, the global meeting of the BBVA Center for Financial Education and Capability in which financial health and education are discussed every year. The event brought together over 30 experts in financial education from 16 countries, including agents of public administrations, universities, think-tanks and professionals in education and finance. This edition addressed the issue of how digitalization contributes to improving the health of people’s finances, and the discussion about the need for the technological revolution to become more inclusive or about the use of chatbots and artificial intelligence in the daily life of personal finances.
Table of Contents
| 26 |
Finally, as aforementioned in the BBVA share section, BBVA continued to be included in theDow Jones Sustainability Index (DJSI), the market’s leading benchmark index, which measures the economic, environmental and social performance of the most valuables companies by market capitalization of the world (in the DJSI World and DJSI Europe), while Garanti BBVA continued to be included in the DJSI Emerging Markets. In the renewal of 2019, BBVA achieved the highest score in financial inclusion and occupational health and safety, and highest scores in climate strategy, environmental reporting and corporate citizenship and philanthropy.
Table of Contents
| 27 |
This section presents and analyzes the most relevant aspects of the Group’s different business areas. Specifically, for each one of them, it shows a summary of the income statement and balance sheet, the business activity figures and the most significant ratios.
In 2019, BBVA Group’s business areasreporting structure of the BBVA Group’s business areas differs from the one presented at the end of 2018, as a result of the integration of theNon-Core Real Estate business area into Banking Activity in Spain, now reported as “Spain”. In order to make the 2019 information comparable to 2018, the figures for this area have been reexpressed.
BBVA Group’s business areas are summarized below:
| • | Spain mainly includes the banking and insurance businesses that the Group carries out in this country. |
| • | The United States includes the financial business activity that BBVA carries out in the country and the activity of the BBVA, S.A branch in New York. |
| • | Mexico includes banking and insurance businesses in this country as well as the activity that BBVA Mexico carries out through its branch in Houston. |
| • | Turkey reports the activity of BBVA Garanti group that is mainly carried out in this country and, to a lesser extent, in Romania and the Netherlands. |
| • | South America basically includes banking and insurance businesses in the region. |
| • | Rest of Eurasia includes the banking business activity carried out in Asia and in Europe, excluding Spain. |
The Corporate Center exercises centralized Group functions, including: the costs of the head offices with a corporate function; management of structural exchange rate positions; some equity instruments issuances to ensure an adequate management of the Group’s global solvency. It also includes portfolios whose management is not linked to customer relationships, such as industrial holdings; certain tax assets and liabilities; funds due to commitments to employees; goodwill and other intangible assets.
In addition to these geographical breakdowns, supplementary information is provided for the wholesale business carried out by BBVA, i.e.Corporate & Investment Banking (CIB), in the countries where it operates. This business is relevant to have a broader understanding of the Group’s activity and results due to the important features of the type of customers served, products offered and risks assumed.
Theinformation by business area is based on units at the lowest level and/or companies that comprise the Group, which are assigned to the different areas according to the main region or company group in which they carry out their activity.
As usual, in the case of the different business areas in America, in Turkey and in CIB, the results of applying constantexchange rates are given as well as theyear-on-year variations at current exchange rates.
Table of Contents
| 28 |
MAJOR INCOME STATEMENT ITEMS BY BUSINESS AREA(MILLIONS OF EUROS)
| Business areas | ||||||||||||||||||||||||||||||||||||
| BBVA Group | Spain | The United States | Mexico | Turkey | South America | Rest of Eurasia | S Business areas | Corporate Center | ||||||||||||||||||||||||||||
Jan.-Sep. 19 | ||||||||||||||||||||||||||||||||||||
Net interest income | 13,475 | 2,721 | 1,813 | 4,599 | 2,029 | 2,376 | 130 | 13,667 | (193 | ) | ||||||||||||||||||||||||||
Gross income | 18,124 | 4,307 | 2,442 | 5,912 | 2,548 | 2,884 | 338 | 18,432 | (308 | ) | ||||||||||||||||||||||||||
Operating income | 9,304 | 1,866 | 989 | 3,954 | 1,661 | 1,733 | 126 | 10,329 | (1,025 | ) | ||||||||||||||||||||||||||
Profit/(loss) before tax | 5,938 | 1,489 | 588 | 2,702 | 982 | 1,137 | 129 | 7,027 | (1,089 | ) | ||||||||||||||||||||||||||
Net attributable profit | 3,667 | 1,064 | 478 | 1,965 | 380 | 569 | 103 | 4,558 | (891 | ) | ||||||||||||||||||||||||||
Jan.-Sep. 18(1) | ||||||||||||||||||||||||||||||||||||
Net interest income | 12,899 | 2,775 | 1,665 | 4,110 | 2,204 | 2,226 | 126 | 13,105 | (206 | ) | ||||||||||||||||||||||||||
Gross income | 17,596 | 4,494 | 2,182 | 5,340 | 2,801 | 2,777 | 318 | 17,911 | (315 | ) | ||||||||||||||||||||||||||
Operating income | 8,875 | 1,976 | 811 | 3,562 | 1,884 | 1,513 | 104 | 9,850 | (975 | ) | ||||||||||||||||||||||||||
Profit/(loss) before tax | 6,012 | 1,481 | 687 | 2,539 | 1,264 | 972 | 98 | 7,041 | (1,029 | ) | ||||||||||||||||||||||||||
Net attributable profit | 4,323 | 1,092 | 542 | 1,838 | 485 | 457 | 61 | 4,474 | (151 | ) | ||||||||||||||||||||||||||
| (1) | The income statements for 2018 were reexpressed due to changes in the reallocation of some expenses related to global projects and activities between the Corporate Center and the business areas incorporated in 2019. |
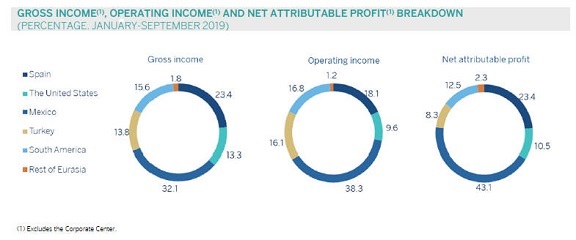
GROSS INCOME(1), OPERATING INCOME(1) AND NET ATTRIBUTABLE PROFIT(1) BREAKDOWN (PERCENTAGE. JANUARY-SEPTEMBER 2019) (1) Excludes the Corporate Center.
Table of Contents
| 29 |
MAJOR BALANCE-SHEET ITEMS AND RISK-WEIGHTED ASSETS BY BUSINESS AREA(MILLIONS OF EUROS) |
| |||||||||||||||||||||||||||||||||||||||||||
| Business areas | ||||||||||||||||||||||||||||||||||||||||||||
| BBVA Group | Spain | The United States | Mexico | Turkey | South America | Rest of Eurasia | S Business areas | Corporate Center | Deletions | NCA&L(1) | ||||||||||||||||||||||||||||||||||
30-09-19 | ||||||||||||||||||||||||||||||||||||||||||||
Loans and advances to customers | 378,775 | 166,217 | 63,210 | 56,510 | 40,776 | 35,875 | 18,473 | 381,061 | 125 | (1,217 | ) | (1,194 | ) | |||||||||||||||||||||||||||||||
Deposits from customers | 379,333 | 180,653 | 67,376 | 52,826 | 41,651 | 36,159 | 4,366 | 383,031 | 311 | (2,499 | ) | (1,510 | ) | |||||||||||||||||||||||||||||||
Off-balance sheet funds | 105,826 | 64,728 | — | 24,155 | 3,460 | 12,986 | 497 | 105,826 | — | — | — | |||||||||||||||||||||||||||||||||
Total assets/liabilities and equity | 709,017 | 372,162 | 88,730 | 107,131 | 67,156 | 55,973 | 21,686 | 712,838 | 10,385 | (12,443 | ) | (1,764 | ) | |||||||||||||||||||||||||||||||
Risk-weighted assets | 368,136 | 105,866 | 65,902 | 57,454 | 58,521 | 45,284 | 17,612 | 350,638 | 17,498 | — | — | |||||||||||||||||||||||||||||||||
31-12-18 | ||||||||||||||||||||||||||||||||||||||||||||
Loans and advances to customers | 374,027 | 170,438 | 60,808 | 51,101 | 41,478 | 34,469 | 16,598 | 374,893 | 990 | (1,857 | ) | — | ||||||||||||||||||||||||||||||||
Deposits from customers | 375,970 | 183,414 | 63,891 | 50,530 | 39,905 | 35,842 | 4,876 | 378,456 | 36 | (2,523 | ) | — | ||||||||||||||||||||||||||||||||
Off-balance sheet funds | 98,150 | 62,559 | — | 20,647 | 2,894 | 11,662 | 388 | 98,150 | — | — | — | |||||||||||||||||||||||||||||||||
Total assets/liabilities and equity | 676,689 | 354,901 | 82,057 | 97,432 | 66,250 | 54,373 | 18,834 | 673,848 | 16,281 | (13,440 | ) | — | ||||||||||||||||||||||||||||||||
Risk-weighted assets | 348,264 | 104,113 | 64,175 | 53,177 | 56,486 | 42,724 | 15,476 | 336,151 | 12,113 | — | — | |||||||||||||||||||||||||||||||||
| (1) | Non-current assets and liabilities held for sale of BBVA Paraguay. |
Since 2019, a column has been included in the balance sheet, which includes thedeletions and balance adjustments between different business areas, especially in terms of the relationship between the areas in which the parent company operates, i.e. Spain, Rest of Eurasia and Corporate Center. In previous years, these deletions were allocated to the different areas, mainly in Banking Activity in Spain. Accordingly, the figures from the previous year have been reexpressed to show comparable series.
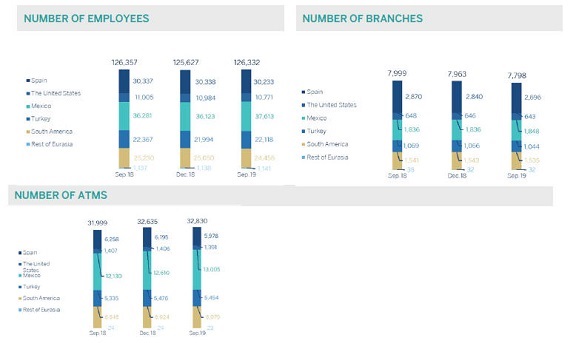
NUMBER OF EMPLOYEES NUMBER OF BRANCHES NUMBER OF ATMS
Table of Contents
| 30 |
Highlights | ||||||||||
• |
Activity affected by the seasonality of the third quarter. | |||||||||
• |
Net Interest income influenced by lower ALCO contribution and the impact of IFRS 16. | |||||||||
• |
Continued decrease in operating expenses. | |||||||||
• |
Positive impact of the sale ofnon-performing andwrite-off portfolios on loan loss provisions and risk indicators.
| |||||||||
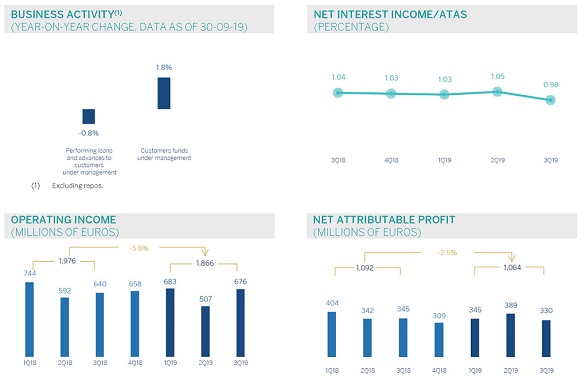
BUSINESS ACTIVITY (1) (YEAR-ON-YEAR CHANGE. DATA AS OF 30-09-19) (1) Excluding repos. NET INTEREST INCOME/ATAS (PERCENTAGE) OPERATING INCOME (MILLIONS OF EUROS) NET ATTRIBUTABLE PROFIT (MILLIONS OF EUROS)BUSINESS ACTIVITY(1) (YEAR-ON-YEAR CHANGE. DATA AS OF 30-09-19) (1) Excluding repos. NET INTEREST INCOME/ATAS (PERCENTAGE) OPERATING INCOME (MILLIONS OF EUROS) NET ATTRIBUTABLE PROFIT (MILLIONS OF EUROS)
Table of Contents
| 31 |
FINANCIAL STATEMENTS AND RELEVANT BUSINESS INDICATORS(MILLIONS OF EUROS AND PERCENTAGE)
Income statement | Jan.-Sep. 19 | D % | Jan.-Sep. 18 | |||||||||
Net interest income | 2,721 | (1.9 | ) | 2,775 | ||||||||
Net fees and commissions | 1,287 | 1.3 | 1,271 | |||||||||
Net trading income | 121 | (62.5 | ) | 324 | ||||||||
Other operating income and expenses | 177 | 42.5 | 124 | |||||||||
Of which: Insurance activities(1) | 385 | 8.1 | 356 | |||||||||
Gross income | 4,307 | (4.2 | ) | 4,494 | ||||||||
Operating expenses | (2,441 | ) | (3.0 | ) | (2,518 | ) | ||||||
Personnel expenses | (1,414 | ) | (0.2 | ) | (1,416 | ) | ||||||
Other administrative expenses | (668 | ) | (23.3 | ) | (871 | ) | ||||||
Depreciation | (359 | ) | 56.1 | (230 | ) | |||||||
Operating income | 1,866 | (5.6 | ) | 1,976 | ||||||||
Impairment on financial assets not measured at fair value through profit or loss | (106 | ) | (63.0 | ) | (287 | ) | ||||||
Provisions or reversal of provisions and other results | (271 | ) | 30.0 | (208 | ) | |||||||
Profit/(loss) before tax | 1,489 | 0.6 | 1,481 | |||||||||
Income tax | (423 | ) | 9.3 | (387 | ) | |||||||
Profit/(loss) for the year | 1,066 | (2.5 | ) | 1,094 | ||||||||
Non-controlling interests | (2 | ) | (20.8 | ) | (2 | ) | ||||||
Net attributable profit | 1,064 | (2.5 | ) | 1,092 | ||||||||
(1) Includes premiums received net of estimated technical insurance reserves.
| ||||||||||||
Balance sheets | 30-09-19 | D % | 31-12-18 | |||||||||
Cash, cash balances at central banks and other demand deposits | 12,719 | (55.4 | ) | 28,545 | ||||||||
Financial assets designated at fair value | 132,383 | 23.4 | 107,320 | |||||||||
Of which: Loans and advances | 35,587 | 17.8 | 30,222 | |||||||||
Financial assets at amortized cost | 196,380 | 0.5 | 195,467 | |||||||||
Of which: Loans and advances to customers | 166,217 | (2.5 | ) | 170,438 | ||||||||
Inter-area positions | 19,145 | 36.5 | 14,026 | |||||||||
Tangible assets | 3,405 | 163.3 | 1,294 | |||||||||
Other assets | 8,129 | (1.5 | ) | 8,249 | ||||||||
Total assets/liabilities and equity | 372,162 | 4.9 | 354,901 | |||||||||
Financial liabilities held for trading and designated at fair value through profit or loss | 80,835 | 13.8 | 71,033 | |||||||||
Deposits from central banks and credit institutions | 46,720 | 1.8 | 45,914 | |||||||||
Deposits from customers | 180,653 | (1.5 | ) | 183,414 | ||||||||
Debt certificates | 33,562 | 7.0 | 31,352 | |||||||||
Inter-area positions | — | — | — | |||||||||
Other liabilities | 21,508 | 48.1 | 14,519 | |||||||||
Economic capital allocated | 8,883 | 2.5 | 8,670 | |||||||||
Relevant business indicators | 30-09-19 | D % | 31-12-18 | |||||||||
Performing loans and advances to customers under management(1) | 162,860 | (2.1 | ) | 166,396 | ||||||||
Non-performing loans | 8,836 | (12.3 | ) | 10,073 | ||||||||
Customer deposits under management(1) | 180,653 | (1.3 | ) | 182,984 | ||||||||
Off-balance sheet funds(2) | 64,728 | 3.5 | 62,559 | |||||||||
Risk-weighted assets | 105,866 | 1.7 | 104,113 | |||||||||
Efficiency ratio (%) | 56.7 | 55.9 | ||||||||||
NPL ratio (%) | 4.6 | 5.1 | ||||||||||
NPL coverage ratio (%) | 59 | 57 | ||||||||||
Cost of risk (%) | 0.08 | 0.21 | ||||||||||
| (1) | Excluding repos. |
| (2) | Includes mutual funds, pension funds and otheroff-balance sheet funds. |
Table of Contents
| 32 |
Activity
The most relevant aspects related to the area’s activity as of September 30, 2019 were:
| • | Lending activity (performing loans under management) was below the figure seen at the end of 2018 (down 2.1% in the last nine months, down 0.8%year-on-year), affected by the seasonality of the third quarter and despite the very positive performance of consumer loans (including credit cards, up 10.8% in the last nine months, up 15.6%year-on-year) and retailandmedium-sized enterprises (up 2.6% in the last nine months, up 4.5%year-on-year), which could not offset the reduction seen in both the mortgage and institutions loans (down 2.8% and down 5.7% respectively in the last nine months, down 3.9% and down 8.0% respectivelyyear-on-year). |
| • | In asset quality, the reduction in NPL balances continued over the quarter, with a positive impact on the area’s NPL ratio, which fell by two basis points to 4.6% as of September 30, 2019 (5.1% as of December 31, 2018). This evolution was mainly explained by the sale ofnon-performing real estate developer loans and write-offs in the second quarter, as well as a lower level ofnon-performing mortgage loans. The coverage stood at 59%, above the closing of 2018 (57%). |
| • | Customerdeposits under management closed the quarter in line with the balance at the end of June 2019, with a slight growth in demand deposits (up 0.4% in the quarter, up 7.2%year-on-year), and a decrease in time deposits of 1.1% (down 16.5%year-on-year). Total deposits, however, decreased compared to the end of December 2018 (down 1.3%) and grew by 2.1%year-on-year. Demand deposits now account for more than 82% of total customer deposits. |
| • | Off-balance sheet fundsperformed well (up 3.5% since December 31, 2018 and up 0.9%year-on-year), in both mutual and pension funds. |
Results
Thenet attributable profit generated by BBVA in Spain in the first nine months of 2019 was €1,064m, below the figure registered in the same period of the previous year (down 2.5%).
The main highlights of the area’s income statement are:
| • | Net interest incomedecreased by 1.9%year-on-year, strongly influenced by the lower contribution from the ALCO portfolios and the effect of IFRS 16 implementation on January 1, 2019. |
| • | Net fees and commissions were 1.3% higher compared to the registered in the same period of the previous year, thanks to a good performance in credit cards, fees charged for insurance sales and those charged to wholesale customers. |
| • | Positive performance fromNTI in the quarter with a contribution of €30m to the profit and loss account, comparedto- €16m between April and June. Theyear-on-year comparison for the first nine months of 2019 was unfavorable (down 62.5%) due to the uneven market performance in 2019, and lower portfolio sales. |
| • | Other operating income and expenses showed ayear-on-year growth (up 42.5%) driven by the strong performance of the net earnings from the insurance business and the lower costs associated with the real estate business, which offset the greater contribution to the Single Resolution Fund (SRF) carried out in the second quarter of 2019. |
| • | The positive trend inoperating expenses (down 3.0%year-on-year) continued as a result of cost reduction plans driving theefficiency ratio to stand at 56.7%. |
| • | Theimpairment on financial assets (down 63.0%year-on-year) is positively affected by the aforementioned sale ofnon-performing loans and write-offs from real estate developers loans carried out in the second quarter of the year. |
| • | Finally,provisions (net) and other gains (losses) closed at -€271m and showed ayear-on-year increase of 30.0%, partly due to higher provisions for contingent liabilities, as well as for real estate assets. |
Table of Contents
| 33 |
| ||||||||||
| Highlights | ||||||||||
•
| Moderation of the activity growth rate.
|
|
| |||||||
•
| Good performance of the recurring revenue items.
| |||||||||
•
| Continued improvement of the efficiency ratio.
| |||||||||
•
| Net attributable profit affected by the impairment on financial assets.
| |||||||||
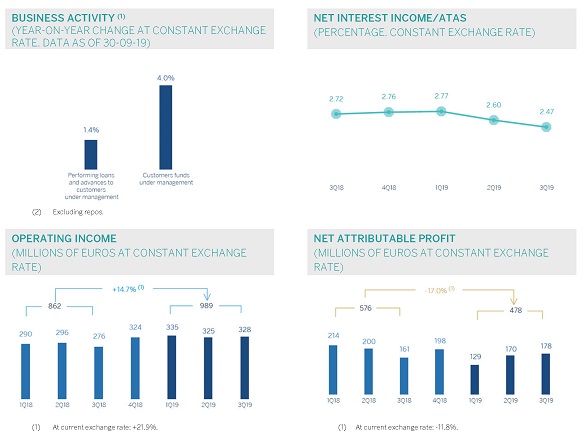
BUSINESS ACTIVITY (1) (YEAR-ON-YEAR CHANGE AT CONSTANT EXCHANGE RATE. DATA AS OF 30-09-19) (2) Excluding repos. NET INTEREST INCOME/ATAS (PERCENTAGE. CONSTANT EXCHANGE RATE) OPERATING INCOME (MILLIONS OF EUROS AT CONSTANT EXCHANGE RATE) (1) At current exchange rate: +21.9%. NET ATTRIBUTABLE PROFIT (MILLIONS OF EUROS AT CONSTANT EXCHANGE RATE) (1) At current exchange rate: -11.8%.
Table of Contents
| 34 |
FINANCIAL STATEMENTS AND RELEVANT BUSINESS INDICATORS(MILLIONS OF EUROS AND PERCENTAGE)
Income statement | Jan.-Sep. 19 | D % | D % (1) | Jan.-Sep. 18 | ||||||||||||
Net interest income | 1,813 | 8.9 | 2.4 | 1,665 | ||||||||||||
Net fees and commissions | 489 | 9.0 | 2.5 | 448 | ||||||||||||
Net trading income | 139 | 99.8 | 88.0 | 69 | ||||||||||||
Other operating income and expenses | 2 | n.s. | n.s. | (0 | ) | |||||||||||
Gross income | 2,442 | 11.9 | 5.3 | 2,182 | ||||||||||||
Operating expenses | (1,454 | ) | 6.0 | (0.3 | ) | (1,372 | ) | |||||||||
Personnel expenses | (839 | ) | 7.1 | 0.7 | (784 | ) | ||||||||||
Other administrative expenses | (449 | ) | (1.5 | ) | (7.3 | ) | (456 | ) | ||||||||
Depreciation | (165 | ) | 25.4 | 18.0 | (132 | ) | ||||||||||
Operating income | 989 | 21.9 | 14.7 | 811 | ||||||||||||
Impairment on financial assets not measured at fair value through profit or loss | (406 | ) | 194.6 | 177.1 | (138 | ) | ||||||||||
Provisions or reversal of provisions and other results | 5 | (64.3 | ) | (66.4 | ) | 14 | ||||||||||
Profit/(loss) before tax | 588 | (14.4 | ) | (19.5 | ) | 687 | ||||||||||
Income tax | (110 | ) | (24.2 | ) | (28.7 | ) | (145 | ) | ||||||||
Profit/(loss) for the year | 478 | (11.8 | ) | (17.0 | ) | 542 | ||||||||||
Non-controlling interests | — | — | — | — | ||||||||||||
Net attributable profit | 478 | (11.8 | ) | (17.0 | ) | 542 | ||||||||||
Balance sheets | 30-09-19 | D % | D %(1) | 31-12-18 | ||||||||||||
Cash, cash balances at central banks and other demand deposits | 7,666 | 58.5 | 50.8 | 4,835 | ||||||||||||
Financial assets designated at fair value | 8,346 | (20.4 | ) | (24.3 | ) | 10,481 | ||||||||||
Of which: Loans and advances | 246 | 57.3 | 49.6 | 156 | ||||||||||||
Financial assets at amortized cost | 69,343 | 9.1 | 3.8 | 63,539 | ||||||||||||
Of which: Loans and advances to customers | 63,210 | 3.9 | (1.1 | ) | 60,808 | |||||||||||
Inter-area positions | — | — | — | — | ||||||||||||
Tangible assets | 951 | 42.3 | 35.4 | 668 | ||||||||||||
Other assets | 2,425 | (4.3 | ) | (9.0 | ) | 2,534 | ||||||||||
Total assets/liabilities and equity | 88,730 | 8.1 | 2.8 | 82,057 | ||||||||||||
Financial liabilities held for trading and designated at fair value through profit or loss | 249 | 6.2 | 1.0 | 234 | ||||||||||||
Deposits from central banks and credit institutions | 4,049 | 20.2 | 14.3 | 3,370 | ||||||||||||
Deposits from customers | 67,376 | 5.5 | 0.3 | 63,891 | ||||||||||||
Debt certificates | 3,710 | 3.1 | (2.0 | ) | 3,599 | |||||||||||
Inter-area positions | 3,024 | 57.0 | 49.3 | 1,926 | ||||||||||||
Other liabilities | 6,654 | 17.7 | 11.9 | 5,654 | ||||||||||||
Economic capital allocated | 3,668 | 8.4 | 3.1 | 3,383 | ||||||||||||
Relevant business indicators | 30-09-19 | D % | D % (1) | 31-12-18 | ||||||||||||
Performing loans and advances to customers under management(2) | 63,326 | 4.2 | (0.9 | ) | 60,784 | |||||||||||
Non-performing loans | 727 | (9.3 | ) | (13.7 | ) | 802 | ||||||||||
Customer deposits under management(2) | 67,374 | 5.5 | 0.3 | 63,888 | ||||||||||||
Off-balance sheet funds(3) | — | — | — | — | ||||||||||||
Risk-weighted assets | 65,902 | 2.7 | (2.3 | ) | 64,175 | |||||||||||
Efficiency ratio (%) | 59.5 | 62.2 | ||||||||||||||
NPL ratio (%) | 1.1 | 1.3 | ||||||||||||||
NPL coverage ratio (%) | 102 | 85 | ||||||||||||||
Cost of risk (%) | 0.87 | 0.39 | ||||||||||||||
| (1) | Figures at constant exchange rate. |
| (2) | Excluding repos. |
| (3) | Includes mutual funds, pension funds and otheroff-balance sheet funds. |
Table of Contents
| 35 |
Activity
Unless expressly stated otherwise, all the comments below on rates of change, for both activity and earnings, will be given at constant exchange rate. These rates, together with changes at current exchange rate, can be seen in the attached tables of financial statements and relevant business indicators. In addition, the quarterly variations are from the quarter ending with respect to the previous quarter.
The most relevant aspects related to the evolution of the area’s activity during the first nine months of 2019 were:
| • | Lending activity (performing loans under management) showed a slight decrease compared to the close of 2018 (down 0.9%), mainly due to a lower dynamism in the commercial portfolio and the contraction in the retail portfolio. On a quarterly basis lending activity showed flat growth that led to ayear-on-year growth rate of 1.4%. |
| • | Thecommercial portfolio showed a flat evolution in the first nine months (up 0.5%) but increasedyear-on-year (up 2.4%). The rest ofretail portfolios, credit cards and consumer loan portfolios, that have higher margins and are increasingly being granted through digital channels, showed a decrease in the last nine months of 2.4%, but increased by 1.6%year-on-year. |
| • | Regardingrisk indicators,non-performing loans showed a significant reduction in the quarter, causing the NPL ratio to stand at 1.1% as of September 30, 2019 while the NPL coverage ratio improved to 102%. |
| • | As the competition for deposits continue to be intense, customerdeposits under management remained flat during the first nine months of 2019 (up 0.3%) but increased 4.0%year-on-year, mainly due to the increase in demand deposits (up 6.6%), which offset the decrease registered in time deposits (down 3.4%). |
Results
The United States generated a cumulative net attributable profit of €478m during the first nine months of 2019, down 17.0%year-on-year, as a result of higher impairments on financial assets in comparison to the same period of the previous year. The most relevant aspects of the evolution of the results are summarized below:
| • | Net interest income continued to perform positively, with an increase of 2.4% onyear-on-year basis, thanks to the updating of yields in the performing loan portfolio and to higher volumes, despite a higher cost of deposits and wholesale funding. |
| • | Net fees and commissions increased by 2.5%year-on-year, mainly due to the increase in those fees related with investment banking, credit cards, merchants and, to a lesser extent, those associated to syndicated loans. |
| • | Higher contribution fromNTI, as a result of higher gains in the ALCO portfolio sales. |
| • | Operating expenses remained flat(down0.3%), which along with the performance of gross income (up 5.3%) led to a further improvement in the efficiency ratio that stood at 59.5%. |
| • | Impairment on financial assets increased by 177.1% in the first nine months of 2019, due to provisions for some specific customers in the commercial portfolio, increased write-offs in consumer loans, and to a lesser extent, the macro scenario adjustments. In addition, the comparison is affected by the release of provisions related to the hurricanes in 2018. As a result, the cumulative cost of risk on September 30, 2019 increased to 0.87% compared to 0.39% on December 31, 2018. |
Table of Contents
| 36 |
| Highlights |
| |||||
• |
Good performance of the lending activity, boosted by growth in the retail portfolio. |
| ||||
• |
Positive trend of customer funds especially in time deposits andoff-balance sheet funds. | |||||
• |
Net interest income growing in line with the activity. | |||||
• |
NTI recovery in the third quarter. | |||||
• |
Higher provisions due to the increase in loan portfolios mainly in consumer. | |||||

BUSINESS ACTIVITY (1) (YEAR-ON-YEAR CHANGE AT CONSTANT EXCHANGE RATE. DATA AS OF 30-09-19) (3) Excluding repos. NET INTEREST INCOME/ATAS (PERCENTAGE. CONSTANT EXCHANGE RATE) OPERATING INCOME (MILLIONS OF EUROS AT CONSTANT EXCHANGE RATE) (1) At current exchange rate: +11.0%. NET ATTRIBUTABLE PROFIT (MILLIONS OF EUROS AT CONSTANT EXCHANGE RATE) (1) At current exchange rate: +6.9%.
Table of Contents
| 37 |
FINANCIAL STATEMENTS AND RELEVANT BUSINESS INDICATORS(MILLIONS OF EUROS AND PERCENTAGE)
Income statement | Jan.-Sep. 19 | D % | D % (1) | Jan.-Sep. 18 | ||||||||||||
Net interest income | 4,599 | 11.9 | 6.5 | 4,110 | ||||||||||||
Net fees and commissions | 952 | 5.7 | 0.6 | 900 | ||||||||||||
Net trading income | 241 | 21.3 | 15.4 | 199 | ||||||||||||
Other operating income and expenses | 121 | (8.0 | ) | (12.5 | ) | 131 | ||||||||||
Gross income | 5,912 | 10.7 | 5.3 | 5,340 | ||||||||||||
Operating expenses | (1,958 | ) | 10.2 | 4.8 | (1,777 | ) | ||||||||||
Personnel expenses | (832 | ) | 9.3 | 4.0 | (761 | ) | ||||||||||
Other administrative expenses | (866 | ) | 4.5 | (0.5 | ) | (829 | ) | |||||||||
Depreciation | (260 | ) | 38.3 | 31.6 | (188 | ) | ||||||||||
Operating income | 3,954 | 11.0 | 5.6 | 3,562 | ||||||||||||
Impairment on financial assets not measured at fair value through profit or loss | (1,238 | ) | 17.3 | 11.6 | (1,055 | ) | ||||||||||
Provisions or reversal of provisions and other results | (14 | ) | n.s. | n.s. | 32 | |||||||||||
Profit/(loss) before tax | 2,702 | 6.4 | 1.2 | 2,539 | ||||||||||||
Income tax | (737 | ) | 5.1 | (0.0 | ) | (701 | ) | |||||||||
Profit/(loss) for the year | 1,965 | 6.9 | 1.7 | 1,838 | ||||||||||||
Non-controlling interests | (0 | ) | 8.4 | 3.2 | (0 | ) | ||||||||||
Net attributable profit | 1,965 | 6.9 | 1.7 | 1,838 | ||||||||||||
Balance sheets | 30-09-19 | D % | D % (1) | 31-12-18 | ||||||||||||
Cash, cash balances at central banks and other demand deposits | 6,831 | (17.4 | ) | (21.3 | ) | 8,274 | ||||||||||
Financial assets designated at fair value | 30,669 | 17.9 | 12.4 | 26,022 | ||||||||||||
Of which: Loans and advances | 2,014 | n.s. | n.s. | 72 | ||||||||||||
Financial assets at amortized cost | 64,580 | 11.9 | 6.7 | 57,709 | ||||||||||||
Of which: Loans and advances to customers | 56,510 | 10.6 | 5.5 | 51,101 | ||||||||||||
Tangible assets | 1,997 | 11.7 | 6.5 | 1,788 | ||||||||||||
Other assets | 3,054 | (16.1 | ) | (19.9 | ) | 3,639 | ||||||||||
Total assets/liabilities and equity | 107,131 | 10.0 | 4.9 | 97,432 | ||||||||||||
Financial liabilities held for trading and designated at fair value through profit or loss | 22,831 | 26.6 | 20.8 | 18,028 | ||||||||||||
Deposits from central banks and credit institutions | 2,105 | 208.0 | 193.7 | 683 | ||||||||||||
Deposits from customers | 52,826 | 4.5 | (0.3 | ) | 50,530 | |||||||||||
Debt certificates | 9,343 | 9.1 | 4.0 | 8,566 | ||||||||||||
Other liabilities | 15,591 | 0.7 | (4.0 | ) | 15,485 | |||||||||||
Economic capital allocated | 4,436 | 7.1 | 2.2 | 4,140 | ||||||||||||
Relevant business indicators | 30-09-19 | D % | D% (1) | 31-12-18 | ||||||||||||
Performing loans and advances to customers under management(2) | 57,040 | 11.0 | 5.9 | 51,387 | ||||||||||||
Non-performing loans | 1,462 | 28.5 | 22.5 | 1,138 | ||||||||||||
Customer deposits under management(2) | 52,390 | 5.3 | 0.5 | 49,740 | ||||||||||||
Off-balance sheet funds(3) | 24,155 | 17.0 | 11.6 | 20,647 | ||||||||||||
Risk-weighted assets | 57,454 | 8.0 | 3.0 | 53,177 | ||||||||||||
Efficiency ratio (%) | 33.1 | 33.3 | ||||||||||||||
NPL ratio (%) | 2.4 | 2.1 | ||||||||||||||
NPL coverage ratio (%) | 136 | 154 | ||||||||||||||
Cost of risk (%) | 2.98 | 3.07 | ||||||||||||||
| (1) | Figures at constant exchange rate. |
| (2) | Excluding repos. |
| (3) | Includes mutual funds, pension funds and otheroff-balance sheet funds. |
Table of Contents
| 38 |
Activity
Unless expressly stated otherwise, all the comments below on rates of change, for both activity and results, will be given at constant exchange rates. These rates, together with changes at current exchange rates, can be found in the attached tables of financial statements and relevant business indicators. In addition, the quarterly variations are from the quarter ending with respect to the previous quarter.
The most relevant aspects related to the area’s activity as of September 30, 2019 were:
| • | Lending activity(performing loans under management) increased by 5.9% during the first nine months of the year (up 7.9%year-on-year). Despite a complex environment and low economic growth, BBVA has retained its leading position in Mexico, with a market share of 22.5% in performing loans according to local figures from the National Banking and Securities Commission (CNBV) at the end of August 2019. |
| • | Thewholesaleportfolio, which represents 50% of total lending, showed an increase of 0.3% in the first nine months of the year, driven mainly by the good performance of corporate loans which also grew by 0.3% during the same time horizon. Theretail portfolio maintained a positive growth trend (up 6.8% compared to December 2018), strongly supported by consumer loans (mainly payroll andcar-purchase loans) and mortgages (up 12.1% and 8.1% respectively compared to December 2018). This performance confirms the bank’s strategy of increasing the placement of these products among its customer base, despite the fall in sales in the automotive sector and the slowdown in the construction sector. |
| • | In terms ofasset qualityindicators, the NPL ratio stood at 2.4% while the NPL coverage ratio stood at 136%. |
| • | Total customerfunds(customer deposits under management, mutual funds and otheroff-balance sheet funds) grew by 3.7% in the first nine months of the year (up 5.3%year-on-year), despite the highly competitive market. The increase is mostly explained by an 11.1% increase in time deposits (up 7.2%year-on-year), mainly driven by the corporate segment, and a 14.3% increase in mutual funds during the same period (up 9.3%year-on-year). Demand deposits continue representing 74% of total customer deposits under management, despite the transfer of demand deposits to time deposits and mutual funds, favored by high interest rates. |
Results
BBVA in Mexico showed a net attributableprofit of €1,965m in the first nine months of 2019, an increase of 1.7%year-on-year. In the third quarter of the year the net attributable profit recorded an improved performance (up 3.3% on a quarterly variation). The most relevant aspects related to the income statement are summarized below:
| • | Strong performance ofnet interest income that registered ayear-on-year growth of 6.5%, driven by higher income from the retail portfolio. |
| • | Net fees and commissions registered a slightyear-on-year improvement of 0.6% due to a higher dynamism in investment banking activities and, credit card, mainly due to higher revenue. |
| • | NTI grew by 15.4% thanks to the continued contribution of exchange differences; additionally, during the third quarter of the year, extraordinary revenues were recorded from sales of securities held for trading and thoseavailable-for-sale. |
| • | Theother operating income and expenses line registered ayear-on-year decrease of 12.5%, mainly due to a higher contribution to the Deposit Guarantee Fund. |
| • | Gross incomegrew by 5.3%year-on-year, which is higher than the increase registered inoperating expenses(up 4.8%) that despite being heavily influenced by the effect of doubling the contribution to the BBVA Bancomer Foundation, remain subject to a strict cost control policy. As a result, the efficiency ratio improved slightly in the first nine months of 2019 standing at 33.1%. |
| • | Theimpairment on financial assetsline grew by 11.6% due to the higher provisions required by the consumer portfolio, caused by higher origination and the negative impact of the deterioration in the macro scenario. The cumulative cost of risk stood at 2.98% during the first nine months of 2019, improving slightly from the 3.07% in 2018. |
| • | In theprovisions (net) and other gains (losses) line, the comparison was negative due to extraordinary income in the first half of 2018 from the sale of holdings in real estate developments by BBVA in Mexico. |
Table of Contents
| 39 |
| ||||
| Highlights | |||
• | Recovery of the activity in Turkish lira. | |||
• | Good performance of the net interest income. | |||
• | Operating expenses growth below the inflation rate. | |||
• | Positive evolution of the recurring revenue items offset by higher loan-loss provisions on financial assets. | |||
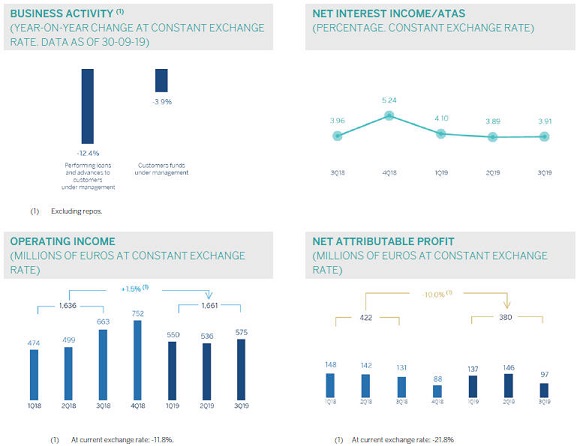
BUSINESS ACTIVITY (1) (YEAR-ON-YEAR CHANGE AT CONSTANT EXCHANGE RATE. DATA AS OF 30-09-19) (1) Excluding repos. NET INTEREST INCOME/ATAS (PERCENTAGE. CONSTANT EXCHANGE RATE) OPERATING INCOME (MILLIONS OF EUROS AT CONSTANT EXCHANGE RATE) (1) At current exchange rate: -11.8%. NET ATTRIBUTABLE PROFIT (MILLIONS OF EUROS AT CONSTANT EXCHANGE RATE) (1) At current exchange rate: -21.8%
Table of Contents
| 40 |
FINANCIAL STATEMENTS AND RELEVANT BUSINESS INDICATORS (MILLIONS OF EUROS AND PERCENTAGE)
|
| |||||||||||||||
Income statement | Jan.-Sep. 19 | D % | D %(1) | Jan.-Sep. 18 | ||||||||||||
Net interest income | 2,029 | (7.9 | ) | 6.0 | 2,204 | |||||||||||
Net fees and commissions | 547 | 6.2 | 22.3 | 515 | ||||||||||||
Net trading income | (65 | ) | n.s. | n.s. | 31 | |||||||||||
Other operating income and expenses | 37 | (27.6 | ) | (16.6 | ) | 51 | ||||||||||
Gross income | 2,548 | (9.0 | ) | 4.7 | 2,801 | |||||||||||
Operating expenses | (886 | ) | (3.3 | ) | 11.3 | (917 | ) | |||||||||
Personnel expenses | (507 | ) | 4.3 | 20.1 | (486 | ) | ||||||||||
Other administrative expenses | (247 | ) | (24.1 | ) | (12.6 | ) | (326 | ) | ||||||||
Depreciation | (132 | ) | 25.8 | 44.8 | (105 | ) | ||||||||||
Operating income | 1,661 | (11.8 | ) | 1.5 | 1,884 | |||||||||||
Impairment on financial assets not measured at fair value through profit or loss | (645 | ) | 1.1 | 16.4 | (638 | ) | ||||||||||
Provisions or reversal of provisions and other results | (34 | ) | n.s. | n.s. | 17 | |||||||||||
Profit/(loss) before tax | 982 | (22.3 | ) | (10.5 | ) | 1,264 | ||||||||||
Income tax | (209 | ) | (24.5 | ) | (13.0 | ) | (277 | ) | ||||||||
Profit/(loss) for the year | 773 | (21.6 | ) | (9.8 | ) | 986 | ||||||||||
Non-controlling interests | (393 | ) | (21.5 | ) | (9.6 | ) | (501 | ) | ||||||||
Net attributable profit | 380 | (21.8 | ) | (10.0 | ) | 485 | ||||||||||
Balance sheets | 30-09-19 | D % | D %(1) | 31-12-18 | ||||||||||||
Cash, cash balances at central banks and other demand deposits | 7,039 | (10.4 | ) | (9.0 | ) | 7,853 | ||||||||||
Financial assets designated at fair value | 5,598 | 1.7 | 3.2 | 5,506 | ||||||||||||
Of which: Loans and advances | 432 | 5.5 | 7.1 | 410 | ||||||||||||
Financial assets at amortized cost | 51,878 | 3.1 | 4.6 | 50,315 | ||||||||||||
Of which: Loans and advances to customers | 40,776 | (1.7 | ) | (0.2 | ) | 41,478 | ||||||||||
Tangible assets | 1,184 | 11.8 | 13.4 | 1,059 | ||||||||||||
Other assets | 1,457 | (4.0 | ) | (2.5 | ) | 1,517 | ||||||||||
Total assets/liabilities and equity | 67,156 | 1.4 | 2.9 | 66,250 | ||||||||||||
Financial liabilities held for trading and designated at fair value through profit or loss | 2,490 | 34.5 | 36.5 | 1,852 | ||||||||||||
Deposits from central banks and credit institutions | 4,938 | (26.7 | ) | (25.6 | ) | 6,734 | ||||||||||
Deposits from customers | 41,651 | 4.4 | 5.9 | 39,905 | ||||||||||||
Debt certificates | 4,836 | (18.9 | ) | (17.7 | ) | 5,964 | ||||||||||
Other liabilities | 10,655 | 15.0 | 16.7 | 9,267 | ||||||||||||
Economic capital allocated | 2,586 | 2.3 | 3.8 | 2,529 | ||||||||||||
Relevant business indicators | 30-09-19 | D % | D %(1) | 31-12-18 | ||||||||||||
Performing loans and advances to customers under management(2) | 39,856 | (2.8 | ) | (1.3 | ) | 40,996 | ||||||||||
Non-performing loans | 3,818 | 32.8 | 34.7 | 2,876 | ||||||||||||
Customer deposits under management(2) | 41,647 | 4.4 | 5.9 | 39,897 | ||||||||||||
Off-balance sheet funds(3) | 3,460 | 19.6 | 21.4 | 2,894 | ||||||||||||
Risk-weighted assets | 58,521 | 3.6 | 5.1 | 56,486 | ||||||||||||
Efficiency ratio (%) | 34.8 | 32.0 | ||||||||||||||
NPL ratio (%) | 7.2 | 5.3 | ||||||||||||||
NPL coverage ratio (%) | 75 | 81 | ||||||||||||||
Cost of risk (%) | 1.99 | 2.44 | ||||||||||||||
| (1) | Figures at constant exchange rate. |
| (2) | Excluding repos. |
| (3) | Includes mutual funds, pension funds and otheroff-balance sheet funds. |
Table of Contents
| 41 |
Activity
Unless expressly stated and communicated otherwise, rates of changes explained ahead, both for activity and for income, will be presented at constant exchange rates. These rates, together with changes at current exchange rates, can be observed in the attached tables of the financial statements and relevant business indicators. In addition, the quarterly variations are from the quarter ending with respect to the previous quarter.
The most relevant aspects related to the area’s activityyear-to-date as of September 30, 2019 were:
| • | Lending activity (performing loans under management) decreased slightly by 1.3%year-to-date (down 12.4%year-on-year) due to the ongoing decrease in foreign currency loans, mainly in U.S. dollars (down 14.7% since December 2018). Recovery of Turkish Lira loans in the third quarter by +1.1% bringing theyear-to-date growth to 3.1%. |
| • | Turkish Liracommercial loans grewyear-to-date thanks to a strong performance in the first quarter supported by the Credit Guarantee Fund (CGF) utilization and short term corporate loans. In quarterly terms, Turkish Lira commercial loans improved as well. Additionally, retail loans remained flat in the quarter as the growth in credit cards was compensated with the downward trend in mortgage loans. |
| • | In terms ofasset quality, the NPL ratio increased to 7.2% from 6.3% as of June 30, 2019 due to the deterioration of some specific wholesale portfolios. The NPL coverage ratio remained stable at 75% reached as of June 30, 2019. |
| • | Customerdeposits (62% of total liabilities in the area as of September 30, 2019) remained the main source of funding for the balance sheet and increased by 5.9% on a year to date basis. |
Results
Turkey generated a net attributableprofit of €380m in the first nine months period of 2019, representing a 10.0% decrease inyear-on-year terms (down 33.4% in the third quarter of 2019). The most significant aspects of theyear-on-year evolution in the income statement are the following:
| • | Positive performance ofnet interest income (up 6.0%) due to successful price management that led to an increase in foreign currency spread and slightly higher inflation-linked bonds contribution. |
| • | Income fromnet fees and commissions grew by 22.3%. This significant increase was mainly driven by the positive performance in payment systems and backed by money transfers andnon-cash loans. |
| • | NTI amounted to -€65m compared with the positive from the previous year, due to the unfavorable market conditions which resulted in lower gains on derivatives and lower results from Global Markets unit. |
| • | Gross income grew 4.7% in the first nine months period of 2019 compared to the same period of 2018, thanks to increased core banking revenues supported with the contribution from inflation-linked bonds. |
| • | Operating expenses increased by 11.3%, significantly below the average inflation rate during the last 12 months of 18.3%. As a result of strict cost-control discipline, the efficiency ratio remained at low levels (34.8%). |
| • | Operating income grew by 1.5%. |
| • | Impairment losses on financial assets rose by 16.4% on a year on year basis due to some negative impacts from the deterioration of retail portfolio. As a result, the cumulative cost of risk of the area stood at 1.99%. |
Table of Contents
| 42 |
| Highlights | |||
• | Positive evolution of activity in the main countries: Argentina, Colombia and Peru. | |||
• | Improved efficiency ratio, supported by the growth in net interest income and the reduction in operating expenses. | |||
• | Higher contribution from the NTI in the third quarter due to the positive performance of foreign currencies operations. | |||
• | Net attributable profit impacted by Argentina’s inflation adjustment. | |||
• | Positive contribution of the main countries to the Group’s attributable profit. | |||
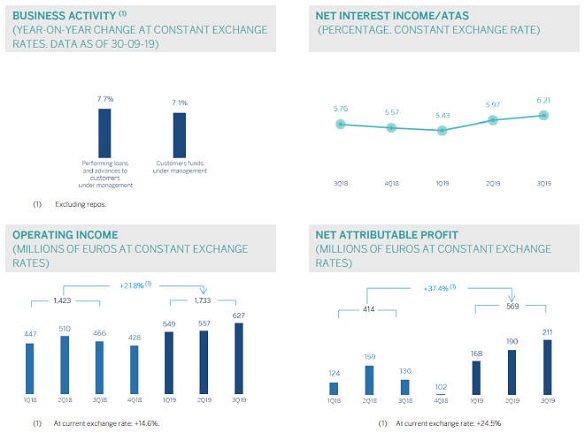
BUSINESS ACTIVITY (1) (YEAR-ON-YEAR CHANGE AT CONSTANT EXCHANGE RATES. DATA AS OF 30-09-19) (1) Excluding repos. NET INTEREST INCOME/ATAS (PERCENTAGE. CONSTANT EXCHANGE RATE) OPERATING INCOME (MILLIONS OF EUROS AT CONSTANT EXCHANGE RATES) (1) At current exchange rate: +14.6%. NET ATTRIBUTABLE PROFIT (MILLIONS OF EUROS AT CONSTANT EXCHANGE RATES) (1) At current exchange rate: +24.5%
Table of Contents
| 43 |
FINANCIAL STATEMENTS AND RELEVANT BUSINESS INDICATORS (MILLIONS OF EUROS AND PERCENTAGE)
Income statement | Jan.-Sep. 19 | D % | D % (1) | Jan.-Sep. 18 | ||||||||||||
Net interest income | 2,376 | 6.7 | 12.9 | 2,226 | ||||||||||||
Net fees and commissions | 424 | (6.8 | ) | (2.1 | ) | 455 | ||||||||||
Net trading income | 417 | 37.9 | 48.8 | 303 | ||||||||||||
Other operating income and expenses | (333 | ) | 60.5 | 54.7 | (207 | ) | ||||||||||
Gross income | 2,884 | 3.9 | 10.8 | 2,777 | ||||||||||||
Operating expenses | (1,151 | ) | (9.0 | ) | (2.5 | ) | (1,264 | ) | ||||||||
Personnel expenses | (584 | ) | (6.8 | ) | 0.3 | (626 | ) | |||||||||
Other administrative expenses | (444 | ) | (18.8 | ) | (13.2 | ) | (547 | ) | ||||||||
Depreciation | (123 | ) | 35.4 | 41.3 | (91 | ) | ||||||||||
Operating income | 1,733 | 14.6 | 21.8 | 1,513 | ||||||||||||
Impairment on financial assets not measured at fair value through profit or loss | (563 | ) | 12.1 | 16.3 | (502 | ) | ||||||||||
Provisions or reversal of provisions and other results | (34 | ) | (11.4 | ) | 3.1 | (38 | ) | |||||||||
Profit/(loss) before tax | 1,137 | 16.9 | 25.5 | 972 | ||||||||||||
Income tax | (321 | ) | (4.0 | ) | (0.2 | ) | (334 | ) | ||||||||
Profit/(loss) for the year | 816 | 27.9 | 39.6 | 638 | ||||||||||||
Non-controlling interests | (247 | ) | 36.4 | 45.0 | (181 | ) | ||||||||||
Net attributable profit | 569 | 24.5 | 37.4 | 457 | ||||||||||||
Balance sheets | 30-09-19 | D % | D % (1) | 31-12-18 | ||||||||||||
Cash, cash balances at central banks and other demand deposits | 7,163 | (20.3 | ) | (13.9 | ) | 8,987 | ||||||||||
Financial assets designated at fair value | 7,101 | 26.0 | 30.8 | 5,634 | ||||||||||||
Of which: Loans and advances | 302 | 134.3 | 135.9 | 129 | ||||||||||||
Financial assets at amortized cost | 38,231 | 4.3 | 7.3 | 36,649 | ||||||||||||
Of which: Loans and advances to customers | 35,875 | 4.1 | 7.0 | 34,469 | ||||||||||||
Tangible assets | 961 | 18.3 | 23.1 | 813 | ||||||||||||
Other assets | 2,518 | 9.9 | 11.8 | 2,290 | ||||||||||||
Total assets/liabilities and equity | 55,973 | 2.9 | 6.8 | 54,373 | ||||||||||||
Financial liabilities held for trading and designated at fair value through profit or loss | 1,641 | 21.0 | 22.3 | 1,357 | ||||||||||||
Deposits from central banks and credit institutions | 3,682 | 19.7 | 18.5 | 3,076 | ||||||||||||
Deposits from customers | 36,159 | 0.9 | 5.6 | 35,842 | ||||||||||||
Debt certificates | 3,307 | 3.2 | 1.4 | 3,206 | ||||||||||||
Other liabilities | 8,808 | 3.1 | 7.3 | 8,539 | ||||||||||||
Economic capital allocated | 2,375 | 0.9 | 6.0 | 2,355 | ||||||||||||
Relevant business indicators | 30-09-19 | D % | D % (1) | 31-12-18 | ||||||||||||
Performing loans and advances to customers under management(2) | 35,598 | 3.1 | 6.0 | 34,518 | ||||||||||||
Non-performing loans | 1,862 | 6.6 | 6.9 | 1,747 | ||||||||||||
Customer deposits under management(3) | 36,164 | 0.5 | 5.2 | �� | 35,984 | |||||||||||
Off-balance sheet funds(4) | 12,986 | 11.4 | 9.1 | 11,662 | ||||||||||||
Risk-weighted assets | 45,284 | 6.0 | 11.0 | 42,724 | ||||||||||||
Efficiency ratio (%) | 39.9 | 46.2 | ||||||||||||||
NPL ratio (%) | 4.4 | 4.3 | ||||||||||||||
NPL coverage ratio (%) | 97 | 97 | ||||||||||||||
Cost of risk (%) | 1.91 | 1.44 | ||||||||||||||
| (1) | Figures at constant exchange rates. |
| (2) | Excluding repos. |
| (3) | Excluding repos and including specific marketable debt securities. |
| (4) | Includes mutual funds, pension funds and otheroff-balance sheet funds. |
Table of Contents
| 44 |
SOUTH AMERICA. DATA PER COUNTRY (MILLIONS OF EUROS)
| Operating income | Net attributable profit | |||||||||||||||||||||||||||||||
Country | Jan.-Sep. 19 | D % | D % (1) | Jan.-Sep. 18 | Jan.-Sep. 19 | D % | D % (1) | Jan.-Sep. 18 | ||||||||||||||||||||||||
Argentina | 421 | 230.6 | n.s. | 127 | 117 | n.s. | n.s. | (4 | ) | |||||||||||||||||||||||
Chile | 103 | (59.2 | ) | (58.1 | ) | 254 | 47 | (59.1 | ) | (58.0 | ) | 116 | ||||||||||||||||||||
Colombia | 483 | 1.7 | 7.3 | 475 | 198 | 12.2 | 18.4 | 177 | ||||||||||||||||||||||||
Peru | 624 | 17.6 | 12.9 | 531 | 153 | 22.8 | 17.8 | 125 | ||||||||||||||||||||||||
Other countries(2) | 101 | (19.5 | ) | (16.4 | ) | 126 | 53 | 20.5 | 28.8 | 44 | ||||||||||||||||||||||
Total | 1,733 | 14.6 | 21.8 | 1,513 | 569 | 24.5 | 37.4 | 457 | ||||||||||||||||||||||||
| (1) | Figures at constant exchange rates. |
| (2) | Venezuela, Paraguay, Uruguay and Bolivia. Additionally, it includes eliminations and other charges. |
SOUTH AMERICA. RELEVANT BUSINESS INDICATORS PER COUNTRY (MILLIONS OF EUROS)
| Argentina | Chile | Colombia | Peru | |||||||||||||||||||||||||||||
| 30-09-19 | 31-12-18 | 30-09-19 | 31-12-18 | 30-09-19 | 31-12-18 | 30-09-19 | 31-12-18 | |||||||||||||||||||||||||
Performing loans and advances to customers under management(1)(2) | 3,332 | 2,928 | 2,036 | 2,059 | 12,240 | 11,759 | 15,035 | 14,010 | ||||||||||||||||||||||||
Non-performing loans and guarantees given(1) | 129 | 60 | 68 | 58 | 703 | 763 | 817 | 744 | ||||||||||||||||||||||||
Customer deposits under management(1)(3) | 4,392 | 4,152 | 9 | 10 | 12,564 | 12,462 | 14,629 | 13,476 | ||||||||||||||||||||||||
Off-balance sheet funds(1)(4) | 658 | 543 | — | — | 1,473 | 1,278 | 1,802 | 1,748 | ||||||||||||||||||||||||
Risk-weighted assets | 6,070 | 8,036 | 2,248 | 2,243 | 14,051 | 12,680 | 19,130 | 15,739 | ||||||||||||||||||||||||
Efficiency ratio (%) | 44.5 | 73.7 | 33.1 | 42.1 | 35.9 | 37.1 | 35.3 | 36.0 | ||||||||||||||||||||||||
NPL ratio (%) | 3.7 | 2.0 | 3.2 | 2.8 | 5.2 | 6.0 | 4.1 | 4.0 | ||||||||||||||||||||||||
NPL coverage ratio (%) | 133 | 111 | 89 | 93 | 96 | 100 | 95 | 93 | ||||||||||||||||||||||||
Cost of risk (%) | 4.49 | 1.60 | 2.36 | 0.81 | 1.66 | 2.16 | 1.50 | 0.98 | ||||||||||||||||||||||||
| (1) | Figures at constant exchange rates. |
| (2) | Excluding repos. |
| (3) | Excluding repos and including specific marketable debt securities. |
| (4) | Includes mutual funds, pension funds and otheroff-balance sheet funds. |
Activity and results
Unless expressly stated otherwise, all the comments below on rates of change, for both activity and results, will be given at constant exchange rates. These rates, together with changes at current exchange rates, can be found in the attached tables of financial statements and relevant business indicators. In addition, the quarterly variations are from the quarter ending with respect to the previous quarter.
The most relevant aspects related to the area’s activity as of September 30, 2019 were:
| • | Lending activity(performing loans under management) remains above the end of the previous year, increasing by 6.0%. Strong performance of the retail portfolio (especially positive in consumer loans and credit cards). |
| • | With regard toasset quality, the NPL ratio stood at 4.4% as of September 30, 2019, slightly higher than the balance as of December 31, 2018, while the coverage stood at 97%, in line with the end of the previous year. |
| • | In terms of customerfunds, customer deposits increased by 5.2% in the first nine months, mainly due to the growth of time deposits and, to a lesser extent, demand deposits.Off-balance sheet funds grew by 9.1% in the same period. |
With respect to results, South America generated cumulative net attributableprofit of €569m in the first nine months of 2019, representing ayear-on-year increase of 37.4% (up 24.5% at current exchange rates). The cumulative impact from January to September 2019 of the inflation in Argentina on the area’s net attributable profit was -€72m.
The most relevant aspects of the income statement are summarized below:
| • | Continued growth of recurring revenue items, that is,net interest incomeandnet fees and commissions, which grew as a whole by 10.3% in the last twelve months (up 4.4% at current exchange rates). |
| • | Higher contribution fromNTI(up 48.8%, and 37.9% at current exchange rates) due to the positive contribution, especially in the third quarter, of foreign exchange operations. |
Table of Contents
| 45 |
| • | Reduction ofoperating costscompared to the same period in the previous financial year (down 2.5%, and down 9.0% at current exchange rates). |
| • | Impairment on financial assetsincreased (up 16.3%, and up 12.1% at current exchange rates), bringing the cumulative cost of risk to 1.91% at the end of September 2019. |
| • | Higherprovisions (net) and other gains (losses)compared to the same period of the previous year (up 3.1%, down 11.4% at constant exchange rates). |
On homogeneous comparison, excluding BBVA Chile due to the sale completed in July 2018, net attributable profit grew by 45.0%year-on-year in the first nine months of 2019 at current exchange rates (up 62.0% at constant exchange rates).
The most significant countries in the business area,Argentina,Colombia andPeru, performed as follows in the first nine months of 2019 in terms of activity and results:
Argentina
| • | Lending activitygrew by 13.8% during the first nine months of 2019, driven by the growth in retail consumer portfolios, credit cards and, to a lesser extent, mortgages. With regard to asset quality, there was an increase in thenon-performing loan ratio, which stood at 3.7% as of September 30, 2019, although it continues to perform better than the system. |
| • | In terms of customerfunds, customer deposits increased by 5.8%, mainly supported by demand deposits, whileoff-balance sheet funds increased by 21.1%, both compared to the figures of December 2018. |
| • | Net attributableprofitstood at €117m, supported by the strong performance of net interest income (driven by an increased contribution from the securities portfolios and a better customer spread) as well as an increase in NTI (positively impacted by the sale of the holding in Prisma Medios de Pago S.A. in the first quarter of 2019 and foreign exchange operations). This strong performance was partially offset by an increase in operating expenses, significantly influenced by the high levels of inflation and greater requirements due to impairment on financial assets as a result of the recent downgrading of the country’s rating. |
Colombia
| • | Lending activitygrew by 4.1% in the first nine months of the year, driven by the performance of retail portfolios (mainly consumer loans and mortgages). In terms of asset quality, the NPL ratio fell to 5.2% as of September 2019. |
| • | Customerdepositsincreased slightly (up 0.8%) compared to the end of the 2018 financial year (up 1.8% year-on-year). |
| • | The net attributableprofitstood at €198m, with an increase of 18.4%year-on-year, driven by the growth of recurring revenue items, the good performance from NTI (up 18.3%), portfolio sales of inflation-linked assets and the valuation of the securities portfolio, the cost containment efforts and lower impairments on financial assets and provisions (down 10.7%). |
Peru
| • | Lending activitywas 7.3% higher than the end of the financial year 2018, mainly due to the wholesale portfolio and also supported by the strong performance of the retail portfolio (mainly consumer lending and mortgages). With regards to asset quality, there was a slight increase in both the NPL and NPL coverage ratios to 4.1% and 95%, respectively. |
| • | Customerdepositsincreased by 8.6% in the first nine months of 2019, mainly due to time deposits (up 24.8% in the last nine months). |
| • | Double-digit growth in net interest income, which grew by 11.6%year-on-year due to higher activity volumes in both the wholesale and retail portfolios. Increase from NTIyear-on-year (up 19.8%) due to the growth of foreign exchange operations. As a result, the net attributableprofitstood at €153m, with ayear-on-year growth of 17.8%. |
Table of Contents
| 46 |
Highlights
| • | Good performance in lending. |
| • | Positive trend of net interest income, in an environment of negative interest rates. |
| • | Controlled growth of operating expenses. |
| • | Improved risk indicators. |
FINANCIAL STATEMENTS AND RELEVANT BUSINESS INDICATORS (MILLIONS OF EUROS AND PERCENTAGE)
Income statement | Jan.-Sep. 19 | D% | Jan.-Sep. 18 | |||||||||
Net interest income | 130 | 3.6 | 126 | |||||||||
Net fees and commissions | 105 | (7.6 | ) | 114 | ||||||||
Net trading income | 94 | 21.4 | 77 | |||||||||
Other operating income and expenses | 9 | n.s. | 1 | |||||||||
Gross income | 338 | 6.4 | 318 | |||||||||
Operating expenses | (212 | ) | (0.6 | ) | (214 | ) | ||||||
Personnel expenses | (103 | ) | 1.9 | (101 | ) | |||||||
Other administrative expenses | (96 | ) | (11.0 | ) | (108 | ) | ||||||
Depreciation | (13 | ) | 191.6 | (5 | ) | |||||||
Operating income | 126 | 21.1 | 104 | |||||||||
Impairment on financial assets not measured at fair value through profit or loss | (7 | ) | (26.2 | ) | (9 | ) | ||||||
Provisions or reversal of provisions and other results | 10 | 193.3 | 3 | |||||||||
Profit/(loss) before tax | 129 | 31.2 | 98 | |||||||||
Income tax | (27 | ) | (29.9 | ) | (38 | ) | ||||||
Profit/(loss) for the year | 103 | 69.4 | 61 | |||||||||
Non-controlling interests | — | — | — | |||||||||
Net attributable profit | 103 | 69.4 | 61 | |||||||||
Balance sheets | 30-09-19 | D% | 31-12-18 | |||||||||
Cash, cash balances at central banks and other demand deposits | 228 | (4.1 | ) | 238 | ||||||||
Financial assets designated at fair value | 494 | (1.9 | ) | 504 | ||||||||
Of which: Loans and advances | — | — | — | |||||||||
Financial assets at amortized cost | 20,650 | 16.0 | 17,799 | |||||||||
Of which: Loans and advances to customers | 18,473 | 11.3 | 16,598 | |||||||||
Inter-area positions | — | — | — | |||||||||
Tangible assets | 74 | 87.5 | 39 | |||||||||
Other assets | 239 | (5.8 | ) | 254 | ||||||||
Total assets/liabilities and equity | 21,686 | 15.1 | 18,834 | |||||||||
Financial liabilities held for trading and designated at fair value through profit or loss | 47 | 13.2 | 42 | |||||||||
Deposits from central banks and credit institutions | 919 | (27.7 | ) | 1,271 | ||||||||
Deposits from customers | 4,366 | (10.5 | ) | 4,876 | ||||||||
Debt certificates | 622 | 192.3 | 213 | |||||||||
Inter-area positions | 14,466 | 26.8 | 11,406 | |||||||||
Other liabilities | 420 | 55.7 | 270 | |||||||||
Economic capital allocated | 844 | 11.6 | 757 | |||||||||
Table of Contents
| 47 |
Relevant business indicators | 30-09-19 | D% | 31-12-18 | |||||||||
Performing loans and advances to customers under management(1) | 18,464 | 11.5 | 16,553 | |||||||||
Non-performing loans | 364 | (15.3 | ) | 430 | ||||||||
Customer deposits under management(1) | 4,366 | (10.5 | ) | 4,876 | ||||||||
Off-balance sheet funds(2) | 497 | 28.1 | 388 | |||||||||
Risk-weighted assets | 17,612 | 13.8 | 15,476 | |||||||||
Efficiency ratio (%) | 62.8 | 69.3 | ||||||||||
NPL ratio (%) | 1.3 | 1.7 | ||||||||||
NPL coverage ratio (%) | 97 | 83 | ||||||||||
Cost of risk (%) | 0.05 | (0.11 | ) | |||||||||
| (1) | Excluding repos. |
| (2) | Includes mutual funds, pension funds and otheroff-balance sheet funds. |
Activity and results
The most relevant aspects of the activity and results in the area as of September 30, 2019 were:
| • | Lending activity(performing loans under management) recorded an increase of 11.5% in the first nine months of 2019 (up 10.4%year-on-year), mainly explained by the good performance in Asia. |
| • | Credit riskindicators improved in the first nine months of the year: the NPL ratio closed at 1.3% and the NPL coverage ratio at 97% (1.7% and 83%, respectively at the end of December 2018). |
| • | Customerdepositsunder management fell by 10.5% in the first nine months of 2019, affected by the negative interest rate environment in Europe. |
| • | Regardingresults, good performance ofnet interest income(up 3.6%year-on-year) and especially of NTI (up 21.4%year-on-year) thanks to the contribution of commercial activity in the Global Markets unit, partially offset by a reduction innet fees and commissions(down 7.6%year-on-year although improved 8.9% in the quarter).Operating expensesshowed a decline (down 0.6%year-on-year) due to the continuous management of discretionary spending. Theimpairment on financial assetsline showed a decrease compared to the first nine months of the previous year (down 26.2%), which included specific provisions of some wholesale customers in Europe and Asia.Provisionsperformance compared to 2018 is affected by higher releases last year, as result of lower loan-loss provisions requirements in Europe. The area’s cumulative net attributableprofitfor the first nine months of 2019 was €103m (up 69.4%year-on-year). |
Table of Contents
| 48 |
FINANCIAL STATEMENTS (MILLIONS OF EUROS AND PERCENTAGE)
Income statement | Jan.-Sep. 19 | D% | Jan.-Sep. 18 | |||||||||
Net interest income | (193 | ) | (6.5 | ) | (206 | ) | ||||||
Net fees and commissions | (61 | ) | 22.9 | (50 | ) | |||||||
Net trading income | (53 | ) | (44.1 | ) | (96 | ) | ||||||
Other operating income and expenses | (0 | ) | n.s. | 37 | ||||||||
Gross income | (308 | ) | (2.2 | ) | (315 | ) | ||||||
Operating expenses | (718 | ) | 8.7 | (660 | ) | |||||||
Personnel expenses | (425 | ) | 9.2 | (389 | ) | |||||||
Other administrative expenses | (153 | ) | 29.0 | (118 | ) | |||||||
Depreciation | (140 | ) | (8.3 | ) | (153 | ) | ||||||
Operating income | (1,025 | ) | 5.2 | (975 | ) | |||||||
Impairment on financial assets not measured at fair value through profit or loss | — | — | — | |||||||||
Provisions or reversal of provisions and other results | (64 | ) | 18.3 | (54 | ) | |||||||
Profit/(loss) before tax | (1,089 | ) | 5.8 | (1,029 | ) | |||||||
Income tax | 203 | (15.9 | ) | 241 | ||||||||
Profit/(loss) after tax from ongoing operations | (886 | ) | 12.5 | (788 | ) | |||||||
Results from corporate operations(1) | — | — | 633 | |||||||||
Profit/(loss) for the year | (886 | ) | n.s. | (154 | ) | |||||||
Non-controlling interests | (5 | ) | n.s. | 3 | ||||||||
Net attributable profit | (891 | ) | n.s. | (151 | ) | |||||||
Net attributable profit excluding results from corporate operations | (891 | ) | 13.6 | (784 | ) | |||||||
(1) Includes net capital gains from the sale of BBVA Chile.
| ||||||||||||
Balance sheets | 30-09-19 | D% | 31-12-18 | |||||||||
Cash, cash balances at central banks and other demand deposits | 811 | 10.8 | 732 | |||||||||
Financial assets designated at fair value | 2,610 | (4.7 | ) | 2,738 | ||||||||
Of which: Loans and advances | — | — | — | |||||||||
Financial assets at amortized cost | 1,839 | (31.0 | ) | 2,665 | ||||||||
Of which: Loans and advances to customers | 125 | (87.3 | ) | 990 | ||||||||
Inter-area positions | (19,145 | ) | 36.5 | (14,026 | ) | |||||||
Tangible assets | 2,217 | 40.9 | 1,573 | |||||||||
Other assets | 22,053 | (2.4 | ) | 22,598 | ||||||||
|
|
|
|
|
| |||||||
Total assets/liabilities and equity | 10,385 | (36.2 | ) | 16,281 | ||||||||
|
|
|
|
|
| |||||||
Financial liabilities held for trading and designated at fair value through profit or loss | 16 | (58.0 | ) | 39 | ||||||||
Deposits from central banks and credit institutions | 737 | 0.6 | 733 | |||||||||
Deposits from customers | 311 | n.s. | 36 | |||||||||
Debt certificates | 7,985 | (2.8 | ) | 8,212 | ||||||||
Inter-area positions | (29,988 | ) | 31.5 | (22,808 | ) | |||||||
Other liabilities | 682 | (65.5 | ) | 1,975 | ||||||||
Economic capital allocated | (22,793 | ) | 4.4 | (21,833 | ) | |||||||
Shareholders’ funds | 53,434 | 7.0 | 49,927 | |||||||||
Table of Contents
| 49 |
The Corporate Center registered a net attributableloss of €891m in the first nine months of 2019, compared to the loss of €151m in the same period of 2018, which included €633m profit of corporate operations generated by the capital gains (net of taxes) from the sale of BBVA Chile. The most relevant aspects as of September 30, 2019 were:
| • | Positive performance fromNTIduring the third quarter of the year, which contributed €20m to the income statement. As a result, theyear-on-year comparison in this line is positive, since the losses generated in the first nine months of 2019 were lower than the cumulative amount during the same period of the previous year, mainly due to higher capital gains from the industrial and financial portfolio. |
| • | Other operating income and expensesincludes primarily the Telefónica, S.A. dividends, as well as the earnings of companies accounted for using the equity method, including holdings in real estate companies. |
| • | Operating expenses include those expenses of the holding that have a corporate function and whoseyear-on- year increase (up 8.7%) is associated with those expenses related to data and cybersecurity. |
Table of Contents
| 50 |
Other information: Corporate & Investment Banking
| Highlights | ||||
• | Good performance of activity with customers. | |||
| • | Leadership position in green and sustainable loans. | ||
• | Positive evolution of net interest income, linked to the activity. | |||
• | Net attributable profit impacted by lower net trading income and higher impairments on financial assets. | |||

BUSINESS ACTIVITY (1) (YEAR-ON-YEAR CHANGE AT CONSTANT EXCHANGE RATES. DATA AS OF 30-09-19) (1) Excluding repos. GROSS INCOME/ATAS (PERCENTAGE. CONSTANT EXCHANGE RATES) OPERATING INCOME (MILLIONS OF EUROS AT CONSTANT EXCHANGE RATES) (1) At current exchange rate: -4.7%. NET ATTRIBUTABLE PROFIT (MILLIONS OF EUROS AT CONSTANT EXCHANGE RATES) (1) At current exchange rate: -14.0%.
Table of Contents
| 51 |
FINANCIAL STATEMENTS AND RELEVANT BUSINESS INDICATORS(MILLIONS OF EUROS AND PERCENTAGE)
Income statement | Jan.-Sep. 19 | D % | D % (1) | Jan.-Sep. 18 | ||||||||||||
Net interest income | 1,139 | 6.6 | 9.8 | 1,068 | ||||||||||||
Net fees and commissions | 536 | (0.4 | ) | 0.3 | 539 | |||||||||||
Net trading income | 569 | (16.6 | ) | (14.6 | ) | 682 | ||||||||||
Other operating income and expenses | (42 | ) | 37.6 | 27.5 | (30 | ) | ||||||||||
Gross income | 2,203 | (2.4 | ) | (0.1 | ) | 2,258 | ||||||||||
Operating expenses | (790 | ) | 1.8 | 1.8 | (776 | ) | ||||||||||
Personnel expenses | (354 | ) | 3.8 | 3.4 | (341 | ) | ||||||||||
Other administrative expenses | (341 | ) | (3.5 | ) | (2.9 | ) | (353 | ) | ||||||||
Depreciation | (95 | ) | 16.3 | 15.6 | (82 | ) | ||||||||||
Operating income | 1,413 | (4.7 | ) | (1.2 | ) | 1,482 | ||||||||||
Impairment on financial assets not measured at fair value through profit or loss | (154 | ) | 193.6 | n.s. | (52 | ) | ||||||||||
Provisions or reversal of provisions and other results | 24 | n.s. | n.s. | (27 | ) | |||||||||||
Profit/(loss) before tax | 1,283 | (8.5 | ) | (6.2 | ) | 1,403 | ||||||||||
Income tax | (329 | ) | (0.2 | ) | 2.3 | (330 | ) | |||||||||
Profit/(loss) for the year | 954 | (11.1 | ) | (8.9 | ) | 1,073 | ||||||||||
Non-controlling interests | (220 | ) | 0.4 | 10.8 | (219 | ) | ||||||||||
Net attributable profit | 734 | (14.0 | ) | (13.5 | ) | 853 | ||||||||||
(1) Figures at constant exchange rates.
| ||||||||||||||||
Balance sheets | 30-09-19 | D % | D % (1) | 31-12-18 | ||||||||||||
Cash, cash balances at central banks and other demand deposits | 4,683 | (7.9 | ) | (10.9 | ) | 5,087 | ||||||||||
Financial assets designated at fair value | 112,594 | 21.9 | 21.1 | 92,391 | ||||||||||||
Of which: Loans and advances | 35,714 | 23.9 | 23.9 | 28,826 | ||||||||||||
Financial assets at amortized cost | 74,834 | 14.8 | 13.6 | 65,167 | ||||||||||||
Of which: Loans and advances to customers | 62,398 | 6.3 | 5.0 | 58,720 | ||||||||||||
Inter-area positions | — | — | — | — | ||||||||||||
Tangible assets | 80 | 178.0 | 172.2 | 29 | ||||||||||||
Other assets | 13,904 | n.s. | n.s. | 2,179 | ||||||||||||
Total assets/liabilities and equity | 206,095 | 25.0 | 23.9 | 164,852 | ||||||||||||
Financial liabilities held for trading and designated at fair value through profit or loss | 94,136 | 28.7 | 28.5 | 73,163 | ||||||||||||
Deposits from central banks and credit institutions | 16,917 | (13.1 | ) | (14.2 | ) | 19,464 | ||||||||||
Deposits from customers | 37,268 | (13.5 | ) | (14.8 | ) | 43,069 | ||||||||||
Debt certificates | 2,431 | 25.9 | 23.5 | 1,931 | ||||||||||||
Inter-area positions | 46,989 | 138.0 | 133.6 | 19,742 | ||||||||||||
Other liabilities | 4,277 | (1.6 | ) | (2.5 | ) | 4,348 | ||||||||||
Economic capital allocated | 4,077 | 30.0 | 28.8 | 3,136 | ||||||||||||
(1) Figures at constant exchange rates. | ||||||||||||||||
Relevant business indicators | 30-09-19 | D % | D % (1) | 31-12-18 | ||||||||||||
Performing loans and advances to customers under management(2) | 61,732 | 5.0 | 3.8 | 58,796 | ||||||||||||
Non-performing loans | 1,181 | 55.1 | 54.2 | 762 | ||||||||||||
Customer deposits under management(2) | 37,220 | (6.1 | ) | (7.3 | ) | 39,642 | ||||||||||
Off-balance sheet funds(3) | 1,124 | 13.2 | 17.6 | 993 | ||||||||||||
Efficiency ratio (%) | 35.9 | 34.5 | ||||||||||||||
| (1) | Figures at constant exchange rates. |
| (2) | Excluding repos. |
| (3) | Includes mutual funds, pension funds and otheroff-balance sheet funds. |
Table of Contents
| 52 |
Activity
Unless expressly stated otherwise, all the comments below onrates of change, for both activity and results, will be given at constant exchange rates. These rates, together with changes at current exchange rates, can be found in the attached tables of financial statements and relevant business indicators. In addition, the quarterly variations are from the quarter ending with respect to the previous quarter.
The most relevant aspects related to the area’s activity as of September 30, 2019 were:
| • | Despite the existence of pressure on margins and excess liquidity in the market,lending activity(performing loans under management) increased by 3.8% compared to the figure at the end of December 2018 (up 7.2 year-on-year). By geographic area, the comparison in Spain, Mexico, South America and Rest of Eurasia was more favorable. |
| • | Customer fundsfell 6.7% compared to the end of period balance as of December 31, 2018 (down 5.3% year-on-year), although there was a good performance of demand deposits and mutual funds (up 5.5% and 17.6%, respectively), it did not offset the decrease in time deposits (down 26.0%). |
| • | BBVA was one of the most active financial institutions in sustainability and digitalization, two processes that the Bank wants to continue to promote together with its customers. |
| • | During the first nine months of 2019, BBVA was one of the most active institutions in the area ofsustainable financing, having participated in 30 transactions classified as green and/or linked to sustainability criteria (ESG score, environmental and social KPIs) certified by reputable independent consultants. Of these 30 transactions, 20 were led by BBVA as a sustainability coordinator. |
| • | This BBVA leadership was registered with relevant operations in different countries, Spain, the United Kingdom, France, Portugal, Belgium, Mexico and China, in various sectors including hotelier, energy (gas and electricity), recycling and automotive components, among others. The 30 operations as of September compared positively with the 23 operations for the whole of 2018. |
| • | In terms of innovation, following the recognition of financing via blockchain in 2018, BBVA was a pioneer in linking a company’s degree of digitization to its bank financing with theso-calledDigital LoanorD-loan. The syndicated loan, placed in Asia and led by BBVA, is the first of its kind worldwide, and demonstrates that the Bank remains at the forefront of innovative solutions for its customers. |
Results
CIB generated a net attributable profit of €734m in the first nine months of 2019, down 13.5%year-on-year (down 3.2% in the quarter). The most relevant aspects of theyear-on-year changes in the income statement for Corporate & Investment Banking are summarized below:
| • | Good performance ofnet interest income(up 9.8%) linked to the activity, in a complex environment of interest rate cuts. |
| • | Slight increase of net fees andcommissions(up 0.3%), supported by the transactional business and bond origination in Global Markets. By geographic area, the increases in Spain and Mexico stand out. |
| • | NTIdecreasedyear-on-year (down 14.6%) resulting from a scenario of relevant cuts in interest rates during the year, which has offset the good performance of activity with customers and the increasing levels of leverage in all products, especially foreign exchange. |
| • | Despite the complex market environment,gross incomeremained stable onyear-on-year terms (down 0.1%). |
| • | Efficient management ofoperating expenses, with increased investment in technological projects and containment of discretionary expenses. |
| • | Impairment on financial assetsincreased, mainly due to higher loan-loss provisions ofone-off customers in Turkey, Argentina and the United States. |
Table of Contents
SIGNATURE
Pursuant to the requirements of the Securities Exchange Act of 1934, the registrant has duly caused this report to be signed on its behalf by the undersigned, thereunto duly authorized.
| Banco Bilbao Vizcaya Argentaria, S.A. | ||||||
Date: October 31, 2019 | By: | /s/ María Ángeles Peláez Morón | ||||
Name: María Ángeles Peláez Morón | ||||||
Title: Authorized representative | ||||||