UNITED STATES
SECURITIES AND EXCHANGE COMMISSION
WASHINGTON, D.C. 20549
FORM6-K
REPORT OF FOREIGN ISSUER
PURSUANT TO RULE13a-16 OR15d-16
UNDER THE SECURITIES EXCHANGE ACT OF 1934
For the month of January, 2020
Commission file number:1-10110
BANCO BILBAO VIZCAYA ARGENTARIA, S.A.
(Exact name of Registrant as specified in its charter)
BANK BILBAO VIZCAYA ARGENTARIA, S.A.
(Translation of Registrant’s name into English)
Calle Azul 4,
28050 Madrid
Spain
(Address of principal executive offices)
Indicate by check mark whether the registrant files or will file annual reports under cover of Form20-F or Form40-F:
Form20-F ☒ Form40-F ☐
Indicate by check mark if the registrant is submitting the Form6-K in paper as permitted by RegulationS-T Rule 101(b)(1):
Yes ☐ No ☒
Indicate by check mark if the registrant is submitting the Form6-K in paper as permitted by RegulationS-T Rule 101(b)(7):
Yes ☐ No ☒

2019 Results January 31st, 2020 BBVA Creating Opportunities

Disclaimer This document is only provided for information purposes and does not constitute, nor should it be interpreted as, an offer to sell or exchange or acquire, or an invitation for offers to buy securities issued by any of the aforementioned companies. Any decision to buy or invest in securities in relation to a specific issue must be made solely and exclusively on the basis of the information set out in the pertinent prospectus filed by the company in relation to such specific issue. No one who becomes aware of the information contained in this report should regard it as definitive, because it is subject to changes and modifications. This document contains or may contain forward looking statements (in the usual meaning and within the meaning of the US Private Securities Litigation Reform Act of 1995) regarding intentions, expectations or projections of BBVA or of its management on the date thereof, that refer to or incorporate various assumptions and projections, including projections about the future earnings of the business. The statements contained herein are based on our current projections, but the actual results may be substantially modified in the future by various risks and other factors that may cause the results or final decisions to differ from such intentions, projections or estimates. These factors include, without limitation, (1) the market situation, macroeconomic factors, regulatory, political or government guidelines, (2) domestic and international stock market movements, exchange rates and interest rates, (3) competitive pressures, (4) technological changes, (5) alterations in the financial situation, creditworthiness or solvency of our customers, debtors or counterparts. These factors could cause or result in actual events differing from the information and intentions stated, projected or forecast in this document or in other past or future documents. BBVA does not undertake to publicly revise the contents of this or any other document, either if the events are not as described herein, or if such events lead to changes in the information contained in this document. This document may contain summarised information or information that has not been audited, and its recipients are invited to consult the documentation and public information filed by BBVA with stock market supervisory bodies, in particular, the prospectuses and periodical information filed with the Spanish Securities Exchange Commission (CNMV) and the Annual Report on Form 20-F and information on Form 6-K that are filed with the US Securities and Exchange Commission. Distribution of this document in other jurisdictions may be prohibited, and recipients into whose possession this document comes shall be solely responsible for informing themselves about, and observing any such restrictions. By accepting this document you agree to be bound by the foregoing restrictions.
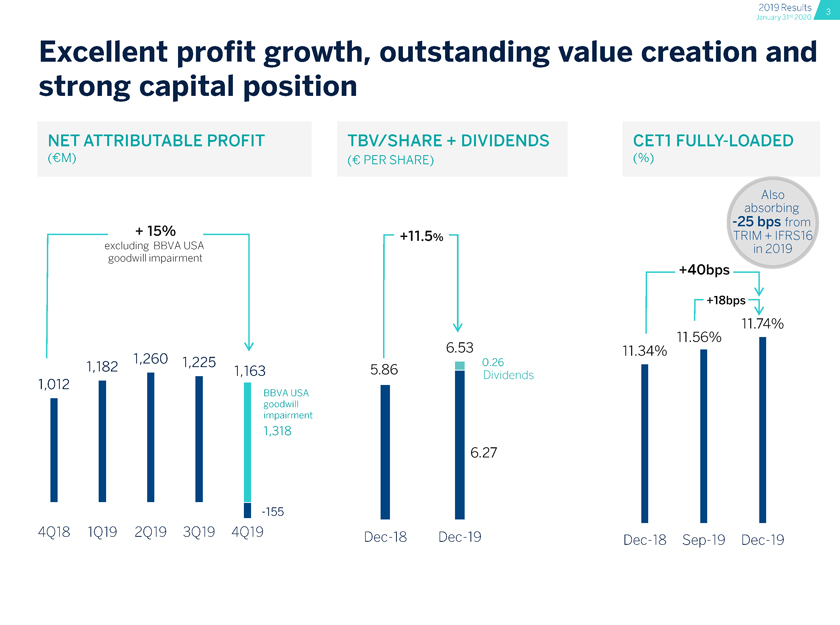
2019 Results January 31st 2020 2019 Results January 31st 2020 Excellent profit growth, outstanding value creation and strong capital position NET ATTRIBUTABLE PROFIT TBV/SHARE + DIVIDENDS CET1 FULLY-LOADED (M) ( PER SHARE) (%) Also absorbing -25 bps from + 15% +11.5% -\ TRIM + IFRS16 excluding BBVA USA in 2019 goodwill impairment +40bps? +18bps— 11.74% 11.56% 1,260 6?53 11.34% 1,012 1182 ? 1225 1,163 5.86 0.26 Dividends 1,012 BBVA USA goodwill impairment 1,318 6.27 | -155 4Q18 1Q19 2Q19 3Q19 4Q19 Dec-18 Dec-19 Dec-18 Sep-19 Dec-19
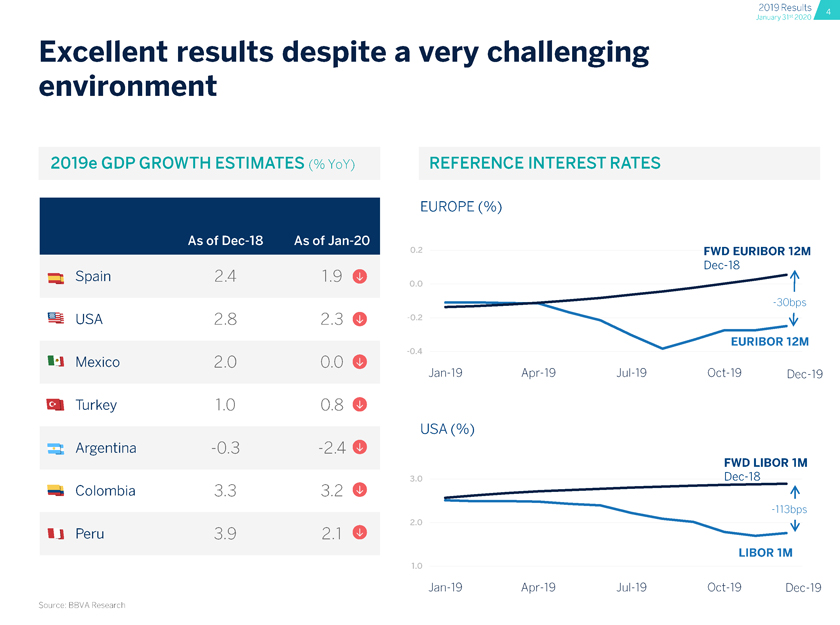
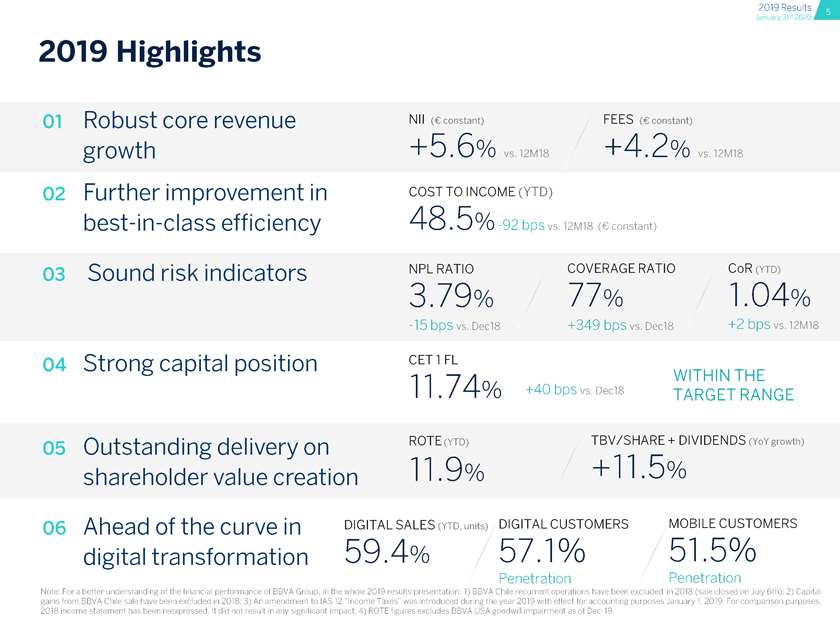
Excellent results despite a very challenging environment 2019e GDP GROWTH ESTIMATES (%YoY) REFERENCE INTEREST RATES EUROPE(%) As of Dec-18 As of Jan-20 0.2 FWD EURIBOR 12M Spain 2.4 1.9 0.0 Dec-18 -30bps usa 2.8 2.3 -0.2 O A EURIBOR 12M Mexico 2.0 0.0 -0.4 Jan-19 Apr-19 Jul-19 Oct-19 Dec-19 Turkey 1.0 0.8 USA (%) Argentina -0.3 -2.4 FWD LIBOR 1M Colombia 3.3 3.2 3.0 Dec-18 ?J Peru 3.9 2.1 2.0 1.0 -113bps LIBOR 1M Jan-19 Apr-19 Jul-19 Oct-19 Dec-19 Source: BBVA Research 2019 Highlights Robust core revenue NII(constant) FEES (constant) growth +5.6% vs. 12M18 +4.2% vs. 12M18 Further improvement in cost to income (ytd) best-in-class efficiency 48.5% -92 bps vs. 12M18 ( constant) Sound risk indicators nplratio coverageratio cor(ytd) 3.79% 77% 1.04% -15 bps vs. Dec18 +349 bps vs. Dec18 +2 bps vs. 12M18 Strong capital position cet1fl within the 11.74% +40 bps vs. Dec18 TARGET RANGE Outstanding delivery on rote(ytd) tbv/share+dividends(vov,growth) shareholder value creation 11.9% +11.5% Ahead of the curve in digital SALES (YTD, units) digital customers mobile customers digital transformation 59.4% 57.1% 51.5% Penetration Penetration Note: For a better understanding of the financial performance of BBVA Group, in the whole 2019 results presentation: 1) BBVA Chile recurrent operations have been excluded in 2018 (sale closed on July 6th); 2) Capital gains from BBVA Chile sale have been excluded in 2018: 3) An amendment to IAS 12 “Income Taxes” was introduced during the year 2019 with effect for accounting purposes January 1, 2019. For comparison purposes, 2018 income statement has been reexpressed. It did not result in any significant impact: 4) ROTE figures excludes BBVA USA goodwill impairment as of Dec-19. 2019 Results January 31st 2020 2019 Results January 31st 2020
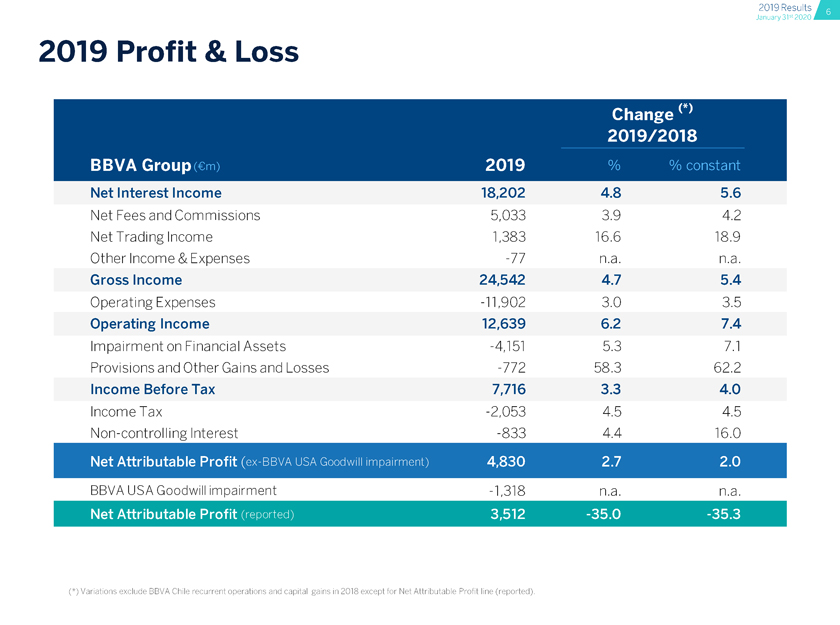
2019 Profit & Loss Net Interest Income 18,202 4.8 5.6 Net Fees and Commissions 5,033 3.9 4.2 Net Trading Income 1,383 16.6 18.9 Other Income & Expenses -77 n.a. n.a. Gross Income 24,542 4.7 5.4 Operating Expenses -11,902 3.0 3.5 Operating Income 12,639 6.2 7.4 Impairment on Financial Assets -4,151 5.3 7.1 Provisions and Other Gains and Losses -772 58.3 62.2 Income Before Tax 7,716 3.3 4.0 Income Tax -2,053 4.5 4.5 Non-controlling Interest -833 4.4 16.0 BBVA USA Goodwill impairment -1,318 n.a. n.a.
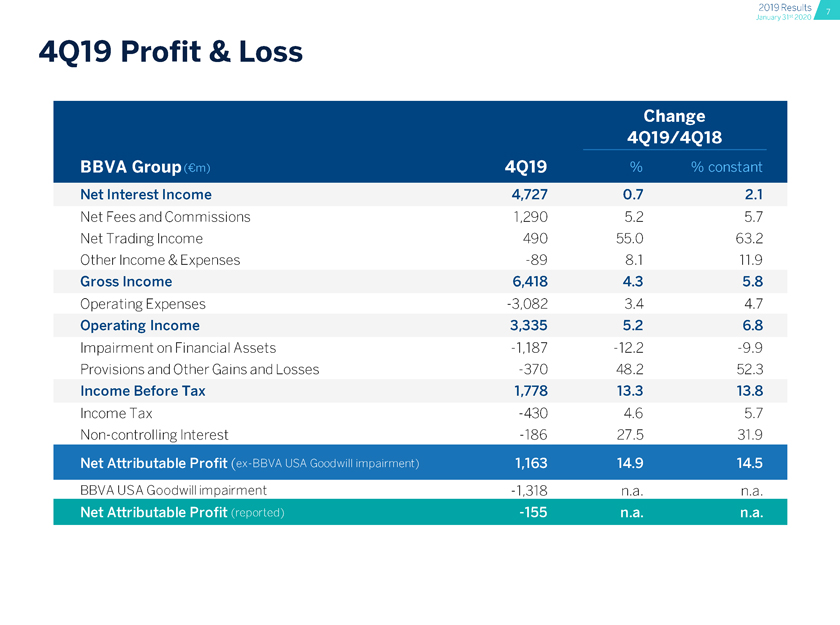
4Q19 Profit & Loss Net Interest Income Net Fees and Commissions Net Trading Income Other Income & Expenses Gross Income Operating Expenses Operating Income Impairment on Financial Assets Provisions and Other Gains and Losses Income Before Tax Income Tax Non-controlling Interest BBVA USA Goodwill impairment Net Interest Income 18,202 4.8 5.6 Net Fees and Commissions 5,033 3.9 4.2 Net Trading Income 1,383 16.6 18.9 Other Income & Expenses -77 n.a. n.a. Gross Income 24,542 4.7 5.4 Operating Expenses -11,902 3.0 3.5 Operating Income 12,639 6.2 7.4 Impairment on Financial Assets -4,151 5.3 7.1 Provisions and Other Gains and Losses -772 58.3 62.2 Income Before Tax 7,716 3.3 4.0 Income Tax -2,053 4.5 4.5 Non-controlling Interest -833 4.4 16.0 -1,318 n.a. n.a. 2019 Results January 31st 2020 2019 Results January 31st 2020
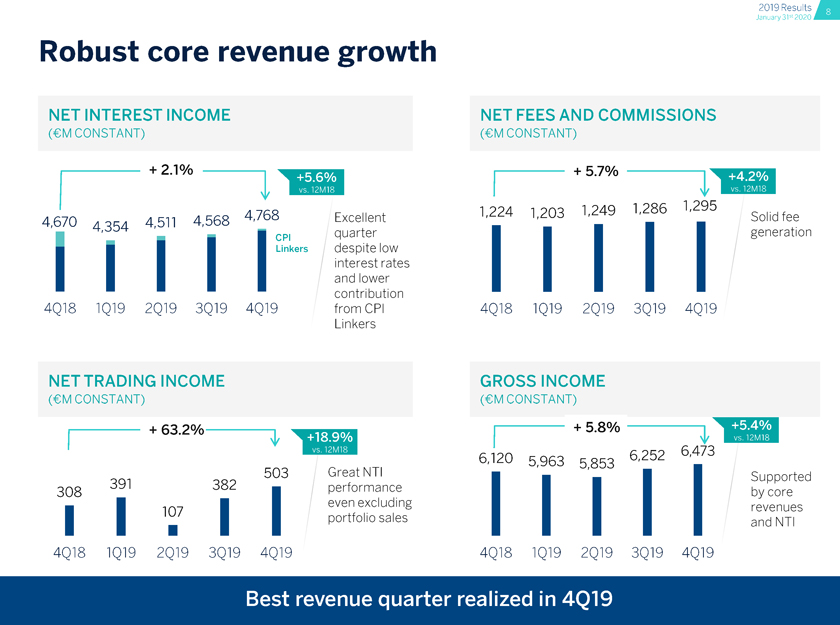
Robust core revenue growth NET INTEREST INCOME NET FEES AND COMMISSIONS (M CONSTANT) (M CONSTANT) Net Interest Income 18,202 4.8 5.6 Net Fees and Commissions 5,033 3.9 4.2 Net Trading Income 1,383 16.6 18.9 Other Income & Expenses -77 n.a. n.a. Gross Income 24,542 4.7 5.4 Operating Expenses -11,902 3.0 3.5 Operating Income 12,639 6.2 7.4 Impairment on Financial Assets -4,151 5.3 7.1 Provisions and Other Gains and Losses -772 58.3 62.2 Income Before Tax 7,716 3.3 4.0 Income Tax -2,053 4.5 4.5 Non-controlling Interest -833 4.4 16.0 391 382 Great NTI ? ? Supported 308 391 382 performance I I I I I by core I I I even excluding I I I I I revenues 107 | | portfolio sales and NTI 4Q18 1Q19 2Q19 3Q19 4Q19 4Q18 1Q19 2Q19 3Q19 4Q19
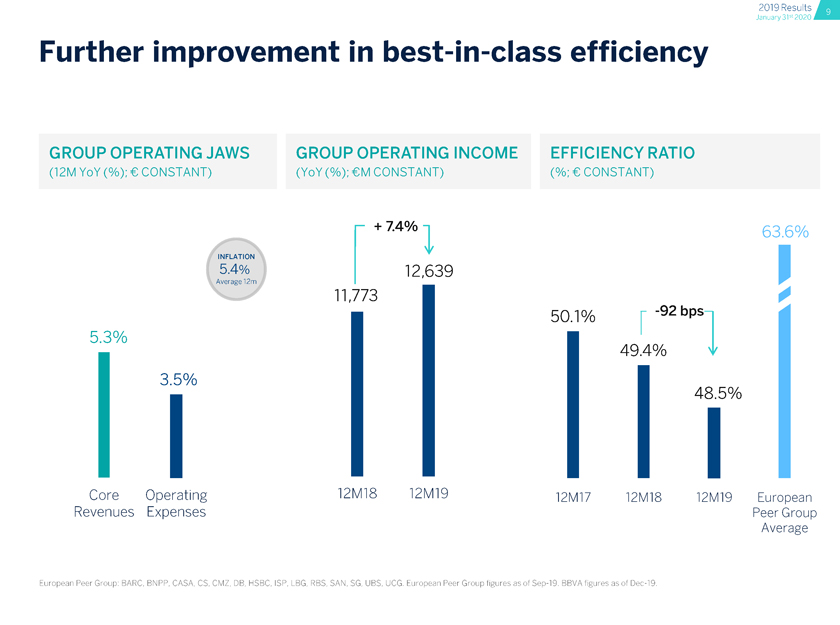
Further improvement in best-in-class efficiency GROUP OPERATING JAWS GROUP OPERATING INCOME EFFICIENCY RATIO (12MYoY(%); CONSTANT) (YoY (%); M CONSTANT) (%; CONSTANT) + 74% 63.6% INFLATION 5.4% 12,639 11,773 1 50.1% -92 bps- Core Operating 12M18 12M19 12m17 12M18 12M19 European Revenues Expenses Peer Group Average
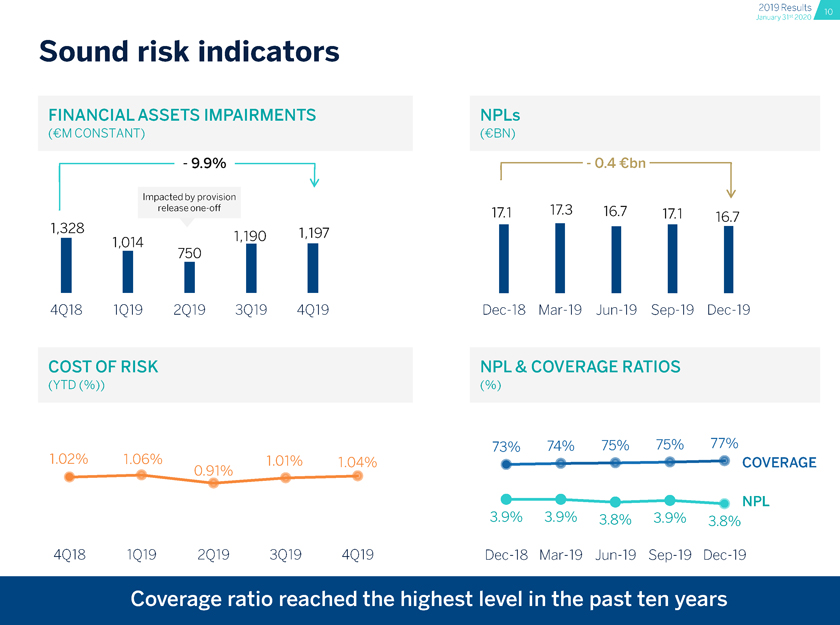
Sound risk indicators FINANCIAL ASSETS IMPAIRMENTS NPLs (M CONSTANT) (CBN) 9.9% 0.4 bn Impacted by provision Net Interest Income 18,202 4.8 5.6 Net Fees and Commissions 5,033 3.9 4.2 Net Trading Income 1,383 16.6 18.9 Other Income & Expenses -77 n.a. n.a. Gross Income 24,542 4.7 5.4 Operating Expenses -11,902 3.0 3.5 Operating Income 12,639 6.2 7.4 Impairment on Financial Assets -4,151 5.3 7.1 Provisions and Other Gains and Losses -772 58.3 62.2 Income Before Tax 7,716 3.3 4.0 Income Tax -2,053 4.5 4.5 Non-controlling Interest -833 4.4 16.0 73% 74% 75% 75% 77% 02% 1.06% 1.01% 1.04% 9 —COVERAGE NPL 3.9% 3.9% 3.8% 3.9% 3.8% 4Q18 1Q19 2Q19 3Q19 4Q19 Dec-18 Mar-19 Jun-19 Sep-19 Dec-19
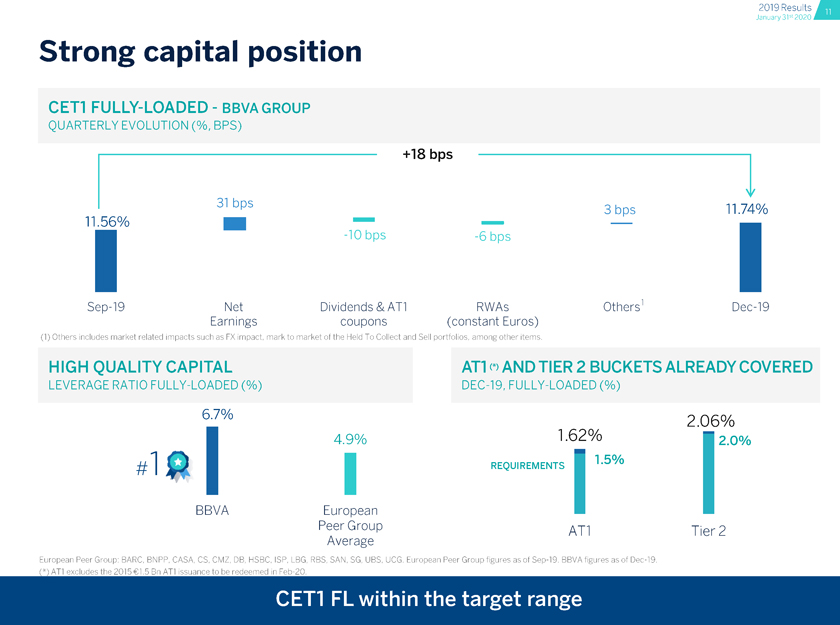
Strong capital position CET1 FULLY-LOADED—BBVA GROUP QUARTERLY EVOLUTION (%, BPS) +18 bps 31 bps 3 bps 11.74% 11.56% Sep-19 Net Dividends & ATI RRRWAs Others1 Dec-19 Earnings coupons (constant Euros) (1) Others includes market related impacts such as FX impact, mark to market of the Held To Collect and Sell portfolios, among other items. HIGH QUALITY CAPITAL ATI (*> AND TIER 2 BUCKETS ALREADY COVERED LEVERAGE RATIO FULLY-LOADED (%) DEC-19, FULLY-LOADED (%) 6.7% 2.06% 4 .9% 1.62% 12.0% REQUIREMENTS I 1-5% BBVA European Peer Group Tier 2 Average 2019 Results January 31st 2020 2019 Results January 31st 2020 European Peer Group: BARC, BNPP, CASA, CS, CMZ, DB, HSBC, ISP, LBG, RBS, SAN, SG, UBS, UCG. European Peer Group figures as of Sep-19. BBVA figures as of Dec-19. 2019 Results January 31st 2020 European Peer Group: BARC, BNPP, CASA, CS, CMZ, DB, HSBC, ISP, LBG, RBS, SAN, SG, UBS, UCG. European Peer Group figures as of Sep-19. BBVA figures as of Dec-19.
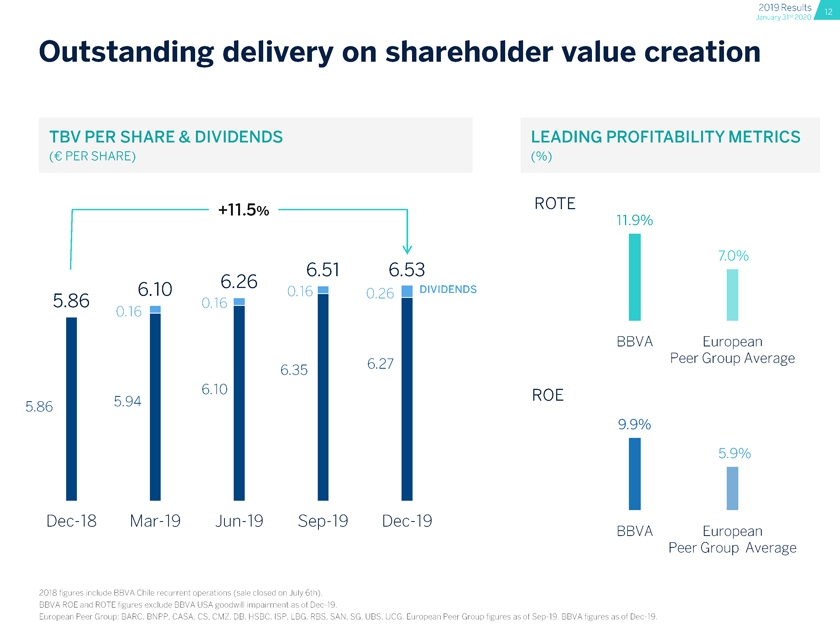
Outstanding delivery on shareholder value creation TBV PER SHARE & DIVIDENDS LEADING PROFITABILITY METRICS Net Interest Income 18,202 4.8 5.6 Net Fees and Commissions 5,033 3.9 4.2 Net Trading Income 1,383 16.6 18.9 Other Income & Expenses -77 n.a. n.a. Gross Income 24,542 4.7 5.4 Operating Expenses -11,902 3.0 3.5 Operating Income 12,639 6.2 7.4 Impairment on Financial Assets -4,151 5.3 7.1 Provisions and Other Gains and Losses -772 58.3 62.2 Income Before Tax 7,716 3.3 4.0 Income Tax -2,053 4.5 4.5 Non-controlling Interest -833 4.4 16.0 9.9% 1 5.9% I Dec-18 Mar-19 Jun-19 Sep-19 Dec-19 BBVA BBVA European Peer Group Average 2018 figures include BBVA Chile recurrent operations (sale closed on July 6th). BBVA ROE and ROTE figures exclude BBVA USA goodwill impairment as of Dec-19. European Peer Group: BARC, BNPP, CASA, CS, CMZ, DB, HSBC, ISP, LBG, RBS, SAN, SG, UBS, UCG. European Peer Group figures as of Sep-19. BBVA figures as of Dec-19.
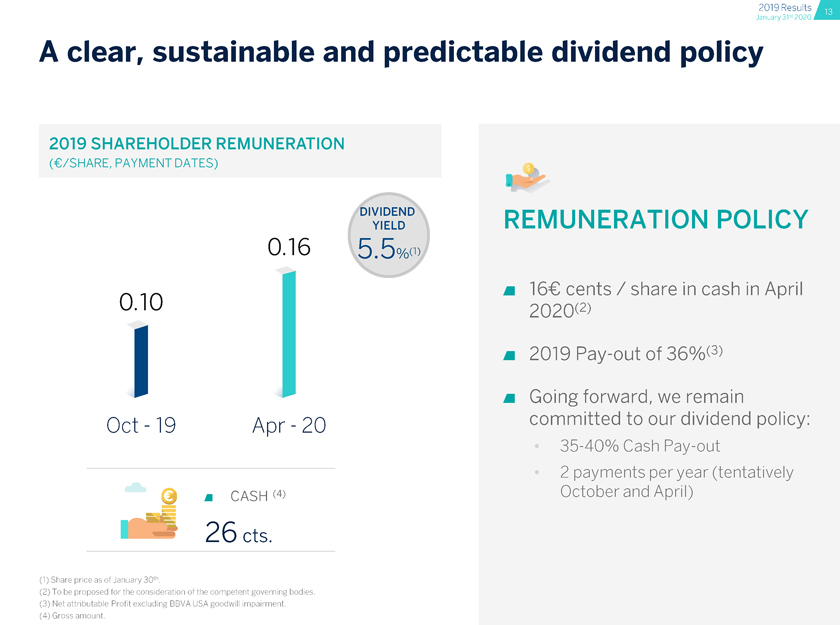
A clear, sustainable and predictable dividend policy 2019 SHAREHOLDER REMUNERATION DIVIDEND YIELD remuneration policy a 16 cents / share in cash in April 0.10 2020 a 2019 Pay-out of 36%(3) a Going forward, we remain 0 m CASH (4) October and April)
Business Areas BBVA Creating Opportunities

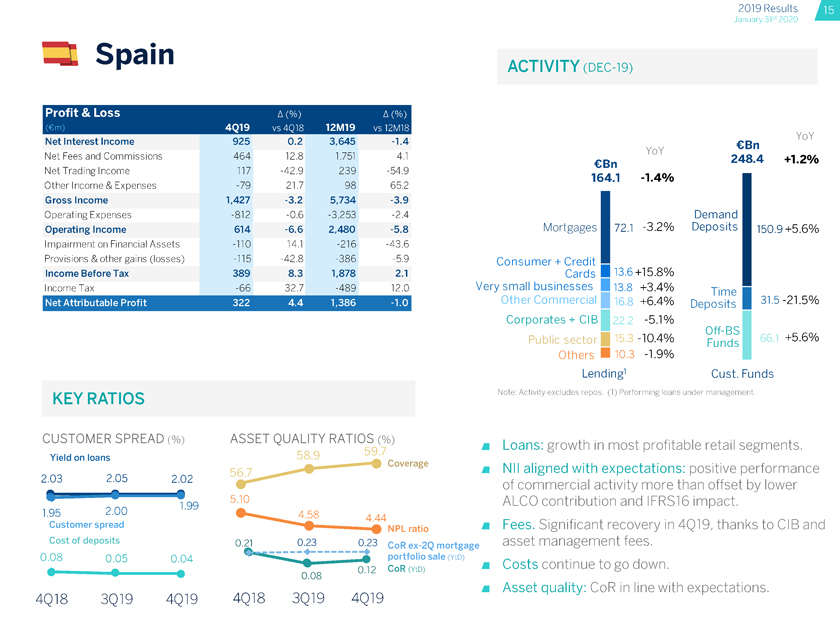
activity (dec 19) Net Interest Income 925 0.2 3,645 -1.4 Bn Net Interest Income 18,202 4.8 5.6 Net Fees and Commissions 5,033 3.9 4.2 Net Trading Income 1,383 16.6 18.9 Other Income & Expenses -77 n.a. n.a. Gross Income 24,542 4.7 5.4 Operating Expenses -11,902 3.0 3.5 Operating Income 12,639 6.2 7.4 Impairment on Financial Assets -4,151 5.3 7.1 Provisions and Other Gains and Losses -772 58.3 62.2 Income Before Tax 7,716 3.3 4.0 Income Tax -2,053 4.5 4.5 Non-controlling Interest -833 4.4 16.0 Provisions & other gains (losses) -115 -42.8 -386 -5.9 Consumer + Credit Income Before Tax 389 8.3 1,878 2.1 Cards 13.6 +15.8% Income Tax -66 32.7 -489 12.0 Very small businesses 113.8 +3.4% Time 116.8 +6.4% Deposits 31.5-21.5% Corporates + ClB 122.2 -5.1% Off- BS .3 -10.4% Funds 66,1 +5-6% Others ? 10.3 -1.9% Lending1 Cust. Funds RATIOS Note: Activity excludes repos. (1) Performing loans under management. CUSTOMER SPREAD (%) ASSET QUALITY RATIOS (%) a Loans: growth in most profitable retail segments. Yield on loans 58.9 56.7 Coverage |\m aligned with expectations: positive performance 2.03 2.05 2.02 Of commercial activity more than offset by lower qq 5-10 ALCO contribution and IFRS16 impact. 1-95 2.00 customer spread Fees. Significant recovery in 4Q19, thanks to CIB and cost of deposits 0.21 0.23 0,23 coR ex-2Q mortgage asset management fees. 0.08 0 05 0 04 1 portfolio sale (YtD) 0.12 cor (YtD) Costs continue to go down. 0.08 Asset quality: CoR in line with expectations. 2019 Results January 31st 2020 ACTIVITY (DEC -19) Spain activity (dec 19) 2019 Results 15 January 31st 2020 4Q18 3Q19 4Q19 4Q18 3Q19 4Q19
usa Net Interest Income 18,202 4.8 5.6 Net Fees and Commissions 5,033 3.9 4.2 Net Trading Income 1,383 16.6 18.9 Other Income & Expenses -77 n.a. n.a. Gross Income 24,542 4.7 5.4 Operating Expenses -11,902 3.0 3.5 Operating Income 12,639 6.2 7.4 Impairment on Financial Assets -4,151 5.3 7.1 Provisions and Other Gains and Losses -772 58.3 62.2 Income Before Tax 7,716 3.3 4.0 Income Tax -2,053 4.5 4.5 Non-controlling Interest -833 4.4 16.0 (constant ) YoY Bn YoY Net Interest Income 18,202 4.8 5.6 Net Fees and Commissions 5,033 3.9 4.2 Net Trading Income 1,383 16.6 18.9 Other Income & Expenses -77 n.a. n.a. Gross Income 24,542 4.7 5.4 Operating Expenses -11,902 3.0 3.5 Operating Income 12,639 6.2 7.4 Impairment on Financial Assets -4,151 5.3 7.1 Provisions and Other Gains and Losses -772 58.3 62.2 Income Before Tax 7,716 3.3 4.0 Income Tax -2,053 4.5 4.5 Non-controlling Interest -833 4.4 16.0 Other Commercial 25.9 +2.8% 110.5 +7.6% Time -2.4% Deposits 145 -15.4% 1.3 +14.1% Lending1 Deposits Note: Activity excludes repos. (1) Performing loans under management. Loan growth at low single digit, driven by the commercial portfolio. Deposits +3.7% YoY, and mix improvement. Flat Nil, in line with expectations. QoQ decrease explained by lower rates. Positive jaws with flat operating expenses in 2019. a Asset quality: CoR within the 80-90bps guidance.
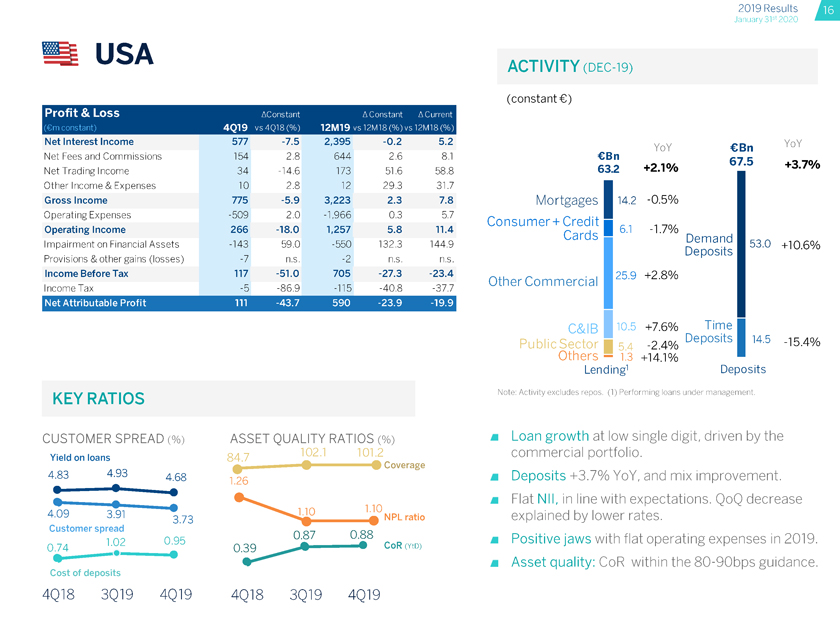
usa Net Interest Income 577 -7.5 2,395 -0.2 5.2 Net Fees and Commissions 154 2.8 644 2.6 8.1 Net Trading Income 34 -14.6 173 51.6 58.8 Other Income & Expenses 10 2.8 12 29.3 31.7 Gross Income 775 -5.9 3,223 2.3 7.8 Operating Expenses -509 2.0 -1,966 0.3 5.7 Operating Income 266 -18.0 1,257 5.8 11.4 Impairment on Financial Assets -143 59.0 -550 132.3 144.9 Provisions & other gains (losses) -7 n.s. -2 n.s. n.s. Income Before Tax 117 -51.0 705 -27.3 -23.4 Income Tax -5 -86.9 -115 -40.8 -37.7 KEY RATIOS CUSTOMER SPREAD (%) ASSET QUALITY RATIOS (%) Yield on loans 84.7 Coverage 4-83 4.93 4.68 4.09 3.91 3 73 NPL ratio Customer spread 0.87 0.88 0.39 CoR (YtD) Cost of deposits 4Q18 3Q19 4Q19 4Q18 3Q19 4Q19 (constant €) YoY €Bn YoY €Bn 67.5 63.2 +2.1% 67.5 +3.7% Mortgages 4.2 -0.5% Consumer+ Credit 6.1 -1.7% Cards Dpmand Deposits 53.0 +10.6% Other Commercial 25.9 +2.8% 110.5 +7.6% Time -2.4% Deposits 145 -15.4% • 1.3 +14.1% Lending1 Deposits Note: Activity excludes repos. (1) Performing loans under management. Loan growth at low single digit, driven by the commercial portfolio. Deposits +3.7% YoY, and mix improvement. Flat Nil, in line with expectations. QoQ decrease explained by lower rates. Positive jaws with flat operating expenses in 2019. a Asset quality: CoR within the 80-90bps guidance
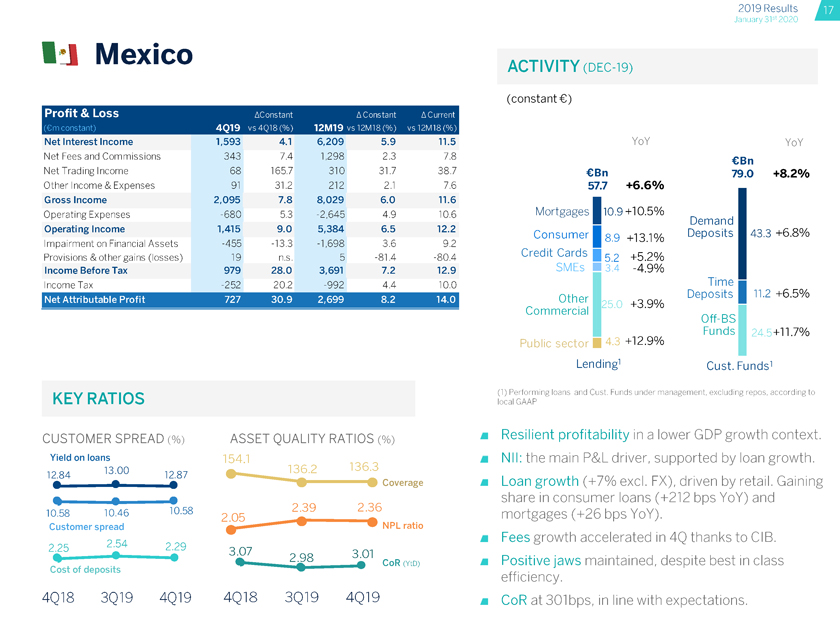
1 Mexico Net Interest Income 1,593 4.1 6,209 5.9 11.5 Net Fees and Commissions 343 7.4 1,298 2.3 7.8 Net Trading Income 68 165.7 310 31.7 38.7 Other Income & Expenses 91 31.2 212 2.1 7.6 Gross Income 2,095 7.8 8,029 6.0 11.6 Operating Expenses-680 5.3-2,645 4.9 10.6 Operating Income 1,415 9.0 5,384 6.5 12.2 impalrment on Financial Assets-455-13.3-1,698 3.6 9.2 Provisions & other gains (losses) 19 n.s. 5-81.4 -80.4 Income Before Tax 979 28.0 3,691 7.2 12.9 income Tax-252 20.2-992 4.4 10.0 KEY RATIOS CUSTOMER SPREAD (%) ASSET QUALITY RATIOS (%) Yield on loans 154.1 12.84 13’00 12.87 % Coverage 10.58 10.46 10.58 2 .05 239 2.36 Customer spread NPL ratio 2.25 2.54 2.29 3 .07 2.98 3.01 Cost of deposits (constant €) YoY YoY €Bn €Bn 79.0 +8.2% 57.7 +6.6% Mortgages 10.9 +10.5% Demand Consumer 8.9 +131% Deposits 43.3+6.8% Credit Cards 5.2 +5 2% 3.4-4.9% Time Deposits 11.2 +6.5% +3.9%Off-BS Funds 24.5+11.7% 3 +12.9% Lending1 Cust. Funds1 (1) Performing loans and Cust. Funds under management, excluding repos, according to local GAAP a Resilient profitability in a lower GDP growth context. a Nil: the main P&L driver, supported by loan growth. a Loan growth (+7% excl. FX), driven by retail. Gaining share in consumer loans (+212 bps YoY) and mortgages (+26 bps YoY). a Fees growth accelerated in 4Q thanks to CIB. a Positive jaws maintained, despite best in class efficiency. a CoR at 301bps, in line with expectations.
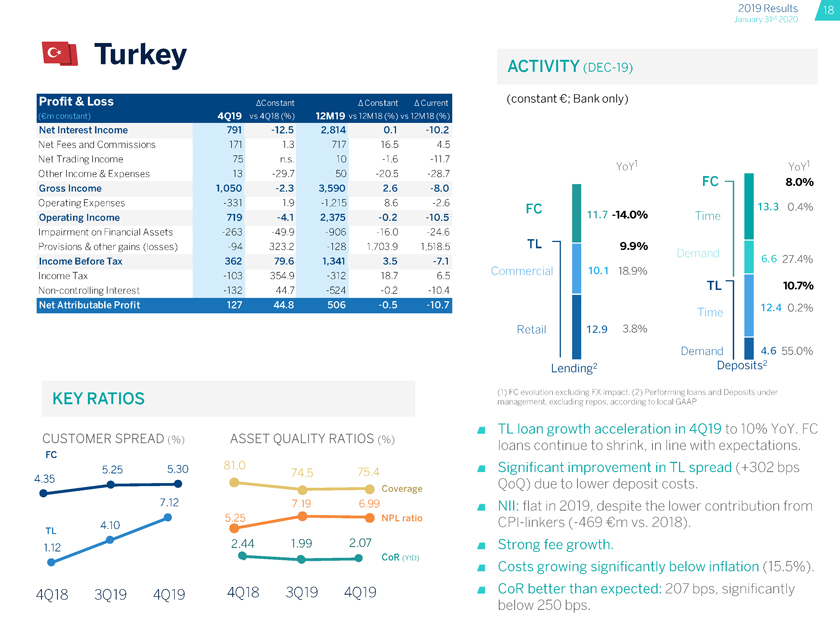
Turkey Net Interest Income 791-12.5 2,814 0.1-10.2 Net Fees and Commissions 171 1.3 717 16.5 4.5 Net Trading Income 75 n.s. 10-1.6-11.7 Other Income & Expenses 13-29.7 50-20.5-28.7 Gross Income 1,050-2.3 3,590 2.6-8.0 Operating Expenses-331 1.9-1,215 8.6-2.6 Operating Income 719-4.1 2,375-0.2-10.5 Impairment on Financial Assets-263-49.9-906-16.0-24.6 Provisions & other gains (losses)-94 323.2-128 1,703.9 1,518.5 Income Before Tax 362 79.6 1,341 3.5-7.1 Income Tax-103 354,9-312 18,7 6.5Non-controlling Interest-132 44.7-524-0.2-10.4 KEY RATIOS CUSTOMER SPREAD (%) ASSET QUALITY RATIOS (%) FC 35 5.25 5’30 ® Coverage 7.12 7.19 6.99 NPL ratio 1 12 2.44 1.99 2.07 CoR (YtD) (constant€; Bank only) YoY1 YoY1 FC 8.0% FC 13.3 0.4%11.7-14.0% Time TL 9.9% Demand 6.6 27.4% Commercial 10.1 18.9% TL 10.7% Time 12.4 0.2% Retail 12.9 3.8% Demand 4.6 55.0% Lending2 Deposits2 FC evolution excluding FX impact. (2) Performing loans and Deposits under management, excluding repos, according to local GAAP a TL loan growth acceleration in 4Q19 to 10% YoY. FC loans continue to shrink, in line with expectations. a Significant improvement in TL spread (+302 bps QoQ) due to lower deposit costs. a NIl: flat in 2019, despite the lower contribution fromCPI-linkers(-469 €m vs. 2018). a Strong fee growth. a Costs growing significantly below inflation (15.5%). a CoR better than expected: 207 bps, significantly below 250 bps.
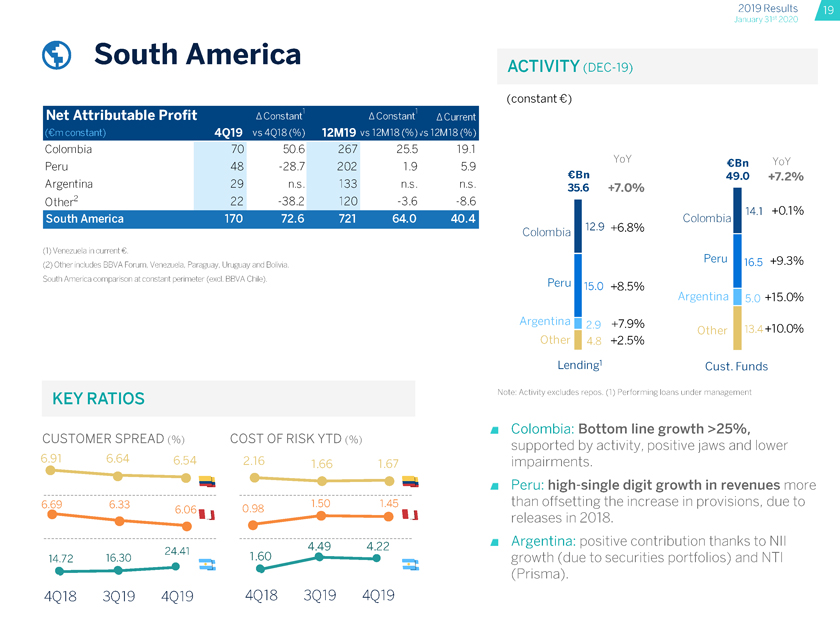
South America Colombia 70 50.6 267 25.5 19.1 Peru 48-28.7 202 1.9 5.9 Argentina 29 n.s. 133 n.s. n.s. Other2 22-38.2 120-3.6 -8.6 Venezuela in current €. Other includes BBVA Forum, Venezuela, Paraguay, Uruguay and Bolivia. South America comparison at constant perimeter (excl. BBVA Chile). KEY RATIOS CUSTOMER SPREAD (%) COST OF RISK YTD (%) 2.16 1 55 1 57 6.69 6.33 0.98 1.50 2441 4.49 422 14.72 16.30 24.4 1.60 4Q18 3Q19 4Q19 4Q18 3Q19 4Q19 (constant €) YoY CBn YoY €Bn 49.0 +7.2% 35.6 +7.0% Colombia Colombia +6.8% Peru 116.5 +9.3% Peru 15.0 +8.5% Argentina 15.( +15.0% Argentina , 2.9 +7.9% other 13. +10.0% +2.5% Lending1 Cust. Funds Note: Activity excludes repos. (1) Performing loans under management a Colombia: Bottom line growth >25%, supported by activity, positive jaws arid lower impairments. a Peru: high-single digit growth in revenues more than offsetting the increase in provisions, due to releases in 2018. a Argentina: positive contribution thanks to Nil growth (due to securities portfolios) and NTI (Prisma).

Update on strategy

BBVA defined a new strategy in 2015 to boost its transformation OUR PURPOSE STRATEGIC PRIORITIES «To bring the age ‘ New standard in customer experience of opportunity DIGITAL New business models everyone Optimize capital allocation OUR VALUES Unrivaled efficiency Customer comes first A first class workforce We think big We are one team
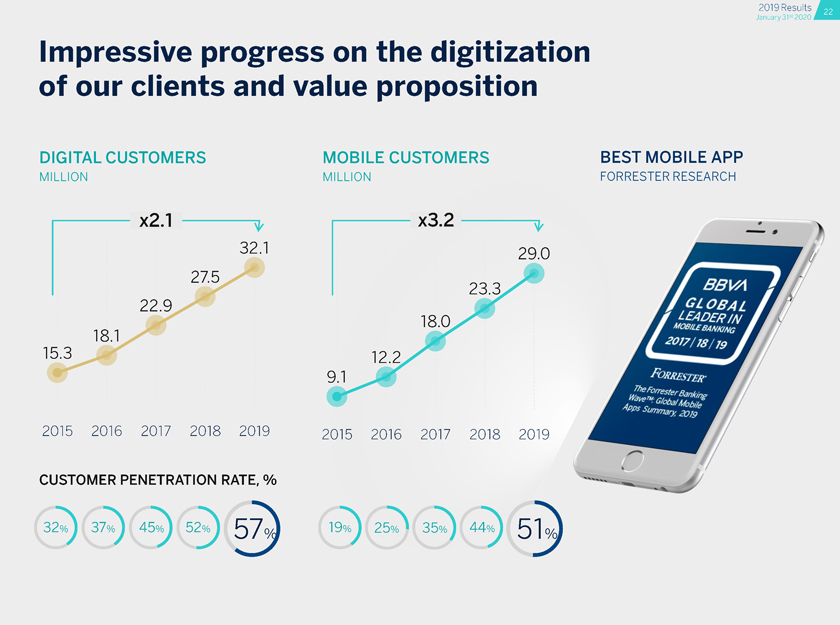
Impressive progress on the digitization of our clients and value proposition DIGITAL CUSTOMERS MOBILE CUSTOMERS BEST MOBILE APP MILLION MILLION FORRESTER RESEARCH x2.1 x3.2 2015 2016 2017 2018 2019 2015 2016 2017 2018 2019 CUSTOMER PENETRATION RATE, % 32% 37% 45 % 52% 57% 19% 25% 35% 44%
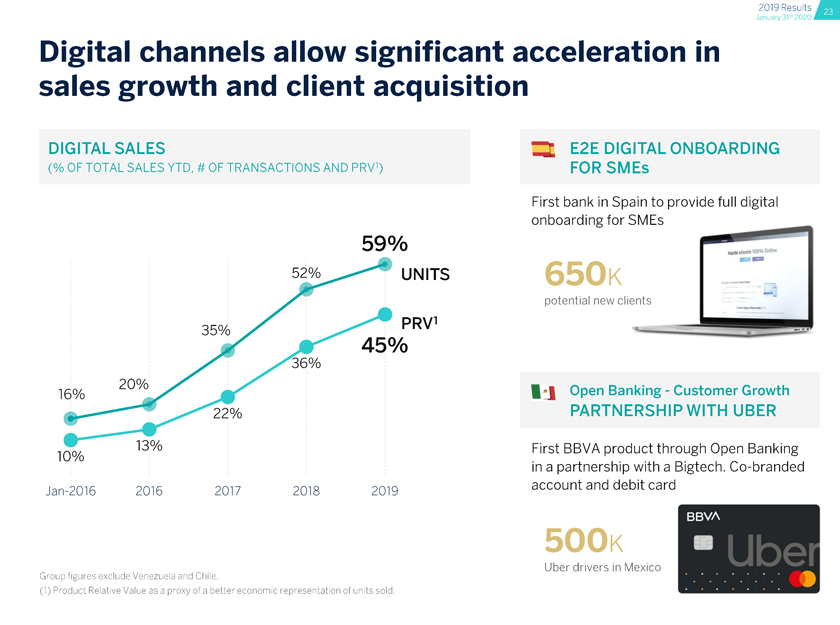
Digital channels allow significant acceleration in sales growth and client acquisition DIGITAL SALES E2E DIGITAL ONBOARDING (% OF TOTAL SALES YTD, # OF TRANSACTIONS AND PRV1) FOR SMEs First bank in Spain to provide full digital onboarding for SMEs 59% Hazte cliente 100% Online UNITS 650k potential new clients 350/0 PRV 45% 16% 20% Open Banking—Customer Growth 22% PARTNERSHIP WITH UBER 10% 13% FIRST product through Open Banking in a partnership with a Bigtech.Co-brandedJan-2016 2016 2017 2018 2019 account and debit card 500k Uber drivers in Mexico Group figures exclude Venezuela and Chile. 1 Product Relative Value as a proxy of a better economic representation of units sold.
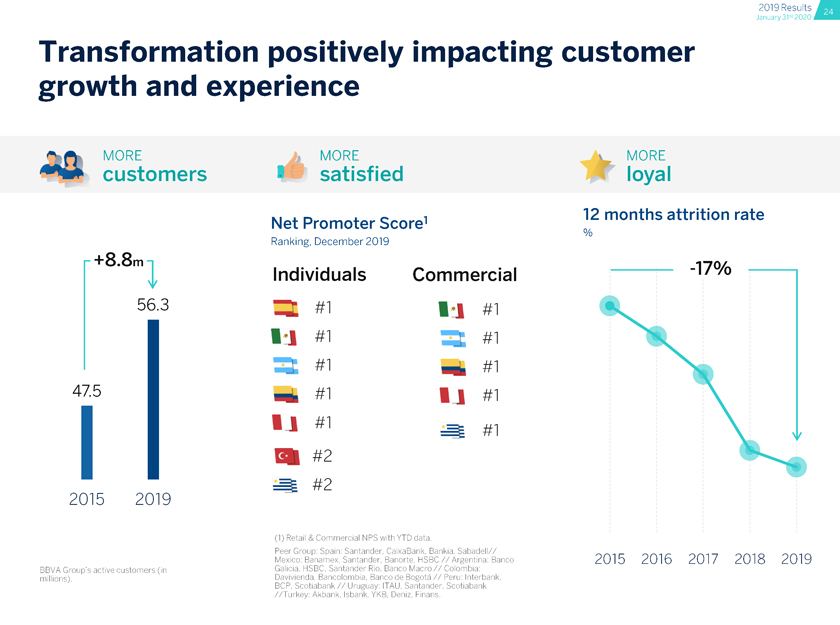
Transformation positively impacting customer
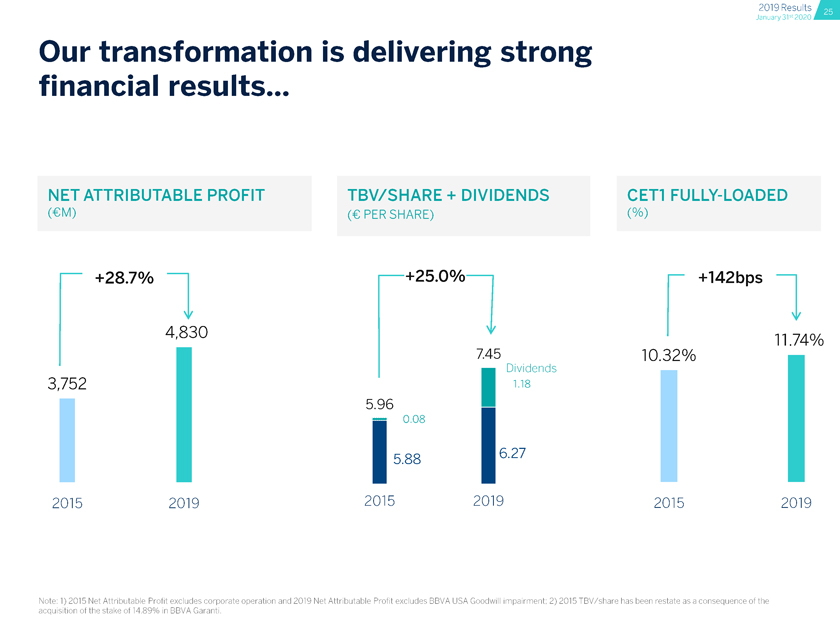
Our transformation is delivering strong financial results... NET ATTRIBUTABLE PROFIT TBV/SHARE + DIVIDENDS CET1 FULLY-LOADED (€M) (€ PER SHARE) (%) +28.7% +25.0% +142bps 4(830 11.74% 1 745 10.32% Dividends 2015 2019 2015 2019 2015 2019 Note: 1) 2015 Net Attributable Profit excludes corporate operation and 2019 Net Attributable Profit excludes BBVA USA Goodwill impairment; 2) 2015 TBV/share has been restate as a consequence of the acquisition of the stake of 14.89% in BBVA Garanti.
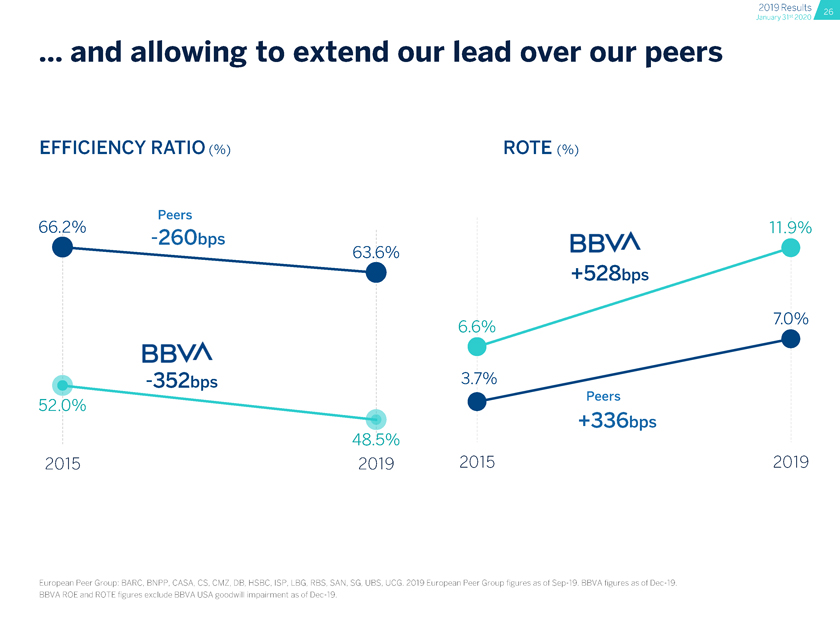
... and allowing to extend our lead over our peers EFFICIENCY RATIO (%) ROTE (%) Peers 66.2% 11.9% ™ BBVA 7.0% BBVA -352bps +336bps 48.5% 2015 2019 2015 2019 European Peer Group: BARC, BNPP, CASA, CS, CMZ, DB, HSBC, ISP, LBG, RBS, SAN, SG, UBS, UCG. 2019 European Peer Group figures as ofSep-19. BBVA figures as ofDec-19. BBVA ROE and ROTE figures exclude BBVA USA goodwill impairment as ofDec-19.

We are evolving our Strategic Priorities to strengthen our purpose Improving our client’s piping our clients transition towards financial health a sustainable future Reaching more clients Operational excellence engaged team MOST Data and Technology

BBVA Creating Opportunities SAVE THE DATE Investor Day March 24, 2020 ‘ T Madrid

Final Remarks & 2020 Outlook
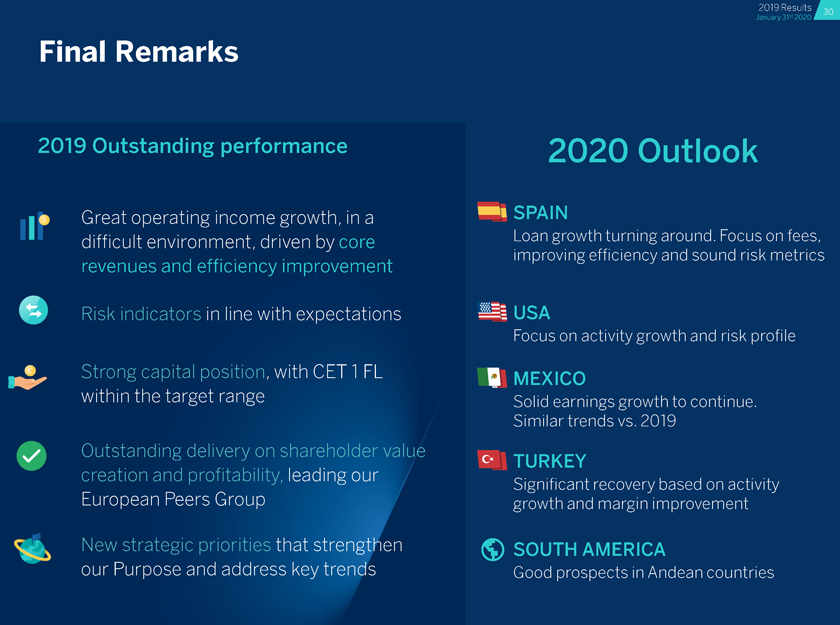
BBVA Creating Opportunities Final Remarks 2019 Outstanding performance Great operating income growth, in a difficult environment, driven by core revenues and efficiency improvement Risk indicators in line with expectations Strong capital position, with CET1 FL within the target range Outstanding delivery on shareholder value creation and profitability, leading our European Peers Group New strategic priorities that strengthen our Purpose and address key trends 2019 Results 30 January 31st 2020 2020 Outlook SPAIN Loan growth turning around. Focus on fees, improving efficiency and sound risk metrics S USA Focus on activity growth and risk profile MEXICO Solid earnings growth to continue. Similar trends vs. 2019 TURKEY Significant recovery based on activity growth and margin improvement SOUTH AMERICA Good prospects in Andean countries
BBVA Creating Opportunities Annex Customer spread by country Gross Income breakdown Net Attributable Profit evolution P&L Accounts by business unit Argentina: hyperinflation adjustment ALCO Portfolio, NIl Sensitivity and LCRs & NSFRs Garanti: wholesale funding Capital and RWAs by business area Book Value of the main subsidiaries Digital sales breakdown

01 Customer spread by country
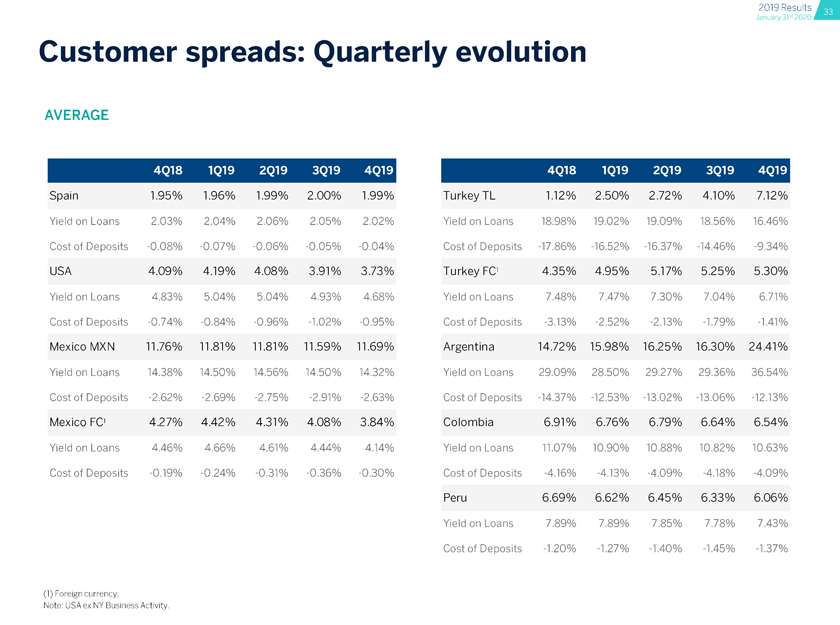
BBVA Creating Opportunities Customer spreads: Quarterly evolution AVERAGE Spain 1.95% 1.95% 1.99% 2.00% 1.99% Turkey TL 1.12% 2.50% 2.72% 4.10% 7.12% Yield on Loans 2.03% 2.04% 2.06% 2.05% 2.02% Yield on Loans 18.98% 19.02% 19.09% 18.56% 16.46% Cost of Deposits-0.08%-0.07%-0.06%-0.05%-0.04% Cost of Deposits-17.86%-16.52%-16.37%-14.46%-9.34% USA 4.09% 4.19% 4.08% 3.91% 3.73% Turkey FC 4.35% 4.95% 5.17% 5.25% 5.30% Yield on Loans 4.83% 5.04% 5.04% 4.93% 4.68% Yield on Loans 7.48% 7.47% 7.30% 7.04% 6.71% Cost of Deposits-0.74%-0.84%-0.96%-1.02%-0.95% Cost of Deposits-3.13%-2.52%-2.13%-1.79%-1.41% Mexico MXN 11.76% 11.81% 11.81% 11.59% 11.69% Argentina 14.72% 15.98% 16.25% 16.30% 24.41% Yield on Loans 14.38% 14.50% 14.56% 14.50% 14.32% Yield on Loans 29.09% 28.50% 29.27% 29.36% 36.54% Cost of Deposits-2.62%-2.69%-2.75%-2.91%-2.63% Cost of Deposits-14.37%-12.53%-13.02%-13.06%-12.13% Mexico FC1 4.27% 4.42% 4.31% 4.08% 3.84% Colombia 6.91% 6.76% 6.79% 6.64% 6.54% Yield on Loans 4.46% 4.66% 4.61% 4.44% 4.14% Yield on Loans 11.07% 10.90% 10.88% 10.82% 10.63% Cost of Deposits-0.19%-0.24%-0.31%-0.36%-0.30% Cost of Deposits-4.16%-4.13%-4.09%-4.18%-4.09% Peru 6.69% 6.62% 6.45% 6.33% 6.06% Yield on Loans 7.89% 7.89% 7.85% 7.78% 7.43% Cost of Deposits-1.20%-1.27%-1.40%-1.45%-1.37%
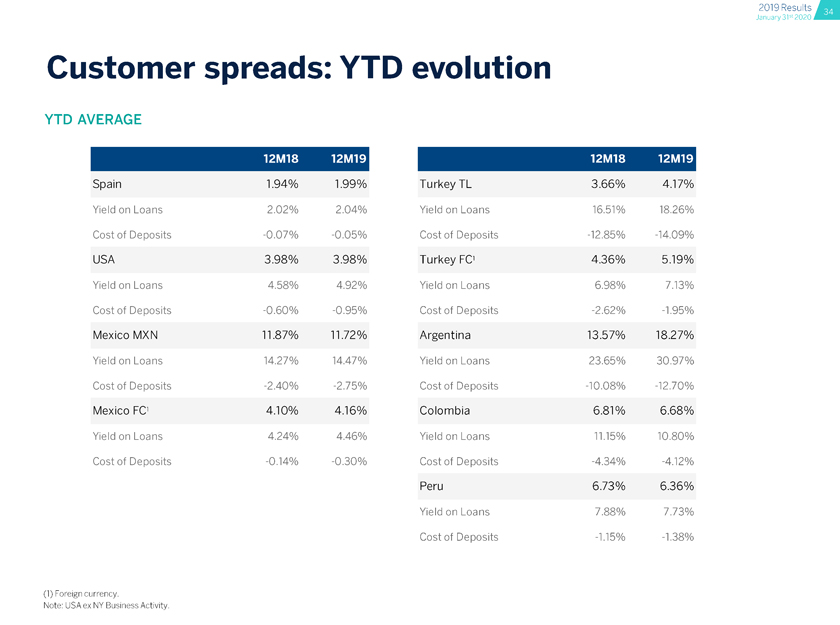
Customer spreads: YTD evolution YTD AVERAGE Spain 1.94% 1.99% Turkey TL 3.66% 4.17% Yield on Loans 2.02% 2.04% Yield on Loans 16.51% 18.26% Cost of Deposits-0.07%-0.05% Cost of Deposits-12.85%-14.09% USA 3.98% 3.98% Turkey FC1 4.36% 5.19% Yield on Loans 4.58% 4.92% Yield on Loans 6.98% 7.13% Cost of Deposits-0.60%-0.95% Cost of Deposits-2.62%-1.95% Mexico MXN 11.87% 11.72% Argentina 13.57% 18.27% Yield on Loans 14.27% 14.47% Yield on Loans 23.65% 30.97% Cost of Deposits-2.40%-2.75% Cost of Deposits-10.08%-12.70% Mexico FC1 4.10% 4.16% Colombia 6.81% 6.68% Yield on Loans 4.24% 4.46% Yield on Loans 11.15% 10.80% Cost of Deposits-0.14%-0.30% Cost of Deposits-4.34%-4.12% Peru 6.73% 6.36% Yield on Loans 7.88% 7.73% Cost of Deposits-1.15%-1.38%

02 Gross Income breakdown BBVA Creating Opportunities
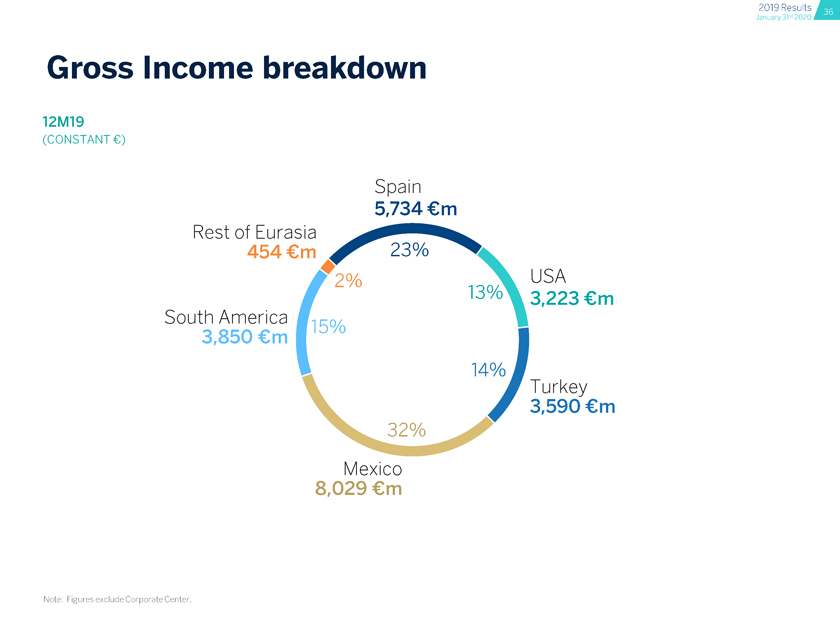
Gross Income breakdown 12M19 (CONSTANT€) Spain 5,734 Cm Rest of Eurasia 454 Cm 23% #2% South America 15% 3,850 Cm 15% Mexico 8,029 €m Note: Figures exclude Corporate Center. N USA 13% 3,223 Cm 14% Turkey 3,590 Cm

03 Net Attributable Profit evolution BBVA Creating Opportunities
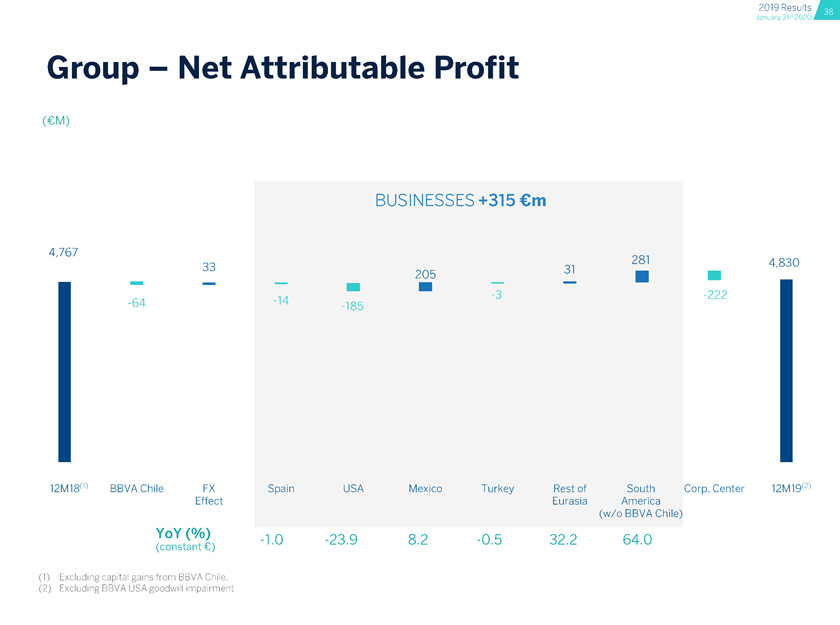
Group—Net Attributable Profit (€M) BUSINESSES +315 Cm 4,767 33 31 281 4,830 205 12M18(1) BBVA Chile FX Spain USA Mexico Turkey Rest of South Corp. Center 12M19 Effect Eurasia America (w/o BBVA Chile) YoY (%)-10 -23.9 8.2-0.5 32.2 64.0 (constant €) 2 Excluding BBVA USA goodwill impairment

04 P&L Accounts by business unit
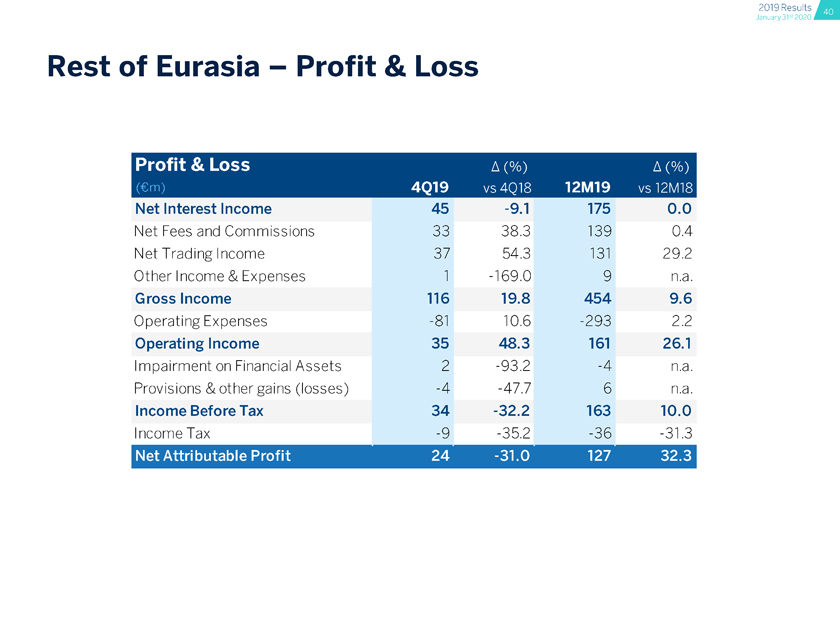
Rest of Eurasia Corporate Center Colombia Peru BBVA Creating Opportunities Rest of Eurasia—Profit & Loss Net Interest Income 45-9.1 175 0.0 Net Fees and Commissions 33 38.3 139 0.4 Net Trading Income 37 54.3 131 29.2 Other Income & Expenses 1-169.0 9 n.a. Gross Income 116 19.8 454 9.6 Operating Expenses-81 10.6-293 2.2 Operating Income 35 48.3 161 26.1 Impairment on Financial Assets 2-93.2-4 n.a. Provisions & other gains (losses)-4-47.7 6 n.a. Income Before Tax 34-32.2 163 10.0 Income Tax-9-35.2-36-31.3
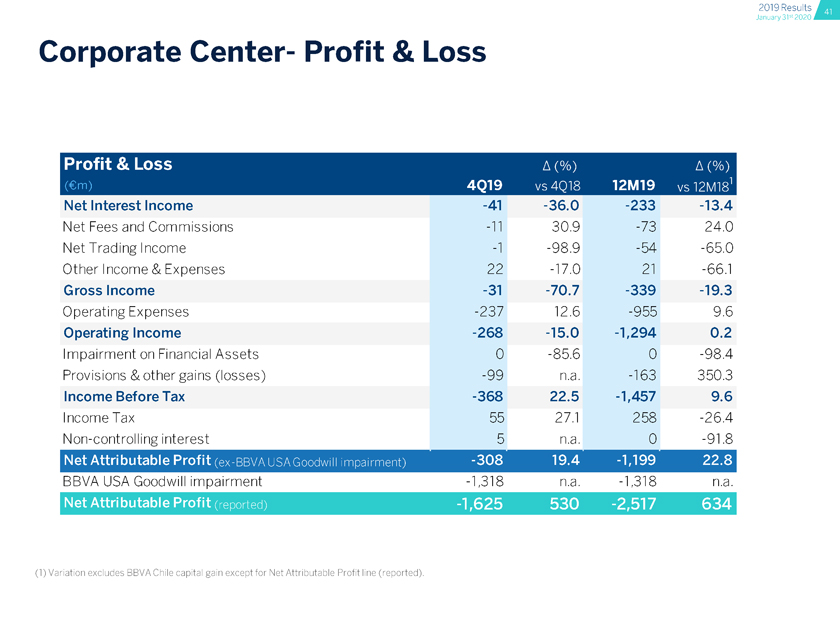
Corporate Center- Profit & Loss Net Interest Income-41-36.0-233-13.4 Net Fees and Commissions-11 30.9-73 24.0 Net Trading Income-1-98.9-54-65.0 Other Income & Expenses 22-17.0 21-66.1 Gross Income-31-70.7-339-19.3 Operating Expenses-237 12.6-955 9.6 Operating Income-268-15.0-1,294 0.2 Impairment on Financial Assets 0-85.6 0-98.4 Provisions & other gains (losses)-99 n.a.-163 350.3 Income Before Tax-368 22.5-1,457 9.6 Income Tax 55 27.1 258-26.4Non-controlling interest 5 n.a. 0-91.8 BBVA USA Goodwill impairment-1,318 n.a.-1,318 n.a.
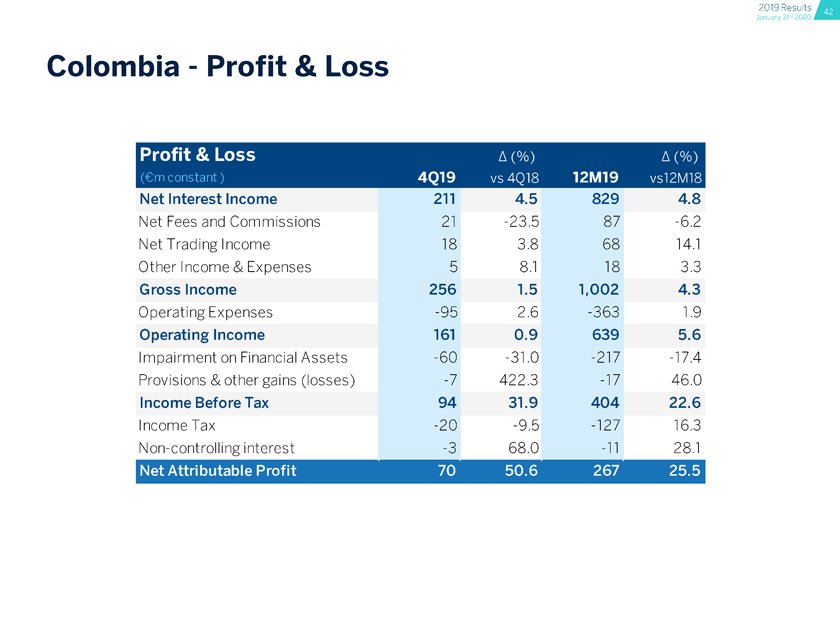
Colombia—Profit & Loss Net Interest Income Net Fees and Commissions Net Trading Income Other Income & Expenses Gross Income Operating Expenses Operating Income Impairment on Financial Assets Provisions & other gains (losses) Income Before Tax Income TaxNon-controlling interest 211 4.5 829 4.8 21-23.5 87-6.2 18 3.8 68 14.1 5 8.1 18 3.3 256 1.5 1,002 4.3-95 2.6-363 1.9 161 0.9 639 5.6-60-31.0-217-17.4-7 422.3-17 46.0 94 31.9 404 22.6-20-9.5-127 16.3-3 68.0-11 28.1
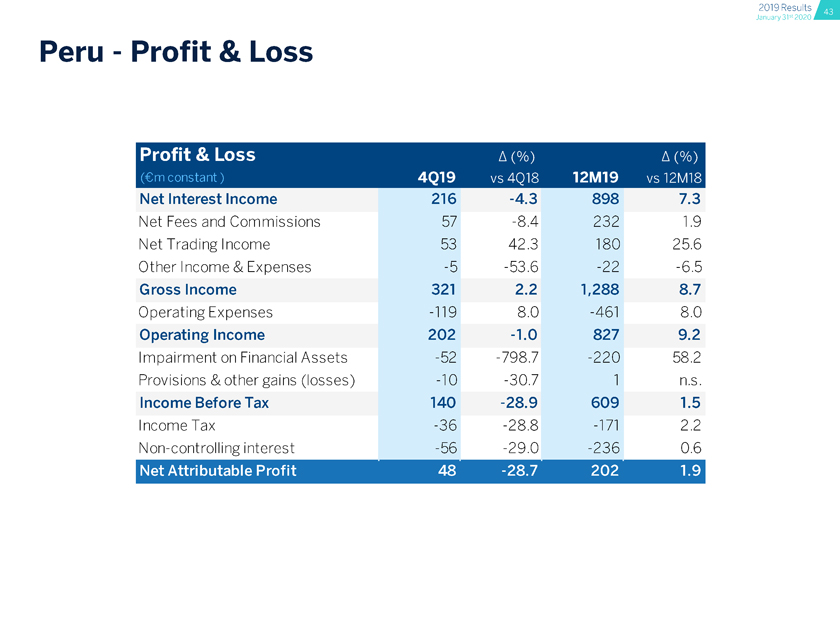
Peru—Profit & Loss Net Interest Income Net Fees and Commissions Net Trading Income Other Income & Expenses Gross Income Operating Expenses Operating Income Impairment on Financial Assets Provisions & other gains (losses) Income Before Tax Income TaxNon-controlling interest 216-4.3 898 7.3 57-8.4 232 1.9 53 42.3 180 25.6-5-53.6-22-6.5 321 2.2 1,288 8.7-119 8.0-461 8.0 202-1.0 827 9.2-52-798.7-220 58.2-10-30.7 1 n.s. 140-28.9 609 1.5-36-28.8-171 2.2-56-29.0-236 0.6
05 Argentina: hyperinflation adjustment BBVA Creating Opportunities
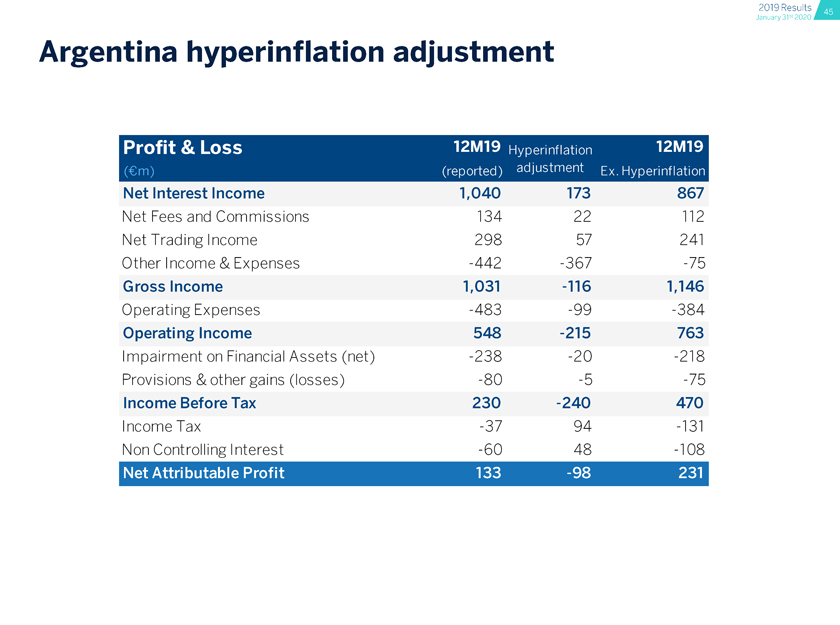
Argentina hyperinflation adjustment Net Interest Income 1,040 173 867 Net Fees and Commissions 134 22 112 Net Trading Income 298 57 241 Other Income & Expenses-442-367-75 Gross Income 1,031-116 1,146 Operating Expenses-483-99-384 Operating Income 548-215 763 Impairment on Financial Assets (net)-238-20-218 Provisions & other gains (losses)-80-5-75 Income Before Tax 230-240 470 Income Tax-37 94-131 Non Controlling Interest-60 48-108

BBVA Creating Opportunities 06 ALCO Portfolio, NIl Sensitivity and LCRs & NSFRs
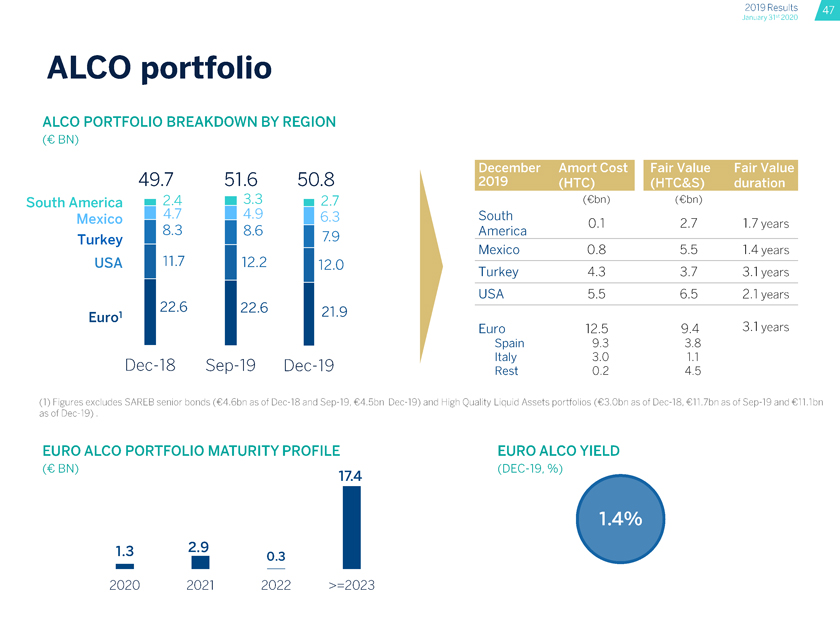
ALCO portfolio ALCO PORTFOLIO BREAKDOWN BY REGION (€ BN) 49.7 51.6 50.8 South America g 2.4 3.3 2.7 (£bn) (€bn) Mexico 47 49 6.3 South 2y 17vears Turkey 8 3 8 6 7.9 America Mexico 0.8 5.5 1.4 years USAâ– 11-7 112.2 â– 12.0 Turkey 4.3 3.7 3.1 years I USA 5.5 6.5 2.1 years 22.6 122.6 I 21.9 Euro 12.5 9.4 3.1 years â– â– Spain 9.3 3.8Dec-18Sep-19Dec-19 Rest 0.2 45 Figures excludes SAREB senior bonds (€4.6bn as ofDec-18 andSep-19, €4.5bnDec-19) and High Quality Liquid Assets portfolios (€3.0bn as ofDec-18, €11.7bn as ofSep-19 and €11.1 bn as ofDec-19). EURO ALCO PORTFOLIO MATURITY PROFILE EURO ALCO YIELD (CBN)(DEC-19, %) I 2020 2021 2022 >=2023

NIl sensitivity to interest rates movements ESTIMATED IMPACT ON NIl IN THE NEXT 12 MONTHS TO PARALLEL INTEREST RATE MOVEMENTS (%) NIl SENSITIVITY TO +100 BPS NIl SENSITIVITYTO -100BPS 15% 0% 10% 5% 0%-15% Euro USA Mexico Euro USA Mexico Note: Nil sensitivities calculated using our dynamic internal model with balance sheets as of Nov 2019 for Euro and Mexico and Dec 2019 for USA. Euro Nil sensitivity to upward rates includes management levers regarding deposit cost and movements from demand deposits to time deposits. Euro Nil sensitivity to downward rates according to the EBA’s “parallel- down” shock scenario. Mexico Nil sensitivity to downward rates also includes pricing management levers (MXN sensitivity-1.4%; USD sensitivity-1.0%).
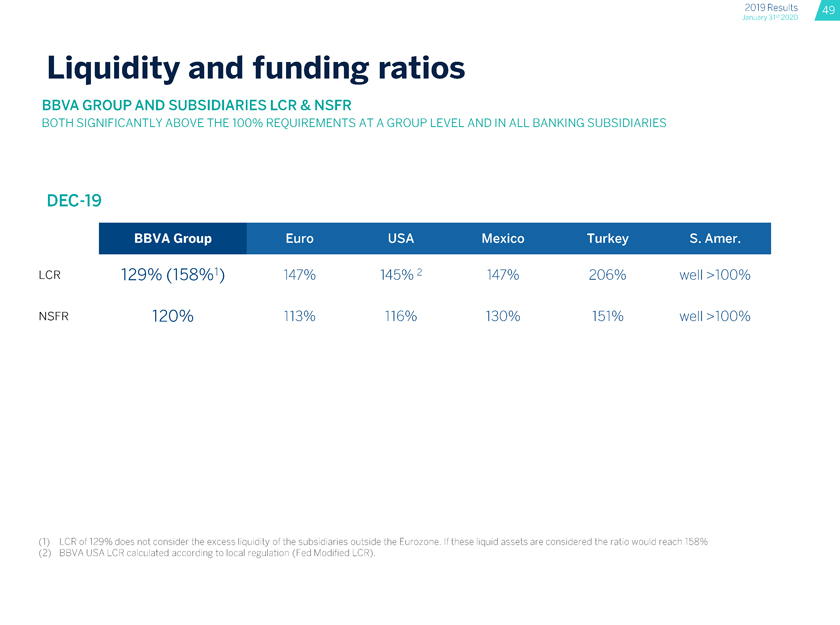
Liquidity and funding ratios BBVA GROUP AND SUBSIDIARIES LCR & NSFR BOTH SIGNIFICANTLY ABOVE THE 100% REQUIREMENTS AT A GROUP LEVEL AND IN ALL BANKING SUBSIDIARIESDEC-19 LCR 129% (158%) 147% 145% 147% 206% well >100% nsfr 120% 113% 116% 130% 151% well >100%1 LCR of 129% does not consider the excess liquidity of the subsidiaries outside the Eurozone. If these liquid assets are considered the ratio would reach 158% 2 BBVA USA LCR calculated according to local regulation (Fed Modified LCR).

07 Garanti: wholesale funding BBVA Creating Opportunities
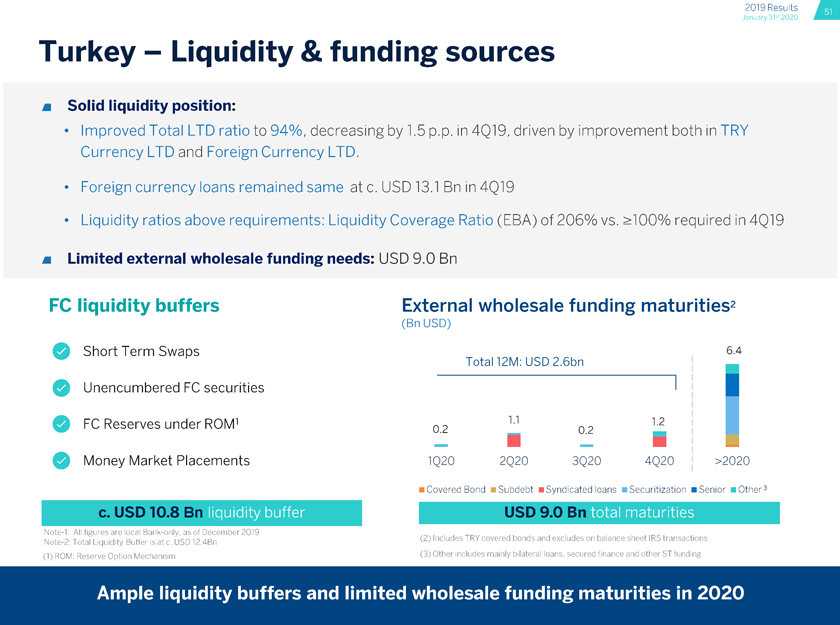
Turkey—Liquidity & funding sources m Solid liquidity position: Improved Total LTD ratio to 94%, decreasing by 1.5 p.p. in 4Q19, driven by improvement both in TRY Currency LTD and Foreign Currency LTD. Foreign currency loans remained same at c. USD 13.1 Bn in 4Q19 Liquidity ratios above requirements: Liquidity Coverage Ratio (EBA) of 206% vs. >100% required in 4Q19 m Limited external wholesale funding needs: USD 9.0 Bn FC liquidity buffers External wholesale funding maturities2 (Bn USD) A Short Term Swaps 6.4 Total 12M: USD 2.6bn 0 Unencumbered FC securities 0 FC Reserves under ROM1 02 11 02 1,2 0 Money Market Placements 1Q20 2Q20 3Q20 4Q20 >2020 â– Covered Bond aSubdebt â– Syndicated loans Securitization ^Senior â– Other3 c. USD 10.8 Bn USD 9.0 BnNote-1: All figures are local Bank-only, as of December 2019 „ „Note-2: Total Liquidity Buffer is at c. USD 12.4Bn (2) lncludes TRY covered bonds and excludes on balance sheet IRS transact’°ns (1) ROM: Reserve Option Mechanism (3) Other includes mainly bilateral loans, secured finance and other ST funding

08 Capital and RWAs Capital YTD RWAs by business area BBVA Creating Opportunities
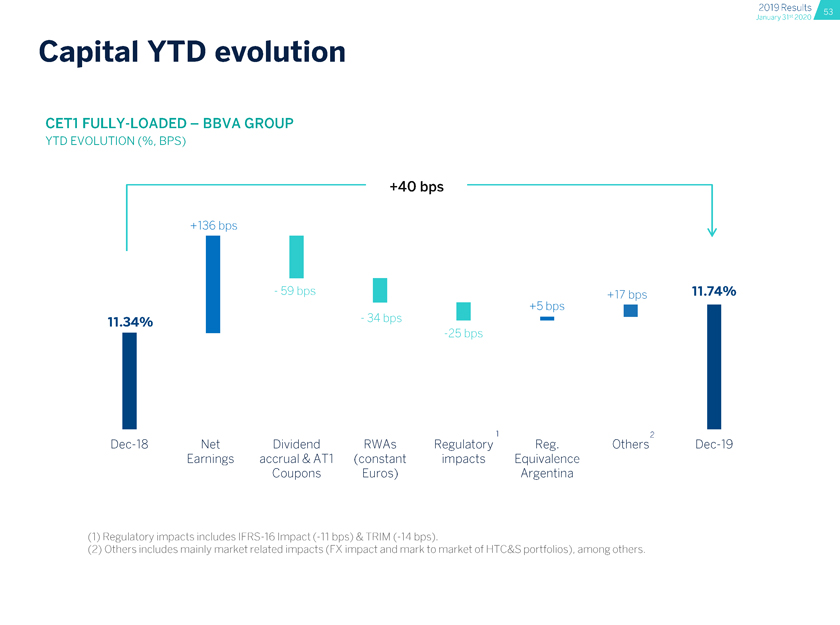
Capital YTD evolution CET1 FULLY-LOADED—BBVA GROUP YTD EVOLUTION (%, BPS) +40 bps +136 bps 1 +17 bps 11.74% +5 bps-34 bps bps 1 2Dec-18 Net Dividend RWAs Regulatory Reg. OthersDec-19 Earnings accrual &AT1 (constant impacts Equivalence Coupons Euros) Argentina
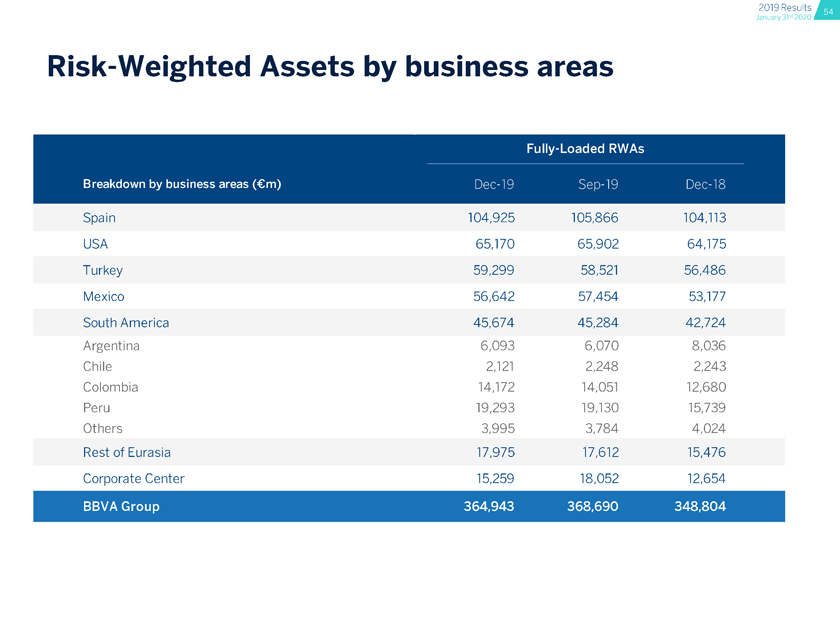
Risk-Weighted Assets by business areas Spain 104,925 105,866 104,113 USA 65,170 65,902 64,175 Turkey 59,299 58,521 56,486 Mexico 56,642 57,454 53,177 South America 45,674 45,284 42,724 Argentina 6,093 6,070 8,036 Chile 2,121 2,248 2,243 Colombia 14,172 14,051 12,680 Peru 19,293 19,130 15,739 Others 3,995 3,784 4,024 Rest of Eurasia 17,975 17,612 15,476 Corporate Center 15,259 18,052 12,654

09 Book Value of the main subsidiaries BBVA Creating Opportunities
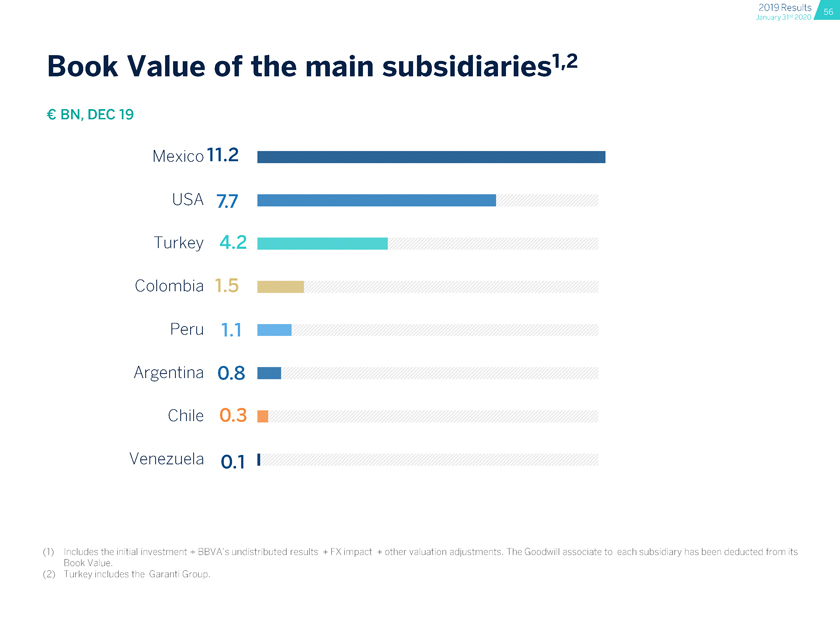
Book Value of the main subsidiaries’ € BN, DEC 19 Mexico11.2 USA 7.7 Turkey 4.2 Colombia 1.5 Peru 1.1 Argentina 0.8 Chile 0.3 Venezuela 0.1 (1) Includes the initial investment + BBVA’s undistributed results + FX impact + other valuation adjustments. The Goodwill associate to each subsidiary has been deducted from its Book Value. (2) Turkey includes the Garanti Group.

10 Digital sales breakdown
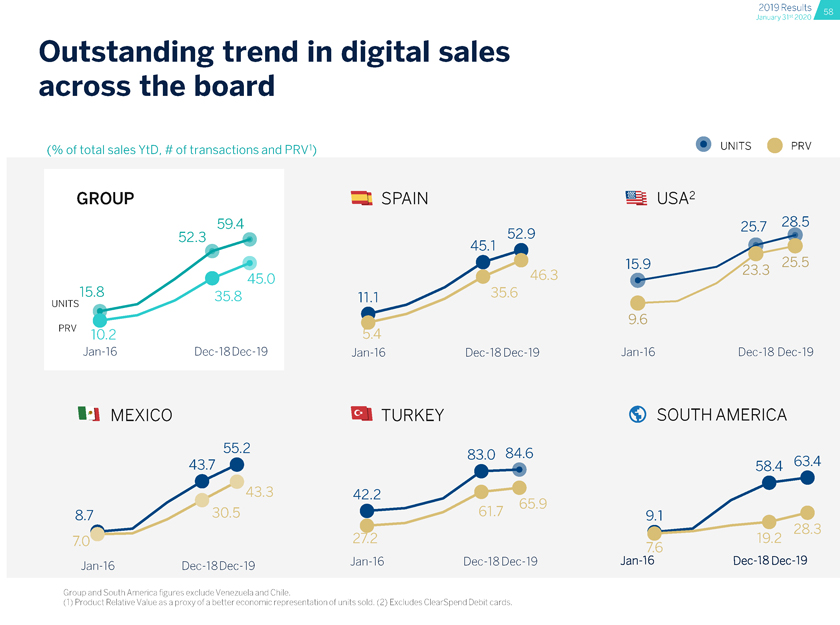
Outstanding trend in digital sales across the board (% of total sales YtD, # of transactions and PRV1) * UNITS PRV GROUP a SPAIN m USA2 52.3 594 52 9 PRV 10.2 Jan-16 Dec-18Dec-19 Jan-16 Dec-18Dec-19Jan-16Dec-18Dec-19 MEXICO TURKEY ® SOUTH AMERICA 55.2 83.0 84.6 437 58.4 634 43 3 42.2 8.7 30.5 61.7 65‘9 9.1 28-3 7.0 272 ^ 19.2 Jan-16Dec-18Dec-19Jan-16Dec-18Dec-19Jan-16Dec-18Dec-19 Group and South America figures exclude Venezuela and Chile. (1) Product Relative Value as a proxy of a better economic representation of units sold. (2) Excludes ClearSpend Debit cards. BBVA (*) Variations exclude BBVA Chile recurrent operations and capital gains in 2018 except for Net Attributable Profit line (reported). (1) Excluding capital gains from BBVA Chile. (1) Variation excludes BBVA Chile capital gain except for Net Attributable Profit line (reported). (1) Regulatory impacts includesIFRS-16 Impact(-11 bps)&TRIM (-14bps). Others includes mainly market related impacts (FX impact and mark to market of HTC&S portfolios), among others.

BBVA
SIGNATURE
Pursuant to the requirements of the Securities Exchange Act of 1934, the registrant has duly caused this report to be signed on its behalf by the undersigned, thereunto duly authorized.
| Banco Bilbao Vizcaya Argentaria, S.A. | ||||||
| Date: January 31, 2020 | By: | /s/ María Ángeles Peláez Morón | ||||
| Name: | María Ángeles Peláez Morón | |||||
| Title: | Authorized representative | |||||