UNITED STATES
SECURITIES AND EXCHANGE COMMISSION
WASHINGTON, D.C. 20549
FORM 6-K
REPORT OF FOREIGN ISSUER
PURSUANT TO RULE 13a-16 OR 15d-16
UNDER THE SECURITIES EXCHANGE ACT OF 1934
For the month of March, 2021
Commission file number: 1-10110
BANCO BILBAO VIZCAYA ARGENTARIA, S.A.
(Exact name of Registrant as specified in its charter)
BANK BILBAO VIZCAYA ARGENTARIA, S.A.
(Translation of Registrant’s name into English)
Calle Azul 4,
28050 Madrid
Spain
(Address of principal executive offices)
Indicate by check mark whether the registrant files or will file annual reports under cover of Form 20-F or Form 40-F:
Form 20-F ☒ Form 40-F ☐
Indicate by check mark if the registrant is submitting the Form 6-K in paper as permitted by Regulation S-T Rule 101(b)(1):
Yes ☐ No ☒
Indicate by check mark if the registrant is submitting the Form 6-K in paper as permitted by Regulation S-T Rule 101(b)(7):
Yes ☐ No ☒

| BBVA. PILLAR III 2020 | P. 1 |
The English language version of this report is a free translation from the original, which was prepared in Spanish. All possible care has been taken, to ensure that the translation is an accurate presentation of the original. However, in all matters of interpretation, views or opinion expressed in the original language version of the document in Spanish take precedence over the translation.
| BBVA. PILLAR III 2020 | INDEX | P. 2 |
Index
| 4 | ||||||
| 7 | ||||||
| 11 | ||||||
| 12 | ||||||
| 13 | ||||||
| 14 | ||||||
| 16 | ||||||
| 18 | ||||||
1. | 22 | |||||
| 1.1. | Corporate name and differences between the consolidated group for the purposes of solvency regulations and accounting criteria | 23 | ||||
1.2. | 27 | |||||
1.3. | Exemptions from capital requirements at the individual or sub-consolidated level | 27 | ||||
2. | 28 | |||||
2.1. | 29 | |||||
2.2. | 30 | |||||
2.3. | 33 | |||||
2.4. | 34 | |||||
2.5. | 36 | |||||
2.6. | 38 | |||||
3. | 40 | |||||
3.1. | 41 | |||||
3.2. | 41 | |||||
3.3. | 103 | |||||
3.4. | 114 | |||||
3.5. | 117 | |||||
3.6. | 124 | |||||
| BBVA. PILLAR III 2020 | INDEX | P. 3 |
| BBVA. PILLAR III 2020 | GLOSSARY OF TERMS | P. 4 |
ACRONYM | DESCRIPTION | |
| ALM (Asset - Liability Management) | Mechanism for managing structural balance-sheet risk due to potential imbalances between assets and liabilities due to different types of factors (interest rate, exchange rate, liquidity, etc.) | |
| AMA | Advanced method for calculating the own funds requirements for operational risk | |
| AT1 (Additional Tier 1) | Additional Tier 1 capital consisting of hybrid instruments, mainly CoCos and preferred shares | |
| Basel III | Package of proposals for reform of banking regulation, published as of December 16, 2010 and with a period of gradual implementation | |
| BCBS (Basel Committee on Banking Supervision) | Basel Committee on Banking Supervision. International cooperation forum on banking supervision to increase the quality of banking supervision worldwide | |
| CCyB (Countercyclical Buffer) | Countercyclical buffer, the part of a set of macroprudential instruments designed to help counteract the procyclicality of the financial system | |
| CCF (Credit Conversion Factor) | Credit conversion factor. The ratio between the current available amount of a commitment that could be used and would therefore be outstanding at the time of default, and the current available amount of the commitment | |
| CCP (Central Counterparty Clearing House) | An entity that liaises between counterparties, acting as a buyer when dealing with sellers and as a seller when dealing with buyers | |
| CDS (Credit Default Swap) | Financial derivative between a beneficiary and a guarantor through which the beneficiary pays the guarantor a premium in exchange for receiving protection from possible credit events over a period of time | |
| CET1 (Common Equity Tier 1) | Common Equity Tier 1: the entity’s capital of the highest quality (see paragraph 2.1) | |
| Counterparty Credit Risk | The credit risk corresponding to derivative instruments, repurchase and reverse repurchase transactions, securities or commodities lending or borrowing transactions and deferred settlement transactions | |
| CoCo (Contingent Convertible) | Convertible contingent bond. Hybrid issues with debt and equity elements convertible | |
| Credit Risk | into shares Credit risk is based on the possibility that one party to the financial instrument’s contract will fail to meet its contractual obligations on the grounds of insolvency or inability to pay and will cause a financial loss for the other party | |
| CRM (Credit Risk Mitigation) | Credit Risk Mitigation: a technique used by the institution to reduce the credit risk associated with one or more exposures that the institution still maintains | |
| CRR / CrD IV | Solvency regulation on prudential requirements of credit institutions and investment firms (EU Regulation 575/2013) | |
| CVA (Credit Valuation Adjustment) | Valuation adjustments for counterparty credit risk | |
| DlGD (Downturn loss Given Default) | Severity in a period of stress in the economic cycle | |
| D-SIB (Domestic Systemically Important Bank) | Domestic Systemically Important Bank | |
| EAD (Exposure at default) | Maximum loss at the time of the counterparty entering into default | |
| EBA (European Banking authority) | European Banking Authority. Independent institution responsible for promoting the stability of the financial system, the transparency of financial markets and products and the protection of depositors and investors | |
| EC (Economic Capital) | The amount of capital considered necessary to cover unexpected losses if actual losses are greater than expected losses | |
| ECB (European Central Bank) | Central bank of the countries of the European Union that have the euro as their currency | |
| ECAI (External Credit assessment Institutions) | External Credit Assessment Agency designated by the entity | |
| El (Expected Loss) | The ratio between the amount expected to be lost in an exposure, due to potential non-payment by a counterparty or dilution over a period of one year, and the amount due at the time of non-payment | |
| ERBA (External Rating Base Aproach) | Methodology for estimating RWAs of securitisations from external ratings | |
| Environmental, social and governance (ESG) | Environmental, social and good corporate governance criteria, the main objective of which is to contribute to sustainable development | |
| FRTB (Fundamental Review of the Trading Book) | A set of reforms proposed by the BCBS on the market risk framework, with the aim of improving the design and consistency of market risk capital standards | |
| FsB (financial Stability Board) | Financial Stability Board. An international body that pursues the effectiveness and stability of the international financial system, monitoring it and publishing recommendations | |
| FTD (First to default) | Derivative by which both parties negotiate protection against the first default by any of the entities that form part of the basket | |
| GRM (Global Risk Management) | Global Risk Management | |
| GRMC (Global Risk Management Committee) | Global Risk Management Committee | |
| G-SIBS (Global Systemically Important Banks) | Financial institutions that, because of their large size, market importance and interconnectedness, could cause a serious crisis in the international financial system in the event of economic problems | |
| IAA (Internal Assessment Approach) | Internal evaluation method for the calculation of securitisation exposures in the banking book | |
| BBVA. PILLAR III 2020 | GLOSSARY OF TERMS | P. 5 |
| ICAAP (Internal Capital Adequacy Assessment Process) | Internal Capital Adequacy Assessment Process | |
| IFRS 9 (International Financial Reporting Standards – Financial Instruments) | International Financial Reporting Standards for Financial Instruments which entered into force on January 1, 2018, replacing IAS 39 in relation to the classification and valuation of financial assets and liabilities, the impairment of financial assets and the accounting of hedges | |
| ILAAP (Internal Liquidity Adequacy Assessment Process) | Internal Liquidity Adequacy Assessment Process | |
| IMA (Internal Model Approach) | Internal model approach for calculating exposure due to market risk | |
| IMM (Internal Model Method) | Internal model method for calculating exposure due to counterparty risk | |
| IRB (Internal Rating-based approach) | Internal model method for calculating exposure due to credit risk, based on internal ratings. This method can be broken down into two types, depending on the estimations set by the Supervisor or the own ones: FIRB (Foundation IRB) and AIRB (Advanced IRB) | |
| IRBA (Internal Risk Base Approach) | Methodology for estimating RWAs of securitisations from internal ratings | |
| IRC (Incremental Risk Capital) | Charge applied to the market risk exposure calculated by the internal method that quantifies the risk not captured by the VaR model, specifically in migration and default events | |
| LCR (Liquidity Coverage Ratio) | Liquidity coverage ratio | |
| LDP (Low Default Portfolios) | Low default portfolios | |
| LGD (Loss Given Default) | Severity or amount to be lost in the event of non-payment | |
| LGD BE (Loss Given Default Best Estimate) | “Actual” loss from default portfolio | |
| Liquidity Risk | Risk of an entity having difficulties in duly meeting its payment commitments, or where, to meet them, it has to resort to funding under burdensome terms which may harm the entity’s image or reputation | |
| LMUS (Liquidity Management Units) | Group entities with financial self-sufficiency created with the aim of preventing and limiting liquidity risk, preventing it from spreading in a crisis that could affect only one or more of these Entities | |
| LR (Leverage Ratio) | Leverage ratio: a measure that relates a company’s indebtedness and assets, calculated as level 1 capital divided by the entity’s total exposure | |
| LRLGD (Long Run Loss Given Default) | Long-term severity (loss given default) | |
| LtSCD (Loan to Stable Customer Deposits) | Ratio that measures the relationship between net credit investment and stable customer resources | |
| Market Risk | Risk due to the possibility that there may be losses in the value of positions held due to movements in the market variables that affect the valuation of financial products and assets in trading activity | |
| MDA (Maximum Distributable Amount) | Trigger by which the ECB restricts the capacity to pay out dividends | |
| MREL (Minimum Required Eligible Liabilities) | Minimum requirement of own funds and eligible liabilities. New requirement faced by European banks, which aims to create a buffer of solvency that absorbs the losses of a financial entity in the event of resolution without jeopardizing taxpayers’ money. The level of this buffer is determined individually for each banking group based on their level of risk and other particular characteristics | |
| MTN (Medium Term Note) | Notes accounted as Issuances designated at fair value through P&L considered equivalent to senior issuances for liquidity | |
| NCAHS | Non-Current Assets Held for Sale | |
| NClHS | Non-Current Liabilities Held for Sale | |
| NSFR | Net Stable Funding Ratio | |
| OE (Original Exposure) | Gross amount that the entity may lose in the event that the counterparty cannot meet its contractual payment obligations, regardless of the effect of guarantees or credit improvements or credit risk mitigation operations | |
| Operational Risk (OR) | BBVA defines operational risk (OR) as risk that may cause losses as a result of human error; inadequate or defective internal processes; inadequate conduct towards customers, in the markets or against the company; failures, interruptions or deficiencies in systems or communications; theft, loss or misuse of information, as well as deterioration of its quality; internal or external fraud including, in all cases, fraud resulting from cyber-attacks; theft or physical damage to assets or persons; legal risks; risks resulting from workforce and occupational health management; and inadequate service provided by suppliers | |
| PD (Probability of Default) | Probability of non-payment by a counterparty over a period of one year | |
| PD-TTC (PD Through the Cycle) | Probability of Default throughout the business cycle | |
| PIT (Point-In-Time) | Approach for calculating provisions under which PD and LGD parameters must be adapted at each moment in time | |
| P2G | Pillar 2 Capital Guidance | |
| P2R | Pillar 2 Capital Requirement | |
| RW (Risk Weight) | Degree of risk applied to exposures (%) | |
| RWAs (Risk-Weighted assets) | Risk exposure of the entity weighted by a percentage derived from the applicable standard (standardised approach) or internal models | |
| SFTs | Securities financing transactions | |
| SREP (Supervisory Review and Evaluation Process) | Supervisory Review and Evaluation Process | |
| Structural Risk | This risk is divided into Structural Interest-Rate Risk (movements in market interest rates that cause changes in an entity’s net interest income and book value) and Structural Exchange-Rate Risk (exposure to variations in exchange rates originating in the Group’s foreign companies and in the provision of funds to foreign branches financed in a different currency from that of the investment) | |
| BBVA. PILLAR III 2020 | GLOSSARY OF TERMS | P. 6 |
| Synthetic Securitisation | A type of operation where the loan portfolio is not typically transferred to a fund; on the contrary, the credit remains in the balance sheet of the corresponding entity, but this transfers the default risk to a third party. The objective of this type of instrument is the transmission of balance risk and capital release. Normally, the assignment of risk is usually made through a derivative (CDS) or through a financial guarantee | |
| TIER I (Tier One Capital) | Capital built by instruments that are able to absorb losses when the entity is in operation. It consists of CET1 and AT1 | |
| TIER II (Tier Two Capital) | Supplementary capital consisting of instruments, mainly subordinated debt, revaluation reserves and hybrid instruments, which will absorb losses when the entity is not viable | |
| TLAC (Total Loss Absorbing Capacity) | Total loss absorption capacity: Regulatory framework approved by the FSB with the aim of ensuring that global systemically important entities (G-SIB) maintain a minimum level of eligible instruments and liabilities to ensure that in resolution procedures, and immediately thereafter, the essential functions of the entity can be maintained without jeopardizing taxpayers’ money or financial stability | |
| Traditional Securitisation | Operation through which an entity is capable of transforming a series of heterogeneous and illiquid financial assets into liquid homogeneous instruments (usually guarantees or bonds) and marketable securities, managing to transfer the risk of the assets in most cases while liquidity is preserved | |
| TRIM (Targeted Review of Internal Models) | Control model implemented by the ECB aimed at reducing inconsistencies and the variability in banks’ internal models used to calculate their risk-weighted assets | |
| Var (Value at Risk) | A risk measurement model that provides a prediction of the maximum loss that the entity’s trading portfolios might experience as a result of market price variations over a given time horizon and for a specific confidence interval | |
| BBVA. PILLAR III 2020 | INDEX OF TABLES | P. 7 |
| BBVA. PILLAR III 2020 | INDEX OF TABLES | P. 8 |
| BBVA. PILLAR III 2020 | INDEX OF TABLES | P. 9 |
| BBVA. PILLAR III 2020 | INDEX OF TABLES | P. 10 |
| BBVA. PILLAR III 2020 | INDEX OF CHARTS | P. 11 |
| BBVA. PILLAR III 2020 | EXECUTIVE SUMMARY | P. 12 |
BBVA’s consolidated phased-in CET1 ratio stood at 12.15% at the close of December 2020, which increased by +17 basis points compared to 2019, mainly due to:
| • | The positive generation of organic results for the Group, which has enabled it to cover the growth of risk-weighted assets (RWAs), and the relative stabilisation of the financial markets that began during the second quarter. This was largely the result of the economic stimulus measures and guarantee programmes announced by various national and supranational authorities, as well as the approval by the European Parliament and the Council of Capital Requirements Regulation 2020/873 (known as the CRR Quick Fix). Here, the positive impact of +19 basis points due to the regulatory change in the deduction of intangible (software) assets stands out. |
| • | The effect of transitional adjustments of IFRS9 impact on the solvency indicators, and subsequent changes in response to the COVID-19 pandemic. |
| • | A positive impact of +7 basis points at the CET1 level due to the execution of the agreement reached with Allianz to jointly boost the non-life insurance business in Spain. |
Additionally, the CET1 capital as of December 2020 includes the effect of the Shareholders’ remuneration of €0.059 gross per share, which amounts to a maximum value of approximately €393m (equivalent to 11 CET1 basis points), calculated based on the ECB’s recommendation.
In fully loaded terms, the CET1 ratio stood at 11.73%, similar to the level recorded by the Group in December 2019 (11.74%).
This ratio does not include the positive impact of the sale of BBVA USA and other companies in the United States, which, according to the current estimate and taking the capital level of December 2020 as a reference, would place the fully-loaded CET1 ratio at 14.58%. This also does not include the effect of the completion of the sale of BBVA Paraguay, which would have an approximate impact of +6 basis points and will be recorded in the first quarter of 2021.
The Liquidity Coverage Ratio (LCR) and the Net Stable Funding Ratio (NSFR) in the Group has remained well above 100% throughout 2020. At December 31, 2020, these ratios stood at 149% (185% considering the excess liquidity of the subsidiaries) and 127%, respectively. Although these requirements are only established at Group level, this minimum is comfortably exceeded in all subsidiaries.
As for the leverage ratio, as of December 31, 2020, the fully loaded ratio was 6.49%, above the minimum required ratio of 3%, still comparing very favorably with the rest of the Peer Group1. This ratio does not include the impact of the sale of BBVA USA, which, according to the current estimate and taking December 2020 as a reference, would place the leverage ratio at 7.74%
The following sections detail matters relating to the Group’s solvency. These are supplemented by information included in the Group’s Consolidated Financial Statements and Management Report, which also contain the Group’s main activity and profitability indicators.
| 1. | The peer group of the Group consists of the following entities: Barclays, BNP Paribas, Crédit Agricole, Commerzbank, Deutsche Bank, HSBC, Intesa Sanpaolo, Lloyds Bank, RBS, Santander, Société Générale, UBS and UniCredit. |
| BBVA. PILLAR III 2020 | INTRODUCTION | P. 13 |
| 14 | ||||
| 16 | ||||
| 18 | ||||
| BBVA. PILLAR III 2020 | INTRODUCTION | P. 14 |
Regulatory framework and regulatory developments in 2020
As a Spanish credit institution, BBVA is subject to Directive 2013/36/EU of the European Parliament and of the Council dated June 26, 2013, on access to the activity of credit institutions and the prudential supervision of credit institutions and investment firms (the “CRD IV Directive”) amended by Directive 2019/878/EU (the “CRD V Directive).
The major regulation governing the solvency of credit institutions is (EU) Regulation No. 575/2013 of the European Parliament and of the Council of June 26, 2013, on the prudential requirements for credit institutions and investment firms amending (EU) Regulation No 648/2012 (“CRR” and in conjunction with Directive CRD IV and any implementing measures of CRD IV, “CRD IV”), which is complemented by several binding Regulatory Technical Standards that are directly applicable to all EU member states, without the need to implement national measures. This Regulation has been amended by Regulation 2019/876/EU (“CRR2”) and Regulation 2020/873/EU (“Quick Fix”).
The CRD IV Directive was transposed to Spanish national law by means of the Royal Decree-Law 14/2013, of November 29 (“RD-L 14/2013”), Law 10/2014 of June 26, Royal Decree 84/2015, of February 13 (“RD 84/2015”), Bank of Spain Circular 2/2014 of January 31 and Circular 2/2016 of February 2 (“Bank of Spain Circular 2/2016”). During 2020, the adoption of the amendments proposed by Directive (EU) 2019/878 to the Spanish legal system began through the publication on September 4, 2020 of the proposed amendments to Law 10/2014 as well as RD 84/2015. As of the date of publication of this report, they had not yet been published in the BOE (Boletín Oficial del Estado — Spanish Official Journal).
In the Macroprudential field, Royal Decree 102/2019 was published in March 2019, establishing the Macroprudential Authority of the Financial Stability Board, establishing its legal regime. The aforementioned Royal Decree also develops certain aspects related to the macroprudential tools contained in Royal Decree-Law 22/2018. The draft Bank of Spain Circular on macroprudential tools was open for consultation during February 2021 (this was the Bank of Spain Circular amending Bank of Spain Circular 2/2016, of 2 February, to credit institutions, on supervision and solvency, which completes the adaptation of the Spanish legal system to Directive 2013/36/EU and Regulation (EU) No 575/2013.) This Circular develops measures that the Bank of Spain may decide to put in place, such as a countercyclical buffer for a particular sector, industry limits on exposure concentration, or the establishment of limits and conditions on the granting of loans and other transactions. As of the date of publication of this report, the Circular had not yet been published in the BOE (Boletín Oficial del Estado — Spanish Official Journal).
Regulatory developments in 2020
Major economic disruption caused by the COVID-19 pandemic and the exceptional containment measures have significantly impacted the economy. Businesses have faced disruptions in the supply chain, temporary closures, and reduced demand, while households have faced unemployment and declining incomes. Public authorities at the Union and Member State level have acted proactively to help households and solvent businesses to weather the intense-but-temporary slowdown in economic activity and the consequent shortage of liquidity.
With the aim of mitigating the impact of COVID-19, various bodies have made pronouncements aimed at allowing greater flexibility in terms of implementing accounting and prudential frameworks. Generally speaking, the following initiatives are notable due to their relevance:
| • | In its press release on 12 March in response to COVID-19, the ECB allowed banks to bring forward the use of Additional Tier 1 or Tier 2 capital instruments to partially meet Pillar II requirements (P2R). This measure has been bolstered by the relaxation of the countercyclical capital buffer (CCyB) that has been announced by various national macroprudential authorities, and by other additional measures published by the ECB that have provided institutions with flexibility by allowing them to operate below established P2G levels as well as to use capital and liquidity buffers. |
With regard to dividends, 15 December 2020 saw the ban on paying out dividends (in force since 27 March 2020) lifted, albeit under the recommendation of exercising extreme caution and limiting the maximum amount to be distributed. The ECB expects dividends and share buy-backs to remain below 15% of the adjusted cumulated 2019-2020 profit attributable to the parent company, provided that they do not exceed 20 basis points of Common Equity Tier I in the fourth quarter of 2020. This recommendation is effective until 30 September 2021.
| • | The European Banking Authority (EBA) published guidelines on legislative and non-legislative payment moratoria in April 2020. These guidelines set out the criteria that both public and private legislative and non-legislative payment moratoria must meet in order to avoid the exposures subject to these payment deferrals being automatically reclassified as forbearance or defaulted exposures. According to the EBA’s latest communication on 2 December 2020, these guidelines remain applicable until 31 March 2021. |
| BBVA. PILLAR III 2020 | INTRODUCTION | P. 15 |
Regarding relevant EBA publications on prudential aspects, the guidelines on structural FX (Guidelines on the treatment of structural foreign exchange under Article 352 (2) of the CRR) that were issued on July 1, 2020, stand out. They apply as of January 1, 2022.
| • | The European Parliament and Council adopted Regulation 2020/873 applicable from 27 June 2020 (known as the “CRR Quick Fix”), which amends both Regulation (EU) 575/2013 (CRR) and Regulation 2019/876 (CRR2). The main amendments included in this Regulation are: the extension of the IFRS 9 transitional treatment (affects phased-in ratios only); the non-deductibility of software from CET1 capital (this entered into force on 23 December 2020 following the publication of Delegated Regulation 2020/2176 in the OJEU); the bringing forward of the application of the SME and infrastructure support factor; the possibility of applying a prudential filter that temporarily neutralises the impact on CET1 capital of variation in the value of sovereign debt instruments classified as fair value through other comprehensive income (FVOCI); the flexibilization of aspects associated with market risk (supplemented by related communications from the EBA); and the temporary exclusion of certain exposures to central banks for leverage ratio purposes (ECB Decision 2020/1306, allowing the exclusion of exposures to central banks from the Eurosystem, entered into force on 26 September 2020). With regard to ongoing regulatory changes also concerning prudential matters, the European Commission’s proposal of 24 July 2020 (pending approval by the European Parliament and Council) on amendments to the securitisation framework (known as the “Securitisation Quick Fix”) is noteworthy. |
| • | On 27 March, the Basel Committee announced the deferral by one year (until 1 January 2023) to the implementation date of the Basel III reform (known as Basel IV). |
The EBA published two Calls for Advice in 2020 to support the European Commission in its task of releasing a European proposal to implement this Basel III reform:
| • | Submission of additional analysis for the Call for Advice for the purposes of revising the own fund requirements for credit, operational, market and credit valuation adjustment risk: published on 5 March 2020. |
| • | Basel III Reforms: Updated Impact Study: published on 15 December 2020. |
With regard to public disclosure and supervisory reporting, the main new development is the publication by the EBA on
2 June 2020 of the guidelines setting out the templates to be used to perform the supervisory reporting and disclosure to the market of exposures subject to payment moratoria and public guarantees introduced by Member States in response to the COVID-19 crisis (“Guidelines on reporting and disclosure of exposures subject to measures applied in response to the COVID-19 crisis”). With regard to the measures contained in the “CRR Quick Fix,” the EBA published guidelines on 11 August setting out how to report and disclose said measures (“Guidelines on supervisory reporting and disclosure requirements in compliance with the CRR quick fix”
and “Guidelines amending Guidelines EBA/GL/2018/01 on uniform disclosures under Article 473a of Regulation (EU) No 575/2013 (CRR) on the transitional period for mitigating the impact of the introduction of IFRS 9 on own funds to ensure compliance with the CRR quick fix”). Finally, on November 4, 2020, the EBA published the guidelines on the specification and disclosure of systemic importance indicators, which apply from December 16, 2020 and repeal the previous revised guidelines. of February 29, 2016 (EBA/GL/2016/01). These guidelines apply to entities whose leverage ratio exposure measure exceeds €200 billion.
Since approved regulatory developments (e.g. CRR2) are in place but apply further down the line, the EBA is in the process of reviewing current implementing technical standards (ITS) related to supervisory reporting and public disclosure to reflect changes derived from these regulations. In this sense, the EBA made the following pronouncements throughout 2020:
| 1. | DPM 2.10 Framework: |
| • | On 4 May 2020, the final document on the benchmarking of internal models for the 2021 exercise (“ITS amending Commission Implementing Regulation (EU) 2016/2070 with regard to benchmarking of internal models”) was published. This document is part of the DPM 2.10 framework and to date its publication in the Official Journal of the European Union (OJEU) is pending. |
| 2. | DPM 3.0 Framework: |
| • | On 24 June 2020, the final documents in terms of both reporting (“ITS on supervisory reporting requirements for institutions”) and disclosure (“TS on public disclosures by institutions”) were published. These documents implement the changes introduced by both the CRR2 (Regulation 2019/876) and the Regulation on the minimum loss coverage for non-performing exposures (Regulation 2019/630). Their application date is 28 June 2021, although they are yet to be published in the OJEU. |
| • | On 3 August 2020, the final document on the reporting and disclosure of MREL and TLAC (“ITS on disclosure and reporting of MREL and TLAC”) was published, which implements the changes introduced by BRRD 2 (Regulation 2019/879). Although it is yet to be published in the OJEU, the application date of the reporting requirements is 30 June 2021, while the application date for disclosure requirements varies between those for the TLAC (once the ITS entries into force) and those for the MREL (1 January 2024 at the earliest). |
| 3. | DPM 3.1 Framework: |
| • | ITS on specific supervisory reporting requirements for market risk: on 4 May 2020, the final document on reporting requirements for the new alternative standardised approach for market risk (“FRTB-SA”) was published. It proposes delaying its application date by six months until 1 September 2021. This document is yet to be published in the OJEU. |
| BBVA. PILLAR III 2020 | INTRODUCTION | P. 16 |
The EBA will gradually publish the documents containing the new reporting templates for the new market risk framework, this being the first publication.
| • | ITS amending Commission Implementing Regulation (EU) 2016/2070 with regard to benchmarking of internal models: published on 17 December 2020 and open for consultation until 15 February 2020, it introduces changes for the 2022 exercise on the benchmarking of internal models. |
With regard to the Minimum Requirement for Own Funds and Eligible Liabilities (MREL), on 20 May 2020, the Single Resolution Board (SRB) issued its MREL policy for the 2020 resolution planning cycle, which incorporates the criteria set out in BRRD 2/CRR 2 and establishes new transition periods (intermediate target in 2022 and final target in 2024). With regard to the existing binding targets (set out in the 2018 and 2019 resolution cycles), the SRB has clarified that it will adopt a forward-looking approach for banks that may face difficulties meeting those targets.
Sustainable finance: Towards integration in regulation and prudential supervision
Throughout 2020, progress continued towards ensuring that ESG criteria are integrated into the policies of companies—specifically their financial and risk departments—so that these criteria can fully permeate their actions and corporate culture. The pandemic seems to have been an accelerator in this area as well. At the global level, the Financial Stability Board (FSB) published its assessment of financial authorities’ experience in including physical and transitional climate risks as part of their financial stability monitoring. The Task Force on
Climate-related Financial Disclosures (TCFD), created by the FSB, has published a consultation paper to gather feedback on climate-related forward-looking metrics that are useful for financial sector decision-making. The TCFD has also published important documents on sustainability. These include its third status report, which highlights an increase in disclosures by companies in line with TCFD recommendations; guidance on the analysis of climate-related scenarios and on the integration of climate-related risks into existing risk management processes; and guidance on the analysis of climate-related scenarios for non-financial firms.
The EU continues to integrate sustainability into the financial system and to make progress on developing regulations for this purpose. To this end, the European Commission consulted on its renewed sustainable finance strategy, which is expected to be published in early 2021. It has also consulted on a possible initiative on sustainable corporate governance principles. For their part, the Commission, Council and Parliament agreed on a sustainable finance taxonomy using a common classification system applicable from the close of 2021 for adaptation and mitigation objectives. The European supervisory authorities (ESAs) published a consultation paper with a set of standards covering the disclosure of ESG information. The survey is part of EBA’s work to develop a draft Implementing Technical Standard (ITS) on the disclosure of prudential information regarding ESG risks. It will also be used to monitor the short-term expectations specified in the EBA Action Plan on Sustainable Finance. The EBA has also published for consultation a document on the management and supervision of ESG risks, which covers a wide range of topics (definition of ESG risks and factors, quantitative and qualitative indicators). Lastly, the ECB published its final guidelines on its supervisory expectations regarding climate change and environmental risks at the end of the year.
Contents of the 2020 Prudential Relevance Report
Article 13 of the CRR establishes that the parent entities of the European Union are subject, based on their consolidated situation, to the disclosure requirements set by Part Eight of CRR.
This report provides the prudential information of BBVA Consolidated Group as of December 31, 2020 which has been prepared in accordance with the precepts contained in Part Eight of the CRR, complying with the guidelines published by EBA and the applicable technical implementation standards.
In addition, the main EBA guidelines that apply as of December 31, 2020 are highlighted below:
| • | Guidelines on materiality, proprietary information, and confidentiality, and on the frequency of disclosure of information according to Article 432, sections 1 and 2, and Article 433 of Regulation (EU) No. 575/2013 (EBA/ GL/2014/14). These guidelines detail the process and the criteria to be followed regarding the principles of materiality, proprietary information, confidentiality and the right to omit information, and provide guidance for entities to assess the need to publish information more frequently than the annual one. These guidelines were adopted by the Executive Commission of the Bank of Spain in February 2015. |
| • | Guidelines on disclosure requirements under Part Eight of Regulation (EU) No. 575/2013 (EBA/GL/2016/11). These guidelines provide guidance in relation to the information that entities must disclose in application of the corresponding articles of the Part Eight and with the presentation of said information. These guidelines were adopted by the Executive Commission of the Bank of Spain in October 2017. |
| BBVA. PILLAR III 2020 | INTRODUCTION | P. 17 |
| • | Guidelines on appropriate remuneration policies under Articles 74, Paragraph 3 and 75, Paragraph 2, of Directive 2013/36/EU and disclosure of information under Article 450 of Regulation (EU) No 575/2013 (EBA/GL/2015/22). These guidelines were adopted by the Executive Commission of the Bank of Spain in July 2016. |
| • | Guidelines amending the EBA/GL/2018/01 guidelines regarding the uniform disclosure of information in accordance with article 473 bis of Regulation (EU) No. 575/2013 (CRR) in relation to transitional provisions to mitigate the impact on capital of the introduction of IFRS 9, to ensure compliance with the quick fix carried out in the CRR in response to the COVID-19 pandemic (EBA/ GL/2020/12). These guidelines are applicable from August 11, 2020 until the end of the transitional periods set by articles 468 and 473 bis of the CRR (December 31, 2024 and December 31, 2022, respectively). |
Furthermore, with the goal of promoting transparency and as a transition towards the new DPM 3.0 framework defined by the EBA (see 2020 Regulatory Developments), the BBVA Group has decided to bring forward the adaptation of certain templates with standard formats, taking into account the
Implementing Technical Standards published in June 2020 concerning reporting and disclosure of public information (EBA/ITS/2020/04). These Implementing Technical Standards entry into force on 28 June 2021 and to date its publication in the Official Journal of the European Union (OJEU) is pending.
In those Implementing Technical Standards, the EBA, as mandated by the European Commission in Article 434a of the CRR2, implements the changes introduced by this regulation, integrating most of the public disclosure requirements that were issued in various guidelines and ITS published to date into a single document. In addition, these guidelines also aim to unify, as far as possible, the public information with the information reported to the Supervisor through integration in regulatory reporting and, in some cases, have involved simplifying standard templates that may contain similar information, maintaining only those templates that contain more complete and relevant information, such as those referring to the asset quality of exposures. Together with the aforementioned ITS, the EBA has also published a mapping tool for informational purposes. This document maps the quantitative data in most of the standard templates required in Pillar 3 with supervisory reporting, which has been taken into account when preparing the data in those templates that apply as of the date of the report. The table below sets out the principal changes and the legislative provisions on which they are based.
Table 2019 | Description | ITS applicable on 2019 report | Modificación | Table 2020 | ITS applicable | |||||
| NPL1 | Credit quality of forborne exposures | EBA/GL/2018/10 | Renamed | EU CQ1 | EBA/ITS/2020/04 | |||||
| NPL3 | Credit quality of performing and non-performing exposures by past due days | EBA/GL/2018/10 | Renamed | EU CQ3 | EBA/ITS/2020/04 | |||||
| NPL4 | Performing and non-performing exposures and related provisions | EBA/GL/2018/10 | Renamed | EU CR1 | EBA/ITS/2020/04 | |||||
| NPL9 | Collateral obtainedd obtained by taking possesion and execution processes | EBA/GL/2018/10 | Renamed | EU CQ7 | EBA/ITS/2020/04 | |||||
| Credit quality of exposures by geographic region | New template | EU CQ4 | ||||||||
| Credit quality of loans and advances to non-financial corporations by sector of activity | New template | EU CQ5 | ||||||||
| EU CR1-A | Credit quality of exposures by exposure class and instrument | EBA/GL/2016/11 | Dropped. Requirement covered by EU CR1 | EU CR1 | Art. 442 g), h) CRR | |||||
| EU CR1-B | Credit quality of exposures by industry or counterparty type | EBA/GL/2016/11 | Dropped. Requirement covered by EU CQ5 | EU CQ5 | EBA/GL/2018/10 | |||||
| EU CR1-C | Credit quality of exposures by geographic | EBA/GL/2016/11 | Dropped. Requirement covered by EU CQ4 | EU CQ4 | EBA/GL/2018/10 | |||||
| BBVA. PILLAR III 2020 | INTRODUCTION | P. 18 |
Annex VI to this report contains the correspondence to the articles of Part Eight of the CRR, which apply on the date of the report, with the different headings of the document (or other public documents) where the required information can be found.
The aforementioned annex, together with the other annexes and the tables of this Report, are included in an editable document in order to facilitate its analysis, following the recommendations of the EBA Guidelines. This document is called “Pillar III 2020 – Tables & Annexes”, which is available in the section of financial reports on the Group’s Shareholders and Investors website.
It must be pointed out that the data published in the Prudential Relevance Report (Pillar 3) was prepared in accordance with internal control processes described in the “Standard for the preparation of periodic public information of Banco Bilbao Vizcaya Argentaria, S.A. and BBVA Group”. These policies ensure that the information disclosed in Pillar 3 is subject to the internal control framework defined by the Group, as well as adequate internal and external revision (by an independent expert), in compliance with the aforementioned Implementing Technical Standards.
Regulatory capital requirements
In this regard, Article 92 of the CRR establishes that credit institutions must maintain the following own funds requirements at all times:
| a. | Common Equity Tier 1 capital ratio of 4.5%, calculated as Common Equity Tier 1 capital expressed as a percentage on the total amount of risk-weighted assets. |
| b. | Tier 1 capital ratio of 6%, calculated as the level of tier capital 1 expressed as a percentage of the total amount of risk-weighted assets. |
| c. | Total capital ratio of 8%, calculated as the total own funds expressed as a percentage of the total amount of risk-weighted assets |
Notwithstanding the application of the Pillar 1 requirement, CRD IV allows competent authorities to require credit institutions to maintain a level of own funds higher than the requirements of Pillar 1 to cover types of risk other than those already covered by the Pillar 1 requirement (this power of the competent authority is commonly referred to as “Pillar 2”).
Furthermore, from 2016 and in accordance with CRD IV, credit institutions must comply with the following combined requirement of capital buffers at all times: (i) the capital conservation buffer, (ii) the buffer for global systemically important banks (the “G-SIB” buffer), (iii) the entity-specific countercyclical capital buffer, (iv) the buffer for other systemically important banks (“D-SIB” buffer) and (v) the systemic risk capital buffer. The “combined capital buffer requirement” must be met with Common Equity Tier 1 capital (“CET1”) to cover both minimum capital required by “Pillar 1” and “Pillar 2”.
Both the capital conservation buffer and the G-SIB buffer (where appropriate) will apply to credit institutions as it establishes a percentage greater than 0%.
The buffer for global systemically important banks applies to those institutions on the list of global systemically important banks, which is updated annually by the Financial Stability Board (“FSB”). Considering the fact that BBVA has not appeared on the said list since November 2015 (effective January 1, 2017), the G-SIB buffer does not apply to BBVA.
For more details on the quantitative indicators for assessing global systemically important entities, see “Annex V – G-SIB indicators”.
The Bank of Spain has extensive discretionary powers as regards the countercyclical capital buffer specific to each bank, the buffer for other systemically important financial institutions (which are those institutions considered to be systemically important domestic financial institutions “D-SIB”) and the buffer against systemic risk (to prevent or avoid systemic or macroprudential risk). The European Central Bank (ECB) has the powers to issue recommendations in this respect following the entry into force on November 4, 2014 of the Single Supervisory Mechanism (SSM).
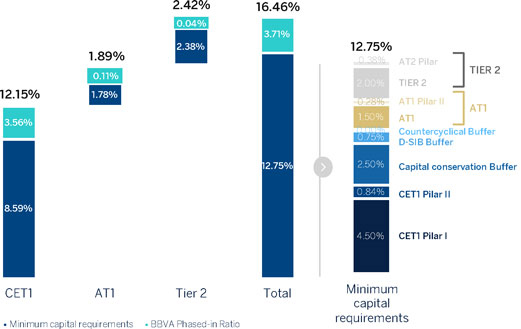
With regard to minimum capital requirements, the ECB, in its announcement on 12 March 2020, has allowed banks to use Additional Tier 1 and Tier 2 capital instruments to comply with the Pillar II (P2R) requirements, which is known as “Pillar 2 tiering.” This measure is reinforced by the relaxation of the Countercyclical Capital Buffer (CCyB) announced by various national macroprudential authorities and by other complementary measures published by the ECB. Furthermore, the BBVA Group received its SREP (Supervisory Review and Evaluation Process) results in December 2020. Through this letter, the ECB informed the Group that, as from 1 January 2021, the Pillar 2 requirement would be maintained at 1.5%, to be distributed according to the aforementioned Pillar 2 tiering. All this has resulted in a lower fully-loaded CET1 requirement of 66 basis points for BBVA, whereby said requirement stands at 8.59% and the requirement at the total ratio level stands at 12.75%.
| BBVA. PILLAR III 2020 | INTRODUCTION | P. 19 |
Then, the consolidated overall capital requirement includes: i) the minimum capital requirement of Common Equity Tier 1 (CET1) of Pillar 1 (4.5%); ii) the capital requirement of Additional Tier 1 (AT1) of Pillar 1 (1.5%); iii) the capital requirement of Tier 2 of Pillar 1 (2%); iv) the CET1 requirement of Pillar 2 (0.84%), v) the capital requirement of Additional Tier 1 (AT1) of Pillar 2 (0.28%); vi) the capital requirement of Tier 2 of Pillar 2 (0.38%); vii) the capital conservation buffer (2.5% of CET1); and viii) the capital buffer for Other Systemically Important Institutions (O-SIIs) (0.75% of CET1).
As of 2021, the BBVA Group has set an objective to maintain a fully-loaded CET1 ratio of between 11.5% and 12.0%, increasing the target distance from the minimum requirement (currently 8.59%) to 291–341 basis points. At the end of financial year 2020, the fully-loaded CET1 ratio falls within this target management range (+314 basis points).
CET1 phased-in ratio reach 12.15% which represents +315 basis points over the mínimum requirement of 8.59%.
Chart 1. Capital Requirements and capital ratios (phased-in)
The following table shows the CET1 ratio that would trigger restrictions on capital distribution and the capital ratios as of December 2020:
Table 1. Capital distribution contrains (12-31-2020)
| CET1 capital ratio that would trigger capital distribution constraints (%) | Current CET 1 capital ratio (%) | |||||||
CET1 Pillar 1 | 4.50 | % | ||||||
CET1 Pillar 2 (P2R) | 0.84 | % | ||||||
Capital conservation buffer | 2.50 | % | ||||||
D-SIB buffer | 0.75 | % | ||||||
Countercyclical buffer | 0.00 | % | ||||||
CET1 phased-in minimum plus Basel III buffers (excluding capital used to meet other minimum regulatory capital) | 8.59 | % | 12.15 | % | ||||
|
|
|
| |||||
CET1 phased-in minimum plus Basel III buffers (including capital used to meet other minimum regulatory capital) | N/A | N/A | ||||||
|
|
|
| |||||
The Group has not made use of CET1 phased-in capital to meet other minimum capital requirements other than the minimum CET1 capital requirement plus combined capital buffer requirements.
The following table shows the distribution by geographic areas of the credit exposure for calculation of the countercyclical capital buffer:
| BBVA. PILLAR III 2020 | INTRODUCTION | P. 20 |
Table 2. Geographical breakdown of relevant credit exposures for the calculation of the countercyclical capital buffer (Million Euros. 12-31-2020)
| General credit exposures(1) | Trading book exposure | Securitisation exposure | Own funds requirements | |||||||||||||||||||||||||||||||||||||||||||||||||
| Exposure value for SA | Exposure value for IRB | Sum of long and short position of trading book | Trading book exposure value for internal models | Exposure value for SA | Total exposure value | Of which: General credit exposures | Of which: Trading book exposures | Of which: Securitisation exposures | Total | Risk weighted exposures | Own funds requirements weights | Countercyclical capital buffer rate | ||||||||||||||||||||||||||||||||||||||||
Geographical breakdown | ||||||||||||||||||||||||||||||||||||||||||||||||||||
Bulgary | 34 | 3 | — | — | — | 37 | 3 | — | — | 3 | 35 | 0.01 | % | 0.50 | % | |||||||||||||||||||||||||||||||||||||
Slovakia | 7 | 187 | — | — | — | 194 | 18 | — | — | 18 | 219 | 0.09 | % | 1.00 | % | |||||||||||||||||||||||||||||||||||||
Hong Kong | 21 | 1,694 | 0 | 9 | — | 1,724 | 24 | 0 | — | 24 | 303 | 0.13 | % | 1.00 | % | |||||||||||||||||||||||||||||||||||||
Luxemburg | 148 | 1,810 | 21 | 3 | — | 1,982 | 59 | 0 | — | 59 | 743 | 0.31 | % | 0.25 | % | |||||||||||||||||||||||||||||||||||||
Norway | 3 | 48 | 0 | 0 | — | 51 | 2 | 0 | — | 2 | 19 | 0.01 | % | 1.00 | % | |||||||||||||||||||||||||||||||||||||
Czech Republic | 14 | 9 | — | — | — | 23 | 1 | — | — | 1 | 15 | 0.01 | % | 0.50 | % | |||||||||||||||||||||||||||||||||||||
|
|
|
|
|
|
|
|
|
|
|
|
|
|
|
|
|
|
|
|
|
|
|
|
|
| |||||||||||||||||||||||||||
Total countries with countercyclical capital buffer stablished | 227 | 3,750 | 21 | 12 | — | 4,011 | 106 | 1 | — | 107 | 1,334 | 0.55 | % | — | ||||||||||||||||||||||||||||||||||||||
|
|
|
|
|
|
|
|
|
|
|
|
|
|
|
|
|
|
|
|
|
|
|
|
|
| |||||||||||||||||||||||||||
Argentina | 5,617 | 396 | 490 | — | — | 6,502 | 289 | 0 | — | 289 | 3,613 | 1.50 | % | — | ||||||||||||||||||||||||||||||||||||||
Colombia | 13,934 | 680 | 737 | 5 | — | 15,355 | 730 | 7 | — | 738 | 9,220 | 3.82 | % | — | ||||||||||||||||||||||||||||||||||||||
Spain | 29,723 | 175,782 | 145 | 105 | 1,585 | 207,339 | 5,197 | 5 | 24 | 5,226 | 65,325 | 27.10 | % | — | ||||||||||||||||||||||||||||||||||||||
United States | 74,786 | 18,691 | 393 | 163 | 64 | 94,097 | 4,138 | 9 | 4 | 4,151 | 51,885 | 21.53 | % | — | ||||||||||||||||||||||||||||||||||||||
France | 341 | 8,544 | 39 | 23 | — | 8,947 | 206 | 1 | — | 207 | 2,589 | 1.07 | % | — | ||||||||||||||||||||||||||||||||||||||
Mexico | 34,802 | 37,954 | 368 | 299 | — | 73,423 | 3,121 | 30 | — | 3,152 | 39,394 | 16.34 | % | — | ||||||||||||||||||||||||||||||||||||||
Peru | 21,648 | 699 | 1,103 | — | — | 23,450 | 902 | 17 | — | 919 | 11,485 | 4.76 | % | — | ||||||||||||||||||||||||||||||||||||||
Portugal | 4,475 | 574 | 18 | 18 | — | 5,085 | 270 | 1 | — | 271 | 3,382 | 1.40 | % | — | ||||||||||||||||||||||||||||||||||||||
United Kingdom | 700 | 6,726 | 101 | 85 | — | 7,612 | 219 | 1 | — | 220 | 2,751 | 1.14 | % | — | ||||||||||||||||||||||||||||||||||||||
Turkey | 51,104 | 556 | 1,887 | — | — | 53,547 | 2,725 | 3 | — | 2,728 | 34,096 | 14.14 | % | — | ||||||||||||||||||||||||||||||||||||||
|
|
|
|
|
|
|
|
|
|
|
|
|
|
|
|
|
|
|
|
|
|
|
|
|
| |||||||||||||||||||||||||||
Total countries with a 0% countercyclical buffer or without countercyclical capital buffer (with own funds requirements greater than 1%) | 237,129 | 250,601 | 5,281 | 697 | 1,649 | 495,357 | 17,798 | 74 | 27 | 17,899 | 223,739 | 92.82 | % | — | ||||||||||||||||||||||||||||||||||||||
|
|
|
|
|
|
|
|
|
|
|
|
|
|
|
|
|
|
|
|
|
|
|
|
|
| |||||||||||||||||||||||||||
Other areas | 10,865 | 29,630 | 428 | 360 | 74 | 41,356 | 1,264 | 14 | 1 | 1,278 | 15,972 | 6.63 | % | — | ||||||||||||||||||||||||||||||||||||||
|
|
|
|
|
|
|
|
|
|
|
|
|
|
|
|
|
|
|
|
|
|
|
|
|
| |||||||||||||||||||||||||||
Total countries without countercyclical capital buffer (with own funds requirements less than 1%) | 10,865 | 29,630 | 428 | 360 | 74 | 41,356 | 1,264 | 14 | 1 | 1,278 | 15,972 | 6.63 | % | — | ||||||||||||||||||||||||||||||||||||||
|
|
|
|
|
|
|
|
|
|
|
|
|
|
|
|
|
|
|
|
|
|
|
|
|
| |||||||||||||||||||||||||||
Total | 248,221 | 283,982 | 5,730 | 1,069 | 1,723 | 540,724 | 19,167 | 88 | 28 | 19,284 | 241,044 | 100.00 | % | — | ||||||||||||||||||||||||||||||||||||||
|
|
|
|
|
|
|
|
|
|
|
|
|
|
|
|
|
|
|
|
|
|
|
|
|
| |||||||||||||||||||||||||||
| (*) | Table format adapted to the EBA/ITS/2020/04 version of the standards. |
| (1) | Credit exposure excludes exposures to Central Governments or Central Banks, Regional Governments or Local Authorities, Public sector entities, Multilateral Development Banks, International Organisations and Institutions in accordance with art. 140.4 of Directive 2013/36/EU. |
| Amount | ||||
Total risk exposure amount | 353,273 | |||
Institution specific countercyclical buffer rate(2) | 0.31 | % | ||
Institution specific countercyclical buffer requirement | 11 | |||
| (2) | Countercyclical capital buffer calculated as of December 2020 in accordance with Commission Delegated Regulation (EU) 2015/1555. |
| BBVA. PILLAR III 2020 | INTRODUCTION | P. 21 |
The countercyclical capital buffer requirement applicable to the BBVA Group has been reduced by approximately €60 million as compared to December 2019. This is due to the relaxation of the countercyclical capital buffer announced by various national macroprudential authorities, principally in France and the United Kingdom, which went from 0.25% and 1% respectively in December 2019 to 0% in December 2020.
Leverage ratio
In order to provide the financial system with a metric that serves as a backstop to capital levels, irrespective of the credit risk, a measure complementing all the other capital indicators has been incorporated into Basel III and transposed to the solvency regulations. This measure, the leverage ratio, can be used to estimate the percentage of assets and off-balance sheet items financed with Tier 1 capital.
Although the book value of the assets used in this ratio is adjusted to reflect the bank’s current or potential leverage with a given balance sheet position, the leverage ratio is intended to be an objective measure that may be reconciled with the Financial Statements.
As of December 31, 2020, the Group had a leverage fully loaded ratio of 6.49% and a phased-in ratio of 6.69%, above the minimum required ratio of 3% and continuing to compare very favorably with the rest of the peer group. This ratio does not include the impact of the sale of BBVA USA, which, according to the current estimate and taking December 2020 as a reference, would place the leverage ratio at 7.74%.
| BBVA. PILLAR III 2020 | 1. GENERAL INFORMATION REQUIREMENTS | P. 22 |
1. General information requirements
| BBVA. PILLAR III 2020 | 1. GENERAL INFORMATION REQUIREMENTS | P. 23 |
1.1. Corporate name and differences between the consolidated group for the purposes of solvency regulations and accounting criteria
1.1.1. Corporate name and scope of application
Banco Bilbao Vizcaya Argentaria, S.A. (hereinafter the “Bank” or “BBVA”) is a private law entity subject to the rules and regulations of the banking entities operating in Spain and carries out its activity through branches and agencies throughout the country and abroad.
The bylaws and other public information are available for consultation at the Bank’s registered office (Plaza San Nicolás, 4, Bilbao) and on its website (www.bbva.com).
Solvency regulations are applicable at a consolidated level for the whole Group.
1.1.2. Differences between the Consolidated Group for the purposes of solvency regulations and accounting criteria
The Consolidated Financial Statements of BBVA Group are presented in accordance with the International Financial Reporting Standards adopted by the European Union (hereinafter referred to as ‘IFRS-EU’) applicable as of December 31, 2020, considering the Bank of Spain Circular
4/2017, and its successive modifications and the other provisions of the financial reporting framework which are applicable and the marking and format requirements stablished by Regulation EU 2019/815 of European Commision.
On the basis of accounting criteria, companies are considered to form part of a consolidated group when the parent entity holds or can hold, directly or indirectly, control of them. An institution is understood to control a subsidiary when it is exposed, or is entitled to, variable returns as a result of its involvement in the subsidiary and has the capacity to influence those returns through the power it exercises over the subsidiary. For control to exist, the following aspects must be fulfilled:
| a. | Power: An investor has power over a subsidiary when it has current rights that provide it with the capacity to direct its relevant activities, i.e. those that significantly affect the returns of the subsidiary. |
| b. | Returns: An investor is exposed, or is entitled to variable returns, as a result of its involvement in the subsidiary when the returns obtained by the investor for such involvement may vary based on the economic performance of the subsidiary. Investor returns can be positive only, negative only, or positive and negative at the same time. |
| c. | Relationship between power and returns: An investor has control over a subsidiary when it not only has power over the subsidiary and is exposed, or is entitled to, variable returns for its involvement in the subsidiary, but it also has the capacity to use its power to influence the returns it obtains due to its involvement in the subsidiary. |
Therefore, in drawing up the Consolidated Financial Statements of BBVA Group, all dependent companies and consolidating structured entities have been consolidated by applying the full consolidation method.
Associated companies, as well as joint ventures (those over which joint control arrangements are in place), are valued using the equity method.
The list of all the companies forming part of the Group is included in the appendices to the Consolidated Financial Statements of BBVA Group.
For the purposes of solvency regulations, the following subsidiaries form part of the consolidated group, as defined in Article 18 of the CRR:
| • | Credit institutions |
| • | Investment firms |
| • | Financial Institutions |
A financial institution is a company, separate from other institutions (credit institution or investment firm), whose main activity may consist of acquiring holdings or performing one or more of the following activities:
| • | Loans, including in particular consumer finance, credit agreements relating to immovable property, recourse and non-recourse factoring, and financing of commercial transactions (including forfaiting) |
| • | Financial leasing |
| • | Payment services |
| • | Issuing and managing other payment channels (e.g. traveler’s checks and bank checks) |
| • | Granting of guarantees and commitments |
| BBVA. PILLAR III 2020 | 1. GENERAL INFORMATION REQUIREMENTS | P. 24 |
| • | Trading on their own account or on behalf of customers on any of the following instruments: |
| • | Money market instruments (checks, bills, certificates of deposit etc.) |
| • | Foreign currency |
| • | Financial futures and options |
| • | Foreign-exchange or interest-rate instruments |
| • | Marketable securities |
| • | Participating in the issuance of securities and the provision of corresponding services |
| • | Advising companies with regard to capital structure, industrial strategy and related matters, as well as advice and services for mergers and acquisitions of companies |
| • | Brokerage in the interbank markets |
| • | Managing or advising on equity management |
| • | Custody and administration of marketable securities |
| • | Issuance of electronic money |
This definition includes financial holding companies, mixed financial holding companies, payment institutions and asset management firms, but excludes pure industrial holding companies, insurance companies, insurance holding companies and mixed insurance holding companies.
| • | Auxiliary services companies: A company whose main activity is holding or management of property, management of computing services or any other similar activity of an auxiliary nature with regard to the main activity of one or more institutions (credit institution or investment firm). |
Therefore, for the purposes of calculating solvency requirements, and hence the drawing up of this Prudential
Relevance Report, the scope of consolidating entities is different from the scope defined for the purposes of drawing up the Consolidated Financial Statements of BBVA Group.
The effect of the difference between the two regulations is mainly due to:
| • | Withdrawals from the balance made by entities (largely insurance companies regulated by the Solvency II regulatory framework) that are consolidated in the Consolidated Financial Statements of BBVA Group by the full consolidation method and consolidated for the purposes of solvency by applying the equity method. |
| • | Entries to the balance contributed mainly by financial entities, consolidated by applying the equity method at the accounting level, but for the purposes of solvency, are proportionally integrated. |
The list of entities that use different consolidation methods in their public and regulatory balance sheets is included in table LI3 in Appendix 1 to the file titled, “Excel Tables and Pillar III 2020 Appendices”, which is included with this report and is available in the Shareholders and Investors/Financial Information section of the Group’s website.
1.1.3. Main changes in the Group in the 2020 financial year
In 2020, the BBVA Group underwent two significant divestment operations, which are detailed in Note 3 to the Consolidated Financial Statements. These operations involved the agreement reached with Allianz to jointly boost the non-life insurance business in Spain, which was finalised in December 2020, and the agreement to sell BBVA USA and other subsidiaries in the United States with activities related to the banking business. The closing of this agreement is subject to the receipt of regulatory authorisations from the relevant authorities.
Furthermore, on 22 January 2021, once all required authorisations had been obtained, BBVA completed the sale of its direct and indirect holdings of 100% of the share capital of Banco Bilbao Vizcaya Argentaria Paraguay, S.A. (“BBVA Paraguay”) to Banco GNB Paraguay S.A., part of the Gilinski Group. This sale will have a positive impact on the Group’s fully loaded CET1 ratio of approximately +6 basis points, which will be reflected in the BBVA Group’s capital base for the first quarter of 2021 (see Note 56 to the Group’s Consolidated Financial Statements).
As result of the agreement to sale BBVA USA, as of 31 December 2020 in the Group’s consolidated public balance sheet, all the items on the balance sheet of BBVA USA, have been reclassified to the category of “Non-current assets (liabilities) and disposal groups classified as held for sale”. The same treatment applied in this report for those breakdowns that, in compliance with the respective RTS/ITS of the EBA, are made based on information from the FINREP Statements (indicated in the respective breakdowns).
On the contrary, for the purposes of prudential consolidation and in compliance with article 18 of the CRR, both in the Corep Statements submitted to the Supervisor, and in the disclosures of this report other than those mentioned above, BBVA USA’s assets and liabilities are presented in their respective balance sheet headings.
This also applies to BBVA Paraguay, whose balance sheet items have been reclassified as “Non-current assets (liabilities) and disposal groups held for sale” since 2019, when the sale agreement was reached with Banco GNB Paraguay, S.A.
For more information on the main transactions during the year, see Note 3 of the Consolidated Financial Statements of BBVA Group.
| BBVA. PILLAR III 2020 | 1. GENERAL INFORMATION REQUIREMENTS | P. 25 |
1.1.4. Reconciliation of the Public Balance Sheet from the accounting perimeter to the regulatory perimeter
This section includes an exercise in transparency to show the reconciliation process between the book balances reported in the public balance sheet (attached to the Consolidated Financial Statements of BBVA Group) and the book balances
this report uses (regulatory perimeter), revealing the main differences between both perimeters. This comparison is affected by the classification of BBVA USA’s and BBVA Paraguay’s assets and liabilities as “Non-current assets (liabilities) and disposal groups held for sale” in the public balance sheet, while they are classified on the prudential balance sheet under their respective balance sheet headings in accordance with the prudential method of consolidation established by the CRR (see Chapter 1.3).
Table 3. CC2 - Reconciliation of regulatory capital to balance sheet (Million Euros. 12-31-2020)
Public Balance Sheet Headings(1) | Public Balance Sheet | Regulatory balance sheet | Referece to template CC1 | |||||||||
Cash, cash balances at central banks and other demand deposits | 65,520 | 77,557 | ||||||||||
Financial assets held for trading | 108,257 | 109,759 | ||||||||||
Non-trading financial assets mandatorily at fair value through profit or loss | 5,198 | 1,619 | ||||||||||
Financial assets designated at fair value through profit or loss | 1,117 | — | ||||||||||
Financial assets at fair value through accumulated other comprehensive income | 69,440 | 59,379 | ||||||||||
Financial assets at amortised cost | 367,668 | 424,956 | ||||||||||
Derivatives - Hedge accounting | 1,991 | 1,863 | ||||||||||
Fair value changes of the hedged items in portfolio hedges of interest rate risk | 51 | 51 | ||||||||||
Joint ventures and associates | 1,437 | 4,382 | ||||||||||
Insurance and reinsurance assets | — | — | ||||||||||
Tangible assets | 7,823 | 8,326 | ||||||||||
Intangible assets | 2,345 | 4,246 | g) | |||||||||
Tax assets | 16,526 | 16,557 | ||||||||||
Of which: deferred tax assets | 15,327 | 15,353 | h) | |||||||||
Other assets | 2,819 | 5,932 | ||||||||||
Non-current assets and disposal groups classified as held for sale | 85,987 | 1,223 | ||||||||||
|
|
|
|
|
| |||||||
Total Assets | 736,176 | 715,850 | — | |||||||||
|
|
|
|
|
| |||||||
Financial liabilities held for trading | 86,488 | 86,933 | ||||||||||
Financial liabilities designated at fair value through profit or loss | 10,050 | 4,531 | ||||||||||
Financial liabilities at amortised cost | 490,606 | 561,576 | o) p) r) | |||||||||
Derivatives - Hedge accounting | 2,318 | 2,157 | ||||||||||
Fair value changes of the hedged items in portfolio hedges of interest rate risk | — | — | ||||||||||
Liabilities under insurance and reinsurance contracts | — | 67 | ||||||||||
Provisions | 6,141 | 5,816 | ||||||||||
Tax liabilities | 2,355 | 1,668 | ||||||||||
Of which: deferred tax liabilities | 1,809 | 1,142 | ||||||||||
Other liabilities | 12,753 | 3,267 | ||||||||||
Liabilities included in disposal groups classified as held for sale | 75,446 | — | ||||||||||
|
|
|
|
|
| |||||||
Total liabilities | 686,156 | 666,015 | — | |||||||||
|
|
|
|
|
| |||||||
Capital | 3,267 | 3,267 | a) | |||||||||
Share premium | 23,992 | 23,992 | a) | |||||||||
Equity instruments issued other than capital | — | — | b) | |||||||||
Other equity | 42 | 42 | b) | |||||||||
Retained earnings | 30,508 | 29,974 | b) | |||||||||
Revaluation reserves | — | — | b) | |||||||||
Other reserves | (164 | ) | 275 | b) | ||||||||
Less: treasury shares | (46 | ) | (46 | ) | l) | |||||||
Profit or loss atributable to owners of the parent | 1,305 | 1,253 | e) | |||||||||
Less: interim dividend | — | — | e) | |||||||||
Accumulated other comprehensive income (loss) | (14,356 | ) | (14,341 | ) | c) i) k) | |||||||
Minority interests | 5,471 | 5,417 | ||||||||||
|
|
|
|
|
| |||||||
Total equity | 50,020 | 49,834 | — | |||||||||
|
|
|
|
|
| |||||||
Total equity and total liabilities | 736,176 | 715,850 | — | |||||||||
|
|
|
|
|
| |||||||
| (1) | In the public balance sheet the assets and liabilities of BBVA USA and BBVA Paraguay are classified as “Non current assets held for sale” and “Non current liabilities held for sale”, while in the regulatory balance sheet they are classified under their respective balance sheet headings in accordance with the prudential consolidation established by the CRR (see section 1.1.3). |
The main differences between the public balance sheet and the regulatory balance sheet, apart from the sales of BBVA USA and BBVA Paraguay, are due to withdrawals from the balance generated by insurance, real estate and financial entities that are consolidated through the application of the equity method for the amount of -21,312 million euros; and balance entries generated by entities that are consolidated using the proportional integration method for an amount of +986 million euros.
The following table also shows the risk to which each of the items on the regulatory balance sheet is exposed:
| BBVA. PILLAR III 2020 | GENERAL INFORMATION REQUIREMENTS | P. 26 |
Table 4. EU LI1 - Differences between the accounting and regulatory scopes of consolidation and the mapping of the financial statements categories with regulatory risk categories (Million Euros. 12-31-2020)
| Carrying values of items (1) | ||||||||||||||||||||||||||||||||||||
| Carrying values as reported in published financial statements(2) | Proforma consolidated accounting values including the United States and Paraguay(3) | From which summarised consolidated balance sheet of US companies for sale(4) | Carrying Values under scope of regulatory consolidation(5) | Subject to credit risk framework | Subject to counterparty credit risk framework | Subject to the Securitisation framework | Subject to the market risk framework | Not subject to capital requirements or subject to deduction from capital | ||||||||||||||||||||||||||||
Assets | ||||||||||||||||||||||||||||||||||||
Cash, cash balances at central banks and other demand deposits | 65,520 | 77,303 | 11,368 | 77,557 | 77,557 | — | — | — | — | |||||||||||||||||||||||||||
Financial assets held for trading | 108,257 | 109,078 | 821 | 109,759 | 12,325 | 74,610 | — | 109,759 | — | |||||||||||||||||||||||||||
Non-trading financial assets mandatorily at fair value through profit or loss | 5,198 | 5,211 | 13 | 1,619 | 1,567 | — | 52 | — | — | |||||||||||||||||||||||||||
Financial assets designated at fair value through profit or loss | 1,117 | 1,117 | — | — | — | — | — | — | — | |||||||||||||||||||||||||||
Financial assets at fair value through accumulated other comprehensive income | 69,440 | 74,416 | 4,974 | 59,379 | 58,987 | — | 364 | 29 | — | |||||||||||||||||||||||||||
Financial assets at amortised cost | 367,668 | 430,260 | 61,558 | 424,956 | 418,357 | 2,120 | 3,917 | — | 562 | |||||||||||||||||||||||||||
Derivatives - Hedge accounting | 1,991 | 2,000 | 9 | 1,863 | — | 1,863 | — | — | — | |||||||||||||||||||||||||||
Fair value changes of the hedged items in portfolio hedges of interest rate risk | 51 | 51 | — | 51 | — | — | — | — | 51 | |||||||||||||||||||||||||||
Joint ventures and associates | 1,436 | 1,437 | — | 4,382 | 4,350 | — | — | — | 32 | |||||||||||||||||||||||||||
Insurance and reinsurance assets | 306 | 306 | — | — | — | — | — | — | — | |||||||||||||||||||||||||||
Tangible assets | 7,823 | 8,629 | 799 | 8,326 | 8,326 | — | — | — | — | |||||||||||||||||||||||||||
Intangible assets | 2,345 | 4,297 | 1,949 | 4,246 | 753 | — | — | — | 3,493 | |||||||||||||||||||||||||||
Tax assets(6) | 16,526 | 16,888 | 360 | 16,557 | 15,079 | — | — | — | 1,478 | |||||||||||||||||||||||||||
Other assets(7) | 2,512 | 3,912 | 1,390 | 5,932 | 3,858 | — | — | — | 2,074 | |||||||||||||||||||||||||||
Non-current assets and disposal groups classified as held for sale(4) | 85,986 | 1,271 | 16 | 1,223 | 1,223 | — | — | — | — | |||||||||||||||||||||||||||
|
|
|
|
|
|
|
|
|
|
|
|
|
|
|
|
|
| |||||||||||||||||||
Total assets | 736,176 | 736,176 | 83,257 | 715,850 | 602,382 | 78,593 | 4,333 | 109,788 | 7,690 | |||||||||||||||||||||||||||
|
|
|
|
|
|
|
|
|
|
|
|
|
|
|
|
|
| |||||||||||||||||||
Liabilities | — | — | — | — | — | — | — | — | — | |||||||||||||||||||||||||||
Financial liabilities held for trading | 86,487 | 86,587 | 98 | 86,933 | — | 74,128 | — | 86,933 | — | |||||||||||||||||||||||||||
Financial liabilities designated at fair value through profit or loss | 10,050 | 10,050 | — | 4,531 | — | — | — | — | 4,531 | |||||||||||||||||||||||||||
Financial liabilities at amortised cost | 490,606 | 565,085 | 73,132 | 561,576 | — | 11,840 | — | — | 549,736 | |||||||||||||||||||||||||||
Derivatives - Hedge accounting | 2,318 | 2,320 | 2 | 2,157 | — | 2,157 | — | — | — | |||||||||||||||||||||||||||
Fair value changes of the hedged items in portfolio hedges of interest rate risk | — | — | — | — | — | — | — | — | — | |||||||||||||||||||||||||||
Liabilities under insurance and reinsurance contracts | 9,951 | 9,951 | — | 67 | — | — | — | — | 67 | |||||||||||||||||||||||||||
Provisions | 6,141 | 6,304 | 157 | 5,816 | 830 | — | — | — | 4,986 | |||||||||||||||||||||||||||
Tax liabilities(3) | 2,355 | 2,558 | 201 | 1,668 | 1,142 | — | — | — | 526 | |||||||||||||||||||||||||||
Other liabilities | 2,802 | 3,300 | 493 | 3,267 | — | — | — | — | 3,267 | |||||||||||||||||||||||||||
Liabilities included in disposal groups classified as held for sale(4) | 75,446 | — | — | — | — | — | — | — | — | |||||||||||||||||||||||||||
|
|
|
|
|
|
|
|
|
|
|
|
|
|
|
|
|
| |||||||||||||||||||
Total Liabilities | 686,156 | 686,156 | 74,083 | 666,015 | 1,973 | 88,125 | — | 86,933 | 563,112 | |||||||||||||||||||||||||||
|
|
|
|
|
|
|
|
|
|
|
|
|
|
|
|
|
| |||||||||||||||||||
| (1) | For the purpose of the template, when a single item is associated with the capital requirements according to more than one risk framework, it is shown in all the columns corresponding to the capital requirements to which it is associated. As a result, the sum of the values of the columns by type of risk may be greater than the carrying value according to the scope of regulatory consolidation. |
| (2) | These headings include BBVA Paraguay’s and USA’s assets and liabilities, reclassified in the epigraphs of Non Current Assets Held For Sale” and “Non Current Liabilities Held For Sale” (see section 1.1.3.). |
| (3) | For comparative purposes, this column presents in proforma the Consolidated Balance Sheet of the Group including the companies for sale of the United States and Paraguay (see section 1.1.3.). |
| (4) | These headings present the summarised consolidated balance sheet of companies for sale in the United States (see section 1.1.3) and footnote 21 of the Group’s Consolidated Annual Statements. |
| (5) | These headings include BBVA USA and BBVA Paraguay’s assets and liabilities under their respective balance sheet headings according to the prudential consolidation established by the CRR (see section 1.1.3.). |
| (6) | Deferred tax assets that depend on future profitability, which deducted from deferred tax liabilities (Article 38 of CCR) amount to 3,441 million euros and have a risk weight of 250%, accordance to Article 48 of CCR. |
| (7) | The amount of other assets includes 2,074 million euros corresponding to insurance contracts linked to pensions, are not subject to capital requirements. |
| BBVA. PILLAR III 2020 | 1. GENERAL INFORMATION REQUIREMENTS | P. 27 |
A table summarizing the main sources of the differences between the amount of exposure in regulatory terms (EAD)
and the book balances according to the Financial Statements is presented below:
Table 5. EU LI2 - Main sources of the differences between regulatory original exposure amounts and carrying values in financial statements (Million Euros. 12-31-2020)
| Items subject to: | ||||||||||||||||||||
| Total | Credit risk framework | Counterparty credit risk framework | Securitisation framework | Market risk framework | ||||||||||||||||
Asset carrying value amount under scope of regulatory consolidation | 795,096 | 602,382 | 78,593 | 4,333 | 109,788 | |||||||||||||||
|
|
|
|
|
|
|
|
|
| |||||||||||
Liabilities carrying value amount under scope of regulatory consolidation | 177,031 | 1,973 | 88,125 | 0 | 86,933 | |||||||||||||||
|
|
|
|
|
|
|
|
|
| |||||||||||
Total net amount under regulatory scope of consolidation | 618,065 | 600,409 | (9,532 | ) | 4,333 | 22,855 | ||||||||||||||
|
|
|
|
|
|
|
|
|
| |||||||||||
Amount of off-balance-sheet | 185,203 | 180,058 | 5,146 | — | — | |||||||||||||||
Differences in valuation | — | — | — | — | — | |||||||||||||||
Differences due to netting agreements (netting, long/short positions) (2) | 96,024 | (4,506 | ) | 100,530 | — | — | ||||||||||||||
Accounting Provisions(1) | 5,395 | 5,395 | — | — | — | |||||||||||||||
Credit risk mitigation techniques (CRM) | (27,603 | ) | (5,642 | ) | (21,891 | ) | (70 | ) | — | |||||||||||
Credit conversion factors (CCF) | (115,164 | ) | (115,164 | ) | — | — | — | |||||||||||||
Differences due to risk transfer securitisations | (2,644 | ) | — | — | (2,644 | ) | — | |||||||||||||
Counterparty credit risk in derivatives (includes the add-on) | 13,873 | — | 13,873 | — | — | |||||||||||||||
Other | 1,264 | (842 | ) | 2,106 | — | — | ||||||||||||||
|
|
|
|
|
|
|
|
|
| |||||||||||
Exposure amounts considered for regulatory purposes | 774,415 | 659,708 | 90,231 | 1,620 | 22,855 | |||||||||||||||
|
|
|
|
|
|
|
|
|
| |||||||||||
| (1) | Includes provisions for exposures to credit risk under advanced approach that do not reduce the EAD. |
| (2) | The balance includes repurchase agreements and derivatives liabilities, the impact of the guarantee adjustment on repurchase agreements and liabilities and the effect of netting. |
1.2. Identification of dependent entities with bank capital below the minimum requirement. Possible impediments to transferring own funds
As of December 31, 2020, there are no entities in the Group with capital adequacy below the minimum regulatory requirement that apply to it.
The Group operates mainly in Spain, Mexico, the United States, Turkey and South America. The Group’s banking subsidiaries around the world are subject to supervision and regulation (with respect to issues such as compliance with a minimum level of regulatory capital) by a number of regulatory bodies.
The obligation to comply with these capital requirements may affect the capacity of these banking subsidiaries to transfer funds (e.g. via dividends) to the parent company.
In some jurisdictions in which the Group operates, the regulations lay down that dividends may only be paid with the funds available by regulation for this purpose.
1.3. Exemptions from capital requirements at the individual or sub-consolidated level
In accordance with what is set out in the solvency regulations regarding the exemption from capital requirements compliance for Spanish credit institutions belonging to a consolidated group (at individual or sub-consolidated level) established in the aforementioned regulation, the Group obtained exemption from the supervisor on December 30, 2009 for the following companies (this exemption was ratified through ECB decision 1024/2013):
| • | Banco Industrial de Bilbao, S.A. |
| • | Banco Occidental, S.A. |
In addition, for Financiero de Crédito de Portugal (BBVA IFIC,
S.A.), the ECB has decided not to apply prudential or liquidity requirements individually.
| BBVA. PILLAR III 2020 | 2. OWN FUNDS AND CAPITAL | P. 28 |
2.1. | 29 | |||||
2.2. | 30 | |||||
2.3. | 33 | |||||
2.4. | 34 | |||||
2.5. | 36 | |||||
2.6. | 38 | |||||
| BBVA. PILLAR III 2020 | 2. OWN FUNDS AND CAPITAL | P. 29 |
2.1. Characteristics of the eligible capital resources
For the purposes of calculating minimum capital requirements, according to Regulation (EU) 575/2013 and subsequent amendments, which enter into force on June 27, 2019 (CRR), the elements and instruments of Tier 1 capital are defined as the sum of Common Equity Tier 1 capital (CET1) and additional Tier 1 capital (AT1), as defined in Part Two, Title I, Chapters I to III of the CRR, as well as their corresponding deductions, in accordance with Articles 36 and 56, respectively.
Also considered are the elements of Tier 2 capital defined in Part Two of Chapter IV, Section I of the CRR. The deductions defined as such in Section II of the same Chapter are also considered.
The level of Common Equity Tier 1 capital essentially comprises the following elements:
| a. | Capital and share premium: This includes the elements described in article 26 section 1, and 28 of the CRR and the EBA list referred to in Article 26 Section 3 of the CRR. |
| b. | Accumulated gains: In accordance with Article 26. 1 c), the gains that may be used immediately and with no restriction to cover any risk or losses are included, in the event that they occur. |
| c. | Other accumulated income and other reserves: In accordance with Article 26. 1, d) and e), this item primarily classifies the exchange-rate differences and the valuation adjustments associated with the portfolio of financial assets at fair value with changes to other comprehensive income. |
| d. | Minority interests eligible as CET1: Includes the sum of the Common Equity Tier 1 capital instruments of a subsidiary that arise in the process of its global consolidation and are attributable to natural or legal third persons other than companies included in the consolidation, calculated in accordance with Article 84 et seq. of the CRR. |
| e. | Net profit of the year attributed to the Group: The independently verified profits are included, net of any possible expense or foreseeable dividend previously authorised by the supervisor (following the treatment set out in Article 5 of Decision (EU) 2015/656 of the ECB). As of December 2020, it includes the prudential accrual of 0.059 cents/share as Shareholders remuneration calculated according to the ECB recommendation. |
Furthermore, CET1 capital is adjusted mainly through the following deductions:
| f. | Additional value adjustments: This includes adjustments resulting from the prudent valuation of positions at fair value, as set out in Article 105 of the CRR and taking into account the transitional treatment of the aggregation |
| factor (66% vs. 50%) introduced by Delegated Regulation (EU) 2020/866 of 28 May 2020 as a measure to mitigate the impact of the extreme market volatilities caused by COVID-19. This transitional measure is applicable until 31 December 2020. |
| g. | Intangible assets: These are included net of the corresponding tax liabilities, as set out in Article 36.1 b) and Article 37 of the CRR. It mainly includes goodwill, software and other intangible assets. The amount shall be deducted from the amount of the accounting revaluation of the intangible assets of the subsidiaries derived from the consolidation of the subsidiaries attributable to persons other than the companies included in the consolidation. This includes the positive effect due to the prudent treatment of software following the publication of Delegated Regulation 2020/2176 of 22 December. |
| h. | Deferred tax assets: It includes deferred tax assets that rely on future profitability and do not rise from temporary differences (net of the corresponding tax liabilities when the conditions established in Article 38.3 of the CRR are met), as per Article 36.1 c) and Article 38 of the CRR, mainly loss carryforwards (LCFs). |
| i. | Reserves at fair value related to losses or gains from cash flow hedging: Includes value adjustments of cash flow hedging of financial instruments not valued at fair value, including expected cash flows in accordance with Article 33 a) of the CRR. |
| j. | Negative amounts due to the calculation of the expected losses: The default provision on expected losses in exposure weighted by method based on internal ratings, calculated in accordance with Article 36.1 d) of the CRR, is included. |
| k. | Profit and loss at fair value: These are derived from the entity’s own credit risk, in accordance with Article 33 b) of the CRR. |
| l. | Direct, indirect and synthetic holdings of own instruments (treasury stock): Includes the shares and other instruments eligible as capital that are held by any of the Group’s consolidating entities, together with those held by non-consolidating entities belonging to the economic Group, as set out in Article 36.1 f) and Article 42 of the CRR. It mainly includes financing own shares, synthetic treasury stock and own shares. |
| m. | Securitisation: Any instance of securitisation that receives a risk weighting of 1.250% is included, as set out in Article 36.1 k) ii) of the CRR. |
| n. | Other regulatory adjustmens: Other CET1 deductions are included according to the CRR, which were not recognised in the above headings, such as losses and gains at fair value arising from the entity’s own credit risk related to derivative liabilities (DVA). It includes also the transitional adjustments of IFRS92. |
| 2. | Since 2018 BBVA Group has applied the transitional treatment of the impacts of IFRS9. Therefore, phased-in capital ratios and leverage ratio are calculated taking into account the transitional provisions as defined by article 473 bis of the CRR and its subsequent amendments made by Regulation 2020/873 of the Parliament and Council of 24 June 2020 in response to the COVID-19 pandemia. The Group also applies paragraph 7a of the aforementioned article in calculating the impact of the transitional treatment on phased in risk-weighted assets. |
| BBVA. PILLAR III 2020 | 2. OWN FUNDS AND CAPITAL | P. 30 |
Other deductions that may be applicable are significant stakes in financial institutions and assets for deferred taxes arising from temporary differences that exceed the 10% limit of the CET1, and the deduction for exceeding the overall 17.65% limit of the CET1 according to Article 48.2 of the CRR. As of December 31, 2020, regarding phased in terms, these stakes are held at levels below the limits indicated, with no deductions to that effect being applicable.
In addition, as of December 31, 2020, the Group do not hold stakes in financial institutions that are excluded from the application of the previously mentioned limits (article 49 of the CRR) and, therefore, the standard template of the EBA INS1 shall not be applicable.
In addition, the Group includes as total eligible additional Tier 1 capital instruments defined in Articles 51, 52, 85, 86 and 484 of the CRR, including the corresponding adjustments, in accordance with Article 472 of the CRR:
| o. | Capital instruments and share premium eligible as AT1: This item includes the perpetual contingent convertible securities that meet the conditions set out in Articles 51 and 52.1, 53 and 54 of the CRR. |
| p. | Elements referred to in Article 484.4 of the CRR: This section includes preferred securities issued by the Group. |
| q. | Qualifying Tier 1 capital included in the consolidated additional capital issued by affiliates and held by third parties: Included as additional consolidated Tier 1 capital is the amount of Tier 1 capital from the subsidiaries, calculated in accordance with Article 85 and 86 of the CRR. |
Finally, the Group also includes as Tier 2 eligible capital the following elements:
| r. | Capital instruments and Tier 2 share premiums: Includes funding that, for credit ranking purposes, comes behind all the common creditors. The issues, moreover, have to fulfill a number of conditions, which are laid out in Article 63 of the CRR. |
| s. | Eligible own funds instruments eligible as Tier 2 capital issued by subsidiaries and held by third parties: These instruments are included under Articles 87 and 88 of the CRR. |
| t. | Credit risk adjustments: It includes the surplus resulting from comparing the provisions and expected credit losses related to exposures calculated under IRB approach with the limit of 0.6% of the risk-weighted exposure. |
| u. | Tier 2 Regulatory adjustments: This mainly includes direct and indirect holdings of own Tier 2 capital instruments. |
Annex III outlines the main characteristics of capital instruments eligible for inclusion as additional Tier 1 and Tier 2 capital.
The amount of total eligible capital, net of deductions, for the different items making up the capital base as of December 31, 2020 and 2019, respectively, is below, in accordance with the requirements for the disclosure of information related to regulatory own funds established by the Commission’s Implementing Regulation (EU) No 1423/2013 of December 20, 2013:
| BBVA. PILLAR III 2020 | 2. OWN FUNDS AND CAPITAL | P. 31 |
Table 6. Amount of capital (CC1) (Million Euros)
Reference to template CC2(1) | 12-31-2020 | 12-31-2019 | ||||||
a) Capital and share premium | 27,259 | 27,259 | ||||||
b) Retained earnings | 29,974 | 29,127 | ||||||
c) Other accumulated earnings and other reserves | (14,023 | ) | (10,133 | ) | ||||
d) Minority interests eligible as CET1 | 3,656 | 4,404 | ||||||
e) Net profit of the year attributed to the Group | 860 | 1,316 | ||||||
|
|
|
| |||||
Common Equity Tier 1 Capital before other regulatory adjustments | 47,726 | 51,974 | ||||||
|
|
|
| |||||
f) Additional value adjustments | (233 | ) | (302 | ) | ||||
g) Intangible assets | (3,455 | ) | (6,803 | ) | ||||
h) Deferred tax assets | (1,478 | ) | (1,420 | ) | ||||
i) Fair value reserves related to gains o losses on cash flow hedges | (204 | ) | 69 | |||||
j) Expected losses in equity | — | — | ||||||
k) Profit or losses on liabilities measured at fair value | 21 | (24 | ) | |||||
l) Direct, indirect and synthetic holdings of own instruments | (366 | ) | (484 | ) | ||||
m) Securitisations tranches at 1250% | (29 | ) | (25 | ) | ||||
n) Other CET1 regulatory adjustments | 949 | 667 | ||||||
|
|
|
| |||||
Total Common Equity Tier 1 regulatory adjustments | (4,795 | ) | (8,321 | ) | ||||
|
|
|
| |||||
Common Equity Tier 1 (CET1) | 42,931 | 43,653 | ||||||
|
|
|
| |||||
o) Equity instruments and AT1 share premium | 6,130 | 5,280 | ||||||
p) Elements referred in Article 484(4) of the CRR | — | 120 | ||||||
q) Qualifying Tier 1 capital included in consolidated AT1 capital issued by subsidiaries and held by third parties | 536 | 648 | ||||||
Additional Tier 1 before regulatory adjustments | 6,666 | 6,048 | ||||||
|
|
|
| |||||
Total regulatory adjustments of Additional Tier 1 | — | — | ||||||
|
|
|
| |||||
Additional Tier 1 (AT1) | 6,666 | 6,048 | ||||||
|
|
|
| |||||
Tier 1 (Common Equity Tier 1+Additional Tier 1) | 49,597 | 49,701 | ||||||
|
|
|
| |||||
r) Equity instruments and Tier 2 share premiums | 4,540 | 3,242 | ||||||
s) Eligible own funds instruments included in consolidated Tier 2 issued by subsidiaries and held by third parties | 3,410 | 4,512 | ||||||
-Of which: instruments issued by subsidiaries subject to phase out | 23 | 516 | ||||||
t) Credit risk adjustments | 604 | 631 | ||||||
Tier 2 before regulatory adjustments | 8,554 | 8,385 | ||||||
u) Tier 2 regulatory adjustments | (6 | ) | (82 | ) | ||||
|
|
|
| |||||
Tier 2 | 8,547 | 8,304 | ||||||
|
|
|
| |||||
Total Capital (Total capital = Tier 1 + Tier 2) | 58,145 | 58,005 | ||||||
|
|
|
| |||||
TOTAL RWA’s | 353,273 | 364,448 | ||||||
|
|
|
| |||||
CET 1 (phased-in) | 12.15 | % | 11.98 | % | ||||
CET 1 (fully loaded) | 11.73 | % | 11.74 | % | ||||
TIER 1 (phased-in) | 14.04 | % | 13.64 | % | ||||
TIER 1 (fully loaded) | 13.62 | % | 13.37 | % | ||||
Total Capital (phased-in) | 16.46 | % | 15.92 | % | ||||
Total Capital (fully loaded) | 15.91 | % | 15.41 | % | ||||
| (*) | As of December 31, 2020, the diference between phased-in and fully loaded ratios arises from the transitional treatment of certain capital elements, mainly the impact of IFRS9, to which the BBVA Group has voluntarily adhered (in accordance with the article 473 bis of the CRR). See paragraph 2.3 for more information on the transitional impact of IFRS9. |
In addition, noted that the Group to date is not applying the transitional treatment of unrealised gains and losses valued at fair value through Other comprehensive Income (hereinafter, unrealised P&L measured at fair value through OCI) as defined in Article 1.6 of that Regulation amending Article 468 of the CRR. Therefore, the Group’s own funds, capital and leverage ratios to date reflect the full impact of the above-mentioned unrealised P&L measured at fair value through OCI.
| (**) | In line with the EBA Standards published in June 2020 (EBA/ITS/2020/04) the template has been adapted according to the format established by the EBA in those rows that are applicable to the date of the report, among which is the transitional impact of IFRS9 on CET1, which has been reclassified from the “Common Equity Tier 1 Before Other Regulatory Adjustments” row as an Common Equity Tier 1 regulatory adjustment, within the “Other regulatory adjustments” row. In addition to this change, December 2019 data has been restated to consider the change in accounting policy made by the Group which involves recording the differences generated when translating the restated financial statements of the subsidiaries in hyperinflationary economies into euros as indicated in footnote 1.3 of the Consolidated Financial Statements. |
| (1) | References to regulatory balance sheet items (CC2) reflecting the diferent items described. |
As of December 2020 Common Equity Tier 1 (CET1) phased-in ratio stood at 12.15% which represented an increase of +17 basis points with respect to 2019. The difference is mainly explained by:
| • | The positive BBVA’s organic profit generation which has made possible to cover the (in constant euros) of risk weighted assets (RWA) and the relative stabilisation of the financial markets during the second half of the year, largely motivated by the measures to stimulate the economy and the announced guaranteed programs by the different national and supranational authorities and the approval |
| by the Parliament and the European Council of regulation 2020/873 (known as CRR quick fix). In this regard, the modification in the software deduction had a positive impact of +19 basis points. |
| • | The effect of the transitional adjustments of IFRS9 in the solvency ratios and subsequent modifications in response to the COVID-19 pandemic. |
| • | The execution of the agreement reached with Allianz to jointly develop the non-life insurance business in Spain, excluding the health insurance line had an impact of +7 basis points in CET1 ratio. |
| BBVA. PILLAR III 2020 | 2. OWN FUNDS AND CAPITAL | P. 32 |
In addition, CET1 capital as of December 2020 includes the effect of the Shareholders remuneration accrued by 0.059 euros gross per share , which rises to a maximum amount of approximately 393 million euros (equivalent to 11 bps of CET1), calculated taking into account the ECB recommendation. (For more information see note 4 of the Consolidated Financial Statements of BBVA Group).
In terms of fully loaded, CET1 ratio stood at 11.73%, which remains at a similar level compared to December 2019 (11.74%).
Phased-in Additional Tier 1 (AT1) capital stood at 1.89% at the end of December 2020, an improvement of +23 basis points compared to the previous year. In this respect, a green CoCo was issued in July 2020 for €1,000 million, with a 6% coupon and an early repayment option from five and a half years. Moreover, a CoCo of €1,500 million (6.75% coupon) was amortised in February, on the first date of the early amortisation option; in January 2021, the early amortisation options were implemented for two preferential issuances, issued by BBVA International Preferred and Caixa Sabadell Preferents for 31 million pounds sterling and €90 million respectively; and finally, for a third preferential issuance issued by Caixa Terrassa Societat de Participacions Preferents, the bondholders’ meeting has approved its early amortisation on 29 January 2021 (versus the early amortisation option date of 10 August 2021). As of 31 December 2020, these issuances do not form part of the Group’s capital adequacy ratios.
The phased-in Tier 2 ratio at 31 December 2020 stood at 2.42%, an increase of +14 basis points over the previous year. Two Tier 2 issuances were issued in 2020: An issuance of €1,000 million in January, with a maturity of 10 years and a repayment option from the fifth year, with a coupon of 1%; and another issuance of 300 million pounds sterling in July, with a maturity of 11 years and with an early repayment option from the sixth year, with a coupon of 3.104%.
Regarding the MREL (Minimum Requirement for own funds and Eligible Liabilities) requirements, BBVA has continued its issuance plan during 2020 by closing two public issuances of non-preferred senior debt, one in January 2020 for €1,250 million with a maturity of seven years and a coupon of 0.5%, and another in February 2020 for CHF 160 million with a maturity of six and a half years and a coupon of 0.125%. In May 2020, the first issuance of a COVID-19 social bond by a
private financial institution in Europe was completed. This is a five-year senior preferred bond, for €1,000 million and a coupon of 0.75%. Finally, in order to optimize the MREL requirement, in September BBVA issued preferred senior debt of USD 2,000 million in two tranches, with maturities of three and five years, for USD 1,200 million and USD 800 million and coupons of 0.875% and 1.125% respectively.
The Group estimates that, following the entry into force of Regulation (EU) No. 2019/877 of the European Parliament and of the Council of May 20 (which, among other matters, establishes the MREL in terms of RWAs and new periods for said requirement’s transition and implementation), the current structure of shareholders’ funds and admissible liabilities enables compliance with the MREL.
Chart 2. Annual evolution of the CET1 fully loaded ratio
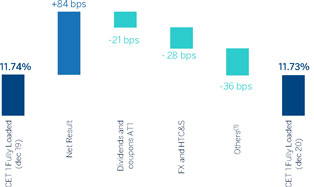
| (1) | Includes mainly RWAs evolution in constant Euros, frontloading of regulatory impacts (-25 bps), impact of the new treatment of software (+19 bps) and impact from the Joint Venture with Allianz (+7 bps). |
The characteristics of the main capital instruments are shown in Annex III, available on the Group’s website, in accordance with Commission Implementing Regulation (EU) No 1423/2013 of December 20, 2013.
The process of reconciliation between accounting own funds and regulatory own funds is shown below. Based on the shareholders’ equity reported in the Consolidated Financial Statements of BBVA Group and applying the deductions and adjustments shown in the table below, we arrive at the regulatory capital figure eligible for solvency purposes:
| BBVA. PILLAR III 2020 | 2. OWN FUNDS AND CAPITAL | P. 33 |
Table 7. Reconciliation of the Public Balance Sheet from the accounting perimeter to the regulatory perimeter (Million Euros)
Eligible capital own funds | 12-31-2020 | 12-31-2019 | ||||||
Capital | 3,267 | 3,267 | ||||||
Share premium | 23,992 | 23,992 | ||||||
Retained earnings, revaluation reserves and other reserves | 30,344 | 29,269 | ||||||
Other equity | 42 | 56 | ||||||
Less: Treasury shares | (46 | ) | (62 | ) | ||||
Attributable to the parent company | 1,305 | 3,512 | ||||||
Attributable dividend | — | (1,084 | ) | |||||
|
|
|
| |||||
Total equity | 58,904 | 58,950 | ||||||
|
|
|
| |||||
Accumulated other comprehensive income (Loss) | (14,356 | ) | (10,226 | ) | ||||
Non-controlling interest | 5,472 | 6,201 | ||||||
|
|
|
| |||||
Shareholders`equity | 50,020 | 54,925 | ||||||
Goodwill and other intangible assets | (3,455 | ) | (6,803 | ) | ||||
Direct and synthetic treasury shares | (320 | ) | (422 | ) | ||||
|
|
|
| |||||
Deductions | (3,775 | ) | (7,225 | ) | ||||
Differences from solvency and accounting level | (186 | ) | (215 | ) | ||||
|
|
|
| |||||
Equity not eligible at solvency level | (186 | ) | (215 | ) | ||||
|
|
|
| |||||
Other adjustments and deductions(2) | (3,128 | ) | (3,832 | ) | ||||
|
|
|
| |||||
Common Equity Tier 1 (CET 1) | 42,931 | 43,653 | ||||||
|
|
|
| |||||
Additional Tier 1 before Regulatory Adjustments | 6,666 | 6,048 | ||||||
|
|
|
| |||||
Total regulatory adjustments of additional Tier 1 | — | — | ||||||
|
|
|
| |||||
Tier 1 | 49,597 | 49,701 | ||||||
|
|
|
| |||||
Tier 2 | 8,548 | 8,304 | ||||||
|
|
|
| |||||
Total Capital (Tier 1 + Tier 2) | 58,145 | 58,005 | ||||||
|
|
|
| |||||
TOTAL Minimum capital required(1) | 45,042 | 46,540 | ||||||
|
|
|
| |||||
| (1) | Calculated over minimum total capital applicable for each period. |
| (2) | Other adjustments and deductions includes the amount of minority interest not eligible as capital, amount of dividends not distributed and other deductions and filters set by the CRR. Additionally, it includes a prudential accrual corresponding to 0.059 euros gross shareholder remuneration based on the current recommendation of the ECB. |
2.3. IFRS 9 and OCI Transitional Arrangements
The table below shows a comparison of institutions’ own funds and capital and leverage ratios with and without the application of the transitional treatment of IFRS9 impact, and with and without the application of the transitional treatment in accordance with Article 468 of the CRR, according to the standard format set by EBA guidelines (EBA/GL/2018/01).
Since 2018 BBVA Group has applied the transitional treatment of IFRS9 impact. Therefore, phased-in capital ratios and leverage ratio are calculated taking into account the transitional provisions as defined by article 473 bis of the CRR and its subsequent amendments made by Regulation 2020/873 of the Parliament and Council of 24 June 2020 in response to the COVID-19 pandemia. The Group also applies paragraph 7a of the aforementioned article in calculating the impact of the transitional treatment on phased in risk-weighted assets.
In addition, as of the date of the report, the Group is not applying the transitional treatment of unrealised gains and losses measured at fair value through other comprehensive income (hereinafter, unrealised gains and losses measured at FVTOCI) outlined in Article 1, Paragraph 6 of the aforementioned regulation amending Article 468 of the CRR. Therefore, the Group’s own funds, and its capital adequacy and leverage ratios, reflect to date the full impact of the aforementioned unrealised gains and losses measured at FVTOCI.
In addition, the own funds and capital adequacy ratios without the application of the transitional treatment of IFRS 9 and unrealised gains and losses measured at FVTOCI do include the impact of applying other transitional regulatory adjustments.
| BBVA. PILLAR III 2020 | 2. OWN FUNDS AND CAPITAL | P. 34 |
Table 8. IFRS 9-FL - Comparison of institutions’ own funds and capital and leverage ratios with and without the application of transitional arrangements for IFRS 9 or analogous ECLs and with and without the application of the transitional treatment of unrealised gains and losses measured at FVTOCI
Own funds | 12-31-2020 | 09-30-2020 | 06-30-2020 | 03-30-2020 | 12-31-2019 | |||||||||||||||
CET1 Capital | 42,931 | 41,231 | 42,119 | 40,854 | 43,653 | |||||||||||||||
CET1 Capital without IFRS9 transitional arrangement or similar ECL | 41,333 | 39,640 | 40,734 | 39,902 | 42,844 | |||||||||||||||
CET1 Capital without FVOCI transitional arrangement | ||||||||||||||||||||
Tier 1 Capital (T1) | 49,597 | 48,248 | 48,186 | 46,974 | 49,701 | |||||||||||||||
Tier 1 Capital (T1) without IFRS9 transitional arrangement or similar ECL | 48,000 | 46,657 | 46,802 | 46,022 | 48,892 | |||||||||||||||
Tier 1 Capital (T1) without FVOCI transitional arrangement | ||||||||||||||||||||
Total Capital | 58,145 | 57,305 | 57,531 | 56,731 | 58,005 | |||||||||||||||
Total Capital without IFRS9 transitional arrangement or similar ECL | 56,544 | 55,712 | 56,146 | 55,779 | 57,196 | |||||||||||||||
Total Capital without FVOCI transitional arrangement | ||||||||||||||||||||
Risk-weighted assets | — | — | — | — | — | |||||||||||||||
Total Risk-weighted assets | 353,273 | 343,923 | 362,050 | 368,666 | 364,448 | |||||||||||||||
Total Risk-weighted assets without IFRS9 transitional arrangement or similar ECL | 352,679 | 344,215 | 362,388 | 368,839 | 364,943 | |||||||||||||||
Capital ratio | — | — | — | — | — | |||||||||||||||
CET1 Capital (as a percentage of total exposure to risk) | 12.15 | % | 11.99 | % | 11.63 | % | 11.08 | % | 11.98 | % | ||||||||||
CET1 Capital (as a percentage of total exposure to risk) without IFRS9 transitional arrangement or similar ECL | 11.72 | % | 11.52 | % | 11.24 | % | 10.82 | % | 11.74 | % | ||||||||||
CET1 Capital (as a percentage of total exposure to risk) without FVOCI transitional arrangement | ||||||||||||||||||||
Tier 1 Capital (T1) (as a percentage of total exposure to risk) | 14.04 | % | 14.03 | % | 13.31 | % | 12.74 | % | 13.64 | % | ||||||||||
Tier 1 Capital (T1) (as a percentage of total exposure to risk) without IFRS9 transitional arrangement or similar ECL | 13.61 | % | 13.55 | % | 12.91 | % | 12.48 | % | 13.40 | % | ||||||||||
Tier 1 Capital (T1) (as a percentage of total exposure to risk) without FVOCI transitional arrangement | ||||||||||||||||||||
Total Capital (as a percentage of total exposure to risk) | 16.46 | % | 16.66 | % | 15.89 | % | 15.39 | % | 15.92 | % | ||||||||||
Total Capital (as a percentage of total exposure to risk) without IFRS9 transitional arrangement or similar ECL | 16.04 | % | 16.19 | % | 15.49 | % | 15.12 | % | 15.67 | % | ||||||||||
Total Capital (as a percentage of total exposure to risk) without FVOCI transitional arrangement | ||||||||||||||||||||
Leverage Ratio | — | — | — | — | — | |||||||||||||||
Total exposure related to leverage ratio | 741,095 | 722,221 | 775,915 | 749,989 | 731,087 | |||||||||||||||
Leverage Ratio | 6.69 | % | 6.68 | % | 6.21 | % | 6.26 | % | 6.80 | % | ||||||||||
Leverage ratio without IFRS9 transitional arrangements or similar ECL | 6.46 | % | 6.47 | % | 6.03 | % | 6.15 | % | 6.70 | % | ||||||||||
Leverage ratio without FVOCI transitional arrangements | ||||||||||||||||||||
The BBVA Group has a general risk management and control model (hereinafter, the “Model”) that is appropriate for its business model, its organisation, the countries where it operates and its corporate governance system. This model allows the Group to carry out its activity within the risk management and control strategy and policy defined by the corporate bodies of BBVA and to adapt itself to a changing economic and regulatory environment, facing this management at a global level and aligned to the circumstances at all times. The Model establishes a suitable risk management system related to the risk profile and strategy of the entity.
The types of risk inherent in the business that make up the risk profile of the Group are as follows:
| • | Credit risk and dilution: Credit risk arises from the probability that one party to a financial instrument will fail to meet its contractual obligations for reasons of insolvency or inability to pay and cause a financial loss for the other party. This includes counterparty risk, issuer risk, liquidation risk and country risk. |
| • | Counterparty risk: The credit risk corresponding to derivative instruments, repurchase and reverse repurchase transactions, securities or commodities lending or borrowing transactions and deferred settlement transactions. |
| • | Credit Valuation Adjustment Risk (CVA): Its aim is to reflect the impact on the fair value of the counterparty’s credit risk, resulting from OTC derivative instruments which are not recognised credit derivatives for the purpose of reducing the amount of credit risk weighted exposure. |
| • | Market risk: Market risk originates in the possibility that there may be losses in the value of positions held due to movements in the market variables that affect the valuation of financial products and assets in the trading book. This includes risk with respect to the position in debt and equity instruments, exchange rate risk and commodity risk. |
| • | Operational risk: a risk that may cause losses as a result of human error; inadequate or defective internal processes; inadequate conduct towards customers, in the markets or against the company; failures, interruptions or deficiencies in systems or communications; theft, loss or misuse of |
| BBVA. PILLAR III 2020 | 2. OWN FUNDS AND CAPITAL | P. 35 |
information, as well as deterioration of its quality; internal or external fraud including, in all cases, fraud resulting from cyber-attacks; theft or physical damage to assets or persons; legal risks; risks resulting from workforce and occupational health management; and inadequate service provided by suppliers. This definition includes legal risk, but excludes strategic and/or business risk and reputational risk. |
| • | Structural risk: This is divided into structural interest-rate risk (movements in market interest rates that cause changes in an entity’s net interest income and book value) and structural exchange-rate risk (exposure to variations in exchange rates originating in the Group’s foreign companies and in the provision of funds to foreign branches financed in a different currency from that of the investment). |
| • | Liquidity risk: Risk of an entity having difficulties in duly meeting its payment commitments, or where, to meet them, it has to resort to funding under burdensome terms which may harm the Group’s image or reputation. |
| • | Reputational risk: Considered to be the potential loss in earnings as a result of events that may negatively affect the perception of the Group’s different stakeholders. |
The chart below shows the total risk-weighted assets broken down by type of risk (where credit risk encompasses counterparty risk) as of December 31, 2020 and December 31, 2019:
Chart 3. Distribution of RWAs by risk type eligible on Pillar 3
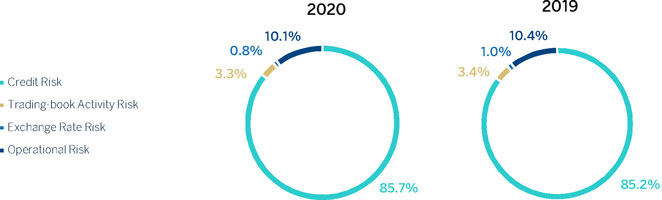
| (*) | Credit Risk includes CVA adjustment risk |
| BBVA. PILLAR III 2020 | 2. OWN FUNDS AND CAPITAL | P. 36 |
2.5. Breakdown of minimum capital requirements by risk type
This section provides an overview of risk-weighted assets and the minimum capital requirements established by Article 92 of the CRR.
The following table shows the total capital requirements broken down by risk type as of December 31, 2020 and December 31, 2019:
Table 9. EU OV1 - Overview of RWAs (Million Euros)
| RWA(1) | Minimum Capital Requirements(2)(3) | |||||||||||||||
| 12-31-2020 | 09-30-2020 | 12-31-2019 | 12-31-2020 | |||||||||||||
Credit Risk (excluding CCR) | 277,644 | 269,409 | 286,159 | 22,212 | ||||||||||||
|
|
|
|
|
|
|
| |||||||||
Of which the standardised approach(4) | 176,056 | 175,783 | 190,603 | 14,085 | ||||||||||||
Of which the foundation IRB (FIRB) approach(6) | 4,263 | 4,458 | 4,606 | 341 | ||||||||||||
Of which the advanced IRB (AIRB) approach(7) | 94,882 | 86,655 | 88,191 | 7,591 | ||||||||||||
Of which equity IRB under the simple risk-weighted approach(5) | 2,444 | 2,513 | 2,758 | 195 | ||||||||||||
Counterparty credit risk (CCR) | 9,284 | 9,557 | 8,289 | 743 | ||||||||||||
|
|
|
|
|
|
|
| |||||||||
Of which mark to market | 7,710 | 8,107 | 6,716 | 617 | ||||||||||||
Of which original exposure | — | — | — | — | ||||||||||||
Of which the standardised approach | — | — | — | — | ||||||||||||
Of which the Internal model method (IMM) | — | — | — | — | ||||||||||||
Of which risk exposure amount for contributions to the default fund of a CCP | 89 | 60 | 44 | 7 | ||||||||||||
Of which CVA | 1,485 | 1,389 | 1,529 | 119 | ||||||||||||
Settlement Risk | 1 | — | — | 0 | ||||||||||||
|
|
|
|
|
|
|
| |||||||||
Securitisation exposures in the banking book(8) (after the cap) | 347 | 368 | 924 | 28 | ||||||||||||
|
|
|
|
|
|
|
| |||||||||
Of which internal assessment approach (SEC-IRBA) | 143 | 157 | — | 11 | ||||||||||||
Of which standardised approach (SEC-SA) | — | — | — | — | ||||||||||||
Of which external assessment approach (SEC-ERBA) | 204 | 210 | — | 16 | ||||||||||||
Market Risk | 14,773 | 16,377 | 16,066 | 1,182 | ||||||||||||
|
|
|
|
|
|
|
| |||||||||
Of which the standardised approach (SA) | 6,397 | 6,232 | 6,991 | 512 | ||||||||||||
Of which IMA approach | 8,376 | 10,145 | 9,075 | 670 | ||||||||||||
Operational Risk | 35,656 | 34,379 | 37,877 | 2,853 | ||||||||||||
|
|
|
|
|
|
|
| |||||||||
Of which basic indicator approach | 883 | 637 | 805 | 71 | ||||||||||||
Of which the standardised approach | 34,773 | 12,783 | 15,250 | 2,782 | ||||||||||||
Of which IRB approach | — | 20,959 | 21,822 | — | ||||||||||||
|
|
|
|
|
|
|
| |||||||||
Amounts below the thresholds for deduction (subject to 250% risk weight) | 15,566 | 13,834 | 15,134 | 1,245 | ||||||||||||
|
|
|
|
|
|
|
| |||||||||
Floor Adjustment | — | — | — | — | ||||||||||||
|
|
|
|
|
|
|
| |||||||||
Total | 353,273 | 343,923 | 364,448 | 28,262 | ||||||||||||
|
|
|
|
|
|
|
| |||||||||
| (1) | Risk-weighted assets for the transitional period (phased-in). |
| (2) | Calculated on the minimum total capital requirements of 8% (Article 92 of the CRR). |
| (3) | Under CET 1 requirements (8.59%) after the supervisory evaluation process (SREP), the requirements amount to EUR 30,346 million euros. Under Total Capital requirements (12.75%), the requirements amount to EUR 45,042 million euros. |
| (4) | Deferred tax assets arising from temporary differences, which are not deducted from eligible own funds (subject to a risk weighting of 250%) are excluded, in accordance with Article 48.4 oh the CRR. This amount is 7,423, 6,548 and 7,279 million euros as of December 31, 2020, Septembre 30, 2020 and December 31, 2019, respectively. |
| (5) | Includes equity, calculated under the simple risk-weighted approach and internal model approach, but excluding significant investments in financial sector entities and insurers that are not deducted from eligible own funds (subject to a risk weighting of 250%), in accordance with Article 48.4 CRR. This amount is 8,143, 7,286 and 7,855 as December 31, 2020, September 30, 2020 and December 31, 2019, respectively. |
| (6) | Exposures clasisified in the FIRB approach correspond to specialised lending exposures. The Group has chosen to use the slotting criteria, in line with article 153.5 of the CRR. |
| (7) | It includes the frontloading to partially cover the regulatory impacts derived from Targeted Review of Internal Models (TRIM) and other regulatory/supervisory impacts. |
| (8) | As of December 31, 2019, the approaches applied to calculate the RWA of securitisations corresponded to the standard and IRB, which were later replaced by the approaches of the new securitisation framework defined in EU Regulation 2017/2401. As of December 31, 2020, the applicable approaches for the Group correspond to SEC-ERBA and SEC-IRBA. |
Throughout 2020, RWAs have decreased by approximately €12.3 billion compared to December 2019 in aggregate terms, mainly affected by the widespread depreciation of currencies, mainly the Turkish lira and the Mexican peso. Excluding the currency effect, RWAs increased by approximately €18 billion, mainly due to:
| • | Organic growth in activity characterised by the various relief measures in the form of temporary payment deferrals for customers due to the pandemic, as well as the granting of loans backed by public guarantees or collateral; and the incorporation of regulatory and supervisory impacts. |
| • | The frontloading of €7.4 billion (equivalent to 25 CET1 basis points) which will partially cover the regulatory and supervisory impacts expected for 2021. |
Furthermore, as indicated in Section 3.6 of this report, in December 2020, BBVA reverted to using advanced models to calculate operational risk capital requirements at the
| BBVA. PILLAR III 2020 | 2. OWN FUNDS AND CAPITAL | P. 37 |
consolidated level in geographical areas for which this method was previously used (Spain and Mexico), following authorisation from the European Central Bank’s Governing Council on 18 December 2020. At the Group level, this reversal does not significantly impact capital requirement figures nor RWAs for operational risk.
The respective sections of the report explain in more detail the evolution of RWAs by type of risk.
The following is a breakdown of risk-weighted assets and capital requirements broken down by risk type and exposure categories as of December 31, 2020 and December 31, 2019:
Table 10. Capital requirements by risk type and exposure class (Million Euros)
| Capital requirements(2) | RWA’s(1) | |||||||||||||||
Exposure Class and risk type | 12-31-2020 | 12-31-2019 | 12-31-2020 | 12-31-2019 | ||||||||||||
Credit Risk | 14,926 | 16,014 | 186,576 | 200,176 | ||||||||||||
|
|
|
|
|
|
|
| |||||||||
Central governments or central banks | 2,347 | 2,375 | 29,343 | 29,685 | ||||||||||||
Regional governments or local authorities | 185 | 132 | 2,317 | 1,644 | ||||||||||||
Public sector entities | 61 | 63 | 768 | 790 | ||||||||||||
Multilateral development banks | 1 | 1 | 7 | 11 | ||||||||||||
International organisations | — | — | — | — | ||||||||||||
Institutions | 626 | 429 | 7,827 | 5,366 | ||||||||||||
Corporates | 6,226 | 6,999 | 77,822 | 87,486 | ||||||||||||
Retail | 2,749 | 3,079 | 34,362 | 38,493 | ||||||||||||
Secured by mortgages on immovable property | 1,022 | 1,199 | 12,769 | 14,983 | ||||||||||||
Exposures in default | 358 | 305 | 4,480 | 3,808 | ||||||||||||
Exposures associated with particularly high risk | 381 | 411 | 4,758 | 5,136 | ||||||||||||
Covered bonds | — | — | — | — | ||||||||||||
Claims on institutions and corporates with a short-term credit assesment | 0 | 0 | 1 | 1 | ||||||||||||
Collective investments undertakings | 0 | 1 | 3 | 8 | ||||||||||||
Other exposures | 970 | 1,021 | 12,120 | 12,767 | ||||||||||||
|
|
|
|
|
|
|
| |||||||||
Total credit risk by Standardised approach | 14,926 | 16,019 | 186,576 | 200,237 | ||||||||||||
|
|
|
|
|
|
|
| |||||||||
Credit Risk | 6,938 | 7,125 | 86,729 | 89,061 | ||||||||||||
|
|
|
|
|
|
|
| |||||||||
Central governments or central banks | 68 | 54 | 849 | 673 | ||||||||||||
Institutions | 567 | 532 | 7,084 | 6,646 | ||||||||||||
Corporates | 4,826 | 4,769 | 60,324 | 59,615 | ||||||||||||
Of which: SMEs | 916 | 998 | 11,452 | 12,478 | ||||||||||||
Of which: Specialised lending | 393 | 433 | 4,912 | 5,407 | ||||||||||||
Of which: Others | 3,517 | 3,338 | 43,960 | 41,730 | ||||||||||||
Retail | 1,478 | 1,770 | 18,471 | 22,128 | ||||||||||||
Of which: Secured by mortgages on immovable property | 586 | 712 | 7,319 | 8,904 | ||||||||||||
Of which: Qualifying revolving | 479 | 589 | 5,987 | 7,365 | ||||||||||||
Of which: Other SMEs | 103 | 131 | 1,289 | 1,636 | ||||||||||||
Of which: Other Non-SMEs | 310 | 338 | 3,876 | 4,223 | ||||||||||||
Equity | 1,163 | 1,293 | 14,532 | 16,167 | ||||||||||||
|
|
|
|
|
|
|
| |||||||||
Simple risk weight approach | 146 | 185 | 1,831 | 2,309 | ||||||||||||
Exposures in sufficiently diversified portfolios (RW 190%) | 89 | 86 | 1,114 | 1,070 | ||||||||||||
Exchange traded exposures (RW 290%) | 34 | 67 | 425 | 841 | ||||||||||||
Others (RW 370%) | 23 | 32 | 291 | 399 | ||||||||||||
PD/LGD approach | 316 | 444 | 3,945 | 5,554 | ||||||||||||
Internal models approach | 49 | 36 | 613 | 449 | ||||||||||||
Exposures subject to a 250% risk weight | 651 | 628 | 8,144 | 7,854 | ||||||||||||
|
|
|
|
|
|
|
| |||||||||
Total credit risk by IRB approach | 8,101 | 8,487 | 101,261 | 106,091 | ||||||||||||
|
|
|
|
|
|
|
| |||||||||
Total contributions to the default fund of a CCP | 7 | 3 | 89 | 44 | ||||||||||||
|
|
|
|
|
|
|
| |||||||||
Securitisation exposures | 28 | 74 | 347 | 924 | ||||||||||||
|
|
|
|
|
|
|
| |||||||||
Total credit risk | 23,062 | 24,510 | 288,273 | 306,372 | ||||||||||||
|
|
|
|
|
|
|
| |||||||||
Settlement risk | 0 | — | 1 | — | ||||||||||||
|
|
|
|
|
|
|
| |||||||||
Standardised approach: | 275 | 272 | 3,431 | 3,395 | ||||||||||||
Of which: Price Risk by fixed income exposures | 155 | 197 | 1,943 | 2,461 | ||||||||||||
Of which: Price Risk by Securitisation exposures | 0 | 2 | 4 | 21 | ||||||||||||
Of which: Price Risk by correlation | 97 | 51 | 1,210 | 641 | ||||||||||||
Of which: Price Risk by stocks and shares | 21 | 20 | 264 | 248 | ||||||||||||
Of which: Commodities Risk | 1 | 2 | 10 | 24 | ||||||||||||
IRB: Market Risk | 670 | 726 | 8,376 | 9,075 | ||||||||||||
|
|
|
|
|
|
|
| |||||||||
Total trading book risk | 945 | 998 | 11,807 | 12,470 | ||||||||||||
|
|
|
|
|
|
|
| |||||||||
Foreing exchange risk (standardised approach) | 237 | 288 | 2,966 | 3,596 | ||||||||||||
|
|
|
|
|
|
|
| |||||||||
CVA risk | 119 | 122 | 1,485 | 1,529 | ||||||||||||
|
|
|
|
|
|
|
| |||||||||
Operational risk | 2,853 | 3,030 | 35,656 | 37,877 | ||||||||||||
|
|
|
|
|
|
|
| |||||||||
Others(3) | 1,047 | 208 | 13,084 | 2,605 | ||||||||||||
|
|
|
|
|
|
|
| |||||||||
Capital requirements | 28,262 | 29,156 | 353,273 | 364,448 | ||||||||||||
|
|
|
|
|
|
|
| |||||||||
| (1) | Risk-weighted assets for the transitional period (phased-in). |
| (2) | Calculated on the minimum total capital requirements of 8% (Article 92 of the CRR). |
| (3) | As of report date, it includes the frontloading to partially cover the regulatory impacts derived from Targeted Review of Internal Models (TRIM) and other regulatory/supervisory impacts. |
| BBVA. PILLAR III 2020 | 2. OWN FUNDS AND CAPITAL | P. 38 |
A breakdown of RWAs distribution by method each exposure category is below:
Chart 4. Distribution of RWAs by exposure category and method
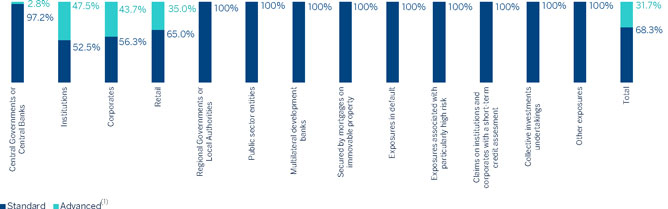
| (*) | Excluding securitisation and equity subject to credit risk. |
| (1) | Table 30 of the report details the models and portfolios authorised by the supervisor for use in the calculation of capital requirements. |
2.6. Procedure used in the capital self-assessment process
The Group carries out the internal capital assessment process in accordance with the Capital Requirements Directive 2013/36/EU and guidelines on the supervisory review and evaluation process (SREP) published by the European Banking Authority. In accordance with Article 108 of the Capital Requirements Directive (2013/36/EU), the Group complies with the obligations set out in Article 73 thereof on a consolidated basis. Furthermore, the document is structured on the basis of the ECB’s guidance on the internal capital adequacy assessment process (ICAAP) of November 2018.
Within the framework of the internal capital assessment process, the Group assesses and quantifies all risk that could significantly affect its capital position and draws a conclusion on the capital adequacy from a holistic medium-term perspective.
The Group applies a proportionate approach that aims to ensure the entity’s survival and continued compliance with all legal and internal requirements. In addition to regulatory and accounting perspectives, the Group bases its capital adequacy position analysis on a sound internal approach in which its capital position is assessed under an economic vision, which includes quantifying capital needs for risk covered in Pillar 1 of Basel and the needs due to risk not covered by Pillar 1.
The following are some of the points assessed in the internal capital assessment process:
| • | Business and strategy model, describing both the changes planned by the bank in the current business model and its underlying activities such as the relationship between the business strategy and internal capital assessment process. |
| • | Internal governance, risk management and the control framework, reviewing the processes and mechanisms that ensure that the bank has a sound and integrated framework for managing present and future material risk. |
| • | Risk appetite framework, describing the correspondence between this framework and the bank’s business strategy and model. |
| • | Identification and assessment of risk (including credit, operational, market, liquidity and other structural risk) and quantification of the capital necessary to cover them, with a quantitative reconciliation between the Pillar 1 and Pillar 2 approaches. |
| • | Planning capital under baseline and stress scenarios, projecting the capital base of the Group, the parent and its main subsidiaries over the next three years and analyzing capital sufficiency in accordance with the regulatory requirements and the internal objectives set out by the entity for the close of the period, also dealing with the planned capital actions. |
This internal capital assessment process concludes with submission to the supervisor of an annual report on the process. The report plays a key role in the review and evaluation methodology applied by the Single Supervisory Mechanism, and is an important element for determining capital requirements under Pillar 2.
| BBVA. PILLAR III 2020 | 3. RISK | P. 39 |
| 3.1. | 44 | |||||
| 3.2. | 44 | |||||
| 3.2.1. | Scope and nature of the Credit Risk measurement and reporting systems for capital framework purposes | 44 | ||||
| 3.2.2. | 45 | |||||
| 3.2.3. | 45 | |||||
| 3.2.4. | 62 | |||||
| 3.2.5. | 66 | |||||
| 3.2.6. | 86 | |||||
| 3.2.7. | 95 | |||||
| 3.2.8. | Hedging and risk reduction policies. Supervision strategies and processes | 102 | ||||
| 3.2.9. | 102 | |||||
| 3.2.10. | 104 | |||||
| 3.3. | 106 | |||||
| 3.3.1. | Scope and nature of the market risk measurement and reporting systems | 106 | ||||
| 3.3.2. | Differences in the trading book under accounting and prudential regulation | 106 | ||||
| 3.3.3. | 106 | |||||
| 3.3.4. | 107 | |||||
| 3.4. | 117 | |||||
| 3.4.1. | 117 | |||||
| 3.4.2. | 118 | |||||
| 3.4.3. | 118 | |||||
| 3.5. | 120 | |||||
| 3.5.1. | 120 | |||||
| 3.5.2. | 121 | |||||
| 3.5.3. | 123 | |||||
| 3.5.4. | 123 | |||||
| BBVA. PILLAR III 2020 | 3. RISK | P. 40 |
| 3.6. | 127 | |||||
| 3.6.1. | 127 | |||||
| 3.6.2. | 128 | |||||
| BBVA. PILLAR III 2020 | 3. RISK | P. 41 |
3.1. General Risk Management and Control Model
The BBVA Group has a general risk management and control model (hereinafter, the ‘Model’) that is appropriate for its business model, its organisation, the countries where it operates and its corporate governance system. This model allows the Group to carry out its activity within the risk management and control strategy and policy defined by the corporate bodies of BBVA and to adapt itself to a changing economic and regulatory environment, facing this management at a global level and aligned to the circumstances at all times.
The Model, for which the Group’s Chief Risk Officer (CRO) is responsible, must be updated or reviewed at least annually. The Model, which is fully applied in the Group, comprises the following basic elements:
| • | Governance and organisation |
| • | Risk Appetite Framework |
| • | Assessment, monitoring and reporting |
| • | Infrastructure |
The Group promotes the development of a risk culture that ensures a consistent application of the Model in the Group, and that guarantees that the risks function is understood and internalised at all levels of the organisation. These elements are described in the “Risk Management” section of the Management Report accompanying the Consolidated Financial Statements of BBVA Group.
3.2. Credit and Counterparty Risk
3.2.1. Scope and nature of the Credit Risk measurement and reporting systems for capital framework purposes
Credit risk is based on the likelihood that one party to the financial instrument’s contract will fail to meet its contractual obligations on the grounds of insolvency or inability to pay and will cause a financial loss for the other party.
It is the Group’s most important risk and includes counterparty risk, issuer risk, settlement risk and country risk management.
The Group has a risk strategy determined by the Board of Directors of the parent company, which establishes the Group’s Risk Appetite statement, the core metrics and statements and by type of risk metrics in which this materializes, as well as the General Risk Management and Control Model.
The Risks and Compliance Committee assists the Board of Directors in a variety of risk control and monitoring areas, complementing these functions with the submission to the Board of proposals on the Group’s strategy, control and risk management. In addition, the CRC proposes, in a manner consistent with the Risk Appetite Framework of the Group approved by the Board of Directors, the management and control policies of the different risks of the Group.
The Risks and Compliance Committee, Executive Committee and the Board itself conduct proper monitoring of the implementation of the Group’s risk strategy and risk profile.
Based on the risk strategy determined by the Board of Directors, the Global Risk Management Committee approves the management limits structure that articulates the Risk Appetite Framework for the different geographies, types of risks, classes of assets and portfolios, including the proposed Asset Allocation management limits with the determined level of disaggregation. The limits are established annually, at maximum levels of exposure by type of portfolio.
The Asset Allocation limits for portfolios, businesses and risks are defined taking into account the established metrics in terms of exposure, economic capital and mix of portfolios, and are geared to maximizing the Group’s generation of recurring economic earnings, subject to the framework of restrictions resulting from the definition of the target risk profile.
The Corporate Risk Area establishes risk concentration thresholds: individual, per portfolio and sector, and geographical. These thresholds are established in terms of EAD and Herfindahl indices in order to limit the impact on capital consumption.
The Business Areas work in line with the global vision and defined metrics, optimizing each of the portfolios for which they are responsible in terms of risk/return, within the Group’s limits and policies.
The existing gaps with respect to the target portfolio are identified at global level and transmitted to the Business Areas, establishing plans at global and local level to adapt the risk to the predefined target profile and taking into account the future expected performance of the portfolios.
| BBVA. PILLAR III 2020 | 3. RISK | P. 42 |
For managing risk and capital, BBVA quantifies its credit risk using two main metrics: expected loss (“EL”) and economic capital (“EC”). The expected loss reflects the average value of the losses and is viewed as a business cost. However, economic capital is the amount of capital considered necessary to cover unexpected losses if actual losses are greater than expected losses.
These risk metrics are combined with information on profitability in value-based management, thus integrating the profitability-risk binomial into decision-making, from the definition of business strategy to the approval of individual loans, price setting, assessment of non-performing loan portfolios, incentives to areas in the Group, etc.
There are three essential parameters in the process of calculating the EL and EC measurements: the probability of default (“PD”), loss given default (“LGD”) and exposure at default (“EAD”), mainly based on the estimate of credit conversion factors (“CCF”). They are generally estimated using historical information available on the systems and are assigned to operations and customers according to their particular characteristics.
In this context, the rating and scoring tools assess the risk in each customer/transaction according to their credit quality by assigning them a score, which is used to assign risk metrics together with other additional information: transaction seniority, loan to value ratio, customer segment, etc.
Section 3.2.5.1 of this Document details the definitions, approaches and data used by the Group to determine the regulatory capital requirements for estimating the parameters of probability of default (PD), loss given default (LGD) and exposure at default (EAD).
3.2.2. Definitions and accounting methodologies
The “expected losses” impairment model is applied to financial assets valued at amortised cost, to debt instruments valued at fair value with changes in other accumulated comprehensive income, to financial guarantee contracts and other commitments. All financial instruments valued at fair value through profit or loss are excluded from the impairment model.
For more information about the accounting impairment model, and other accounting definitions (according to Article 442 of CRR), refer to Note 2.2.1 of the Consolidated Financial Statements of BBVA Group.
3.2.3. Information on credit risk
3.2.3.1. Exposure to credit risk
According to Article 5 of the CRR, with respect to the regulatory capital requirements for credit risk, exposure is understood to be any asset item and all items included in the Group’s off-balance sheet accounts involving credit risk and not deducted from the Group’s bank capital. Accordingly, mainly loan and advances to customers are included, with their corresponding undrawn balances, letters of credit and guarantees, debt securities and capital instruments, cash and balances with central banks and credit institutions, repurchase and reverse repurchase agreements, financial derivatives and intangible assets.
The credit risk exposure specified in the following sections of this document is broken down into credit risk according to the standardised approach (Section 3.2.4), credit risk according to the advanced approach (Section 3.2.5), counterparty credit risk (Section 3.2.6), securitisation credit risk (Section 3.2.7) and structural equity risk (Section 3.4).
In addition to the exposure at default and the risk-weighted assets, the table below shows the original exposure, the exposure net of provisions and the exposure after conversion factors under the standardised and advanced approaches as of December 31, 2020 and December 31, 2019 (including counterparty credit risk):
| BBVA. PILLAR III 2020 | 3. RISK | P. 43 |
Table 11. Credit Risk and Counterparty Risk Exposure (Million Euros. 12-31-2020)
Exposure Class | Original Exposure(1) | Provisions(2) | Net exposure of provisions(3) | On-balance exposure after credit risk mitigation techniques(4a) | Off-balance exposure after credit risk mitigation techniques(4b) | Exposure in the adjusted value(5) | EAD(6) | RWA’s(7) | RWA density (8=(7)/(6)) | |||||||||||||||||||||||||||
Central governments or central banks | 177,273 | (120 | ) | 177,153 | 204,373 | 9,038 | 213,411 | 207,083 | 29,392 | 14 | % | |||||||||||||||||||||||||
Regional governments or local authorities | 19,740 | (28 | ) | 19,712 | 6,881 | 851 | 7,732 | 7,207 | 2,317 | 32 | % | |||||||||||||||||||||||||
Public sector entities | 1,926 | (1 | ) | 1,925 | 1,678 | 242 | 1,920 | 1,835 | 768 | 42 | % | |||||||||||||||||||||||||
Multilateral development banks | 271 | — | 271 | 303 | 38 | 341 | 303 | 7 | 2 | % | ||||||||||||||||||||||||||
International organisations | — | — | — | — | — | — | — | — | 0 | % | ||||||||||||||||||||||||||
Institutions | 35,589 | (41 | ) | 35,548 | 15,386 | 13,541 | 28,927 | 17,047 | 7,827 | 46 | % | |||||||||||||||||||||||||
Corporates | 106,523 | (1,507 | ) | 105,016 | 64,598 | 30,885 | 95,483 | 79,985 | 77,822 | 97 | % | |||||||||||||||||||||||||
Retail | 82,631 | (1,815 | ) | 80,816 | 46,040 | 25,794 | 71,833 | 49,019 | 34,362 | 70 | % | |||||||||||||||||||||||||
Secured by mortgages on immovable property | 35,013 | (324 | ) | 34,690 | 34,433 | 216 | 34,649 | 34,614 | 12,769 | 37 | % | |||||||||||||||||||||||||
Exposures in default | 8,392 | (4,309 | ) | 4,083 | 3,847 | 170 | 4,017 | 3,959 | 4,480 | 113 | % | |||||||||||||||||||||||||
Exposures associated with particularly high risk | 4,122 | (544 | ) | 3,578 | 3,035 | 419 | 3,454 | 3,172 | 4,758 | 150 | % | |||||||||||||||||||||||||
Covered bonds | — | — | — | — | — | — | — | — | — | |||||||||||||||||||||||||||
Claims on institutions and corporates with a short-term credit assesment | 1 | — | 1 | 1 | — | 1 | 1 | 1 | 88 | % | ||||||||||||||||||||||||||
Collective investments undertakings | 8 | — | 8 | — | 5 | 5 | 3 | 3 | 100 | % | ||||||||||||||||||||||||||
Other exposures | 20,030 | — | 20,030 | 19,964 | 675 | 20,638 | 20,389 | 12,071 | 59 | % | ||||||||||||||||||||||||||
|
|
|
|
|
|
|
|
|
|
|
|
|
|
|
|
|
| |||||||||||||||||||
Total standardised approach | 491,521 | (8,691 | ) | 482,830 | 400,539 | 81,872 | 482,412 | 424,616 | 186,576 | 44 | % | |||||||||||||||||||||||||
|
|
|
|
|
|
|
|
|
|
|
|
|
|
|
|
|
| |||||||||||||||||||
Central governments or central banks | 13,333 | (7 | ) | 14,233 | 193 | 14,427 | 14,328 | 849 | 6 | % | ||||||||||||||||||||||||||
Institutions | 112,423 | (33 | ) | 91,252 | 5,813 | 97,065 | 94,455 | 7,084 | 8 | % | ||||||||||||||||||||||||||
Corporates | 162,314 | (2,335 | ) | 82,250 | 69,516 | 151,767 | 115,181 | 60,324 | 52 | % | ||||||||||||||||||||||||||
Corporates (SMEs) | 23,254 | (1,028 | ) | 14,156 | 4,019 | 18,175 | 15,734 | 11,452 | 73 | % | ||||||||||||||||||||||||||
Corporates: Specialised lending | 6,407 | (23 | ) | 5,790 | 616 | 6,407 | 6,136 | 4,912 | 80 | % | ||||||||||||||||||||||||||
Corporates: Others | 132,653 | (1,285 | ) | 62,304 | 64,881 | 127,185 | 93,312 | 43,960 | 47 | % | ||||||||||||||||||||||||||
Retail | 115,544 | (3,020 | ) | 91,886 | 21,425 | 113,310 | 95,236 | 18,471 | 19 | % | ||||||||||||||||||||||||||
Of which: secured by immovable property | 76,070 | (1,129 | ) | 71,737 | 4,308 | 76,045 | 71,824 | 7,319 | 10 | % | ||||||||||||||||||||||||||
Of which: Qualifying revolving | 22,516 | (734 | ) | 6,222 | 16,293 | 22,516 | 9,035 | 5,987 | 66 | % | ||||||||||||||||||||||||||
Of which: Others | 16,959 | (1,157 | ) | 13,926 | 823 | 14,749 | 14,377 | 5,165 | 36 | % | ||||||||||||||||||||||||||
Retail: Other SMEs | 5,768 | (296 | ) | 2,765 | 813 | 3,578 | 3,211 | 1,289 | 40 | % | ||||||||||||||||||||||||||
Retail: Other Non-SMEs | 11,191 | (862 | ) | 11,161 | 10 | 11,171 | 11,166 | 3,876 | 35 | % | ||||||||||||||||||||||||||
|
|
|
|
|
|
|
|
|
|
|
|
|
|
|
|
|
| |||||||||||||||||||
Total IRB approach | 403,615 | (5,395 | ) | — | 279,622 | 96,946 | 376,568 | 319,200 | 86,729 | 27 | % | |||||||||||||||||||||||||
|
|
|
|
|
|
|
|
|
|
|
|
|
|
|
|
|
| |||||||||||||||||||
Total credit risk dilution and delivery | 895,135 | (14,086 | ) | 482,830 | 680,161 | 178,819 | 858,980 | 743,816 | 273,304 | 37 | % | |||||||||||||||||||||||||
|
|
|
|
|
|
|
|
|
|
|
|
|
|
|
|
|
| |||||||||||||||||||
Total positions in securitisation(7) | 1,723 | — | — | 1,649 | — | 1,649 | 1,649 | 347 | 21 | % | ||||||||||||||||||||||||||
|
|
|
|
|
|
|
|
|
|
|
|
|
|
|
|
|
| |||||||||||||||||||
Equity | 6,123 | — | 6,123 | 6,123 | — | 6,123 | 6,123 | 14,532 | 237 | % | ||||||||||||||||||||||||||
|
|
|
|
|
|
|
|
|
|
|
|
|
|
|
|
|
| |||||||||||||||||||
Simple risk weight approach | 812 | 812 | 812 | — | 812 | 812 | 1,831 | 226 | % | |||||||||||||||||||||||||||
Exposures in sufficiently diversified portfolios (RW 190%) | 586 | 586 | 586 | — | 586 | 586 | 1,114 | 190 | % | |||||||||||||||||||||||||||
Exchange traded exposures (RW 290%) | 147 | 147 | 147 | — | 147 | 147 | 425 | 290 | % | |||||||||||||||||||||||||||
Others (RW 370%) | 79 | 79 | 79 | — | 79 | 79 | 291 | 370 | % | |||||||||||||||||||||||||||
PD/LGD approach | 1,869 | 1,869 | 1,869 | — | 1,869 | 1,869 | 3,945 | 211 | % | |||||||||||||||||||||||||||
Internal models approach | 185 | 185 | 185 | — | 185 | 185 | 613 | 331 | % | |||||||||||||||||||||||||||
Exposures subject to a 250% risk weight | 3,257 | 3,257 | 3,257 | — | 3,257 | 3,257 | 8,144 | 250 | % | |||||||||||||||||||||||||||
|
|
|
|
|
|
|
|
|
|
|
|
|
|
|
|
|
| |||||||||||||||||||
Total credit risk | 902,981 | (14,086 | ) | 488,953 | 687,934 | 178,819 | 866,753 | 751,588 | 288,184 | 38 | % | |||||||||||||||||||||||||
|
|
|
|
|
|
|
|
|
|
|
|
|
|
|
|
|
| |||||||||||||||||||
| (1) | Gross exposure value before credit risk mitigation techniques and CCF, excluding contributions to the default fund for a CCP. |
| (2) | Includes provisions and impairment of financial assets and contingent risk and commitments. |
| (3) | Standardised Approach exposures are adjusted by credit risk adjustments. The original equity exposure is shown net of impairment. |
| (4a)(4b) | Eligible credit risk mitigation techniques are included, either on-balance sheet or off-balance sheet, according to Chapter 4 of CRR. In the case of securitisation exposure, unfunded credit protection is included. |
| (5) | It corresponds to the exposure value adjusted by eligible credit risk mitigation techniques. |
| (6) | Exposure at default, calculated as (4a)+((4b)*CCF). |
| (7) | This row includes the SEC-SA, SEC-ERBA and SEC-IRBA methods. The exposure of securitisations with a risk weight of 1,250% which are deducted from own funds is included (€29 million). |
| BBVA. PILLAR III 2020 | 3. RISK | P. 44 |
Credit Risk and Counterparty Risk Exposure (Million Euros. 12-31-2019)
| On-balance | Off-balance | |||||||||||||||||||||||||||||||||||
| exposure | exposure | |||||||||||||||||||||||||||||||||||
| after | after | Exposure in | ||||||||||||||||||||||||||||||||||
| Net | credit risk | credit risk | the | Densidad | ||||||||||||||||||||||||||||||||
| Original | exposure of | mitigation | mitigation | adjusted | APR | |||||||||||||||||||||||||||||||
Exposure Class | Exposure(1) | Provisions(2) | provisions(3) | techniques(4a) | techniques(4b) | value(5) | EAD(6) | RWA’s(7) | (8=(7)/(6)) | |||||||||||||||||||||||||||
Central governments or central banks | 130,050 | (128 | ) | 129,922 | 148,210 | 5,624 | 153,834 | 148,863 | 29,685 | 20 | % | |||||||||||||||||||||||||
Regional governments or local authorities | 10,665 | (23 | ) | 10,642 | 6,830 | 1,049 | 7,879 | 7,101 | 1,644 | 23 | % | |||||||||||||||||||||||||
Public sector entities | 1,764 | (2 | ) | 1,763 | 1,643 | 227 | 1,870 | 1,779 | 790 | 44 | % | |||||||||||||||||||||||||
Multilateral development banks | 167 | (0 | ) | 167 | 210 | 38 | 247 | 210 | 11 | 5 | % | |||||||||||||||||||||||||
International organisations | 0 | — | 0 | 0 | 0 | 0 | 0 | — | — | |||||||||||||||||||||||||||
Institutions | 36,102 | (32 | ) | 36,070 | 12,270 | 13,202 | 25,472 | 13,333 | 5,366 | 40 | % | |||||||||||||||||||||||||
Corporates | 112,830 | (1,106 | ) | 111,723 | 72,768 | 32,558 | 105,327 | 89,826 | 87,486 | 97 | % | |||||||||||||||||||||||||
Retail | 89,038 | (1,781 | ) | 87,257 | 52,116 | 30,403 | 82,519 | 54,871 | 38,493 | 70 | % | |||||||||||||||||||||||||
Secured by mortgages on immovable property | 39,867 | (229 | ) | 39,638 | 39,423 | 164 | 39,587 | 39,561 | 14,983 | 38 | % | |||||||||||||||||||||||||
Exposures in default | 8,276 | (4,673 | ) | 3,603 | 3,198 | 328 | 3,526 | 3,423 | 3,808 | 111 | % | |||||||||||||||||||||||||
Exposures associated with particularly high risk | 4,472 | (509 | ) | 3,962 | 3,317 | 419 | 3,736 | 3,424 | 5,136 | 150 | % | |||||||||||||||||||||||||
Covered bonds | — | — | — | — | — | — | — | — | — | |||||||||||||||||||||||||||
Claims on institutions and corporates with a short-term credit assesment | 1 | (0 | ) | 1 | 1 | — | 1 | 1 | 1 | 96 | % | |||||||||||||||||||||||||
Collective investments undertakings | 22 | (0 | ) | 22 | 6 | 4 | 10 | 8 | 8 | 100 | % | |||||||||||||||||||||||||
Other exposures | 21,063 | (45 | ) | 21,018 | 25,346 | 825 | 26,172 | 25,843 | 12,767 | 49 | % | |||||||||||||||||||||||||
Securitisation exposures | 3,953 | — | 3,953 | 134 | — | 134 | 134 | 61 | 45 | % | ||||||||||||||||||||||||||
|
|
|
|
|
|
|
|
|
|
|
|
|
|
|
|
|
| |||||||||||||||||||
Total standardised approach | 458,271 | (8,529 | ) | 449,742 | 365,472 | 84,841 | 450,313 | 388,379 | 200,237 | 52 | % | |||||||||||||||||||||||||
|
|
|
|
|
|
|
|
|
|
|
|
|
|
|
|
|
| |||||||||||||||||||
Central governments or central banks | 11,018 | (5 | ) | 13,172 | 656 | 13,829 | 13,498 | 673 | 5 | % | ||||||||||||||||||||||||||
Institutions | 115,854 | (39 | ) | 93,188 | 5,521 | 98,708 | 96,262 | 6,646 | 7 | % | ||||||||||||||||||||||||||
Corporates | 156,624 | (2,356 | ) | 86,917 | 66,987 | 153,903 | 119,106 | 59,615 | 50 | % | ||||||||||||||||||||||||||
Corporates (SMEs) | 23,121 | (1,029 | ) | 17,135 | 4,588 | 21,723 | 18,979 | 12,478 | 66 | % | ||||||||||||||||||||||||||
Corporates: Specialised lending | 7,310 | (62 | ) | 6,639 | 671 | 7,310 | 6,986 | 5,407 | 77 | % | ||||||||||||||||||||||||||
Corporates: Others | 126,192 | (1,266 | ) | 63,142 | 61,728 | 124,870 | 93,140 | 41,730 | 45 | % | ||||||||||||||||||||||||||
Retail | 118,897 | (2,467 | ) | 96,129 | 22,696 | 118,825 | 100,020 | 22,128 | 22 | % | ||||||||||||||||||||||||||
Of which: secured by immovable property | 78,379 | (941 | ) | 73,978 | 4,376 | 78,353 | 74,139 | 8,904 | 12 | % | ||||||||||||||||||||||||||
Of which: Qualifying revolving | 24,618 | (646 | ) | 7,190 | 17,428 | 24,618 | 10,430 | 7,365 | 71 | % | ||||||||||||||||||||||||||
Of which: Others | 15,901 | (880 | ) | 14,961 | 893 | 15,854 | 15,452 | 5,859 | 38 | % | ||||||||||||||||||||||||||
Retail: Other SMEs | 4,444 | (268 | ) | 3,524 | 878 | 4,401 | 4,006 | 1,636 | 41 | % | ||||||||||||||||||||||||||
Retail: Other Non-SMEs | 11,456 | (611 | ) | 11,438 | 15 | 11,453 | 11,445 | 4,223 | 37 | % | ||||||||||||||||||||||||||
Securitisation exposures | 2,794 | — | 2,714 | — | 2,714 | 2,714 | 856 | 32 | % | |||||||||||||||||||||||||||
|
|
|
|
|
|
|
|
|
|
|
|
|
|
|
|
|
| |||||||||||||||||||
Total IRB approach | 405,188 | (4,867 | ) | — | 292,120 | 95,860 | 387,979 | 331,600 | 89,917 | 27 | % | |||||||||||||||||||||||||
|
|
|
|
|
|
|
|
|
|
|
|
|
|
|
|
|
| |||||||||||||||||||
Total credit risk dilution and delivery | 863,459 | (13,396 | ) | 449,742 | 657,592 | 180,701 | 838,293 | 719,979 | 290,153 | 40 | % | |||||||||||||||||||||||||
|
|
|
|
|
|
|
|
|
|
|
|
|
|
|
|
|
| |||||||||||||||||||
Equity | 7,124 | — | 7,124 | 7,124 | — | 7,124 | 7,124 | 16,167 | 227 | % | ||||||||||||||||||||||||||
|
|
|
|
|
|
|
|
|
|
|
|
|
|
|
|
|
| |||||||||||||||||||
Simple risk weight approach | 961 | 961 | 961 | — | 961 | 961 | 2,309 | 240 | % | |||||||||||||||||||||||||||
Exposures in sufficiently diversified portfolios | 563 | 563 | 563 | — | 563 | 563 | 1,070 | 190 | % | |||||||||||||||||||||||||||
Exchange traded exposures | 290 | 290 | 290 | — | 290 | 290 | 841 | 290 | % | |||||||||||||||||||||||||||
Others | 108 | 108 | 108 | — | 108 | 108 | 399 | 370 | % | |||||||||||||||||||||||||||
PD/LGD approach | 2,883 | 2,883 | 2,883 | — | 2,883 | 2,883 | 5,554 | 193 | % | |||||||||||||||||||||||||||
Internal models approach | 138 | 138 | 138 | — | 138 | 138 | 449 | 324 | % | |||||||||||||||||||||||||||
Exposures subject to a 250% risk weight | 3,142 | 3,142 | 3,142 | — | 3,142 | 3,142 | 7,854 | 250 | % | |||||||||||||||||||||||||||
|
|
|
|
|
|
|
|
|
|
|
|
|
|
|
|
|
| |||||||||||||||||||
Total credit risk | 870,583 | (13,396 | ) | 456,867 | 664,716 | 180,701 | 845,417 | 727,103 | 306,321 | 42 | % | |||||||||||||||||||||||||
|
|
|
|
|
|
|
|
|
|
|
|
|
|
|
|
|
| |||||||||||||||||||
| (1) | Gross exposure value before credit risk mitigation techniques and CCF, excluding contributions to the default fund for a CCP. |
| (2) | Includes provisions and impairment of financial assets and contingent risk and commitments. |
| (3) | Standardised Approach exposures are adjusted by credit risk adjustments. The original equity exposure is shown net of impairment. |
| (4a)(4b) | Eligible credit risk mitigation techniques are included, either on-balance sheet or off-balance sheet, according to Chapter 4 of CRR. In the case of securitisation exposure, unfunded credit protection is included. |
| (5) | It corresponds to the exposure value adjusted by eligible credit risk mitigation techniques. |
| (6) | Exposure at default, calculated as (4a)+((4b)*CCF). |
| (7) | The exposure of securitisations with a risk weight of 1,250%, which are deducted from own funds is included (€25 million). |
| BBVA. PILLAR III 2020 | 3. RISK | P. 45 |
3.2.3.2. Distribution and maturity of credit risk exposure
The following table provides the average amount of credit risk exposure during 2020 and 2019, both for the standardised approach and the advanced method by exposure categories:
Table 12. EU CRB-B - Total and average net amount of exposures (including counterparty credit risk) (Million Euros)
| 12-31-2020 | 12-31-2019 | |||||||||||||||
| Net value of exposures at | Average net exposures | Net value of exposures at | Average net exposures | |||||||||||||
| the end of the period (4Q)(1) | over the period | the end of the period (4Q)(1) | over the period | |||||||||||||
Central governments or central banks | 13,326 | 11,683 | 11,014 | 9,178 | ||||||||||||
Institutions | 112,390 | 124,029 | 115,815 | 114,552 | ||||||||||||
Corporates | 159,979 | 161,320 | 154,267 | 146,359 | ||||||||||||
Of which: Specialised lending | 6,384 | 6,718 | 7,249 | 7,343 | ||||||||||||
Of which: SMEs | 22,227 | 22,104 | 22,092 | 20,810 | ||||||||||||
Retail | 112,524 | 111,749 | 116,431 | 115,975 | ||||||||||||
Secured by immovable property | 74,941 | 75,528 | 77,437 | 78,385 | ||||||||||||
Qualifying revolving | 21,782 | 21,001 | 23,973 | 23,199 | ||||||||||||
Other retail | 15,801 | 15,220 | 15,021 | 14,391 | ||||||||||||
SMEs | 5,472 | 4,934 | 4,176 | 3,984 | ||||||||||||
Non-SMEs | 10,329 | 10,286 | 10,845 | 10,408 | ||||||||||||
Equity | 6,123 | 6,008 | 7,124 | 7,145 | ||||||||||||
|
|
|
|
|
|
|
| |||||||||
Total IRB approach | 404,343 | 414,790 | 404,651 | 393,210 | ||||||||||||
|
|
|
|
|
|
|
| |||||||||
Central governments or central banks | 177,153 | 161,564 | 129,922 | 125,611 | ||||||||||||
Regional governments or local authorities | 19,712 | 19,456 | 10,642 | 10,948 | ||||||||||||
Public sector entities | 1,925 | 1,697 | 1,763 | 1,285 | ||||||||||||
Multilateral development banks | 271 | 273 | 167 | 288 | ||||||||||||
International organisations | — | — | 0 | 0 | ||||||||||||
Institutions | 35,548 | 37,132 | 36,070 | 38,088 | ||||||||||||
Corporates | 105,016 | 110,359 | 111,723 | 119,071 | ||||||||||||
Of which: SMEs | 14,366 | 14,509 | 13,154 | 22,949 | ||||||||||||
Retail | 80,816 | 81,897 | 87,257 | 86,432 | ||||||||||||
Of which: SMEs | 27,629 | 26,024 | 25,382 | 25,919 | ||||||||||||
Secured by mortgages on immovable property | 34,690 | 36,333 | 39,638 | 40,128 | ||||||||||||
Of which: SMEs | 12,458 | 11,526 | 13,689 | 13,111 | ||||||||||||
Exposures in default | 4,083 | 3,883 | 3,603 | 3,874 | ||||||||||||
Exposures associated with particularly high risk | 3,578 | 3,820 | 3,962 | 3,602 | ||||||||||||
Covered bonds | — | — | — | — | ||||||||||||
Claims on institutions and corporates with a short-term credit assesment | 1 | 2 | 1 | 3 | ||||||||||||
Collective investments undertakings | 8 | 90 | 22 | 165 | ||||||||||||
Equity exposures | — | — | — | — | ||||||||||||
Other exposures | 20,030 | 19,258 | 21,018 | 20,177 | ||||||||||||
|
|
|
|
|
|
|
| |||||||||
Total standardised approach | 482,830 | 475,763 | 445,789 | 449,673 | ||||||||||||
|
|
|
|
|
|
|
| |||||||||
Total | 887,172 | 890,553 | 850,440 | 842,883 | ||||||||||||
|
|
|
|
|
|
|
| |||||||||
| (1) | For the purpose of this table, the original exposure is shown net of credit risk adjustments and provisions reported in the COREP statements for credit risk under both the standardised and IRB approaches. Additionally, it includes equity credit risk and excludes securitisation exposures. |
| BBVA. PILLAR III 2020 | 3. RISK | P. 46 |
The distribution by geographical area of the original exposure, net of provisions based on the country of the counterparty is shown below. The distribution includes credit risk exposure and counterparty credit risk exposure, as well as equity credit exposure.
Table 13. EU CRB-C - Geographical breakdown of exposures (including counterparty credit risk) (Million Euros. 12-31-2020)
| Original Exposure net of provisions(1)(2) | ||||||||||||||||||||||||||||
Exposure Class | Spain | Turkey | Mexico | USA | South America | Other areas(3) | Total | |||||||||||||||||||||
Central governments or central banks | 16 | — | 22 | 7,078 | 257 | 5,555 | 12,928 | |||||||||||||||||||||
Institutions | 20,015 | 48 | 236 | 1,931 | 431 | 10,708 | 33,369 | |||||||||||||||||||||
Corporates | 68,471 | 384 | 20,573 | 18,046 | 2,604 | 44,917 | 154,996 | |||||||||||||||||||||
Retail | 96,805 | 1 | 15,132 | 39 | 62 | 481 | 112,521 | |||||||||||||||||||||
Equity | 4,016 | 176 | 592 | 733 | 275 | 332 | 6,123 | |||||||||||||||||||||
|
|
|
|
|
|
|
|
|
|
|
|
|
| |||||||||||||||
Total IRB approach | 189,323 | 609 | 36,556 | 27,827 | 3,628 | 61,993 | 319,937 | |||||||||||||||||||||
|
|
|
|
|
|
|
|
|
|
|
|
|
| |||||||||||||||
Central governments or central banks | 86,033 | 12,737 | 27,838 | 18,819 | 9,576 | 8,644 | 163,647 | |||||||||||||||||||||
Regional governments or local authorities | 547 | 155 | 3,581 | 14,743 | 581 | 41 | 19,648 | |||||||||||||||||||||
Public sector entities | 14 | 43 | 14 | 582 | 842 | 0 | 1,494 | |||||||||||||||||||||
Multilateral development banks | — | — | — | — | 121 | 149 | 270 | |||||||||||||||||||||
International organisations | 0 | — | — | — | — | — | 0 | |||||||||||||||||||||
Institutions | 11,717 | 1,899 | 4,047 | 3,331 | 400 | 5,061 | 26,455 | |||||||||||||||||||||
Corporates | 3,944 | 23,121 | 3,945 | 46,360 | 16,875 | 6,629 | 100,873 | |||||||||||||||||||||
Retail | 14,592 | 20,121 | 11,725 | 14,398 | 17,787 | 1,765 | 80,388 | |||||||||||||||||||||
Secured by mortgages on immovable property | 2,917 | 2,367 | 10,724 | 9,497 | 7,119 | 2,066 | 34,690 | |||||||||||||||||||||
Exposures in default | 696 | 1,073 | 519 | 965 | 704 | 127 | 4,083 | |||||||||||||||||||||
Exposures associated with particularly high risk | 174 | 1,964 | 517 | 221 | 654 | 0 | 3,531 | |||||||||||||||||||||
Covered bonds | — | — | — | — | — | — | — | |||||||||||||||||||||
Claims on institutions and corporates with a short-term credit assesment | 1 | — | — | 0 | — | 3 | 5 | |||||||||||||||||||||
Collective investments undertakings | — | — | — | — | 1 | — | 1 | |||||||||||||||||||||
Equity exposures | — | — | — | — | — | — | — | |||||||||||||||||||||
Other exposures | 7,420 | 2,115 | 5,001 | 2,348 | 2,953 | 192 | 20,030 | |||||||||||||||||||||
|
|
|
|
|
|
|
|
|
|
|
|
|
| |||||||||||||||
Total standardised approach | 128,054 | 65,594 | 67,910 | 111,264 | 57,612 | 24,679 | 455,113 | |||||||||||||||||||||
|
|
|
|
|
|
|
|
|
|
|
|
|
| |||||||||||||||
Total | 317,377 | 66,204 | 104,466 | 139,091 | 61,240 | 86,672 | 775,050 | |||||||||||||||||||||
|
|
|
|
|
|
|
|
|
|
|
|
|
| |||||||||||||||
| (1) | Geographical areas determined based on the counterparty. |
| (2) | For the purpose of this table, the original exposure is shown net of credit risk adjustments and provisions reported in the COREP statements for credit risk under both the standardised and IRB approaches. Additionally, it includes equity credit risk and excludes securitisation exposures. |
| (3) | Includes all other countries not included in the previous columns. The countries with the greatest exposure in this area are: United Kingdom, France, Italy, Germany and Portugal. |
EU CRB-C - Geographical breakdown of exposures (including counterparty credit risk) (Million Euros. 12-31-2019)
| Original Exposure net of provisions(1)(2) | ||||||||||||||||||||||||||||
Exposure Class | Spain | Turkey | Mexico | USA | South America | Other areas(3) | Total | |||||||||||||||||||||
Central governments or central banks | 17 | — | 130 | 5,365 | 189 | 3,713 | 9,414 | |||||||||||||||||||||
Institutions | 22,059 | 32 | 426 | 1,276 | 488 | 10,014 | 34,295 | |||||||||||||||||||||
Corporates | 62,344 | 495 | 23,625 | 18,781 | 2,685 | 42,416 | 150,345 | |||||||||||||||||||||
Retail | 98,367 | 1 | 17,418 | 39 | 69 | 532 | 116,427 | |||||||||||||||||||||
Equity | 4,742 | 198 | 977 | 333 | 458 | 416 | 7,124 | |||||||||||||||||||||
|
|
|
|
|
|
|
|
|
|
|
|
|
| |||||||||||||||
Total IRB approach | 187,461 | 732 | 42,288 | 26,313 | 3,750 | 57,062 | 317,606 | |||||||||||||||||||||
|
|
|
|
|
|
|
|
|
|
|
|
|
| |||||||||||||||
Central governments or central banks | 56,903 | 13,632 | 27,222 | 9,582 | 8,401 | 6,587 | 122,327 | |||||||||||||||||||||
Regional governments or local authorities | 282 | 99 | 3,315 | 6,726 | 82 | 63 | 10,568 | |||||||||||||||||||||
Public sector entities | — | 44 | 63 | 625 | 864 | 0 | 1,595 | |||||||||||||||||||||
Multilateral development banks | — | — | — | — | 144 | 23 | 167 | |||||||||||||||||||||
International organisations | 0 | — | — | — | — | — | 0 | |||||||||||||||||||||
Institutions | 11,620 | 1,566 | 3,406 | 2,694 | 154 | 4,299 | 23,738 | |||||||||||||||||||||
Corporates | 5,217 | 25,314 | 3,378 | 49,189 | 20,003 | 5,665 | 108,766 | |||||||||||||||||||||
Retail | 14,310 | 20,914 | 15,798 | 16,375 | 17,271 | 2,065 | 86,733 | |||||||||||||||||||||
Secured by mortgages on immovable property | 3,213 | 3,671 | 11,395 | 10,361 | 8,785 | 2,213 | 39,638 | |||||||||||||||||||||
Exposures in default | 703 | 1,136 | 408 | 477 | 755 | 123 | 3,602 | |||||||||||||||||||||
Exposures associated with particularly high risk | 200 | 2,259 | 527 | 254 | 689 | 1 | 3,931 | |||||||||||||||||||||
Covered bonds | — | — | — | — | — | — | — | |||||||||||||||||||||
Claims on institutions and corporates with a short-term credit assesment | 1 | — | — | 2 | — | 7 | 10 | |||||||||||||||||||||
Collective investments undertakings | 0 | — | — | — | 1 | — | 1 | |||||||||||||||||||||
Equity exposures | — | — | — | — | — | — | — | |||||||||||||||||||||
Other exposures | 7,564 | 2,122 | 5,293 | 2,485 | 3,295 | 260 | 21,018 | |||||||||||||||||||||
|
|
|
|
|
|
|
|
|
|
|
|
|
| |||||||||||||||
Total standardised approach | 100,013 | 70,758 | 70,806 | 98,769 | 60,443 | 21,307 | 422,096 | |||||||||||||||||||||
|
|
|
|
|
|
|
|
|
|
|
|
|
| |||||||||||||||
Total | 287,474 | 71,490 | 113,094 | 125,082 | 64,193 | 78,369 | 739,702 | |||||||||||||||||||||
|
|
|
|
|
|
|
|
|
|
|
|
|
| |||||||||||||||
| (1) | Geographical areas determined based on the counterparty. |
| (2) | For the purpose of this table, the original exposure is shown net of credit risk adjustments and provisions reported in the COREP statements for credit risk under both the standardised and IRB approaches. Additionally, it includes equity credit risk and excludes securitisation exposures. |
| (3) | Includes all other countries not included in the previous columns. The countries with the greatest exposure in this area are: United Kingdom, France, Italy, Germany and Portugal. |
| BBVA. PILLAR III 2020 | 3. RISK | P. 47 |
A graphic depiction of the original exposure distribution by geographic area, revealing the Group’s high level of
geographic diversification, which constitutes one of the key factors for its strategic growth is below.
Chart 5. Distribution of credit risk exposures by geographical areas
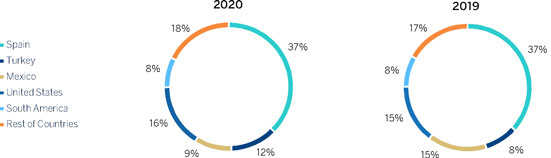
| (*) | Includes all other countries not included in the above groupings. The countries with the greatest exposure in this area are United Kingdom, France, Italy, Germany and Portugal. |
In addition, the following table shows the distribution of original exposure net of provisions by economic sector for financial assets and contingenct risk and commitments (standardised and advanced approach), excluding counterparty credit risk but including equity credit risk:
| BBVA. PILLAR III 2020 | RISK | P. 48 |
Table 14. EU CRB-D - Concentration of exposures by industry or counterparty types (excluding counterparty credit risk) (Million Euros. 12-31-2020)
Exposure Class | Agriculture, forestry and fishing | Mining and quarrying | Manufacturing Industry | Energy supply | Water supply | Construction | Wholesale and retail trade | Transport and storage | Accommodation and food service activities | Information and communication | Financial activities and insurance | Real estate activities | Professional, scientific and technical activities | Administrative and support service activities | Public administration and defense, compulsory social security | Education | Human health services and social work activities | Arts, entertainment and recreation | Other services | Total(1) | ||||||||||||||||||||||||||||||||||||||||||||||||||||||||||||
Central governments or central banks | — | — | 0 | — | — | — | — | — | — | — | 5,944 | — | — | — | 6,984 | 0 | — | — | — | 12,928 | ||||||||||||||||||||||||||||||||||||||||||||||||||||||||||||
Institutions | 4 | — | 62 | 455 | 273 | 479 | 17 | 1,340 | 2 | 31 | 9,903 | 103 | 66 | 189 | 20,156 | 2 | 91 | 24 | 170 | 33,369 | ||||||||||||||||||||||||||||||||||||||||||||||||||||||||||||
Corporates | 2,036 | 5,274 | 44,855 | 18,035 | 1,634 | 11,469 | 17,737 | 6,081 | 6,171 | 8,140 | 13,372 | 6,663 | 6,682 | 3,776 | 21 | 291 | 1,333 | 985 | 442 | 154,996 | ||||||||||||||||||||||||||||||||||||||||||||||||||||||||||||
Retail | 577 | 45 | 2,039 | 98 | 69 | 1,976 | 4,167 | 1,432 | 1,523 | 532 | 224 | 455 | 1,764 | 655 | 51 | 275 | 745 | 336 | 95,558 | 112,521 | ||||||||||||||||||||||||||||||||||||||||||||||||||||||||||||
Equity | — | — | — | — | — | 1,291 | 0 | 17 | — | 925 | 2,354 | (1 | ) | (1 | ) | 1 | — | — | — | — | 1,537 | 6,123 | ||||||||||||||||||||||||||||||||||||||||||||||||||||||||||
|
|
|
|
|
|
|
|
|
|
|
|
|
|
|
|
|
|
|
|
|
|
|
|
|
|
|
|
|
|
|
|
|
|
|
|
|
|
|
| |||||||||||||||||||||||||||||||||||||||||
Total IRB approach | 2,617 | 5,319 | 46,956 | 18,588 | 1,976 | 15,214 | 21,921 | 8,870 | 7,696 | 9,628 | 31,798 | 7,221 | 8,511 | 4,621 | 27,212 | 567 | 2,169 | 1,345 | 97,708 | 319,937 | ||||||||||||||||||||||||||||||||||||||||||||||||||||||||||||
|
|
|
|
|
|
|
|
|
|
|
|
|
|
|
|
|
|
|
|
|
|
|
|
|
|
|
|
|
|
|
|
|
|
|
|
|
|
|
| |||||||||||||||||||||||||||||||||||||||||
Central governments or central banks | — | 0 | 0 | — | — | 0 | 0 | — | — | — | 49,749 | — | — | 0 | 111,468 | 0 | — | — | 2,430 | 163,647 | ||||||||||||||||||||||||||||||||||||||||||||||||||||||||||||
Regional governments or local authorities | 0 | — | 29 | 7 | 84 | 53 | 3 | 126 | — | 0 | 0 | 70 | 1 | 1 | 16,722 | 878 | 937 | 17 | 719 | 19,648 | ||||||||||||||||||||||||||||||||||||||||||||||||||||||||||||
Public sector entities | (0 | ) | 10 | 247 | 484 | 25 | (0 | ) | (0 | ) | 6 | — | 61 | 4 | (0 | ) | — | 0 | 650 | 3 | 2 | 0 | 2 | 1,494 | ||||||||||||||||||||||||||||||||||||||||||||||||||||||||
Multilateral development banks | — | — | — | — | — | — | — | — | — | — | 229 | — | — | — | 41 | 0 | — | — | — | 270 | ||||||||||||||||||||||||||||||||||||||||||||||||||||||||||||
International organisations | — | — | — | — | — | — | — | — | — | — | — | — | — | — | — | — | — | — | 0 | 0 | ||||||||||||||||||||||||||||||||||||||||||||||||||||||||||||
Institutions | — | 0 | — | — | — | 0 | 0 | — | — | 1 | 25,145 | 54 | — | — | 1,007 | — | — | — | 246 | 26,455 | ||||||||||||||||||||||||||||||||||||||||||||||||||||||||||||
Corporates | 1,684 | 2,315 | 27,778 | 6,261 | 356 | 4,442 | 10,862 | 5,895 | 2,116 | 2,049 | 6,384 | 12,369 | 1,876 | 2,282 | 147 | 648 | 3,289 | 731 | 9,390 | 100,873 | ||||||||||||||||||||||||||||||||||||||||||||||||||||||||||||
Retail | 1,218 | 289 | 4,441 | 206 | 64 | 2,027 | 11,251 | 2,235 | 1,742 | 467 | 307 | 1,028 | 2,251 | 1,370 | 398 | 1,346 | 1,619 | 353 | 47,778 | 80,388 | ||||||||||||||||||||||||||||||||||||||||||||||||||||||||||||
Secured by mortgages on immovable property | 335 | 173 | 1,369 | 29 | 9 | 525 | 2,311 | 401 | 883 | 161 | 301 | 16,028 | 1,401 | 1,095 | 351 | 945 | 962 | 98 | 7,314 | 34,690 | ||||||||||||||||||||||||||||||||||||||||||||||||||||||||||||
Exposures in default | 69 | 54 | 639 | 36 | 3 | 372 | 559 | 265 | 285 | 33 | 62 | 242 | 117 | 74 | 12 | 60 | 75 | 45 | 1,082 | 4,083 | ||||||||||||||||||||||||||||||||||||||||||||||||||||||||||||
Exposures associated with particularly high risk | 1 | 1 | 4 | 469 | — | 644 | 68 | 1 | 1 | 505 | 567 | 1,231 | 12 | 8 | — | 0 | 1 | 1 | 18 | 3,531 | ||||||||||||||||||||||||||||||||||||||||||||||||||||||||||||
Covered bonds | — | — | — | — | — | — | — | — | — | — | — | — | — | — | — | — | — | — | — | — | ||||||||||||||||||||||||||||||||||||||||||||||||||||||||||||
Claims on institutions and corporates with a short-term | — | — | — | — | — | — | — | — | — | — | 5 | — | — | — | — | — | — | — | — | 5 | ||||||||||||||||||||||||||||||||||||||||||||||||||||||||||||
credit assesment | ||||||||||||||||||||||||||||||||||||||||||||||||||||||||||||||||||||||||||||||||
Collective investments undertakings | 1 | — | — | — | — | — | — | — | — | — | — | — | — | — | — | — | — | — | — | 1 | ||||||||||||||||||||||||||||||||||||||||||||||||||||||||||||
Equity exposures | — | — | — | — | — | — | — | — | — | — | — | — | — | — | — | — | — | — | — | — | ||||||||||||||||||||||||||||||||||||||||||||||||||||||||||||
Other exposures | 0 | — | 0 | — | — | 0 | 0 | 0 | — | 1 | 11,917 | 906 | 57 | — | 0 | — | 0 | — | 7,148 | 20,030 | ||||||||||||||||||||||||||||||||||||||||||||||||||||||||||||
|
|
|
|
|
|
|
|
|
|
|
|
|
|
|
|
|
|
|
|
|
|
|
|
|
|
|
|
|
|
|
|
|
|
|
|
|
|
|
| |||||||||||||||||||||||||||||||||||||||||
Total standardised approach | 3,307 | 2,842 | 34,506 | 7,492 | 540 | 8,062 | 25,054 | 8,929 | 5,027 | 3,278 | 94,673 | 31,927 | 5,715 | 4,830 | 130,794 | 3,880 | 6,884 | 1,245 | 76,127 | 455,113 | ||||||||||||||||||||||||||||||||||||||||||||||||||||||||||||
|
|
|
|
|
|
|
|
|
|
|
|
|
|
|
|
|
|
|
|
|
|
|
|
|
|
|
|
|
|
|
|
|
|
|
|
|
|
|
| |||||||||||||||||||||||||||||||||||||||||
Total | 5,925 | 8,161 | 81,463 | 26,080 | 2,516 | 23,276 | 46,976 | 17,798 | 12,722 | 12,906 | 126,471 | 39,148 | 14,226 | 9,451 | 158,006 | 4,447 | 9,053 | 2,590 | 173,835 | 775,050 | ||||||||||||||||||||||||||||||||||||||||||||||||||||||||||||
|
|
|
|
|
|
|
|
|
|
|
|
|
|
|
|
|
|
|
|
|
|
|
|
|
|
|
|
|
|
|
|
|
|
|
|
|
|
|
| |||||||||||||||||||||||||||||||||||||||||
| (1) | For the purpose of this table, the original exposure is shown net of credit risk adjustments and provisions reported in the COREP statements for credit risk under both the standardised and IRB approaches. Additionally, it includes equity credit risk and excludes securitisation exposures |
| BBVA. PILLAR III 2020 | RISK | P. 49 |
EU CRB-D - Concentration of exposures by industry or counterparty types (excluding counterparty credit risk) (Million Euros. 12-31-2019)
Exposure Class | Agriculture, forestry and fishing | Mining and quarrying | Manufacturing Industry | Energy supply | Water supply | Construction | Wholesale and retail trade | Transport and storage | Accommodation and food service activities | Information and communication | Financial activities and insurance | Real estate activities | Professional, scientific and technical activities | Administrative and support service activities | Public administration and defense, compulsory social security | Education | Human health services and social work activities | Arts, entertainment and recreation | Other services | Total(1) | ||||||||||||||||||||||||||||||||||||||||||||||||||||||||||||
Central governments or central banks | — | — | 0 | — | — | — | — | — | — | — | 2,474 | — | 81 | — | 6,860 | 0 | — | — | 0 | 9,414 | ||||||||||||||||||||||||||||||||||||||||||||||||||||||||||||
Institutions | 3 | — | 170 | 434 | 310 | 594 | 12 | 1,342 | 9 | 66 | 11,614 | 93 | 67 | 243 | 19,189 | 1 | 92 | 19 | 38 | 34,295 | ||||||||||||||||||||||||||||||||||||||||||||||||||||||||||||
Corporates | 1,923 | 5,086 | 44,062 | 17,235 | 1,434 | 11,845 | 19,697 | 4,675 | 4,893 | 6,304 | 11,543 | 9,115 | 6,223 | 3,466 | 38 | 303 | 1,378 | 804 | 322 | 150,345 | ||||||||||||||||||||||||||||||||||||||||||||||||||||||||||||
Retail | 581 | 45 | 1,858 | 105 | 64 | 1,922 | 3,814 | 1,408 | 1,439 | 490 | 223 | 458 | 1,711 | 637 | — | 252 | 706 | 304 | 100,409 | 116,427 | ||||||||||||||||||||||||||||||||||||||||||||||||||||||||||||
Equity | — | — | — | — | — | 830 | 0 | — | — | 2,830 | 2,352 | 0 | 0 | — | 34 | — | — | — | 1,078 | 7,124 | ||||||||||||||||||||||||||||||||||||||||||||||||||||||||||||
|
|
|
|
|
|
|
|
|
|
|
|
|
|
|
|
|
|
|
|
|
|
|
|
|
|
|
|
|
|
|
|
|
|
|
|
|
|
|
| |||||||||||||||||||||||||||||||||||||||||
Total IRB approach | 2,506 | 5,131 | 46,090 | 17,775 | 1,808 | 15,190 | 23,523 | 7,425 | 6,341 | 9,690 | 28,206 | 9,666 | 8,082 | 4,346 | 26,121 | 557 | 2,175 | 1,126 | 101,847 | 317,606 | ||||||||||||||||||||||||||||||||||||||||||||||||||||||||||||
|
|
|
|
|
|
|
|
|
|
|
|
|
|
|
|
|
|
|
|
|
|
|
|
|
|
|
|
|
|
|
|
|
|
|
|
|
|
|
| |||||||||||||||||||||||||||||||||||||||||
Central governments or central banks | — | — | 0 | — | — | — | 0 | 1 | — | — | 27,355 | — | — | 0 | 92,720 | 0 | 1 | 0 | 2,250 | 122,327 | ||||||||||||||||||||||||||||||||||||||||||||||||||||||||||||
Regional governments or local authorities | 0 | — | 52 | 27 | 65 | 48 | 4 | 140 | — | 0 | 0 | — | 1 | 2 | 8,614 | 653 | 860 | 10 | 93 | 10,568 | ||||||||||||||||||||||||||||||||||||||||||||||||||||||||||||
Public sector entities | 2 | 0 | 304 | 427 | 25 | 0 | 0 | 8 | — | 29 | 44 | — | 0 | 0 | 711 | 5 | 0 | 0 | 37 | 1,595 | ||||||||||||||||||||||||||||||||||||||||||||||||||||||||||||
Multilateral development banks | — | — | — | — | — | — | — | — | — | — | 114 | — | — | — | 53 | — | — | — | — | 167 | ||||||||||||||||||||||||||||||||||||||||||||||||||||||||||||
International organisations | — | — | — | — | — | — | — | — | — | — | — | — | — | — | — | — | — | — | 0 | 0 | ||||||||||||||||||||||||||||||||||||||||||||||||||||||||||||
Institutions | 1 | 0 | 14 | 62 | — | 29 | 15 | 53 | 24 | 35 | 21,755 | 51 | 215 | 293 | 662 | 0 | 177 | 0 | 354 | 23,738 | ||||||||||||||||||||||||||||||||||||||||||||||||||||||||||||
Corporates | 1,712 | 1,996 | 31,688 | 5,984 | 339 | 3,909 | 13,210 | 6,404 | 5,381 | 3,756 | 4,902 | 12,438 | 2,256 | 2,696 | 234 | 684 | 3,951 | 523 | 6,704 | 108,766 | ||||||||||||||||||||||||||||||||||||||||||||||||||||||||||||
Retail | 1,109 | 403 | 4,619 | 214 | 51 | 2,034 | 11,192 | 1,922 | 1,452 | 457 | 680 | 921 | 2,420 | 1,793 | — | 1,529 | 1,879 | 310 | 53,748 | 86,733 | ||||||||||||||||||||||||||||||||||||||||||||||||||||||||||||
Secured by mortgages on immovable property | 408 | 218 | 1,821 | 179 | 10 | 653 | 2,947 | 516 | 1,172 | 187 | 321 | 17,433 | 1,605 | 1,494 | — | 1,076 | 1,164 | 123 | 8,310 | 39,638 | ||||||||||||||||||||||||||||||||||||||||||||||||||||||||||||
Exposures in default | 109 | 65 | 351 | 31 | 5 | 431 | 521 | 221 | 181 | 39 | 72 | 233 | 170 | 107 | 4 | 45 | 52 | 25 | 940 | 3,602 | ||||||||||||||||||||||||||||||||||||||||||||||||||||||||||||
Exposures associated with particularly high risk | 2 | 1 | 4 | 660 | 0 | 843 | 356 | 4 | 4 | 1 | 223 | 1,123 | 655 | 35 | — | 1 | 1 | 1 | 20 | 3,931 | ||||||||||||||||||||||||||||||||||||||||||||||||||||||||||||
Covered bonds | — | — | — | — | — | — | — | — | — | — | — | — | — | — | — | — | — | — | — | — | ||||||||||||||||||||||||||||||||||||||||||||||||||||||||||||
Claims on institutions and corporates with a short-term | — | — | — | — | — | — | — | — | — | — | 10 | — | — | — | — | — | — | — | — | 10 | ||||||||||||||||||||||||||||||||||||||||||||||||||||||||||||
credit assesment | ||||||||||||||||||||||||||||||||||||||||||||||||||||||||||||||||||||||||||||||||
Collective investments undertakings | — | — | — | — | — | — | — | — | — | — | 1 | — | — | — | — | — | — | — | — | 1 | ||||||||||||||||||||||||||||||||||||||||||||||||||||||||||||
Equity exposures | — | — | — | — | — | — | — | — | — | — | — | — | — | — | — | — | — | — | — | — | ||||||||||||||||||||||||||||||||||||||||||||||||||||||||||||
Other exposures | 0 | — | 0 | — | — | 0 | 0 | 0 | — | 0 | 12,476 | 565 | 53 | — | 0 | — | 0 | — | 7,924 | 21,018 | ||||||||||||||||||||||||||||||||||||||||||||||||||||||||||||
|
|
|
|
|
|
|
|
|
|
|
|
|
|
|
|
|
|
|
|
|
|
|
|
|
|
|
|
|
|
|
|
|
|
|
|
|
|
|
| |||||||||||||||||||||||||||||||||||||||||
Total standardised approach | 3,342 | 2,683 | 38,853 | 7,585 | 496 | 7,946 | 28,245 | 9,269 | 8,213 | 4,505 | 67,955 | 32,764 | 7,373 | 6,419 | 102,999 | 3,993 | 8,085 | 991 | 80,380 | 422,096 | ||||||||||||||||||||||||||||||||||||||||||||||||||||||||||||
|
|
|
|
|
|
|
|
|
|
|
|
|
|
|
|
|
|
|
|
|
|
|
|
|
|
|
|
|
|
|
|
|
|
|
|
|
|
|
| |||||||||||||||||||||||||||||||||||||||||
Total | 5,849 | 7,814 | 84,942 | 25,359 | 2,304 | 23,136 | 51,768 | 16,694 | 14,554 | 14,195 | 96,161 | 42,430 | 15,455 | 10,765 | 129,119 | 4,550 | 10,260 | 2,117 | 182,227 | 739,702 | ||||||||||||||||||||||||||||||||||||||||||||||||||||||||||||
|
|
|
|
|
|
|
|
|
|
|
|
|
|
|
|
|
|
|
|
|
|
|
|
|
|
|
|
|
|
|
|
|
|
|
|
|
|
|
| |||||||||||||||||||||||||||||||||||||||||
| (1) | For the purpose of this table, the original exposure is shown net of credit risk adjustments and provisions reported in the COREP statements for credit risk under both the standardised and IRB approaches. Additionally, it includes equity credit risk and excludes securitisation exposures. |
| BBVA. PILLAR III 2020 | 3. RISK | P. 50 |
The following table shows the distribution of original exposure, net of value adjustments and provisions, by residual maturity of financial assets and contingent risk and
commmitments, broken down by categories of exposure under the standard and advanced approaches, excluding counterparty risk and including equity credit risk:
Table 15. EU CRB-E - Maturity of exposures (excluding counterparty credit risk) (Million Euros. 12-31-2020)
| Net exposure value(1) | ||||||||||||||||||||||||
Exposure Class | On demand | £ 1 year | > 1 year £ 5 years | > 5 years | No stated maturity | Total | ||||||||||||||||||
Central governments or central banks | 9 | 4,629 | 2,435 | 205 | 5,649 | 12,928 | ||||||||||||||||||
Institutions | 974 | 4,768 | 15,222 | 5,467 | 6,937 | 33,369 | ||||||||||||||||||
Corporates | 330 | 51,184 | 69,964 | 24,434 | 9,085 | 154,996 | ||||||||||||||||||
Retail | 4 | 804 | 9,366 | 80,243 | 22,104 | 112,521 | ||||||||||||||||||
Equity | — | — | — | — | 6,123 | 6,123 | ||||||||||||||||||
|
|
|
|
|
|
|
|
|
|
|
| |||||||||||||
Total IRB approach | 1,317 | 61,385 | 96,988 | 110,349 | 49,898 | 319,937 | ||||||||||||||||||
|
|
|
|
|
|
|
|
|
|
|
| |||||||||||||
Central governments or central banks | 52,119 | 22,439 | 27,249 | 31,231 | 30,610 | 163,647 | ||||||||||||||||||
Regional governments or local authorities | 67 | 1,274 | 2,194 | 15,972 | 140 | 19,648 | ||||||||||||||||||
Public sector entities | 10 | 844 | 120 | 520 | 1,494 | |||||||||||||||||||
Multilateral development banks | 47 | 48 | 38 | 137 | — | 270 | ||||||||||||||||||
International organisations | — | — | — | 0 | 0 | 0 | ||||||||||||||||||
Institutions | 2,928 | 8,982 | 3,532 | 2,698 | 8,315 | 26,455 | ||||||||||||||||||
Corporates | 4,538 | 31,990 | 42,333 | 17,715 | 4,298 | 100,873 | ||||||||||||||||||
Retail | 3,082 | 23,507 | 31,781 | 14,752 | 7,265 | 80,388 | ||||||||||||||||||
Secured by mortgages on immovable property | 168 | 3,908 | 3,002 | 27,597 | 14 | 34,690 | ||||||||||||||||||
Exposures in default | 37 | 852 | 733 | 1,815 | 646 | 4,083 | ||||||||||||||||||
Exposures associated with particularly high risk | 58 | 1,362 | 1,148 | 672 | 291 | 3,531 | ||||||||||||||||||
Covered bonds | — | — | — | — | — | — | ||||||||||||||||||
Claims on institutions and corporates with a short-term credit assesment | — | 4 | 1 | 5 | ||||||||||||||||||||
Collective investments undertakings | 1 | 0 | — | — | — | 1 | ||||||||||||||||||
Equity exposures | — | — | — | — | — | — | ||||||||||||||||||
Other exposures | 5,475 | 3,590 | 30 | (628 | ) | 11,563 | 20,030 | |||||||||||||||||
|
|
|
|
|
|
|
|
|
|
|
| |||||||||||||
Total standardised approach | 68,529 | 98,800 | 112,159 | 112,482 | 63,144 | 455,113 | ||||||||||||||||||
|
|
|
|
|
|
|
|
|
|
|
| |||||||||||||
Total | 69,846 | 160,185 | 209,147 | 222,830 | 113,043 | 775,050 | ||||||||||||||||||
|
|
|
|
|
|
|
|
|
|
|
| |||||||||||||
| (1) | For the purpose of this table, the original exposure is shown net of credit risk adjustments and provisions reported in the COREP statements for credit risk under both the standardised and IRB approaches. Additionally, it includes equity credit risk and excludes securitisation exposures. |
EU CRB-E - Maturity of exposures (excluding counterparty credit risk) (Million Euros. 12-31-2019)
| Net exposure value(1) | ||||||||||||||||||||||||
Exposure Class | On demand | £ 1 year | > 1 year £ 5 years | > 5 years | No stated maturity | Total | ||||||||||||||||||
Central governments or central banks | — | 591 | 6,081 | 262 | 2,480 | 9,414 | ||||||||||||||||||
Institutions | 577 | 9,668 | 7,971 | 11,583 | 4,497 | 34,295 | ||||||||||||||||||
Corporates | 481 | 52,945 | 64,965 | 22,967 | 8,988 | 150,345 | ||||||||||||||||||
Retail | 7 | 2,049 | 6,624 | 83,415 | 24,332 | 116,427 | ||||||||||||||||||
Equity | — | — | — | — | 7,124 | 7,124 | ||||||||||||||||||
|
|
|
|
|
|
|
|
|
|
|
| |||||||||||||
Total IRB approach | 1,065 | 65,253 | 85,640 | 118,227 | 47,421 | 317,606 | ||||||||||||||||||
|
|
|
|
|
|
|
|
|
|
|
| |||||||||||||
Central governments or central banks | 25,424 | 14,468 | 30,707 | 50,840 | 888 | 122,327 | ||||||||||||||||||
Regional governments or local authorities | 9 | 640 | 2,113 | 7,800 | 6 | 10,568 | ||||||||||||||||||
Public sector entities | 84 | 814 | 182 | 516 | — | 1,595 | ||||||||||||||||||
Multilateral development banks | 54 | 83 | 16 | 15 | — | 167 | ||||||||||||||||||
International organisations | — | — | — | 0 | 0 | 0 | ||||||||||||||||||
Institutions | 4,303 | 9,503 | 4,727 | 1,234 | 3,973 | 23,738 | ||||||||||||||||||
Corporates | 5,538 | 35,147 | 48,740 | 18,648 | 694 | 108,766 | ||||||||||||||||||
Retail | 2,762 | 28,464 | 35,917 | 14,687 | 4,904 | 86,733 | ||||||||||||||||||
Secured by mortgages on immovable property | 231 | 4,595 | 4,062 | 30,739 | 11 | 39,638 | ||||||||||||||||||
Exposures in default | 51 | 767 | 64 | 1,625 | 1,096 | 3,602 | ||||||||||||||||||
Exposures associated with particularly high risk | 104 | 1,483 | 916 | 1,036 | 391 | 3,931 | ||||||||||||||||||
Covered bonds | — | — | — | — | — | — | ||||||||||||||||||
Claims on institutions and corporates with a short-term credit assesment | — | 6 | — | 4 | 10 | |||||||||||||||||||
Collective investments undertakings | 1 | 0 | — | — | — | 1 | ||||||||||||||||||
Equity exposures | — | — | — | — | — | — | ||||||||||||||||||
Other exposures | 4,053 | 5,495 | 24 | — | 11,447 | 21,018 | ||||||||||||||||||
|
|
|
|
|
|
|
|
|
|
|
| |||||||||||||
Total standardised approach | 42,613 | 101,465 | 127,467 | 127,138 | 23,412 | 422,096 | ||||||||||||||||||
|
|
|
|
|
|
|
|
|
|
|
| |||||||||||||
Total | 43,677 | 166,717 | 213,108 | 245,365 | 70,834 | 739,702 | ||||||||||||||||||
|
|
|
|
|
|
|
|
|
|
|
| |||||||||||||
| (1) | For the purpose of this table, the original exposure is shown net of credit risk adjustments and provisions reported in the COREP statements for credit risk under both the standardised and IRB approaches. Additionally, it includes equity credit risk and excludes securitisation exposures. |
| BBVA. PILLAR III 2020 | RISK | P. 51 |
3.2.3.3. Credit quality of exposures
The carrying amount of performing and non-performing exposures, broken down by product
and counterparty sector, as of December 31, 2020, is below. The information as of 2019 is also included for comparative purposes:
Table 16. EU CR1 - Performing and non-performing exposures and related provisions (Million Euros. 12-31-2020)
| Gross carrying amount/nominal amount | Accumulated impairment, accumulated negative changes in fair value due to credit risk and provisions | Collateral and financial | ||||||||||||||||||||||||||||||||||||||||||||||||||||||||||
| Performing exposures | Non-performing exposures | Performing exposures | Non-performing exposures | guarantees received | ||||||||||||||||||||||||||||||||||||||||||||||||||||||||
| Of which stage 1 | Of which stage 2 | Of which stage 2 | Of which stage 3 | Of which stage 1 | Of which stage 2 | Of which stage 2 | Of which stage 3 | Accumulated partial write-off | On performing exposures | On non- performing exposures | ||||||||||||||||||||||||||||||||||||||||||||||||||
Loans and advances | 329,513 | 298,940 | 30,572 | 14,684 | — | 14,684 | (4,331 | ) | (2,042 | ) | (2,289 | ) | (7,820 | ) | — | (7,820 | ) | 21,963 | 159,684 | 4,152 | ||||||||||||||||||||||||||||||||||||||||
Central banks | 6,229 | 6,229 | — | — | — | — | (20 | ) | (20 | ) | — | — | — | — | — | 479 | — | |||||||||||||||||||||||||||||||||||||||||||
General governments | 19,447 | 19,247 | 200 | 76 | — | 76 | (23 | ) | (14 | ) | (9 | ) | (25 | ) | — | (25 | ) | 36 | 4,477 | 19 | ||||||||||||||||||||||||||||||||||||||||
Credit institutions | 14,607 | 14,587 | 20 | 6 | — | 6 | (12 | ) | (10 | ) | (2 | ) | (2 | ) | — | (2 | ) | 4 | 237 | — | ||||||||||||||||||||||||||||||||||||||||
Other financial corporations | 9,347 | 9,252 | 95 | 14 | — | 14 | (32 | ) | (25 | ) | (6 | ) | (7 | ) | — | (7 | ) | 3 | 1,977 | — | ||||||||||||||||||||||||||||||||||||||||
Non-financial corporations | 135,720 | 120,542 | 15,178 | 7,476 | — | 7,476 | (1,882 | ) | (772 | ) | (1,110 | ) | (4,238 | ) | — | (4,238 | ) | 16,555 | 60,932 | 1,548 | ||||||||||||||||||||||||||||||||||||||||
Of which: SME | 50,784 | 44,160 | 6,624 | 4,150 | — | 4,150 | (960 | ) | (397 | ) | (563 | ) | (2,463 | ) | — | (2,463 | ) | 5,060 | 30,142 | 1,107 | ||||||||||||||||||||||||||||||||||||||||
Households | 144,163 | 129,082 | 15,080 | 7,113 | — | 7,113 | (2,361 | ) | (1,200 | ) | (1,161 | ) | (3,548 | ) | — | (3,548 | ) | 5,364 | 91,583 | 2,585 | ||||||||||||||||||||||||||||||||||||||||
Debt securities | 84,765 | 84,350 | 416 | 20 | — | 20 | (119 | ) | (75 | ) | (44 | ) | (16 | ) | — | (16 | ) | — | — | — | ||||||||||||||||||||||||||||||||||||||||
Central banks | 1,624 | 1,624 | — | — | — | — | (13 | ) | (13 | ) | — | — | — | — | — | — | — | |||||||||||||||||||||||||||||||||||||||||||
General governments | 69,339 | 68,934 | 405 | — | — | — | (93 | ) | (50 | ) | (43 | ) | — | — | — | — | — | — | ||||||||||||||||||||||||||||||||||||||||||
Credit institutions | 2,064 | 2,064 | — | — | — | — | (1 | ) | (1 | ) | — | — | — | — | — | — | — | |||||||||||||||||||||||||||||||||||||||||||
Other financial corporations | 7,429 | 7,424 | 5 | 19 | — | 19 | (9 | ) | (8 | ) | — | (15 | ) | — | (15 | ) | — | — | — | |||||||||||||||||||||||||||||||||||||||||
Non-financial corporations | 4,309 | 4,304 | 5 | 1 | — | 1 | (3 | ) | (3 | ) | (1 | ) | (1 | ) | — | (1 | ) | — | — | — | ||||||||||||||||||||||||||||||||||||||||
Off-balance-sheet exposures | 177,866 | 165,184 | 12,682 | 1,032 | — | 1,032 | (454 | ) | (239 | ) | (215 | ) | (274 | ) | — | (274 | ) | — | 7,021 | 103 | ||||||||||||||||||||||||||||||||||||||||
Central banks | 125 | 125 | — | — | — | — | — | — | — | — | — | — | — | — | — | |||||||||||||||||||||||||||||||||||||||||||||
General governments | 3,244 | 3,146 | 98 | 7 | — | 7 | (2 | ) | (1 | ) | (1 | ) | (3 | ) | — | (3 | ) | — | 46 | — | ||||||||||||||||||||||||||||||||||||||||
Credit institutions | 17,049 | 16,743 | 306 | 1 | — | 1 | (13 | ) | (11 | ) | (2 | ) | — | — | — | — | 2 | — | ||||||||||||||||||||||||||||||||||||||||||
Other financial corporations | 8,798 | 8,316 | 483 | — | — | — | (6 | ) | (6 | ) | — | — | — | — | — | 123 | — | |||||||||||||||||||||||||||||||||||||||||||
Non-financial corporations | 106,978 | 97,395 | 9,583 | 917 | — | 917 | (281 | ) | (110 | ) | (172 | ) | (258 | ) | — | (258 | ) | — | 6,525 | 100 | ||||||||||||||||||||||||||||||||||||||||
Households | 41,672 | 39,460 | 2,212 | 107 | — | 107 | (152 | ) | (112 | ) | (40 | ) | (13 | ) | — | (13 | ) | — | 325 | 3 | ||||||||||||||||||||||||||||||||||||||||
|
|
|
|
|
|
|
|
|
|
|
|
|
|
|
|
|
|
|
|
|
|
|
|
|
|
|
|
|
| |||||||||||||||||||||||||||||||
Total exposures December 2020 | 592,144 | 548,474 | 43,670 | 15,736 | — | 15,736 | (4,903 | ) | (2,355 | ) | (2,548 | ) | (8,110 | ) | — | (8,110 | ) | 21,963 | 166,705 | 4,255 | ||||||||||||||||||||||||||||||||||||||||
|
|
|
|
|
|
|
|
|
|
|
|
|
|
|
|
|
|
|
|
|
|
|
|
|
|
|
|
|
| |||||||||||||||||||||||||||||||
| (*) | Includes the carrying amount of reverse repurchase agreements and positions subject to the securitisation framework. Excluding the assets of BBVA USA and BBVA Paraguay, which are accounted for as non-current assets held for sale (see Note 1.3 of the Consolidated Financial Statements). |
| (**) | The Group’s general policy is to align the default and stage 3 concepts so that they are uniform at the management level. However, for portfolios where IRB models are used, there may be some differences due to the use of materiality thresholds on wholesale exposures by other prudential specifications. In any case, the Group estimates that the difference between these two concepts is not material on 31 December 2020 as it would not exceed 1% of the defaulted exposures. |
| BBVA. PILLAR III 2020 | RISK | P. 52 |
EU CR1 - Performing and non-performing exposures and related provisions (Million Euros. 12-31-2019)
| Gross carrying amount/nominal amount | Accumulated impairment, accumulated negative changes in fair value due to credit risk and provisions | Collateral and financial | ||||||||||||||||||||||||||||||||||||||||||||||||||||||||||
| Performing exposures | Non-performing exposures | Performing exposures | Non-performing exposures | guarantees received | ||||||||||||||||||||||||||||||||||||||||||||||||||||||||
| Of which stage 1 | Of which stage 2 | Of which stage 2 | Of which stage 3 | Of which stage 1 | Of which stage 2 | Of which stage 2 | Of which stage 3 | Accumulated partial write-off | On performing exposures | On non- performing exposures | ||||||||||||||||||||||||||||||||||||||||||||||||||
Loans and advances | 396,946 | 363,449 | 33,498 | 15,957 | — | 15,957 | (4,326 | ) | (2,143 | ) | (2,183 | ) | (8,092 | ) | — | (8,092 | ) | 26,206 | 181,867 | 5,132 | ||||||||||||||||||||||||||||||||||||||||
Central banks | 4,285 | 4,285 | — | — | — | — | (9 | ) | (9 | ) | — | — | — | — | 0 | 5 | — | |||||||||||||||||||||||||||||||||||||||||||
General governments | 28,787 | 28,105 | 682 | 88 | — | 88 | (38 | ) | (15 | ) | (22 | ) | (21 | ) | — | (21 | ) | 32 | 11,897 | 21 | ||||||||||||||||||||||||||||||||||||||||
Credit institutions | 13,519 | 13,361 | 158 | 6 | — | 6 | (11 | ) | (9 | ) | (3 | ) | (2 | ) | — | (2 | ) | 5 | 193 | — | ||||||||||||||||||||||||||||||||||||||||
Other financial corporations | 10,951 | 10,815 | 136 | 17 | — | 17 | (22 | ) | (19 | ) | (2 | ) | (10 | ) | — | (10 | ) | 3 | 3,385 | 1 | ||||||||||||||||||||||||||||||||||||||||
Non-financial corporations | 165,239 | 149,223 | 16,017 | 8,465 | — | 8,465 | (1,713 | ) | (808 | ) | (904 | ) | (4,748 | ) | — | (4,748 | ) | 17,064 | 55,548 | 2,003 | ||||||||||||||||||||||||||||||||||||||||
Of which: SME | 47,042 | 40,279 | 6,764 | 4,078 | — | 4,078 | (723 | ) | (331 | ) | (392 | ) | (2,259 | ) | — | (2,259 | ) | 4,820 | 20,602 | 1,301 | ||||||||||||||||||||||||||||||||||||||||
Households | 174,165 | 157,660 | 16,505 | 7,381 | — | 7,381 | (2,534 | ) | (1,282 | ) | (1,252 | ) | (3,312 | ) | — | (3,312 | ) | 9,102 | 110,839 | 3,107 | ||||||||||||||||||||||||||||||||||||||||
Debt securities | 77,534 | 77,178 | 356 | 34 | — | 34 | (135 | ) | (60 | ) | (75 | ) | (18 | ) | — | (18 | ) | — | — | — | ||||||||||||||||||||||||||||||||||||||||
Central banks | 1,015 | 1,015 | — | — | — | — | (5 | ) | (5 | ) | — | — | — | — | — | — | — | |||||||||||||||||||||||||||||||||||||||||||
General governments | 64,505 | 64,195 | 310 | — | — | — | (116 | ) | (44 | ) | (72 | ) | — | — | — | — | — | — | ||||||||||||||||||||||||||||||||||||||||||
Credit institutions | 1,057 | 1,057 | — | 0 | — | 0 | (0 | ) | (0 | ) | — | (0 | ) | — | (0 | ) | — | — | — | |||||||||||||||||||||||||||||||||||||||||
Other financial corporations | 7,851 | 7,823 | 28 | 33 | — | 33 | (12 | ) | (10 | ) | (2 | ) | (17 | ) | — | (17 | ) | — | — | — | ||||||||||||||||||||||||||||||||||||||||
Non-financial corporations | 3,106 | 3,088 | 18 | 1 | — | 1 | (2 | ) | (1 | ) | (1 | ) | (1 | ) | — | (1 | ) | — | — | — | ||||||||||||||||||||||||||||||||||||||||
Off-balance-sheet exposures | 179,717 | 169,265 | 10,452 | 1,001 | — | 1,001 | (443 | ) | (248 | ) | (196 | ) | (268 | ) | — | (268 | ) | — | 7,324 | 109 | ||||||||||||||||||||||||||||||||||||||||
Central banks | 2 | 2 | — | 0 | — | 0 | (0 | ) | (0 | ) | — | (0 | ) | — | (0 | ) | — | — | — | |||||||||||||||||||||||||||||||||||||||||
General governments | 3,756 | 3,672 | 84 | 7 | — | 7 | (2 | ) | (2 | ) | (0 | ) | (1 | ) | — | (1 | ) | — | 91 | — | ||||||||||||||||||||||||||||||||||||||||
Credit institutions | 18,689 | 18,422 | 267 | 1 | — | 1 | (5 | ) | (5 | ) | (1 | ) | (0 | ) | — | (0 | ) | — | 2 | — | ||||||||||||||||||||||||||||||||||||||||
Other financial corporations | 7,655 | 7,495 | 160 | 0 | — | 0 | (3 | ) | (3 | ) | (1 | ) | (0 | ) | — | (0 | ) | — | 66 | 0 | ||||||||||||||||||||||||||||||||||||||||
Non-financial corporations | 103,232 | 95,604 | 7,628 | 920 | — | 920 | (252 | ) | (111 | ) | (141 | ) | (254 | ) | — | (254 | ) | — | 6,774 | 106 | ||||||||||||||||||||||||||||||||||||||||
Households | 46,383 | 44,071 | 2,313 | 73 | — | 73 | (181 | ) | (128 | ) | (53 | ) | (12 | ) | — | (12 | ) | — | 391 | 4 | ||||||||||||||||||||||||||||||||||||||||
|
|
|
|
|
|
|
|
|
|
|
|
|
|
|
|
|
|
|
|
|
|
|
|
|
|
|
|
|
| |||||||||||||||||||||||||||||||
Total exposures December 2019 | 654,197 | 609,892 | 44,306 | 16,992 | — | 16,992 | (4,905 | ) | (2,451 | ) | (2,454 | ) | (8,378 | ) | — | (8,378 | ) | 26,206 | 189,191 | 5,242 | ||||||||||||||||||||||||||||||||||||||||
|
|
|
|
|
|
|
|
|
|
|
|
|
|
|
|
|
|
|
|
|
|
|
|
|
|
|
|
|
| |||||||||||||||||||||||||||||||
| (*) | Includes the carrying amount of reverse repurchase agreements and positions subject to the securitisation framework. Excluding the assets of BBVA USA and BBVA Paraguay, which are accounted for as non-current assets held for sale (see Note 1.3 of the Consolidated Financial Statements). |
| (**) | The Group’s general policy is to align the default and stage 3 concepts so that they are uniform at the management level. However, for portfolios where IRB models are used, there may be some differences due to the use of materiality thresholds on wholesale exposures by other prudential specifications. In any case, the Group estimates that the difference between these two concepts is not material on 31 December 2019 as it would not exceed 1% of the defaulted exposures. |
| BBVA. PILLAR III 2020 | 3. RISK | P. 53 |
The distribution by geographical area of total and non-performing exposures of financial assets and contingent risk
and commitments, as well as credit risk adjustments, as well as the impairment, is below:
Table 17. EU CQ4 - Credit quality of exposures by geography (Million Euros. 12-31-2020)
| Gross carrying amount(2)/nominal amount | ||||||||||||||||||||||||||||
| Of which: non performing | Of which: defaulted | Of which: subject to impairment(3) | Accumulated impairment | Provisions on off-balance sheet | Accumulated negative changes in fair value due to credit risk on non- performing exposures | |||||||||||||||||||||||
On balance expousures | 488,309 | 14,704 | 14,704 | 487,291 | (12,285 | ) | — | |||||||||||||||||||||
Spain | 239,786 | 7,826 | 7,826 | 239,650 | (5,365 | ) | — | |||||||||||||||||||||
Turkey | 73,056 | 1,791 | 1,791 | 72,846 | (2,220 | ) | — | |||||||||||||||||||||
Mexico | 50,602 | 2,842 | 2,842 | 49,998 | (2,240 | ) | — | |||||||||||||||||||||
USA | 18,043 | 32 | 32 | 17,975 | (44 | ) | — | |||||||||||||||||||||
South America | 49,521 | 1,744 | 1,744 | 49,520 | (1,997 | ) | — | |||||||||||||||||||||
Other areas(1) | 57,301 | 469 | 469 | 57,301 | (419 | ) | — | |||||||||||||||||||||
Off balance expousures | 178,898 | 1,032 | 1,032 | (728 | ) | |||||||||||||||||||||||
Spain | 52,907 | 536 | 536 | (224 | ) | |||||||||||||||||||||||
Turkey | 17,391 | 86 | 86 | (114 | ) | |||||||||||||||||||||||
Mexico | 15,480 | 210 | 210 | (246 | ) | |||||||||||||||||||||||
USA | 36,284 | 100 | 100 | (11 | ) | |||||||||||||||||||||||
South America | 10,357 | 82 | 82 | (98 | ) | |||||||||||||||||||||||
Other areas(1) | 46,479 | 19 | 19 | (35 | ) | |||||||||||||||||||||||
|
|
|
|
|
|
|
|
|
|
|
|
|
| |||||||||||||||
Total | 667,207 | 15,736 | 15,736 | 487,291 | (12,285 | ) | (728 | ) | — | |||||||||||||||||||
|
|
|
|
|
|
|
|
|
|
|
|
|
| |||||||||||||||
| (*) | Includes the carrying amount of reverse repurchase agreements and positions subject to the securitisation framework. Excluding the assets of BBVA USA and BBVA Paraguay, which are accounted for as non-current assets held for sale (see Note 1.3 of the Consolidated Financial Statements). |
| (1) | Includes all other countries not included on the previous columns. The countries with the greatest exposure in this area are: United Kingdom, France, Italy, Germany and Portugal. |
| (2) | Includes gross carrying amount of assets at amortised cost, assets at fair value through other comprehensive income and assets designated at fair value through profit and loss other than those held for trading. |
| (3) | Includes gross carrying amount of assets at amortised cost and assets at fair value through other comprehensive income. |
EU CQ4 - Credit quality of exposures by geography (Million Euros. 12-31-2019)
| Gross carrying amount(2)/nominal amount | ||||||||||||||||||||||||||||
| Of which: non performing | Of which: defaulted | Of which: subject to impairment(3) | Accumulated impairment | Provisions on off-balance sheet | Accumulated negative changes in fair value due to credit risk on non- performing exposures | |||||||||||||||||||||||
On balance expousures | 527,907 | 15,991 | 15,991 | 526,725 | (12,572 | ) | — | |||||||||||||||||||||
Spain | 207,925 | 8,107 | 8,107 | 207,276 | (4,946 | ) | — | |||||||||||||||||||||
Turkey | 75,033 | 1,478 | 1,478 | 74,951 | (2,017 | ) | — | |||||||||||||||||||||
Mexico | 55,628 | 3,238 | 3,238 | 55,183 | (2,460 | ) | — | |||||||||||||||||||||
USA | 90,258 | 682 | 682 | 90,258 | (704 | ) | — | |||||||||||||||||||||
South America | 48,831 | 1,851 | 1,851 | 48,830 | (1,908 | ) | — | |||||||||||||||||||||
Other areas(1) | 50,233 | 633 | 633 | 50,226 | (537 | ) | — | |||||||||||||||||||||
Off balance expousures | 180,718 | 1,001 | 1,001 | (711 | ) | |||||||||||||||||||||||
Spain | 52,127 | 530 | 530 | (195 | ) | |||||||||||||||||||||||
Turkey | 19,551 | 7 | 7 | (105 | ) | |||||||||||||||||||||||
Mexico | 16,901 | 242 | 242 | (181 | ) | |||||||||||||||||||||||
USA | 38,014 | 130 | 130 | (101 | ) | |||||||||||||||||||||||
South America | 11,783 | 73 | 73 | (101 | ) | |||||||||||||||||||||||
Other areas(1) | 42,342 | 19 | 19 | (28 | ) | |||||||||||||||||||||||
|
|
|
|
|
|
|
|
|
|
|
|
|
| |||||||||||||||
Total | 708,625 | 16,992 | 16,992 | 526,725 | (12,572 | ) | (711 | ) | — | |||||||||||||||||||
|
|
|
|
|
|
|
|
|
|
|
|
|
| |||||||||||||||
| (*) | Includes the carrying amount of reverse repurchase agreements and positions subject to the securitisation framework. Excluding the assets of BBVA USA and BBVA Paraguay, which are accounted for as non-current assets held for sale (see Note 1.3 of the Consolidated Financial Statements). |
| (1) | Includes all other countries not included on the previous columns. The countries with the greatest exposure in this area are: United Kingdom, France, Italy, Germany and Portugal. |
| (2) | Includes gross carrying amount of assets at amortised cost, assets at fair value through other comprehensive income and assets designated at fair value through profit and loss other than those held for trading. |
| (3) | Includes gross carrying amount of assets at amortised cost and assets at fair value through other comprehensive income. |
| BBVA. PILLAR III 2020 | 3. RISK | P. 54 |
The distribution by counterparty sector of total and non-performing exposures of loans and advances, as well as their impairment, are shown below:
Table 18. EU CQ5 - Credit quality of loans and advances by industry or counterparty types (Million Euros. 12-31-2020)
| Gross carrying amount(1)/nominal amount | ||||||||||||||||||||||||
| Of which: non performing | Of which: defaulted | Of which: subject to impairment(2) | Accumulated impairment | Accumulated negative changes in fair value due to credit risk on non- performing exposures | ||||||||||||||||||||
Agriculture, forestry and fishing | 3,438 | 132 | 132 | 3,438 | (108 | ) | — | |||||||||||||||||
Mining and quarrying | 4,349 | 47 | 47 | 4,349 | (59 | ) | — | |||||||||||||||||
Manufacturing | 33,811 | 1,486 | 1,486 | 33,771 | (1,129 | ) | — | |||||||||||||||||
Electricity, gas, steam and air conditioning supply | 13,490 | 591 | 591 | 13,490 | (509 | ) | — | |||||||||||||||||
Water supply | 899 | 17 | 17 | 899 | (15 | ) | — | |||||||||||||||||
Construction | 10,021 | 1,397 | 1,397 | 10,019 | (722 | ) | — | |||||||||||||||||
Wholesale and retail trade | 24,594 | 1,456 | 1,456 | 24,594 | (1,223 | ) | — | |||||||||||||||||
Transport and storage | 8,117 | 489 | 489 | 8,117 | (368 | ) | — | |||||||||||||||||
Accommodation and food service activities | 8,337 | 358 | 358 | 8,337 | (294 | ) | — | |||||||||||||||||
Information and communication | 6,179 | 73 | 73 | 5,764 | (60 | ) | — | |||||||||||||||||
Real estate activities | 5,289 | 123 | 123 | 5,289 | (132 | ) | — | |||||||||||||||||
Financial activities and insurance | 10,099 | 617 | 617 | 10,025 | (494 | ) | — | |||||||||||||||||
Professional, scientific and technical activities | 2,895 | 177 | 177 | 2,886 | (124 | ) | — | |||||||||||||||||
Administrative and support service activities | 4,031 | 142 | 142 | 4,031 | (192 | ) | — | |||||||||||||||||
Public administration and defence, compulsory social security | 129 | 5 | 5 | 129 | (4 | ) | — | |||||||||||||||||
Education | 665 | 54 | 54 | 665 | (43 | ) | — | |||||||||||||||||
Human health services and social work activities | 1,812 | 67 | 67 | 1,812 | (59 | ) | — | |||||||||||||||||
Arts, entertainment and recreation | 1,131 | 46 | 46 | 1,131 | (65 | ) | — | |||||||||||||||||
Other services | 3,911 | 198 | 198 | 3,911 | (521 | ) | — | |||||||||||||||||
|
|
|
|
|
|
|
|
|
|
|
| |||||||||||||
Total | 143,196 | 7,476 | 7,476 | 142,655 | (6,120 | ) | — | |||||||||||||||||
|
|
|
|
|
|
|
|
|
|
|
| |||||||||||||
| (*) | Includes the carrying amount of reverse repurchase agreements and positions subject to the securitisation framework. Excluding the assets of BBVA USA and BBVA Paraguay, which are accounted for as non-current assets held for sale (see Note 1.3 of the Consolidated Financial Statements). |
| (1) | Includes gross carrying amount of assets at amortised cost, assets at fair value through other comprehensive income and assets designated at fair value through profit and loss other than those held for trading. |
| (2) | Includes gross carrying amount of assets at amortised cost and assets at fair value through other comprehensive income. |
EU CQ5 - Credit quality of loans and advances by industry or counterparty types (Million Euros. 12-31-2019)
| Gross carrying amount(1)/nominal amount | ||||||||||||||||||||||||
| Of which: non performing | Of which: defaulted | Of which: subject to impairment(2) | Accumulated impairment | Accumulated negative changes in fair value due to credit risk on non- performing exposures | ||||||||||||||||||||
Agriculture, forestry and fishing | 3,758 | 154 | 154 | 3,758 | (124 | ) | — | |||||||||||||||||
Mining and quarrying | 4,669 | 100 | 100 | 4,669 | (86 | ) | — | |||||||||||||||||
Manufacturing | 39,517 | 1,711 | 1,711 | 39,517 | (1,242 | ) | — | |||||||||||||||||
Electricity, gas, steam and air conditioning supply | 12,305 | 684 | 684 | 12,305 | (575 | ) | — | |||||||||||||||||
Water supply | 900 | 14 | 14 | 900 | (16 | ) | — | |||||||||||||||||
Construction | 10,945 | 1,377 | 1,377 | 10,945 | (876 | ) | — | |||||||||||||||||
Wholesale and retail trade | 27,467 | 1,799 | 1,799 | 27,467 | (1,448 | ) | — | |||||||||||||||||
Transport and storage | 9,638 | 507 | 507 | 9,638 | (392 | ) | — | |||||||||||||||||
Accommodation and food service activities | 8,703 | 279 | 279 | 8,703 | (203 | ) | — | |||||||||||||||||
Information and communication | 6,761 | 95 | 95 | 6,316 | (65 | ) | — | |||||||||||||||||
Real estate activities | 6,856 | 191 | 191 | 6,856 | (139 | ) | — | |||||||||||||||||
Financial activities and insurance | 19,435 | 782 | 782 | 19,435 | (527 | ) | — | |||||||||||||||||
Professional, scientific and technical activities | 4,375 | 167 | 167 | 4,375 | (140 | ) | — | |||||||||||||||||
Administrative and support service activities | 3,428 | 118 | 118 | 3,428 | (134 | ) | — | |||||||||||||||||
Public administration and defence, compulsory social security | 282 | 5 | 5 | 282 | (6 | ) | — | |||||||||||||||||
Education | 903 | 41 | 41 | 903 | (38 | ) | — | |||||||||||||||||
Human health services and social work activities | 4,696 | 66 | 66 | 4,696 | (55 | ) | — | |||||||||||||||||
Arts, entertainment and recreation | 1,396 | 47 | 47 | 1,396 | (39 | ) | — | |||||||||||||||||
Other services | 7,672 | 329 | 329 | 7,658 | (356 | ) | — | |||||||||||||||||
|
|
|
|
|
|
|
|
|
|
|
| |||||||||||||
Total | 173,704 | 8,465 | 8,465 | 173,247 | (6,460 | ) | — | |||||||||||||||||
|
|
|
|
|
|
|
|
|
|
|
| |||||||||||||
| (*) | Includes the carrying amount of reverse repurchase agreements and positions subject to the securitisation framework. Excluding the assets of BBVA USA and BBVA Paraguay, which are accounted for as non-current assets held for sale (see Note 1.3 of the Consolidated Financial Statements). |
| (1) | Includes gross carrying amount of assets at amortised cost, assets at fair value through other comprehensive income and assets designated at fair value through profit and loss other than those held for trading. |
| (2) | Includes gross carrying amount of assets at amortised cost and assets at fair value through other comprehensive income. |
| BBVA. PILLAR III 2020 | 3. RISK | P. 55 |
The distribution of the gross carrying amount of performing and non-performing exposures of loans and debt securities by residual maturity is shown in the following table, which includes the amounts as of December 31, 2020 and the main figures as of December 31, 2019 for comparative purposes only:
Table 19. EU CQ3 - Credit quality of performing and non-performing exposures by past due days (Million Euros. 12-31-2020)
| Gross carrying amount/nominal amount | ||||||||||||||||||||||||||||||||||||||||||||||||
| Performing exposures | Non-performing exposures | |||||||||||||||||||||||||||||||||||||||||||||||
| Not past due or past due £ 30 days | Past due > 30 days £ 90 days |
| Unlikely to pay that are not past due or are past due £ 90 days | Past due > 90 days £ 180 days | Past due > 180 days £ 1 year | Past due > 1 year £ 2 years | Past due > 2 years £ 5 years | Past due > 5 years £ 7 years | Past due > 7 years | Of which defaulted | |||||||||||||||||||||||||||||||||||||
Loans and advances | 329,513 | 327,647 | 1,866 | 14,684 | 7,800 | 1,251 | 948 | 1,972 | 2,393 | 179 | 141 | 14,684 | ||||||||||||||||||||||||||||||||||||
Central banks | 6,229 | 6,229 | — | — | — | — | — | — | — | — | — | — | ||||||||||||||||||||||||||||||||||||
General governments | 19,447 | 19,444 | 3 | 76 | 53 | — | 1 | 2 | 3 | — | 17 | 76 | ||||||||||||||||||||||||||||||||||||
Credit institutions | 14,607 | 14,607 | — | 6 | 4 | 2 | — | — | — | — | — | 6 | ||||||||||||||||||||||||||||||||||||
Other financial corporations | 9,347 | 9,346 | 1 | 14 | 6 | 7 | — | — | 1 | — | — | 14 | ||||||||||||||||||||||||||||||||||||
Non-financial corporations | 135,720 | 135,310 | 410 | 7,476 | 4,102 | 322 | 413 | 995 | 1,443 | 113 | 88 | 7,476 | ||||||||||||||||||||||||||||||||||||
Of which: SME | 50,784 | 50,590 | 194 | 4,150 | 1,714 | 246 | 269 | 655 | 1,144 | 92 | 29 | 4,150 | ||||||||||||||||||||||||||||||||||||
Households | 144,163 | 142,710 | 1,453 | 7,113 | 3,635 | 921 | 534 | 976 | 945 | 65 | 36 | 7,113 | ||||||||||||||||||||||||||||||||||||
Debt securities | 84,765 | 84,765 | — | 20 | 17 | 3 | — | — | — | — | — | 20 | ||||||||||||||||||||||||||||||||||||
Central banks | 1,624 | 1,624 | — | — | — | — | — | — | — | — | — | — | ||||||||||||||||||||||||||||||||||||
General governments | 69,339 | 69,339 | — | — | — | — | — | — | — | — | — | — | ||||||||||||||||||||||||||||||||||||
Credit institutions | 2,064 | 2,064 | — | — | — | — | — | — | — | — | — | — | ||||||||||||||||||||||||||||||||||||
Other financial corporations | 7,429 | 7,429 | — | 19 | 16 | 3 | — | — | — | — | — | 19 | ||||||||||||||||||||||||||||||||||||
Non-financial corporations | 4,309 | 4,309 | — | 1 | 1 | — | — | — | — | — | — | 1 | ||||||||||||||||||||||||||||||||||||
Off-balance-sheet exposures | 177,866 | — | — | 1,032 | — | — | — | — | — | — | — | 1,032 | ||||||||||||||||||||||||||||||||||||
Central banks | 125 | — | — | — | — | — | — | — | — | — | — | — | ||||||||||||||||||||||||||||||||||||
General governments | 3,244 | — | — | 7 | — | — | — | — | — | — | — | 7 | ||||||||||||||||||||||||||||||||||||
Credit institutions | 17,049 | — | — | 1 | — | — | — | — | — | — | — | 1 | ||||||||||||||||||||||||||||||||||||
Other financial corporations | 8,798 | — | — | — | — | — | — | — | — | — | — | — | ||||||||||||||||||||||||||||||||||||
Non-financial corporations | 106,978 | — | — | 917 | — | — | — | — | — | — | — | 917 | ||||||||||||||||||||||||||||||||||||
Households | 41,672 | — | — | 107 | — | — | — | — | �� | — | — | — | 107 | |||||||||||||||||||||||||||||||||||
|
|
|
|
|
|
|
|
|
|
|
|
|
|
|
|
|
|
|
|
|
|
|
| |||||||||||||||||||||||||
Total exposures December 2020 | 592,144 | 412,412 | 1,866 | 15,736 | 7,817 | 1,254 | 948 | 1,972 | 2,393 | 179 | 141 | 15,736 | ||||||||||||||||||||||||||||||||||||
|
|
|
|
|
|
|
|
|
|
|
|
|
|
|
|
|
|
|
|
|
|
|
| |||||||||||||||||||||||||
| (*) | Includes the carrying amount of reverse repurchase agreements and positions subject to the securitisation framework. Excluding the assets of BBVA USA and BBVA Paraguay, which are accounted for as non-current assets held for sale (see Note 1.3 of the Consolidated Financial Statements). |
| BBVA. PILLAR III 2020 | 3. RISK | P. 56 |
EU CQ3 - Credit quality of performing and non-performing exposures by past due days (Million Euros. 12-31-2019)
| Gross carrying amount/nominal amount | ||||||||||||||||||||||||||||||||||||||||||||||||
| Performing exposures | Non-performing exposures | |||||||||||||||||||||||||||||||||||||||||||||||
| Not past due or past due £ 30 days | Past due > 30 days £ 90 days |
| Unlikely to pay that are not past due or are past due £ 90 days | Past due > 90 days £ 180 days | Past due > 180 days £ 1 year | Past due > 1 year £ 2 years | Past due > 2 years £ 5 years | Past due > 5 years £ 7 years | Past due > 7 years | Of which defaulted | |||||||||||||||||||||||||||||||||||||
Loans and advances | 396,946 | 393,722 | 3,224 | 15,957 | 8,107 | 1,323 | 1,930 | 2,329 | 1,970 | 148 | 149 | 15,957 | ||||||||||||||||||||||||||||||||||||
Central banks | 4,285 | 4,285 | — | — | — | — | — | — | — | — | — | — | ||||||||||||||||||||||||||||||||||||
General governments | 28,787 | 28,783 | 4 | 88 | 61 | 1 | 2 | 3 | 2 | 4 | 16 | 88 | ||||||||||||||||||||||||||||||||||||
Credit institutions | 13,519 | 13,518 | 1 | 6 | 4 | 2 | 0 | 0 | — | — | — | 6 | ||||||||||||||||||||||||||||||||||||
Other financial corporations | 10,951 | 10,950 | 1 | 17 | 9 | 5 | 1 | 0 | 2 | — | — | 17 | ||||||||||||||||||||||||||||||||||||
Non-financial corporations | 165,239 | 164,549 | 691 | 8,465 | 4,433 | 396 | 914 | 1,400 | 1,152 | 83 | 86 | 8,465 | ||||||||||||||||||||||||||||||||||||
Of which: SME | 47,042 | 46,624 | 418 | 4,078 | 1,719 | 203 | 504 | 878 | 719 | 23 | 31 | 4,078 | ||||||||||||||||||||||||||||||||||||
Households | 174,165 | 171,638 | 2,527 | 7,381 | 3,600 | 918 | 1,012 | 926 | 815 | 62 | 48 | 7,381 | ||||||||||||||||||||||||||||||||||||
Debt securities | 77,534 | 77,534 | — | 34 | 31 | 3 | — | — | — | — | — | 34 | ||||||||||||||||||||||||||||||||||||
Central banks | 1,015 | 1,015 | — | — | — | — | — | — | — | — | — | — | ||||||||||||||||||||||||||||||||||||
General governments | 64,505 | 64,505 | — | — | — | — | — | — | — | — | — | — | ||||||||||||||||||||||||||||||||||||
Credit institutions | 1,057 | 1,057 | — | 0 | 0 | — | — | — | — | — | — | 0 | ||||||||||||||||||||||||||||||||||||
Other financial corporations | 7,851 | 7,851 | — | 33 | 30 | 3 | — | — | — | — | — | 33 | ||||||||||||||||||||||||||||||||||||
Non-financial corporations | 3,106 | 3,106 | — | 1 | 1 | — | — | — | — | — | — | 1 | ||||||||||||||||||||||||||||||||||||
Off-balance-sheet exposures | 179,717 | — | — | 1,001 | — | — | — | — | — | — | — | 1,001 | ||||||||||||||||||||||||||||||||||||
Central banks | 2 | — | — | 0 | — | — | — | — | — | — | — | 0 | ||||||||||||||||||||||||||||||||||||
General governments | 3,756 | — | — | 7 | — | — | — | — | — | — | — | 7 | ||||||||||||||||||||||||||||||||||||
Credit institutions | 18,689 | — | — | 1 | — | — | — | — | — | — | — | 1 | ||||||||||||||||||||||||||||||||||||
Other financial corporations | 7,655 | — | — | 0 | — | — | — | — | — | — | — | 0 | ||||||||||||||||||||||||||||||||||||
Non-financial corporations | 103,232 | — | — | 920 | — | — | — | — | — | — | — | 920 | ||||||||||||||||||||||||||||||||||||
Households | 46,383 | — | — | 73 | — | — | — | — | — | — | — | 73 | ||||||||||||||||||||||||||||||||||||
|
|
|
|
|
|
|
|
|
|
|
|
|
|
|
|
|
|
|
|
|
|
|
| |||||||||||||||||||||||||
Total exposures December 2019 | 654,197 | 471,256 | 3,224 | 16,992 | 8,138 | 1,325 | 1,930 | 2,329 | 1,970 | 148 | 149 | 16,992 | ||||||||||||||||||||||||||||||||||||
|
|
|
|
|
|
|
|
|
|
|
|
|
|
|
|
|
|
|
|
|
|
|
| |||||||||||||||||||||||||
| (*) | Includes the carrying amount of reverse repurchase agreements and positions subject to the securitisation framework. Excluding the assets of BBVA USA and BBVA Paraguay, which are accounted for as non-current assets held for sale (see Note 1.3 of the Consolidated Financial Statements). |
3.2.3.4. Impairment losses in the period
The breakdown of impairment losses on financial assets and
contingent risk and commitments, as well as transfers to written-off recorded directly in the income statement in 2020 and 2019 is below:
Table 20. EU CR2-A - Changes in the stock of general and specific credit risk adjustments (Million Euros. 12-31-2020)
Accumulated credit risk adjustment(1) | ||||
Opening balance | 13,396 | |||
|
| |||
Increases due to origination and acquisition | 1,571 | |||
Decrease due to derecognition repayments and disposals | (1,444 | ) | ||
Changes due to change in credit risk (net) | 3,699 | |||
Changes due to modifications without derecognition (net) | 283 | |||
Changes due to update in the institution’s methodology for estimation (net) | — | |||
Decrease in allowance account due to write-offs | (2,568 | ) | ||
Other adjustments | (1,924 | ) | ||
|
| |||
Closing balance | 13,013 | |||
Recoveries on credit risk adjustments recorded directly to the statement of profit or loss | (338 | ) | ||
Specific credit risk adjustments recorded directly to the statement of profit or loss | 314 | |||
| (1) | The closing balance excludes the impairment losses of BBVA USA and BBVA Paraguay which are included in “Other adjustments” (see section 1.1.3). |
Regarding the flow statements of non-performing loans, fixed income and guarantees given between December 31, 2019 and December 31, 2020 are included in Note 7.2.5 of Consolidated Financial Statements of BBVA Group.
A table with a general overview of forborne exposures is shown below, which includes the amounts as of December 31, 2020 and the main figures as of December 31, 2019 for comparative purposes only:
| BBVA. PILLAR III 2020 | 3. RISK | P. 57 |
Table 21. EU CQ1 - Credit quality of forborne exposures (Million Euros. 12-31-2020)
| Gross carrying amount/nominal amount of exposures with forbearance measures | Accumulated impairment, accumulated negative changes in fair value due to credit risk and provisions | Collateral received and financial guarantees received on forborne exposures | ||||||||||||||||||||||||||||||
| Non-performing forborne | ||||||||||||||||||||||||||||||||
| Performing forborne |
| Of which defaulted | Of which impaired | On performing forborne exposures | On non- performing forborne exposures | Of which collateral and financial guarantees received on non- performing exposures with forbearance measures | ||||||||||||||||||||||||||
Loans and advances | 7,659 | 9,040 | 9,040 | 9,040 | (759 | ) | (4,100 | ) | 7,408 | 3,149 | ||||||||||||||||||||||
Central banks | — | — | — | — | — | — | — | — | ||||||||||||||||||||||||
General governments | 83 | 56 | 56 | 56 | (3 | ) | (12 | ) | 45 | 14 | ||||||||||||||||||||||
Credit institutions | — | — | — | — | — | — | — | — | ||||||||||||||||||||||||
Other financial corporations | 2 | 2 | 2 | 2 | — | — | 1 | — | ||||||||||||||||||||||||
Non-financial corporations | 2,996 | 5,023 | 5,023 | 5,023 | (372 | ) | (2,565 | ) | 2,638 | 1,158 | ||||||||||||||||||||||
Households | 4,579 | 3,958 | 3,958 | 3,958 | (384 | ) | (1,522 | ) | 4,725 | 1,977 | ||||||||||||||||||||||
Debt Securities | — | — | — | — | — | — | — | — | ||||||||||||||||||||||||
Loan commitments given | 182 | 57 | 57 | 57 | (4 | ) | (4 | ) | 1 | 1 | ||||||||||||||||||||||
|
|
|
|
|
|
|
|
|
|
|
|
|
|
|
| |||||||||||||||||
Total exposures December 2020 | 7,841 | 9,097 | 9,097 | 9,097 | (763 | ) | (4,104 | ) | 7,409 | 3,150 | ||||||||||||||||||||||
|
|
|
|
|
|
|
|
|
|
|
|
|
|
|
| |||||||||||||||||
| (*) | Includes the carrying amount of reverse repurchase agreements and positions subject to the securitisation framework. Excluding the assets of BBVA USA and BBVA Paraguay, which are accounted for as non-current assets held for sale (see Note 1.3 of the Consolidated Financial Statements). |
EU CQ1 - Credit quality of forborne exposures (Million Euros. 12-31-2019)
| Gross carrying amount/nominal amount of exposures with forbearance measures | Accumulated impairment, accumulated negative changes in fair value due to credit risk and provisions | Collateral received and financial guarantees received on forborne exposures | ||||||||||||||||||||||||||||||
| Non-performing forborne | ||||||||||||||||||||||||||||||||
| Performing forborne |
| Of which defaulted | Of which impaired | On performing forborne exposures | On non- performing forborne exposures | Of which collateral and financial guarantees received on non- performing exposures with forbearance measures | ||||||||||||||||||||||||||
Loans and advances | 6,888 | 9,350 | 9,350 | 9,350 | (623 | ) | (4,164 | ) | 7,304 | 3,423 | ||||||||||||||||||||||
Central banks | — | — | — | — | — | — | — | — | ||||||||||||||||||||||||
General governments | 96 | 62 | 62 | 62 | (3 | ) | (7 | ) | 49 | 16 | ||||||||||||||||||||||
Credit institutions | — | — | — | — | — | — | — | — | ||||||||||||||||||||||||
Other financial corporations | 1 | 5 | 5 | 5 | (0 | ) | (4 | ) | 1 | 1 | ||||||||||||||||||||||
Non-financial corporations | 2,853 | 5,235 | 5,235 | 5,235 | (294 | ) | (2,722 | ) | 2,417 | 1,185 | ||||||||||||||||||||||
Households | 3,938 | 4,048 | 4,048 | 4,048 | (326 | ) | (1,431 | ) | 4,838 | 2,221 | ||||||||||||||||||||||
Debt Securities | — | — | — | — | — | — | — | — | ||||||||||||||||||||||||
Loan commitments given | 134 | 45 | 45 | 45 | (5 | ) | (7 | ) | — | — | ||||||||||||||||||||||
|
|
|
|
|
|
|
|
|
|
|
|
|
|
|
| |||||||||||||||||
Total exposures December 2019 | 7,022 | 9,395 | 9,395 | 9,395 | (628 | ) | (4,172 | ) | 7,304 | 3,423 | ||||||||||||||||||||||
|
|
|
|
|
|
|
|
|
|
|
|
|
|
|
| |||||||||||||||||
| (*) | Includes the carrying amount of reverse repurchase agreements and positions subject to the securitisation framework. Excluding the assets of BBVA USA and BBVA Paraguay, which are accounted for as non-current assets held for sale (see Note 1.3 of the Consolidated Financial Statements). |
The collateral obtained by taking possession and execution processes as of December 31, 2020 are shown below,
distinguishing between collateral classified as property, plant and equipment and other types of collateral:
Table 22. EU CQ7 - Collateral obtained by taking possession and execution processes (Million Euros)
| 12-31-2020 | 12-31-2019 | |||||||||||||||
| Collateral obtained | Collateral obtained | |||||||||||||||
| Value at initial recognition(1) | Accumulated negative changes(2) | Value at initial recognition(1) | Accumulated negative changes(2) | |||||||||||||
Property, plant and equipment (PP&E) | — | — | 641 | — | ||||||||||||
Other than PP&E | 3,028 | (853 | ) | 2,996 | (738 | ) | ||||||||||
Residential immovable property | 1,504 | (371 | ) | 1,438 | (377 | ) | ||||||||||
Commercial Immovable property | 367 | (135 | ) | 348 | (152 | ) | ||||||||||
Movable property (auto, shipping, etc.) | 23 | (11 | ) | 1 | (0 | ) | ||||||||||
Equity and debt instruments | 1,074 | (279 | ) | 1,177 | (209 | ) | ||||||||||
Other | 60 | (57 | ) | 31 | — | |||||||||||
|
|
|
|
|
|
|
| |||||||||
Total | 3,028 | (853 | ) | 3,637 | (738 | ) | ||||||||||
|
|
|
|
|
|
|
| |||||||||
| (*) | Includes the carrying amount of reverse repurchase agreements and positions subject to the securitisation framework. Excluding the assets of BBVA USA and BBVA Paraguay, which are accounted for as non-current assets held for sale (see Note 1.3 of the Consolidated Financial Statements). |
| (1) | Value at initial recognition: the gross carrying amount of the collateral obtained by taking possession at initial recognition in the balance sheet. |
| (2) | Accumulated negative changes: accumulated impairment or accumulated negative changes to the initial recognition value of the collateral obtained by taking possession. |
| BBVA. PILLAR III 2020 | RISK | P. 58 |
3.2.3.5. Public guarantees and moratorium programmes in response to COVID-19 crisis
Information about public guarantees and moratorium schemes, introduced by the governments in response to COVID-19 crisis is shown below. For further information on these programmes, refer to Note 7.2 of the Consolidated Financial Statements of BBVA Group:Information on the standardised approach.
Table 23. Information on loans and advances subject to to legislative and non-legislative moratoria (Million euros. 12-31-2020)
| Gross carrying amount | Accumulated impairment, accumulated negative changes in fair value due to credit risk | Gross carriyng amount | ||||||||||||||||||||||||||||||||||||||||||||||||||||||||||
| Performing | Non Performing | Performing | Non performing | |||||||||||||||||||||||||||||||||||||||||||||||||||||||||
| Of which: exposures with forbearance measures | Of which: Instruments with significant increase in credit risk since initial recognition but not credit-impaired (Stage 2) | Of which: exposures with forbearance measures | Of which: Unlikely to pay that are not past-due or past-due <= 90 days | Of which: exposures with forbearance measures | Of which: Instruments with significant increase in credit risk since initial recognition but not credit- impaired (Stage 2) | Of which: exposures with forbearance measures | Of which: Unlikely to pay that are not past-due or past-due <= 90 days | Inflows to non- performing exposures | ||||||||||||||||||||||||||||||||||||||||||||||||||||
Loans and advances subject to moratorium | 6,803 | 6,265 | 1,311 | 3,049 | 538 | 488 | 502 | (582 | ) | (457 | ) | (257 | ) | (427 | ) | (126 | ) | (104 | ) | (106 | ) | 59 | ||||||||||||||||||||||||||||||||||||||
of which: Households | 4,657 | 4,179 | 614 | 1,874 | 478 | 447 | 464 | (267 | ) | (166 | ) | (42 | ) | (149 | ) | (100 | ) | (86 | ) | (91 | ) | 35 | ||||||||||||||||||||||||||||||||||||||
of which: Collateralised by residential immovable property | 3,664 | 3,248 | 441 | 1,421 | 417 | 406 | 411 | (169 | ) | (93 | ) | (24 | ) | (88 | ) | (76 | ) | (74 | ) | (74 | ) | 21 | ||||||||||||||||||||||||||||||||||||||
of which: Non-financial corporations | 2,086 | 2,026 | 697 | 1,175 | 60 | 41 | 37 | (315 | ) | (290 | ) | (215 | ) | (278 | ) | (26 | ) | (18 | ) | (15 | ) | 25 | ||||||||||||||||||||||||||||||||||||||
of which: Small and Medium-sized Enterprises | 1,031 | 983 | 217 | 544 | 48 | 34 | 30 | (145 | ) | (126 | ) | (70 | ) | (118 | ) | (19 | ) | (15 | ) | (11 | ) | 21 | ||||||||||||||||||||||||||||||||||||||
of which: Collateralised by commercial immovable property | 918 | 886 | 213 | 416 | 31 | 21 | 22 | (101 | ) | (92 | ) | (60 | ) | (86 | ) | (9 | ) | (6 | ) | (6 | ) | 10 | ||||||||||||||||||||||||||||||||||||||
| (*) | For more information on loans subject to moratoria, see note 7.2 of the Consolidated Financial Statements of BBVA Group. |
Table 24. Breakdown of loans and advances subject to legislative and non-legislative moratoria by residual maturity of moratoria (Million Euros. 12-31-2020)
| Gross carrying amount | ||||||||||||||||||||||||||||||||||||
| Number of obligors(1) | Of which: legislative moratoria | Of which: expired | Residual maturity of moratoria | |||||||||||||||||||||||||||||||||
| <= 3 months | > 3 months <= 6 months | > 6 months <= 9 months | > 9 months <= 12 months | > 1 year | |||||||||||||||||||||||||||||||
Loans and advances for which moratorium was offered | 2,866,628 | 35,150 | ||||||||||||||||||||||||||||||||||
Loans and advances subject to moratorium (granted) | 2,843,977 | 33,828 | 30,101 | 27,025 | 3,173 | 1,987 | 1,415 | 213 | 15 | |||||||||||||||||||||||||||
of which: Households | 21,333 | 17,628 | 16,676 | 1,835 | 1,612 | 1,113 | 98 | — | ||||||||||||||||||||||||||||
of which: Collateralised by residential immovable property | 12,387 | 9,148 | 8,723 | 1,005 | 1,490 | 1,074 | 95 | — | ||||||||||||||||||||||||||||
of which: Non-financial corporations | 12,237 | 12,217 | 10,151 | 1,309 | 357 | 289 | 115 | 15 | ||||||||||||||||||||||||||||
of which: Small and Medium-sized Enterprises | 6,087 | 6,086 | 5,056 | 644 | 94 | 199 | 85 | 9 | ||||||||||||||||||||||||||||
of which: Collateralised by commercial immovable property | 2,511 | 2,503 | 1,593 | 548 | 38 | 228 | 92 | 12 | ||||||||||||||||||||||||||||
| (1) | For further information on loans subject to moratorium measures, see note 7.2 of the Group’s Consolidated Annual Accounts |
Table 25. Information on new loans and advances subject to public guarantee schemes introduced in response to the COVID-19 crisis (12-31-2020. Million euros)
| Gross carrying amount | Maximum amount of collateral that can be considered | Gross carrying amount | ||||||||||||||
| of which: forborne | Public guarantees received | Inflows to non-performing exposures | ||||||||||||||
Newly originated loans and advances subject to public guarantee schemes | 18,619 | 170 | 15,242 | 60 | ||||||||||||
of which: Households | 1,237 | 3 | ||||||||||||||
of which: Collateralised by residential immovable property | 1 | — | ||||||||||||||
of which: Non-financial corporations | 17,303 | 168 | 14,163 | 57 | ||||||||||||
of which: Small and medium-sized enterprises | 11,373 | 39 | ||||||||||||||
of which: Collateralised by commercial immovable property | 4 | 0 | ||||||||||||||
| (*) | For further information on loans under public guarantee programmes, see note 7.2 of the Group’s Consolidated Financial Statements. |
| BBVA. PILLAR III 2020 | 3. RISK | P. 59 |
3.2.4. Information on the standardised approach
3.2.4.1. Identification of external rating agencies
The external credit assessment institutions (ECAIs) appointed by the Group to determine the risk weightings applicable to its exposure are as follows: Standard&Poors, Moodys, Fitch and DBRS.
The exposure for which the ratings of ECAI are used are those corresponding to wholesale portfolios, basically those involving “Sovereigns and central banks” in developed countries, and “Financial Institutions”.
In cases where a counterparty has ratings from different ECAIs, the Group follows the procedure laid down in Article 138 of the Solvency Regulations, which specifies the order of priority to be used in the assignment of ratings.
When two different credit ratings made by designated ECAIs are available for a rated exposure, the higher risk weighting will be applied. However, when there are more than two credit ratings for the same rated exposure, use is to be made of the two credit ratings that provide the lowest risk weightings. If the two lowest risk weightings coincide, then that weighting will be applied; if they do not coincide, the higher of the two will be applied.
The correspondence between the alphanumeric scale of each agency used and the risk categories used by the Group are defined in the Final Draft Implementing Technical Standards on the mapping of ECAIs credit assessment under Article 136(1) and (3) of Regulation (EU) No. 575/2013; complying with the provisions of Article 136 of the CRR.
3.2.4.2. Assignment of the credit ratings to public share issues
The number of cases and the amount of these assignments are not relevant for the Group in terms of credit admission and issuer risk management.
3.2.4.3. Exposure values before and after the application of credit risk mitigation techniques
The original exposure net of value adjustments and provisions, exposure after risk mitigation techniques, and RWA density for each exposure category, according to the standardised approach, are shown below, excluding securitisation and counterparty credit risk exposure, which is presented in Section 3.2.6 of this Report.
Table 26. EU CR4 - Standardised approach - credit risk exposure and credit risk mitigation effects (Million Euros. 12-31-2020)
| Exposures before CCF and CRM(1) | Exposures post- CCF and CRM(2) | RWA(3) and RWA Density | ||||||||||||||||||||||
Exposure Class | On-balance sheet amount | Off-balance sheet amount | On-balance sheet amount | Off-balance sheet amount | RWA | RWA Density | ||||||||||||||||||
Central governments or central banks | 159,908 | 3,740 | 202,956 | 2,709 | 29,227 | 14 | % | |||||||||||||||||
Regional governments or local authorities | 18,791 | 857 | 6,880 | 326 | 2,316 | 32 | % | |||||||||||||||||
Public sector entities | 1,195 | 298 | 1,525 | 157 | 690 | 41 | % | |||||||||||||||||
Multilateral development banks | 232 | 38 | 302 | — | 7 | 2 | % | |||||||||||||||||
International Organisations | — | — | — | — | — | — | ||||||||||||||||||
Institutions | 12,604 | 13,851 | 12,698 | 1,661 | 7,014 | 49 | % | |||||||||||||||||
Corporates | 69,279 | 31,594 | 62,616 | 15,387 | 75,827 | 97 | % | |||||||||||||||||
Retail | 53,759 | 26,629 | 46,005 | 2,979 | 34,337 | 70 | % | |||||||||||||||||
Secured by mortgages on immovable property | 34,472 | 218 | 34,433 | 180 | 12,769 | 37 | % | |||||||||||||||||
Exposures in default | 3,911 | 172 | 3,847 | 112 | 4,480 | 113 | % | |||||||||||||||||
Exposures associated with particularly high risk | 3,104 | 426 | 2,988 | 137 | 4,687 | 150 | % | |||||||||||||||||
Covered bonds | — | — | — | — | — | — | ||||||||||||||||||
Institutions and corporates with a short term credit assessment | 1 | — | 1 | — | 1 | 87 | % | |||||||||||||||||
Collective Investment Undertakings | — | 5 | — | 3 | 3 | 100 | % | |||||||||||||||||
Equity | — | — | — | — | — | — | ||||||||||||||||||
Other Items | 20,030 | — | 19,964 | 425 | 12,120 | 59 | % | |||||||||||||||||
|
|
|
|
|
|
|
|
|
|
|
| |||||||||||||
Total | 377,286 | 77,828 | 394,215 | 24,077 | 183,479 | 44 | % | |||||||||||||||||
|
|
|
|
|
|
|
|
|
|
|
| |||||||||||||
| (1) | Net OE: original exposure net of value adjustments and provisions. |
| (2) | EAD: original exposure net of value adjustments and provisions after CRM and CCF. |
| (3) | RWAs: EAD after risk-weighting. |
| BBVA. PILLAR III 2020 | 3. RISK | P. 60 |
EU CR4 - Standardised approach - credit risk exposure and credit risk mitigation effects (Million Euros. 12-31-2019)
| Exposures before CCF and CRM (1) | Exposures post- CCF and CRM(2) | RWA(3) and RWA Density | ||||||||||||||||||||||
Exposure Class | On-balance sheet amount | Off-balance sheet amount | On- balance sheet amount | Off-balance sheet amount | RWA | RWA Density | ||||||||||||||||||
Central governments or central banks | 117,878 | 4,449 | 146,001 | 654 | 29,629 | 20 | % | |||||||||||||||||
Regional governments or local authorities | 9,512 | 1,056 | 6,827 | 271 | 1,643 | 23 | % | |||||||||||||||||
Public sector entities | 1,383 | 212 | 1,504 | 137 | 714 | 43 | % | |||||||||||||||||
Multilateral development banks | 130 | 38 | 210 | — | 11 | 5 | % | |||||||||||||||||
International Organisations | — | — | — | — | — | — | ||||||||||||||||||
Institutions | 10,202 | 13,536 | 10,239 | 1,063 | 4,725 | 42 | % | |||||||||||||||||
Corporates | 75,447 | 33,319 | 71,354 | 17,058 | 86,058 | 97 | % | |||||||||||||||||
Retail | 56,081 | 30,653 | 52,060 | 2,755 | 38,451 | 70 | % | |||||||||||||||||
Secured by mortgages on immovable property | 39,471 | 167 | 39,423 | 138 | 14,983 | 38 | % | |||||||||||||||||
Exposures in default | 3,273 | 330 | 3,197 | 225 | 3,806 | 111 | % | |||||||||||||||||
Exposures associated with particularly high risk | 3,502 | 428 | 3,285 | 107 | 5,088 | 150 | % | |||||||||||||||||
Covered bonds | — | — | — | — | — | — | ||||||||||||||||||
Institutions and corporates with a short term credit assessment | 1 | — | 1 | — | 1 | 96 | % | |||||||||||||||||
Collective Investment Undertakings | 6 | 4 | 4 | 3 | 7 | 100 | % | |||||||||||||||||
Equity | — | — | — | — | — | 0 | % | |||||||||||||||||
Other Items | 21,018 | — | 21,211 | 496 | 12,767 | 59 | % | |||||||||||||||||
|
|
|
|
|
|
|
|
|
|
|
| |||||||||||||
Total | 337,904 | 84,191 | 355,316 | 22,907 | 197,882 | 52 | % | |||||||||||||||||
|
|
|
|
|
|
|
|
|
|
|
| |||||||||||||
| (1) | Net OE: original exposure net of value adjustments and provisions. |
| (2) | EAD: original exposure net of value adjustments and provisions after CRM and CCF. |
| (3) | RWAs: EAD after risk-weighting. |
In addition, the following tables show the exposure net of provisions, before and after the application of credit risk mitigation techniques by risk weights and exposure categories under the standardised approach, excluding securitisation positions and counterparty credit risk exposure.
Exposure net of provisions and after applying CCF and CRM related to counterparty credit risk are shown in table EU CCR3 of Section 3.2.6 of this report.
| BBVA. PILLAR III 2020 | RISK | P. 61 |
Table 27. Standardised approach: exposure values before application of credit risk mitigation techinques (Million Euros. 12-31-2020)
| Risk Weight | Total credit exposures amount | Of which: | ||||||||||||||||||||||||||||||||||||||||||||||||||||||||||||||||||
Exposure Class | 0% | 2% | 4% | 10% | 20% | 35% | 50% | 70% | 75% | 100% | 150% | 250% | 370% | 1250% | Others | pre-CRM) | unrated(1) | |||||||||||||||||||||||||||||||||||||||||||||||||||
Central Government or central banks | 131,891 | — | — | — | 6,501 | — | 4,612 | — | — | 16,541 | 660 | 3,441 | — | — | — | 163,647 | 60,006 | |||||||||||||||||||||||||||||||||||||||||||||||||||
Regional government or local authorities | 526 | — | — | — | 14,806 | — | 1,181 | — | — | 3,136 | — | — | — | — | — | 19,648 | 16,891 | |||||||||||||||||||||||||||||||||||||||||||||||||||
Public sector entities | — | — | — | — | 561 | — | 654 | — | — | 278 | — | — | — | — | — | 1,494 | 1,034 | |||||||||||||||||||||||||||||||||||||||||||||||||||
Multilateral development banks | 218 | — | — | — | — | — | 52 | — | — | — | — | — | — | — | — | 270 | 229 | |||||||||||||||||||||||||||||||||||||||||||||||||||
International Organisations | — | — | — | — | — | — | — | — | — | — | — | — | — | — | — | — | — | |||||||||||||||||||||||||||||||||||||||||||||||||||
Institutions | — | 280 | — | — | 18,089 | — | 2,941 | — | — | 5,062 | 83 | — | — | — | — | 26,455 | 24,326 | |||||||||||||||||||||||||||||||||||||||||||||||||||
Corporates | — | — | — | — | 57 | — | 808 | — | — | 98,776 | 1,231 | — | — | — | — | 100,873 | 99,478 | |||||||||||||||||||||||||||||||||||||||||||||||||||
Retail | — | — | — | — | — | — | — | — | 80,388 | — | — | — | — | — | — | 80,388 | 80,388 | |||||||||||||||||||||||||||||||||||||||||||||||||||
Secured by mortgages on immovable property | — | — | — | — | — | 30,065 | 3,552 | — | 846 | 228 | — | — | — | — | — | 34,690 | 34,690 | |||||||||||||||||||||||||||||||||||||||||||||||||||
Exposures in default | — | — | — | — | — | — | — | — | — | 2,973 | 1,110 | — | — | — | — | 4,083 | 4,083 | |||||||||||||||||||||||||||||||||||||||||||||||||||
Exposures associated with particularly high risk | — | — | — | — | — | — | — | — | — | — | 3,531 | — | — | — | — | 3,531 | 3,531 | |||||||||||||||||||||||||||||||||||||||||||||||||||
Covered bonds | — | — | — | — | — | — | — | — | — | — | — | — | — | — | — | — | — | |||||||||||||||||||||||||||||||||||||||||||||||||||
Institutions and corporates with a short-term credit assessment | — | — | — | — | — | — | — | — | — | 1 | — | — | — | — | — | 1 | 1 | |||||||||||||||||||||||||||||||||||||||||||||||||||
Collective investment undertakings | — | — | — | — | — | — | — | — | — | 5 | — | — | — | — | — | 5 | 5 | |||||||||||||||||||||||||||||||||||||||||||||||||||
Other Items | 7,280 | — | — | — | — | — | — | — | — | 12,750 | — | — | — | — | — | 20,030 | 20,030 | |||||||||||||||||||||||||||||||||||||||||||||||||||
Equity | — | — | — | — | — | — | — | — | — | — | — | — | — | — | — | — | — | |||||||||||||||||||||||||||||||||||||||||||||||||||
|
|
|
|
|
|
|
|
|
|
|
|
|
|
|
|
|
|
|
|
|
|
|
|
|
|
|
|
|
|
|
|
|
| |||||||||||||||||||||||||||||||||||
Total | 139,916 | 280 | — | — | 40,015 | 30,065 | 13,798 | — | 81,233 | 139,748 | 6,617 | 3,441 | — | — | — | 455,113 | 344,692 | |||||||||||||||||||||||||||||||||||||||||||||||||||
|
|
|
|
|
|
|
|
|
|
|
|
|
|
|
|
|
|
|
|
|
|
|
|
|
|
|
|
|
|
|
|
|
| |||||||||||||||||||||||||||||||||||
| (1) | Of which: Unrated refers to exposure for which no credit rating from designated ECAIs is available. |
Standardised approach: exposure values before application of credit risk mitigation techinques (Million Euros. 12-31-2019)
| Risk Weight | Total credit exposures amount | Of which: | ||||||||||||||||||||||||||||||||||||||||||||||||||||||||||||||||||
Exposure Class | 0% | 2% | 4% | 10% | 20% | 35% | 50% | 70% | 75% | 100% | 150% | 250% | 370% | 1250% | Others | pre-CRM) | unrated (1) | |||||||||||||||||||||||||||||||||||||||||||||||||||
Central Government or central banks | 90,680 | — | — | — | 4,536 | — | 5,923 | — | — | 17,045 | 872 | 3,271 | — | — | — | 122,327 | 51,205 | |||||||||||||||||||||||||||||||||||||||||||||||||||
Regional government or local authorities | 244 | — | — | — | 6,827 | — | 3,360 | — | — | 136 | — | — | — | — | — | 10,568 | 9,110 | |||||||||||||||||||||||||||||||||||||||||||||||||||
Public sector entities | — | — | — | — | 672 | — | 634 | — | — | 289 | 1 | — | — | — | — | 1,595 | 1,092 | |||||||||||||||||||||||||||||||||||||||||||||||||||
Multilateral development banks | 77 | — | — | — | 90 | — | — | — | — | — | — | — | — | — | — | 167 | 114 | |||||||||||||||||||||||||||||||||||||||||||||||||||
International Organisations | 0 | — | — | — | — | — | — | — | — | — | — | — | — | — | — | — | — | |||||||||||||||||||||||||||||||||||||||||||||||||||
Institutions | — | 250 | — | — | 6,292 | — | 15,024 | — | — | 2,152 | 21 | — | — | — | — | 23,738 | 20,511 | |||||||||||||||||||||||||||||||||||||||||||||||||||
Corporates | — | 399 | — | — | 142 | — | 2,935 | — | — | 104,209 | 1,081 | — | — | — | — | 108,766 | 107,315 | |||||||||||||||||||||||||||||||||||||||||||||||||||
Retail | — | — | — | — | — | — | — | — | 84,589 | 2,145 | — | — | — | — | — | 86,733 | 86,601 | |||||||||||||||||||||||||||||||||||||||||||||||||||
Secured by mortgages on immovable property | — | — | — | — | — | 33,296 | 4,898 | — | 810 | 634 | — | — | — | — | — | 39,638 | 39,634 | |||||||||||||||||||||||||||||||||||||||||||||||||||
Exposures in default | — | — | — | — | — | — | — | — | — | 2,797 | 805 | — | — | — | — | 3,602 | 3,596 | |||||||||||||||||||||||||||||||||||||||||||||||||||
Exposures associated with particularly high risk | — | — | — | — | — | — | — | — | — | — | 3,931 | — | — | — | — | 3,931 | 3,931 | |||||||||||||||||||||||||||||||||||||||||||||||||||
Covered bonds | — | — | — | — | — | — | — | — | — | — | — | — | — | — | — | — | — | |||||||||||||||||||||||||||||||||||||||||||||||||||
Institutions and corporates with a short-term credit assessment | — | — | — | — | 0 | — | — | — | — | 1 | — | — | — | — | — | 1 | — | |||||||||||||||||||||||||||||||||||||||||||||||||||
Collective investment undertakings | — | — | — | — | — | — | — | — | — | 10 | — | — | — | — | — | 10 | 10 | |||||||||||||||||||||||||||||||||||||||||||||||||||
Other Items | 7,484 | — | — | — | 6 | — | — | — | — | 13,527 | 0 | — | — | — | — | 21,018 | 20,941 | |||||||||||||||||||||||||||||||||||||||||||||||||||
Equity | — | — | — | — | — | — | — | — | — | — | — | — | — | — | — | — | — | |||||||||||||||||||||||||||||||||||||||||||||||||||
|
|
|
|
|
|
|
|
|
|
|
|
|
|
|
|
|
|
|
|
|
|
|
|
|
|
|
|
|
|
|
|
|
| |||||||||||||||||||||||||||||||||||
Total | 98,485 | 649 | — | — | 18,566 | 33,296 | 32,774 | — | 85,398 | 142,946 | 6,711 | 3,271 | — | — | — | 422,096 | 344,060 | |||||||||||||||||||||||||||||||||||||||||||||||||||
|
|
|
|
|
|
|
|
|
|
|
|
|
|
|
|
|
|
|
|
|
|
|
|
|
|
|
|
|
|
|
|
|
| |||||||||||||||||||||||||||||||||||
| (1) | Of which: Unrated refers to exposures for which no credit rating from designated ECAIs is available. |
| BBVA. PILLAR III 2020 | RISK | P. 62 |
Table 28. EU CR5 - Standardised approach: exposure values after application of credit risk mitigation techniques (Million Euros. 12-31-2020)
| Risk Weight | Total credit exposures amount | Of which: | ||||||||||||||||||||||||||||||||||||||||||||||||||||||||||||||||||
Exposure Class | 0% | 2% | 4% | 10% | 20% | 35% | 50% | 70% | 75% | 100% | 150% | 250% | 370% | 1250% | Others | pre-CRM) | unrated(1) | |||||||||||||||||||||||||||||||||||||||||||||||||||
Central Government or central banks | 176,481 | — | — | — | 3,752 | — | 4,797 | — | — | 16,534 | 660 | 3,441 | — | — | — | 205,665 | 59,394 | |||||||||||||||||||||||||||||||||||||||||||||||||||
Regional government or local authorities | 1 | — | — | — | 5,582 | — | 847 | — | — | 776 | — | — | — | — | — | 7,206 | 2,032 | |||||||||||||||||||||||||||||||||||||||||||||||||||
Public sector entities | — | — | — | — | 905 | — | 534 | — | — | 242 | — | — | — | — | — | 1,681 | 643 | |||||||||||||||||||||||||||||||||||||||||||||||||||
Multilateral development banks | 288 | — | — | — | — | — | 14 | — | — | — | — | — | — | — | — | 302 | 229 | |||||||||||||||||||||||||||||||||||||||||||||||||||
International Organisations | — | — | — | — | — | — | — | — | — | — | — | — | — | — | — | — | — | |||||||||||||||||||||||||||||||||||||||||||||||||||
Institutions | — | 280 | — | — | 7,826 | — | 1,701 | — | — | 4,472 | 80 | — | — | — | — | 14,359 | 12,720 | |||||||||||||||||||||||||||||||||||||||||||||||||||
Corporates | — | — | — | — | 50 | — | 498 | — | — | 76,550 | 904 | — | — | — | — | 78,003 | 76,329 | |||||||||||||||||||||||||||||||||||||||||||||||||||
Retail | — | — | — | — | — | — | — | — | 48,984 | — | — | — | — | — | — | 48,984 | 48,984 | |||||||||||||||||||||||||||||||||||||||||||||||||||
Secured by mortgages on immovable property | — | — | — | — | — | 30,049 | 3,506 | — | 844 | 215 | — | — | — | — | — | 34,614 | 34,614 | |||||||||||||||||||||||||||||||||||||||||||||||||||
Exposures in default | — | — | — | — | — | — | — | — | — | 2,917 | 1,042 | — | — | — | — | 3,959 | 3,959 | |||||||||||||||||||||||||||||||||||||||||||||||||||
Exposures associated with particularly high risk | — | — | — | — | — | — | — | — | — | — | 3,125 | — | — | — | — | 3,125 | 3,125 | |||||||||||||||||||||||||||||||||||||||||||||||||||
Covered bonds | — | — | — | — | — | — | — | — | — | — | — | — | — | — | — | — | — | |||||||||||||||||||||||||||||||||||||||||||||||||||
Institutions and corporates with a short-term credit assessment | — | — | — | — | — | — | — | — | — | 1 | — | — | — | — | — | 1 | 1 | |||||||||||||||||||||||||||||||||||||||||||||||||||
Collective investment undertakings | — | — | — | — | — | — | — | — | — | 3 | — | — | — | — | — | 3 | 3 | |||||||||||||||||||||||||||||||||||||||||||||||||||
Other Items | 8,269 | — | — | — | — | — | — | — | — | 12,120 | — | — | — | — | — | 20,389 | 20,389 | |||||||||||||||||||||||||||||||||||||||||||||||||||
Equity | — | — | — | — | — | — | — | — | — | — | — | — | — | — | — | — | — | |||||||||||||||||||||||||||||||||||||||||||||||||||
|
|
|
|
|
|
|
|
|
|
|
|
|
|
|
|
|
|
|
|
|
|
|
|
|
|
|
|
|
|
|
|
|
| |||||||||||||||||||||||||||||||||||
Total | 185,038 | 280 | — | — | 18,116 | 30,049 | 11,895 | — | 49,829 | 113,831 | 5,812 | 3,441 | — | — | — | 418,291 | 262,422 | |||||||||||||||||||||||||||||||||||||||||||||||||||
|
|
|
|
|
|
|
|
|
|
|
|
|
|
|
|
|
|
|
|
|
|
|
|
|
|
|
|
|
|
|
|
|
| |||||||||||||||||||||||||||||||||||
| (1) | Of which: Unrated refers to exposure for which no credit rating from designated ECAIs is available |
EU CR5 - Standardised approach: exposure values after application of credit risk mitigation techniques (Million Euros. 12-31-2019)
| Risk Weight | Total credit exposures amount | Of which: | ||||||||||||||||||||||||||||||||||||||||||||||||||||||||||||||||||
Exposure Class | 0% | 2% | 4% | 10% | 20% | 35% | 50% | 70% | 75% | 100% | 150% | 250% | 370% | 1250% | Others | pre-CRM) | unrated(1) | |||||||||||||||||||||||||||||||||||||||||||||||||||
Central Government or central banks | 118,530 | — | — | — | 1,230 | — | 5,708 | — | — | 17,044 | 872 | 3,271 | — | — | — | 146,655 | 50,520 | |||||||||||||||||||||||||||||||||||||||||||||||||||
Regional government or local authorities | 1 | — | — | — | 6,579 | — | 381 | — | — | 136 | — | — | — | — | — | 7,098 | 7,075 | |||||||||||||||||||||||||||||||||||||||||||||||||||
Public sector entities | — | — | — | — | 798 | — | 578 | — | — | 264 | 1 | — | — | — | — | 1,641 | 497 | |||||||||||||||||||||||||||||||||||||||||||||||||||
Multilateral development banks | 157 | — | — | — | 53 | — | — | — | — | — | — | — | — | — | — | 210 | 114 | |||||||||||||||||||||||||||||||||||||||||||||||||||
International Organisations | 0 | — | — | — | — | — | — | — | — | — | — | — | — | — | — | 0 | 0 | |||||||||||||||||||||||||||||||||||||||||||||||||||
Institutions | — | 250 | — | — | 5,757 | — | 3,474 | — | — | 1,802 | 19 | — | — | — | — | 11,302 | 8,756 | |||||||||||||||||||||||||||||||||||||||||||||||||||
Corporates | — | — | — | — | 34 | — | 1,895 | — | — | 85,656 | 828 | — | — | — | — | 88,412 | 86,955 | |||||||||||||||||||||||||||||||||||||||||||||||||||
Retail | — | — | — | — | — | — | — | — | 54,814 | — | — | — | — | — | — | 54,814 | 54,682 | |||||||||||||||||||||||||||||||||||||||||||||||||||
Secured by mortgages on immovable property | — | — | — | — | — | 33,285 | 4,843 | — | 804 | 629 | — | — | — | — | — | 39,561 | 39,558 | |||||||||||||||||||||||||||||||||||||||||||||||||||
Exposures in default | — | — | — | — | — | — | — | — | — | 2,655 | 767 | — | — | — | — | 3,423 | 3,423 | |||||||||||||||||||||||||||||||||||||||||||||||||||
Exposures associated with particularly high risk | — | — | — | — | — | — | — | — | — | — | 3,392 | — | — | — | — | 3,392 | 3,392 | |||||||||||||||||||||||||||||||||||||||||||||||||||
Covered bonds | — | — | — | — | — | — | — | — | — | — | — | — | — | — | — | — | — | |||||||||||||||||||||||||||||||||||||||||||||||||||
Institutions and corporates with a short-term credit assessment | — | — | — | — | 0 | — | — | — | — | 1 | — | — | — | — | — | 1 | 0 | |||||||||||||||||||||||||||||||||||||||||||||||||||
Collective investment undertakings | — | — | — | — | — | — | — | — | — | 7 | — | — | — | — | — | 7 | 7 | |||||||||||||||||||||||||||||||||||||||||||||||||||
Other Items | 8,935 | — | — | — | 6 | — | — | — | — | 12,765 | 0 | — | — | — | — | 21,707 | 21,707 | |||||||||||||||||||||||||||||||||||||||||||||||||||
Equity | — | — | — | — | — | — | — | — | — | — | — | — | — | — | — | — | — | |||||||||||||||||||||||||||||||||||||||||||||||||||
|
|
|
|
|
|
|
|
|
|
|
|
|
|
|
|
|
|
|
|
|
|
|
|
|
|
|
|
|
|
|
|
|
| |||||||||||||||||||||||||||||||||||
Total | 127,622 | 250 | — | — | 14,458 | 33,285 | 16,879 | — | 55,618 | 120,959 | 5,880 | 3,271 | — | — | — | 378,222 | 276,846 | |||||||||||||||||||||||||||||||||||||||||||||||||||
|
|
|
|
|
|
|
|
|
|
|
|
|
|
|
|
|
|
|
|
|
|
|
|
|
|
|
|
|
|
|
|
|
| |||||||||||||||||||||||||||||||||||
| (1) | Of which: Unrated refers to exposure for which no credit rating from designated ECAIs is available |
| BBVA. PILLAR III 2020 | 3. RISK | P. 63 |
The following table shows the flow statements of credit and counterparty credit risk RWA under standardised approach during the fourth quarter of 2020:
Table 29. RWA flow statements of credit risk exposures under the standardised approach (Million Euros)
| Credit Risk | Counterparty Credit Risk | Total | ||||||||||||||||||||||
| RWA amounts | Capital Requirements | RWA amounts | Capital Requirements | RWA amounts | Capital requirements | |||||||||||||||||||
RWAs as of September 30, 2020 | 179,907 | 14,393 | 3,612 | 289 | 183,519 | 14,682 | ||||||||||||||||||
|
|
|
|
|
|
|
|
|
|
|
| |||||||||||||
Asset size | 5,602 | 448 | (14 | ) | (1 | ) | 5,588 | 447 | ||||||||||||||||
Asset quality | (97 | ) | (8 | ) | (8 | ) | (1 | ) | (105 | ) | (8 | ) | ||||||||||||
Model updates | — | — | — | — | — | — | ||||||||||||||||||
Methodology and policy | — | — | — | — | — | — | ||||||||||||||||||
Acquisitions and disposals | — | — | — | — | — | — | ||||||||||||||||||
Foreign exchange movements | (1,933 | ) | (155 | ) | (493 | ) | (39 | ) | (2,426 | ) | (194 | ) | ||||||||||||
Other | — | — | — | — | — | — | ||||||||||||||||||
|
|
|
|
|
|
|
|
|
|
|
| |||||||||||||
RWAs as of December 31, 2020 | 183,479 | 14,678 | 3,097 | 248 | 186,576 | 14,926 | ||||||||||||||||||
|
|
|
|
|
|
|
|
|
|
|
| |||||||||||||
Regarding credit risk RWA (ex-FX effect) under standardised approach, the fourth quarter figures reveal a wide deviation of roughly €5,590 million, mostly due to the great spike in Corporates, Retail and Institutions (with emphaseis in Turkey and Mexico), in addition to a noticeable upswing in Sovereign exposures (mostly in Turkey, Perú and Colombia).
Regarding the effect of the exchange rate, the credit risk RWA in the portfolios under the standard method have fallen by €2,425 million euros, mainly due to the depreciation of the US dollar (-5%) and to a lesser extent by the depreciation of the Argentine peso and the Peruvian sol that completely neutralize the impact of the appreciation registered in the Mexican peso.
The full annual serie of flow statements related to credit risk under the standard approach is available in the editable file “Pillar III 2020 – Tables & Annexes”.
3.2.5. Information on the IRB approach
3.2.5.1. General information
3.2.5.1.1. Authorisation by the supervisor to use the IRB approach
The following are the models authorised by the supervisor for use in the calculation of regulatory capital requirements.
Table 30. Models authorised by the supervisor for the purpose of their use in the calculation of capital requirements (12-31-2020)
Institution Portfolio | Portfolio | Number of | Model description | |||
| BBVA S.A. | Financial institutions | 4 | 1 Rating, 1 PD model, 1 LGD model, 1 EAD model | |||
| Public institutions | 5 | 1 Rating, 1 PD model, 2 LGD models, 1 EAD model | ||||
| Specialised finance | 2 | 1 Slotting criteria, 1 EAD model | ||||
| Developers | 4 | 1 Rating, 1 PD model, 1 LGD model, 1 EAD model | ||||
| Small Corporates | 5 | 1 Rating, 1 PD model, 2 LGD models, 1 EAD model | ||||
| Medium-sized Corporates | 5 | 1 Rating, 1 PD model, 2 LGD models, 1 EAD model | ||||
| Large Corporates | 5 | 1 Rating, 1 PD model, 2 LGD models, 1 EAD model | ||||
| Mortgages | 6 | 2 Scorings, 2 PD models, 1 LGD model, 1 EAD model | ||||
| Consumer finance | 5 | 2 Scorings, 2 PD models, 1 LGD model | ||||
| Credit cards | 10 | 2 Scorings, 2 PD models, 3 LGD models, 3 EAD models | ||||
| Automobiles | 4 | 2 Scorings, 1 PD model, 1 LGD model | ||||
| BBVA Bancomer |
Retail Revolving (Credit Cards) |
11 |
4 Scorings, 5 PD models, 1 LGD model, 1 EAD model | |||
| Large Corporates | 5 | 1 Rating, 1 PD model, 2 LGD models, 1 EAD model | ||||
| Medium-sized Corporates | 5 | 1 Rating, 1 PD model, 2 LGD models, 1 EAD model | ||||
| Grupo BBVA | Equity | 1 | 1 capital model | |||
| BBVA. PILLAR III 2020 | 3. RISK | P. 64 |
The following chart shows the distribution of exposures at default (EAD) related to credit risk and counterparty credit risk
by model for each exposure category, as of December, 31, 2020:
Chart 6. Distribution of EAD by Exposure Category and Method for Credit and Counterparty Risk
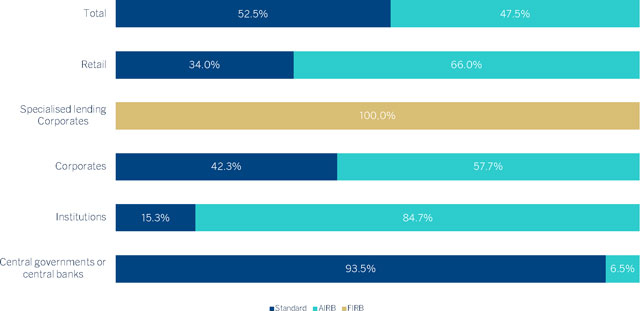
| (*) | Regulatory credit risk exposure categories other than those included in the chart is subjet to standardised approach |
The main types of rating models used in the IRB portfolios are ratings for wholesale portfolios and proactive and reactive scorings in the case of retail portfolios.
The rating models give contracts/customers a score that orders customers according to their credit quality. This score is determined by the characteristics of the transactions, economic and financial conditions of the customer, information on payment behavior, credit bureau, etc.
The approval of the models by the supervisor includes both own estimations of the probability of default (PD), loss given default (LGD) and the internal estimation of credit conversion factors (CCFs).
The Group continues with the development of a new rollout plan that increases the coverage of IRB models.
3.2.5.1.2. Structure of internal rating systems and relationship between internal and external ratings
The Group has rating tools for each exposure category listed in the Basel Agreement.
The retail portfolio has scoring tools for determining the credit quality of transactions on the basis of information on the transaction itself and on the customer. The scoring models are algorithms calculated using statistical methods that score each transaction. This score reflects the transaction’s level of risk and is in direct relation to its probability of default (PD).
These decision models are the basic tool to decide who should receive a loan and the amount to be granted, thereby contributing to both the arrangement and management of retail-type loans.
For the wholesale portfolio, the Group has rating tools that, unlike scorings, do not assess transactions but rather customers. The Group has different tools for rating the various customer segments: small companies, corporates, government and the public sector, etc. In those wholesale portfolios where the number of defaults is very low (sovereign risk, corporates, financial institutions) the internal information is supplemented by the benchmarks of external rating agencies.
The PD estimates made by the Group are transferred to the Master Scale, enabling a comparison to be made with the scales used by external agencies.
| BBVA. PILLAR III 2020 | 3. RISK | P. 65 |
Table 31. Master Scale of BBVA’s rating (12-31-2020)
External rating | Internal rating | Probability of default (basic points) | ||||||||||||||
Standard & Poor’s List | Reduced List (22 groups) | Average | Minimum from >= | Maximum | ||||||||||||
AAA | AAA | 1 | 0 | 2 | ||||||||||||
AA+ | AA+ | 2 | 2 | 3 | ||||||||||||
AA | AA | 3 | 3 | 4 | ||||||||||||
AA- | AA- | 4 | 4 | 5 | ||||||||||||
A+ | A+ | 5 | 5 | 6 | ||||||||||||
A | A | 8 | 6 | 9 | ||||||||||||
A- | A- | 10 | 9 | 11 | ||||||||||||
BBB+ | BBB+ | 14 | 11 | 17 | ||||||||||||
BBB | BBB | 20 | 17 | 24 | ||||||||||||
BBB- | BBB- | 31 | 24 | 39 | ||||||||||||
BB+ | BB+ | 51 | 39 | 67 | ||||||||||||
BB | BB | 88 | 67 | 116 | ||||||||||||
BB- | BB- | 150 | 116 | 194 | ||||||||||||
B+ | B+ | 255 | 194 | 335 | ||||||||||||
B | B | 441 | 335 | 581 | ||||||||||||
B- | B- | 785 | 581 | 1,061 | ||||||||||||
CCC+ | CCC+ | 1,191 | 1,061 | 1,336 | ||||||||||||
CCC | CCC | 1,500 | 1,336 | 1,684 | ||||||||||||
CCC- | CCC- | 1,890 | 1,684 | 2,121 | ||||||||||||
CC+ | CC+ | 2,381 | 2,121 | 2,673 | ||||||||||||
CC | CC | 3,000 | 2,673 | 3,367 | ||||||||||||
CC- | CC- | 3,780 | 3,367 | 4,243 | ||||||||||||
3.2.5.1.3. Use of internal estimates for purposes other than the calculation of regulatory capital requirements
The Group’s internal estimates are a critical component of management based on value creation, giving rise to criteria for assessing the risk-return trade-off.
These measures have a broad range of uses, from the adoption of strategic business decisions through to the individual admission of transactions.
Specifically, internal estimates are used in everyday business in support of credit risk management through their inclusion in admission and monitoring processes, as well as in the pricing of transactions.
The management use of performance metrics that consider expected loss, economic capital and risk-adjusted return enables the monitoring of portfolios and the assessment of non-performing positions, among others.
3.2.5.1.4. Process for managing and recognizing the effects of credit risk mitigation
Mitigation is an iterative process whose purpose is to recognize the benefits of the existence of collateral and guarantees, ordering them from the highest to the lowest credit quality.
The Group uses risk mitigation techniques for exposure pertaining to the wholesale portfolio by replacing the debtor’s PD with that of the guarantor, in cases in which the latter is eligible and its PD is lower than the debtor’s. In retail admission processes the guarantor is included in the scoring itself.
Collateral in IRB models is recognised through the LGD and must meet eligibility criteria based on maturity and minimum exposure coverage, and making the necessary adjustments depending on the type of existing collateral, financial or real.
3.2.5.1.5. Control mechanisms for internal rating models
The Group has a management framework for rating models that includes all the phases of its life cycle: from the time when a need that triggers the construction or modification of a model is identified, through to its use and monitoring.
Appropriate monitoring allows detection of unexpected behavior, identification of incorrect use and even anticipation when changes in the risk profile of the portfolios or products require corrective action to be taken. The monitoring of the risk rating models is performed with a frequency that is appropriate to the nature of the model, the availability of new data, modeling techniques and the importance of its use in management. This is analysed from a twofold perspective: performance and use.
The aim of performance monitoring is to detect deficiencies in the performance of the rating models for risk anticipating its possible deterioration over time. It allows us to determine if these systems work correctly, helping to verify that the model components work as expected. The monitoring performance framework can identify weaknesses and establish the plans of action needed to ensure correct operation. This analytical framework, a fundamental component of risk model planning, sets out the minimum criteria to be taken into account, as well as the metrics and thresholds that make it possible to flag unwanted behaviors.
| BBVA. PILLAR III 2020 | 3. RISK | P. 66 |
The purpose of the use monitoring is to verify that the model is used generally, in the way it was intended, and appropriately. This control mechanism allows continued detection of deviations from the planned use of models, as well as the establishment of action plans for their correction.
Additionally, the Group has an area independent of the developers and users of the rating models and the departments responsible for their monitoring, whose main function is to perform an effective contrast to the models used, in order to guarantee their accuracy, robustness and stability.
This review process is not restricted as to the time of approval, or the inclusion of changes in the models, but rather is framed within a plan that allows for a periodic evaluation of them, resulting in the issuance of recommendations and mitigating actions for the deficiencies identified.
The various aspects to be improved and detected during the review process, carried out by this independent area, are reflected in the validation reports by setting recommendations. These reports are presented to the appropriate Risk Committees, together with the status of the action plans associated with the recommendations, to ensure their resolution and the proper operation of the rating models at any time.
3.2.5.1.6. Description of the internal rating process
There follows a description of the internal rating process by type of customer:
| • | Central banks and central governments: For this segment, the assignment of ratings is made by the Risk units appointed for this purpose, which periodically analyze this type of customer, rating them according to the parameters included in the corresponding rating model. There are 3 different methodologies currently in use for allocating country ratings: (i) ratings from external agencies, used for developed countries, emerging countries with elevated incomes and emerging countries where the Group has little risk; (ii) internal rating based on a proprietary tool used for emerging countries where the Group has an appreciable risk; and lastly (iii) the country risk scores published by the Belgian export credit agency (which manages the quantitative model used by the OECD to assign its country risk scores) for countries of marginal importance for the Group that have no external ratings. Sovereign ratings are generated in local and foreign currency for all countries, as well as a transfer rating, which evaluates the risk of inconvertibility/transfer restrictions. In the case of emerging countries where BBVA subsidiaries or branches are present, the rating in local currency is adjusted to the rating obtained by the emerging countries tool under the authorisation of the Risk Committee assigned for this purpose. |
| • | Institutions: The rating for Public Institutions is generally provided by the risk units responsible for their approval, on a yearly basis, coinciding with the review of customer risk or with the reporting of their financial accounts. |
In the case of financial institutions, the responsible Risk unit gives a regular rating for these customers, continuously monitoring them on domestic and international markets. External ratings are a key factor in assigning ratings for financial institutions.
| • | Large Companies: Includes the rating of exposure with corporate business groups. The result is affected both by indicators of business risk (evaluation of the competitive environment, business positioning, regulation, etc.) and financial risk indicators (size of the group by sales, cash generation, levels of debt, financial flexibility, etc.). |
In accordance with the characteristics of the large companies, the rating model has a global nature with specific algorithms according to the sector of activity and geographical adaptations. The rating of these customers is generally calculated within the framework of the annual risk review process, or the admission of new operations.
The responsibility for the assessment lies with the units proposing the risk, while those responsible of approvals, validate it when the decision is taken.
| • | Medium-sized companies: This segment also takes into account quantitative factors derived from economic and financial information, and qualitative factors that are related to the age of the company, the sector, management quality, etc. and alert factors derived from risk monitoring. |
As in the Corporate segment, the rating tends to run parallel to the admission process, so the responsibility for rating lies with the unit proposing the risk, while the decision-making level is in charge of validating it.
| • | Small-sized companies: As in the case of medium-sized companies, this segment also takes into account quantitative factors derived from economic and financial information, and qualitative factors that are related to the age of the company, the sector, management quality, etc. and alert factors derived from risk monitoring. Similarly, the rating tends to run parallel with the admission process, so the responsibility for rating is with the unit proposing the risk, while the decision-making level is in charge of validating it. |
| • | Specialised Lending: To classify this segment, the Group has chosen to use the approach of slotting criteria, as included in the Basel Accord of June 2004 and in the solvency regulations (CRR Article 153.5) |
| • | Developers: The rating of real estate developers covers the rating of both customers who are developers and the Property Projects unit. Its use makes it easier to monitor and rate projects during their execution phase, as well as enriching the admission processes. |
| BBVA. PILLAR III 2020 | 3. RISK | P. 67 |
| • | BBVA Mexico Corporates: This segment also takes into account quantitative factors derived from economic and financial information and bureau information, as well as qualitative factors related to the age of the company, the sector, the quality of its management, etc. The rating tends to run parallel to the admission process, so that responsibility for the rating is with the unit originating the risk, while the decision-making body validates it. |
In general in the wholesale area, the rating of customers is not limited to admission, as the ratings are updated according to new information available at any time (economic and financial data, changes in the company, external factors, etc.)
| • | Retailers: Retail exposure is rated by models developed internally by the Entity that allow the credit risk of portfolios to be assessed. The model score can be assigned at the customer or product level and transformed into a probability of default, allowing for management based on risk groups. Depending on the information available, ratings can be reactive or proactive. The reactive ratings are generated from the customer’s request to take out a product, while the proactive ratings are periodically calculated on the basis of the information available, internal and external, on the customer’s payment behavior. Proactive models allow offers of pre-approved and/ or pre-offered products, which are instrumentalised in mass marketing campaigns. Ratings are integrated into admission and monitoring processes for retail portfolios, ensuring adequate credit risk management. |
The rating process is as follows for each specific category of retail exposure:
| a. | Mortgages, Consumer Finance and Retail Cards - Spain: The manager collects data on the customer (personal, financial, banking relationship information) and on the transaction (LTV, amount, maturity, destination etc.) and calculates the rating of the transaction with the scoring. The decision on whether it is approved is made based on the results of applying the model and risk policies. |
| b. | Consumer Finance Autos Spain: The financing request may come through the call center or be directly recorded in the web application by our authorised dealers. The necessary information on the customer (personal, financial information, authorisation to consult the external bureau of credit) and on the transaction (maturity, amount, etc.) is recorded to rate the transaction with the scoring. Once the validity of the information provided is verified, the decision of whether to approve it is made based on the results of applying the model and risk policies. |
| c. | Retail Revolving- Cards BBVA Mexico: The manager or specialist party gathers the necessary information on the customer (personal, financial information and authorisation to consult the external bureau of credit) and on the transaction (limit requested) to rate the |
transaction with the scoring. There are additional processes for validating and checking this information through the back office or operational support areas. The decision on whether it is approved is made based on the results of applying the model and risk policies.
| • | Behavioral: Every month all the active cards are rated according to their transactional behavior and payment status. |
| • | Proactive: Each month all the customers who have asset positions on credit cards, consumer finance or mortgages and liabilities positions are rated, based on information on internal behavior and flows. |
| d. | Proactive - Spain: Each month all the customers who have asset positions in credit cards, consumer finance or mortgages and first and second in liability seniority, are rated according to information on their behavior. |
| e. | SMEs Spain (legal persons): Management is based on the allocation of limits/ceilings at the customer level, based on the results of a proactive monthly update rating. |
| • | Equity: For its portfolio position registered as equity, the Group is applying the rating obtained for customers as a result of their rating in the lending process. |
3.2.5.1.7. Definitions, methods and data for estimating and validating risk parameters
The estimation of the parameters is based on the uniform definition of default established at Group level. Specifically, for a contract or customer to be considered in a situation of default, the provisions of current regulations must be met.
Specifically, there are two approaches in the Group for considering default and estimating parameters:
| • | The facility level approach is applied within the sphere of retail risk. Each customer transaction is handled as an independent unit in terms of credit risk. Therefore, noncompliance with credit obligations to the bank is handled at the transaction level, regardless of the customer’s behavior with respect to other obligations. |
| • | The obligor level approach is applied to the remainder portfolios. The significant unit for defining default is the customer’s sum of contracts, which enter a situation of default en masse when the customer defaults. |
Furthermore, to avoid including non material defaults in the estimates, non-performing volumes have to pass through a materiality filter that depends on the type of customer and transaction.
Estimating parameters
In the case of Spain and Mexico, the Group has an internal information system denominated RAR – Risk Adjusted Return that reflects exposure to credit risk in the Group’s different portfolios included in advanced internal models.
| BBVA. PILLAR III 2020 | 3. RISK | P. 68 |
This information system guarantees the availability of historical data recorded by the Group, which are used to estimate the parameters of Probability of Default (PD), Loss Given Default (LGD) and Credit Conversion Factors (CCF). These are then used to calculate the regulatory capital using the advanced approach, economic capital and expected loss by credit risk.
Other sources of information for the Bank may be used in addition, depending on any new needs detected in the estimation process. Internal estimates of the PD, LGD and CCF parameters are made for all the Group’s portfolios.
In the case of low default portfolios (LDP), in which the number of defaults tends to be insufficient for obtaining empirical estimates, use is made of data from external agencies that are merged with the internal information available and expert criteria.
The following shows the estimation methodologies used for the PD, LGD and CCF risk parameters, for the purpose of calculating regulatory capital requirements.
| • | Probability of default (PD) |
The methodology used for estimating the PD in cases that have a sufficiently large mass of internal data is based on the creation of risk groups. The groups proposed with a view to calibration are defined by grouping contracts together, seeking to achieve intra-group homogeneity in terms of credit quality and differentiation with all the other risk groups. The largest possible number of groups is defined in order to allow a suitable discrimination of risk.
The fundamental metric used for making these groupings is the score, being supplemented by other metrics relevant to
PD that are proven to be sufficiently discriminating depending on the portfolio.
Once the risk groups have been defined, the average empirical PD recorded for each one is obtained and adjusted to the cycle. The adjustment to the cycle provides stable estimates over the course of the economic cycle, referred to as PD-TTC (through the cycle). This calculation considers the portfolio’s track record and provides long-term levels of PD.
In low default portfolios (LDPs) the empirical PDs observed by external rating agencies are used to obtain the PD of internal risk groups.
Finally, in obligor level portfolios there is a Master Scale, which is simply a standard and uniform rule for credit levels that makes it possible to make comparisons of credit quality in the Group’s different portfolios.
| • | Loss given default (LGD) |
As a general rule, the method used to estimate loss given default (LGD) in portfolios with a sufficient number of defaults is Workout LGD. Here, the LGD of a contract is obtained as a quotient of the sum of all the financial flows recorded during
the recovery process that takes place when a transaction defaults, and the transaction’s exposure at the time of default.
This estimate is made by considering all the historical data recorded in internal systems. When making the estimates, there are transactions that have already defaulted but for which the recovery process is still ongoing. The loss given default recorded at the time of the estimate is therefore higher than it will ultimately be. The necessary adjustments are made in these cases so as not to distort the estimate.
These estimates are made by defining uniform risk groups in terms of the nature of the operations that determine the LGD. They are made in such a way that there are enough groups for each one to be distinguishable and receive a different estimate.
In line with the guidelines set out by the regulations, the estimates are made by distinguishing between wholesale and retail type exposure.
There is insufficient historical experience to make a robust estimate in low default portfolios (LDP) using the Workout LGD method, so external sources of information are used, combined with internal data to provide the portfolio with a representative rate of loss given default (LGD).
The loss given default (LGD) rates estimated according to the internal databases the Bank holds are conditioned to the moment of the cycle of the data window used, since loss given default varies over the economic cycle. Hence, the following concepts can be defined: long-run loss given default (LRLGD), the downturn loss given default (DLGD), and loss given default best estimate (LGD BE).
LRLGD is calculated by making an adjustment to capture the difference between the loss given default obtained empirically with the available sample and the average loss given default observed throughout the economic cycle if the observation of the cycle is complete. In addition, the loss given default observed in a period of stress in the economic cycle, the downturn loss given default (DLGD) is determined.
These estimates are made for those portfolios whose loss given default (LGD) is noticeably sensitive to the cycle. The different ways in which the recovery cycles can conclude are determined for each portfolio where this loss given default (LGD) in conditions of stress has not yet been observed, and the level these parameters would have in a downturn situation are estimated.
Finally, LGD BE is determined according to the loss given default (LGD) observed in the BE period, which aims to cover the defaults closest in time to the present, in other words those that have been produced at a time of the economic cycle that is similar to the present and that also correspond to a very similar portfolio to the present one.
However, for defaulted transactions, the LGD at the worst time will be the LGD BE plus a stress, which is measured based on the volatility of LGD.
| BBVA. PILLAR III 2020 | 3. RISK | P. 69 |
Credit conversion factor (CCF)
As with the two preceding parameters, exposure at default is another of the necessary inputs for calculating expected loss and regulatory capital. A contract’s exposure usually coincides with its balance. However, this is not applicable in all cases.
For example, for products with explicit limits, such as credit cards or credit facilities, the exposure should incorporate the potential increase in the balance that may be recorded up to the time of default.
In observance of regulatory requirements, exposure is calculated as the drawn balance, which is the real risk at any specific moment, plus a percentage (CCF) of the undrawn balance, which is the part that the customer can still use until the available limit is reached. Therefore, the CCF is defined as the percentage of the undrawn balance that is expected to be used before default occurs.
CCF is estimated by using the cohort2 approach, analyzing how the exposure varies from a pre-established reference date through to the moment of default, obtaining the average performance according to the relevant metrics.
Different approaches are used for retail and wholesale exposure. The facility level approach analyzes the evolution of the exposure up to the time of the breach of contract, while the obligor level approach analyzes the evolution of the exposure up to the moment of the non-compliance of the client.
Again, in low-default portfolios there is not enough historical experience to be able to make a reliable estimate with the defined LGD methodology. In this case, external sources are also used, which are combined with internal data to obtain a CCF representative of the portfolio.
Validation process
The models used for calculating the parameters, as explained above, are subjected to an effective contrast, in accordance with the principle of proportionality, by the internal approval team, independent from those that have developed or used said calculation, in order to ensure its accuracy, robustness and stability.
This review process is not restricted as to the time of approval, or the inclusion of changes in the models, but rather is framed within a plan that allows for a periodic evaluation of them, resulting in the issuance of recommendations and mitigating actions for the deficiencies identified.
As such, all Models used in Regulatory Capital Calculations using Internal Models must be subjected to an annual review of the calculation, which must meet the minimum quantitative and qualitative test content requested by the regulator in
Section 4 of the ECB’s Guidelines on Internal Models (General Aspects); even when, in accordance with the principle of proportionality, certain aspects or models that are relatively insignificant within the capital calculation may be subject to revision in the context of a broader review cycle. However, this possibility does not provide an exemption from conducting the various tests defined in the Instructions for Reporting the Validation Results of Internal Models, issued by the ECB in February 2019, and that should—for internal models on capital for credit risk—be sent to the supervisor on an annual basis and include:
| • | Back-testing of the parameters by comparing the model estimates with the levels actually achieved in the annual study period. |
| • | Discrimination Capacity Analysis, it being important to analyse the evolution of the calculated indices over time by comparing them with indices obtained at different points in time (for example, during model construction). |
| • | Representativeness Analysis, both in order to analyse that the model’s application perimeter is set to the approved and defined perimeter, and in order to analyse the representativeness of the historical data used in the estimation of the risk parameters applied; with particular emphasis on tracking the record of changes made to the definition. |
| • | Override analyses, which modify the final score obtained as a large number of analyses could indicate that the model is lacking certain important information. |
| • | Stability Analysis: in order to assess the stability of the rating system, analyses will be conducted on customer migrations, on the stability of the migration matrix and on concentration in rating grades; these analyses may be supplemented, optionally and based on results, by comparing the Stability Index (PSI). |
| • | Evaluation of the Data Used in the Calibration by analysing the data extraction, processing and purging processes; analysing the Data Quality Management Framework and the results obtained therefrom. |
3.2.5.2. Exposure values by category and PD range
The following table presents the information on credit risk as of December 31, 2020 (excluding counterparty credit risk, which is set out in detail in Table CCR4 in section 3.2.6.2.2) using the internal ratings-based (IRB) approach, by debtor grade for the different categories of exposure:
| 2. | A cohort is a twelve-month window that has a reference date (end of each month) and contains all delinquent transactions whose date of noncompliance occurs within said cohort. All operations must have a contract date prior to the reference date. |
| BBVA. PILLAR III 2020 | RISK | P. 70 |
Table 32. EU CR6 - IRB approach - Credit risk exposures by exposure class and PD range (Million Euros. 12-31-2020)
PD Scale as of 12-31-2020(1)(7) | Original on- balance sheet gross exposure | Off-balance sheet exposures pre CCF | Average CCF(2) | EAD post CRM and post-CCF | Average PD(3) | Number of obligors | Average LGD(4) | Average Maturity (days)(5) | RWAs | RWA Density | EL | Value adjustments and provisions | ||||||||||||||||||||||||||||||||||||
Prudential portfolios for FIRB approach(6) | 4,938 | 616 | 56.01 | % | 5,283 | — | 332 | — | 4,263 | 81 | % | 69 | (23 | ) | ||||||||||||||||||||||||||||||||||
|
|
|
|
|
|
|
|
|
|
|
|
|
|
|
|
|
|
|
|
|
|
|
| |||||||||||||||||||||||||
Corporate - Specialised lending | 4,938 | 616 | 56.01 | % | 5,283 | — | 332 | — | — | 4,263 | 81 | % | 69 | (23 | ) | |||||||||||||||||||||||||||||||||
|
|
|
|
|
|
|
|
|
|
|
|
|
|
|
|
|
|
|
|
|
|
|
| |||||||||||||||||||||||||
Prudential portfolios for AIRB approach | 214,542 | 100,982 | 40.73 | % | 231,880 | 4.03 | % | 11,107,380 | 37.28 | % | 81,798 | 35 | % | 3,665 | (5,372 | ) | ||||||||||||||||||||||||||||||||
|
|
|
|
|
|
|
|
|
|
|
|
|
|
|
|
|
|
|
|
|
|
|
| |||||||||||||||||||||||||
Central governments or central banks | 12,664 | 271 | 48.78 | % | 13,930 | 0.27 | % | 66 | 23.19 | % | 370 | 843 | 6 | % | 14 | (7 | ) | |||||||||||||||||||||||||||||||
|
|
|
|
|
|
|
|
|
|
|
|
|
|
|
|
|
|
|
|
|
|
|
| |||||||||||||||||||||||||
0,00<0,15 | 12,315 | 108 | 48.31 | % | 13,749 | 0.03 | % | 28 | 22.91 | % | 366 | 734 | 5 | % | 1 | (1 | ) | |||||||||||||||||||||||||||||||
0,15<0,25 | 79 | 51 | 50.30 | % | 82 | 0.20 | % | 4 | 43.62 | % | 680 | 41 | 50 | % | 0 | (0 | ) | |||||||||||||||||||||||||||||||
0,25<0,50 | 3 | 3 | 40.68 | % | 38 | 0.29 | % | 3 | 48.72 | % | 887 | 29 | 76 | % | 0 | (0 | ) | |||||||||||||||||||||||||||||||
0,50<0,75 | — | 0 | 52.14 | % | 8 | 0.48 | % | 1 | 51.81 | % | 627 | 10 | 125 | % | 0 | (1 | ) | |||||||||||||||||||||||||||||||
0,75<2,50 | 63 | 1 | 51.20 | % | 14 | 1.11 | % | 4 | 47.73 | % | 819 | 13 | 93 | % | 0 | (0 | ) | |||||||||||||||||||||||||||||||
2,50<10,00 | 14 | 41 | 54.35 | % | 4 | 2.76 | % | 14 | 47.03 | % | 756 | 5 | 139 | % | 0 | (1 | ) | |||||||||||||||||||||||||||||||
10,00<100,00 | 1 | 7 | 50.24 | % | 3 | 19.15 | % | 6 | 39.87 | % | 103 | 7 | 201 | % | 0 | (0 | ) | |||||||||||||||||||||||||||||||
100,00 (Default) | 189 | 61 | — | 32 | 100.00 | % | 6 | 39.99 | % | 401 | 4 | 14 | % | 13 | (4 | ) | ||||||||||||||||||||||||||||||||
Institutions | 26,470 | 6,932 | 55.10 | % | 15,934 | 0.35 | % | 3,200 | 42.50 | % | 594 | 4,754 | 30 | % | 26 | (33 | ) | |||||||||||||||||||||||||||||||
|
|
|
|
|
|
|
|
|
|
|
|
|
|
|
|
|
|
|
|
|
|
|
| |||||||||||||||||||||||||
0,00<0,15 | 20,022 | 5,153 | 55.48 | % | 12,803 | 0.07 | % | 1,844 | 43.96 | % | 591 | 3,099 | 24 | % | 4 | (8 | ) | |||||||||||||||||||||||||||||||
0,15<0,25 | 2,262 | 582 | 52.29 | % | 1,011 | 0.20 | % | 489 | 42.45 | % | 529 | 402 | 40 | % | 1 | (2 | ) | |||||||||||||||||||||||||||||||
0,25<0,50 | 2,848 | 862 | 58.85 | % | 1,006 | 0.31 | % | 310 | 25.29 | % | 683 | 297 | 30 | % | 1 | (3 | ) | |||||||||||||||||||||||||||||||
0,50<0,75 | 344 | 109 | 47.36 | % | 265 | 0.51 | % | 170 | 37.30 | % | 1,143 | 160 | 61 | % | 1 | (1 | ) | |||||||||||||||||||||||||||||||
0,75<2,50 | 785 | 149 | 53.27 | % | 725 | 1.44 | % | 153 | 42.41 | % | 403 | 616 | 85 | % | 4 | (2 | ) | |||||||||||||||||||||||||||||||
2,50<10,00 | 88 | 63 | 50.29 | % | 71 | 5.27 | % | 143 | 39.97 | % | 690 | 101 | 143 | % | 2 | (1 | ) | |||||||||||||||||||||||||||||||
10,00<100,00 | 53 | 15 | 50.09 | % | 31 | 16.97 | % | 20 | 45.67 | % | 817 | 75 | 242 | % | 2 | (0 | ) | |||||||||||||||||||||||||||||||
100,00 (Default) | 67 | 0 | 46.88 | % | 21 | 100.00 | % | 71 | 53.92 | % | 98 | 3 | 14 | % | 11 | (15 | ) | |||||||||||||||||||||||||||||||
Corporate SMEs | 17,961 | 5,155 | 39.27 | % | 15,596 | 12.57 | % | 34,205 | 44.14 | % | 825 | 11,329 | 73 | % | 866 | (1,028 | ) | |||||||||||||||||||||||||||||||
|
|
|
|
|
|
|
|
|
|
|
|
|
|
|
|
|
|
|
|
|
|
|
| |||||||||||||||||||||||||
0,00<0,15 | 2,399 | 1,230 | 41.41 | % | 2,796 | 0.11 | % | 6,157 | 50.59 | % | 654 | 739 | 26 | % | 2 | (3 | ) | |||||||||||||||||||||||||||||||
0,15<0,25 | 768 | 323 | 42.85 | % | 795 | 0.20 | % | 1,745 | 50.82 | % | 632 | 307 | 39 | % | 1 | (2 | ) | |||||||||||||||||||||||||||||||
0,25<0,50 | 1,293 | 494 | 44.91 | % | 1,274 | 0.31 | % | 2,610 | 48.11 | % | 676 | 632 | 50 | % | 2 | (3 | ) | |||||||||||||||||||||||||||||||
0,50<0,75 | 2,185 | 551 | 44.68 | % | 1,803 | 0.52 | % | 3,316 | 44.41 | % | 879 | 1,232 | 68 | % | 4 | (8 | ) | |||||||||||||||||||||||||||||||
0,75<2,50 | 4,387 | 1,102 | 36.74 | % | 3,342 | 1.12 | % | 6,117 | 41.94 | % | 946 | 2,934 | 88 | % | 16 | (26 | ) | |||||||||||||||||||||||||||||||
2,50<10,00 | 4,337 | 1,143 | 36.23 | % | 3,213 | 4.79 | % | 9,005 | 38.56 | % | 1,148 | 3,753 | 117 | % | 59 | (131 | ) | |||||||||||||||||||||||||||||||
10,00<100,00 | 943 | 270 | 30.87 | % | 773 | 19.39 | % | 2,620 | 37.04 | % | 1,264 | 1,248 | 162 | % | 56 | (54 | ) | |||||||||||||||||||||||||||||||
100,00 (Default) | 1,649 | 42 | 33.17 | % | 1,602 | 100.00 | % | 2,635 | 45.37 | % | 160 | 486 | 30 | % | 727 | (801 | ) | |||||||||||||||||||||||||||||||
Corporate Non-SMEs | 62,268 | 66,392 | 47.79 | % | 89,319 | 2.31 | % | 12,818 | 42.14 | % | 692 | 42,456 | 48 | % | 771 | (1,285 | ) | |||||||||||||||||||||||||||||||
|
|
|
|
|
|
|
|
|
|
|
|
|
|
|
|
|
|
|
|
|
|
|
| |||||||||||||||||||||||||
0,00<0,15 | 21,200 | 30,625 | 48.69 | % | 36,839 | 0.11 | % | 2,576 | 43.93 | % | 674 | 10,049 | 27 | % | 18 | (12 | ) | |||||||||||||||||||||||||||||||
0,15<0,25 | 10,499 | 14,432 | 46.99 | % | 17,369 | 0.29 | % | 1,259 | 41.95 | % | 713 | 7,366 | 42 | % | 21 | (12 | ) | |||||||||||||||||||||||||||||||
0,25<0,50 | 11,463 | 11,008 | 47.28 | % | 16,400 | 0.33 | % | 2,149 | 40.57 | % | 714 | 8,833 | 54 | % | 22 | (22 | ) | |||||||||||||||||||||||||||||||
0,50<0,75 | 7,248 | 5,041 | 46.21 | % | 8,308 | 0.60 | % | 1,831 | 39.72 | % | 763 | 5,639 | 68 | % | 20 | (21 | ) | |||||||||||||||||||||||||||||||
0,75<2,50 | 6,295 | 3,768 | 47.32 | % | 5,836 | 1.48 | % | 1,990 | 41.20 | % | 776 | 5,574 | 96 | % | 36 | (58 | ) | |||||||||||||||||||||||||||||||
2,50<10,00 | 3,115 | 1,093 | 48.51 | % | 2,242 | 4.30 | % | 2,167 | 41.84 | % | 513 | 2,980 | 133 | % | 40 | (248 | ) | |||||||||||||||||||||||||||||||
10,00<100,00 | 907 | 306 | 42.02 | % | 808 | 20.41 | % | 270 | 40.92 | % | 688 | 1,730 | 214 | % | 66 | (33 | ) | |||||||||||||||||||||||||||||||
100,00 (Default) | 1,542 | 120 | 29.75 | % | 1,517 | 100.00 | % | 576 | 36.13 | % | 211 | 286 | 19 | % | 548 | (880 | ) | |||||||||||||||||||||||||||||||
Retail - Mortgage exposures | 71,759 | 4,311 | 2.00 | % | 71,824 | 4.17 | % | 1,030,894 | 24.03 | % | — | 7,319 | 10 | % | 570 | (1,129 | ) | |||||||||||||||||||||||||||||||
|
|
|
|
|
|
|
|
|
|
|
|
|
|
|
|
|
|
|
|
|
|
|
| |||||||||||||||||||||||||
0,00<0,15 | 55,416 | — | 0.00 | % | 55,463 | 0.04 | % | 824,534 | 23.35 | % | — | 1,733 | 3 | % | 6 | (18 | ) | |||||||||||||||||||||||||||||||
0,15<0,25 | 3,312 | — | 0.00 | % | 3,311 | 0.20 | % | 41,258 | 28.60 | % | — | 402 | 12 | % | 2 | (5 | ) | |||||||||||||||||||||||||||||||
0,25<0,50 | 1,703 | — | 0.00 | % | 1,710 | 0.32 | % | 24,476 | 30.88 | % | — | 314 | 18 | % | 2 | (8 | ) | |||||||||||||||||||||||||||||||
0,50<0,75 | 2,197 | 261 | 0.00 | % | 2,201 | 0.49 | % | 30,465 | 27.96 | % | — | 500 | 23 | % | 3 | (12 | ) | |||||||||||||||||||||||||||||||
0,75<2,50 | 3,737 | 321 | 2.00 | % | 3,743 | 1.01 | % | 49,590 | 27.08 | % | — | 1,342 | 36 | % | 10 | (46 | ) | |||||||||||||||||||||||||||||||
2,50<10,00 | 2,167 | 210 | 2.01 | % | 2,171 | 4.98 | % | 27,586 | 26.23 | % | — | 1,900 | 88 | % | 28 | (245 | ) | |||||||||||||||||||||||||||||||
10,00<100,00 | 509 | 42 | 2.00 | % | 509 | 16.96 | % | 6,337 | 27.23 | % | — | 779 | 153 | % | 24 | (46 | ) | |||||||||||||||||||||||||||||||
100,00 (Default) | 2,718 | 0 | 2.36 | % | 2,715 | 100.00 | % | 26,648 | 18.27 | % | — | 350 | 13 | % | 496 | (749 | ) | |||||||||||||||||||||||||||||||
| BBVA. PILLAR III 2020 | RISK | P. 71 |
PD Scale as of 12-31-2020(1)(7) | Original on- balance sheet gross exposure | Off-balance sheet exposures pre CCF | Average CCF(2) | EAD post CRM and post-CCF | Average PD(3) | Number of obligors | Average LGD(4) | Average Maturity (days)(5) | RWAs | RWA Density | EL | Value adjustments and provisions | ||||||||||||||||||||||||||||||||||||
Retail - Other exposures SMEs | 4,153 | 1,611 | 54.78 | % | 3,208 | 15.63 | % | 162,989 | 51.77 | % | — | 1,287 | 40 | % | 304 | (296 | ) | |||||||||||||||||||||||||||||||
|
|
|
|
|
|
|
|
|
|
|
|
|
|
|
|
|
|
|
|
|
|
|
| |||||||||||||||||||||||||
0,00<0,15 | 422 | — | 52.31 | % | 418 | 0.12 | % | 25,064 | 52.62 | % | — | 55 | 13 | % | 0 | (1 | ) | |||||||||||||||||||||||||||||||
0,15<0,25 | 193 | — | 56.80 | % | 173 | 0.20 | % | 7,615 | 52.35 | % | — | 37 | 21 | % | 0 | (0 | ) | |||||||||||||||||||||||||||||||
0,25<0,50 | 327 | — | 55.55 | % | 304 | 0.31 | % | 13,110 | 52.43 | % | — | 90 | 30 | % | 0 | (1 | ) | |||||||||||||||||||||||||||||||
0,50<0,75 | 387 | 218 | 54.38 | % | 312 | 0.52 | % | 15,445 | 51.71 | % | — | 112 | 36 | % | 1 | (1 | ) | |||||||||||||||||||||||||||||||
0,75<2,50 | 863 | 329 | 56.98 | % | 593 | 1.17 | % | 32,103 | 50.92 | % | — | 287 | 48 | % | 4 | (5 | ) | |||||||||||||||||||||||||||||||
2,50<10,00 | 1,283 | 276 | 57.58 | % | 829 | 4.28 | % | 44,179 | 46.67 | % | — | 484 | 58 | % | 17 | (18 | ) | |||||||||||||||||||||||||||||||
10,00<100,00 | 252 | 41 | 45.84 | % | 161 | 23.31 | % | 10,139 | 47.24 | % | — | 143 | 89 | % | 18 | (13 | ) | |||||||||||||||||||||||||||||||
100,00 (Default) | 427 | 10 | 39.98 | % | 418 | 100.00 | % | 15,334 | 63.31 | % | — | 80 | 19 | % | 265 | (256 | ) | |||||||||||||||||||||||||||||||
Retail - Other exposures Non-SMEs | 11,175 | 15 | 52.81 | % | 11,166 | 8.58 | % | 1,013,058 | 55.25 | % | — | 3,876 | 35 | % | 538 | (862 | ) | |||||||||||||||||||||||||||||||
|
|
|
|
|
|
|
|
|
|
|
|
|
|
|
|
|
|
|
|
|
|
|
| |||||||||||||||||||||||||
0,00<0,15 | 4,751 | 4 | 42.32 | % | 4,752 | 0.06 | % | 362,577 | 52.40 | % | — | 418 | 9 | % | 1 | (4 | ) | |||||||||||||||||||||||||||||||
0,15<0,25 | 440 | 1 | 60.42 | % | 441 | 0.20 | % | 48,192 | 57.91 | % | — | 111 | 25 | % | 1 | (2 | ) | |||||||||||||||||||||||||||||||
0,25<0,50 | 1,129 | 1 | 76.75 | % | 1,130 | 0.31 | % | 120,280 | 57.51 | % | — | 373 | 33 | % | 2 | (7 | ) | |||||||||||||||||||||||||||||||
0,50<0,75 | 881 | 1 | 56.92 | % | 879 | 0.60 | % | 97,446 | 56.22 | % | — | 415 | 47 | % | 3 | (8 | ) | |||||||||||||||||||||||||||||||
0,75<2,50 | 1,612 | 3 | 47.86 | % | 1,609 | 1.22 | % | 169,642 | 58.61 | % | — | 1,073 | 67 | % | 11 | (29 | ) | |||||||||||||||||||||||||||||||
2,50<10,00 | 1,322 | 3 | 56.00 | % | 1,316 | 3.90 | % | 122,097 | 57.46 | % | — | 1,136 | 86 | % | 30 | (107 | ) | |||||||||||||||||||||||||||||||
10,00<100,00 | 234 | 1 | 33.85 | % | 233 | 29.49 | % | 23,870 | 55.79 | % | — | 320 | 137 | % | 38 | (47 | ) | |||||||||||||||||||||||||||||||
100,00 (Default) | 807 | 0 | 42.86 | % | 806 | 100.00 | % | 68,954 | 55.96 | % | — | 30 | 4 | % | 451 | (657 | ) | |||||||||||||||||||||||||||||||
Retail - qualifying revolving (QRRE) | 6,222 | 16,294 | 17.26 | % | 9,035 | 7.77 | % | 8,850,150 | 67.80 | % | — | 5,987 | 66 | % | 557 | (734 | ) | |||||||||||||||||||||||||||||||
|
|
|
|
|
|
|
|
|
|
|
|
|
|
|
|
|
|
|
|
|
|
|
| |||||||||||||||||||||||||
0,00<0,15 | 906 | 4,522 | 23.80 | % | 1,982 | 0.04 | % | 2,568,735 | 46.79 | % | — | 25 | 1 | % | 0 | (1 | ) | |||||||||||||||||||||||||||||||
0,15<0,25 | 130 | 204 | 22.88 | % | 177 | 0.21 | % | 248,504 | 47.48 | % | — | 10 | 5 | % | 0 | (1 | ) | |||||||||||||||||||||||||||||||
0,25<0,50 | 50 | 105 | 25.19 | % | 76 | 0.31 | % | 98,125 | 49.42 | % | — | 7 | 9 | % | 0 | (0 | ) | |||||||||||||||||||||||||||||||
0,50<0,75 | 548 | 1,911 | 12.35 | % | 784 | 0.53 | % | 652,799 | 69.48 | % | — | 147 | 19 | % | 3 | (4 | ) | |||||||||||||||||||||||||||||||
0,75<2,50 | 1,296 | 4,493 | 12.66 | % | 1,865 | 1.19 | % | 1,516,590 | 73.95 | % | — | 688 | 37 | % | 16 | (31 | ) | |||||||||||||||||||||||||||||||
2,50<10,00 | 2,203 | 4,566 | 16.34 | % | 2,949 | 5.28 | % | 2,814,082 | 75.07 | % | — | 3,120 | 106 | % | 118 | (206 | ) | |||||||||||||||||||||||||||||||
10,00<100,00 | 770 | 492 | 22.85 | % | 883 | 22.59 | % | 766,499 | 75.99 | % | — | 1,977 | 224 | % | 151 | (230 | ) | |||||||||||||||||||||||||||||||
100,00 (Default) | 319 | 0 | 25.27 | % | 319 | 100.00 | % | 184,816 | 84.02 | % | — | 14 | 5 | % | 268 | (260 | ) | |||||||||||||||||||||||||||||||
Equity | 1,869 | — | — | 1,869 | 1.08 | % | — | 90.00 | % | — | 3,945 | 211 | % | 18 | — | |||||||||||||||||||||||||||||||||
|
|
|
|
|
|
|
|
|
|
|
|
|
|
|
|
|
|
|
|
|
|
|
| |||||||||||||||||||||||||
0,00<0,15 | 895 | — | — | 895 | 0.14 | % | — | 90.00 | % | — | 1,073 | 120 | % | 1 | — | |||||||||||||||||||||||||||||||||
0,15<0,25 | 106 | — | — | 106 | 0.20 | % | — | 90.00 | % | — | 160 | 151 | % | 0 | — | |||||||||||||||||||||||||||||||||
0,25<0,50 | 17 | — | — | 17 | 0.31 | % | — | 90.00 | % | — | 29 | 2 | 0 | — | ||||||||||||||||||||||||||||||||||
0,50<0,75 | — | — | — | — | — | — | — | — | — | 0 | % | — | — | |||||||||||||||||||||||||||||||||||
0,75<2,50 | 285 | — | — | 285 | 1.50 | % | — | 90.00 | % | 831 | 292 | % | 4 | — | ||||||||||||||||||||||||||||||||||
2,50<10,00 | 567 | — | — | 567 | 2.55 | % | — | 90.00 | % | — | 1,852 | 327 | % | 13 | — | |||||||||||||||||||||||||||||||||
10,00<100,00 | — | — | — | — | — | — | — | — | — | — | 0 | — | ||||||||||||||||||||||||||||||||||||
100,00 (Default) | — | — | — | — | — | — | — | — | — | — | — | — | ||||||||||||||||||||||||||||||||||||
|
|
|
|
|
|
|
|
|
|
|
|
|
|
|
|
|
|
|
|
|
|
|
| |||||||||||||||||||||||||
Total Standardised Approach | 219,480 | 101,598 | 40.73 | % | 237,163 | 4.03 | % | 11,107,380 | 37.28 | % | 86,061 | 36 | % | 3,733 | (5,395 | ) | ||||||||||||||||||||||||||||||||
|
|
|
|
|
|
|
|
|
|
|
|
|
|
|
|
|
|
|
|
|
|
|
| |||||||||||||||||||||||||
| (1) | PD Intervals recommended by the EBA Guidelines on Disclosure Requirements under Part Eight of the CRR. |
| (2) | Calculated as EAD after CCF for off-balance sheet exposure over total off-balance exposure before CCF. |
| (3) | Corresponds to obligor grade PD weighted by EAD post CRM. |
| (4) | Corresponds to obligor grade LGD weighted by EAD post CRM. |
| (5) | Corresponds to the obligor maturity in days weighted by EAD post CRM. According to Regulation (EU) No 680/2014, it is reported only for categories in which the average maturities are relevant for the calculation of RWAs. |
| (6) | Exposure classified in the FIRB approach corresponds to specialised lending exposure. The Group has chosen to use the slotting criteria, in line with Article 153.5 of the CRR. |
| (7) | It does not include the frontloading amount to partially cover the regulatory impacts derived from Targeted Review of Internal Models (TRIM) and other regulatory/supervisory impacts. |
| BBVA. PILLAR III 2020 | RISK | P. 72 |
EU CR6 - IRB approach - Credit risk exposures by exposure class and PD range (Million Euros. 12-31-2019)
PD Scale as of 12-31-2019(1)(7) | Original on- balance sheet gross exposure | Off-balance sheet exposures pre CCF | Average CCF(2) | EAD post CRM and post-CCF | Average PD(3) | Number of obligors | Average LGD(4) | Average Maturity (days)(5) | RWAs | RWA Density | EL | Value adjustments and provisions | ||||||||||||||||||||||||||||||||||||
Prudential portfolios for FIRB approach(6) | 5,676 | 671 | 51.66 | % | 6,022 | — | 352 | — | 4,606 | 76 | % | 113 | (62 | ) | ||||||||||||||||||||||||||||||||||
|
|
|
|
|
|
|
|
|
|
|
|
|
|
|
|
|
|
|
|
|
|
|
| |||||||||||||||||||||||||
Corporate - Specialised lending | 5,676 | 671 | 51.66 | % | 6,022 | — | 352 | — | — | 4,606 | 76 | % | 113 | (62 | ) | |||||||||||||||||||||||||||||||||
Prudential portfolios for AIRB approach | 215,544 | 96,342 | 41.11 | % | 239,149 | 3.97 | % | 11,054,690 | 37.74 | % | 85,586 | 36 | % | 3,457 | (4,805 | ) | ||||||||||||||||||||||||||||||||
|
|
|
|
|
|
|
|
|
|
|
|
|
|
|
|
|
|
|
|
|
|
|
| |||||||||||||||||||||||||
Central governments or central banks | 9,109 | 310 | 49.59 | % | 11,899 | 0.06 | % | 60 | 26.68 | % | 567 | 664 | 6 | % | 3 | (5 | ) | |||||||||||||||||||||||||||||||
|
|
|
|
|
|
|
|
|
|
|
|
|
|
|
|
|
|
|
|
|
|
|
| |||||||||||||||||||||||||
0,00<0,15 | 8,684 | 113 | 49.80 | % | 11,489 | 0.04 | % | 24 | 26.13 | % | 550 | 596 | 5 | % | 1 | (2 | ) | |||||||||||||||||||||||||||||||
0,15<0,25 | 64 | 63 | 49.78 | % | 324 | 0.21 | % | 3 | 41.64 | % | 1,176 | 20 | 6 | % | 0 | (0 | ) | |||||||||||||||||||||||||||||||
0,25<0,50 | 5 | 8 | 45.00 | % | 46 | 0.29 | % | 4 | 44.39 | % | 613 | 5 | 10 | % | 0 | (2 | ) | |||||||||||||||||||||||||||||||
0,50<0,75 | 0 | 0 | 35.29 | % | 0 | 0.58 | % | 1 | 21.67 | % | 402 | 0 | 30 | % | — | — | ||||||||||||||||||||||||||||||||
0,75<2,50 | 95 | 2 | 49.82 | % | 7 | 0.91 | % | 7 | 42.04 | % | 580 | 3 | 51 | % | 0 | (0 | ) | |||||||||||||||||||||||||||||||
2,50<10,00 | 202 | 107 | 50.42 | % | 28 | 4.25 | % | 13 | 43.07 | % | 292 | 31 | 112 | % | 1 | (1 | ) | |||||||||||||||||||||||||||||||
10,00<100,00 | 12 | 8 | 50.21 | % | 5 | 18.09 | % | 5 | 39.40 | % | 128 | 9 | 194 | % | 0 | (0 | ) | |||||||||||||||||||||||||||||||
100,00 (Default) | 47 | 8 | 0.00 | % | 1 | 100.00 | % | 3 | 39.20 | % | 971 | 0 | 1 | % | 0 | (1 | ) | |||||||||||||||||||||||||||||||
Institutions | 27,634 | 6,701 | 55.70 | % | 15,189 | 0.45 | % | 2,845 | 42.17 | % | 504 | 4,243 | 28 | % | 27 | (39 | ) | |||||||||||||||||||||||||||||||
|
|
|
|
|
|
|
|
|
|
|
|
|
|
|
|
|
|
|
|
|
|
|
| |||||||||||||||||||||||||
0,00<0,15 | 20,587 | 4,764 | 56.46 | % | 11,976 | 0.07 | % | 1,555 | 43.64 | % | 470 | 2,428 | 20 | % | 4 | (9 | ) | |||||||||||||||||||||||||||||||
0,15<0,25 | 2,282 | 579 | 51.01 | % | 952 | 0.20 | % | 465 | 42.67 | % | 524 | 370 | 39 | % | 1 | (2 | ) | |||||||||||||||||||||||||||||||
0,25<0,50 | 3,188 | 1,058 | 56.49 | % | 995 | 0.32 | % | 281 | 24.90 | % | 777 | 320 | 32 | % | 1 | (4 | ) | |||||||||||||||||||||||||||||||
0,50<0,75 | 326 | 108 | 50.58 | % | 235 | 0.54 | % | 167 | 37.41 | % | 1,115 | 148 | 63 | % | 0 | (1 | ) | |||||||||||||||||||||||||||||||
0,75<2,50 | 955 | 124 | 52.20 | % | 877 | 1.38 | % | 129 | 43.02 | % | 422 | 764 | 87 | % | 5 | (2 | ) | |||||||||||||||||||||||||||||||
2,50<10,00 | 124 | 38 | 50.33 | % | 68 | 4.19 | % | 139 | 36.30 | % | 973 | 87 | 127 | % | 1 | (1 | ) | |||||||||||||||||||||||||||||||
10,00<100,00 | 84 | 27 | 48.51 | % | 55 | 14.42 | % | 17 | 42.36 | % | 857 | 121 | 222 | % | 3 | (4 | ) | |||||||||||||||||||||||||||||||
100,00 (Default) | 89 | 3 | 49.73 | % | 30 | 100.00 | % | 92 | 37.85 | % | 118 | 4 | 14 | % | 11 | (16 | ) | |||||||||||||||||||||||||||||||
Corporate SMEs | 18,431 | 4,551 | 40.20 | % | 18,841 | 10.32 | % | 32,755 | 44.17 | % | 788 | 12,355 | 66 | % | 816 | (1,029 | ) | |||||||||||||||||||||||||||||||
|
|
|
|
|
|
|
|
|
|
|
|
|
|
|
|
|
|
|
|
|
|
|
| |||||||||||||||||||||||||
0,00<0,15 | 2,748 | 1,092 | 41.84 | % | 3,980 | 0.11 | % | 7,001 | 51.29 | % | 715 | 1,058 | 27 | % | 2 | (12 | ) | |||||||||||||||||||||||||||||||
0,15<0,25 | 672 | 214 | 43.85 | % | 901 | 0.20 | % | 1,584 | 51.47 | % | 705 | 346 | 38 | % | 1 | (3 | ) | |||||||||||||||||||||||||||||||
0,25<0,50 | 1,502 | 352 | 42.46 | % | 1,686 | 0.32 | % | 2,883 | 48.18 | % | 738 | 832 | 49 | % | 3 | (6 | ) | |||||||||||||||||||||||||||||||
0,50<0,75 | 3,524 | 594 | 44.73 | % | 3,380 | 0.52 | % | 3,776 | 41.44 | % | 908 | 2,351 | 70 | % | 7 | (14 | ) | |||||||||||||||||||||||||||||||
0,75<2,50 | 4,079 | 1,055 | 38.60 | % | 3,642 | 1.17 | % | 5,840 | 42.45 | % | 986 | 3,190 | 88 | % | 18 | (25 | ) | |||||||||||||||||||||||||||||||
2,50<10,00 | 3,639 | 1,065 | 36.26 | % | 3,136 | 4.21 | % | 7,416 | 37.93 | % | 855 | 3,337 | 106 | % | 50 | (179 | ) | |||||||||||||||||||||||||||||||
10,00<100,00 | 612 | 130 | 33.81 | % | 458 | 18.44 | % | 1,511 | 35.54 | % | 1,250 | 772 | 169 | % | 30 | (27 | ) | |||||||||||||||||||||||||||||||
100,00 (Default) | 1,656 | 48 | 37.92 | % | 1,657 | 100.00 | % | 2,744 | 42.56 | % | 120 | 468 | 28 | % | 705 | (762 | ) | |||||||||||||||||||||||||||||||
Corporate Non-SMEs | 61,299 | 62,074 | 48.60 | % | 90,321 | 2.42 | % | 11,898 | 41.72 | % | 706 | 40,643 | 45 | % | 761 | (1,266 | ) | |||||||||||||||||||||||||||||||
|
|
|
|
|
|
|
|
|
|
|
|
|
|
|
|
|
|
|
|
|
|
|
| |||||||||||||||||||||||||
0,00<0,15 | 26,073 | 34,260 | 48.63 | % | 43,874 | 0.11 | % | 2,755 | 43.53 | % | 704 | 12,349 | 28 | % | 21 | (23 | ) | |||||||||||||||||||||||||||||||
0,15<0,25 | 6,583 | 8,835 | 49.24 | % | 11,432 | 0.20 | % | 1,046 | 40.73 | % | 755 | 4,874 | 43 | % | 9 | (16 | ) | |||||||||||||||||||||||||||||||
0,25<0,50 | 13,183 | 11,376 | 49.87 | % | 18,964 | 0.31 | % | 1,797 | 39.94 | % | 753 | 10,080 | 53 | % | 24 | (23 | ) | |||||||||||||||||||||||||||||||
0,50<0,75 | 6,077 | 3,529 | 46.25 | % | 7,176 | 0.50 | % | 1,711 | 38.84 | % | 697 | 4,781 | 67 | % | 14 | (16 | ) | |||||||||||||||||||||||||||||||
0,75<2,50 | 4,184 | 2,382 | 46.82 | % | 4,192 | 1.14 | % | 1,701 | 42.05 | % | 681 | 3,800 | 91 | % | 20 | (23 | ) | |||||||||||||||||||||||||||||||
2,50<10,00 | 2,942 | 1,298 | 41.08 | % | 2,420 | 4.40 | % | 2,082 | 41.60 | % | 548 | 3,456 | 143 | % | 45 | (171 | ) | |||||||||||||||||||||||||||||||
10,00<100,00 | 500 | 280 | 45.66 | % | 458 | 13.86 | % | 169 | 42.51 | % | 815 | 974 | 213 | % | 27 | (12 | ) | |||||||||||||||||||||||||||||||
100,00 (Default) | 1,757 | 114 | 46.17 | % | 1,805 | 100.00 | % | 637 | 33.33 | % | 233 | 330 | 18 | % | 602 | (982 | ) | |||||||||||||||||||||||||||||||
Retail - Mortgage exposures | 74,000 | 4,378 | 3.69 | % | 74,139 | 4.36 | % | 1,054,848 | 24.12 | % | — | 8,904 | 12 | % | 610 | (941 | ) | |||||||||||||||||||||||||||||||
|
|
|
|
|
|
|
|
|
|
|
|
|
|
|
|
|
|
|
|
|
|
|
| |||||||||||||||||||||||||
0,00<0,15 | 56,265 | 3,104 | 3.69 | % | 56,366 | 0.05 | % | 838,237 | 23.26 | % | — | 1,774 | 3 | % | 6 | (9 | ) | |||||||||||||||||||||||||||||||
0,15<0,25 | 2,005 | 28 | 3.70 | % | 2,005 | 0.20 | % | 25,223 | 29.24 | % | — | 248 | 12 | % | 1 | (2 | ) | |||||||||||||||||||||||||||||||
0,25<0,50 | 3,281 | 423 | 3.69 | % | 3,296 | 0.32 | % | 42,025 | 30.85 | % | — | 617 | 19 | % | 3 | (2 | ) | |||||||||||||||||||||||||||||||
0,50<0,75 | 1,953 | 255 | 3.69 | % | 1,961 | 0.54 | % | 26,409 | 29.99 | % | — | 518 | 26 | % | 3 | (3 | ) | |||||||||||||||||||||||||||||||
0,75<2,50 | 4,268 | 328 | 3.69 | % | 4,279 | 1.09 | % | 55,196 | 26.98 | % | — | 1,617 | 38 | % | 13 | (50 | ) | |||||||||||||||||||||||||||||||
2,50<10,00 | 2,297 | 199 | 3.69 | % | 2,302 | 4.74 | % | 28,834 | 26.87 | % | — | 1,993 | 87 | % | 29 | (200 | ) | |||||||||||||||||||||||||||||||
10,00<100,00 | 1,112 | 40 | 3.69 | % | 1,112 | 18.89 | % | 11,614 | 26.86 | % | — | 1,778 | 160 | % | 58 | (82 | ) | |||||||||||||||||||||||||||||||
100,00 (Default) | 2,820 | 0 | 3.69 | % | 2,818 | 100.00 | % | 27,310 | 17.61 | % | — | 359 | 13 | % | 496 | (593 | ) | |||||||||||||||||||||||||||||||
| BBVA. PILLAR III 2020 | RISK | P. 73 |
PD Scale as of 12-31-2019(1)(7) | Original on- balance sheet gross exposure | Off-balance sheet exposures pre CCF | Average CCF(2) | EAD post CRM and post-CCF | Average PD(3) | Number of obligors | Average LGD(4) | Average Maturity (days)(5) | RWAs | RWA Density | EL | Value adjustments and provisions | ||||||||||||||||||||||||||||||||||||
Retail - Other exposures SMEs |
| 3,556 |
| 884 | 54.98 | % | 4,002 | 12.64 | % | 155,069 | 51.92 | % | — | 1,635 | 41 | % | 291 | (268 | ) | |||||||||||||||||||||||||||||
|
|
|
|
|
|
|
|
|
|
|
|
|
|
|
|
|
|
|
|
|
|
|
| |||||||||||||||||||||||||
0,00<0,15 | 327 | 238 | 53.30 | % | 454 | 0.11 | % | 23,712 | 51.75 | % | — | 52 | 11 | % | 0 | (1 | ) | |||||||||||||||||||||||||||||||
0,15<0,25 | 146 | 66 | 53.94 | % | 182 | 0.20 | % | 7,173 | 52.52 | % | — | 32 | 18 | % | 0 | (0 | ) | |||||||||||||||||||||||||||||||
0,25<0,50 | 256 | 95 | 55.62 | % | 308 | 0.31 | % | 11,021 | 51.93 | % | — | 71 | 23 | % | 0 | (0 | ) | |||||||||||||||||||||||||||||||
0,50<0,75 | 343 | 119 | 54.22 | % | 404 | 0.52 | % | 15,094 | 51.96 | % | — | 127 | 32 | % | 1 | (1 | ) | |||||||||||||||||||||||||||||||
0,75<2,50 | 871 | 188 | 57.10 | % | 969 | 1.18 | % | 33,664 | 51.38 | % | — | 441 | 45 | % | 6 | (4 | ) | |||||||||||||||||||||||||||||||
2,50<10,00 | 1,019 | 140 | 57.71 | % | 1,083 | 4.31 | % | 42,177 | 50.48 | % | — | 653 | 60 | % | 23 | (24 | ) | |||||||||||||||||||||||||||||||
10,00<100,00 | 197 | 29 | 50.15 | % | 203 | 21.54 | % | 8,279 | 46.14 | % | — | 176 | 87 | % | 20 | (13 | ) | |||||||||||||||||||||||||||||||
100,00 (Default) | 398 | 10 | 40.29 | % | 400 | 100.00 | % | 13,949 | 59.90 | % | — | 82 | 21 | % | 240 | (225 | ) | |||||||||||||||||||||||||||||||
Retail - Other exposures Non-SMEs | 11,441 | 16 | 50.49 | % | 11,445 | 6.68 | % | 1,023,637 | 56.53 | % | — | 4,223 | 37 | % | 392 | (611 | ) | |||||||||||||||||||||||||||||||
|
|
|
|
|
|
|
|
|
|
|
|
|
|
|
|
|
|
|
|
|
|
|
| |||||||||||||||||||||||||
0,00<0,15 | 4,856 | 5 | 37.66 | % | 4,858 | 0.06 | % | 385,973 | 54.67 | % | — | 446 | 9 | % | 2 | (3 | ) | |||||||||||||||||||||||||||||||
0,15<0,25 | 642 | 1 | 50.83 | % | 643 | 0.20 | % | 65,735 | 61.12 | % | — | 171 | 27 | % | 1 | (2 | ) | |||||||||||||||||||||||||||||||
0,25<0,50 | 794 | 1 | 57.89 | % | 794 | 0.30 | % | 81,542 | 59.77 | % | — | 263 | 33 | % | 1 | (3 | ) | |||||||||||||||||||||||||||||||
0,50<0,75 | 1,017 | 4 | 56.77 | % | 1,018 | 0.50 | % | 107,899 | 60.19 | % | — | 467 | 46 | % | 3 | (5 | ) | |||||||||||||||||||||||||||||||
0,75<2,50 | 1,321 | 1 | 59.13 | % | 1,322 | 1.17 | % | 135,038 | 60.27 | % | — | 898 | 68 | % | 9 | (13 | ) | |||||||||||||||||||||||||||||||
2,50<10,00 | 1,984 | 3 | 60.58 | % | 1,983 | 3.87 | % | 171,172 | 55.94 | % | — | 1,674 | 84 | % | 43 | (104 | ) | |||||||||||||||||||||||||||||||
10,00<100,00 | 212 | 1 | 40.54 | % | 212 | 21.30 | % | 20,638 | 57.20 | % | — | 276 | 130 | % | 26 | (24 | ) | |||||||||||||||||||||||||||||||
100,00 (Default) | 615 | 0 | 41.67 | % | 615 | 100.00 | % | 55,640 | 49.80 | % | — | 29 | 5 | % | 306 | (457 | ) | |||||||||||||||||||||||||||||||
Retail - qualifying revolving (QRRE) | 7,190 | 17,428 | 18.59 | % | 10,430 | 6.48 | % | 8,773,578 | 68.56 | % | — | 7,365 | 71 | % | 527 | (646 | ) | |||||||||||||||||||||||||||||||
|
|
|
|
|
|
|
|
|
|
|
|
|
|
|
|
|
|
|
|
|
|
|
| |||||||||||||||||||||||||
0,00<0,15 | 1,104 | 4,540 | 24.90 | % | 2,234 | 0.04 | % | 2,782,216 | 45.53 | % | — | 30 | 1 | % | 0 | (1 | ) | |||||||||||||||||||||||||||||||
0,15<0,25 | 23 | 41 | 26.66 | % | 34 | 0.20 | % | 37,976 | 49.63 | % | — | 2 | 6 | % | 0 | (0 | ) | |||||||||||||||||||||||||||||||
0,25<0,50 | 78 | 131 | 26.00 | % | 112 | 0.29 | % | 140,727 | 48.95 | % | — | 8 | 8 | % | 0 | (0 | ) | |||||||||||||||||||||||||||||||
0,50<0,75 | 472 | 1,757 | 12.40 | % | 690 | 0.52 | % | 484,949 | 71.11 | % | — | 130 | 19 | % | 3 | (3 | ) | |||||||||||||||||||||||||||||||
0,75<2,50 | 1,595 | 5,377 | 13.57 | % | 2,324 | 1.15 | % | 1,494,958 | 74.25 | % | — | 836 | 36 | % | 20 | (33 | ) | |||||||||||||||||||||||||||||||
2,50<10,00 | 2,697 | 5,040 | 18.77 | % | 3,643 | 5.05 | % | 2,728,548 | 76.09 | % | — | 3,797 | 104 | % | 141 | (204 | ) | |||||||||||||||||||||||||||||||
10,00<100,00 | 1,009 | 542 | 31.38 | % | 1,179 | 20.92 | % | 961,891 | 76.20 | % | — | 2,549 | 216 | % | 188 | (247 | ) | |||||||||||||||||||||||||||||||
100,00 (Default) | 213 | 1 | 29.70 | % | 213 | 100.00 | % | 142,313 | 82.07 | % | — | 13 | 6 | % | 175 | (159 | ) | |||||||||||||||||||||||||||||||
Equity | 2,883 | — | 0.00 | % | 2,883 | 1.18 | % | — | 88.67 | % | — | 5,554 | 193 | % | 30 | — | ||||||||||||||||||||||||||||||||
|
|
|
|
|
|
|
|
|
|
|
|
|
|
|
|
|
|
|
|
|
|
|
| |||||||||||||||||||||||||
0,00<0,15 | 1,687 | — | 0.00 | % | 1,687 | 0.14 | % | — | 89.56 | % | — | 2,013 | 119 | % | 2 | — | ||||||||||||||||||||||||||||||||
0,15<0,25 | 110 | — | 0.00 | % | 110 | 0.20 | % | — | 65.00 | % | — | 112 | 103 | % | 0 | — | ||||||||||||||||||||||||||||||||
0,25<0,50 | 0 | — | 0.00 | % | — | 0.31 | % | — | 65.00 | % | — | 0 | 0 | % | — | — | ||||||||||||||||||||||||||||||||
0,50<0,75 | 14 | — | 0.00 | % | 14 | 0.58 | % | — | 65.00 | % | — | 23 | 160 | % | 0 | — | ||||||||||||||||||||||||||||||||
0,75<2,50 | 443 | — | — | 443 | 0.78 | % | — | 90.00 | % | — | 1,081 | 244 | % | 3 | — | |||||||||||||||||||||||||||||||||
2,50<10,00 | 630 | — | — | 630 | 4.41 | % | — | 90.00 | % | — | 2,325 | 369 | % | 25 | — | |||||||||||||||||||||||||||||||||
10,00<100,00 | — | — | — | — | — | — | — | — | — | — | — | — | ||||||||||||||||||||||||||||||||||||
100,00 (Default) | — | — | — | — | — | — | — | — | — | — | — | — | ||||||||||||||||||||||||||||||||||||
|
|
|
|
|
|
|
|
|
|
|
|
|
|
|
|
|
|
|
|
|
|
|
| |||||||||||||||||||||||||
Total Standardised Approach | 221,219 | 97,013 | 41.11 | % | 245,171 | 3.97 | % | 11,055,042 | 37.74 | % | 90,193 | 37 | % | 3,569 | (4,867 | ) | ||||||||||||||||||||||||||||||||
|
|
|
|
|
|
|
|
|
|
|
|
|
|
|
|
|
|
|
|
|
|
|
| |||||||||||||||||||||||||
| (1) | PD Intervals recommended by the EBA Guidelines on Disclosure Requirements under Part Eight of the CRR. |
| (2) | Calculated as EAD after CCF for off-balance sheet exposure over total off-balance exposure before CCF. |
| (3) | Corresponds to obligor grade PD weighted by EAD post CRM. |
| (4) | Corresponds to obligor grade LGD weighted by EAD post CRM. |
| (5) | Corresponds to the obligor maturity in days weighted by EAD post CRM. According to Regulation (EU) No 680/2014, it is reported only for categories in which the average maturities are relevant for the calculation of RWAs. |
| (6) | Exposure classified in the FIRB approach corresponds to specialised lending. The Group has chosen to use the slotting criteria, in line with Article 153.5 of the CRR. |
| (7) | It does not include the frontloading amount to partially cover the regulatory impacts derived from Targeted Review of Internal Models (TRIM) and other regulatory/supervisory impacts. |
| BBVA. PILLAR III 2020 | 3.RISK | P. 74 |
The information included in the above tables is set out below in graphic format (including counterparty risk):
Chart 7. IRB Approach: EAD by obligor category
(Million Euros)
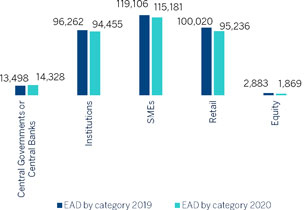
Chart 8. IRB Approach: Weighted average PD by EAD
(Million Euros)
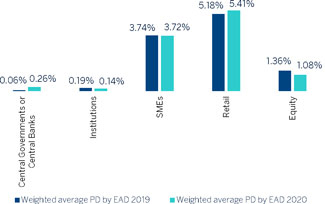
Chart 9. IRB Approach: Weighted average LGD by EAD
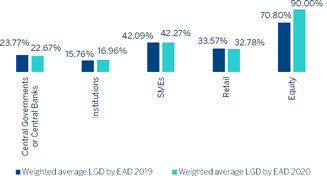
Chart 10. IRB Approach: RWAs by obligor category
(Million Euros)
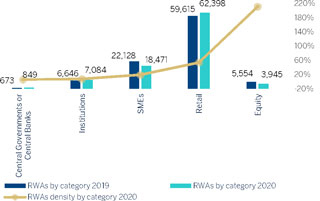
Table 33. Average PD and LGD by category and country (Spain. 12-31-2020)
Exposure Class | Weighted average PD by EAD | Weighted average LGD by EAD | ||||||
Central governments or central banks | 0.26 | % | 22.67 | % | ||||
Institutions | 0.14 | % | 16.96 | % | ||||
Corporates | 3.84 | % | 43.75 | % | ||||
Corporates - SMEs | 14.07 | % | 45.41 | % | ||||
Corporates - Other | 2.16 | % | 43.48 | % | ||||
Retail | 5.11 | % | 29.73 | % | ||||
Of which: mortgage exposures - SMEs | 2.61 | % | 17.60 | % | ||||
Of which: mortgage exposures - Non SMEs | 4.17 | % | 24.03 | % | ||||
Of which: qualifying revolving (QRRE) | 3.22 | % | 48.89 | % | ||||
Of which: other exposures SMEs | 15.63 | % | 51.76 | % | ||||
Of which: other exposures Non SMEs | 8.58 | % | 55.25 | % | ||||
|
|
|
| |||||
IRB approach totals | 2.84 | % | 29.63 | % | ||||
|
|
|
| |||||
| BBVA. PILLAR III 2020 | 3. RISK | P. 75 |
PD and LGD by category and country (Mexico. 12-31-2020)
Exposure Class | Weighted average PD by EAD | Weighted average LGD by EAD | ||||||
Central governments or central banks | ||||||||
Institutions | ||||||||
Corporates | 3.08 | % | 34.50 | % | ||||
Corporates - SMEs | 5.67 | % | 38.15 | % | ||||
Corporates - Other | 2.58 | % | 33.79 | % | ||||
Retail | 9.82 | % | 76.31 | % | ||||
Of which: mortgage exposures - SMEs | ||||||||
Of which: mortgage exposures - Non SMEs | ||||||||
Of which: qualifying revolving (QRRE) | 9.82 | % | 76.31 | % | ||||
Of which: other exposures SMEs | ||||||||
Of which: other exposures Non SMEs | ||||||||
|
|
|
| |||||
IRB approach totals | 4.85 | % | 45.49 | % | ||||
|
|
|
| |||||
To provide backtesting data to validate the reliability of PD calculations, the table compares the PD used in IRB capital calculations with the effective default rates for the Group’s obligors (credit and counterparty credit risk) is included below.
The information is broken down by geographies using internal models. The criteria adopted to comply with the EBA uniform template are as follows:
| • | Portfolio: The portfolio breakdown corresponds to that recommended by the supervisor, excluding equity positions. |
| • | PD Range: These are those included in the Group’s internal master scale of ratings found in 3.2.5.1.2 (Table 31). |
| • | External rating equivalence: Equivalence between PDs and external ratings described in 3.2.5.1.2 has been used. |
| • | Weighted average PD and arithmetic average PD by obligor: The guarantor’s probability of default (PD) is used in cases where the guarantor is eligible, and its PD is lower than the debtor’s PD. |
| • | Number of obligors: Obligors are presented at end of the financial year and at end of previous financial year. |
| • | Defaulted obligors: In order to ensure the traceability of the table, columns “g” and “h” in the standard table have been unified to show information on operations/clients who defaulted at some point during the last 12 months, so that defaulted obligors over the year is broken down by PD range. |
| • | Average historical annual default rate: It corresponds to the average annual default rate for the last five years. |
Table 34. EU CR9 - IRB approach - Backtesting of PD per exposure class (BBVA, S.A. Million euros. 12-31-2020)
| External rating | Weighted | Arithmetic average PD | Number of Obligors | Defaulted obligors in | Average historical annual | |||||||||||||||||||||||
PD Range | equivalent | average PD(1) | by obligors | 12-31-2020 | 12-31-2019 | the year | default rate | |||||||||||||||||||||
Central governments or central banks | ||||||||||||||||||||||||||||
0.00<0.02 | AAA | 0.01 | % | 0.01 | % | 5 | 5 | — | — | |||||||||||||||||||
0.02<0.03 | AA+ | 0.03 | % | 0.03 | % | 1 | 1 | — | — | |||||||||||||||||||
0.03<0.04 | AA | 0.03 | % | 0.03 | % | 1 | 3 | — | — | |||||||||||||||||||
0.04<0.05 | AA- | 0.04 | % | 0.04 | % | 4 | 3 | — | — | |||||||||||||||||||
0.05<0.06 | A+ | 0.05 | % | 0.05 | % | 8 | 8 | — | — | |||||||||||||||||||
0.06<0.09 | A | 0.08 | % | 0.07 | % | 1 | 1 | — | — | |||||||||||||||||||
0.09<0.11 | A- | 0.10 | % | 0.10 | % | 3 | 2 | — | — | |||||||||||||||||||
0.11<0.17 | BBB+ | 0.15 | % | 0.13 | % | 7 | 5 | — | — | |||||||||||||||||||
0.17<0.24 | BBB | 0.20 | % | 0.19 | % | 5 | 4 | — | — | |||||||||||||||||||
0.29<0.39 | BBB- | 0.29 | % | 0.29 | % | 3 | 4 | — | — | |||||||||||||||||||
0.39<0.67 | BB+ | 0.48 | % | 0.51 | % | 1 | 1 | — | — | |||||||||||||||||||
0.67<1.16 | BB | 0.86 | % | 0.83 | % | 2 | 4 | — | — | |||||||||||||||||||
1.16<1.94 | BB- | 1.30 | % | 1.43 | % | 2 | 3 | 2 | 100.00 | % | ||||||||||||||||||
1.94<3.35 | B+ | 2.48 | % | 2.52 | % | 6 | 3 | 1 | 12.50 | % | ||||||||||||||||||
3.35<5.81 | B | 4.41 | % | 4.41 | % | 4 | 2 | — | — | |||||||||||||||||||
5.81<11.61 | B- | 7.85 | % | 7.85 | % | 4 | 8 | 1 | 20.00 | % | ||||||||||||||||||
11.61<100.00 | C | 19.24 | % | 24.90 | % | 6 | 5 | — | — | |||||||||||||||||||
100.00 (default) | D | 100.00 | % | 100.00 | % | 6 | 3 | — | — | |||||||||||||||||||
Institutions | ||||||||||||||||||||||||||||
0.00<0.02 | AAA | 0.03 | % | 0.03 | % | 10 | 10 | — | — | |||||||||||||||||||
0.02<0.03 | AA+ | 0.03 | % | 0.03 | % | 11 | 9 | — | — | |||||||||||||||||||
0.03<0.04 | AA | 0.03 | % | 0.03 | % | 29 | 31 | — | — | |||||||||||||||||||
0.04<0.05 | AA- | 0.04 | % | 0.04 | % | 151 | 146 | — | — | |||||||||||||||||||
0.05<0.06 | A+ | 0.05 | % | 0.05 | % | 387 | 324 | — | — | |||||||||||||||||||
0.06<0.09 | A | 0.08 | % | 0.08 | % | 143 | 162 | — | — | |||||||||||||||||||
| BBVA. PILLAR III 2020 | 3. RISK | P. 76 |
| External rating | Weighted | Arithmetic average PD | Number of Obligors | Defaulted obligors in | Average historical annual | |||||||||||||||||||||
PD Range | equivalent | average PD(1) | by obligors | 12-31-2020 | 12-31-2019 | the year | default rate | |||||||||||||||||||
0.09<0.11 | A- | 0.10 | % | 0.09 | % | 475 | 486 | 9 | 0.32 | % | ||||||||||||||||
0.11<0.17 | BBB+ | 0.14 | % | 0.15 | % | 1,113 | 1,158 | 10 | 0.80 | % | ||||||||||||||||
0.17<0.24 | BBB | 0.20 | % | 0.24 | % | 521 | 536 | 4 | 0.85 | % | ||||||||||||||||
0.29<0.39 | BBB- | 0.31 | % | 0.35 | % | 337 | 325 | — | 0.54 | % | ||||||||||||||||
0.39<0.67 | BB+ | 0.51 | % | 0.69 | % | 174 | 188 | — | 1.29 | % | ||||||||||||||||
0.67<1.16 | BB | 0.88 | % | 0.89 | % | 88 | 89 | — | — | |||||||||||||||||
1.16<1.94 | BB- | 1.50 | % | 1.13 | % | 190 | 176 | — | — | |||||||||||||||||
1.94<3.35 | B+ | 2.55 | % | 2.57 | % | 62 | 73 | — | 0.60 | % | ||||||||||||||||
3.35<5.81 | B | 4.41 | % | 4.41 | % | 56 | 59 | — | 0.91 | % | ||||||||||||||||
5.81<11.61 | B- | 7.94 | % | 7.86 | % | 33 | 22 | — | 1.68 | % | ||||||||||||||||
11.61<100.00 | C | 17.05 | % | 15.92 | % | 23 | 21 | — | — | |||||||||||||||||
100.00 (default) | D | 100.00 | % | 100.00 | % | 72 | 92 | — | — | |||||||||||||||||
Corporate - SMEs | ||||||||||||||||||||||||||
0.00<0.02 | AAA | 0.03 | % | 0.03 | % | 105 | 74 | — | — | |||||||||||||||||
0.02<0.03 | AA+ | 0.03 | % | 0.03 | % | 45 | 20 | — | — | |||||||||||||||||
0.03<0.04 | AA | 0.03 | % | 0.03 | % | 24 | 45 | — | — | |||||||||||||||||
0.04<0.05 | AA- | 0.05 | % | 0.05 | % | 2 | 15 | — | — | |||||||||||||||||
0.05<0.06 | A+ | 0.05 | % | 0.05 | % | 31 | 21 | — | — | |||||||||||||||||
0.06<0.09 | A | 0.07 | % | 0.07 | % | 75 | 52 | — | — | |||||||||||||||||
0.09<0.11 | A- | 0.11 | % | 0.11 | % | 3,984 | 5,124 | 5 | 0.11 | % | ||||||||||||||||
0.11<0.17 | BBB+ | 0.15 | % | 0.17 | % | 1,896 | 1,878 | 6 | 0.22 | % | ||||||||||||||||
0.17<0.24 | BBB | 0.22 | % | 0.35 | % | 1,721 | 1,615 | 6 | 0.18 | % | ||||||||||||||||
0.29<0.39 | BBB- | 0.64 | % | 0.88 | % | 2,420 | 2,590 | 11 | 0.38 | % | ||||||||||||||||
0.39<0.67 | BB+ | 0.56 | % | 0.52 | % | 2,896 | 2,953 | 23 | 0.70 | % | ||||||||||||||||
0.67<1.16 | BB | 0.94 | % | 0.88 | % | 3,139 | 2,855 | 30 | 1.21 | % | ||||||||||||||||
1.16<1.94 | BB- | 1.58 | % | 1.94 | % | 2,563 | 2,778 | 43 | 2.02 | % | ||||||||||||||||
1.94<3.35 | B+ | 2.75 | % | 3.05 | % | 3,235 | 2,690 | 71 | 2.81 | % | ||||||||||||||||
3.35<5.81 | B | 4.51 | % | 4.58 | % | 4,283 | 2,243 | 72 | 3.34 | % | ||||||||||||||||
5.81<11.61 | B- | 8.02 | % | 8.60 | % | 1,299 | 2,396 | 79 | 7.00 | % | ||||||||||||||||
11.61<100.00 | C | 19.52 | % | 23.15 | % | 2,596 | 1,512 | 109 | 6.36 | % | ||||||||||||||||
100.00 (default) | D | 100.00 | % | 100.00 | % | 2,618 | 2,635 | — | — | |||||||||||||||||
Corporate - Non-SMEs | ||||||||||||||||||||||||||
0.00<0.02 | AAA | — | — | — | — | — | — | |||||||||||||||||||
0.02<0.03 | AA+ | 0.03 | % | 0.03 | % | 34 | 31 | — | — | |||||||||||||||||
0.03<0.04 | AA | 0.03 | % | 0.03 | % | 36 | 37 | — | — | |||||||||||||||||
0.04<0.05 | AA- | 0.04 | % | 0.04 | % | 20 | 19 | — | — | |||||||||||||||||
0.05<0.06 | A+ | 0.05 | % | 0.05 | % | 51 | 50 | 1 | 2.27 | % | ||||||||||||||||
0.06<0.09 | A | 0.08 | % | 0.08 | % | 213 | 244 | 1 | 0.46 | % | ||||||||||||||||
0.09<0.11 | A- | 0.10 | % | �� | 0.09 | % | 1,173 | 1,563 | 2 | 0.13 | % | |||||||||||||||
0.11<0.17 | BBB+ | 0.14 | % | 0.14 | % | 1,100 | 1,034 | 4 | 0.56 | % | ||||||||||||||||
0.17<0.24 | BBB | 0.20 | % | 0.20 | % | 1,114 | 1,063 | 9 | 0.49 | % | ||||||||||||||||
0.29<0.39 | BBB- | 0.31 | % | 0.32 | % | 1,533 | 1,444 | 5 | 0.36 | % | ||||||||||||||||
0.39<0.67 | BB+ | 0.51 | % | 0.52 | % | 1,003 | 900 | 11 | 1.06 | % | ||||||||||||||||
0.67<1.16 | BB | 0.88 | % | 0.93 | % | 774 | 570 | 2 | 0.93 | % | ||||||||||||||||
1.16<1.94 | BB- | 1.60 | % | 1.63 | % | 506 | 389 | 18 | 2.51 | % | ||||||||||||||||
1.94<3.35 | B+ | 3.00 | % | 3.03 | % | 496 | 412 | 17 | 2.69 | % | ||||||||||||||||
3.35<5.81 | B | 4.40 | % | 4.46 | % | 524 | 432 | 8 | 5.40 | % | ||||||||||||||||
5.81<11.61 | B- | 7.92 | % | 9.81 | % | 213 | 201 | 13 | 8.84 | % | ||||||||||||||||
11.61<100.00 | C | 46.30 | % | 45.54 | % | 221 | 154 | 15 | 10.29 | % | ||||||||||||||||
100.00 (default) | D | 100.00 | % | 100.00 | % | 376 | 391 | — | — | |||||||||||||||||
Retail - Mortgage exposures | ||||||||||||||||||||||||||
0.00<0.02 | AAA | 0.03 | % | 0.03 | % | 470,671 | 447,207 | 410 | 0.04 | % | ||||||||||||||||
0.02<0.03 | AA+ | 0.03 | % | 0.03 | % | 75,026 | 77,011 | 143 | 0.11 | % | ||||||||||||||||
0.03<0.04 | AA | 0.03 | % | 0.03 | % | 16,045 | 82,575 | 201 | 0.08 | % | ||||||||||||||||
0.04<0.05 | AA- | 0.05 | % | 0.05 | % | 20,469 | 33,040 | 71 | 0.09 | % | ||||||||||||||||
0.05<0.06 | A+ | 0.05 | % | 0.05 | % | 63,580 | 31,973 | 63 | 0.07 | % | ||||||||||||||||
0.06<0.09 | A | 0.07 | % | 0.07 | % | 90,446 | 70,598 | 273 | 0.19 | % | ||||||||||||||||
0.09<0.11 | A- | 0.10 | % | 0.10 | % | 59,002 | 53,643 | 125 | 0.15 | % | ||||||||||||||||
0.11<0.17 | BBB+ | 0.14 | % | 0.14 | % | 29,295 | 42,190 | 133 | 0.25 | % | ||||||||||||||||
0.17<0.24 | BBB | 0.20 | % | 0.20 | % | 41,258 | 25,223 | 111 | 0.36 | % | ||||||||||||||||
0.29<0.39 | BBB- | 0.32 | % | 0.31 | % | 24,476 | 42,025 | 150 | 0.35 | % | ||||||||||||||||
0.39<0.67 | BB+ | 0.49 | % | 0.50 | % | 30,465 | 26,409 | 141 | 0.50 | % | ||||||||||||||||
0.67<1.16 | BB | 0.78 | % | 0.84 | % | 37,922 | 39,287 | 409 | 1.00 | % | ||||||||||||||||
1.16<1.94 | BB- | 1.73 | % | 1.57 | % | 11,763 | 15,909 | 235 | 2.14 | % | ||||||||||||||||
1.94<3.35 | B+ | 2.64 | % | 2.64 | % | 10,484 | 10,203 | 278 | 4.93 | % | ||||||||||||||||
3.35<5.81 | B | 3.96 | % | 4.48 | % | 7,766 | 9,971 | 621 | 10.64 | % | ||||||||||||||||
5.81<11.61 | B- | 8.09 | % | 7.95 | % | 9,361 | 8,660 | 767 | 14.10 | % | ||||||||||||||||
11.61<100.00 | C | 16.96 | % | 17.40 | % | 6,337 | 11,614 | 2,338 | 21.89 | % | ||||||||||||||||
100.00 (default) | D | 100.00 | % | 100.00 | % | 26,649 | 27,310 | — | — | |||||||||||||||||
| BBVA. PILLAR III 2020 | 3. RISK | P. 77 |
| External rating | Weighted | Arithmetic average PD | Number of Obligors | Defaulted obligors in | Average historical annual | |||||||||||||||||||||||
PD Range | equivalent | average PD(1) | by obligors | 12-31-2020 | 12-31-2019 | the year | default rate | |||||||||||||||||||||
Retail - Other exposures SMEs | ||||||||||||||||||||||||||||
0.00<0.02 | AAA | — | — | — | — | — | — | |||||||||||||||||||||
0.02<0.03 | AA+ | — | — | — | — | — | — | |||||||||||||||||||||
0.03<0.04 | AA | — | — | — | — | — | — | |||||||||||||||||||||
0.04<0.05 | AA- | — | — | — | — | — | — | |||||||||||||||||||||
0.05<0.06 | A+ | — | — | — | — | — | — | |||||||||||||||||||||
0.06<0.09 | A | — | — | — | — | — | — | |||||||||||||||||||||
0.09<0.11 | A- | 0.10 | % | 0.10 | % | 16,924 | 16,439 | 8 | 0.03 | % | ||||||||||||||||||
0.11<0.17 | BBB+ | 0.14 | % | 0.16 | % | 8,213 | 7,383 | 9 | 0.06 | % | ||||||||||||||||||
0.17<0.24 | BBB | 0.21 | % | 0.26 | % | 7,626 | 7,203 | 4 | 0.10 | % | ||||||||||||||||||
0.29<0.39 | BBB- | 0.32 | % | 0.44 | % | 13,168 | 11,120 | 27 | 0.26 | % | ||||||||||||||||||
0.39<0.67 | BB+ | 0.56 | % | 0.61 | % | 15,490 | 15,151 | 60 | 0.39 | % | ||||||||||||||||||
0.67<1.16 | BB | 0.98 | % | 1.16 | % | 16,992 | 17,239 | 160 | 0.72 | % | ||||||||||||||||||
1.16<1.94 | BB- | 1.68 | % | 1.69 | % | 15,206 | 16,554 | 151 | 1.09 | % | ||||||||||||||||||
1.94<3.35 | B+ | 2.93 | % | 2.98 | % | 17,388 | 17,426 | 379 | 1.85 | % | ||||||||||||||||||
3.35<5.81 | B | 4.65 | % | 4.68 | % | 18,918 | 15,527 | 404 | 2.61 | % | ||||||||||||||||||
5.81<11.61 | B- | 8.44 | % | 8.46 | % | 8,000 | 9,388 | 354 | 5.31 | % | ||||||||||||||||||
11.61<100.00 | C | 23.92 | % | 29.89 | % | 10,179 | 8,315 | 781 | 8.75 | % | ||||||||||||||||||
100.00 (default) | D | 100.00 | % | 100.00 | % | 15,349 | 13,980 | — | — | |||||||||||||||||||
Retail - Other exposures Non-SMEs | ||||||||||||||||||||||||||||
0.00<0.02 | AAA | 0.03 | % | 0.03 | % | 45,523 | 3 | — | 0.03 | % | ||||||||||||||||||
0.02<0.03 | AA+ | 0.03 | % | 0.03 | % | 47,895 | 102,001 | 89 | 0.05 | % | ||||||||||||||||||
0.03<0.04 | AA | 0.03 | % | 0.04 | % | 74,722 | 39,448 | 20 | 0.03 | % | ||||||||||||||||||
0.04<0.05 | AA- | — | — | — | 72,835 | — | — | |||||||||||||||||||||
0.05<0.06 | A+ | 0.06 | % | 0.06 | % | 46,484 | 43,631 | 66 | 0.09 | % | ||||||||||||||||||
0.06<0.09 | A | 0.08 | % | 0.08 | % | 76,354 | 30,849 | 51 | 0.10 | % | ||||||||||||||||||
0.09<0.11 | A- | 0.10 | % | 0.10 | % | 146 | 7,355 | 22 | 0.19 | % | ||||||||||||||||||
0.11<0.17 | BBB+ | 0.12 | % | 0.12 | % | 71,459 | 89,860 | 341 | 0.29 | % | ||||||||||||||||||
0.17<0.24 | BBB | 0.20 | % | 0.20 | % | 48,192 | 65,735 | 445 | 0.56 | % | ||||||||||||||||||
0.29<0.39 | BBB- | 0.31 | % | 0.31 | % | 120,280 | 81,542 | 632 | 0.57 | % | ||||||||||||||||||
0.39<0.67 | BB+ | 0.60 | % | 0.60 | % | 97,449 | 107,899 | 1,248 | 0.90 | % | ||||||||||||||||||
0.67<1.16 | BB | 0.92 | % | 0.91 | % | 92,219 | 68,209 | 1,179 | 1.33 | % | ||||||||||||||||||
1.16<1.94 | BB- | 1.57 | % | 1.57 | % | 77,423 | 66,829 | 1,423 | 1.84 | % | ||||||||||||||||||
1.94<3.35 | B+ | 2.52 | % | 2.50 | % | 64,274 | 74,921 | 1,950 | 2.37 | % | ||||||||||||||||||
3.35<5.81 | B | 4.18 | % | 4.19 | % | 39,595 | 78,771 | 3,163 | 3.63 | % | ||||||||||||||||||
5.81<11.61 | B- | 8.71 | % | 8.86 | % | 18,229 | 17,481 | 1,750 | 6.75 | % | ||||||||||||||||||
11.61<100.00 | C | 29.49 | % | 28.61 | % | 23,870 | 20,639 | 5,556 | 24.43 | % | ||||||||||||||||||
100.00 (default) | D | 100.00 | % | 100.00 | % | 68,954 | 55,640 | — | — | |||||||||||||||||||
Retail - qualifying revolving (QRRE) | ||||||||||||||||||||||||||||
0.00<0.02 | AAA | 0.03 | % | 0.03 | % | 1,241,113 | 753,482 | 573 | 0.02 | % | ||||||||||||||||||
0.02<0.03 | AA+ | 0.03 | % | 0.03 | % | 514,424 | 1,401,597 | 696 | 0.03 | % | ||||||||||||||||||
0.03<0.04 | AA | 0.03 | % | 0.03 | % | 518,378 | 210,330 | 291 | 0.06 | % | ||||||||||||||||||
0.04<0.05 | AA- | 0.04 | % | 0.04 | % | 110,402 | 110,402 | — | — | |||||||||||||||||||
0.05<0.06 | A+ | 0.05 | % | 0.05 | % | 2,186 | 3,972 | 3 | 0.24 | % | ||||||||||||||||||
0.06<0.09 | A | 0.07 | % | 0.07 | % | 80,719 | 65,007 | 191 | 0.24 | % | ||||||||||||||||||
0.09<0.11 | A- | 0.10 | % | 0.10 | % | 25,896 | 123,283 | 290 | 0.16 | % | ||||||||||||||||||
0.11<0.17 | BBB+ | 0.14 | % | 0.14 | % | 75,610 | 114,142 | 453 | 0.42 | % | ||||||||||||||||||
0.17<0.24 | BBB | 0.21 | % | 0.21 | % | 248,466 | 37,963 | 290 | 0.14 | % | ||||||||||||||||||
0.29<0.39 | BBB- | 0.31 | % | 0.31 | % | 97,891 | 140,687 | 887 | 0.62 | % | ||||||||||||||||||
0.39<0.67 | BB+ | 0.53 | % | 0.53 | % | 192,000 | 130,456 | 1,331 | 0.82 | % | ||||||||||||||||||
0.67<1.16 | BB | 0.92 | % | 0.91 | % | 120,196 | 129,461 | 1,617 | 1.52 | % | ||||||||||||||||||
1.16<1.94 | BB- | 1.52 | % | 1.51 | % | 68,890 | 100,825 | 2,499 | 1.90 | % | ||||||||||||||||||
1.94<3.35 | B+ | 2.47 | % | 2.47 | % | 137,465 | 78,872 | 2,258 | 2.89 | % | ||||||||||||||||||
3.35<5.81 | B | 4.77 | % | 4.73 | % | 81,254 | 66,995 | 3,431 | 3.76 | % | ||||||||||||||||||
5.81<11.61 | B- | 6.91 | % | 6.91 | % | 38,070 | 32,127 | 1,757 | 5.78 | % | ||||||||||||||||||
11.61<100.00 | C | 27.27 | % | 28.81 | % | 24,574 | 27,493 | 3,131 | 11.79 | % | ||||||||||||||||||
100.00 (default) | D | 100.00 | % | 100.00 | % | 69,940 | 66,970 | — | — | |||||||||||||||||||
Corporate - Specialised lending | 369 | 627 | ||||||||||||||||||||||||||
| (*) | A floor of 0.03% PD is applied to exposures in the categories of Institutions, Corporates and Retail, according to Articles 160 and 163 of the CRR. |
| BBVA. PILLAR III 2020 | 3. RISK | P. 78 |
EU CR9 - IRB approach - Backtesting of PD per exposure class (BBVA Mexico. Million euros. 12-31-2020)
| External rating | Weighted | Arithmetic average PD | Number of Obligors | Defaulted obligors in | Average historical annual | |||||||||||||||||||||
PD Range | equivalent | average PD(1) | by obligors | 12-31-2020 | 12-31-2019 | the year | default rate | |||||||||||||||||||
Corporate - SMEs | ||||||||||||||||||||||||||
0.00 a <0.02 | AAA | — | — | — | — | — | — | |||||||||||||||||||
0.02 a <0.03 | AA+ | — | — | — | — | — | — | |||||||||||||||||||
0.03 a <0.04 | AA | — | — | — | — | — | — | |||||||||||||||||||
0.04 a <0.05 | AA- | — | — | — | — | — | — | |||||||||||||||||||
0.05 a <0.06 | A+ | — | — | — | — | — | — | |||||||||||||||||||
0.06 a <0.09 | A | — | — | — | — | — | — | |||||||||||||||||||
0.09 a <0.11 | A- | — | — | — | — | — | — | |||||||||||||||||||
0.11 a <0.17 | BBB+ | 0.14 | % | 0.14 | % | 2 | — | — | — | |||||||||||||||||
0.17 a <0.24 | BBB | 0.19 | % | 0.20 | % | 16 | 19 | — | — | |||||||||||||||||
0.29 a <0.39 | BBB- | 0.31 | % | 0.27 | % | 67 | 374 | — | — | |||||||||||||||||
0.39 a <0.67 | BB+ | 0.53 | % | 0.50 | % | 256 | 902 | — | — | |||||||||||||||||
0.67 a <1.16 | BB | 0.90 | % | 1.00 | % | 332 | 211 | — | — | |||||||||||||||||
1.16 a <1.94 | BB- | 1.55 | % | 1.90 | % | 183 | 155 | — | — | |||||||||||||||||
1.94 a <3.35 | B+ | 2.63 | % | 2.28 | % | 105 | 110 | — | — | |||||||||||||||||
3.35 a <5.81 | B | 4.36 | % | 4.77 | % | 65 | 55 | — | — | |||||||||||||||||
5.81 a <10.61 | B- | 6.92 | % | 7.49 | % | 307 | 50 | — | — | |||||||||||||||||
10.61 a <100.00 | C | 15.62 | % | 14.25 | % | 22 | 21 | — | — | |||||||||||||||||
100.00 (default) | D | 100.00 | % | 100.00 | % | 79 | 149 | — | — | |||||||||||||||||
Corporate - Non-SMEs | 0 | 0.00 | % | 0.00 | % | — | — | — | 0 | % | ||||||||||||||||
0.00 a <0.02 | AAA | — | — | — | — | — | — | |||||||||||||||||||
0.02 a <0.03 | AA+ | — | — | — | — | — | — | |||||||||||||||||||
0.03 a <0.04 | AA | — | — | — | — | — | — | |||||||||||||||||||
0.04 a <0.05 | AA- | — | — | — | — | — | — | |||||||||||||||||||
0.05 a <0.06 | A+ | — | — | — | — | — | — | |||||||||||||||||||
0.06 a <0.09 | A | — | — | — | 5 | — | — | |||||||||||||||||||
0.09 a <0.11 | A- | 0.10 | % | 0.10 | % | — | 27 | — | — | |||||||||||||||||
0.11 a <0.17 | BBB+ | 0.14 | % | 0.13 | % | 6 | 28 | — | — | |||||||||||||||||
0.17 a <0.24 | BBB | 0.19 | % | 0.20 | % | 40 | 100 | — | — | |||||||||||||||||
0.29 a <0.39 | BBB- | 0.31 | % | 0.27 | % | 170 | 562 | 7 | 1.13 | % | ||||||||||||||||
0.39 a <0.67 | BB+ | 0.53 | % | 0.50 | % | 654 | 899 | 11 | 1.91 | % | ||||||||||||||||
0.67 a <1.16 | BB | 0.90 | % | 1.00 | % | 844 | 305 | 22 | 4.97 | % | ||||||||||||||||
1.16 a <1.94 | BB- | 1.55 | % | 1.90 | % | 467 | 511 | 29 | 6.15 | % | ||||||||||||||||
1.94 a <3.35 | B+ | 2.63 | % | 2.28 | % | 266 | 154 | 26 | 9.05 | % | ||||||||||||||||
3.35 a <5.81 | B | 4.36 | % | 4.77 | % | 166 | 177 | 33 | 12.12 | % | ||||||||||||||||
5.81 a <10.61 | B- | 6.92 | % | 7.49 | % | 781 | 763 | 37 | 2.46 | % | ||||||||||||||||
10.61 a <100.00 | C | 15.62 | % | 14.25 | % | 56 | 26 | 4 | 11.11 | % | ||||||||||||||||
100.00 (default) | D | 100.00 | % | 100.00 | % | 200 | 254 | 31 | 47.97 | % | ||||||||||||||||
Retail - qualifying revolving (QRRE) | ||||||||||||||||||||||||||
0.00 a <0.02 | AAA | — | — | — | — | — | — | |||||||||||||||||||
0.02 a <0.03 | AA+ | — | — | — | — | — | — | |||||||||||||||||||
0.03 a <0.04 | AA | — | — | — | — | — | — | |||||||||||||||||||
0.04 a <0.05 | AA- | — | — | — | — | — | — | |||||||||||||||||||
0.05 a <0.06 | A+ | — | — | — | — | — | — | |||||||||||||||||||
0.06 a <0.09 | A | — | — | — | — | — | — | |||||||||||||||||||
0.09 a <0.11 | A- | — | — | — | — | — | — | |||||||||||||||||||
0.11 a <0.17 | BBB+ | 0.15 | % | 0.15 | % | 7 | 1 | — | — | |||||||||||||||||
0.17 a <0.24 | BBB | 0.19 | % | 0.20 | % | 38 | 13 | — | 87.50 | % | ||||||||||||||||
0.29 a <0.39 | BBB- | 0.33 | % | 0.33 | % | 234 | 40 | — | 94.00 | % | ||||||||||||||||
0.39 a <0.67 | BB+ | 0.53 | % | 0.54 | % | 460,799 | 354,493 | 2,331 | 0.30 | % | ||||||||||||||||
0.67 a <1.16 | BB | 0.86 | % | 0.87 | % | 576,325 | 720,615 | 4,150 | 0.40 | % | ||||||||||||||||
1.16 a <1.94 | BB- | 1.46 | % | 1.42 | % | 751,179 | 544,057 | 8,184 | 0.87 | % | ||||||||||||||||
1.94 a <3.35 | B+ | 2.57 | % | 2.36 | % | 723,529 | 671,605 | 14,323 | 1.40 | % | ||||||||||||||||
3.35 a <5.81 | B | 4.40 | % | 4.31 | % | 697,138 | 755,064 | 26,181 | 2.13 | % | ||||||||||||||||
5.81 a <10.61 | B- | 7.92 | % | 5.90 | % | 1,136,626 | 1,123,885 | 44,319 | 2.26 | % | ||||||||||||||||
10.61 a <100.00 | C | 22.48 | % | 18.70 | % | 741,925 | 934,398 | 11,404 | 3.99 | % | ||||||||||||||||
100.00 (default) | D | 100.00 | % | 100.00 | % | 114,876 | 75,343 | 3,706 | 9.92 | % | ||||||||||||||||
| (*) | A floor of 0.03% PD is applied to exposures in the categories of Institutions, Corporates and Retail, according to Articles 160 and 163 of the CRR. |
The following table shows the flow statements of credit and counterparty credit risk RWA under internal model (IRB) during the last quarter of 2020:
| BBVA. PILLAR III 2020 | 3. RISK | P. 79 |
Table 35. EU CR8 - RWA flow statements of credit risk and counterparty exposures under the IRB approach (Million euros)
| Credit Risk | Counterparty Credit Risk | Total | ||||||||||||||||||||||
| RWA amounts | Capital Requirements | RWA amounts | Capital Requirements | RWA amounts | Capital requirements | |||||||||||||||||||
RWAs as of September 30, 2020 | 82,207 | 6,577 | 4,495 | 360 | 86,702 | 6,936 | ||||||||||||||||||
|
|
|
|
|
|
|
|
|
|
|
| |||||||||||||
Asset size | (102 | ) | (8 | ) | (144 | ) | (12 | ) | (246 | ) | (20 | ) | ||||||||||||
Asset quality | (40 | ) | (3 | ) | 117 | 9 | 77 | 6 | ||||||||||||||||
Model updates | — | — | — | — | — | — | ||||||||||||||||||
Methodology and policy | — | — | — | — | — | — | ||||||||||||||||||
Acquisitions and disposals | — | — | — | — | — | — | ||||||||||||||||||
Foreign exchange movements | 51 | 4 | 145 | 12 | 196 | 16 | ||||||||||||||||||
Other | — | — | — | — | — | — | ||||||||||||||||||
|
|
|
|
|
|
|
|
|
|
|
| |||||||||||||
RWAs as of December 31, 2020 | 82,115 | 6,569 | 4,613 | 369 | 86,729 | 6,938 | ||||||||||||||||||
|
|
|
|
|
|
|
|
|
|
|
| |||||||||||||
During the last quarter of 2020, credit risk RWA (ex-fx effect) under internal models lodged a slight decreased, with an opposite behaviour amongst different regulatory categories. Likewise, while institutions portfolio registered a rise in RWA, it is worth noting the slow down in the corporates portfolio RWA (in both Spain and Mexico). The foreign exchange effect, in aggregate terms, has generated a slight increase in credit risk RWA in the portfolios under the IRB approach, as a combination of the appreciation of the Mexican peso (+ 7%) that has been partially offset by the depreciation of the US dollar (-5%).
The full annual series of RWA flow of credit risk under the IRB approach is available in the editable file “Pillar III 2020 – Tables & Annexes”.
3.2.5.3. Comparative analysis of the estimates made
The charts compare the expected loss calculated according to the Group’s internal estimates of parameters for the main portfolios approved by the European Central Bank, with the effective loss incurred between 20023 and the most recent date available. It is important to emphasise that a number of regulatory changes are currently underway that affect the default score, such as the implementation of the new PD and LGD guidelines issued by the European Banking Authority or the new definition of default. As such, the series available to the entity as of 31 December 2020 are shown, though said parametrics may be pending approval by supervisory authorities.
The series shown are as follows:
| • | Observed loss: effective loss calculated as the default rate ratio4 observed, multiplied by the estimated point in time loss given default (LGD)5. |
| • | Average: average effective loss, which is the simple average of observed losses since 2002. |
| • | Expected loss: this is calculated as the average annual default rate since 2002 multiplied by the average annual loss given de fault since 2002. |
The observed loss is the annual loss incurred. It must be less than the expected loss adjusted to the cycle in the expansionary years of an economic cycle, and greater during years of crisis.
The comparison has been made for the portfolios of Mortgages, Consumer Finance, Credit Cards, Autos (retailers), and Commercial and Real Estate Developers, all of them in Spain and Portugal. In Mexico, Credit Card and Corporates have been compared for the period from 20046 to the most recent date available. Regarding the categories of Institutions (Public and Financial Institutions) and Corporates, historical experience shows that there is such a small number of defaulted exposure (Low Default Portfolios) that it is not statistically significant, hence the reason the comparison is not shown.
The charts show that during the years of biggest economic growth, in general the effective loss was significantly lower than the expected loss adjusted to the cycle calculated using internal models.
The contrary was the case after the start of the crisis. This is in line with the major economic slowdown and the financial difficulties experienced by households and companies, above all in the case of small businesses in development and construction.
Regarding the last period of the series, it should be noted that global growth slowed down throughout 2019 to growth rates somewhat below 3% in annual terms in the second half of the year, below of 3.6% registered in 2018. The increase in trade protectionism and geopolitical risks had a negative impact on economic activity, mainly on exports and investment, which was added to the structural slowdown of the Chinese economy and the moderation cyclicality of the US economy and the euro zone. In this environment of economic slowdown, the losses experienced by the Group’s portfolios during 2019 are framed. In addition, specifically, for the geographies of Spain and Mexico, the indicators reflected worsening macroeconomic expectations.
| 3. | In line with the possible start date of the cycle identified by the regulator. |
| 4. | PD PiT Basel. |
| 5. | The methodology (LGD pit) allows for better approximation of observed losses. For more recent years, since recovery processes have not yet been completed, the best estimate of final loss given default is shown. |
| 6. | In some cases, the data for 2004 and 2005 had to be estimated. |
| BBVA. PILLAR III 2020 | 3. RISK | P. 80 |
Retail Mortgages
Starting in 2007, the effective losses are above the expected loss adjusted to the cycle, as they are losses incurred in years of crisis. Effective losses are in line with the expected loss adjusted to the cycle.
Chart 11. Comparative analysis of expected loss: retail mortgages
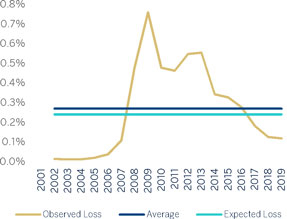
Credit Cards
As in the case of Mortgages and Consumer Finance, the observed loss is lower than the Expected Loss calculated using average parameters at the best periods of the cycle, and higher during its worst periods.
Chart 13. Comparative analysis of expected loss: Credit Cards
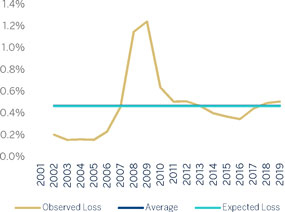
Consumer Finance
The chart shows that during the years of biggest economic growth the effective loss was lower than the Expected Loss. The contrary was the case starting in 2007. This is in line with the major economic slowdown and the financial difficulties experienced by households.
Chart 12. Comparative analysis of expected loss: consumer finance
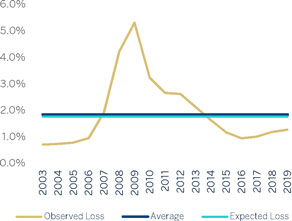
Automobiles
In the case of the Autos portfolio, the Expected Loss calculated using the average parameters remains similar to the average of the actual losses since 2001.
Chart 14. Comparative analysis of expected loss: Automobiles
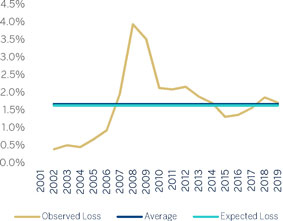
| BBVA. PILLAR III 2020 | 3. RISK | P. 81 |
Commercial and Real Estate Developers
In this case, LGD is only available from 2008 onwards and, as such, it has been decided to keep the LGD constant for previous years. As in the portfolios shown above, effective losses exceed average losses from 2007 onwards.
Chart 15. Comparative analysis of expected loss: SMEs and Real Estate
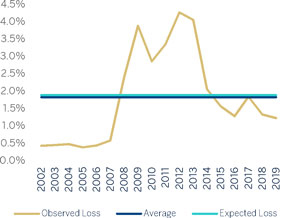
Mexico Corporates
Similarly to the Credit Cards portfolio, Mexico’s commercial portfolio shows expected loss levels similar to the average observed loss since 2004.
Chart 17. Comparative analysis of expected loss: Mexico corporates
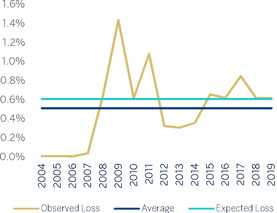
Mexico Credit Cards
In the case of BBVA Mexico’s credit card portfolio, the Expected Loss is in line with the average observed losses since 2004.
Chart 16. Comparative analysis of expected loss: Mexico Credit Cards
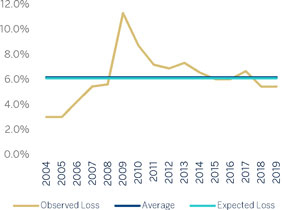
3.2.5.4. Risk weights of specialised lending exposure
The solvency regulation stipulates that the classification of specialised lending companies should apply to legal entities with the following characteristics:
| • | The exposure is to an entity created specifically to finance and/or operate physical assets. |
| • | The contractual arrangements give the lender a substantial degree of control over the assets and income they generate. |
| • | The primary source of repayment of the obligation is the income generated by the assets being financed, rather than the independent capacity of the borrower. |
The following table shows the exposure assigned to each of the risk weightings of the specialised lending exposure (including counterparty credit risk) as of December 31, 2020 and December 31, 2019:
| BBVA. PILLAR III 2020 | 3. RISK | P. 82 |
Table 36. EU CR10 (1) - IRB: specialised lending (Million Euros. 12-31-2020)
Specialised lending | ||||||||||||||||||||||||||
Regulatory | Remaining Maturity | On-balance sheet amount(1) | Off-balance sheet amount(2) | RW | Exposure Amount(3) | RWAs | Expected Losses | |||||||||||||||||||
Category 1 | Less than 2.5 years | 320 | 38 | 50 | % | 355 | 177 | — | ||||||||||||||||||
Category 1 | Equal to or more than 2.5 years | 2,549 | 866 | 70 | % | 3,297 | 2,308 | 13 | ||||||||||||||||||
Category 2 | Less than 2.5 years | 224 | 122 | 70 | % | 303 | 212 | 1 | ||||||||||||||||||
Category 2 | Equal to or more than 2.5 years | 1,213 | 349 | 90 | % | 1,465 | 1,319 | 12 | ||||||||||||||||||
Category 3 | Less than 2.5 years | 148 | 1 | 115 | % | 148 | 170 | 4 | ||||||||||||||||||
Category 3 | Equal to or more than 2.5 years | 341 | 79 | 115 | % | 414 | 476 | 12 | ||||||||||||||||||
Category 4 | Less than 2.5 years | 20 | 1 | 250 | % | 21 | 53 | 2 | ||||||||||||||||||
Category 4 | Equal to or more than 2.5 years | 75 | 4 | 250 | % | 79 | 197 | 6 | ||||||||||||||||||
Category 5 | Less than 2.5 years | 3 | 2 | 4 | — | 2 | ||||||||||||||||||||
Category 5 | Equal to or more than 2.5 years | 45 | 6 | 51 | — | 25 | ||||||||||||||||||||
|
|
|
|
|
|
|
|
|
| |||||||||||||||||
Total | Less than 2.5 years | 715 | 165 | 830 | 612 | 9 | ||||||||||||||||||||
|
|
|
|
|
|
|
|
|
| |||||||||||||||||
Total | Equal to or more than 2.5 years | 4,223 | 1,304 | 5,305 | 4,299 | 68 | ||||||||||||||||||||
|
|
|
|
|
|
|
|
|
| |||||||||||||||||
| (1) | Corresponds to the original exposure. |
| (2) | Corresponds to the value of off-balance sheet exposure, regardless of credit conversion factors (CCF), or the effect of the Credit Risk Mitigation (CRM) techniques. |
| (3) | Corresponds to exposure value after CRM and CCF. |
EU CR10 (1) - IRB: specialised lending (Million Euros. 12-31-2019)
Specialised lending | ||||||||||||||||||||||||||
Regulatory | Remaining Maturity | On-balance sheet amount(1) | Off-balance sheet amount(2) | RW | Exposure Amount(3) | RWAs | Expected Losses | |||||||||||||||||||
Category 1 | Less than 2.5 years | 289 | 63 | 50 | % | 333 | 166 | — | ||||||||||||||||||
Category 1 | Equal to or more than 2.5 years | 3,054 | 960 | 70 | % | 3,833 | 2,683 | 15 | ||||||||||||||||||
Category 2 | Less than 2.5 years | 217 | 55 | 70 | % | 253 | 177 | 1 | ||||||||||||||||||
Category 2 | Equal to or more than 2.5 years | 1,576 | 444 | 90 | % | 1,923 | 1,731 | 15 | ||||||||||||||||||
Category 3 | Less than 2.5 years | 161 | 4 | 115 | % | 163 | 187 | 5 | ||||||||||||||||||
Category 3 | Equal to or more than 2.5 years | 212 | 70 | 115 | % | 276 | 318 | 8 | ||||||||||||||||||
Category 4 | Less than 2.5 years | 4 | — | 250 | % | 4 | 10 | 0 | ||||||||||||||||||
Category 4 | Equal to or more than 2.5 years | 19 | 34 | 250 | % | 53 | 133 | 4 | ||||||||||||||||||
Category 5 | Less than 2.5 years | 103 | 4 | 105 | — | 53 | ||||||||||||||||||||
Category 5 | Equal to or more than 2.5 years | 40 | 1 | 41 | — | 21 | ||||||||||||||||||||
|
|
|
|
|
|
|
|
|
| |||||||||||||||||
Total | Less than 2.5 years | 774 | 126 | 859 | 542 | 58 | ||||||||||||||||||||
|
|
|
|
|
|
|
|
|
| |||||||||||||||||
Total | Equal to or more than 2.5 years | 4,901 | 1,508 | 6,127 | 4,865 | 63 | ||||||||||||||||||||
|
|
|
|
|
|
|
|
|
| |||||||||||||||||
| (1) | Corresponds to the original exposure. |
| (2) | Corresponds to the value of off-balance sheet exposure, regardless of credit conversion factors (CCF), or the effect of the Credit Risk Mitigation (CRM) techniques. |
| (3) | Corresponds to exposure value after CRM and CCF. |
3.2.5.5. Equity exposure by method
The following table shows equity exposure by the following
approaches: internal, PD/LGD and simple (in this case, broken down by risk weights), as of December 31, 2020 and December 31, 2019.
Table 37. EU CR10 (2) - IRB: equity (Million Euros. 12-31-2020)
| Equity under the IRB approach | ||||||||||||||||||||||||
Categories | On-balance sheet amount(1) | Off-balance sheet amount(2) | RW | Exposure Amount(3) | RWAs | Capital Requirements | ||||||||||||||||||
Simple method - Private Equity Exposures | 586 | — | 190 | % | 586 | 1,114 | 89 | |||||||||||||||||
Simple method - Exchange-traded equity exposures | 147 | — | 290 | % | 147 | 425 | 34 | |||||||||||||||||
Simple method - Other Equity Exposures | 79 | — | 370 | % | 79 | 291 | 23 | |||||||||||||||||
Exposures subject to 250% risk weight | 3,257 | — | 250 | % | 3,257 | 8,144 | 651 | |||||||||||||||||
Internal model | 185 | — | 185 | 613 | 49 | |||||||||||||||||||
PD/LGD method | 1,869 | — | 1,869 | 3,945 | 316 | |||||||||||||||||||
|
|
|
|
|
|
|
|
|
| |||||||||||||||
Total | 6,123 | — | 6,123 | 14,532 | 1,163 | |||||||||||||||||||
|
|
|
|
|
|
|
|
|
| |||||||||||||||
| (1) | Corresponds to the original exposure. |
| (2) | Corresponds to the value of off-balance sheet exposure, regardless of credit conversion factors (CCF), or the effect of the Credit Risk Mitigation (CRM) techniques. |
| (3) | Corresponds to exposure value after CRM and CCF. |
| BBVA. PILLAR III 2020 | 3. RISK | P. 83 |
EU CR10 (2) - IRB: equity (Million Euros. 12-31-2019)
| Equity under the IRB approach | ||||||||||||||||||||||||
Categories | On-balance sheet amount(1) | Off-balance sheet amount(2) | RW | Exposure Amount(3) | RWAs | Capital Requirements | ||||||||||||||||||
Simple method - Private Equity Exposures | 563 | — | 190 | % | 563 | 1,070 | 86 | |||||||||||||||||
Simple method - Exchange-traded equity exposures | 290 | — | 290 | % | 290 | 841 | 67 | |||||||||||||||||
Simple method - Other Equity Exposures | 108 | — | 370 | % | 108 | 399 | 32 | |||||||||||||||||
Exposures subject to 250% risk weight | 3,142 | — | 250 | % | 3,142 | 7,854 | 628 | |||||||||||||||||
Internal model | 138 | — | 138 | 449 | 36 | |||||||||||||||||||
PD/LGD method | 2,883 | — | 2,883 | 5,554 | 444 | |||||||||||||||||||
|
|
|
|
|
|
|
|
|
| |||||||||||||||
Total | 7,124 | — | 7,124 | 16,167 | 1,293 | |||||||||||||||||||
|
|
|
|
|
|
|
|
|
| |||||||||||||||
| (1) | Corresponds to the original exposure. |
| (2) | Corresponds to the value of off-balance sheet exposure, regardless of credit conversion factors (CCF), or the effect of the Credit Risk Mitigation (CRM) techniques. |
| (3) | Corresponds to exposure value after CRM and CCF. |
In addition, section 3.4 shows detailed information on structural equity risk.
3.2.6. Information on counterparty credit risk
Counterparty credit risk exposure involves that part of the original exposure corresponding to derivative instruments, repurchase and reverse repurchase transactions, securities or commodities lending transactions and deferred settlement transactions.
3.2.6.1. Policies for managing counterparty risk
3.2.6.1.1. Methodology: allocation of internal capital and limits to exposure subject to counterparty risk
The Group has an economic model for calculating internal capital through exposure to counterparty risk in treasury operations. This model has been implemented in the Risk unit systems in Market areas. It is used to estimate the credit exposure for each of the counterparties for which the entity operates.
Exposure is generated in a manner consistent with those used for the monitoring and control of credit risk limits. The time horizon is divided up into intervals, and the market risk factors (interest rates, exchange rates, etc.) underlying the instruments that determine their valuation are simulated for each interval.
Exposure is obtained based on the 2000 different scenarios generated using the Monte Carlo method for risk factors (subject to counterparty risk) and applying the corresponding mitigating factors to each counterparty (i.e. applying collateral and/or compensation arrangements, or netting, as applicable).
The correlations, loss given defaults, internal ratings and associated probabilities of default are consistent with the Group’s economic model for general credit risk.
The capital for each counterparty is then calculated using the exposure profile and taking into account the analytical formula adopted by Basel. This figure is modified by an adjustment factor for possible subsequent maturity after one year of the operations, in a similar vein to the general approach adopted by Basel for the treatment of credit risk.
Counterparty limits are specified within the financial programs authorised for each subsidiary within the line item of treasury limits. It stipulates both the limit and the maximum maturity for the transaction.
Transactions that generate counterparty risk are subject to risk limits that control both bilateral risk and risk with CCPs. When setting these limits for each business area and segment, and to ensure their correct application, the corresponding capital consumption and revenue generated by this operation are taken into account.
There is also a risk committee that individually analyzes the most significant transactions to assess (among other aspects) the relationship between profitability and risk.
The consumption of transactions within the limits is measured in terms of market capitalisation (mark to market) plus the potential risk with Monte Carlo Simulation methodology (95% confidence level or above if there are mitigating agreements or a risk of adverse links) and considering possible mitigating factors (such as netting, break clauses and collateral contracts).
Management of consumption by lines in the Markets area is carried out through a corporate platform that enables online monitoring of the limits and liquid assets established for the different counterparties and customers. This control is completed by independent units of the business area to guarantee proper segregation of functions.
3.2.6.1.2. Policies for ensuring the effectiveness of collateral and setting the value adjustments for impairment losses to cover this risk
The Group negotiates agreements with its customers to mitigate counterparty risk within the legal frameworks applicable in each of the countries where it operates.
| BBVA. PILLAR III 2020 | 3. RISK | P. 84 |
These agreements regulate the exchange of guarantees as a mechanism to reduce exposure derived from transactions that generate counterparty risk.
The assets covered by these agreements include cash, as well as financial assets with a high credit quality. In addition, the agreements with customers include mechanisms that allow the immediate replacement of the collateral if its quality is impaired (for example, a reduction in the market capitalisation or adverse changes in the asset rating).
Mitigation by compensation or netting transactions and by collateral only reduces the consumption of limits and capital if there is a positive opinion on their immediate effectiveness in case of the counterparty’s default or insolvency.
An internal tool has been specifically designed to store and process the collateral contracts concluded with counterparties. This application enables the existence of collateral to be taken into account at the transaction level (useful for controlling and monitoring the status of specific operations) as well as at the counterparty level. Furthermore, this tool feeds the applications responsible for estimating counterparty risk by providing all the necessary parameters for considering the impact of mitigation in the portfolio due to the agreements signed.
Likewise, there is also application process that reconciles and adjusts the positions serving the Collateral and Risk units.
In order to guarantee the effectiveness of collateral contracts, the Group carries out daily monitoring of the market values of operations governed by such contracts and of the deposits made by the counterparties. Once the amount of the collateral to be delivered or received is obtained, the collateral demand (margin call), or the demand received, is carried out at the intervals established in the contract, usually daily.
If significant variations arise from the process of reconciliation between the counterparties, after a reconciliation in economic terms, they are reported by the Collateral unit to the Risk unit for subsequent analysis and monitoring. Within the control process, the Collateral unit issues a daily report on the guarantees which includes a description by counterparty of the exposure and deposited collateral, making special reference to those guarantee deficits at or beyond the set warning levels.
Financial assets and liabilities may be the object of compensation, or netting, in other words presentation for a net amount in the consolidated balance sheet, only when the Group’s entities comply with the provisions laid down in IAS 32 - Paragraph 42, and thus have the legally obliged right to offset the amounts recognised, and the intention to settle the net amount or to divest the asset and pay the liability at the same time.
In addition, the Group has assets and liabilities on the balance sheet that are not netted and for which there are master netting agreements, but for which there is neither
the intention nor the right to settle. The most common types of events that trigger the compensation of reciprocal obligations include the bankruptcy of the credit institution in question, swiftly accumulating indebtedness, default, and the restructuring or dissolution of the entity.
In the current market context, derivatives are arranged under a variety of framework contracts, with the most general being those developed by the International Swaps and Derivatives Association (ISDA), and for the Spanish market the Framework Agreement for Financial Transactions (FAFT). Practically all portfolio derivative operations have been concluded under these master contracts, including in them the netting clauses referred to in the above point as Master Netting Agreements, considerably reducing the credit exposure in these instruments. Furthermore, in the contracts concluded with professional counterparties, annexes are included with collateral agreements called Credit Support Annexes (CSA), thus minimizing exposure to a possible counterparty insolvency.
At the same time, the Group has a high volume of assets sold under repurchase agreements traded through clearing houses that use mechanisms to reduce counterparty risk, as well as through various master contracts in bilateral operations, the most common being the Global Master Repurchase Agreement (GMRA), which is published by the International Capital Market Association (ICMA). This tends to have clauses added relating to the exchange of collateral within the main body of the master contract itself.
3.2.6.1.3. Policies on the risk of adverse effects due to correlations
Derivatives contracts may give rise to potential adverse correlation effects between the exposure to the counterparty and its credit quality (wrong-way-exposure).
The Group has specific policies for handling these type of exposures, which establish:
| • | How to identify transactions subject to adverse correlation risk. |
| • | A specific transaction-by-transaction admission procedure. |
| • | Measurements appropriate to the risk profile with adverse correlation and sanctioned in the corresponding decision-making areas. |
| • | Control and monitoring of the transaction. |
3.2.6.1.4. Impact of collateral in the event of a downgrade in credit quality
In derivatives transactions, as a general policy the Group does not subscribe collateral contracts that involve an increase in the amount to be deposited in the event of the Group being downgraded.
| BBVA. PILLAR III 2020 | 3. RISK | P. 85 |
The general criteria applied to date with banking counterparties is to establish a zero threshold within collateral contracts, irrespective of the mutual rating; provision will be made as collateral of any difference that arises through market capitalisation (mark to market).
Since 2018, with the entry into force of the regulatory obligations for exchange of margins for derivatives that are not offset in the clearing houses, all the collateral annexes have been adapted to the characteristics required by the regulation, among which is that of establishing a zero threshold. Furthermore, the obligation to exchange initial margins with the main financial counterparties to overcollateralize exposure was added in 2019.
3.2.6.2. Amounts of counterparty risk
The original exposure for the counterparty risk of derivatives, according to Chapter 6 of the CRR, can be calculated using the following methods: original risk, mark-to-market valuation, standardised and internal models.
The Group calculates the value of exposure to risk through the mark-to-market method, obtained as the aggregated positive mark to market after contractual netting agreements plus the potential future risk of each transaction or instrument.
Below is a breakdown of the amount in terms of original exposure, EAD and RWAs:
Table 38. Positions subject to counterparty credit risk in terms of OE, EAD and RWAs (Million euros. 12-31-2020)
| Securities financing transactions | Derivatives and transactions with deferred settlement | Total | ||||||||||||||||||||||||||||||||||
Exposure Class and risk types | OE | EAD | RWAs | OE | EAD | RWAs | OE | EAD | RWAs | |||||||||||||||||||||||||||
Central governments or central banks | 13,260 | 1,007 | 7 | 245 | 410 | 108 | 13,506 | 1,418 | 115 | |||||||||||||||||||||||||||
Regional governments or local authorities | — | — | — | 65 | 1 | 1 | 65 | 1 | 1 | |||||||||||||||||||||||||||
Public sector entities | — | — | — | 431 | 153 | 78 | 431 | 153 | 78 | |||||||||||||||||||||||||||
Multilateral Development Banks | — | — | — | 1 | 1 | — | 1 | 1 | — | |||||||||||||||||||||||||||
Institutions | 6,563 | 675 | 137 | 2,530 | 2,013 | 676 | 9,093 | 2,688 | 813 | |||||||||||||||||||||||||||
Corporates | 2,208 | 77 | 73 | 1,934 | 1,905 | 1,922 | 4,142 | 1,982 | 1,995 | |||||||||||||||||||||||||||
Retail | 393 | — | — | 36 | 34 | 25 | 428 | 34 | 25 | |||||||||||||||||||||||||||
Secured by mortgages on immovable property | — | — | — | — | — | — | — | — | — | |||||||||||||||||||||||||||
Exposures in default | — | — | — | — | — | — | — | — | — | |||||||||||||||||||||||||||
Exposures associated with particularly high risk | — | — | — | 47 | 47 | 70 | 47 | 47 | 70 | |||||||||||||||||||||||||||
Covered bonds | — | — | — | — | — | — | — | — | — | |||||||||||||||||||||||||||
Short-term claims on institutions and corporate | — | — | — | — | — | — | — | — | — | |||||||||||||||||||||||||||
Collective investments undertakings | 3 | — | — | — | — | — | 3 | — | — | |||||||||||||||||||||||||||
Other exposures | — | — | — | — | — | — | — | — | — | |||||||||||||||||||||||||||
|
|
|
|
|
|
|
|
|
|
|
|
|
|
|
|
|
| |||||||||||||||||||
Total counterparty risk by standardised approach | 22,426 | 1,760 | 217 | 5,290 | 4,565 | 2,880 | 27,716 | 6,325 | 3,097 | |||||||||||||||||||||||||||
|
|
|
|
|
|
|
|
|
|
|
|
|
|
|
|
|
| |||||||||||||||||||
Central governments or central banks | 365 | 365 | 1 | 33 | 33 | 5 | 398 | 398 | 6 | |||||||||||||||||||||||||||
Institutions | 60,337 | 60,337 | 984 | 18,684 | 18,184 | 1,346 | 79,021 | 78,521 | 2,330 | |||||||||||||||||||||||||||
Corporates | 204 | 204 | — | 4,779 | 4,779 | 2,275 | 4,983 | 4,983 | 2,275 | |||||||||||||||||||||||||||
Of which: SMEs | — | — | — | 138 | 138 | 122 | 138 | 138 | 122 | |||||||||||||||||||||||||||
Of which: specialised lending | — | — | — | 853 | 853 | 649 | 853 | 853 | 649 | |||||||||||||||||||||||||||
Of which: other | 204 | 204 | — | 3,789 | 3,789 | 1,504 | 3,992 | 3,992 | 1,504 | |||||||||||||||||||||||||||
Retail | — | — | — | 3 | 3 | 1 | 3 | 3 | 1 | |||||||||||||||||||||||||||
Of which: Secured by immovable property | — | — | — | — | — | — | — | — | — | |||||||||||||||||||||||||||
Of which: Qualifying revolving | — | — | — | — | — | — | — | — | — | |||||||||||||||||||||||||||
Of which: Other retail | — | — | — | 3 | 3 | 1 | 3 | 3 | 1 | |||||||||||||||||||||||||||
Other retail: SMEs | — | — | — | — | — | — | — | — | — | |||||||||||||||||||||||||||
Other retail: Non SMEs | — | — | — | 3 | 3 | 1 | 3 | 3 | 1 | |||||||||||||||||||||||||||
|
|
|
|
|
|
|
|
|
|
|
|
|
|
|
|
|
| |||||||||||||||||||
Total counterparty risk by IRB approach | 60,907 | 60,907 | 986 | 23,499 | 22,999 | 3,627 | 84,406 | 83,906 | 4,613 | |||||||||||||||||||||||||||
|
|
|
|
|
|
|
|
|
|
|
|
|
|
|
|
|
| |||||||||||||||||||
Total credit risk | 83,333 | 62,666 | 1,203 | 28,789 | 27,565 | 6,507 | 112,122 | 90,231 | 7,710 | |||||||||||||||||||||||||||
|
|
|
|
|
|
|
|
|
|
|
|
|
|
|
|
|
| |||||||||||||||||||
Positions subject to counterparty credit risk in terms of OE, EAD and RWAs (Million euros. 12-31-2019)
| Securities financing transactions | Derivatives and transactions with deferred settlement | Total | ||||||||||||||||||||||||||||||||||
Exposure Class and risk types | OE | EAD | RWAs | OE | EAD | RWAs | OE | EAD | RWAs | |||||||||||||||||||||||||||
Central governments or central banks | 7,521 | 1,904 | 42 | 74 | 305 | 13 | 7,595 | 2,209 | 55 | |||||||||||||||||||||||||||
Regional governments or local authorities | — | — | — | 74 | 3 | 1 | 74 | 3 | 1 | |||||||||||||||||||||||||||
Public sector entities | — | — | — | 167 | 138 | 76 | 167 | 138 | 76 | |||||||||||||||||||||||||||
Multilateral Development Banks | — | — | — | — | — | — | — | — | — | |||||||||||||||||||||||||||
Institutions | 10,192 | 488 | 235 | 2,140 | 1,543 | 406 | 12,332 | 2,031 | 641 | |||||||||||||||||||||||||||
Corporates | 1,773 | 257 | 255 | 1,184 | 1,157 | 1,173 | 2,957 | 1,414 | 1,428 | |||||||||||||||||||||||||||
Retail | 465 | — | — | 58 | 57 | 41 | 523 | 57 | 41 | |||||||||||||||||||||||||||
Secured by mortgages on immovable property | — | — | — | — | — | — | — | — | — | |||||||||||||||||||||||||||
Exposures in default | — | — | — | 1 | 1 | 1 | 1 | 1 | 1 | |||||||||||||||||||||||||||
Exposures associated with particularly high risk | — | — | — | 32 | 32 | 48 | 32 | 32 | 48 | |||||||||||||||||||||||||||
| BBVA. PILLAR III 2020 | 3. RISK | P. 86 |
Covered bonds | — | — | — | — | — | — | — | — | — | |||||||||||||||||||||||||||
Short-term claims on institutions and corporate | — | — | — | — | — | — | — | — | — | |||||||||||||||||||||||||||
Collective investments undertakings | 10 | 0 | 0 | 1 | 1 | 1 | 12 | 2 | 2 | |||||||||||||||||||||||||||
Other exposures | — | 4,136 | — | — | — | — | — | 4,136 | — | |||||||||||||||||||||||||||
|
|
|
|
|
|
|
|
|
|
|
|
|
|
|
|
|
| |||||||||||||||||||
Total counterparty risk by standardised approach | 19,961 | 6,785 | 533 | 3,733 | 3,237 | 1,761 | 23,693 | 10,022 | 2,294 | |||||||||||||||||||||||||||
|
|
|
|
|
|
|
|
|
|
|
|
|
|
|
|
|
| |||||||||||||||||||
Central governments or central banks | 1,558 | 1,558 | 3 | 41 | 41 | 6 | 1,599 | 1,599 | 9 | |||||||||||||||||||||||||||
Institutions | 62,497 | 62,497 | 879 | 19,022 | 18,576 | 1,524 | 81,520 | 81,073 | 2,402 | |||||||||||||||||||||||||||
Corporates | 116 | 116 | 0 | 3,806 | 3,806 | 2,010 | 3,922 | 3,922 | 2,010 | |||||||||||||||||||||||||||
Of which: SMEs | — | — | — | 139 | 139 | 123 | 139 | 139 | 123 | |||||||||||||||||||||||||||
Of which: specialised lending | — | — | — | 964 | 964 | 800 | 964 | 964 | 800 | |||||||||||||||||||||||||||
Of which: other | 116 | 116 | 0 | 2,704 | 2,704 | 1,086 | 2,820 | 2,820 | 1,087 | |||||||||||||||||||||||||||
Retail | — | — | — | 4 | 4 | 1 | 4 | 4 | 1 | |||||||||||||||||||||||||||
Of which: Secured by immovable property | — | — | — | — | — | — | — | — | — | |||||||||||||||||||||||||||
Of which: Qualifying revolving | — | — | — | — | — | — | — | — | — | |||||||||||||||||||||||||||
Of which: Other retail | — | — | — | 4 | 4 | 1 | 4 | 4 | 1 | |||||||||||||||||||||||||||
Other retail: SMEs | — | — | — | — | — | — | — | — | — | |||||||||||||||||||||||||||
Other retail: Non SMEs | — | — | — | 4 | 4 | 1 | 4 | 4 | 1 | |||||||||||||||||||||||||||
|
|
|
|
|
|
|
|
|
|
|
|
|
|
|
|
|
| |||||||||||||||||||
Total counterparty risk by IRB approach | 64,171 | 64,171 | 882 | 22,874 | 22,428 | 3,540 | 87,045 | 86,599 | 4,423 | |||||||||||||||||||||||||||
|
|
|
|
|
|
|
|
|
|
|
|
|
|
|
|
|
| |||||||||||||||||||
Total credit risk | 84,132 | 70,956 | 1,415 | 26,606 | 25,665 | 5,301 | 110,738 | 96,621 | 6,716 | |||||||||||||||||||||||||||
|
|
|
|
|
|
|
|
|
|
|
|
|
|
|
|
|
|
From the amounts shown in the table above, those referring to the counterparty risk of trading book exposures are shown below:
Table 39. Amounts of counterparty risk in the trading book (Million euros)
| Capital requirements | ||||||||||||||||
| 2020 | 2019 | |||||||||||||||
Counterparty Risk Trading Book Activities | Mtm Method | Internal Models (IMM) | Mtm Method | Internal Models (IMM) | ||||||||||||
Standardised Approach | 239 | 169 | ||||||||||||||
Advanced Approach | 337 | 357 | ||||||||||||||
|
|
|
| |||||||||||||
Total | 576 | 526 | ||||||||||||||
|
|
|
| |||||||||||||
The Group currently has a negligible amount of regulatory capital requirements for the settlement risk of trading book exposures.
The following table shows the amounts (in million euros) relating to the counterparty risk of derivatives and securities financing transactions as of December 31, 2020 and December 31, 2019:
Table 40. CCR5-A - Impact of netting and collateral held on exposure values(1) (Million euros. 12-31-2020)
| Gross positive fair value or net carrying amount | Netting benefits | Netted current credit exposure | Collateral held(4) | Net credit exposure | ||||||||||||||||
Derivatives(2) | 44,436 | (29,522 | ) | 14,914 | (7,536 | ) | 7,377 | |||||||||||||
SFTs(3) | 34,157 | — | 34,157 | (31,070 | ) | 3,087 | ||||||||||||||
Cross-product netting | ||||||||||||||||||||
|
|
|
|
|
|
|
|
|
| |||||||||||
Total | 78,593 | (29,522 | ) | 49,071 | (38,607 | ) | 10,464 | |||||||||||||
|
|
|
|
|
|
|
|
|
| |||||||||||
| (1) | Securities financing transactions include both collateral recognised on the balance sheet and collateral that is not offset on the balance sheet by accounting standards, but does reduce credit risk. |
Collateral for derivatives corresponds only to those that are eligible as mitigation techniques for capital purposes.
| (2) | Positive mark-to-market of derivatives is included. |
| (3) | Only the amount of reverse repurchase agreements is included. |
| (4) | The collateral held amount includes volatility adjustments outlined in Title II, Chapter 4, Section 4 of the CRR. |
CCR5-A - Impact of netting and collateral held on exposure values(1) (Million euros. 12-31-2019)
| Gross positive fair value or net carrying amount | Netting benefits | Netted current credit exposure | Collateral held(4) | Net credit exposure | ||||||||||||||||
Derivatives(2) | 36,583 | (23,265 | ) | 13,319 | (6,440 | ) | 6,879 | |||||||||||||
SFTs(3) | 35,629 | — | 35,629 | (32,394 | ) | 3,236 | ||||||||||||||
Cross-product netting | ||||||||||||||||||||
|
|
|
|
|
|
|
|
|
| |||||||||||
Total | 72,213 | (23,265 | ) | 48,948 | (38,833 | ) | 10,115 | |||||||||||||
|
|
|
|
|
|
|
|
|
| |||||||||||
| (1) | Securities financing transactions include both collateral recognised on the balance sheet and collateral that is not offset on the balance sheet by accounting standards, but does reduce credit risk. |
Collateral for derivatives corresponds only to those that are eligible as mitigation techniques for capital purposes.
| (2) | Positive mark-to-market of derivatives is included. |
| (3) | Only the amount of reverse repurchase agreements is included. |
| (4) | The collateral held amount includes volatility adjustments outlined in Title II, Chapter 4, Section 4 of the CRR. |
| BBVA. PILLAR III 2020 | 3. RISK | P. 87 |
Below is an overview of the methods used to calculate the regulatory requirements for counterparty credit risk and the main parameters of each method (excluding requirements for
CVA and exposure cleared through a CCP, which are shown in tables CCR2 and CCR8, respectively).
Table 41. : EU CCR1 - Analysis of CCR exposure by approach (Million Euros)
| 12-31-2020 | 12-31-2019 | |||||||||||||||||||||||||||||||
| Replacement Cost / Current market value | Potential future credit exposure | EAD post- CRM | RWAs | Replacement Cost / Current market value | Potential future credit exposure | EAD post- CRM | RWAs | |||||||||||||||||||||||||
Mark to market | 14,299 | 10,370 | 21,082 | 6,146 | 13,174 | 10,153 | 20,157 | 5,119 | ||||||||||||||||||||||||
Internal Model Method (for derivatives and SFTs) | — | — | — | — | — | — | — | — | ||||||||||||||||||||||||
Simple Approach for credit risk mitigation (for SFTs) | — | — | — | — | — | — | — | — | ||||||||||||||||||||||||
Comprehensive Approach for credit risk mitigation (for SFTs) | — | — | 62,320 | 1,195 | — | — | 70,367 | 1,186 | ||||||||||||||||||||||||
VaR for SFTs | — | — | — | — | — | — | — | — | ||||||||||||||||||||||||
|
|
|
|
|
|
|
|
|
|
|
|
|
|
|
| |||||||||||||||||
Total | 14,299 | 10,370 | 83,402 | 7,341 | 13,174 | 10,153 | 90,524 | 6,305 | ||||||||||||||||||||||||
|
|
|
|
|
|
|
|
|
|
|
|
|
|
|
| |||||||||||||||||
3.2.6.2.1. Counterparty credit risk by standardised approach
The following table shows a breakdown of exposure to counterparty credit risk (following credit risk mitigation and
CCF techniques) calculated using the standardised approach, by exposure category and risk weights:
Table 42. EU CCR3 - Standardised approach - CCR exposures by regulatory portfolio and risk (Million Euros. 12-31-2020)
| Risk weight | Of which: unrated(1) | |||||||||||||||||||||||||||||||||||||||||||||||||||
Exposure Class | 0% | 2% | 4% | 10% | 20% | 50% | 70% | 75% | 100% | 150% | Others | Total | ||||||||||||||||||||||||||||||||||||||||
Central governments or central banks | 1,270 | — | — | — | 10 | 48 | — | — | 89 | — | — | 1,418 | 856 | |||||||||||||||||||||||||||||||||||||||
Regional government or local authorities | — | — | — | — | — | — | — | — | 1 | — | — | 1 | 1 | |||||||||||||||||||||||||||||||||||||||
Public sector entities | — | — | — | — | — | 151 | — | — | 2 | — | — | 153 | 2 | |||||||||||||||||||||||||||||||||||||||
Multilateral development banks | 1 | — | — | — | — | — | — | — | — | — | — | 1 | 1 | |||||||||||||||||||||||||||||||||||||||
International organisations | — | — | — | — | — | — | — | — | — | — | — | — | — | |||||||||||||||||||||||||||||||||||||||
Institutions | — | 101 | 591 | — | 1,186 | 520 | — | — | 290 | — | — | 2,688 | 2,162 | |||||||||||||||||||||||||||||||||||||||
Corporates | — | — | — | — | 2 | 9 | — | — | 1,889 | 82 | — | 1,982 | 1,940 | |||||||||||||||||||||||||||||||||||||||
Retail | — | — | — | — | — | — | — | 34 | — | — | — | 34 | 34 | |||||||||||||||||||||||||||||||||||||||
Institutions and corporates with a short term credit assessment | — | — | — | — | — | — | — | — | — | — | — | — | — | |||||||||||||||||||||||||||||||||||||||
Other items | — | — | — | — | — | — | — | — | — | 47 | — | 47 | 47 | |||||||||||||||||||||||||||||||||||||||
|
|
|
|
|
|
|
|
|
|
|
|
|
|
|
|
|
|
|
|
|
|
|
|
|
| |||||||||||||||||||||||||||
Total | 1,272 | 101 | 591 | — | 1,198 | 729 | — | 34 | 2,271 | 129 | — | 6,325 | 5,043 | |||||||||||||||||||||||||||||||||||||||
|
|
|
|
|
|
|
|
|
|
|
|
|
|
|
|
|
|
|
|
|
|
|
|
|
| |||||||||||||||||||||||||||
| (1) | Of which: Unrated refers to exposure for which no credit rating from designated ECAIs is available. |
EU CCR3 - Standardised approach - CCR exposures by regulatory portfolio and risk (Million Euros. 12-31-2019)
| Risk weight | Of which: unrated(1) | |||||||||||||||||||||||||||||||||||||||||||||||||||
Exposure Class | 0% | 2% | 4% | 10% | 20% | 50% | 70% | 75% | 100% | 150% | Others | Total | ||||||||||||||||||||||||||||||||||||||||
Central governments or central banks | 2,066 | — | — | — | 62 | 76 | — | — | 5 | — | — | 2,209 | 1,660 | |||||||||||||||||||||||||||||||||||||||
Regional government or local authorities | — | — | — | — | 3 | 1 | — | — | — | — | — | 3 | 3 | |||||||||||||||||||||||||||||||||||||||
Public sector entities | — | — | — | — | 3 | 120 | — | — | 16 | — | — | 138 | 105 | |||||||||||||||||||||||||||||||||||||||
Multilateral development banks | — | — | — | — | — | — | — | — | — | — | — | — | — | |||||||||||||||||||||||||||||||||||||||
International organisations | — | — | — | — | — | — | — | — | — | — | — | — | — | |||||||||||||||||||||||||||||||||||||||
Institutions | — | 471 | 15 | — | 789 | 566 | — | — | 190 | — | — | 2,031 | 1,639 | |||||||||||||||||||||||||||||||||||||||
Corporates | — | — | — | — | 2 | 5 | — | — | 1,369 | 37 | — | 1,414 | 1,353 | |||||||||||||||||||||||||||||||||||||||
Retail | — | — | — | — | — | — | — | 57 | — | — | — | 57 | 57 | |||||||||||||||||||||||||||||||||||||||
Institutions and corporates with a short term credit assessment | — | — | — | — | — | — | — | — | — | — | — | — | — | |||||||||||||||||||||||||||||||||||||||
Other items | 4,136 | — | — | — | — | — | — | — | 2 | 33 | — | 4,170 | 3,853 | |||||||||||||||||||||||||||||||||||||||
|
|
|
|
|
|
|
|
|
|
|
|
|
|
|
|
|
|
|
|
|
|
|
|
|
| |||||||||||||||||||||||||||
Total | 6,202 | 471 | 15 | — | 858 | 768 | — | 57 | 1,582 | 70 | — | 10,022 | 8,668 | |||||||||||||||||||||||||||||||||||||||
|
|
|
|
|
|
|
|
|
|
|
|
|
|
|
|
|
|
|
|
|
|
|
|
|
| |||||||||||||||||||||||||||
| (1) | Of which: Unrated refers to exposure for which no credit rating from designated ECAIs is available. |
| BBVA. PILLAR III 2020 | 3. RISK | P. 88 |
3.2.6.2.2. Counterparty risk by advanced approach
The following table presents the relevant parameters used to
calculate the capital requirements for counterparty credit risk in the IRB models as of December 31, 2020 and December 31, 2019:
Table 43. EU CCR4 - IRB approach - CCR exposures by portfolio and PD scale (Million Euros. 12-31-2020)
PD scale as of 31-12-2020(1) | EAD post-CRM | Average PD(2) | Number of Obligors | Average LGD(3) | Average Maturity (days)(4) | RWAs | RWA Density | |||||||||||||||||||||
Prudential Portfolio- FIRB method(5) | 853 | — | 260 | — | 649 | 76 | % | |||||||||||||||||||||
|
|
|
|
|
|
|
|
|
|
|
|
|
| |||||||||||||||
Corporate - Specialised lending | 853 | — | 260 | — | — | 649 | 76 | % | ||||||||||||||||||||
Prudential Portfolio- AIRB method | 83,053 | 0.10 | % | 3,416 | 13.00 | % | 3,964 | 5 | % | |||||||||||||||||||
|
|
|
|
|
|
|
|
|
|
|
|
|
| |||||||||||||||
Central governments or central banks | 398 | 0.07 | % | 5 | 4.51 | % | 102 | 6 | 2 | % | ||||||||||||||||||
|
|
|
|
|
|
|
|
|
|
|
|
|
| |||||||||||||||
0,00 to <0,15 | 382 | 0.06 | % | 4 | 3.00 | % | 88 | 2 | 0 | % | ||||||||||||||||||
0,15 to <0,25 | 16 | 0.20 | % | 1 | 40.00 | % | 417 | 5 | 29 | % | ||||||||||||||||||
0,25 to <0,50 | — | — | — | — | — | — | — | |||||||||||||||||||||
0,50 to <0,75 | — | — | — | — | — | — | — | |||||||||||||||||||||
0,75 to <2,50 | — | — | — | — | — | — | — | |||||||||||||||||||||
2,50 to <10,00 | — | — | — | — | — | — | — | |||||||||||||||||||||
10,00 to <100,00 | — | — | — | — | — | — | — | |||||||||||||||||||||
100,00 (Default) | — | — | — | — | — | — | — | |||||||||||||||||||||
Institutions | 78,521 | 0.10 | % | 978 | 11.72 | % | 229 | 2,330 | 3 | % | ||||||||||||||||||
|
|
|
|
|
|
|
|
|
|
|
|
|
| |||||||||||||||
0,00 to <0,15 | 66,024 | 0.06 | % | 717 | 13.13 | % | 215 | 1,794 | 3 | % | ||||||||||||||||||
0,15 to <0,25 | 6,601 | 0.20 | % | 54 | 3.79 | % | 412 | 243 | 4 | % | ||||||||||||||||||
0,25 to <0,50 | 4,464 | 0.31 | % | 46 | 4.46 | % | 207 | 154 | 3 | % | ||||||||||||||||||
0,50 to <0,75 | 817 | 0.51 | % | 13 | 4.82 | % | 129 | 51 | 6 | % | ||||||||||||||||||
0,75 to <2,50 | 519 | 1.06 | % | 135 | 8.40 | % | 93 | 77 | 15 | % | ||||||||||||||||||
2,50 to <10,00 | 97 | 4.08 | % | 11 | 3.28 | % | — | 10 | 10 | % | ||||||||||||||||||
10,00 to <100,00 | 0 | 37.80 | % | 2 | 45.00 | % | 1,825 | 0 | 305 | % | ||||||||||||||||||
100,00 (Default) | — | — | — | — | — | — | — | |||||||||||||||||||||
Corporate - SMEs | 138 | 11.12 | % | 932 | 40.05 | % | 474 | 122 | 89 | % | ||||||||||||||||||
|
|
|
|
|
|
|
|
|
|
|
|
|
| |||||||||||||||
0,00 to <0,15 | 6 | 0.11 | % | 173 | 40.42 | % | 406 | 1 | 13 | % | ||||||||||||||||||
0,15 to <0,25 | 7 | 0.20 | % | 59 | 40.30 | % | 357 | 1 | 20 | % | ||||||||||||||||||
0,25 to <0,50 | 11 | 0.31 | % | 124 | 40.59 | % | 338 | 4 | 33 | % | ||||||||||||||||||
0,50 to <0,75 | 25 | 0.54 | % | 152 | 39.21 | % | 270 | 15 | 58 | % | ||||||||||||||||||
0,75 to <2,50 | 42 | 1.18 | % | 215 | 40.19 | % | 558 | 34 | 80 | % | ||||||||||||||||||
2,50 to <10,00 | 30 | 5.63 | % | 158 | 39.23 | % | 511 | 38 | 129 | % | ||||||||||||||||||
10,00 to <100,00 | 5 | 20.22 | % | 21 | 42.05 | % | 1,234 | 10 | 192 | % | ||||||||||||||||||
100,00 (Default) | 12 | 100.00 | % | 30 | 41.60 | % | 415 | 20 | 167 | % | ||||||||||||||||||
Corporate - Non-SMEs | 3,992 | 0.44 | % | 1,027 | 37.78 | % | 560 | 1,504 | 38 | % | ||||||||||||||||||
|
|
|
|
|
|
|
|
|
|
|
|
|
| |||||||||||||||
0,00 to <0,15 | 2,221 | 0.12 | % | 267 | 34.60 | % | 425 | 433 | 20 | % | ||||||||||||||||||
0,15 to <0,25 | 479 | 0.20 | % | 116 | 38.59 | % | 563 | 169 | 35 | % | ||||||||||||||||||
0,25 to <0,50 | 789 | 0.31 | % | 223 | 43.84 | % | 712 | 412 | 52 | % | ||||||||||||||||||
0,50 to <0,75 | 138 | 0.51 | % | 148 | 43.06 | % | 816 | 99 | 71 | % | ||||||||||||||||||
0,75 to <2,50 | 284 | 1.36 | % | 164 | 40.57 | % | 1,057 | 292 | 103 | % | ||||||||||||||||||
2,50 to <10,00 | 71 | 4.19 | % | 85 | 42.44 | % | 492 | 88 | 123 | % | ||||||||||||||||||
10,00 to <100,00 | 5 | 15.03 | % | 13 | 43.90 | % | 1,259 | 11 | 222 | % | ||||||||||||||||||
100,00 (Default) | 3 | 100.00 | % | 11 | 43.72 | % | 978 | 1 | 16 | % | ||||||||||||||||||
Retail - Other SMEs | 3 | 13.08 | % | 464 | 40.02 | % | — | 1 | 38 | % | ||||||||||||||||||
|
|
|
|
|
|
|
|
|
|
|
|
|
| |||||||||||||||
0,00 to <0,15 | 0 | 0.12 | % | 73 | 40.00 | % | — | 0 | 8 | % | ||||||||||||||||||
0,15 to <0,25 | 0 | 0.20 | % | 11 | 40.00 | % | — | — | 0 | % | ||||||||||||||||||
0,25 to <0,50 | 1 | 0.31 | % | 58 | 40.00 | % | — | 0 | 17 | % | ||||||||||||||||||
0,50 to <0,75 | 0 | 0.51 | % | 45 | 40.00 | % | — | 0 | 22 | % | ||||||||||||||||||
0,75 to <2,50 | 1 | 1.12 | % | 95 | 40.13 | % | — | 0 | 34 | % | ||||||||||||||||||
2,50 to <10,00 | 1 | 5.02 | % | 127 | 40.00 | % | — | 1 | 46 | % | ||||||||||||||||||
10,00 to <100,00 | 1 | 22.30 | % | 40 | 40.00 | % | — | 0 | 63 | % | ||||||||||||||||||
100,00 (Default) | 0 | 100.00 | % | 15 | 40.05 | % | — | 0 | 14 | % | ||||||||||||||||||
Retail - Other Non-SMEs | 0 | 3.07 | % | 10 | 40.00 | % | — | 0 | 39 | % | ||||||||||||||||||
|
|
|
|
|
|
|
|
|
|
|
|
|
| |||||||||||||||
0,00 to <0,15 | 0 | 0.10 | % | 6 | 40.00 | % | — | 0 | 10 | % | ||||||||||||||||||
0,15 to <0,25 | — | — | — | — | — | — | — | |||||||||||||||||||||
0,25 to <0,50 | — | — | — | — | — | — | — | |||||||||||||||||||||
0,50 to <0,75 | 0 | 0.51 | % | 3 | 40.00 | % | — | 0 | 33 | % | ||||||||||||||||||
0,75 to <2,50 | — | — | — | — | — | — | — | |||||||||||||||||||||
2,50 to <10,00 | 0 | 3.84 | % | 1 | 40.00 | % | — | 0 | 45 | % | ||||||||||||||||||
10,00 to <100,00 | — | — | — | — | — | — | — | |||||||||||||||||||||
100,00 (Default) | — | — | — | — | — | — | — | |||||||||||||||||||||
|
|
|
|
|
|
|
|
|
|
|
| |||||||||||||||||
Total Advanced Approach | 83,906 | 0.13 | % | 3,676 | 12.99 | % | 4,613 | 5 | % | |||||||||||||||||||
|
|
|
|
|
|
|
|
|
|
|
| |||||||||||||||||
| (1) | PD Intervals recommended by the EBA Guidelines on Disclosure Requirements under Part Eight of the CRR. |
| (2) | Corresponds to obligor grade PD weighted by EAD post CRM. |
| (3) | Corresponds to obligor grade LGD weighted by EAD post CRM. |
| (4) | Corresponds to the obligor maturity in days weighted by EAD post CRM. According to Regulation (EU) No 680/2014, it is reported only for categories in which the average maturities are relevant for the calculation of RWAs. |
| (5) | Exposure classified in the FIRB approach corresponds to specialised lending exposure. The Group has chosen to use the slotting criteria, in line with Article 153.5 of the CRR. |
| BBVA. PILLAR III 2020 | 3. RISK | P. 89 |
EU CCR4 - IRB approach - CCR exposures by portfolio and PD scale (Million Euros. 12-31-2019)
PD scale as of 31-12-2019(1) | EAD post-CRM | Average PD(2) | Number of Obligors | Average LGD(3) | Average Maturity (days)(4) | RWAs | RWA Density | |||||||||||||||||||||
Prudential Portfolio- FIRB method(5) | 964 | — | 275 | — | 800 | 83 | % | |||||||||||||||||||||
|
|
|
|
|
|
|
|
|
|
|
|
|
| |||||||||||||||
Corporate - Specialised lending | 964 | — | 275 | — | — | 800 | 83 | % | ||||||||||||||||||||
Prudential Portfolio- AIRB method | 85,635 | 0.21 | % | 3,368 | 11.66 | % | 3,622 | 4 | % | |||||||||||||||||||
|
|
|
|
|
|
|
|
|
|
|
|
|
| |||||||||||||||
Central governments or central banks | 1,599 | 0.05 | % | 5 | 2.10 | % | 8 | 9 | 1 | % | ||||||||||||||||||
|
|
|
|
|
|
|
|
|
|
|
|
|
| |||||||||||||||
0,00 to <0,15 | 1,586 | 0.05 | % | 4 | 1.79 | % | 2 | 4 | 0 | % | ||||||||||||||||||
0,15 to <0,25 | 13 | 0.20 | % | 1 | 40.00 | % | 782 | 5 | 38 | % | ||||||||||||||||||
0,25 to <0,50 | — | — | — | — | — | — | — | |||||||||||||||||||||
0,50 to <0,75 | — | — | — | — | — | — | — | |||||||||||||||||||||
0,75 to <2,50 | — | — | — | — | — | — | — | |||||||||||||||||||||
2,50 to <10,00 | — | — | — | — | — | — | — | |||||||||||||||||||||
10,00 to <100,00 | — | — | — | — | — | — | — | |||||||||||||||||||||
100,00 (Default) | — | — | — | — | — | — | — | |||||||||||||||||||||
Institutions | 81,073 | 0.14 | % | 1,062 | 10.81 | % | 115 | 2,402 | 3 | % | ||||||||||||||||||
|
|
|
|
|
|
|
|
|
|
|
|
|
| |||||||||||||||
0,00 to <0,15 | 62,300 | 0.06 | % | 771 | 13.37 | % | 144 | 1,984 | 3 | % | ||||||||||||||||||
0,15 to <0,25 | 7,927 | 0.20 | % | 71 | 2.51 | % | 8 | 132 | 2 | % | ||||||||||||||||||
0,25 to <0,50 | 7,164 | 0.31 | % | 44 | 1.76 | % | 31 | 124 | 2 | % | ||||||||||||||||||
0,50 to <0,75 | 1,590 | 0.51 | % | 21 | 4.08 | % | 49 | 75 | 5 | % | ||||||||||||||||||
0,75 to <2,50 | 1,854 | 1.34 | % | 136 | 2.00 | % | 9 | 66 | 4 | % | ||||||||||||||||||
2,50 to <10,00 | 238 | 3.60 | % | 15 | 3.20 | % | 50 | 20 | 9 | % | ||||||||||||||||||
10,00 to <100,00 | 0 | 36.30 | % | 4 | 44.65 | % | 1,726 | 1 | 296 | % | ||||||||||||||||||
100,00 (Default) | — | — | — | — | — | — | — | |||||||||||||||||||||
Corporate—SMEs | 139 | 32.80 | % | 787 | 49.92 | % | 462 | 123 | 89 | % | ||||||||||||||||||
|
|
|
|
|
|
|
|
|
|
|
|
|
| |||||||||||||||
0,00 to <0,15 | 4 | 0.10 | % | 228 | 40.40 | % | 470 | 1 | 14 | % | ||||||||||||||||||
0,15 to <0,25 | 1 | 0.21 | % | 50 | 40.98 | % | 876 | 0 | 38 | % | ||||||||||||||||||
0,25 to <0,50 | 5 | 0.30 | % | 81 | 41.06 | % | 777 | 2 | 44 | % | ||||||||||||||||||
0,50 to <0,75 | 24 | 0.53 | % | 79 | 40.54 | % | 508 | 16 | 65 | % | ||||||||||||||||||
0,75 to <2,50 | 32 | 1.17 | % | 159 | 40.06 | % | 722 | 27 | 84 | % | ||||||||||||||||||
2,50 to <10,00 | 26 | 3.99 | % | 128 | 39.55 | % | 595 | 29 | 113 | % | ||||||||||||||||||
10,00 to <100,00 | 4 | 20.47 | % | 22 | 38.20 | % | 314 | 9 | 235 | % | ||||||||||||||||||
100,00 (Default) | 43 | 100.00 | % | 40 | 71.79 | % | 134 | 40 | 92 | % | ||||||||||||||||||
Corporate - Non-SMEs | 2,820 | 0.47 | % | 847 | 39.67 | % | 686 | 1,087 | 39 | % | ||||||||||||||||||
|
|
|
|
|
|
|
|
|
|
|
|
|
| |||||||||||||||
0,00 to <0,15 | 1,684 | 0.11 | % | 283 | 37.75 | % | 661 | 429 | 26 | % | ||||||||||||||||||
0,15 to <0,25 | 284 | 0.20 | % | 117 | 41.95 | % | 661 | 107 | 38 | % | ||||||||||||||||||
0,25 to <0,50 | 588 | 0.31 | % | 209 | 43.83 | % | 710 | 308 | 52 | % | ||||||||||||||||||
0,50 to <0,75 | 93 | 0.50 | % | 88 | 43.16 | % | 631 | 64 | 69 | % | ||||||||||||||||||
0,75 to <2,50 | 119 | 1.10 | % | 74 | 36.68 | % | 836 | 93 | 78 | % | ||||||||||||||||||
2,50 to <10,00 | 48 | 5.15 | % | 57 | 42.84 | % | 1,144 | 77 | 159 | % | ||||||||||||||||||
10,00 to <100,00 | 4 | 14.99 | % | 11 | 43.58 | % | 894 | 8 | 215 | % | ||||||||||||||||||
100,00 (Default) | 0 | 100.00 | % | 8 | 41.40 | % | 1,301 | 0 | 14 | % | ||||||||||||||||||
Retail - Other SMEs | 4 | 23.01 | % | 656 | 40.02 | % | — | 1 | 27 | % | ||||||||||||||||||
|
|
|
|
|
|
|
|
|
|
|
|
|
| |||||||||||||||
0,00 to <0,15 | 0 | 0.12 | % | 110 | 40.10 | % | — | 0 | 10 | % | ||||||||||||||||||
0,15 to <0,25 | 0 | 0.19 | % | 30 | 40.00 | % | — | 0 | 13 | % | ||||||||||||||||||
0,25 to <0,50 | 1 | 0.27 | % | 99 | 40.00 | % | — | 0 | 16 | % | ||||||||||||||||||
0,50 to <0,75 | 0 | 0.48 | % | 57 | 40.00 | % | — | 0 | 21 | % | ||||||||||||||||||
0,75 to <2,50 | 1 | 1.13 | % | 129 | 40.01 | % | — | 0 | 33 | % | ||||||||||||||||||
2,50 to <10,00 | 1 | 5.20 | % | 164 | 40.00 | % | — | 0 | 45 | % | ||||||||||||||||||
10,00 to <100,00 | 0 | 17.01 | % | 36 | 40.12 | % | — | 0 | 61 | % | ||||||||||||||||||
100,00 (Default) | 1 | 100.00 | % | 31 | 40.02 | % | — | 0 | 14 | % | ||||||||||||||||||
Retail - Other Non-SMEs | 0 | 0.10 | % | 11 | 40.00 | % | — | 0 | 7 | % | ||||||||||||||||||
|
|
|
|
|
|
|
|
|
|
|
|
|
| |||||||||||||||
0,00 to <0,15 | 0 | 0.10 | % | 11 | 40.00 | % | — | 0 | 7 | % | ||||||||||||||||||
0,15 to <0,25 | — | — | — | — | — | — | — | |||||||||||||||||||||
0,25 to <0,50 | — | — | — | — | — | — | — | |||||||||||||||||||||
0,50 to <0,75 | — | — | — | — | — | — | — | |||||||||||||||||||||
0,75 to <2,50 | — | — | — | — | — | — | — | |||||||||||||||||||||
2,50 to <10,00 | — | — | — | — | — | — | — | |||||||||||||||||||||
10,00 to <100,00 | — | — | — | — | — | — | — | |||||||||||||||||||||
100,00 (Default) | — | — | — | — | — | — | — | |||||||||||||||||||||
|
|
|
|
|
|
|
|
|
|
|
| |||||||||||||||||
Total Advanced Approach | 86,599 | 0.21 | % | 3,643 | 11.66 | % | 4,423 | 5 | % | |||||||||||||||||||
|
|
|
|
|
|
|
|
|
|
|
| |||||||||||||||||
| (1) | PD Intervals recommended by the EBA Guidelines on Disclosure Requirements under Part Eight of the CRR. |
| (2) | Corresponds to obligor grade PD weighted by EAD post CRM. |
| (3) | Corresponds to obligor grade LGD weighted by EAD post CRM. |
| (4) | Corresponds to the obligor maturity in days weighted by EAD post CRM. According to Regulation (EU) No 680/2014, it is reported only for categories in which the average maturities are relevant for the calculation of RWAs. |
| (5) | Exposure classified in the FIRB approach corresponds to specialised lending exposure. The Group has chosen to use the slotting criteria, in line with Article 153.5 of the CRR. |
| BBVA. PILLAR III 2020 | 3. RISK | P. 90 |
3.2.6.2.3. Composition of collateral for counterparty risk exposure
A table with a breakdown of collaterals contributed or received by the Group to strengthen or reduce exposure to
counterparty credit risk related to derivatives transactions and securities financing transactions as of December 31, 2020 and December 31, 2019 is presented below:
Table 44. EU CCR5-B - Composition of collateral for exposure to Counterparty Credit Risk(1) (Million Euros. 12-31-2020)
| Collateral used in derivative transactions | Collateral used in SFTs | |||||||||||||||||||||||
| Fair Value of Collateral received | Fair Value of posted Collateral(1) | Fair Value of Collateral received | Fair Value of posted Collateral | |||||||||||||||||||||
| Segregated(2) | Unsegregated(3) | Segregated(2) | Unsegregated(3) | |||||||||||||||||||||
Cash- domestic currency | — | 2,688 | 4 | 7,159 | 23,290 | 26,939 | ||||||||||||||||||
Cash- other currencies | — | 2,162 | 1 | 1,503 | 19,141 | 7,218 | ||||||||||||||||||
Domestic sovereign debt | — | — | — | — | 8,081 | 15,650 | ||||||||||||||||||
Other sovereign debt | — | — | — | 20 | 14,377 | 13,179 | ||||||||||||||||||
Government agency debt | — | — | — | — | 144 | 209 | ||||||||||||||||||
Corporate bonds | — | 998 | — | — | 5,658 | 11,274 | ||||||||||||||||||
Equity securities | — | — | — | — | — | 2,435 | ||||||||||||||||||
Other collateral | — | 1,853 | — | 110 | 2,810 | — | ||||||||||||||||||
|
|
|
|
|
|
|
| |||||||||||||||||
Total | — | 7,701 | 4 | 8,792 | ||||||||||||||||||||
|
|
|
|
|
|
|
| |||||||||||||||||
| (1) | In accordance with Articles 279 and 298 of Regulation (EU) 2015/13 regarding the treatment of collateral for the purpose of calculating counterparty risk, the amount of collateral provided as collateral for the netting of derivative liability arrangements has been taken into account in the EAD calculation. |
| (2) | Refers to collateral that is held in a bankruptcy-remote manner. (3) Refers to collateral that is not held in a bankruptcy-remote manner. |
EU CCR5-B - Composition of collateral for exposure to Counterparty Credit Risk(1) (Million Euros. 12-31-2019)
| Collateral used in derivative transactions | Collateral used in SFTs | |||||||||||||||||||||||
| Fair Value of Collateral received | Fair Value of posted Collateral(1) | Fair Value of Collateral received | Fair Value of posted Collateral | |||||||||||||||||||||
| Segregated(2) | Unsegregated(3) | Segregated(2) | Unsegregated(3) | |||||||||||||||||||||
Cash- domestic currency | — | 2,549 | — | 6,242 | 29,306 | 29,259 | ||||||||||||||||||
Cash- other currencies | — | 1,113 | — | 1,154 | 16,601 | 6,371 | ||||||||||||||||||
Domestic sovereign debt | — | — | — | — | 5,163 | 19,708 | ||||||||||||||||||
Other sovereign debt | — | 5 | — | — | 7,947 | 14,411 | ||||||||||||||||||
Government agency debt | — | 2 | — | — | 162 | 215 | ||||||||||||||||||
Corporate bonds | — | 960 | — | — | 5,029 | 7,833 | ||||||||||||||||||
Equity securities | — | — | — | — | — | 3,526 | ||||||||||||||||||
Other collateral | — | 1,811 | — | — | 14,093 | 29 | ||||||||||||||||||
|
|
|
|
|
|
|
| |||||||||||||||||
Total | — | 6,440 | — | 7,397 | ||||||||||||||||||||
|
|
|
|
|
|
|
| |||||||||||||||||
| (1) | In accordance with Articles 279 and 298 of Regulation (EU) 2015/13 regarding the treatment of collateral for the purpose of calculating counterparty risk, the amount of collateral provided as collateral for the netting of derivative liability arrangements has been taken into account in the EAD calculation. |
| (2) | Refers to collateral that is held in a bankruptcy-remote manner. (3) Refers to collateral that is not held in a bankruptcy-remote manner. |
3.2.6.2.4. Credit Derivatives transactions
The table below shows the amounts of credit derivative transactions, broken down into purchased and sold derivatives:
Table 45. EU CCR6 - Credit derivatives exposures (Million Euros. 12-31-2020)
| Credit derivative hedges | ||||||||||||
| Protection Bought | Protection Sold | Other credit derivatives | ||||||||||
Notionals | 10,148 | 14,110 | — | |||||||||
|
|
|
|
|
| |||||||
Single-name credit default swaps | 5,166 | 6,243 | — | |||||||||
Index credit default swaps | 4,982 | 5,985 | — | |||||||||
Total return swaps | — | 1,882 | — | |||||||||
Credit options | — | — | — | |||||||||
Other credit derivatives | — | — | — | |||||||||
Fair Values | (122 | ) | (30 | ) | — | |||||||
|
|
|
|
|
| |||||||
Positive fair value (asset) | 21 | 132 | — | |||||||||
Negative fair value (liability) | (142 | ) | (163 | ) | — | |||||||
| BBVA. PILLAR III 2020 | 3. RISK | P. 91 |
EU CCR6 - EU CCR6 - Credit derivatives exposures (Million Euros. 12-31-2019)
| Credit derivative hedges | Other credit derivatives | |||||||||||
| Protection Bought | Protection Sold | |||||||||||
Notionals | 12,431 | 16,646 | — | |||||||||
|
|
|
|
|
| |||||||
Single-name credit default swaps | 5,718 | 6,934 | — | |||||||||
Index credit default swaps | 6,713 | 7,338 | — | |||||||||
Total return swaps | — | 2,225 | — | |||||||||
Credit options | — | 150 | — | |||||||||
Other credit derivatives | — | — | — | |||||||||
Fair Values | (218 | ) | 174 | — | ||||||||
|
|
|
|
|
| |||||||
Positive fair value (asset) | 36 | 316 | — | |||||||||
Negative fair value (liability) | (255 | ) | (143 | ) | — | |||||||
As of year-end 2020 and 2019, the Group did not use credit derivative as collateral in brokerage activities.
3.2.6.3. CVA charge requirements
The CVA surcharge in Capital refers to the additional capital requirements to cover unexpected losses due to credit valuation adjustments, for which there are two approaches:
| • | Standardised Approach (Art. 384 CRR): application of a standard regulatory formula. The formula applied is an analytical approximation to the calculation of the CVA VaR by supposing that the counterparty spreads depend on a single systematic risk factor and on its own idiosyncratic factor, both variables distributed by independent normal distributions, assuming a 99% confidence level. |
| • | Advanced Approach (Art 383 CRR): based on the market |
| • | risk VaR methodology, which requires a calculation of the “CVA VaR”, assuming the same confidence level (99%) and time horizon (10 days), as well as a stressed scenario. As of December 31, 2020 and December 31, 2019, the Group has no surcharge for CVA calculated under the advanced approach. |
Procedures for calculating the valuation adjustments and reserves
Credit valuation adjustments (CVA) and debit valuations adjustments (DVA) are incorporated into derivative valuations of both assets and liabilities, to reflect the impact on fair value of the counterparty credit risk and own credit risk, respectively. (See Note 8.1.1 of the Consolidated Financial Statements of BBVA Group for more information).
The credit valuation adjustments in millions of euros as of December 31, 2020 and December 31, 2019 are shown below:
Table 46. EU CCR2 - CVA Capital Charge (Million Euros. 12-31-2020)
| Exposure value | RWA | |||||||
Total portfolios subject to the advanced method | — | — | ||||||
(i) VaR component (included 3x multiplier) | — | — | ||||||
(ii) SVaR component (included 3x multiplier) | — | — | ||||||
All portfolios subject to the standardised method | 7,369 | 1,485 | ||||||
|
|
|
| |||||
Total subject to the CVA capital charge | 7,369 | 1,485 | ||||||
|
|
|
| |||||
EU CCR2 - CVA Capital Charge (Million Euros. 12-31-2019)
| Exposure value | RWA | |||||||
Total portfolios subject to the advanced method | — | — | ||||||
(i) VaR component (included 3x multiplier) | — | — | ||||||
(ii) SVaR component (included 3x multiplier) | — | — | ||||||
All portfolios subject to the standardised method | 7.283 | 1.529 | ||||||
|
|
|
| |||||
Total subject to the CVA capital charge | 7.283 | 1.529 | ||||||
|
|
|
| |||||
The flow statements of CVA RWAs during 2020 are shown below:
Table 47. Variaciones en términos de APRs por CVA
(Millones de euros)
CVA | ||||||||
RWAs as of December 31, 2019 | 1,529 | |||||||
Effects | Asset size | (44 | ) | |||||
RWAs as of December 31, 2020 | 1,485 |
As of December 31, 2020, the CVA risk-weighted assets remain at a similar level compared to December 2019.
3.2.6.4. Exposure to central counterparty clearing houses
The following table presents a complete overview of the exposure to central counterparty clearing houses by type of exposure (arising from transactions, margins, or contributions to the default fund) and their corresponding capital requirements:
| BBVA. PILLAR III 2020 | 3. RISK | P. 92 |
Table 48. EU CCR8- Exposures to CCPs (Million Euros)
| 12-31-2020 | 12-31-2019 | |||||||||||||||
| EAD post CRM | RWA | EAD post CRM | RWA | |||||||||||||
Exposures to QCCPs (total) | 458 | 198 | ||||||||||||||
Exposures for trades at QCCPs (excluding initial margin and default fund contributions); of which | 6,812 | 349 | 5,823 | 139 | ||||||||||||
(i) OTC Derivatives | 4,738 | 114 | 4,939 | 121 | ||||||||||||
(ii) Exchange-traded derivatives | 1,729 | 228 | 520 | 10 | ||||||||||||
(iii) Securities financing transactions (SFTs) | 346 | 7 | 364 | 7 | ||||||||||||
(iv) Netting sets where cross-product netting has been approved | — | — | — | — | ||||||||||||
Segregated initial margin | 1,372 | 1,239 | ||||||||||||||
Non-segregated initial margin | 576 | 20 | 340 | 16 | ||||||||||||
Pre-funded default fund contributions | 132 | 89 | 111 | 44 | ||||||||||||
Alternative calculation of own funds requirements for exposures | — | — | ||||||||||||||
|
|
|
| |||||||||||||
Exposures to non-QCCPs (total) | 667 | �� | 690 | |||||||||||||
|
|
|
| |||||||||||||
Exposures for trades at non-QCCPs (excluding initial margin and default to contributions); of which | 17 | 20 | 273 | 273 | ||||||||||||
(i) OTC Derivatives | 10 | 10 | 42 | 42 | ||||||||||||
(ii) Exchange-traded derivatives | 6 | 9 | 6 | 9 | ||||||||||||
(iii) Securities financing transactions (SFTs) | 1 | 1 | 225 | 222 | ||||||||||||
(iv) Netting sets where cross-product netting has been approved | — | — | — | — | ||||||||||||
Segregated initial margin | 171 | — | ||||||||||||||
Non-segregated initial margin | 710 | 647 | 496 | 417 | ||||||||||||
Pre-funded default fund contributions | — | — | 1 | 0 | ||||||||||||
Unfunded default fund contributions | — | — | — | — | ||||||||||||
3.2.7. Information on securitisation
3.2.7.1. General characteristics of securitisation
3.2.7.1.1. Purposes of securitisation
The Group’s current securitisation policy considers a recurrent issuance program with a deliberate diversification of securitised assets that adjusts their volume to the Bank’s capital requirements and to market conditions.
This program is complemented by all the other finance and capital instruments, thereby diversifying the need to resort to wholesale markets.
The definition of the strategy and the execution of the operations, as with all other wholesale finance and capital management, is supervised by the Assets & Liabilities Committee, with the pertinent internal authorisations obtained directly from the Board of Directors or from the Executive Committee.
The main objective of securitisation is to serve as an instrument for the efficient management of the balance sheet, above all as a source of liquidity at an efficient cost, obtaining liquid assets through eligible collateral, as a complement to other financial instruments. In addition, there are other secondary objectives associated with the use of securitisation instruments, such as the freeing up of regulatory capital by transferring risk and the freeing of potential excess over the expected loss, provided it is allowed by the volume of the first-loss tranche and risk transfer.
Main risk exposed in securitisation operations.
1. Default risk
Default risk is the risk that the debtor does not pay the assumed contractual obligations by the due date and in the correct manner (for example, potential non-payment of installments).
In the particular case of securitisation, the entities provide information to investors on the situation of the securitised loan portfolio. In this respect, it is worth noting that transactions transferred to the Securitisation Fund do not include defaults, or at most, if there is one, in no case do they exceed 30 days of non-payment, demonstrating the high quality of securitised transactions. The rating agencies take this element closely into account when analyzing the credit risk of transactions.
BBVA monitors the changes in these indicators with the aim of establishing specific action plans in the different products, in order to correct any deviations that are leading to a deterioration in credit quality.
In order to monitor these indicators, monthly, and in some cases, daily information is available. It includes flows of additions, recoveries, irregular investments and non-performing loans. The information is obtained through different applications and reports prepared in the Risk area.
BBVA’s policy of recovery for impaired loans consists of defining an operating system that allows a speedy and efficient correction of the irregular situation. It is based on a highly personalised management, with a key role being played by the Recovery Manager and his close and ongoing relationship with the debtor.
| BBVA. PILLAR III 2020 | 3. RISK | P. 93 |
The main guarantee is always mortgage on the asset subject of the transaction, or on the main residence. In addition, there are frequent personal guarantees issued by the holders of the loan or the guarantors, which reinforce the repayment of the debt and quality of the risk. The rights to collection before insurance companies are also subrogated in favor of the Bank in cases where there is damage to the mortgaged building due to fire or other duly stipulated causes.
BBVA’s policy regarding the use of guarantees on retained securitised exposures, at this stage, is limited to the signature of a financial guarantee with the European Investment Bank on specific tranches of synthetic securitisations, including pools of corporates and SMEs loans granted by BBVA
2. Early repayment risk
This derives from the potential total or partial prepayment by the debtor of the amounts corresponding to the (fully or partially) securitised loans, which could imply that the maturity of the securitisation bonds calculated at the time of the issue is shorter than the maturity of the loans transferred to the Fund.
This risk is mainly due to the variations of market interest rates, but despite its importance it is not the only determining factor; to this have to be added other more personal elements, such as inheritance, divorce, change of residence, etc.
In the specific case of the Group’s securitisations, this risk is very limited, as the maturity date of the securitisation Bonds is set according to the maturity of the last loan of the securitised portfolio.
3. Liquidity risk
At times it is noted that a possible limited liquidity of the markets in which the Bonds are traded could constitute a risk derived from the securitisation processes.
Although an entity may not undertake contracts in the secondary market of Bonds issued by the Securitisation Fund, and thus provide liquidity to the funds, the securitisation process itself consists of converting illiquid assets that form part of the Bank’s balance sheet into liquid assets in the form of securitisation Bonds, which give the possibility for trading and transferring them in a regulated market. This would not be the case if they were not subject to the securitisation process.
In addition, understanding liquidity risk as the possible time mismatch between the maturities of the collections generated by the loans and the payments the Bonds originate, BBVA has not so far made any securitisation issues in which there is a divergence between collections and payments. The entities that have programs for debt security issues, in which this risk is typically present, mitigate it with the use of liquidity lines that are included in the structure of the Fund.
3.2.7.1.2. Functions performed by the securitisation process and degree of involvement
The Group’s degree of involvement in its securitisation funds is not usually restricted to the mere role of assignor and administrator of the securitised portfolio.
Chart 18. Functions performed in the securitisation process and Group’s level of involvement
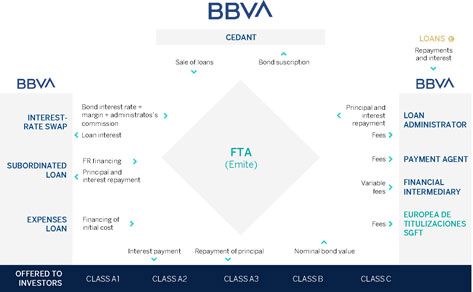
| BBVA. PILLAR III 2020 | 3. RISK | P. 94 |
As can be seen in the above chart, the Group has usually taken additional roles such as:
| • | Payment Agent. |
| • | Provider of treasury account. |
| • | Provider of the subordinated loan and of the financing of initial costs, with the former being the one that finances the first-loss tranche, and the latter financing the fund’s fixed expenditure. |
| • | Administrative agent of the securitised portfolio. |
The Group has not assumed the role of sponsor of securitisation originated by third-party institutions.
The Group’s balance sheet maintains the first-loss tranches of all securitisation that has been carried out.
It is worth noting that the Group has maintained a consistent line on generating securitisation operations since the credit crunch, which began in July 2007.
In addition, the Group has performed various Synthetic Securitisation operations to date, introducing this new operation as an additional source of regulatory capital release.
3.2.7.1.3. Methods used for the calculation of risk-weighted exposure in securitisation transactions.
When securitisation positions meet the criteria for significant and effective risk transfer as defined by Articles 244 and 245 of Regulation 2017/2401, the Group calculates the capital requirements of these securitisations by applying the following methods, which apply to both originated securitisations and investment positions in securitisation funds originated by third parties:
| • | IRBA method (Article 259): When according to the securitisation features, all information on the underlying loans of the securitised portfolio is accesible, and at least for 95% of the loans the risk weights are calculated under IRB approach. |
| • | SA method (Article 261): When information is available on the underlying loans of the securitised portfolio, but the threshold of 95% of the loans under the IRB approach is not reached. |
| • | ERBA method (Article 263): When information on the underlying securitisation loans is not accesible, and it is necessary to use external rating data. |
3.2.7.1.4. Transfer of risk in securitisation activities and criteria for recognition of gains on sales
The Group considers that the risks and benefits of the securitisations are substantially retained if the subordinated bonds are held and/or if subordination funding has been granted to those securitisation funds, which means that the credit loss risk of the securitised assets will be assumed. Consequently, the Group is not derecognizing those transferred loan portfolios.
In addition, the Group recognizes the gains on sales of securitised assets when they are derecognised from the balance sheet, which implies to comply with the substantial transfer of risks and benefits requirements described above.
The result will be recognised in the income statement and calculated as the difference between the carrying amount and the sum of the amount received, including any new asset received minus liabilities assumed.
When the amount of the transferred financial asset matches the total amount of the original financial asset, the new financial assets, financial liabilities and service-delivery liabilities, which, if any, arise as a result of the transfer, shall be recorded at fair value.
For more information on securities accounting see Note 2.2.2 of the Consolidated Financial Statements of BBVA Group.
3.2.7.2. Securitisation exposure in the banking and trading book
The Group has carried out three securitisations in 2020, two of them in cash or traditional format and the third in synthetic securitisation format. One of the traditional operations and the synthetic operation, both with risk transfer.
The first of them in June, from a portfolio of Auto loans (BBVA Consumer Auto 2020-1) amounting to €1,100 million, the second in July, for an amount of €2,100 million (BBVA Leasing 2 FT), from a portfolio of leases and, the third, the synthetic operation (VELA SME 2020-1) also in June, for an amount of €1,244 million from a portfolio of loans to SMEs and companies. Given that there is no risk transfer for the BBVA Leasing 2 FT securitisation, this operation is not included in the securitisation framework defined by the CRR, the calculation of its risk-weighted assets based on the underlying loans.
Additionally, in February, the Synthetic Securitisations VELA SME 2018 and VELA Corporate 2018-1, consisting of loans to SMEs and Corporates, were early canceled by executing the Regulatory Call - clause provided for in the contract.
The table below shows the amounts in terms of EAD of securitisation positions for the banking book:
| BBVA. PILLAR III 2020 | 3. RISK | P. 95 |
Table 49. SEC1 — Securitisation exposures in the banking book (Million Euros. 12-31-2020)
| Bank acts as originator | Bank acts as sponsor | Bank acts as investor | ||||||||||||||||||||||||||||||||||||||||||||||
| Traditional | Of which: STS | Synthetic | Subtotal | Traditional | Of which: STS | Synthetic | Subtotal | Traditional | Of which: STS | Synthetic | Subtotal | |||||||||||||||||||||||||||||||||||||
Retail (total)-of which | 269 | 269 | 932 | 1,200 | — | — | — | — | 411 | 73 | — | 411 | ||||||||||||||||||||||||||||||||||||
|
|
|
|
|
|
|
|
|
|
|
|
|
|
|
|
|
|
|
|
|
|
|
| |||||||||||||||||||||||||
Residential mortgage | — | — | — | — | — | — | — | — | 337 | — | — | 337 | ||||||||||||||||||||||||||||||||||||
Credit card | — | — | — | — | — | — | — | — | — | — | — | — | ||||||||||||||||||||||||||||||||||||
Other retail exposures | 269 | 269 | 932 | 1,200 | — | — | — | — | 73 | 73 | — | 73 | ||||||||||||||||||||||||||||||||||||
Re-Securitisation | — | — | — | — | — | — | — | — | — | — | — | — | ||||||||||||||||||||||||||||||||||||
|
|
|
|
|
|
|
|
|
|
|
|
|
|
|
|
|
|
|
|
|
|
|
| |||||||||||||||||||||||||
Wholesale (total)-of which | — | — | — | — | — | — | — | — | 54 | — | — | 54 | ||||||||||||||||||||||||||||||||||||
|
|
|
|
|
|
|
|
|
|
|
|
|
|
|
|
|
|
|
|
|
|
|
| |||||||||||||||||||||||||
Loans to corporates | — | — | — | — | — | — | — | — | — | — | — | — | ||||||||||||||||||||||||||||||||||||
Commercial mortgage | — | — | — | — | — | — | — | — | — | — | — | — | ||||||||||||||||||||||||||||||||||||
Lease and receivables | — | — | — | — | — | — | — | — | — | — | — | — | ||||||||||||||||||||||||||||||||||||
Other wholesale | — | — | — | — | — | — | — | — | 54 | — | — | 54 | ||||||||||||||||||||||||||||||||||||
Re-Securitisation | — | — | — | — | — | — | — | — | — | — | — | — | ||||||||||||||||||||||||||||||||||||
SEC1- Securitisation exposures in the banking book (Million Euros. 12-31-2019)
| Bank acts as originator | Bank acts as sponsor | Bank acts as investor | ||||||||||||||||||||||||||||||||||
| Traditional | Synthetic | Subtotal | Traditional | Synthetic | Subtotal | Traditional | Synthetic | Subtotal | ||||||||||||||||||||||||||||
Retail (total)-of which | 788 | — | 788 | — | — | — | 474 | — | 474 | |||||||||||||||||||||||||||
|
|
|
|
|
|
|
|
|
|
|
|
|
|
|
|
|
| |||||||||||||||||||
Residential mortgage | — | — | — | — | — | — | 474 | — | 474 | |||||||||||||||||||||||||||
Credit card | — | — | — | — | — | — | — | — | — | |||||||||||||||||||||||||||
Other retail exposures | 788 | — | 788 | — | — | — | — | — | — | |||||||||||||||||||||||||||
Re-Securitisation | — | — | — | — | — | — | — | — | — | |||||||||||||||||||||||||||
|
|
|
|
|
|
|
|
|
|
|
|
|
|
|
|
|
| |||||||||||||||||||
Wholesale (total)-of which | 65 | 1,447 | 1,511 | — | — | — | 75 | — | 75 | |||||||||||||||||||||||||||
|
|
|
|
|
|
|
|
|
|
|
|
|
|
|
|
|
| |||||||||||||||||||
Loans to corporates | 23 | 1,447 | 1,470 | — | — | — | 44 | — | 44 | |||||||||||||||||||||||||||
Commercial mortgage | — | — | — | — | — | — | 1 | — | 1 | |||||||||||||||||||||||||||
Lease and receivables | 42 | — | 42 | — | — | — | — | — | — | |||||||||||||||||||||||||||
Other wholesale | — | — | — | — | — | — | 30 | — | 30 | |||||||||||||||||||||||||||
Re-Securitisation | — | — | — | — | — | — | — | — | — | |||||||||||||||||||||||||||
The table below shows the amounts in terms of EAD of securitisation positions for the trading book:
Table 50. SEC2 — Securitisation exposures in the trading book (Million euros. 12-31-2020)
| Bank acts as originator | Bank acts as sponsor | Bank acts as investor | ||||||||||||||||||||||||||||||||||||||||||||||
| Traditional | Of Which: STS | Synthetic | Subtotal | Traditional | Of Which: STS | Synthetic | Subtotal | Traditional | Of Which: STS | Synthetic | Subtotal | |||||||||||||||||||||||||||||||||||||
Retail (total)-of which | — | — | — | — | — | — | 16 | — | — | 16 | ||||||||||||||||||||||||||||||||||||||
|
|
|
|
|
|
|
|
|
|
|
|
|
|
|
|
|
|
|
|
|
|
|
| |||||||||||||||||||||||||
Residential mortgage | — | — | — | — | — | — | 16 | — | — | 16 | ||||||||||||||||||||||||||||||||||||||
Credit card | — | — | — | — | — | — | — | — | — | — | — | — | ||||||||||||||||||||||||||||||||||||
Other retail exposures | — | — | — | — | — | — | — | — | — | — | — | — | ||||||||||||||||||||||||||||||||||||
Re-Securitisation | — | — | — | — | — | — | — | — | — | — | — | — | ||||||||||||||||||||||||||||||||||||
|
|
|
|
|
|
|
|
|
|
|
|
|
|
|
|
|
|
|
|
|
|
|
| |||||||||||||||||||||||||
Wholesale (total)-of which | — | — | — | — | — | — | — | — | — | — | — | — | ||||||||||||||||||||||||||||||||||||
|
|
|
|
|
|
|
|
|
|
|
|
|
|
|
|
|
|
|
|
|
|
|
| |||||||||||||||||||||||||
Loans to corporates | — | — | — | — | — | — | — | — | — | — | — | — | ||||||||||||||||||||||||||||||||||||
Commercial mortgage | — | — | — | — | — | — | — | — | — | — | — | — | ||||||||||||||||||||||||||||||||||||
Lease and receivables | — | — | — | — | — | — | — | — | — | — | — | — | ||||||||||||||||||||||||||||||||||||
Other wholesale | — | — | — | — | — | — | — | — | — | — | — | — | ||||||||||||||||||||||||||||||||||||
Re-Securitisation | — | — | — | — | — | — | — | — | — | — | — | — | ||||||||||||||||||||||||||||||||||||
| (*) | Positions in securitisations posted in the trading portfolio are included. |
As of December 31, 2019, the Group had no securitisation exposures in the trading book.
3.2.7.3. Securitisation – Group acting as investor
The table below shows the EAD and RWAs of securitisation
positions where the Group acts as investor by type of exposure, tranches and weighting ranges and their corresponding capital requirements as of December 31, 2020 and December 31, 2019.
| BBVA. PILLAR III 2020 | RISK | P. 96 |
Table 51. SEC4—Securitisation exposures in the banking book and associated regulatory capital requirements – bank acting as investor (Million Euros. 12-31-2020)
| Exposure values (by RW bands) | Exposure values (by regulatory approach) | RWA (by regulatory approach) | Capital requirement after cap | |||||||||||||||||||||||||||||||||||||||||||||||||||||||||||||||||
| £20% RW | >20% to 50% RW | >50% to 100% RW | >100% to <1250% RW | 1250% RW | SEC-IRBA | SEC-ERBA & SEC-IAA | SEC-SA | 1250% | SEC-IRBA | SEC-ERBA & SEC-IAA | SEC-SA | 1250% | SEC-IRBA | SEC-ERBA & SEC-IAA | SEC-SA | 1250% | ||||||||||||||||||||||||||||||||||||||||||||||||||||
Total Exposures | 75 | 308 | 50 | 9 | 7 | — | 442 | — | 7 | — | 204 | — | — | — | 16 | — | — | |||||||||||||||||||||||||||||||||||||||||||||||||||
|
|
|
|
|
|
|
|
|
|
|
|
|
|
|
|
|
|
|
|
|
|
|
|
|
|
|
|
|
|
|
|
|
| |||||||||||||||||||||||||||||||||||
Traditional Securitisation | 75 | 308 | 50 | 9 | 7 | — | 442 | — | 7 | — | 204 | — | — | — | 16 | — | — | |||||||||||||||||||||||||||||||||||||||||||||||||||
|
|
|
|
|
|
|
|
|
|
|
|
|
|
|
|
|
|
|
|
|
|
|
|
|
|
|
|
|
|
|
|
|
| |||||||||||||||||||||||||||||||||||
Of which Securitisation | 75 | 308 | 50 | 9 | 7 | — | 442 | — | 7 | — | 204 | — | — | — | 16 | — | — | |||||||||||||||||||||||||||||||||||||||||||||||||||
Of which retail underlying | 74 | 269 | 38 | 8 | 6 | — | 388 | — | 6 | — | 175 | — | — | — | 14 | — | — | |||||||||||||||||||||||||||||||||||||||||||||||||||
Of which STS | 73 | — | — | — | — | — | 73 | — | — | — | 7 | — | — | — | 1 | — | — | |||||||||||||||||||||||||||||||||||||||||||||||||||
Of which wholesale | 1 | 39 | 12 | 2 | — | 54 | — | — | 29 | — | — | — | 2 | — | — | |||||||||||||||||||||||||||||||||||||||||||||||||||||
Of which STS | — | — | — | — | — | — | — | — | — | — | — | — | — | — | — | — | — | |||||||||||||||||||||||||||||||||||||||||||||||||||
Of which re-Securitisation | — | — | — | — | — | — | — | — | — | — | — | — | — | — | — | — | — | |||||||||||||||||||||||||||||||||||||||||||||||||||
Of which senior | — | — | — | — | — | — | — | — | — | — | — | — | — | — | — | — | — | |||||||||||||||||||||||||||||||||||||||||||||||||||
Of which non-senior | — | — | — | — | — | — | — | — | — | — | — | — | — | — | — | — | — | |||||||||||||||||||||||||||||||||||||||||||||||||||
Synthetic Securitisation | — | — | — | — | — | — | — | — | — | — | — | — | — | — | — | — | — | |||||||||||||||||||||||||||||||||||||||||||||||||||
|
|
|
|
|
|
|
|
|
|
|
|
|
|
|
|
|
|
|
|
|
|
|
|
|
|
|
|
|
|
|
|
|
| |||||||||||||||||||||||||||||||||||
Of which Securitisation | — | — | — | — | — | — | — | — | — | — | — | — | — | — | — | — | — | |||||||||||||||||||||||||||||||||||||||||||||||||||
Of which retail underlying | — | — | — | — | — | — | — | — | — | — | — | — | — | — | — | — | — | |||||||||||||||||||||||||||||||||||||||||||||||||||
Of which wholesale | — | — | — | — | — | — | — | — | — | — | — | — | — | — | — | — | — | |||||||||||||||||||||||||||||||||||||||||||||||||||
Of which re-Securitisation | — | — | — | — | — | — | — | — | — | — | — | — | — | — | — | — | — | |||||||||||||||||||||||||||||||||||||||||||||||||||
Of which senior | — | — | — | — | — | — | — | — | — | — | — | — | — | — | — | — | — | |||||||||||||||||||||||||||||||||||||||||||||||||||
Of which non-senior | — | — | — | — | — | — | — | — | — | — | — | — | — | — | — | — | — | |||||||||||||||||||||||||||||||||||||||||||||||||||
De la cual, preferente | ||||||||||||||||||||||||||||||||||||||||||||||||||||||||||||||||||||
De la cual, no preferente | ||||||||||||||||||||||||||||||||||||||||||||||||||||||||||||||||||||
| * | Securitisations with a risk weighting of 1250% are deducted from own funds, as explained in section m) of chapter 2.1 of this report. |
SEC4 - Securitisation exposures in the banking book and associated regulatory capital requirements – bank acting as investor (Million Euros. 12-31-2019)
| Exposure values (by RW bands) | Exposure values (by regulatory approach) | RWA (by regulatory approach) | Capital requirement after cap | |||||||||||||||||||||||||||||||||||||||||||||||||||||||||||||||||
| £20% RW | >20% to 50% RW | >50% to 100% RW | >100% to <1250% RW | 1250% RW | SEC-IRBA | SEC-ERBA & SEC-IAA | SEC-SA | 1250% | SEC-IRBA | SEC-ERBA & SEC-IAA | SEC-SA | 1250% | SEC-IRBA | SEC-ERBA & SEC-IAA | SEC-SA | 1250% | ||||||||||||||||||||||||||||||||||||||||||||||||||||
Total Exposures | 395 | 120 | 5 | 5 | 25 | 411 | — | 113 | 25 | 38 | — | 60 | 1 | 3 | — | 5 | — | |||||||||||||||||||||||||||||||||||||||||||||||||||
|
|
|
|
|
|
|
|
|
|
|
|
|
|
|
|
|
|
|
|
|
|
|
|
|
|
|
|
|
|
|
|
|
| |||||||||||||||||||||||||||||||||||
Traditional Securitisation | 395 | 120 | 5 | 5 | 25 | 411 | — | 113 | 25 | 38 | — | 60 | 1 | 3 | — | 5 | — | |||||||||||||||||||||||||||||||||||||||||||||||||||
|
|
|
|
|
|
|
|
|
|
|
|
|
|
|
|
|
|
|
|
|
|
|
|
|
|
|
|
|
|
|
|
|
| |||||||||||||||||||||||||||||||||||
Of which Securitisation | 395 | 120 | 5 | 5 | 25 | 411 | — | 113 | 25 | 38 | — | 60 | 1 | 3 | — | 5 | — | |||||||||||||||||||||||||||||||||||||||||||||||||||
Of which retail underlying | 388 | 52 | 5 | 5 | 25 | 380 | — | 69 | 25 | 30 | — | 39 | 1 | 2 | — | 3 | — | |||||||||||||||||||||||||||||||||||||||||||||||||||
Of which wholesale | 6 | 68 | — | — | — | 31 | — | 44 | — | 8 | — | 21 | — | 1 | — | 2 | — | |||||||||||||||||||||||||||||||||||||||||||||||||||
Of which re-Securitisation | — | — | — | — | — | — | — | — | — | — | — | — | — | — | — | — | — | |||||||||||||||||||||||||||||||||||||||||||||||||||
Of which senior | — | — | — | — | — | — | — | — | — | — | — | — | — | — | — | — | — | |||||||||||||||||||||||||||||||||||||||||||||||||||
Of which non-senior | — | — | — | — | — | — | — | — | — | — | — | — | — | — | — | — | — | |||||||||||||||||||||||||||||||||||||||||||||||||||
Synthetic Securitisation | — | — | — | — | — | — | — | — | — | — | — | — | — | — | — | — | — | |||||||||||||||||||||||||||||||||||||||||||||||||||
|
|
|
|
|
|
|
|
|
|
|
|
|
|
|
|
|
|
|
|
|
|
|
|
|
|
|
|
|
|
|
|
|
| |||||||||||||||||||||||||||||||||||
Of which Securitisation | — | — | — | — | — | — | — | — | — | — | — | — | — | — | — | — | — | |||||||||||||||||||||||||||||||||||||||||||||||||||
Of which retail underlying | — | — | — | — | — | — | — | — | — | — | — | — | — | — | — | — | — | |||||||||||||||||||||||||||||||||||||||||||||||||||
Of which wholesale | — | — | — | — | — | — | — | — | — | — | — | — | — | — | — | — | — | |||||||||||||||||||||||||||||||||||||||||||||||||||
Of which re-Securitisation | — | — | — | — | — | — | — | — | — | — | — | — | — | — | — | — | — | |||||||||||||||||||||||||||||||||||||||||||||||||||
Of which senior | — | — | — | — | — | — | — | — | — | — | — | — | — | — | — | — | — | |||||||||||||||||||||||||||||||||||||||||||||||||||
Of which non-senior | — | — | — | — | — | — | — | — | — | — | — | — | — | — | — | — | — | |||||||||||||||||||||||||||||||||||||||||||||||||||
| * | Securitisations with a risk weighting of 1250% are deducted from own funds, as explained in section m) of chapter 2.1 of this report. |
| BBVA. PILLAR III 2020 | 3. RISK | P. 97 |
3.2.7.4. Securitisation – Group acting as originator
3.2.7.4.1. Rating agencies used
The external credit assessment institutions (ECAI) involved in the rating of those securitisations originated by the Group which fulfill the criteria of risk transfer and falling within the securitisation solvency framework are, generally, Fitch, Moody’s, S&P, DBRS and ARC Rating, S.A. The types of securitisation exposure for which each agency is used are, with no differentiation between the different agencies, all the asset types that tend to be used as residential mortgage loans to Corporates and SMEs, consumer finance and autos and leasing.
In all the securitisation funds, the agencies have assessed the risk of the entire issuance structure:
| • | Awarding ratings to all bond tranches. |
| • | Establishing the volume of the credit enhancement. |
| • | Establishing the necessary triggers (early termination of the restitution period, pro-rata depreciation of AAA classes, pro-rata depreciation of series subordinated to AAA and depreciation of the reserve fund, amongst others). |
For each issue, in addition to the initial rating, the agencies carry out regular quarterly monitoring.
3.2.7.4.2. Positions in securitisation originated by the Group
The table below shows the EAD and RWAs of securitisation positions originated by the Group broken down by type of exposure, tranches and weighting ranges and their corresponding capital requirements as of December 31, 2020 and December 31, 2019.
| BBVA. PILLAR III 2020 | RISK | P. 98 |
Table 52. SEC3—Securitisation exposures in the banking book and associated regulatory capital requirements – bank acting as originator or as sponsor (Million Euros. 12-31-2020)
| Exposure values (by RW bands) | Exposure values (by regulatory approach) | RWA (by regulatory approach) | Capital requirement after cap | |||||||||||||||||||||||||||||||||||||||||||||||||||||||||||||||||
| £20% RW | >20% to 50% RW | >50% to 100% RW | >100% to <1250% RW | 1250% RW | SEC-IRBA | SEC-ERBA & SEC-IAA | SEC-SA | 1250% | SEC-IRBA | SEC-ERBA & SEC-IAA | SEC-SA | 1250% | SEC-IRBA | SEC-ERBA & SEC-IAA | SEC-SA | 1250% | ||||||||||||||||||||||||||||||||||||||||||||||||||||
Total Exposures | 1,175 | — | — | 3 | 22 | 1,178 | — | — | 22 | 143 | — | — | — | 11 | — | — | — | |||||||||||||||||||||||||||||||||||||||||||||||||||
|
|
|
|
|
|
|
|
|
|
|
|
|
|
|
|
|
|
|
|
|
|
|
|
|
|
|
|
|
|
|
|
|
| |||||||||||||||||||||||||||||||||||
Traditional Securitisation | 264 | — | — | 3 | 2 | 267 | — | — | 2 | 52 | — | — | — | 4 | — | — | — | |||||||||||||||||||||||||||||||||||||||||||||||||||
|
|
|
|
|
|
|
|
|
|
|
|
|
|
|
|
|
|
|
|
|
|
|
|
|
|
|
|
|
|
|
|
|
| |||||||||||||||||||||||||||||||||||
Of which Securitisation | 264 | — | — | 3 | 2 | 267 | — | — | 2 | 52 | — | — | — | 4 | — | — | — | |||||||||||||||||||||||||||||||||||||||||||||||||||
Of which retail underlying | 264 | — | — | 3 | 2 | 267 | — | — | 2 | 52 | — | — | — | 4 | — | — | — | |||||||||||||||||||||||||||||||||||||||||||||||||||
Of which STS | 264 | — | — | 3 | 2 | 267 | — | — | 2 | 52 | — | — | — | 4 | — | — | — | |||||||||||||||||||||||||||||||||||||||||||||||||||
Of which wholesale | — | — | — | — | — | — | — | — | — | — | — | — | — | — | — | — | — | |||||||||||||||||||||||||||||||||||||||||||||||||||
Of which STS | — | — | — | — | — | — | — | — | — | — | — | — | — | — | — | — | — | |||||||||||||||||||||||||||||||||||||||||||||||||||
Of which re-Securitisation | — | — | — | — | — | — | — | — | — | — | — | — | — | — | — | — | — | |||||||||||||||||||||||||||||||||||||||||||||||||||
Of which senior | — | — | — | — | — | — | — | — | — | — | — | — | — | — | — | — | — | |||||||||||||||||||||||||||||||||||||||||||||||||||
Of which non-senior | — | — | — | — | — | — | — | — | — | — | — | — | — | — | — | — | — | |||||||||||||||||||||||||||||||||||||||||||||||||||
Synthetic Securitisation | 911 | — | — | — | 21 | 911 | — | — | 21 | 91 | — | — | — | 7 | — | — | — | |||||||||||||||||||||||||||||||||||||||||||||||||||
|
|
|
|
|
|
|
|
|
|
|
|
|
|
|
|
|
|
|
|
|
|
|
|
|
|
|
|
|
|
|
|
|
| |||||||||||||||||||||||||||||||||||
Of which Securitisation | 911 | — | — | — | 21 | 911 | — | — | 21 | 91 | — | — | — | 7 | — | — | — | |||||||||||||||||||||||||||||||||||||||||||||||||||
Of which retail underlying | 911 | — | — | — | 21 | 911 | — | — | 21 | 91 | — | — | — | 7 | — | — | — | |||||||||||||||||||||||||||||||||||||||||||||||||||
Of which wholesale | — | — | — | — | — | — | — | — | — | — | — | — | — | — | — | — | — | |||||||||||||||||||||||||||||||||||||||||||||||||||
Of which re-Securitisation | — | — | — | — | — | — | — | — | — | — | — | — | — | — | — | — | — | |||||||||||||||||||||||||||||||||||||||||||||||||||
Of which senior | — | — | — | — | — | — | — | — | — | — | — | — | — | — | — | — | — | |||||||||||||||||||||||||||||||||||||||||||||||||||
Of which non-senior | — | — | — | — | — | — | — | — | — | — | — | — | — | — | — | — | — | |||||||||||||||||||||||||||||||||||||||||||||||||||
| (*) | Securitisations with a risk weighting of 1250% are deducted from own funds, as explained in section m) of chapter 2.1 of this report. |
SEC3—Securitisation exposures in the banking book and associated regulatory capital requirements – bank acting as originator or as sponsor (Million Euros. 12-31-2019)
| Exposure values (by RW bands) | Exposure values (by regulatory approach) | RWA (by regulatory approach) | Capital requirement after cap | |||||||||||||||||||||||||||||||||||||||||||||||||||||||||||||||||
| £20% RW | >20% to 50% RW | >50% to 100% RW | >100% to <1250% RW | 1250% RW | SEC-IRBA | SEC-ERBA & SEC-IAA | SEC-SA | 1250% | SEC-IRBA | SEC-ERBA & SEC-IAA | SEC-SA | 1250% | SEC-IRBA | SEC-ERBA & SEC-IAA | SEC-SA | 1250% | ||||||||||||||||||||||||||||||||||||||||||||||||||||
Total Exposures | 2,150 | 33 | — | 1 | 116 | 785 | 1,398 | — | 116 | 86 | 98 | — | 634 | 7 | — | — | 51 | |||||||||||||||||||||||||||||||||||||||||||||||||||
|
|
|
|
|
|
|
|
|
|
|
|
|
|
|
|
|
|
|
|
|
|
|
|
|
|
|
|
|
|
|
|
|
| |||||||||||||||||||||||||||||||||||
Traditional Securitisation | 752 | 33 | — | 1 | 67 | 785 | — | — | 67 | 86 | — | — | 24 | 7 | — | — | 2 | |||||||||||||||||||||||||||||||||||||||||||||||||||
|
|
|
|
|
|
|
|
|
|
|
|
|
|
|
|
|
|
|
|
|
|
|
|
|
|
|
|
|
|
|
|
|
| |||||||||||||||||||||||||||||||||||
Of which Securitisation | 752 | 33 | — | 1 | 67 | 785 | — | — | 67 | 86 | — | — | 24 | 7 | — | — | 2 | |||||||||||||||||||||||||||||||||||||||||||||||||||
Of which retail underlying | 752 | 33 | — | 1 | 3 | 785 | — | — | 3 | 86 | — | — | — | 7 | — | — | — | |||||||||||||||||||||||||||||||||||||||||||||||||||
Of which wholesale | — | — | — | — | 65 | — | — | — | 65 | — | — | — | 24 | — | — | — | 2 | |||||||||||||||||||||||||||||||||||||||||||||||||||
Of which re-Securitisation | — | — | — | — | — | — | — | — | — | — | — | — | — | — | — | — | — | |||||||||||||||||||||||||||||||||||||||||||||||||||
Of which senior | — | — | — | — | — | — | — | — | — | — | — | — | — | — | — | — | — | |||||||||||||||||||||||||||||||||||||||||||||||||||
Of which non-senior | — | — | — | — | — | — | — | — | — | — | — | — | — | — | — | — | — | |||||||||||||||||||||||||||||||||||||||||||||||||||
Synthetic Securitisation | 1,398 | — | — | — | 49 | — | 1,398 | — | 49 | — | 98 | — | 610 | — | — | — | ||||||||||||||||||||||||||||||||||||||||||||||||||||
|
|
|
|
|
|
|
|
|
|
|
|
|
|
|
|
|
|
|
|
|
|
|
|
|
|
|
|
|
|
|
|
|
| |||||||||||||||||||||||||||||||||||
Of which Securitisation | 1,398 | — | — | — | 49 | — | 1,398 | — | 49 | — | — | — | 610 | — | — | — | 49 | |||||||||||||||||||||||||||||||||||||||||||||||||||
Of which retail underlying | — | — | — | — | — | — | — | — | — | — | — | — | — | — | — | — | — | |||||||||||||||||||||||||||||||||||||||||||||||||||
Of which wholesale | 1,398 | — | — | — | 49 | — | 1,398 | — | 49 | — | 98 | — | 610 | — | — | — | 49 | |||||||||||||||||||||||||||||||||||||||||||||||||||
Of which re-Securitisation | — | — | — | — | — | — | — | — | — | — | — | — | — | — | — | — | — | |||||||||||||||||||||||||||||||||||||||||||||||||||
Of which senior | — | — | — | — | — | — | — | — | — | — | — | — | — | — | — | — | — | |||||||||||||||||||||||||||||||||||||||||||||||||||
Of which non-senior | — | — | — | — | — | — | — | — | — | — | — | — | — | — | — | — | — | |||||||||||||||||||||||||||||||||||||||||||||||||||
| (*) | Securitisations with a risk weighting of 1250% are deducted from own funds, as explained in section m) of chapter 2.1 of this report. |
| BBVA. PILLAR III 2020 | 3. RISK | P. 99 |
3.2.7.4.3. Breakdown of securitised positions by type of asset
The table below shows the outstanding amount, non-performing exposures and impairment losses recognised in the period by underlying assets of originated securitisation operations which meet the risk transfer criteria, broken down by asset type as of December 31, 2020 and December 31, 2019.
Table 53. Breakdown of securitised balances by type of asset (Million Euros. 12-31-2020)
Type of asset | Outstanding amount | Of which: Non- performing Exposures | Total impairment losses for the period | |||||||||
Commercial and residential mortgages | — | — | — | |||||||||
Credit cards | — | — | — | |||||||||
Financial leasing | — | — | — | |||||||||
Lending to corporates and SMEs | 1,001 | — | (13 | ) | ||||||||
Consumer finance | 557 | 0 | (20 | ) | ||||||||
Receivables | — | — | — | |||||||||
Securitisation balances | — | — | — | |||||||||
Others | — | — | — | |||||||||
|
|
|
|
|
| |||||||
Total | 1,558 | 0 | (33 | ) | ||||||||
|
|
|
|
|
| |||||||
Breakdown of securitised balances by type of asset (Million Euros. 12-31-2019)
Type of asset | Outstanding amount | Of which: Non- performing Exposures | Total impairment losses for the period | |||||||||
Commercial and residential mortgages | — | — | — | |||||||||
Credit cards | — | — | — | |||||||||
Financial leasing | 25 | 2 | (2 | ) | ||||||||
Lending to corporates and SMEs | 1,350 | 13 | (0 | ) | ||||||||
Consumer finance | 736 | 12 | (12 | ) | ||||||||
Receivables | — | — | — | |||||||||
Securitisation balances | — | — | — | |||||||||
Others | — | — | — | |||||||||
|
|
|
|
|
| |||||||
Total | 2,110 | 27 | (14 | ) | ||||||||
|
|
|
|
|
| |||||||
The table below shows the outstanding balance corresponding to the underlying assets of securitisation originated by the Group, which do not meet the risk transfer criteria, and which, therefore, are not included in the securitisation framework, but rather for which the capital calculation of the exposure is carried out as if it had not been securitised:
Table 54. Outstanding balance corresponding to the underlying assets of the Group’s originated securitisations, in which risk transfer criteria are not fulfilled (Million Euros)
| Outstanding amount | ||||||||
Type of asset | 12-31-2020 | 12-31-2019 | ||||||
Commercial and residential mortgages | 23,988 | 26,058 | ||||||
Credit cards | — | — | ||||||
Financial leasing | 1,955 | — | ||||||
Lending to corporates and SMEs | 20 | 25 | ||||||
Consumer finance | 2,749 | 3,483 | ||||||
Receivables | — | — | ||||||
Securitisation balances | — | — | ||||||
Mortgage-covered bonds | — | — | ||||||
Others | — | — | ||||||
|
|
|
| |||||
Total | 28,711 | 29,567 | ||||||
|
|
|
| |||||
3.2.8. Hedging and risk reduction policies. Supervision strategies and processes
Maximum exposure to credit risk may be reduced by the existence of real guarantees, credit improvements and other actions that mitigate the Group’s exposure. The Group applies a credit risk hedging and mitigation policy derived from its understanfing of the banking business focused on relationship banking.
The existence of guarantees could be a necessary but not sufficient instrument for accepting risk, as the assumption of risk by the Group requires the verification of the debtor’s capacity for repayment, or that the debtor can generate sufficient resources to reduce the risk incurred under the agreed terms.
For further details on the hedging in the Group’s credit risk policy and its typology, see Note 7.2.3 of the Consolidated Financial Statements of BBVA Group.
3.2.9. Information on credit risk mitigation techniques
3.2.9.1. Hedging based on on-balance sheet and off-balance sheet netting
Within the limits established by the netting rules in each operating country, the Group negotiates with its customers the assignment of the derivatives business to master agreements (e.g., ISDA or CMOF) by including the netting of off-balance sheet transactions.
The specific clauses of each agreement determine the transactions subject to netting.
The mitigation of counterparty risk exposure stemming from the use of mitigation techniques (netting plus the use of collateral agreements) leads to a reduction in overall exposure (mark to market plus add-on).
As pointed out above, financial assets and liabilities may be netted in certain cases. In particular, they are presented for a net amount on the consolidated balance sheet only when the Group’s entities satisfy the provisions of IAS 32-Paragraph 42, so they have both the legal right to net recognised amounts, and the intention of settling the net amount or of realizing the asset and simultaneously paying the liability.
3.2.9.2. Hedging based on collateral
3.2.9.2.1. Management and valuation policies and procedures
The procedures for management and valuation of collateral are included in the Specific Collateral Rules, or in the Policies and Procedures for Retail and Wholesale Credit Risk.
| BBVA. PILLAR III 2020 | 3. RISK | P. 100 |
These Policies and Procedures lay down the basic principles of credit risk management, which includes the management of the collateral assigned in transactions with customers.
Accordingly, the risk management model jointly values the existence of a suitable cash flow generation by the debtor that enables them to service the debt, together with the existence of suitable and sufficient guarantees that ensure the recovery of the credit when the debtor’s circumstances render them unable to meet their obligations.
The valuation of collaterals is carried out in a rigorous and prudent manner, with the necessary information to determine it and with extreme caution in the use of appraisal values and any other type of valuation by independent experts. At the time of granting credit, unless local regulations provide for a shorter term, individual appraisals / independent expert appraisals must be available for a maximum age of one year in new origination proposals or that imply an increase in the amount over the existing risk; and three years in proposals on existing risk such as subrogations, forbearance, financing of assets on the group’s balance sheet, etc.
The milestones under which the valuations of the collaterals must be updated in accordance with local regulation are established under these prudential principles.
Random or rotating case assignment processes must be established to ensure the independence in the activity of the professionals or companies in charge of the appraisal with respect to the credit originating units. The valuation of non-real estate guarantees will also be carried out considering the general principles of prudence and rigor. Similarly, the independence and objectivity of the valuations is a critical factor that must be guaranteed through the use of external sources or the value contrast with them. Given the heterogeneity of this type of guarantees, in general the validity of the valuations must be ensured through documentation (for example, pro-forma invoices for movable property, certificates of deposits) or through consultation processes of market values (eg in securities accounts, investment funds).
With respect to the entities that carry out the valuation of the collateral, principles are in place in accordance with local regulations that govern the level of customer loyalty and dependence on the Group, along with related processes. These valuations will be updated by statistical methods, indices or appraisals of goods, consultation of internal and external sources, etc. which shall be carried out under the generally accepted standards in each market and in accordance with local regulations.
For the validation of the collaterals, the Legal Services, support in the formalisation process ensuring that the requirements are met so that the guarantees are duly established in the corresponding jurisdiction. The guarantees are required to be included in the corresponding policies, duly guarded and registered in the official formats and bodies established, in order to fully preserve their recovery effectiveness. In general, these policies must include the
general circumstances of the guarantees, the description of the assets that act as collateral, the obligations and rights of the parties involved and the related insurance. In the wholesale sphere, the possibility of carrying out a due diligence will be considered when the risk or complexity of the operation so requires.
3.2.9.2.2. Types of collateral
As collateral for the purpose of calculating bank capital, the Group uses the hedging established in the solvency regulations. The following are the main types of collateral available in the Group:
| • | Mortgage Guarantees: The collateral is the property upon which the loan is arranged. |
| • | Financial guarantees: Their object is any one of the following financial assets, as per articles 197 and 198 of the solvency regulation. |
| • | Cash deposits, deposit certificates or similar instruments. |
| • | Debt securities issued for the different categories. |
| • | Shares or convertible bonds. |
| • | Other goods and rights used as a real collateral: The following property and rights are considered acceptable as collateral as per Article 200 of the solvency regulation. |
| • | Cash deposits, deposit certificates or similar instruments held in third-party institutions other than the lending credit institution, when these are pledged in favor of the latter. |
| • | Life insurance policies pledged in favor of the lending credit institution. |
| • | Debt securities issued by other institutions, provided that these securities are to be repurchased at a pre-set price by the issuing institutions at the request of the holder of the securities. |
3.2.9.3. Hedging based on personal guarantees
According to the solvency regulations, unfunded credit protection consists of personal guarantees, including those arising from credit insurance, that have been granted by the providers of protection defined in Articles 201 and 202 of the solvency regulation.
In the category of Retail exposure under the advanced measurement approach, unfunded credit protection impacts the PD and does not reduce the amount of the credit risk in EAD.
In line with the EBA standards published in June 2020 (EBA/ ITS/2020/04), the following table shows the book value of secured and unsecured exposures, including all guarantees recognised for accounting purposes, regardless of their use for capital purposes. The data for December 2019 is also shown for comparative purposes:
| BBVA. PILLAR III 2020 | 3. RISK | P. 101 |
Table 55. EU CR3—CRM techniques – overview (Million Euros. 12-31-2020)
| Exposures | Exposures | |||||||||||||||||||
| Exposures | Exposures | Exposures | secured by | secured | ||||||||||||||||
| unsecured - | secured - | secured by | financial | by credit | ||||||||||||||||
| carrying amount | Carrying amount | collateral | guarantees(1) | derivatives | ||||||||||||||||
Total Loans | 239,644 | 163,879 | 116,867 | 47,012 | — | |||||||||||||||
Total debt securities | 84,786 | — | — | — | — | |||||||||||||||
|
|
|
|
|
|
|
|
|
| |||||||||||
Total exposures | 324,430 | 163,879 | 116,867 | 47,012 | — | |||||||||||||||
|
|
|
|
|
|
|
|
|
| |||||||||||
Of which: defaulted | 10,552 | 4,152 | 3,577 | 575 | — | |||||||||||||||
| (1) | Excluding personal guarantees (unfunded credit protection which impacts on the PD but not in EAD. |
EU CR3—CRM techniques – overview (Million Euros. 12-31-2019)
| Exposures | Exposures | Exposures | ||||||||||||||||||
| Exposures | secured - | Exposures | secured by | secured | ||||||||||||||||
| unsecured - | Carrying | secured by | financial | by credit | ||||||||||||||||
| carrying amount | amount | collateral | guarantees(1) | derivatives | ||||||||||||||||
Total Loans | 238,603 | 211,736 | 152,341 | 59,395 | — | |||||||||||||||
Total debt securities | 77,568 | — | — | — | — | |||||||||||||||
|
|
|
|
|
|
|
|
|
| |||||||||||
Total exposures | 316,171 | 211,736 | 152,341 | 59,395 | — | |||||||||||||||
|
|
|
|
|
|
|
|
|
| |||||||||||
Of which: defaulted | 10,858 | 5,132 | 4,590 | 542 | — | |||||||||||||||
| (1) | Excluding personal guarantees (unfunded credit protection which impacts on the PD but not in EAD. |
3.2.9.4. Risk concentration
BBVA has established the measurement, monitoring and reporting criteria for the analysis of large credit exposures that could represent a concentration risk, with the aim of ensuring their alignment with the risk appetite framework defined in the Group.
In particular, measurement and monitoring criteria are established for large exposures at the level of individual concentrations, concentrations of retail portfolios, wholesale sectors and geographies.
A quarterly measurement and monitoring process has been established for reviewing concentration risk.
The main measures to prevent risk concentration in BBVA are:
| • | At both the Group level and the subsidiaries belonging to the banking group, the information of customers (groups) that hold the largest exposures (greater than 10% of fully loaded CET1; in the subsidiaries their level of own funds are used) is available. If a customer presents a concentration that exceeds the thresholds, the reasonableness of maintaining this exposure must be justified, or the measures to reduce the exposure be explained (for example, cancellation of risk) in writing every year. |
| • | As an additional support to management, the portfolio concentration is calculated using the Herfindahl index. To date, the concentration at Group level is “very low”. |
| • | The credit risk mitigation does not have a significant impact on the Group’s large exposures, being used solely as a mechanism for mitigating intra-group risk (“standby letters of credit” issued by BBVA in favor of the banking Group’s subsidiaries). |
| • | The concentration to different industries is calculated based on the risk aggregation by economic activity. BBVA uses a classification that groups activities into 15 sectors. All of them are under the acceptable thresholds at the Group level. |
| • | In retail portfolios, the analysis is carried out at subportfolio level (mortgages and non-mortgage retail). Both are below the acceptable thresholds at the Group level. |
3.2.10. RWA density by geographic areas
A summary of the average weights by exposure category in the main geographic areas where the Group operates is shown below for credit risk and counterparty credit risk. The purpose is getting an overview of the entity’s risk profile in terms of RWAs.
| BBVA. PILLAR III 2020 | 3. RISK | P. 102 |
Table 56. Breakdown of RWA density by geographical area and approach (12-31-2020)
| RWA density(1)(2) | ||||||||||||||||||||||||||||
Category of exposure | Total | Spain(3) | Turkey | Mexico | USA | South America | Other areas(4) | |||||||||||||||||||||
Central governments or central banks | 14 | % | 12 | % | 58 | % | 11 | % | 1 | % | 39 | % | 1 | % | ||||||||||||||
Regional governments or local authorities | 32 | % | 16 | % | 100 | % | 63 | % | 20 | % | 83 | % | 20 | % | ||||||||||||||
Public sector entities | 42 | % | — | 98 | % | 52 | % | 20 | % | 63 | % | 19 | % | |||||||||||||||
Multilateral Development Banks | 2 | % | — | — | — | — | 9 | % | — | |||||||||||||||||||
International organisations | — | — | — | — | — | — | — | |||||||||||||||||||||
Institutions | 46 | % | 23 | % | 70 | % | 81 | % | 22 | % | 56 | % | 31 | % | ||||||||||||||
Corporates | 97 | % | 94 | % | 95 | % | 99 | % | 99 | % | 98 | % | 95 | % | ||||||||||||||
Retail | 70 | % | 63 | % | 68 | % | 71 | % | 74 | % | 73 | % | 72 | % | ||||||||||||||
Secured by mortgages on immovable property | 37 | % | 33 | % | 35 | % | 37 | % | 36 | % | 40 | % | 37 | % | ||||||||||||||
Exposures in default | 113 | % | 111 | % | 112 | % | 101 | % | 126 | % | 109 | % | 108 | % | ||||||||||||||
Exposures associated with particularly high risk | 150 | % | 150 | % | 150 | % | 150 | % | 150 | % | 150 | % | 150 | % | ||||||||||||||
Covered bonds | — | — | — | — | — | — | — | |||||||||||||||||||||
Short-term claims on institutions and corporate | 87 | % | — | — | — | — | 87 | % | — | |||||||||||||||||||
Collective investments undertakings | 100 | % | 100 | % | 0 | % | 0 | % | 100 | % | — | 100 | % | |||||||||||||||
Other exposures | 59 | % | 80 | % | 46 | % | 50 | % | 75 | % | 34 | % | 18 | % | ||||||||||||||
|
|
|
|
|
|
|
|
|
|
|
|
|
| |||||||||||||||
Total credit risk by standardised approach | 44 | % | 23 | % | 77 | % | 38 | % | 50 | % | 65 | % | 37 | % | ||||||||||||||
|
|
|
|
|
|
|
|
|
|
|
|
|
| |||||||||||||||
Central governments or central banks | 6 | % | 71 | % | 96 | % | 49 | % | 1 | % | 18 | % | 9 | % | ||||||||||||||
Institutions | 8 | % | 13 | % | 132 | % | 59 | % | 14 | % | 15 | % | 6 | % | ||||||||||||||
Corporates | 52 | % | 56 | % | 90 | % | 72 | % | 37 | % | 53 | % | 42 | % | ||||||||||||||
Retail | 19 | % | 14 | % | 6 | % | 92 | % | 16 | % | 21 | % | 22 | % | ||||||||||||||
|
|
|
|
|
|
|
|
|
|
|
|
|
| |||||||||||||||
Total credit risk by IRB approach | 27 | % | 27 | % | 92 | % | 77 | % | 22 | % | 35 | % | 16 | % | ||||||||||||||
|
|
|
|
|
|
|
|
|
|
|
|
|
| |||||||||||||||
Securitisation exposures | 21 | % | 19 | % | 0 | % | 0 | % | 74 | % | 0 | % | 0 | % | ||||||||||||||
|
|
|
|
|
|
|
|
|
|
|
|
|
| |||||||||||||||
Total credit risk dilution and delivery | 37 | % | 25 | % | 77 | % | 49 | % | 45 | % | 63 | % | 20 | % | ||||||||||||||
|
|
|
|
|
|
|
|
|
|
|
|
|
| |||||||||||||||
| (1) | Does not include equity exposures. |
| (2) | Calculated as RWAs/EAD. |
| (3) | In Spain, the category of Central Governments or Central Banks includes deferred tax assets net of deferred tax liabilities. |
| (4) | Includes all other countries not included on the previous columns. The countries with the greatest exposure in this area are: United Kingdom, France, Italy, Germany and Portugal. |
Breakdown of RWA density by geographical area and approach (12-31-2019)
| RWA density(1)(2) | ||||||||||||||||||||||||||||
Category of exposure | Total | Spain(3) | Turkey | Mexico | USA | South America | Other areas(4) | |||||||||||||||||||||
Central governments or central banks | 20 | % | 19 | % | 48 | % | 11 | % | 2 | % | 53 | % | 4 | % | ||||||||||||||
Regional governments or local authorities | 23 | % | 20 | % | 100 | % | 50 | % | 20 | % | 73 | % | 20 | % | ||||||||||||||
Public sector entities | 44 | % | — | 79 | % | 64 | % | 20 | % | 61 | % | — | ||||||||||||||||
Multilateral Development Banks | 5 | % | — | — | — | — | 10 | % | — | |||||||||||||||||||
International organisations | — | — | — | — | — | — | — | |||||||||||||||||||||
Institutions | 40 | % | 39 | % | 69 | % | 52 | % | 21 | % | 75 | % | 29 | % | ||||||||||||||
Corporates | 97 | % | 78 | % | 98 | % | 91 | % | 100 | % | 100 | % | 97 | % | ||||||||||||||
Retail | 70 | % | 62 | % | 68 | % | 72 | % | 74 | % | 73 | % | 71 | % | ||||||||||||||
Secured by mortgages on immovable property | 38 | % | 32 | % | 43 | % | 36 | % | 36 | % | 42 | % | 36 | % | ||||||||||||||
Exposures in default | 111 | % | 118 | % | 112 | % | 100 | % | 121 | % | 103 | % | 117 | % | ||||||||||||||
Exposures associated with particularly high risk | 150 | % | 150 | % | 150 | % | 150 | % | 150 | % | 150 | % | 150 | % | ||||||||||||||
Covered bonds | — | — | — | — | — | — | — | |||||||||||||||||||||
Short-term claims on institutions and corporate | 96 | % | — | — | — | — | 96 | % | — | |||||||||||||||||||
Collective investments undertakings | 100 | % | 100 | % | 0 | % | 100 | % | 100 | % | — | 100 | % | |||||||||||||||
Other exposures | 49 | % | 79 | % | 45 | % | 52 | % | 71 | % | 33 | % | 2 | % | ||||||||||||||
Securitisation exposures | 45 | % | — | — | 50 | % | 44 | % | — | — | ||||||||||||||||||
|
|
|
|
|
|
|
|
|
|
|
|
|
| |||||||||||||||
Total credit risk by standardised approach | 52 | % | 31 | % | 74 | % | 38 | % | 62 | % | 71 | % | 36 | % | ||||||||||||||
|
|
|
|
|
|
|
|
|
|
|
|
|
| |||||||||||||||
Central governments or central banks | 5 | % | 5 | % | 1 | % | 10 | % | 2 | % | 9 | % | 7 | % | ||||||||||||||
Institutions | 7 | % | 10 | % | 115 | % | 27 | % | 11 | % | 30 | % | 5 | % | ||||||||||||||
Corporates | 50 | % | 52 | % | 77 | % | 66 | % | 33 | % | 61 | % | 41 | % | ||||||||||||||
Retail | 22 | % | 16 | % | 11 | % | 95 | % | 18 | % | 25 | % | 25 | % | ||||||||||||||
Securitisation exposures | 27 | % | 27 | % | — | — | — | — | — | |||||||||||||||||||
|
|
|
|
|
|
|
|
|
|
|
|
|
| |||||||||||||||
Total credit risk by IRB approach | 27 | % | 27 | % | 60 | % | 72 | % | 22 | % | 38 | % | 16 | % | ||||||||||||||
|
|
|
|
|
|
|
|
|
|
|
|
|
| |||||||||||||||
Total credit risk dilution and delivery | 40 | % | 28 | % | 74 | % | 48 | % | 54 | % | 69 | % | 20 | % | ||||||||||||||
|
|
|
|
|
|
|
|
|
|
|
|
|
| |||||||||||||||
| (1) | Does not include equity exposures. |
| (2) | Calculated as RWAs/EAD. |
| (3) | In Spain, the category of Central Governments or Central Banks includes deferred tax assets net of deferred tax liabilities. |
| (4) | Includes all other countries not included on the previous columns. The countries with the greatest exposure in this area are: United Kingdom, France, Italy, Germany and Portugal. |
| BBVA. PILLAR III 2020 | 3. RISK | P. 103 |
3.3.1. Scope and nature of the market risk measurement and reporting systems
Market risk is the possibility that there may be losses in the value of positions held due to movements in the market variables that affect the valuation of financial products and assets in trading activity.
The main market risks can be classified into the following groups: interest rate risk, equity risk, exchange rate risk, credit spread risk, and volatility risk.
The metrics developed to control and monitor market risk in the Group are aligned with best practices in the market and are implemented consistently across all the local market risk units.
Measurement procedures are established in terms of the possible impact of negative market conditions on the trading book of the Group’s Global Markets units, both under ordinary circumstances and in stress situations.
For more information on market risk governance, see Note 7.3.1 of the Consolidated Financial Statements of BBVA Group.
In addition, in Chapter 3.3.4 more information about the risk measurement models used in the Group, focused on internal models approved by the supervisor for BBVA S.A. and BBVA Mexico to calculate regulatory capital requirements on trading portfolios is detailed. For the other geographic areas (South America, BBVA Garanti and BBVA USA), the calculation of own funds requirements for trading portfolios is carried out using the standardised approach.
Analysis of the Group’s RWA structure showns that 4% corresponds to Market Risk (including structural exchange risk).
3.3.2. Differences in the trading book under accounting and prudential regulation
According to the solvency regulations, trading book shall be made up of all the positions on financial instruments and commodities that the credit institution holds for the purpose of trading or that act as hedging for other elements in this portfolio.
With respect to this portfolio, the rule also refers to the need to establish clearly defined policies and procedures.
For this purpose, regulatory trading book defined by the Group includes the positions managed by the Group’s Trading units, for which market risk limits are set and then monitored daily. Moreover, they comply with the other requirements defined in the solvency regulations.
The definition of the financial assets held for trading is included in Note 2.2.1. of the Consolidated Financial Statements of BBVA Group.
Market risk-weighted assets under the standardised approach (excluding structural exchange rate risk) account for 21% of total market risk-weighted assets.
The amounts in terms of RWAs and market risk capital requirements calculated by standardised approach as of December 31, 2020 and December 31, 2019 are below.
Table 57. EU MR1—Market risk under the standardised approach
(Million Euros. 12-31-2020)
| Capital | ||||||||
| RWAs | Requirements | |||||||
Outright Products | 5,183 | 415 | ||||||
Interest Rate Risk | 1,943 | 155 | ||||||
Equity Risk | 264 | 21 | ||||||
Foreign Exchange Risk | 2,966 | 237 | ||||||
Commodity Risk | 10 | 1 | ||||||
Options | — | — | ||||||
Simplified approach | — | — | ||||||
Delta-plus method | — | — | ||||||
Scenario approach | — | — | ||||||
Securitisation | 4 | 0 | ||||||
|
|
|
| |||||
Correlation trading portfolio | 1,210 | 97 | ||||||
|
|
|
| |||||
Total | 6,397 | 512 | ||||||
|
|
|
| |||||
EU MR1—Market risk under the standardised approach
(Million Euros. 12-31-2019)
| Requerimientos | ||||||||
| APR | de Capital | |||||||
Outright Products | 6.329 | 506 | ||||||
Interest Rate Risk | 2.461 | 197 | ||||||
Equity Risk | 248 | 20 | ||||||
Foreign Exchange Risk | 3.596 | 288 | ||||||
Commodity Risk | 24 | 2 | ||||||
Options | — | — | ||||||
Simplified approach | — | — | ||||||
Delta-plus method | — | — | ||||||
Scenario approach | — | — | ||||||
Securitisation | 21 | 2 | ||||||
|
|
|
| |||||
Correlation trading portfolio | 641 | 51 | ||||||
|
|
|
| |||||
Total | 6.991 | 559 | ||||||
|
|
|
| |||||
| BBVA. PILLAR III 2020 | 3. RISK | P. 104 |
Market risk RWAs under the standardised approach have been reduced over 600 million euros, of which 630 million related to the structural exchange rate risk. The latter is motivated, among others, mainly by the structural position in Turkish lira which has had a strong depreciation (26.7%).
3.3.4.1. Scope of application
For the purposes of calculating own funds requirements as approved by the supervisor, the scope of application of the internal market risk model extends to BBVA S.A. and BBVA Mexico trading activity.
As explained in Note 7.3.1 of the Consolidated Financial Statements of BBVA Group, most of the items on the Group’s consolidated balance sheet that are subject to market risk are positions whose principal metric used to measure their market risk is VaR.
3.3.4.2. Characteristics of the models used
Measurement procedures are established in terms of the possible impact of negative market conditions on the trading portfolio of the Group’s Global Markets units, both under ordinary circumstances and in situations of heightened risk factors.
The standard metric used to measure market risk is Value at Risk (“VaR”), which indicates the maximum loss that may occur in the portfolios at a given confidence level (99%) and time horizon (one day).
This statistic value is widely used in the market and has the advantage of summing up in a single metric the risks inherent to trading activity, taking into account how they are related and providing a prediction of the loss that the trading book could sustain as a result of fluctuations in equity prices, interest rates, foreign exchange rates and credit spreads. The market risk analysis considers various risks, such as credit spread risk, basis risk, as well as volatility and correlation risk.
With respect to the risk measurement models used in the Group, the supervisor has authorised the use of the internal model to determine the regulatory capital requirements deriving from risk positions on the BBVA, S.A. and BBVA Mexico trading book, which together, account for around 72% of the market risk of the Group’s trading book market risk.
BBVA uses a single model to calculate the regulatory requirements by risk, taking into account the correlation between the assets and thus recognizing the diversification effect of the portfolios. The model used estimates the VaR in accordance with the “historical simulation” methodology, which involves estimating the profit and loss that would have been incurred in the current portfolio if the changing market conditions that occurred over a given period of time were
repeated. Based on this information, it infers the maximum foreseeable loss in the current portfolio with a given level of confidence.
Absolute and relative returns are used in simulating the potential variation of the risk factors, depending on the type of risk factor. Relative returns are used in the case of equity and foreign currency; while absolute returns are used in the case of spreads and interest rates.
The decision on the type of return to apply is made according to the risk factor metric subject to variation. The relative return is used in the case of price risk factors, while for interest-rate risk factors it is absolute returns.
The model has the advantage of accurately reflecting the historical distribution of the market variables and of not requiring any specific distribution assumption. The historical period used in this model is two years.
VaR figures are estimated following two methodologies:
| • | VaR without smoothing, which awards equal weight to the daily information for the previous two years. This is currently the official methodology for measuring market risk for the purpose of monitoring compliance with risk limits. |
| • | VaR with smoothing, which weighs more recent market information more heavily. This model adjusts the historical information of each market variable to reflect the differences between historical volatility and current volatility. This metric is complementary to the one above. |
VaR with smoothing adapts more swiftly to the changes in financial market conditions, whereas VaR without smoothing is, in general, a more stable metric that will tend to exceed VaR with smoothing when the markets show less volatile trends, but be lower when they present upturns in uncertainty.
Furthermore, and following the guidelines established by Spanish and European regulators, BBVA incorporates additional VaR metrics to fulfill the regulatory requirements issued by the supervisor for the purpose of calculating bank capital for the trading book. Specifically, the new measures incorporated in the Group since December 2011 (which follow the guidelines set out by Basel 2.5) are as follows:
| • | VaR: In regulatory terms, the charge for VaR Stress is added to the charge for VaR and the sum of both (VaR and VaR Stress) is calculated. This quantifies the losses associated with movements in the risk factors inherent in market operations (interest rate, FX, RV, credit, etc.). |
Both VaR and VaR Stress are rescaled by a regulatory multiplier set at three and by the square root of ten to calculate the capital charge. |
| • | Specific Risk: Incremental Risk Capital (IRC). Quantification of the risk of default and the risk of a downgrade in the credit rating of the positions on bonds and credit derivatives held in the portfolio. The specific risk capital for IRC is a charge exclusively for those geographical areas with an approved internal model (BBVA S.A. and BBVA Mexico). |
| BBVA. PILLAR III 2020 | 3. RISK | P. 105 |
The capital charge is determined based on the associated losses (at 99.9% over a time horizon of 1 year under the assumption of constant risk) resulting from the rating migration and/or default of the asset’s issuer. Also included is the price risk in sovereign positions for the indicated items.
The calculation methodology is based on the Monte Carlo simulation of the impact of defaults and rating transitions on the portfolio subject to incremental risk capital. The model defining the transition and default process of a counterparty is based on the changes in a counterparty’s credit quality. Under a one-factor Merton model, which underlies the Basel or Creditmetrics model, this credit quality will correspond to the value of the issuer’s assets, depending on a systemic factor that is common to all the issuers, and an idiosyncratic factor specific to each.
All that is needed to simulate the rating and default transition process for the issuers is to simulate the systemic factor and the idiosyncratic component. Once the underlying variable is available, the final rating can be obtained. The individual credit quality simulation of the issuers allows losses due to systemic risk and idiosyncratic risk to be obtained.
Transition matrices
The transition matrix used for calculation is estimated based on the external information about the rating transitions provided by the rating agencies. Specifically, the information provided by the Standard & Poors agency is used.
The appropriateness of using information on external transitions is justified by:
| • | The internal ratings for the Sovereign, Emerging Sovereign Country, Financial Institution and Corporate segments (which constitute the core positions subject to incremental risk capital) are aligned with the external ratings. By way of example, the internal rating system for financial institutions is based on an algorithm that uses external ratings. |
| • | The rating agencies provide sufficient historical information to cover a complete economic cycle (rating transition information is available dating back to the 1981 financial year) and obtain a long-term transition matrix in the same way that long-term probabilities of default are required for the calculation of the regulatory capital for credit risk in the banking book. |
This depth level of historical information is not available for the internal rating systems.
Although external data are used for determining the transitions between ratings, to establish the default, the
probabilities used are assigned by the BBVA master scale, which ensures consistency with the probabilities used for the calculations of capital in the Banking Book.
The transition matrix is recalibrated every year, based on information on transitions provided by Standard & Poor’s. A procedure has been defined to readjust the transitions in accordance with the probability of default assigned by the master scale.
Liquidity horizons
The calculation of incremental risk capital used by BBVA explicitly includes the use of positions with a hypothesis of a constant level of risk and quarterly liquidity horizons of less than one year. The average liquidity horizon is in the range of 3-6 months.
The establishment of liquidity horizons follows the guidelines/ criteria established by Basel in its guidelines for computing capital for incremental risk.
First, a criterion has been used of capacity for managing positions through liquid instruments that allow their inherent risk to be hedged. The main instrument for hedging the price risk for rating transitions and defaults is the Credit Default Swap (CDS). The existence of this hedging instrument serves as a justification for considering a short term liquidity horizon.
However, in addition to considering the existence of a liquid CDS, a distinction has to be made according to the issuer’s rating (this factor is also mentioned in the aforementioned guidelines). Specifically, between investment grade issuers or those with a rating of BBB- or above, and issuers below this limit.
According to these criteria, the issuers are mapped to standard liquidity horizons of 3, 6 or 12 months.
Correlation
The calculation methodology is based on a single-factor model, in which there is one factor common to all the counterparties. The coefficient of the model is determined by the correlation curves established by Basel for corporates, financial institutions and sovereigns based on the probability of default.
The use of the Basel correlation curve ensures consistency with the calculation of regulatory capital under the IRB approach for the positions on the banking book.
| • | Specific Risk: securitisation and correlation portfolios. Capital charge for securitisation and for the correlation portfolio for potential losses associated with the rating level of a given credit structure (rating). Both are calculated using the standardised approach. The perimeter of the correlation portfolios is referred to First-to-default (FTD) type market operations and/or market CDO tranches, and only for positions with an active market and hedging capacity. |
| BBVA. PILLAR III 2020 | 3. RISK | P. 106 |
Validity tests are performed periodically on the risk measurement models used by the Group. They estimate the maximum loss that could have been incurred in the positions assessed with a given level of probability (backtesting), as well as measurements of the impact of extreme market events on the risk positions held (stress testing).
Backtesting is performed at the trading floor level as an additional control measure in order to carry out a more specific monitoring of the validity of the measurement models.
The current structure for market risk management includes monitoring market risk limits, which consists of a system of limits based on Value at Risk (VaR), economic capital (based on VaR measurements) and VaR sub-limits, as well as stop-loss limits for each of the Group’s business units. The global limits are approved by the Executive Committee on an annual basis, once they have been analysed by the Global Risk Management Committee (GRMC). This limits structure is developed by identifying specific risks by type, trading activity and trading floor. The market risk unit also maintains consistency between limits. The control structure in place is supplemented by limits on loss and a system of alert signals to anticipate the effects of adverse situations in terms of risk and/or result.
The review of the quality of the inputs used by the evaluation processes is based on checking the data against other sources of information accepted as standard. These checks detect errors in the historical series such as repetitions, data outside the range, missing data, etc. As well as these periodic checks of the historical data loaded, the daily data that feed these series are subject to a data quality process to guarantee their integrity.
The choice of proxies is based on the correlation detected
between the performance of the factor to be entered and the proxy factor. A Simple Linear Regression model is used, selecting the proxy that best represents the determination coefficient (R2) within the whole period for which the performance of both series is available. Next, the performance of the factor on the necessary dates is reconstructed, using the beta parameter estimated in the simple linear regression.
3.3.4.2.1. Valuation methodology and description of the independent price verification process
Fair value is the price that would be received for selling an asset or paid for transferring a liability in an orderly transaction between market participants. It is therefore a market-based measurement, and not specific to each entity.
The fair value is reached without making any deduction in transaction costs that might be incurred due to sale or disposal by other means.
At BBVA SA, BBVA Mexico, BBVA USA and Garanti BBVA, full revaluation is used for most financial products. For the other geographies, approximations are used through sensitivities to risk factors
For Further information about valuation methodology and fair value levels, see Note 8 of Consolidated Financial Statements.
In addition, the Group calculates Prudent Valuation Adjustments (PVA) for all instruments valued at fair value. PVA is an additional or conservative adjustment to the fair value that allows a more prudent assessment to be obtained by considering sources of risks that exist in the calculation of the fair value (uncertainty inputs, risk model, etc). A detailed breakdown of the method for calculating PVAs for the Group is below:
Table 58. EU PV1—Prudent Valuation Adjustments (Million Euros. 12-31-2020)
| Unearned | Investment | Of which: in | Of which: in | |||||||||||||||||||||||||||||||||||||
| Interest | credit | and funding | the trading | the banking | ||||||||||||||||||||||||||||||||||||
| Equity | Rates | FX | Credit | Commodities | spreads | costs | Total | book | book | |||||||||||||||||||||||||||||||
Close-out uncertainty, of which: | 73 | 366 | 28 | 12 | — | 5 | — | 205 | 101 | 104 | ||||||||||||||||||||||||||||||
Mid-market value | 28 | 183 | 11 | 2 | — | 1 | — | 77 | 39 | 37 | ||||||||||||||||||||||||||||||
Close-out cost | 30 | 136 | 17 | 10 | — | 4 | — | 67 | 47 | 20 | ||||||||||||||||||||||||||||||
Concentration | 15 | 46 | — | — | — | — | — | 62 | 15 | 47 | ||||||||||||||||||||||||||||||
Early termination | — | 1 | — | — | — | — | — | 1 | 1 | — | ||||||||||||||||||||||||||||||
Model risk | 16 | 3 | — | 3 | — | — | 2 | 8 | 3 | 5 | ||||||||||||||||||||||||||||||
Operational risk | 2 | 11 | 1 | 1 | — | — | — | 14 | 9 | 6 | ||||||||||||||||||||||||||||||
Future administrative costs | — | 4 | — | — | — | — | — | 4 | 4 | — | ||||||||||||||||||||||||||||||
|
|
|
|
|
|
|
|
|
|
|
|
|
|
|
|
|
|
|
| |||||||||||||||||||||
Total Adjustment | 91 | 384 | 29 | 16 | — | 5 | 2 | 233 | 118 | 115 | ||||||||||||||||||||||||||||||
|
|
|
|
|
|
|
|
|
|
|
|
|
|
|
|
|
|
|
| |||||||||||||||||||||
| BBVA. PILLAR III 2020 | 3. RISK | P. 107 |
EU PV1—Prudent Valuation Adjustments (Million Euros. 12-31-2019)
| Unearned | Investment | Of which: in | Of which: in | |||||||||||||||||||||||||||||||||||||
| Interest | credit | and funding | the trading | the banking | ||||||||||||||||||||||||||||||||||||
| Equity | Rates | FX | Credit | Commodities | spreads | costs | Total | book | book | |||||||||||||||||||||||||||||||
Close-out uncertainty, of which: | 106 | 301 | 30 | 12 | — | 18 | — | 274 | 121 | 153 | ||||||||||||||||||||||||||||||
Mid-market value | 27 | 146 | 9 | 7 | — | 7 | — | 98 | 50 | 48 | ||||||||||||||||||||||||||||||
Close-out cost | 37 | 115 | 21 | 5 | — | 10 | — | 94 | 63 | 32 | ||||||||||||||||||||||||||||||
Concentration | 42 | 39 | — | — | — | — | — | 82 | 8 | 73 | ||||||||||||||||||||||||||||||
Early termination | — | 1 | — | — | — | — | — | 1 | 1 | — | ||||||||||||||||||||||||||||||
Model risk | 15 | 4 | — | 1 | — | 11 | 4 | 17 | 10 | 8 | ||||||||||||||||||||||||||||||
Operational risk | — | 7 | — | — | — | — | — | 7 | 0 | 6 | ||||||||||||||||||||||||||||||
Future administrative costs | — | 3 | — | — | — | — | — | 3 | 3 | — | ||||||||||||||||||||||||||||||
|
|
|
|
|
|
|
|
|
|
|
|
|
|
|
|
|
|
|
| |||||||||||||||||||||
Total Adjustment | 121 | 315 | 30 | 13 | — | 28 | 4 | 302 | 135 | 136 | ||||||||||||||||||||||||||||||
|
|
|
|
|
|
|
|
|
|
|
|
|
|
|
|
|
|
|
| |||||||||||||||||||||
3.3.4.2.2. Market risk evolution in 2020
During 2020, the average VaR stood at 27 million euros, levels higher than in the 2019 financial year, with a maximum level in the year reached on May 14, when rose to 39 million euros.
VaR without smoothing by risk factor for the Group is below:
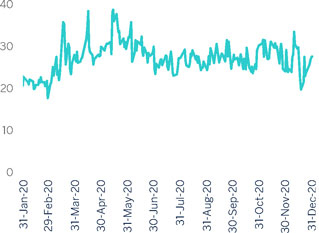
Table 59. Trading Book. VaR without smoothing by risk factors (Million Euros)
| Interest-rate | Exchange - | Vega / | Diversification | |||||||||||||||||||||
VaR by risk factors | and spread risk | rate risk | Equity risk | correlation risk | effect(1) | Total | ||||||||||||||||||
December 2020 | ||||||||||||||||||||||||
Average VaR for the period | 29 | 12 | 4 | 11 | (28 | ) | 27 | |||||||||||||||||
Maximum VaR for the period | 39 | 20 | 10 | 20 | (14 | ) | 39 | |||||||||||||||||
Minimum VaR for the period | 20 | 3 | 1 | 6 | (39 | ) | 18 | |||||||||||||||||
|
|
|
|
|
|
|
|
|
|
|
| |||||||||||||
VaR at the end of the period | 32 | 12 | 2 | 11 | (29 | ) | 28 | |||||||||||||||||
|
|
|
|
|
|
|
|
|
|
|
| |||||||||||||
December 2019 | ||||||||||||||||||||||||
Average VaR for the period | 21 | 6 | 4 | 9 | (20 | ) | 19 | |||||||||||||||||
Maximum VaR for the period | 28 | 6 | 3 | 9 | (21 | ) | 25 | |||||||||||||||||
Minimum VaR for the period | 13 | 5 | 5 | 9 | (18 | ) | 14 | |||||||||||||||||
|
|
|
|
|
|
|
|
|
|
|
| |||||||||||||
VaR at the end of the period | 24 | 5 | 5 | 8 | (22 | ) | 20 | |||||||||||||||||
|
|
|
|
|
|
|
|
|
|
|
| |||||||||||||
| (1) | The diversification effect is the difference between the sum of the average individual risk factors and the total VaR figure that includes the implied correlation between all the variables and scenarios used in the measurement. |
By type of market risk assumed by the Group’s trading portfolio, the main risk factor in the Group continues to be that linked to interest rates, with a weight of 56% of the total at the end of 2020 (this figure includes the spread risk), dropping the relative weight compared to 2019 end (58%). On the other hand, the foreign exchange risk represents 22%, slightly increasing the proportion with respect to 2019 (13%), while that of equity and that of volatility and correlation
decrease, presenting a weight of 22% at the end of 2020 (vs. 29% at year-end 2019).
In accordance with Article 455 d) and e) of the CRR, corresponding to the breakdown of information on internal market risk models, the elements comprising the own funds requirements referred to in Articles 364 and 365 of the CRR are presented below.
| BBVA. PILLAR III 2020 | 3. RISK | P. 108 |
Table 60. EU-MR3—IMA values for trading portfolios (Million Euros)
IMA values for trading portfolios (2020)(1)(2) | ||||||
VaR (10 day 99%) |
| |||||
1 | Maximum value | 91 | ||||
2 | Average value | 61 | ||||
3 | Minimum value | 35 | ||||
4 | Period value | 63 | ||||
SVaR (10 day 99%) |
| |||||
5 | Maximum value | 163 | ||||
6 | Average value | 109 | ||||
7 | Minimum value | 59 | ||||
8 | Period value | 127 | ||||
Incremental Risk Charge (99.9%) |
| |||||
9 | Maximum value | 165 | ||||
10 | Average value | 127 | ||||
11 | Minimum value | 84 | ||||
12 | Period value | 104 | ||||
IMA values for trading portfolios (2019)(1)(2) | ||||||
VaR (10 day 99%) |
| |||||
1 | Maximum value | 90 | ||||
2 | Average value | 53 | ||||
3 | Minimum value | 34 | ||||
4 | Period value | 52 | ||||
SVaR (10 day 99%) |
| |||||
5 | Maximum value | 203 | ||||
6 | Average value | 131 | ||||
7 | Minimum value | 82 | ||||
8 | Period value | 170 | ||||
Incremental Risk Charge (99.9%) |
| |||||
9 | Maximum value | 170 | ||||
10 | Average value | 143 | ||||
11 | Minimum value | 108 | ||||
12 | Period value | 115 | ||||
| (1) | Data related to the second half of 2020. |
| (2) | The amounts reported do not include additional capital charges especifically required by the supervisor, i.e. multiplier factor. |
| (1) | Data related to the second half of 2019. |
| (2) | The amounts reported do not include additional capital charges especifically required by the supervisor, i.e. multiplier factor. |
Table 61. EU MR2-A—Market risk under the IMA (Million Euros. 12-31-2020)
| RWAs | Capital Requirements | |||||||
VaR | 2,276 | 182 | ||||||
Previous day’s VaR | 793 | 63 | ||||||
Average of the daily VaR on each of the preceding sixty business days (VaRavg) x multiplication factor | 2,276 | 182 | ||||||
SVaR | 3,640 | 291 | ||||||
Latest SVaR | 1,587 | 127 | ||||||
Average of the SVaR during the preceding sixty business days (sVaRavg) x multiplication factor (mc) | 3,640 | 291 | ||||||
Incremental risk charge—IRC | 2,461 | 197 | ||||||
Most recent IRC value | 2,076 | 166 | ||||||
Average of the IRC number over the preceding 12 weeks | 2,461 | 197 | ||||||
Comprehensive Risk Measure- CRM | — | — | ||||||
Most recent risk number for the correlation trading portfolio over the preceding 12 weeks | — | — | ||||||
Average of the risk number for the correlation trading portfolio over the preceding 12 weeks | — | — | ||||||
8% of the own funds requirement in SA on most recent risk number for the correlation trading portfolio | — | — | ||||||
Others | — | — | ||||||
|
|
|
| |||||
Total | 8,376 | 670 | ||||||
|
|
|
| |||||
EU MR2-A—Market risk under the IMA (Million Euros. 12-31-2019)
| RWAs | Capital Requirements | |||||||
VaR | 2,095 | 168 | ||||||
Previous day’s VaR | 653 | 52 | ||||||
Average of the daily VaR on each of the preceding sixty business days (VaRavg) x multiplication factor | 2,095 | 168 | ||||||
SVaR | 4,680 | 374 | ||||||
Latest SVaR | 2,126 | 170 | ||||||
Average of the SVaR during the preceding sixty business days (sVaRavg) x multiplication factor (mc) | 4,680 | 374 | ||||||
Incremental risk charge—IRC | 2,301 | 184 | ||||||
Most recent IRC value | 2,301 | 184 | ||||||
Average of the IRC number over the preceding 13 weeks | 1,934 | 155 | ||||||
Comprehensive Risk Measure- CRM | — | — | ||||||
Most recent risk number for the correlation trading portfolio over the preceding 13 weeks | — | — | ||||||
Average of the risk number for the correlation trading portfolio over the preceding 13 weeks | — | — | ||||||
8% of the own funds requirement in SA on most recent risk number for the correlation trading portfolio | — | — | ||||||
Others | — | — | ||||||
|
|
|
| |||||
Total | 9,075 | 726 | ||||||
|
|
|
| |||||
| BBVA. PILLAR III 2020 | 3. RISK | P. 109 |
The main changes in the market RWAs, calculated using the
method based on internal models are below:
Table 62. EU MR2-B—RWA flow statements of market risk exposures under the IMA (Million Euros)
| VaR | SVaR | IRC | CRM | Other | Total RWAs | Total Capital Requirements | ||||||||||||||||||||||
RWAs September, 2020 | 2,355 | 4,386 | 3,404 | — | — | 10,145 | 812 | |||||||||||||||||||||
Regulatory adjustments | 1,617 | 3,132 | — | — | — | 4,749 | 380 | |||||||||||||||||||||
RWAs as of September 30, 2020 | 738 | 1,254 | 3,404 | — | — | 5,396 | 432 | |||||||||||||||||||||
Level risk variation | (130 | ) | (901 | ) | (1,066 | ) | — | — | (2,098 | ) | (168 | ) | ||||||||||||||||
Model updates | — | — | — | — | — | — | — | |||||||||||||||||||||
Methodology and policy | — | — | — | — | — | — | — | |||||||||||||||||||||
Acquisitions and disposals | — | — | — | — | — | — | — | |||||||||||||||||||||
Foreign Exchange movements | 51 | 155 | 123 | — | — | 329 | 26 | |||||||||||||||||||||
Other | — | — | — | — | — | — | — | |||||||||||||||||||||
RWAs as of December 31, 2020 | 793 | 1,587 | 2,076 | — | — | 4,456 | 356 | |||||||||||||||||||||
Regulatory adjustments | 1,483 | 2,052 | 385 | — | — | 3,920 | 314 | |||||||||||||||||||||
RWAs December, 2020 | 2,276 | 3,640 | 2,461 | — | — | 8,376 | 670 | |||||||||||||||||||||
During the last quarter of 2020, the own funds requirements for market risk under the internal model were affected mainly by the fall in capital requirements for incremental risk capital (IRC) at BBVA S.A. and BBVA Mexico as a result of the reduction in positions and the fall in capital requirements due to stressed VaR at BBVA Mexico.
| • | Capital requirements have fallen by 17% at BBVA S.A. compared to September 2020, down to 388 million. The capital charge for IRC has fallen by 41% compared to the previous quarter as a result of reduced positions. |
| • | Capital requirements have fallen by 24% at BBVA Mexico compared to September 2020, down to 282 million. The capital charge for SVaR has fallen by 30% compared to the previous quarter due to the exit of higher SVaR and the entry of lower SVaR. The fall in capital requirements for IRC—26% in comparison with the previous quarter—is a result of decreased exposure to sovereign positions in Mexico. |
Following the internal model review process in 2019, the IRC component remains subject to the additional surcharge of 1.60.
The full annual series of RWA flow of market risk under the IMA is available in the editable file “Pillar III 2020 – Tables &
Annexes”.
3.3.4.2.3. Stress testing
All the tasks associated with stress, methodologies, scenarios of market variables or reports are undertaken in coordination with the Group’s Risk Areas.
Several different stress-test exercises are performed on the Group’s trading portfolios. Both local and global historical scenarios are used, which replicate the behavior of a past extreme event, for example, the collapse of Lehman Brothers or the “Tequila crisis”. These stress exercises are supplemented with simulated scenarios which aim to
generate scenarios that have a significant impact on the different portfolios, but without being restricted to a specific historical scenario.
Lastly, for certain portfolios or positions, fixed stress test exercises are also prepared that have a significant impact on the market variables that affect those positions.
Historical scenarios
The baseline historical stress scenario in the Group is that of Lehman Brothers, whose sudden collapse in September 2008 had a significant impact on the behavior of financial markets at a global level. The following are the most relevant effects of this historical scenario:
| 1. | Credit shock: reflected mainly in the increase in credit spreads and downgrades of credit ratings. |
| 2. | Increased volatility in most financial markets. |
| 3. | Liquidity shock in the financial systems, reflected in major fluctuations in interbank curves, particularly in the shortest terms of the euro and dollar curves. |
Table 63. Trading Book. Impact on earnings in Lehman scenario (Million Euros)
Impact on earnings in Lehman scenario | ||||||||
| 12-31-2020 | 12-31-2019 | |||||||
GM Europe, NY & Asia | (54 | ) | (38 | ) | ||||
GM Mexico | (23 | ) | (19 | ) | ||||
GM Argentina | (1 | ) | (1 | ) | ||||
GM Chile | — | — | ||||||
GM Colombia | (3 | ) | (3 | ) | ||||
GM Peru | (3 | ) | (7 | ) | ||||
GM Venezuela | — | — | ||||||
| BBVA. PILLAR III 2020 | 3. RISK | P. 110 |
Simulated scenarios
Unlike the historical scenarios, which are fixed and, thus, do not adapt to the composition of portfolio risk at any given time, the scenario used to perform the economic stress exercises is based on the resampling method. This methodology uses dynamic scenarios that are recalculated regularly according to the main types of risk held in the trading portfolios. A simulation exercise is carried out in a data window that is sufficiently extensive to include different periods of stress (data is taken from January 1, 2008 until the day of assessment), using a resampling of the historical observations. This generates a distribution of profit and loss that allows an analysis of the most extreme events occurring within the selected historical window.
The advantage of this methodology is that the stress period is not pre-established, but rather a function of the portfolio held at any given time; and the large number of simulations (10,000) means that the expected shortfall analysis can
include richer information than that available in scenarios included in the VaR calculation.
The main characteristics of this methodology are as follows:
| a. | The simulations generated respect the data correlation structure. |
| b. | It provides flexibility in terms of including new risk factors. |
| c. | It enables a great deal of variability to be introduced in simulations (which is desirable for considering extreme events). |
The impact of the stress tests by simulated scenarios (Stress VaR 95% at 20 days, Expected Shortfall 95% at 20 days and Stress VaR 99% at 1 day) is shown below.
Table 64. Trading Book. Stress resampling (Million Euros)
| Europe | Mexico | Peru | Venezuela | Argentina | Colombia | Turkey | USA | |||||||||||||||||||||||||
Expected impact | (121 | ) | (69 | ) | (8 | ) | — | (8 | ) | (4 | ) | (8 | ) | (5 | ) | |||||||||||||||||
| Stress VaR | Expected Shortfall | Stress Period | Stress VaR 1D | |||||||||||||
| 2020 | 95 20 D | 95 20 D | 99% Resampling | |||||||||||||
Total | ||||||||||||||||
GM Europe, NY and Asia | (77 | ) | (121 | ) | | 02-01-2008 - 02-12-2009 | | (36 | ) | |||||||
GM Mexico | (51 | ) | (69 | ) | | 09-05-2008 - 06-05-2010 | | (15 | ) | |||||||
3.3.4.2.4. Backtesting
Introduction
The ex-post or Backtesting validation is based on the comparison of the periodic results of the portfolio with the market risk measures from the established measurement system. The validity of a VaR model is particularly dependent on whether the empirical reality of the results does not enter into open contradiction with what is expected in the model. If the observed results were sufficiently adjusted to what was predicted by the model, it would be rated as good, and if the discrepancy were notable, revisions would be required in order to correct possible errors or modifications and to improve quality.
In order to determine whether the results have been sufficiently adjusted to the risk measurements, it is necessary to establish objective criteria, which are specified in a series of validation tests carried out with a given methodology. In establishing the most appropriate methodology, the criteria recommended by Basel have been largely followed as they are considered appropriate.
Validation test
In the comparison between results and risk measurements, a key element that is of interest is the confidence that the losses do not exceed the VaR risk measurements made more than a number of times determined by the level of confidence adopted in the model. The validation test presented below, which focuses on contrasting this aspect, emphasizes that the risk measurement model is underestimating the risk that is actually being borne.
For the establishment of a hypothesis comparison test, we start from the observed results and try to infer whether there is enough evidence to reject the model (the null hypothesis that the trust of the model is established is not met).
In cases where the model functions properly, the VaR measurement indicates that the variation of the value of a portfolio in a given time horizon will not exceed the value obtained in a percentage of times determined by the level of confidence. In other words, the probability of having a loss that is higher than the VaR measurement, what we will call an exception, will be 1%, and the probability that the exception will not occur will be 99%.
| BBVA. PILLAR III 2020 | 3. RISK | P. 111 |
GREEN ZONE model acceptance zone | It is characterised as being an area in which there is a high probability of accepting a suitable model and a low probability of accepting an unsuitable model. This is defined by the set for which the accumulated probability of less than 95%, with the null hypothesis proving correct. It covers a number between zero and four exceptions. | |
| YELLOW ZONE ambiguous zone | Possible results for both a suitable and inadequate model. It begins when the accumulated probability is greater than equal to 95% (it must be less than 99.99%), with the null hypothesis proving correct. It covers a number of between five and nine exceptions. | |
RED ZONE model rejection zone | High probability that the model is unsuitable and unlikely to reject if suitable. It is defined by the fact that the level of significance is less than 0.1% or, which is the same, the accumulated probability is greater than or equal to 99.99%, with the null hypothesis proving correct. It corresponds to a number of exceptions equal to or greater than ten. | |
To carry out this test it is advisable to have, at least, a one-year historical series of both results and risk estimates on a daily basis.
The criterion used is perfectly adapted to the priority of supervisory, which is to avoid situations where excess risk for which the entity is not prepared jeopardizes its survival. However, the use of risk measurements as a tool for managing positions entails a concern that the risk measurements are adjusted to the real risk on both sides: not only is there concern that the risk is being underestimated, but also that It may be overestimating.
At the close of December 31, 2020, the model is in the green zone of acceptance of the model.
Backtesting results
Regulatory backtesting is made up of two types: Hypothetical Backtesting and Actual Backtesting:
| • | Hypothetical Backtesting is defined as the contrast of the Hypothetical P&L on the estimated VaR, the day before the performance of said result. Actual Backtesting is defined as the contrast with the Actual P&L on the same estimated VaR, the day before the performance of said result. |
| • | Actual Backtesting was implemented and entered into force on January 1, 2013, as a result of the transposition in the national legal order through the Bank of Spain Circular 4/2011 of November 30, of the CRD III that introduces Basel 2.5 in the European Union. The results that are used for the construction of both types of Backtesting are based on the actual results of the management tools. |
According to Article 369 of the CRR, the P&L used in Backtesting should have a sufficient level of granularity in order to be shown at the “top-of-house” level, differentiating between Hypothetical and Actual P&L. In addition to the above, the historical Backtesting series will include a minimum of one year.
Actual P&L
The Actual P&L contains the complete management results, including the intraday operation and the daily and non-
daily valuation adjustments, discounting the results of the franchises and commissions of each day and each desk.
The valuation functions and the parameters of the valuation models used in the calculation of the Actual P&L are the same as those used in the calculation of the Economic P&L.
At the close of December 31, 2020, the actual negative P&L did not exceed the VaR within the last 250 top-of-house level observations in BBVA SA thus presenting zero Exceptions in the BBVA SA Actual Backtesting.
At the close of December 31, 2020, the actual negative P&L exceeded three times the VaR within the last 250 top-of-house level observations in BBVA Mexico thus presenting three Exceptions in the BBVA Mexico Actual Backtesting7 . The origin of these exceptions lies in the spread of the COVID-19 pandemic, together with the fall of oil price, which led to a sharp depreciation of the local currency, a considerable increase in stock market volatility, a break in the correlation between different curves and an abrupt movement of the local interest rate curves.
Hypothetical P&L
The Hypothetical P&L contains the management results without the P&L of the daily activity, it is said, excluding intraday operations, premiums, and commissions. The data is provided by the management systems and broken down by desk, in adherence with the Volcker Rule on desk distribution.
The valuation functions and the parameters assigned to the valuation models used in the calculation of the Hypothetical P&L are the same as those used in the calculation of the Actual P&L.
The P&L figures used in both Backtesting types exclude Credit Valuation Adjustments (CVA), Debt Valuation Adjustments (DVA) and Additional Valuation Adjustments (AVA). As well as any change in value resulting from migrations from rating to default, except those reflected in prices by the market itself, since the changes in value due to migration from rating to default are included in the Counterparty Credit Risk metrics.
| 8. | Joint Supervisory Team allows the exclusion of the exceptions, since they were caused by COVID-19 pandemic, based in CRR article 500c. |
| BBVA. PILLAR III 2020 | 3. RISK | P. 112 |
At the close of December 31, 2020, the hypothetical negative P&L did not exceed the VaR within the last 250 top-of-house level observations in BBVA SA thus presenting zero exceptions in the BBVA SA Hypothetical Backtesting.
At the close of December 31, 2020, the hypothetical negative P&L exceeded three times the VaR within the last 250 top-of-house level observations in BBVA Mexico thus presenting three exceptions in the BBVA Mexico Hypothetical Backtesting. The origin of these exceptions lies in the spread of the COVID-19 pandemic, together with the fall of oil price, which led to a sharp depreciation of the local currency, a considerable increase in stock market volatility, a break in the correlation between different curves and an abrupt movement of the local interest rate curves.
Perimeter of the backtesting and internal model exceptions
The calculation scope of VaR and P&L (Hypothetical and
Actual) is limited to the totality of the Trading Book portfolios of the Global Markets Internal Model of BBVA SA and BBVA Mexico.
All the positions belonging to the Banking Book, the portfolios under the Standardised Approach and the trading activity with Hedge Funds (this activity was excluded from the
Internal Model in its original approval) are thus excluded from this scope of application.
It is considered that there is an exception at the Top of House level, when the two following circumstances concur in the same internal model and date:
| • | The Hypothetical P&L and/or the Actual P&L are negative. |
| • | With an amount equal to or greater than the maximum between VaR without smoothing and VaR with smoothing calculated based on the previous day |
For the purposes of calculating the number of exceptions of the Regulatory Backtesting, exceptions will only be taken into account within a mobile window of 250 consecutive Business Days at the Top of House level in each respective internal model.
At the close of December 31, 2020, there are no exceptions in Real Backtesting or Hypothetical Backtesting in the last 250 BBVA SA observations8.
t the close of December 31, 2020, there are three exceptions in Real Backtesting and Hypothetical Backtesting in the last 250 BBVA Mexico observations9.
Chart 20. Trading book. Market Risk Model Validation for BBVA S.A. Hypothetical Backtesting (EU MR4) (Million Euros)
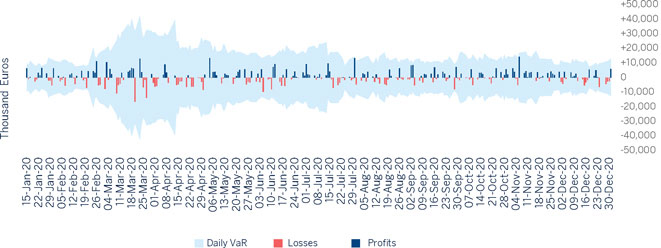
| 9. | Joint Supervisory Team allows the exclusion of the exceptions, since they were caused by COVID-19 pandemic, based in CRR article 500c. |
| BBVA. PILLAR III 2020 | 3. RISK | P. 113 |
Chart 21. Trading book. Market Risk Model Validation for BBVA S.A. Real Backtesting (EU MR4) (Million Euros)
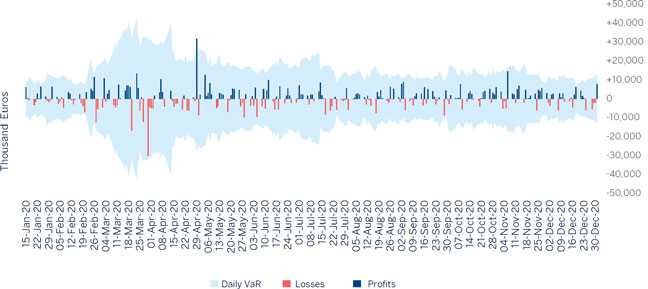
Chart 22. Trading book. Market Risk Model Validation for BBVA Bancomer. Hypothetical Backtesting (EU MR4) (Million Euros)
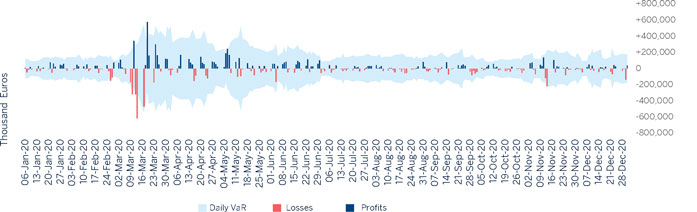
Chart 23. Trading book. Market Risk Model Validation for BBVA Bancomer. Real Backtesting (EU MR4) (Million Euros)
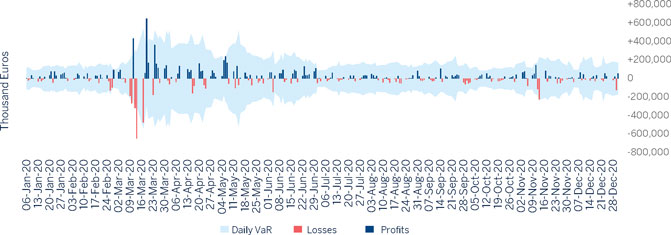
| BBVA. PILLAR III 2020 | 3. RISK | P. 114 |
3.3.4.3. Characteristics of the risk management system
The Group has a risk management system in place which is appropriate for the volume of risk managed, complying with the functions set out in the Corporate Policy on Market Risk in Market Activities.
The risk units must have:
| • | A suitable organisation (means, resources and experience) in line with the nature and complexity of the business. |
| • | Segregation of functions and independence in decision-making. |
| • | Performance under integrity and good governance principles, driving the best practices in the industry and complying with the rules, both internal (policies, |
procedures) and external (regulation, supervision, guidelines). |
| • | The existence of channels for communication with the relevant corporate bodies at local level according to their corporate governance system, as well as with the Corporate Area. |
| • | All market risk existing in the business units that carry out trading activity must be adequately identified, measured and assessed, and procedures must be in place for its control and mitigation. |
| • | The Global Market Risk Unit (GMRU), as the unit responsible for managing market risk at Group level, must promote the use of objective and uniform metrics for measuring the different types of risks. |
The structural risks are defined, in general terms, as the possibility of sustaining losses due to adverse movements in market risk factors as a result of mismatches in the financial structure of an entity’s balance sheet.
In the Group, the following types of structural risk are defined, according to nature and market factors: Interest rate, exchange rate and equity.
The scope of structural risk in the Group is limited to the banking book, excluding market risk of the trading book, which is clearly defined and separated and makes up the Market Risks.
The Assets and Liabilities Committee (ALCO) is the main responsible body for the management of structural risks regarding liquidity/ funding interestrate, currency, equity and solvency. Every month, with the participation of the CEO and representatives from the areas of Finance, Risks and Business Areas, this committee monitors the structural risks and is presented with proposals for managing them for its approval. These management proposals are made proactively by the Finance area, taking into account the risk appetite framework and with the aim of guaranteeing recurrent earnings and financial stability and preserving the entity’s solvency. All balance management units have a local ALCO, which is permanently attended by members of the corporate center, and there is a corporate ALCO where management strategies are monitored and presented in the Group’s subsidiaries.
Global Risk Management (GRM) area acts as an independent unit, ensuring adequate separation between the management and risk control functions, and is responsible for ensuring that the structural risks in the Group are managed according to the strategy approved by the Board of Directors.
For more information on governance regarding structural risk, see Note 7.4 of the Consolidated Financial Statements of BBVA Group.
3.4.1. Structural interest rate risk
The structural interest-rate risk (“IRRBB”) is related to the potential impact that variations in market interest rates have on an entity’s net interest income and equity. In order to properly measure IRRBB, BBVA takes into account the main sources that generate this risk: repricing risk, yield curve risk, option risk and basis risk, which are analysed with an integral vision, combining two complementary points of view: net interest income (short term) and economic value (long term).
The exposure of a financial entity to adverse interest rates movements is a risk inherent to the development of the banking business, which is also, in turn, an opportunity to create economic value. Therefore, interest rate risk must be effectively managed so that it is limited in accordance with the entity’s equity and in line with the expected economic result.
In this regard, the BBVA Group maintains an exposure to fluctuations on interest rates according to its objective strategy and risk profile, being carried out in a decentralised and independent manner in each of the banking entities that compose its structural balance-sheet.
As described above, the structural interest rate risk in the banking book (IRRBB) is within the entity’s risk management framework and is included within the internal capital assessment process as part of Pillar 2 of the Basel framework.
| BBVA. PILLAR III 2020 | 3. RISK | P. 115 |
For more information on the nature of interest-rate risk, as well as on interest rate variations in 2020, see Note 7.4.1 to the Consolidated Financial Statements of BBVA Group.
3.4.2. Structural exchange rate risk
Structural exchange rate risk, inherentto the business of international banking groups that develop their activities in different geographies and currencies, is defined as the possibility of impacts on solvency, equity value and results driven by fluctuations in the exchange rates due to exposures in foreign currencies.
In the BBVA Group, structural exchange-rate risk arises from the consolidation of holdings in subsidiaries with functional currencies other than the euro. Its management is centralised in order to optimize the joint management of permanent foreign currency exposures, taking diversification into account.
For more information on exchange rate management and governance, see Note 7.4.2 of the Consolidated Financial Statements of BBVA Group.
The evolution of the capital requirements on structural exchange rate risk during 2020 is shown in paragraph 3.3.3. of this Report.
Structural equity risk refers to the possibility of suffering losses in the value of positions in shares and other equity instruments held in the banking book with long or medium term investment horizons due to fluctuations in the value of equity indexes or shares.
BBVA Group’s exposure to structural equity risk arises largely from minority shareholdings held on industrial and financial companies. This exposure is modulated in some portfolios with positions held on derivative instruments on the same underlying assets, in order to adjust the portfolio sensitivity to potential changes in equity prices.
For more information on equity management, see Note 7.4.3 of the Consolidated Financial Statements of BBVA Group.
3.4.3.1. Classification of equity exposure not included in the trading book
The Group distinguishes between equity exposures in investments in associates, capital instruments classified as financial assets at fair value through other comprehensive income and non-trading financial assets mandatory at fair value through profit or loss.
The investments in associates are the investments in entities over which the Group has a significant influence. It is presumed that there is significant influence when 20% or more of the voting rights of the subsidiary are held, directly or indirectly, unless it can be clearly demonstrated that such influence does not exist. There are certain exceptions to this criterion that do not constitute significant amounts for the Group. These investments in associates are valued using the equity method.
For further details, see Note 2.1 of the Consolidated Financial Statements of BBVA Group.
The remaining capital instruments not held for trading are classified as financial assets at fair value through other comprehensive income and non-trading financial assets mandatory at fair value through profit or loss, depending on the business model and the contractual cash flow assessment, commonly known as “Solely Payments of Principal and Interest (SPPI). The detailed description of the classification and valuation of capital instruments is found in Section 2.2.1 of the Consolidated Financial Statements of BBVA Group.
3.4.3.2. Carrying amount and exposure of investments in associates and capital instruments contained in aforementioned portfolios
The accompanying table shows the carrying amount, exposure and RWAs of equity exposures by portfolio class:
Table 65. Breakdown of book value, EAD and RWAs of equity investments and capital instruments (Million Euros)
| Equity investments and capital instruments | ||||||||||||||||||||||||||||||||
| 12-31-2020 | 12-31-2019 | |||||||||||||||||||||||||||||||
| Book value | OE | EAD | RWAs | Book value | OE | EAD | RWAs | |||||||||||||||||||||||||
Investments in associates | 4,249 | 4,249 | 4,249 | 10,901 | 4,577 | 4,577 | 4,577 | 11,819 | ||||||||||||||||||||||||
Financial assets at fair value through other comprehensive income | 1,307 | 1,307 | 1,307 | 2,244 | 2,108 | 2,108 | 2,108 | 3,355 | ||||||||||||||||||||||||
Non - trading financial assets mandatorily at fair value through profit or loss | 568 | 568 | 568 | 1,387 | 439 | 439 | 439 | 994 | ||||||||||||||||||||||||
|
|
|
|
|
|
|
|
|
|
|
|
|
|
|
| |||||||||||||||||
Total | 6,123 | 6,123 | 6,123 | 14,532 | 7,124 | 7,124 | 7,124 | 16,167 | ||||||||||||||||||||||||
|
|
|
|
|
|
|
|
|
|
|
|
|
|
|
| |||||||||||||||||
| BBVA. PILLAR III 2020 | 3. RISK | P. 116 |
The accompanying table shows the types, nature and amounts of the original exposure in investments in associates and capital instruments listed or unlisted on a stock market,
with an item differentiating sufficiently diversified portfolios and other unlisted instruments:
Table 66. Exposure in equity investments and capital instruments (Million Euros)
| Nature of Exposure(1) | ||||||||||||||||
| 2020 | 2019 | |||||||||||||||
Concepto | Non-derivatives | Derivatives | Non-derivatives | Derivatives | ||||||||||||
Exchange-traded instruments | 1,418 | 79 | 2,481 | 88 | ||||||||||||
Non-exchange traded instruments | 4,626 | — | 4,555 | — | ||||||||||||
Included in sufficiently diversified portfolios | 4,626 | — | 4,555 | — | ||||||||||||
Other instruments | — | — | — | — | ||||||||||||
|
|
|
|
|
|
|
| |||||||||
Total | 6,044 | 79 | 7,036 | 88 | ||||||||||||
|
|
|
|
|
|
|
| |||||||||
| (1) | Depending on their nature, equity instruments not included in trading book activity will be separated into derivatives and non-derivatives. The amount shown refers to Original Exposure, i.e. gross exposure of value corrections through asset impairment and provisions, before applying risk mitigation techniques. |
3.4.3.3. Risk-weighted assets of investments in associates and capital instruments
A breakdown of the RWAs by the method applicable to investments in associates and capital instruments by accounting portfolio as of December 31, 2020 and December 31, 2019 is shown below:
Table 67. Breakdown of RWAs, equity investments and capital instruments by applicable approach (Million Euros)
| RWA’s | ||||||||||||||||||
Concepto | Internal Models | Simple method | PD/LGD method | Total | ||||||||||||||
| 12-31-2020 | Investments in associates | — | 8,514 | 2,909 | 11,423 | |||||||||||||
| Financial assets at fair value through other comprehensive income | 261 | 500 | 1,036 | 1,797 | ||||||||||||||
| Non - trading financial assets mandatorily at fair value through profit or loss | 352 | 960 | — | 1,312 | ||||||||||||||
| 12-31-2019 | Investments in associates | — | 8,253 | 3,566 | 11,819 | |||||||||||||
| Financial assets at fair value through other comprehensive income | 289 | 1,077 | 1,988 | 3,355 | ||||||||||||||
| Non - trading financial assets mandatorily at fair value through profit or loss | 160 | 834 | — | 994 | ||||||||||||||
The table below shows the main variations in RWA of equity credit risk as of December 31, 2020:
Table 68. Variation in RWAs for Equity Risk (Million Euros)
Equity Risk | ||||||
RWAs as of December 31, 2019 | 16,167 | |||||
Effects | Asset size | (1,111 | ) | |||
| Acquisitions and disposals | — | |||||
| Foreign exchange movements | (524 | ) | ||||
| Other | — | |||||
|
| |||||
RWAs as of December 31, 2020 | 14,532 | |||||
|
| |||||
The portfolio mainly consist of the Group’s insurance companies, which for regulatory purposes are considered as investments in associates. It also includes stakes in real estate investment companies and equity holdings in other sectors, with a significant stake in Telefónica. In 2020, the most relevant event in this regard was the drop of Telefónica’s share price, which reduced exposure and led to a decrease in credit risk RWAs of approximately €1,025 million. Meanwhile,
the RWA of the Group’s insurance companies increased due to the profit generation, as well as the positive effect that the joint venture with Allianz had on the net equity of BBVA Seguros.
3.4.3.4. Profit and loss and valuation adjustments of investments in associates and capital instruments
Below is a breakdown of the profit and loss made by the sale and liquidation of investments in associates and capital instruments and by applicable portfolio type as of December 31, 2020 and December 31, 2019, as well as the valuation adjustments for latent revaluation of investments in associates and capital instruments:
| BBVA. PILLAR III 2020 | 3. RISK | P. 117 |
Table 69. Realised profit and loss from sales and settlements of equity investments and capital instruments (Million Euros)
| 12-31-2020 | 12-31-2019 | |||||||||||||||||||||||
| Losses | Gains | Net | Losses | Gains | Net | |||||||||||||||||||
Investments in associates | 1 | 7 | 6 | 2 | 18 | 16 | ||||||||||||||||||
Financial assets at fair value through other comprehensive income | 1 | 8 | 7 | 0 | 18 | 17 | ||||||||||||||||||
Non - trading financial assets mandatorily at fair value through profit or loss | 74 | 159 | 85 | 28 | 198 | 170 | ||||||||||||||||||
Table 70. TValuation adjustments for latent revaluation of equity investments and capital instruments (Million Euros)
Valuation adjustments for latent revaluation
| FVOCI | ||||
December 2019 | (402 | ) | ||
Variation | (852 | ) | ||
December 2020 | (1,255 | ) | ||
Liquidity and funding risk is defined as the incapacity of a bank in meeting its payment commitments due to the lack of resources or that, to face those commitments, should have to make use of funding under burdensome terms.
Liquidity and funding risk management is aimed to ensure a solid balance sheet structure that allows for a sustainable business model, with the short term aim of preventing the entity from having difficulties in meeting its payment commitments in due time and form, or having to resort to obtaining funds under burdensome terms that damage the image or reputation of the entity in order to meet them. In the medium term the aim is to ensure that the Group’s financing structure is ideal and that it is moving in the right direction with respect to the economic situation, the markets and regulatory changes.
This management of structural finance and liquidity is based on the principle of financial self-sufficiency of the entities that make it up. This approach helps prevent and limit liquidity risk by reducing the Group’s vulnerability during periods of high risk.
The core objectives of the Group in terms of liquidity risk and funding are determined through Liquidity Coverage Ratio (LCR) and the Loan to Stable Customer Deposits ratio (LtSCD).
A statement of the level of appropriateness of the liquidity risk management mechanisms is included as part of the Internal Liquidity Adequacy Assessment Process (ILAAP) approved by the Board of Directors in April 2020:
“From the internal assessment carried out, the Board of Directors concluded that the liquidity and funding management model is robust, with a medium-low liquidity and funding risk profile backed by the existing Risk Appetite Framework and the liquidity and funding planning.”
Also, this liquidity and funding management model considers the liquid resources needed and the ability to generate the additional measures to continue maintaining this profile over the planning horizon and face unexpected stress conditions.
Even considering the uncertainty of the current situation and its future impacts, the assessment reveals that BBVA Group entities maintain a robust funding structure and an effective governance that enables the planning and management of liquidity and funding to be adapted to adverse situations.
The foregoing is endorsed by the adaptation of the liquidity and funding plan to the context of Covid-19 for the main Group entities, together with the management capacity faced with a possible worsening and/or prolongation of this scenario.
For more information on Liquidity Risk and Funding see Note 7.5 of the Consolidated Financial Statements of BBVA Group.
3.5.1. Liquidity and funding prospects
The Group faces 2021 with a comfortable liquidity situation in all the territories it operates in. The financing structure based on stable customer deposits and biased toward the long term, as well as the proven capacity to access capital markets, allows to comfortably face the moderate volume of maturities expected for the coming quarters.
The following is a breakdown of wholesale financing maturities of the most significant units of the Group according to their nature:
| BBVA. PILLAR III 2020 | 3. RISK | P. 118 |
Table 71. Maturity of wholesale issuances of Balance Euro by nature (Million Euros)
Type of issuance | 2021 | 2022 | 2023 | After 2023 | Total | |||||||||||||||
Senior debt | 1,484 | 2,790 | 1,160 | 3,217 | 8,651 | |||||||||||||||
Non preferred senior debt | — | 1,499 | 1,650 | 5,538 | 8,687 | |||||||||||||||
Mortgage-covered bonds | 3,175 | 1,618 | 2,350 | 5,417 | 12,559 | |||||||||||||||
Public-covered bonds | — | 300 | 200 | — | 500 | |||||||||||||||
Preferred shares(1) | 1,193 | 500 | 1,000 | 3,628 | 6,320 | |||||||||||||||
Subordinated debt(1) | 86 | 68 | 150 | 4,168 | 4,471 | |||||||||||||||
Structured financing(2) | 2,497 | 225 | 199 | 724 | 3,644 | |||||||||||||||
|
|
|
|
|
|
|
|
|
| |||||||||||
Total | 8,434 | 7,000 | 6,708 | 22,691 | 44,833 | |||||||||||||||
|
|
|
|
|
|
|
|
|
| |||||||||||
| (1) | Regulatory capital instruments are classified in this table by terms according to their contractual maturity or nearest amortisation option. |
| (2) | Global Markets MTN programme balances not eligible as MREL instruments, classified according to their nearest repayment option. |
Table 72. Maturity of wholesale issuances of BBVA Mexico by nature (Million Euros)
Type of issuance | 2021 | 2022 | 2023 | After 2023 | Total | |||||||||||||||
Senior debt | 184 | 322 | 517 | 2,075 | 3,098 | |||||||||||||||
Subordinated debt(1) | 611 | 1,222 | — | 1,589 | 3,423 | |||||||||||||||
|
|
|
|
|
|
|
|
|
| |||||||||||
Total | 796 | 1,544 | 517 | 3,664 | 6,521 | |||||||||||||||
|
|
|
|
|
|
|
|
|
| |||||||||||
| (1) | Regulatory capital instruments are classified in this table by terms according to their contractual maturity or nearest amortisation option. |
Table 73. Maturity of wholesale issuances of BBVA USA by nature (Million Euros)
Type of issuance | 2021 | 2022 | 2023 | After 2023 | Total | |||||||||||||||
Senior debt | 937 | 611 | — | 489 | 2,037 | |||||||||||||||
Subordinated debt(1) | 17 | — | — | 628 | 645 | |||||||||||||||
|
|
|
|
|
|
|
|
|
| |||||||||||
Total | 954 | 611 | — | 1,117 | 2,683 | |||||||||||||||
|
|
|
|
|
|
|
|
|
| |||||||||||
| (1) | Regulatory capital instruments are classified in this table by terms according to their contractual maturity or nearest amortisation option. |
Table 74. Maturity of wholesale issuances of BBVA Garanti by nature (Million Euros)
Type of issuance | 2021 | 2022 | 2023 | After 2023 | Total | |||||||||||||||
Senior debt | 407 | 471 | 432 | 122 | 1,432 | |||||||||||||||
Mortgage-covered bonds | — | 92 | 16 | — | 109 | |||||||||||||||
Subordinated debt(1) | — | — | — | 721 | 721 | |||||||||||||||
Securitisations | 47 | 288 | 105 | 176 | 616 | |||||||||||||||
Syndicated loans | 1,132 | — | — | — | 1,132 | |||||||||||||||
Other long term financial instruments | 461 | 324 | 146 | 1,593 | 2,524 | |||||||||||||||
|
|
|
|
|
|
|
|
|
| |||||||||||
Total | 2,047 | 1,175 | 700 | 2,612 | 6,535 | |||||||||||||||
|
|
|
|
|
|
|
|
|
| |||||||||||
| (1) | Regulatory capital instruments are classified in this table by terms according to their contractual maturity or nearest amortisation option. |
Table 75. Maturity of wholesale issuances of South America by nature (Million Euros)
Type of issuance | 2021 | 2022 | 2023 | After 2023 | Total | |||||||||||||||
Senior debt | 286 | 816 | 272 | 206 | 1,580 | |||||||||||||||
Subordinated debt(1) | 41 | 20 | 68 | 805 | 934 | |||||||||||||||
|
|
|
|
|
|
|
|
|
| |||||||||||
Total | 327 | 836 | 340 | 1,011 | 2,514 | |||||||||||||||
|
|
|
|
|
|
|
|
|
| |||||||||||
| (1) | Regulatory capital instruments are classified in this table by terms according to their contractual maturity or nearest amortisation option. |
Going into 2021, one of the main objectives of the Group’s funding strategy is maintaining the strength of the financing structure based on the growth of stable customer resources; diversifying the different sources of financing and ensuring
A breakdown of the LCR disclosure as of December 31, 2020 is shown below, according to Article 435 of Regulation (EU)
No 575/2013. These figures are calculated as simple averages of end-of-month observations from the twelve months
the availability of sufficient levels of liquid assets; and optimizing the generation of collateral, for compliance with regulatory ratios, and other internal metrics to monitor liquidity risk, including stress scenarios.
preceding each quarter. No transfer of liquidity is assumed between subsidiaries, and therefore no excess liquidity is transferred from the entities abroad to the consolidated figures displayed in the following table:
| BBVA. PILLAR III 2020 | 3. RISK | P. 119 |
Table 76. EU LIQ1: Liquidity Coverage Ratio disclosure (Million Euros)
| Total unweighted value (average) | Total weighted value (average) | |||||||||||||||||||||||||||||||
| March | June | September | December | March | June | September | December | |||||||||||||||||||||||||
End of the quarter | 03-31-20 | 06-30-20 | 09-30-20 | 12-31-20 | 03-31-20 | 06-30-20 | 09-30-20 | 12-31-20 | ||||||||||||||||||||||||
Number of data points used in the calculation of averages | 12 | 12 | 12 | 12 | 12 | 12 | 12 | 12 | ||||||||||||||||||||||||
High-quality liquid assets | — | — | — | — | — | — | — | — | ||||||||||||||||||||||||
|
|
|
|
|
|
|
|
|
|
|
|
|
|
|
| |||||||||||||||||
Total high-quality liquid assets (HQLA) | 91 | 98 | 105 | 114 | ||||||||||||||||||||||||||||
Cash-outflows | — | — | — | — | — | — | — | — | ||||||||||||||||||||||||
|
|
|
|
|
|
|
|
|
|
|
|
|
|
|
| |||||||||||||||||
Retail deposits and deposits from small business customers, of which: | 221 | 231 | 240 | 248 | 16 | 16 | 17 | 17 | ||||||||||||||||||||||||
Stable deposits | 149 | 154 | 158 | 163 | 7 | 8 | 8 | 8 | ||||||||||||||||||||||||
Less stable deposits | 72 | 73 | 74 | 74 | 9 | 9 | 9 | 9 | ||||||||||||||||||||||||
Unsecured wholesale funding | 130 | 134 | 135 | 139 | 55 | 57 | 57 | 58 | ||||||||||||||||||||||||
Operational deposits (all counterparties) and deposits in networks of cooperative banks | 52 | 54 | 56 | 58 | 12 | 12 | 13 | 13 | ||||||||||||||||||||||||
Non-operational deposits (all counterparties) | 76 | 78 | 78 | 79 | 42 | 43 | 42 | 43 | ||||||||||||||||||||||||
Unsecured debt | 2 | 2 | 1 | 2 | 2 | 2 | 1 | 2 | ||||||||||||||||||||||||
Secured wholesale funding | 4 | 5 | 5 | 5 | ||||||||||||||||||||||||||||
Additional requirements | 96 | 93 | 93 | 93 | 16 | 16 | 17 | 18 | ||||||||||||||||||||||||
Outflows related to derivative exposures and other collateral requirements(1) | 6 | 6 | 7 | 8 | 6 | 6 | 7 | 8 | ||||||||||||||||||||||||
Outflows related to loss of funding on debt products | 0 | 0 | 0 | 0 | 0 | 0 | 0 | 0 | ||||||||||||||||||||||||
Credit and liquidity facilities | 89 | 87 | 86 | 85 | 9 | 9 | 9 | 10 | ||||||||||||||||||||||||
Other contractual funding obligations | 14 | 14 | 13 | 13 | 1 | 1 | 1 | 1 | ||||||||||||||||||||||||
Other contingent funding obligations | 64 | 78 | 79 | 81 | 3 | 3 | 3 | 3 | ||||||||||||||||||||||||
|
|
|
|
|
|
|
|
|
|
|
|
|
|
|
| |||||||||||||||||
Total cash outflows | 96 | 99 | 99 | 102 | ||||||||||||||||||||||||||||
|
|
|
|
|
|
|
|
|
|
|
|
|
|
|
| |||||||||||||||||
Cash—inflows | — | — | — | — | — | — | — | — | ||||||||||||||||||||||||
|
|
|
|
|
|
|
|
|
|
|
|
|
|
|
| |||||||||||||||||
Secured lending (e.g. reverse repos) | 21 | 22 | 21 | 21 | 1 | 1 | 1 | 1 | ||||||||||||||||||||||||
Inflows from fully performing exposures | 31 | 30 | 29 | 29 | 20 | 19 | 19 | 18 | ||||||||||||||||||||||||
Other cash inflows | 4 | 4 | 4 | 5 | 4 | 4 | 4 | 5 | ||||||||||||||||||||||||
(Difference between total weighted inflows and total weighted outflows arising from transactions in third countries where there are transfer restrictions or which are denominated in non-convertible currencies) | ||||||||||||||||||||||||||||||||
(Excess inflows from a related specialised credit institutions) | ||||||||||||||||||||||||||||||||
|
|
|
|
|
|
|
|
|
|
|
|
|
|
|
| |||||||||||||||||
Total cash inflows | 56 | 56 | 55 | 54 | 25 | 24 | 24 | 24 | ||||||||||||||||||||||||
|
|
|
|
|
|
|
|
|
|
|
|
|
|
|
| |||||||||||||||||
Fully exempt inflows | ||||||||||||||||||||||||||||||||
Inflows subject to 90% cap | ||||||||||||||||||||||||||||||||
Inflows subject to 75% cap | 56 | 56 | 55 | 54 | 25 | 24 | 24 | 24 | ||||||||||||||||||||||||
Total adjusted value | ||||||||||||||||||||||||||||||||
Liquidity buffer | 91 | 98 | 105 | 114 | ||||||||||||||||||||||||||||
|
|
|
|
|
|
|
| |||||||||||||||||||||||||
Total net cash outflows | 71 | 75 | 75 | 78 | ||||||||||||||||||||||||||||
|
|
|
|
|
|
|
| |||||||||||||||||||||||||
Liquidity coverage ratio (%) | 128.4 | % | 131.6 | % | 140.6 | % | 147.0 | % | ||||||||||||||||||||||||
|
|
|
|
|
|
|
| |||||||||||||||||||||||||
Liquidity buffer (including excess liquidity of subsidiaries) | 112 | 119 | 128 | 138 | ||||||||||||||||||||||||||||
|
|
|
|
|
|
|
| |||||||||||||||||||||||||
Total net cash outflows | 71 | 75 | 75 | 78 | ||||||||||||||||||||||||||||
|
|
|
|
|
|
|
| |||||||||||||||||||||||||
Liquidity coverage ratio (%) | 156.9 | % | 159.5 | % | 170.3 | % | 178.5 | % | ||||||||||||||||||||||||
|
|
|
|
|
|
|
| |||||||||||||||||||||||||
| (1) | Includes the amount of the collateral that the entity would have to provide in case of a credit downgrade, according to CRR Article 449(d). |
The establishment of an independent control framework for the Euro, USA, Mexico and Turkey LMUs, allows compliance with the Liquidity and Finance corporate requirements on the four main currencies in which the BBVA Group operates: Euro, Dollar, Mexican Peso and Turkish Lira.
With the exception of the dollar, significant currencies at the Group level are fully managed by entities resident in the jurisdictions of each of them, with their financing needs covered in the local markets in which they operate.
For those LMUs operating in dollarised economies (Argentina, Peru, Mexico and Turkey) there are specific regulatory requirements that limit the level of risk of each subsidiary. In addition, the LCR in US dollars in all of them exceeds 100%.
Regarding the sustainability of wholesale financing as a source of funding, this depends on the degree of diversification. In particular, in order to ensure adequate diversification by counterparties, specific concentration thresholds are set and must be met at all times by each LMU. As of December 31, 2020, except for the positions against central clearing houses and the secured financing operations with several Central
Banks, the Group has no counterparties that maintain balances greater than 1% of the Group’s total liabilities and the weight of the first 10 counterparties per balance represents 5%.
| BBVA. PILLAR III 2020 | 3. RISK | P. 120 |
3.5.3. Net Stable Funding Ratio
The Net Stable Funding Ratio (NSFR), defined as the ratio between the amount of stable funding available and the amount of stable funding required, is one of the Basel Committee’s essential reforms, and requires banks to maintain a stable funding profile in relation to the composition of their assets and off-balance-sheet activities. This ratio should be at least 100% at all times.
This requirement was defined by the Basel Committee in October 2014, and following the final approval of the Capital Requirements Regulation II (CRR II) or Regulation (EU) 2019/876 amending the CRR, the transposition of the Basel requirement will be effective in June 2021.
Within its risk appetite framework, BBVA has included the NSFR indicator within the limits scheme for both the Group as a whole and for each individual LMU, aimed at keeping this metric at a comfortable level above 100%. In this respect, the NSFR of the Group as of December 31, 2020 was 127%.
For information on the NSFR of the main LMUs, see Note 7.5.3 of the Consolidated Financial Statements of BBVA Group.
3.5.4. Encumbered assets in funding operations
In relation to the management of encumbered liquid assets10 , all LMUs maintain adequate positions not only to cover the minimum survival periods in a stress situation, but also uncollateralised wholesale liabilities, which are ultimately the most affected by the ratio of encumbered assets.
All of the Group’s LMUs have implemented procedures and controls to ensure that the risk associated with the management of guarantees and asset assessment are properly identified, controlled and managed in compliance with the Corporate Liquidity and Financing Risk Policy, highlighting: i) monitoring and control scheme for encumbered assets risk indicators, ii) periodic evaluation of stress scenarios as a result of the risk levels achieved, and iii) a contingency plan with action measures based on the degree of criticality and immediacy of the situation.
The impact on the business model of the level of the asset pledging, as well as the importance in the Group’s financing model is low because the financing is based on stable customer deposits, the dependence on short term financing is reduced, and a robust financing structure is maintained, with a moderate level of encumbered assets.
The ratio of encumbered assets to total assets for the main LMUs as of December 31, 2020 is:
Table 77. Encumbered assets over total assets
| 12-31-2020 | ||||
BBVA Group | 20 | % | ||
LMU Euro | 25 | % | ||
LMU Mexico | 17 | % | ||
LMU Compass | 11 | % | ||
LMU Garanti | 5 | % | ||
The Group mainly has the following pledging sources:
| • | Guaranteed bonds |
The issue of guaranteed bonds is one of the main sources of guaranteed financing which give the holders a high degree of protection. Issues are backed by on-balance sheet assets that are susceptible to being curbed (pooled) and have a joint guarantee from the Entity that will support the issue in the event that the underlying assets cannot cope with the payments. The products through which this type of financing is implemented are mortgage-covered bonds, public covered bonds and internationalisation bonds.
| • | Assets sold under repurchase agreement |
Co-financing operations collateralised by assets sold under repurchase agreement are among the short term sources of financing. These operations play an important role in the type of encumbered assets in the Group.
| • | Assets pledged with Central Banks |
The role of central banks as suppliers of liquidity ultimately constitutes one of the key contingent financing resources in the event of there being tensions in the financial markets. In this regard, in accordance with the principles established for management of collateral, the Group’s strategy consists of maintaining broad credit policies with the central banks concerned by pledging assets as collateral in geographical areas where these instruments are used as part of monetary policy.
Additionally, a relevant element is, in the case of the ECB, the non-standard monetary policy measures related to the “Targeted Longer-Term Refinancing Operations” (TLTRO) to provide long-term financing in order to facilitate the credit conditions of the private sector and stimulate financing to the real economy. In this sense, BBVA maintained at the end of December 2020 an amount drawn down from the TLTRO III program of €35 billion.
| • | Management of collateral agreements |
The use of collateral is one of the most effective techniques to mitigate exposure to Credit Risk arising from operations with Derivatives or in operations with repurchase agreements or Value Loans. The assets currently used as collateral are: cash, fixed-income and credit letters.
| 10. | An asset is considered encumbered if it is subject to any form of agreement with the objective of ensuring, collateralizing or improving the credit quality of a transaction, and it cannot be freely removed. |
In any case, the consideration of a committed asset is not based on an explicit legal definition, such as the transfer of a title, but on an economic criterion, so any asset that is subject to any restriction to be used or to replace another asset, is considered pledged.
| BBVA. PILLAR III 2020 | 3. RISK | P. 121 |
| • | Securitisation |
The issuance of securitisation represents one of the main potential sources of risk for pledged assets on the balance sheet. According to the type of assets supporting the securitisation, the following classes are issued: residential mortgage-backed securities (RMBS), consumer loans and loans to SMEs. The impact of this pledging source is very low for the Group.
The projects subject to overcollateralisation are:
| • | Mortgage-covered bonds. |
These are mortgage bonds issued with first-rank mortgage loan collateral constituted in favor of the bank. In the case of BBVA S.A., which accounts for more than 95% of the issuance of mortgage-covered bonds in the Group, the bonds have to be overcollateralised at 125% of their nominal value, and the amount of loans that back them cannot be more than 80% of the value of the collateral. The other geographic area that issues these types of product (to a residual extent) is Garanti BBVA.
| • | Public covered bonds. |
Public covered bonds are similar to mortgage-covered bonds.
They are backed by loans and credit granted by the issuer to the State, to central and regional governments, local authorities and autonomous bodies that answer to them, as well as other public-sector entities in the European Economic Area. In this case, the issues have to be overcollateralised at 143% of their nominal value. BBVA SA accounts for 100% of this type of issue.
| • | Internationalisation bonds. |
These are securities guaranteed by loans and credit linked to the financing of contracts for the export of goods and services or to the internationalisation of companies. The level of overcollateralisation is the same as for public covered bonds. BBVA SA accounts for 100% of this type of issue. The weight of this type of issue is very residual.
Within the Group there are units responsible for the execution, monitoring and control of issues of this type, as well as the calculation of the capacity for additional issuance, with the aim of ensuring that the Entity is not over-issued and complies with the established limits of the Encumbered Asset Ratio.
The following table shows assets contributed as collateral (loans) underlying the issue of mortgage-covered bonds, public covered bonds and internationalisation bonds, as well as the total issued and excess issuance capacity as of December 31, 2020:
Table 78. Mortgage-covered bonds (Million euros. 12-31-2020)
Withheld | ||||
Withheld applied | 19,500 | |||
Withheld not applied | 9 | |||
Issued to Market | 12,560 | |||
Total mortgage-covered bonds issued | 32,069 | |||
Eligible collateral to consider | 43,685 | |||
Maximum to issue | 34,948 | |||
Capacity to issue | 2,879 | |||
Table 79. Public-covered bonds (Million euros. 12-31-2020)
Withheld applied | ||||
Withheld not applied | 6,040 | |||
Issued to Market | — | |||
Total mortgage-covered bonds issued | 500 | |||
Eligible collateral to consider | 6,540 | |||
Maximum to issue | 12,803 | |||
Capacity to issue | 8,962 | |||
Capacity to issue | 2,422 | |||
Table 80. Internationalisation-covered bonds (Million euros. 12-31-2020)
Withheld applied | ||||
Withheld applied | 1,500 | |||
Withheld not applied | — | |||
Issued to Market | — | |||
Total internationalisation-covered bonds issued | 1,500 | |||
Eligible collateral to consider | 3,276 | |||
Maximum to issue | 2,293 | |||
Capacity to issue | 793 | |||
The assets on the balance sheet and the collaterals received that, as of December 31, 2020, is encumbered (provided as collateral or security with respect to certain liabilities) and the collateral that is unencumbered are shown below. It should be noted that the value used for the purpose of this disclosure is the carrying amount and fair value, for both the assets on the balance sheet and the pledged and unpledged guarantees received. The balances are calculated as annual medians using as a sample the four quarters of the last year.
| BBVA. PILLAR III 2020 | 3. RISK | P. 122 |
Table 81. Encumbered and unencumbered Assets (Million Euros. 12-31-2020)
| Carrying value of encumbered assets | Fair value of encumbered assets | Carrying value of unencumbered assets | Fair value of unencumbered assets | |||||||||||||||||||||||||||||
| of which notionally elligible EHQLA and HQLA | of which notionally elligible EHQLA and HQLA | of which EHQLA and HQLA | of which EHQLA and HQLA | |||||||||||||||||||||||||||||
Institution’s assets | 122,054 | 31,223 | 593,490 | 144,764 | ||||||||||||||||||||||||||||
|
|
|
|
|
|
|
|
|
|
|
|
|
|
|
| |||||||||||||||||
Equity instruments | 2,231 | 1,495 | 6,073 | 2,684 | ||||||||||||||||||||||||||||
Debt securities | 31,409 | 30,159 | 28,149 | 30,159 | 82,078 | 74,084 | 85,229 | 75,078 | ||||||||||||||||||||||||
Of which: covered bonds | 72 | 63 | 72 | 63 | 592 | 592 | 591 | 591 | ||||||||||||||||||||||||
Of which: ABSs | 31 | — | 36 | — | 220 | — | 214 | — | ||||||||||||||||||||||||
Of which: issued by general governments | 26,642 | 26,642 | 23,210 | 23,210 | 67,528 | 64,679 | 70,841 | 65,630 | ||||||||||||||||||||||||
Of which: issued by financial corporations | 2,238 | 1,650 | 2,409 | 1,650 | 8,988 | 5,738 | 8,824 | 5,826 | ||||||||||||||||||||||||
Of which: issued by non- financial corporations | 2,860 | 1,967 | 2,864 | 1,967 | 2,598 | 768 | 2,589 | 784 | ||||||||||||||||||||||||
Loans and Other assets | 91,156 | — | 506,019 | 64,394 | ||||||||||||||||||||||||||||
Of which: Loans and advances | 87,939 | — | 397,392 | 55,091 | ||||||||||||||||||||||||||||
Of which: Other assets | 0 | — | 105,139 | 5,780 | ||||||||||||||||||||||||||||
Encumbered and unencumbered Assets (Million Euros. 12-31-2019)
| Carrying value of encumbered assets | Fair value of encumbered assets | Carrying value of unencumbered assets | Fair value of unencumbered assets | |||||||||||||||||||||||||||||
| of which notionally elligible EHQLA and HQLA | of which notionally elligible EHQLA and HQLA | of which EHQLA and HQLA | of which EHQLA and HQLA | |||||||||||||||||||||||||||||
Institution’s assets | 109,189 | 32,142 | 570,814 | 105,564 | ||||||||||||||||||||||||||||
|
|
|
|
|
|
|
|
|
|
|
|
|
|
|
| |||||||||||||||||
Equity instruments | 2,664 | 1,635 | 7,269 | 3,862 | ||||||||||||||||||||||||||||
Debt securities | 32,119 | 30,491 | 33,255 | 30,673 | 73,893 | 64,130 | 73,766 | 64,850 | ||||||||||||||||||||||||
Of which: covered bonds | 46 | 44 | 45 | 44 | 693 | 691 | 683 | 681 | ||||||||||||||||||||||||
Of which: ABSs | 22 | — | 22 | — | 193 | — | 231 | — | ||||||||||||||||||||||||
Of which: issued by general governments | 27,802 | 28,109 | 28,879 | 28,290 | 61,515 | 58,527 | 61,457 | 59,219 | ||||||||||||||||||||||||
Of which: issued by financial corporations | 2,751 | 1,369 | 2,823 | 1,375 | 7,545 | 4,840 | 7,473 | 4,855 | ||||||||||||||||||||||||
Of which: issued by non- financial corporations | 1,289 | 971 | 1,280 | 971 | 2,564 | 732 | 2,578 | 745 | ||||||||||||||||||||||||
Loans and Other assets | 74,238 | — | 490,012 | 37,056 | ||||||||||||||||||||||||||||
Of which: Loans and advances | 74,238 | — | 396,242 | 31,073 | ||||||||||||||||||||||||||||
Of which: Other assets | — | — | 89,710 | 5,253 | ||||||||||||||||||||||||||||
Table 82. Collateral received (Million Euros. 12-31-2020)
| Fair value of encumbered collateral received or own debt securities issued | Fair value of collateral received or own debt securities issued available for encumbrance | |||||||||||||||
| of which notionally elligible EHQLA and HQLA | of which EHQLA and HQLA | |||||||||||||||
Collateral received | 38,879 | 35,352 | 7,590 | 4,455 | ||||||||||||
|
|
|
|
|
|
|
| |||||||||
Loans on demand | — | — | — | — | ||||||||||||
Equity instruments | 220 | 111 | 199 | 158 | ||||||||||||
Debt securities | 38,659 | 35,233 | 7,410 | 4,327 | ||||||||||||
Of which: covered bonds | 823 | 143 | 25 | 2 | ||||||||||||
Of which: ABSs | — | — | 24 | — | ||||||||||||
Of which: issued by general governments | 32,065 | 30,628 | 4,240 | 3,980 | ||||||||||||
Of which: issued by financial corporations | 5,115 | 2,085 | 2,400 | 535 | ||||||||||||
Of which: issued by non- financial corporations | 1,260 | 259 | 530 | 42 | ||||||||||||
Loans and advances other than loans on demand | — | — | — | — | ||||||||||||
Other collateral received | — | — | — | — | ||||||||||||
Own debt securities issued other than own mortgage-covered bonds or ABSs | — | — | 112 | — | ||||||||||||
Own mortgage-covered bonds and ABSs issued and not yet pledged | 11,141 | — | ||||||||||||||
|
|
|
|
|
|
|
| |||||||||
Total assets, collateral received and own debt securities issued | 162,044 | 68,860 | ||||||||||||||
|
|
|
|
|
|
|
| |||||||||
| BBVA. PILLAR III 2020 | 3. RISK | P. 123 |
Collateral received (Million Euros. 12-31-2019)
| Fair value of encumbered collateral received or own debt securities issued | Fair value of collateral received or own debt securities issued available for encumbrance | |||||||||||||||
| of which notionally elligible EHQLA and HQLA | of which EHQLA and HQLA | |||||||||||||||
Collateral received | 33,705 | 28,795 | 10,301 | 6,724 | ||||||||||||
|
|
|
|
|
|
|
| |||||||||
Loans on demand | — | — | 0 | — | ||||||||||||
Equity instruments | 125 | 77 | 67 | 27 | ||||||||||||
Debt securities | 33,582 | 28,750 | 10,217 | 6,689 | ||||||||||||
Of which: covered bonds | 640 | 146 | 91 | 10 | ||||||||||||
Of which: ABSs | — | — | 175 | — | ||||||||||||
Of which: issued by general governments | 28,575 | 26,591 | 6,008 | 5,558 | ||||||||||||
Of which: issued by financial corporations | 3,105 | 599 | 2,989 | 1,068 | ||||||||||||
Of which: issued by non- financial corporations | 692 | 153 | 360 | 74 | ||||||||||||
Loans and advances other than loans on demand | — | — | 1 | — | ||||||||||||
Other collateral received | — | — | — | — | ||||||||||||
Own debt securities issued other than own mortgage-covered bonds or ABSs | 9 | — | 82 | — | ||||||||||||
Own mortgage-covered bonds and ABSs issued and not yet pledged | 19,311 | — | ||||||||||||||
|
|
|
|
|
|
|
| |||||||||
Total assets, collateral received and own debt securities issued | 139,930 | — | ||||||||||||||
|
|
|
|
|
|
|
| |||||||||
The pledging sources with associated collateral as of December 31, 2020 are below:
Table 83. Sources of encumbrance (Million Euros. 12-31-2020)
| Matching liabilities, contingent liabilities or securities lent | Assets, collateral received and own securities issued other than mortgage-covered bonds, public-covered bonds and ABSs encumbered | |||||||
Carrying amount of selected financial liabilities | 138,902 | 156,573 | ||||||
|
|
|
| |||||
Derivatives | 18,165 | 16,700 | ||||||
Repos and other collateralised deposits | 104,618 | 121,009 | ||||||
Debt securities | 17,818 | 21,671 | ||||||
Other sources of encumbrance | 516 | 5,472 | ||||||
Sources of encumbrance (Million Euros. 12-31-2019)
| Matching liabilities, contingent liabilities or securities lent | Assets, collateral received and own securities issued other than mortgage-covered bonds, public-covered bonds and ABSs encumbered | |||||||
Carrying amount of selected financial liabilities | 120,985 | 135,005 | ||||||
|
|
|
| |||||
Derivatives | 13,345 | 12,914 | ||||||
Repos and other collateralised deposits | 89,895 | 99,999 | ||||||
Debt securities | 17,882 | 21,865 | ||||||
Other sources of encumbrance | 465 | 4,925 | ||||||
The assets without associated liabilities shown in the table above correspond to guarantees given to be able to operate in certain markets, as well as assets mainly encumbered in security lending operations. The collateral received off the balance sheet is mostly reverse repurchase agreements, of sovereign securities.
| BBVA. PILLAR III 2020 | 3. RISK | P. 124 |
BBVA defines operational risk (OR) as risk that may cause losses as a result of human error; inadequate or defective internal processes; inadequate conduct towards customers, in the markets or against the company; failures, interruptions or deficiencies in systems or communications; theft, loss or misuse of information, as well as deterioration of its quality; internal or external fraud including, in all cases, fraud resulting from cyber-attacks; theft or physical damage to assets or persons; legal risks; risks resulting from workforce and occupational health management; and inadequate service provided by suppliers.
Operational risk management is oriented toward identifying its root causes, preventing its occurrence, and mitigating its potential consequences, so that the risk level falls within defined tolerance limits.
Operational risk management is based on a number of components similar to those adopted for other types of risk.
Chart 24. Operational Risk Management Processes

All these elements, as well as operational risk governance, are described in the “Risk Management – Operational Risk” section of the Management Report accompanying the Group’s Consolidated Financial Statements
3.6.1. Methods used for calculating capital
On 18 December 2020, the European Central Bank’s Governing Council authorised BBVA to revert to using
advanced models to calculate regulatory capital requirements for operational risk at the consolidated level, for geographical areas in which it was previously used (Spain and Mexico).
At the Group level, this reversal does not significantly impact capital figures for this type of risk, nor does it imply an eased level of requirement in terms of its measurement and management.
BBVA remains steadfast in its full commitment to effectively and pre-emptively manage operational risks as a key tool in helping to not only minimise the economic impact of operational events within the Group, but also as an instrument for increasing the quality of the service provided and helping to achieve the Bank’s strategic objectives.
Following said change, all Group entities apply a standard method for calculating their capital requirements for operational risk, except for Bolivia and the international subsidiaries of Garanti Bank, for which the basic method is applied.
Both the basic and standard methods use fixed parameters to calculate regulatory capital for operational risk:
| • | Basic method: according to Chapter 2 of Title III of the CRR, the capital requirement for operational risk using the basic method is calculated as the three-year average of relevant income multiplied by a single factor established by the Regulator, which amounts to 15%. The sum of the following elements of the profit and loss account is defined as relevant income: |
| • | Income from interest and other similar income |
| • | Interest expense and other similar charges |
| • | Return on equities and other fixed- or variable-income securities |
| • | Fees receivable |
| • | Fees payable |
| • | Net trading income |
| • | Other operating income |
| • | Standard method: according to Chapter 3 of Title III of the CRR, capital requirement for operational risk using the standard method is calculated as the three-year average of relevant income multiplied by a factor established by the Regulator for each line of business. |
For information on the AMA model used by the Group until this year, see Section 3.6.1 of the Pillar III Report 2019 available on the BBVA Group’s Shareholders and Investors website.
The following table shows the operational risk capital requirements broken down according to the calculation models used and by geographic area, to provide a global vision of capital consumption for this type of risk:
| BBVA. PILLAR III 2020 | 3. RISK | P. 125 |
Table 84. Regulatory capital for Operational Risk (Million Euros)
| Capital requirements | RWAs | |||||||||||||||
Regulatory capital for operational risk | 12-31-2020 | 12-31-2019 | 12-31-2020 | 12-31-2019 | ||||||||||||
Advanced | 1,746 | 21,822 | ||||||||||||||
Spain | 1,382 | 17,270 | ||||||||||||||
Mexico | 364 | 4,552 | ||||||||||||||
Standardised | 2,782 | 1,220 | 34,773 | 15,250 | ||||||||||||
Spain | 804 | 5 | 10,045 | 62 | ||||||||||||
Mexico | 875 | 0 | 10,943 | 0 | ||||||||||||
Others | 1,103 | 1,215 | 13,785 | 15,188 | ||||||||||||
Basic | 71 | 64 | 883 | 805 | ||||||||||||
|
|
|
|
|
|
|
| |||||||||
BBVA Group total | 2,853 | 3,030 | 35,656 | 37,877 | ||||||||||||
|
|
|
|
|
|
|
| |||||||||
The main variations in the regulatory capital requirements for operational risk are due to:
| • | The increase in capital in the Standard Method is mainly due to including Spain and Mexico in the calculation through this method. The change in model for Spain has generated a capital reduction of €606m, offset by an increase in capital of €511 million in Mexico, meaning that the total decrease in capital in these countries amounts to €95 million. This variation is explained by: depreciation of the Mexican peso exchange rate (€-132 million), the decrease in relevant income (€-23 million) and increased due to the change in the method (€+60 million). |
| • | The other countries have generally shown a decrease in capital, essentially as a result of exchange rate differences, mainly in Turkey and the United States. |
3.6.2. The Group’s Operational Risk Profile
BBVA’s operational risk profile is shown below by risk type after assessing the risk, resulting in the following distribution:
Chart 25. Operational Risk Profile of BBVA Group
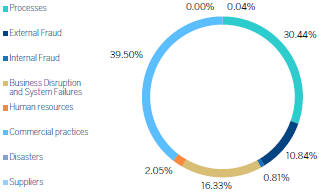
The following charts reflect the distribution of operational losses by risk class and country for 2020.
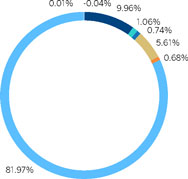
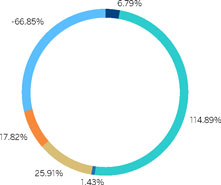
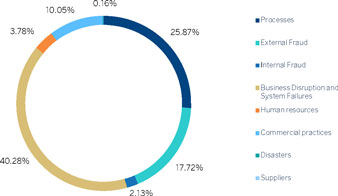
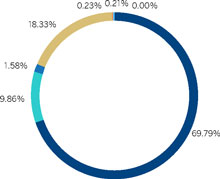
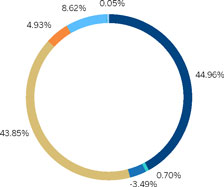
| BBVA. PILLAR III 2020 | 4. LEVERAGE RATIO | P. 127 |
4.1. | 128 | |||||
4.2. | 129 | |||||
4.3. | 130 | |||||
| BBVA. PILLAR III 2020 | 4. LEVERAGE RATIO | P. 128 |
4.1. Leverage Ratio definition and composition
The leverage ratio (LR) is a regulatory measure (not risk-based) complementing capital designed to guarantee the soundness and financial strength of institutions in terms of indebtedness.
In January 2014, the Basel Committee on Banking Supervision published the final version of the “Basel III leverage ratio framework and disclosure requirements”, which has been included through a delegated act that amends the definition of leverage ratio in the CRR regulation.
Pursuant to Article 451, section 2 of the CRR, on June 15, 2015 the EBA published the final draft of the Implementing Technical Standard (ITS) on disclosures of the Leverage Ratio for breaking down the leverage ratio, which has been applied in this report.
The leverage ratio is defined as the quotient of eligible Tier 1 bank capital and exposure.
Described below are the elements making up the leverage ratio, in accordance with the “EBA final draft Implementing Technical Standards on disclosure of the leverage ratio under Article 451(2) of Regulation (EU) No. 575/2013 (Capital Requirements Regulation – CRR)—Second submission following the EC’s Delegated Act specifying the LR” published by the EBA on June 15, 2015:
| • | Tier 1 capital (letter h in the following table): Section 2.2. of this Document presents details of the bank capital, calculated based on the criteria defined in the CRR. |
| • | Exposure: As set out in Article 429 of the CRR, the exposure measurement generally follows the book value subject to the following considerations: |
| • | On-balance sheet exposure other than derivatives is included net of allowances and accounting valuation adjustments. |
| • | Measurement of the Group’s total exposure is composed of the total assets as per financial statements adjusted for reconciliation between the accounting perimeter and the prudential perimeter. |
Total exposure for the purpose of calculating the Group’s leverage ratio is composed by the sum of the following items:
| • | Asset Balance: the asset balance corresponding to the financial statements. |
| • | Adjustments for reconciliation between the accounting perimeter and the solvency perimeter: the balance resulting from the difference between the accounting balance sheet and the regulatory balance sheet is included. |
| • | Exposure in derivatives: in adittion to the account balance (or replacement cost), which is adjusted by the cash variation margin, the netting effects (as permitted by the CRR) and the notional cash amounts, the exposure also includes and add-on to collect the future potential credit risk. |
| • | Securities Financing Transactions (SFTs): as well as the book value, the difference between this and the exposure value is included, corresponding to an additional counterparty risk surcharge, determined in accordance with Article 429 of the CRR. |
| • | Off-balance sheet items: these correspond to risk and contingent liabilities and commitments, mainly collateral and undrawn balances. A minimum floor is applied to conversion factors (CCFs) of 10% in line with the provisions of CRR Article 429.10 (a). |
| • | Tier 1 deductions: all those amounts of assets that have been deducted in the determination of the eligible Tier 1 capital are deducted, in order not to duplicate exposure. The main deductions are intangible assets, loss carry forwards and other deductions defined in Article 36 of the CRR and indicated in section 2.1 of this report. Also, as of 31 December 2020, the temporary exemption of certain exposures to central banks was included as a mitigation measure introduced by the European Parliament through the Quick Fix. |
The table below shows a breakdown of the items making up the leverage ratio as of December 31, 2020 and December 31,
2019.
| BBVA. PILLAR III 2020 | 4. LEVERAGE RATIO | P. 129 |
Table 85. LRSum—Summary reconciliation of accounting assets and exposure corresponding to the Leverage Ratio (Million Euros)
Summary table of accounting assets and leverage ratio exposure conciliation | 12-31-2020 Phased-in | 12-31-2020 Fully Loaded | 12-31-2019 Phased-in | 12-31-2019 Fully Loaded | ||||||||||||
(a) Total assets as published financial statements | 736,176 | 736,176 | 698,690 | 698,690 | ||||||||||||
(b) Adjustment for entities which are consolidated for accounting purposes but are outside the scope of regulatory consolidation | (20,326 | ) | (20,326 | ) | (21,636 | ) | (21,636 | ) | ||||||||
(Adjustment for fiduciary assets recognised on the balance sheet pursuant to the operative accounting framework but excluded from the leverage ratio exposure measure in accordance with Article 429 (13) of Regulation (EU) No 575/2013) | — | — | — | — | ||||||||||||
(c) Adjustments for derivative financial instruments | (13,858 | ) | (13,858 | ) | (7,124 | ) | (7,124 | ) | ||||||||
(d) Adjustments for securities financing transactions “SFTs” | 1,992 | 1,992 | 1,840 | 1,840 | ||||||||||||
(e) Adjustment for off-balance sheet items(1) | 67,758 | 67,758 | 67,165 | 67,165 | ||||||||||||
(f) (Adjustment for intragroup exposures excluded from the leverage ratio exposure measure in accordance with Article 429 (7) of Regulation (EU) No 575/2013) | — | — | — | — | ||||||||||||
(g) (Adjustment for exposures excluded from the total exposure measure corresponding to the leverage ratio under Article 429(14) of Regulation (EU) No 575/2013) | (26,456 | ) | (26,456 | ) | — | — | ||||||||||
(h) Other adjustments | (4,191 | ) | (5,788 | ) | (7,847 | ) | (8,656 | ) | ||||||||
|
|
|
|
|
|
|
| |||||||||
Leverage ratio total exposure measure(2) | 741,095 | 739,497 | 731,087 | 730,279 | ||||||||||||
|
|
|
|
|
|
|
| |||||||||
(i) Capital Tier 1 | 49,597 | 48,012 | 49,701 | 48,775 | ||||||||||||
|
|
|
|
|
|
|
| |||||||||
Leverage ratio | 6.69 | % | 6.49 | % | 6.80 | % | 6.68 | % | ||||||||
|
|
|
|
|
|
|
| |||||||||
| (1) | Corresponds to the off-balance sheet exposure after applying the conversion factors obtained in accordance with Article 429(10) of the CRR. |
| (2) | Excluding the temporary exemption of certain exposures to Central Banks, the total exposure would amount to €767,551 million, with a phased-in leverage ratio of 6.46%. |
The phased-in leverage ratio as of December 2020 stands at 6.7% (6.5% in fully loaded terms), up 1 basis point from September 2020. The reasons for this change are:
| • | Tier 1 capital increased in the fourth quarter by €1,349 million (+19 basis points), mainly due to the increase in attributable profit net of dividends and CoCo remuneration payments (€843 million) and the reduction in the amount to be deducted for software (€740 million). |
| • | Total exposure increased by €18,874 million compared to the third quarter of 2020 (-17 basis points), mainly due to the increase in the exposure values of assets (€11,206 million) and off-balance-sheet items (€965 million), as well as the reduction in the counterparty credit risk exposure value (€ -951 million) of financial assets held for trading (derivatives and asset repurchase operations). In addition to the evolution of the balance sheet items, the amount of exposure excluded from the measurement of the total exposure has reduced by €7,654 million. |
The leverage level reflects the nature of the business model that is geared toward the retail sector.
Chart 27. Trends in the leverage ratio
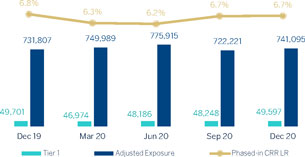
| BBVA. PILLAR III 2020 | 4. LEVERAGE RATIO | P. 130 |
The activities making up the Group’s regulatory reporting include monthly measurement and control of the leverage ratio by assessing and monitoring this measurement in its more restrictive version (fully loaded), to guarantee that leverage remains far from the minimum levels (which could be considered risky levels), without undermining the return on investment.
The estimates and development of the leverage ratio are reported on a regular basis to different governing bodies and committees to guarantee adequate control of the entity’s leverage levels and ongoing monitoring of the main capital indicators.
In line with the risk appetite framework and structural risk management, the Group operates by establishing limits and operational measures to achieve a sustainable development and growth of the balance sheet, maintaining tolerable risk levels at all times. This can be seen in the fact that the regulatory leverage level itself is well above the minimum required levels.
| BBVA. PILLAR III 2020 | 5. INFORMATION ON REMUNERATION | P. 131 |
5. Information on remuneration
| BBVA. PILLAR III 2020 | 5. INFORMATION ON REMUNERATION | P. 132 |
In accordance with Article 85 of Act 10/2014, of June 26, on the regulation, supervision and solvency of credit institutions (the “LOSS”), and in Article 93 of Royal Decree 84/2015, of February 13 implementing said Act, and pursuant to the provisions of Bank of Spain Circular 2/2016 of February 2, to credit institutions, on supervision and solvency, completing the adaptation of the Spanish legal system to Directive 2013/36/ EU and Regulation (EU) No. 575/2013 (the “Bank of Spain
Circular 2/2016”), credit institutions shall provide to the public and periodically update it, at least once a year, inter alia, information concerning their remuneration policies and practices established in section eight of Regulation 575/2013/ EU, in relation to those categories of staff whose professional activities have a significant impact on the Group’s risk profile (hereinafter, the “Identified Staff” or “Risk Takers”).
5.1. Information on the decision-making process used to establish the remuneration policy for the Identified Staff
In accordance with the provisions contained in BBVA’s Bylaws, the BBVA Board of Directors Regulations grants to this body, among others, the powers to approve the remuneration policy of directors, for submission to the General Meeting, that of senior management and the rest of the Identified Staff as well as the determination of the remuneration of non-executive directors and, in the case of executive directors, the corresponding remuneration for their executive functions and the remaining conditions to be respected in their contracts.
In addition, among the Committees constituted to support the Board in carrying out its duties, the Remunerations Committee is the body which assists it in remunerations matters related to directors, senior management and the rest of the Identified Staff, ensuring observance of the remuneration policies established.
Thus, in accordance with Article 5 of the Remunerations Committee Regulations, and without prejudice to any other functions assigned to it by law, the internal rules of the Bank or assigned to it by decision of the Board, the Remunerations Committee performs, on a general basis, the following functions:
| 1. | Propose directors’ remuneration policy to the Board, for submission to the General Meeting, likewise submitting the corresponding report, in the terms established by applicable law at any time. |
| 2. | Determine the remuneration of non-executive directors, as provided for in the director’s remuneration policy, submitting the corresponding proposals to the Board. |
| 3. | Determine, the extent and amount of individual remunerations, rights and other economic rewards, as well as the remaining contractual conditions for executive directors, so that these can be contractually agreed, in line with the director’s remuneration policy, submitting the corresponding proposals to the Board. |
| 4. | Determine the objectives and criteria for measuring the variable remuneration of the executive directors and assess their degree of achievement thereof, submitting the corresponding proposals to the Board. |
| 5. | Analyze, where appropriate, the need to make ex ante or ex post adjustments to variable remuneration, including the application of reduction or recovery clauses for variable remuneration, submitting the corresponding proposals to the Board, prior report of the corresponding committees in each case. |
| 6. | Annually submit the proposal of the annual report on the remuneration of the Bank’s directors to the Board, which will be submitted to the Annual General Shareholders’ Meeting in accordance with the provisions of the applicable law. |
| 7. | Propose to the Board the remuneration policy for senior managers and other employees of the Identified Staff; and oversee its implementation, including the supervision of the process for the identification of the abovementioned Staff. |
| 8. | Submit a proposal to the Board of Directors the Group’s remuneration policy, which may include that of the senior managers and the rest of the Identified Staff, as indicated in the previous paragraph and oversee its implementation. |
| 9. | Submit to the Board the basic contractual conditions for senior managers, including their remuneration and severance in the event of termination. |
| 10. | Directly supervise the remuneration of senior managers. |
| 11. | Ensure observance with the remuneration policies established by the Entity and review them periodically, proposing modifications, where appropriate, to ensure, among other things, that they are adequate to attract and retain the best professionals, so that they contribute to the creation of long-term value and to adequate control and management of risks, and that they attend to the principle of pay equity. In particular, ensure that the remuneration policies established by the Entity are subject to internal, central and independent review at least once a year. |
| BBVA. PILLAR III 2020 | 5. INFORMATION ON REMUNERATION | P. 133 |
| 12. | Verify all information concerning the remuneration of directors and senior managers contained in the various corporate documents, including the annual report on the remuneration of directors. |
| 13. | Oversee the selection of external advisers whose advice or support is required for the performance of their functions in remuneration matters, ensuring that any potential conflicts of interest do not impair the independence of the advice provided. |
At the end of 2020 financial year, the Remunerations Committee is composed of five members; all of them have the status of non-executive directors, with the majority being independent, including the Chair. The names, positions and conditions of the members of the Remunerations Committee are detailed in the following table:
Table 86. Composition of the Remunerations Committee
Name and surname(s) | Position | Status | ||
| Ms. Belén Garijo López | Chair | Independent | ||
| Ms. Lourdes Máiz Carro | Member of the board | Independent | ||
| Ms. Ana Peralta Moreno | Member of the board | Independent | ||
| M. Carlos Salazar Lomelín | Member of the board | External | ||
| M. Jan Verplancke | Member of the board | Independent |
The members of the Remunerations Committee who held such position at the end of 2020 financial year have received a total amount of 250 thousand euros for their membership. In addition, the Annual Report on BBVA Directors’ Remuneration pertaining to said financial year includes the individual remuneration of each director, broken down by remuneration items.
The Remunerations Committee performs its functions with full autonomy of operation, meeting as often as necessary to carry out its duties, headed by its Chair, and convened on a total of 4 occasions during the 2020 financial year.
In order to adequately perform its functions, the Committee uses the advice provided by the Bank’s internal services, and may also take the external advice needed to establish criteria on matters within its remit. To this end, during 2020, the Committee has relied on information provided by the leading global consulting firm on compensation of directors and senior managers, Willis Towers Watson and has received legal advice from the law firm J&A Garrigues S.L.P.
In addition, the Board’s Risks and Compliance Committee participates in the process of establishing a remuneration policy, ensuring that it is compatible with adequate and efficient risk management and does not offer incentives to take risk that might exceed the level tolerated by the Group.
Since 2011, BBVA has a specific remuneration system applicable to the members of the Identified Staff, designed within the framework of the regulations applicable to credit institutions, considering best practices and recommendations at the local and international level in this matter.
As regards the members of the Board of Directors, BBVA has a specific remuneration policy applicable to its directors (the “BBVA Directors’ Remuneration Policy”) which distinguishes between the remuneration system applicable to non-executive directors and that applicable to executive directors in accordance with the provisions of the BBVA Bylaws. The remuneration system for executive directors corresponds, in general, to that applicable to the members of the Identified Staff, of which they form a part, including certain specific characteristics derived from their status as directors. The remuneration system of non-executive directors is based on the criteria of responsibility, dedication and incompatibilities inherent to the position they hold, and consists exclusively of fixed elements, not receiving any type of variable remuneration.
As indicated above, the Remunerations Committee has among its functions the one of proposing the BBVA Directors’ Remuneration Policy to the Board, for submission to the General Meeting, likewise submitting the corresponding report, in the terms established by applicable law at any time.
The BBVA Directors’ Remuneration Policy applicable during 2020 was approved by the General Shareholders’ Meeting held on March 15, 2019 and is available on the Bank’s corporate website (www.bbva.com).
In 2021, the Board of Directors, at the proposal of the Remunerations Committee has resolved to approve a new policy for its application during the 2021, 2022 and 2023 financial years, which will be submitted for approval to the Annual General Shareholders’ Meeting to be held on 2021.
With regard to the rest of the Identified Staff, it is also the responsibility of the Remunerations Committee to submit to the Board the remuneration policy for senior managers and other employees who are members of this Staff in the Group.
The remuneration policy applicable to the Identified Staff within the Group, including Senior Management, was last updated in 2017, in order to adapt it to the requirements established in the applicable regulations, and particularly the Bank of Spain Circular 2/2016 and the European Banking Authority Guidelines on sound remuneration policies of June 27, 2016.
This policy is integrated within the remuneration policy applicable in general to the entire staff of BBVA and the subsidiaries that form part of its consolidated group (hereafter, the “BBVA Group Remuneration Policy”) and includes, in a specific chapter, the special characteristics of the remuneration system applicable to the members of the Identified Staff of the Group, as well as the procedure for their identification, in accordance with that established in the applicable regulations, as detailed in the following sections.
| BBVA. PILLAR III 2020 | 5. INFORMATION ON REMUNERATION | P. 134 |
The BBVA Group Remuneration Policy, approved by the Board upon the proposal of the Remunerations Committee, is coordinated at the corporate level by BBVA’s Talent and Culture area, and the supervisory functions of the Group actively and regularly cooperate in its design and oversight, in accordance with the powers conferred to them by applicable legislation. Thus, the Board of Directors periodically reviews the general principles of the Policy and oversees its implementation, based on the information and reports received from the Talent and Culture area and the various corresponding control functions, thus guaranteeing that this Policy is applied properly and in a manner consistent with BBVA’s corporate governance system.
Thus, as indicated above, BBVA employs a decision-making system in the field of remuneration, which features the Remunerations Committee as its central element, which, as stated, is in charge of determining both the remuneration policy applicable to the Identified Staff and the board members’ remuneration policy, and submitting the corresponding proposals for approval to the Board, for its subsequent submission to the General Shareholders’ Meeting in the later case.
Over the course of the 2020 financial year, the Remuneration Committee has analysed the remuneration proposals needed for the development and implementation of these remuneration policies. However, during 2020, the Committee’s activity has been necessarily affected by the crisis generated by the COVID-19 pandemic, as set forth below.
In this sense, over the first months of 2020 financial year, the Remunerations Committee, carried out its ordinary activities regarding remunerations, submitting to the Board, among others, the proposals relating to the settlement and payment system of the Annual Variable Remuneration accrued during the last closed financial year, that is, 2019, according to the result of the indicators established based on the corresponding objectives and achievement scales; as well as the necessary proposals for the settlement of 2020 financial year remuneration.
Thus, the Committee determined the annual performance indicators which would be used for the calculation of the 2020 Annual Variable Remuneration of the executive directors and its corresponding weightings, submitting the corresponding proposals to the Board for approval. Likewise, the Remunerations Committee determined the multi-year performance indicators which would be used for the settlement of the 2020 financial year Annual Variable Remuneration deferred part of the executive directors and the rest of the members of the Identified Staff, including Senior Management, and its corresponding weightings, having, for this purpose, the previous analysis carried out by the Risk and Compliance Committee, which ensured its adequacy to the Bank’s risk profile. In addition, over the first months of 2020, the Remunerations Committee submitted the proposal to the Board for its submission to the 2020 General Shareholders’ Meeting regarding the increase of the maximum variable remuneration level of up to 200% of the fixed component of the total remuneration for a certain group of employees whose professional activities have a significant impact on the Group’s risk profile, and also submitted to the Board the Report that accompanies this agreement and which was made available to the shareholders of the Bank.
Likewise, in accordance with the proposal raised by the Remunerations Committee, the Board approved the Annual Report on Remuneration of the Directors of BBVA, developed in accordance with Circular 1/2018 of the National Securities Market Commission, which was submitted to an advisory vote on the General Shareholders’ Meeting held in 2020, pursuant to Article 541 of the Corporate Enterprises Act, and which was available on the Bank’s corporate website (www. bbva.com) from the date on which the General Shareholders’ Meeting was convened.
The Annual Report on the Remuneration of BBVA Directors contains a description of the basic principles of the remuneration policy of the Bank with regard to members of the Board, both executive and non-executive, as well as a detailed presentation of the various elements and amounts that make up their remuneration.
In March 2020, after the holding of the General Shareholders’ Meetings, the healthcare crisis due to the spread of the COVID-19 was triggered. This substantially conditioned the Remunerations Committee activity planned for the remainder of the year, as well as that of the rest of the Bank’s corporate bodies.
In particular, in that moment, taking into consideration the exceptional circumstances derived from the COVID-19 crisis and as a gesture of responsibility and commitment towards clients, shareholders, employees and to society as a whole, 330 members of the Identified Staff, including executive directors and members of the Senior Management, waived the generation of the Annual Variable Remuneration corresponding to 2020 financial year.
In the case of the executive directors and members of the Senior Management, that waiver covered the whole of the Annual Variable Remuneration that they could have accrued. Conversely, in the case of the rest of the members of the Identified Staff, the waiver was total or partial, depending on their specific conditions and circumstances.
The Remunerations Committee analysed both the waiver to the accrual of 2020 financial year Annual Variable Remuneration itself, as well as the consequences derived from it.
In this context, the Remunerations Committee equally analysed the minimum thresholds of Attributed Profit and Capital Ratio established as ex ante adjustments to determine the accrual, as the case may be, of Annual Variable Remuneration for the 2020 financial year of both those members of the Identified Staff who did not waived it in full and of the rest of the Group’s staff, all of which was likewise duly reported to the Board.
In addition, while performing its functions, during 2020 financial year, the Committee, has received information on the impact that COVID-19 has had on the variable remuneration of other banking entities from the Bank’s footprint.
| BBVA. PILLAR III 2020 | 5. INFORMATION ON REMUNERATION | P. 135 |
On the other hand, within the framework of the function attributed to the Remunerations Committee for the observance and periodic review of the established remuneration policy applicable to the Identified Staff, it has carried out the review of the BBVA Group Remuneration Policy in the 2019 financial year, in accordance with applicable regulations and recommendations. To this end, this review has analysed the BBVA Group Remuneration Policy, which includes the remuneration policy of the Identified Staff, as well as their identification process, based on the central and independent internal review carried out by the Bank’s Internal Audit area, with the foregoing being duly reported to the Board.
The Committee has also received information on the application of the identification process of the Identified Staff in the BBVA Group in the 2020 financial year from the technical areas of the Bank, in accordance with the criteria established under the applicable regulations and the internal criteria established by the Bank, including both the number of persons included in the Identified Staff and the information involving the excluded members, duly reporting on such to the Board.
Finally, the Committee has been informed of the main regulatory changes which it was foreseen that would entry into force in 2021 and that may affect the remuneration policies approved by the Bank. In this sense, the Committee has analysed the approaches for the update of the Directors’ Remuneration Policy to adapt it to the regulatory changes and to the most recent market practices and recommendations regarding remuneration, which, in the end, has led to the approval by the Board of a new Policy that, as stated before, will be submitted, in turn, for approval to the 2021 Annual General Shareholders’ Meeting.
All of the issues discussed above, along with other matters within its scope, are detailed in the Remunerations Committee Activity Report for the 2020 financial year, published on the Bank’s corporate website on the occasion of the calling of the 2021 Annual General Meeting (www.bbva.com).
5.2. Description of the different types of employees included in the Identified Staff
In accordance with the BBVA Group’s Remuneration Policy, the selection of the persons who make up the Identified Staff within the Group is part of an annual process, the determination of which is based on the qualitative and quantitative criteria established under the (EU) Delegated Regulations No. 604/2014 of March 4, 2014 supplementing Directive 2013/36/EU of the European Parliament and of the Council as regards regulatory technical standards in relation to the qualitative criteria and appropriate quantitative criteria to identify categories of staff whose professional activities have material impact on an institution’s risk profile(the “Delegated Regulation 604/2014”). This process also includes internal criteria established by BBVA, complementary to those indicated in said Regulation, in compliance with Rule 38 of Bank of Spain Circular 2/2016 (hereinafter, the “Identification Process”).
The qualitative criteria established in the Identification Process are defined based on the responsibility of the position (for example, members of the BBVA Board of Directors, members of BBVA Senior Management, personnel responsible for control functions and other key functions or significant business units within the Group), as well as on the basis of the staff’s capacity or responsibility to assume or manage risk.
The quantitative criteria establishes that employees have
a significant impact on the Group’s risk profile based on the total remuneration granted, unless BBVA determines that, in fact, the activity of such personnel has no significant impact on the risk profile, in accordance with the provisions contained in Article 4 of Delegated Regulation 604/2014. In relation to the quantitative criteria, the Identification Process shall take into account the total remuneration granted in the previous financial year or that which is established by the applicable rules at all times.
The Identification Process is updated during the year and takes all BBVA Group personnel into consideration, allowing the inclusion of personnel in the Identified Staff who meet or are likely to meet the qualitative criteria established under Article 3 of Delegated Regulation 604/2014 for at least three months out of a given financial year.
All the companies that form part of the BBVA Group will actively participate in the Identification Process carried out by BBVA, providing all information necessary in order to adequately identify the personnel having a significant impact on the Group’s risk profile.
In accordance with the Identification Process previously indicated, a total of 591 Risk Takers were identified at year-end 2020, including:
| • | Members of the BBVA Board of Directors11. |
| 11. | Regarding non-executive directors, they are defined as Risk Takers by virtue of the provisions of Article 3 of Delegated Regulation 604/2014, although, as detailed in Section 5.3, below, they are subject to a specific remuneration system, different from the one applicable to executive directors and they do not receive variable remuneration |
| BBVA. PILLAR III 2020 | 5. INFORMATION ON REMUNERATION | P. 136 |
| • | Members of BBVA Senior Management. |
| • | Risk Takers by function: team defined by the functions that correspond to the qualitative criteria established under Article 3 of Delegated Regulation 604/2014 of the European Commission, between points 4 and 15, both inclusive, as well as those Risk Takers identified according to Bank criteria. |
| • | Risk Takers by remuneration: composed of those employees who meet the quantitative criteria of Article 4 of the aforementioned Delegated Regulation EU 604/2014. |
The total number of Risk Takers identified in 2020 financial year has remained at a similar level to the previous year, in which the total number of members identified amounted to 580 people; this figure has not, therefore, experienced significant changes.
Notwithstanding the foregoing, BBVA will adapt the composition of the Identified Staff, including the categories of professionals deemed necessary at any time, in accordance with the requirements established for that purpose under the terms of applicable regulations.
5.3. Key features of the remuneration system
As stated in section 5.1, in 2017, at the proposal of the Remunerations Committee , the Board approved the BBVA Group Remuneration Policy which was applicable during the 2020 financial year, which includes the remuneration system applicable to the Identified Staff, as well as the Identification Process referred to in section 5.2 above.
The BBVA Group Remuneration Policy is oriented toward the recurrent generation of value for the Group, seeking, at the same time, alignment of the interests of its employees and shareholders with sound risk management.
This policy is one of the elements designed by the Board as part of BBVA’s Corporate Governance System to guarantee adequate management of the Group and it is based on the following principles:
| • | the creation of long-term value; |
| • | rewarding the achievement of results based on prudent and responsible risk-taking; |
| • | attracting and retaining the best professionals; |
| • | rewarding the level of responsibility and career path; |
| • | ensuring internal equity and external competitiveness; and |
| • | ensuring transparency of the remuneration model. |
Based on the general principles mentioned above, BBVA has defined the Group’s Remuneration Policy by, in addition to the necessary compliance with the legal requirements applicable to credit institutions and in the different sectors in which it operates, taking into consideration alignment with best market practices, including elements aimed at reducing exposure to excessive risk and adjusting the remuneration to the Group’s objectives, values and long-term interests.
In line with this, the policy complies with the following premises:
| • | it is compatible with and promotes sound and effective risk management, not offering incentives to encourage risk-taking that exceed the levels tolerated by BBVA Group; |
| • | it is in line with BBVA Group’s business strategy, objectives, values and long-term interests and will include measures to avoid conflicts of interest; |
| • | it clearly distinguishes the criteria for the establishment of fixed remuneration and variable remuneration; |
| • | it promotes equal treatment for all staff, not discriminating due to gender or other personal characteristics; and |
| • | it seeks to ensure that remuneration is not based exclusively or primarily on quantitative criteria and considers adequate qualitative criteria, which reflect compliance with the applicable rules. |
In accordance with the above, the remuneration scheme generally applicable to all of the Group’s employees is implemented through the following:
| a. | A fixed remuneration, which takes into account levels of responsibility, functions performed, and the professional trajectory of each employee, as well as the principles of internal equity and the value of the function in the market, constituting a relevant part of the total compensation. |
The grant and the amount of the fixed remuneration are based on predetermined and non-discretionary objective criteria.
| b. | Variable remuneration, constituted by those payments or benefits additional to the fixed remuneration, monetary or not, that are linked to variable parameters. Variable remuneration shall not limit the ability of the Group to strengthen its capital base in any way in accordance with regulatory requirements and shall consider current and future risks as well as the necessary capital and liquidity costs reflecting sustainable income and adapted to risk. |
| BBVA. PILLAR III 2020 | 5. INFORMATION ON REMUNERATION | P. 137 |
| Guaranteed variable remuneration will not make up part of the Group’s variable remuneration models in any form. BBVA may only grant guaranteed variable remuneration on an exceptional basis, and solely within the framework of the conditions established under applicable regulations. |
Within this remuneration model for general application, the BBVA Group Remuneration Policy includes certain special characteristics applicable, on the one hand, to staff who exercise supervisory functions and, on the other hand, to personnel involved in the provision of services to clients. Thus:
| i. | Staff who exercise control functions are independent of the business units that they supervise, have the necessary authority, and are remunerated according to the achievement of certain objectives related to their functions, regardless of the results of the business areas that they supervise. |
In order to reinforce the independence and objectivity of these functions, the fixed components of their remuneration have a greater weight than that of the variable components, the latter being related, for the most part, to the objectives of the function.
In addition, the remuneration of BBVA senior managers in independent control functions, including compliance and risk management functions, is directly overseen by the BBVA Remunerations Committee, as well as that of the other members of Senior Management.
| ii. | In designing and establishing the remuneration of the staff involved in the provision of services to clients, care must be taken to protect their interests and the quality of the services provided, so that: |
| • | responsible business conduct and fair treatment of clients is encouraged; |
| • | no incentives should be established that could induce staff to put their own interests or those of the BBVA Group in possible opposition to the interests of their clients; |
| • | remuneration is not linked primarily or exclusively with the sale of a product or a particular category or type of products, such as certain products that are more profitable for the entity or the employee, with other factors coming into play such as the needs of the client, without one objective being assigned greater weight in the determination of remuneration; and |
| • | an adequate balance is maintained between the fixed and variable components of remuneration. |
Based on the principles and premises mentioned above, and in compliance with the regulatory requirements established by the LOSS and its development regulations, BBVA has defined the particularities of the remuneration policy applicable to the Identified Staff, designing an incentive system specifically oriented to maintain the alignment of their remuneration with risks, as well as with the Group’s long-term
objectives and interests. The result is a remuneration scheme for the Identified Staff based on the following fundamental characteristics:
| • | Balance between the fixed components and the variable components of the overall remuneration, in line with that established in the applicable regulations, allowing a fully flexible policy regarding the payment of variable components, which may cause them to be reduced, depending on the situation, up to their entirety. The proportion between the two components has been established taking into account the type of functions carried out by each beneficiary (business, support or supervision) and, consequently, their impact on the Group’s risk profile, adapting to the reality existing in the different countries or functions in each particular case. |
| • | The variable remuneration of the members of the Identified Staff will be based on an effective management of the risk and linked to the degree of achievement of previously established financial and non-financial objectives, as defined at the Group, Area and Individual level, taking into account current and future risks assumed and the Group’s long-term interests. |
| • | Variable remuneration of Identified Staff members for each financial year is subject to ex ante adjustments, so that it shall be reduced at the time of the performance of their role in the event of negative performance of the Group’s results or other parameters such as the level of achievements of budgeted targets, and it will not accrue, or will accrue in a reduced amount, should a certain level of profit and capital ratios not be obtained. |
| • | The calculation of the annual variable remuneration for each member of the Identified Staff will be performed on the basis of: (i) annual performance indicators of the Group, area, and individual (financial and non-financial); (ii) the corresponding achievement scales, according to the weighting allocated to each indicator; and (iii) an “target” annual variable remuneration, which represents the amount of annual variable remuneration if 100% of the pre-established targets are met. The resulting amount will constitute the Annual Variable Remuneration of each beneficiary. |
| • | The financial and non-financial indicators for the annual performance will be aligned with the Group’s most relevant management metrics and related to strategic priorities. |
| • | In the event of termination of the contractual relationship of a member of the Identified Staff before the closing date of the financial year to which the Annual Variable Remuneration has accrued, the latter shall be entitled to receive, if conditions are met, the proportional installment of said Annual Variable Remuneration, calculated pro rata for the length of the service during said financial year and being subject, in any case, to the same system of settlement and payment that would be applicable if it had remained active, in accordance with the rules indicated below. The foregoing shall not apply to the circumstances of termination of the contractual relationship due to voluntary resignation or lawful dismissal, in which case the employee shall not be eligible for Annual Variable Remuneration. |
| BBVA. PILLAR III 2020 | 5. INFORMATION ON REMUNERATION | P. 138 |
| • | The Annual Variable Remuneration for the members of the Identified Staff shall be subject to specific rules of settlement and payment, and in particular: |
| • | 60% of the Annual Variable Remuneration will be paid, if the conditions are met during the following financial year (the “Upfront Portion”). For executive directors, members of Senior Management and those members of the Identified Staff with variable remunerations of particularly high amounts, the Upfront Portion will correspond to 40% of the overall Annual Variable Remuneration. |
| • | The remaining part will be deferred over time (hereinafter the “Deferred Portion”) for a period of 5 years, for executive directors and Senior Management, and 3 years for the remaining risk takers. |
| • | 50% of the Annual Variable Remuneration, both of the Upfront and Deferred Portion, will be fixed in BBVA shares. For executive directors and members of Senior Management, 60% of the Deferred Portion will be fixed in shares. |
| • | Shares received as Annual Variable Remuneration will be withheld for a period of one year after delivery, except for those shares which sale would be required to honour the payment of taxes accruing on the shares delivered. |
| • | The Deferred Portion of the Annual Variable Remuneration may be reduced even in its entirety, but never increased, based on the result of multi-year performance indicators aligned with the Group’s core risk management and control metrics related to solvency, capital, liquidity or profitability, or to the share performance and recurring Group’s results. |
The multi-year performance indicators are approved by the Board, at the proposal of the Remunerations Committee, and subsequent to analysis by the Risk and Compliance Committee, which ensures that they are adequate to align differed remuneration with prudent risk management.
The multi-year performance indicators approved for 2020 financial year are as follows:
Table 87. Multi-year performance indicators
Indicator | Weight | |||
Common Equity Tier (CET ) 1 fully loaded | 40 | % | ||
Liquidity Coverage Ratio (LCR) | 20 | % | ||
Return on Equity (ROE) | 30 | % | ||
Total Shareholder Return (TSR) | 10 | % | ||
These indicators are associated with scales of achievement, which are approved by the Board at the proposal of the Remunerations Committee , so that, if the objectives established for each of the indicators
are not achieved in the three-year measurement period from the beginning of the deferral period, the Deferred Portion of the Annual Variable Remuneration of 2020 of those members of the Identified Staff who had accrued it, may be reduced, even in its entirety, but never be increased.
In the case of executive directors and members of Senior Management, neither the multi-year performance indicators nor the said scales are applicable during this financial year, as no Annual Variable Remuneration has been generated by them in 2020.
| • | The cash amounts of the Deferred Portion of the Annual Variable Remuneration subject to the multi-year performance indicators, which are finally paid, will be updated by applying the Consumer Price Index (CPI) measured as the year-on-year change in prices, in accordance with that established by the Board of Directors. |
| • | The entire Annual Variable Remuneration that is accrued will be subject to malus and clawback arrangements throughout the whole deferral and retention period, under the terms indicated below. |
| • | No personal hedging strategies or insurance may be used in connection with remuneration and liability that may undermine the effects of alignment with prudent risk management. |
| • | The variable component of the remuneration corresponding to a financial year shall be limited to a maximum amount of 100% of the fixed component of the total remuneration, unless the General Shareholders’ Meeting resolves to increase such percentage up to a maximum of 200%. As explained in detail in section 5.7 of this report, the General Meeting held on March 13, 2020 authorised the increase of this threshold, up to 200%, to a maximum of 339 Risk Takers. |
In addition, as regards executive directors, the BBVA Directors’ Remuneration Policy also provides that, upon receipt of the shares, executive directors will not be allowed to transfer a number of shares equivalent to twice their annual fixed remuneration for at least three years after their delivery.
In addition, as indicated above, up to 100% of the Annual Variable Remuneration of each member of the Identified Staff corresponding to each year will be subject to malus and clawback arrangements, both linked to a downturn in financial performance of the Bank as a whole, or of a specific unit or area, or of exposures generated by a member of the Identified Staff, when such downturn in financial performance arises from any of the following circumstances:
| a. | Misconduct, fraud or serious infringement of the Code of Conduct and other applicable internal regulations by the member of the Identified Staff. |
| b. | Regulatory sanctions or judicial convictions due to events that could be attributable to a specific unit or to the staff responsible for such events. |
| BBVA. PILLAR III 2020 | 5. INFORMATION ON REMUNERATION | P. 139 |
| c. | Significant failures of risk management committed by the Bank or by a business or risk control unit, to which the wilful misconduct or gross negligence of the member of the Identified Staff was a contributing factor. |
| d. | Restatement of the Bank’s annual accounts, except where such restatements is due to a change in applicable accounting regulations. |
To this end, the Bank will compare the performance assessment carried out for the member of the Identified Staff with the ex post behavior of some of the criteria that contributed to achieve the targets. Both malus and clawback will apply to the Annual Variable Remuneration corresponding to the year in which the event giving rise to the application of the arrangement occurred, and will remain in force during the deferral and retention period applicable to said Annual Variable Remuneration.
Notwithstanding the foregoing, in the event that the above scenarios give rise to a dismissal or termination of contract due to serious and guilty breach of duties of the member of the Identified Staff, malus arrangements may apply to the entire deferred Annual Variable Remuneration pending payment at the date on which the dismissal or termination decision is adopted, in light of the extent of the damage caused.
In any case, variable remuneration will be paid or will vest only if it is sustainable in accordance with the situation of the BBVA Group as a whole, and if justified based on the results of the Bank, the business unit, and the member of the Identified Staff concerned.
On the other hand, in accordance with the provisions of the BBVA Group’s Remuneration Policy and in line with applicable regulations, payments to members of the Identified Staff due to early termination of a contract with will be based on the results obtained over time. Under no circumstances will poor results or misconduct be rewarded, and compensation may not be granted in cases where there have been clear and serious breaches that justify the immediate termination of the contract or the dismissal of the member of the Identified Staff. With regard to BBVA directors, the Bank has no commitments to make severance payments.
As regards the pension policy, this shall remain compatible at all times with the entity’s long-term business strategy, objectives and interests. To this end, BBVA maintains a pension system, which is arranged based on the geographies and coverage offered to different groups of employees. In general, the Bank’s pension schemes to cover the retirement contingency are defined-contribution. Contributions to the pension schemes of the Group’s employees will be carried out within the framework of applicable labor regulations and individual or group agreements applicable in each entity, sector or geographic area. BBVA determines the characteristics of the pension commitments based on the different professional categories of employees, including the pensionable salary.
The basis for the calculation of the benefits (commitments for retirement, death and disability) reflect fixed annual amounts; no temporary fluctuations exist derived from variable components or individual results.
With regard to executive directors and members of Senior Management, these shall be subject to the specificities set out in applicable regulations regarding “discretionary pension benefits.” Thus, 15% of the annual contributions agreed to cover the pension commitments will be based on variable components, and will be considered as “discretionary pension benefits”, subject to share delivery, retention and clawback conditions established under applicable regulations and remuneration policies. Detailed information on the implementation of the obligations contracted in terms of pensions during the financial year can be found in Note 54 of the Annual Report corresponding to the Bank’s Consolidated Financial Statements for the year 2020, which is available on the Bank’s corporate website (www.bbva.com).
With regard to BBVA’s non-executive directors, a detailed description of its remuneration system is included in the Directors’ Remuneration Policy. A description of the implementation of this system is outlined in the Annual Report on the Remuneration of BBVA Directors for 2020, both documents are available on the Bank’s corporate website (www.bbva.com).
As set out in those documents, non-executive directors do not receive variable remuneration; they receive a fixed annual amount in cash as member of the Board and of the various committees, where applicable, as well as for the performance of any other functions or responsibilities that may be attributed to them in the framework of the Bank’s corporate governance system. The relative amount of remuneration shall be set by the Board, at the proposal of the Remunerations Committee, depending on the nature of the assigned functions and the dedication and responsibility required in each case.
In addition, the Bank has a remuneration system in BBVA shares with deferred delivery to non-executive directors, which has been approved by the General Meeting. This system comprises the annual allocation to non-executive directors, as part of their fixed remuneration, of a number of “theoretical shares” of the Bank, which will vest, where applicable, after they cease to be directors on grounds other than serious breach of duties. The annual number of “theoretical shares” to be allocated to each non-executive director shall be equivalent to 20% their total remuneration in cash received the previous year, according to the average closing prices of the BBVA share during the 60 trading sessions prior to the Annual General Shareholders’ Meetings approving the corresponding financial statements for each financial year.
| BBVA. PILLAR III 2020 | 5. INFORMATION ON REMUNERATION | P. 140 |
5.4. Information on the connection between the remuneration of the Identified Staff and the Group’s performance
As explained in the preceding sections, the BBVA Group’s Remuneration Policy provides for the entitlement by the members of the Identified Staff to an Annual Variable Remuneration, whose accrual is subject to ex ante adjustments and the amount of which is calculated on the basis of the achievement of the objectives established at the beginning of the year for each of the annual performance indicators, according to the scales and weights associated with each of them. In this way, the amount of variable remuneration received by the members of the Identified Staff is linked to the results of the BBVA Group and varies depending on them.
In the case of the members of the Identified Staff who did not waive in full the accrual of the 2020 financial year Annual
Variable Remuneration, the amount of their Annual Variable Remuneration has been determined taking into account, in addition to the results of the Group’s annual performance indicators, the level of achievement of strategic objectives (both financial and non-financial) set at the level of each area and for each individual, according to the weights associated with each indicator and that, as previously indicated, have been determined depending on the types of functions carried out by each beneficiary (business, support, or control).
During the 2020 financial year, the BBVA Group achieved a profit without extraordinary items of 3.084 million euros, which represents a decrease of 36.1 % compared to 2019 financial year. These results have been affected by the outbreak of the Covid-19 pandemic, whose main impacts were the increase in the deterioration of financial assets and higher endowments to provisions.
This profit is the figure that has been considered for incentive purposes and does not include the result of corporate transactions in relation to the bancassurance agreement reached with Allianz in Spain, which has resulted in a net capital gain of 304 million euros, and nor does it include the negative impact of 2,084 million euros derived from the accounting of the deterioration in the valuation of the BBVA USA goodwill, given that it does not affect either the net tangible equity, capital or liquidity.
Consequently, the result and evolution of the annual indicators of the 2020 Annual Variable Remuneration, included as Group indicators for the members of the Identified Staff, has been below the targets set for the financial year in three of the four financial indicators (Attributed Profit, RORC and Tangible Book Value). However, the Efficiency Ratio has been above the target set for the financial year.
In relation to non-financial indicators, the Digital Sales indicator ended the year below the established objective and, for its part, the achievement of the Customer Satisfaction Index (IreNe) has shown good results, exceeding the established objectives. The foregoing, has led to a reduction in the 2020 financial year Annual Variable Remuneration of those members of the Identified Staff who had not waived it in full, in line with the Bank’s financial situation and results.
Thus, accordingly, the Annual Variable Remuneration of the members of the Identified Staff is linked to the Group’s financial and non-financial results, all within the framework of and in accordance with the rules of the remuneration system detailed in Section 5.3 of this report.
5.5. Description of the criteria used to take into consideration present and future risk in the remuneration processes
In line with that which is set out in section 5.3 of this report, the remuneration policy applicable to Risk Takers in 2020 financial year has featured the following elements:
| • | Balance between the fixed and variable components of total remuneration. |
| • | Ex-ante adjustments, compliance with which has been verified prior to the accrual and determination of the Annual Variable Remuneration. |
| • | The use of financial indicators for the evaluation of results, which incorporate adjustments for current and future risk. |
| • | Consideration, in the measurement of the performance, of financial and non-financial measures that value both the individual management aspects and the objectives of the area and the Group. |
| BBVA. PILLAR III 2020 | 5. INFORMATION ON REMUNERATION | P. 141 |
| • | Greater weight assigned to the objectives related to specific functions in the measurement of the performance of the members with control functions, to reinforce the independence and objectivity of these functions. |
| • | At least 50% of the Annual Variable Remuneration is established in shares. |
| • | Deferral clauses, designed so that a substantial portion of the Annual Variable Remuneration – 60% in the case of risk takers with particularly high variable remuneration; and 40% in all other cases – is deferred over time, thus taking into account the economic cycle and business risks. |
| • | Incorporation of multi-year performance indicators, measured over a period of three years from the beginning of the deferral period, to which weightings have been assigned and for which scales of achievement have been established, so that, in the event that the objectives set for each indicator are not obtained, the Deferred Portion of the Annual Variable Remuneration may be reduced, even in its entirety, yet never be increased. |
| • | Mandatory retention periods of any shares delivered as Annual Variable Remuneration, so that the beneficiaries cannot freely dispose of them until one year after their delivery date, except for those which sale would be required to honour the payment of taxes accruing on the shares delivered. |
| • | Prohibition of carrying out personal hedging strategies or insurance related to remuneration and liability. |
| • | Limitation of the variable component of the remuneration for the year to 100% of the fixed component of total remuneration, except for the maximum of 339 employees for whom the BBVA General Meeting, authorised the application of a maximum ratio of 200%, as explained in detail in section 5.7 of this report. |
Submission of the entire Annual Variable Remuneration to malus and clawback arrangements during the whole deferral and retention period, under the terms indicated in Section 5.3.
5.6. Main parameters and the motivation of any component of possible variable compensation plans and other non-cash advantages
The main parameters of and motivation behind the components of the variable remuneration plans of the
Identified Staff have been set out in the previous sections of this report.
5.7. Ratios between fixed and variable remuneration of the Identified Staff
As set forth in section 5.3 above, the fixed components and the variable components of the overall remuneration of the Identified Staff are appropriately balanced, in line with applicable regulations, to ensure a policy that is fully flexible with regard to payment of the variable components, allowing for such components to be reduced even in their entirety, where appropriate.
The proportion between both components is established taking into account the type of functions carried out by each beneficiary (business, support or control) and, consequently, their impact on the risk profile, adapted in each case to the reality existing in the different countries in which the members of the Identified Staff perform their activities or functions.
To this end, the Bank has defined “target” ratios between fixed remuneration and “target” variable remuneration, which take into account both the function performed by each member of the Identified Staff as well as their impact on the risk profile.
Notwithstanding the foregoing, as set forth under applicable legislation, the variable component of the remuneration of the Identified Staff corresponding to a financial year shall be limited to a maximum amount of 100% of the fixed component of total remuneration, except for those functions for which the General Meeting resolves to increase this percentage up to a maximum of 200%.
For these purposes, the General Meeting held on March 13, 2020 resolved to raise the maximum level of the variable component of remuneration up to a maximum of 200% of the fixed component of total remuneration for certain members of the Identified Staff, in accordance with the Report issued by the Board of Directors for these purposes on February 10, 2020. Thus, the Bank submitted the following proposed resolution to the General Meeting:
| BBVA. PILLAR III 2020 | 5. INFORMATION ON REMUNERATION | P. 142 |
“For the purposes of the provisions of Article 34.1 g) of Act 10/2014 of June 26, on the regulation, supervision and solvency of credit institutions, to approve a maximum level of variable remuneration of up to 200% of the fixed component of total remuneration for a group of employees whose professional activities have significant impact on the Group’s risk profile, enabling subsidiaries of Banco Bilbao Vizcaya Argentaria, S.A., to likewise apply said maximum level to their professionals, pursuant to the Report issued in this regard by the Board of Directors of Banco Bilbao Vizcaya Argentaria, S.A., on February 10, 2020, and which has been made available to shareholders as of the date on which this General Meeting was convened”.
This resolution was approved by the General Meeting for a maximum of 339 Risk Takers, with a favorable vote of 97.23% on 66.83% of the capital present or represented at said General Meeting.
The proposal submitted to the General Shareholders’ Meeting included the detailed recommendation of the Board, explaining the reasons and scope of the decision proposed
to the General Meeting and included the number of persons affected, their positions, as well as the expected effect on maintaining a solid capital basis, taking into account the considerations established by the competent authority as regards dividend distribution policies.
As reflected in the Report of the Board, the persons for whom approval of the higher level of remuneration for 2020 financial year was requested performed one of the following functions:
| • | Members of the BBVA Board of Directors holding the position of executive directors. |
| • | Members of BBVA Senior Management. |
| • | Members of the Identified Staff who perform their functions in the business areas of Spain, the United States, Mexico, Turkey, South America countries, and Corporate and Investment Banking (CIB). |
| • | Identified Staff members who perform their functions in corporate support areas, working globally for the Group as a whole, without being attached to a business area, including activities focused on digital transformation. |
5.8. Quantitative information on remuneration of the Identified Staff
After year-end 2020, in accordance with the results obtained, described in Section 5.4 above, the Annual Variable Remuneration corresponding to said year of the members of the Identified Staff who had not waived its accrual in full was calculated.
As set forth in Sections 5.1 and 5.4 above, taking into consideration the exceptional circumstances derived from the COVID-19 crisis and as a gesture of responsibility and commitment towards clients, shareholders, employees and to society as a whole, 330 members of the Identified Staff, including executive directors and members of the Senior Management, waived the accrual of the Annual Variable Remuneration corresponding to 2020 financial year.
In the case of the executive directors and members of the Senior Management, that waiver covered the whole of the Annual Variable Remuneration that they could have accrued. Conversely, in the case of the rest of the members of the Identified Staff, the waiver was total or partial, depending on their specific conditions and circumstances.
Notwithstanding the foregoing, in accordance with the settlement and payment system of the Annual Variable Remuneration for 2020 financial year applicable to those members of the Identified Staff who had not waived its accrual in full:
| • | The Upfront Portion will be paid, if the conditions are met, in 2021, 40% in the case of members of the Identified Staff with particularly high variable remuneration amounts, and 60% for the remaining members of the Identified Staff. |
| • | The Deferred Portion will be subject to the result of multi-year performance indicators mentioned in section 5.3 of this report, to be paid, if conditions are met, in 2024. |
This gives rise, among other things, to the amounts presented in the following table, broken down by types of employees:
| BBVA. PILLAR III 2020 | 5. INFORMATION ON REMUNERATION | P. 143 |
Table 88. Remuneration of the Identified Staff for the 2020 financial year (Thousand euros or number of shares) |
Remuneration for Identified Staff in 2020 | Executive Directors(1) | Non-executive Directors(2) | Senior Management(3) | Rest of Identified Staff | Total Identified Staff | |||||||||||||||
Number of beneficiaries of fixed remuneration | 2 | 13 | 15 | 561 | 591 | |||||||||||||||
|
|
|
|
|
|
|
|
|
| |||||||||||
Amount of total fixed remuneration for 2020(4) | 6,246 | 4,172 | 15,187 | 203,908 | 229,513 | |||||||||||||||
|
|
|
|
|
|
|
|
|
| |||||||||||
Number of beneficiaries of variable remuneration | — | — | — | 420 | 420 | |||||||||||||||
|
|
|
|
|
|
|
|
|
| |||||||||||
Amount of total variable remuneration for 2020(5) | — | — | — | 38,077 | 38,077 | |||||||||||||||
In cash | — | — | — | 19,039 | 19,039 | |||||||||||||||
Number of BBVA shares | — | — | — | 4,467,719 | 4,467,719 | |||||||||||||||
Variable remuneration corresponding to 2020 payable in 2021 | — | — | — | 22,584 | 22,584 | |||||||||||||||
In cash | — | — | — | 11,292 | 11,292 | |||||||||||||||
Number of BBVA shares | — | — | — | 2,648,588 | 2,648,588 | |||||||||||||||
Outstanding deferred variable remuneration corresponding to 2020(6) | — | — | — | 15,493 | 15,493 | |||||||||||||||
In cash | — | — | — | 7,747 | 7,747 | |||||||||||||||
Number of BBVA shares | — | — | — | 1,819,131 | 1,819,131 | |||||||||||||||
| (1) | Includes the information of the executive directors who held such position as of 31 December 2020. The information relating to the executive director who ceased to hold office after the 2020 General Meeting is included in the category “Other Identified Staff”. The remuneration amounts are detailed in Note 54 of the Annual Report of BBVA’s Consolidated Financial Statements. |
| (2) | Includes information on the non-executive directors who held this position as of 31 December 2020. The information relating to the two non-executive directors who ceased to hold office after the 2020 Annual General Meeting is included in the category of “Other Identified Staff”. The remuneration amounts are detailed in Note 54 of the Annual Report of BBVA’s Consolidated Financial Statements. |
| (3) | Includes information on the members of Senior Management, excluding executive directors, who had such status as of 31 December 2020. |
| (4) | Fixed remuneration received in 2020, both in cash and in kind, except for social welfare. In the case of executive directors and Senior Management, the contributions made by the Bank in 2020 in relation to the pension commitments assumed in matters of social welfare are detailed in Note 54 of the Annual Report of BBVA’s Consolidated Financial Statements. In the case of non-executive directors have a fixed remuneration system with deferred delivery of shares after they cease to hold office. Detailed information on this system, including the number of “”theoretical shares”” allocated in 2020 (corresponding to 20% of the annual fixed allowance received in the previous year), is included in Note 54 of the Annual Report of BBVA’s Consolidated Financial Statements. |
| (5) | Includes the total variable remuneration corresponding to 2020 (including the Annual Variable Remuneration and other payments considered variable in accordance with the applicable regulations). Regarding the “discretionary pension benefits” (15% of the annual contribution agreed to cover the retirement contingency of executive directors and members of Senior Management), detailed information can be found in Note 54 of the Annual Report corresponding to BBVA’s Consolidated Financial Statements, in the section on pension commitments. |
| (6) | Includes the variable remuneration corresponding to 2020, which is deferred and pending payment. This remuneration is subject to multi-year performance indicators related to the Risk Appetite Framework and shareholder return that may reduce, even in its entirety, these deferred amounts (never increase them). |
| (*) | Provisional data from Garanti BBVA |
Table 89. Extraordinary remuneration of the Identified Staff for the 2020 financial year (Thousand euros)
Extraordinary remuneration | Executive Directors | Non-executive directors | Senior Management | Rest of Identified Staff | Total Identified Staff | |||||||||||||||
Number of beneficiaries of guaranteed bonuses | — | — | — | — | — | |||||||||||||||
|
|
|
|
|
|
|
|
|
| |||||||||||
Total amount of guarantees bonuses granted in 2020 | — | — | — | — | — | |||||||||||||||
|
|
|
|
|
|
|
|
|
| |||||||||||
Number of beneficiaries of hiring incentives | — | — | — | — | — | |||||||||||||||
|
|
|
|
|
|
|
|
|
| |||||||||||
Total amount of hiring incentives paid in 2020 | — | — | — | — | — | |||||||||||||||
|
|
|
|
|
|
|
|
|
| |||||||||||
Number of beneficiaries of severance indemnity | — | — | 1 | 22 | 23 | |||||||||||||||
|
|
|
|
|
|
|
|
|
| |||||||||||
Total amount of severance indemnity paid in 2020(1) | — | — | 2,185 | 22,163 | 24,348 | |||||||||||||||
Upfront payment | — | — | 2,185 | 19,833 | 22,018 | |||||||||||||||
Deferred amount | — | — | 0 | 2,330 | 2,330 | |||||||||||||||
| (1) | Includes the amount of the compulsory severance payment in accordance with labour regulations, as well as, if applicable, the amount in addition to this legal severance payment (which is considered variable remuneration in accordance with the solvency regulations applicable to this staff) and, if applicable, the amounts corresponding to the advance notice clauses, all in accordance with the provisions contained in the contracts of certain members of the Identified Staff. |
On the other hand, non-competition agreements have been signed with some beneficiaries for a total amount of 11,458 thousand euros, that will be paid periodically from the moment the member of the Identified Collective leaves, during the non-competition period.
Of the total severance payments made in 2020, the highest one paid to a single member amounts to €4,555,999.
In addition, in accordance with Rule 40.1 of Circular 2/2016 of the Bank of Spain, it is stated that of the 22 cases of payments for early termination of contract, none of them has exceeded two annuities of the fixed remuneration.
In addition, in 2020, the deferred amounts from previous financial years which payment was due in such financial year have been paid out. The following table shows the amounts paid in both cash and shares, as well as the deferred amounts that remain outstanding as of December 31, 2020:
| BBVA. PILLAR III 2020 | 5. INFORMATION ON REMUNERATION | P. 144 |
Table 90. Deferred variable remuneration from financial years prior to 2020 (Thousand Euros or number of shares)
Deferred variable remuneration for years prior to 2020 for the Identified Staff | Executive Directors(1) | Non-executive directors(2) | Senior Management(3) | Rest of Identified Staff | Total Identified Staff | |||||||||||||||
Vested(4) | ||||||||||||||||||||
In cash | 861 | — | 1,380 | 36,798 | 39,039 | |||||||||||||||
Number of BBVA shares | 120,244 | — | 182,461 | 3,918,195 | 4,220,900 | |||||||||||||||
Outstanding(5) | ||||||||||||||||||||
In cash | 3,282 | — | 3,235 | 57,378 | 63,896 | |||||||||||||||
Number of BBVA shares | 853,903 | — | 845,174 | 10,693,258 | 12,392,335 | |||||||||||||||
Implicit ex-post adjustments applied in the year(6) | (178 | ) | — | (270 | ) | (4,994 | ) | (5,442 | ) | |||||||||||
Explicit ex-post adjustments applied in the year(7) | (43 | ) | — | (73 | ) | (1,905 | ) | (2,021 | ) | |||||||||||
| (1) | Includes the information of the Executive Directors who held such position as of 31 December 2020. |
| (2) | Includes information on Non-Executive Directors who held such position as of 31 December 2020. |
| (3) | Includes information of the members of the Senior Management who held such position as of 31 December 2020, excluding executive directors. |
| (4) | Includes the amounts paid in 2020 of the deferred variable remuneration corresponding to previous financial years and the restatement thereof (total amount of deferred variable remuneration for 2016 including the downward adjustment for long-term indicators). In the case of the executive directors, these amounts are stated individually in Note 54 of the Annual Report of the Bank’s Consolidated Financial Statements. |
| (5) | This includes the amounts pending payment as of 31 December 2020 of deferred variable remuneration corresponding to financial years prior to 2020 (the total deferred variable remuneration for 2017, 2018 and 2019). The amounts corresponding to each executive director are as follows: |
| - | The total deferred annual variable remuneration for 2017: €675 thousand and 139,488 BBVA shares in the case of the chairman and €290 thousand and 39,796 BBVA shares in the case of the chief executive officer. |
| - | The total deferred annual variable remuneration for 2018: €574 thousand and 180,785 BBVA shares in the case of the Chairman and €295 thousand and 61,901 BBVA shares in the case of the Chief Executive Officer. |
| - | The total deferred annual variable remuneration for 2019: 763 thousand euros and 227,645 BBVA shares in the case of the Chairman; 685 thousand euros and 204,288 BBVA shares in the case of the Chief Executive Officer. |
| (6) | Adjustment derived from the decrease in the value of the deferred variable remuneration shares corresponding to previous financial years and delivered in 2020. |
| (7) | Adjustment derived from the result of the multi-year indicators, which led to a 3% reduction in the deferred amounts of the 2016 variable remuneration paid in 2020. |
The following table shows the total remuneration of the Identified Staff in 2020 by activity area:
Table 91. Remuneration of the Identified Staff for the 2020 financial year, by activity areas (Thousand Euros)
Activity area | Number of people | 2020 total remuneration(1) | Average variable/fixed ratio | |||||||||
Executive Directors(2) | 2 | 6,246 | 0 | % | ||||||||
Non-executive Directors(3) | 13 | 4,172 | 0 | % | ||||||||
Senior Management (4) | 15 | 15,187 | 0 | % | ||||||||
Commercial Banking(5) | 178 | 81,386 | 24 | % | ||||||||
Investment Banking(6) | 87 | 44,844 | 51 | % | ||||||||
Asset Management(7) | 24 | 11,146 | 50 | % | ||||||||
Corporate functions(8) | 152 | 67,268 | 11 | % | ||||||||
Control functions(9) | 118 | 37,159 | 13 | % | ||||||||
Rest(10) | 2 | 183 | 0 | % | ||||||||
|
|
|
|
|
| |||||||
Total Identified Staff | 591 | 267,590 | ||||||||||
|
|
|
|
|
| |||||||
| (1) | Fixed remuneration received in 2020 and total variable remuneration for 2020. The executive directors and other members of senior management have voluntarily waived their annual variable remuneration for 2020. For this reason, the ratio of variable over fixed is zero for all members. |
| (2) | Includes the information of the executive directors who had such status as at 31 December 2020. |
| (3) | Includes the information of the non-executive directors who were executive directors as at 31 December 2020. |
| (4) | Includes information on members of senior management who were senior executives as at 31 December 2020, excluding executive directors. |
| (5) | Includes Retail, Business, Corporate and Insurance Banking activities. |
| (6) | Includes trading and other investment banking activities. |
| (7) | Includes Asset Management and Private Banking activities. |
| (8) | Includes support areas for the BBVA Group and business support areas (Finance, Legal, Human Resources, etc.). |
| (9) | Includes Risk Management, Internal Audit and Compliance activities. |
| (10) | Other activities not included in the previous categories. Includes the two non-executive directors who stepped down in 2020. |
| (*) | Provisional data from Garanti BBVA. |
| BBVA. PILLAR III 2020 | 5. INFORMATION ON REMUNERATION | P. 145 |
On the other hand, the number of employees with a remuneration equal to or greater than 1 million euros is as follows:
Table 92. Number of individuals with total remuneration exceeding €1 million during the 2020 financial year
Total remuneration in 2020(1) | Number of individuals | |||
Between 3.5 million and 4 million euro | 1 | |||
Between 3 million and 3.5 million euro | 0 | |||
Between 2.5 million and 3 million euro | 1 | |||
Between 2 million and 2.5 million euro | 1 | |||
Between 1.5 million and 2 million euro | 3 | |||
Between 1 million and 1.5 million euro | 19 | |||
|
| |||
Total | 25 | |||
|
| |||
| (1) | Includes the sum of the fixed remuneration received in 2020 and the total variable remuneration corresponding to 2020. The part of the variable remuneration for 2020 that remains deferred is subject to multi-year indicators and targets, the level of achievement of which could reduce (but not increase) these deferred amounts and therefore the total remuneration for 2020. |
| (*) | Provisional data from Garanti BBVA. |
| BBVA. PILLAR III 2020 | 6. INFORMATION ON THE CORPORATE GOVERNANCE SYSTEM | P. 146 |
6. Information on the corporate governance system
As well as the information that has already been dealt with in this Report and in relation to the other information on the corporate governance system in Part Eight of the CRR, readers are referred to the Annual Corporate Governance Report for the 2020 financial year. This is an integral part of
the Management Report accompanying the Consolidated Financial Statements of BBVA Group and the Policy on the selection, suitability and diversity of the BBVA Board of Directors, both of which are accessible on the corporate website (www.bbva.com).
SIGNATURE
Pursuant to the requirements of the Securities Exchange Act of 1934, the registrant has duly caused this report to be signed on its behalf by the undersigned, thereunto duly authorized.
| Banco Bilbao Vizcaya Argentaria, S.A. | ||||||
| Date: March 12, 2021 | By: | /s/ Juan Carlos García Céspedes | ||||
| Name: | Juan Carlos García Céspedes | |||||
| Title: | Authorized representative | |||||