UNITED STATES SECURITIES AND EXCHANGE
COMMISSION
WASHINGTON, D.C. 20549
FORM 6-K
REPORT OF FOREIGN ISSUER PURSUANT TO RULE 13a-16 OR 15d-16
UNDER THE SECURITIES EXCHANGE ACT OF 1934
For the month of April, 2023
Commission file number: 1-10110
BANCO BILBAO VIZCAYA ARGENTARIA, S.A.
(Exact name of Registrant as specified in its charter)
BANK BILBAO VIZCAYA ARGENTARIA, S.A.
(Translation of Registrant’s name into English)
Calle Azul 4,
28050 Madrid
Spain
(Address of principal executive offices)
Indicate by check mark whether the registrant files or will file annual reports under cover of Form 20-F or Form 40-F:
Form 20-F X Form 40-F
Indicate by check mark if the registrant is submitting the Form 6-K in paper as permitted by Regulation S-T Rule 101(b)(1):
Yes No X
Indicate by check mark if the registrant is submitting the Form 6-K in paper as permitted by Regulation S-T Rule 101(b)(7):
Yes No X

1Q23 Results April 27, 2023

1Q23 Results 2 Disclaimer This document is only provided for information purposes and does not constitute, nor should it be interpreted as, an offer to sell or exchange or acquire, or an invitation for offers to buy securities issued by any of the aforementioned companies. Any decision to buy or invest in securities in relation to a specific issue must be made solely and exclusively on the basis of the information set out in the pertinent prospectus filed by the company in relation to such specific issue. No one who becomes aware of the information contained in this report should regard it as definitive, because it is subject to changes and modifications. This document contains or may contain forward looking statements (in the usual meaning and within the meaning of the US Private Securities Litigation Reform Act of 1995) regarding intentions, expectations or projections of BBVA or of its management on the date thereof, that refer to or incorporate various assumptions and projections, including projections about the future earnings of the business. The statements contained herein are based on our current projections, but the actual results may be substantially modified in the future by various risks and other factors that may cause the results or final decisions to differ from such intentions, projections or estimates. These factors include, without limitation, (1) the market situation, macroeconomic factors, regulatory, political or government guidelines, (2) domestic and international stock market movements, exchange rates and interest rates, (3) competitive pressures, (4) technological changes, (5) alterations in the financial situation, creditworthiness or solvency of our customers, debtors or counterparts. These factors could cause or result in actual events differing from the information and intentions stated, projected or forecast in this document or in other past or future documents. BBVA does not undertake to publicly revise the contents of this or any other document, either if the events are not as described herein, or if such events lead to changes in the information contained in this document. This document may contain summarised information or information that has not been audited, and its recipients are invited to consult the documentation and public information filed by BBVA with stock market supervisory bodies, in particular, the prospectuses and periodical information filed with the Spanish Securities Exchange Commission (CNMV) and the Annual Report on Form 20-F and information on Form 6-K that are filed with the US Securities and Exchange Commission. Distribution of this document in other jurisdictions may be prohibited, and recipients into whose possession this document comes shall be solely responsible for informing themselves about, and observing any such restrictions. By accepting this document you agree to be bound by the foregoing restrictions.
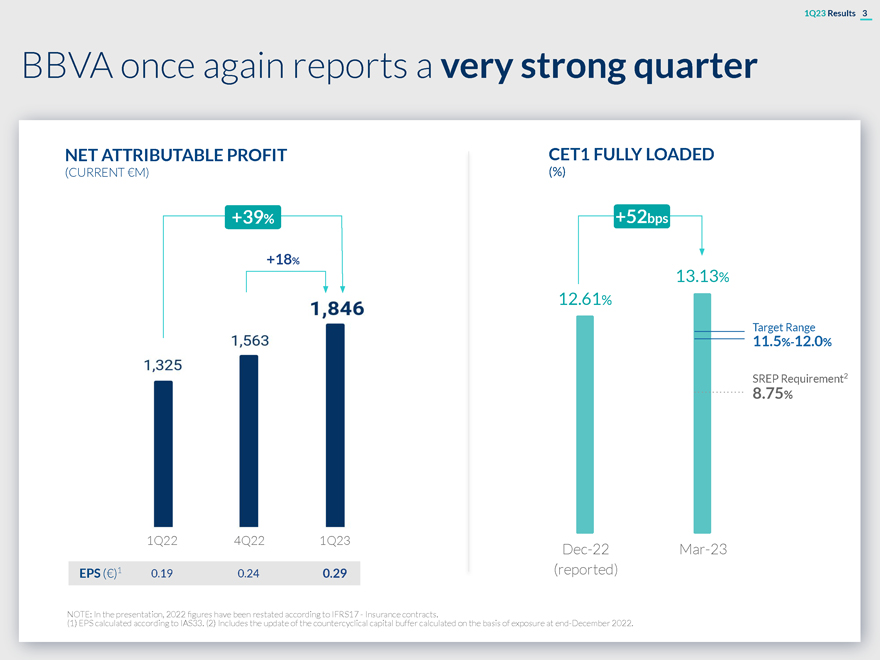
1Q23 Results 3 BBVA once again reports a very strong quarter NET ATTRIBUTABLE PROFIT CET1 FULLY LOADED (CURRENT €M) (%) +39% +52bps +18% 13.13% 12.61% Target Range 11.5%-12.0% SREP Requirement2 8.75% 1Q22 4Q22 1Q23 Dec-22 Mar-23 EPS (€)1 0.19 0.24 0.29 (reported) NOTE: In the presentation, 2022 figures have been restated according to IFRS17—Insurance contracts. (1) EPS calculated according to IAS33. (2) Includes the update of the countercyclical capital buffer calculated on the basis of exposure at end-December 2022.
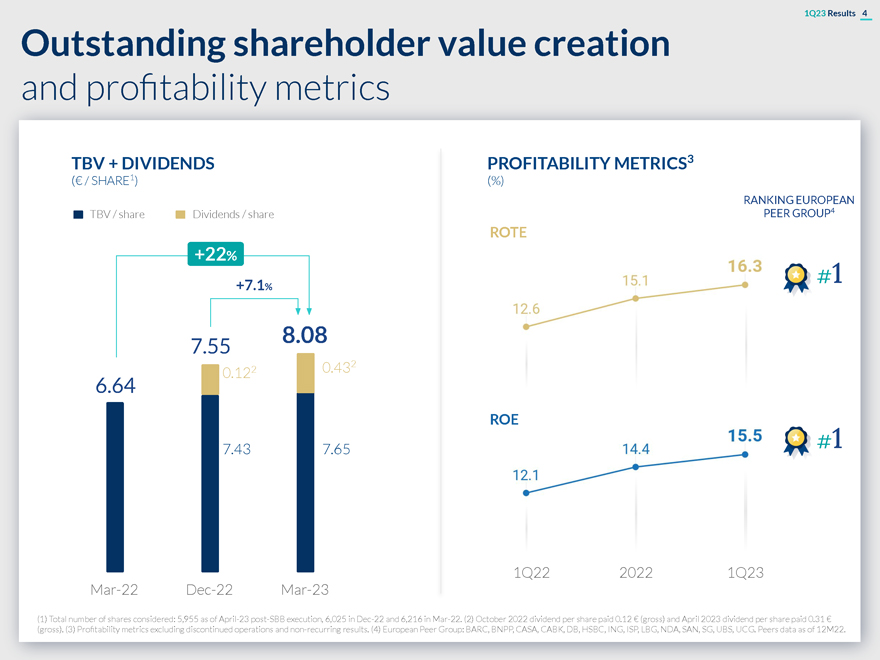
1Q23 Results 4 Outstanding shareholder value creation and profitability metrics TBV + DIVIDENDS PROFITABILITY METRICS3 (€ / SHARE1) (%) RANKING EUROPEAN TBV / share Dividends / share PEER GROUP4 ROTE +22% #1 +7.1% 8.08 7.55 2 0.122 0.43 6.64 ROE #1 7.43 7.65 1Q22 2022 1Q23 Mar-22 Dec-22 Mar-23 (1) Total number of shares considered: 5,955 as of April-23 post-SBB execution, 6,025 in Dec-22 and 6,216 in Mar-22. (2) October 2022 dividend per share paid 0.12 € (gross) and April 2023 dividend per share paid 0.31 € (gross). (3) Profitability metrics excluding discontinued operations and non-recurring results. (4) European Peer Group: BARC, BNPP, CASA, CABK, DB, HSBC, ING, ISP, LBG, NDA, SAN, SG, UBS, UCG. Peers data as of 12M22.
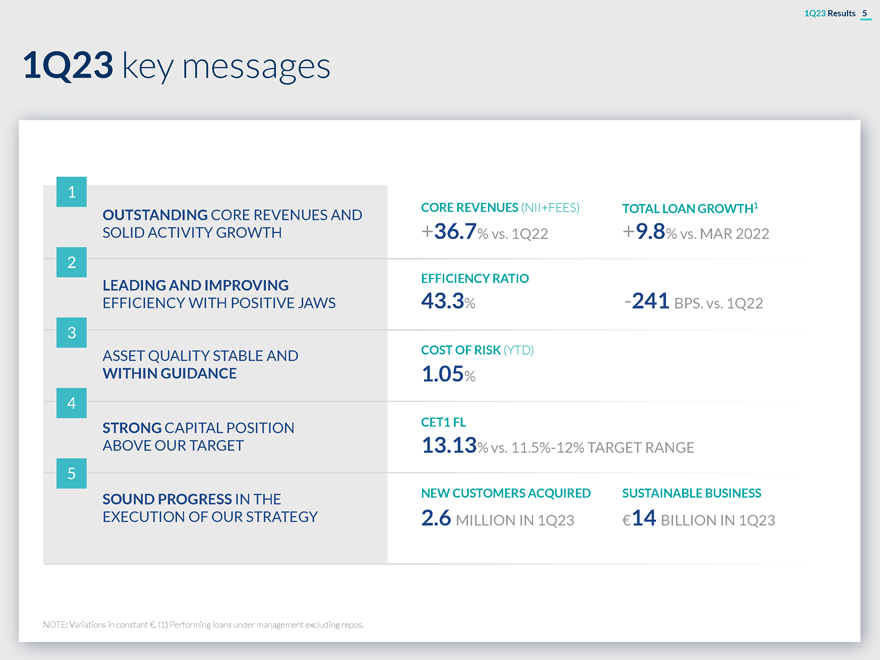
1Q23 Results 5 1Q23 key messages 1 OUTSTANDING CORE REVENUES AND CORE REVENUES (NII+FEES) TOTAL LOAN GROWTH1 SOLID ACTIVITY GROWTH +36.7% vs. 1Q22 +9.8% vs. MAR 2022 2 EFFICIENCY RATIO LEADING AND IMPROVING EFFICIENCY WITH POSITIVE JAWS 43.3% -241 BPS. vs. 1Q22 3 ASSET QUALITY STABLE AND COST OF RISK (YTD) WITHIN GUIDANCE 1.05% 4 STRONG CAPITAL POSITION CET1 FL ABOVE OUR TARGET 13.13% vs. 11.5%-12% TARGET RANGE 5 SOUND PROGRESS IN THE NEW CUSTOMERS ACQUIRED SUSTAINABLE BUSINESS EXECUTION OF OUR STRATEGY 2.6 MILLION IN 1Q23 €14 BILLION IN 1Q23 NOTE: Variations in constant €. (1) Performing loans under management excluding repos.
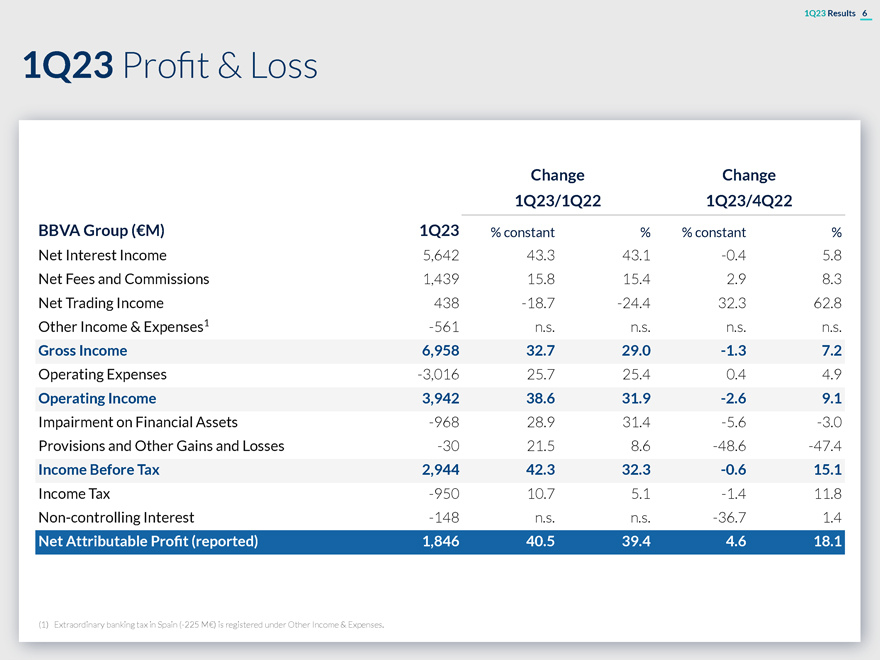
1Q23 Results 6 1Q23 Profit & Loss Change Change 1Q23/1Q22 1Q23/4Q22 BBVA Group (€M) 1Q23 % constant % % constant % Net Interest Income 5,642 43.3 43.1 -0.4 5.8 Net Fees and Commissions 1,439 15.8 15.4 2.9 8.3 Net Trading Income 438 -18.7 -24.4 32.3 62.8 Other Income & Expenses1 -561 n.s. n.s. n.s. n.s. Gross Income 6,958 32.7 29.0 -1.3 7.2 Operating Expenses -3,016 25.7 25.4 0.4 4.9 Operating Income 3,942 38.6 31.9 -2.6 9.1 Impairment on Financial Assets -968 28.9 31.4 -5.6 -3.0 Provisions and Other Gains and Losses -30 21.5 8.6 -48.6 -47.4 Income Before Tax 2,944 42.3 32.3 -0.6 15.1 Income Tax -950 10.7 5.1 -1.4 11.8 Non-controlling Interest -148 n.s. n.s. -36.7 1.4 Net Attributable Profit (reported) 1,846 40.5 39.4 4.6 18.1 (1) Extraordinary banking tax in Spain (-225 M€) is registered under Other Income & Expenses.
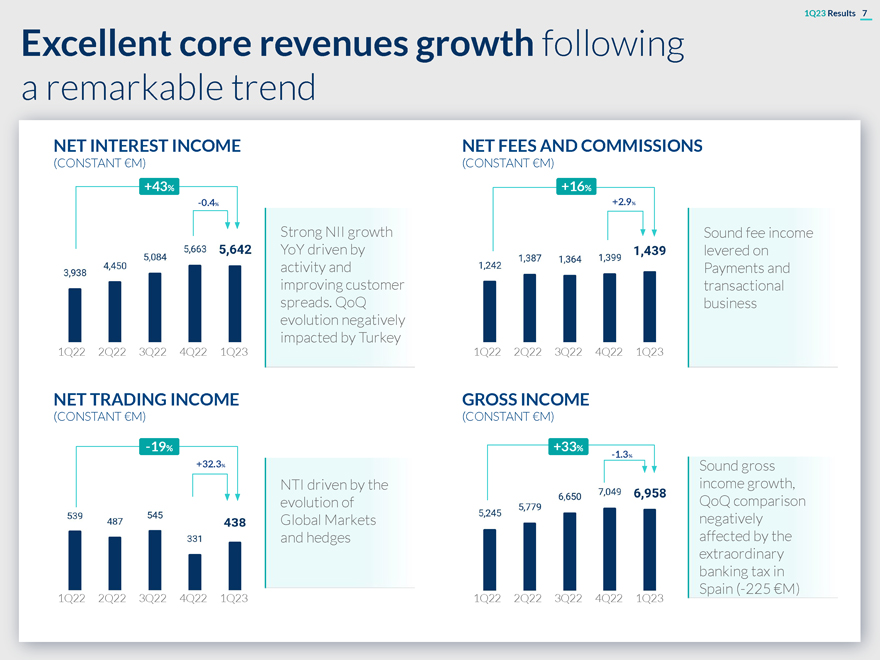
1Q23 Results 7 Excellent core revenues growth following a remarkable trend NET INTEREST INCOME NET FEES AND COMMISSIONS (CONSTANT €M) (CONSTANT €M) +43% +16% -0.4% +2.9% Strong NII growth Sound fee income YoY driven by levered on activity and Payments and improving customer transactional spreads. QoQ business evolution negatively impacted by Turkey 1Q22 2Q22 3Q22 4Q22 1Q23 1Q22 2Q22 3Q22 4Q22 1Q23 NET TRADING INCOME GROSS INCOME (CONSTANT €M) (CONSTANT €M) -19% +33% -1.3% +32.3% Sound gross NTI driven by the income growth, evolution of QoQ comparison Global Markets negatively and hedges affected by the extraordinary banking tax in 1Q22 2Q22 3Q22 4Q22 1Q23 1Q22 2Q22 3Q22 4Q22 1Q23 Spain (-225 €M)
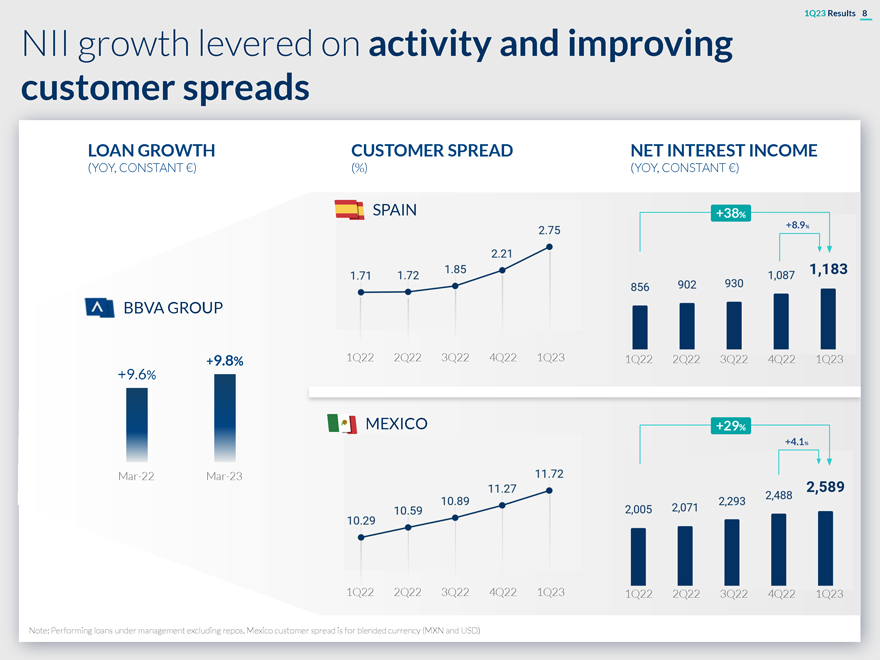
1Q23 Results 8 NII growth levered on activity and improving customer spreads LOAN GROWTH CUSTOMER SPREAD NET INTEREST INCOME (YOY, CONSTANT €) (%) (YOY, CONSTANT €) SPAIN +38% +8.9% BBVA GROUP +9.8% 1Q22 2Q22 3Q22 4Q22 1Q23 1Q22 2Q22 3Q22 4Q22 1Q23 +9.6% MEXICO +29% +4.1% Mar-22 Mar-23 1Q22 2Q22 3Q22 4Q22 1Q23 1Q22 2Q22 3Q22 4Q22 1Q23 Note: Performing loans under management excluding repos. Mexico customer spread is for blended currency (MXN and USD)
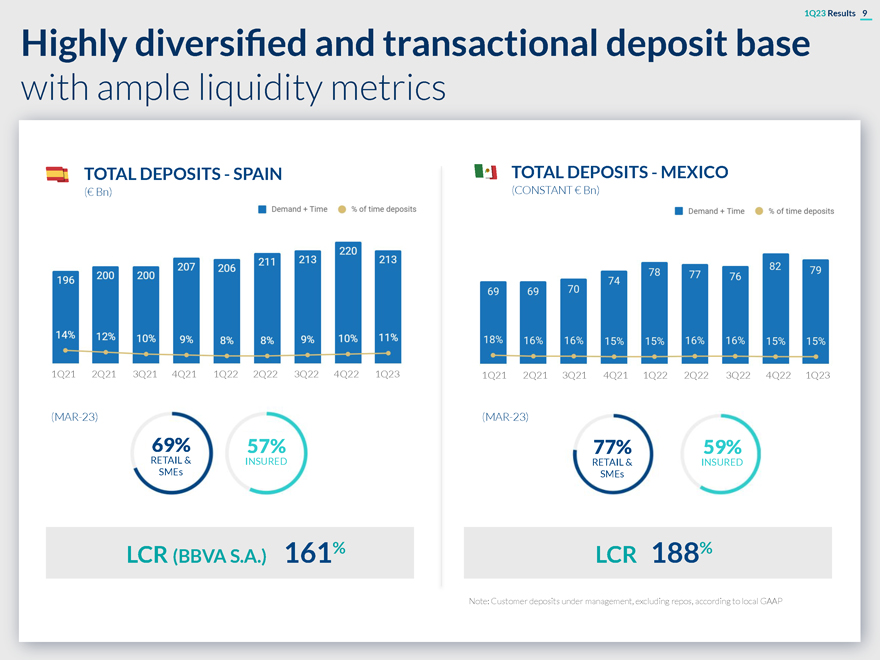
1Q23 Results 9 Highly diversified and transactional deposit base with ample liquidity metrics TOTAL DEPOSITS—SPAIN TOTAL DEPOSITS—MEXICO (€ Bn) (CONSTANT € Bn) 1Q21 2Q21 3Q21 4Q21 1Q22 2Q22 3Q22 4Q22 1Q23 1Q21 2Q21 3Q21 4Q21 1Q22 2Q22 3Q22 4Q22 1Q23 (MAR-23) (MAR-23) 69% 57% 77% 59% RETAIL & INSURED RETAIL & INSURED SMEs SMEs % % LCR (BBVA S.A.) 161 LCR 188 Note: Customer deposits under management, excluding repos, according to local GAAP
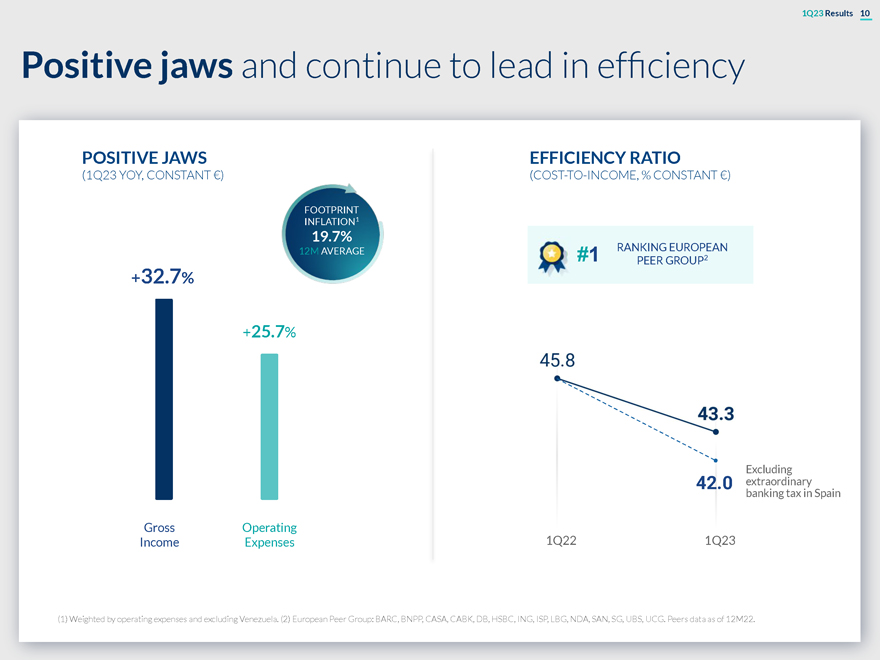
1Q23 Results 10 Positive jaws and continue to lead in efficiency POSITIVE JAWS EFFICIENCY RATIO (1Q23 YOY, CONSTANT €) (COST-TO-INCOME, % CONSTANT €) FOOTPRINT INFLATION1 19.7% 12M AVERAGE RANKING EUROPEAN #1 PEER GROUP2 +32.7% +25.7% Excluding 42.0 extraordinary banking tax in Spain Gross Operating Income Expenses 1Q22 1Q23 (1) Weighted by operating expenses and excluding Venezuela. (2) European Peer Group: BARC, BNPP, CASA, CABK, DB, HSBC, ING, ISP, LBG, NDA, SAN, SG, UBS, UCG. Peers data as of 12M22.
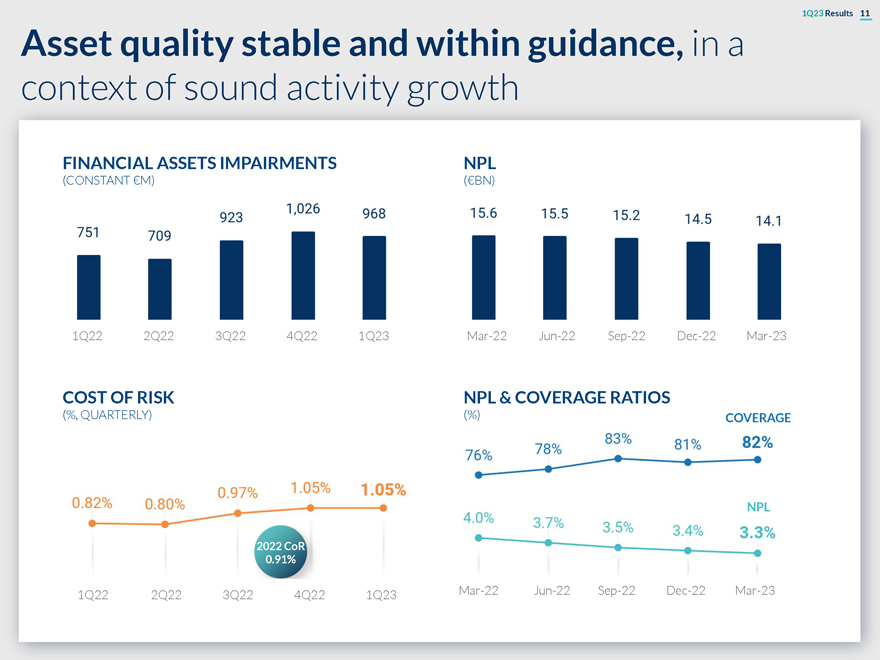
1Q23 Results 11 Asset quality stable and within guidance, in a context of sound activity growth FINANCIAL ASSETS IMPAIRMENTS NPL (CONSTANT €M) (€BN) 1Q22 2Q22 3Q22 4Q22 1Q23 Mar-22 Jun-22 Sep-22 Dec-22 Mar-23 COST OF RISK NPL & COVERAGE RATIOS (%, QUARTERLY) (%) COVERAGE 2019 at 1.04% NPL 2022 CoR 0.91% 1Q22 2Q22 3Q22 4Q22 1Q23 Mar-22 Jun-22 Sep-22 Dec-22 Mar-23
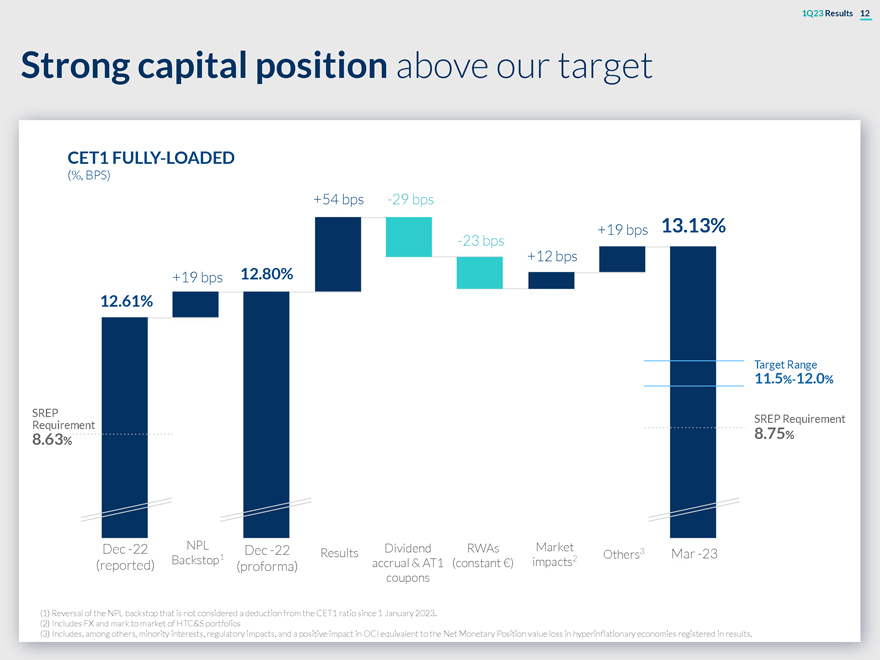
1Q23 Results 12 Strong capital position above our target CET1 FULLY-LOADED (%, BPS) +54 bps -29 bps +19 bps 13.13% -23 bps +12 bps +19 bps 12.80% 12.61% Target Range 11.5%-12.0% SREP SREP Requirement Requirement .63 8.75% 8 % Dec -22 NPL Dividend RWAs Market Dec -22 Results Others3 Mar -23 Backstop1 impacts2 (reported) (proforma) accrual & AT1 (constant €) coupons (1) Reversal of the NPL backstop that is not considered a deduction from the CET1 ratio since 1 January 2023. (2) Includes FX and mark to market of HTC&S portfolios (3) Includes, among others, minority interests, regulatory impacts, and a positive impact in OCI equivalent to the Net Monetary Position value loss in hyperinflationary economies registered in results.

1Q23 Results 13 Excellent customer acquisition driven by digital NEW CUSTOMERS1 (BBVA GROUP, MILLION; % ACQUISITION THROUGH DIGITAL CHANNELS) DIGITAL 64% TOTAL DIGITAL 11% 1Q18 1Q19 1Q20 1Q21 1Q22 1Q23 (1) Gross customer acquisition through own channels for retail segment. Excludes the US business sold to PNC for comparison purposes.
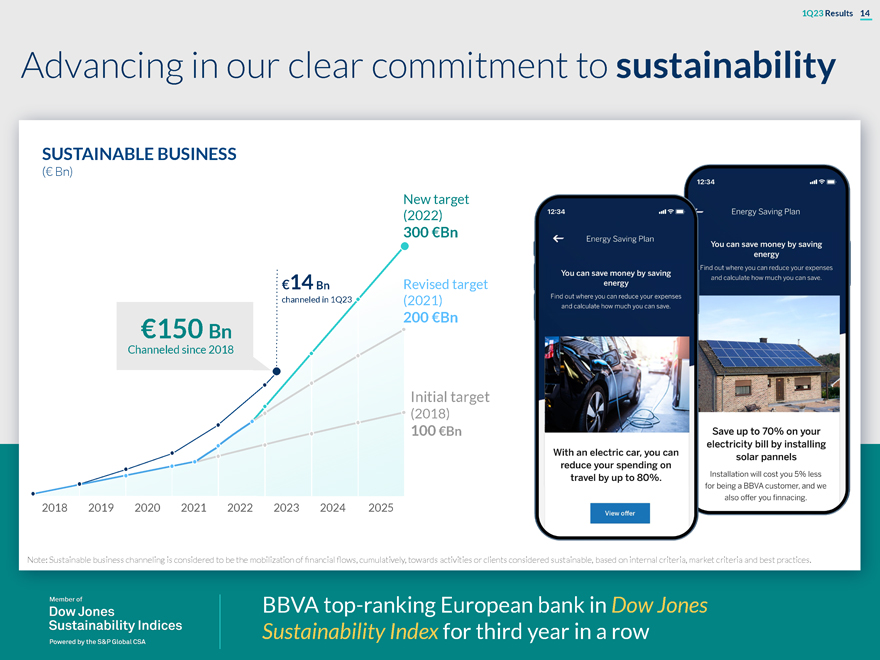
1Q23 Results 14 Advancing in our clear commitment to sustainability SUSTAINABLE BUSINESS (€ Bn) New target (2022) 300 €Bn €14 Bn Revised target channeled in 1Q23 (2021) €150 Bn 200 €Bn Channeled since 2018 Initial target (2018) 100 €Bn 2018 2019 2020 2021 2022 2023 2024 2025 Note: Sustainable business channeling is considered to be the mobilization of financial flows, cumulatively, towards activities or clients considered sustainable, based on internal criteria, market criteria and best practices. BBVA top-ranking European bank in Dow Jones Sustainability Index for third year in a row
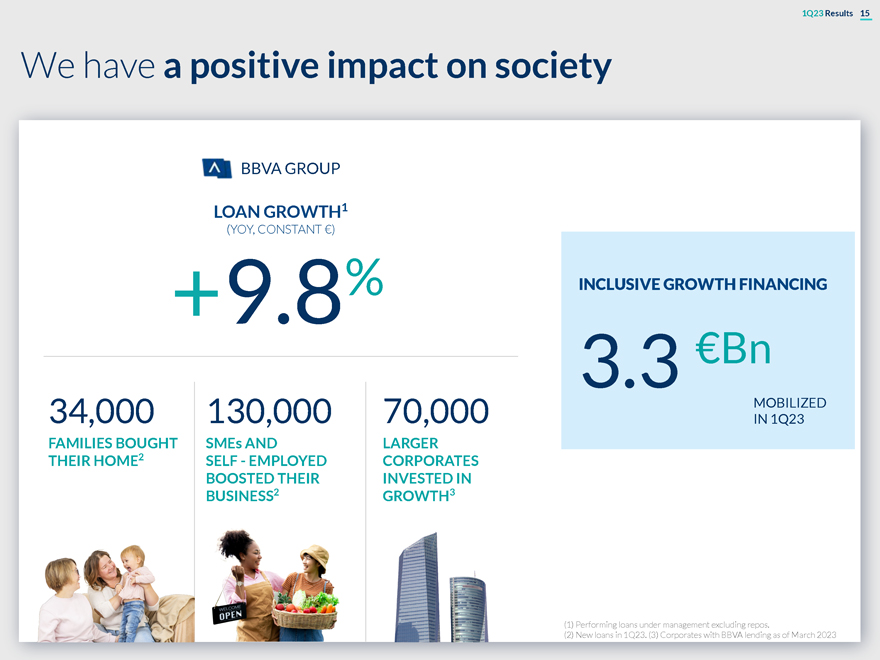
1Q23 Results 15 We have a positive impact on society BBVA GROUP LOAN GROWTH1 (YOY, CONSTANT €) +9.8% INCLUSIVE GROWTH FINANCING 3.3 €Bn 34,000 130,000 70,000 MOBILIZED IN 1Q23 FAMILIES BOUGHT SMEs AND LARGER THEIR HOME2 SELF—EMPLOYED CORPORATES BOOSTED THEIR INVESTED IN BUSINESS2 GROWTH3 (1) Performing loans under management excluding repos. (2) New loans in 1Q23. (3) Corporates with BBVA lending as of March 2023
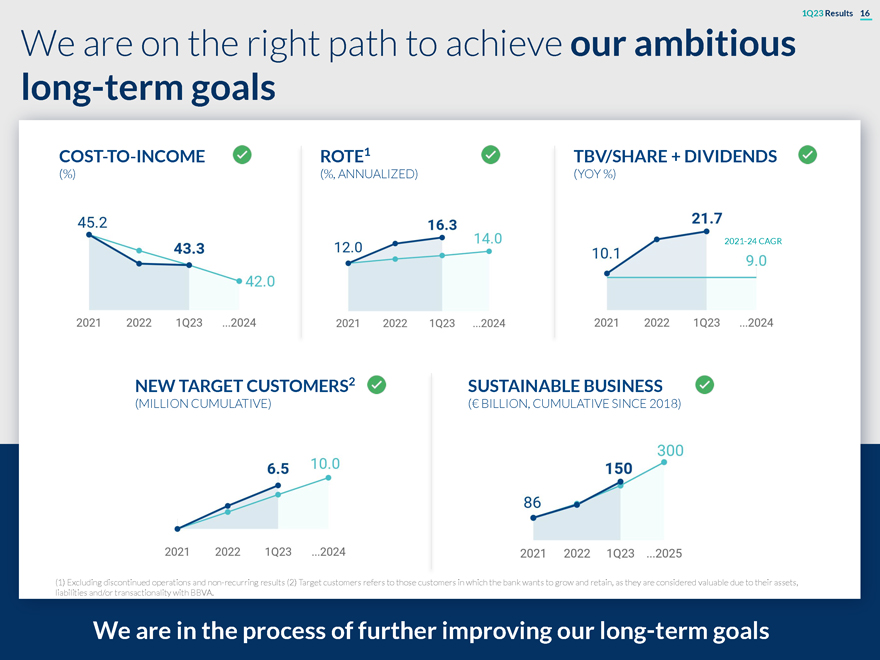
1Q23 Results 16 We are on the right path to achieve our ambitious long-term goals COST-TO-INCOME ROTE1 TBV/SHARE + DIVIDENDS (%) (%, ANNUALIZED) (YOY %) 2021-24 CAGR NEW TARGET CUSTOMERS2 SUSTAINABLE BUSINESS (MILLION CUMULATIVE) (€ BILLION, CUMULATIVE SINCE 2018) (1) Excluding discontinued operations and non-recurring results (2) Target customers refers to those customers in which the bank wants to grow and retain, as they are considered valuable due to their assets, liabilities and/or transactionality with BBVA. We are in the process of further improving our long-term goals

Business Areas
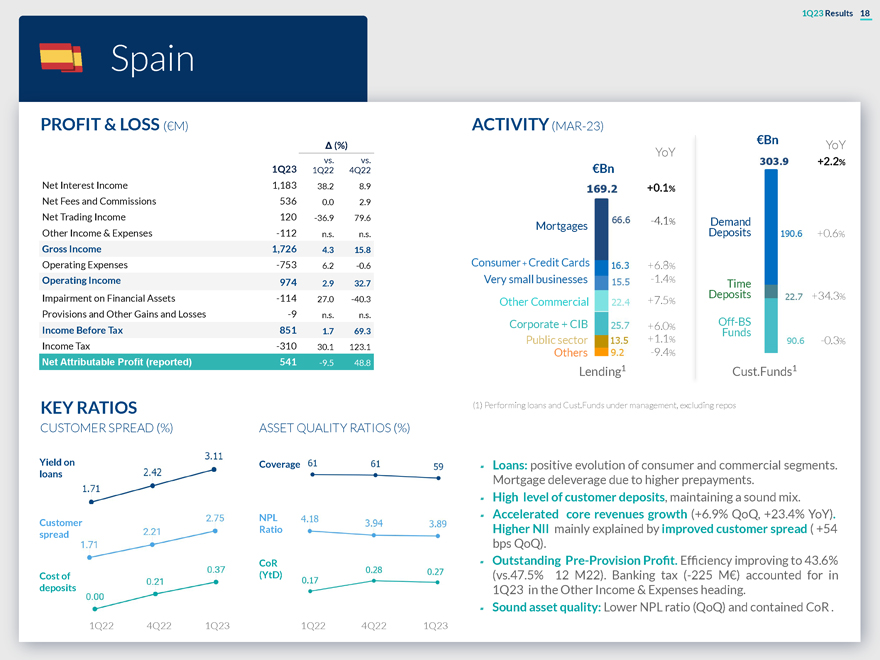
1Q23 Results 18 Spain PROFIT & LOSS (€M) ACTIVITY (MAR-23) €Bn Δ (%) YoY vs. vs. YoY +2 1Q23 .2% 1Q22 4Q22 €Bn Net Interest Income 1,183 38.2 8.9 +0.1% Net Fees and Commissions 536 0.0 2.9 Net Trading Income 120 -36.9 79.6 -4.1 Mortgages % Demand Other Income & Expenses -112 n.s. n.s. Deposits +0.6% Gross Income 1,726 4.3 15.8 Operating Expenses -753 6.2 -0.6 Consumer + Credit Cards +6.8% Operating Income 974 Very small businesses -1.4% 2.9 32.7 Time Impairment on Financial Assets -114 Deposits +34.3% 27.0 -40.3 Other Commercial +7.5% Provisions and Other Gains and Losses -9 n.s. n.s. Corporate + CIB +6.0 Off-BS Income Before Tax 851 % 1.7 69.3 Funds Public sector +1.1% -0.3% Income Tax -310 30.1 123.1 Others -9.4% Net Attributable Profit (reported) 541 -9.5 48.8 Lending1 Cust.Funds1 KEY RATIOS (1) Performing loans and Cust.Funds under management, excluding repos CUSTOMER SPREAD (%) ASSET QUALITY RATIOS (%) Yield on Coverage of and commercial segments. loans â–° Loans: positive evolution consumer Mortgage deleverage due to higher prepayments. â–° High level of customer deposits, maintaining a sound mix. Customer NPL â–° Accelerated core revenues growth (+6.9% QoQ, +23.4% YoY). Ratio Higher NII mainly explained by improved customer spread ( +54 spread bps QoQ). CoR â–° Outstanding Pre-Provision Profit. Efficiency improving to 43.6% Cost (YtD) (vs.47.5% 12 M22). Banking tax (-225 M€) accounted for in 1Q23 in the Other Income & Expenses heading. â–° Sound asset quality: Lower NPL ratio (QoQ) and contained CoR . 1Q22 4Q22 1Q23
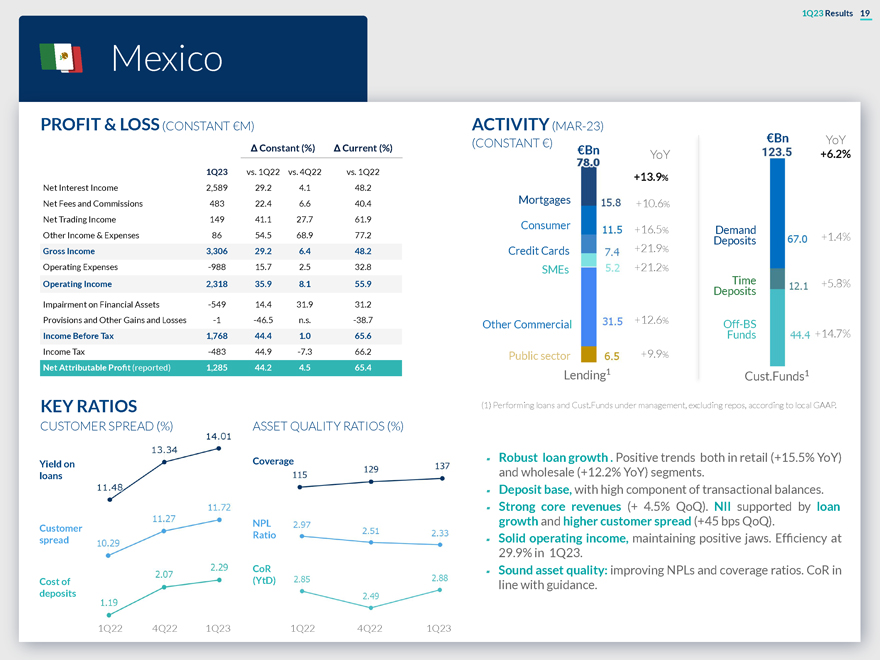
1Q23 Results 19 Mexico PROFIT & LOSS (CONSTANT €M) ACTIVITY (MAR-23) (CONSTANT €) €Bn YoY Δ Constant (%) Δ Current (%) €Bn YoY +6.2% 1Q23 vs. 1Q22 vs. 4Q22 vs. 1Q22 +13.9% Net Interest Income 2,589 29.2 4.1 48.2 Net Fees and Commissions 483 22.4 6.6 40.4 Mortgages +10.6 % Net Trading Income 149 41.1 27.7 61.9 Consumer +16.5 % Demand Other Income & Expenses 86 54.5 68.9 77.2 +1.4% Deposits Gross Income 3,306 29.2 6.4 48.2 Credit Cards +21.9% Operating Expenses -988 15.7 2.5 32.8 SMEs +21.2% Operating Income 2,318 35.9 8.1 55.9 Time +5.8% Deposits Impairment on Financial Assets -549 14.4 31.9 31.2 Provisions and Other Gains and Losses -1 -46.5 n.s. -38.7 Other Commercial +12.6% Off-BS Income Before Tax 1,768 44.4 1.0 65.6 Funds +14.7% Income Tax -483 44.9 -7.3 66.2 Public sector +9.9% Net Attributable Profit (reported) 1,285 44.2 4.5 65.4 Lending1 Cust.Funds1 KEY RATIOS (1) Performing loans and Cust.Funds under management, excluding repos, according to local GAAP. CUSTOMER SPREAD (%) ASSET QUALITY RATIOS (%) Coverage Robust loan growth . Positive trends both in retail (+15.5% YoY) Yield and wholesale (+12.2% YoY) segments. loans Deposit base, with high component of transactional balances. Strong core revenues (+ 4.5% QoQ). NII supported by loan growth and higher customer spread (+45 bps QoQ). spread Solid operating income, maintaining positive jaws. Efficiency at 29.9% in 1Q23. Sound asset quality: improving NPLs and coverage ratios. CoR in Cost (YtD) line with guidance. deposits 1Q22 4Q22 1Q23
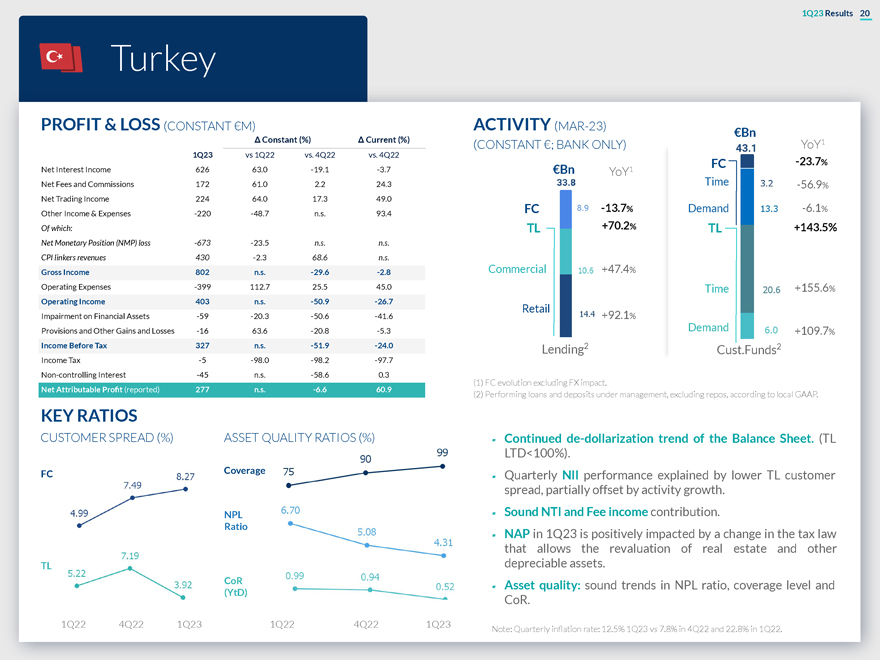
1Q23 Results 20 Turkey PROFIT & LOSS (CONSTANT €M) ACTIVITY (MAR-23) €Bn Δ Constant (%) Δ Current (%) (CONSTANT €; BANK ONLY) YoY1 1Q23 vs 1Q22 vs. 4Q22 vs. 4Q22 FC -23.7% Net Interest Income 626 63.0 -19.1 -3.7 €Bn YoY1 Net Fees and Commissions 172 61.0 2.2 24.3 Time -56.9% Net Trading Income 224 64.0 17.3 49.0 FC -13.7% Demand -6.1% Other Income & Expenses -220 -48.7 n.s. 93.4 Of which: TL +70.2% TL +143.5% Net Monetary Position (NMP) loss -673 -23.5 n.s. n.s. CPI linkers revenues 430 -2.3 68.6 n.s. Gross Income 802 n.s. -29.6 -2.8 Commercial +47.4% Operating Expenses -399 112.7 25.5 45.0 Time +155.6% Operating Income 403 n.s. -50.9 -26.7 Retail Impairment on Financial Assets -59 -20.3 -50.6 -41.6 +92.1% Provisions and Other Gains and Losses -16 63.6 -20.8 -5.3 Demand +109 7 . % Income Before Tax 327 n.s. -51.9 -24.0 Lending2 Cust.Funds2 Income Tax -5 -98.0 -98.2 -97.7 Non-controlling Interest -45 n.s. -58.6 0.3 Net Attributable Profit (reported) 277 n.s. -6.6 60.9 (1) FC evolution excluding FX impact. (2) Performing loans and deposits under management, excluding repos, according to local GAAP. KEY RATIOS CUSTOMER SPREAD (%) ASSET QUALITY RATIOS (%) â–° Continued de-dollarization trend of the Balance Sheet. (TL LTD<100%). FC Coverage â–° Quarterly NII performance explained by lower TL customer spread, partially offset by activity growth. NPL â–° Sound NTI and Fee income contribution. Ratio â–° NAP in 1Q23 is positively impacted by a change in the tax law that allows the revaluation of real estate and other TL depreciable assets. CoR â–° Asset quality: sound trends in NPL ratio, coverage level and (YtD) CoR. 1Q22 4Q22 1Q23 1Q22 4Q22 1Q23 Note: Quarterly inflation rate: 12.5% 1Q23 vs 7.8% in 4Q22 and 22.8% in 1Q22.
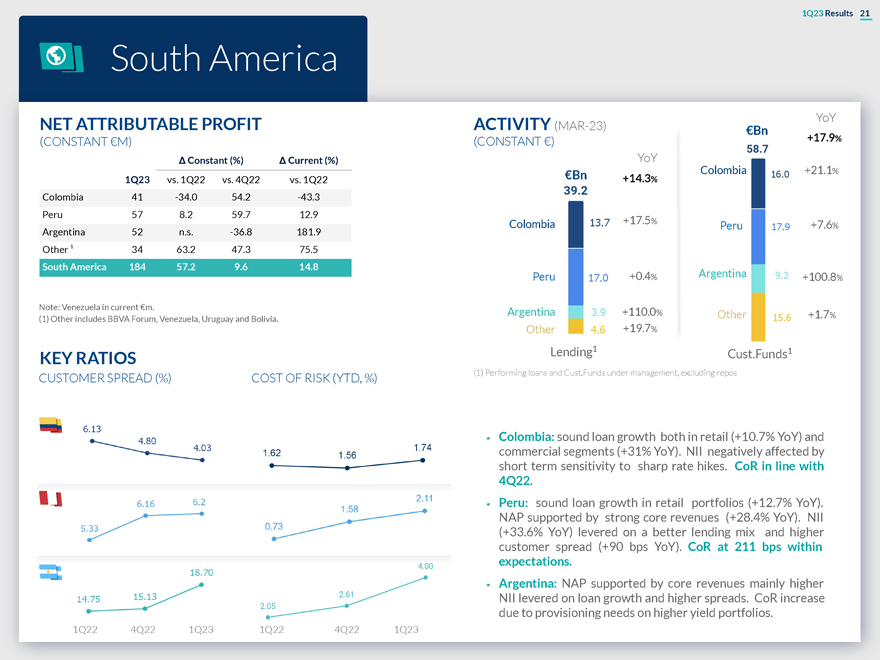
1Q23 Results 21 South America YoY NET ATTRIBUTABLE PROFIT ACTIVITY (MAR-23) €Bn (CONSTANT €M) (CONSTANT €) +17.9% Δ Constant (%) Δ Current (%) YoY €Bn Colombia +21.1% 1Q23 vs. 1Q22 vs. 4Q22 vs. 1Q22 +14. Colombia 41 -34.0 54.2 -43.3 Peru 57 8.2 59.7 12.9 Colombia +17.5% .6 Peru +7 % Argentina 52 n.s. -36.8 181.9 Other ¹ 34 63.2 47.3 75.5 South America 184 57.2 9.6 14.8 Peru +0.4% Argentina .8 +100 % Note: Venezuela in current €m. Argentina +110.0% Other +1.7% (1) Other includes BBVA Forum, Venezuela, Uruguay and Bolivia. Other +19.7% Lending1 1 KEY RATIOS Cust.Funds (1) Performing loans and Cust.Funds under management, excluding repos CUSTOMER SPREAD (%) COST OF RISK (YTD, %) â–° Colombia: sound loan growth both in retail (+10.7% YoY) and commercial segments (+31% YoY). NII negatively affected by short term sensitivity to sharp rate hikes. CoR in line with 4Q22. â–° Peru: sound loan growth in retail portfolios (+12.7% YoY). NAP supported by strong core revenues (+28.4% YoY). NII (+33.6% YoY) levered on a better lending mix and higher customer spread (+90 bps YoY). CoR at 211 bps within expectations. â–° Argentina: NAP supported by core revenues mainly higher NII levered on loan growth and higher spreads. CoR increase due to provisioning needs on higher yield portfolios. 1Q22 4Q22 1Q23 1Q22 4Q22 1Q23

1Q23 Results 22 Takeaways BBVA delivered another very strong quarter mainly driven by Spain and Mexico Excellent core revenues evolution on the back of activity growth and higher spreads Delivering exceptional value creation for all our stakeholders: shareholders, clients, employees and society at large Significant progress in the execution of our strategy focused on digitization, innovation and sustainability On track to achieve our ambitious long-term goals
Annex 01 Net Attributable Profit 08 CET1 Sensitivity to market evolution impacts 02 Gross Income breakdown 09 RWAs by business area 03 P&L Accounts by business 10 Book Value of the main unit subsidiaries 04 Customer spread by country 11 TBV per share & dividends evolution 05 Stages breakdown by 12 MREL business area 06 Exposure to Covid-related loans 13 Digital metrics and Commercial Real Estate 07 ALCO portfolio, NII sensitivity and LCRs & NSFRs

01 Net Attributable Profit evolution
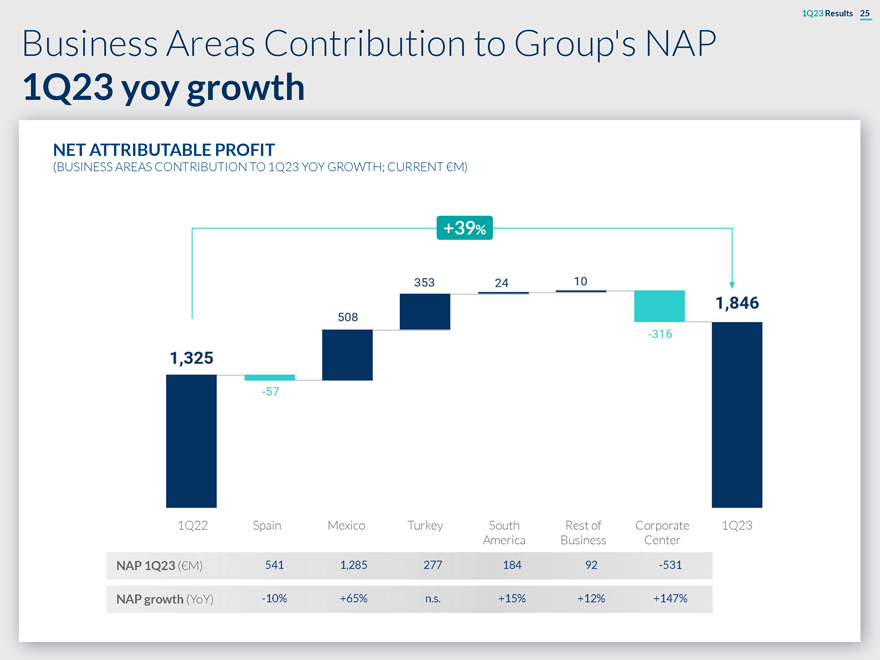
1Q23 Results 25 Business Areas Contribution to Group’s NAP 1Q23 yoy growth NET ATTRIBUTABLE PROFIT (BUSINESS AREAS CONTRIBUTION TO 1Q23 YOY GROWTH; CURRENT €M) +39% 1Q22 Spain Mexico Turkey South Rest of Corporate 1Q23 America Business Center NAP 1Q23 (€M) 541 1,285 277 184 92 -531 NAP growth (YoY) -10% +65% n.s. +15% +12% +147%

02 Gross Income breakdown
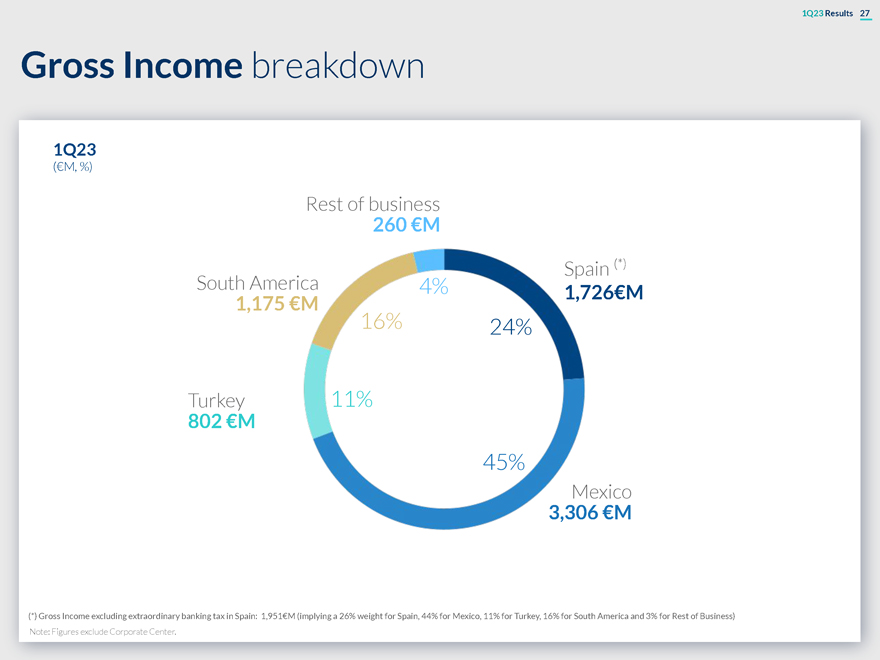
1Q23 Results 27 Gross Income breakdown 1Q23 (€M, %) Rest of business 260 €M Spain (*) South America 4% 1,726€M 1,175 €M 16% 24% Turkey 11% 802 €M 45% Mexico 3,306 €M (*) Gross Income excluding extraordinary banking tax in Spain: 1,951€M (implying a 26% weight for Spain, 44% for Mexico, 11% for Turkey, 16% for South America and 3% for Rest of Business) Note: Figures exclude Corporate Center.

03 P&L Accounts by business unit Rest of Corporate Turkey Argentina Colombia Peru Business Center (hyperinflation (hyperinflation adjustment) adjustment)
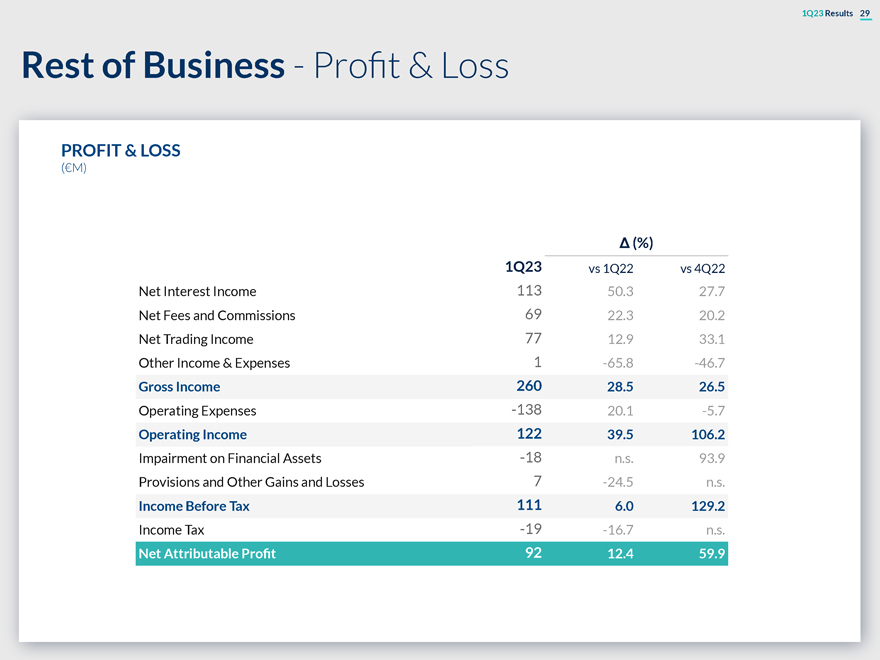
1Q23 Results 29 Rest of Business—Profit & Loss PROFIT & LOSS (€M) Δ (%) 1Q23 vs 1Q22 vs 4Q22 Net Interest Income 113 50.3 27.7 Net Fees and Commissions 69 22.3 20.2 Net Trading Income 77 12.9 33.1 Other Income & Expenses 1 -65.8 -46.7 Gross Income 260 28.5 26.5 Operating Expenses -138 20.1 -5.7 Operating Income 122 39.5 106.2 Impairment on Financial Assets -18 n.s. 93.9 Provisions and Other Gains and Losses 7 -24.5 n.s. Income Before Tax 111 6.0 129.2 Income Tax -19 -16.7 n.s. Net Attributable Profit 92 12.4 59.9
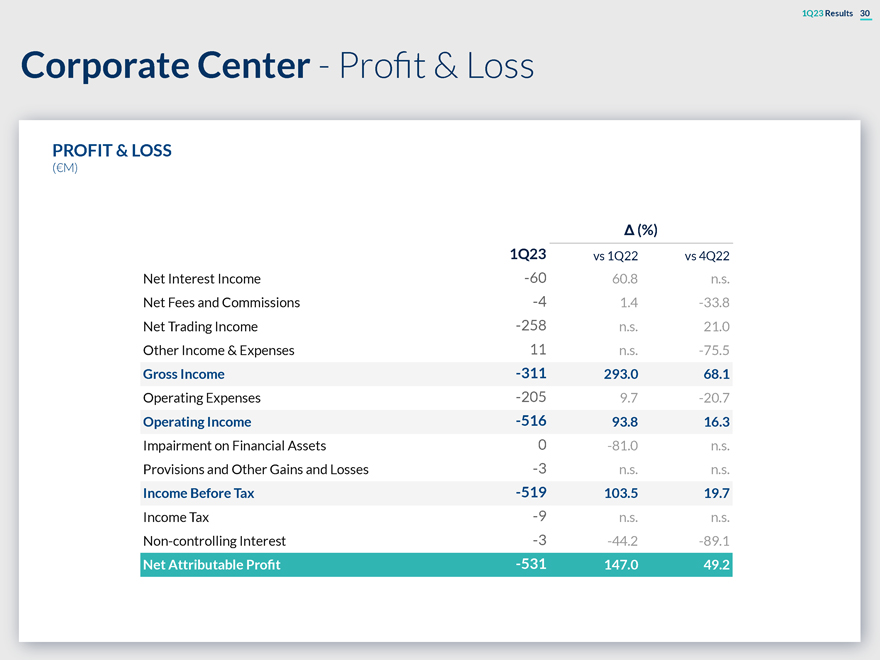
1Q23 Results 30 Corporate Center—Profit & Loss PROFIT & LOSS (€M) Δ (%) 1Q23 vs 1Q22 vs 4Q22 Net Interest Income -60 60.8 n.s. Net Fees and Commissions -4 1.4 -33.8 Net Trading Income -258 n.s. 21.0 Other Income & Expenses 11 n.s. -75.5 Gross Income -311 293.0 68.1 Operating Expenses -205 9.7 -20.7 Operating Income -516 93.8 16.3 Impairment on Financial Assets 0 -81.0 n.s. Provisions and Other Gains and Losses -3 n.s. n.s. Income Before Tax -519 103.5 19.7 Income Tax -9 n.s. n.s. Non-controlling Interest -3 -44.2 -89.1 Net Attributable Profit -531 147.0 49.2
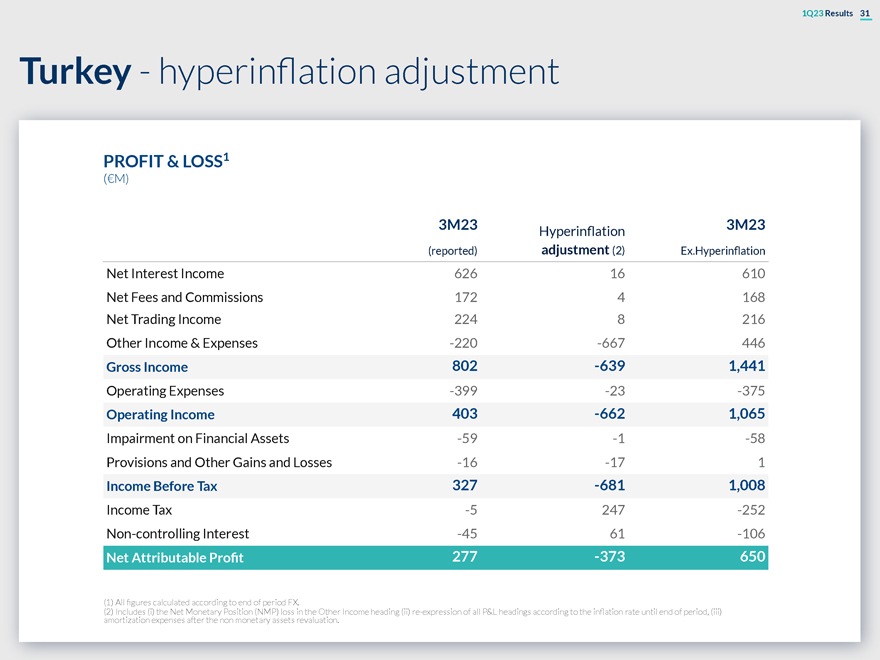
1Q23 Results 31 Turkey—hyperinflation adjustment PROFIT & LOSS1 (€M) 3M23 3M23 Hyperinflation (reported) adjustment (2) Ex.Hyperinflation Net Interest Income 626 16 610 Net Fees and Commissions 172 4 168 Net Trading Income 224 8 216 Other Income & Expenses -220 -667 446 Gross Income 802 -639 1,441 Operating Expenses -399 -23 -375 Operating Income 403 -662 1,065 Impairment on Financial Assets -59 -1 -58 Provisions and Other Gains and Losses -16 -17 1 Income Before Tax 327 -681 1,008 Income Tax -5 247 -252 Non-controlling Interest -45 61 -106 Net Attributable Profit 277 -373 650 (1) All figures calculated according to end of period FX. (2) Includes (i) the Net Monetary Position (NMP) loss in the Other Income heading (ii) re-expression of all P&L headings according to the inflation rate until end of period, (iii) amortization expenses after the non monetary assets revaluation.
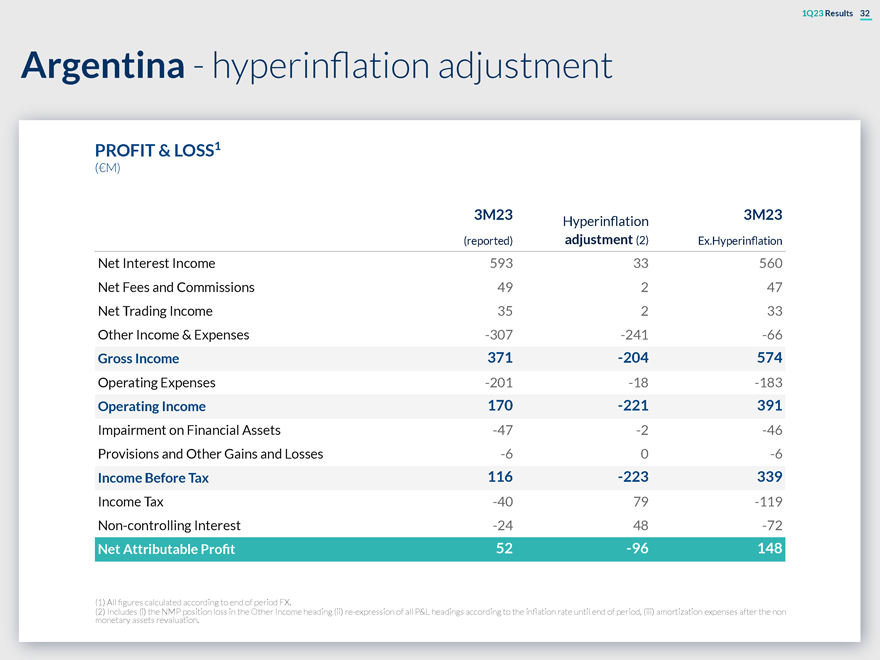
1Q23 Results 32 Argentina—hyperinflation adjustment PROFIT & LOSS1 (€M) 3M23 3M23 Hyperinflation (reported) adjustment (2) Ex.Hyperinflation Net Interest Income 593 33 560 Net Fees and Commissions 49 2 47 Net Trading Income 35 2 33 Other Income & Expenses -307 -241 -66 Gross Income 371 -204 574 Operating Expenses -201 -18 -183 Operating Income 170 -221 391 Impairment on Financial Assets -47 -2 -46 Provisions and Other Gains and Losses -6 0 -6 Income Before Tax 116 -223 339 Income Tax -40 79 -119 Non-controlling Interest -24 48 -72 Net Attributable Profit 52 -96 148 (1) All figures calculated according to end of period FX. (2) Includes (i) the NMP position loss in the Other Income heading (ii) re-expression of all P&L headings according to the inflation rate until end of period, (iii) amortization expenses after the non monetary assets revaluation.
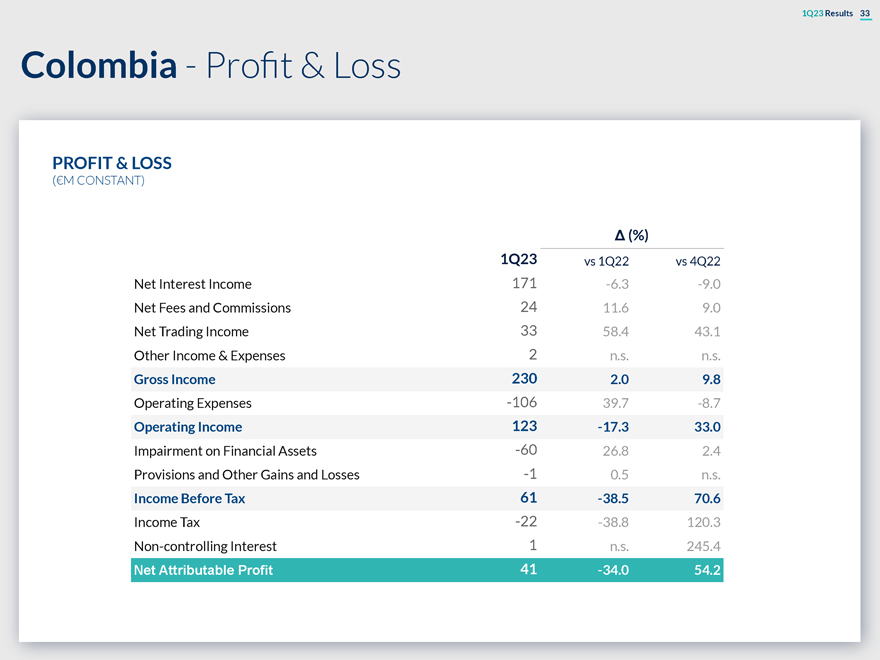
1Q23 Results 33 Colombia—Profit & Loss PROFIT & LOSS (€M CONSTANT) Δ (%) 1Q23 vs 1Q22 vs 4Q22 Net Interest Income 171 -6.3 -9.0 Net Fees and Commissions 24 11.6 9.0 Net Trading Income 33 58.4 43.1 Other Income & Expenses 2 n.s. n.s. Gross Income 230 2.0 9.8 Operating Expenses -106 39.7 -8.7 Operating Income 123 -17.3 33.0 Impairment on Financial Assets -60 26.8 2.4 Provisions and Other Gains and Losses -1 0.5 n.s. Income Before Tax 61 -38.5 70.6 Income Tax -22 -38.8 120.3 Non-controlling Interest 1 n.s. 245.4 Net Attributable Profit 41 -34.0 54.2
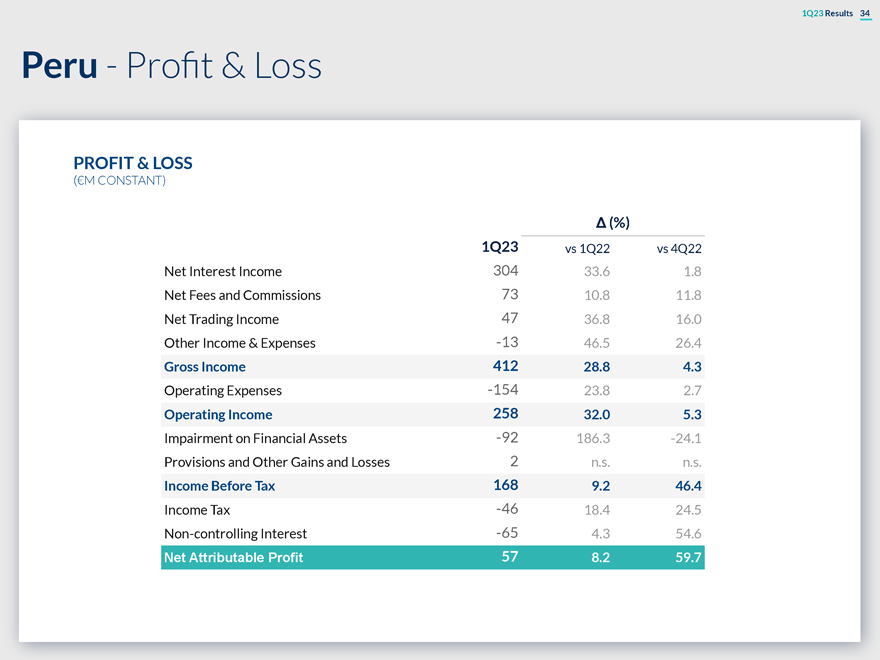
1Q23 Results 34 Peru—Profit & Loss PROFIT & LOSS (€M CONSTANT) Δ (%) 1Q23 vs 1Q22 vs 4Q22 Net Interest Income 304 33.6 1.8 Net Fees and Commissions 73 10.8 11.8 Net Trading Income 47 36.8 16.0 Other Income & Expenses -13 46.5 26.4 Gross Income 412 28.8 4.3 Operating Expenses -154 23.8 2.7 Operating Income 258 32.0 5.3 Impairment on Financial Assets -92 186.3 -24.1 Provisions and Other Gains and Losses 2 n.s. n.s. Income Before Tax 168 9.2 46.4 Income Tax -46 18.4 24.5 Non-controlling Interest -65 4.3 54.6 Net Attributable Profit 57 8.2 59.7

04 Customer Spread by country
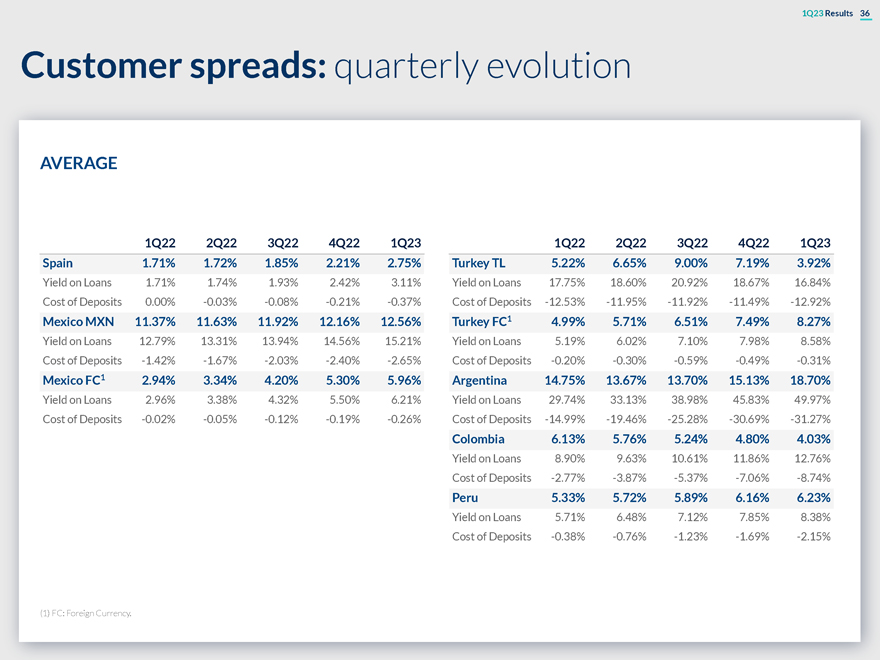
1Q23 Results 36 Customer spreads: quarterly evolution AVERAGE 1Q22 2Q22 3Q22 4Q22 1Q23 1Q22 2Q22 3Q22 4Q22 1Q23 Spain 1.71% 1.72% 1.85% 2.21% 2.75% Turkey TL 5.22% 6.65% 9.00% 7.19% 3.92% Yield on Loans 1.71% 1.74% 1.93% 2.42% 3.11% Yield on Loans 17.75% 18.60% 20.92% 18.67% 16.84% Cost of Deposits 0.00% -0.03% -0.08% -0.21% -0.37% Cost of Deposits -12.53% -11.95% -11.92% -11.49% -12.92% Mexico MXN 11.37% 11.63% 11.92% 12.16% 12.56% Turkey FC1 4.99% 5.71% 6.51% 7.49% 8.27% Yield on Loans 12.79% 13.31% 13.94% 14.56% 15.21% Yield on Loans 5.19% 6.02% 7.10% 7.98% 8.58% Cost of Deposits -1.42% -1.67% -2.03% -2.40% -2.65% Cost of Deposits -0.20% -0.30% -0.59% -0.49% -0.31% Mexico FC1 2.94% 3.34% 4.20% 5.30% 5.96% Argentina 14.75% 13.67% 13.70% 15.13% 18.70% Yield on Loans 2.96% 3.38% 4.32% 5.50% 6.21% Yield on Loans 29.74% 33.13% 38.98% 45.83% 49.97% Cost of Deposits -0.02% -0.05% -0.12% -0.19% -0.26% Cost of Deposits -14.99% -19.46% -25.28% -30.69% -31.27% Colombia 6.13% 5.76% 5.24% 4.80% 4.03% Yield on Loans 8.90% 9.63% 10.61% 11.86% 12.76% Cost of Deposits -2.77% -3.87% -5.37% -7.06% -8.74% Peru 5.33% 5.72% 5.89% 6.16% 6.23% Yield on Loans 5.71% 6.48% 7.12% 7.85% 8.38% Cost of Deposits -0.38% -0.76% -1.23% -1.69% -2.15% (1) FC: Foreign Currency.

05 Stages breakdown by business areas
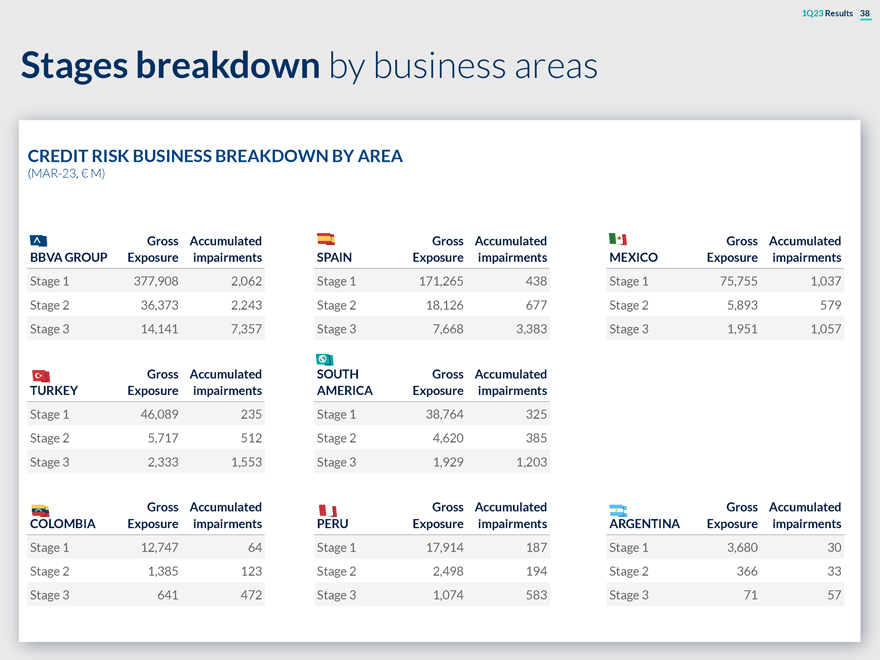
1Q23 Results 38 Stages breakdown by business areas CREDIT RISK BUSINESS BREAKDOWN BY AREA (MAR-23, € M) Gross Accumulated Gross Accumulated Gross Accumulated BBVA GROUP Exposure impairments SPAIN Exposure impairments MEXICO Exposure impairments Stage 1 377,908 2,062 Stage 1 171,265 438 Stage 1 75,755 1,037 Stage 2 36,373 2,243 Stage 2 18,126 677 Stage 2 5,893 579 Stage 3 14,141 7,357 Stage 3 7,668 3,383 Stage 3 1,951 1,057 Gross Accumulated SOUTH Gross Accumulated TURKEY Exposure impairments AMERICA Exposure impairments Stage 1 46,089 235 Stage 1 38,764 325 Stage 2 5,717 512 Stage 2 4,620 385 Stage 3 2,333 1,553 Stage 3 1,929 1,203 Gross Accumulated Gross Accumulated Gross Accumulated COLOMBIA Exposure impairments PERU Exposure impairments ARGENTINA Exposure impairments Stage 1 12,747 64 Stage 1 17,914 187 Stage 1 3,680 30 Stage 2 1,385 123 Stage 2 2,498 194 Stage 2 366 33 Stage 3 641 472 Stage 3 1,074 583 Stage 3 71 57 06 Exposure to Covid-related loans and Commercial Real Estate

06Exposure to Covid-related loans and Commercial Real Estate
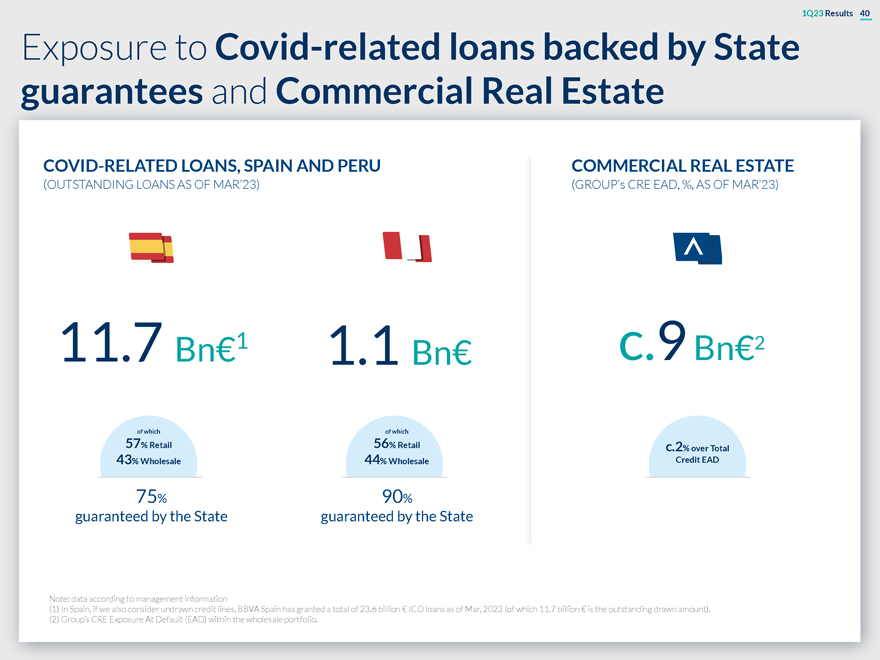
1Q23 Results 40 Exposure to Covid-related loans backed by State guarantees and Commercial Real Estate COVID-RELATED LOANS, SPAIN AND PERU COMMERCIAL REAL ESTATE (OUTSTANDING LOANS AS OF MAR’23) (GROUP’s CRE EAD, %, AS OF MAR’23) 11.7 Bn€1 1.1 Bn€ c.9 Bn€2 of which of which 57% Retail 56% Retail c.2% over Total 43% Wholesale 44% Wholesale Credit EAD 75% 90% guaranteed by the State guaranteed by the State Note: data according to management information (1) In Spain, if we also consider undrawn credit lines, BBVA Spain has granted a total of 23.6 billion € ICO loans as of Mar, 2023 (of which 11.7 billion € is the outstanding drawn amount). (2) Group’s CRE Exposure At Default (EAD) within the wholesale portfolio.

07 ALCO Portfolio, NII Sensitivity and LCRs & NSFRs
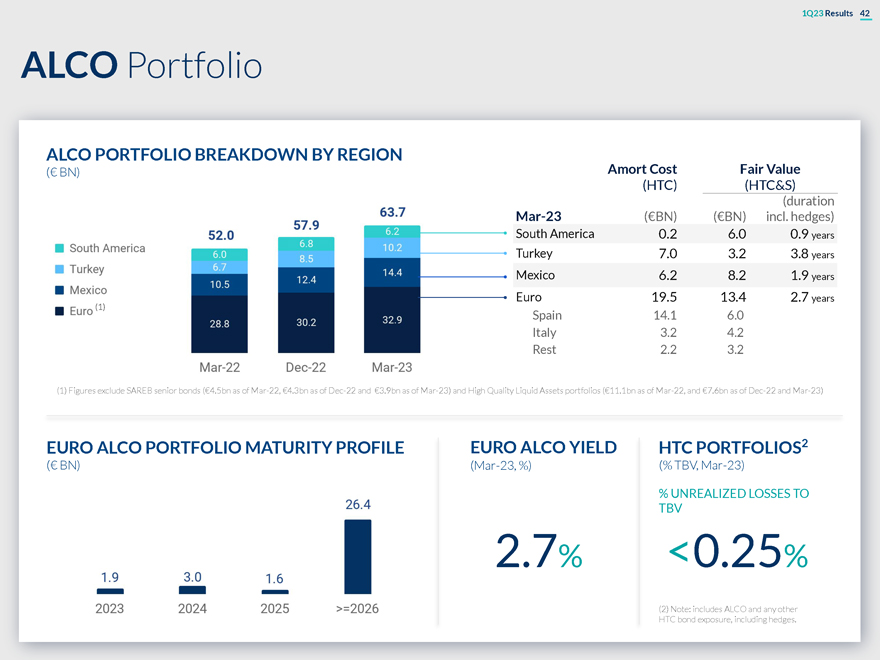
1Q23 Results 42 ALCO Portfolio ALCO PORTFOLIO BREAKDOWN BY REGION (€ BN) Amort Cost Fair Value (HTC) (HTC&S) (duration Mar-23 (€BN) (€BN) incl. hedges) South America 0.2 6.0 0.9 years Turkey 7.0 3.2 3.8 years Mexico 6.2 8.2 1.9 years Euro 19.5 13.4 2.7 years (1) Spain 14.1 6.0 Italy 3.2 4.2 Rest 2.2 3.2 (1) Figures exclude SAREB senior bonds (€4.5bn as of Mar-22, €4.3bn as of Dec-22 and €3.9bn as of Mar-23) and High Quality Liquid Assets portfolios (€11.1bn as of Mar-22, and €7.6bn as of Dec-22 and Mar-23) EURO ALCO PORTFOLIO MATURITY PROFILE EURO ALCO YIELD HTC PORTFOLIOS2 (€ BN) (Mar-23, %) (% TBV, Mar-23) % UNREALIZED LOSSES TO TBV 2.7% <0.25% (2) Note: includes ALCO and any other HTC bond exposure, including hedges.
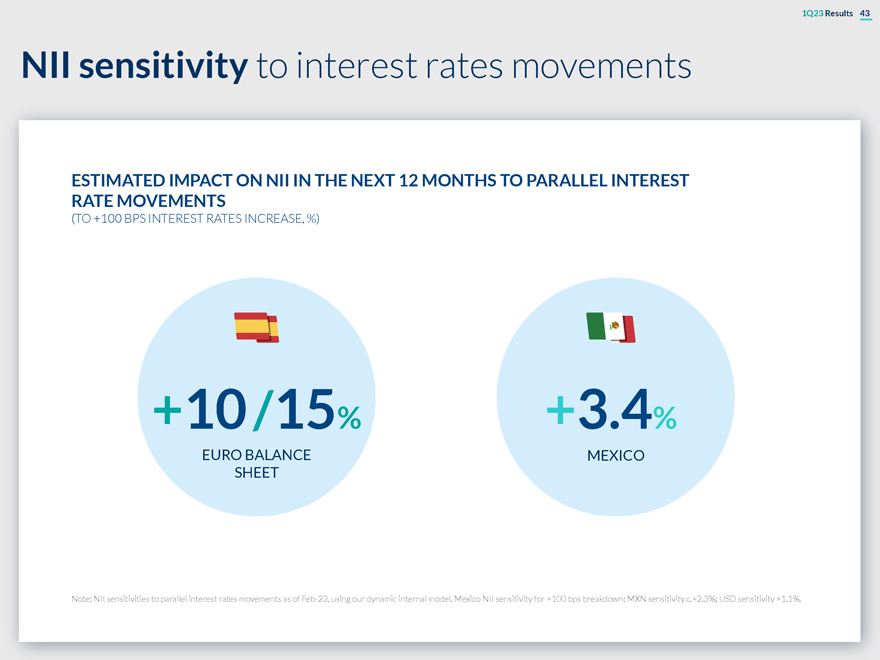
1Q23 Results 43 NII sensitivity to interest rates movements ESTIMATED IMPACT ON NII IN THE NEXT 12 MONTHS TO PARALLEL INTEREST RATE MOVEMENTS (TO +100 BPS INTEREST RATES INCREASE, %) +10 /15% +3.4% EURO BALANCE MEXICO SHEET Note: NII sensitivities to parallel interest rates movements as of Feb-23, using our dynamic internal model. Mexico NII sensitivity for +100 bps breakdown: MXN sensitivity c.+2.3%; USD sensitivity +1.1%.
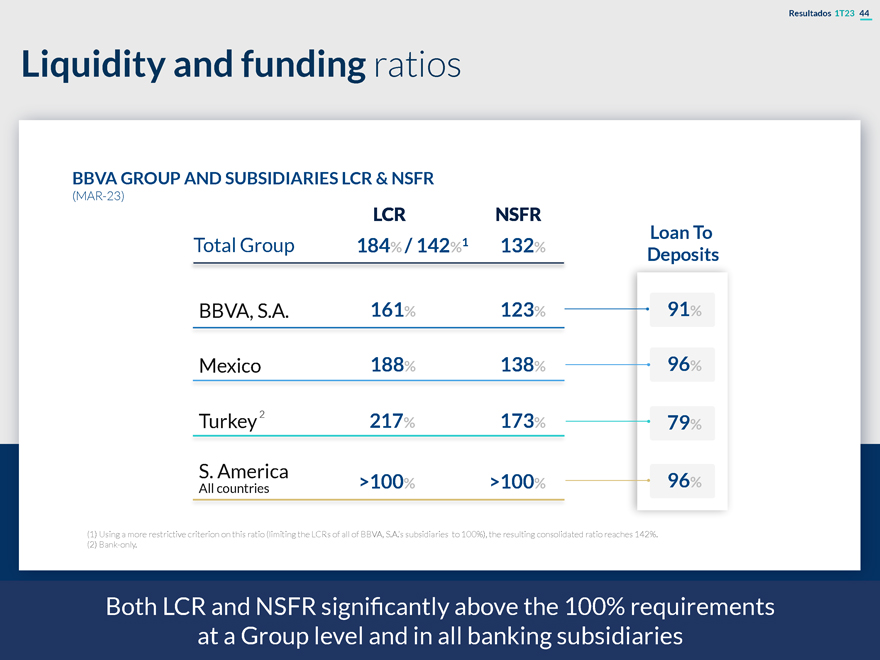
Resultados 1T23 44 Liquidity and funding ratios BBVA GROUP AND SUBSIDIARIES LCR & NSFR (MAR-23) LCR NSFR Loan To Total Group 184% / 142%1 132% Deposits BBVA, S.A. 161% 123% 91% Mexico 188% 138% 96% 2 217 Turkey % 173% 79% S. America >100% >100% 96% All countries (1) Using a more restrictive criterion on this ratio (limiting the LCRs of all of BBVA, S.A.’s subsidiaries to 100%), the resulting consolidated ratio reaches 142%. (2) Bank-only. Both LCR and NSFR significantly above the 100% requirements at a Group level and in all banking subsidiaries

08 CET1 Sensitivity to market impacts
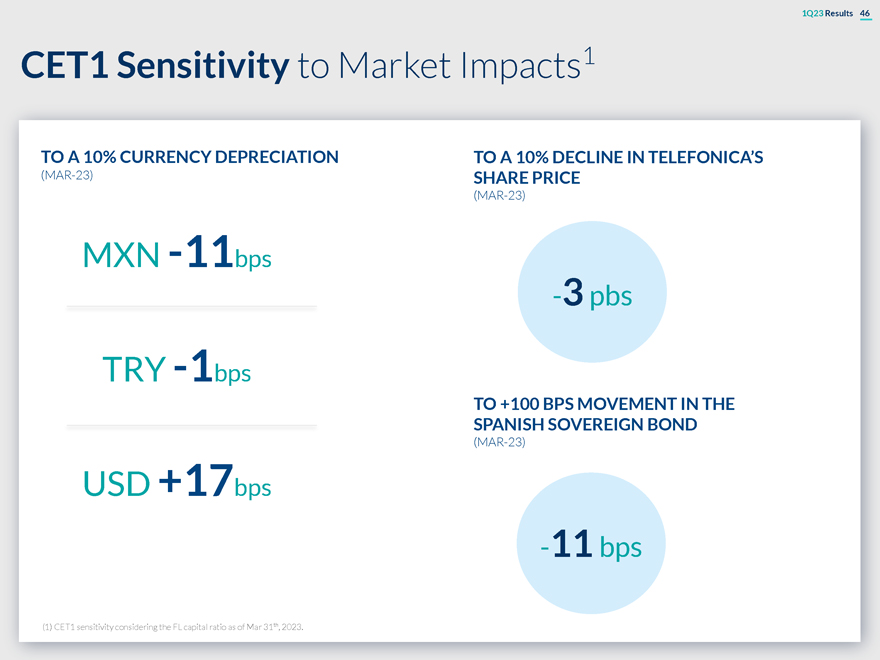
1Q23 Results 46 CET1 Sensitivity to Market Impacts1 TO A 10% CURRENCY DEPRECIATION TO A 10% DECLINE IN TELEFONICA’S (MAR-23) SHARE PRICE (MAR-23) MXN -11bps -3 pbs TRY -1bps TO +100 BPS MOVEMENT IN THE SPANISH SOVEREIGN BOND (MAR-23) USD +17bps -11 bps (1) CET1 sensitivity considering the FL capital ratio as of Mar 31th, 2023.

9 RWAs by business area
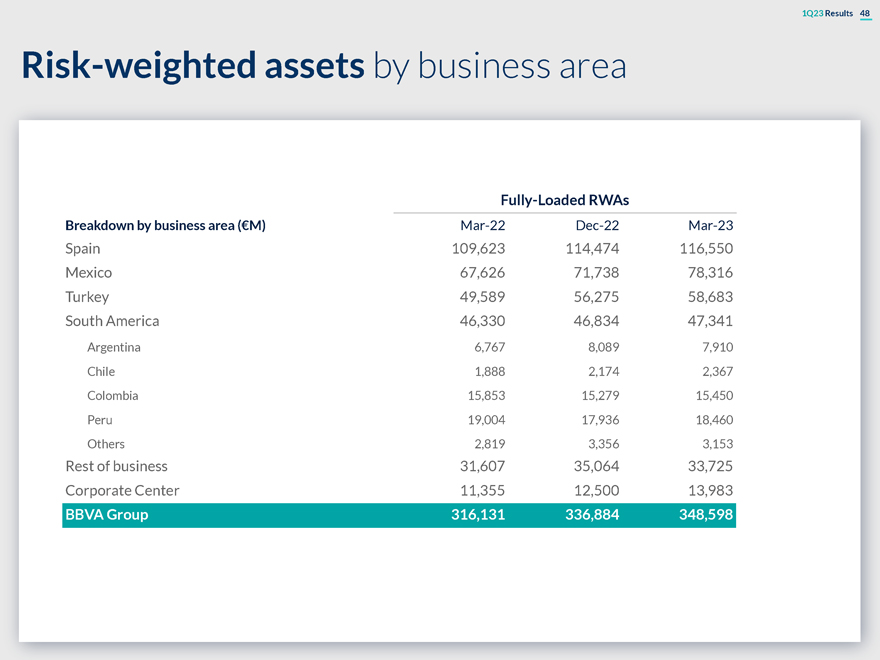
1Q23 Results 48 Risk-weighted assets by business area Fully-Loaded RWAs Breakdown by business area (€M) Mar-22 Dec-22 Mar-23 Spain 109,623 114,474 116,550 Mexico 67,626 71,738 78,316 Turkey 49,589 56,275 58,683 South America 46,330 46,834 47,341 Argentina 6,767 8,089 7,910 Chile 1,888 2,174 2,367 Colombia 15,853 15,279 15,450 Peru 19,004 17,936 18,460 Others 2,819 3,356 3,153 Rest of business 31,607 35,064 33,725 Corporate Center 11,355 12,500 13,983 BBVA Group 316,131 336,884 348,598

10 Book Value of the main subsidiaries
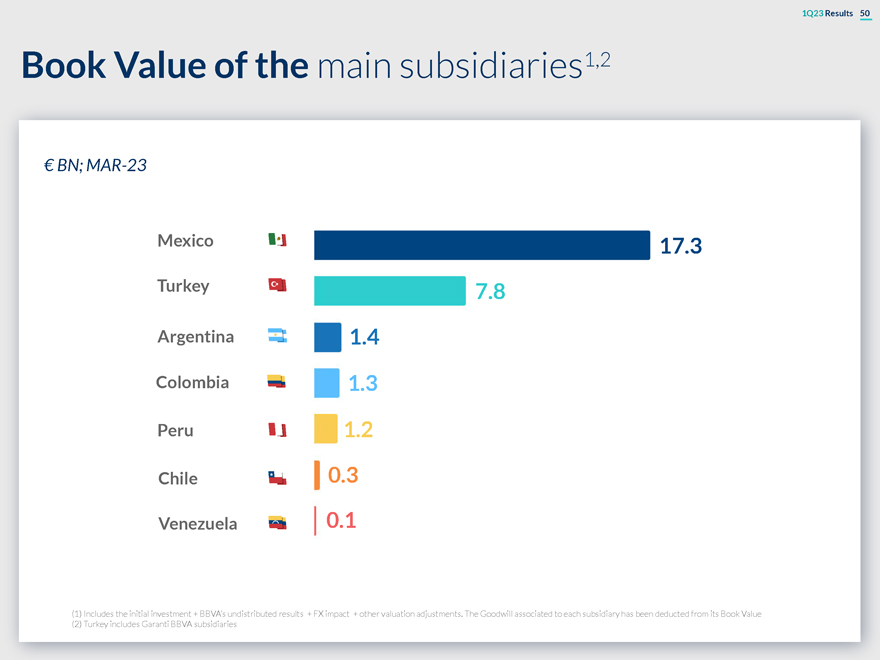
1Q23 Results 50 Book Value of the main subsidiaries1,2 € BN; MAR-23 Mexico 17.3 Turkey 7.8 Argentina 1.4 Colombia 1.3 Peru 1.2 Chile 0.3 Venezuela 0.1 (1) Includes the initial investment + BBVA’s undistributed results + FX impact + other valuation adjustments. The Goodwill associated to each subsidiary has been deducted from its Book Value (2) Turkey includes Garanti BBVA subsidiaries
11 TBV per share & dividends evolution
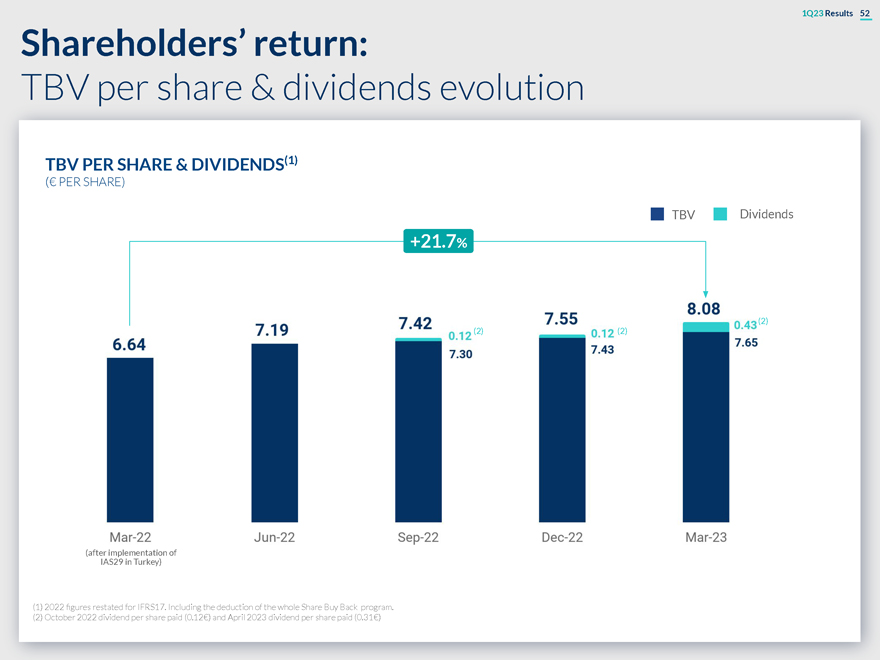
1Q23 Results 52 Shareholders’ return: TBV per share & dividends evolution TBV PER SHARE & DIVIDENDS(1) (€ PER SHARE) TBV Dividends +21.7% (2) (2) (2) (after implementation of IAS29 in Turkey) (1) 2022 figures restated for IFRS17. Including the deduction of the whole Share Buy Back program. (2) October 2022 dividend per share paid (0.12€) and April 2023 dividend per share paid (0.31€)

12 MREL
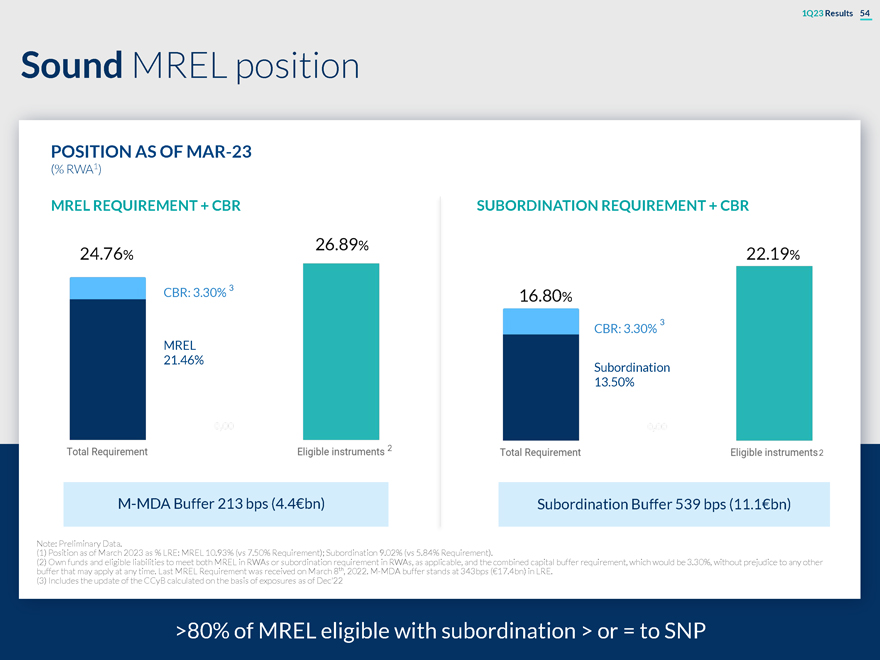
1Q23 Results 54 Sound MREL position POSITION AS OF MAR-23 (% RWA1) MREL REQUIREMENT + CBR SUBORDINATION REQUIREMENT + CBR 26.89% 24.76% 22.19% CBR: 3.30% 3 16.80% 3 CBR: 3.30% MREL 21.46% Subordination 13.50% 2 2 M-MDA Buffer 213 bps (4.4€bn) Subordination Buffer 539 bps (11.1€bn) Note: Preliminary Data. (1) Position as of March 2023 as % LRE: MREL 10.93% (vs 7.50% Requirement); Subordination 9.02% (vs 5.84% Requirement). (2) Own funds and eligible liabilities to meet both MREL in RWAs or subordination requirement in RWAs, as applicable, and the combined capital buffer requirement, which would be 3.30%, without prejudice to any other buffer that may apply at any time. Last MREL Requirement was received on March 8th, 2022. M-MDA buffer stands at 343bps (€17.4bn) in LRE. (3) Includes the update of the CCyB calculated on the basis of exposures as of Dec’22 >80% of MREL eligible with subordination > or = to SNP

13 Digital metrics Digital & mobile Digital customers sales
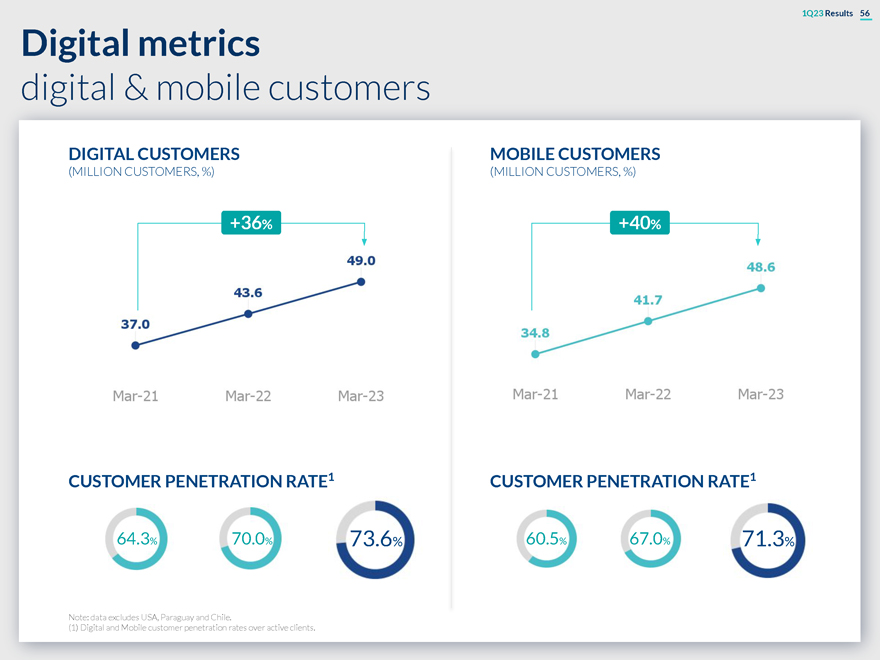
1Q23 Results 56 Digital metrics digital & mobile customers DIGITAL CUSTOMERS MOBILE CUSTOMERS (MILLION CUSTOMERS, %) (MILLION CUSTOMERS, %) +36% +40% CUSTOMER PENETRATION RATE1 CUSTOMER PENETRATION RATE1 64.3% 70.0% 73.6% 60.5% 67.0% 71.3% Note: data excludes USA, Paraguay and Chile. (1) Digital and Mobile customer penetration rates over active clients.
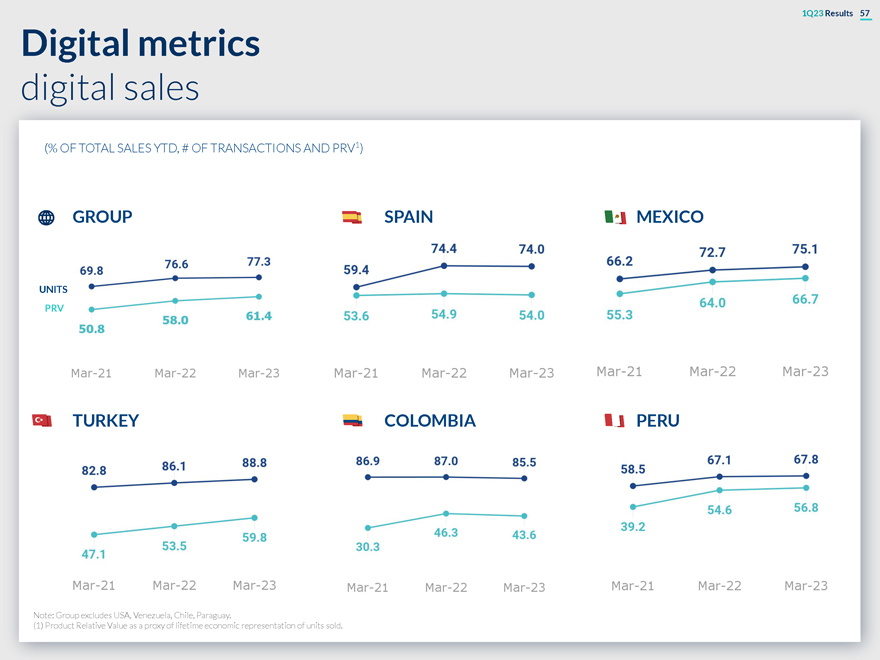
1Q23 Results 57 Digital metrics digital sales (% OF TOTAL SALES YTD, # OF TRANSACTIONS AND PRV1) GROUP SPAIN MEXICO UNITS PRV TURKEY COLOMBIA PERU Note: Group excludes USA, Venezuela, Chile, Paraguay. (1) Product Relative Value as a proxy of lifetime economic representation of units sold.

BBVA
SIGNATURE
Pursuant to the requirements of the Securities Exchange Act of 1934, the registrant has duly caused this report to be signed on its behalf by the undersigned, thereunto duly authorized.
| Banco Bilbao Vizcaya Argentaria, S.A. | ||
| Date: April 27, 2023 | ||
| By: /s/ María Ángeles Peláez Morón | ||
| Name: María Ángeles Peláez Morón | ||
| Title: Authorized representative | ||