INVESTOR UPDATE THIRD QUARTER 2018 UNLESS OTHERWISE INDICATED, ALL RPT OPERATING INFORMATION IS PRESENTED ON A CONSOLIDATED BASIS AND IS AS OF OR FOR THE QUARTER ENDED SEPTEMBER 30, 2018. ALL DEMOGRAPHIC DATA IS SOURCED FROM ESRI, UNLESS OTHERWISE NOTED. FOOTNOTES AND NON-GAAP RECONCILIATIONS ARE INCLUDED AT THE END OF THE UPDATE.

FORWARD-LOOKING STATEMENTS This document contains forward-looking statements within the meaning of Section 27A of the Securities Act of 1933, as amended, and Section 21E of the Securities Exchange Act of 1934, as amended. These forward-looking statements represent our expectations, plans or beliefs concerning future events and may be identified by terminology such as “may,” “will,” “should,” “believe,” “expect,” “estimate,” “anticipate,” “continue,” “predict” or similar terms. Although the forward- looking statements made in this document are based on our good faith beliefs, reasonable assumptions and our best judgment based upon current information, certain factors could cause actual results to differ materially from those in the forward-looking statements, including: our success or failure in implementing our business strategy; economic conditions generally and in the commercial real estate and finance markets specifically; the cost and availability of capital, which depends in part on our asset quality and our relationships with lenders and other capital providers; our business prospects and outlook; changes in governmental regulations, tax rates and similar matters; our continuing to qualify as a REIT; and other factors discussed elsewhere in this document and our other filings with the SEC, including our Annual Report on Form 10-K for the year ended December 31, 2017. Given these uncertainties, you should not place undue reliance on any forward-looking statements. Except as required by law, we assume no obligation to update these forward-looking statements, even if new information becomes available in the future. RPT + INVESTOR UPDATE THIRD QUARTER 2018 2
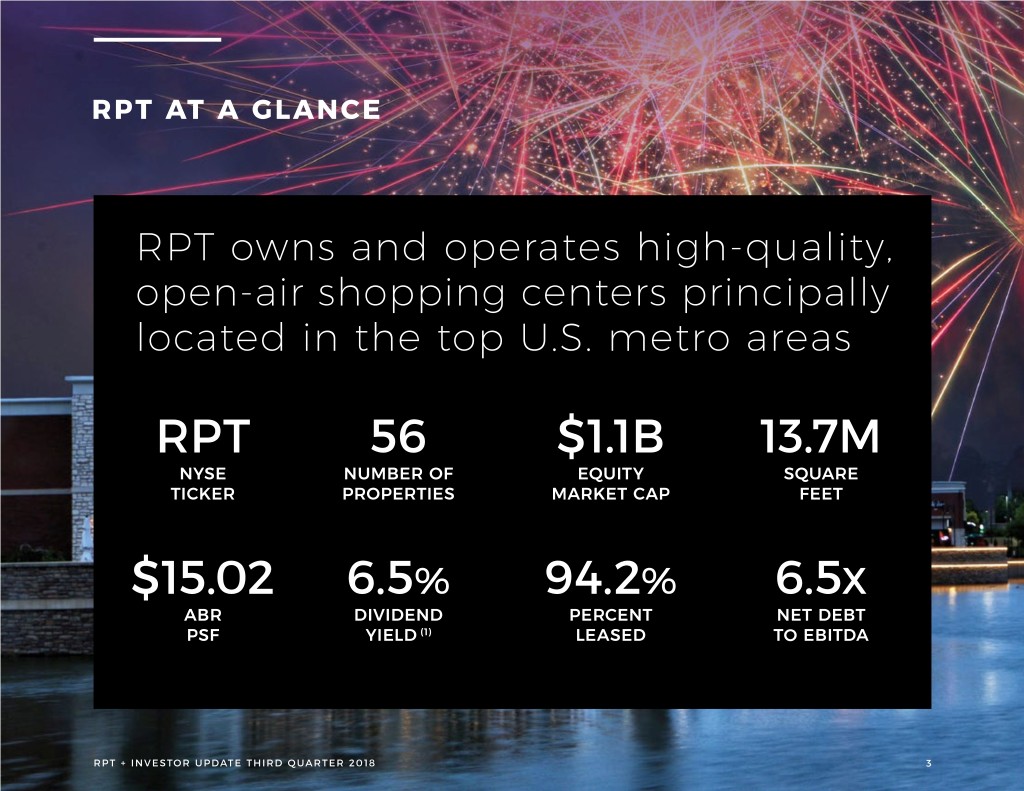
RPT AT A GLANCE RPT owns and operates high-quality, open-air shopping centers principally located in the top U.S. metro areas RPT 56 $1.1B 13.7M NYSE NUMBER OF EQUITY SQUARE TICKER PROPERTIES MARKET CAP FEET $15.02 6.5% 94.2% 6.5X ABR DIVIDEND PERCENT NET DEBT PSF YIELD (1) LEASED TO EBITDA RPT + INVESTOR UPDATE THIRD QUARTER 2018 3

WHY INVEST IN RPT? 01 02 03 An ability to move An underappreciated, An organizational swiftly to significantly high-quality portfolio platform poised and improve the portfolio, with untapped motivated to lay the balance sheet and potential foundation to position operating platform RPT for long-term sustainable growth 04 05 A disciplined capital A transparent, allocation approach accessible and that is aligned with energized executive shareholder interests management team RPT + INVESTOR UPDATE THIRD QUARTER 2018 4

DOCKET 01 02 03 PORTFOLIO BALANCE LOOKING SHEET AHEAD

01 PORTFOLIO
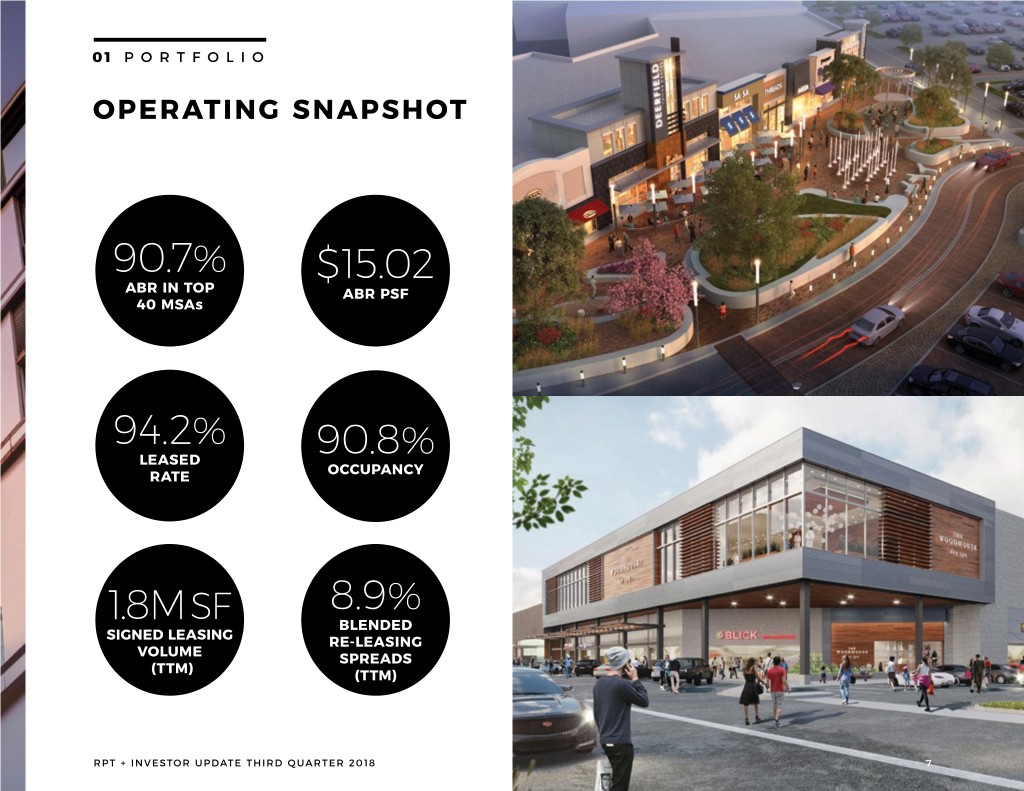
01 PORTFOLIO OPERATING SNAPSHOT 90.7% $15.02 ABR IN TOP ABR PSF 40 MSAs 94.2% LEASED 90.8% OCCUPANCY RATE 8.9% 1 . 8 M SF BLENDED SIGNED LEASING RE-LEASING VOLUME SPREADS (TTM) (TTM) RPT + INVESTOR UPDATE THIRD QUARTER 2018 7

01 PORTFOLIO SNAPSHOT Nearly 60% of portfolio is grocery-anchored(1) COMMUNITY LIFESTYLE POWER SHOPPING CENTER CENTER(2) CENTER 47.9% 29.0% 23.1% Based on ABR RPT + INVESTOR UPDATE THIRD QUARTER 2018 8
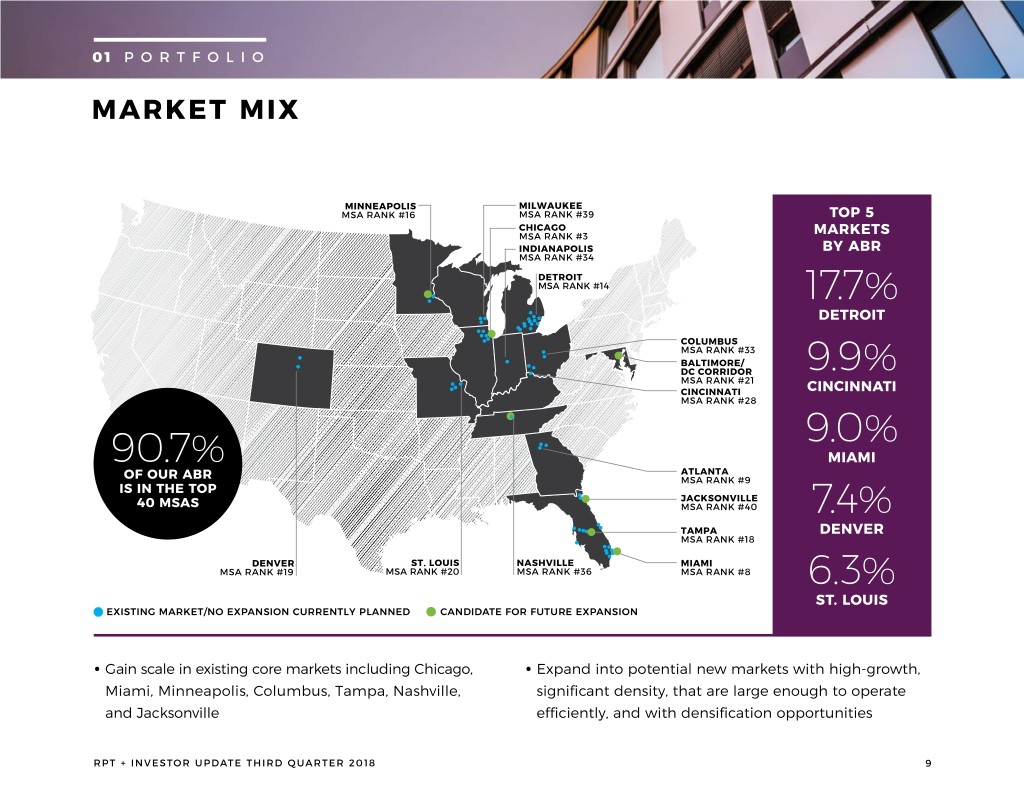
01 PORTFOLIO MARKET MIX MINNEAPOLIS MILWAUKEE MSA RANK #�� MSA RANK #�� TOP 5 CHICAGO MSA RANK #� MARKETS INDIANAPOLIS BY ABR MSA RANK #�� DETROIT MSA RANK #�� 17.7% DETROIT COLUMBUS MSA RANK #�� BALTIMORE/ DC CORRIDOR 9.9% MSA RANK #�� CINCINNATI CINCINNATI MSA RANK #�� 9.0% 90.7% MIAMI ATLANTA OF OUR ABR MSA RANK #� IS IN THE TOP JACKSONVILLE 40 MSAS MSA RANK #�� 7.4% TAMPA DENVER MSA RANK #�� DENVER ST. LOUIS NASHVILLE MIAMI MSA RANK #�� MSA RANK #�� MSA RANK #�� MSA RANK #� 6.3% ST. LOUIS EXISTING MARKET/NO EXPANSION CURRENTLY PLANNED CANDIDATE FOR FUTURE EXPANSION • Gain scale in existing core markets including Chicago, • Expand into potential new markets with high-growth, Miami, Minneapolis, Columbus, Tampa, Nashville, significant density, that are large enough to operate and Jacksonville efficiently, and with densification opportunities RPT + INVESTOR UPDATE THIRD QUARTER 2018 9
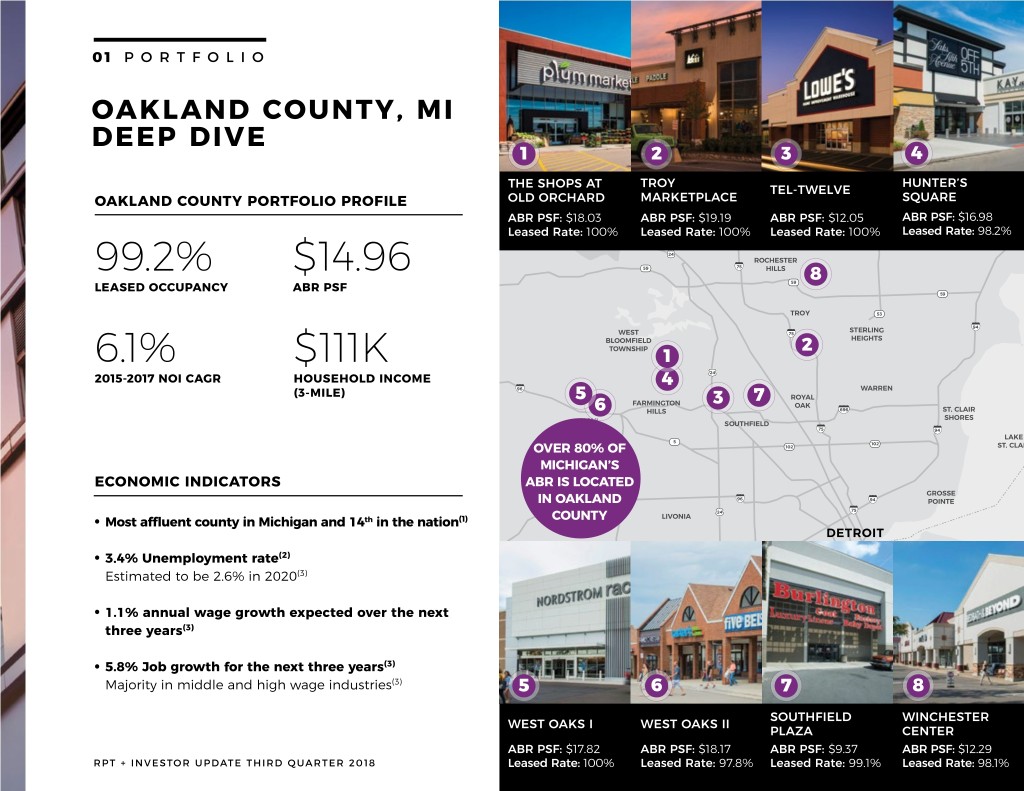
01 PORTFOLIO OAKLAND COUNTY, MI DEEP DIVE 1 2 3 4 53 24 THE SHOPS75 AT TROY HUNTER’S TEL-TWELVE OAKLAND COUNTY PORTFOLIO PROFILE OLD ORCHARD MARKETPLACE SQUARE ABR PSF: $18.03 ABR PSF: $19.19 ABR PSF: $12.05 ABR PSF: $16.98 94 Leased Rate: 100% Leased Rate: 100% Leased Rate: 100% Leased Rate: 98.2% 24 99.2% $14.96 59 75 59 8 59 LEASED OCCUPANCY ABR PSF 59 53 94 75 2 6.1% $111K 1 24 2015-2017 NOI CAGR HOUSEHOLD INCOME 4 96 (3-MILE) 5 3 7 6 696 75 94 5 102 OVER 80% OF275 102 MICHIGAN’S ECONOMIC INDICATORS ABR IS LOCATED IN OAKLAND 96 94 75 COUNTY 24 • Most affluent county in Michigan and 14th in the nation(1) (2) 3.4% Unemployment rate 275 • 75 (3) Estimated to be 2.6% in 2020 12 24 94 • 1.1% annual wage growth expected over the next three years(3) • 5.8% Job growth for the next three years(3) Majority in middle and high wage industries(3) 5 6 7 8 SOUTHFIELD WINCHESTER WEST OAKS I WEST OAKS II PLAZA CENTER ABR PSF: $17.82 ABR PSF: $18.17 ABR PSF: $9.37 ABR PSF: $12.29 RPT + INVESTOR UPDATE THIRD QUARTER 2018 Leased Rate: 100% Leased Rate: 97.8% Leased Rate: 99.1% Leased10 Rate: 98.1%
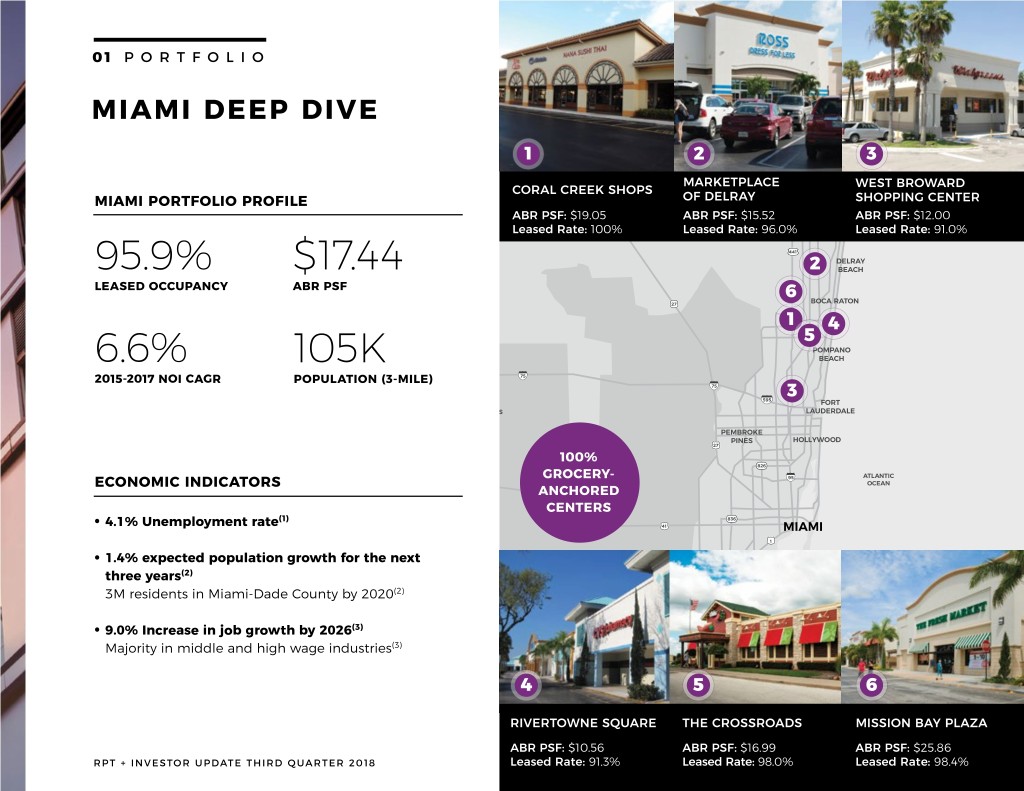
01 PORTFOLIO MIAMI DEEP DIVE 1 2 3 WEST PALM BEACH BELLE GLADE MARKETPLACE WEST BROWARD CORAL CREEK SHOPS MIAMI PORTFOLIO PROFILE OF DELRAY 882 SHOPPING CENTER ABR PSF: $19.05 ABR PSF: $15.52 812 95 ABR PSF: $12.00 Leased Rate: 100% Leased Rate: 96.0% Leased Rate: 91.0% 441 6 DELRAY 95.9% $17.4 4 2 BEACH IMMOKALEE LEASED OCCUPANCY ABR PSF 65 27 BOCA RATON 3 4 29 1 2 4 5 POMPANO 6.6% 105K BEACH 2015-2017 NOI CAGR 75 POPULATION (3-MILE) 75 31 595 FORT BIG CYPRESS LAUDERDALE NATIONAL PRESERVE PEMBROKE 29 PINES HOLLYWOOD 27 100% 826 GROCERY- 95 ATLANTIC ECONOMIC INDICATORS 41 OCEAN ANCHORED CENTERS (1) 836 • 4.1% Unemployment rate 41 MIAMI 1 • 1.4% expected population growth for the next 874 three years(2) (2) 3M residents in Miami-Dade County by 2020 1 EVERGLADES NATIONAL PARK (3) • 9.0% Increase in job growth by 2026 HOMESTEAD Majority in middle and high wage industries(3) 4 5 6 RIVERTOWNE SQUARE THE CROSSROADS MISSION BAY PLAZA ABR PSF: $10.56 ABR PSF: $16.99 ABR PSF: $25.86 RPT + INVESTOR UPDATE THIRD QUARTER 2018 Leased Rate: 91.3% Leased Rate: 98.0% Leased Rate:11 98.4%
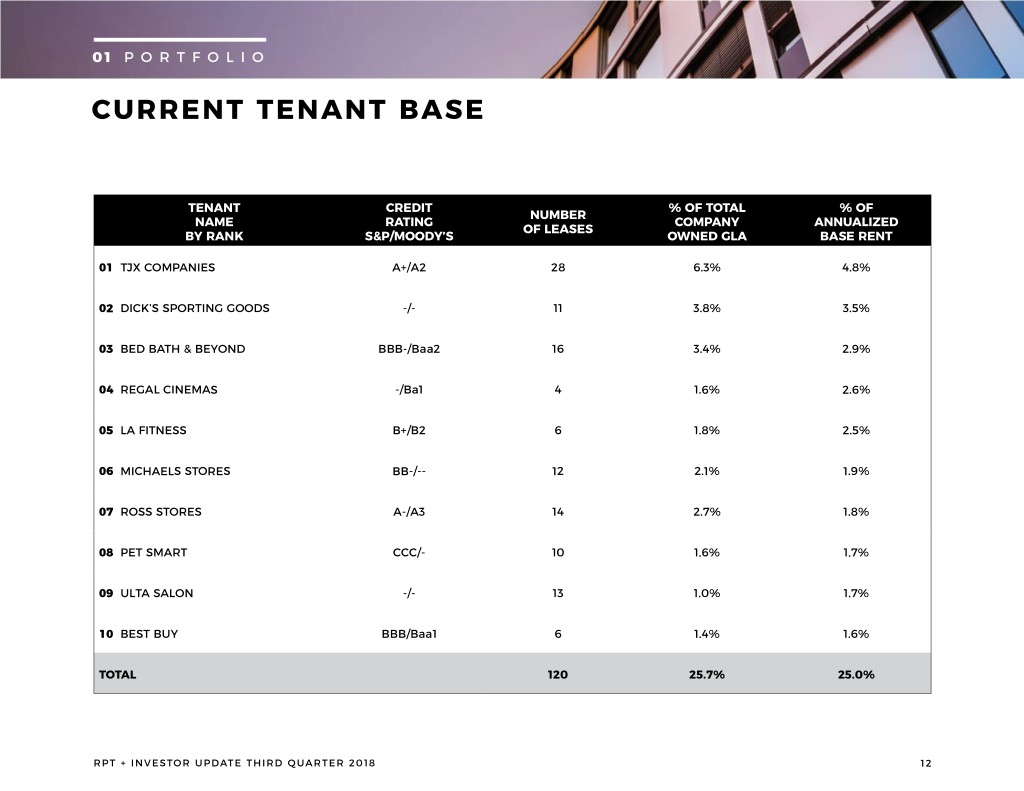
01 PORTFOLIO CURRENT TENANT BASE TENANT CREDIT % OF TOTAL % OF NUMBER NAME RATING COMPANY ANNUALIZED OF LEASES BY RANK S&P/MOODY’S OWNED GLA BASE RENT 01 TJX COMPANIES A+/A2 28 6.3% 4.8% 02 DICK’S SPORTING GOODS -/- 11 3.8% 3.5% 03 BED BATH & BEYOND BBB-/Baa2 16 3.4% 2.9% 04 REGAL CINEMAS -/Ba1 4 1.6% 2.6% 05 LA FITNESS B+/B2 6 1.8% 2.5% 06 MICHAELS STORES BB-/-- 12 2.1% 1.9% 07 ROSS STORES A-/A3 14 2.7% 1.8% 08 PET SMART CCC/- 10 1.6% 1.7% 09 ULTA SALON -/- 13 1.0% 1.7% 10 BEST BUY BBB/Baa1 6 1.4% 1.6% TOTAL 120 25.7% 25.0% RPT + INVESTOR UPDATE THIRD QUARTER 2018 12

01 PORTFOLIO MERCHANDISING MIX RESTAURANTS & ENTERTAINMENT APPAREL & ACCESSORIES OFF-PRICE/DISCOUNT SPORTS & HOBBIES 16.5% 12.6% 8.9% 7.9% GROCERY FITNESS & SPA PET STORES SERVICE 6.9% 5.5% 3.3% HOME & FURNITURE 12.3% 13.1% ELECTRONICS & OFFICE HEALTH BOOKS OTHER & BEAUTY & CARDS % 6.0 3.2% 1.9% 1.6% Based on ABR OFFICE SPACE 0.2% RPT + INVESTOR UPDATE THIRD QUARTER 2018 13

01 PORTFOLIO LEASE EXPIRATIONS Over the last twelve months, signed 197 comparable leases, representing 1.2 million square feet, at blended releasing spreads of 8.9% % of ABR expiring ABR PSF expiring Note: Excludes month-to-month leases RPT + INVESTOR UPDATE THIRD QUARTER 2018 14
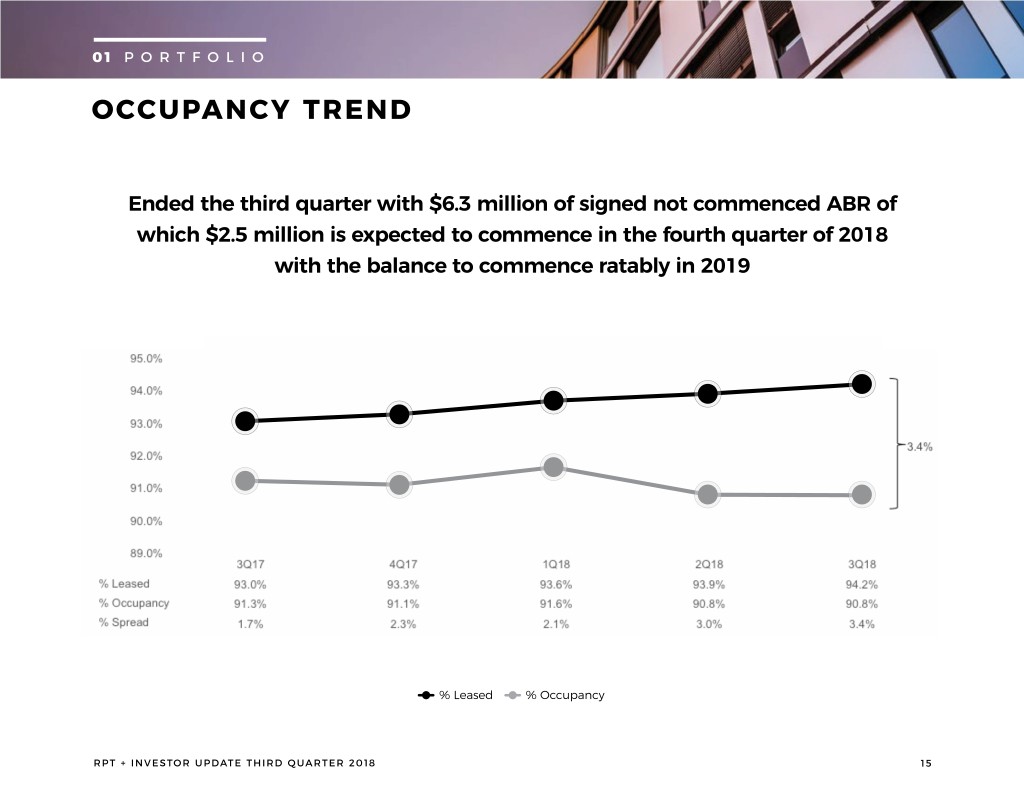
01 PORTFOLIO OCCUPANCY TREND Ended the third quarter with $6.3 million of signed not commenced ABR of which $2.5 million is expected to commence in the fourth quarter of 2018 with the balance to commence ratably in 2019 % Leased % Occupancy RPT + INVESTOR UPDATE THIRD QUARTER 2018 15

02 BALANCE SHEET
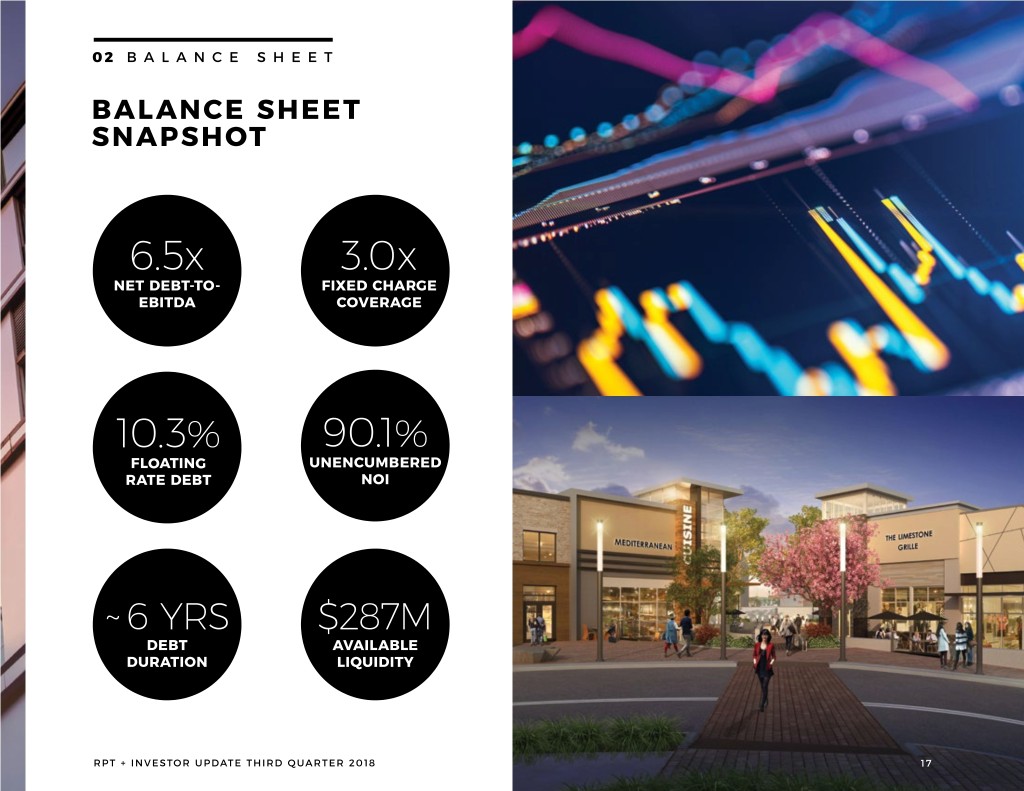
02 BALANCE SHEET BALANCE SHEET SNAPSHOT 6.5x 3.0x NET DEBT-TO- FIXED CHARGE EBITDA COVERAGE 10.3% 90.1% FLOATING UNENCUMBERED RATE DEBT NOI ~ 6 YRS $287M DEBT AVAILABLE DURATION LIQUIDITY RPT + INVESTOR UPDATE THIRD QUARTER 2018 17
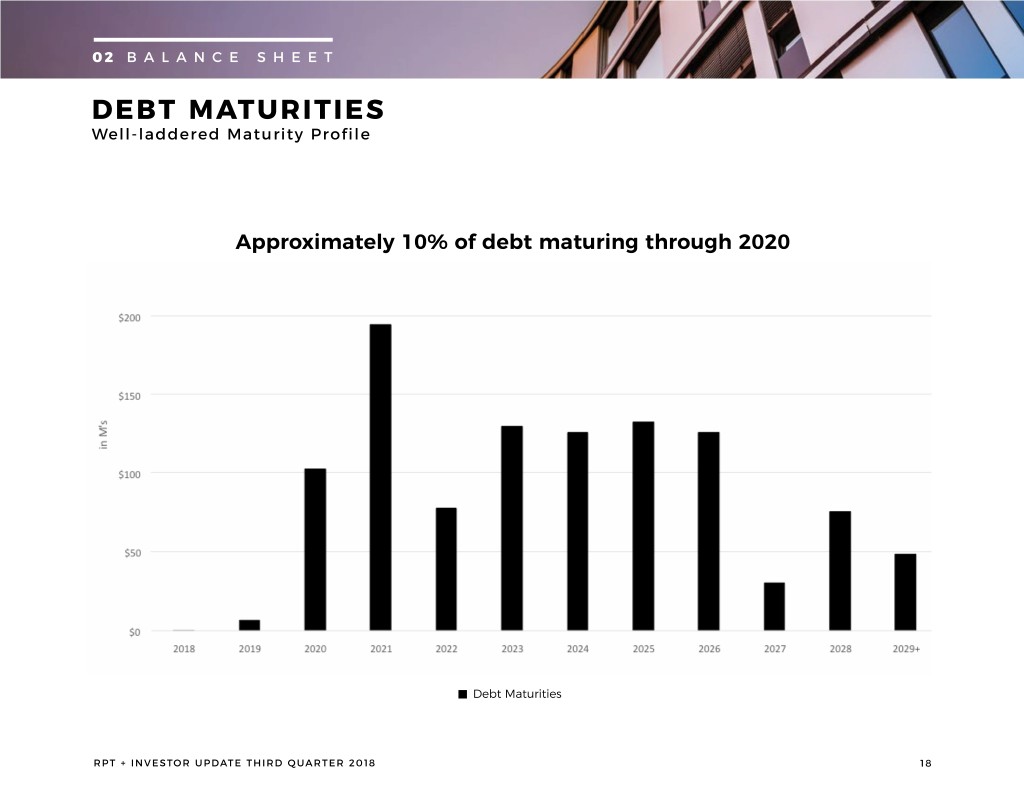
02 BALANCE SHEET DEBT MATURITIES Well-laddered Maturity Profile Approximately 10% of debt maturing through 2020 Debt Maturities RPT + INVESTOR UPDATE THIRD QUARTER 2018 18

03 LOOKING AHEAD
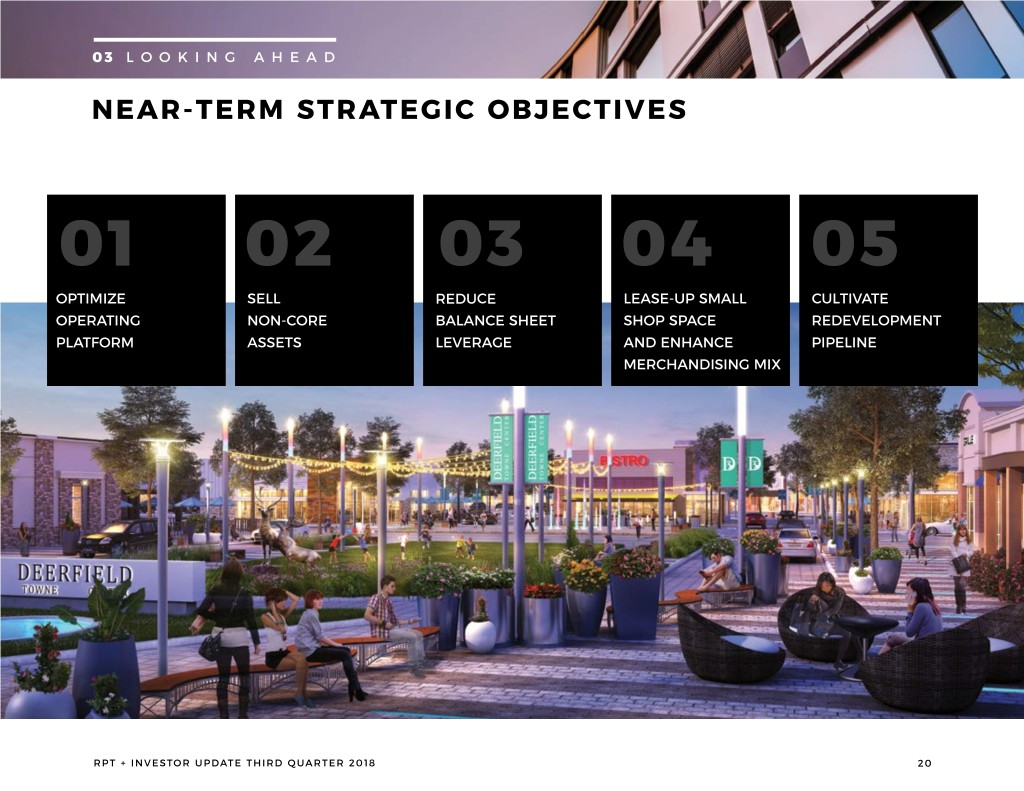
03 LOOKING AHEAD NEAR-TERM STRATEGIC OBJECTIVES 01 02 03 04 05 OPTIMIZE SELL REDUCE LEASE-UP SMALL CULTIVATE OPERATING NON-CORE BALANCE SHEET SHOP SPACE REDEVELOPMENT PLATFORM ASSETS LEVERAGE AND ENHANCE PIPELINE MERCHANDISING MIX RPT + INVESTOR UPDATE THIRD QUARTER 2018 20

03 LOOKING AHEAD EXECUTIVE TEAM Over 100 years of combined real estate experience BRIAN HARPER MIKE FITZMAURICE PRESIDENT & CEO EVP & CFO • 20 years of retail experience in both • 19 years in real estate finance open air and mall sectors and accounting • Former CEO of Rouse Properties • Former SVP of Finance at RPAI • Start date - June 2018 • Start date - June 2018 TIM COLLIER CATHY CLARK EVP, LEASING EVP, TRANSACTIONS • 21 years in leasing and merchandising • 35 years in real estate transactions • Former head of leasing at • Former VP of the Fourmidable Group Acadia Realty Trust • Start date - February 1997 • Start date - August 2018 JONATHAN KRAUSCHE RAY MERK SVP, DEVELOPMENT SVP, CHIEF ACCOUNTING OFFICER • 21 years of construction and • 36 years in accounting and finance development experience • Former CFO of DynaVox Inc. • Former VP of development & tenant Start date - September 2016 coordination at Westfield • • Start date - September 2018 RPT + INVESTOR UPDATE THIRD QUARTER 2018 21
0103 OPERATINGLOOKING AHEAD PLATFORM OPTIMIZING OUR OPERATING PLATFORM STREAMLINED ENHANCED NEW YORK STRUCTURE PROCESSES OFFICE AND TOOLS Simplified from a two-region • Management team, plus key • finance and support roles will structure to a singular • Implemented several oversight office out of the New York City one, streamlining leasing, and review processes to ensure area starting September 2018 property management and proper governance of capital • Presence in the New York area redevelopment allocation will provide management with • Expect to decentralize Executive Lease and greater access to investors, • bankers, and retailers leasing, property management Investment Committee and redevelopment to our • Legal Leasing Tracking Calls MICHIGAN local markets to optimize the • Bi-weekly Property Portfolio growth profile of our assets Reviews OFFICE Streamlining our organizational • • Leasing Portfolio Reviews • Lease expiring in 2019 offers structure has resulted in • Investing in a best in class opportunity to inaugurate approximately $2 million of business intelligence tool new RPT office in Detroit ongoing annual net cash savings Metropolitan area RPT + INVESTOR UPDATE THIRD QUARTER 2018 22
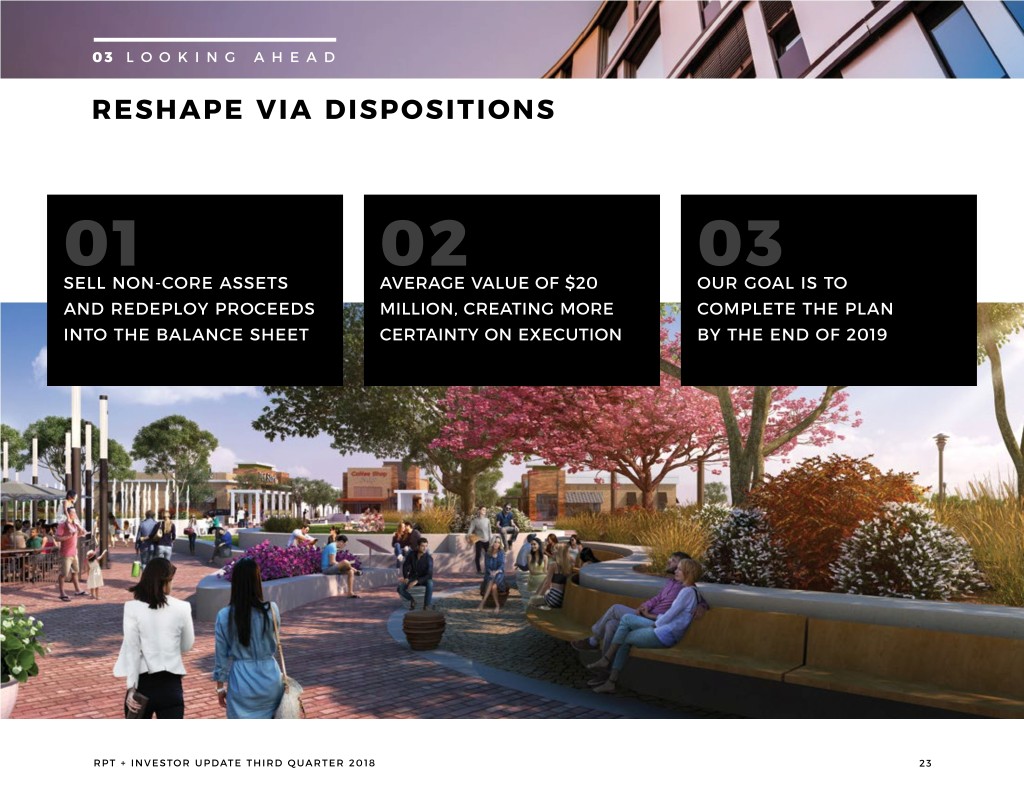
03 LOOKING AHEAD RESHAPE VIA DISPOSITIONS 01 02 03 SELL NON-CORE ASSETS AVERAGE VALUE OF $20 OUR GOAL IS TO AND REDEPLOY PROCEEDS MILLION, CREATING MORE COMPLETE THE PLAN INTO THE BALANCE SHEET CERTAINTY ON EXECUTION BY THE END OF 2019 RPT + INVESTOR UPDATE THIRD QUARTER 2018 23
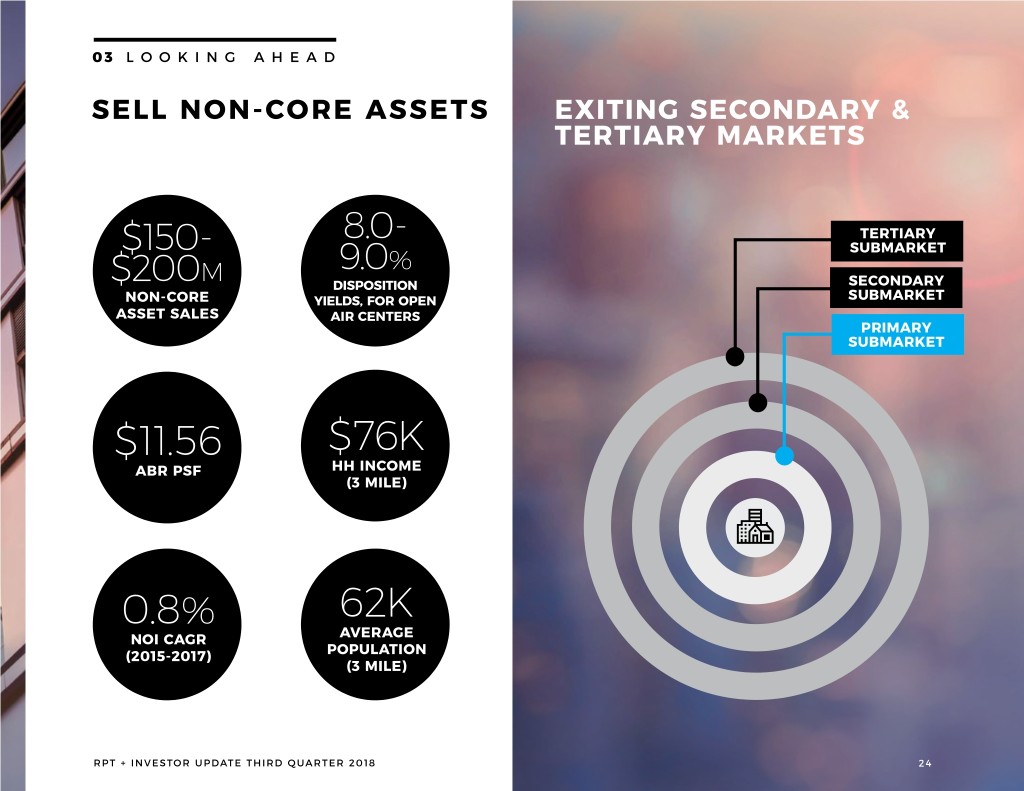
03 LOOKING AHEAD SELL NON-CORE ASSETS EXITING SECONDARY & TERTIARY MARKETS 8.0- TERTIARY $150- SUBMARKET M 9.0% $200 DISPOSITION SECONDARY NON-CORE YIELDS, FOR OPEN SUBMARKET ASSET SALES AIR CENTERS PRIMARY SUBMARKET $11.56 $76K ABR PSF HH INCOME (3 MILE) 0.8% 62K NOI CAGR AVERAGE (2015-2017) POPULATION (3 MILE) RPT + INVESTOR UPDATE THIRD QUARTER 2018 24

03 LOOKING AHEAD DELEVERING Asset sale proceeds will be used to reduce net debt to EBITDA to 5.5x - 6.0x Pre-payable Debt (w/o fee) $318M Pre-payable Debt (w/ fee) $729M Note: Includes capital leases RPT + INVESTOR UPDATE THIRD QUARTER 2018 25

03 LOOKING AHEAD SMALL SHOP OPPORTUNITY 100% Tactical Plan 95% 91-92%92% • Place internal leasing agents in core Represents 90% markets to drive rent and occupancy $2 - 3M in ABR 88%87% 85% • Develop an elevated leasing and merchandising strategy for each asset 80% Drive better pricing with retailers 75% • TODAY STABILIZED Percent Leased Percent Leased Incentivize leasing agents to drive Every 1% increase in small shop • • annual growth within leases occupancy results in $800K of incremental ABR(1) RPT + INVESTOR UPDATE THIRD QUARTER 2018 26

03 LOOKING AHEAD TARGETED TENANT BASE Open air shopping centers are moving away from commoditized shopping experiences and toward a broadened value proposition for consumers that e-commerce can’t satisfy FIT FABULOUS FOOD RPT + INVESTOR UPDATE THIRD QUARTER 2018 27

03 LOOKING AHEAD IN HER PATH: TOWN & COUNTRY CROSSING Town & Country, Missouri • Dominant town center strategically located at the intersection of Highway 141 and Clayton Road • Whole Foods Market and Target attract a relevant and strong merchandising mix • Affluent area with average household income of $134,000 FIT FABULOUS FOOD (1) RPT + INVESTOR UPDATE THIRD QUARTER 2018 28

03 LOOKING AHEAD CULTIVATING A BEST IN CLASS DEVELOPMENT PIPELINE The development/redevelopment strategy follows two distinct parallels: 01 Densification of key properties by adding multi-family residential, office, hospitality, entertainment, food, service, soft goods, or a combination thereof. These properties will become the premier properties in the portfolio that will be used to “illustrate” the new RPT 02 At the same time we will continue to expand GLA or develop new opportunities in core properties RPT + INVESTOR UPDATE THIRD QUARTER 2018 29

03 LOOKING AHEAD CULTIVATING A BEST IN CLASS DEVELOPMENT PIPELINE A Selection of Densification Opportunities SHOPS ON LANE - COLUMBUS, OH WEBSTER PLACE - CHICAGO, IL CENTENNIAL SHOPS - MINNEAPOLIS, MN RIVERTOWNE SQUARE - MIAMI, FL PARKWAY SHOPS - JACKSONVILLE, FL WOODBURY LAKES - MINNEAPOLIS, MN RPT + INVESTOR UPDATE THIRD QUARTER 2018 30
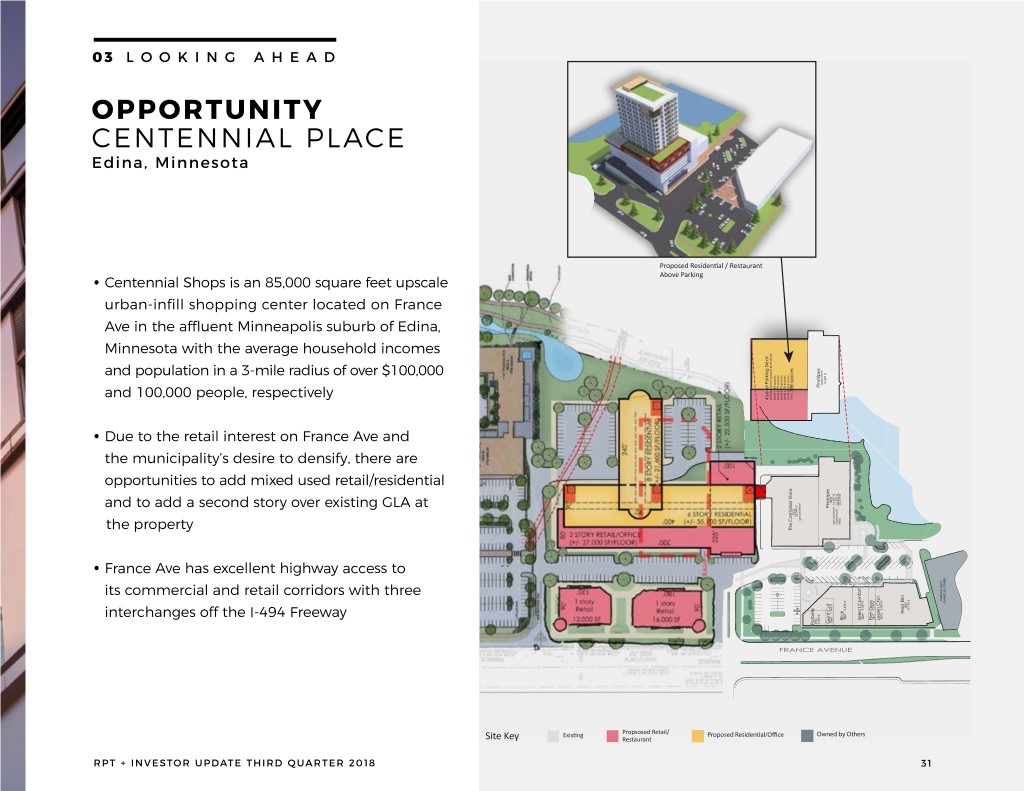
03 LOOKING AHEAD OPPORTUNITY CENTENNIAL PLACE Edina, Minnesota • Centennial Shops is an 85,000 square feet upscale urban-infill shopping center located on France Ave in the affluent Minneapolis suburb of Edina, Minnesota with the average household incomes and population in a 3-mile radius of over $100,000 and 100,000 people, respectively • Due to the retail interest on France Ave and the municipality’s desire to densify, there are opportunities to add mixed used retail/residential and to add a second story over existing GLA at the property • France Ave has excellent highway access to its commercial and retail corridors with three interchanges off the I-494 Freeway Site Key RPT + INVESTOR UPDATE THIRD QUARTER 2018 31
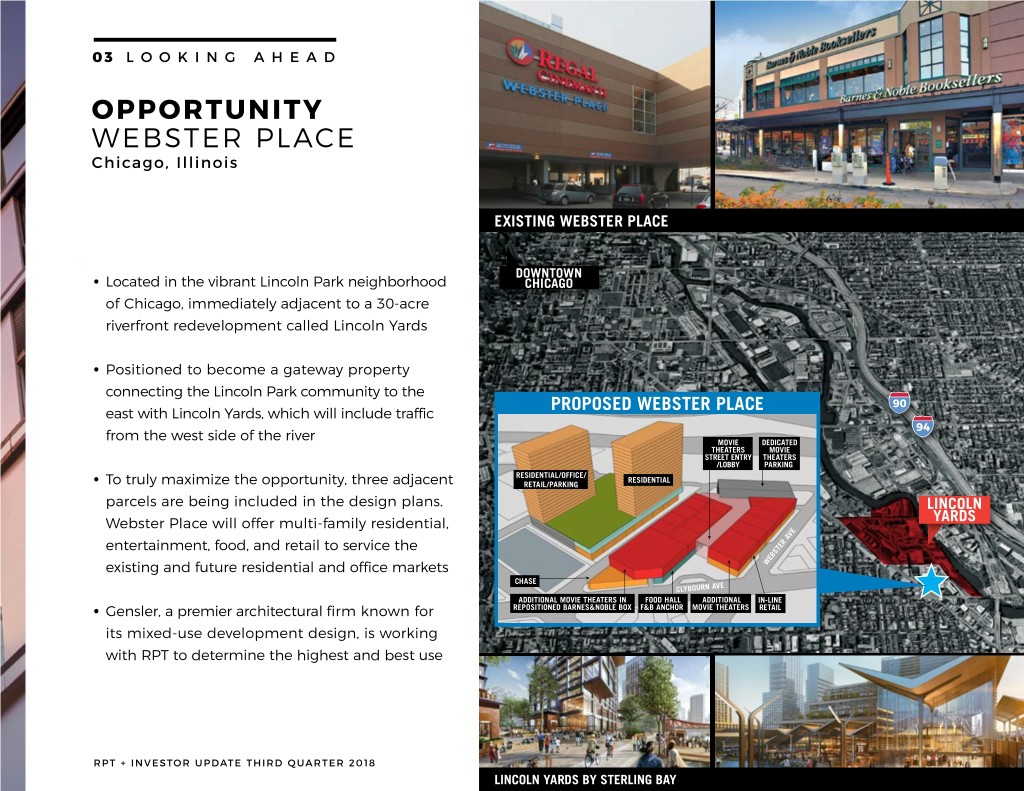
03 LOOKING AHEAD OPPORTUNITY WEBSTER PLACE Chicago, Illinois EXISTING WEBSTER PLACE DOWNTOWN • Located in the vibrant Lincoln Park neighborhood CHICAGO of Chicago, immediately adjacent to a 30-acre riverfront redevelopment called Lincoln Yards • Positioned to become a gateway property connecting the Lincoln Park community to the PROPOSED WEBSTER PLACE 90 east with Lincoln Yards, which will include traffic 94 from the west side of the river �OVIE DEDICATED THEATERS �OVIE STREET ENTRY THEATERS �LOBBY PAR�ING RESIDENTIAL�O��ICE� RESIDENTIAL • To truly maximize the opportunity, three adjacent RETAIL�PAR�ING parcels are being included in the design plans. LINCOLN YARDS Webster Place will offer multi-family residential, entertainment, food, and retail to service the existing and future residential and office markets WEBSTER AVE CHASE CLYBOURN AVE ADDITIONAL �OVIE THEATERS IN �OOD HALL ADDITIONAL IN�LINE • Gensler, a premier architectural firm known for REPOSITIONED BARNES�NOBLE BOX ��B ANCHOR �OVIE THEATERS RETAIL its mixed-use development design, is working with RPT to determine the highest and best use RPT + INVESTOR UPDATE THIRD QUARTER 2018 32 LINCOLN YARDS BY STERLING BAY
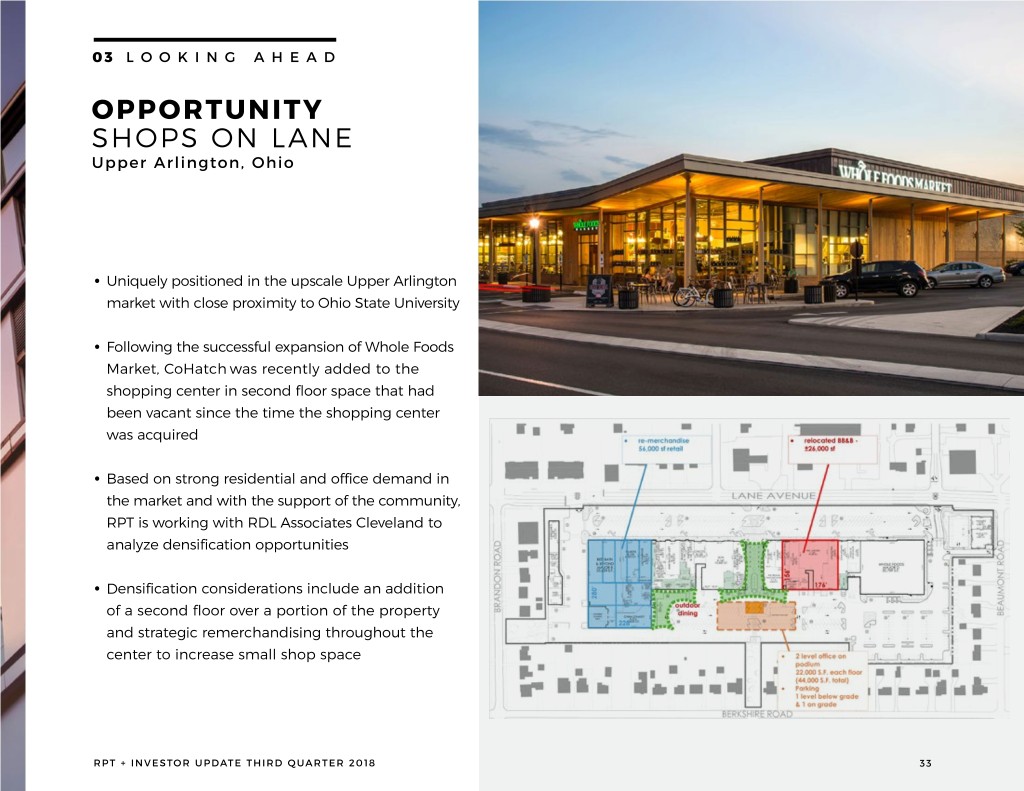
03 LOOKING AHEAD OPPORTUNITY SHOPS ON LANE Upper Arlington, Ohio • Uniquely positioned in the upscale Upper Arlington market with close proximity to Ohio State University • Following the successful expansion of Whole Foods Market, CoHatch was recently added to the shopping center in second floor space that had been vacant since the time the shopping center was acquired • Based on strong residential and office demand in the market and with the support of the community, RPT is working with RDL Associates Cleveland to analyze densification opportunities • Densification considerations include an addition of a second floor over a portion of the property and strategic remerchandising throughout the center to increase small shop space RPT + INVESTOR UPDATE THIRD QUARTER 2018 33

03 LOOKING AHEAD OPPORTUNITY RIVERTOWNE SQUARE Deerfield Beach, Florida PROPOSED RIVERTOWNE SQUARE • Rivertowne Square is situated in densely populated Deerfield Beach and is a principal city of the Miami metropolitan area • One of the most important competitive advantages that the City of Deerfield Beach has is its strategic location. The City is strategically located in Broward County and centrally located in the larger Tri-County region. The City has excellent highway access to its commercial and industrial corridors with two interchanges on I-95 and direct access to the Florida Turnpike and Sawgrass Expressway from SW 10th Street. Traffic counts in front of Rivertowne Square exceed 40,000 vehicles per day • Demand remains strong for a broad mix of uses including residential, retail and hotel in this high barrier to entry market RPT + INVESTOR UPDATE THIRD QUARTER 2018 34
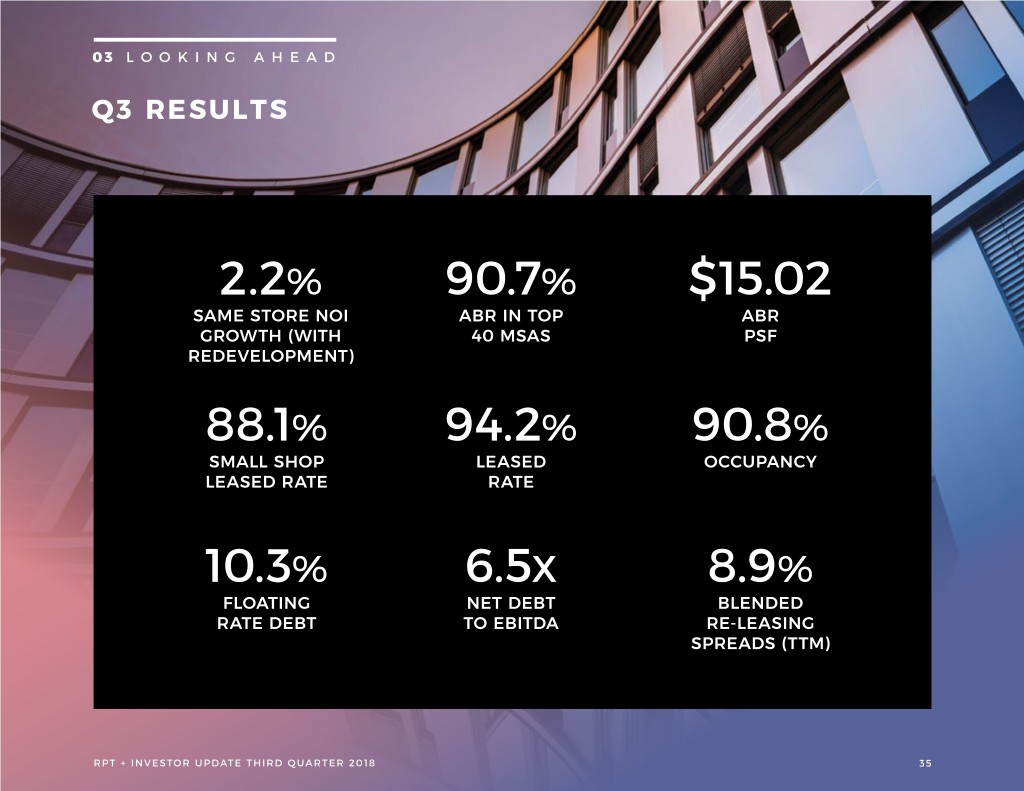
03 LOOKING AHEAD Q3 RESULTS 2.2% 90.7% $15.02 SAME STORE NOI ABR IN TOP ABR GROWTH (WITH 40 MSAS PSF REDEVELOPMENT) 88.1% 94.2% 90.8% SMALL SHOP LEASED OCCUPANCY LEASED RATE RATE 10.3% 6.5X 8.9% FLOATING NET DEBT BLENDED RATE DEBT TO EBITDA RE-LEASING SPREADS (TTM) RPT + INVESTOR UPDATE THIRD QUARTER 2018 35
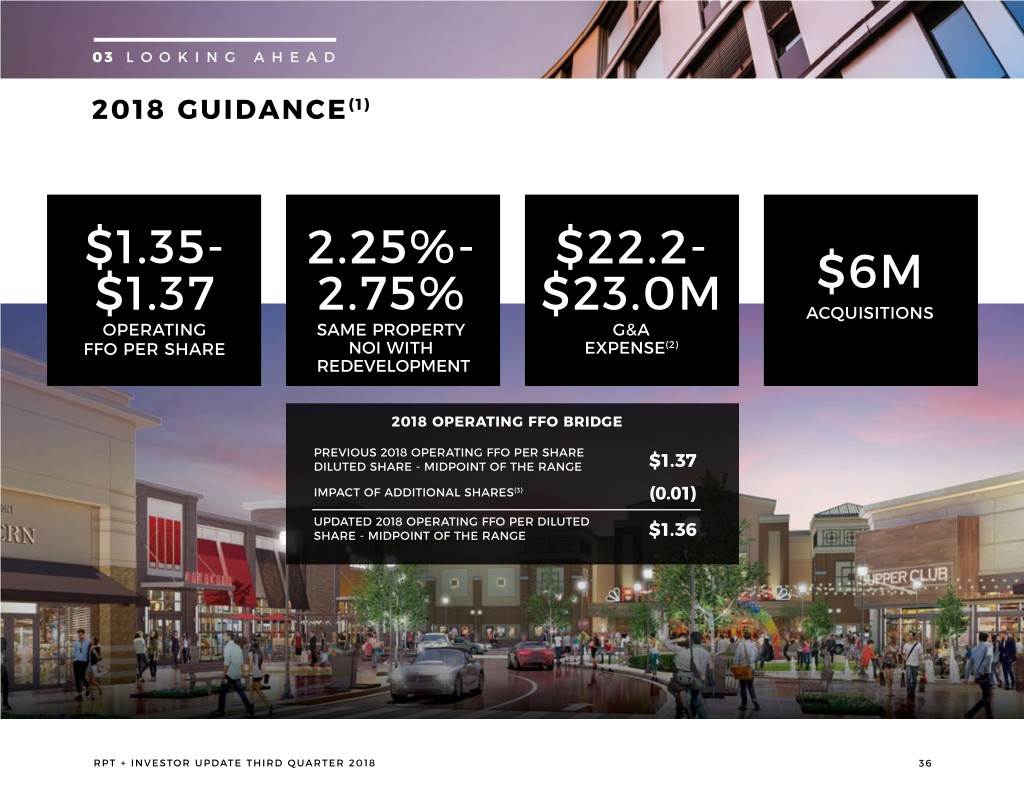
03 LOOKING AHEAD 2018 GUIDANCE(1) $1.35- 2.25%- $22.2- $6M $1.37 2.75% $23.0M ACQUISITIONS OPERATING SAME PROPERTY G&A FFO PER SHARE NOI WITH EXPENSE(2) REDEVELOPMENT 2018 OPERATING FFO BRIDGE PREVIOUS 2018 OPERATING FFO PER SHARE DILUTED SHARE - MIDPOINT OF THE RANGE $1.37 IMPACT OF ADDITIONAL SHARES(3) (0.01) UPDATED 2018 OPERATING FFO PER DILUTED SHARE - MIDPOINT OF THE RANGE $1.36 RPT + INVESTOR UPDATE THIRD QUARTER 2018 36

FOOTNOTES, NON-GAAP FINANCIAL MEASURES & OTHER DEFINITIONS

FOOTNOTES, NON-GAAP FINANCIAL MEASURES & OTHER DEFINITIONS FOOTNOTES SLIDE 3 (1) Based on our common stock price of $13.60 as of September 28, 2018 and an annualized dividend of $0.88 per share SLIDE 8 (1) Based on total property count: 32 properties within the portfolio have grocer or shadow grocer (2) Includes one regional mall (Jackson Crossing) SLIDE 10 (1) University of Michigan Study, Detroit Free Press, May 2018 (2) Bureau of Labor Statistics, August 2018 (3) University of Michigan 3-Year Economic Forecast, Oakland County, April 2018 SLIDE 11 (1) Bureau of Labor Statistics, August 2018 (2) Cushman Wakefield Miami Population Report, February 2018 (3) Florida Department of Economic Opportunity, November 2018 SLIDE 26 (1) Calculation based on 1% of total small shop GLA (40K square feet) multiplied by $20 average small shop rent SLIDE 28 (1) In negotiation SLIDE 36 (1) Represents guidance previously provided in our earnings release or earnings call. We have not updated or affirmed that guidance or any of the supporting assumptions and are not doing so by restating it herein (2) Excludes the impact from non-recurring executive transition and employee severance costs (3) Driven by a higher estimated weighted average share count attributable to an assumed above-target payout ratio for 2018 equity-based performance awards based on the Company’s relative stock outperformance during the third quarter of 2018 RPT + INVESTOR UPDATE THIRD QUARTER 2018 38
FOOTNOTES, NON-GAAP FINANCIAL MEASURES & OTHER DEFINITIONS DEFINITIONS SAME PROPERTY OPERATING INCOME Same Property Operating Income (“Same Property NOI with Redevelopment”) is a supplemental non-GAAP financial measure of real estate companies’ operating performance. Same Property NOI with Redevelopment is considered by management to be a relevant performance measure of our operations because it includes only the NOI of comparable properties for the reporting period. Same Property NOI with Redevelopment excludes acquisitions and dispositions. Same Property NOI with Redevelopment is calculated using consolidated operating income and adjusted to exclude management and other fee income, depreciation and amortization, general and administrative expense, provision for impairment and non-comparable income/expense adjustments such as straight-line rents, lease termination fees, above/below market rents, and other non-comparable operating income and expense adjustments. In addition to Same Property NOI with Redevelopment, the Company also believes Same Property NOI without Redevelopment to be a relevant performance measure of our operations. Same Property NOI without Redevelopment follows the same methodology as Same Property NOI with Redevelopment, however it excludes redevelopment activity that significantly impacts the entire property, as well as lesser redevelopment activity where we are adding GLA or retenanting a specific space. A property is designated as redevelopment when projected costs exceed $1.0 million, and the construction impacts approximately 20% or more of the income producing property’s gross leasable area (“GLA”) or the location and nature of the construction significantly impacts or disrupts the daily operations of the property. Redevelopment may also include a portion of certain properties designated as same property for which we are adding additional GLA or retenanting space. Same Property NOI should not be considered an alternative to net income in accordance with GAAP or as a measure of liquidity. Our method of calculating Same Property NOI may differ from methods used by other REITs and, accordingly, may not be comparable to such other REITs. EBITDARE/ADJUSTED EBITDA/PROFORMA ADJUSTED EBITDA NAREIT defines EBITDAre as net income computed in accordance with GAAP, plus interest expense, income tax expense (benefit), depreciation and amortization and impairment of depreciable real estate and in substance real estate equity investments; plus or minus gains or losses from sales of operating real estate assets and interests in real estate equity investments; and adjustments to reflect our share of unconsolidated real estate joint ventures and partnerships for these items. The Company calculates EBITDAre in a manner consistent with the NAREIT definition. The Company also presents Adjusted EBITDA which is EBITDAre net of severance expense, lease termination income, and other non-recurring items. EBITDAre and Adjusted EBITDA should not be considered an alternative measure of operating results or cash flow from operations as determined in accordance with GAAP. Proforma Adjusted EBITDA further adjusts for the effect of the acquisition or disposition of properties during the period. RPT + INVESTOR UPDATE THIRD QUARTER 2018 39
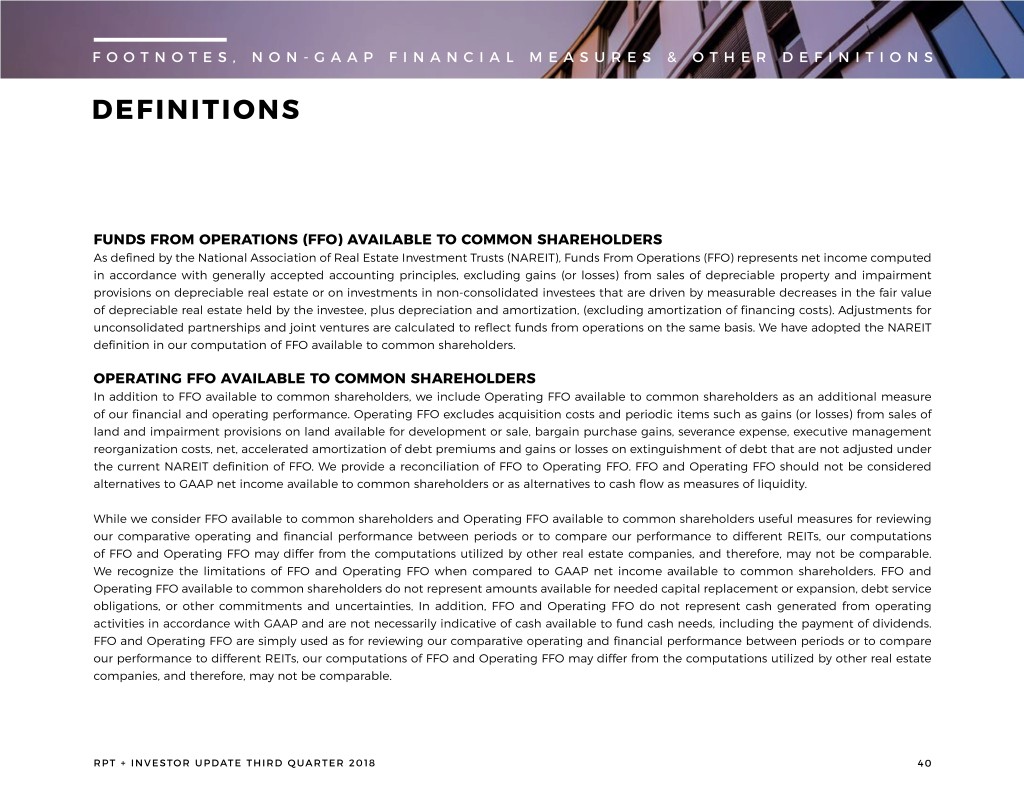
FOOTNOTES, NON-GAAP FINANCIAL MEASURES & OTHER DEFINITIONS DEFINITIONS FUNDS FROM OPERATIONS (FFO) AVAILABLE TO COMMON SHAREHOLDERS As defined by the National Association of Real Estate Investment Trusts (NAREIT), Funds From Operations (FFO) represents net income computed in accordance with generally accepted accounting principles, excluding gains (or losses) from sales of depreciable property and impairment provisions on depreciable real estate or on investments in non-consolidated investees that are driven by measurable decreases in the fair value of depreciable real estate held by the investee, plus depreciation and amortization, (excluding amortization of financing costs). Adjustments for unconsolidated partnerships and joint ventures are calculated to reflect funds from operations on the same basis. We have adopted the NAREIT definition in our computation of FFO available to common shareholders. OPERATING FFO AVAILABLE TO COMMON SHAREHOLDERS In addition to FFO available to common shareholders, we include Operating FFO available to common shareholders as an additional measure of our financial and operating performance. Operating FFO excludes acquisition costs and periodic items such as gains (or losses) from sales of land and impairment provisions on land available for development or sale, bargain purchase gains, severance expense, executive management reorganization costs, net, accelerated amortization of debt premiums and gains or losses on extinguishment of debt that are not adjusted under the current NAREIT definition of FFO. We provide a reconciliation of FFO to Operating FFO. FFO and Operating FFO should not be considered alternatives to GAAP net income available to common shareholders or as alternatives to cash flow as measures of liquidity. While we consider FFO available to common shareholders and Operating FFO available to common shareholders useful measures for reviewing our comparative operating and financial performance between periods or to compare our performance to different REITs, our computations of FFO and Operating FFO may differ from the computations utilized by other real estate companies, and therefore, may not be comparable. We recognize the limitations of FFO and Operating FFO when compared to GAAP net income available to common shareholders. FFO and Operating FFO available to common shareholders do not represent amounts available for needed capital replacement or expansion, debt service obligations, or other commitments and uncertainties. In addition, FFO and Operating FFO do not represent cash generated from operating activities in accordance with GAAP and are not necessarily indicative of cash available to fund cash needs, including the payment of dividends. FFO and Operating FFO are simply used as for reviewing our comparative operating and financial performance between periods or to compare our performance to different REITs, our computations of FFO and Operating FFO may differ from the computations utilized by other real estate companies, and therefore, may not be comparable. RPT + INVESTOR UPDATE THIRD QUARTER 2018 40

FOOTNOTES, NON-GAAP FINANCIAL MEASURES & OTHER DEFINITIONS DEFINITIONS OCCUPANCY Occupancy is defined, for a property or group of properties, as the ratio, expressed as a percentage, of (a) the number of square feet of such property economically occupied by tenants under leases with an initial term of greater than one year, to (b) the aggregate number of square feet for such property. LEASED RATE Lease Rate is defined, for a property or group of properties, as the ratio, expressed as a percentage, of (a) the number of square feet of such property occupied by tenants at the time the lease was executed with an initial term of greater than one year, to (b) the aggregate number of square feet for such property. RPT + INVESTOR UPDATE THIRD QUARTER 2018 41
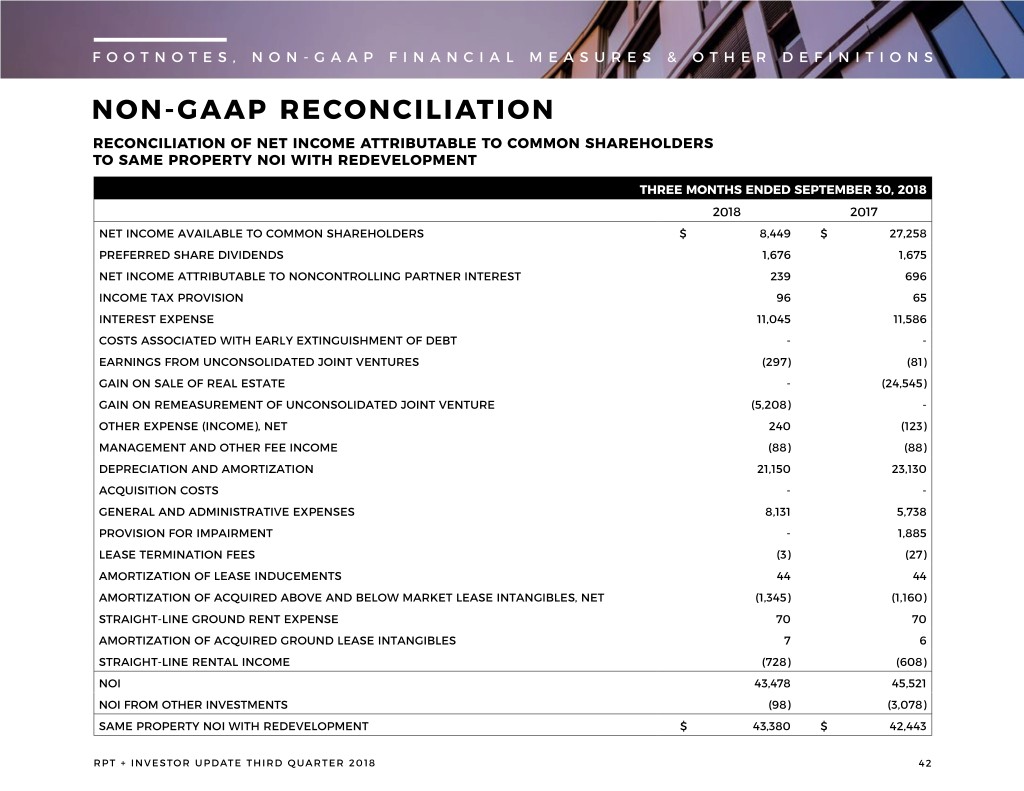
FOOTNOTES, NON-GAAP FINANCIAL MEASURES & OTHER DEFINITIONS NON-GAAP RECONCILIATION RECONCILIATION OF NET INCOME ATTRIBUTABLE TO COMMON SHAREHOLDERS TO SAME PROPERTY NOI WITH REDEVELOPMENT THREE MONTHS ENDED SEPTEMBER 30, 2018 2018 2017 NET INCOME AVAILABLE TO COMMON SHAREHOLDERS $ 8,449 $ 27,258 PREFERRED SHARE DIVIDENDS 1,676 1,675 NET INCOME ATTRIBUTABLE TO NONCONTROLLING PARTNER INTEREST 239 696 INCOME TAX PROVISION 96 65 INTEREST EXPENSE 11,045 11,586 COSTS ASSOCIATED WITH EARLY EXTINGUISHMENT OF DEBT - - EARNINGS FROM UNCONSOLIDATED JOINT VENTURES (297) (81) GAIN ON SALE OF REAL ESTATE - (24,545) GAIN ON REMEASUREMENT OF UNCONSOLIDATED JOINT VENTURE (5,208) - OTHER EXPENSE (INCOME), NET 240 (123) MANAGEMENT AND OTHER FEE INCOME (88) (88) DEPRECIATION AND AMORTIZATION 21,150 23,130 ACQUISITION COSTS - - GENERAL AND ADMINISTRATIVE EXPENSES 8,131 5,738 PROVISION FOR IMPAIRMENT - 1,885 LEASE TERMINATION FEES (3) (27) AMORTIZATION OF LEASE INDUCEMENTS 44 44 AMORTIZATION OF ACQUIRED ABOVE AND BELOW MARKET LEASE INTANGIBLES, NET (1,345) (1,160) STRAIGHT-LINE GROUND RENT EXPENSE 70 70 AMORTIZATION OF ACQUIRED GROUND LEASE INTANGIBLES 7 6 STRAIGHT-LINE RENTAL INCOME (728) (608) NOI 43,478 45,521 NOI FROM OTHER INVESTMENTS (98) (3,078) SAME PROPERTY NOI WITH REDEVELOPMENT $ 43,380 $ 42,443 RPT + INVESTOR UPDATE THIRD QUARTER 2018 42
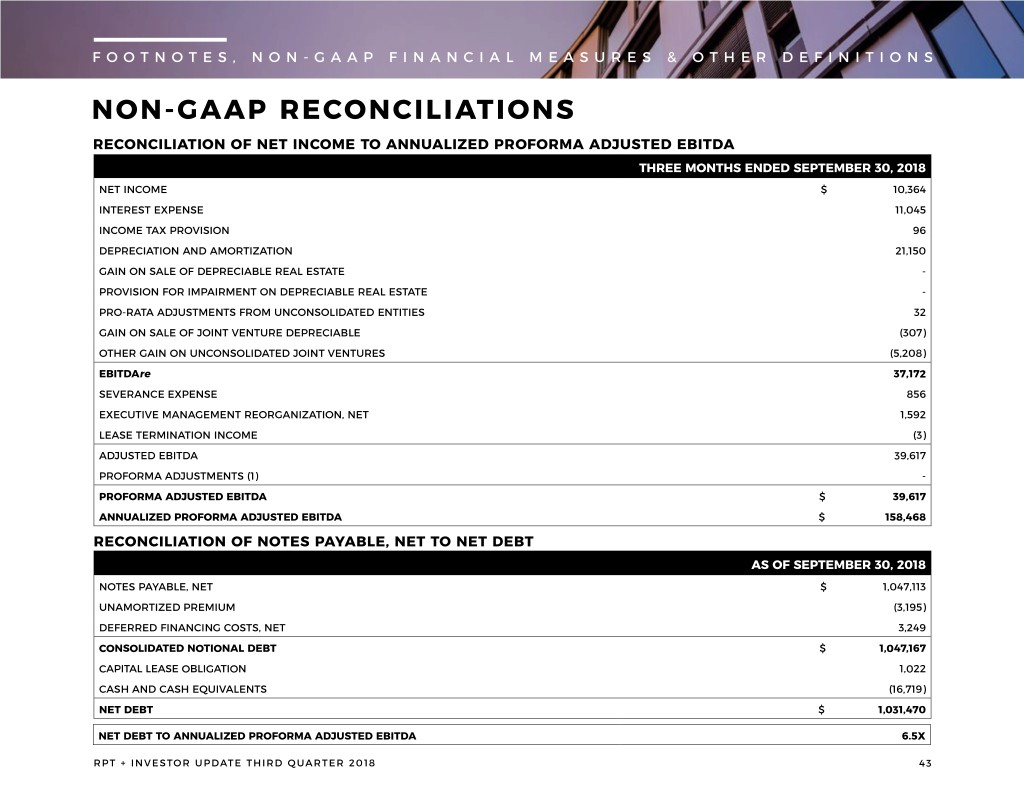
FOOTNOTES, NON-GAAP FINANCIAL MEASURES & OTHER DEFINITIONS NON-GAAP RECONCILIATIONS RECONCILIATION OF NET INCOME TO ANNUALIZED PROFORMA ADJUSTED EBITDA THREE MONTHS ENDED SEPTEMBER 30, 2018 NET INCOME $ 10,364 INTEREST EXPENSE 11,045 INCOME TAX PROVISION 96 DEPRECIATION AND AMORTIZATION 21,150 GAIN ON SALE OF DEPRECIABLE REAL ESTATE - PROVISION FOR IMPAIRMENT ON DEPRECIABLE REAL ESTATE - PRO-RATA ADJUSTMENTS FROM UNCONSOLIDATED ENTITIES 32 GAIN ON SALE OF JOINT VENTURE DEPRECIABLE (307) OTHER GAIN ON UNCONSOLIDATED JOINT VENTURES (5,208) EBITDAre 37,172 SEVERANCE EXPENSE 856 EXECUTIVE MANAGEMENT REORGANIZATION, NET 1,592 LEASE TERMINATION INCOME (3) ADJUSTED EBITDA 39,617 PROFORMA ADJUSTMENTS (1) - PROFORMA ADJUSTED EBITDA $ 39,617 ANNUALIZED PROFORMA ADJUSTED EBITDA $ 158,468 RECONCILIATION OF NOTES PAYABLE, NET TO NET DEBT AS OF SEPTEMBER 30, 2018 NOTES PAYABLE, NET $ 1,047,113 UNAMORTIZED PREMIUM (3,195) DEFERRED FINANCING COSTS, NET 3,249 CONSOLIDATED NOTIONAL DEBT $ 1,047,167 CAPITAL LEASE OBLIGATION 1,022 CASH AND CASH EQUIVALENTS (16,719) NET DEBT $ 1,031,470 NET DEBT TO ANNUALIZED PROFORMA ADJUSTED EBITDA 6.5X RPT + INVESTOR UPDATE THIRD QUARTER 2018 43
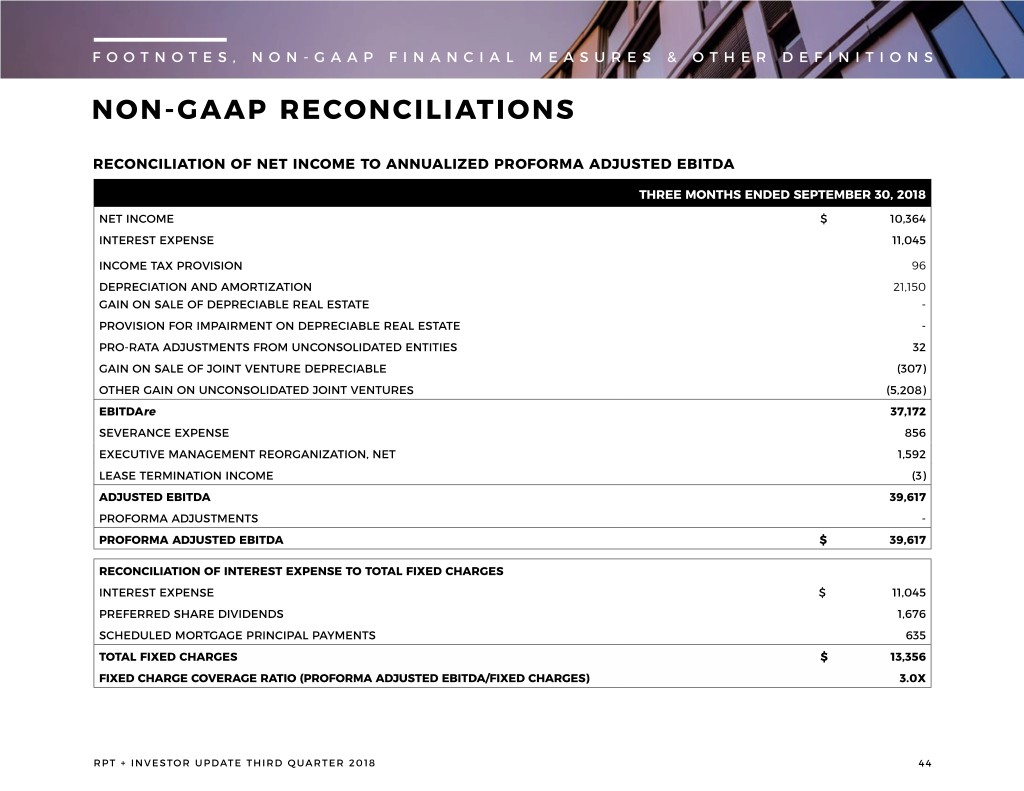
FOOTNOTES, NON-GAAP FINANCIAL MEASURES & OTHER DEFINITIONS NON-GAAP RECONCILIATIONS RECONCILIATION OF NET INCOME TO ANNUALIZED PROFORMA ADJUSTED EBITDA THREE MONTHS ENDED SEPTEMBER 30, 2018 NET INCOME $ 10,364 INTEREST EXPENSE 11,045 INCOME TAX PROVISION 96 DEPRECIATION AND AMORTIZATION 21,150 GAIN ON SALE OF DEPRECIABLE REAL ESTATE - PROVISION FOR IMPAIRMENT ON DEPRECIABLE REAL ESTATE - PRO-RATA ADJUSTMENTS FROM UNCONSOLIDATED ENTITIES 32 GAIN ON SALE OF JOINT VENTURE DEPRECIABLE (307) OTHER GAIN ON UNCONSOLIDATED JOINT VENTURES (5,208) EBITDAre 37,172 SEVERANCE EXPENSE 856 EXECUTIVE MANAGEMENT REORGANIZATION, NET 1,592 LEASE TERMINATION INCOME (3) ADJUSTED EBITDA 39,617 PROFORMA ADJUSTMENTS - PROFORMA ADJUSTED EBITDA $ 39,617 RECONCILIATION OF INTEREST EXPENSE TO TOTAL FIXED CHARGES INTEREST EXPENSE $ 11,045 PREFERRED SHARE DIVIDENDS 1,676 SCHEDULED MORTGAGE PRINCIPAL PAYMENTS 635 TOTAL FIXED CHARGES $ 13,356 FIXED CHARGE COVERAGE RATIO (PROFORMA ADJUSTED EBITDA/FIXED CHARGES) 3.0X RPT + INVESTOR UPDATE THIRD QUARTER 2018 44

FOOTNOTES, NON-GAAP FINANCIAL MEASURES & OTHER DEFINITIONS NON-GAAP RECONCILIATION RECONCILIATION OF NET INCOME ATTRIBUTABLE TO COMMON SHAREHOLDERS TO UNENCUMBERED NOI NINE MONTHS ENDED SEPTEMBER 30, 2018 NET INCOME AVAILABLE TO COMMON SHAREHOLDERS $ 16,687 PREFERRED SHARE DIVIDENDS 5,026 NET INCOME ATTRIBUTABLE TO NONCONTROLLING PARTNER INTEREST 514 INCOME TAX PROVISION 147 INTEREST EXPENSE 32,354 EARNINGS FROM UNCONSOLIDATED JOINT VENTURES (570) GAIN ON SALE OF REAL ESTATE (181) OTHER GAIN ON UNCONSOLIDATED JOINT VENTURES (5,208) OTHER EXPENSE (INCOME), NET 55 MANAGEMENT AND OTHER FEE INCOME (222) DEPRECIATION AND AMORTIZATION 65,719 ACQUISITION COSTS 233 GENERAL AND ADMINISTRATIVE EXPENSES 27,396 PROVISION FOR IMPAIRMENT 216 LEASE TERMINATION FEES (108) AMORTIZATION OF LEASE INDUCEMENTS 130 AMORTIZATION OF ACQUIRED ABOVE AND BELOW MARKET LEASE INTANGIBLES, NET (8,733) STRAIGHT-LINE GROUND RENT EXPENSE 211 AMORTIZATION OF ACQUIRED GROUND LEASE INTANGIBLES 19 STRAIGHT-LINE RENTAL INCOME (2,290) NOI 131,395 ENCUMBERED NOI (13,039) UNENCUMBERED NOI $ 118,356 UNENCUMBERED NOI RATIO 90.1% RPT + INVESTOR UPDATE THIRD QUARTER 2018 45
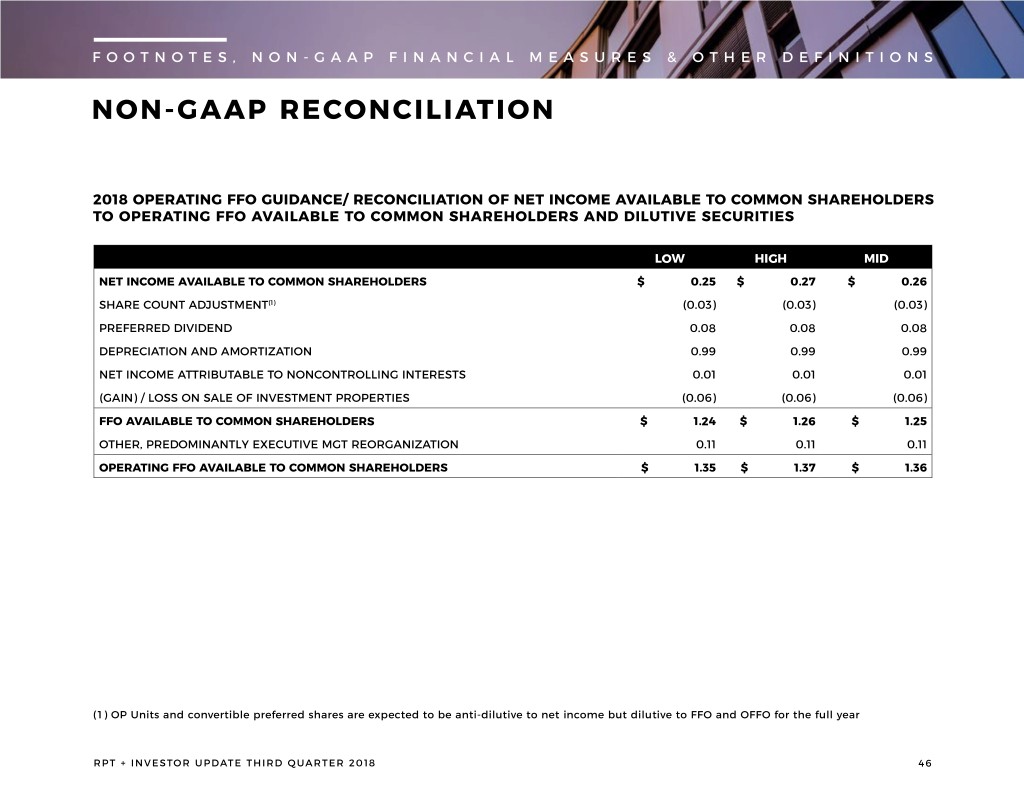
FOOTNOTES, NON-GAAP FINANCIAL MEASURES & OTHER DEFINITIONS NON-GAAP RECONCILIATION 2018 OPERATING FFO GUIDANCE/ RECONCILIATION OF NET INCOME AVAILABLE TO COMMON SHAREHOLDERS TO OPERATING FFO AVAILABLE TO COMMON SHAREHOLDERS AND DILUTIVE SECURITIES LOW HIGH MID NET INCOME AVAILABLE TO COMMON SHAREHOLDERS $ 0.25 $ 0.27 $ 0.26 SHARE COUNT ADJUSTMENT(1) (0.03) (0.03) (0.03) PREFERRED DIVIDEND 0.08 0.08 0.08 DEPRECIATION AND AMORTIZATION 0.99 0.99 0.99 NET INCOME ATTRIBUTABLE TO NONCONTROLLING INTERESTS 0.01 0.01 0.01 (GAIN) / LOSS ON SALE OF INVESTMENT PROPERTIES (0.06) (0.06) (0.06) FFO AVAILABLE TO COMMON SHAREHOLDERS $ 1.24 $ 1.26 $ 1.25 OTHER, PREDOMINANTLY EXECUTIVE MGT REORGANIZATION 0.11 0.11 0.11 OPERATING FFO AVAILABLE TO COMMON SHAREHOLDERS $ 1.35 $ 1.37 $ 1.36 (1) OP Units and convertible preferred shares are expected to be anti-dilutive to net income but dilutive to FFO and OFFO for the full year RPT + INVESTOR UPDATE THIRD QUARTER 2018 46


