Exhibit 99.2
Supplemental Financial & Operating Statistics December 31, 2007
Table of Contents SectionPage Company Overview 1 Consolidated Statements of Income 2 Income Statement Detail 3 Earnings Per Common Share 4 Consolidated Balance Sheets 5 Balance Sheet Detail 6 Calculation of Funds from Operations and Funds Available for Distribution 7 Selected Financial and Operating Ratios 8 Quarterly & Year to Date Operating Information Same Properties Analysis 9 Leasing Activity Analysis 10 Current Development Projects 11 Current Redevelopment Projects 12 Market Capitalization Information Summary of Outstanding Debt 13 Loan Maturity Summary 14 Market Capitalization Information 15 Common Stock Performance 15 Portfolio Information Property Summary 16-18 Geographic Diversification 19 Anchor, Non-Anchor Tenant Mix 19 National, Regional, Local Tenant Mix 19 Major Tenants 20 Summary of Expiring GLA 21 Joint Venture Information Joint Ventures Contribution to Funds from Operations 22 Joint Ventures Combining Balance Sheets 23 Summary of Joint Venture Debt 24 Investor Information 25 Quarterly & Year to Date Financial Results
COMPANY OVERVIEW Ramco-Gershenson Properties Trust (NYSE:RPT) is a self-administered and self-managed real estate investment trust primarily engaged in the business of owning, developing, acquiring, managing and leasing community shopping centers located primarily in the Midwestern, Mid-Atlantic and Southeastern United States. At December 31, 2007, the Company owned interests in 89 shopping centers with approximately 20.0 million square feet of gross leasable area located in Michigan, Florida, Georgia, Ohio, Wisconsin, Indiana, New Jersey, Maryland, North Carolina, South Carolina, Virginia, Tennessee and Illinois. The Company’s properties consist of 88 community centers and one regional mall. As part of the Company’s current business strategy, Ramco-Gershenson is focused on generating internal growth through the redevelopment of core assets. In an effort to maximize the potential of each asset, the Company constantly reevaluates each shopping center’s position within the market. This effort is part of an overall approach that allows management to anticipate changes in retailing trends and tenant needs and proactively implement solutions to boost the performance and value of the center namely through enhancement in the tenant mix, improvement of existing rental rates and occupancy growth. Ramco-Gershenson seeks to further generate growth through the construction of new shopping centers. Throughout the Company’s history, management’s experience and long-standing relationships with tenants has allowed us to capitalize on development opportunities. Ramco-Gershenson’s current goal is to develop at least one strategically located shopping center a year with a minimum return of 10%. The Company also remains committed to the acquisition of well-located shopping centers that may lend themselves to further improvements, either through strategic joint ventures or on-balance sheet transactions. The main objective of the Company is to attract investors based on the quality of its assets and the experience of its management team while continuing to build shareholder value through the proactive management of its assets as well as the selective development and acquisition of shopping centers. The Company is listed on the New York Stock Exchange under the symbol RPT and is headquartered in Farmington Hills, Michigan. Supplemental Financial and Operating Statistics Q4 2007 Ramco-Gershenson Properties Trust (RPT) Page 1
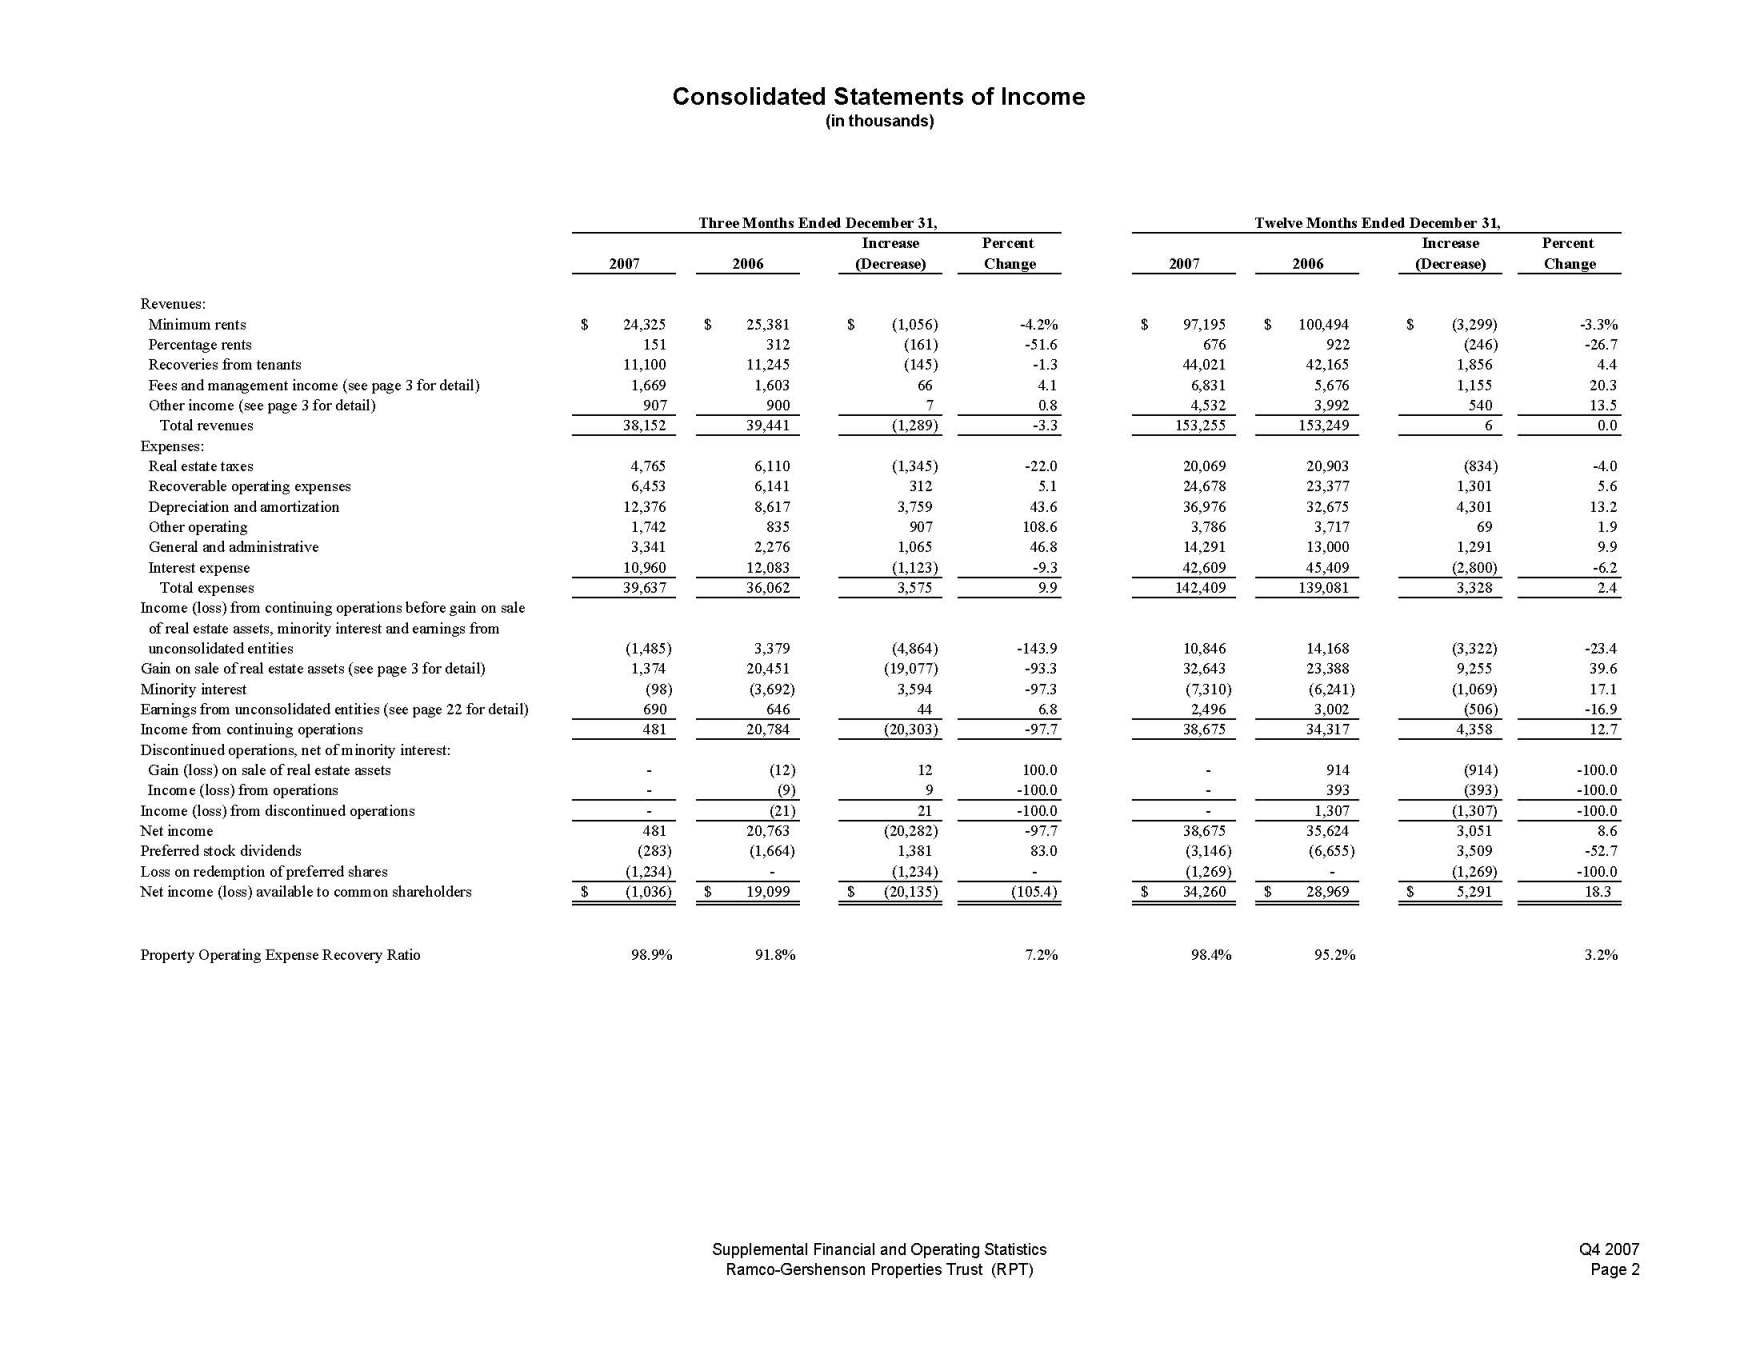
Consolidated Statements of Income (in thousands) Three Months Ended December 31, Twelve Months Ended December 31, Increase Percent Increase Percent 2007 2006 (Decrease) Change 2007 2006 (Decrease) Change Revenues: Minimum rents $ 24,325 25,381$ $ (1,056) -4.2% $ 97,195 100,494$ $ (3,299) -3.3% Percentage rents 151 312 (161) -51.6 676 922 (246) -26.7 Recoveries from tenants 11,100 11,245 (145) -1.3 44,021 42,165 1,856 4.4 Fees and management income (see page 3 for detail) 1,669 1,603 66 4.1 6,831 5,676 1,155 20.3 Other income (see page 3 for detail) 907 900 7 0.8 4,532 3,992 540 13.5 Total revenues 38,152 39,441 (1,289) -3.3 153,255 153,249 6 0.0 Expenses: Real estate taxes 4,765 6,110 (1,345) -22.0 20,069 20,903 (834) -4.0 Recoverable operating expenses 6,453 6,141 312 5.1 24,678 23,377 1,301 5.6 Depreciation and amortization 12,376 8,617 3,759 43.6 36,976 32,675 4,301 13.2 Other operating 1,742 835 907 108.6 3,786 3,717 69 1.9 General and administrative 3,341 2,276 1,065 46.8 14,291 13,000 1,291 9.9 Interest expense 10,960 12,083 (1,123) -9.3 42,609 45,409 (2,800) -6.2 Total expenses 39,637 36,062 3,575 9.9 142,409 139,081 3,328 2.4 Income (loss) from continuing operations before gain on sale of real estate assets, minority interest and earnings from unconsolidated entities (1,485) 3,379 (4,864) -143.9 10,846 14,168 (3,322) -23.4 Gain on sale of real estate assets (see page 3 for detail) 1,374 20,451 (19,077) -93.3 32,643 23,388 9,255 39.6 Minority interest (98) (3,692) 3,594 -97.3 (7,310) (6,241) (1,069) 17.1 Earnings from unconsolidated entities (see page 22 for detail) 690 646 44 6.8 2,496 3,002 (506) -16.9 Income from continuing operations 481 20,784 (20,303) -97.7 38,675 34,317 4,358 12.7 Discontinued operations, net of minority interest: Gain (loss) on sale of real estate assets - (12) 12 100.0 - 914 (914) -100.0 Income (loss) from operations - (9) 9 -100.0 - 393 (393) -100.0 Income (loss) from discontinued operations - (21) 21 -100.0 - 1,307 (1,307) -100.0 Net income 481 20,763 (20,282) -97.7 38,675 35,624 3,051 8.6 Preferred stock dividends (283) (1,664) 1,381 83.0 (3,146) (6,655) 3,509 -52.7 Loss on redemption of preferred shares (1,234) - (1,234) - (1,269) - (1,269) -100.0 Net income (loss) available to common shareholders $ (1,036) 19,099$ $ (20,135) (105.4) $ 34,260 28,969$ 5,291$ 18.3 Property Operating Expense Recovery Ratio 98.9% 91.8% 7.2% 98.4% 95.2% 3.2% Supplemental Financial and Operating Statistics Q4 2007 Ramco-Gershenson Properties Trust (RPT) Page 2
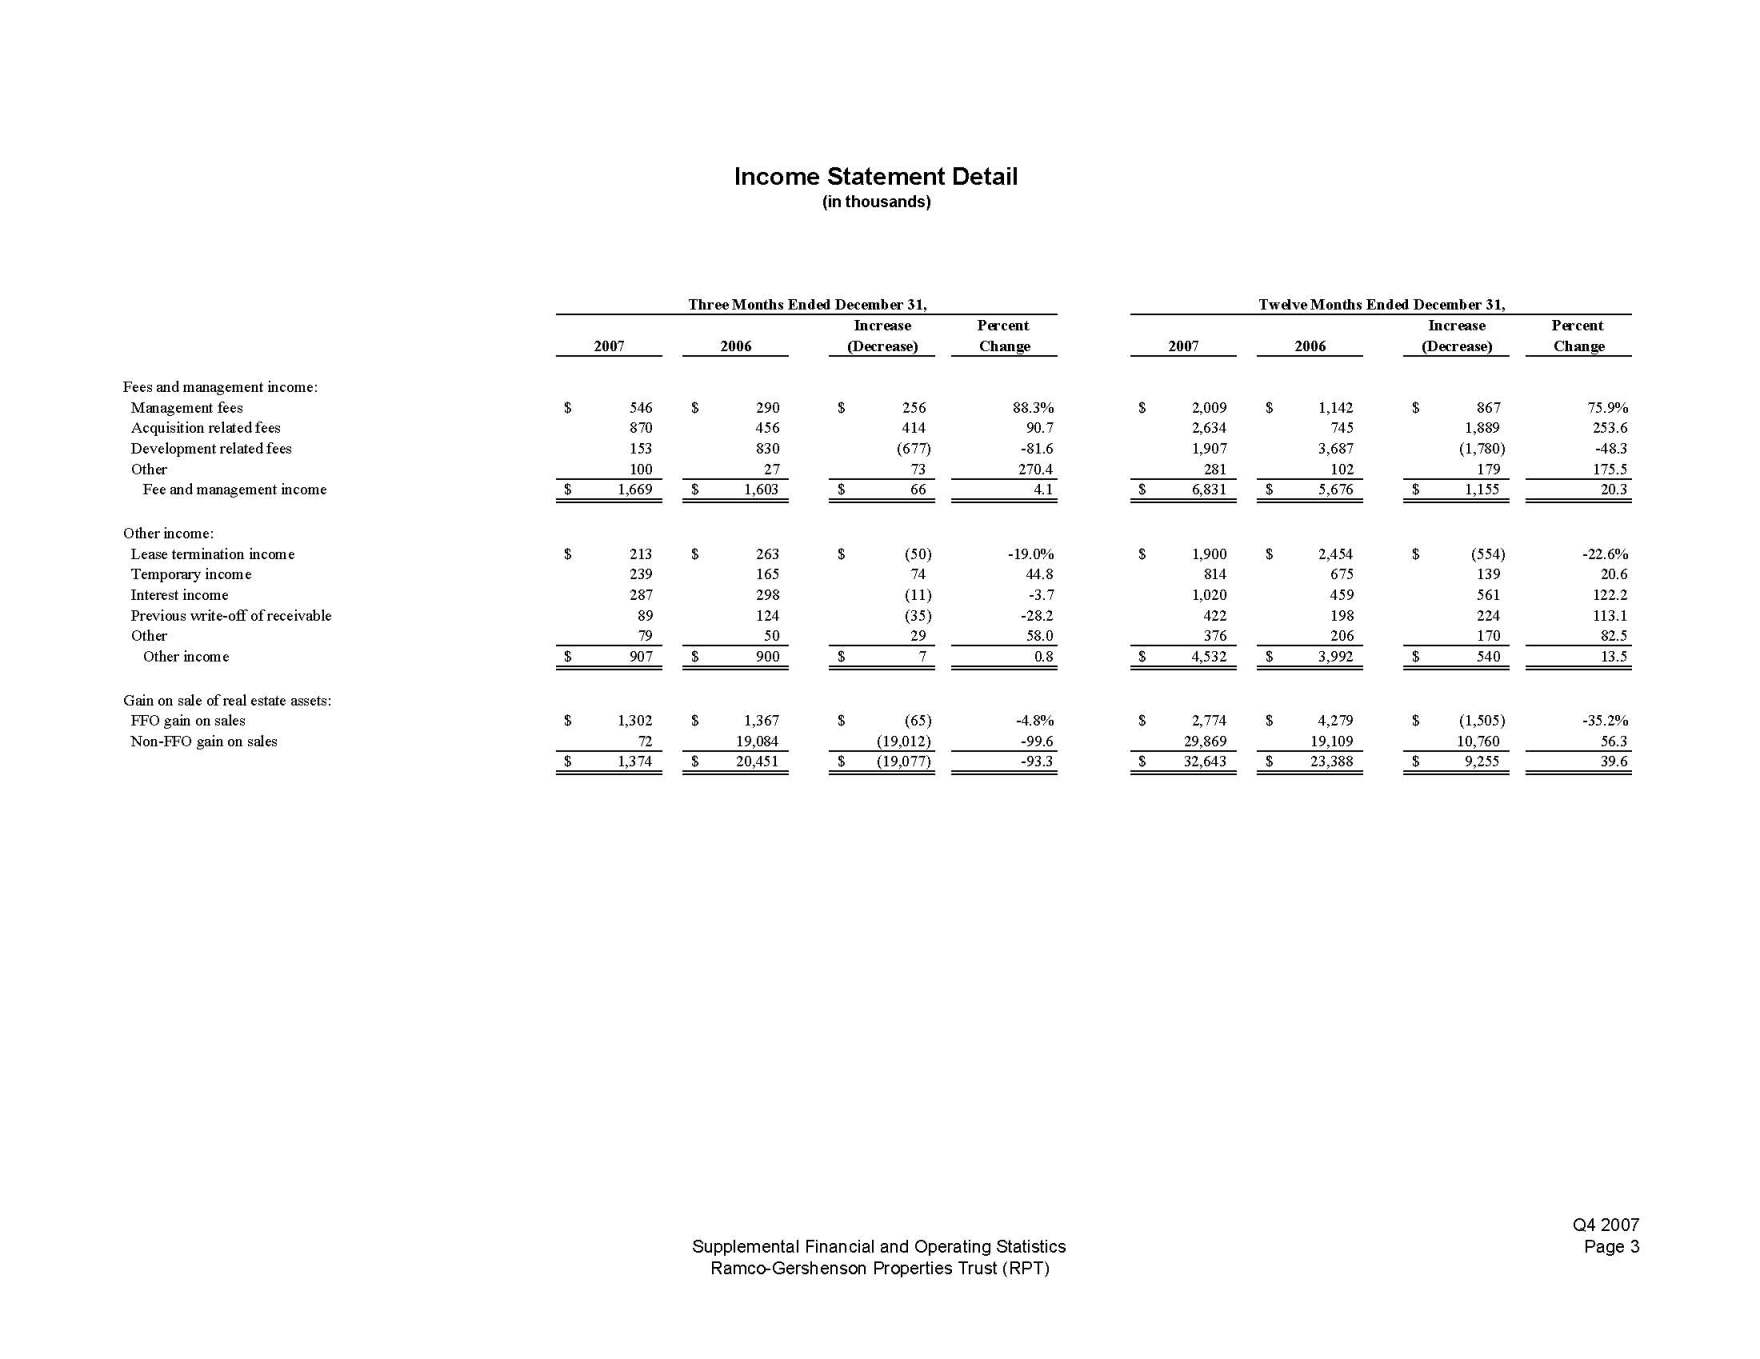
Income Statement Detail (in thousands) Three Months Ended December 31, Twelve Months Ended December 31, Increase Percent Increase Percent 2007 2006 (Decrease) Change 2007 2006 (Decrease) Change Fees and management income: Management fees $ 546 290$ 256$ 88.3% $ 2,009 1,142$ 867$ 75.9% Acquisition related fees 870 456 414 90.7 2,634 745 1,889 253.6 Development related fees 153 830 (677) -81.6 1,907 3,687 (1,780) -48.3 Other 100 27 73 270.4 281 102 179 175.5 Fee and management income $ 1,669 1,603$ 66$ 4.1 $ 6,831 5,676$ 1,155$ 20.3 Other income: Lease termination income $ 213 263$ $ (50) -19.0% $ 1,900 2,454$ $ (554) -22.6% Temporary income 239 165 74 44.8 814 675 139 20.6 Interest income 287 298 (11) -3.7 1,020 459 561 122.2 Previous write-off of receivable 89 124 (35) -28.2 422 198 224 113.1 Other 79 50 29 58.0 376 206 170 82.5 Other income $ 907 900$ 7$ 0.8 $ 4,532 3,992$ 540$ 13.5 Gain on sale of real estate assets: FFO gain on sales $ 1,302 1,367$ $ (65) -4.8% $ 2,774 4,279$ $ (1,505) -35.2% Non-FFO gain on sales 72 19,084 (19,012) -99.6 29,869 19,109 10,760 56.3 $ 1,374 20,451$ (19,077)$ -93.3 $ 32,643 23,388$ 9,255$ 39.6 Q4 2007 Supplemental Financial and Operating Statistics Page 3 Ramco-Gershenson Properties Trust (RPT)
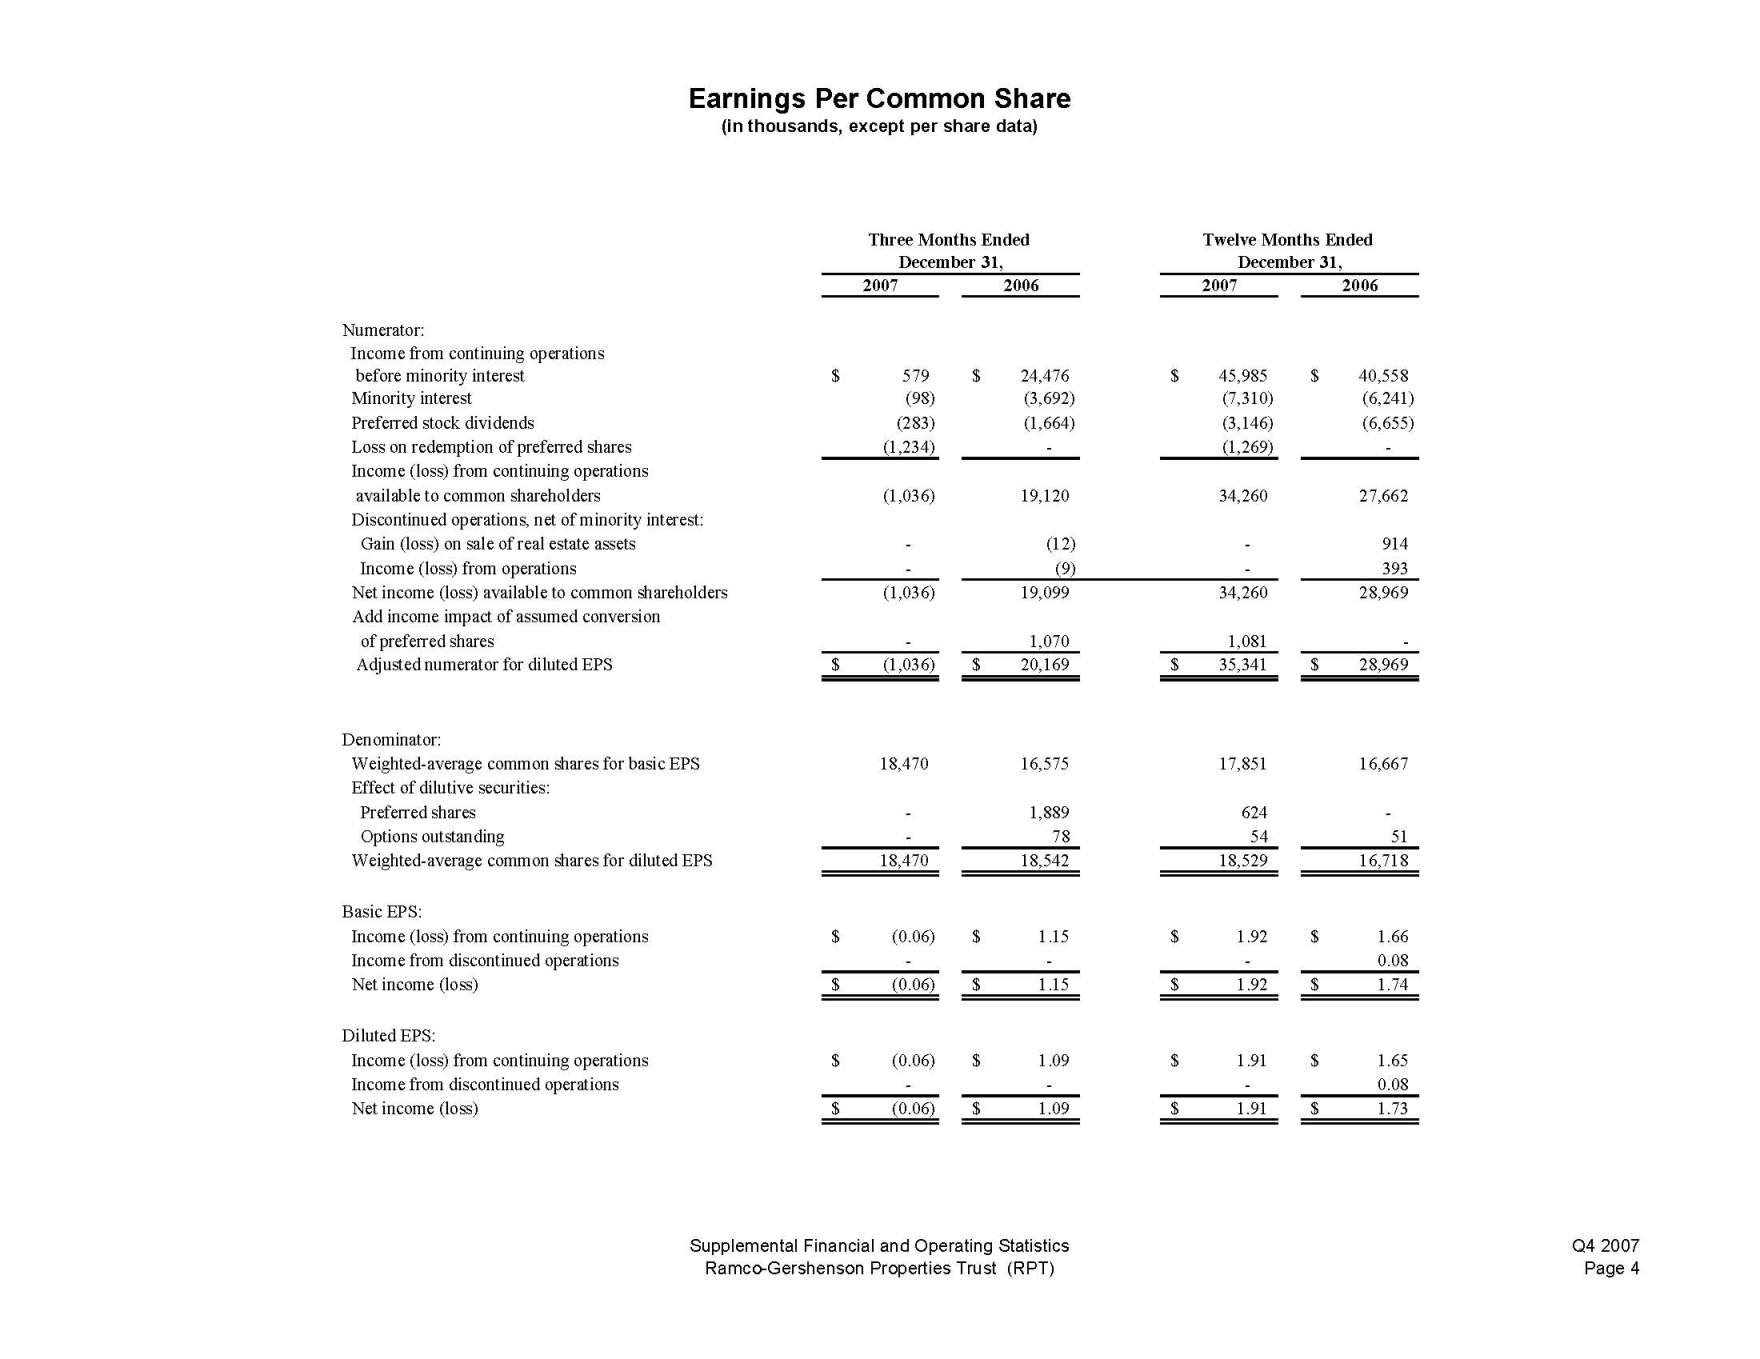
Earnings Per Common Share (in thousands, except per share data) Three Months Ended Twelve Months Ended December 31, December 31, 2007 2006 2007 2006 Numerator: Income from continuing operations before minority interest $ 579 24,476$ $ 45,985 40,558$ Minority interest (98) (3,692) (7,310) (6,241) Preferred stock dividends (283) (1,664) (3,146) (6,655) Loss on redemption of preferred shares (1,234) - (1,269) - Income (loss) from continuing operations available to common shareholders (1,036) 19,120 34,260 27,662 Discontinued operations, net of minority interest: Gain (loss) on sale of real estate assets - (12) - 914 Income (loss) from operations - (9) - 393 Net income (loss) available to common shareholders (1,036) 19,099 34,260 28,969 Add income impact of assumed conversion of preferred shares - 1,070 1,081 - Adjusted numerator for diluted EPS $ (1,036) 20,169$ $ 35,341 28,969$ Denominator: Weighted-average common shares for basic EPS 18,470 16,575 17,851 16,667 Effect of dilutive securities: Preferred shares - 1,889 624 - Options outstanding - 78 54 51 Weighted-average common shares for diluted EPS 18,470 18,542 18,529 16,718 Basic EPS: Income (loss) from continuing operations $ (0.06) 1.15$ $ 1.92 1.66$ Income from discontinued operations - - - 0.08 Net income (loss) $ (0.06) 1.15$ $ 1.92 1.74$ Diluted EPS: Income (loss) from continuing operations $ (0.06) 1.09$ $ 1.91 1.65$ Income from discontinued operations - - - 0.08 Net income (loss) $ (0.06) 1.09$ $ 1.91 1.73$ Supplemental Financial and Operating Statistics Q4 2007 Ramco-Gershenson Properties Trust (RPT) Page 4
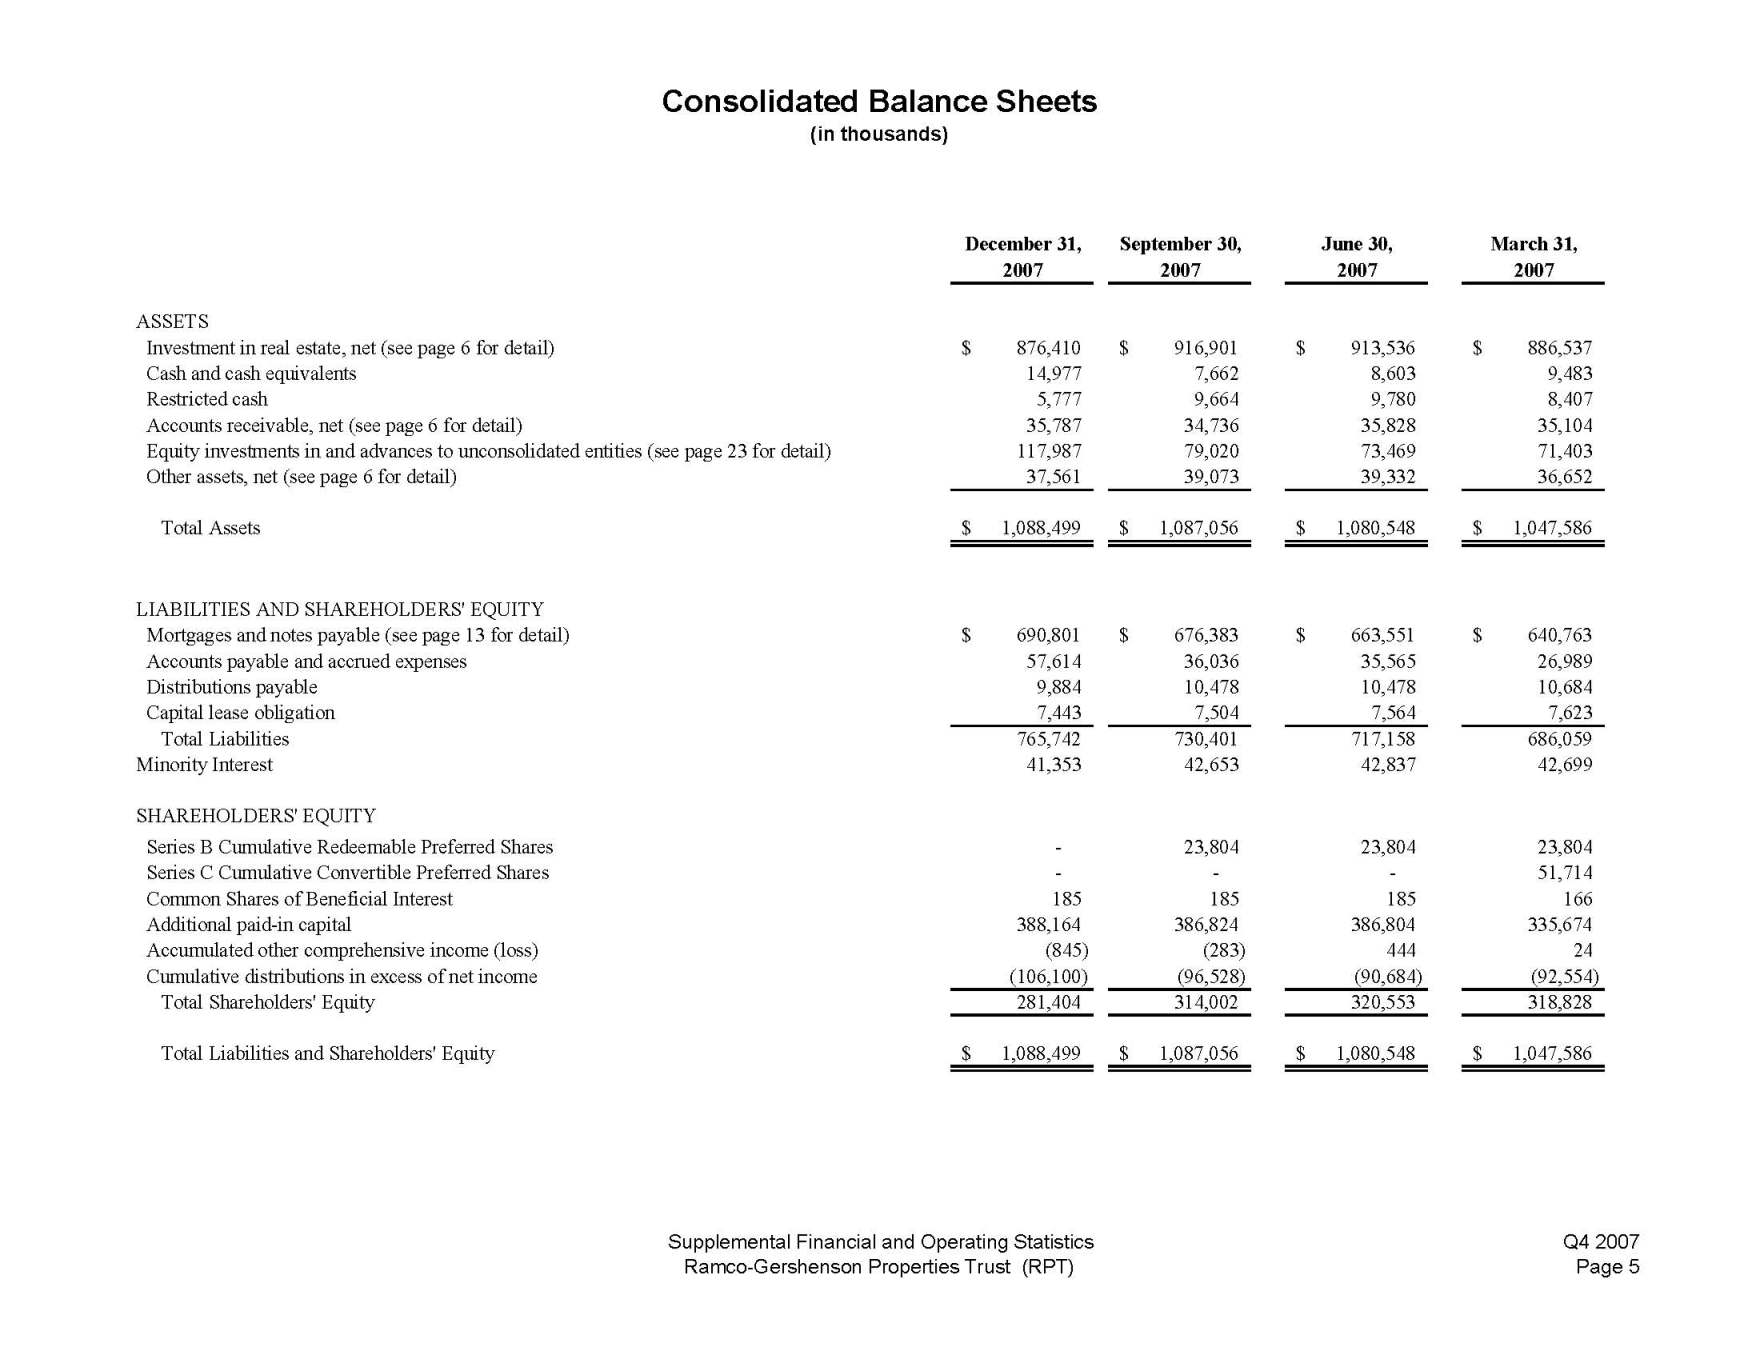
Consolidated Balance Sheets (in thousands) December 31, September 30, June 30, March 31, 2007 2007 2007 2007 ASSETS Investment in real estate, net (see page 6 for detail) 876,410$ 916,901$ $ 913,536 886,537$ Cash and cash equivalents 14,977 7,662 8,603 9,483 Restricted cash 5,777 9,664 9,780 8,407 Accounts receivable, net (see page 6 for detail) 35,787 34,736 35,828 35,104 Equity investments in and advances to unconsolidated entities (see page 23 for detail) 117,987 79,020 73,469 71,403 Other assets, net (see page 6 for detail) 37,561 39,073 39,332 36,652 Total Assets 1,088,499$ 1,087,056$ $ 1,080,548 1,047,586$ LIABILITIES AND SHAREHOLDERS' EQUITY Mortgages and notes payable (see page 13 for detail) 690,801$ 676,383$ $ 663,551 640,763$ Accounts payable and accrued expenses 57,614 36,036 35,565 26,989 Distributions payable 9,884 10,478 10,478 10,684 Capital lease obligation 7,443 7,504 7,564 7,623 Total Liabilities 765,742 730,401 717,158 686,059 Minority Interest 41,353 42,653 42,837 42,699 SHAREHOLDERS' EQUITY Series B Cumulative Redeemable Preferred Shares - 23,804 23,804 23,804 Series C Cumulative Convertible Preferred Shares - - - 51,714 Common Shares of Beneficial Interest 185 185 185 166 Additional paid-in capital 388,164 386,824 386,804 335,674 Accumulated other comprehensive income (loss) (845) (283) 444 24 Cumulative distributions in excess of net income (106,100) (96,528) (90,684) (92,554) Total Shareholders' Equity 281,404 314,002 320,553 318,828 Total Liabilities and Shareholders' Equity 1,088,499$ 1,087,056$ $ 1,080,548 1,047,586$ Supplemental Financial and Operating Statistics Q4 2007 Ramco-Gershenson Properties Trust (RPT) Page 5
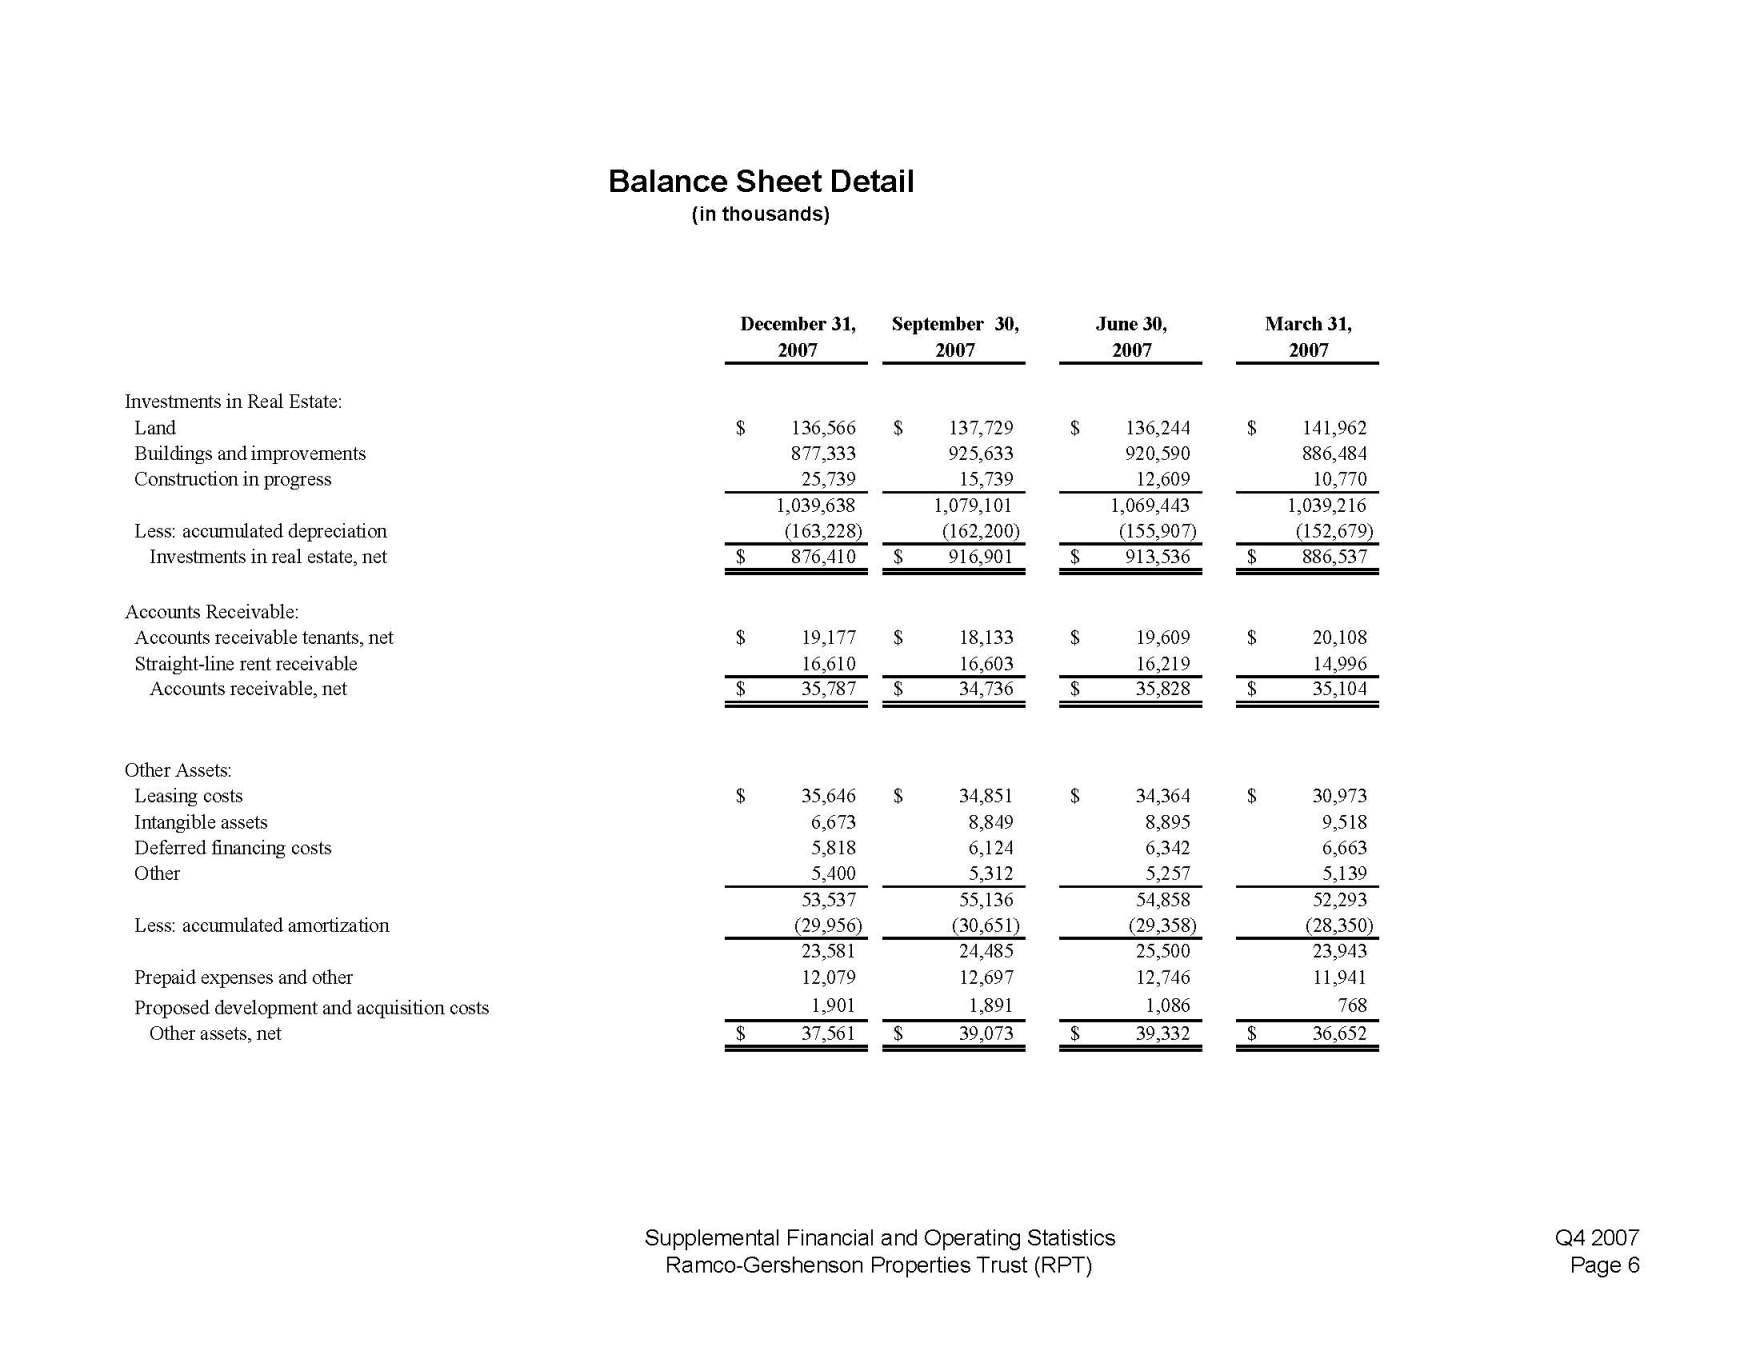
Balance Sheet Detail (in thousands) December 31, September 30, June 30, March 31, 2007 2007 2007 2007 Investments in Real Estate: Land $ 136,566 $ 137,729 $ 136,244 $ 141,962 Buildings and improvements 877,333 925,633 920,590 886,484 Construction in progress 25,739 15,739 12,609 10,770 1,039,638 1,079,101 1,069,443 1,039,216 Less: accumulated depreciation (163,228) (162,200) (155,907) (152,679) Investments in real estate, net $ 876,410 $ 916,901 $ 913,536 $ 886,537 Accounts Receivable: Accounts receivable tenants, net $ Straight-line rent receivable Accounts receivable, net $ 19,177 $ 18,133 $ 19,609 $ 20,108 16,610 16,603 16,219 14,99635,787 $ 34,736 $ 35,828 $ 35,104 Other Assets: Leasing costs $ 35,646 $ Intangible assets 6,673 Deferred financing costs 5,818 Other 5,400 53,537 Less: accumulated amortization (29,956) 23,581 Prepaid expenses and other 12,079 Proposed development and acquisition costs 1,901 Other assets, net $ 37,561 $ 34,851 $ 34,364 $ 30,973 8,849 8,895 9,5186,124 6,342 6,6635,312 5,257 5,139 55,136 54,858 52,293(30,651) (29,358) (28,350) 24,485 25,500 23,94312,697 12,746 11,9411,891 1,086 76839,073 $ 39,332 $ 36,652 Supplemental Financial and Operating Statistics Q4 2007 Ramco-Gershenson Properties Trust (RPT) Page 6
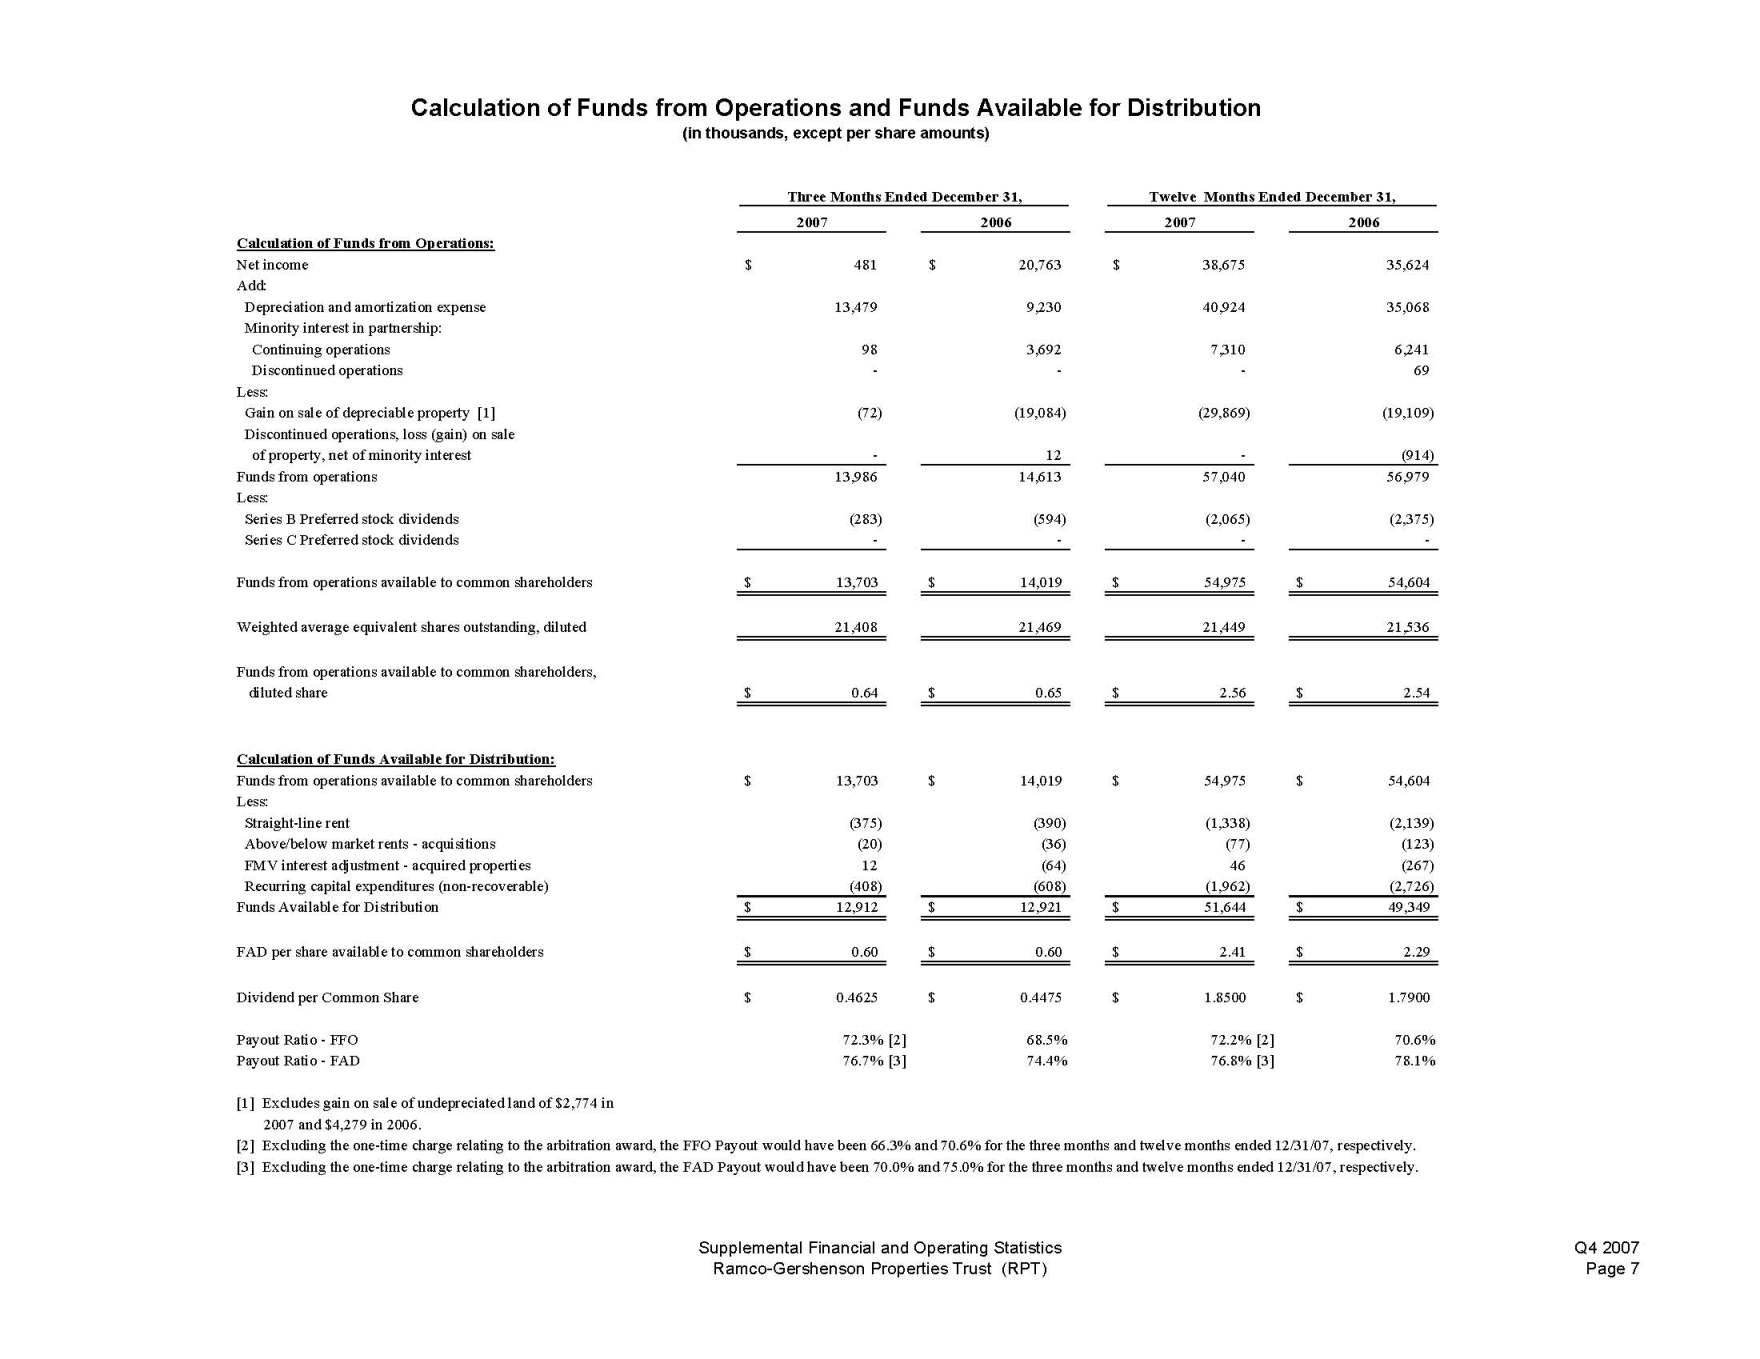
Calculation of Funds from Operations and Funds Available for Distribution (in thousands, except per share amounts) Three Months Ended December 31, Twelve Months Ended December 31, 2007 2006 2007 2006 Calculation of Funds from Operations: Net income $ 481 $ 20,763 $ 38,675 35,624 Add: Depreciation and amortization expense 13,479 9,230 40,924 35,068 Minority interest in partnership: Continuing operations 98 3,692 7,310 6,241 Discontinued operations - - - 69 Less: Gain on sale of depreciable property [1] (72) (19,084) (29,869) (19,109) Discontinued operations, loss (gain) on sale of property, net of minority interest - 12 - (914) Funds from operations 13,986 14,613 57,040 56,979 Less: Series B Preferred stock dividends (283) (594) (2,065) (2,375) Series C Preferred stock dividends - - - - Funds from operations available to common shareholders 13,703$ 14,019$ 54,975$ 54,604$ Weighted average equivalent shares outstanding, diluted 21,408 21,469 21,449 21,536 Funds from operations available to common shareholders, diluted share 0.64$ 0.65$ 2.56$ 2.54$ Calculation of Funds Available for Distribution: Funds from operations available to common shareholders 13,703$ 14,019$ 54,975$ 54,604$ Less: Straight-line rent (375) (390) (1,338) (2,139) Above/below market rents - acquisitions (20) (36) (77) (123) FMV interest adjustment - acquired properties 12 (64) 46 (267) Recurring capital expenditures (non-recoverable) (408) (608) (1,962) (2,726) Funds Available for Distribution 12,912$ 12,921$ 51,644$ 49,349$ FAD per share available to common shareholders 0.60$ 0.60$ 2.41$ 2.29$ Dividend per Common Share 0.4625$ 0.4475$ 1.8500$ 1.7900$ Payout Ratio - FFO 72.3% [2] 68.5% 72.2% [2] 70.6% Payout Ratio - FAD 76.7% [3] 74.4% 76.8% [3] 78.1% [1] Excludes gain on sale of undepreciated land of $2,774 in 2007 and $4,279 in 2006. [2] Excluding the one-time charge relating to the arbitration award, the FFO Payout would have been 66.3% and 70.6% for the three months and twelve months ended 12/31/07, respectively. [3] Excluding the one-time charge relating to the arbitration award, the FAD Payout would have been 70.0% and 75.0% for the three months and twelve months ended 12/31/07, respectively. Supplemental Financial and Operating Statistics Q4 2007 Ramco-Gershenson Properties Trust (RPT) Page 7
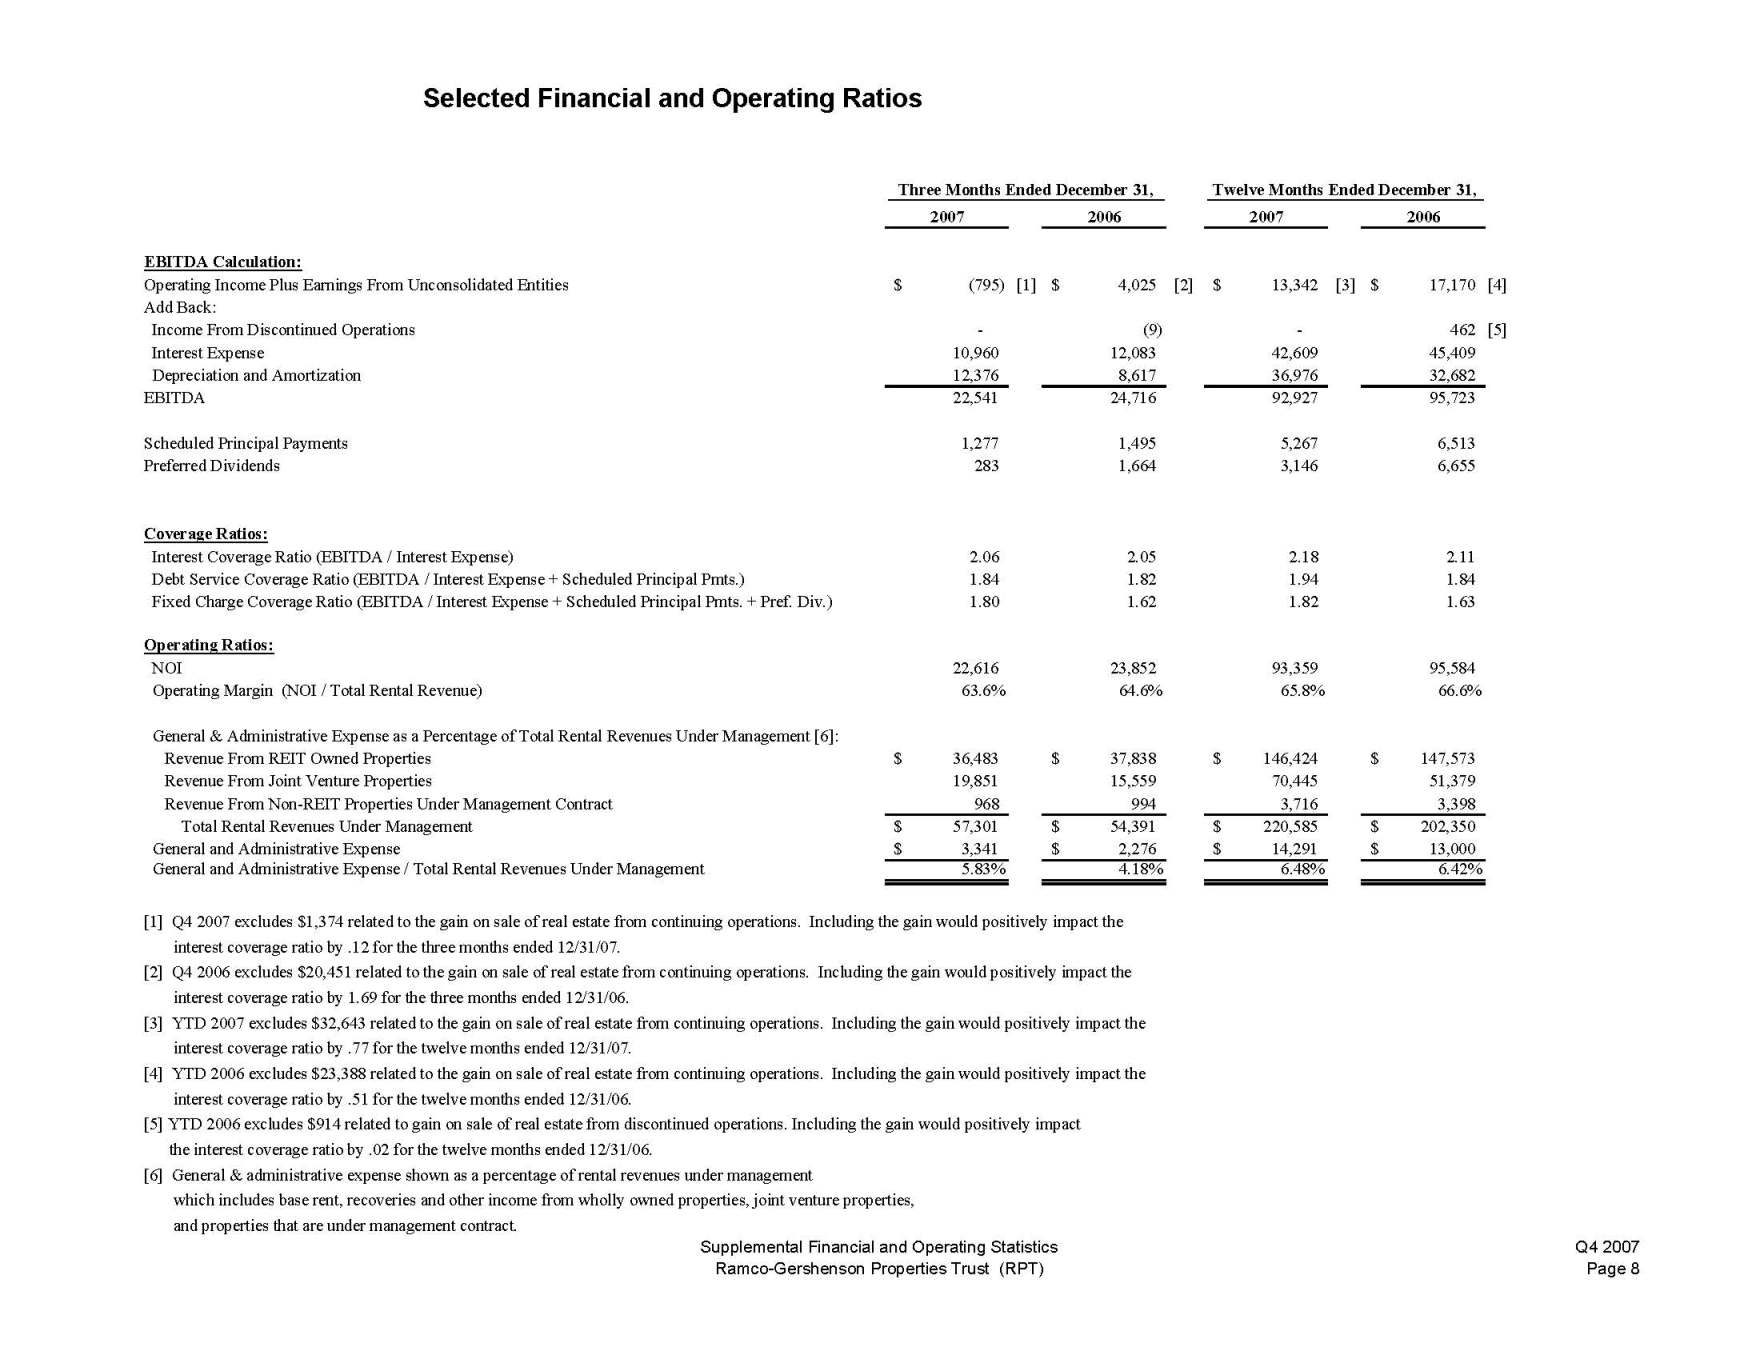
Selected Financial and Operating Ratios Three Months Ended December 31, Twelve Months Ended December 31, 2007 2006 2007 2006 EBITDA Calculation: Operating Income Plus Earnings From Unconsolidated Entities $ (795) [1] $ 4,025 [2] $ 13,342 [3] $ 17,170 [4] Add Back: Income From Discontinued Operations - (9) - 462 [5] Interest Expense 10,960 12,083 42,609 45,409 Depreciation and Amortization 12,376 8,617 36,976 32,682 EBITDA 22,541 24,716 92,927 95,723 Scheduled Principal Payments 1,277 1,495 5,267 6,513 Preferred Dividends 283 1,664 3,146 6,655 Coverage Ratios: Interest Coverage Ratio (EBITDA / Interest Expense) 2.06 2.05 2.18 2.11 Debt Service Coverage Ratio (EBITDA / Interest Expense + Scheduled Principal Pmts.) 1.84 1.82 1.94 1.84 Fixed Charge Coverage Ratio (EBITDA / Interest Expense + Scheduled Principal Pmts. + Pref. Div.) 1.80 1.62 1.82 1.63 Operating Ratios: NOI 22,616 23,852 93,359 95,584 Operating Margin (NOI / Total Rental Revenue) 63.6% 64.6% 65.8% 66.6% General & Administrative Expense as a Percentage of Total Rental Revenues Under Management [6]: Revenue From REIT Owned Properties 36,483$ 37,838$ 146,424$ 147,573$ Revenue From Joint Venture Properties 19,851 15,559 70,445 51,379 Revenue From Non-REIT Properties Under Management Contract 968 994 3,716 3,398 Total Rental Revenues Under Management 57,301$ 54,391$ 220,585$ 202,350$ General and Administrative Expense 3,341$ 2,276$ 14,291$ 13,000$ General and Administrative Expense / Total Rental Revenues Under Management 5.83% 4.18% 6.48% 6.42% [1] Q4 2007 excludes $1,374 related to the gain on sale of real estate from continuing operations. Including the gain would positively impact the interest coverage ratio by .12 for the three months ended 12/31/07. [2] Q4 2006 excludes $20,451 related to the gain on sale of real estate from continuing operations. Including the gain would positively impact the interest coverage ratio by 1.69 for the three months ended 12/31/06. [3] YTD 2007 excludes $32,643 related to the gain on sale of real estate from continuing operations. Including the gain would positively impact the interest coverage ratio by .77 for the twelve months ended 12/31/07. [4] YTD 2006 excludes $23,388 related to the gain on sale of real estate from continuing operations. Including the gain would positively impact the interest coverage ratio by .51 for the twelve months ended 12/31/06. [5] YTD 2006 excludes $914 related to gain on sale of real estate from discontinued operations. Including the gain would positively impact the interest coverage ratio by .02 for the twelve months ended 12/31/06. [6] General & administrative expense shown as a percentage of rental revenues under management which includes base rent, recoveries and other income from wholly owned properties, joint venture properties, and properties that are under management contract. Supplemental Financial and Operating Statistics Q4 2007 Ramco-Gershenson Properties Trust (RPT) Page 8
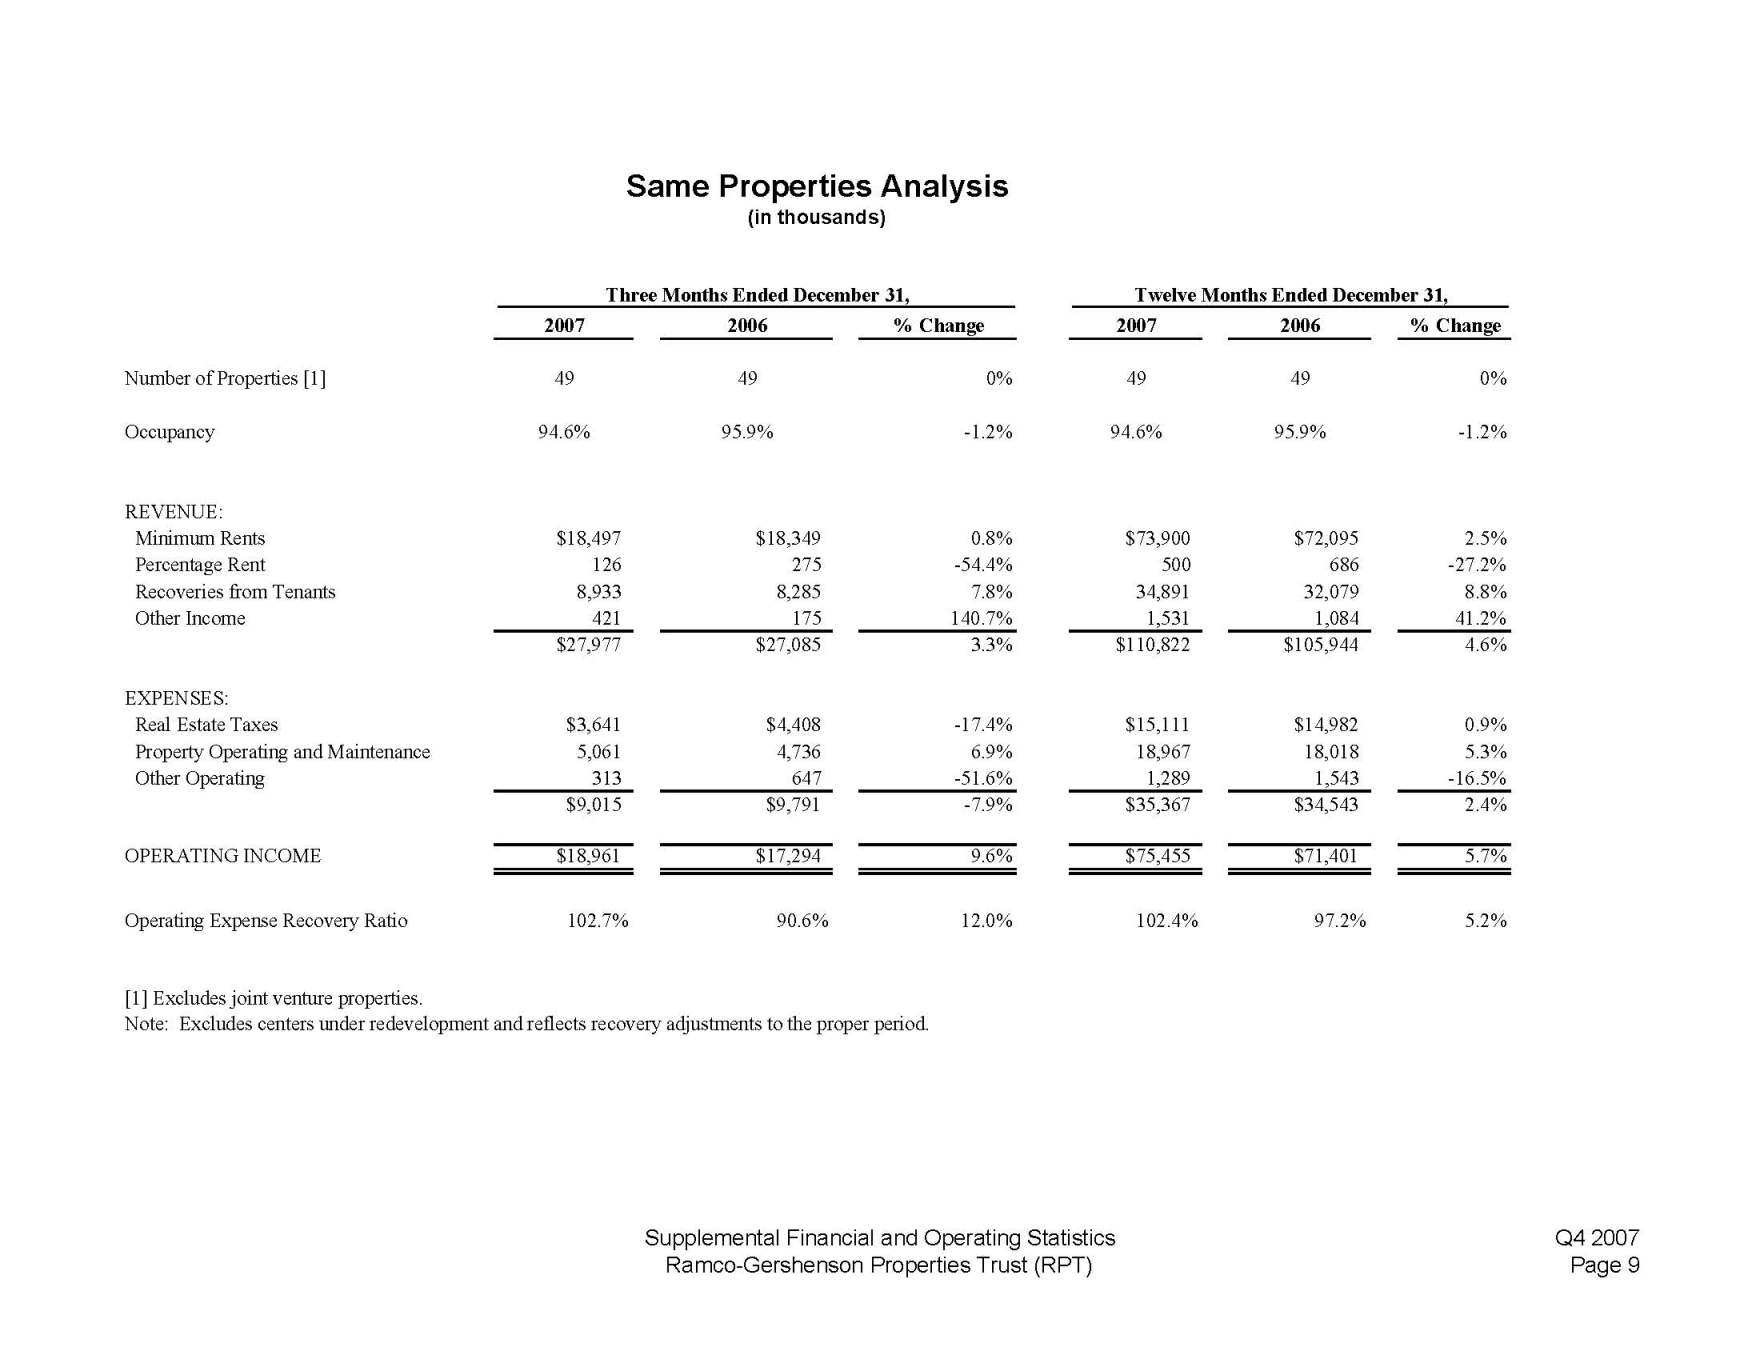
Same Properties Analysis (in thousands) Three Months Ended December 31, Twelve Months Ended December 31, 2007 2006 % Change 2007 2006 % Change Number of Properties [1] 49 49 0% 49 49 0% Occupancy 94.6% 95.9% -1.2% 94.6% 95.9% -1.2% REVENUE: Minimum Rents $18,497 $18,349 0.8% $73,900 $72,095 2.5% Percentage Rent 126 275 -54.4% 500 686 -27.2% Recoveries from Tenants 8,933 8,285 7.8% 34,891 32,079 8.8% Other Income 421 175 140.7% 1,531 1,084 41.2% $27,977 $27,085 3.3% $110,822 $105,944 4.6% EXPENSES: Real Estate Taxes $3,641 $4,408 -17.4% $15,111 $14,982 0.9% Property Operating and Maintenance 5,061 4,736 6.9% 18,967 18,018 5.3% Other Operating 313 647 -51.6% 1,289 1,543 -16.5% $9,015 $9,791 -7.9% $35,367 $34,543 2.4% OPERATING INCOME $18,961 $17,294 9.6% $75,455 $71,401 5.7% Operating Expense Recovery Ratio 102.7% 90.6% 12.0% 102.4% 97.2% 5.2% [1] Excludes joint venture properties. Note: Excludes centers under redevelopment and reflects recovery adjustments to the proper period. Supplemental Financial and Operating Statistics Q4 2007 Ramco-Gershenson Properties Trust (RPT) Page 9
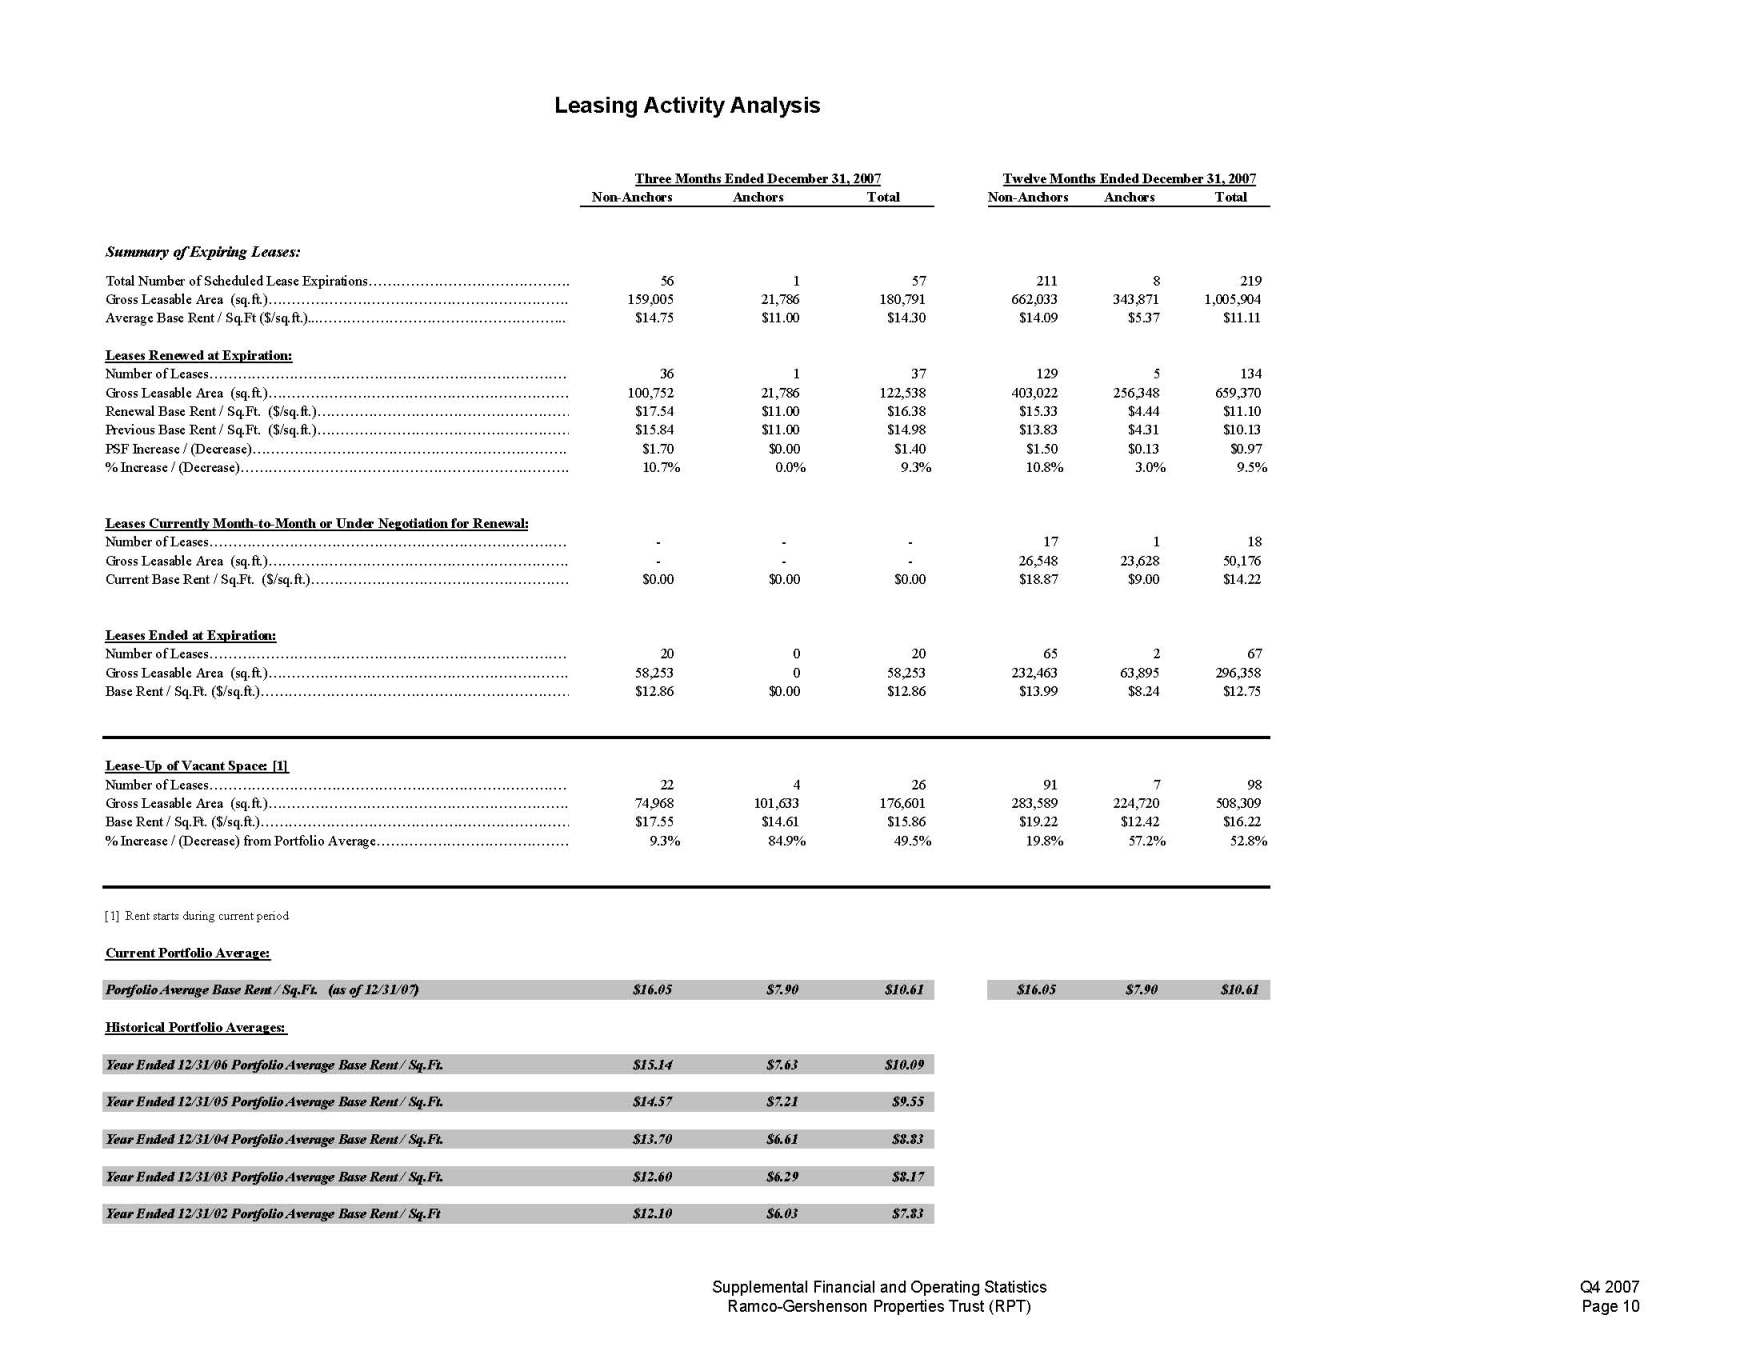
Leasing Activity Analysis Three Months Ended December 31, 2007 Twelve Months Ended December 31, 2007 Non-Anchors Anchors Total Non-Anchors Anchors Total Summary of Expiring Leases: Total Number of Scheduled Lease Expirations 56 1 57 211 8 219 Gross Leasable Area (sq.ft.) 159,005 21,786 180,791 662,033 343,871 1,005,904 Average Base Rent / Sq.Ft ($/sq.ft.)$14.75 $11.00 $14.30 $14.09 $5.37 $11.11 Leases Renewed at Expiration: Number of Leases 36 1 37 129 5 134 Gross Leasable Area (sq.ft.) 100,752 21,786 122,538 403,022 256,348 659,370 Renewal Base Rent / Sq.Ft. ($/sq.ft.) $17.54 $11.00 $16.38 $15.33 $4.44 $11.10 Previous Base Rent / Sq.Ft. ($/sq.ft.)$15.84 $11.00 $14.98 $13.83 $4.31 $10.13 PSF Increase / (Decrease) $1.70 $0.00 $1.40 $1.50 $0.13 $0.97 % Increase / (Decrease) 10.7% 0.0% 9.3% 10.8% 3.0% 9.5% Leases Currently Month-to-Month or Under Negotiation for Renewal: Number of Leases - - - 17 1 18 Gross Leasable Area (sq.ft.) - - - 26,548 23,628 50,176 Current Base Rent / Sq.Ft. ($/sq.ft.)$0.00 $0.00 $0.00 $18.87 $9.00 $14.22 Leases Ended at Expiration: Number of Leases 20 0 20 65 2 67 Gross Leasable Area (sq.ft.) 58,253 0 58,253 232,463 63,895 296,358 Base Rent / Sq.Ft. ($/sq.ft.) $12.86 $0.00 $12.86 $13.99 $8.24 $12.75 Lease-Up of Vacant Space: [1] Number of Leases 22 4 26 91 7 98 Gross Leasable Area (sq.ft.)74,968 101,633 176,601 283,589 224,720 508,309 Base Rent / Sq.Ft. ($/sq.ft.) $17.55 $14.61 $15.86 $19.22 $12.42 $16.22 % Increase / (Decrease) from Portfolio Average 9.3% 84.9% 49.5% 19.8% 57.2% 52.8% [1] Rent starts during current period Current Portfolio Average: Portfolio Average Base Rent / Sq.Ft. (as of 12/31/07) $16.05 $7.90 $10.61 $16.05 $7.90 $10.61 Historical Portfolio Averages: Year Ended 12/31/06 Portfolio Average Base Rent / Sq.Ft. $15.14 $7.63 $10.09 Year Ended 12/31/05 Portfolio Average Base Rent / Sq.Ft. $14.57 $7.21 $9.55 Year Ended 12/31/04 Portfolio Average Base Rent / Sq.Ft. $13.70 $6.61 $8.83 Year Ended 12/31/03 Portfolio Average Base Rent / Sq.Ft. $12.60 $6.29 $8.17 Year Ended 12/31/02 Portfolio Average Base Rent / Sq.Ft $12.10 $6.03 $7.83 Supplemental Financial and Operating Statistics Q4 2007 Ramco-Gershenson Properties Trust (RPT) Page 10
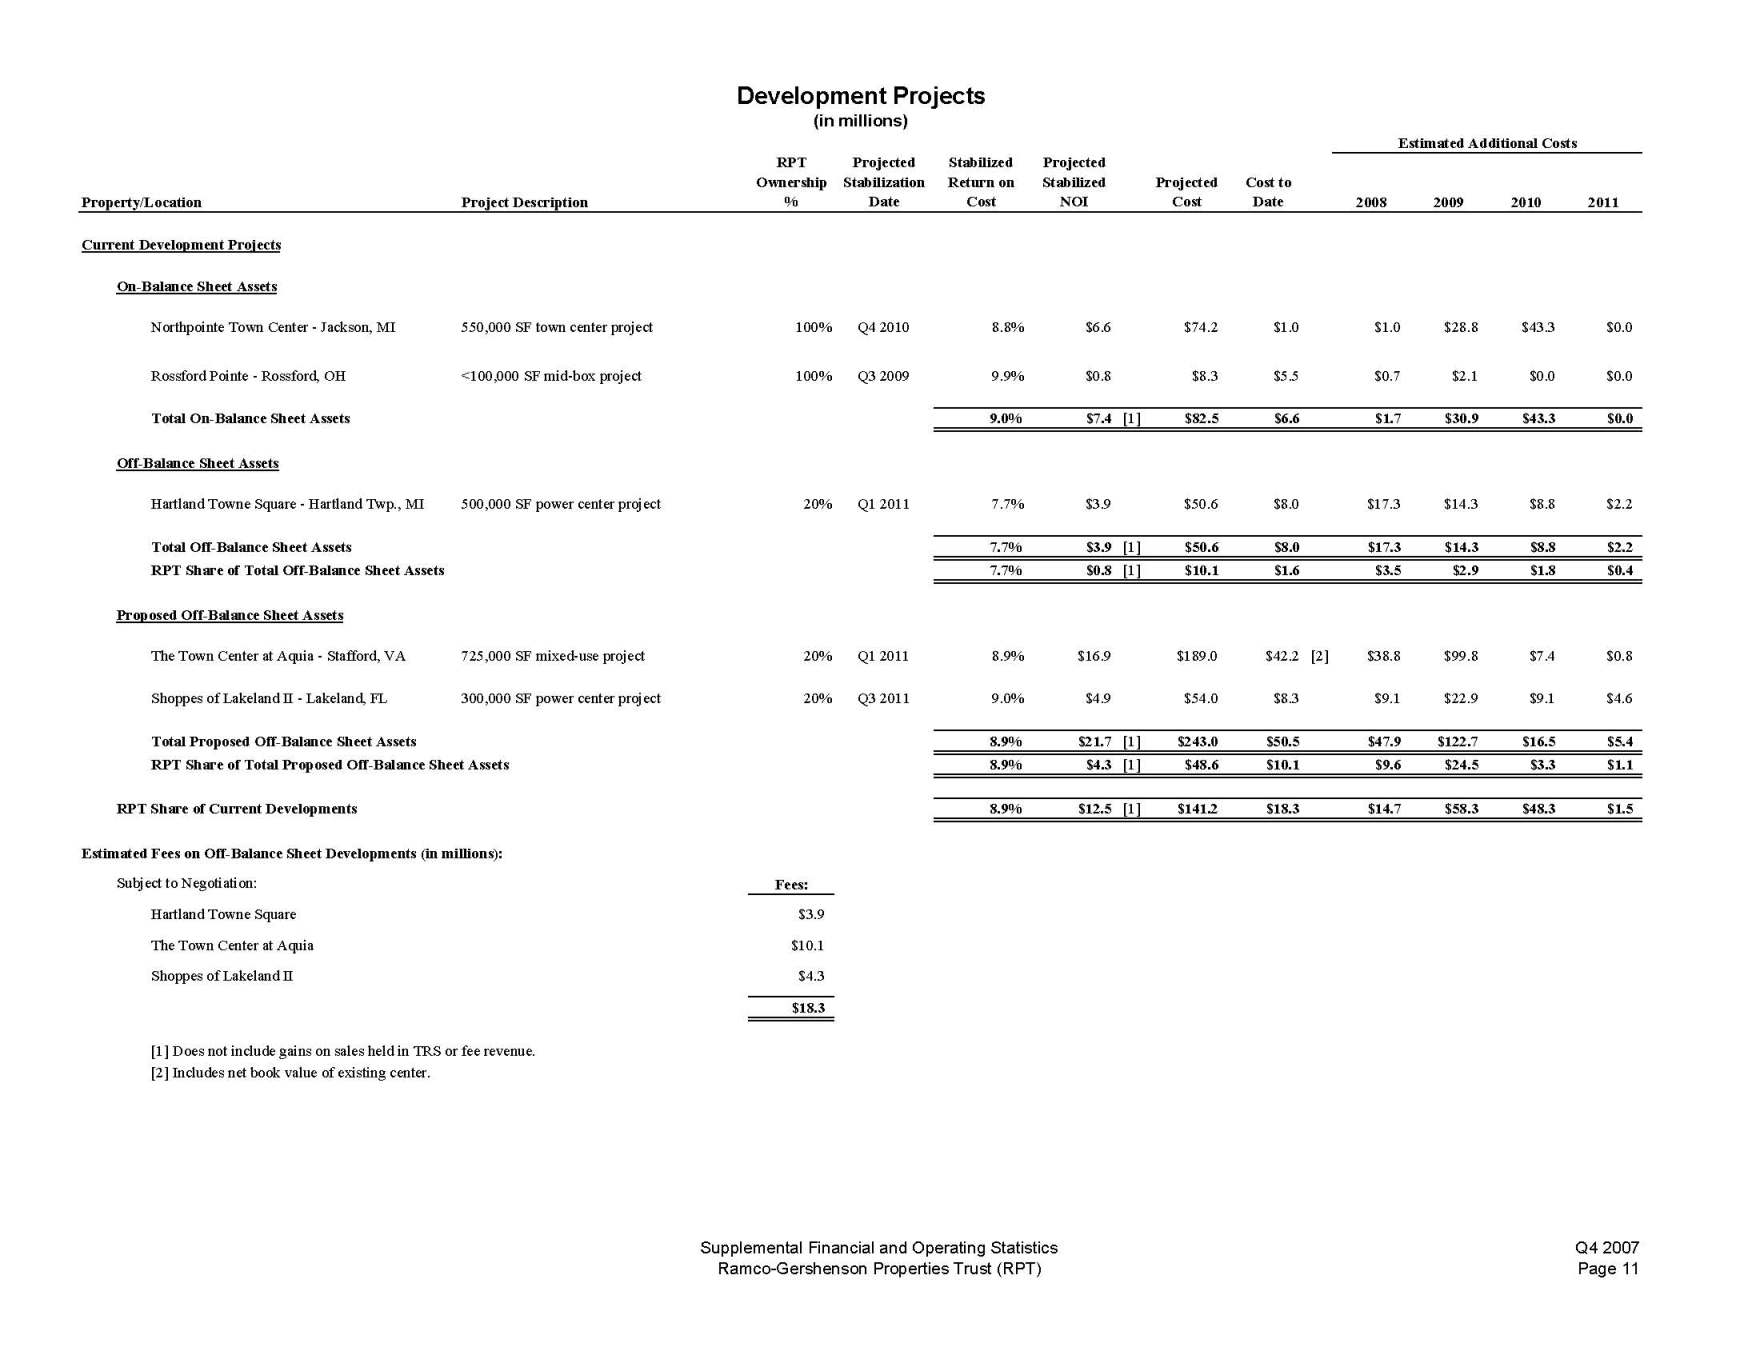
Development Projects (in millions) Estimated Additional Costs RPT Projected Stabilized Projected Ownership Stabilization Return on Stabilized Projected Cost to Property/Location Project Description % Date Cost NOI Cost Date 2008 2009 2010 2011 Current Development Projects On-Balance Sheet Assets Northpointe Town Center - Jackson, MI 550,000 SF town center project 100% Q4 2010 8.8% $6.6 $74.2 $1.0 $1.0 $28.8 $43.3 $0.0 Rossford Pointe - Rossford, OH <100,000 SF mid-box project 100% Q3 2009 9.9% $0.8 $8.3 $5.5 $0.7 $2.1 $0.0 $0.0 Total On-Balance Sheet Assets 9.0% $7.4 [1] $82.5 $6.6 $1.7 $30.9 $43.3 $0.0 Off-Balance Sheet Assets Hartland Towne Square - Hartland Twp., MI 500,000 SF power center project 20% Q1 2011 7.7% $3.9 $50.6 $8.0 $17.3 $14.3 $8.8 $2.2 Total Off-Balance Sheet Assets 7.7% $3.9 [1] $50.6 $8.0 $17.3 $14.3 $8.8 $2.2 RPT Share of Total Off-Balance Sheet Assets 7.7% $0.8 [1] $10.1 $1.6 $3.5 $2.9 $1.8 $0.4 Proposed Off-Balance Sheet Assets The Town Center at Aquia - Stafford, VA 725,000 SF mixed-use project 20% Q1 2011 8.9% $16.9 $189.0 $42.2 [2] $38.8 $99.8 $7.4 $0.8 Shoppes of Lakeland II - Lakeland, FL 300,000 SF power center project 20% Q3 2011 9.0% $4.9 $54.0 $8.3 $9.1 $22.9 $9.1 $4.6 Total Proposed Off-Balance Sheet Assets 8.9% $21.7 [1] $243.0 $50.5 $47.9 $122.7 $16.5 $5.4 RPT Share of Total Proposed Off-Balance Sheet Assets 8.9% $4.3 [1] $48.6 $10.1 $9.6 $24.5 $3.3 $1.1 RPT Share of Current Developments 8.9% $12.5 [1] $141.2 $18.3 $14.7 $58.3 $48.3 $1.5 Estimated Fees on Off-Balance Sheet Developments (in millions): Subject to Negotiation: Fees: Hartland Towne Square $3.9 The Town Center at Aquia $10.1 Shoppes of Lakeland II $4.3 $18.3 [1] Does not include gains on sales held in TRS or fee revenue. [2] Includes net book value of existing center. Supplemental Financial and Operating Statistics Q4 2007 Ramco-Gershenson Properties Trust (RPT) Page 11
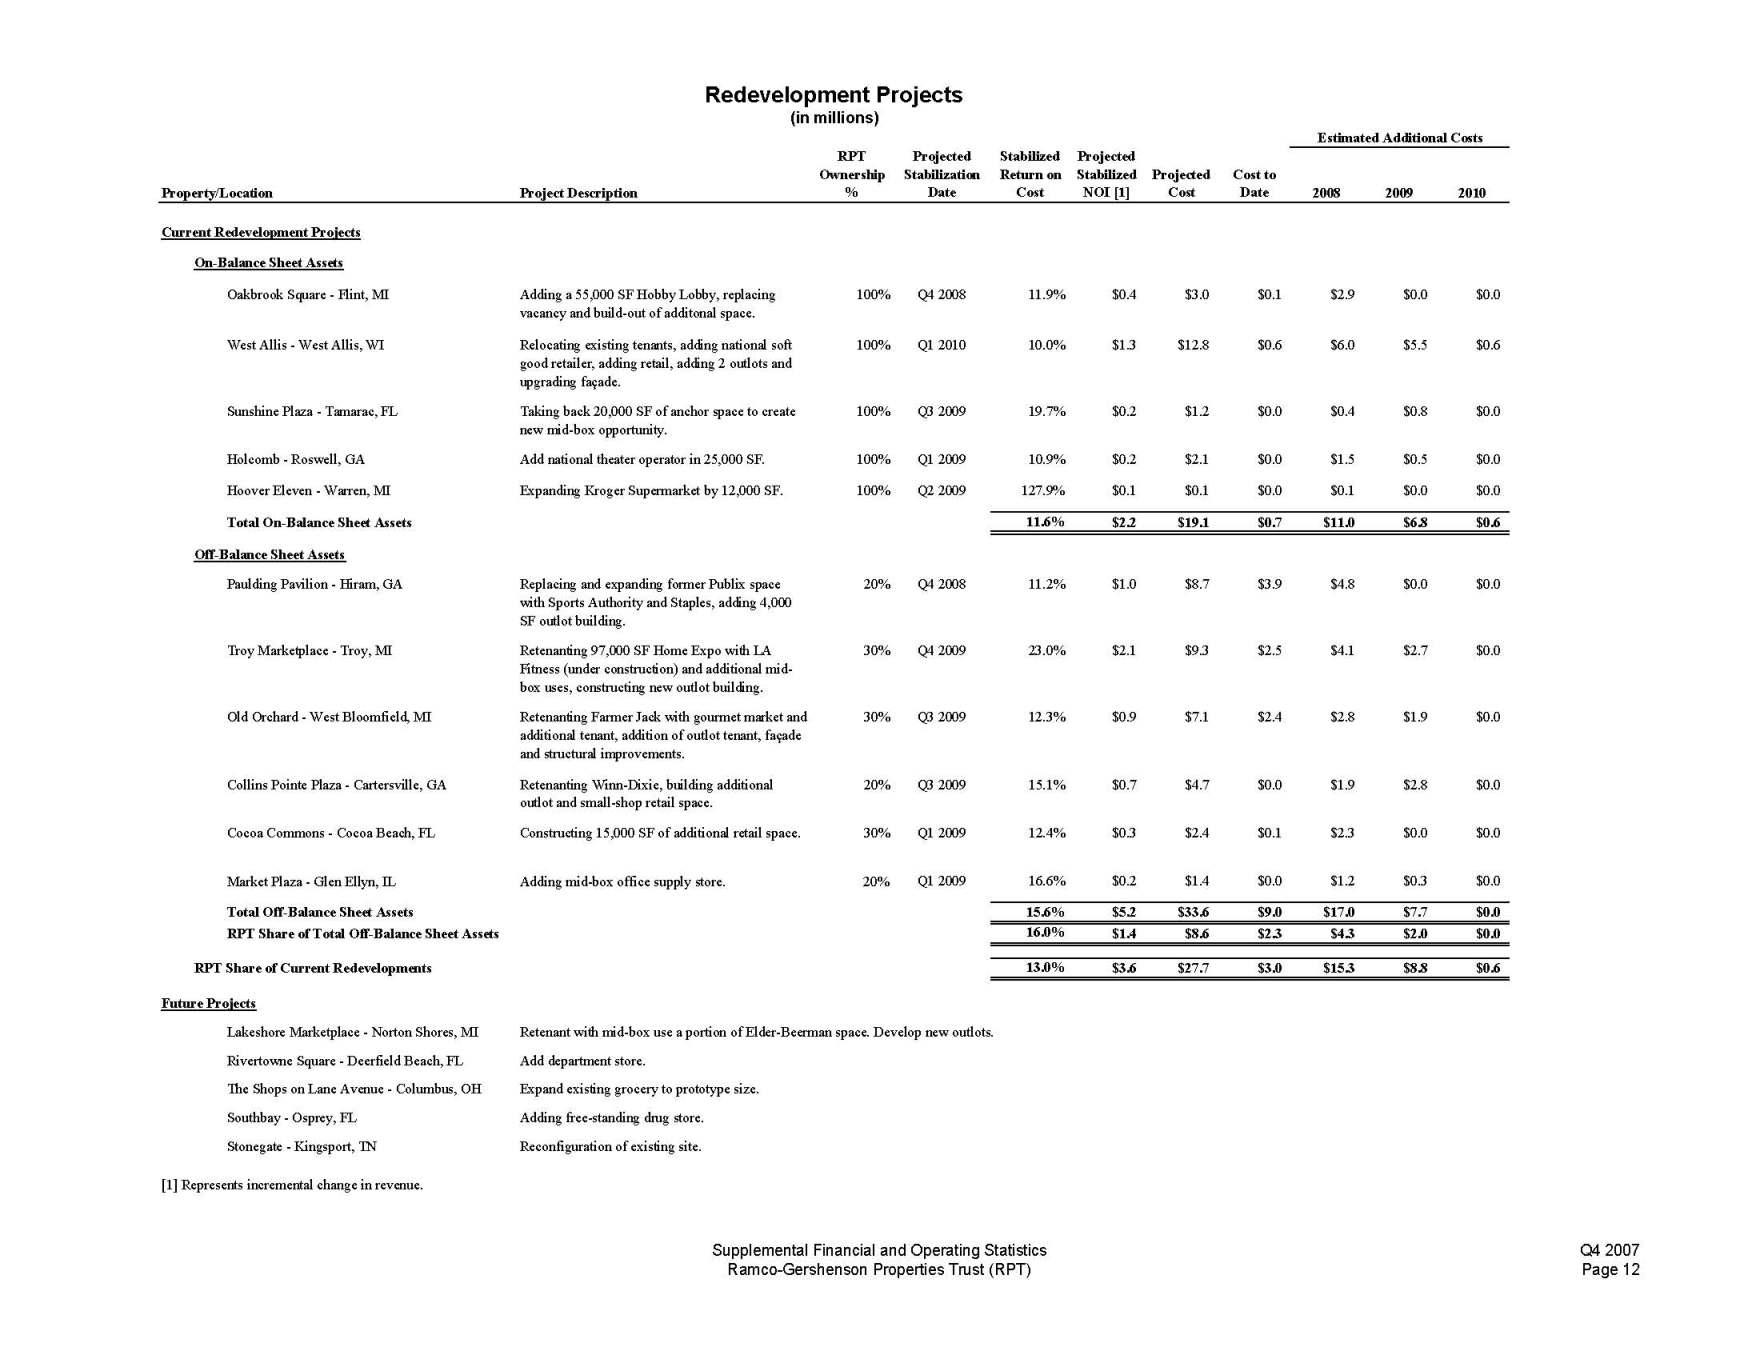
Redevelopment Projects (in millions) Estimated Additional Costs RPT Projected Stabilized Projected Ownership Stabilization Return on Stabilized Projected Cost to Property/Location Project Description % Date Cost NOI [1] Cost Date 2008 2009 2010 Current Redevelopment Projects On-Balance Sheet Assets Oakbrook Square - Flint, MI Adding a 55,000 SF Hobby Lobby, replacing 100% Q4 2008 11.9% $0.4 $3.0 $0.1 $2.9 $0.0 $0.0 vacancy and build-out of additonal space. West Allis - West Allis, WI Relocating existing tenants, adding national soft 100% Q1 2010 10.0% $1.3 $12.8 $0.6 $6.0 $5.5 $0.6 good retailer, adding retail, adding 2 outlots and upgrading façade. Sunshine Plaza - Tamarac, FL Taking back 20,000 SF of anchor space to create 100% Q3 2009 19.7% $0.2 $1.2 $0.0 $0.4 $0.8 $0.0 new mid-box opportunity. Holcomb - Roswell, GA Add national theater operator in 25,000 SF. 100% Q1 2009 10.9% $0.2 $2.1 $0.0 $1.5 $0.5 $0.0 Hoover Eleven - Warren, MI Expanding Kroger Supermarket by 12,000 SF. 100% Q2 2009 127.9% $0.1 $0.1 $0.0 $0.1 $0.0 $0.0 Total On-Balance Sheet Assets 11.6% $2.2 $19.1 $0.7 $11.0 $6.8 $0.6 Off-Balance Sheet Assets Paulding Pavilion - Hiram, GA Replacing and expanding former Publix space 20% Q4 2008 11.2% $1.0 $8.7 $3.9 $4.8 $0.0 $0.0 with Sports Authority and Staples, adding 4,000 SF outlot building. Troy Marketplace - Troy, MI Retenanting 97,000 SF Home Expo with LA 30% Q4 2009 23.0% $2.1 $9.3 $2.5 $4.1 $2.7 $0.0 Fitness (under construction) and additional mid- box uses, constructing new outlot building. Old Orchard - West Bloomfield, MI Retenanting Farmer Jack with gourmet market and 30% Q3 2009 12.3% $0.9 $7.1 $2.4 $2.8 $1.9 $0.0 additional tenant, addition of outlot tenant, façade and structural improvements. Collins Pointe Plaza - Cartersville, GA Retenanting Winn-Dixie, building additional 20% Q3 2009 15.1% $0.7 $4.7 $0.0 $1.9 $2.8 $0.0 outlot and small-shop retail space. Cocoa Commons - Cocoa Beach, FL Constructing 15,000 SF of additional retail space. 30% Q1 2009 12.4% $0.3 $2.4 $0.1 $2.3 $0.0 $0.0 Market Plaza - Glen Ellyn, IL Adding mid-box office supply store. 20% Q1 2009 16.6% $0.2 $1.4 $0.0 $1.2 $0.3 $0.0 Total Off-Balance Sheet Assets 15.6% $5.2 $33.6 $9.0 $17.0 $7.7 $0.0 RPT Share of Total Off-Balance Sheet Assets 16.0% $1.4 $8.6 $2.3 $4.3 $2.0 $0.0 RPT Share of Current Redevelopments 13.0% $3.6 $27.7 $3.0 $15.3 $8.8 $0.6 Future Projects Lakeshore Marketplace - Norton Shores, MI Retenant with mid-box use a portion of Elder-Beerman space. Develop new outlots. Rivertowne Square - Deerfield Beach, FL Add department store. The Shops on Lane Avenue - Columbus, OH Expand existing grocery to prototype size. Southbay - Osprey, FL Adding free-standing drug store. Stonegate - Kingsport, TN Reconfiguration of existing site. [1] Represents incremental change in revenue. Supplemental Financial and Operating Statistics Q4 2007 Ramco-Gershenson Properties Trust (RPT) Page 12
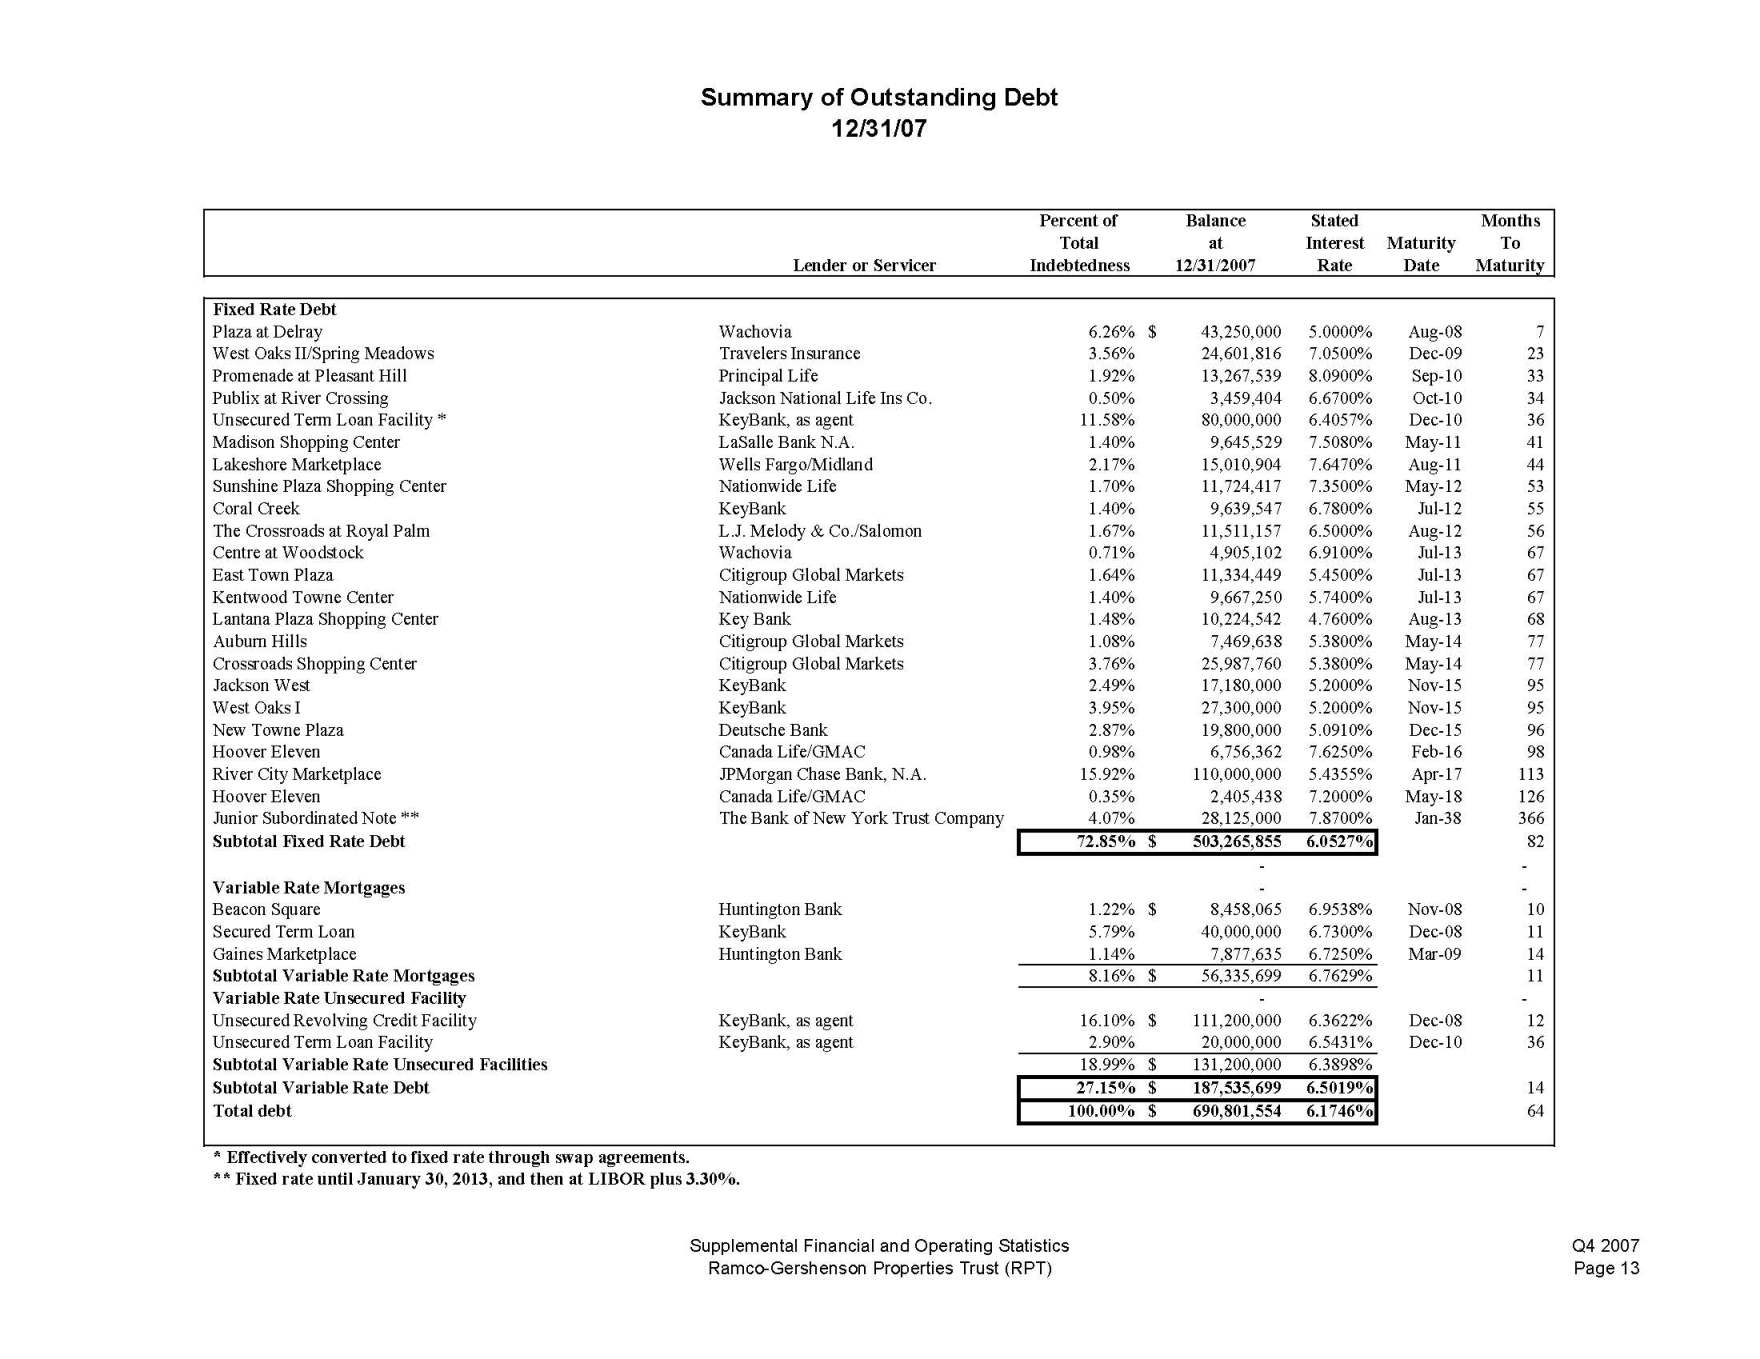
Summary of Outstanding Debt 12/31/07 Lender or Servicer I Percent of Total ndebtedness Balance at 12/31/2007 Stated Interest Rate MMaturity Date M onthsTo aturity Fixed Rate Debt Plaza at Delray Wachovia 6.26% $ 43,250,000 5.0000% Aug-08 7 West Oaks II/Spring Meadows Travelers Insurance 3.56% 24,601,816 7.0500% Dec-09 23 Promenade at Pleasant Hill Principal Life 1.92% 13,267,539 8.0900% Sep-10 33 Publix at River Crossing Jackson National Life Ins Co. 0.50% 3,459,404 6.6700% Oct-10 34 Unsecured Term Loan Facility * KeyBank, as agent 11.58% 80,000,000 6.4057% Dec-10 36 Madison Shopping Center LaSalle Bank N.A. 1.40% 9,645,529 7.5080% May-11 41 Lakeshore Marketplace Wells Fargo/Midland 2.17% 15,010,904 7.6470% Aug-11 44 Sunshine Plaza Shopping Center Nationwide Life 1.70% 11,724,417 7.3500% May-12 53 Coral Creek KeyBank 1.40% 9,639,547 6.7800% Jul-12 55 The Crossroads at Royal Palm L.J. Melody & Co./Salomon 1.67% 11,511,157 6.5000% Aug-12 56 Centre at Woodstock Wachovia 0.71% 4,905,102 6.9100% Jul-13 67 East Town Plaza Citigroup Global Markets 1.64% 11,334,449 5.4500% Jul-13 67 Kentwood Towne Center Nationwide Life 1.40% 9,667,250 5.7400% Jul-13 67 Lantana Plaza Shopping Center Key Bank 1.48% 10,224,542 4.7600% Aug-13 68 Auburn Hills Citigroup Global Markets 1.08% 7,469,638 5.3800% May-14 77 Crossroads Shopping Center Citigroup Global Markets 3.76% 25,987,760 5.3800% May-14 77 Jackson West KeyBank 2.49% 17,180,000 5.2000% Nov-15 95 West Oaks I KeyBank 3.95% 27,300,000 5.2000% Nov-15 95 New Towne Plaza Deutsche Bank 2.87% 19,800,000 5.0910% Dec-15 96 Hoover Eleven Canada Life/GMAC 0.98% 6,756,362 7.6250% Feb-16 98 River City Marketplace JPMorgan Chase Bank, N.A. 15.92% 110,000,000 5.4355% Apr-17 113 Hoover Eleven Canada Life/GMAC 0.35% 2,405,438 7.2000% May-18 126 Junior Subordinated Note ** The Bank of New York Trust Company 4.07% 28,125,000 7.8700% Jan-38 366 Subtotal Fixed Rate Debt 72.85% $ 503,265,855 6.0527% 82 - - - Variable Rate Mortgages - - Beacon Square Huntington Bank 1.22% $ 8,458,065 6.9538% Nov-08 10 Secured Term Loan KeyBank 5.79% 40,000,000 6.7300% Dec-08 11 Gaines Marketplace Huntington Bank 1.14% 7,877,635 6.7250% Mar-09 14 Subtotal Variable Rate Mortgages 8.16% $ 56,335,699 6.7629% 11 Variable Rate Unsecured Facility - - Unsecured Revolving Credit Facility KeyBank, as agent 16.10% $ 111,200,000 6.3622% Dec-08 12 Unsecured Term Loan Facility KeyBank, as agent 2.90% 20,000,000 6.5431% Dec-10 36 Subtotal Variable Rate Unsecured Facilities 18.99% $ 131,200,000 6.3898% Subtotal Variable Rate Debt 27.15% $ 187,535,699 6.5019% 14 Total debt 100.00% $ 690,801,554 6.1746% 64 * Effectively converted to fixed rate through swap agreements. ** Fixed rate until January 30, 2013, and then at LIBOR plus 3.30%. Supplemental Financial and Operating Statistics Q4 2007 Ramco-Gershenson Properties Trust (RPT) Page 13
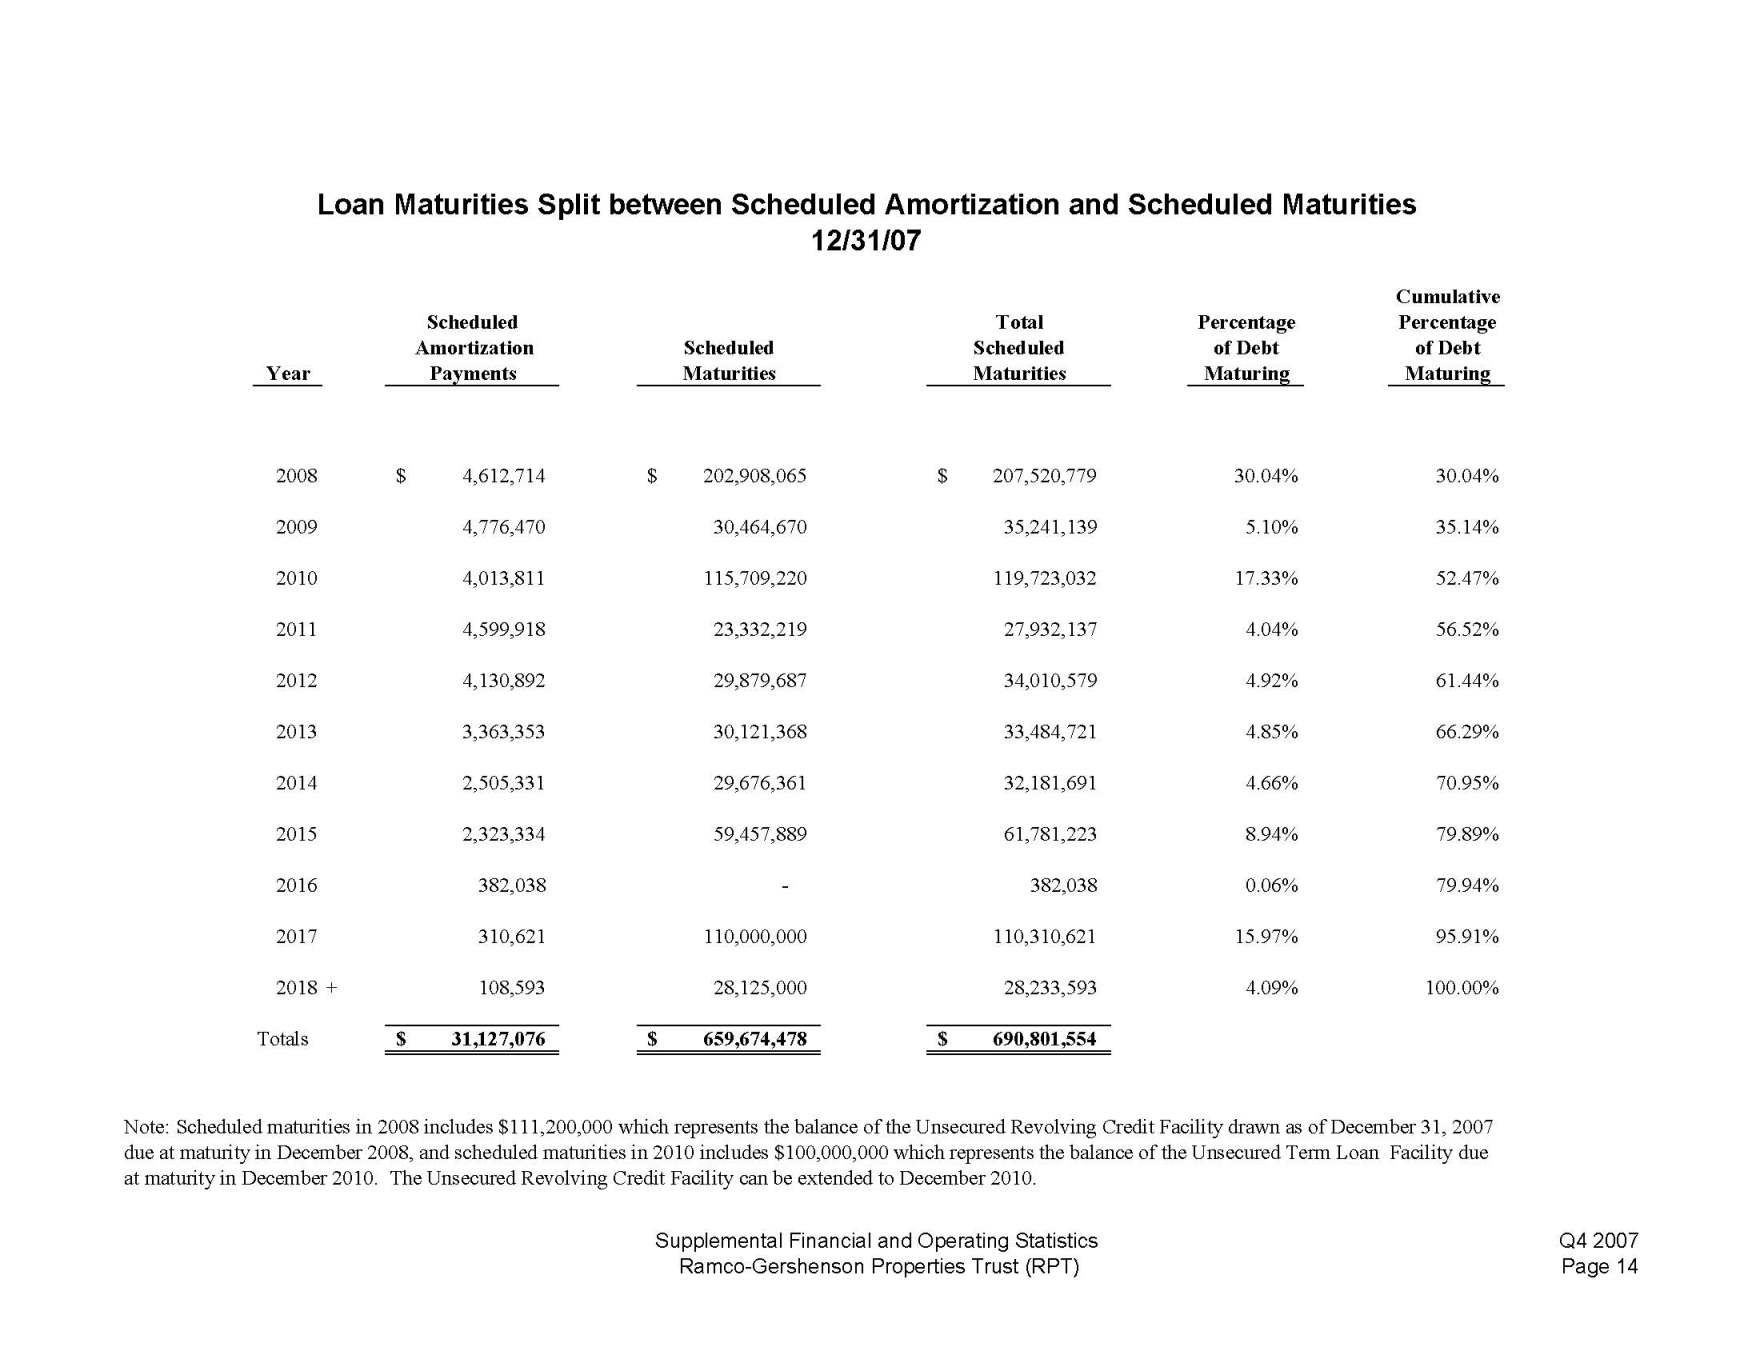
Cumulative Scheduled Total Percentage Percentage Amortization Scheduled Scheduled of Debt of Debt Year Payments Maturities Maturities Maturing Maturing Loan Maturities Split between Scheduled Amortization and Scheduled Maturities 12/31/07 2008 $ 4,612,714 $ 202,908,065 $ 207,520,779 30.04% 30.04% 2009 4,776,470 30,464,670 35,241,139 5.10% 35.14% 2010 4,013,811 115,709,220 119,723,032 17.33% 52.47% 2011 4,599,918 23,332,219 27,932,137 4.04% 56.52% 2012 4,130,892 29,879,687 34,010,579 4.92% 61.44% 2013 3,363,353 30,121,368 33,484,721 4.85% 66.29% 2014 2,505,331 29,676,361 32,181,691 4.66% 70.95% 2015 2,323,334 59,457,889 61,781,223 8.94% 79.89% 2016 382,038 - 382,038 0.06% 79.94% 2017 310,621 110,000,000 110,310,621 15.97% 95.91% 2018 + 108,593 28,125,000 28,233,593 4.09% 100.00% Totals $ 31,127,076 $ 659,674,478 $ 690,801,554 Note: Scheduled maturities in 2008 includes $111,200,000 which represents the balance of the Unsecured Revolving Credit Facility drawn as of December 31, 2007 due at maturity in December 2008, and scheduled maturities in 2010 includes $100,000,000 which represents the balance of the Unsecured Term Loan Facility due at maturity in December 2010. The Unsecured Revolving Credit Facility can be extended to December 2010. Supplemental Financial and Operating Statistics Ramco-Gershenson Properties Trust (RPT) Q4 2007 Page 14
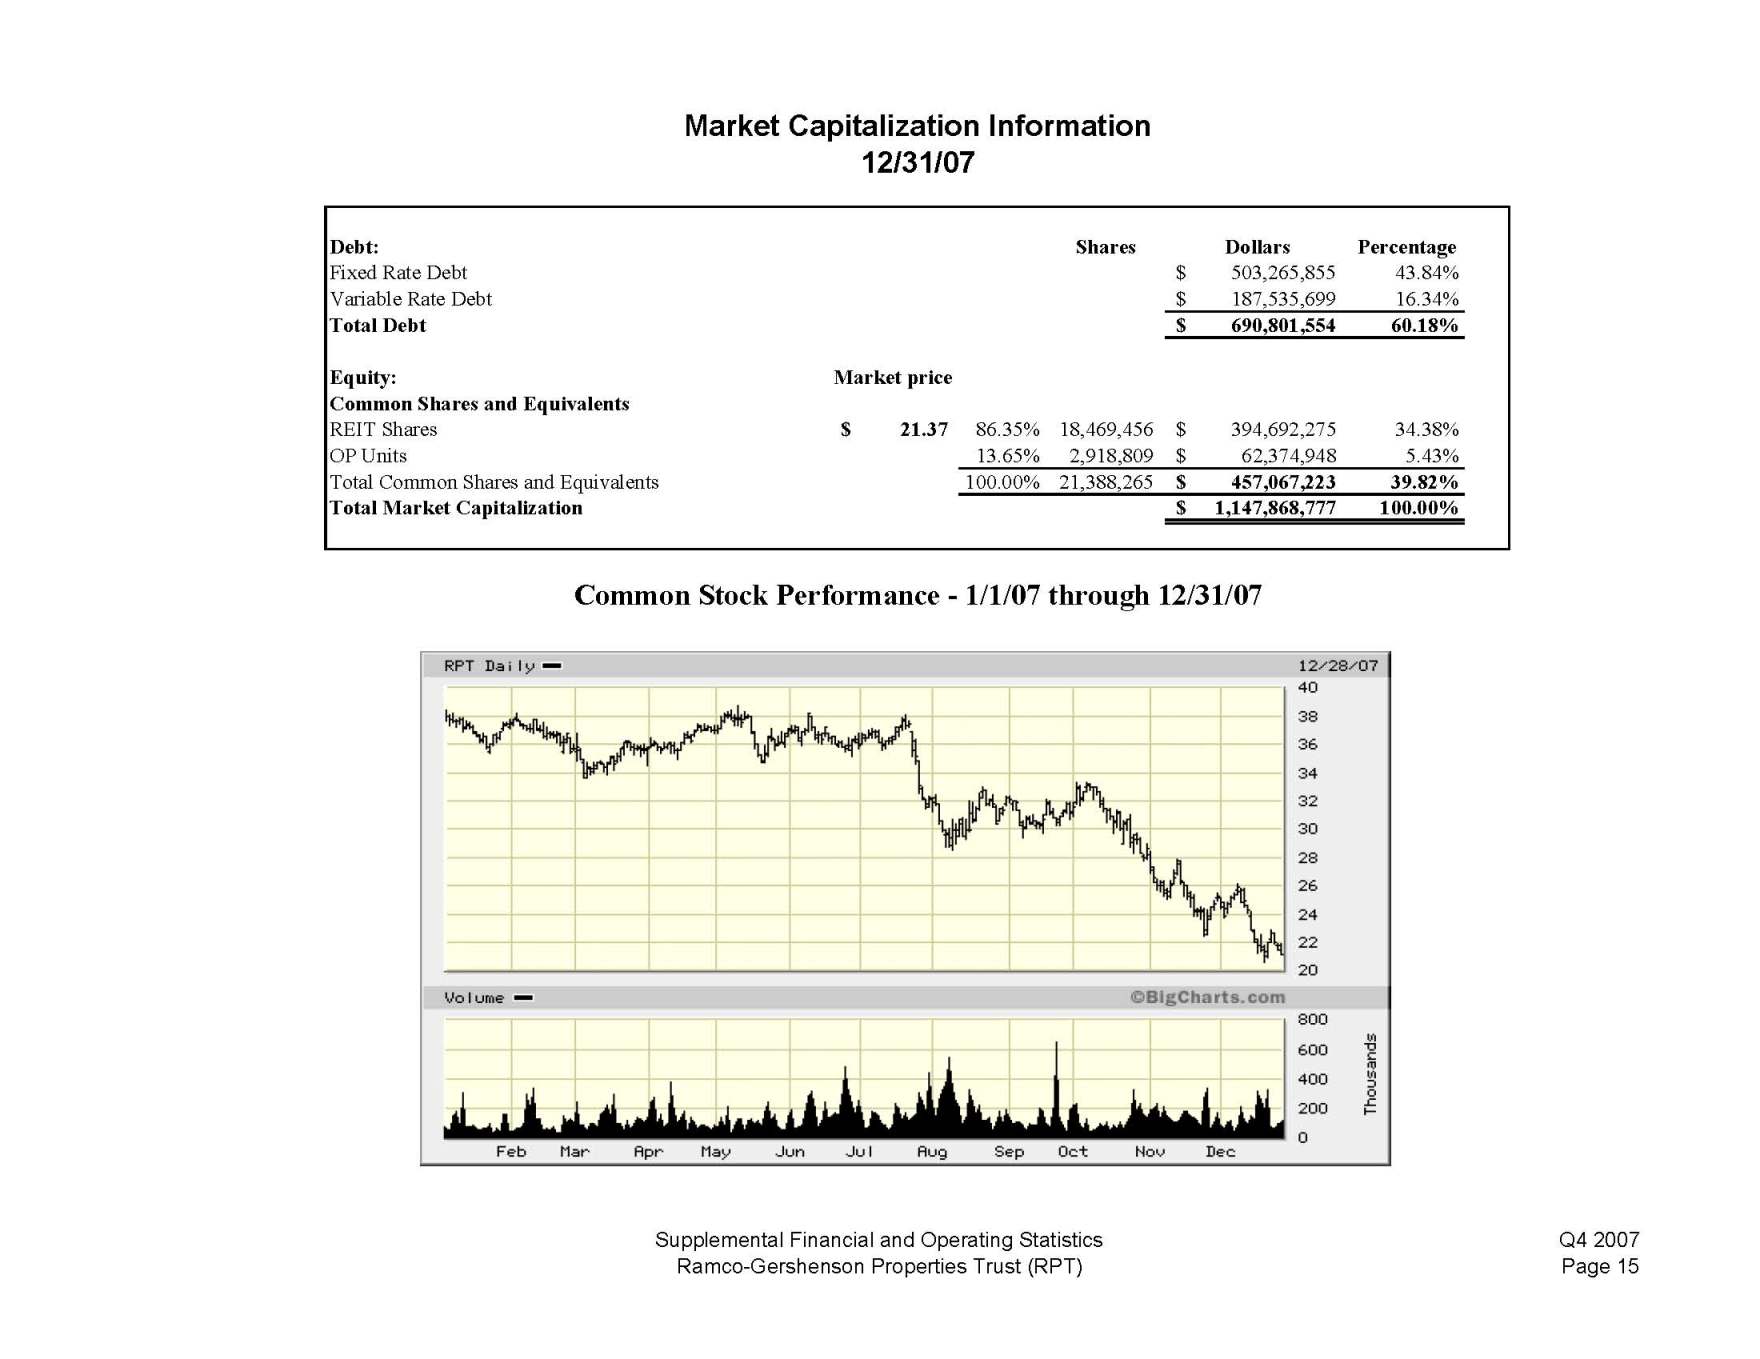
Market Capitalization Information 12/31/07 Debt: Shares Dollars Percentage Fixed Rate Debt $ 503,265,855 43.84% Variable Rate Debt $ 187,535,699 16.34% Total Debt $ 690,801,554 60.18% Equity: Market price Common Shares and Equivalents REIT Shares $ 21.37 86.35% 18,469,456 $ 394,692,275 34.38% OP Units 13.65% 2,918,809 $ 62,374,948 5.43% Total Common Shares and Equivalents 100.00% 21,388,265 $ 457,067,223 39.82% Total Market Capitalization $ 1,147,868,777 100.00% Common Stock Performance - 1/1/07 through 12/31/07 Supplemental Financial and Operating Statistics Ramco-Gershenson Properties Trust (RPT) Q4 2007 Page 15
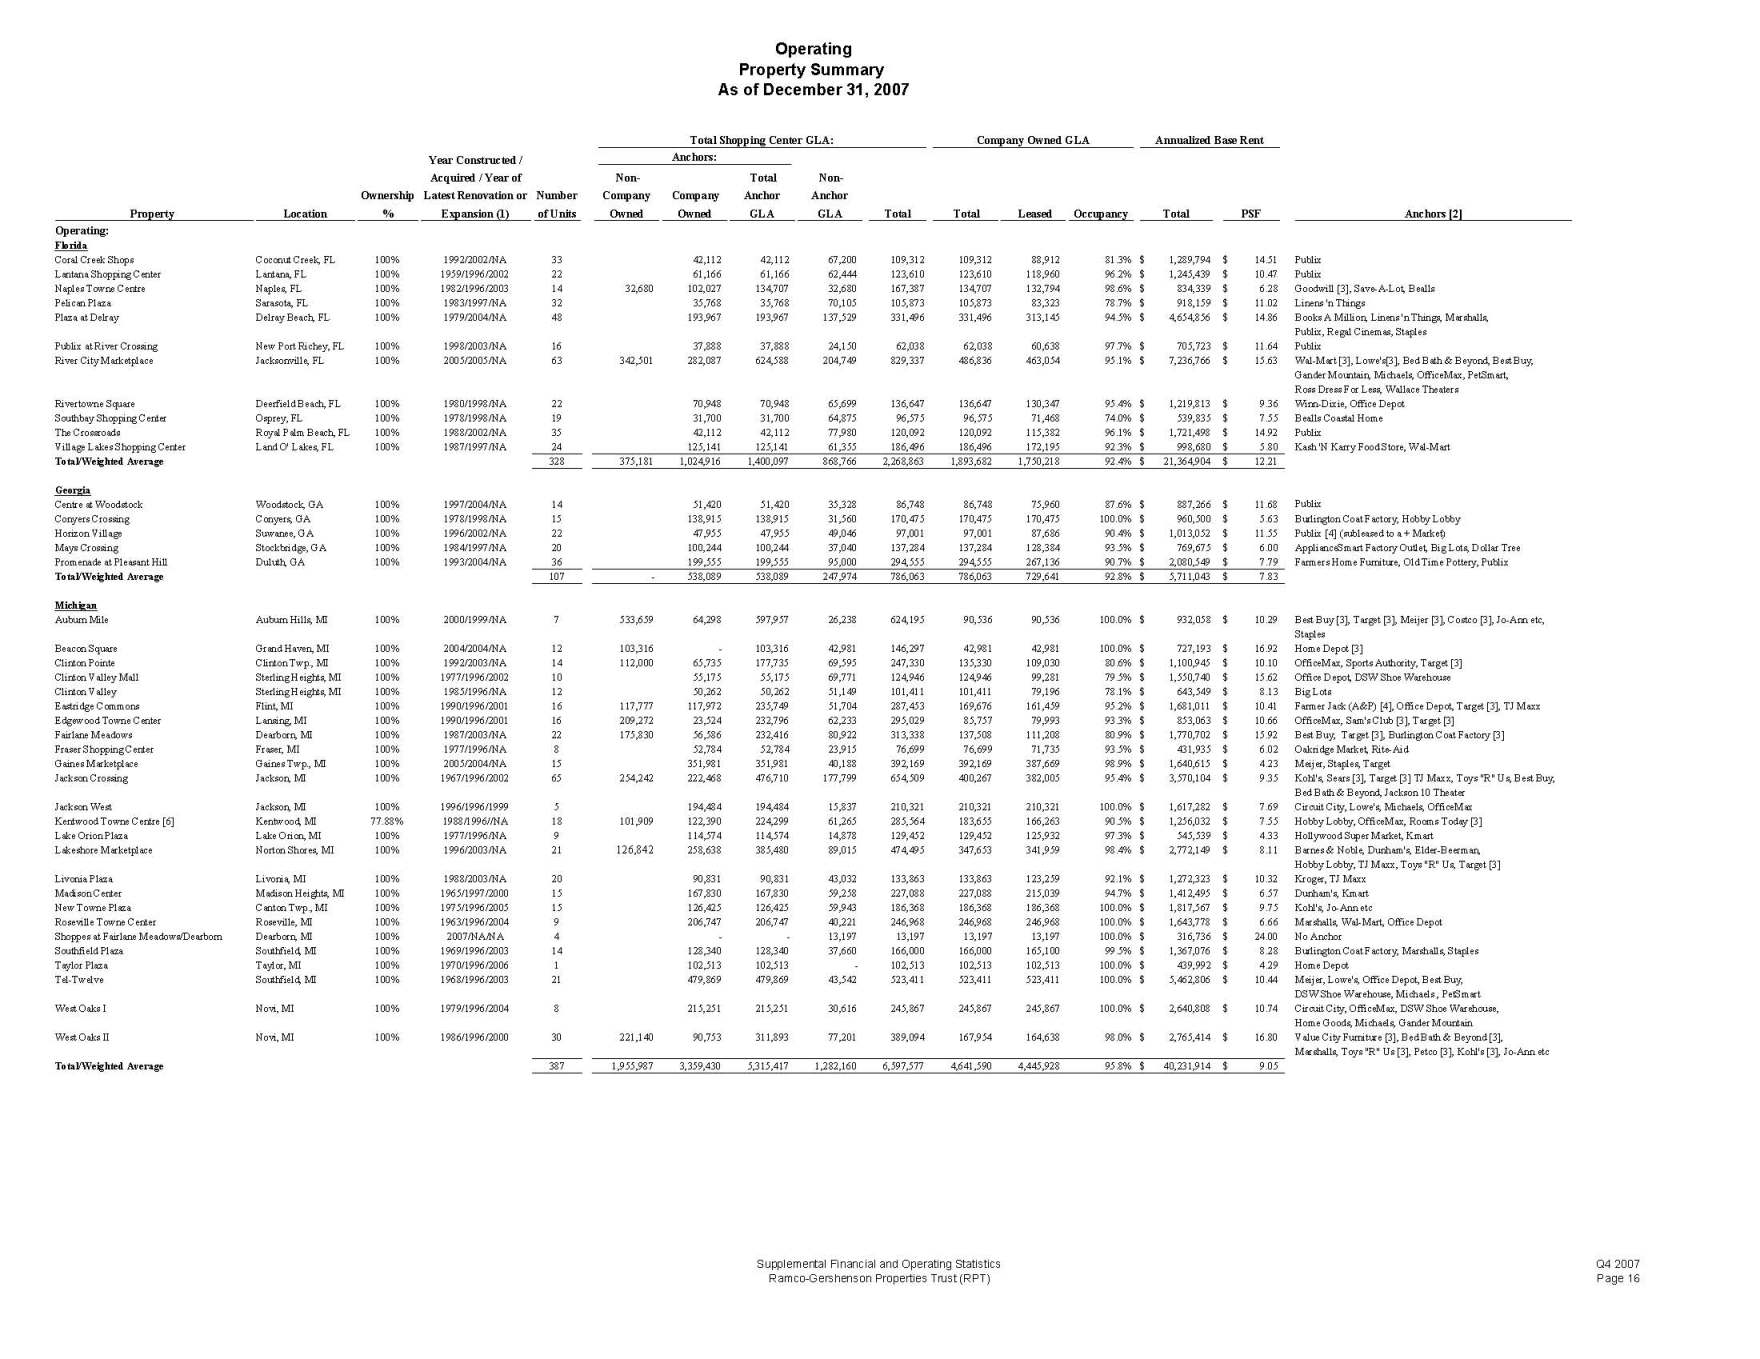
Operating Property Summary As of December 31, 2007 Total Shopping Center GLA: Company Owned GLA Annualized Base Rent Year Constructed / Anchors: Acquired / Year of Non Total Non- Ownership Latest Renovation or Number Company Company Anchor Anchor Property Location % Expansion (1) of Units Owned Owned GLA GLA Total Total Leased Occupancy Total PSF Anchors [2] Operating: Florida Coral Creek Shops Coconut Creek, FL 100% 1992/2002/NA 33 42,112 42,112 67,200 109,312 109,312 88,912 81.3% $ 1,289,794 14.51$ Publix Lantana Shopping Center Lantana, FL 100% 1959/1996/2002 22 61,166 61,166 62,444 123,610 123,610 118,960 96.2% $ 1,245,439 10.47$ Publix Naples Towne Centre Naples, FL 100% 1982/1996/2003 14 32,680 102,027 134,707 32,680 167,387 134,707 132,794 98.6% $ 834,339 6.28$ Goodwill [3], Save-A-Lot, Bealls Pelican Plaza Sarasota, FL 100% 1983/1997/NA 32 35,768 35,768 70,105 105,873 105,873 83,323 78.7% $ 918,159 11.02$ Linens 'n Things Plaza at Delray Delray Beach, FL 100% 1979/2004/NA 48 193,967 193,967 137,529 331,496 331,496 313,145 94.5% $ 4,654,856 14.86$ Books A Million, Linens 'n Things, Marshalls, Publix, Regal Cinemas, Staples Publix at River Crossing New Port Richey, FL 100% 1998/2003/NA 16 37,888 37,888 24,150 62,038 62,038 60,638 97.7% $ 705,723 11.64$ Publix River City Marketplace Jacksonville, FL 100% 2005/2005/NA 63 342,501 282,087 624,588 204,749 829,337 486,836 463,054 95.1% $ 7,236,766 15.63$ Wal-Mart [3], Lowe's[3], Bed Bath & Beyond, Best Buy, Gander Mountain, Michaels, OfficeMax, PetSmart, Ross Dress For Less, Wallace Theaters Rivertowne Square Deerfield Beach, FL 100% 1980/1998/NA 22 70,948 70,948 65,699 136,647 136,647 130,347 95.4% $ 1,219,813 9.36$ Winn-Dixie, Office Depot Southbay Shopping Center Osprey, FL 100% 1978/1998/NA 19 31,700 31,700 64,875 96,575 96,575 71,468 74.0% $ 539,835 7.55$ Bealls Coastal Home The Crossroads Royal Palm Beach, FL 100% 1988/2002/NA 35 42,112 42,112 77,980 120,092 120,092 115,382 96.1% $ 1,721,498 14.92$ Publix Village Lakes Shopping Center Land O' Lakes, FL 100% 1987/1997/NA 24 125,141 125,141 61,355 186,496 186,496 172,195 92.3% $ 998,680 5.80$ Kash 'N Karry Food Store, Wal-Mart Total/Weighted Average 328 375,181 1,024,916 1,400,097 868,766 2,268,863 1,893,682 1,750,218 92.4% $ 21,364,904 12.21$ Georgia Centre at Woodstock Woodstock, GA 100% 1997/2004/NA 14 51,420 51,420 35,328 86,748 86,748 75,960 87.6% $ 887,266 11.68$ Publix Conyers Crossing Conyers, GA 100% 1978/1998/NA 15 138,915 138,915 31,560 170,475 170,475 170,475 100.0% $ 960,500 5.63$ Burlington Coat Factory, Hobby Lobby Horizon Village Suwanee, GA 100% 1996/2002/NA 22 47,955 47,955 49,046 97,001 97,001 87,686 90.4% $ 1,013,052 11.55$ Publix [4] (subleased to a + Market) Mays Crossing Stockbridge, GA 100% 1984/1997/NA 20 100,244 100,244 37,040 137,284 137,284 128,384 93.5% $ 769,675 6.00$ ApplianceSmart Factory Outlet, Big Lots, Dollar Tree Promenade at Pleasant Hill Duluth, GA 100% 1993/2004/NA 36 199,555 199,555 95,000 294,555 294,555 267,136 90.7% $ 2,080,549 7.79$ Farmers Home Furniture, Old Time Pottery, Publix Total/Weighted Average 107 - 538,089 538,089 247,974 786,063 786,063 729,641 92.8% $ 5,711,043 7.83$ Michigan Auburn Mile Auburn Hills, MI 100% 2000/1999/NA 7 533,659 64,298 597,957 26,238 624,195 90,536 90,536 100.0% $ 932,058 10.29$ Best Buy [3], Target [3], Meijer [3], Costco [3], Jo-Ann etc, Staples Beacon Square Grand Haven, MI 100% 2004/2004/NA 12 103,316 - 103,316 42,981 146,297 42,981 42,981 100.0% $ 727,193 16.92$ Home Depot [3] Clinton Pointe Clinton Twp., MI 100% 1992/2003/NA 14 112,000 65,735 177,735 69,595 247,330 135,330 109,030 80.6% $ 1,100,945 10.10$ OfficeMax, Sports Authority, Target [3] Clinton Valley Mall Sterling Heights, MI 100% 1977/1996/2002 10 55,175 55,175 69,771 124,946 124,946 99,281 79.5% $ 1,550,740 15.62$ Office Depot, DSW Shoe Warehouse Clinton Valley Sterling Heights, MI 100% 1985/1996/NA 12 50,262 50,262 51,149 101,411 101,411 79,196 78.1% $ 643,549 8.13$ Big Lots Eastridge Commons Flint, MI 100% 1990/1996/2001 16 117,777 117,972 235,749 51,704 287,453 169,676 161,459 95.2% $ 1,681,011 10.41$ Farmer Jack (A&P) [4], Office Depot, Target [3], TJ Maxx Edgewood Towne Center Lansing, MI 100% 1990/1996/2001 16 209,272 23,524 232,796 62,233 295,029 85,757 79,993 93.3% $ 853,063 10.66$ OfficeMax, Sam's Club [3], Target [3] Fairlane Meadows Dearborn, MI 100% 1987/2003/NA 22 175,830 56,586 232,416 80,922 313,338 137,508 111,208 80.9% $ 1,770,702 15.92$ Best Buy, Target [3], Burlington Coat Factory [3] Fraser Shopping Center Fraser, MI 100% 1977/1996/NA 8 52,784 52,784 23,915 76,699 76,699 71,735 93.5% $ 431,935 6.02$ Oakridge Market, Rite-Aid Gaines Marketplace Gaines Twp., MI 100% 2005/2004/NA 15 351,981 351,981 40,188 392,169 392,169 387,669 98.9% $ 1,640,615 4.23$ Meijer, Staples, Target Jackson Crossing Jackson, MI 100% 1967/1996/2002 65 254,242 222,468 476,710 177,799 654,509 400,267 382,005 95.4% $ 3,570,104 9.35$ Kohl's, Sears [3], Target [3] TJ Maxx, Toys "R" Us, Best Buy, Bed Bath & Beyond, Jackson 10 Theater Jackson West Jackson, MI 100% 1996/1996/1999 5 194,484 194,484 15,837 210,321 210,321 210,321 100.0% $ 1,617,282 7.69$ Circuit City, Lowe's, Michaels, OfficeMax Kentwood Towne Centre [6] Kentwood, MI 77.88% 1988/1996//NA 18 101,909 122,390 224,299 61,265 285,564 183,655 166,263 90.5% $ 1,256,032 7.55$ Hobby Lobby, OfficeMax, Rooms Today [3] Lake Orion Plaza Lake Orion, MI 100% 1977/1996/NA 9 114,574 114,574 14,878 129,452 129,452 125,932 97.3% $ 545,539 4.33$ Hollywood Super Market, Kmart Lakeshore Marketplace Norton Shores, MI 100% 1996/2003/NA 21 126,842 258,638 385,480 89,015 474,495 347,653 341,959 98.4% $ 2,772,149 8.11$ Barnes & Noble, Dunham's, Elder-Beerman, Hobby Lobby, TJ Maxx, Toys "R" Us, Target [3] Livonia Plaza Livonia, MI 100% 1988/2003/NA 20 90,831 90,831 43,032 133,863 133,863 123,259 92.1% $ 1,272,323 10.32$ Kroger, TJ Maxx Madison Center Madison Heights, MI 100% 1965/1997/2000 15 167,830 167,830 59,258 227,088 227,088 215,039 94.7% $ 1,412,495 6.57$ Dunham's, Kmart New Towne Plaza Canton Twp., MI 100% 1975/1996/2005 15 126,425 126,425 59,943 186,368 186,368 186,368 100.0% $ 1,817,567 9.75$ Kohl's, Jo-Ann etc Roseville Towne Center Roseville, MI 100% 1963/1996/2004 9 206,747 206,747 40,221 246,968 246,968 246,968 100.0% $ 1,643,778 6.66$ Marshalls, Wal-Mart, Office Depot Shoppes at Fairlane Meadows/Dearborn Dearborn, MI 100% 2007/NA/NA 4 - - 13,197 13,197 13,197 13,197 100.0% $ 316,736 24.00$ No Anchor Southfield Plaza Southfield, MI 100% 1969/1996/2003 14 128,340 128,340 37,660 166,000 166,000 165,100 99.5% $ 1,367,076 8.28$ Burlington Coat Factory, Marshalls, Staples Taylor Plaza Taylor, MI 100% 1970/1996/2006 1 102,513 102,513 - 102,513 102,513 102,513 100.0% $ 439,992 4.29$ Home Depot Tel-Twelve Southfield, MI 100% 1968/1996/2003 21 479,869 479,869 43,542 523,411 523,411 523,411 100.0% $ 5,462,806 10.44$ Meijer, Lowe's, Office Depot, Best Buy, DSW Shoe Warehouse, Michaels , PetSmart West Oaks I Novi, MI 100% 1979/1996/2004 8 215,251 215,251 30,616 245,867 245,867 245,867 100.0% $ 2,640,808 10.74$ Circuit City, OfficeMax, DSW Shoe Warehouse, Home Goods, Michaels, Gander Mountain West Oaks II Novi, MI 100% 1986/1996/2000 30 221,140 90,753 311,893 77,201 389,094 167,954 164,638 98.0% $ 2,765,414 16.80$ Value City Furniture [3], Bed Bath & Beyond [3], Marshalls, Toys "R" Us [3], Petco [3], Kohl's [3], Jo-Ann etc Total/Weighted Average 387 1,955,987 3,359,430 5,315,417 1,282,160 6,597,577 4,641,590 4,445,928 95.8% $ 40,231,914 9.05$ Supplemental Financial and Operating Statistics Ramco-Gershenson Properties Trust (RPT) Q4 2007 Page 16
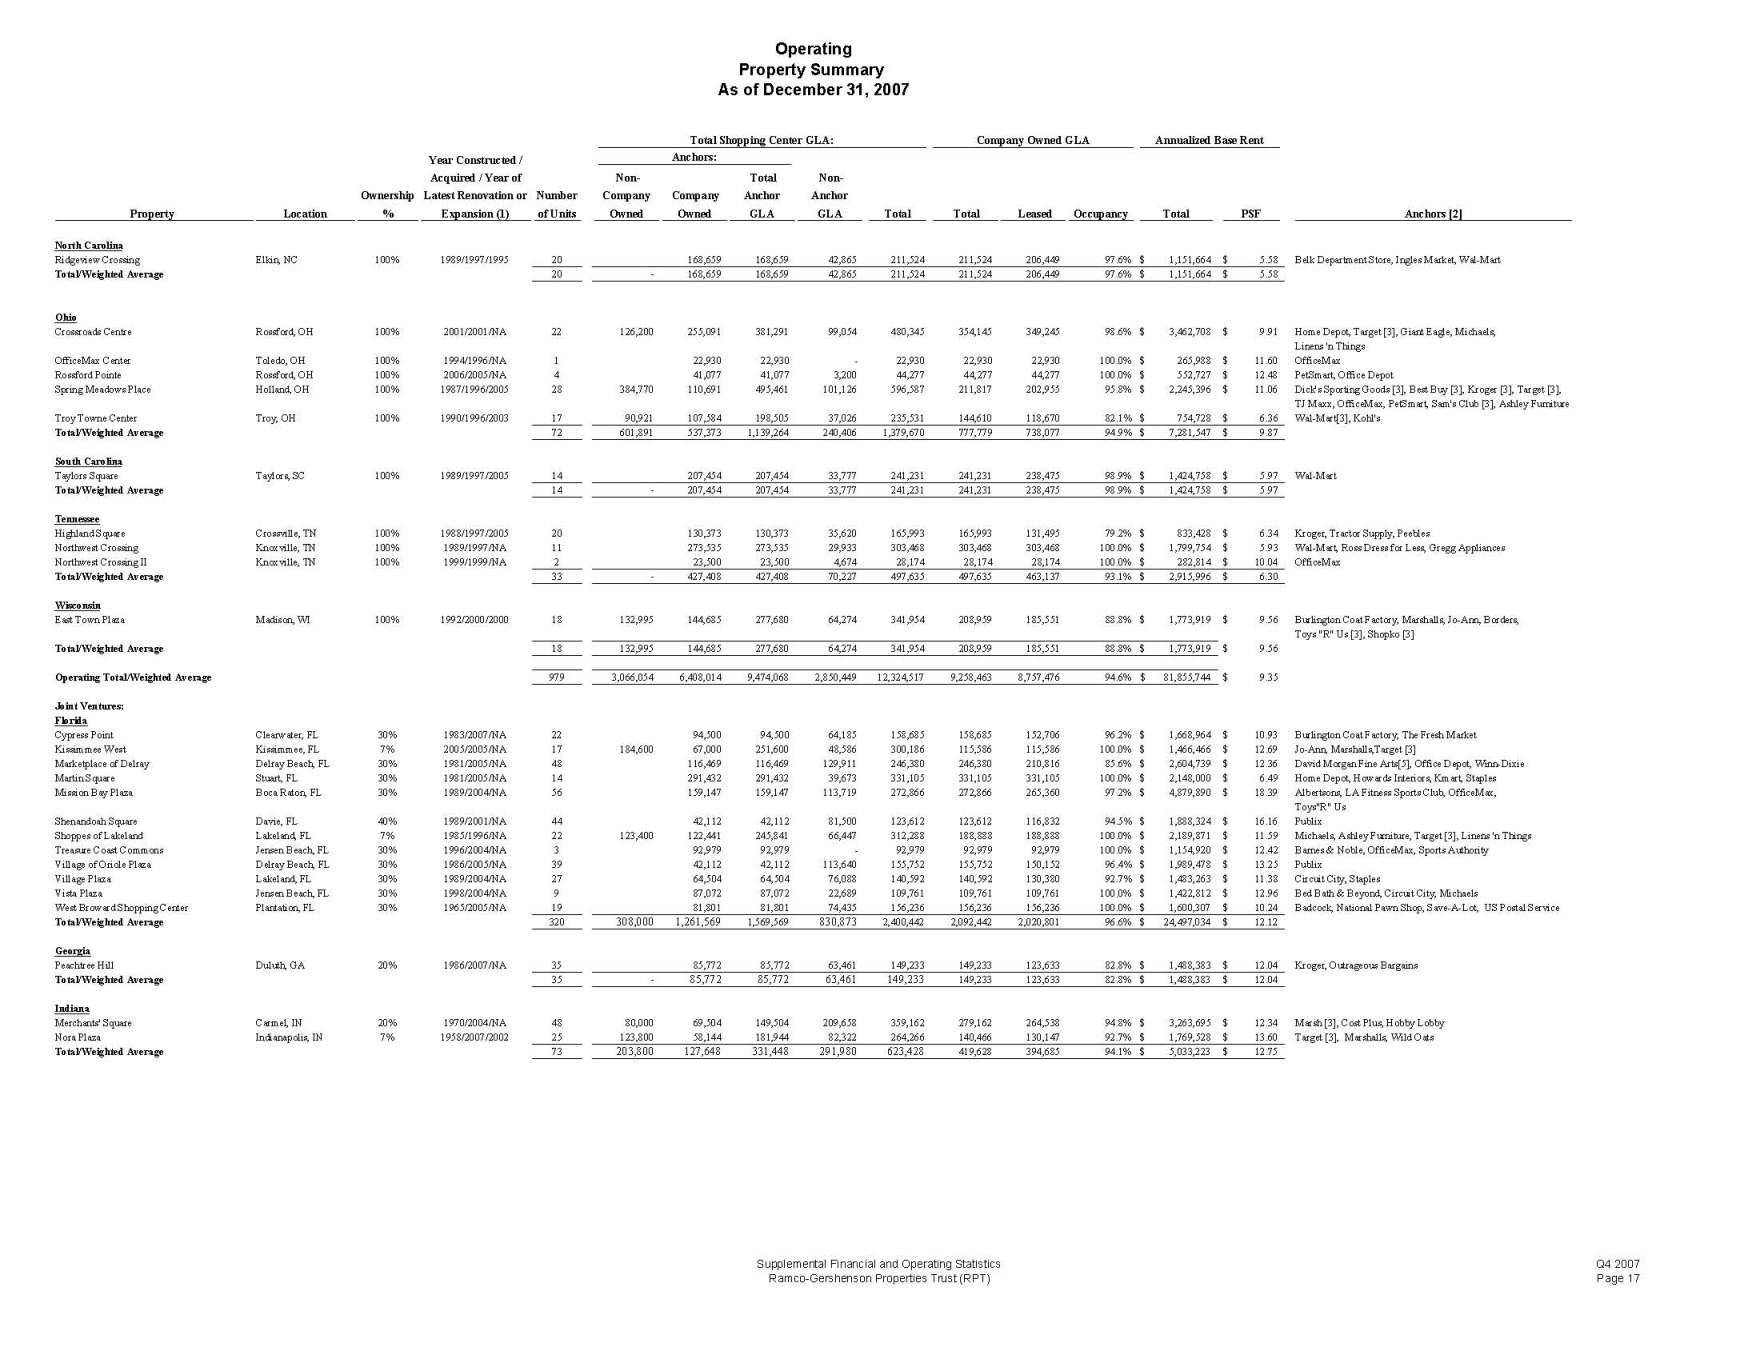
Operating Property Summary As of December 31, 2007 Total Shopping Center GLA: Company Owned GLA Annualized Base Rent Year Constructed / Anchors: Acquired / Year of Non Total Non- Ownership Latest Renovation or Number Company Company Anchor Anchor Property Location % Expansion (1) of Units Owned Owned GLA GLA Total Total Leased Occupancy Total PSF Anchors [2] North Carolina Ridgeview Crossing Elkin, NC 100% 1989/1997/1995 20 168,659 168,659 42,865 211,524 211,524 206,449 97.6% $ 1,151,664 $ 5.58 Belk Department Store, Ingles Market, Wal-Mart Total/Weighted Average 20 - 168,659 168,659 42,865 211,524 211,524 206,449 97.6% $ 1,151,664 $ 5.58 Ohio Crossroads Centre Rossford, OH 100% 2001/2001/NA 22 126,200 255,091 381,291 99,054 480,345 354,145 349,245 98.6% $ 3,462,708 $ 9.91 Home Depot, Target [3], Giant Eagle, Michaels, Linens 'n Things OfficeMax Center Toledo, OH 100% 1994/1996/NA 1 22,930 22,930 - - 22,930 22,930 22,930 100.0% $ 265,988 $ 11.60 OfficeMax Rossford Pointe Rossford, OH 100% 2006/2005/NA 4 41,077 41,077 3,200 44,277 44,277 44,277 100.0% $ 552,727 $ 12.48 PetSmart, Office Depot Spring Meadows Place Holland, OH 100% 1987/1996/2005 28 384,770 110,691 495,461 101,126 596,587 211,817 202,955 95.8% $ 2,245,396 $ 11.06 Dick's Sporting Goods [3], Best Buy [3], Kroger [3], Target [3], TJ Maxx, OfficeMax, PetSmart, Sam's Club [3], Ashley Furniture Troy Towne Center Troy, OH 100% 1990/1996/2003 17 90,921 107,584 198,505 37,026 235,531 144,610 118,670 82.1% $ 754,728 $ 6.36 Wal-Mart[3], Kohl's Total/Weighted Average 72 601,891 537,373 1,139,264 240,406 1,379,670 777,779 738,077 94.9% $ 7,281,547 $ 9.87 South Carolina Taylors Square Taylors, SC 100% 1989/1997/2005 14 207,454 207,454 33,777 241,231 241,231 238,475 98.9% $ 1,424,758 $ 5.97 Wal-Mart Total/Weighted Average 14 - 207,454 207,454 33,777 241,231 241,231 238,475 98.9% $ 1,424,758 $ 5.97 Tennessee Highland Square Crossville, TN 100% 1988/1997/2005 20 130,373 130,373 35,620 165,993 165,993 131,495 79.2% $ 833,428 $ 6.34 Kroger, Tractor Supply, Peebles Northwest Crossing Knoxville, TN 100% 1989/1997/NA 11 273,535 273,535 29,933 303,468 303,468 303,468 100.0% $ 1,799,754 $ 5.93 Wal-Mart, Ross Dress for Less, Gregg Appliances Northwest Crossing II Knoxville, TN 100% 1999/1999/NA 2 23,500 23,500 4,674 28,174 28,174 28,174 100.0% $ 282,814 $ 10.04 OfficeMax Total/Weighted Average 33 - 427,408 427,408 70,227 497,635 497,635 463,137 93.1% $ 2,915,996 $ 6.30 Wisconsin East Town Plaza Madison, WI 100% 1992/2000/2000 18 132,995 144,685 277,680 64,274 341,954 208,959 185,551 88.8% $ 1,773,919 $ 9.56 Burlington Coat Factory, Marshalls, Jo-Ann, Borders, Toys "R" Us [3], Shopko [3] Total/Weighted Average 18 132,995 144,685 277,680 64,274 341,954 208,959 185,551 88.8% $ 1,773,919 $ 9.56 Operating Total/Weighted Average 979 3,066,054 6,408,014 9,474,068 2,850,449 12,324,517 9,258,463 8,757,476 94.6% $ 81,855,744 $ 9.35 Joint Ventures: Florida Cypress Point Clearwater, FL 30% 1983/2007/NA 22 94,500 94,500 64,185 158,685 158,685 152,706 96.2% $ 1,668,964 $ 10.93 Burlington Coat Factory, The Fresh Market Kissimmee West Kissimmee, FL 7% 2005/2005/NA 17 184,600 67,000 251,600 48,586 300,186 115,586 115,586 100.0% $ 1,466,466 $ 12.69 Jo-Ann, Marshalls,Target [3] Marketplace of Delray Delray Beach, FL 30% 1981/2005/NA 48 116,469 116,469 129,911 246,380 246,380 210,816 85.6% $ 2,604,739 $ 12.36 David Morgan Fine Arts[5], Office Depot, Winn-Dixie Martin Square Stuart, FL 30% 1981/2005/NA 14 291,432 291,432 39,673 331,105 331,105 331,105 100.0% $ 2,148,000 $ 6.49 Home Depot, Howards Interiors, Kmart, Staples Mission Bay Plaza Boca Raton, FL 30% 1989/2004/NA 56 159,147 159,147 113,719 272,866 272,866 265,360 97.2% $ 4,879,890 $ 18.39 Albertsons, LA Fitness Sports Club, OfficeMax, Toys"R" Us Shenandoah Square Davie, FL 40% 1989/2001/NA 44 42,112 42,112 81,500 123,612 123,612 116,832 94.5% $ 1,888,324 $ 16.16 Publix Shoppes of Lakeland Lakeland, FL 7% 1985/1996/NA 22 123,400 122,441 245,841 66,447 312,288 188,888 188,888 100.0% $ 2,189,871 $ 11.59 Michaels, Ashley Furniture, Target [3], Linens 'n Things Treasure Coast Commons Jensen Beach, FL 30% 1996/2004/NA 3 92,979 92,979 - - 92,979 92,979 92,979 100.0% $ 1,154,920 $ 12.42 Barnes & Noble, OfficeMax, Sports Authority Village of Oriole Plaza Delray Beach, FL 30% 1986/2005/NA 39 42,112 42,112 113,640 155,752 155,752 150,152 96.4% $ 1,989,478 $ 13.25 Publix Village Plaza Lakeland, FL 30% 1989/2004/NA 27 64,504 64,504 76,088 140,592 140,592 130,380 92.7% $ 1,483,263 $ 11.38 Circuit City, Staples Vista Plaza Jensen Beach, FL 30% 1998/2004/NA 9 87,072 87,072 22,689 109,761 109,761 109,761 100.0% $ 1,422,812 $ 12.96 Bed Bath & Beyond, Circuit City, Michaels West Broward Shopping Center Plantation, FL 30% 1965/2005/NA 19 81,801 81,801 74,435 156,236 156,236 156,236 100.0% $ 1,600,307 $ 10.24 Badcock, National Pawn Shop, Save-A-Lot, US Postal Service Total/Weighted Average 320 308,000 1,261,569 1,569,569 830,873 2,400,442 2,092,442 2,020,801 96.6% $ 24,497,034 $ 12.12 Georgia Peachtree Hill Duluth, GA 20% 1986/2007/NA 35 85,772 85,772 63,461 149,233 149,233 123,633 82.8% $ 1,488,383 $ 12.04 Kroger, Outrageous Bargains Total/Weighted Average 35 - 85,772 85,772 63,461 149,233 149,233 123,633 82.8% $ 1,488,383 $ 12.04 Indiana Merchants' Square Carmel, IN 20% 1970/2004/NA 48 80,000 69,504 149,504 209,658 359,162 279,162 264,538 94.8% $ 3,263,695 $ 12.34 Marsh [3], Cost Plus, Hobby Lobby Nora Plaza Indianapolis, IN 7% 1958/2007/2002 25 123,800 58,144 181,944 82,322 264,266 140,466 130,147 92.7% $ 1,769,528 $ 13.60 Target [3], Marshalls, Wild Oats Total/Weighted Average 73 203,800 127,648 331,448 291,980 623,428 419,628 394,685 94.1% $ 5,033,223 $ 12.75 Supplemental Financial and Operating Statistics Ramco-Gershenson Properties Trust (RPT) Q4 2007 Page 17
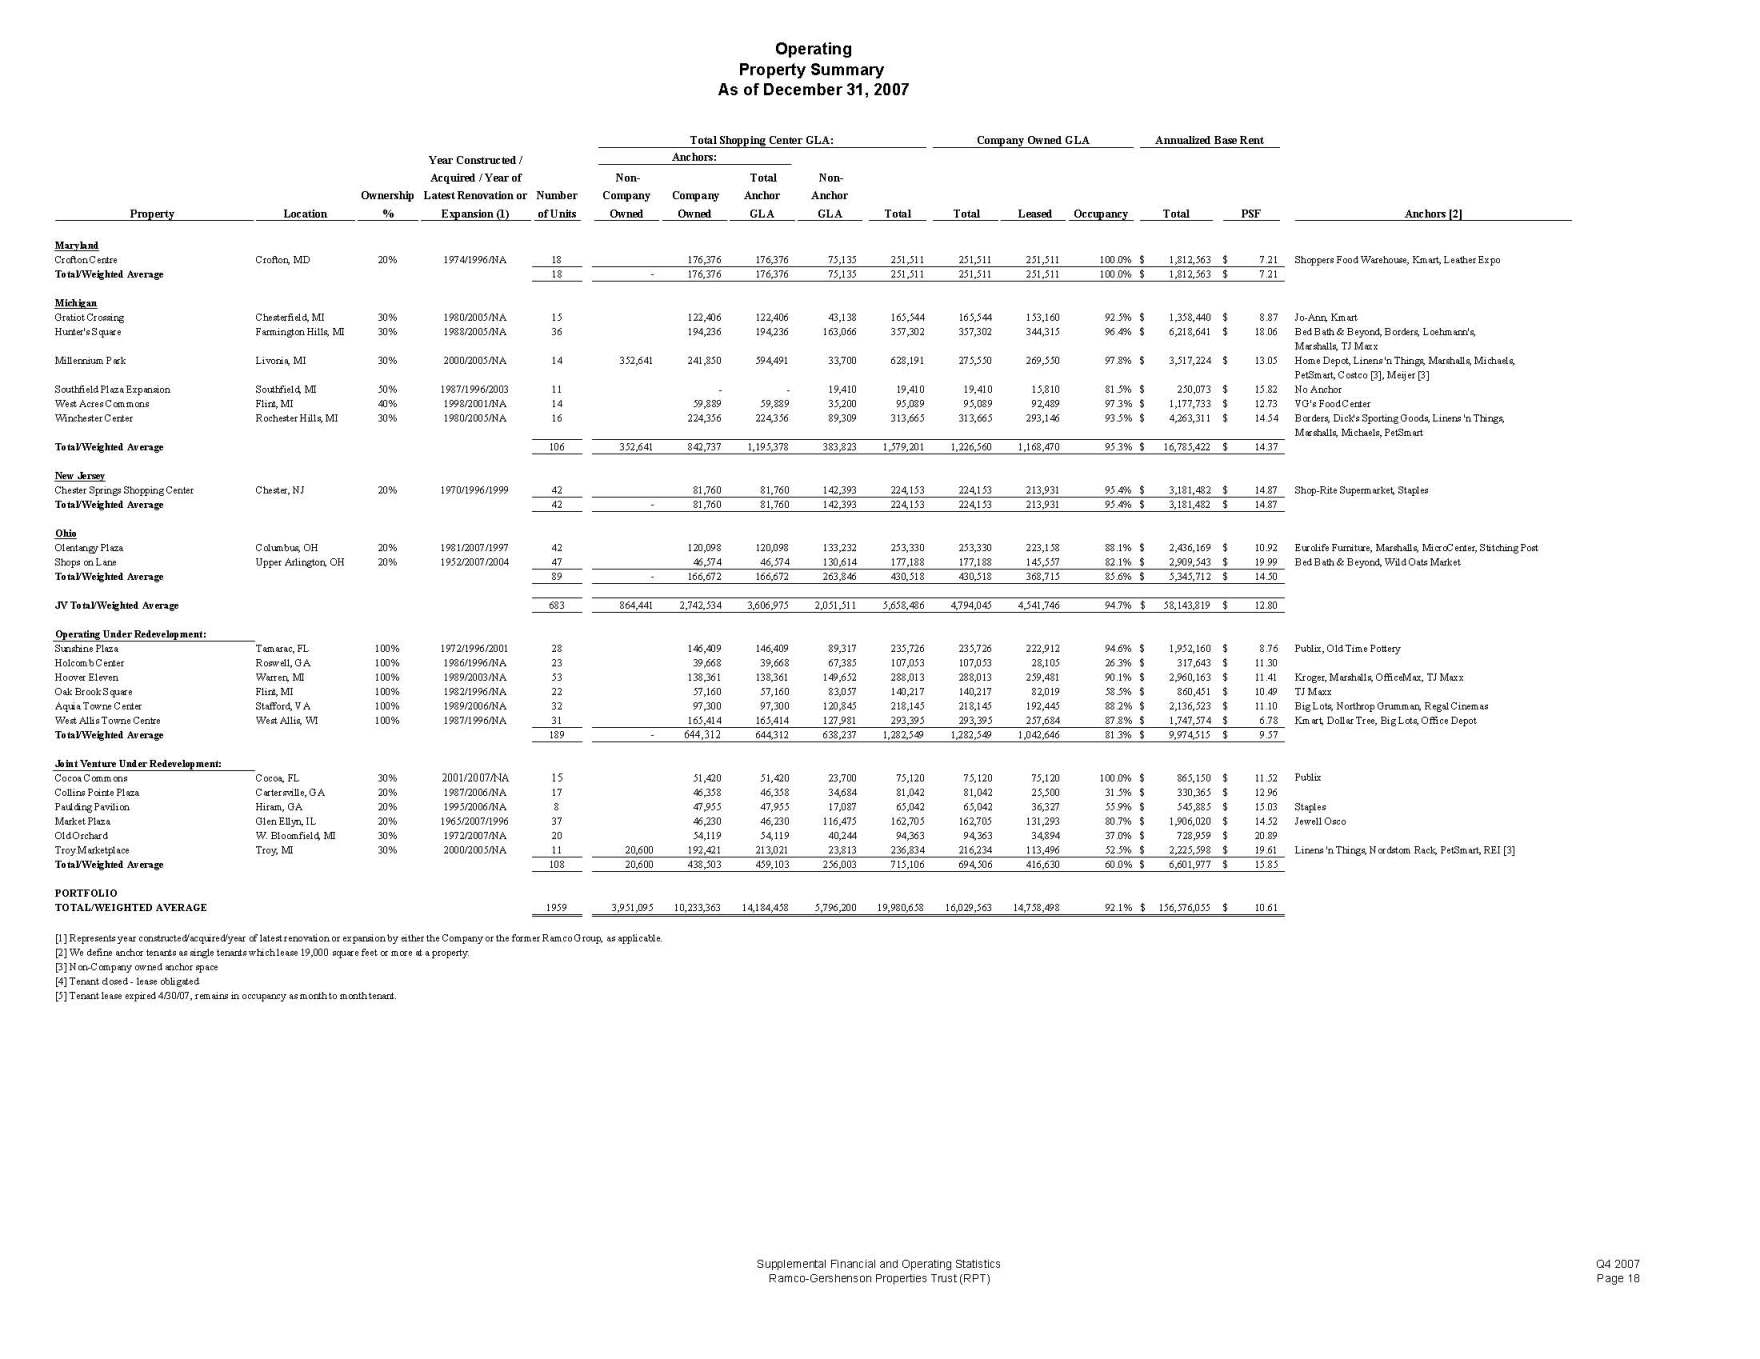
Operating Property Summary As of December 31, 2007 Total Shopping Center GLA: Company Owned GLA Annualized Base Rent Year Constructed / Anchors: Acquired / Year of Non Total Non- Ownership Latest Renovation or Number Company Company Anchor Anchor Property Location % Expansion (1) of Units Owned Owned GLA GLA Total Total Leased Occupancy Total PSF Anchors [2] Maryland Crofton Centre Crofton, MD 20% 1974/1996/NA 18 176,376 176,376 75,135 251,511 251,511 251,511 100.0% $ 1,812,563 7.21$ Shoppers Food Warehouse, Kmart, Leather Expo Total/Weighted Average 18 - 176,376 176,376 75,135 251,511 251,511 251,511 100.0% $ 1,812,563 7.21$ Michigan Gratiot Crossing Chesterfield, MI 30% 1980/2005/NA 15 122,406 122,406 43,138 165,544 165,544 153,160 92.5% $ 1,358,440 8.87$ Jo-Ann, Kmart Hunter's Square Farmington Hills, MI 30% 1988/2005/NA 36 194,236 194,236 163,066 357,302 357,302 344,315 96.4% $ 6,218,641 18.06$ Bed Bath & Beyond, Borders, Loehmann's, Marshalls, TJ Maxx Millennium Park Livonia, MI 30% 2000/2005/NA 14 352,641 241,850 594,491 33,700 628,191 275,550 269,550 97.8% $ 3,517,224 13.05$ Home Depot, Linens 'n Things, Marshalls, Michaels, PetSmart, Costco [3], Meijer [3] Southfield Plaza Expansion Southfield, MI 50% 1987/1996/2003 11 - - 19,410 19,410 19,410 15,810 81.5% $ 250,073 15.82$ No Anchor West Acres Commons Flint, MI 40% 1998/2001/NA 14 59,889 59,889 35,200 95,089 95,089 92,489 97.3% $ 1,177,733 12.73$ VG's Food Center Winchester Center Rochester Hills, MI 30% 1980/2005/NA 16 224,356 224,356 89,309 313,665 313,665 293,146 93.5% $ 4,263,311 14.54$ Borders, Dick's Sporting Goods, Linens 'n Things, Marshalls, Michaels, PetSmart Total/Weighted Average 106 352,641 842,737 1,195,378 383,823 1,579,201 1,226,560 1,168,470 95.3% $ 16,785,422 $ 14.37 New Jersey Chester Springs Shopping Center Chester, NJ 20% 1970/1996/1999 42 81,760 81,760 142,393 224,153 224,153 213,931 95.4% $ 3,181,482 $ 14.87 Shop-Rite Supermarket, Staples Total/Weighted Average 42 - 81,760 81,760 142,393 224,153 224,153 213,931 95.4% $ 3,181,482 $ 14.87 Ohio Olentangy Plaza Columbus, OH 20% 1981/2007/1997 42 120,098 120,098 133,232 253,330 253,330 223,158 88.1% $ 2,436,169 $ 10.92 Eurolife Furniture, Marshalls, MicroCenter, Stitching Post Shops on Lane Upper Arlington, OH 20% 1952/2007/2004 47 46,574 46,574 130,614 177,188 177,188 145,557 82.1% $ 2,909,543 $ 19.99 Bed Bath & Beyond, Wild Oats Market Total/Weighted Average 89 - 166,672 166,672 263,846 430,518 430,518 368,715 85.6% $ 5,345,712 $ 14.50 JV Total/Weighted Average 683 864,441 2,742,534 3,606,975 2,051,511 5,658,486 4,794,045 4,541,746 94.7% $ 58,143,819 $ 12.80 Operating Under Redevelopment: Sunshine Plaza Tamarac, FL 100% 1972/1996/2001 28 146,409 146,409 89,317 235,726 235,726 222,912 94.6% $ 1,952,160 $ 8.76 Publix, Old Time Pottery Holcomb Center Roswell, GA 100% 1986/1996/NA 23 39,668 39,668 67,385 107,053 107,053 28,105 26.3% $ 317,643 $ 11.30 Hoover Eleven Warren, MI 100% 1989/2003/NA 53 138,361 138,361 149,652 288,013 288,013 259,481 90.1% $ 2,960,163 $ 11.41 Kroger, Marshalls, OfficeMax, TJ Maxx Oak Brook Square Flint, MI 100% 1982/1996/NA 22 57,160 57,160 83,057 140,217 140,217 82,019 58.5% $ 860,451 $ 10.49 TJ Maxx Aquia Towne Center Stafford, VA 100% 1989/2006/NA 32 97,300 97,300 120,845 218,145 218,145 192,445 88.2% $ 2,136,523 $ 11.10 Big Lots, Northrop Grumman, Regal Cinemas West Allis Towne Centre West Allis, WI 100% 1987/1996/NA 31 165,414 165,414 127,981 293,395 293,395 257,684 87.8% $ 1,747,574 $ 6.78 Kmart, Dollar Tree, Big Lots, Office Depot Total/Weighted Average 189 - 644,312 644,312 638,237 1,282,549 1,282,549 1,042,646 81.3% $ 9,974,515 $ 9.57 Joint Venture Under Redevelopment: Cocoa Commons Cocoa, FL 30% 2001/2007/NA 15 51,420 51,420 23,700 75,120 75,120 75,120 100.0% $ 865,150 $ 11.52 Publix Collins Pointe Plaza Cartersville, GA 20% 1987/2006/NA 17 46,358 46,358 34,684 81,042 81,042 25,500 31.5% $ 330,365 $ 12.96 Paulding Pavilion Hiram, GA 20% 1995/2006/NA 8 47,955 47,955 17,087 65,042 65,042 36,327 55.9% $ 545,885 $ 15.03 Staples Market Plaza Glen Ellyn, IL 20% 1965/2007/1996 37 46,230 46,230 116,475 162,705 162,705 131,293 80.7% $ 1,906,020 $ 14.52 Jewell Osco Old Orchard W. Bloomfield, MI 30% 1972/2007/NA 20 54,119 54,119 40,244 94,363 94,363 34,894 37.0% $ 728,959 $ 20.89 Troy Marketplace Troy, MI 30% 2000/2005/NA 11 20,600 192,421 213,021 23,813 236,834 216,234 113,496 52.5% $ 2,225,598 $ 19.61 Linens 'n Things, Nordstom Rack, PetSmart, REI [3] Total/Weighted Average 108 20,600 438,503 459,103 256,003 715,106 694,506 416,630 60.0% $ 6,601,977 $ 15.85 PORTFOLIO TOTAL/WEIGHTED AVERAGE 1959 3,951,095 10,233,363 14,184,458 5,796,200 19,980,658 16,029,563 14,758,498 92.1% $ 156,576,055 $ 10.61 [1] Represents year constructed/acquired/year of latest renovation or expansion by either the Company or the former Ramco Group, as applicable. [2] We define anchor tenants as single tenants which lease 19,000 square feet or more at a property. [3] Non-Company owned anchor space [4] Tenant closed - lease obligated [5] Tenant lease expired 4/30/07, remains in occupancy as month to month tenant. Supplemental Financial and Operating Statistics Ramco-Gershenson Properties Trust (RPT) Q4 2007 Page 18
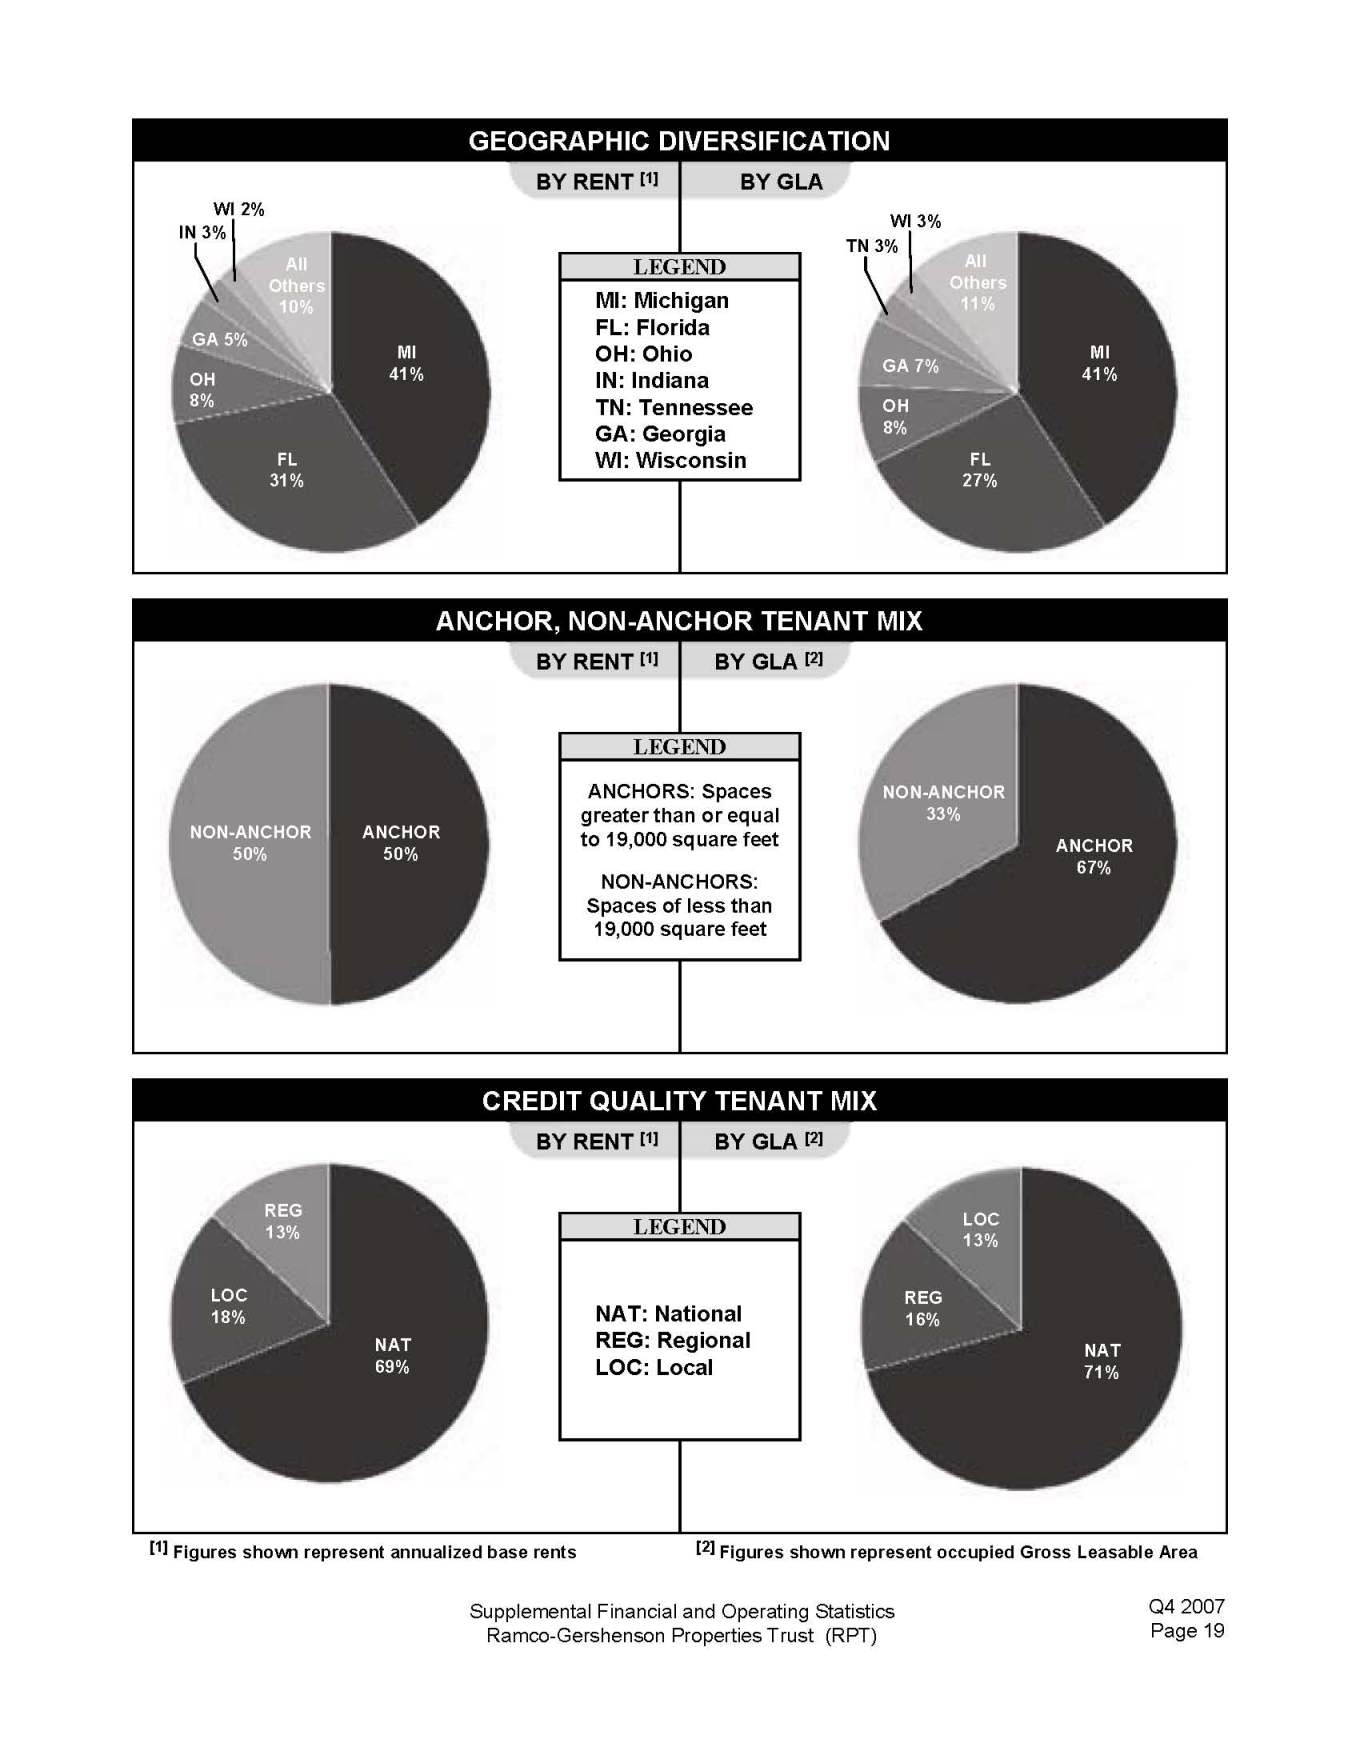
[1] Figures shown represent annualized base rents [2] Figures shown represent occupied Gross Leasable Area Supplemental Financial and Operating Statistics Q4 2007 Ramco-Gershenson Properties Trust (RPT) Page 19
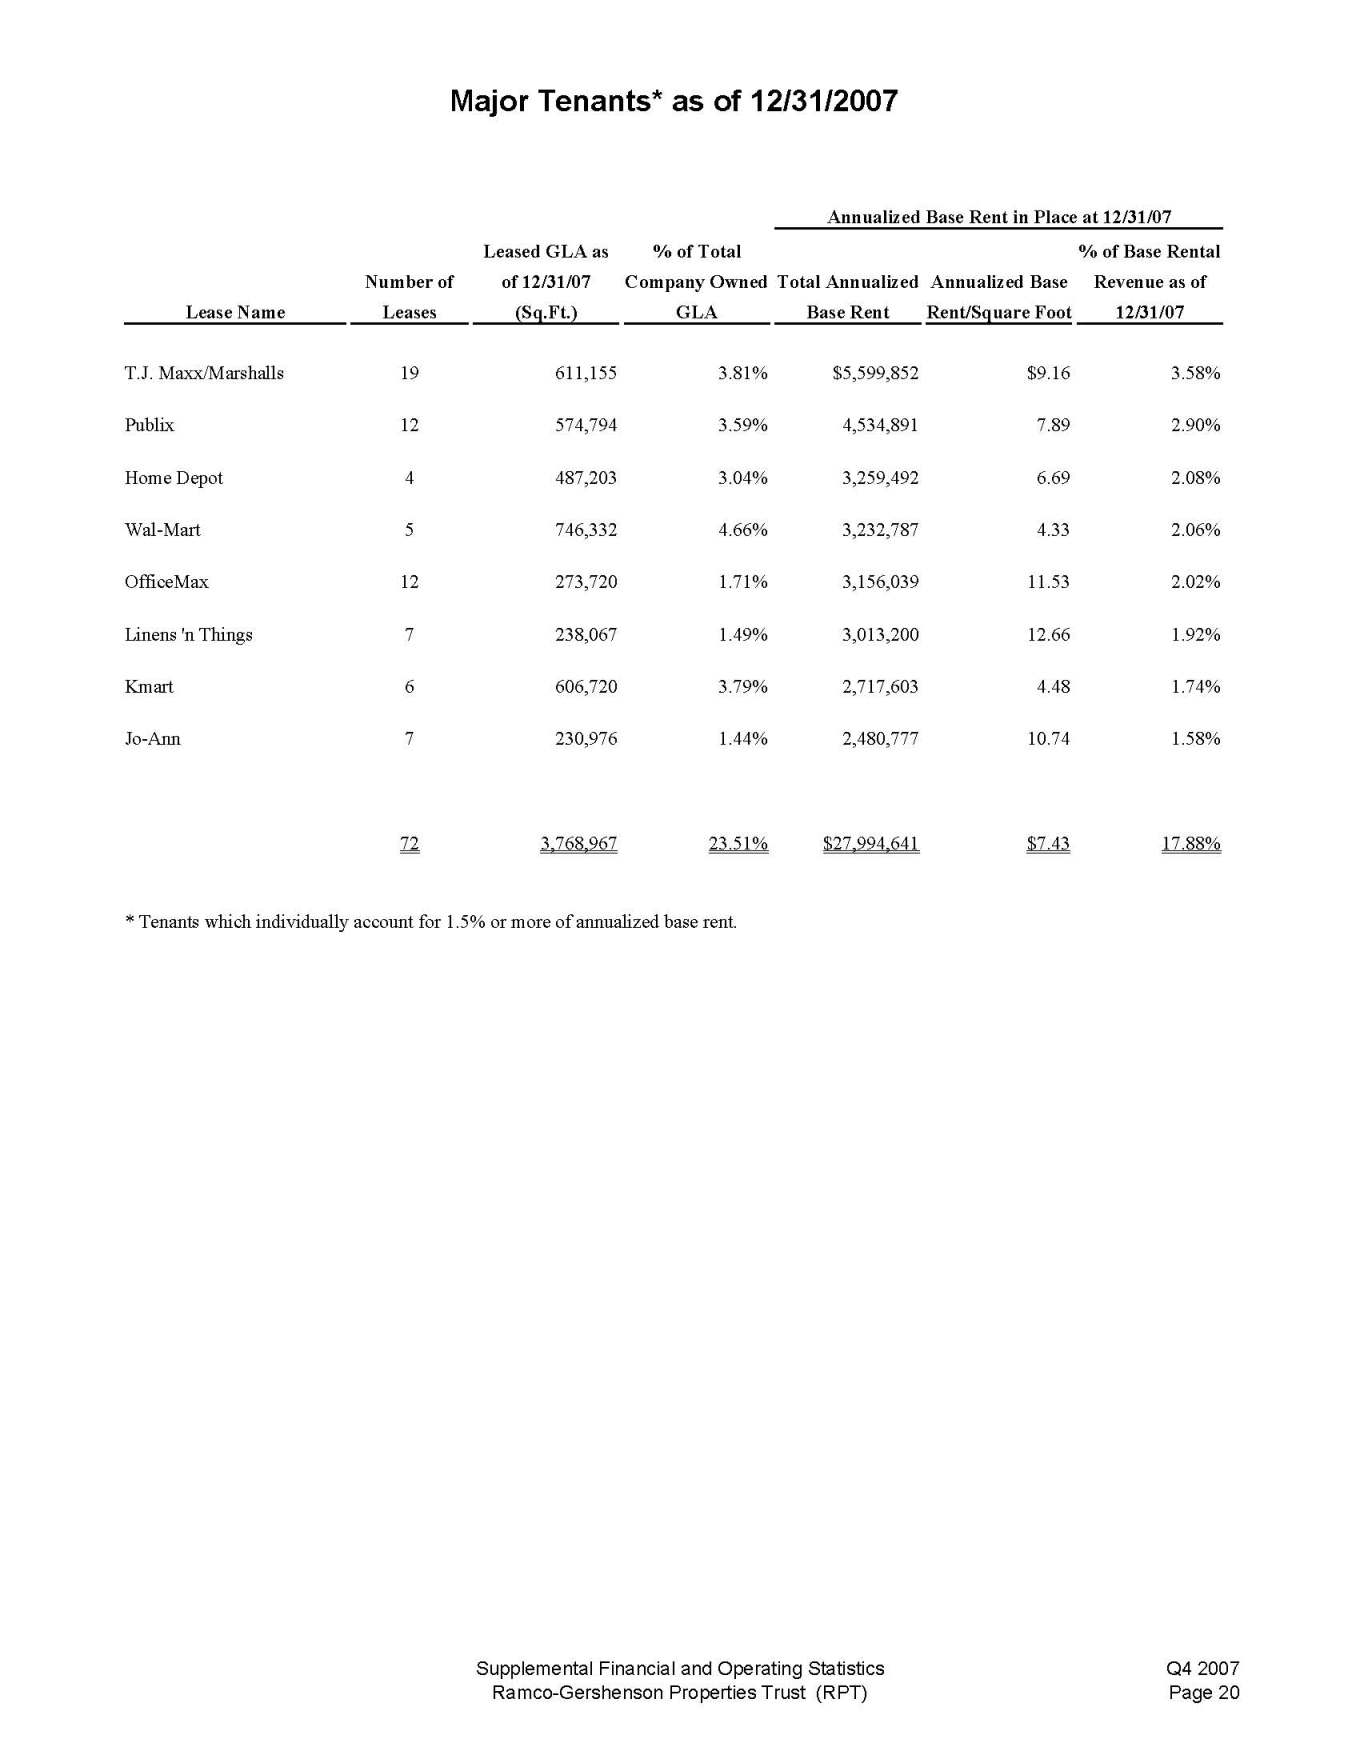
Major Tenants* as of 12/31/2007 Annualized Base Rent in Place at 12/31/07 Leased GLA as % of Total % of Base Rental Number of of 12/31/07 Company Owned Total Annualized Annualized Base Revenue as of Lease Name Leases (Sq.Ft.) GLA Base Rent Rent/Square Foot 12/31/07 T.J. Maxx/Marshalls 19 611,155 3.81% $5,599,852 $9.16 3.58% Publix 12 574,794 3.59% 4,534,891 7.89 2.90% Home Depot 4 487,203 3.04% 3,259,492 6.69 2.08% Wal-Mart 5 746,332 4.66% 3,232,787 4.33 2.06% OfficeMax 12 273,720 1.71% 3,156,039 11.53 2.02% Linens 'n Things 7 238,067 1.49% 3,013,200 12.66 1.92% Kmart 6 606,720 3.79% 2,717,603 4.48 1.74% Jo-Ann 7 230,976 1.44% 2,480,777 10.74 1.58% 72 3,768,967 23.51% $27,994,641 $7.43 17.88% * Tenants which individually account for 1.5% or more of annualized base rent. Supplemental Financial and Operating Statistics Q4 2007 Ramco-Gershenson Properties Trust (RPT) Page 20
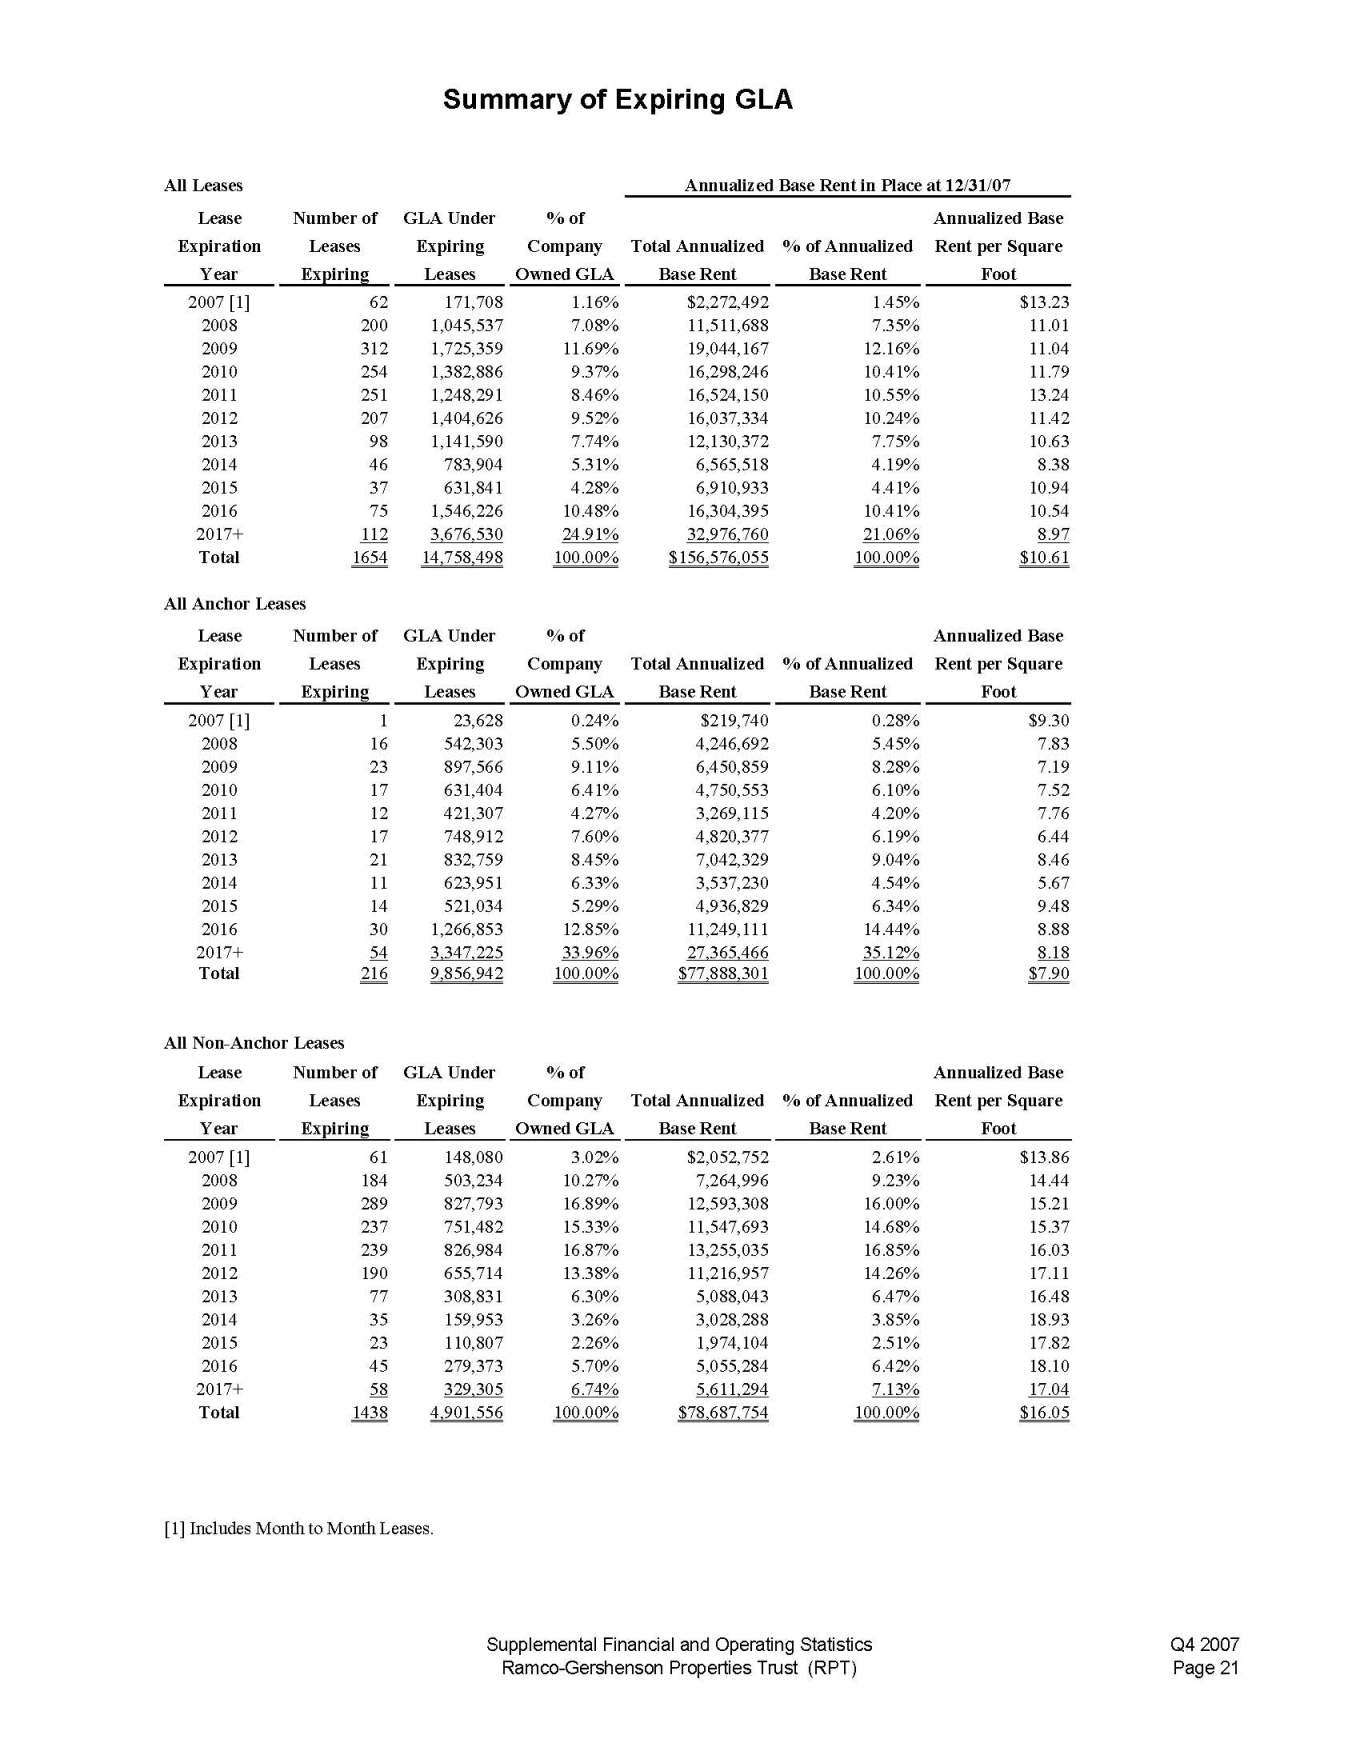
Annualized Base Rent in Place at 12/31/07 Summary of Expiring GLA All Leases Lease Number of GLA Under % of Annualized Base Expiration Leases Expiring Company Total Annualized % of Annualized Rent per Square Year Expiring Leases Owned GLA Base Rent Base Rent Foot 2007 [1] 62 171,708 2008 200 1,045,537 2009 312 1,725,359 2010 254 1,382,886 2011 251 1,248,291 2012 207 1,404,626 2013 98 1,141,590 2014 46 783,904 2015 37 631,841 2016 75 1,546,226 2017+ 112 3,676,530 Total 1654 14,758,498 1.16% $2,272,492 1.45% $13.23 7.08% 11,511,688 7.35% 11.01 11.69% 19,044,167 12.16% 11.04 9.37% 16,298,246 10.41% 11.79 8.46% 16,524,150 10.55% 13.24 9.52% 16,037,334 10.24% 11.42 7.74% 12,130,372 7.75% 10.63 5.31% 6,565,518 4.19% 8.38 4.28% 6,910,933 4.41% 10.94 10.48% 16,304,395 10.41% 10.54 24.91% 32,976,760 21.06% 8.97 100.00% $156,576,055 100.00% $10.61 All Anchor Leases Lease Number of GLA Under % of Annualized Base Expiration Leases Expiring Company Total Annualized % of Annualized Rent per Square Year Expiring Leases Owned GLA Base Rent Base Rent Foot 2007 [1] 1 23,628 0.24% $219,740 0.28% $9.30 2008 16 542,303 5.50% 4,246,692 5.45% 7.83 2009 23 897,566 9.11% 6,450,859 8.28% 7.19 2010 17 631,404 6.41% 4,750,553 6.10% 7.52 2011 12 421,307 4.27% 3,269,115 4.20% 7.76 2012 17 748,912 7.60% 4,820,377 6.19% 6.44 2013 21 832,759 8.45% 7,042,329 9.04% 8.46 2014 11 623,951 6.33% 3,537,230 4.54% 5.67 2015 14 521,034 5.29% 4,936,829 6.34% 9.48 2016 30 1,266,853 12.85% 11,249,111 14.44% 8.88 2017+ 54 3,347,225 33.96% 27,365,466 35.12% 8.18 Total 216 9,856,942 100.00% $77,888,301 100.00% $7.90 All Non-Anchor Leases Lease Number of GLA Under % of Annualized Base Expiration Leases Expiring Company Total Annualized % of Annualized Rent per Square Year Expiring Leases Owned GLA Base Rent Base Rent Foot 2007 [1] 61 148,080 3.02% $2,052,752 2.61% $13.86 2008 184 503,234 10.27% 7,264,996 9.23% 14.44 2009 289 827,793 16.89% 12,593,308 16.00% 15.21 2010 237 751,482 15.33% 11,547,693 14.68% 15.37 2011 239 826,984 16.87% 13,255,035 16.85% 16.03 2012 190 655,714 13.38% 11,216,957 14.26% 17.11 2013 77 308,831 6.30% 5,088,043 6.47% 16.48 2014 35 159,953 3.26% 3,028,288 3.85% 18.93 2015 23 110,807 2.26% 1,974,104 2.51% 17.82 2016 45 279,373 5.70% 5,055,284 6.42% 18.10 2017+ 58 329,305 6.74% 5,611,294 7.13% 17.04 Total 1438 4,901,556 100.00% $78,687,754 100.00% $16.05 [1] Includes Month to Month Leases. Supplemental Financial and Operating Statistics Q4 2007 Ramco-Gershenson Properties Trust (RPT) Page 21
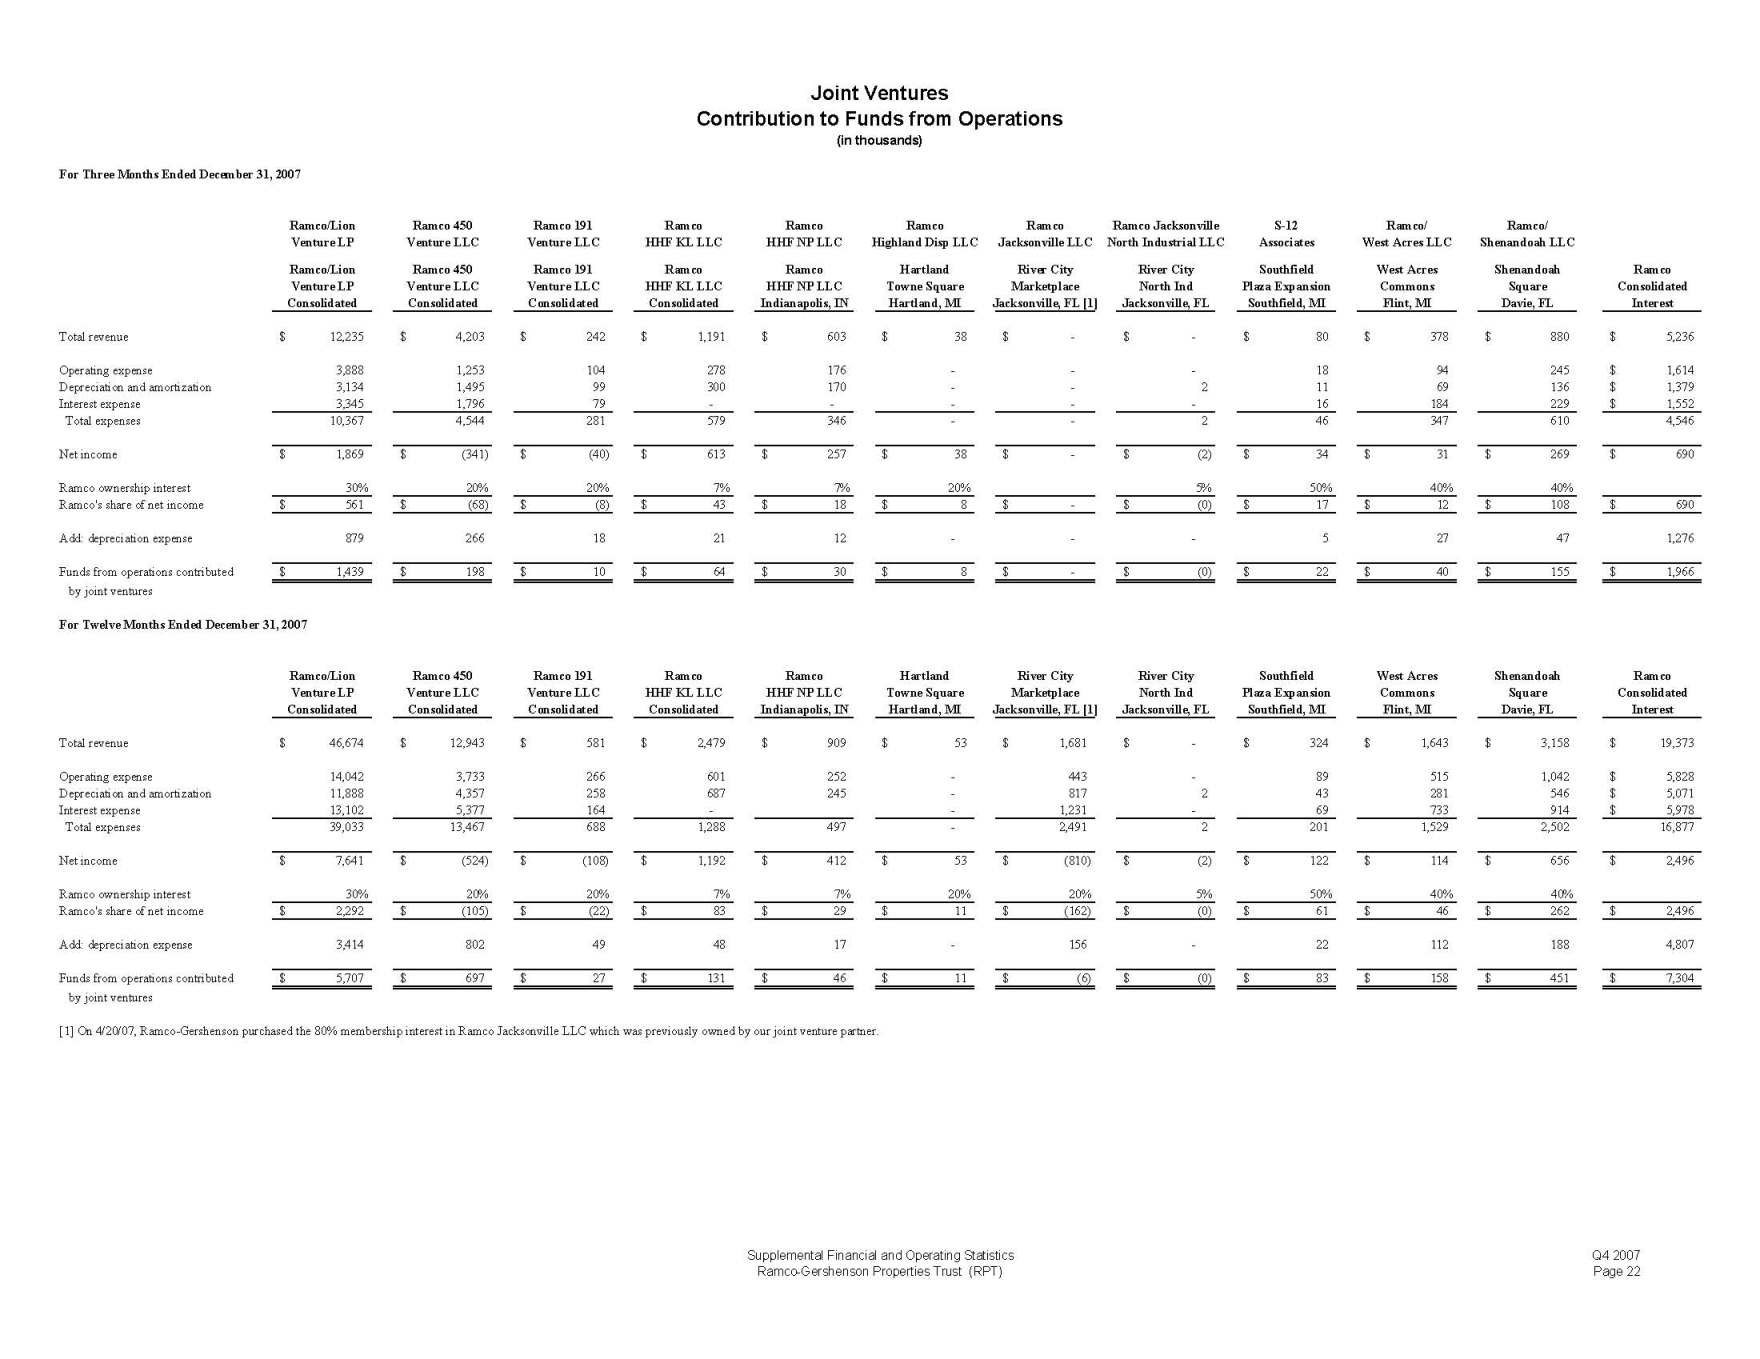
Joint Ventures Contribution to Funds from Operations (in thousands) For Three Months Ended December 31, 2007 Ramco/Lion Ramco 450 Ramco 191 Ramco Ramco Ramco Ramco Ramco Jacksonville S-12 Ramco/ Ramco/ Venture LP Venture LLC Venture LLC HHF KL LLC HHF NP LLC Highland Disp LLC Jacksonville LLC North Industrial LLC Associates West Acres LLC Shenandoah LLC Ramco/Lion Ramco 450 Ramco 191 Ramco Ramco Hartland River City River City Southfield West Acres Shenandoah Ramco Venture LP Venture LLC Venture LLC HHF KL LLC HHF NP LLC Towne Square Marketplace North Ind Plaza Expansion Commons Square Consolidated Consolidated Consolidated Consolidated Consolidated Indianapolis, IN Hartland, MI Jacksonville, FL [1] Jacksonville, FL Southfield, MI Flint, MI Davie, FL Interest Total revenue 12,235$ 4,203$ 242$ 1,191$ 603$ 38$ $ - - -$ 80$ 378$ 880$ 5,236$ Operating expense 3,888 1,253 104 278 176 - - - - 18 94 245 $ 1,614 Depreciation and amortization 3,134 1,495 99 300 170 - - - 2 11 69 136 $ 1,379 Interest expense 3,345 1,796 79 - - - - - 16 184 229 $ 1,552 Total expenses 10,367 4,544 281 579 346 - - - 2 46 347 610 4,546 Net income $ 1,869 $ (341) (40)$ 613$ 257$ 38$ $ - (2)$ 34$ 31$ 269$ 690$ Ramco ownership interest 30% 20% 20% 7% 7% 20% 5% 50% 40% 40% Ramco's share of net income $ 561 $ (68) (8)$ 43$ 18$ $ 8 $ - (0)$ 17$ 12$ 108$ 690$ Add: depreciation expense 879 266 18 21 12 - - - - 5 27 47 1,276 Funds from operations contributed 1,439$ 198$ 10$ 64$ 30$ $ 8 $ - (0)$ 22$ 40$ 155$ 1,966$ by joint ventures For Twelve Months Ended December 31, 2007 Ramco/Lion Ramco 450 Ramco 191 Ramco Ramco Hartland River City River City Southfield West Acres Shenandoah Ramco Venture LP Venture LLC Venture LLC HHF KL LLC HHF NP LLC Towne Square Marketplace North Ind Plaza Expansion Commons Square Consolidated Consolidated Consolidated Consolidated Consolidated Indianapolis, IN Hartland, MI Jacksonville, FL [1] Jacksonville, FL Southfield, MI Flint, MI Davie, FL Interest Total revenue 46,674$ 12,943$ 581$ 2,479$ 909$ 53$ 1,681$ -$ 324$ 1,643$ 3,158$ 19,373$ Operating expense 14,042 3,733 266 601 252 - 443 - 89 515 1,042 $ 5,828 Depreciation and amortization 11,888 4,357 258 687 245 - 817 2 43 281 546 $ 5,071 Interest expense 13,102 5,377 164 - - 1,231 - 69 733 914 $ 5,978 Total expenses 39,033 13,467 688 1,288 497 - 2,491 2 201 1,529 2,502 16,877 Net income $ 7,641 $ (524) (108)$ 1,192$ 412$ 53$ $ (810) (2)$ 122$ 114$ 656$ 2,496$ Ramco ownership interest 30% 20% 20% 7% 7% 20% 20% 5% 50% 40% 40% Ramco's share of net income $ 2,292 $ (105) (22)$ 83$ 29$ 11$ $ (162) (0)$ 61$ 46$ 262$ 2,496$ Add: depreciation expense 3,414 802 49 48 17 - 156 - 22 112 188 4,807 Funds from operations contributed 5,707$ 697$ 27$ 131$ 46$ 11$ $ (6) (0)$ 83$ 158$ 451$ 7,304$ by joint ventures [1] On 4/20/07, Ramco-Gershenson purchased the 80% membership interest in Ramco Jacksonville LLC which was previously owned by our joint venture partner. Supplemental Financial and Operating Statistics Q4 2007 Ramco-Gershenson Properties Trust (RPT) Page 22
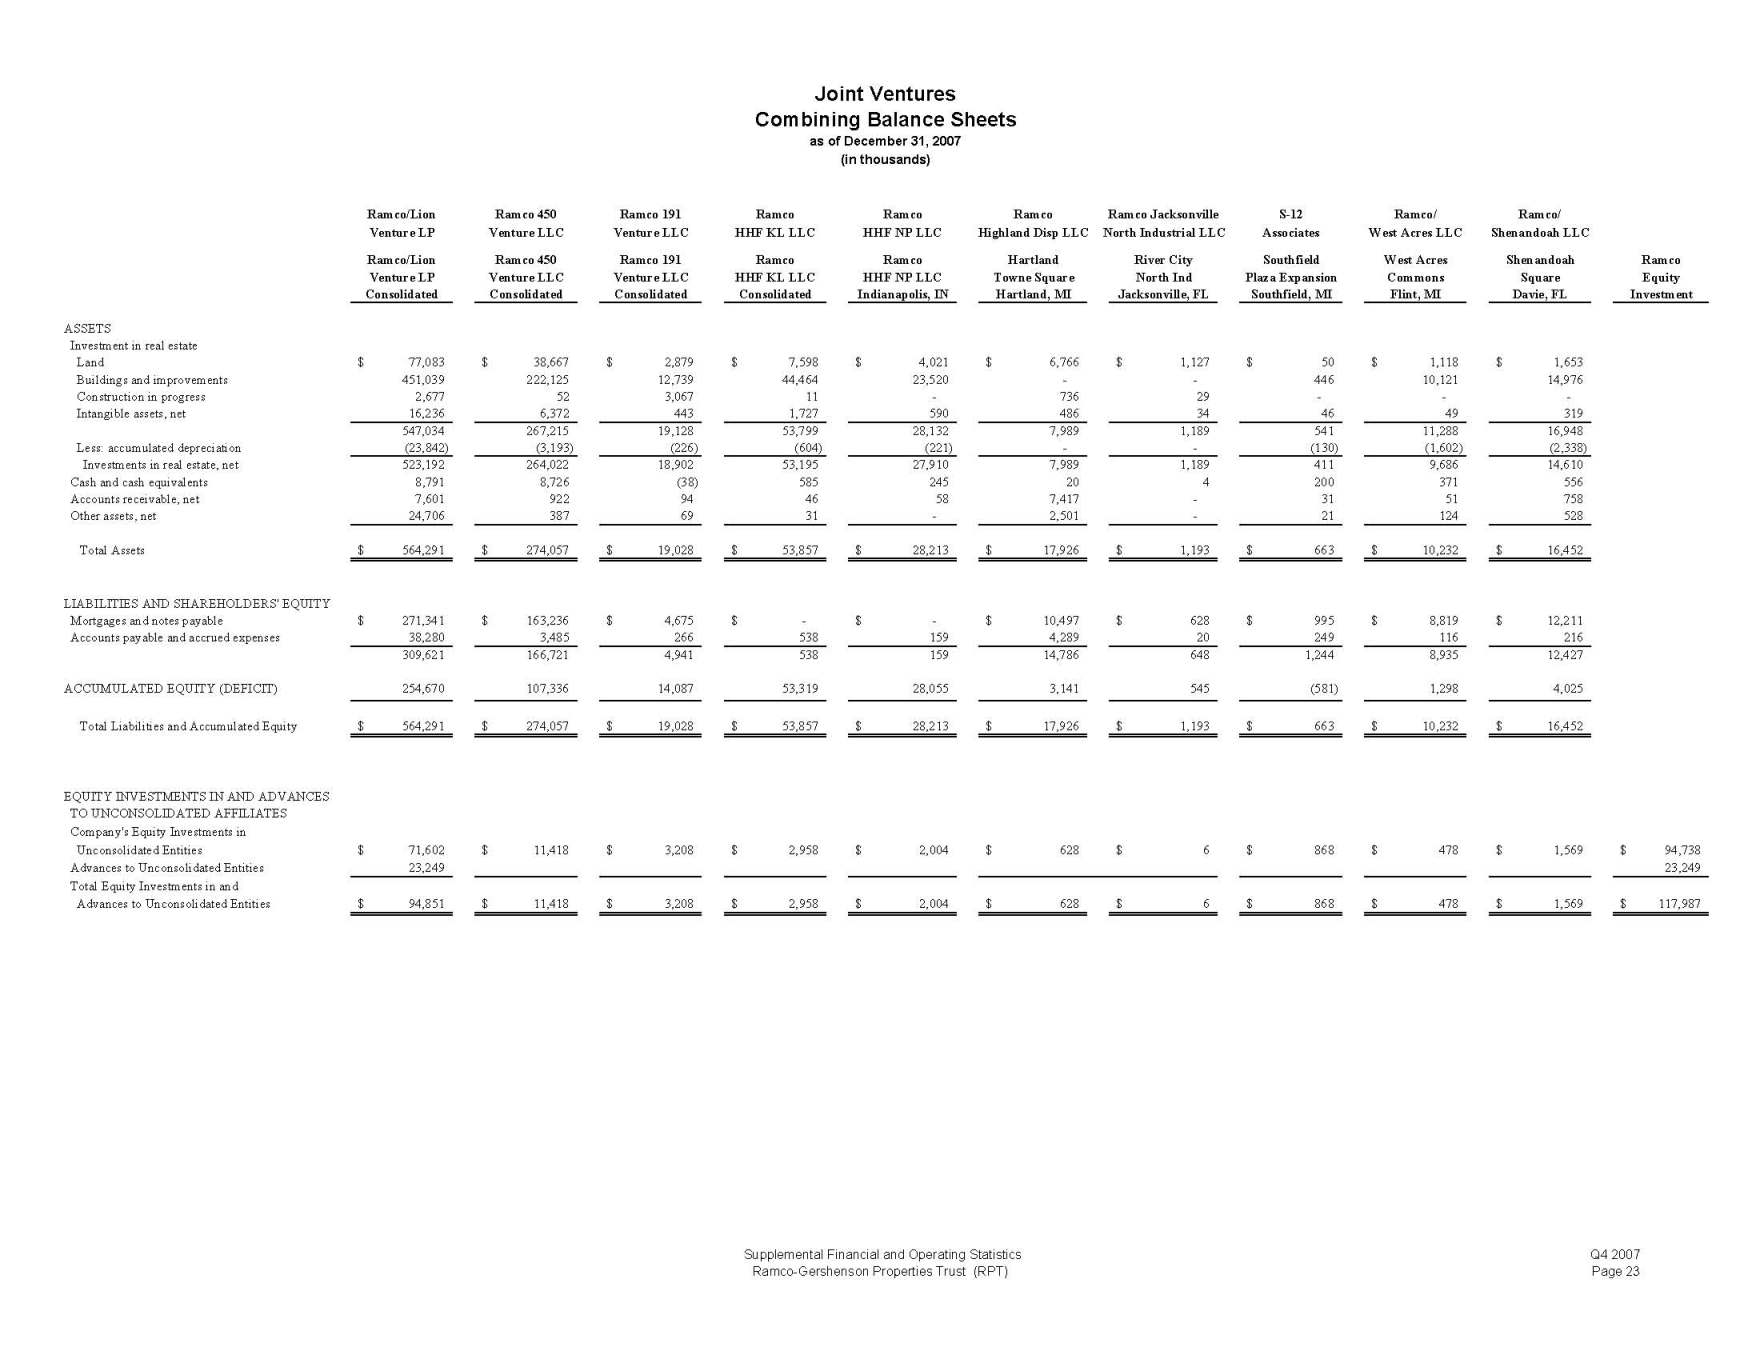
Joint Ventures Combining Balance Sheets as of December 31, 2007 (in thousands) Ramco/Lion Ramco 450 Ramco 191 Ramco Ramco Ramco Ramco Jacksonville S-12 Ramco/ Ramco/ Venture LP Venture LLC Venture LLC HHF KL LLC HHF NP LLC Highland Disp LLC North Industrial LLC Associates West Acres LLC Shenandoah LLC Ramco/Lion Ramco 450 Ramco 191 Ramco Ramco Hartland River City Southfield West Acres Shenandoah Ramco Venture LP Venture LLC Venture LLC HHF KL LLC HHF NP LLC Towne Square North Ind Plaza Expansion Commons Square Equity Consolidated Consolidated Consolidated Consolidated Indianapolis, IN Hartland, MI Jacksonville, FL Southfield, MI Flint, MI Davie, FL Investment ASSETS Investment in real estate Land 77,083$ 38,667$ 2,879$ 7,598$ 4,021$ 6,766$ 1,127$ 50$ 1,118$ 1,653$ Buildings and improvements 451,039 222,125 12,739 44,464 23,520 - - - 446 10,121 14,976 Construction in progress 2,677 52 3,067 11 - 736 29 - - - Intangible assets, net 16,236 6,372 443 1,727 590 486 34 46 49 319 547,034 267,215 19,128 53,799 28,132 7,989 1,189 541 11,288 16,948 Less: accumulated depreciation (23,842) (3,193) (226) (604) (221) - - - (130) (1,602) (2,338) Investments in real estate, net 523,192 264,022 18,902 53,195 27,910 7,989 1,189 411 9,686 14,610 Cash and cash equivalents 8,791 8,726 (38) 585 245 20 4 200 371 556 Accounts receivable, net 7,601 922 94 46 58 7,417 - 31 51 758 Other assets, net 24,706 387 69 31 - 2,501 - 21 124 528 Total Assets 564,291$ 274,057$ 19,028$ 53,857$ 28,213$ 17,926$ 1,193$ 663$ 10,232$ 16,452$ LIABILITIES AND SHAREHOLDERS' EQUITY Mortgages and notes payable 271,341$ 163,236$ 4,675$ $ - - -$ 10,497$ 628$ 995$ 8,819$ 12,211$ Accounts payable and accrued expenses 38,280 3,485 266 538 159 4,289 20 249 116 216 309,621 166,721 4,941 538 159 14,786 648 1,244 8,935 12,427 ACCUMULATED EQUITY (DEFICIT) 254,670 107,336 14,087 53,319 28,055 3,141 545 (581) 1,298 4,025 Total Liabilities and Accumulated Equity 564,291$ 274,057$ 19,028$ 53,857$ 28,213$ 17,926$ 1,193$ 663$ 10,232$ 16,452$ EQUITY INVESTMENTS IN AND ADVANCES TO UNCONSOLIDATED AFFILIATES Company's Equity Investments in Unconsolidated Entities 71,602$ 11,418$ 3,208$ 2,958$ 2,004$ 628$ 6$ 868$ 478$ 1,569$ 94,738$ Advances to Unconsolidated Entities 23,249 23,249 Total Equity Investments in and Advances to Unconsolidated Entities 94,851$ 11,418$ 3,208$ 2,958$ 2,004$ 628$ 6$ 868$ 478$ 1,569$ 117,987$ Supplemental Financial and Operating Statistics Q4 2007 Ramco-Gershenson Properties Trust (RPT) Page 23
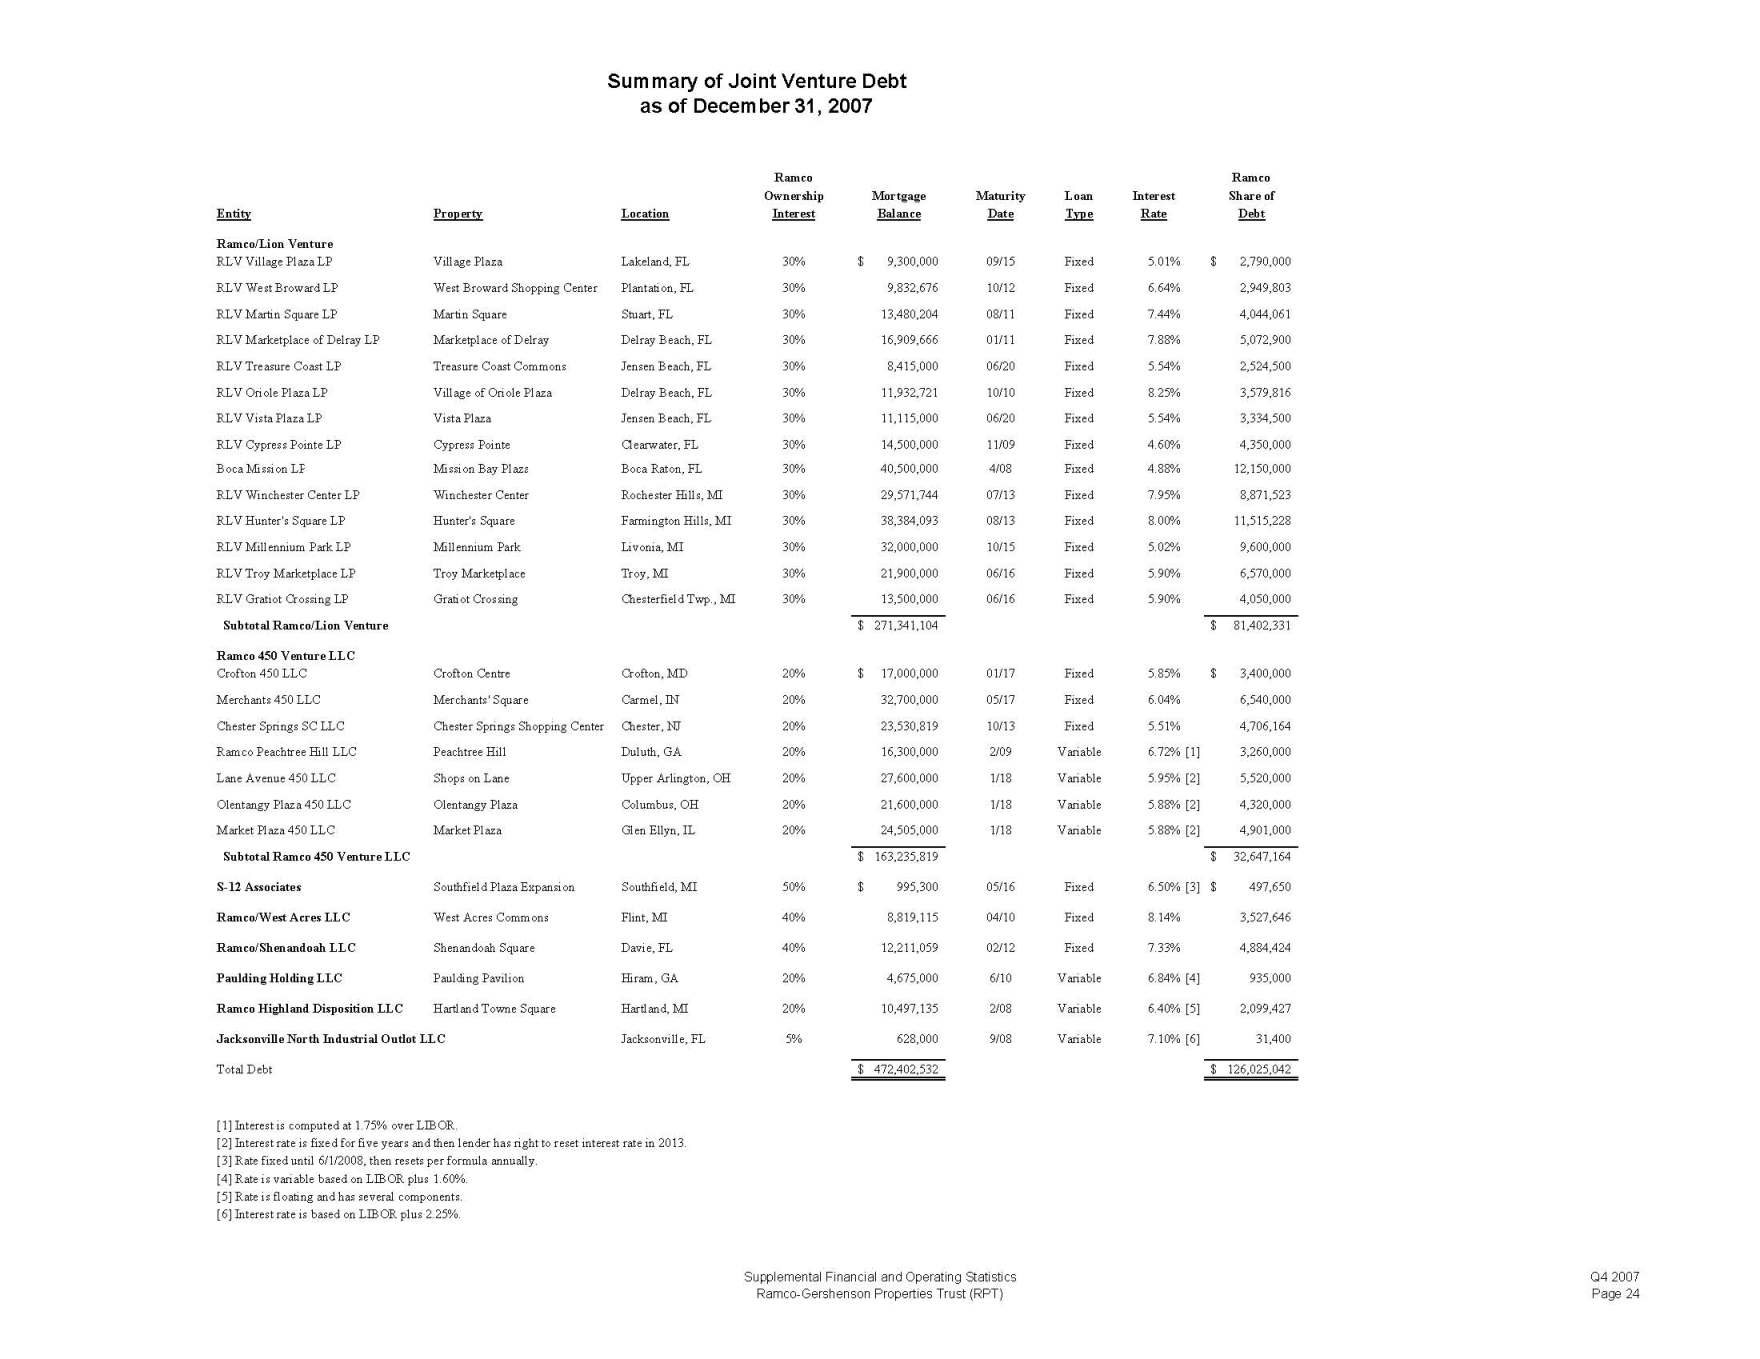
Summary of Joint Venture Debt as of December 31, 2007 Ramco Ramco Ownership Mortgage Maturity Loan Interest Share of Entity Property Location Interest Balance Date Type Rate Debt Ramco/Lion Venture RLV Village Plaza LP Village Plaza Lakeland, FL 30% $ 9,300,000 09/15 Fixed 5.01% $ 2,790,000 RLV West Broward LP West Broward Shopping Center Plantation, FL 30% 9,832,676 10/12 Fixed 6.64% 2,949,803 RLV Martin Square LP Martin Square Stuart, FL 30% 13,480,204 08/11 Fixed 7.44% 4,044,061 RLV Marketplace of Delray LP Marketplace of Delray Delray Beach, FL 30% 16,909,666 01/11 Fixed 7.88% 5,072,900 RLV Treasure Coast LP Treasure Coast Commons Jensen Beach, FL 30% 8,415,000 06/20 Fixed 5.54% 2,524,500 RLV Oriole Plaza LP Village of Oriole Plaza Delray Beach, FL 30% 11,932,721 10/10 Fixed 8.25% 3,579,816 RLV Vista Plaza LP Vista Plaza Jensen Beach, FL 30% 11,115,000 06/20 Fixed 5.54% 3,334,500 RLV Cypress Pointe LP Cypress Pointe Clearwater, FL 30% 14,500,000 11/09 Fixed 4.60% 4,350,000 Boca Mission LP Mission Bay Plaza Boca Raton, FL 30% 40,500,000 4/08 Fixed 4.88% 12,150,000 RLV Winchester Center LP Winchester Center Rochester Hills, MI 30% 29,571,744 07/13 Fixed 7.95% 8,871,523 RLV Hunter's Square LP Hunter's Square Farmington Hills, MI 30% 38,384,093 08/13 Fixed 8.00% 11,515,228 RLV Millennium Park LP Millennium Park Livonia, MI 30% 32,000,000 10/15 Fixed 5.02% 9,600,000 RLV Troy Marketplace LP Troy Marketplace Troy, MI 30% 21,900,000 06/16 Fixed 5.90% 6,570,000 RLV Gratiot Crossing LP Gratiot Crossing Chesterfield Twp., MI 30% 13,500,000 06/16 Fixed 5.90% 4,050,000 Subtotal Ramco/Lion Venture $ 271,341,104 $ 81,402,331 Ramco 450 Venture LLC Crofton 450 LLC Crofton Centre Crofton, MD 20% $ 17,000,000 01/17 Fixed 5.85% $ 3,400,000 Merchants 450 LLC Merchants' Square Carmel, IN 20% 32,700,000 05/17 Fixed 6.04% 6,540,000 Chester Springs SC LLC Chester Springs Shopping Center Chester, NJ 20% 23,530,819 10/13 Fixed 5.51% 4,706,164 Ramco Peachtree Hill LLC Peachtree Hill Duluth, GA 20% 16,300,000 2/09 Variable 6.72% [1] 3,260,000 Lane Avenue 450 LLC Shops on Lane Upper Arlington, OH 20% 27,600,000 1/18 Variable 5.95% [2] 5,520,000 Olentangy Plaza 450 LLC Olentangy Plaza Columbus, OH 20% 21,600,000 1/18 Variable 5.88% [2] 4,320,000 Market Plaza 450 LLC Market Plaza Glen Ellyn, IL 20% 24,505,000 1/18 Variable 5.88% [2] 4,901,000 Subtotal Ramco 450 Venture LLC $ 163,235,819 $ 32,647,164 S-12 Associates Southfield Plaza Expansion Southfield, MI 50% $ 995,300 05/16 Fixed 6.50% [3] $ 497,650 Ramco/West Acres LLC West Acres Commons Flint, MI 40% 8,819,115 04/10 Fixed 8.14% 3,527,646 Ramco/Shenandoah LLC Shenandoah Square Davie, FL 40% 12,211,059 02/12 Fixed 7.33% 4,884,424 Paulding Holding LLC Paulding Pavilion Hiram, GA 20% 4,675,000 6/10 Variable 6.84% [4] 935,000 Ramco Highland Disposition LLC Hartland Towne Square Hartland, MI 20% 10,497,135 2/08 Variable 6.40% [5] 2,099,427 Jacksonville North Industrial Outlot LLC Jacksonville, FL 5% 628,000 9/08 Variable 7.10% [6] 31,400 Total Debt $ 472,402,532 $ 126,025,042 [1] Interest is computed at 1.75% over LIBOR. [2] Interest rate is fixed for five years and then lender has right to reset interest rate in 2013. [3] Rate fixed until 6/1/2008, then resets per formula annually. [4] Rate is variable based on LIBOR plus 1.60%. [5] Rate is floating and has several components. [6] Interest rate is based on LIBOR plus 2.25%. Supplemental Financial and Operating Statistics Q4 2007 Ramco-Gershenson Properties Trust (RPT) Page 24
INVESTOR INFORMATION Inquiries Ramco-Gershenson Properties Trust welcomes any questions or comments from shareholders, analysts, investment managers, media or prospective investors. Please address all inquiries to our Investor Relations Department: Dawn L. Hendershot Director of Investor Relations Ramco-Gershenson Properties Trust 31500 Northwestern Highway, Suite 300 Farmington Hills, MI 48334 Phone: (248) 592-6202 FAX: (248) 592-6203 E-mail: dhendershot@rgpt.com Website: www.rgpt.com Ticker: NYSE:RPT Research Coverage Cantor Fitzgerald Philip Martin 312.469.7485 Deutsche Bank Securities Inc. Louis W. Taylor Christeen Kim 203.863.2381 415.617.4221 RBC Capital Markets Richard C. Moore 216.378.7625 Stifel Nicolaus David M. Fick Nathan Isbee 443.224.1308 443.224.1346 Our Supplemental Financial Package is available via e-mail and is also featured on our corporate website at www.rgpt.com. If you would like to receive this document electronically each quarter, please e-mail: dhendershot@rgpt.com. Supplemental Financial and Operating Statistics Q4 2007 Ramco-Gershenson Properties Trust (RPT) Page 25