| SELECTED FUNDS | Table of Contents |
| Shareholder Letter | 2 |
| | |
| Management's Discussion of Fund Performance: | |
| Selected American Shares | 3 |
| Selected Special Shares | 5 |
| | |
| Fund Overview: | |
| Selected American Shares | 7 |
| Selected Special Shares | 9 |
| Selected Daily Government Fund | 11 |
| | |
| Expense Example | 12 |
| | |
| Schedule of Investments: | |
| Selected American Shares | 14 |
| Selected Special Shares | 19 |
| Selected Daily Government Fund | 23 |
| | |
| Statements of Assets and Liabilities | 25 |
| | |
| Statements of Operations | 27 |
| | |
| Statements of Changes in Net Assets | 28 |
| | |
| Notes to Financial Statements | 30 |
| | |
| Financial Highlights | 39 |
| | |
| Report of Independent Registered Public Accounting Firm | 41 |
| | |
| Fund Information | 42 |
| | |
| Privacy Notice and Householding | 43 |
| | |
| Directors and Officers | 44 |
This Annual Report is authorized for use by existing shareholders. Prospective shareholders must receive a current Selected Funds prospectus, which contains more information about investment strategies, risks, fees, and expenses. Please read the prospectus carefully before investing or sending money.
Shares of the Selected Funds are not deposits or obligations of any bank, are not guaranteed by any bank, are not insured by the FDIC or any other agency, and involve investment risks, including possible loss of the principal amount invested.
| SELECTED FUNDS | Shareholder Letter |
Dear Fellow Shareholder,
As stewards of our customers’ savings, the management team and Directors of the Selected Funds recognize the importance of candid, thorough, and regular communication with our shareholders. In our Annual and Semi-Annual Reports, we include all of the required quantitative information, such as audited financial statements, detailed footnotes, performance reports, fund holdings, and performance attribution. Also included is a list of positions opened and closed.
In addition, we produce a Research Report for certain funds, which is published semi-annually. In this report, we give a more qualitative perspective on fund performance, discuss our thoughts on individual holdings, and share our investment outlook. You may obtain a copy of the current Research Report either on our website, www.selectedfunds.com, or by calling 1-800-243-1575.
We thank you for your continued trust. We will do our best to earn it in the years ahead.
Sincerely,
James J. McMonagle Christopher C. Davis Kenneth C. Feinberg
Chairman President & Portfolio Manager Portfolio Manager
February 4, 2011
| SELECTED FUNDS | Management’s Discussion of Fund Performance |
| SELECTED AMERICAN SHARES, INC. | |
Performance Overview
Selected American Shares’ Class S shares delivered a total return on net asset value of 12.53% (Class D shares returned 12.90%) for the year ended December 31, 2010. Over the same time period, the Standard & Poor’s 500® Index (“Index”) returned 15.06%. Every sector1 within the Index delivered positive returns over the year. The sectors that turned in the strongest performance over the year were consumer discretionary, industrials, and materials. The sectors that turned in the weakest (but still positive) performance over the year were health care and utilities.
Factors Impacting the Fund’s Performance
The Fund had more invested in financial companies than in any other sector (28% versus 16% for the Index) and they were the most important contributor2 to the Fund’s performance. The Fund’s financial companies out-performed the corresponding sector within the Index (up 17% versus up 11% for the Index). Berkshire Hathaway3, Wells Fargo, and Julius Baer Group were among the most important contributors to performance. Visa was among the most important detractors from performance.
Consumer staple companies were an important contributor to performance. The Fund’s consumer staple companies out-performed the corresponding sector within the Index (up 18% versus up 14% for the Index) and had a higher relative average weighting (15% versus 11% for the Index). Costco Wholesale was among the most important contributors to performance.
While energy companies made positive contributions to absolute performance, they were the most important reason that the Fund’s performance lagged the Index. The Fund’s energy companies under-performed the corresponding sector within the Index (up 8% versus up 20% for the Index), but had a higher relative average weighting (16% versus 11% for the Index) in this stronger performing sector. Occidental Petroleum and Canadian Natural Resources were among the most important contributors to performance. EOG Resources, China Coal Energy, and Transocean were among the most important detractors from performance.
Industrial companies also made positive contributions to absolute performance, but they were the second most important reason that the Fund’s performance lagged the Index. The Fund’s industrial companies under-performed the corresponding sector within the Index (up 15% versus up 27% for the Index) and had a lower relative average weighting (7% versus 11% for the Index) in this stronger performing sector. D&B Corp. was among the most important detractors from performance.
Other important contributors to performance included Harley-Davidson, Texas Instruments, and Sealed Air. Other important detractors from performance included two information technology companies, Hewlett-Packard and Microsoft. These two companies turned in negative returns for the year despite generally positive returns in both the information technology sector and the overall market.
The Fund had approximately 21% of its net assets invested in foreign companies at December 31, 2010. As a whole these companies out-performed the domestic companies held by the Fund.
Selected American Shares’ investment objective is to achieve both capital growth and income. In the current market environment, we expect that income will be low. There can be no assurance that the Fund will achieve its objective. Selected American Shares’ principal risks are: market risk, company risk, financial services risk, foreign country risk, headline risk, and fees and expenses risk. See the prospectus for a full description of each risk.
1 The companies included in the Standard & Poor’s 500® Index are divided into ten sectors. One or more industry groups make up a sector.
2 A company’s or sector’s contribution to or detraction from the Fund’s performance is a product both of its appreciation or depreciation and its weighting within the Fund. For example, a 5% holding that rises 20% has twice as much impact as a 1% holding that rises 50%.
3 This Management Discussion of Fund Performance discusses a number of individual companies. The information provided in this report does not provide information reasonably sufficient upon which to base an investment decision and should not be considered a recommendation to purchase or sell any particular security. The Schedule of Investments lists the Fund’s holdings of each company discussed.
| SELECTED FUNDS | Management’s Discussion of Fund Performance |
| SELECTED AMERICAN SHARES, INC. – (CONTINUED) | |
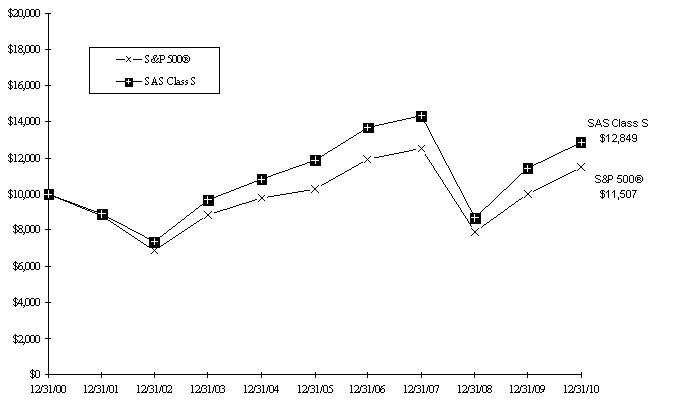
Comparison of a $10,000 investment in Selected American Shares Class S versus the Standard & Poor’s 500® Index over 10 years for an investment made on December 31, 2000
Average Annual Total Return for periods ended December 31, 2010
| Fund & Benchmark Index | 1-Year | 5-Year | 10-Year | Since Class D’s Inception (May 3, 2004) | Gross Expense Ratio | Net Expense Ratio |
| Class S | 12.53% | 1.60% | 2.54% | N/A | 0.93% | 0.93% |
| Class D | 12.90% | 1.94% | N/A | 4.29% | 0.60% | 0.60% |
Standard & Poor’s 500® Index | 15.06% | 2.29% | 1.41% | 3.89% | | |
The Standard & Poor’s 500® Index is an unmanaged index of 500 selected common stocks, most of which are listed on the New York Stock Exchange. The Index is adjusted for dividends, weighted towards stocks with large market capitalizations, and represents approximately two-thirds of the total market value of all domestic common stocks. Investments cannot be made directly in the Index.
The performance data for Selected American Shares contained in this report represents past performance and assumes that all distributions were reinvested, and should not be considered as an indication of future performance from an investment in the Fund today. The investment return and principal value will fluctuate so that shares may be worth more or less than their original cost when redeemed. Fund performance changes over time and current performance may be higher or lower than stated. Returns shown do not reflect the deduction of taxes that a shareholder would pay on fund distributions or the redemption of fund shares. The operating expense ratios may vary in future years. For more current information please call Selected Funds Investor Services at 1-800-243-1575.
| SELECTED FUNDS | Management’s Discussion of Fund Performance |
| SELECTED SPECIAL SHARES, INC. | |
Performance Overview
Selected Special Shares’ Class S shares delivered a total return on net asset value of 13.73% (Class D shares returned 14.30%) for the year ended December 31, 2010. Over the same time period, the Russell 3000® Index (“Index”) returned 16.93%. Every sector1 within the Index delivered positive returns over the year. The sectors within the Index that turned in the strongest performance over the year were consumer discretionary, industrials, and materials. The sectors that turned in the weakest (but still positive) performance over the year were health care and utilities.
Factors Impacting the Fund’s Performance
The Fund’s 2010 performance benefited from Youku.com2, an initial public offering (IPO) in the information technology sector. Davis Advisors purchases shares intending to benefit from long-term growth of the underlying company; the rapid appreciation of the IPO was an unusual occurrence. The Fund’s information technology sector benefited from the addition of Youku.com, and as such, information technology companies were the most important contributor3 to performance. Texas Instruments was also among the most important contributors to performance. Microsoft and Hewlett-Packard were among the most important detractors from performance.
Consumer discretionary companies were also an important contributor to performance. The Fund’s consumer discretionary companies out-performed the corresponding sector within the Index (up 37% versus up 30% for the Index) and had a slightly lower relative average weighting (10% versus 11% for the Index). Yum! Brands and Hunter Douglas were among the most important contributors to performance. H&R Block was among the most important detractors from performance.
Consumer staple companies were also important contributors to performance. The Fund’s consumer staple companies out-performed the corresponding sector within the Index (up 23% versus up 14% for the Index) and had approximately the same relative average weighting (both 10%). Coca-Cola was among the most important contributors to performance.
While energy companies made positive contributions to performance, they were the most important reason that the Fund’s performance lagged the Index. The Fund’s energy companies under-performed the corresponding sector within the Index (up 2% versus up 22% for the Index) and had a lower relative average weighting (6% versus 11% for the Index) in this stronger performing sector. Transocean was among the most important detractors from performance.
The Fund’s material companies under-performed the corresponding sector within the Index (up 10% versus up 25% for the Index), but had a higher relative average weighting (9% versus 4% for the Index) in this stronger performing sector. Sino-Forest and Sigma-Aldrich were among the most important contributors to performance. Monsanto and Yingde Gases Group were among the most important detractors from performance.
Other important contributors to performance included Kuehne & Nagel, Blount, and Agilent. Other important detractors from performance included Charles Schwab and Pfizer.
The Fund had approximately 20% of its net assets invested in foreign companies at December 31, 2010. As a whole these companies out-performed the domestic companies held by the Fund.
Selected Special Shares’ investment objective is capital growth. There can be no assurance that the Fund will achieve its objective. Selected Special Shares’ principal risks are: market risk, company risk, under $10 billion market capitalization risk, foreign country risk, headline risk, and fees and expenses risk. See the prospectus for a full description of each risk.
1 The companies included in the Russell 3000® Index are divided into ten sectors. One or more industry groups make up a sector.
2 This Management Discussion of Fund Performance discusses a number of individual companies. The information provided in this report does not provide information reasonably sufficient upon which to base an investment decision and should not be considered a recommendation to purchase or sell any particular security. The Schedule of Investments lists the Fund’s holdings of each company discussed.
3 A company’s or sector’s contribution to or detraction from the Fund’s performance is a product both of its appreciation or depreciation and its weighting within the Fund. For example, a 5% holding that rises 20% has twice as much impact as a 1% holding that rises 50%.
| SELECTED FUNDS | Management’s Discussion of Fund Performance |
| SELECTED SPECIAL SHARES, INC. – (CONTINUED) | |
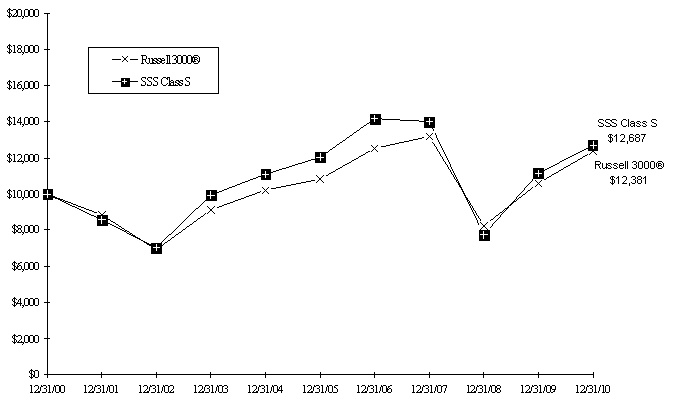
Comparison of a $10,000 investment in Selected Special Shares Class S versus the Russell 3000® Index over 10 years for an investment made on December 31, 2000
Average Annual Total Return for periods ended December 31, 2010
| Fund & Benchmark Index | 1-Year | 5-Year | 10-Year | Since Class D’s Inception (May 3, 2004) | Gross Expense Ratio | Net Expense Ratio |
| Class S | 13.73% | 1.06% | 2.41% | N/A | 1.23% | 1.23% |
| Class D | 14.30% | 1.50% | N/A | 3.74% | 0.76% | 0.76% |
Russell 3000® Index | 16.93% | 2.74% | 2.16% | 4.56% | | |
Selected Special Shares made a favorable investment in an IPO, which had a material impact on the investment performance, adding approximately 2% to the Fund’s total return in 2010. The IPO was purchased with the intent to benefit from long-term growth of the underlying company and the rapid appreciation was an unusual occurrence. Such performance may not continue in the future.
The Russell 3000® Index measures the performance of the 3,000 largest companies based on total market capitalization, which represents approximately 98% of the investable U.S. equity market. Investments cannot be made directly in the Index.
The performance data for Selected Special Shares contained in this report represents past performance and assumes that all distributions were reinvested, and should not be considered as an indication of future performance from an investment in the Fund today. The investment return and principal value will fluctuate so that shares may be worth more or less than their original cost when redeemed. Fund performance changes over time and current performance may be higher or lower than stated. Returns shown do not reflect the deduction of taxes that a shareholder would pay on fund distributions or the redemption of fund shares. The operating expense ratios may vary in future years. For more current information please call Selected Funds Investor Services at 1-800-243-1575.
| SELECTED FUNDS | Fund Overview |
| SELECTED AMERICAN SHARES, INC. | December 31, 2010 |
| Portfolio Composition | | Industry Weightings |
| (% of Fund’s 12/31/10 Net Assets) | | (% of 12/31/10 Long-Term Portfolio) |
| | | | | | |
| | | | | Fund | S&P 500® |
| Common Stock (U.S.) | 75.49% | | Energy | 15.77% | 12.03% |
| Common Stock (Foreign) | 20.37% | | Diversified Financials | 13.32% | 7.53% |
| Convertible Bonds (Foreign) | 0.28% | | Health Care | 13.14% | 10.91% |
| Convertible Bonds (U.S.) | 0.12% | | Insurance | 9.11% | 3.90% |
| Short-Term Investments | 3.82% | | Food & Staples Retailing | 9.11% | 2.36% |
| Other Assets & Liabilities | (0.08)% | | Materials | 8.82% | 3.74% |
| | 100.00% | | Food, Beverage & Tobacco | 6.55% | 5.87% |
| | | | Information Technology | 5.11% | 18.65% |
| | | | Banks | 4.76% | 3.10% |
| | | | Retailing | 3.02% | 3.71% |
| | | | Transportation | 2.69% | 2.02% |
| | | | Commercial & Professional Services | 2.55% | 0.60% |
| | | | Automobiles & Components | 1.66% | 0.87% |
| | | | Other | 1.28% | 12.44% |
| | | | Household & Personal Products | 1.16% | 2.41% |
| | | | Capital Goods | 1.02% | 8.33% |
| | | | Real Estate | 0.93% | 1.53% |
| | | | | 100.00% | 100.00% |
| | | | | | |
| Top 10 Long-Term Holdings |
| (% of Fund’s 12/31/10 Net Assets) |
| Costco Wholesale Corp. | Food & Staples Retailing | 5.00% |
| Wells Fargo & Co. | Commercial Banks | 4.58% |
| American Express Co. | Consumer Finance | 4.27% |
| CVS Caremark Corp. | Food & Staples Retailing | 3.76% |
| EOG Resources, Inc. | Energy | 3.39% |
| Occidental Petroleum Corp. | Energy | 3.30% |
| Loews Corp. | Multi-line Insurance | 3.05% |
| Canadian Natural Resources Ltd. | Energy | 2.95% |
| Merck & Co., Inc. | Pharmaceuticals, Biotechnology & Life Sciences | 2.94% |
| Devon Energy Corp. | Energy | 2.94% |
| SELECTED FUNDS | Fund Overview |
| SELECTED AMERICAN SHARES, INC. – (CONTINUED) | December 31, 2010 |
New Positions Added (01/01/10 - 12/31/10)
(Highlighted positions are those greater than 0.50% of Fund’s 12/31/10 net assets)
| | | Date of 1st | % of Fund’s 12/31/10 |
| Security | Industry | Purchase | Net Assets |
| Air Products and Chemicals, Inc. | Materials | 08/24/10 | 0.22% |
| America Movil SAB de C.V., Series L, ADR | Telecommunication Services | 04/21/10 | 0.32% |
| Aon Corp. | Insurance Brokers | 07/12/10 | 0.12% |
| Baxter International Inc. | Health Care Equipment & Services | 04/22/10 | 0.61% |
| Charles Schwab Corp. | Capital Markets | 08/31/10 | 0.06% |
| Fairfax Financial Holdings Ltd., 144A | Multi-line Insurance | 02/23/10 | 0.22% |
| Kraft Foods Inc., Class A | Food, Beverage & Tobacco | 12/17/10 | 0.29% |
| Lockheed Martin Corp. | Capital Goods | 09/20/10 | 0.63% |
| Nestle S.A. | Food, Beverage & Tobacco | 03/09/10 | 0.18% |
| Praxair, Inc. | Materials | 05/21/10 | 0.22% |
| Roche Holding AG - Genusschein | Pharmaceuticals, Biotechnology & | | |
| | Life Sciences | 07/16/10 | 0.93% |
| Schlumberger Ltd. | Energy | 06/07/10 | 0.21% |
| Unilever NV, NY Shares | Food, Beverage & Tobacco | 02/09/10 | 0.40% |
| | | | |
Positions Closed (01/01/10 - 12/31/10)
(Gains and losses greater than $20,000,000 are highlighted)
| | | Date of | Realized |
| Security | Industry | Final Sale | Gain (Loss) |
| ABB Ltd., ADR | Capital Goods | 12/01/10 | | $ | 7,646,677 |
| AES Corp. | Utilities | 02/17/10 | | | (991,612) |
| Amazon.com, Inc. | Retailing | 07/13/10 | | | 26,725,486 |
| Berkshire Hathaway Inc., Class B | Property & Casualty Insurance | 05/07/10 | | | 2,553,198 |
| Cardinal Health, Inc. | Health Care Equipment & Services | 07/09/10 | | | 742,954 |
| CareFusion Corp. | Health Care Equipment & Services | 08/13/10 | | | (1,239,004) |
| Comcast Corp., Special Class A | Media | 02/24/10 | | | (10,133,816) |
| ConocoPhillips | Energy | 07/09/10 | | | 12,889,141 |
| Cosco Pacific Ltd. | Transportation | 09/17/10 | | | (10,227,476) |
| DIRECTV, Class A | Media | 01/21/10 | | | 27,462,004 |
| Garmin Ltd. | Consumer Durables & Apparel | 01/04/10 | | | (54,237) |
| H&R Block, Inc. | Consumer Services | 09/10/10 | | | (5,395,018) |
Harley-Davidson, Inc., Sr. Notes, 15.00%, 02/01/14 | Automobiles & Components | 12/08/10 | | | 13,254,531 |
| Hartford Financial Services Group, Inc. | Multi-line Insurance | 01/13/10 | | | 21,510,458 |
| Laboratory Corp. of America Holdings | Health Care Equipment & Services | 05/28/10 | | | 8,511,451 |
Level 3 Communications, Inc., Conv. Sr. Notes, 10.00%, 05/01/11 | Telecommunication Services | 05/27/10 | | | 320,640 |
| News Corp., Class A | Media | 09/24/10 | | | (25,491,690) |
| PACCAR Inc. | Capital Goods | 06/10/10 | | | 7,537,714 |
| Principal Financial Group, Inc. | Life & Health Insurance | 02/01/10 | | | 436,978 |
| Sealed Air Corp., Sr. Notes, | | | | | |
| 12.00%, 02/14/14 | Materials | 11/30/10 | | | 6,750,000 |
| UnitedHealth Group Inc. | Health Care Equipment & Services | 01/05/10 | | | (2,132,099) |
| United Parcel Service, Inc., Class B | Transportation | 07/23/10 | | | 3,863,026 |
| Walt Disney Co. | Media | 10/05/10 | | | 35,309,477 |
| SELECTED FUNDS | Fund Overview |
| SELECTED SPECIAL SHARES, INC. | December 31, 2010 |
| Portfolio Composition | | Industry Weightings |
| (% of Fund’s 12/31/10 Net Assets) | | (% of 12/31/10 Stock Holdings) |
| | | | | | |
| | | | | Fund | Russell 3000® |
| Common Stock (U.S.) | 77.39% | | Health Care | 19.26% | 11.26% |
| Common Stock (Foreign) | 19.76% | | Information Technology | 18.36% | 18.35% |
| Stock Warrants | 0.58% | | Materials | 11.00% | 4.32% |
| Short-Term Investments | 2.54% | | Food, Beverage & Tobacco | 9.32% | 4.98% |
| Other Assets & Liabilities | (0.27)% | | Diversified Financials | 6.60% | 6.50% |
| | 100.00% | | Energy | 6.43% | 11.25% |
| | | | Insurance | 5.42% | 3.88% |
| | | | Capital Goods | 5.04% | 8.60% |
| | | | Food & Staples Retailing | 4.28% | 1.98% |
| | | | Consumer Services | 3.43% | 2.20% |
| | | | Banks | 3.38% | 3.38% |
| | | | Consumer Durables & Apparel | 2.67% | 1.40% |
| | | | Transportation | 1.98% | 2.00% |
| | | | Media | 1.77% | 3.08% |
| | | | Other | 1.06% | 16.82% |
| | | | | 100.00% | 100.00% |
| Top 10 Long-Term Holdings |
| (% of Fund’s 12/31/10 Net Assets) |
| | | |
| Johnson & Johnson | Pharmaceuticals, Biotechnology & Life Sciences | 4.50% |
| Merck & Co., Inc. | Pharmaceuticals, Biotechnology & Life Sciences | 4.25% |
| CVS Caremark Corp. | Food & Staples Retailing | 4.18% |
| Sino-Forest Corp. | Materials | 3.87% |
| Texas Instruments Inc. | Semiconductors & Semiconductor Equipment | 3.71% |
| Oaktree Capital Group LLC, Class A | Diversified Financial Services | 3.69% |
| Coca-Cola Co. | Food, Beverage & Tobacco | 3.52% |
| Markel Corp. | Property & Casualty Insurance | 3.46% |
| Google Inc., Class A | Software & Services | 3.39% |
| Yum! Brands, Inc. | Consumer Services | 3.27% |
| SELECTED FUNDS | Fund Overview |
| SELECTED SPECIAL SHARES, INC. – (CONTINUED) | December 31, 2010 |
New Positions Added (01/01/10 - 12/31/10)
(Highlighted positions are those greater than 2.00% of Fund’s 12/31/10 net assets)
| Security | Industry | Date of 1st Purchase | % of Fund’s 12/31/10 Net Assets |
| Altera Corp. | Semiconductors & Semiconductor Equipment | 03/30/10 | 0.61% |
| Baxter International Inc. | Health Care Equipment & Services | 04/22/10 | 1.71% |
| Coca-Cola Co. | Food, Beverage & Tobacco | 02/26/10 | 3.52% |
| Kraft Foods Inc., Class A | Food, Beverage & Tobacco | 12/17/10 | 2.52% |
| Lockheed Martin Corp. | Capital Goods | 01/19/10 | 0.75% |
| Nestle S.A. | Food, Beverage & Tobacco | 03/08/10 | 1.02% |
| Sherwin-Williams Co. | Materials | 03/23/10 | 1.67% |
| U.S. Bancorp | Commercial Banks | 09/23/10 | 0.27% |
| W. R. Berkley Corp. | Property & Casualty Insurance | 04/07/10 | − |
| Wells Fargo & Co., Stock Warrants, | | | |
| strike price $34.01, expires 10/28/18 | Commercial Banks | 05/21/10 | 0.58% |
| Yingde Gases Group Co. Ltd. | Materials | 04/07/10 | 0.81% |
| Youku.com Inc., ADR | Software & Services | 12/08/10 | 1.86% |
Positions Closed (01/01/10 - 12/31/10)
(Gains and losses greater than $200,000 are highlighted)
| | | Date of | | | Realized |
| Security | Industry | Final Sale | | | Gain (Loss) |
| American Tower Corp., Class A | Telecommunication Services | 10/27/10 | | $ | 144,662 |
| Aon Corp. | Insurance Brokers | 12/27/10 | | | 46,949 |
| Brown & Brown, Inc. | Insurance Brokers | 07/19/10 | | | (8,151) |
| CareFusion Corp. | Health Care Equipment & Services | 12/27/10 | | | 22,879 |
| CarMax, Inc. | Retailing | 12/28/10 | | | 55,326 |
| Cisco Systems, Inc. | Technology Hardware & Equipment | 10/27/10 | | | 54,099 |
| CME Group Inc. | Diversified Financial Services | 12/27/10 | | | 17,298 |
| Comcast Corp., Special Class A | Media | 02/26/10 | | | (296,174) |
| Costco Wholesale Corp. | Food & Staples Retailing | 12/27/10 | | | 43,643 |
| D&B Corp. | Commercial & Professional Services | 01/20/10 | | | 14,238 |
| DIRECTV, Class A | Media | 01/21/10 | | | 224,275 |
| E*TRADE Financial Corp. | Capital Markets | 04/26/10 | | | (257,297) |
| Everest Re Group, Ltd. | Reinsurance | 12/27/10 | | | 8,036 |
| Exelon Corp. | Utilities | 03/04/10 | | | (11,190) |
| GAM Holding Ltd. | Capital Markets | 01/20/10 | | | 44,320 |
| Garmin Ltd. | Consumer Durables & Apparel | 01/04/10 | | | 13,133 |
| Johnson Controls, Inc. | Automobiles & Components | 12/27/10 | | | 12,214 |
| Julius Baer Group Ltd. | Capital Markets | 01/20/10 | | | 108,282 |
| Laboratory Corp. of America Holdings | Health Care Equipment & Services | 12/27/10 | | | 323,226 |
| Lagardere S.C.A. | Media | 03/08/10 | | | (106,112) |
Level 3 Communications, Inc. Conv. Sr. Notes, 10.00%, 05/01/11 | Telecommunication Services | 05/27/10 | | | 18,370 |
| Liberty Media Corp. - Interactive, Series A | Retailing | 01/20/10 | | | (193,734) |
| Liberty Media - Starz, Series A | Media | 01/20/10 | | | 30,750 |
| Millipore Corp. | Pharmaceuticals, Biotechnology & | | | | |
| | Life Sciences | 07/15/10 | | | 125,205 |
| NetEase.com Inc., ADR | Software & Services | 12/08/10 | | | 29,976 |
| News Corp., Class A | Media | 02/26/10 | | | (517,710) |
| Pargesa Holdings S.A., Bearer Shares | Diversified Financial Services | 12/08/10 | | | 103,391 |
| RenaissanceRe Holdings Ltd. | Reinsurance | 12/27/10 | | | 11,620 |
| Ryanair Holdings PLC, ADR | Transportation | 10/27/10 | | | 55,544 |
| UnitedHealth Group Inc. | Health Care Equipment & Services | 09/20/10 | | | (126,260) |
| W. R. Berkley Corp. | Property & Casualty Insurance | 12/27/10 | | | 2,047 |
| Walt Disney Co. | Media | 08/19/10 | | | 993,264 |
| SELECTED FUNDS | Fund Overview |
| SELECTED CAPITAL PRESERVATION TRUST - | December 31, 2010 |
| SELECTED DAILY GOVERNMENT FUND | |
| Portfolio Composition | | Maturity Diversification |
| (% of Fund’s 12/31/10 Net Assets) | | (% of 12/31/10 Portfolio Holdings) |
| | | | | |
| Repurchase Agreements | 49.63% | | 0-30 Days | 69.79% |
| Federal Home Loan Bank | 29.75% | | 31-90 Days | 9.82% |
| Freddie Mac | 15.28% | | 91-180 Days | 11.20% |
| Federal Farm Credit Bank | 4.84% | | 181-397 Days | 9.19% |
| Fannie Mae | 0.27% | | | 100.00% |
| Other Assets & Liabilities | 0.23% | | | |
| | 100.00% | | | |
| | | | | |
| | | | | |
| | | | | |
The maturity dates of floating rate securities used in the Maturity Diversification table are considered to be the effective maturities, based on the reset dates of the securities’ variable rates. See the Fund’s Schedule of Investments for a listing of the floating rate securities.
| SELECTED FUNDS | Expense Example |
Example
As a shareholder of each Fund, you incur ongoing costs only, including advisory and administrative fees, distribution and/or service (12b-1) fees, and other Fund expenses. The Expense Example is intended to help you understand your ongoing costs (in dollars) of investing in each Fund and to compare these costs with the ongoing costs of investing in other mutual funds. The Expense Example is based on an investment of $1,000 invested at the beginning of the period and held for the entire period indicated, which for each class is for the six-month period ended December 31, 2010.
Actual Expenses
The information represented in the row entitled “Actual” provides information about actual account values and actual expenses. You may use the information in this row, together with the amount you invested, to estimate the expenses that you paid over the period. Simply divide your account value by $1,000 (for example, an $8,600 account value divided by $1,000 = 8.6), then multiply the result by the number under the heading “Expenses Paid During Period” to estimate the expenses you paid on your account during this period. An annual maintenance fee of $15, charged on retirement plan accounts per Social Security Number, is not included in the Expense Example. This fee will be waived for accounts sharing the same Social Security Number if the accounts total at least $50,000 at Selected Funds. If this fee was included, the estimate of expenses you paid during the period would be higher, and your ending account value would be lower, by this amount.
Hypothetical Example for Comparison Purposes
The information represented in the row entitled “Hypothetical” provides information about hypothetical account values and hypothetical expenses based on each Fund’s actual expense ratio and an assumed rate of return of 5% per year before expenses, which is not the Fund’s actual return. The hypothetical account values and expenses may not be used to estimate the actual ending account balance or expenses you paid for the period. You may use this information to compare the ongoing costs of investing in the Fund and other funds. To do so, compare this 5% hypothetical example with the 5% hypothetical examples that appear in the shareholder reports of the other funds. An annual maintenance fee of $15, charged on retirement plan accounts per Social Security Number, is not included in the Expense Example. This fee will be waived for accounts sharing the same Social Security Number if the accounts total at least $50,000 at Selected Funds. If this fee was included, the estimate of expenses you paid during the period would be higher, and your ending account value would be lower, by this amount.
Please note that the expenses shown in the table are meant to highlight your ongoing costs only. Therefore, the information in the row entitled “Hypothetical” is useful in comparing ongoing costs only, and will not help you determine the relative total costs of owning different funds.
| SELECTED FUNDS | Expense Example – (Continued) |
| | Beginning | | Ending | | Expenses Paid |
| | Account Value | | Account Value | | During Period* |
| | (07/01/10) | | (12/31/10) | | (07/01/10-12/31/10) |
| Selected American Shares | | | | | |
Class S (annualized expense ratio 0.93%**) | | | | | |
Actual | $1,000.00 | | $1,214.94 | | $5.19 |
Hypothetical | $1,000.00 | | $1,020.52 | | $4.74 |
Class D (annualized expense ratio 0.60%**) | | | | | |
Actual | $1,000.00 | | $1,216.83 | | $3.35 |
Hypothetical | $1,000.00 | | $1,022.18 | | $3.06 |
Selected Special Shares | | | | | |
Class S (annualized expense ratio 1.23%**) | | | | | |
Actual | $1,000.00 | | $1,255.38 | | $6.99 |
Hypothetical | $1,000.00 | | $1,019.00 | | $6.26 |
Class D (annualized expense ratio 0.75%**) | | | | | |
Actual | $1,000.00 | | $1,258.68 | | $4.27 |
Hypothetical | $1,000.00 | | $1,021.42 | | $3.82 |
Selected Daily Government Fund | | | | | |
Class S (annualized expense ratio 0.21%**) | | | | | |
Actual | $1,000.00 | | $1,000.56 | | $1.06 |
Hypothetical | $1,000.00 | | $1,024.15 | | $1.07 |
Class D (annualized expense ratio 0.21%**) | | | | | |
Actual | $1,000.00 | | $1,000.56 | | $1.06 |
Hypothetical | $1,000.00 | | $1,024.15 | | $1.07 |
Hypothetical assumes 5% annual return before expenses.
*Expenses are equal to each Class’s annualized operating expense ratio, multiplied by the average account value over the period, multiplied by 184/365 (to reflect the one-half year period).
**The expense ratios reflect the impact, if any, of the reduction of expenses paid indirectly and of certain reimbursements and/or waivers from the Adviser and/or Distributor.
| SELECTED FUNDS | Schedule of Investments |
| SELECTED AMERICAN SHARES, INC. | December 31, 2010 |
| | Shares | | Value (Note 1) | |
| |
| | CONSUMER DISCRETIONARY – (5.31%) | |
| | Automobiles & Components – (1.59%) | |
| | | | | | | | | |
| | Consumer Durables & Apparel – (0.21%) | |
| | Hunter Douglas NV (Netherlands) | | | | | | | |
| | Media – (0.60%) | |
| | Grupo Televisa S.A., ADR (Mexico)* | | | | | | | |
| | Liberty Media - Starz, Series A * | | | | | | | |
| | | 44,581,318 | |
| |
| | Retailing – (2.91%) | |
| | | | | | | | | |
| | | | | | | | | |
| | Liberty Media Corp. - Interactive, Series A * | | | | | | | |
| | | 217,513,158 | |
| | Total Consumer Discretionary | | | | |
| | CONSUMER STAPLES – (16.18%) | |
| | Food & Staples Retailing – (8.76%) | |
| | | | | | | | | |
| | | | | | | | | |
| | | 655,846,301 | |
| |
| | Food, Beverage & Tobacco – (6.30%) | |
| | | | | | | | | |
| | Diageo PLC (United Kingdom) | | | | | | | |
| | Heineken Holding NV (Netherlands) | | | | | | | |
| | | | | | | | | |
| | Kraft Foods Inc., Class A | | | | | | | |
| | Mead Johnson Nutrition Co. | | | | | | | |
| | Nestle S.A. (Switzerland) | | | | | | | |
| | Philip Morris International Inc. | | | | | | | |
| | Unilever NV, NY Shares (Netherlands) | | | | | | | |
| | | 471,664,940 | |
| |
| | Household & Personal Products – (1.12%) | |
| | Natura Cosmeticos S.A. (Brazil) | | | | | | | |
| | | | | | | | | |
| | | 83,502,704 | |
| | | | | | |
| | ENERGY – (15.18%) | |
| | Canadian Natural Resources Ltd. (Canada) | | | | | | | |
| | China Coal Energy Co. - H (China) | | | | | | | |
| | | | | | | | | |
| | | | | | | | | |
| | Occidental Petroleum Corp. | | | | | | | |
| | OGX Petroleo e Gas Participacoes S.A. (Brazil)* | | | | | | | |
| | | | | | | | | |
| | | | | | | | | |
| | | | | | |
| SELECTED FUNDS | Schedule of Investments |
| SELECTED AMERICAN SHARES, INC. - (CONTINUED) | December 31, 2010 |
| | Shares | | Value (Note 1) | |
COMMON STOCK – (CONTINUED) | |
| | FINANCIALS – (27.07%) | |
| | Banks – (4.58%) | |
| | Commercial Banks – (4.58%) | |
| | | | | | | | | |
| | Diversified Financials – (12.82%) | |
| | Capital Markets – (7.79%) | |
| | Ameriprise Financial, Inc. | | | | | | | |
| | Bank of New York Mellon Corp. | | | | | | | |
| | Brookfield Asset Management Inc., Class A (Canada) | | | | | | | |
| | | | | | | | | |
| | GAM Holding Ltd. (Switzerland)* | | | | | | | |
| | Goldman Sachs Group, Inc. | | | | | | | |
| | Julius Baer Group Ltd. (Switzerland) | | | | | | | |
| | 583,258,534 | |
| |
| | Consumer Finance – (4.27%) | |
| | | | | | | | | |
| | Diversified Financial Services – (0.76%) | |
| | | | | | | | | |
| | | | | | | | | |
| | | | | | | | | |
| | 57,241,560 | |
| | | 959,700,426 | |
| |
| | Insurance – (8.77%) | |
| | Insurance Brokers – (0.12%) | |
| | | | | | | | | |
| | Multi-line Insurance – (3.72%) | |
| | Fairfax Financial Holdings Ltd. (Canada) | | | | | | | |
| | Fairfax Financial Holdings Ltd., 144A (Canada)(a)(b) | | | | | | | |
| | | | | | | | | |
| | 277,906,060 | |
| |
| | Property & Casualty Insurance – (3.89%) | |
| | Berkshire Hathaway Inc., Class A * | | | | | | | |
| | | | | | | | | |
| | | | | | | | | |
| | 291,232,524 | |
| |
| | Reinsurance – (1.04%) | |
| | Transatlantic Holdings, Inc. | | | | | | | |
| | | 656,281,847 | |
| |
| | Real Estate – (0.90%) | |
| | Hang Lung Group Ltd. (Hong Kong) | | | | | | | |
| | | | | | |
| | HEALTH CARE – (12.65%) | |
| | Health Care Equipment & Services – (3.47%) | |
| | Baxter International Inc. | | | | | | | |
| | Becton, Dickinson and Co. | | | | | | | |
| | | | | | | | | |
| | | 259,695,382 | |
| |
| SELECTED FUNDS | Schedule of Investments |
| SELECTED AMERICAN SHARES, INC. - (CONTINUED) | December 31, 2010 |
| | Shares | | Value (Note 1) | |
COMMON STOCK – (CONTINUED) | |
| | HEALTH CARE – (CONTINUED) | |
| | Pharmaceuticals, Biotechnology & Life Sciences – (9.18%) | |
| | Agilent Technologies, Inc. * | | | | | | | |
| | | | | | | | | |
| | | | | | | | | |
| | | | | | | | | |
| | Roche Holding AG - Genusschein (Switzerland) | | | | | | | |
| | | 686,813,912 | |
| | | | | | |
| | INDUSTRIALS – (6.02%) | |
| | Capital Goods – (0.98%) | |
| | | | | | | | | |
| | | | | | | | | |
| | | 73,143,683 | |
| |
| | Commercial & Professional Services – (2.45%) | |
| | | | | | | | | |
| | | | | | | | | |
| | | 183,721,577 | |
| |
| | Transportation – (2.59%) | |
| | China Merchants Holdings International Co., Ltd. (China) | | | | | | | |
| | China Shipping Development Co. Ltd. - H (China) | | | | | | | |
| | Kuehne & Nagel International AG (Switzerland) | | | | | | | |
| | LLX Logistica S.A. (Brazil)* | | | | | | | |
| | PortX Operacoes Portuarias S.A. (Brazil)* | | | | | | | |
| | | 193,954,556 | |
| | | | | | |
| | INFORMATION TECHNOLOGY – (4.92%) | |
| | Semiconductors & Semiconductor Equipment – (1.73%) | |
| | | | | | | | | |
| | Software & Services – (2.43%) | |
| | Activision Blizzard, Inc. | | | | | | | |
| | | | | | | | | |
| | | | | | | | | |
| | | 181,688,660 | |
| |
| | Technology Hardware & Equipment – (0.76%) | |
| | | | | | | | | |
| | Total Information Technology | | | | |
| | MATERIALS – (8.21%) | |
| | Air Products and Chemicals, Inc. | | | | | | | |
| | BHP Billiton PLC (United Kingdom) | | | | | | | |
| | Martin Marietta Materials, Inc. | | | | | | | |
| | | | | | | | | |
| | Potash Corp. of Saskatchewan Inc. (Canada) | | | | | | | |
| | | | | | | | | |
| | Rio Tinto PLC (United Kingdom) | | | | | | | |
| | | | | | | | | |
| | Sino-Forest Corp. (Canada)* | | | | | | | |
| | Sino-Forest Corp., 144A (Canada)*(a)(b) | | | | | | | |
| SELECTED FUNDS | Schedule of Investments |
| SELECTED AMERICAN SHARES, INC. - (CONTINUED) | December 31, 2010 |
| | Shares/Principal | | Value (Note 1) |
COMMON STOCK – (CONTINUED) |
| | MATERIALS – (CONTINUED) |
| | | | | | | | |
| | | | | |
| | TELECOMMUNICATION SERVICES – (0.32%) |
| | America Movil SAB de C.V., Series L, ADR (Mexico) | | | | | | |
| | Total Telecommunication Services | | | |
| | | | | |
| | TOTAL COMMON STOCK – (Identified cost $4,374,357,551) | | | 7,173,232,788 |
| | | | | |
CONVERTIBLE BONDS – (0.40%) |
| | MATERIALS – (0.28%) |
| | Sino-Forest Corp., Conv. Sr. Notes, 5.00%, 08/01/13 (Canada)(b) | | | | | | |
| | | | | |
| | TELECOMMUNICATION SERVICES – (0.12%) |
| | Level 3 Communications, Inc., Conv. Sr. Notes, 15.00%, 01/15/13 | | | | | | |
| | Total Telecommunication Services | | | |
| | | | | |
| | TOTAL CONVERTIBLE BONDS – (Identified cost $23,365,000) | | | 29,771,559 |
| | | | | |
SHORT-TERM INVESTMENTS – (3.82%) |
| | COMMERCIAL PAPER – (2.49%) |
| | Intesa Funding LLC, 0.34%, 01/03/11 | | | | | | |
| | Intesa Funding LLC, 0.25%, 01/04/11 | | | | | | |
| | Intesa Funding LLC, 0.25%, 01/06/11 | | | | | | |
| | Societe Generale North America, Inc., 0.11%, 01/03/11 | | | | | | |
| | Societe Generale North America, Inc., 0.24%, 01/06/11 | | | | | | |
| | | | | |
| | REPURCHASE AGREEMENTS – (1.33%) |
| | Banc of America Securities LLC Joint Repurchase Agreement, 0.25%, 01/03/11, dated 12/31/10, repurchase value of $19,087,398 (collateralized by: U.S. Government agency mortgages in a pooled cash account, 2.104%-6.50%, 06/01/25-12/01/40, total market value $19,468,740) | | | | | | |
| | Goldman, Sachs & Co. Joint Repurchase Agreement, 0.16%, 01/03/11, dated 12/31/10, repurchase value of $22,904,305 (collateralized by: U.S. Government agency mortgages in a pooled cash account, 3.50%-6.50%, 12/01/25-01/01/41, total market value $23,362,080) | | | | | | |
| | Mizuho Securities USA Inc. Joint Repurchase Agreement, 0.24%, 01/03/11, dated 12/31/10, repurchase value of $57,261,145 (collateralized by: U.S. Government agency obligations in a pooled cash account, 3.125%-7.50%, 01/31/12-05/15/37, total market value $58,405,200) | | | | | | |
| | Total Repurchase Agreements | | | |
| | | |
| | TOTAL SHORT-TERM INVESTMENTS – (Identified cost $285,980,943) | 285,980,943 |
| | | |
| | | | | |
| | Total Investments – (100.08%) – (Identified cost $4,683,703,494) – (c) | | | 7,488,985,290 |
| | Liabilities Less Other Assets – (0.08%) | | | (5,883,674) |
| | Net Assets – (100.00%) | | $ | 7,483,101,616 |
| |
| |
| SELECTED FUNDS | Schedule of Investments |
| SELECTED AMERICAN SHARES, INC. - (CONTINUED) | December 31, 2010 |
| | ADR: American Depositary Receipt | |
| | | |
| | * | | Non-Income producing security. |
| | | | |
| | (a) | | These securities are subject to Rule 144A. The Board of Directors of the Fund has determined that there is sufficient liquidity in these securities to realize current valuations. These securities amounted to $19,545,349 or 0.26% of the Fund's net assets as of December 31, 2010. |
| | | | |
| | (b) | | Restricted Security – See Note 9 of the Notes to Financial Statements. |
| | | | |
| | (c) | | Aggregate cost for federal income tax purposes is $4,705,419,519. At December 31, 2010 unrealized appreciation (depreciation) of securities for federal income tax purposes is as follows: |
| | | | |
| | Unrealized appreciation | | $ | 2,898,245,391 |
| | Unrealized depreciation | | | (114,679,620) |
| | Net unrealized appreciation | | $ | 2,783,565,771 |
| |
| |
| See Notes to Financial Statements |
| SELECTED FUNDS | Schedule of Investments |
| SELECTED SPECIAL SHARES, INC. | December 31, 2010 |
| | Shares | | Value (Note 1) | |
| |
| | CONSUMER DISCRETIONARY – (7.69%) | |
| | Consumer Durables & Apparel – (2.61%) | |
| | Hunter Douglas NV (Netherlands) | | | | | | | |
| | Consumer Services – (3.35%) | |
| | | | | | | | | |
| | | | | | | | | |
| | | 3,059,081 | |
| |
| | Media – (1.73%) | |
| | Grupo Televisa S.A., ADR (Mexico)* | | | | | | | |
| | Total Consumer Discretionary | | | | |
| | CONSUMER STAPLES – (13.28%) | |
| | Food & Staples Retailing – (4.18%) | |
| | | | | | | | | |
| | Food, Beverage & Tobacco – (9.10%) | |
| | | | | | | | | |
| | Heineken Holding NV (Netherlands) | | | | | | | |
| | Kraft Foods Inc., Class A | | | | | | | |
| | Mead Johnson Nutrition Co. | | | | | | | |
| | Nestle S.A. (Switzerland) | | | | | | | |
| | | 8,316,189 | |
| | | | | | |
| | ENERGY – (6.29%) | |
| | | | | | | | | |
| | Occidental Petroleum Corp. | | | | | | | |
| | Tenaris S.A., ADR (Argentina) | | | | | | | |
| | | | | | | | | |
| | | | | | |
| | FINANCIALS – (14.46%) | |
| | Banks – (2.72%) | |
| | Commercial Banks – (2.72%) | |
| | Banco Santander Brasil S.A., ADS (Brazil) | | | | | | | |
| | | | | | | | | |
| | | | | | | | | |
| | | 2,484,127 | |
| |
| | Diversified Financials – (6.44%) | |
| | Capital Markets – (2.75%) | |
| | Bank of New York Mellon Corp. | | | | | | | |
| | | | | | | | | |
| | 2,514,776 | |
| |
| | Diversified Financial Services – (3.69%) | |
| | Oaktree Capital Group LLC, Class A (a) | | | | | | | |
| | | 5,887,276 | |
| |
| SELECTED FUNDS | Schedule of Investments |
| SELECTED SPECIAL SHARES, INC. - (CONTINUED) | December 31, 2010 |
| | Shares | | Value (Note 1) | |
COMMON STOCK – (CONTINUED) | |
| | FINANCIALS – (CONTINUED) | |
| | Insurance – (5.30%) | |
| | Property & Casualty Insurance – (4.29%) | |
| | Berkshire Hathaway Inc., Class B * | | | | | | | |
| | | | | | | | | |
| | 3,920,321 | |
| |
| | Reinsurance – (1.01%) | |
| | Transatlantic Holdings, Inc. | | | | | | | |
| | | 4,837,505 | |
| | | | | | |
| | HEALTH CARE – (18.82%) | |
| | Health Care Equipment & Services – (6.62%) | |
| | Baxter International Inc. | | | | | | | |
| | Becton, Dickinson and Co. | | | | | | | |
| | IDEXX Laboratories, Inc. * | | | | | | | |
| | | 6,047,555 | |
| |
| | Pharmaceuticals, Biotechnology & Life Sciences – (12.20%) | |
| | Agilent Technologies, Inc. * | | | | | | | |
| | | | | | | | | |
| | | | | | | | | |
| | | | | | | | | |
| | | 11,145,307 | |
| | | | | | |
| | INDUSTRIALS – (7.34%) | |
| | Capital Goods – (4.93%) | |
| | ABB Ltd., ADR (Switzerland) | | | | | | | |
| | Blount International, Inc. * | | | | | | | |
| | | | | | | | | |
| | | | | | | | | |
| | | 4,498,143 | |
| |
| | Commercial & Professional Services – (0.48%) | |
| | | | | | | | | |
| | Transportation – (1.93%) | |
| | | | | | | | | |
| | Kuehne & Nagel International AG (Switzerland) | | | | | | | |
| | | 1,764,347 | |
| | | | | | |
| | INFORMATION TECHNOLOGY – (17.95%) | |
| | Semiconductors & Semiconductor Equipment – (4.32%) | |
| | | | | | �� | | | |
| | | | | | | | | |
| | | 3,948,204 | |
| |
| | Software & Services – (11.31%) | |
| | Activision Blizzard, Inc. | | | | | | | |
| | | | | | | | | |
| | International Business Machines Corp. | | | | | | | |
| | | | | | | | | |
| | | | | | | | | |
| | Youku.com Inc., ADR (China)* | | | | | | | |
| | | 10,326,068 | |
| |
| SELECTED FUNDS | Schedule of Investments |
| SELECTED SPECIAL SHARES, INC. - (CONTINUED) | December 31, 2010 |
| | Shares/Principal | | Value (Note 1) | |
COMMON STOCK – (CONTINUED) | |
| | INFORMATION TECHNOLOGY – (CONTINUED) | |
| | Technology Hardware & Equipment – (2.32%) | |
| | | | | | | | | |
| | | | | | | | | |
| | | 2,118,601 | |
| | Total Information Technology | | | | |
| | MATERIALS – (10.75%) | |
| | | | | | | | | |
| | | | | | | | | |
| | | | | | | | | |
| | Sino-Forest Corp. (Canada)* | | | | | | | |
| | Yingde Gases Group Co. Ltd. (China)* | | | | | | | |
| | | | | | |
| | TELECOMMUNICATION SERVICES – (0.57%) | |
| | America Movil SAB de C.V., Series L, ADR (Mexico) | | | | | | | |
| | Total Telecommunication Services | | | | |
| | | | | | |
| | TOTAL COMMON STOCK – (Identified cost $70,277,817) | | | 88,738,817 | |
| | | | | | |
| |
| | FINANCIALS – (0.58%) | |
| | Banks – (0.58%) | |
| | Commercial Banks – (0.58%) | |
| | Wells Fargo & Co., strike price $34.01, expires 10/28/18 * | | | | | | | |
| | | | | | |
| | TOTAL STOCK WARRANTS – (Identified cost $378,644) | | | 528,836 | |
| | | | | | |
SHORT-TERM INVESTMENTS – (2.54%) | |
| | Banc of America Securities LLC Joint Repurchase Agreement, 0.25%, 01/03/11, dated 12/31/10, repurchase value of $446,009 (collateralized by: U.S. Government agency mortgages in a pooled cash account, 2.104%-6.50%, 06/01/25-12/01/40, total market value $454,920) | | | | | | | |
| | Goldman, Sachs & Co. Joint Repurchase Agreement, 0.16%, 01/03/11, dated 12/31/10, repurchase value of $536,007 (collateralized by: U.S. Government agency mortgages in a pooled cash account, 3.50%-6.50%, 12/01/25-01/01/41, total market value $546,720) | | | | | | | |
| | Mizuho Securities USA Inc. Joint Repurchase Agreement, 0.24%, 01/03/11, dated 12/31/10, repurchase value of $1,339,027 (collateralized by: U.S. Government agency obligations in a pooled cash account, 3.125%-7.50%, 01/31/12-05/15/37, total market value $1,365,780) | | | | | | | |
| | | | | | |
| | TOTAL SHORT-TERM INVESTMENTS – (Identified cost $2,321,000) | | | 2,321,000 | |
| | | | | | |
| | | | | | |
| | Total Investments – (100.27%) – (Identified cost $72,977,461) – (b) | | | 91,588,653 | |
| | Liabilities Less Other Assets – (0.27%) | | | (244,363) | |
| | Net Assets – (100.00%) | | $ | 91,344,290 | |
| |
| |
| SELECTED FUNDS | Schedule of Investments |
| SELECTED SPECIAL SHARES, INC. - (CONTINUED) | December 31, 2010 |
| | ADR: American Depositary Receipt | | |
| | | | |
| | ADS: American Depositary Share | | |
| | | | |
| | * | | Non-Income producing security. | |
| | | | | |
| | (a) | | Restricted Security – See Note 9 of the Notes to Financial Statements. | |
| | | | | |
| | (b) | | Aggregate cost for federal income tax purposes is $75,126,072. At December 31, 2010 unrealized appreciation (depreciation) of securities for federal income tax purposes is as follows: | |
| | | | | |
| | Unrealized appreciation | | $ | 18,815,040 | |
| | Unrealized depreciation | | | (2,352,459) | |
| | Net unrealized appreciation | | $ | 16,462,581 | |
| |
| |
| See Notes to Financial Statements | |
| SELECTED FUNDS | Schedule of Investments |
| SELECTED CAPITAL PRESERVATION TRUST – | December 31, 2010 |
| SELECTED DAILY GOVERNMENT FUND | |
| | Principal | | Value (Note 1) |
|
| | | | | | | | |
| | | | | |
| | TOTAL FANNIE MAE – (Identified cost $72,526) | | | 72,526 |
| | | | | |
FEDERAL FARM CREDIT BANK – (4.84%) |
| | | | | | | | |
| | | | | | | | |
| | | | | | | | |
| | | | | | | | |
| | | | | | | | |
| | | | | | | | |
| | | |
| | TOTAL FEDERAL FARM CREDIT BANK – (Identified cost $1,311,639) | 1,311,639 |
| | | |
FEDERAL HOME LOAN BANK – (29.75%) |
| | | | | | | | |
| | | | | | | | |
| | | | | | | | |
| | | | | | | | |
| | | | | | | | |
| | | | | | | | |
| | | | | | | | |
| | | | | | | | |
| | | | | | | | |
| | | | | | | | |
| | | | | | | | |
| | | | | | | | |
| | | | | | | | |
| | | | | | | | |
| | | | | | | | |
| | | | | | | | |
| | | | | | | | |
| | | | | | | | |
| | | | | | | | |
| | | | | | | | |
| | | | | | | | |
| | | | | | | | |
| | | | | | | | |
| | | | | | | | |
| | | | | | | | |
| | | | | | | | |
| | | | | | | | |
| | | | | |
| | TOTAL FEDERAL HOME LOAN BANK – (Identified cost $8,067,261) | | | 8,067,261 |
| | | | | |
| SELECTED FUNDS | Schedule of Investments |
| SELECTED CAPITAL PRESERVATION TRUST – | December 31, 2010 |
| SELECTED DAILY GOVERNMENT FUND - (CONTINUED) | |
| | Principal | | Value (Note 1) | |
| |
| | | | | | | | | |
| | | | | | | | | |
| | | | | | | | | |
| | | | | | | | | |
| | | | | | | | | |
| | | | | | | | | |
| | | | | | | | | |
| | | | | | | | | |
| | | | | | | | | |
| | | | | | | | | |
| | | | | | | | | |
| | | | | | | | | |
| | | | | | |
| | TOTAL FREDDIE MAC – (Identified cost $4,143,506) | | | 4,143,506 | |
| | | | | | |
REPURCHASE AGREEMENTS – (49.63%) | |
| | Banc of America Securities LLC Joint Repurchase Agreement, 0.25%, 01/03/11, dated 12/31/10, repurchase value of $2,588,054 (collateralized by: U.S. Government agency mortgages in a pooled cash account, 2.104%-6.50%, 06/01/25-12/01/40, total market value $2,639,760) | | | | | | | |
| | Goldman, Sachs & Co. Joint Repurchase Agreement, 0.16%, 01/03/11, dated 12/31/10, repurchase value of $3,106,041 (collateralized by: U.S. Government agency mortgages in a pooled cash account, 3.50%-6.50%, 12/01/25-01/01/41, total market value $3,168,120) | | | | | | | |
| | Mizuho Securities USA Inc. Joint Repurchase Agreement, 0.24%, 01/03/11, dated 12/31/10, repurchase value of $7,765,155 (collateralized by: U.S. Government agency obligations in a pooled cash account, 3.125%-7.50%, 01/31/12-05/15/37, total market value $7,920,300) | | | | | | | |
| | | | | | |
| | TOTAL REPURCHASE AGREEMENTS – (Identified cost $13,459,000) | | | 13,459,000 | |
| | | | | | |
| | | | | | |
| | Total Investments – (99.77%) – (Identified cost $27,053,932) – (c) | | | 27,053,932 | |
| | Other Assets Less Liabilities – (0.23%) | | | 61,037 | |
| | Net Assets – (100.00%) | | $ | 27,114,969 | |
| |
| |
| | (a) | The interest rates on floating rate securities, shown as of December 31, 2010, may change daily or less frequently and are based on indices of market interest rates. For purposes of amortized cost valuation, the maturity dates of these securities are considered to be the effective maturities, based on the reset dates of the securities' variable rates. | |
| | | | |
| | (b) | Zero coupon bonds reflect the effective yield on the date of purchase. | |
| | | | |
| | (c) | Aggregate cost for federal income tax purposes is $27,053,932. | |
| | | | |
See Notes to Financial Statements | |
| SELECTED FUNDS | Statements of Assets and Liabilities |
| | At December 31, 2010 |
| | | | | | | | | | | |
| | | | Selected American Shares | | | Selected Special Shares | | | Selected Daily Government Fund |
| ASSETS: | | | | | | | | | |
| Investments in securities at value* (see accompanying Schedules of Investments) | | $ | 7,488,985,290 | | $ | 91,588,653 | | $ | 27,053,932 |
| Cash | | | 85,089 | | | 2,622 | | | 13,544 |
| Receivables: | | | | | | | | | |
| | Capital stock sold | | | 9,400,718 | | | 66,838 | | | 82,713 |
| | Dividends and interest | | | 8,918,561 | | | 114,191 | | | 45,520 |
| | Investment securities sold | | | 368,787 | | | 18,439 | | | – |
| Prepaid expenses | | | 180,659 | | | 3,163 | | | 1,809 |
| Due from Adviser | | | – | | | – | | | 14,100 |
| | Total assets | | | 7,507,939,104 | | | 91,793,906 | | | 27,211,618 |
| | | | | | | | | | |
| LIABILITIES: | | | | | | | | | |
| Payables: | | | | | | | | | |
| | Capital stock redeemed | | | 17,409,308 | | | 60,922 | | | 67,026 |
| | Distributions payable | | | – | | | – | | | 156 |
| | Investment securities purchased | | | 2,088,031 | | | 306,882 | | | – |
| Accrued distribution service fees | | | 772,077 | | | 4,338 | | | – |
| Accrued management fees | | | 3,476,724 | | | 44,044 | | | 7,115 |
| Accrued transfer agent fees | | | 858,969 | | | 15,554 | | | 4,957 |
| Other accrued expenses | | | 232,379 | | | 17,876 | | | 17,395 |
| | Total liabilities | | | 24,837,488 | | | 449,616 | | | 96,649 |
| | | | | | | | | | |
| NET ASSETS | | $ | 7,483,101,616 | | $ | 91,344,290 | | $ | 27,114,969 |
| | | | | | | | | | |
| NET ASSETS CONSIST OF: | | | | | | | | | |
| Par value of shares of capital stock | | $ | 225,804,144 | | $ | 2,073,753 | | $ | 2,711,497 |
| | | | | | | | | | |
| Additional paid-in capital | | | 5,099,779,296 | | | 83,592,546 | | | 24,403,472 |
| | | | | | | | | | |
| Undistributed (overdistributed) net investment income | | | (30,548,243) | | | 122,343 | | | – |
| | | | | | | | | | |
| Accumulated net realized losses from investments | | | (617,512,281) | | | (13,058,915) | | | – |
| | | | | | | | | | |
| Net unrealized appreciation on investments and foreign currency transactions | | | 2,805,578,700 | | | 18,614,563 | | | – |
| | Net Assets | | $ | 7,483,101,616 | | $ | 91,344,290 | | $ | 27,114,969 |
| | | | | | | | | | | |
| *Including: | | | | | | | | | |
| | Cost of investments | | $ | 4,683,703,494 | | $ | 72,977,461 | | $ | 27,053,932 |
| | | | | | | | | | |
| | Cost and market value of repurchase agreements (if greater than 10% of net assets) | | | – | | | – | | | 13,459,000 |
| | | | | | | | | | | |
| | | | | | | | | | | |
| SELECTED FUNDS | Statements of Assets and Liabilities – (Continued) |
| | At December 31, 2010 |
| | | | Selected American Shares | | | Selected Special Shares | | | Selected Daily Government Fund | |
| CLASS S SHARES: | | | | | | | | | | |
| | Net assets | | $ | 3,548,690,108 | | $ | 18,206,771 | | $ | 3,645,296 | |
| | Shares outstanding | | | 85,633,308 | | | 1,655,230 | | | 3,645,296 | |
| | Net asset value, offering, and redemption price per share (Net assets ÷ Shares outstanding) | | $ | 41.44 | | $ | 11.00 | | $ | 1.00 | |
| | | | | | | | | | | |
| CLASS D SHARES: | | | | | | | | | | |
| | Net assets | | $ | 3,934,411,508 | | $ | 73,137,519 | | $ | 23,469,673 | |
| | Shares outstanding | | | 95,010,007 | | | 6,639,783 | | | 23,469,673 | |
| | Net asset value, offering, and redemption price per share (Net assets ÷ Shares outstanding) | | $ | 41.41 | | $ | 11.02 | | $ | 1.00 | |
| | | | | | | | | | | | |
| | | | | | | | | | | | |
| See Notes to Financial Statements |
| SELECTED FUNDS | Statements of Operations |
| | For the year ended December 31, 2010 |
| | | | | | | | | | | | |
| | | | Selected American Shares | | | Selected Special Shares | | | Selected Daily Government Fund | |
| INVESTMENT INCOME: | |
| Income: | | | | | | | | | | |
| Dividends* | | $ | 119,354,828 | | $ | 1,758,709 | | $ | – | |
| Interest | | | 12,459,009 | | | 47,440 | | | 81,839 | |
| Net lending fees | | | 188,949 | | | – | | | – | |
| | Total income | | | 132,002,786 | | | 1,806,149 | | | 81,839 | |
| | | | | | | | | | | | |
| Expenses: | | | | | | | | | | |
| Management fees (Note 3) | | | 40,716,332 | | | 462,654 | | | 82,429 | |
| Custodian fees | | | 1,098,334 | | | 34,168 | | | 13,773 | |
| Transfer agent fees: | |
| | Class S | | | 4,482,391 | | | 49,470 | | | 17,074 | |
| | Class D | | | 1,144,168 | | | 36,720 | | | 11,877 | |
| Audit fees | | | 56,400 | | | 20,400 | | | 16,800 | |
| Legal fees | | | 87,253 | | | 5,773 | | | 5,285 | |
| Reports to shareholders | | | 770,648 | | | 8,834 | | | 1,944 | |
| Directors’ fees and expenses | | | 545,920 | | | 8,741 | | | 4,911 | |
| Registration and filing fees | | | 72,298 | | | 32,620 | | | 36,459 | |
| Excise tax expense (Note 1) | | | – | | | 5,408 | | | 881 | |
| Miscellaneous | | | 261,729 | | | 12,195 | | | 6,561 | |
| Payments under distribution plan (Note 7): | |
| | Class S | | | 9,928,551 | | | 44,648 | | | 9,985 | |
| Total expenses | | | 59,164,024 | | | 721,631 | | | 207,979 | |
| Expenses paid indirectly (Note 4) | | | (166) | | | (24) | | | (9) | |
| | | | | | | | | | | |
| Reimbursement/waiver of expenses by Adviser/Distributor (Notes 3 and 7) | | | – | | | – | | | (147,725) | |
| | Net expenses | | | 59,163,858 | | | 721,607 | | | 60,245 | |
| Net investment income | | | 72,838,928 | | | 1,084,542 | | | 21,594 | |
| | | | | | | | | | | | |
REALIZED & UNREALIZED GAIN (LOSS) ON INVESTMENTS AND FOREIGN CURRENCY TRANSACTIONS: | | |
| Net realized gain (loss) from: | | | | | | | | | | |
| | Investment transactions | | | 596,580,439 | | | 3,109,997 | | | – | |
| | Foreign currency transactions | | | (174,391) | | | 7,741 | | | – | |
| Net realized gain | | | 596,406,048 | | | 3,117,738 | | | – | |
| Net increase in unrealized appreciation | | | 184,564,141 | | | 7,236,815 | | | – | |
| | Net realized and unrealized gain on investments and foreign currency transactions | | | 780,970,189 | | | 10,354,553 | | | – | |
Net increase in net assets resulting from operations | | $ | 853,809,117 | | $ | 11,439,095 | | $ | 21,594 | |
| | | | | | | | | | | | |
| *Net of foreign taxes withheld as follows | | $ | 1,954,743 | | $ | 90,554 | | $ | – | |
| | | | | | | | | | | | |
| |
| See Notes to Financial Statements |
| SELECTED FUNDS | Statements of Changes in Net Assets |
| | For the year ended December 31, 2010 |
| | | | Selected American Shares | | | Selected Special Shares | | | Selected Daily Government Fund | |
| | | | | | | | | | | | | |
| OPERATIONS: |
| Net investment income | | $ | 72,838,928 | | $ | 1,084,542 | | $ | 21,594 | |
| | | | | | | | | | | |
Net realized gain from investments and foreign currency transactions | | | 596,406,048 | | | 3,117,738 | | | – | |
| | | | | | | | | | | |
Net increase in unrealized appreciation on investments and foreign currency transactions | | | 184,564,141 | | | 7,236,815 | | | – | |
| | Net increase in net assets resulting from operations | | | 853,809,117 | | | 11,439,095 | | | 21,594 | |
| | | | | | | | | | | | | |
| DIVIDENDS AND DISTRIBUTIONS TO SHAREHOLDERS FROM: | | | |
| Net investment income: | | | | | | | | | | | |
| | Class S | | | (42,002,049) | | | (193,435) | | | (3,195) | |
| | Class D | | | (58,415,003) | | | (1,054,966) | | | (18,399) | |
| | | | | | | | | | | | | |
| CAPITAL SHARE TRANSACTIONS: |
| Net decrease in net assets resulting from capital share transactions (Note 5): | | | | | | | | | | | |
| | Class S | | | (1,548,697,217) | | | (2,984,529) | | | (88,155) | |
| | Class D | | | (117,718,783) | | | (2,168,819) | | | (57,712) | |
| | | | | | | | | | | | |
| | Total increase (decrease) in net assets | | | (913,023,935) | | | 5,037,346 | | | (145,867) | |
| | | | | | | | | | | | | |
| NET ASSETS: |
| Beginning of year | | | 8,396,125,551 | | | 86,306,944 | | | 27,260,836 | |
End of year* | | $ | 7,483,101,616 | | $ | 91,344,290 | | $ | 27,114,969 | |
| | | | | | | | | | | | | |
| *Including undistributed (overdistributed) net investment income of | | $ | (30,548,243) | | $ | 122,343 | | $ | – | |
| | | | | | | | | | | | | |
| See Notes to Financial Statements |
| SELECTED FUNDS | Statements of Changes in Net Assets |
| | For the year ended December 31, 2009 |
| | | | Selected American Shares | | | Selected Special Shares | | | Selected Daily Government Fund | |
| | | | | | | | | | | | | |
| OPERATIONS: |
| Net investment income | | $ | 72,873,478 | | $ | 541,151 | | $ | 147,189 | |
| | | | | | | | | | | |
| Net realized loss from investments and foreign currency transactions | | | (820,578,816) | | | (7,214,739) | | | – | |
| | | | | | | | | | | |
| Net change in unrealized appreciation (depreciation) on investments and foreign currency transactions | | | 2,781,165,680 | | | 33,700,405 | | | – | |
| | Net increase in net assets resulting from operations | | | 2,033,460,342 | | | 27,026,817 | | | 147,189 | |
| | | | | | | | | | | | | |
DIVIDENDS AND DISTRIBUTIONS TO SHAREHOLDERS FROM: | | | |
| Net investment income: | | | | | | | | | | | |
| | Class S | | | (36,762,782) | | | (52,579) | | | (8,866) | |
| | Class D | | | (37,108,020) | | | (440,887) | | | (138,323) | |
| | | | | | | | | | | | | |
| CAPITAL SHARE TRANSACTIONS: |
| Net decrease in net assets resulting from capital share transactions (Note 5): | | | | | | | | | | | |
| | Class S | | | (863,944,809) | | | (2,611,779) | | | (510,481) | |
| | Class D | | | (60,905,184) | | | (1,054,695) | | | (43,775,612) | |
| | | | | | | | | | | | |
| | Total increase (decrease) in net assets | | | 1,034,739,547 | | | 22,866,877 | | | (44,286,093) | |
| | | | | | | | | | | | | |
| NET ASSETS: |
| Beginning of year | | | 7,361,386,004 | | | 63,440,067 | | | 71,546,929 | |
End of year* | | $ | 8,396,125,551 | | $ | 86,306,944 | | $ | 27,260,836 | |
| | | | | | | | | | | | | |
| *Including overdistributed net investment income of | | $ | (3,309,052) | | $ | (38,915) | | $ | – | |
| | | | | | | | | | | | | |
| See Notes to Financial Statements |
| SELECTED FUNDS | Notes to Financial Statements |
| | December 31, 2010 |
NOTE 1 - SUMMARY OF SIGNIFICANT ACCOUNTING POLICIES
The Selected Funds (“Funds”) consist of Selected American Shares, Inc. (a Maryland corporation) (“Selected American Shares”), Selected Special Shares, Inc. (a Maryland corporation) (“Selected Special Shares”), and Selected Capital Preservation Trust (an Ohio corporation) (“Trust”). The Trust consists of Selected Daily Government Fund. The Funds and Trust are registered under the Investment Company Act of 1940 (“40 Act”), as amended, as diversified, open-end management investment companies. The following is a summary of significant accounting policies followed by the Funds in the preparation of their financial statements.
Selected American Shares’ investment objective is to achieve both capital growth and income. The Fund primarily invests in equity securities issued by large companies with market capitalizations of at least $10 billion.
Selected Special Shares’ investment objective is capital growth. The Fund invests in a diversified portfolio of small, mid, and large capitalization companies.
Selected Daily Government Fund’s investment objective is to provide as high a level of current income as possible from the type of short-term investments in which it invests, consistent with prudent investment management, stability of principal, and maintenance of liquidity.
Selected Daily Government Fund invests exclusively in U.S. Treasury securities, U.S. Government agency securities, U.S. Government agency mortgage securities (collectively “U.S. Government Securities”), and repurchase agreements collateralized by U.S. Government Securities. The Fund seeks to maintain liquidity and preserve capital by carefully monitoring the maturity of its investments. The Fund’s portfolio maintains a dollar-weighted average maturity of sixty days or less.
An investment in any of the Funds, as with any mutual fund, includes risks that vary depending upon the Funds’ investment objectives and policies. There is no assurance that the investment objective of any Fund will be achieved. The Funds’ return and net asset value will fluctuate, although Selected Daily Government Fund seeks to maintain a net asset value of $1.00 per share.
Class S and Class D shares are sold at net asset value. Income, expenses (other than those attributable to a specific class), and gains and losses are allocated daily to each class of shares based on the relative proportion of net assets represented by each class. Operating expenses directly attributable to a specific class are charged against the operations of that class. All classes have identical rights with respect to voting (exclusive of each class’ distribution arrangement), liquidation, and distributions.
Security Valuation - The Funds calculate the net asset value of their shares as of the close of the New York Stock Exchange (“Exchange”), normally 4:00 P.M. Eastern time, on each day the Exchange is open for business. Securities listed on the Exchange (and other national exchanges) are valued at the last reported sales price on the day of valuation. Securities traded in the over-the-counter market (e.g. NASDAQ) and listed securities for which no sale was reported on that date are stated at the last quoted bid price. Securities traded on foreign exchanges are valued based upon the last sales price on the principal exchange on which the security is traded prior to the time when the Funds’ assets are valued. Securities (including restricted securities) for which market quotations are not readily available are valued at their fair value. Securities whose values have been materially affected by what Davis Selected Advisers, L.P. (“Adviser”), the Funds’ investment adviser, identifies as a significant event occurring before the Funds’ assets are valued but after the close of their respective exchanges will be fair valued. Fair value is determined in good faith using consistently applied procedures under the supervision of the Board of Directors/Trustees. Short-term securities purchased within 60 days to maturity are valued at amortized cost, which approximates market value. For Selected Daily Government Fund, in compliance with Rule 2a-7 of the 40 Act, securities are valued at amortized cost, which approximates market value. These valuation procedures are reviewed and subject to approval by the Board of Directors/Trustees.
| SELECTED FUNDS | Notes to Financial Statements – (Continued) |
| | December 31, 2010 |
NOTE 1 - SUMMARY OF SIGNIFICANT ACCOUNTING POLICIES – (CONTINUED)
Value Measurements - Fair value is defined as the price that the Funds would receive upon selling an investment in an orderly transaction to an independent buyer in the principal or most advantageous market for the investment. Various inputs are used to determine the fair value of the Funds’ investments. These inputs are summarized in the three broad levels listed below.
Level 1 – quoted prices in active markets for identical securities
Level 2 – other significant observable inputs (including quoted prices for similar investments, interest rates, prepayment speeds, credit risk, etc.)
| Level 3 – significant unobservable inputs (including Fund’s own assumptions in determining the fair value of investments) |
The inputs or methodology used for valuing securities are not necessarily an indication of the risk associated with investing in those securities. Money market securities are valued using amortized cost, in accordance with rules under the 40 Act. Generally, amortized cost approximates the current fair value of a security, but since the value is not obtained from a quoted price in an active market, such securities are reflected as Level 2.
The following is a summary of the inputs used as of December 31, 2010 in valuing each Fund’s investments carried at value:
| | Investments in Securities at Value |
| | | | | | Selected |
| | Selected | | Selected | | Daily |
| | American | | Special | | Government |
| | Shares | | Shares | | Fund |
| Valuation inputs | | | | | | | | |
| Level 1 – Quoted prices: | | | | | | | | |
Equity securities: | | | | | | | | |
| Consumer discretionary | $ | 396,972,285 | | $ | 7,024,152 | | $ | – |
| Consumer staples | | 1,211,013,945 | | | 12,134,283 | | | – |
| Energy | | 1,135,952,650 | | | 5,744,133 | | | – |
| Financials | | 2,025,511,599 | | | 10,365,244 | | | – |
| Health care | | 946,509,294 | | | 17,192,862 | | | – |
| Industrials | | 450,819,816 | | | 6,701,816 | | | – |
| Information technology | | 368,029,130 | | | 16,392,873 | | | – |
| Materials | | 614,392,875 | | | 9,823,730 | | | – |
| Telecommunication services | | 24,031,194 | | | 516,060 | | | – |
| Total Level 1 | | 7,173,232,788 | | | 85,895,153 | | | – |
| | | | | | | | | |
| Level 2 – Other Significant Observable Inputs: | | | | | | | | |
| Short-term debt securities issued by U.S. Treasuries and U.S. Government corporations and agencies | | – | | | – | | | 13,594,932 |
| Convertible debt securities | | 29,771,559 | | | – | | | – |
Equity securities: | | | | | | | | |
| Financials | | – | | | 3,372,500 | | | – |
| Short-term securities | | 285,980,943 | | | 2,321,000 | | | 13,459,000 |
| Total Level 2 | | 315,752,502 | | | 5,693,500 | | | 27,053,932 |
| | | | | | | | | |
| Level 3 – Significant Unobservable Inputs: | | – | | | – | | | – |
| Total | $ | 7,488,985,290 | | $ | 91,588,653 | | $ | 27,053,932 |
| | | | | | | | | |
| SELECTED FUNDS | Notes to Financial Statements – (Continued) |
| | December 31, 2010 |
NOTE 1 - SUMMARY OF SIGNIFICANT ACCOUNTING POLICIES – (CONTINUED)
Value Measurements – (Continued)
| | | | | | Selected |
| | Selected | | Selected | | Daily |
| | American | | Special | | Government |
| | Shares | | Shares | | Fund |
Level 2 to Level 1 transfers*: | | | | | | | | |
| Consumer discretionary | $ | 15,630,344 | | $ | 2,385,934 | | $ | – |
| Consumer staples | | 181,675,300 | | | 1,350,183 | | | – |
| Energy | | 64,361,305 | | | – | | | – |
| Financials | | 93,214,341 | | | – | | | – |
| Industrials | | 188,598,207 | | | 1,732,406 | | | – |
| Materials | | 104,211,368 | | | – | | | – |
| Total | $ | 647,690,865 | | $ | 5,468,523 | | $ | – |
*Application of fair value procedures for securities traded on foreign exchanges triggered transfers between Level 1 and Level 2 assets during the year ended December 31, 2010.
Master Repurchase Agreements - The Funds, along with other affiliated funds, may transfer uninvested cash balances into one or more master repurchase agreement accounts. These balances are invested in one or more repurchase agreements, secured by U.S. Government securities. A custodian bank holds securities pledged as collateral for repurchase agreements until the agreements mature. Each agreement requires that the market value of the collateral be sufficient to cover payments of interest and principal; however, in the event of default by the other party to the agreement, retention of the collateral may be subject to legal proceedings.
Currency Translation - The market values of all assets and liabilities denominated in foreign currencies are recorded in the financial statements after translation to the U.S. Dollar based upon the mean between the bid and offered quotations of the currencies against U.S. Dollars on the date of valuation. The cost basis of such assets and liabilities is determined based upon historical exchange rates. Income and expenses are translated at average exchange rates in effect as accrued or incurred.
Foreign Currency - The Funds may enter into forward purchases or sales of foreign currencies to hedge certain foreign currency denominated assets and liabilities against declines in market value relative to the U.S. Dollar. Forward currency contracts are marked-to-market daily and the change in market value is recorded by the Funds as an unrealized gain or loss. When the forward currency contract is closed, the Funds record a realized gain or loss equal to the difference between the value of the forward currency contract at the time it was opened and value at the time it was closed. Investments in forward currency contracts may expose the Funds to risks resulting from unanticipated movements in foreign currency exchange rates or failure of the counter-party to the agreement to perform in accordance with the terms of the contract.
Reported net realized foreign exchange gains or losses arise from the sales of foreign currencies, currency gains or losses realized between the trade and settlement dates on securities transactions, the difference between the amounts of dividends, interest, and foreign withholding taxes recorded on the Funds’ books, and the U.S. Dollar equivalent of the amounts actually received or paid. Net unrealized foreign exchange gains and losses arise from changes in the value of assets and liabilities other than investments in securities at fiscal year end, resulting from changes in the exchange rate. The Funds include foreign currency gains and losses realized on the sale of investments together with market gains and losses on such investments in the Statements of Operations.
| SELECTED FUNDS | Notes to Financial Statements – (Continued) |
| | December 31, 2010 |
NOTE 1 - SUMMARY OF SIGNIFICANT ACCOUNTING POLICIES – (CONTINUED)
Federal Income Taxes - It is each Fund’s policy to comply with the requirements of the Internal Revenue Code applicable to regulated investment companies, and to distribute substantially all of its taxable income, including any net realized gains on investments not offset by loss carryovers, to shareholders. Therefore, no provision for federal income tax is required. Selected Special Shares and Selected Daily Government Fund incurred a 2009 excise tax liability of $5,408 and $881, respectively, during the year ended December 31, 2010. The Adviser has analyzed the Funds’ tax positions taken on federal and state income tax returns for all open tax years and has concluded that as of December 31, 2010, no provision for income tax would be required in the Funds’ financial statements related to those tax positions. The Funds’ federal and state (Arizona and Maryland) income and federal excise tax returns for tax years for which the applicable statutes of limitations have not expired are subject to examination by the Internal Revenue Service and state departments of revenue. The earliest tax year that remains subject to examination by these jurisdictions is 2007. The Funds have available for federal income tax purposes unused capital loss carryforwards as follows:
| | Capital Loss Carryforwards | |
| | | | | |
| | Selected American Shares | | Selected Special Shares | |
| Expiring | | | | | | |
| 12/31/2016 | $ | – | | $ | 1,725,000 | |
| 12/31/2017 | | 617,525,000 | | | 10,261,000 | |
| Total | $ | 617,525,000 | | $ | 11,986,000 | |
| Utilized in 2010 | $ | 497,393,000 | | $ | 3,115,000 | |
The Regulated Investment Company Modernization Act of 2010 (the “Act”) was enacted on December 22, 2010. The Act makes changes to several tax rules impacting the Funds. In general, the provisions of the Act will be effective for the Funds’ fiscal year ending December 31, 2011. Although the Act provides several benefits, including the unlimited carryforward of future capital losses, there may be a greater likelihood that all, or a portion, of each Fund’s pre-enactment capital loss carryforwards may expire without being utilized due to the fact that post-enactment capital losses get utilized before pre-enactment capital loss carryforwards. Relevant information regarding the impact of the Act on the Funds, if any, will be contained within the “Federal Income Taxes” section of the Notes to Financial Statements for the fiscal year ending December 31, 2011.
Securities Transactions and Related Investment Income - Securities transactions are accounted for on the trade date (date the order to buy or sell is executed) with realized gain or loss on the sale of securities being determined based upon identified cost. Dividend income is recorded on the ex-dividend date. Interest income, which includes accretion of discount and amortization of premium, is accrued as earned.
Dividends and Distributions to Shareholders - Dividends and distributions to shareholders are recorded on the ex-dividend date. Net investment income (loss), net realized gains (losses), and net unrealized appreciation (depreciation) on investments may differ for financial statement and tax purposes primarily due to differing treatments of wash sales, foreign currency transactions, net operating losses, passive foreign investment company shares, and partnership income. The character of dividends and distributions made during the fiscal year from net investment income and net realized securities gains may differ from their ultimate characterization for federal income tax purposes. Also, due to the timing of dividends and distributions, the fiscal year in which amounts are distributed may differ from the fiscal year in which income or realized gain was recorded by the Funds. The Funds adjust certain components of capital to reflect permanent differences between financial statement amounts and net income and realized gains/losses determined in accordance with income tax rules. Accordingly, during the year ended December 31, 2010, for Selected American Shares, amounts have been reclassified to reflect a decrease in overdistributed net investment income of $338,933, a decrease in accumulated net realized losses from investments and foreign currency transactions of $15,144, and a decrease in paid in capital of $354,077; for Selected Special Shares, amounts have been reclassified to reflect an increase in undistributed net investment income of $325,117, an increase in accumulated net realized losses from investments and foreign currency transactions of $319,716, and a decrease in paid in capital of $5,401. The Funds’ net assets have not been affected by these reclassifications.
| SELECTED FUNDS | Notes to Financial Statements – (Continued) |
| | December 31, 2010 |
NOTE 1 - SUMMARY OF SIGNIFICANT ACCOUNTING POLICIES – (CONTINUED)
Dividends and Distributions to Shareholders - (Continued)
The tax character of distributions paid during the years ended December 31, 2010 and 2009 was as follows:
| | Ordinary Income | | Long-Term Capital Gain | | Return of Capital | | Total | |
| Selected American Shares | | | | | | | | | | | | |
| 2010 | $ | 100,417,052 | | $ | − | | $ | − | | $ | 100,417,052 | |
| 2009 | | 73,870,802 | | | − | | | − | | | 73,870,802 | |
| | | | | | | | | | | | | |
| Selected Special Shares | | | | | | | | | | | | |
| 2010 | | 1,248,401 | | | − | | | − | | | 1,248,401 | |
| 2009 | | 493,466 | | | − | | | − | | | 493,466 | |
| | | | | | | | | | | | | |
| Selected Daily Government Fund | | | | | | | | | | | | |
| 2010 | | 21,594 | | | − | | | − | | | 21,594 | |
| 2009 | | 147,189 | | | − | | | − | | | 147,189 | |
As of December 31, 2010, the components of distributable earnings (accumulated losses) on a tax basis were as follows:
| | Selected American Shares | | Selected Special Shares | |
Undistributed (overdistributed) net investment income | $ | (6,243,631) | | $ | 1,234,181 | |
Accumulated net realized losses from investments and foreign currency transactions | | (617,525,073) | | | (11,985,710) | |
| Net unrealized appreciation on investments | | 2,783,862,674 | | | 16,465,952 | |
| Total | $ | 2,160,093,970 | | $ | 5,714,423 | |
| | | | | | | |
| | | | | | | |
Indemnification - Under the Funds’ organizational documents, their officers and directors are indemnified against certain liabilities arising out of the performance of their duties to the Funds. In addition, some of the Funds’ contracts with their service providers contain general indemnification clauses. The Funds’ maximum exposure under these arrangements is unknown since the amount of any future claims that may be made against the Funds cannot be determined and the Funds have no historical basis for predicting the likelihood of any such claims.
Use of Estimates in Financial Statements - In preparing financial statements in conformity with accounting principles generally accepted in the United States of America, management makes estimates and assumptions that affect the reported amounts of assets and liabilities and disclosure of contingent assets and liabilities at the date of the financial statements, as well as the reported amounts of income and expenses during the reporting period. Actual results may differ from these estimates.
Directors/Trustees Fees and Expenses - The Funds set up a Rabbi Trust to provide for the deferred compensation plan for Independent Directors/Trustees that enables them to elect to defer receipt of all or a portion of annual fees they are entitled to receive. The value of an eligible Director’s/Trustee’s account is based upon years of service and fees paid to each Director/Trustee during the years of service. The amount paid to the Director/Trustee by the Trust under the plan will be determined based upon the performance of the Selected Funds in which the amounts are invested.
| SELECTED FUNDS | Notes to Financial Statements – (Continued) |
| | December 31, 2010 |
NOTE 2 - PURCHASES AND SALES OF SECURITIES
The cost of purchases and proceeds from sales of investment securities (excluding short-term securities) during the year ended December 31, 2010 were as follows:
| | Selected American Shares | | Selected Special Shares | |
| Cost of purchases | $ | 643,893,258 | | $ | 23,140,877 | |
| Proceeds of sales | | 2,491,381,893 | | | 24,511,538 | |
NOTE 3 - INVESTMENT ADVISORY FEES AND OTHER TRANSACTIONS WITH AFFILIATES
Advisory fees are paid monthly to the Adviser. The annual rate for Selected American Shares is 0.55% of the average net assets for the first $3 billion, 0.54% on the next $1 billion, 0.53% on the next $1 billion, 0.52% on the next $1 billion, 0.51% on the next $1 billion, 0.50% on the next $3 billion, and 0.485% of the average net assets in excess of $10 billion. Advisory fees paid during the year ended December 31, 2010 approximated 0.53% of average net assets for Selected American Shares. The fixed annual rate for Selected Special Shares is 0.55% of the average net assets. The fixed annual rate for the Selected Daily Government Fund is 0.30% of the average net assets. The Adviser is contractually committed to waive fees and/or reimburse Selected Daily Government Fund’s expenses to the extent necessary to cap total annual operating expenses at 0.50% for Class S and D shares. The Adviser also agrees to waive some or all of its advisory fee and to reimburse expenses to the extent necessary so that the Fund’s investment income will not be less than zero until May 1, 2011. During the year ended December 31, 2010, such waivers and reimbursements amounted to $32,918 and $104,822 for Class S and Class D shares, respectively.
Boston Financial Data Services, Inc. (“BFDS”) is the Funds’ primary transfer agent. The Adviser is also paid for certain transfer agent services. The fee paid to the Adviser for the year ended December 31, 2010 was $231,492, $13,781, and $4,241 for Selected American Shares, Selected Special Shares, and Selected Daily Government Fund, respectively. State Street Bank and Trust Company (“State Street Bank”) is the Funds’ primary accounting provider. Fees for such services are included in the custodian fee as State Street Bank also serves as the Funds’ custodian. Certain Directors/Trustees and Officers of the Funds are also Directors/Trustees and Officers of the general partner of the Adviser.
Davis Selected Advisers-NY, Inc. (“DSA-NY”), a wholly-owned subsidiary of the Adviser, acts as sub-adviser to the Funds. DSA-NY performs research and portfolio management services for the Funds under a Sub-Advisory Agreement with the Adviser. The Funds pay no fees directly to DSA-NY.
NOTE 4 - EXPENSES PAID INDIRECTLY
Under an agreement with State Street Bank, custodian fees are reduced for earnings on cash balances maintained at the custodian by the Funds. Such reductions amounted to $166, $24, and $9 for Selected American Shares, Selected Special Shares, and Selected Daily Government Fund, respectively, during the year ended December 31, 2010.
| SELECTED FUNDS | Notes to Financial Statements – (Continued) |
| | December 31, 2010 |
NOTE 5 - CAPITAL STOCK
At December 31, 2010, there were 600 million shares of capital stock of Selected American Shares ($1.25 par value per share) authorized. At December 31, 2010, there were 50 million shares of capital stock of Selected Special Shares ($0.25 par value per share) authorized. At December 31, 2010, there were unlimited shares of capital stock of Selected Capital Preservation Trust ($0.10 par value per share) authorized. Transactions in capital stock were as follows:
| Class S | Year ended December 31, 2010 |
| | Selected American | | Selected Special | | Selected Daily | |
| | Shares | | Shares | | Government Fund | |
| Shares sold | | 16,239,953 | | | 45,139 | | | 2,797,277 | |
| Shares issued in reinvestment of distributions | | 1,018,369 | | | 18,064 | | | 2,923 | |
| | | 17,258,322 | | | 63,203 | | | 2,800,200 | |
| Shares redeemed | | (58,805,800) | | | (369,295) | | | (2,888,355) | |
| Net decrease | | (41,547,478) | | | (306,092) | | | (88,155) | |
| | | | | | | | | | |
| Proceeds from shares sold | $ | 613,804,715 | | $ | 445,446 | | $ | 2,797,277 | |
| Proceeds from shares issued in reinvestment of | | | | | | | | | |
| distributions | | 40,327,412 | | | 186,418 | | | 2,923 | |
| | | 654,132,127 | | | 631,864 | | | 2,800,200 | |
| Cost of shares redeemed | | (2,202,829,344) | | | (3,616,393) | | | (2,888,355) | |
| Net decrease | $ | (1,548,697,217) | | $ | (2,984,529) | | $ | (88,155) | |
| | | | | | | | | | |
| | | | | | | | | | |
| Class S | Year ended December 31, 2009 |
| | Selected American | | Selected Special | | Selected Daily | |
| | Shares | | Shares | | Government Fund | |
| Shares sold | | 29,874,792 | | | 125,145 | | | 2,652,721 | |
| Shares issued in reinvestment of distributions | | 969,609 | | | 5,059 | | | 9,740 | |
| | | 30,844,401 | | | 130,204 | | | 2,662,461 | |
| Shares redeemed | | (60,645,087) | | | (468,008) | | | (3,172,942) | |
| Net decrease | | (29,800,686) | | | (337,804) | | | (510,481) | |
| | | | | | | | | | |
| Proceeds from shares sold | $ | 893,449,877 | | $ | 1,036,529 | | $ | 2,652,721 | |
| Proceeds from shares issued in reinvestment of | | | | | | | | | |
| distributions | | 35,671,925 | | | 48,972 | | | 9,740 | |
| | | 929,121,802 | | | 1,085,501 | | | 2,662,461 | |
| Cost of shares redeemed | | (1,793,066,611) | | | (3,697,280) | | | (3,172,942) | |
| Net decrease | $ | (863,944,809) | | $ | (2,611,779) | | $ | (510,481) | |
| | | | | | | | | | |
| | | | | | | | | | |
| SELECTED FUNDS | Notes to Financial Statements – (Continued) |
| | December 31, 2010 |
NOTE 5 - CAPITAL STOCK – (CONTINUED)
| Class D | Year ended December 31, 2010 |
| | Selected American | | Selected Special | | Selected Daily | |
| | Shares | | Shares | | Government Fund | |
| Shares sold | | 8,967,736 | | | 198,098 | | | 8,515,283 | |
| Shares issued in reinvestment of distributions | | 1,094,661 | | | 66,368 | | | 17,944 | |
| | | 10,062,397 | | | 264,466 | | | 8,533,227 | |
| Shares redeemed | | (13,152,603) | | | (482,269) | | | (8,590,939) | |
| Net decrease | | (3,090,206) | | | (217,803) | | | (57,712) | |
| | | | | | | | | | |
| Proceeds from shares sold | $ | 338,123,569 | | $ | 1,957,621 | | $ | 8,515,283 | |
| Proceeds from shares issued in reinvestment of | | | | | | | | | |
| distributions | | 43,304,799 | | | 685,585 | | | 17,944 | |
| | | 381,428,368 | | | 2,643,206 | | | 8,533,227 | |
| Cost of shares redeemed | | (499,147,151) | | | (4,812,025) | | | (8,590,939) | |
| Net decrease | $ | (117,718,783) | | $ | (2,168,819) | | $ | (57,712) | |
| | | | | | | | | | |
| | | | | | | | | | |
| Class D | Year ended December 31, 2009 |
| | Selected American | | Selected Special | | Selected Daily | |
| | Shares | | Shares | | Government Fund | |
| Shares sold | | 11,637,523 | | | 305,178 | | | 6,677,409 | |
| Shares issued in reinvestment of distributions | | 773,829 | | | 29,925 | | | 175,020 | |
| | | 12,411,352 | | | 335,103 | | | 6,852,429 | |
| Shares redeemed | | (15,383,362) | | | (500,773) | | | (50,628,041) | |
| Net decrease | | (2,972,010) | | | (165,670) | | | (43,775,612) | |
| | | | | | | | | | |
| Proceeds from shares sold | $ | 361,723,094 | | $ | 2,609,144 | | $ | 6,677,409 | |
| Proceeds from shares issued in reinvestment of | | | | | | | | | |
| distributions | | 28,431,483 | | | 289,689 | | | 175,020 | |
| | | 390,154,577 | | | 2,898,833 | | | 6,852,429 | |
| Cost of shares redeemed | | (451,059,761) | | | (3,953,528) | | | (50,628,041) | |
| Net decrease | $ | (60,905,184) | | $ | (1,054,695) | | $ | (43,775,612) | |
| | | | | | | | | | |
| | | | | | | | | | |
NOTE 6 - BANK BORROWINGS
Each Fund may borrow up to 5% of its assets from a bank to purchase portfolio securities, or for temporary and emergency purposes. The purchase of securities with borrowed funds creates leverage in the Fund. Each Fund has entered into an agreement, which enables it to participate with certain other funds managed by the Adviser in an unsecured line of credit with a bank, which permits borrowings up to $50 million, collectively. Interest is charged based on its borrowings, at a rate equal to the higher of the Federal Funds Rate or the Overnight Libor Rate, plus 1.25%. The Funds had no borrowings during the year ended December 31, 2010.
NOTE 7 - DISTRIBUTION SERVICE FEES
For services under the distribution agreement, the Funds’ Class S shares pay an annual fee of 0.25% of average daily net assets. For the year ended December 31, 2010, Selected American Shares, Selected Special Shares, and Selected Daily Government Fund incurred distribution services fees totaling $9,928,551, $44,648, and $9,985, respectively.
Davis Distributors, LLC entered into an agreement with Selected Daily Government Fund to temporarily eliminate the 0.25% distribution fee on Class S shares through December 31, 2011. During the year ended December 31, 2010 such fee elimination amounted to $9,985.
There are no distribution service fees for the Funds’ Class D shares.
| SELECTED FUNDS | Notes to Financial Statements – (Continued) |
| | December 31, 2010 |
NOTE 8 - SECURITIES LOANED
Selected American Shares (“Fund”) has entered into a securities lending arrangement with State Street Bank. Under the terms of the agreement, the Fund receives fee income from lending transactions; in exchange for such fees, State Street Bank is authorized to loan securities on behalf of the Fund, against receipt of collateral at least equal to the value of the securities loaned. As of December 31, 2010, the Fund did not have any securities on loan. The Fund bears the risk of any deficiency in the amount of the collateral available for return to a borrower due to a loss in an approved investment.
NOTE 9 - RESTRICTED SECURITIES
Restricted securities are not registered under the Securities Act of 1933 and may have contractual restrictions on resale. They are valued under methods approved by the Board of Directors as reflecting fair value. The aggregate value of restricted securities in Selected American Shares amounted to $40,316,908 or 0.54% of the Fund’s net assets as of December 31, 2010. The aggregate value of restricted securities in Selected Special Shares amounted to $3,372,500 or 3.69% of the Fund’s net assets as of December 31, 2010. Information regarding restricted securities is as follows:
| | | | | | | | | | | Cost per | | Valuation per |
| | | | | Acquisition | | | | Shares/ | | Share/ | | Share/Unit as of |
| Fund | | Security | | Date | | Principal | | Units | | Unit | | December 31, 2010 |
| | | | | | | | | | | | | | | | |
| Selected | | | | | | | | | | | | | | | |
| American | | Fairfax Financial | | | | | | | | | | | | | |
| Shares | | Holdings Ltd., 144A | | 02/23/10 | | | N/A | | 39,220 | | $ | 355.00 | | $ | 411.33 |
| | | | | | | | | | | | | | | | |
| Selected | | | | | | | | | | | | | | | |
| American | | | | | | | | | | | | | | | |
| Shares | | Sino-Forest Corp., 144A | | 12/11/09 | | | N/A | | 145,700 | | $ | 15.85 | | $ | 23.42 |
| | | | | | | | | | | | | | | | |
| Selected | | | | | | | | | | | | | | | |
| American | | Sino-Forest Corp., Conv. Sr. | | | | | | | | | | | | | |
| Shares | | Notes, 5.00%, 08/01/13 | | 07/17/08 | | $ | 15,365,000 | | 153,650 | | $ | 100.00 | | $ | 135.19 |
| | | | | | | | | | | | | | | | |
| Selected | | | | | | | | | | | | | | | |
| Special | | Oaktree Capital Group LLC, | | | | | | | | | | | | | |
| Shares | | Class A | | 05/21/07 | | | N/A | | 95,000 | | $ | 27.40 | | $ | 35.50 |
NOTE 10 - SUBSEQUENT EVENTS
The Board of Directors has approved the modification of Selected Special Shares’ investment strategy to invest primarily in a diversified portfolio of common stocks issued by companies outside the U.S., including countries with developed or emerging markets, effective May 1, 2011. The Fund will continue to invest in large, medium, and small companies without regard to market capitalization and maintain its investment objective. Selected Special Shares will be renamed Selected International Fund.
| SELECTED FUNDS |
| |
| The following financial information represents selected data for each share of capital stock outstanding throughout each period: |
| |
| Income (Loss) from Investment Operations | |
| | Net Asset Value, Beginning of Period | Net Investment Income (Loss) | Net Realized and Unrealized Gains (Losses) | Total from Investment Operations |
| Selected American Shares Class S: | | | | |
| Year ended December 31, 2010 | $37.28 | $0.30d | $4.35 | $4.65 |
| Year ended December 31, 2009 | $28.54 | $0.27d | $8.76 | $9.03 |
| Year ended December 31, 2008 | $47.78 | $0.34d | $(19.23) | $(18.89) |
| Year ended December 31, 2007 | $46.06 | $0.49d | $1.72 | $2.21 |
| Year ended December 31, 2006 | $40.24 | $0.30d | $5.81 | $6.11 |
| Selected American Shares Class D: | | | | |
| Year ended December 31, 2010 | $37.25 | $0.43d | $4.35 | $4.78 |
| Year ended December 31, 2009 | $28.50 | $0.36d | $8.77 | $9.13 |
| Year ended December 31, 2008 | $47.79 | $0.48d | $(19.28) | $(18.80) |
| Year ended December 31, 2007 | $46.07 | $0.63d | $1.73 | $2.36 |
| Year ended December 31, 2006 | $40.23 | $0.45d | $5.81 | $6.26 |
| Selected Special Shares Class S: | | | | |
| Year ended December 31, 2010 | $9.78 | $0.09d | $1.25 | $1.34 |
| Year ended December 31, 2009 | $6.80 | $0.03d | $2.98 | $3.01 |
| Year ended December 31, 2008 | $12.30 | $0.04d | $(5.54) | $(5.50) |
| Year ended December 31, 2007 | $13.98 | $–d,f | $(0.17) | $(0.17) |
| Year ended December 31, 2006 | $12.47 | $(0.03)d | $2.22 | $2.19 |
| Selected Special Shares Class D: | | | | |
| Year ended December 31, 2010 | $9.79 | $0.14d | $1.25 | $1.39 |
| Year ended December 31, 2009 | $6.81 | $0.07d | $2.98 | $3.05 |
| Year ended December 31, 2008 | $12.30 | $0.08d | $(5.54) | $(5.46) |
| Year ended December 31, 2007 | $13.98 | $0.05d | $(0.17) | $(0.12) |
| Year ended December 31, 2006 | $12.46 | $0.02d | $2.23 | $2.25 |
| Selected Daily Government Fund Class S: | | | | |
| Year ended December 31, 2010 | $1.000 | $0.001 | $– | $0.001 |
| Year ended December 31, 2009 | $1.000 | $0.002 | $– | $0.002 |
| Year ended December 31, 2008 | $1.000 | $0.020 | $– | $0.020 |
| Year ended December 31, 2007 | $1.000 | $0.044 | $– | $0.044 |
| Year ended December 31, 2006 | $1.000 | $0.043 | $– | $0.043 |
| Selected Daily Government Fund Class D: | | | | |
| Year ended December 31, 2010 | $1.000 | $0.001 | $– | $0.001 |
| Year ended December 31, 2009 | $1.000 | $0.003 | $– | $0.003 |
| Year ended December 31, 2008 | $1.000 | $0.024 | $– | $0.024 |
| Year ended December 31, 2007 | $1.000 | $0.048 | $– | $0.048 |
| Year ended December 31, 2006 | $1.000 | $0.045 | $– | $0.045 |
| Financial Highlights |
| |
Dividends and Distributions Ratios to Average Net Assets |
| | Dividends from Net Investment Income | Distributions from Realized Gains | Return of Capital | Total Distributions | Net Asset Value, End of Period | Total Returna | Net Assets, End of Period (in millions) | Gross Expense Ratio | Net Expense Ratiob | Net Investment Income (Loss) Ratio | Portfolio Turnoverc |
| | | | | | | | | | | | |
| | $(0.49) | $– | $– | $(0.49) | $41.44 | 12.53% | $3,549 | 0.93% | 0.93% | 0.80% | 9% |
| | $(0.29) | $– | $– | $(0.29) | $37.28 | 31.64% | $4,742 | 0.94% | 0.94% | 0.86% | 11% |
| | $(0.34) | $– | $(0.01) | $(0.35) | $28.54 | (39.44)% | $4,481 | 0.92% | 0.92% | 0.86% | 18% |
| | $(0.49) | $– | $– | $(0.49) | $47.78 | 4.79% | $7,602 | 0.90% | 0.88% | 1.01% | 8% |
| | $(0.29) | $– | $– | $(0.29) | $46.06 | 15.19% | $7,509 | 0.90% | 0.90% | 0.72% | 9% |
| | | | | | | | | | | | |
| | $(0.62) | $– | $– | $(0.62) | $41.41 | 12.90% | $3,934 | 0.60% | 0.60% | 1.13% | 9% |
| | $(0.38) | $– | $– | $(0.38) | $37.25 | 32.06% | $3,654 | 0.61% | 0.61% | 1.19% | 11% |
| | $(0.48) | $– | $(0.01) | $(0.49) | $28.50 | (39.24)% | $2,881 | 0.59% | 0.59% | 1.19% | 18% |
| | $(0.64) | $– | $– | $(0.64) | $47.79 | 5.11% | $5,020 | 0.57% | 0.57% | 1.32% | 8% |
| | $(0.42) | $– | $– | $(0.42) | $46.07 | 15.59% | $4,407 | 0.58% | 0.58% | 1.04% | 9% |
| | | | | | | | | | | | |
| | $(0.12) | $– | $– | $(0.12) | $11.00 | 13.73%e | $18 | 1.23% | 1.23% | 0.92% | 28% |
| | $(0.03) | $– | $– | $(0.03) | $9.78 | 44.21% | $19 | 1.32% | 1.32% | 0.38% | 24% |
| | $– | $– | $– | $– | $6.80 | (44.72)% | $16 | 1.26% | 1.26% | 0.43% | 30% |
| | $(0.01) | $(1.50) | $– | $(1.51) | $12.30 | (1.27)% | $42 | 1.17% | 1.17% | (0.03)% | 36% |
| | $(0.11) | $(0.57) | $– | $(0.68) | $13.98 | 17.74% | $55 | 1.16% | 1.16% | (0.20)% | 41% |
| | | | | | | | | | | | |
| | $(0.16) | $– | $– | $(0.16) | $11.02 | 14.30%e | $73 | 0.76% | 0.76% | 1.39% | 28% |
| | $(0.07) | $– | $– | $(0.07) | $9.79 | 44.72% | $67 | 0.84% | 0.84% | 0.86% | 24% |
| | $(0.03) | $– | $–f | $(0.03) | $6.81 | (44.40)% | $48 | 0.86% | 0.86% | 0.83% | 30% |
| | $(0.06) | $(1.50) | $– | $(1.56) | $12.30 | (0.89)% | $94 | 0.81% | 0.81% | 0.33% | 36% |
| | $(0.16) | $(0.57) | $– | $(0.73) | $13.98 | 18.19% | $95 | 0.83% | 0.83% | 0.13% | 41% |
| | | | | | | | | | | | |
| | $(0.001) | $– | $– | $(0.001) | $1.000 | 0.08% | $4 | 1.29% | 0.22% | 0.08% | NA |
| | $(0.002) | $– | $– | $(0.002) | $1.000 | 0.20% | $4 | 1.17% | 0.54% | 0.31% | NA |
| | $(0.020) | $– | $– | $(0.020) | $1.000 | 2.05% | $4 | 0.94% | 0.75% | 2.09% | NA |
| | $(0.044) | $– | $– | $(0.044) | $1.000 | 4.50% | $5 | 0.97% | 0.75% | 4.41% | NA |
| | $(0.043) | $– | $– | $(0.043) | $1.000 | 4.33% | $6 | 0.67% | 0.67% | 4.28% | NA |
| | | | | | | | | | | | |
| | $(0.001) | $– | $– | $(0.001) | $1.000 | 0.08% | $23 | 0.67% | 0.22% | 0.08% | NA |
| | $(0.003) | $– | $– | $(0.003) | $1.000 | 0.29% | $24 | 0.57% | 0.44% | 0.41% | NA |
| | $(0.024) | $– | $– | $(0.024) | $1.000 | 2.40% | $67 | 0.40% | 0.40% | 2.44% | NA |
| | $(0.048) | $– | $– | $(0.048) | $1.000 | 4.85% | $110 | 0.41% | 0.41% | 4.75% | NA |
| | $(0.045) | $– | $– | $(0.045) | $1.000 | 4.61% | $104 | 0.40% | 0.40% | 4.55% | NA |
| | a | Assumes hypothetical initial investment on the business day before the first day of the fiscal period with all dividends and distributions reinvested in additional shares on the reinvestment date, and redemption at the net asset value calculated on the last business day of the fiscal period. | |
| | | | |
| | b | The ratios in this column reflect the impact, if any, of the reduction of expenses paid indirectly and of certain reimbursements from the Adviser. | |
| | | | |
| | c | The lesser of purchases or sales of portfolio securities for a period, divided by the monthly average of the market value of portfolio securities owned during the period. Securities with a maturity or expiration date at the time of acquisition of one year or less are excluded from the calculation. | |
| | | | |
| | d | Per share calculations were based on average shares outstanding for the period. | |
| | | | |
| | e | Selected Special Shares made a favorable investment in an initial public offering (IPO), which had a material impact on the investment performance, adding approximately 2% to the Fund’s total return in 2010. The IPO was purchased with the intent to benefit from long-term growth of the underlying company and the rapid appreciation was an unusual occurrence. Such performance may not continue in the future. | |
| | | | |
| | f | Less than $0.005 per share. | |
| | | | |
| | See Notes to Financial Statements | |
| | | |
| SELECTED FUNDS | Report of Independent Registered Public Accounting Firm |
To the Shareholders and Board of Directors/Trustees
of Selected American Shares, Inc., Selected Special Shares, Inc., and Selected Capital Preservation Trust:
We have audited the accompanying statements of assets and liabilities of Selected American Shares, Inc., Selected Special Shares, Inc., and Selected Daily Government Fund (a series of Selected Capital Preservation Trust), including the schedules of investments, as of December 31, 2010, and the related statements of operations for the year then ended, the statements of changes in net assets for each of the years in the two-year period then ended, and the financial highlights for each of the years in the five-year period then ended. These financial statements and financial highlights are the responsibility of the Funds' management. Our responsibility is to express an opinion on these financial statements and financial highlights based on our audits.
We conducted our audits in accordance with the standards of the Public Company Accounting Oversight Board (United States). Those standards require that we plan and perform the audit to obtain reasonable assurance about whether the financial statements and financial highlights are free of material misstatement. An audit includes examining, on a test basis, evidence supporting the amounts and disclosures in the financial statements. Our procedures included confirmation of securities owned as of December 31, 2010, by correspondence with the custodian and brokers or by other appropriate auditing procedures where replies from brokers were not received. An audit also includes assessing the accounting principles used and significant estimates made by management, as well as evaluating the overall financial statement presentation. We believe that our audits provide a reasonable basis for our opinion.
In our opinion, the financial statements and financial highlights referred to above present fairly, in all material respects, the financial position of Selected American Shares, Inc., Selected Special Shares, Inc., and Selected Daily Government Fund as of December 31, 2010, the results of their operations for the year then ended, the changes in their net assets for each of the years in the two-year period then ended, and the financial highlights for each of the years in the five-year period then ended, in conformity with U.S. generally accepted accounting principles.
KPMG LLP
Denver, Colorado
February 17, 2011
| SELECTED FUNDS | Fund Information |
Federal Income Tax Information (Unaudited)
In early 2011, shareholders will receive information regarding all dividends and distributions paid to them by the Funds during the calendar year 2010. Regulations of the U.S. Treasury Department require the Funds to report this information to the Internal Revenue Service.
The information and distributions reported herein may differ from the information reported as distributions taxable to certain shareholders for the calendar year 2010 with their 2010 Form 1099-DIV.
The information is presented to assist shareholders in reporting distributions received from the Funds to the Internal Revenue Service. Because of the complexity of the federal regulations that may affect your individual tax return and the many variations in state and local regulations, we recommend that you consult your tax adviser for specific guidance.
Each Fund designates the following amounts distributed during the calendar year ended December 31, 2010, as dividends eligible for the corporate dividends-received deduction and qualified dividend income.
| | | Selected American Shares | | Selected Special Shares |
| | | | | |
| Income dividends | $ | 100,417,052 | $ | 1,248,401 |
| Income qualifying for corporate dividends-received deduction | $ | 100,417,052 | $ | 667,603 |
| | 100% | | 53% |
| Qualified dividend income | $ | 100,417,052 | $ | 1,025,027 |
| | 100% | | 82% |