Dear Fellow Shareholder,
As stewards of our customers’ savings, the management team and Directors of the Selected Funds recognize the importance of candid, thorough, and regular communication with our shareholders. In our Annual and Semi-Annual Reports, we include all of the required quantitative information, such as financial statements, detailed footnotes, performance reports, fund holdings, and performance attribution.
In addition, we produce a Manager Commentary for each Fund. In this commentary, we give a more qualitative perspective on fund performance, discuss our thoughts on individual holdings, and share our investment outlook. You may obtain a copy of the current Manager Commentary either on the Funds’ website at www.selectedfunds.com, or by calling 1-800-243-1575.
We value the trust you have placed in us and look forward to continuing our investment journey together.
Sincerely,
|
|
|
James J. McMonagle | Christopher C. Davis | Danton G. Goei |
Chairman | President & Portfolio Manager | Portfolio Manager |
| | | |
August 5, 2022 | | |
| SELECTED FUNDS | Management’s Discussion of Fund Performance |
| SELECTED AMERICAN SHARES, INC. | |
Performance Overview
Selected American Shares underperformed the Standard & Poor’s 500® Index (“S&P 500®” or the “Index”) for the six-month period ended June 30, 2022 (the “period”). The Fund’s Class S and D shares delivered total returns of -22.25% and -22.15%, respectively, versus a -19.96% return for the S&P 500®. The sectors1 within the S&P 500® that reported the weakest performance were Consumer Discretionary (down 33%), Communication Services (down 30%), and Information Technology (down 27%). Energy (up 32%) was the only sector in the S&P 500® that reported positive performance during the period. The other sectors within the Index that were stronger comparatively were Utilities (down 1%) and Consumer Staples (down 6%).
Detractors from Performance
The Fund’s Communication Services holdings were an important detractor2 from performance both on an absolute basis and relative to the Index. The Fund’s holdings underperformed the Index sector (down 36%, versus down 30%) and the Fund was overweight in this weaker performing sector (average weighting of 13%, versus 9%). Meta Platforms3 (down 52%) and Alphabet (down 25%) were among the weaker performers from this sector.
The Fund continued to hold a large position in Financials. These holdings were the top detractor from absolute performance. Capital One Financial (down 28%), Wells Fargo (down 18%), Bank of New York Mellon (down 27%), JPMorgan Chase (down 28%), and U.S. Bancorp (down 17%), holdings that were significant contributors in 2021, were among the key detractors from performance during the period. Wells Fargo and Capital One Financial both remain as top five holdings at the end of the period, representing 7.89% and 6.92% of net assets, respectively.
The Fund’s Information Technology holdings were also a key detractor from absolute performance. The Fund’s holdings underperformed the Index sector (down 32%, versus down 27%). Applied Materials (down 42%), the largest holding at the beginning of the period, was the overall top detractor from performance. Intel (down 26%) was also among the weaker performers from this sector.
The Fund had no exposure in Energy or Utilities and was underweight in Consumer Staples (average weighting of 1%, versus 6%), the three highest performing sectors of the S&P 500®. As a result, relative performance suffered.
An additional individual detractor from performance was Amazon (down 36%).
Contributors to Performance
Although the aforementioned Financials sector was the Fund’s largest detractor from absolute performance, the Fund benefited significantly from its overweight position (average weight of 48%, compared to the Index sector’s 12%) while also outperforming the Index sector (down 16%, versus down 18%). AIA Group (up 9%), Chubb (up 3%), Markel (up 5%), and Loews (up 3%) were among the largest contributors to performance. American Express (down 14%) started the period off strong but finished on a negative note, thus being down for the entire period. Fortunately, the Fund sold a majority of its shares before the performance declined. As a result, American Express was also a contributor for the period.
The Fund’s relative performance also benefited from both outperforming (down 27%, versus down 33%) and being underweight (average weighting of 10%, versus 12%) in the weakest performing sector of the Index, Consumer Discretionary. While JD.com (down 6%) decreased during the period, the Fund benefited from some timely purchases in March and subsequent performance of those shares.
Cigna (up 16%), a Health Care holding, was the overall top contributor to performance and a top ten holding at the end of the period, representing 4.96% of net assets. The Fund’s sole holding in the Materials sector, Teck Resources (up 8%), outperformed the Index sector (down 18%).
The Fund also benefited from its lower average weighting in the weaker performing Information Technology sector (16%, versus 27% for the Index). Additionally, the Fund had an average weighting of 16% of net assets in foreign securities. The Fund’s foreign holdings outperformed the U.S. holdings (down 12%, versus down 24%).
Selected American Shares’ investment objective is to achieve both capital growth and income. In the current market environment, we expect that income will be low. There can be no assurance that the Fund will achieve its objective. Selected American Shares’ principal risks are: stock market risk, common stock risk, financial services risk, foreign country risk, headline risk, large-capitalization companies risk, manager risk, depositary receipts risk, emerging market risk, fees and expenses risk, foreign currency risk, and mid- and small-capitalization companies risk. See the prospectus for a full description of each risk.
Past performance does not guarantee future results, Fund prices fluctuate, and the value of an investment may be worth more or less than the purchase price. Data provided in this performance overview is for the six-month period ended June 30, 2022, unless otherwise noted. Return figures for underlying Fund positions reflect the return of the security from the beginning of the period or the date of first purchase if subsequent thereto through the end of the period or the date the position is completely liquidated. The actual contribution to the Fund will vary based on a number of factors (e.g., trading activity, weighting). Portfolio holding information is as of the end of the six-month period, June 30, 2022, unless otherwise noted.
1 | The companies included in the Standard & Poor’s 500® Index are divided into eleven sectors. One or more industry groups make up a sector. For purposes of measuring concentration, the Fund generally classifies companies at the industry group or industry level. See the SAI for additional information regarding the Fund’s concentration policy. |
2 | A company’s or sector’s contribution to or detraction from the Fund’s performance is a product both of its appreciation or depreciation and its weighting within the Fund. For example, a 5% holding that rises 20% has twice as much impact as a 1% holding that rises 50%. |
3 | This Management Discussion of Fund Performance discusses a number of individual companies. The information provided in this report does not provide information reasonably sufficient upon which to base an investment decision and should not be considered a recommendation to purchase, sell, or hold any particular security. The Schedule of Investments lists the Fund’s holdings of each company discussed. |
| SELECTED FUNDS | Management’s Discussion of Fund Performance |
| SELECTED AMERICAN SHARES, INC. – (CONTINUED) | |
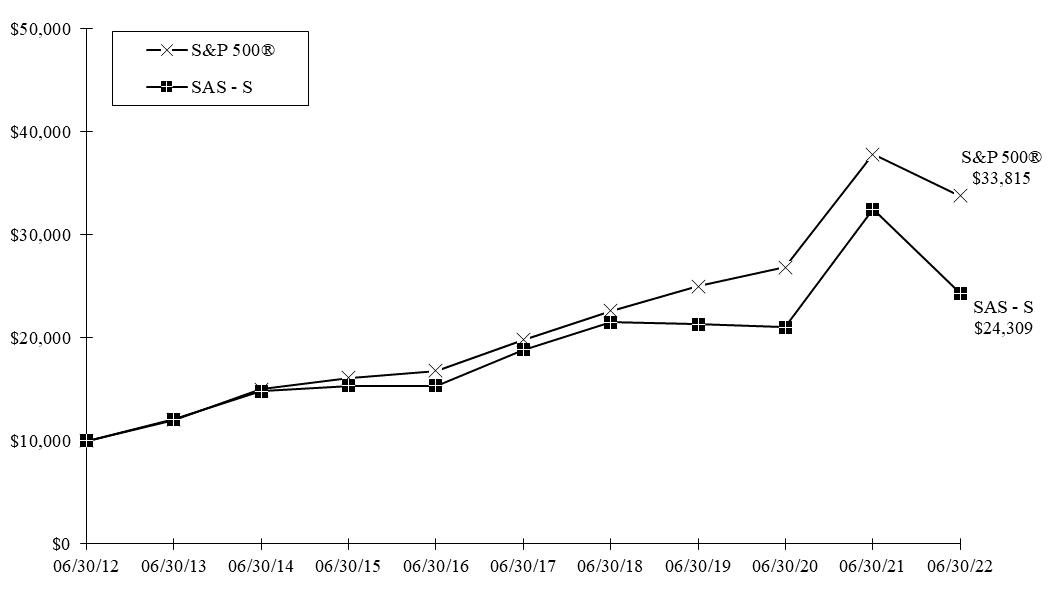
Comparison of a $10,000 investment in Selected American Shares Class S versus the
Standard & Poor’s 500® Index over 10 years for an investment made on June 30, 2012
Average Annual Total Return for periods ended June 30, 2022
| Fund & Benchmark Index | 1-Year | 5-Year | 10-Year | Since Class D’s Inception (May 3, 2004) | Gross Expense Ratio | Net Expense Ratio |
| Class S | (25.19)% | 5.22% | 9.28% | N/A | 0.99% | 0.99% |
| Class D | (24.96)% | 5.56% | 9.64% | 6.98% | 0.67% | 0.67% |
Standard & Poor’s 500® Index | (10.62)% | 11.30% | 12.95% | 9.11% | | |
The Standard & Poor’s 500® Index is an unmanaged index of 500 selected common stocks, most of which are listed on the New York Stock Exchange. The Index is adjusted for dividends, weighted towards stocks with large market capitalizations, and represents approximately two-thirds of the total market value of all domestic common stocks. Investments cannot be made directly in the Index.
The performance data quoted in this report represents past performance, assumes that all distributions were reinvested, and is not a guarantee of future results. The investment return and principal value will fluctuate so that shares may be worth more or less than their original cost when redeemed. Current performance may be higher or lower than performance data quoted. Returns shown do not reflect the deduction of taxes that a shareholder would pay on fund distributions or the redemption of fund shares. The operating expense ratios may vary in future years. For most recent month-end performance information, please call Selected Funds Investor Services at 1-800-243-1575 or visit the Fund’s website at www.selectedfunds.com.
| SELECTED FUNDS | Management’s Discussion of Fund Performance |
| SELECTED INTERNATIONAL FUND, INC. | |
Performance Overview
Selected International Fund outperformed the Morgan Stanley Capital International All Country World Index ex USA (“MSCI” or the “Index”) for the six-month period ended June 30, 2022 (the “period”). The Fund’s Class S and D shares delivered total returns of -15.19% and -15.11%, respectively, versus a -18.42% return for the MSCI. The sectors1 within the MSCI that reported the weakest performance were Information Technology (down 34%), Industrials (down 24%), and Consumer Discretionary (down 21%). Energy (up 8%) was the only sector in the MSCI that reported positive performance during the period. The other sectors within the Index that were stronger comparatively were Utilities (down 11%) and Financials (down 12%).
Contributors to Performance
No sector contributed2 positively to the Fund’s absolute performance during the period. However, several sectors contributed to performance relative to the MSCI, including the largest Fund position, Financials. The Fund benefited from its overweight position (average weighting of 46%, compared to 20% for the Index) in one of the stronger sectors of the Index. AIA Group3 (up 9%) was the top overall contributor to performance during the period.
The Fund’s Consumer Discretionary holdings, the second-largest sector position with an average weighting of 26%, were another significant relative outperformer. The Fund’s holdings outperformed the Index sector (down 13%, versus down 21%). Delivery Hero (up 25%), a new addition to the Fund in May, was a strong performer subsequent to the purchase.
The Information Technology sector was also a contributor to the Fund’s relative performance. The Fund’s holdings outperformed the Index sector (down 24%, versus down 34%). Hollysys Automation Technologies (up 7%) was among the stronger contributors during the period.
Other smaller individual contributors during the period included Kuaishou Technology (up 14%) and Teck Resources (up 8%). The Fund no longer owns Kuaishou Technology.
The Fund’s largest geographic position remained in Chinese securities (36% average weighting, compared to 9% for the MSCI). This overweight position benefited the Fund’s performance versus the Index as the Fund’s Chinese holdings were only down 9%.
Detractors from Performance
As mentioned above, the Fund’s relative outperformance in the Consumer Discretionary and Information Technology sectors was due to stock selection. However, larger average weightings in two of the weaker sectors of the Index reduced the impact from the stronger stock selection. The Fund had a 26% and 18% average weighting in Consumer Discretionary and Information Technology, respectively (versus 11% and 12% for Index, respectively). Tokyo Electron (down 43%) and Samsung Electronics (down 33%), two Information Technology holdings, were the top two overall detractors from Fund performance. Consumer Discretionary holdings detracting from performance included Fila Holdings (down 28%), Meituan (down 14%), and Prosus (down 22%).
The Fund’s aforementioned Financials sector holdings contributed to overall relative performance due to its overweight position but also declined 12%, thus making this sector the top detractor from absolute performance. Julius Baer Group (down 28%), Danske Bank (down 17%), Bank of N.T. Butterfield (down 16%), and DNB Bank (down 18%) were key detractors during the period.
The Fund had no exposure in Energy, Utilities, Health Care, or Consumer Staples, four higher performing sectors of the MSCI. As a result, relative performance suffered.
An additional individual detractor from performance was DiDi Global (down 41%), an Industrials holding.
Selected International Fund’s investment objective is capital growth. There can be no assurance that the Fund will achieve its objective. Selected International Fund’s principal risks are: stock market risk, common stock risk, foreign country risk, China risk-generally, headline risk, depositary receipts risk, foreign currency risk, exposure to industry or sector risk, emerging market risk, large-capitalization companies risk, manager risk, fees and expenses risk, and mid- and small-capitalization companies risk. See the prospectus for a full description of each risk.
Past performance does not guarantee future results, Fund prices fluctuate, and the value of an investment may be worth more or less than the purchase price. Data provided in this performance overview is for the six-month period ended June 30, 2022, unless otherwise noted. Return figures for underlying Fund positions reflect the return of the security from the beginning of the period or the date of first purchase if subsequent thereto through the end of the period or the date the position is completely liquidated. The actual contribution to the Fund will vary based on a number of factors (e.g., trading activity, weighting). Portfolio holding information is as of the end of the six-month period, June 30, 2022, unless otherwise noted.
1 | The companies included in the Morgan Stanley Capital International All Country World Index ex USA are divided into eleven sectors. One or more industry groups make up a sector. For purposes of measuring concentration, the Fund generally classifies companies at the industry group or industry level. See the SAI for additional information regarding the Fund’s concentration policy. |
2 | A company’s or sector’s contribution to or detraction from the Fund’s performance is a product both of its appreciation or depreciation and its weighting within the Fund. For example, a 5% holding that rises 20% has twice as much impact as a 1% holding that rises 50%. |
3 | This Management Discussion of Fund Performance discusses a number of individual companies. The information provided in this report does not provide information reasonably sufficient upon which to base an investment decision and should not be considered a recommendation to purchase, sell, or hold any particular security. The Schedule of Investments lists the Fund’s holdings of each company discussed. |
| SELECTED FUNDS | Management’s Discussion of Fund Performance |
| SELECTED INTERNATIONAL FUND, INC. – (CONTINUED) | |
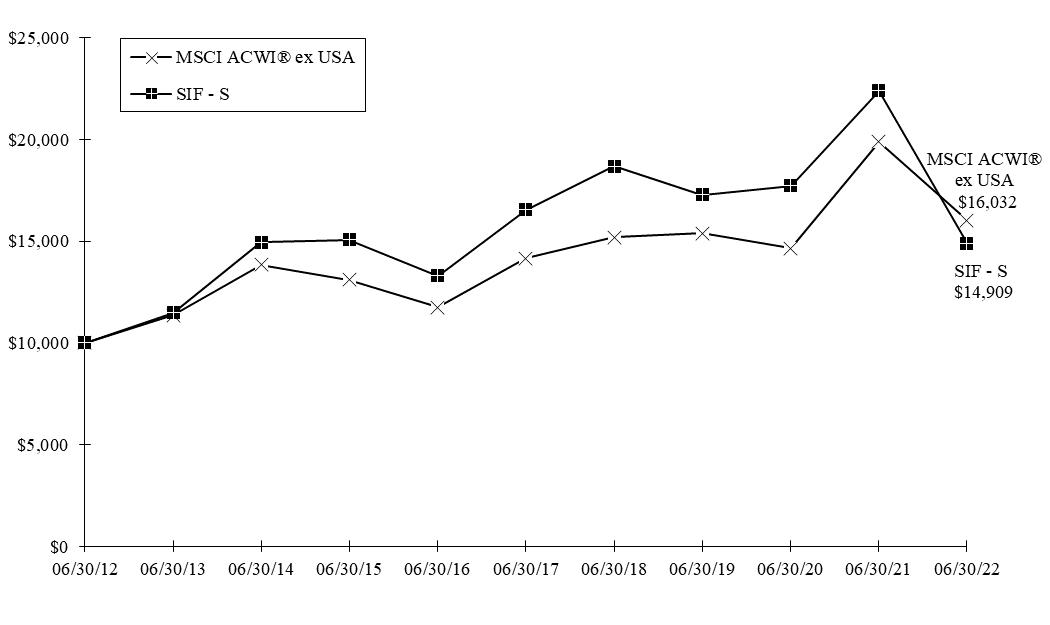
Comparison of a $10,000 investment in Selected International Fund Class S versus the
Morgan Stanley Capital International All Country World Index ex USA (MSCI ACWI® ex USA)
over 10 years for an investment made on June 30, 2012
Average Annual Total Return for periods ended June 30, 2022
| Fund & Benchmark Index | 1-Year | 5-Year | 10-Year | Since Class D’s Inception (May 3, 2004) | Gross Expense Ratio | Net Expense Ratio |
| Class S | (33.40)% | (2.06)% | 4.07% | N/A | 1.67% | 1.05% |
| Class D | (33.24)% | (1.79)% | 4.47% | 2.64% | 1.00% | 0.80% |
MSCI ACWI® ex USA | (19.42)% | 2.50% | 4.83% | 5.16% | | |
The Fund’s performance benefited from IPO purchases in 2014. After purchase, the IPOs rapidly increased in value. The Adviser purchases shares intending to benefit from long-term growth of the underlying company; the rapid appreciation of the IPOs were unusual occurrences.
The MSCI ACWI® ex USA is a free float-adjusted market capitalization weighted index designed to measure the equity market performance of developed and emerging markets, excluding the United States. The Index includes reinvestment of dividends, net of foreign withholding taxes. Investments cannot be made directly in the Index.
The performance data quoted in this report represents past performance, assumes that all distributions were reinvested, and is not a guarantee of future results. The investment return and principal value will fluctuate so that shares may be worth more or less than their original cost when redeemed. Current performance may be higher or lower than performance data quoted. Returns shown do not reflect the deduction of taxes that a shareholder would pay on fund distributions or the redemption of fund shares. The operating expense ratios may vary in future years. For most recent month-end performance information, please call Selected Funds Investor Services at 1-800-243-1575 or visit the Fund’s website at www.selectedfunds.com.
| SELECTED FUNDS | |
| SELECTED AMERICAN SHARES, INC. | June 30, 2022 (Unaudited) |
| Portfolio Composition | | Industry Weightings |
| (% of Fund’s 06/30/22 Net Assets) | | (% of 06/30/22 Stock Holdings) |
| | | | | | | |
| | | | | Fund | | S&P 500® |
Common Stock (U.S.) | 80.63% | | Banks | 20.70% | | 3.69% |
| Common Stock (Foreign) | 17.29% | | Diversified Financials | 19.61% | | 4.95% |
Short-Term Investments | 1.11% | | Information Technology | 14.49% | | 26.84% |
Preferred Stock (Foreign) | 0.85% | | Media & Entertainment | 12.18% | | 7.45% |
Other Assets & Liabilities | 0.12% | | Retailing | 10.70% | | 5.72% |
| | 100.00% | | Health Care | 9.75% | | 15.14% |
| | | | Insurance | 7.41% | | 2.20% |
| | | | Materials | 1.67% | | 2.60% |
| | | | Capital Goods | 1.31% | | 5.25% |
| | | | Food, Beverage & Tobacco | 1.14% | | 3.72% |
| | | | Transportation | 1.04% | | 1.79% |
| | | | Energy | – | | 4.35% |
| | | | Utilities | – | | 3.10% |
| | | | Real Estate | – | | 2.92% |
| | | | Other | – | | 10.28% |
| | | | | 100.00% | | 100.00% |
| Top 10 Long-Term Holdings |
| (% of Fund’s 06/30/22 Net Assets) |
| |
| Berkshire Hathaway Inc., Class A | Diversified Financial Services | 7.90% |
| Wells Fargo & Co. | Banks | 7.89% |
| Alphabet Inc.* | Media & Entertainment | 7.26% |
| Capital One Financial Corp. | Consumer Finance | 6.92% |
| Applied Materials, Inc. | Semiconductors & Semiconductor Equipment | 5.56% |
| Cigna Corp. | Health Care Equipment & Services | 4.96% |
| Amazon.com, Inc. | Retailing | 4.27% |
| U.S. Bancorp | Banks | 4.14% |
| Intel Corp. | Semiconductors & Semiconductor Equipment | 3.88% |
| Bank of New York Mellon Corp. | Capital Markets | 3.82% |
*Alphabet Inc. holding includes Class A and Class C.
| SELECTED FUNDS | |
| SELECTED INTERNATIONAL FUND, INC. | June 30, 2022 (Unaudited) |
| Portfolio Composition | | Industry Weightings |
| (% of Fund’s 06/30/22 Net Assets) | | (% of 06/30/22 Stock Holdings) |
| | | | | | | |
| | | | | Fund | | MSCI ACWI® EX USA |
Common Stock (Foreign) | 99.22% | | Retailing | 26.99% | | 3.52% |
Short-Term Investments | 1.22% | | Banks | 24.21% | | 12.38% |
Other Assets & Liabilities | (0.44)% | | Information Technology | 15.84% | | 11.01% |
| | 100.00% | | Insurance | 13.83% | | 4.63% |
| | | | Diversified Financials | 5.73% | | 3.28% |
| | | | Media & Entertainment | 4.46% | | 3.28% |
| | | | Consumer Durables & Apparel | 3.10% | | 3.33% |
| | | | Transportation | 2.78% | | 2.67% |
| | | | Materials | 2.68% | | 8.04% |
| | | | Commercial & Professional Services | 0.38% | | 1.34% |
| | | | Health Care | – | | 9.80% |
| | | | Capital Goods | – | | 7.80% |
| | | | Energy | – | | 6.03% |
| | | | Food, Beverage & Tobacco | – | | 5.53% |
| | | | Automobiles & Components | – | | 3.61% |
| | | | Other | – | | 13.75% |
| | | | | 100.00% | | 100.00% |
| Country Diversification | | Top 10 Long-Term Holdings |
| (% of 06/30/22 Stock Holdings) | | (% of Fund’s 06/30/22 Net Assets) |
| | | | | |
China | 39.64% | | JD.com, Inc., Class A, ADR | 7.90% |
South Korea | 9.28% | | AIA Group Ltd. | 7.67% |
Hong Kong | 7.73% | | Danske Bank A/S | 7.49% |
Denmark | 7.54% | | DBS Group Holdings Ltd. | 7.24% |
Singapore | 7.30% | | Hollysys Automation Technologies Ltd. | 6.67% |
Bermuda | 5.95% | | Ping An Insurance (Group) Co. of China, Ltd. - H | 6.05% |
Switzerland | 4.42% | | Bank of N.T. Butterfield & Son Ltd. | 5.91% |
South Africa | 4.20% | | Samsung Electronics Co., Ltd. | 5.46% |
Japan | 3.62% | | Meituan, Class B | 5.41% |
Norway | 3.13% | | Alibaba Group Holding Ltd., ADR | 4.44% |
Netherlands | 3.04% | | | |
Canada | 2.68% | | | |
Germany | 1.18% | | | |
United Kingdom | 0.29% | | | |
| | 100.00% | | | |
| SELECTED FUNDS | Expense Example ( Unaudited) |
As a shareholder of each Fund, you incur ongoing costs, including advisory and administrative fees, distribution and/or service (12b-1) fees, and other Fund expenses. As a shareholder of Selected International Fund, you may also incur transaction costs, which consist of short-term trading fees. The Expense Example is intended to help you understand your ongoing costs (in dollars) of investing in each Fund and to compare these costs with the ongoing costs of investing in other mutual funds. The Expense Example is based on an investment of $1,000 invested at the beginning of the period and held for the entire period indicated, which for each class is for the six-month period ended June 30, 2022.
Actual Expenses
The information represented in the row entitled “Actual” provides information about actual account values and actual expenses. You may use the information in this row, together with the amount you invested, to estimate the expenses that you paid over the period. Simply divide your account value by $1,000 (for example, an $8,600 account value divided by $1,000 = 8.6), then multiply the result by the number under the heading “Expenses Paid During Period” to estimate the expenses you paid on your account during this period. An annual maintenance fee of $15, charged on retirement plan accounts per Social Security Number, is not included in the Expense Example. This fee will be waived for accounts sharing the same Social Security Number if the accounts total at least $50,000 at Selected Funds. If this fee was included, the estimate of expenses you paid during the period would be higher, and your ending account value would be lower, by this amount.
Hypothetical Example for Comparison Purposes
The information represented in the row entitled “Hypothetical” provides information about hypothetical account values and hypothetical expenses based on each Fund’s actual expense ratio and an assumed rate of return of 5% per year before expenses, which is not the Fund’s actual return. The hypothetical account values and expenses may not be used to estimate the actual ending account balance or expenses you paid for the period. You may use this information to compare the ongoing costs of investing in the Fund and other funds. To do so, compare this 5% hypothetical example with the 5% hypothetical examples that appear in the shareholder reports of the other funds. An annual maintenance fee of $15, charged on retirement plan accounts per Social Security Number, is not included in the Expense Example. This fee will be waived for accounts sharing the same Social Security Number if the accounts total at least $50,000 at Selected Funds. If this fee was included, the estimate of expenses you paid during the period would be higher, and your ending account value would be lower, by this amount.
Please note that the expenses shown in the table are meant to highlight your ongoing costs only and do not reflect any transactional costs, such as short-term trading fees. Therefore, the information in the row entitled “Hypothetical” is useful in comparing ongoing costs only, and will not help you determine the relative total costs of owning different funds. In addition, if these transactional costs were included, your costs would be higher.
| | Beginning | Ending | Expenses Paid |
| | Account Value | Account Value | During Period* |
| | (01/01/22) | (06/30/22) | (01/01/22-06/30/22) |
| Selected American Shares | | | |
Class S (annualized expense ratio 0.99%**) | | | |
| Actual | $1,000.00 | $777.51 | $4.36 |
| Hypothetical | $1,000.00 | $1,019.89 | $4.96 |
Class D (annualized expense ratio 0.67%**) | | | |
| Actual | $1,000.00 | $778.51 | $2.95 |
| Hypothetical | $1,000.00 | $1,021.47 | $3.36 |
| Selected International Fund | | | |
Class S (annualized expense ratio 1.05%**) | | | |
| Actual | $1,000.00 | $848.09 | $4.81 |
| Hypothetical | $1,000.00 | $1,019.59 | $5.26 |
Class D (annualized expense ratio 0.80%**) | | | |
| Actual | $1,000.00 | $848.88 | $3.67 |
| Hypothetical | $1,000.00 | $1,020.83 | $4.01 |
| | | | |
| Hypothetical assumes 5% annual return before expenses. |
| |
| *Expenses are equal to each Class’s annualized operating expense ratio, multiplied by the average account value over the period, multiplied by 181/365 (to reflect the one-half year period). |
| |
| **The expense ratios reflect the impact, if any, of certain reimbursements from the Adviser. |
| SELECTED FUNDS | |
| SELECTED AMERICAN SHARES, INC. | June 30, 2022 (Unaudited) |
| | Shares/Units | | Value
(Note 1) |
| COMMON STOCK – (97.92%) |
| | COMMUNICATION SERVICES – (12.03%) |
| | | Media & Entertainment – (12.03%) |
| | | | | | | | | | |
| | | | | | | | |
| | | | | | | | |
| | | | | | | | |
| | Liberty TripAdvisor Holdings, Inc., Series A * | | | | | | |
| | Meta Platforms, Inc., Class A * | | | | | | |
| | | | | | | | |
| | | | Total Communication Services | | | |
| | CONSUMER DISCRETIONARY – (9.72%) |
| | Retailing – (9.72%) |
| | Alibaba Group Holding Ltd., ADR (China)* | | | | | | |
| | | | | | | | |
| | Coupang, Inc., Class A (South Korea)* | | | | | | |
| | JD.com, Inc., Class A, ADR (China) | | | | | | |
| | Naspers Ltd. - N (South Africa) | | | | | | |
| | Prosus N.V., Class N (Netherlands) | | | | | | |
| | Total Consumer Discretionary | | | |
| | CONSUMER STAPLES – (1.12%) |
| | Food, Beverage & Tobacco – (1.12%) |
| | Darling Ingredients Inc. * | | | | | | |
| | | | | |
| | FINANCIALS – (47.14%) |
| | Banks – (20.45%) |
| | Danske Bank A/S (Denmark) | | | | | | |
| | DBS Group Holdings Ltd. (Singapore) | | | | | | |
| | | | | | | | |
| | | | | | | | |
| | | | | | | | |
| | | | 297,383,461 |
| | Diversified Financials – (19.37%) |
| | Capital Markets – (3.82%) |
| | Bank of New York Mellon Corp. | | | | | | |
| | Consumer Finance – (7.65%) |
| | | | | | | | |
| | Capital One Financial Corp. | | | | | | |
| | | 111,197,074 |
| | Diversified Financial Services – (7.90%) |
| | Berkshire Hathaway Inc., Class A * | | | | | | |
| | | | 281,733,352 |
| | Insurance – (7.32%) |
| | Life & Health Insurance – (4.21%) |
| | AIA Group Ltd. (Hong Kong) | | | | | | |
| | Ping An Insurance (Group) Co. of China, Ltd. - H (China) | | | | | | |
| | | 61,217,608 |
| | Property & Casualty Insurance – (3.11%) |
| | | | | | | | |
| SELECTED FUNDS | Schedule of Investments |
| SELECTED AMERICAN SHARES, INC. - (CONTINUED) | June 30, 2022 (Unaudited) |
| | Shares | | Value
(Note 1) |
| COMMON STOCK – (CONTINUED) |
| | FINANCIALS – (CONTINUED) |
| | | Insurance – (Continued) |
| | | Property & Casualty Insurance – (Continued) |
| | | | | | | | | |
| | | | | | | | |
| | | 45,179,139 |
| | | | 106,396,747 |
| | | | | | | | |
| | HEALTH CARE – (9.63%) |
| | Health Care Equipment & Services – (6.42%) |
| | | | | | | | |
| | | | | | | | |
| | | | 93,379,666 |
| | Pharmaceuticals, Biotechnology & Life Sciences – (3.21%) |
| | | | | | | | |
| | | | | |
| | INDUSTRIALS – (2.32%) |
| | Capital Goods – (1.29%) |
| | Orascom Construction PLC (United Arab Emirates) | | | | | | |
| | | | | | | | |
| | | | 18,779,882 |
| | Transportation – (1.03%) |
| | DiDi Global Inc., Class A, ADS (China)* | | | | | | |
| | | | | |
| | INFORMATION TECHNOLOGY – (14.31%) |
| | Semiconductors & Semiconductor Equipment – (13.13%) |
| | | | | | | | |
| | | | | | | | |
| | | | | | | | |
| | | | 190,909,859 |
| | Software & Services – (1.18%) |
| | | | | | | | |
| | Total Information Technology | | | |
| | MATERIALS – (1.65%) |
| | Teck Resources Ltd., Class B (Canada) | | | | | | |
| | | | | |
| | TOTAL COMMON STOCK – (Identified cost $939,550,051)
| | | |
| PREFERRED STOCK – (0.85%) |
| | CONSUMER DISCRETIONARY – (0.85%) |
| | Retailing – (0.85%) |
| | Chengxin Technology, Inc., Series A-1 (China)*(a)(b)(c) | | | | | | |
| | TOTAL PREFERRED STOCK – (Identified cost $18,500,000)
| | | |
| SELECTED FUNDS | Schedule of Investments |
| SELECTED AMERICAN SHARES, INC. - (CONTINUED) | June 30, 2022 (Unaudited) |
| | Principal | | Value
(Note 1) |
| SHORT-TERM INVESTMENTS – (1.11%) |
| | | | StoneX Financial Inc. Joint Repurchase Agreement, 1.50%, 07/01/22, dated 06/30/22, repurchase value of $8,373,349 (collateralized by: U.S. Government agency mortgages and obligations in a pooled cash account, 0.375%-8.50%, 11/20/22-10/15/63, total market value $8,540,460) | | | | | | |
| | Truist Securities, Inc. Joint Repurchase Agreement, 1.49%, 07/01/22, dated 06/30/22, repurchase value of $7,814,323 (collateralized by: U.S. Government agency mortgages in a pooled cash account, 0.00%-5.00%, 11/15/27-06/01/52, total market value $7,970,280) | | | | | | |
| | TOTAL SHORT-TERM INVESTMENTS – (Identified cost $16,187,000)
| | | |
| | Total Investments – (99.88%) – (Identified cost $974,237,051) | | | 1,452,529,047 |
| | Other Assets Less Liabilities – (0.12%) | | | 1,700,324 |
| | | | | Net Assets – (100.00%) | | $ | 1,454,229,371 |
| |
| | ADR: American Depositary Receipt |
| |
| | ADS: American Depositary Share |
| |
| | * | Non-income producing security. |
| |
| | (a) | Restricted Security – See Note 6 of the Notes to Financial Statements. |
| |
| | (b) | The value of this security was determined using significant unobservable inputs. See Note 1 of the Notes to Financial Statements. |
| |
| | (c) | Includes 252,991 shares of Full Trillion Development Ltd., Class A, Pfd. |
| |
| See Notes to Financial Statements |
| SELECTED FUNDS | |
| SELECTED INTERNATIONAL FUND, INC. | June 30, 2022 (Unaudited) |
| | Shares | | Value
(Note 1) |
| COMMON STOCK – (99.22%) |
| | COMMUNICATION SERVICES – (4.43%) |
| | | Media & Entertainment – (4.43%) |
| | | | Baidu, Inc., Class A, ADR (China)* | | | | | | |
| | Fang Holdings Ltd., Class A, ADR (China)* | | | | | | |
| | iQIYI, Inc., Class A, ADR (China)* | | | | | | |
| | | | Total Communication Services | | | |
| | CONSUMER DISCRETIONARY – (29.85%) |
| | Consumer Durables & Apparel – (3.08%) |
| | Fila Holdings Corp. (South Korea) | | | | | | |
| | Retailing – (26.77%) |
| | Alibaba Group Holding Ltd., ADR (China)* | | | | | | |
| | Coupang, Inc., Class A (South Korea)* | | | | | | |
| | Delivery Hero SE (Germany)* | | | | | | |
| | JD.com, Inc., Class A, ADR (China) | | | | | | |
| | Meituan, Class B (China)* | | | | | | |
| | Naspers Ltd. - N (South Africa) | | | | | | |
| | Prosus N.V., Class N (Netherlands) | | | | | | |
| | | | 12,211,074 |
| | Total Consumer Discretionary | | | |
| | FINANCIALS – (43.43%) |
| | Banks – (24.02%) |
| | Bank of N.T. Butterfield & Son Ltd. (Bermuda) | | | | | | |
| | Danske Bank A/S (Denmark) | | | | | | |
| | DBS Group Holdings Ltd. (Singapore) | | | | | | |
| | | | | | | | |
| | Metro Bank PLC (United Kingdom)* | | | | | | |
| | | | 10,954,785 |
| | Diversified Financials – (5.69%) |
| | Capital Markets – (5.69%) |
| | Julius Baer Group Ltd. (Switzerland) | | | | | | |
| | Noah Holdings Ltd., Class A, ADS (China)* | | | | | | |
| | | | 2,593,803 |
| | Insurance – (13.72%) |
| | Life & Health Insurance – (13.72%) |
| | AIA Group Ltd. (Hong Kong) | | | | | | |
| | Ping An Insurance (Group) Co. of China, Ltd. - H (China) | | | | | | |
| | | | 6,258,492 |
| | | | | |
| | INDUSTRIALS – (3.13%) |
| | Commercial & Professional Services – (0.38%) |
| | China Index Holdings Ltd., Class A, ADR (China)* | | | | | | |
| | Transportation – (2.75%) |
| | DiDi Global Inc., Class A, ADS (China)* | | | | | | |
| | | | | |
| | INFORMATION TECHNOLOGY – (15.72%) |
| | Semiconductors & Semiconductor Equipment – (3.59%) |
| | Tokyo Electron Ltd. (Japan) | | | | | | |
| SELECTED FUNDS | Schedule of Investments |
| SELECTED INTERNATIONAL FUND, INC. - (CONTINUED) | June 30, 2022 (Unaudited) |
| | Shares/Principal | | Value
(Note 1) |
| COMMON STOCK – (CONTINUED) |
| | INFORMATION TECHNOLOGY – (CONTINUED) |
| | | Technology Hardware & Equipment – (12.13%) |
| | | | Hollysys Automation Technologies Ltd. (China) | | | | | | |
| | Samsung Electronics Co., Ltd. (South Korea) | | | | | | |
| | | | 5,532,883 |
| | | | | | | Total Information Technology | | | |
| | MATERIALS – (2.66%) |
| | Teck Resources Ltd., Class B (Canada) | | | | | | |
| | | | | |
| | TOTAL COMMON STOCK – (Identified cost $48,876,503)
| | | |
| SHORT-TERM INVESTMENTS – (1.22%) |
| | StoneX Financial Inc. Joint Repurchase Agreement, 1.50%, 07/01/22, dated 06/30/22, repurchase value of $288,012 (collateralized by: U.S. Government agency mortgages and obligations in a pooled cash account, 0.375%-8.50%, 11/20/22-10/15/63, total market value $293,760) | | | | | | |
| | Truist Securities, Inc. Joint Repurchase Agreement, 1.49%, 07/01/22, dated 06/30/22, repurchase value of $269,011 (collateralized by: U.S. Government agency mortgages in a pooled cash account, 3.00%-4.00%, 01/01/35-09/01/47, total market value $274,380) | | | | | | |
| | TOTAL SHORT-TERM INVESTMENTS – (Identified cost $557,000)
| | | |
| |
Total Investments – (100.44%) – (Identified cost $49,433,503) | | | 45,806,592 |
| | Liabilities Less Other Assets – (0.44%) | | | (199,510) |
| | Net Assets – (100.00%) | | $ | 45,607,082 |
| |
| | ADR: American Depositary Receipt |
| |
| | ADS: American Depositary Share |
| |
| | * | Non-income producing security. |
| |
| See Notes to Financial Statements |
| SELECTED FUNDS | Statements of Assets and Liabilities |
| | At June 30, 2022 (Unaudited) |
| | | | Selected American Shares | | | Selected International Fund |
| ASSETS: | | | | | | |
Investments in securities at value* (see accompanying Schedules of Investments) | | $ | 1,452,529,047 | | $ | 45,806,592 |
Cash | | | 50,634 | | | 2,205 |
| Receivables: | | | | | | |
| | | Capital stock sold | | | 39,260 | | | 85,218 |
| | Dividends and interest | | | 1,012,251 | | | 67,621 |
| | Investment securities sold | | | 7,146,103 | | | 158,524 |
Prepaid expenses | | | 29,329 | | | 1,120 |
Due from Adviser | | | – | | | 10,251 |
| | | Total assets | | | 1,460,806,624 | | | 46,131,531 |
LIABILITIES: | | | | | | |
| Payables: | | | | | | |
| | Capital stock redeemed | | | 228,810 | | | 42,047 |
| | Investment securities purchased | | | 5,138,999 | | | 414,438 |
Accrued custodian fees | | | 199,708 | | | 27,590 |
Accrued distribution service fees | | | 94,245 | | | 1,501 |
Accrued investment advisory fees | | | 733,141 | | | 22,084 |
Other accrued expenses | | | 182,350 | | | 16,789 |
| | Total liabilities | | | 6,577,253 | | | 524,449 |
NET ASSETS | | $ | 1,454,229,371 | | $ | 45,607,082 |
NET ASSETS CONSIST OF: | | | | | | |
Par value of shares of capital stock | | $ | 57,272,664 | | $ | 1,160,525 |
Additional paid-in capital | | | 865,764,762 | | | 47,345,100 |
Distributable earnings (losses) | | | 531,191,945 | | | (2,898,543) |
| | Net Assets | | $ | 1,454,229,371 | | $ | 45,607,082 |
CLASS S SHARES: | | | | | | |
Net assets | | $ | 406,465,859 | | $ | 5,258,129 |
| Shares outstanding | | | 12,828,301 | | | 538,245 |
Net asset value, offering, and redemption price per share (Net assets ÷ Shares outstanding) | | $ | 31.69 | | $ | 9.77 |
CLASS D SHARES: | | | | | | |
Net assets | | $ | 1,047,763,512 | | $ | 40,348,953 |
| Shares outstanding | | | 32,989,830 | | | 4,103,855 |
Net asset value, offering, and redemption price per share (Net assets ÷ Shares outstanding) | | $ | 31.76 | | $ | 9.83 |
*Including: | | | | | | |
| | Cost of investments | | $ | 974,237,051 | | $ | 49,433,503 |
| See Notes to Financial Statements |
| SELECTED FUNDS | |
| | For the six months ended June 30, 2022 (Unaudited) |
| | | | Selected American Shares | | | Selected International Fund |
| INVESTMENT INCOME: | | | | | | |
| Income: | | | | | | |
Dividends* | | $ | 14,517,788 | | $ | 778,044 |
Interest | | | 53,062 | | | 1,383 |
| | | Total income | | | 14,570,850 | | | 779,427 |
Expenses: | | | | | | |
Investment advisory fees (Note 3) | | | 4,815,097 | | | 137,057 |
Custodian fees | | | 210,434 | | | 28,395 |
| Transfer agent fees: | | | | | | |
| | Class S | | | 300,620 | | | 15,076 |
| | Class D | | | 340,168 | | | 20,594 |
Audit fees | | | 35,074 | | | 12,690 |
Legal fees | | | 18,346 | | | 3,876 |
Reports to shareholders | | | 24,000 | | | 1,915 |
Directors’ fees and expenses | | | 204,779 | | | 9,416 |
Registration and filing fees | | | 28,000 | | | 22,500 |
Miscellaneous | | | 48,087 | | | 9,565 |
| Distribution service fees (Note 3): | | | | | | |
| | Class S | | | 614,093 | | | 7,323 |
| Total expenses | | | 6,638,698 | | | 268,407 |
| Reimbursement of expenses by Adviser (Note 3): | | | | | | |
| | | Class S | | | – | | | (18,121) |
| | Class D | | | – | | | (43,500) |
| | Net expenses | | | 6,638,698 | | | 206,786 |
| Net investment income | | | 7,932,152 | | | 572,641 |
REALIZED AND UNREALIZED GAIN (LOSS) ON INVESTMENTS AND FOREIGN CURRENCY TRANSACTIONS: | | | | | | |
| Net realized gain (loss) from: | | | | | | |
| | Investment transactions | | | 57,250,299 | | | 1,178,621 |
| | Foreign currency transactions | | | (778) | | | (6,317) |
| Net realized gain | | | 57,249,521 | | | 1,172,304 |
Net change in unrealized appreciation (depreciation) | | | (492,114,717) | | | (9,985,520) |
| | Net realized and unrealized loss on investments and foreign currency transactions | | | (434,865,196) | | | (8,813,216) |
| Net decrease in net assets resulting from operations | | $ | (426,933,044) | | $ | (8,240,575) |
| | | | | | | | |
*Net of foreign taxes withheld of | | $ | 205,541 | | $ | 70,537 |
| See Notes to Financial Statements |
| SELECTED FUNDS | Statements of Changes in Net Assets |
| | For the six months ended June 30, 2022 (Unaudited) |
| | | | Selected American Shares | | | Selected International Fund |
| OPERATIONS: | | | | | | |
Net investment income | | $ | 7,932,152 | | $ | 572,641 |
Net realized gain from investments and foreign currency transactions | | | 57,249,521 | | | 1,172,304 |
Net change in unrealized appreciation (depreciation) on investments and foreign currency transactions | | | (492,114,717) | | | (9,985,520) |
| | | Net decrease in net assets resulting from operations | | | (426,933,044) | | | (8,240,575) |
DIVIDENDS AND DISTRIBUTIONS TO SHAREHOLDERS: | | | | | | |
| | Class S | | | (15,566,024) | | | – |
| | Class D | | | (41,863,914) | | | – |
CAPITAL SHARE TRANSACTIONS: | | | | | | |
Net decrease in net assets resulting from capital share transactions (Note 4): | | | | | | |
| | Class S | | | (18,065,108) | | | (443,317) |
| | Class D | | | (25,606,524) | | | (5,412,517) |
| |
Total decrease in net assets | | | (528,034,614) | | | (14,096,409) |
NET ASSETS: | | | | | | |
Beginning of period | | | 1,982,263,985 | | | 59,703,491 |
| End of period | | $ | 1,454,229,371 | | $ | 45,607,082 |
| See Notes to Financial Statements |
| SELECTED FUNDS | Statements of Changes in Net Assets |
| | For the year ended December 31, 2021 |
| | | | Selected American Shares | | | Selected International Fund |
| OPERATIONS: | | | | | | |
Net investment income | | $ | 8,276,265 | | $ | 457,886 |
Net realized gain from investments and foreign currency transactions | | | 253,484,915 | | | 2,074,507 |
Net increase (decrease) in unrealized appreciation on investments and foreign currency transactions | | | 65,868,021 | | | (20,657,226) |
| | | Net increase (decrease) in net assets resulting from operations | | | 327,629,201 | | | (18,124,833) |
DIVIDENDS AND DISTRIBUTIONS TO SHAREHOLDERS: | | | | | | |
| | Class S | | | (67,945,883) | | | (76,377) |
| | Class D | | | (171,206,906) | | | (748,430) |
CAPITAL SHARE TRANSACTIONS: | | | | | | |
Net increase (decrease) in net assets resulting from capital share transactions (Note 4): | | | | | | |
| | Class S | | | (22,206,450) | | | (3,854,224) |
| | Class D | | | 80,534,900 | | | (1,682,358) |
| |
Total increase (decrease) in net assets | | | 146,804,862 | | | (24,486,222) |
NET ASSETS: | | | | | | |
Beginning of year | | | 1,835,459,123 | | | 84,189,713 |
| End of year | | $ | 1,982,263,985 | | $ | 59,703,491 |
| See Notes to Financial Statements |
| SELECTED FUNDS | Notes to Financial Statements |
| | June 30, 2022 (Unaudited) |
NOTE 1 - SUMMARY OF SIGNIFICANT ACCOUNTING POLICIES
The Selected Funds (“Funds”) consist of Selected American Shares, Inc. (a Maryland corporation) (“Selected American Shares”) and Selected International Fund, Inc. (a Maryland corporation) (“Selected International Fund”). The Funds are registered under the Investment Company Act of 1940, as amended, as diversified, open-end management investment companies. The Funds follow the reporting guidance of the Financial Accounting Standards Board (“FASB”) Accounting Standards Codification Topic 946, Financial Services – Investment Companies.
Selected American Shares’ investment objective is to achieve both capital growth and income. The Fund principally invests in common stocks issued by large companies with market capitalizations of at least $10 billion.
Selected International Fund’s investment objective is to achieve capital growth. The Fund principally invests in common stocks issued by foreign companies, including companies in developed or emerging markets. The Fund may invest in large, medium, or small companies without regard to market capitalization.
An investment in the Funds, as with any mutual fund, includes risks that vary depending upon the Funds’ investment objectives and policies. There is no assurance that the investment objective of any fund will be achieved. Each Fund’s return and net asset value will fluctuate. The COVID-19 pandemic has caused market disruptions on a global scale and the long-term impact is uncertain. The aforementioned disruptions may adversely affect the value and liquidity of the Fund’s investments and thus Fund performance.
Class S and Class D shares are sold at net asset value. Income, expenses (other than those attributable to a specific class), and gains and losses are allocated daily to each class of shares based on the relative proportion of net assets represented by each class. Operating expenses directly attributable to a specific class are charged against the operations of that class. All classes have identical rights with respect to voting (exclusive of each class’ distribution arrangement), liquidation, and distributions. Selected International Fund assesses a 2% short-term trading fee on the proceeds of Fund shares that are redeemed (either by selling or exchanging into Selected American Shares) within 30 days of their purchase. The fee, which is retained by the Fund, is accounted for as an addition to paid-in capital.
Eligible Class S shares can be converted to Class D shares upon request. Class D shares offer lower expenses for shareholders who have chosen not to use an intermediary, but instead invest directly with the Funds. These conversions are non-taxable events.
The following is a summary of significant accounting policies followed by the Funds in the preparation of their financial statements.
Security Valuation - The Funds calculate the net asset value of their shares as of the close of the New York Stock Exchange (“Exchange”), normally 4:00 P.M. Eastern time, on each day the Exchange is open for business. Securities listed on the Exchange (and other national exchanges including NASDAQ) are valued at the last reported sales price on the day of valuation. Listed securities for which no sale was reported on that date are valued at the last quoted bid price. Securities traded on foreign exchanges are valued based upon the last sales price on the principal exchange on which the security is traded prior to the time when the Funds’ assets are valued. Securities (including restricted securities) for which market quotations are not readily available or securities whose values have been materially affected by what Davis Selected Advisers, L.P. (“Adviser”), the Funds’ investment adviser, identifies as a significant event occurring before the Funds’ assets are valued, but after the close of their respective exchanges will be fair valued using a fair valuation methodology applicable to the security type or the significant event as previously approved by the Funds’ Pricing Committee and Board of Directors. The Pricing Committee considers all facts it deems relevant that are reasonably available, through either public information or information available to the Adviser’s portfolio management team, when determining the fair value of a security. To assess the appropriateness of security valuations, the Adviser may consider (i) comparing prior day prices and/or prices of comparable securities; (ii) comparing sale prices to the prior or current day prices and challenge those prices exceeding certain tolerance levels with the third-party pricing service or broker source; (iii) new rounds of financing; (iv) the performance of the market or the issuer’s industry; (v) the liquidity of the security; (vi) the size of the holding in a fund; and/or (vii) any other appropriate information. The determination of a security’s fair value price often involves the consideration of a number of subjective factors and is therefore subject to the unavoidable risk that the value assigned to a security may be higher or lower than the security’s value would be if a reliable market quotation for the security was readily available. Fair value determinations are subject to review, approval, and ratification by the Funds’ Board of Directors at its next regularly scheduled meeting covering the calendar quarter in which the fair valuation was determined. Fair valuation methods used by the Funds may include, but are not limited to, valuing securities initially at cost (excluding commissions)
| SELECTED FUNDS | Notes to Financial Statements – (Continued) |
| | June 30, 2022 (Unaudited) |
NOTE 1 - SUMMARY OF SIGNIFICANT ACCOUNTING POLICIES – (CONTINUED)
Security Valuation - (Continued)
and subsequently adjusting the value due to: additional transactions by the issuer, changes in company specific fundamentals and changes in the value of similar securities. Values may be further adjusted for any discounts related to security-specific resale restrictions.
Short-term investments purchased within 60 days to maturity are valued at amortized cost, which approximates market value.
The Funds’ valuation procedures are reviewed and subject to approval by the Board of Directors. There have been no significant changes to the fair valuation procedures during the period.
Fair Value Measurements - Fair value is defined as the price that the Funds would receive upon selling an investment in an orderly transaction to an independent buyer in the principal market for the investment. Various inputs are used to determine the fair value of the Funds’ investments. These inputs are summarized in the three broad levels listed below.
Level 1 –
| quoted prices in active markets for identical securities |
Level 2 –
| other significant observable inputs (including quoted prices for similar investments, interest rates, prepayment speeds, credit risk, etc.) |
Level 3 –
| significant unobservable inputs (including the Fund’s own assumptions in determining the fair value of investments) |
The inputs or methodologies used for valuing securities are not necessarily an indication of the risks associated with investing in those securities nor can it be assured that the Funds can obtain the fair value assigned to a security if they were to sell the security.
The following is a summary of the inputs used as of June 30, 2022 in valuing each Fund’s investments carried at value:
| | Investments in Securities at Value |
| | Selected | | Selected |
| | American Shares | | International Fund |
Valuation Inputs | | | | | |
| Level 1 – Quoted Prices: | | | | | |
Common Stock: | | | | | |
| Communication Services | $ | 173,842,944 | | $ | 2,018,114 |
| Consumer Discretionary | | 141,303,602 | | | 13,613,672 |
| Consumer Staples | | 16,360,084 | | | – |
| Financials | | 685,513,560 | | | 19,807,080 |
| Health Care | | 140,056,287 | | | – |
| Industrials | | 33,699,359 | | | 1,429,043 |
| Information Technology | | 208,150,857 | | | 7,168,666 |
| Materials | | 23,930,808 | | | 1,213,017 |
| Total Level 1 | | 1,422,857,501 | | | 45,249,592 |
| Level 2 – Other Significant Observable Inputs: | | | | | |
| Short-Term Investments | | 16,187,000 | | | 557,000 |
| Total Level 2 | | 16,187,000 | | | 557,000 |
| Level 3 – Significant Unobservable Inputs: | | | | | |
Common Stock: | | | | | |
| Communication Services | | 1,150,526 | | | – |
Preferred Stock: | | | | | |
| Consumer Discretionary | | 12,334,020 | | | – |
| Total Level 3 | | 13,484,546 | | | – |
| Total Investments | $ | 1,452,529,047 | | $ | 45,806,592 |
| SELECTED FUNDS | Notes to Financial Statements – (Continued) |
| | June 30, 2022 (Unaudited) |
NOTE 1 - SUMMARY OF SIGNIFICANT ACCOUNTING POLICIES – (CONTINUED)
Fair Value Measurements - (Continued)
The following table reconciles the valuation of assets in which significant unobservable inputs (Level 3) were used in determining fair value during the six months ended June 30, 2022. The net change in unrealized appreciation (depreciation) during the period on Level 3 securities still held at June 30, 2022 was $(1,583,971) for Selected American Shares. The cost of purchases or proceeds from sales may include securities received or delivered through corporate actions or exchanges. Realized and unrealized gains (losses) are included in the related amounts on investments in the Statements of Operations.
| | | Beginning Balance at January 1, 2022 | | Cost of Purchases | | Net Change in Unrealized Appreciation (Depreciation) | | Net Realized Gain (Loss) | | Transfers into Level 3 | | Transfers out of Level 3 | | Ending Balance at June 30, 2022 |
| Selected American Shares | | | | | | | | | | | | | | | | | | | | | |
| Investments in Securities: | | | | | | | | | | | | | | | | | | | | | |
| Common Stock | | $ | 1,193,517 | | $ | – | | $ | (42,991) | | $ | – | | $ | – | | $ | – | | $ | 1,150,526 |
| Preferred Stock | | | 13,875,000 | | | – | | | (1,540,980) | | | – | | | – | | | – | | | 12,334,020 |
| Total Level 3 | | $ | 15,068,517 | | $ | – | | $ | (1,583,971) | | $ | – | | $ | – | | $ | – | | $ | 13,484,546 |
The following table is a summary of those assets in which significant unobservable inputs (Level 3) were used by the Adviser in determining fair value. Note that these amounts exclude any valuations provided by a pricing service or broker.
| | | Fair Value at | | Valuation | | Unobservable | | | | Impact to Valuation from |
| | | June 30, 2022 | | Technique | | Input(s) | | Amount(s) | | an Increase in Input |
| Selected American Shares | | | | | | | | | | | |
| Investments in Securities: | | | | | | | | | | | |
| Common Stock | | $ | 1,150,526 | | Discounted Cash Flow | | Annualized Yield | | 3.704% | | Decrease |
| | | | | | | | | | | | |
| Preferred Stock | | | 12,334,020 | | Market Approach | | Deemed Issue Price Discount for Uncertainty | | $11.5842 33.33% | | Increase Decrease |
| | | | | | | | | | | | |
| Total Level 3 | | $ | 13,484,546 | | | | | | | | |
The significant unobservable inputs listed in the above table are used in the fair value measurement of equity securities, and if changed, would affect the fair value of the Fund’s investments. The deemed issue price input is attributable to a liquidation event of a private security. The “Impact to Valuation from an Increase in Input” represents the change in fair value measurement resulting from an increase in the corresponding input. A decrease in the input would have the opposite effect.
| SELECTED FUNDS | Notes to Financial Statements – (Continued) |
| | June 30, 2022 (Unaudited) |
NOTE 1 - SUMMARY OF SIGNIFICANT ACCOUNTING POLICIES – (CONTINUED)
Master Repurchase Agreements - The Funds, along with other affiliated funds, may transfer uninvested cash balances into one or more master repurchase agreement accounts. These balances are invested in one or more repurchase agreements, secured by U.S. Government securities. A custodian bank holds securities pledged as collateral for repurchase agreements until the agreements mature. Each agreement requires that the market value of the collateral be sufficient to cover payments of interest and principal; however, in the event of default by the other party to the agreement, retention of the collateral may be subject to legal proceedings.
Currency Translation - The market values of all assets and liabilities denominated in foreign currencies are recorded in the financial statements after translation to United States Dollar (“USD”) on the date of valuation using exchange rates determined as of the close of trading on the Exchange. The cost basis of such assets and liabilities is determined based upon historical exchange rates. Income and expenses are translated at average exchange rates in effect as accrued or incurred.
Foreign Currency - The Funds may enter into forward purchases or sales of foreign currencies to hedge certain foreign currency denominated assets and liabilities against declines in market value relative to USD. Forward currency contracts are marked-to-market daily and the change in market value is recorded by the Funds as an unrealized gain or loss. When the forward currency contract is closed, the Funds record a realized gain or loss equal to the difference between the value of the forward currency contract at the time it was opened and value at the time it was closed. Investments in forward currency contracts may expose the Funds to risks resulting from unanticipated movements in foreign currency exchange rates or failure of the counter-party to the agreement to perform in accordance with the terms of the contract. There were no forward contracts entered into by the Funds.
Reported net realized foreign exchange gains or losses arise from the sales of foreign currencies, currency gains or losses realized between the trade and settlement dates on security transactions, the difference between the amounts of dividends, interest, and foreign withholding taxes recorded on the Funds’ books, and the USD equivalent of the amounts actually received or paid. Net unrealized foreign exchange gains or losses arise from changes in the value of assets and liabilities, other than investments in securities at fiscal period end, resulting from changes in the exchange rate. The Funds include foreign currency gains and losses realized on the sales of investments together with market gains and losses on such investments in the Statements of Operations.
Federal Income Taxes - It is each Fund’s policy to comply with the requirements of the Internal Revenue Code applicable to regulated investment companies, and to distribute substantially all of its taxable income, including any net realized gains on investments not offset by loss carryovers, to shareholders. Therefore, no provision for federal income or excise tax is required. The Adviser analyzed the Funds’ tax positions taken on federal and state income tax returns for all open tax years and concluded that as of June 30, 2022, no provision for income tax is required in the Funds’ financial statements related to these tax positions. The Funds’ federal and state (Arizona) income and federal excise tax returns for tax years for which the applicable statutes of limitations have not expired are subject to examination by the Internal Revenue Service and state Department of Revenue. The earliest tax year that remains subject to examination by these jurisdictions is 2018.
Under current tax regulations, ordinary losses realized after October 31 (“post-October” losses; for the period from November 1, 2021 through December 31, 2021) may be deferred and treated as occurring on the first business day of the following fiscal year. At December 31, 2021, the Selected International Fund had ordinary post-October losses in the amount of $139,778.
Additionally, based on the Funds’ understanding of the tax rules and rates related to income, gains, and transactions for the foreign jurisdictions in which they invest, the Funds will provide for foreign taxes, and where appropriate, deferred foreign taxes.
| SELECTED FUNDS | Notes to Financial Statements – (Continued) |
| | June 30, 2022 (Unaudited) |
NOTE 1 - SUMMARY OF SIGNIFICANT ACCOUNTING POLICIES – (CONTINUED)
Federal Income Taxes - (Continued)
At June 30, 2022, the aggregate cost of investments and unrealized appreciation (depreciation) for federal income tax purposes were as follows:
| | Selected | | Selected |
| | American Shares | | International Fund |
| Cost | $ | 978,025,983 | | $ | 51,083,510 |
Unrealized appreciation | | 597,576,239 | | | 6,849,170 |
| Unrealized depreciation | | (123,073,175) | | | (12,126,088) |
| Net unrealized appreciation (depreciation) | $ | 474,503,064 | | $ | (5,276,918) |
Securities Transactions and Related Investment Income - Securities transactions are accounted for on the trade date (date the order to buy or sell is executed) with realized gain or loss on the sale of securities being determined based upon identified cost. Dividend income is recorded on the ex-dividend date. Interest income, which includes accretion of discount and amortization of premium, is accrued as earned.
Dividends and Distributions to Shareholders - Dividends and distributions to shareholders are recorded on the ex-dividend date. Net investment income (loss), net realized gains (losses), and net unrealized appreciation (depreciation) on investments [collectively “Distributable earnings (losses)”] may differ for financial statement and tax purposes primarily due to permanent and temporary differences which may include wash sales, foreign currency transactions, equalization, corporate actions, partnership income, Directors’ deferred compensation, net operating losses, deferred post-October losses, and passive foreign investment company shares. The character of dividends and distributions made during the fiscal year from net investment income and net realized securities gains may differ from their ultimate characterization for federal income tax purposes. Also, due to the timing of dividends and distributions, the fiscal year in which amounts are distributed may differ from the fiscal year in which income or realized gain was recorded by the Funds. The Funds adjust certain components of capital to reflect permanent differences between financial statement amounts and net income and realized gains/losses determined in accordance with income tax rules.
| SELECTED FUNDS | Notes to Financial Statements – (Continued) |
| | June 30, 2022 (Unaudited) |
NOTE 1 - SUMMARY OF SIGNIFICANT ACCOUNTING POLICIES – (CONTINUED)
Indemnification - Under the Funds’ organizational documents, their officers and directors are indemnified against certain liabilities arising out of the performance of their duties to the Funds. In addition, some of the Funds’ contracts with their service providers contain general indemnification clauses. The Funds’ maximum exposure under these arrangements is unknown since the amount of any future claims that may be made against the Funds cannot be determined and the Funds have no historical basis for predicting the likelihood of any such claims.
Use of Estimates in Financial Statements - In preparing financial statements in conformity with accounting principles generally accepted in the United States of America, management makes estimates and assumptions that affect the reported amounts of assets and liabilities and disclosure of contingent assets and liabilities at the date of the financial statements, as well as the reported amounts of income and expenses during the reporting period. Actual results may differ from these estimates.
Directors Fees and Expenses - The Funds set up a Rabbi Trust to provide for the deferred compensation plan for Independent Directors that enables them to elect to defer receipt of all or a portion of annual fees they are entitled to receive. The value of an eligible Director’s account is based upon years of service and fees paid to each Director during the years of service. The amount paid to the Director by the Trust under the plan will be determined based upon the performance of the Funds in which the amounts are invested.
NOTE 2 - PURCHASES AND SALES OF SECURITIES
The cost of purchases and proceeds from sales of investment securities (excluding short-term investments) during the six months ended June 30, 2022 were as follows:
| | Selected American Shares | | Selected International Fund |
| Cost of purchases | $ | 58,222,833 | | $ | 2,025,995 |
| Proceeds from sales | | 156,105,016 | | | 4,767,966 |
NOTE 3 - FEES AND OTHER TRANSACTIONS WITH SERVICE PROVIDERS (INCLUDING AFFILIATES)
Davis Selected Advisers-NY, Inc. (“DSA-NY”), a wholly-owned subsidiary of the Adviser, acts as sub-adviser to the Funds. DSA-NY performs research and portfolio management services for the Funds under a Sub-Advisory Agreement with the Adviser. The Funds pay no fees directly to DSA-NY.
All officers of the Funds (including Interested Directors) hold positions as executive officers with the Adviser or its affiliates.
As of June 30, 2022, related shareholders with greater than 20% of outstanding shares were as follows:
Selected American Shares | | Selected International Fund |
| n/a | | 29% |
Investment activities of this shareholder could have a material impact on the Fund.
Investment Advisory Fees and Reimbursement of Expenses - Advisory fees are paid monthly to the Adviser. The annual rate for Selected American Shares is 0.55% of the average net assets for the first $3 billion, 0.54% on the next $1 billion, 0.53% on the next $1 billion, 0.52% on the next $1 billion, 0.51% on the next $1 billion, 0.50% on the next $3 billion, and 0.485% of the average net assets in excess of $10 billion. Advisory fees paid during the six months ended June 30, 2022 approximated 0.55% of the average net assets for Selected American Shares. The fixed annual rate for Selected International Fund is 0.55% of the average net assets. The Adviser is contractually committed to waive fees and/or reimburse Selected International Fund’s expenses to the extent necessary to cap total annual Fund operating expenses (Class S shares, 1.05%, and Class D shares, 0.80%) until May 1, 2023. After that date, there is no assurance that the Adviser will continue to cap expenses. The expense cap cannot be terminated prior to that date without the consent of the Board of Directors. During the six months ended June 30, 2022, such reimbursements for Class S and Class D of Selected International Fund amounted to $18,121 and $43,500, respectively, and are not subject to future recoupment.
| SELECTED FUNDS | Notes to Financial Statements – (Continued) |
| | June 30, 2022 (Unaudited) |
NOTE 3 - FEES AND OTHER TRANSACTIONS WITH SERVICE PROVIDERS (INCLUDING AFFILIATES) – (CONTINUED)
Transfer Agent and Accounting Fees - DST Asset Manager Solutions, Inc. is the Funds’ primary transfer agent. The Adviser is also paid for certain transfer agent services. The fees paid to the Adviser during the six months ended June 30, 2022 were $75,895 and $6,763 for Selected American Shares and Selected International Fund, respectively. State Street Bank and Trust Company (“State Street Bank”) is the Funds’ primary accounting provider. Fees for such services are included in the custodian fees as State Street Bank also serves as the Funds’ custodian.
Distribution Service Fees - For services under the distribution agreement, the Funds’ Class S shares pay an annual fee of 0.25% of average daily net assets. During the six months ended June 30, 2022, Selected American Shares and Selected International Fund incurred distribution service fees totaling $614,093 and $7,323 respectively.
There are no distribution service fees for the Funds’ Class D shares.
NOTE 4 - CAPITAL STOCK
At June 30, 2022, there were 600 million shares of capital stock of Selected American Shares ($1.25 par value per share) and 50 million shares of capital stock of Selected International Fund ($0.25 par value per share) authorized. Transactions in capital stock were as follows:
| | Six months ended June 30, 2022 (Unaudited) |
| | | Sold | | | Reinvestment of Distributions | | | Redeemed* | | | Net Decrease |
| Selected American Shares | | | | | | | | | | | |
| Shares: Class S | | 51,762 | | | 476,415 | | | (929,175) | | | (400,998) |
| Class D | | 299,411 | | | 1,207,917 | | | (2,022,593) | | | (515,265) |
| Value: Class S | $ | 2,006,605 | | $ | 15,388,196 | | $ | (35,459,909) | | $ | (18,065,108) |
| Class D | | 11,572,170 | | | 39,112,343 | | | (76,291,037) | | | (25,606,524) |
| | | | | | | | | | | | |
| Selected International Fund | | | | | | | | | | | |
| Shares: Class S | | 13,194 | | | – | | | (57,171) | | | (43,977) |
| Class D | | 24,889 | | | – | | | (499,666) | | | (474,777) |
| Value: Class S | $ | 137,316 | | $ | – | | $ | (580,633) | | $ | (443,317) |
| Class D | | 253,091 | | | – | | | (5,665,608) | | | (5,412,517) |
| | | | | | | | | | | | |
* Selected International Fund: net of short-term trading fees amounting to $2 for Class S.
| | Year ended December 31, 2021 |
| | | Sold | | | Reinvestment of Distributions | | | Redeemed* | | | Net Increase (Decrease) |
| Selected American Shares | | | | | | | | | | | |
| Shares: Class S | | 174,329 | | | 1,516,893 | | | (2,152,205) | | | (460,983) |
| Class D | | 1,269,967 | | | 3,607,734 | | | (3,029,621) | | | 1,848,080 |
| Value: Class S | $ | 8,132,046 | | $ | 67,182,983 | | $ | (97,521,479) | | $ | (22,206,450) |
| Class D | | 59,019,262 | | | 159,965,469 | | | (138,449,831) | | | 80,534,900 |
| | | | | | | | | | | | |
| Selected International Fund | | | | | | | | | | | |
| Shares: Class S | | 233,254 | | | 6,370 | | | (588,297) | | | (348,673) |
| Class D | | 154,526 | | | 60,923 | | | (324,266) | | | (108,817) |
| Value: Class S | $ | 3,564,535 | | $ | 75,486 | | $ | (7,494,245) | | $ | (3,854,224) |
| Class D | | 2,116,040 | | | 725,598 | | | (4,523,996) | | | (1,682,358) |
| | | | | | | | | | | | |
* Selected International Fund: net of short-term trading fees amounting to $2,253 and $2 for Class S and Class D, respectively.
NOTE 5 - SECURITIES LOANED
The Funds have entered into a securities lending arrangement with State Street Bank. Under the terms of the agreement, the Funds receive fee income from lending transactions; in exchange for such fees, State Street Bank is authorized to loan securities on behalf of the Funds, against receipt of collateral at least equal to the value of the securities loaned. As of June 30, 2022, the Funds did not have any securities on loan. The Funds bear the risk of any deficiency in the amount of the collateral available for return to a borrower due to a loss in an approved investment.
| SELECTED FUNDS | Notes to Financial Statements – (Continued) |
| | June 30, 2022 (Unaudited) |
NOTE 6 - RESTRICTED SECURITIES
Restricted securities are not registered under the Securities Act of 1933 and may have contractual restrictions on resale. They are fair valued under methods approved by the Board of Directors. The aggregate value of restricted securities in Selected American Shares amounted to $13,484,546 or 0.93% of the Fund’s net assets as of June 30, 2022. Information regarding restricted securities is as follows:
| Fund | | Security | | Initial Acquisition Date | | Units/Shares | | Cost per Unit/Share | | Valuation per Unit/Share as of June 30, 2022 |
| | | | | | | | | | | | | |
| Selected American Shares | | ASAC II L.P. | | 10/10/13 | | 1,174,606 | | $ | 1.00 | | $ | 0.9795 |
| | | | | | | | | | | | | |
| Selected American Shares | | Chengxin Technology, Inc., Series A-1, Pfd.* | | 03/29/21 | | 1,850,000 | | $ | 10.00 | | $ | 7.7232 |
*Includes 252,991 shares of Full Trillion Development Ltd., Class A, Pfd.
The following financial information represents selected data for each share of capital stock outstanding throughout each period: |
| | | Income (Loss) from Investment Operations |
| | Net Asset Value, Beginning of Period | Net Investment Income (Loss)a | Net Realized and Unrealized Gains (Losses) | Total from Investment Operations |
| Selected American Shares Class S: | | | | |
Six months ended June 30, 2022e | $42.34 | $0.13 | $(9.53) | $(9.40) |
| Year ended December 31, 2021 | $40.41 | $0.08 | $7.16 | $7.24 |
| Year ended December 31, 2020 | $37.22 | $0.14 | $4.17 | $4.31 |
| Year ended December 31, 2019 | $29.94 | $0.19 | $8.97 | $9.16 |
| Year ended December 31, 2018 | $40.53 | $0.20 | $(5.35) | $(5.15) |
| Year ended December 31, 2017 | $35.76 | $0.15 | $7.46 | $7.61 |
| Selected American Shares Class D: | | | | |
Six months ended June 30, 2022e | $42.45 | $0.19 | $(9.57) | $(9.38) |
| Year ended December 31, 2021 | $40.50 | $0.23 | $7.18 | $7.41 |
| Year ended December 31, 2020 | $37.29 | $0.24 | $4.20 | $4.44 |
| Year ended December 31, 2019 | $29.99 | $0.30 | $8.99 | $9.29 |
| Year ended December 31, 2018 | $40.59 | $0.33 | $(5.36) | $(5.03) |
| Year ended December 31, 2017 | $35.80 | $0.28 | $7.47 | $7.75 |
| Selected International Fund Class S: | | | | |
Six months ended June 30, 2022e | $11.52 | $0.11 | $(1.86) | $(1.75) |
| Year ended December 31, 2021 | $14.92 | $0.06 | $(3.33) | $(3.27) |
| Year ended December 31, 2020 | $12.56 | $(0.03) | $2.64 | $2.61 |
| Year ended December 31, 2019 | $10.45 | $0.04 | $2.77 | $2.81 |
| Year ended December 31, 2018 | $14.44 | $0.04 | $(3.23) | $(3.19) |
| Year ended December 31, 2017 | $10.45 | $(0.03) | $4.02 | $3.99 |
| Selected International Fund Class D: | | | | |
Six months ended June 30, 2022e | $11.58 | $0.12 | $(1.87) | $(1.75) |
| Year ended December 31, 2021 | $15.00 | $0.09 | $(3.34) | $(3.25) |
| Year ended December 31, 2020 | $12.62 | $(0.01) | $2.66 | $2.65 |
| Year ended December 31, 2019 | $10.50 | $0.06 | $2.80 | $2.86 |
| Year ended December 31, 2018 | $14.53 | $0.09 | $(3.26) | $(3.17) |
| Year ended December 31, 2017 | $10.50 | $0.05 | $4.03 | $4.08 |
a | Per share calculations were based on average shares outstanding for the period. |
| | |
b | Assumes hypothetical initial investment on the business day before the first day of the fiscal period, with all dividends and distributions reinvested in additional shares on the reinvestment date, and redemption at the net asset value calculated on the last business day of the fiscal period. Total returns are not annualized for periods of less than one year. |
| | |
c | The ratios in this column reflect the impact, if any, of certain reimbursements. |
| | |
d | The lesser of purchases or sales of portfolio securities for a period, divided by the monthly average of the market value of portfolio securities owned during the period. Securities with a maturity or expiration date at the time of acquisition of one year or less are excluded from the calculation. |
| Dividends and Distributions | | | | Ratios to Average Net Assets | |
Dividends from Net Investment Income | Distributions from Realized Gains | Return of Capital | Total Distributions | Net Asset Value, End of Period | Total Returnb | Net Assets, End of Period (in millions) | Gross Expense Ratio | Net Expense Ratioc | Net Investment Income (Loss) Ratio | Portfolio Turnoverd |
| | | | | | | | | | | |
| $(0.14) | $(1.11) | $– | $(1.25) | $31.69 | (22.25)% | $406 | 0.99%f | 0.99%f | 0.67%f | 3% |
| $(0.07) | $(5.24) | $– | $(5.31) | $42.34 | 17.72% | $560 | 0.98% | 0.98% | 0.18% | 20% |
| $(0.15) | $(0.97) | $– | $(1.12) | $40.41 | 11.61% | $553 | 0.98% | 0.98% | 0.39% | 12% |
| $(0.41) | $(1.47) | $– | $(1.88) | $37.22 | 31.15% | $656 | 0.98% | 0.98% | 0.56% | 11% |
| $(0.19) | $(5.25) | $– | $(5.44) | $29.94 | (14.00)% | $656 | 0.97% | 0.97% | 0.52% | 24% |
| $(0.15) | $(2.69) | $– | $(2.84) | $40.53 | 21.77% | $911 | 0.97% | 0.97% | 0.39% | 13% |
| | | | | | | | | | | |
| $(0.20) | $(1.11) | $– | $(1.31) | $31.76 | (22.15)% | $1,048 | 0.67%f | 0.67%f | 0.99%f | 3% |
| $(0.22) | $(5.24) | $– | $(5.46) | $42.45 | 18.10% | $1,422 | 0.67% | 0.67% | 0.49% | 20% |
| $(0.26) | $(0.97) | $– | $(1.23) | $40.50 | 11.95% | $1,282 | 0.67% | 0.67% | 0.70% | 12% |
| $(0.52) | $(1.47) | $– | $(1.99) | $37.29 | 31.57% | $1,264 | 0.66% | 0.66% | 0.88% | 11% |
| $(0.32) | $(5.25) | $– | $(5.57) | $29.99 | (13.71)% | $1,025 | 0.65% | 0.65% | 0.84% | 24% |
| $(0.27) | $(2.69) | $– | $(2.96) | $40.59 | 22.18% | $1,344 | 0.65% | 0.65% | 0.71% | 13% |
| | | | | | | | | | | |
| $– | $– | $– | $– | $9.77 | (15.19)% | $5 | 1.67%f | 1.05%f | 2.08%f | 4% |
| $(0.13) | $– | $– | $(0.13) | $11.52 | (21.94)% | $7 | 1.37% | 1.05% | 0.39% | 22% |
| $(0.03) | $(0.22) | $– | $(0.25) | $14.92 | 20.77% | $14 | 1.44% | 1.11% | (0.28)% | 23% |
| $(0.34) | $(0.36) | $– | $(0.70) | $12.56 | 27.15% | $7 | 1.50% | 1.15% | 0.27% | 9% |
| $(0.01) | $(0.79) | $– | $(0.80) | $10.45 | (22.27)% | $9 | 1.31% | 1.26% | 0.30% | 31% |
$–g | $– | $– | $–g | $14.44 | 38.22% | $34 | 1.28% | 1.25% | (0.07)% | 12% |
| | | | | | | | | | | |
| $– | $– | $– | $– | $9.83 | (15.11)% | $40 | 1.00%f | 0.80%f | 2.33%f | 4% |
| $(0.17) | $– | $– | $(0.17) | $11.58 | (21.72)% | $53 | 0.90% | 0.80% | 0.64% | 22% |
| $(0.05) | $(0.22) | $– | $(0.27) | $15.00 | 21.08% | $70 | 0.89% | 0.87% | (0.04)% | 23% |
| $(0.38) | $(0.36) | $– | $(0.74) | $12.62 | 27.45% | $61 | 0.90% | 0.90% | 0.52% | 9% |
| $(0.07) | $(0.79) | $– | $(0.86) | $10.50 | (22.05)% | $48 | 0.89% | 0.89% | 0.67% | 31% |
| $(0.05) | $– | $– | $(0.05) | $14.53 | 38.90% | $69 | 0.87% | 0.87% | 0.31% | 12% |
e | Unaudited. |
| | |
f | Annualized. |
| | |
g | Less than $0.005 per share. |
See Notes to Financial Statements
| SELECTED FUNDS | Director Approval of Advisory Agreements ( Unaudited) |
Process of Annual Review
The Board of Directors of the Selected Funds oversees the management of each Selected Fund and, as required by law, determines annually whether to approve the continuance of each Selected Fund’s advisory agreement with Davis Selected Advisers, L.P. and sub-advisory agreement with Davis Selected Advisers-NY, Inc. (jointly “Davis Advisors” and “Advisory Agreements”).
With the assistance of counsel to the Independent Directors, the Independent Directors undertook a comprehensive review process in anticipation of their annual contract review meeting, held in April 2022. As part of this process, Davis Advisors provided the Independent Directors with material (including recent investment performance data) that was responsive to questions submitted to Davis Advisors by the Independent Directors. At this meeting, the Independent Directors reviewed and evaluated all information which they deemed reasonably necessary under the circumstances and were provided guidance by their independent counsel. In reaching their decision, the Independent Directors also took into account information furnished to them throughout the year and otherwise provided to them during their quarterly meetings or through other prior communications. The Independent Directors concluded that they had been supplied with sufficient information and data to analyze the Advisory Agreements and that their questions had been sufficiently answered by Davis Advisors. Upon completion of this review, the Independent Directors found that the terms of the Advisory Agreements were fair and reasonable and that continuation of the Advisory Agreements is in the best interests of Selected American Shares and Selected International Fund (each individually a “Fund” or collectively the “Funds”), and their shareholders.
Reasons the Independent Directors Approved Continuation of the Advisory Agreements
The Independent Directors’ determinations were based upon a comprehensive consideration of all information provided to them, and they did not identify any single item or piece of information as the controlling factor. Each Independent Director did not necessarily attribute the same weight to each factor. The following considerations and conclusions were important, but not exclusive, to the Independent Directors’ recommendation to renew the Advisory Agreements.
The Independent Directors considered the investment performance of each Fund on an absolute basis as well as relative to its benchmark and other comparable funds. The Independent Directors not only considered the investment performance of each Fund, but also the full range and quality of services provided by Davis Advisors to each Fund and its shareholders, including whether a Fund:
| 1. | achieves satisfactory investment results over the long-term, after all costs; |
| 2. | efficiently and effectively handles shareholder transactions, inquiries, requests and records, provides quality accounting, legal and compliance services, and oversees third-party service providers; and |
| 3. | fosters healthy investor behavior. |
Davis Advisors is reimbursed a portion of its costs in providing some but not all of these services.
A shareholder’s ultimate return is the product of a fund’s results as well as the shareholder’s behavior, specifically in selecting when to invest or redeem. The Independent Directors concluded that, through its actions and communications, Davis Advisors has attempted to have a meaningful positive impact on investor behavior.
In aggregate, Davis Advisors, employees of Davis Advisors, and the Davis family have made significant investments in the Funds. The Independent Directors considered that these investments tend to align Davis Advisors’, Davis Advisors’ employees, and the Davis family’s interests with other shareholders, as they face the same risks, pay the same fees, and are motivated to achieve satisfactory long-term returns.
The Independent Directors noted the importance of reviewing quantitative measures, but recognized that qualitative factors are also important in assessing whether Selected Funds’ shareholders are likely to be well served by the renewal of the Advisory Agreements. They noted both the value and shortcomings of purely quantitative measures, including the data provided by independent service providers, and concluded that, while such measures and data may be informative, the judgment of the Independent Directors must take many factors into consideration in representing the shareholders of the Selected Funds, including those listed below. In connection with reviewing comparative performance information, the Independent Directors generally give greater weight to longer-term measurements.
| SELECTED FUNDS | Director Approval of Advisory Agreements (Unaudited) – (Continued) |
Reasons the Independent Directors Approved Continuation of the Advisory Agreements – (Continued)
The Independent Directors noted that Davis Advisors employs a disciplined, company-specific, research-driven, businesslike, long-term investment philosophy. The Independent Directors considered the quality of Davis Advisors’ investment process, as well as the experience, capability, and integrity of its senior management and other personnel.
The Independent Directors recognized Davis Advisors’ (a) efforts to minimize transaction costs by generally having a long- term time horizon and low portfolio turnover; (b) focus on tax efficiency; (c) record of generally producing satisfactory results over longer-term periods; (d) efforts towards fostering healthy investor behavior by, among other things, providing informative and substantial educational material; and (e) efforts to promote shareholder interests by actively speaking out on corporate governance issues.
The Independent Directors assessed (a) comparative fee and expense information for other funds, as selected and analyzed by a nationally recognized independent service provider; (b) information regarding fees charged by Davis Advisors to other advisory clients, which includes other funds it advises, other funds which it sub-advises, and private accounts, as well as the differences in the services provided to such other clients; and (c) the fee schedule of each Fund, including an assessment of competitive fee schedules.
The Independent Directors reviewed the management fee schedule for each Fund, the profitability of each Fund to Davis Advisors, the extent to which economies of scale might be realized if the Funds’ net assets increase, and whether the fee schedules should reflect those potential economies of scale at this time. The Independent Directors considered the nature, quality, and extent of the services being provided to each Fund and the costs incurred by Davis Advisors in providing such services. The Independent Directors considered various potential benefits that Davis Advisors may receive in connection with the services it provides under the Advisory Agreements with the Funds, including a review of portfolio brokerage practices. The Independent Directors noted that Davis Advisors does not use client commissions to pay for publications that are available to the general public or for research reports that are created by parties other than the broker-dealers providing trade execution, clearing and/or settlement services to the Funds.
The Independent Directors compared the fees paid to Davis Advisors by the Selected Funds with those paid by Davis Advisors’ advised and sub-advised clients, private account clients, and managed money/wrap clients. To the extent sub- advised, private account, or managed money/wrap fees were lower than fees paid by the Funds, the Independent Directors noted that the range of services provided to the Funds is more extensive, with greater risks associated with operating SEC registered, publicly traded mutual funds. Serving as the primary adviser for mutual funds is more work because of the complex overlay of regulatory, tax, and accounting issues, which are unique to mutual funds. In addition, the operational work required to service shareholders is more extensive because of the significantly greater number of shareholders, and managing trading is more complex because of the more frequent fund flows. With respect to risk, not only has regulation become more complex and burdensome, but the scrutiny of regulators and shareholders has become more intense. The Independent Directors concluded that reasonable justifications existed for any differences between the fee rates for the Funds and Davis Advisors’ other lines of business.
Selected American Shares
The Independent Directors noted that Selected American Shares’ Class S shares underperformed its benchmark, the Standard & Poor’s 500® Index (“S&P 500®”), over the one-, three-, five-, and ten-year time periods, and since Davis Advisors took over the daily management of the Fund on May 1, 1993, all periods ended March 31, 2022.
Broadridge, an independent service provider, presented a report to the Independent Directors that compared the Fund to all Lipper retail and institutional large-cap value funds (the “Performance Universe Average”), as well as the relevant Lipper Index. The report indicated that the Fund’s Class D shares outperformed both the Performance Universe Average and the Lipper Index over the three- and five-year time periods, underperformed both over the one- and four-year time periods, and outperformed the Performance Universe Average and was in-line with the Lipper Index over the two- and ten-year time periods, all periods ended December 31, 2021.
The Independent Directors also reviewed the Fund’s Class S shares performance versus both the S&P 500® and the Lipper Large-Cap Value category when measured over rolling five- and ten-year time frames. The Fund outperformed the S&P 500® in 11 out of 25 rolling five-year time periods and outperformed the Lipper Large-Cap Value category in 14 out of 25 rolling five-year time periods, all periods ended December 31 for each year from 1997 through 2021. The Fund outperformed the
| SELECTED FUNDS | Director Approval of Advisory Agreements (Unaudited) – (Continued) |
Selected American Shares – (Continued)
S&P 500® in 10 out of 20 rolling ten-year time periods and outperformed the Lipper Large-Cap Value category in 8 out of 20 rolling ten-year time periods, all periods ended December 31 for each year from 2002 through 2021.
The Independent Directors considered Selected American Shares’ management fee and total expense ratio. They observed that both, the Fund’s Class D shares current management fee and total expense ratio, were reasonable and below the average and median of its expense group, as determined by Broadridge. The Directors noted that Class D shares do not pay any 12b-1 fees.
Selected International Fund
Davis Advisors became the investment adviser to Selected Special Shares on May 1, 1993. Davis Advisors oversaw a sub- adviser from 1993 to May 31, 2001, at which point, Davis Advisors began active daily management of the Fund. On May 1, 2011, the Fund changed its name from Selected Special Shares to Selected International Fund and changed its investment strategy from primarily investing in domestic equity securities to primarily investing in foreign equity securities. While the Independent Directors reviewed all time periods, these changes limit the relevance of long-term comparisons against the Fund’s benchmark, the Morgan Stanley Capital International All Country World Index ex USA (“MSCI ACWI ex USA”).
The Independent Directors noted that Selected International Fund’s Class S shares underperformed the MSCI ACWI ex USA over the one-, three- five-, and ten-year time periods, and since Davis Advisors took over the daily management of the Fund on May 1, 1993, all periods ended March 31, 2022.
Broadridge, an independent service provider, presented a report to the Independent Directors that compared the Fund to all Lipper retail and institutional international multi-cap growth funds (the “Performance Universe Average”), as well as the relevant Lipper Index. The Fund’s Class D shares underperformed the Performance Universe Average and the Lipper Index over the one-, two-, three-, four-, five-, and ten-year time periods, all periods ended December 31, 2021.
The Independent Directors also reviewed the Fund’s Class S shares performance versus both the MSCI ACWI ex USA and the Lipper International Multi-Cap Growth category when measured over rolling five- and ten-year time frames since its investment strategy change in 2011. The Fund outperformed the MSCI ACWI ex USA in 5 out of 6 rolling five-year time periods and outperformed the Lipper International Multi-Cap Growth category in 3 out of 6 rolling five-year time periods, all periods ended December 31 for each year from 2016 through 2021. The Fund underperformed both the MSCI ACWI ex USA and the Lipper International Multi-Cap Growth category in its first rolling ten-year time period, ended December 31, 2021.
The Independent Directors considered Selected International Fund’s management fee and total expense ratio. They observed that both, the Fund’s Class D shares’ current management fee and total expense ratio, were reasonable and well below the average and median of its expense group, as determined by Broadridge. The Independent Directors also noted that the Adviser has capped expenses of Class S and Class D shares through May 1, 2023, and that Class D shares do not pay any 12b-1 fees.
Approval of Advisory Agreements
The Independent Directors concluded that Davis Advisors had provided Selected American Shares, Selected International Fund, and their shareholders a reasonable level of both investment and non-investment services. The Independent Directors further concluded that shareholders have received a significant benefit from Davis Advisors’ shareholder-oriented approach, as well as the execution of its investment discipline.
The Independent Directors determined that the advisory fees for Selected American Shares and Selected International Fund were reasonable in light of the nature, quality and extent of the services being provided to the Funds, the costs incurred by Davis Advisors in providing such services, and in comparison to the range of the average advisory fees of their peer groups as determined by an independent service provider. The Independent Directors found that the terms of the Advisory Agreements are fair and reasonable and that continuation of the Advisory Agreements is in the best interests of each Fund and its shareholders. The Independent Directors and the full Board of Directors therefore voted to continue the Advisory Agreements.
| SELECTED FUNDS | Liquidity Risk Management Program |
Following is a description of the operation and effectiveness of the Liquidity Risk Management Program (“LRMP”) that was adopted by the Board of Directors (the “Board”) in accordance with Rule 22e-4 under the Investment Company Act of 1940 (the “Liquidity Rule”). The Liquidity Rule is meant to promote effective liquidity risk management practices in order to reduce the likelihood that a fund would be unable to meet its redemption obligations.
The Board has appointed Davis Selected Advisers, L.P. (the “Adviser”) to serve as the Administrator of the LRMP, subject to the supervision of the Board. The Adviser has engaged a third party to perform certain functions, including the production of liquidity classification model information.
The Adviser monitors the adequacy and effectiveness of the implementation of the LRMP on an ongoing basis. This monitoring includes a review of the Funds’ liquidity risk based on a variety of factors including the Funds’ (1) investment strategy, (2) portfolio liquidity and cash flow projections during normal and reasonably foreseeable stressed conditions, (3) shareholder redemptions, and (4) borrowing arrangements and other funding sources. The Liquidity Rule places a 15% limit on a fund’s illiquid investments and requires a fund that does not primarily hold assets that are highly liquid investments to determine and maintain a minimum percentage of the funds’ net assets in highly liquid investments (highly liquid investment minimum or HLIM). The LRMP includes provisions and safeguards that are reasonably designed to comply with the 15% limit on illiquid investments and the Funds are currently classified as Funds that primarily hold highly liquid investments. The LRMP includes the classification, no less than monthly, of the Funds’ investments into one of four liquidity classifications as provided for in the Liquidity Rule.
At a recent meeting of the Funds’ Board of Directors, the Adviser provided a written report to the Board pertaining to the operation, adequacy, and effectiveness of implementation of the LRMP from April 1, 2021 through March 31, 2022. The report concluded that the LRMP is operating effectively and is reasonably designed to assess and manage the Funds’ liquidity risk. There can be no guarantee that the LRMP will achieve its objectives in the future. Additional information regarding risks of investing in the Funds, including liquidity risks presented by the Funds’ investment portfolio, is found in the Funds’ Prospectus and Statement of Additional Information.
| SELECTED FUNDS | Privacy Notice and Householding |
Privacy Notice
While you generally will be dealing with a broker-dealer or other financial adviser, we may collect information about you from your account application and other forms that you may deliver to us. We use this information to process your requests and transactions; for example, to provide you with additional information about our Funds, to open an account for you, or to process a transaction. In order to service your account and execute your transactions, we may provide your personal information to firms that assist us in servicing your account, such as our transfer agent. We may also provide your name and address to one of our agents for the purpose of mailing to you your account statement and other information about our products and services. We may also gather information through the use of “cookies” when you visit our website. These files help us to recognize repeat visitors and allow easy access to and use of the website. We require these outside firms and agents to protect the confidentiality of your information and to use the information only for the purpose for which the disclosure is made. We do not provide customer names and addresses to outside firms, organizations, or individuals except in furtherance of our business relationship with you or as otherwise allowed by law.
We restrict access to nonpublic personal information about you to those employees who need to know that information to provide products or services to you. We maintain physical, electronic, and procedural safeguards that comply with federal standards to guard your personal information.
Householding
The Funds may, on occasion, mail notices, reports, prospectuses, or proxy material to shareholders. To avoid sending duplicate copies of materials to households, the Funds will mail only one copy of these items to shareholders having the same last name and address on the Funds’ records. The consolidation of these mailings, called householding, benefits the Funds through reduced mailing expense. If you have a direct account with the Funds and you do not want the mailing of these documents to be combined with those to other members of your household, please contact Selected Funds by phone at 1-800-243-1575. Your instructions will become effective within 30 days of your notice to the Funds.
For the purpose of their service as Directors to the Selected Funds, the business address for each of the Directors is 2949 E. Elvira Road, Suite 101, Tucson, AZ 85756. Each Director serves until retirement, resignation, death, or removal. After turning 75, each Director will be annually reviewed by the Independent Directors, and a majority of the Independent Directors (with such Director abstaining) may request such Director’s resignation as of the last business day of the year. Subject to further exceptions and exemptions that may be granted by the Independent Directors, Directors must retire from the Board and cease being a Director at the close of business on the last day of the calendar year in which the Director attains age 80.
Name, Date of Birth, Position(s) Held with Funds, Length of Service | Principal Occupation(s) During Past Five Years | Number of Portfolios Overseen | Other Directorships |
Independent Directors
| | | | |
Francisco L. Borges (11/17/51) Director since 2006 | Partner and Co-Head, Ares Management Corp. (global alternative investment manager) since 2021; Chairman and Managing Partner, Landmark Partners, LLC (private equity firm) until 2021. | 3 | Chairman and Trustee, John S. and James L. Knight Foundation; Chairman/Director, Assured Guaranty Ltd. (financial guaranty insurance business); Trustee, Millbrook School; Trustee, Clipper Funds Trust (consisting of one portfolio); Director, Hartford HealthCare (healthcare network). |
| | | | |
Lawrence E. Harris (09/16/56) Director since 2015 | Fred V. Keenan Chair in Finance of the Marshall School of Business, University of Southern California, Los Angeles, CA. | 3 | Director, Interactive Brokers Group, Inc.; Trustee, Clipper Funds Trust (consisting of one portfolio). |
| | | | |
Steven N. Kearsley (09/29/41) Director since 2015 | Private Investor, Real Estate Development. | 3 | Trustee, Clipper Funds Trust (consisting of one portfolio). |
| | | | |
Katherine L. MacWilliams (01/19/56) Director since 1997 | Retired; Chief Financial Officer, Caridian BCT, Inc. (medical device company) 2008-2012. | 3 | Trustee, Clipper Funds Trust (consisting of one portfolio). |
| | | | |
James J. McMonagle (10/01/44) Director since 1990 Chairman since 1997 | Of Counsel to Vorys, Sater, Seymour and Pease LLP (law firm) since 2002. | 3 | Chairman/Trustee, Clipper Funds Trust (consisting of one portfolio). |
| | | | |
Richard O’Brien (09/12/45) Director since 1996 | Retired; Corporate Economist, HP Inc. | 3 | Trustee, Clipper Funds Trust (consisting of one portfolio). |
Interested Directors*
| | | | |
Andrew A. Davis (06/25/63) Director since 1998 | President or Vice President of each Selected Fund, Clipper Fund, and Davis Fund; President, Davis Selected Advisers, L.P., and also serves as an executive officer of certain companies affiliated with the Adviser. | 16 | Director, Davis Funds (consisting of 13 portfolios); Trustee, Clipper Funds Trust (consisting of one portfolio). |
| | | | |
Christopher C. Davis (07/13/65) Director since 1998 | President or Vice President of each Selected Fund, Davis Fund, Clipper Fund, and Davis ETF; Chairman, Davis Selected Advisers, L.P., and also serves as an executive officer of certain companies affiliated with the Adviser, including sole member of the Adviser’s general partner, Davis Investments, LLC. | 16 | Director, Davis Funds (consisting of 13 portfolios); Trustee, Clipper Funds Trust (consisting of one portfolio); Lead Independent Director, Graham Holdings Company (educational and media company); Director, The Coca-Cola Company (beverage company); Director, Berkshire Hathaway Inc. (financial services). |
* Andrew A. Davis and Christopher C. Davis own partnership units (directly, indirectly, or both) of the Adviser and are considered to be “interested persons” of the Funds as defined in the Investment Company Act of 1940. Andrew A. Davis and Christopher C. Davis are brothers.
Officers
Lisa J. Cohen (born 04/25/89, Selected Funds officer since 2021). Vice President and Secretary of Selected Funds (consisting of two portfolios), Davis Funds (consisting of 13 portfolios), Clipper Funds Trust (consisting of one portfolio), and Davis Fundamental ETF Trust (consisting of four portfolios); Vice President, Senior Attorney, and Secretary, Davis Selected Advisers, L.P., and also serves as an executive officer of certain companies affiliated with the Adviser.
Andrew A. Davis (born 06/25/63, Selected Funds officer since 1998). See description in the section on Interested Directors.
Christopher C. Davis (born 07/13/65, Selected Funds officer since 1998). See description in the section on Interested Directors.
Kenneth C. Eich (born 08/14/53, Selected Funds officer since 1997). Executive Vice President and Principal Executive Officer of Selected Funds (consisting of two portfolios), Davis Funds (consisting of 13 portfolios), and Clipper Funds Trust (consisting of one portfolio); Trustee/Chairman, Executive Vice President, and Principal Executive Officer of Davis Fundamental ETF Trust (consisting of four portfolios); Chief Operating Officer, Davis Selected Advisers, L.P., and also serves as an executive officer of certain companies affiliated with the Adviser.
Douglas A. Haines (born 03/04/71, Selected Funds officer since 2004). Vice President, Treasurer, Chief Financial Officer, Principal Financial Officer, and Principal Accounting Officer of Selected Funds (consisting of two portfolios), Davis Funds (consisting of 13 portfolios), Clipper Funds Trust (consisting of one portfolio), and Davis Fundamental ETF Trust (consisting of four portfolios); Vice President and Director of Fund Accounting, Davis Selected Advisers, L.P.
Randi J. Roessler (born 06/26/81, Selected Funds officer since 2018). Vice President and Chief Compliance Officer of Selected Funds (consisting of two portfolios), Davis Funds (consisting of 13 portfolios), Clipper Funds Trust (consisting of one portfolio), and Davis Fundamental ETF Trust (consisting of four portfolios); Vice President and Chief Compliance Officer, Davis Selected Advisers, L.P., and also serves as an executive officer of certain companies affiliated with the Adviser.
| Investment Adviser |
Davis Selected Advisers, L.P. |
2949 East Elvira Road, Suite 101 |
Tucson, Arizona 85756 |
| |
| Distributor |
Davis Distributors, LLC |
2949 East Elvira Road, Suite 101 |
Tucson, Arizona 85756 |
| |
| Custodian |
State Street Bank and Trust Co. |
c/o The Selected Funds |
One Lincoln Street |
Boston, Massachusetts 02111 |
| |
| Transfer Agent |
DST Asset Manager Solutions, Inc. |
c/o The Selected Funds |
P.O. Box 219662 |
Kansas City, Missouri 64121-9662 |
| |
Overnight Address: |
430 West 7th Street, Suite 219662 |
Kansas City, Missouri 64105-1407 |
| |
| Legal Counsel |
Greenberg Traurig, LLP |
77 West Wacker Drive, Suite 3100 |
Chicago, Illinois 60601 |
| |
| Independent Registered Public Accounting Firm |
KPMG LLP |
1225 17th Street, Suite 800 |
Denver, Colorado 80202 |
| |
For more information about the Selected Funds including management fee, charges, and expenses, see the current prospectus, which must precede or accompany this report. The Funds’ Statement of Additional Information contains additional information about the Funds’ Directors and is available without charge upon request by calling 1-800-243-1575 or on the Funds’ website at www.selectedfunds.com. Quarterly Fact Sheets are available on the Funds’ website at www.selectedfunds.com.

ITEM 2. CODE OF ETHICS
Not Applicable
ITEM 3. AUDIT COMMITTEE FINANCIAL EXPERT
The registrant’s board of directors has determined that independent director Katherine MacWilliams qualifies as the “audit committee financial expert”, as defined in Item 3 of form N-CSR.
ITEM 4. PRINCIPAL ACCOUNTANT FEES AND SERVICES
Not Applicable
ITEM 5. AUDIT COMMITTEE OF LISTED REGISTRANTS
Not Applicable
ITEM 6. SCHEDULE OF INVESTMENTS
| (a) | Not Applicable. The complete Schedule of Investments is included in Item 1 of this Form N-CSR |
| | |
| (b) | Not Applicable. |
ITEM 7. DISCLOSURE OF PROXY VOTING POLICIES AND PROCEDURES FOR CLOSED-END MANAGEMENT INVESTMENT COMPANIES
Not Applicable
ITEM 8. PORTFOLIO MANAGERS OF CLOSED-END MANAGEMENT INVESTMENT COMPANIES
Not Applicable
ITEM 9. PURCHASES OF EQUITY SECURITIES BY CLOSED-END MANAGEMENT INVESTMENT COMPANIES AND AFFILIATED PURCHASERS
Not Applicable
ITEM 10. SUBMISSION OF MATTERS TO A VOTE OF SECURITY HOLDERS
There have been no changes to the procedure by which shareholders may recommend nominees to the registrant’s Board of Directors.
ITEM 11. CONTROLS AND PROCUDURES
| (a) | The registrant’s principal executive officer and principal financial officer have concluded that the registrant’s disclosure controls and procedures (as defined in Rule 30a-2 (c) under the Investment Company Act of 1940, as amended) are effective as of a date within 90 days of the filing date of this report. |
| |
| (b) | There have been no significant changes in the registrant’s internal controls or in other factors that could significantly affect these controls. |
ITEM 12. DISCLOSURE OF SECURITIES LENDING ACTIVITIES FOR CLOSED-END MANAGEMENT INVESTMENT COMPANIES
Not Applicable.
ITEM 13. EXHIBITS
| (a)(1) | Not Applicable |
| |
| (a)(2) | Certifications pursuant to Section 302 of the Sarbanes-Oxley Act of 2002 are attached. |
| |
| (b) | Certifications pursuant to Section 906 of the Sarbanes-Oxley Act of 2002 are attached. |
SIGNATURES
Pursuant to the requirements of the Securities Exchange Act of 1934 and the Investment Company Act of 1940, the registrant has duly caused this report to be signed on its behalf by the undersigned, thereunto duly authorized.
SELECTED INTERNATIONAL FUND, INC.
By | /s/ Kenneth C. Eich |
| | Kenneth C. Eich |
| | Principal Executive Officer |
Date: August 22, 2022
Pursuant to the requirements of the Securities Exchange Act of 1934 and the Investment Company Act of 1940, this report has been signed below by the following persons on behalf of the registrant and in the capacities and on the dates indicated.
By | /s/ Kenneth C. Eich |
| | Kenneth C. Eich |
| | Principal Executive Officer |
Date: August 22, 2022
By | /s/ Douglas A. Haines |
| | Douglas A. Haines |
| | Principal Financial Officer and Principal Accounting Officer |
Date: August 22, 2022