UNITED STATES
SECURITIES AND EXCHANGE COMMISSION
Washington, DC 20549
FORM N-CSR
CERTIFIED SHAREHOLDER REPORT OF REGISTERED MANAGEMENT INVESTMENT COMPANY
Investment Company Act file number 811-01533
SELECTED INTERNATIONAL FUND, INC.
(Exact name of registrant as specified in charter)
2949 East Elvira Road, Suite 101
Tucson, AZ 85756
(Address of principal executive offices)
Lisa J. Cohen
Davis Selected Advisers, L.P.
2949 East Elvira Road, Suite 101
Tucson, AZ 85756
(Name and address of agent for service)
Registrant’s telephone number, including area code: 520-806-7600
Date of fiscal year end: December 31, 2021
Date of reporting period: December 31, 2021
____________________
ITEM 1. REPORT TO STOCKHOLDERS
| SELECTED FUNDS | Table of Contents |
| 2 |
Management’s Discussion of Fund Performance: | |
| 3 |
| 5 |
Fund Overview: | |
| 7 |
| 9 |
| 11 |
Schedule of Investments: | |
| 12 |
| 15 |
| 17 |
| 18 |
| 19 |
| 21 |
| 29 |
| 31 |
| 32 |
| 33 |
| 34 |
This Annual Report is authorized for use by existing shareholders. Prospective shareholders must receive a current Selected Funds (the “Funds”) prospectus, which contains more information about investment strategies, risks, fees, and expenses. Please read the prospectus carefully before investing or sending money.
Shares of the Funds are not deposits or obligations of any bank, are not guaranteed by any bank, are not insured by the FDIC or any other agency, and involve investment risks, including possible loss of the principal amount invested.
Portfolio Proxy Voting Policies and Procedures
The Funds have adopted Portfolio Proxy Voting Policies and Procedures under which the Funds vote proxies relating to securities held by the Funds. A description of the Funds’ Portfolio Proxy Voting Policies and Procedures is available (i) without charge, upon request, by calling the Funds toll-free at 1-800-243-1575, (ii) on the Funds’ website at www.selectedfunds.com, and (iii) on the SEC’s website at www.sec.gov.
In addition, the Funds are required to file Form N-PX, with their complete proxy voting record for the 12 months ended June 30th, no later than August 31st of each year. The Funds’ Form N-PX filing is available (i) without charge, upon request, by calling the Funds toll-free at 1-800-243-1575, (ii) on the Funds’ website at www.selectedfunds.com, and (iii) on the SEC’s website at www.sec.gov.
Quarterly Schedule of Investments
The Funds file their complete schedule of investments with the SEC on Form N-CSR (as of the end of the second and fourth quarters) and on Form N-PORT Part F (as of the end of the first and third quarters). The Funds’ Forms N-CSR (Annual and Semi-Annual Reports) and N-PORT Part F are available without charge, upon request, by calling 1-800-243-1575, on the Funds’ website at www.selectedfunds.com, and on the SEC’s website at www.sec.gov. A list of the Funds’ quarter-end holdings is also available at www.selectedfunds.com on or about the 15th day following each quarter end and remains available on the website until the list is updated for the subsequent quarter.
Dear Fellow Shareholder,
As stewards of our customers’ savings, the management team and Directors of the Selected Funds recognize the importance of candid, thorough, and regular communication with our shareholders. In our Annual and Semi-Annual Reports, we include all of the required quantitative information, such as audited financial statements, detailed footnotes, performance reports, fund holdings, and performance attribution. Also included is a list of positions opened and closed.
In addition, we produce a Manager Commentary for each Fund. In this commentary, we give a more qualitative perspective on fund performance, discuss our thoughts on individual holdings, and share our investment outlook. You may obtain a copy of the current Manager Commentary either on the Funds’ website at www.selectedfunds.com, or by calling 1-800-243-1575.
We value the trust you have placed in us and look forward to continuing our investment journey together.
Sincerely,
| | |
James J. McMonagle | Christopher C. Davis | Danton G. Goei |
Chairman | President & Portfolio Manager | Portfolio Manager |
| |
February 4, 2022 |
| SELECTED FUNDS | Management’s Discussion of Fund Performance |
| SELECTED AMERICAN SHARES, INC. | |
Performance Overview
Selected American Shares underperformed the Standard & Poor’s 500® Index (“S&P 500®” or the “Index”) for the twelve-month period ended December 31, 2021 (the “period”). The Fund’s Class S and D shares delivered total returns of 17.72% and 18.10%, respectively, versus a 28.71% return for the S&P 500®. The sectors1 within the Index that reported the strongest performance were Energy (up 55%), Real Estate (up 46%), and Information Technology (up 36%). The sectors within the Index that reported the weakest performance were Utilities (up 18%), Consumer Staples (up 19%), and Industrials (up 21%).
Detractors from Performance
The Fund’s Consumer Discretionary holdings were the most important detractor2 from performance both on an absolute basis and relative to the Index. The Fund’s holdings underperformed the S&P 500® sector (down 39%, versus up 24%). New Oriental Education & Technology3 (down 88%) and Alibaba (down 48%) were the two largest detractors during the period. The Fund completely liquidated its position in New Oriental Education & Technology after the Chinese government placed new regulations on the company related to after-school tutoring and private educational services, one of which is mandating that it must now be registered as a non-profit organization. Vroom (down 68%), Prosus (down 23%), and Chengxin Technology (down 25%) were also weaker performers from this sector. Vroom and Chengxin Technology were new holdings during the period.
The Fund’s Industrials holdings were an important detractor from performance on both an absolute and relative basis. The Fund’s holdings underperformed the Index sector (down 43%, versus up 21%) but a smaller average weighting (5%, versus 8% for the Index) in this lesser performing sector somewhat offset the impact from the weaker stock selection. The Fund held private equity shares of China ride hailing company Didi Chuxing. In June 2021, the company was renamed DiDi Global and shortly thereafter completed its initial public offering (“IPO”). DiDi Global was a top detractor from performance primarily due to its performance subsequent to the IPO. Including its pre-IPO performance, DiDi Global decreased 47% during the period.
Compared to the Index, the Fund suffered due to its weaker performing Health Care holdings. The Fund’s holdings were up 13%, versus up 26% for the Index sector. Viatris (down 26%) was a key detractor. The Fund also had no exposure in Energy and Real Estate, the two highest performing sectors of the S&P 500®, and relative performance suffered as a result.
Additional individual detractors from performance were Vimeo (down 60%), AIA Group (down 17%), and Ping An Insurance (down 19%). Vimeo was spun off from IAC/InterActiveCorp and Ping An Insurance was a new purchase during the period.
The Fund had an average weighting of 17% of net assets in foreign securities. The Fund’s foreign holdings significantly underperformed the U.S. holdings (down 34%, compared to up 34%).
Contributors to Performance
The Fund’s largest weighting was in Financials (average weight of 44%, compared to the Index sector’s 12%). These holdings were a significant contributor to both absolute and relative performance. The Fund’s holdings outperformed the Index sector (up 34%, versus up 31%). Of the top ten contributors during the period, seven were from the Financials sector including Wells Fargo (up 61%), Capital One Financial (up 49%), Berkshire Hathaway (up 30%), American Express (up 37%), Bank of New York Mellon (up 41%), JPMorgan Chase (up 28%), and U.S. Bancorp (up 24%). Wells Fargo, Capital One Financial, and Berkshire Hathaway were all top five holdings at the end of the period, representing 7.82%, 7.59%, and 6.87% of net assets, respectively.
The Fund’s holdings in the Communication Services sector were also beneficial to performance on both an absolute and relative basis. The Fund’s Communication Services holdings outperformed the Index sector (up 38%, versus up 22%). Alphabet (up 65%), the parent company of Google, continued to be a large holding at the end of the period, representing 7.58% of net assets. Meta Platforms (up 23%), formerly known as Facebook, was also a strong performer.
The Fund’s Information Technology position was a key performer. The Fund’s holdings outperformed the Index sector (up 46%, versus up 36%). Applied Materials (up 84%) was the top contributor to performance and largest holding at the end of the period, representing 8.14% of net assets.
Selected American Shares’ investment objective is to achieve both capital growth and income. In the current market environment, we expect that income will be low. There can be no assurance that the Fund will achieve its objective. Selected American Shares’ principal risks are: stock market risk, common stock risk, financial services risk, foreign country risk, headline risk, large-capitalization companies risk, manager risk, depositary receipts risk, emerging market risk, fees and expenses risk, foreign currency risk, and mid- and small-capitalization companies risk. See the prospectus for a full description of each risk.
Past performance does not guarantee future results, Fund prices fluctuate, and the value of an investment may be worth more or less than the purchase price. Data provided in this performance overview is for the twelve-month period ended December 31, 2021, unless otherwise noted. Return figures for underlying Fund positions reflect the return of the security from the beginning of the period or the date of first purchase if subsequent thereto through the end of the period or the date the position is completely liquidated. The actual contribution to the Fund will vary based on a number of factors (e.g., trading activity, weighting). Portfolio holding information is as of the end of the twelve-month period, December 31, 2021, unless otherwise noted.
1 | The companies included in the Standard & Poor’s 500® Index are divided into eleven sectors. One or more industry groups make up a sector. For purposes of measuring concentration, the Fund generally classifies companies at the industry group or industry level. See the SAI for additional information regarding the Fund’s concentration policy. |
2 | A company’s or sector’s contribution to or detraction from the Fund’s performance is a product both of its appreciation or depreciation and its weighting within the Fund. For example, a 5% holding that rises 20% has twice as much impact as a 1% holding that rises 50%. |
3 | This Management Discussion of Fund Performance discusses a number of individual companies. The information provided in this report does not provide information reasonably sufficient upon which to base an investment decision and should not be considered a recommendation to purchase, sell, or hold any particular security. The Schedule of Investments lists the Fund’s holdings of each company discussed. |
| SELECTED FUNDS | Management’s Discussion of Fund Performance |
| SELECTED AMERICAN SHARES, INC. – (CONTINUED) | |
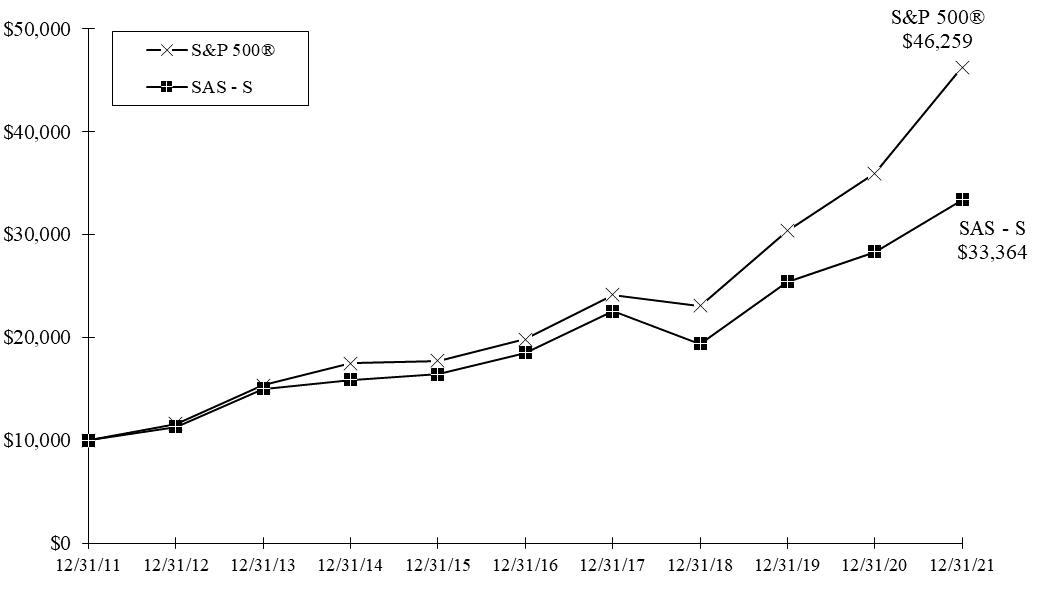
Comparison of a $10,000 investment in Selected American Shares Class S versus the
Standard & Poor’s 500® Index over 10 years for an investment made on December 31, 2011
Average Annual Total Return for periods ended December 31, 2021
| Fund & Benchmark Index | 1-Year | 5-Year | 10-Year | Since Class D’s Inception (May 3, 2004) | Gross Expense Ratio | Net Expense Ratio |
| Class S | 17.72% | 12.52% | 12.79% | N/A | 0.98% | 0.98% |
| Class D | 18.10% | 12.89% | 13.16% | 8.71% | 0.67% | 0.67% |
Standard & Poor’s 500® Index | 28.71% | 18.46% | 16.54% | 10.76% | | |
The Standard & Poor’s 500® Index is an unmanaged index of 500 selected common stocks, most of which are listed on the New York Stock Exchange. The Index is adjusted for dividends, weighted towards stocks with large market capitalizations, and represents approximately two-thirds of the total market value of all domestic common stocks. Investments cannot be made directly in the Index.
The performance data quoted in this report represents past performance, assumes that all distributions were reinvested, and is not a guarantee of future results. The investment return and principal value will fluctuate so that shares may be worth more or less than their original cost when redeemed. Current performance may be higher or lower than performance data quoted. Returns shown do not reflect the deduction of taxes that a shareholder would pay on fund distributions or the redemption of fund shares. The operating expense ratios may vary in future years. For most recent month-end performance information, please call Selected Funds Investor Services at 1-800-243-1575 or visit the Fund’s website at www.selectedfunds.com.
| SELECTED FUNDS | Management’s Discussion of Fund Performance |
| SELECTED INTERNATIONAL FUND, INC. | |
Performance Overview
Selected International Fund underperformed the Morgan Stanley Capital International All Country World Index ex USA (“MSCI” or the “Index”) for the twelve-month period ended December 31, 2021 (the “period”). The Fund’s Class S and D shares delivered a total return of -21.94% and -21.72%, respectively, versus a 7.82% return for the MSCI. The sectors1 within the MSCI that reported the strongest performance were Energy (up 27%), Financials (up 17%), and Information Technology (up 16%). The sectors within the MSCI that reported the weakest performance were Communication Services (down 6%), Consumer Discretionary (down 6%), and Real Estate (down 2%).
Detractors from Performance
The Fund’s largest average sector position was in Consumer Discretionary companies. These holdings were the top detractor2 from Fund performance both on an absolute basis and relative to the Index. The Fund’s holdings underperformed the Index sector (down 49%, versus down 6%) and the Fund was significantly overweight in this sector (average weighting of 35%, versus 13%). Of the top ten detractors during the period, seven were from the Consumer Discretionary sector led by two companies providing education services in China, New Oriental Education & Technology3 (down 88%) and TAL Education Group (down 92%). The Fund completely liquidated its positions in New Oriental Education & Technology and TAL Education Group after the Chinese government placed new regulations on these companies related to after-school tutoring and private educational services. Alibaba (down 49%), Meituan (down 24%), JD.com (down 20%), Naspers (down 24%), and Fila Holdings (down 25%) were the additional top detractors from this sector.
The Fund’s holdings in the Communication Services sector also hindered both absolute and relative performance. The Fund’s Communication Services holdings underperformed the Index sector (down 54%, versus down 6%). iQIYI (down 74%) was a key detractor during the period.
Compared to the Index, the Fund’s performance in the Industrials and Financials sectors suffered. The Fund’s Industrials holdings were down 26%, versus up 13% for the Index sector. The Fund held private equity shares of China ride hailing company Didi Chuxing, an Industrials company. In June 2021, the company was renamed DiDi Global and shortly thereafter completed its initial public offering (“IPO”). DiDi Global was a top detractor from performance primarily due to its performance subsequent to the IPO. Including its pre-IPO performance, DiDi Global decreased 47% during the period. The Fund’s holdings in Financials were up 8%, versus up 17% for the Index sector. AIA Group (down 17%) was a key detractor.
The Fund also had no exposure in Energy, the highest performing sector of the MSCI, and relative performance was hurt as a result.
The Fund had an average weighting of 42% of net assets in Chinese securities and these holdings were down 50% during the period.
Contributors to Performance
The Fund continued to hold a large position in Financials. As mentioned above, the Fund’s Financials sector holdings detracted from overall relative performance due to stock selection. However, absolute performance benefited by the Fund being overweight in this stronger performing sector of the Index (average weighting of 33%, versus 19%). DBS Group Holdings (up 32%), DNB (up 28%), Bank of N.T. Butterfield (up 28%), Julius Baer Group (up 20%), and Danske Bank (up 6%) were all among the top contributors. DBS Group Holdings and Danske Bank were the two largest holdings at the end of the period, representing 9.09% and 7.00% of net assets, respectively.
The Information Technology sector was also a contributor to the Fund’s absolute performance. Tokyo Electron (up 58%) was the top contributor to performance and a top five holding at the end of the period, representing 6.37% of net assets.
While the Fund’s Industrials holdings as a whole detracted from relative performance, several individual companies contributed positively. Grab Holdings (up 112%), a ride hailing company in Southeast Asia, went public in 2021 via a merger with a special purpose acquisition company (SPAC). As a result, its value increased making it a top contributor. Schneider Electric (up 16%) and Ferguson (up 8%) were also key performers. The Fund no longer holds these three companies.
Compared to the Index, the Fund benefited from having no holdings in the Health Care, Consumer Staples, Utilities, and Real Estate sectors.
Selected International Fund’s investment objective is capital growth. There can be no assurance that the Fund will achieve its objective. Selected International Fund’s principal risks are: stock market risk, common stock risk, foreign country risk, headline risk, depositary receipts risk, foreign currency risk, exposure to industry or sector risk, emerging market risk, large-capitalization companies risk, manager risk, fees and expenses risk, and mid- and small-capitalization companies risk. See the prospectus for a full description of each risk.
Past performance does not guarantee future results, Fund prices fluctuate, and the value of an investment may be worth more or less than the purchase price. Data provided in this performance overview is for the twelve-month period ended December 31, 2021, unless otherwise noted. Return figures for underlying Fund positions reflect the return of the security from the beginning of the period or the date of first purchase if subsequent thereto through the end of the period or the date the position is completely liquidated. The actual contribution to the Fund will vary based on a number of factors (e.g., trading activity, weighting). Portfolio holding information is as of the end of the twelve-month period, December 31, 2021, unless otherwise noted.
1 | The companies included in the Morgan Stanley Capital International All Country World Index ex USA are divided into eleven sectors. One or more industry groups make up a sector. For purposes of measuring concentration, the Fund generally classifies companies at the industry group or industry level. See the SAI for additional information regarding the Fund’s concentration policy. |
2 | A company’s or sector’s contribution to or detraction from the Fund’s performance is a product both of its appreciation or depreciation and its weighting within the Fund. For example, a 5% holding that rises 20% has twice as much impact as a 1% holding that rises 50%. |
3 | This Management Discussion of Fund Performance discusses a number of individual companies. The information provided in this report does not provide information reasonably sufficient upon which to base an investment decision and should not be considered a recommendation to purchase, sell, or hold any particular security. The Schedule of Investments lists the Fund’s holdings of each company discussed. |
| SELECTED FUNDS | Management’s Discussion of Fund Performance |
| SELECTED INTERNATIONAL FUND, INC. – (CONTINUED) | |
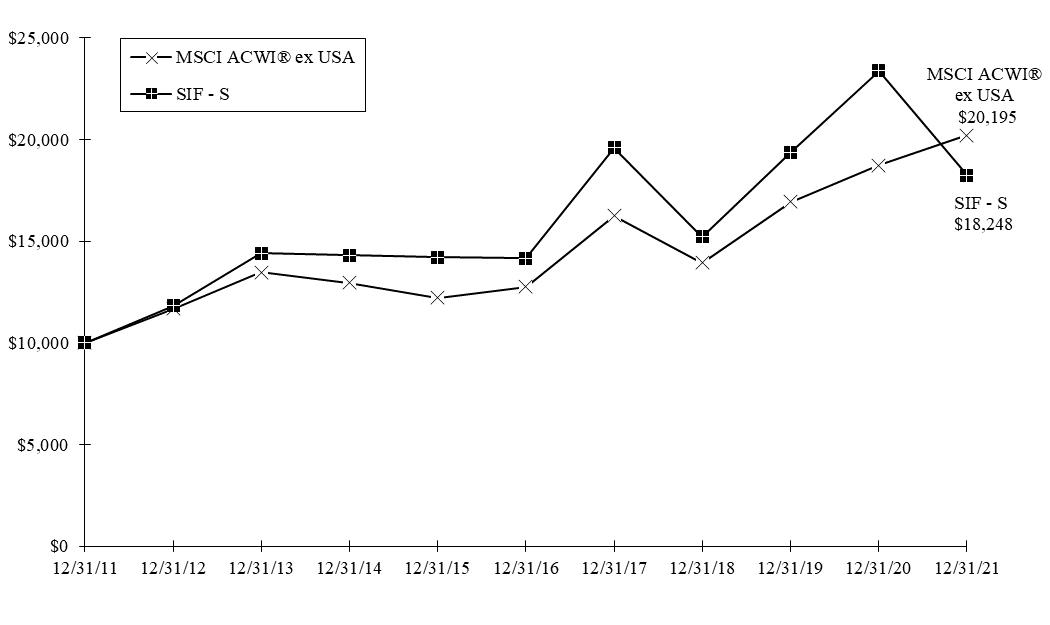
Comparison of a $10,000 investment in Selected International Fund Class S versus the
Morgan Stanley Capital International All Country World Index ex USA (MSCI ACWI® ex USA)
over 10 years for an investment made on December 31, 2011
Average Annual Total Return for periods ended December 31, 2021
| Fund & Benchmark Index | 1-Year | 5-Year | 10-Year | Since Class D’s Inception (May 3, 2004) | Gross Expense Ratio | Net Expense Ratio |
| Class S | (21.94)% | 5.19% | 6.19% | N/A | 1.37% | 1.05% |
| Class D | (21.72)% | 5.51% | 6.62% | 3.67% | 0.90% | 0.80% |
MSCI ACWI® ex USA | 7.82% | 9.61% | 7.28% | 6.53% | | |
The Fund’s performance benefited from IPO purchases in 2014. After purchase, the IPOs rapidly increased in value. The Adviser purchases shares intending to benefit from long-term growth of the underlying company; the rapid appreciation of the IPOs were unusual occurrences.
The MSCI ACWI® ex USA is a free float-adjusted market capitalization weighted index designed to measure the equity market performance of developed and emerging markets, excluding the United States. The Index includes reinvestment of dividends, net of foreign withholding taxes. Investments cannot be made directly in the Index.
The performance data quoted in this report represents past performance, assumes that all distributions were reinvested, and is not a guarantee of future results. The investment return and principal value will fluctuate so that shares may be worth more or less than their original cost when redeemed. Current performance may be higher or lower than performance data quoted. Returns shown do not reflect the deduction of taxes that a shareholder would pay on fund distributions or the redemption of fund shares. The operating expense ratios may vary in future years. For most recent month-end performance information, please call Selected Funds Investor Services at 1-800-243-1575 or visit the Fund’s website at www.selectedfunds.com.
| SELECTED FUNDS | |
| SELECTED AMERICAN SHARES, INC. | December 31, 2021 |
| Portfolio Composition | | Industry Weightings |
| (% of Fund’s 12/31/21 Net Assets) | | (% of 12/31/21 Stock Holdings) |
| | | | | | | |
| | | | | Fund | | S&P 500® |
Common Stock (U.S.) | 84.22% | | Diversified Financials | 20.80% | | 4.89% |
| Common Stock (Foreign) | 14.42% | | Banks | 20.15% | | 3.96% |
Short-Term Investments | 0.92% | | Information Technology | 17.28% | | 29.17% |
Preferred Stock (Foreign) | 0.70% | | Media & Entertainment | 14.28% | | 8.99% |
Other Assets & Liabilities | (0.26)% | | Retailing | 10.71% | | 6.82% |
| | 100.00% | | Health Care | 7.22% | | 13.29% |
| | | | Insurance | 5.59% | | 1.83% |
| | | | Transportation | 1.37% | | 1.75% |
| | | | Food, Beverage & Tobacco | 0.96% | | 2.87% |
| | | | Materials | 0.90% | | 2.56% |
| | | | Telecommunication Services | 0.62% | | 1.17% |
| | | | Capital Goods | 0.09% | | 5.16% |
| | | | Food & Staples Retailing | 0.03% | | 1.40% |
| | | | Real Estate | – | | 2.77% |
| | | | Automobiles & Components | – | | 2.68% |
| | | | Other | – | | 10.69% |
| | | | | 100.00% | | 100.00% |
| Top 10 Long-Term Holdings |
| (% of Fund’s 12/31/21 Net Assets) |
| |
| Applied Materials, Inc. | Semiconductors & Semiconductor Equipment | | 8.14% |
| Wells Fargo & Co. | Banks | | 7.82% |
| Capital One Financial Corp. | Consumer Finance | | 7.59% |
| Alphabet Inc.* | Media & Entertainment | | 7.58% |
| Berkshire Hathaway Inc., Class A | Diversified Financial Services | | 6.87% |
| Amazon.com, Inc. | Retailing | | 5.08% |
| Meta Platforms, Inc., Class A | Media & Entertainment | | 4.97% |
| Bank of New York Mellon Corp. | Capital Markets | | 4.19% |
| U.S. Bancorp | Banks | | 3.98% |
| Intel Corp. | Semiconductors & Semiconductor Equipment | | 3.92% |
| |
*Alphabet Inc. holding includes Class A and Class C. |
| SELECTED FUNDS | Fund Overview |
| SELECTED AMERICAN SHARES, INC. – (CONTINUED) | December 31, 2021 |
New Positions Added (01/01/21-12/31/21)
(Highlighted positions are those greater than 1.00% of the Fund’s 12/31/21 net assets)
| Security | Industry | Date of 1st Purchase | % of Fund’s 12/31/21 Net Assets |
Chengxin Technology, Inc., Series A-1, Pfd. | Retailing | 03/29/21 | 0.60% |
Coupang, Inc., Class A | Retailing | 03/11/21 | 0.74% |
Darling Ingredients Inc. | Food, Beverage & Tobacco | 06/25/21 | 0.96% |
Full Trillion Development Ltd., Class A, Pfd. | Retailing | 03/29/21 | 0.10% |
JD.com, Inc., Class A, ADR | Retailing | 08/20/21 | 1.24% |
Missfresh Ltd., Class B, ADS | Food & Staples Retailing | 06/25/21 | 0.03% |
Ping An Insurance (Group) Co. | | | |
of China, Ltd. - H | Life & Health Insurance | 07/14/21 | 1.30% |
Teck Resources Ltd., Class B | Materials | 09/24/21 | 0.89% |
Vroom, Inc. | Retailing | 03/10/21 | 0.30% |
Positions Closed (01/01/21-12/31/21)
(Gains and losses greater than $45,000,000 are highlighted)
| Security | Industry | Date of Final Sale | | | Realized Gain (Loss) |
Carrier Global Corp. | Capital Goods | 05/27/21 |
| $ | 53,903,650 |
CVS Health Corp. | Health Care Equipment & Services | 10/07/21 | | | 766,868 |
New Oriental Education & Technology | | | | | |
Group, Inc., ADR | Consumer Services | 07/29/21 | | | (45,175,153) |
Raytheon Technologies Corp. | Capital Goods | 11/16/21 | | | 19,347,338 |
| SELECTED FUNDS | |
| SELECTED INTERNATIONAL FUND, INC. | December 31, 2021 |
| Portfolio Composition | | Industry Weightings |
| (% of Fund’s 12/31/21 Net Assets) | | (% of 12/31/21 Stock Holdings) |
| | | | | | | |
| | | | | Fund | | MSCI ACWI® EX USA |
Common Stock (Foreign) | 95.13% | | Banks | 27.01% | | 11.48% |
Short-Term Investments | 4.17% | | Retailing | 25.55% | | 3.39% |
Other Assets & Liabilities | 0.70% | | Information Technology | 18.37% | | 13.59% |
| | 100.00% | | Insurance | 10.88% | | 4.24% |
| | | | Diversified Financials | 5.76% | | 3.46% |
| | | | Media & Entertainment | 3.89% | | 3.33% |
| | | | Transportation | 3.73% | | 2.58% |
| | | | Consumer Durables & Apparel | 3.44% | | 3.87% |
| | | | Materials | 0.96% | | 8.08% |
| | | | Commercial & Professional Services | 0.41% | | 1.56% |
| | | | Health Care | – | | 9.39% |
| | | | Capital Goods | – | | 8.47% |
| | | | Food, Beverage & Tobacco | – | | 5.10% |
| | | | Energy | – | | 4.79% |
| | | | Automobiles & Components | – | | 3.66% |
| | | | Other | – | | 13.01% |
| | | | | 100.00% | | 100.00% |
| Country Diversification | | Top 10 Long-Term Holdings |
| (% of 12/31/21 Stock Holdings) | | (% of Fund’s 12/31/21 Net Assets) |
| | | | | |
China | 37.38% | | DBS Group Holdings Ltd. | 9.09% |
South Korea | 10.02% | | Danske Bank A/S | 7.00% |
Singapore | 9.55% | | JD.com, Inc., Class A, ADR | 6.59% |
Denmark | 7.35% | | Tokyo Electron Ltd. | 6.37% |
Japan | 6.70% | | Meituan, Class B | 6.26% |
Bermuda | 5.79% | | Samsung Electronics Co., Ltd. | 6.26% |
Hong Kong | 5.73% | | Bank of N.T. Butterfield & Son Ltd. | 5.51% |
South Africa | 4.93% | | AIA Group Ltd. | 5.45% |
Switzerland | 4.17% | | Ping An Insurance (Group) Co. of China, Ltd. - H | 4.89% |
Norway | 4.00% | | Hollysys Automation Technologies Ltd. | 4.85% |
Netherlands | 3.10% | | | |
Canada | 0.96% | | | |
United Kingdom | 0.32% | | | |
| | 100.00% | | | |
| SELECTED FUNDS | Fund Overview |
| SELECTED INTERNATIONAL FUND, INC. – (CONTINUED) | December 31, 2021 |
New Positions Added (01/01/21-12/31/21)
(Highlighted positions are those greater than 4.00% of the Fund’s 12/31/21 net assets)
| Security | Industry | Date of 1st Purchase | % of Fund’s 12/31/21 Net Assets |
Kuaishou Technology, Class B | Media & Entertainment | 01/29/21 | 0.02% |
Ping An Insurance (Group) Co. | | | |
of China, Ltd. - H | Life & Health Insurance | 07/14/21 | 4.89% |
Samsung Electronics Co., Ltd. | Technology Hardware & Equipment | 02/18/21 | 6.26% |
TAL Education Group, Class A, ADR | Consumer Services | 03/26/21 | – |
Teck Resources Ltd., Class B | Materials | 09/24/21 | 0.91% |
Positions Closed (01/01/21-12/31/21)
(Gains and losses greater than $2,000,000 are highlighted)
| Security | Industry | Date of Final Sale | | | Realized Gain (Loss) |
Ferguson PLC | Capital Goods | 04/21/21 |
| $ | 1,840,713 |
Grab Holdings Ltd., Class A | Transportation | 12/06/21 | | | 1,326,449 |
New Oriental Education & Technology | | | | | |
Group, Inc., ADR | Consumer Services | 07/29/21 | | | (1,350,178) |
Schneider Electric SE | Capital Goods | 07/28/21 | | | 2,210,391 |
TAL Education Group, Class A, ADR | Consumer Services | 07/26/21 | | | (3,101,453) |
Yiren Digital Ltd., ADR | Consumer Finance | 02/23/21 | | | (777,472) |
As a shareholder of each Fund, you incur ongoing costs, including advisory and administrative fees, distribution and/or service (12b-1) fees, and other Fund expenses. As a shareholder of Selected International Fund, you may also incur transaction costs, which consist of short-term trading fees. The Expense Example is intended to help you understand your ongoing costs (in dollars) of investing in each Fund and to compare these costs with the ongoing costs of investing in other mutual funds. The Expense Example is based on an investment of $1,000 invested at the beginning of the period and held for the entire period indicated, which for each class is for the six-month period ended December 31, 2021.
Actual Expenses
The information represented in the row entitled “Actual” provides information about actual account values and actual expenses. You may use the information in this row, together with the amount you invested, to estimate the expenses that you paid over the period. Simply divide your account value by $1,000 (for example, an $8,600 account value divided by $1,000 = 8.6), then multiply the result by the number under the heading “Expenses Paid During Period” to estimate the expenses you paid on your account during this period. An annual maintenance fee of $15, charged on retirement plan accounts per Social Security Number, is not included in the Expense Example. This fee will be waived for accounts sharing the same Social Security Number if the accounts total at least $50,000 at Selected Funds. If this fee was included, the estimate of expenses you paid during the period would be higher, and your ending account value would be lower, by this amount.
Hypothetical Example for Comparison Purposes
The information represented in the row entitled “Hypothetical” provides information about hypothetical account values and hypothetical expenses based on each Fund’s actual expense ratio and an assumed rate of return of 5% per year before expenses, which is not the Fund’s actual return. The hypothetical account values and expenses may not be used to estimate the actual ending account balance or expenses you paid for the period. You may use this information to compare the ongoing costs of investing in the Fund and other funds. To do so, compare this 5% hypothetical example with the 5% hypothetical examples that appear in the shareholder reports of the other funds. An annual maintenance fee of $15, charged on retirement plan accounts per Social Security Number, is not included in the Expense Example. This fee will be waived for accounts sharing the same Social Security Number if the accounts total at least $50,000 at Selected Funds. If this fee was included, the estimate of expenses you paid during the period would be higher, and your ending account value would be lower, by this amount.
Please note that the expenses shown in the table are meant to highlight your ongoing costs only and do not reflect any transactional costs, such as short-term trading fees. Therefore, the information in the row entitled “Hypothetical” is useful in comparing ongoing costs only, and will not help you determine the relative total costs of owning different funds. In addition, if these transactional costs were included, your costs would be higher.
| | Beginning | Ending | Expenses Paid |
| | Account Value | Account Value | During Period* |
| | (07/01/21) | (12/31/21) | (07/01/21-12/31/21) |
| Selected American Shares | | | |
Class S (annualized expense ratio 1.00%**) | | | |
| Actual | $1,000.00 | $962.21 | $4.95 |
| Hypothetical | $1,000.00 | $1,020.16 | $5.09 |
Class D (annualized expense ratio 0.68%**) | | | |
| Actual | $1,000.00 | $963.86 | $3.37 |
| Hypothetical | $1,000.00 | $1,021.78 | $3.47 |
| Selected International Fund | | | |
Class S (annualized expense ratio 1.05%**) | | | |
| Actual | $1,000.00 | $785.33 | $4.73 |
| Hypothetical | $1,000.00 | $1,019.91 | $5.35 |
Class D (annualized expense ratio 0.80%**) | | | |
| Actual | $1,000.00 | $786.45 | $3.60 |
| Hypothetical | $1,000.00 | $1,021.17 | $4.08 |
| | | | |
| Hypothetical assumes 5% annual return before expenses. |
| |
*Expenses are equal to each Class’s annualized operating expense ratio, multiplied by the average account value over the period, multiplied by 184/365 (to reflect the one-half year period). |
| |
| **The expense ratios reflect the impact, if any, of certain reimbursements from the Adviser. |
| SELECTED FUNDS | |
| SELECTED AMERICAN SHARES, INC. | December 31, 2021 |
| | Shares/Units | | Value
(Note 1) |
| COMMON STOCK – (98.64%) |
| | COMMUNICATION SERVICES – (14.80%) |
| | | Media & Entertainment – (14.19%) |
| | | | | | | | | | |
| | | | | | | | |
| | | | | | | | |
| | | | | | | | |
| | Liberty TripAdvisor Holdings, Inc., Series A * | | | | | | |
| | Meta Platforms, Inc., Class A * | | | | | | |
| | | | | | | | |
| | | | 281,219,294 |
| | Telecommunication Services – (0.61%) |
| | Liberty Global plc, Series C * | | | | | | |
| | | | Total Communication Services | | | |
| | CONSUMER DISCRETIONARY – (9.94%) |
| | Retailing – (9.94%) |
| | Alibaba Group Holding Ltd., ADR (China)* | | | | | | |
| | | | | | | | |
| | Coupang, Inc., Class A (South Korea)* | | | | | | |
| | JD.com, Inc., Class A, ADR (China)* | | | | | | |
| | Naspers Ltd. - N (South Africa) | | | | | | |
| | Prosus N.V., Class N (Netherlands) | | | | | | |
| | | | | | | | |
| | Total Consumer Discretionary | | | |
| | CONSUMER STAPLES – (0.99%) |
| | Food & Staples Retailing – (0.03%) |
| | Missfresh Ltd., Class B, ADS (China)* | | | | | | |
| | Food, Beverage & Tobacco – (0.96%) |
| | Darling Ingredients Inc. * | | | | | | |
| | | | | |
| | FINANCIALS – (46.23%) |
| | Banks – (20.02%) |
| | Danske Bank A/S (Denmark) | | | | | | |
| | DBS Group Holdings Ltd. (Singapore) | | | | | | |
| | | | | | | | |
| | | | | | | | |
| | | | | | | | |
| | | | 396,822,859 |
| | Diversified Financials – (20.66%) |
| | Capital Markets – (4.19%) |
| | Bank of New York Mellon Corp. | | | | | | |
| | Consumer Finance – (9.60%) |
| | | | | | | | |
| | Capital One Financial Corp. | | | | | | |
| | | 190,398,916 |
| | Diversified Financial Services – (6.87%) |
| | Berkshire Hathaway Inc., Class A * | | | | | | |
| | | | 409,619,161 |
| SELECTED FUNDS | Schedule of Investments |
| SELECTED AMERICAN SHARES, INC. - (CONTINUED) | December 31, 2021 |
| | Shares
| | Value
(Note 1)
|
| COMMON STOCK – (CONTINUED) |
| | FINANCIALS – (CONTINUED) |
| | | Insurance – (5.55%) |
| | | Life & Health Insurance – (3.16%) |
| | | AIA Group Ltd. (Hong Kong) | | | | | $
| |
| | Ping An Insurance (Group) Co. of China, Ltd. - H (China) | | | | | | |
| | | 62,599,131 |
| | Property & Casualty Insurance – (2.39%) |
| | | | | | | | |
| | | | | | | | |
| | | | | | | | |
| | | 47,343,850 |
| | | | 109,942,981 |
| | | | | | | | |
| | HEALTH CARE – (7.17%) |
| | Health Care Equipment & Services – (4.76%) |
| | | | | | | | |
| | | | | | | | |
| | | | 94,261,604 |
| | Pharmaceuticals, Biotechnology & Life Sciences – (2.41%) |
| | | | | | | | |
| | | | | |
| | INDUSTRIALS – (1.45%) |
| | Capital Goods – (0.09%) |
| | Orascom Construction PLC (United Arab Emirates) | | | | | | |
| | Transportation – (1.36%) |
| | DiDi Global Inc., Class A, ADS (China)* | | | | | | |
| | | | | |
| | INFORMATION TECHNOLOGY – (17.17%) |
| | Semiconductors & Semiconductor Equipment – (15.62%) |
| | | | | | | | |
| | | | | | | | |
| | | | | | | | |
| | | | 309,575,774 |
| | Software & Services – (1.55%) |
| | | | | | | | |
| | Total Information Technology | | | |
| | MATERIALS – (0.89%) |
| | Teck Resources Ltd., Class B (Canada) | | | | | | |
| | | | | |
| | TOTAL COMMON STOCK – (Identified cost $980,181,969)
| | | |
| SELECTED FUNDS | Schedule of Investments |
| SELECTED AMERICAN SHARES, INC. - (CONTINUED) | December 31, 2021 |
| | Shares/Principal | | Value
(Note 1) |
| PREFERRED STOCK – (0.70%) |
| | CONSUMER DISCRETIONARY – (0.70%) |
| | | Retailing – (0.70%) |
| | | | Chengxin Technology, Inc., Series A-1 (China)*(a)(b) | | | | | | |
| | Full Trillion Development Ltd., Class A (China)*(a)(b) | | | | | | |
| | | | | | Total Consumer Discretionary | | | |
| | TOTAL PREFERRED STOCK – (Identified cost $18,500,000)
| | | |
| SHORT-TERM INVESTMENTS – (0.92%) |
| | StoneX Financial Inc. Joint Repurchase Agreement, 0.04%, 01/03/22, dated 12/31/21, repurchase value of $9,586,032 (collateralized by: U.S. Government agency mortgages and obligations in a pooled cash account, 0.50%-9.50%, 04/01/22-01/15/59, total market value $9,777,720) | | | | | | |
| | Truist Securities, Inc. Joint Repurchase Agreement, 0.05%, 01/03/22, dated 12/31/21, repurchase value of $8,725,036 (collateralized by: U.S. Government agency mortgages in a pooled cash account, 1.50%-3.00%, 11/01/31-01/01/52, total market value $8,899,500) | | | | | | |
| | TOTAL SHORT-TERM INVESTMENTS – (Identified cost $18,311,000)
| | | |
| | Total Investments – (100.26%) – (Identified cost $1,016,992,969) | | | 1,987,379,166 |
| | Liabilities Less Other Assets – (0.26%) | | | (5,115,181) |
| | Net Assets – (100.00%) | | $ | 1,982,263,985 |
| |
| | ADR: American Depositary Receipt |
| |
| | ADS: American Depositary Share |
| |
| | * | Non-income producing security. |
| |
| | (a) | Restricted Security – See Note 6 of the Notes to Financial Statements. |
| |
| | (b) | The value of this security was determined using significant unobservable inputs. See Note 1 of the Notes to Financial Statements. |
| |
| See Notes to Financial Statements |
| SELECTED FUNDS | |
| SELECTED INTERNATIONAL FUND, INC. | December 31, 2021 |
| | Shares | | Value
(Note 1) |
| COMMON STOCK – (95.13%) |
| | COMMUNICATION SERVICES – (3.70%) |
| | | Media & Entertainment – (3.70%) |
| | | | Baidu, Inc., Class A, ADR (China)* | | | | | | |
| | Fang Holdings Ltd., Class A, ADR (China)* | | | | | | |
| | iQIYI, Inc., Class A, ADR (China)* | | | | | | |
| | Kuaishou Technology, Class B (China)* | | | | | | |
| | | | Total Communication Services | | | |
| | CONSUMER DISCRETIONARY – (27.58%) |
| | Consumer Durables & Apparel – (3.27%) |
| | Fila Holdings Corp. (South Korea) | | | | | | |
| | Retailing – (24.31%) |
| | Alibaba Group Holding Ltd., ADR (China)* | | | | | | |
| | JD.com, Inc., Class A, ADR (China)* | | | | | | |
| | Meituan, Class B (China)* | | | | | | |
| | Naspers Ltd. - N (South Africa) | | | | | | |
| | Prosus N.V., Class N (Netherlands) | | | | | | |
| | | | 14,511,207 |
| | Total Consumer Discretionary | | | |
| | FINANCIALS – (41.52%) |
| | Banks – (25.70%) |
| | Bank of N.T. Butterfield & Son Ltd. (Bermuda) | | | | | | |
| | Danske Bank A/S (Denmark) | | | | | | |
| | DBS Group Holdings Ltd. (Singapore) | | | | | | |
| | | | | | | | |
| | Metro Bank PLC (United Kingdom)* | | | | | | |
| | | | 15,341,875 |
| | Diversified Financials – (5.48%) |
| | Capital Markets – (5.48%) |
| | Julius Baer Group Ltd. (Switzerland) | | | | | | |
| | Noah Holdings Ltd., Class A, ADS (China)* | | | | | | |
| | | | 3,272,587 |
| | Insurance – (10.34%) |
| | Life & Health Insurance – (10.34%) |
| | AIA Group Ltd. (Hong Kong) | | | | | | |
| | Ping An Insurance (Group) Co. of China, Ltd. - H (China) | | | | | | |
| | | | 6,176,846 |
| | | | | |
| | INDUSTRIALS – (3.94%) |
| | Commercial & Professional Services – (0.39%) |
| | China Index Holdings Ltd., Class A, ADR (China)* | | | | | | |
| | Transportation – (3.55%) |
| | DiDi Global Inc., Class A, ADS (China)* | | | | | | |
| | | | | |
| | INFORMATION TECHNOLOGY – (17.48%) |
| | Semiconductors & Semiconductor Equipment – (6.37%) |
| | Tokyo Electron Ltd. (Japan) | | | | | | |
| | Technology Hardware & Equipment – (11.11%) |
| | Hollysys Automation Technologies Ltd. (China)* | | | | | | |
| SELECTED FUNDS | Schedule of Investments |
| SELECTED INTERNATIONAL FUND, INC. - (CONTINUED) | December 31, 2021 |
| | Shares/Principal | | Value
(Note 1) |
| COMMON STOCK – (CONTINUED) |
| | INFORMATION TECHNOLOGY – (CONTINUED) |
| | | Technology Hardware & Equipment – (Continued) |
| | | | Samsung Electronics Co., Ltd. (South Korea) | | | | | | |
| | | | 6,631,562 |
| | | | | | | Total Information Technology | | | |
| | MATERIALS – (0.91%) |
| | Teck Resources Ltd., Class B (Canada) | | | | | | |
| | | | | |
| | TOTAL COMMON STOCK – (Identified cost $50,439,852)
| | | |
| SHORT-TERM INVESTMENTS – (4.17%) |
| | StoneX Financial Inc. Joint Repurchase Agreement, 0.04%, 01/03/22, dated 12/31/21, repurchase value of $1,303,004 (collateralized by: U.S. Government agency mortgages and obligations in a pooled cash account, 0.50%-9.50%, 04/01/22-01/15/59, total market value $1,329,060) | | | | | | |
| | Truist Securities, Inc. Joint Repurchase Agreement, 0.05%, 01/03/22, dated 12/31/21, repurchase value of $1,187,005 (collateralized by: U.S. Government agency mortgages in a pooled cash account, 1.50%-3.00%, 11/01/31-01/01/52, total market value $1,210,740) | | | | | | |
| | TOTAL SHORT-TERM INVESTMENTS – (Identified cost $2,490,000)
| | | |
| | Total Investments – (99.30%) – (Identified cost $52,929,852) | | | 59,284,269 |
| | Other Assets Less Liabilities – (0.70%) | | | 419,222 |
| | Net Assets – (100.00%) | | $ | 59,703,491 |
| |
| | ADR: American Depositary Receipt |
| |
| | ADS: American Depositary Share |
| |
| | * | Non-income producing security. |
| |
| See Notes to Financial Statements |
| SELECTED FUNDS | Statements of Assets and Liabilities |
| | At December 31, 2021 |
| | | | Selected American Shares | | | Selected International Fund |
| ASSETS: | | | | | | |
Investments in securities at value* (see accompanying Schedules of Investments) | | $ | 1,987,379,166 | | $ | 59,284,269 |
Cash | | | 18,875 | | | 3,532 |
| Receivables: | | | | | | |
| | | Capital stock sold | | | 115,722 | | | 485,621 |
| | Dividends and interest | | | 984,860 | | | 49,648 |
Prepaid expenses | | | 68,577 | | | 3,130 |
Due from Adviser | | | – | | | 9,316 |
| | | Total assets | | | 1,988,567,200 | | | 59,835,516 |
LIABILITIES: | | | | | | |
| Payables: | | | | | | |
| | Capital stock redeemed | | | 4,357,025 | | | 2,457 |
Accrued audit fees | | | 21,642 | | | 7,738 |
Accrued custodian fees | | | 617,896 | | | 68,554 |
Accrued distribution service fees | | | 125,605 | | | 1,850 |
Accrued investment advisory fees | | | 970,034 | | | 29,256 |
Accrued transfer agent fees | | | 197,934 | | | 11,847 |
Other accrued expenses | | | 13,079 | | | 10,323 |
| | Total liabilities | | | 6,303,215 | | | 132,025 |
NET ASSETS | | $ | 1,982,263,985 | | $ | 59,703,491 |
NET ASSETS CONSIST OF: | | | | | | |
Par value of shares of capital stock | | $ | 58,417,993 | | $ | 1,290,214 |
Additional paid-in capital | | | 908,291,065 | | | 53,071,245 |
Distributable earnings | | | 1,015,554,927 | | | 5,342,032 |
| | Net Assets | | $ | 1,982,263,985 | | $ | 59,703,491 |
CLASS S SHARES: | | | | | | |
Net assets | | $ | 560,140,002 | | $ | 6,704,644 |
| Shares outstanding | | | 13,229,299 | | | 582,222 |
Net asset value, offering, and redemption price per share (Net assets ÷ Shares outstanding) | | $ | 42.34 | | $ | 11.52 |
CLASS D SHARES: | | | | | | |
Net assets | | $ | 1,422,123,983 | | $ | 52,998,847 |
| Shares outstanding | | | 33,505,095 | | | 4,578,632 |
Net asset value, offering, and redemption price per share (Net assets ÷ Shares outstanding) | | $ | 42.45 | | $ | 11.58 |
| *Including: | | | | | | |
| | Cost of investments | | $ | 1,016,992,969 | | $ | 52,929,852 |
| See Notes to Financial Statements |
| SELECTED FUNDS | |
| | For the year ended December 31, 2021 |
| | | | Selected American Shares | | | Selected International Fund |
| INVESTMENT INCOME: | | | | | | |
| Income: | | | | | | |
Dividends* | | $ | 23,843,129 | | $ | 1,086,480 |
Interest | | | 27,613 | | | 1,434 |
Net securities lending fees | | | 44,873 | | | 16,626 |
| | | Total income | | | 23,915,615 | | | 1,104,540 |
Expenses: | | | | | | |
Investment advisory fees (Note 3) | | | 11,336,603 | | | 423,319 |
Custodian fees | | | 688,490 | | | 80,790 |
| Transfer agent fees: | | | | | | |
| | | Class S | | | 685,526 | | | 36,955 |
| | Class D | | | 720,351 | | | 51,522 |
Audit fees | | | 63,056 | | | 22,848 |
Legal fees | | | 35,866 | | | 7,938 |
Reports to shareholders | | | 49,359 | | | 3,828 |
Directors’ fees and expenses | | | 400,721 | | | 19,315 |
Registration and filing fees | | | 61,792 | | | 47,103 |
Miscellaneous | | | 93,589 | | | 23,215 |
| Distribution service fees (Note 3): | | | | | | |
| | Class S | | | 1,503,997 | | | 30,024 |
Total expenses
| | | 15,639,350
| | | 746,857
|
Reimbursement of expenses by Adviser (Note 3): | | | | | | |
| | Class S | | | – | | | (38,726) |
| | Class D | | | – | | | (61,477) |
| | Net expenses | | | 15,639,350 | | | 646,654 |
| Net investment income | | | 8,276,265 | | | 457,886 |
REALIZED AND UNREALIZED GAIN (LOSS) ON INVESTMENTS AND FOREIGN CURRENCY TRANSACTIONS: | | | | | | |
| Net realized gain (loss) from: | | | | | | |
| | Investment transactions | | | 253,505,924 | | | 2,079,708 |
| | Foreign currency transactions | | | (21,009) | | | (5,201) |
| Net realized gain | | | 253,484,915 | | | 2,074,507 |
Net increase (decrease) in unrealized appreciation | | | 65,868,021 | | | (20,657,226) |
| | Net realized and unrealized gain (loss) on investments and foreign currency transactions | | | 319,352,936 | | | (18,582,719) |
| Net increase (decrease) in net assets resulting from operations | | $ | 327,629,201 | | $ | (18,124,833) |
*Net of foreign taxes withheld of | | $ | 128,076 | | $ | 125,311 |
| See Notes to Financial Statements |
| SELECTED FUNDS | Statements of Changes in Net Assets |
| | For the year ended December 31, 2021 |
| | | | Selected American Shares | | | Selected International Fund |
| OPERATIONS: | | | | | | |
Net investment income | | $ | 8,276,265 | | $ | 457,886 |
Net realized gain from investments and foreign currency transactions | | | 253,484,915 | | | 2,074,507 |
Net increase (decrease) in unrealized appreciation on investments and foreign currency transactions | | | 65,868,021 | | | (20,657,226) |
| | Net increase (decrease) in net assets resulting from operations | | | 327,629,201 | | | (18,124,833) |
DIVIDENDS AND DISTRIBUTIONS TO SHAREHOLDERS: | | | | | | |
| | Class S | | | (67,945,883) | | | (76,377) |
| | Class D | | | (171,206,906) | | | (748,430) |
CAPITAL SHARE TRANSACTIONS: | | | | | | |
Net increase (decrease) in net assets resulting from capital share transactions (Note 4): | | | | | | |
| | Class S | | | (22,206,450) | | | (3,854,224) |
| | Class D | | | 80,534,900 | | | (1,682,358) |
| | Total increase (decrease) in net assets | | | 146,804,862 | | | (24,486,222) |
NET ASSETS: | | | | | | |
Beginning of year | | | 1,835,459,123 | | | 84,189,713 |
| End of year | | $ | 1,982,263,985 | | $ | 59,703,491 |
| See Notes to Financial Statements |
| SELECTED FUNDS | Statements of Changes in Net Assets |
| | For the year ended December 31, 2020 |
| | | | Selected American Shares | | | Selected International Fund |
| OPERATIONS: | | | | | | |
Net investment income (loss) | | $ | 9,934,597 | | $ | (48,494) |
Net realized gain (loss) from investments and foreign currency transactions | | | 72,450,476 | | | (1,001,586) |
Net increase in unrealized appreciation on investments and foreign currency transactions | | | 94,989,784 | | | 15,198,181 |
| | Net increase in net assets resulting from operations | | | 177,374,857 | | | 14,148,101 |
DIVIDENDS AND DISTRIBUTIONS TO SHAREHOLDERS: | | | | | | |
| | Class S | | | (15,025,908) | | | (222,413) |
| | Class D | | | (38,214,666) | | | (1,249,616) |
CAPITAL SHARE TRANSACTIONS: | | | | | | |
Net increase (decrease) in net assets resulting from capital share transactions (Note 4): | | | | | | |
| | Class S | | | (132,733,334) | | | 5,414,883 |
| | Class D | | | (75,673,976) | | | (1,820,381) |
| |
Total increase (decrease) in net assets | | | (84,273,027) | | | 16,270,574 |
NET ASSETS: | | | | | | |
Beginning of year | | | 1,919,732,150 | | | 67,919,139 |
| End of year | | $ | 1,835,459,123 | | $ | 84,189,713 |
| See Notes to Financial Statements |
| SELECTED FUNDS | Notes to Financial Statements |
| | December 31, 2021 |
NOTE 1 - SUMMARY OF SIGNIFICANT ACCOUNTING POLICIES
The Selected Funds (“Funds”) consist of Selected American Shares, Inc. (a Maryland corporation) (“Selected American Shares”) and Selected International Fund, Inc. (a Maryland corporation) (“Selected International Fund”). The Funds are registered under the Investment Company Act of 1940, as amended, as diversified, open-end management investment companies. The Funds follow the reporting guidance of the Financial Accounting Standards Board (“FASB”) Accounting Standards Codification Topic 946, Financial Services – Investment Companies.
Selected American Shares’ investment objective is to achieve both capital growth and income. The Fund principally invests in common stocks issued by large companies with market capitalizations of at least $10 billion.
Selected International Fund’s investment objective is to achieve capital growth. The Fund principally invests in common stocks issued by foreign companies, including companies in developed or emerging markets. The Fund may invest in large, medium, or small companies without regard to market capitalization.
An investment in the Funds, as with any mutual fund, includes risks that vary depending upon the Funds’ investment objectives and policies. There is no assurance that the investment objective of any fund will be achieved. Each Fund’s return and net asset value will fluctuate. The COVID-19 pandemic has caused market disruptions on a global scale and the long-term impact is uncertain. The aforementioned disruptions may adversely affect the value and liquidity of the Fund’s investments and thus Fund performance.
Class S and Class D shares are sold at net asset value. Income, expenses (other than those attributable to a specific class), and gains and losses are allocated daily to each class of shares based on the relative proportion of net assets represented by each class. Operating expenses directly attributable to a specific class are charged against the operations of that class. All classes have identical rights with respect to voting (exclusive of each class’ distribution arrangement), liquidation, and distributions. Selected International Fund assesses a 2% short-term trading fee on the proceeds of Fund shares that are redeemed (either by selling or exchanging into Selected American Shares) within 30 days of their purchase. The fee, which is retained by the Fund, is accounted for as an addition to paid-in capital.
Eligible Class S shares can be converted to Class D shares upon request. Class D shares offer lower expenses for shareholders who have chosen not to use an intermediary, but instead invest directly with the Funds. These conversions are non-taxable events.
The following is a summary of significant accounting policies followed by the Funds in the preparation of their financial statements.
Security Valuation - The Funds calculate the net asset value of their shares as of the close of the New York Stock Exchange (“Exchange”), normally 4:00 P.M. Eastern time, on each day the Exchange is open for business. Securities listed on the Exchange (and other national exchanges including NASDAQ) are valued at the last reported sales price on the day of valuation. Listed securities for which no sale was reported on that date are valued at the last quoted bid price. Securities traded on foreign exchanges are valued based upon the last sales price on the principal exchange on which the security is traded prior to the time when the Funds’ assets are valued. Securities (including restricted securities) for which market quotations are not readily available or securities whose values have been materially affected by what Davis Selected Advisers, L.P. (“Adviser”), the Funds’ investment adviser, identifies as a significant event occurring before the Funds’ assets are valued, but after the close of their respective exchanges will be fair valued using a fair valuation methodology applicable to the security type or the significant event as previously approved by the Funds’ Pricing Committee and Board of Directors. The Pricing Committee considers all facts it deems relevant that are reasonably available, through either public information or information available to the Adviser’s portfolio management team, when determining the fair value of a security. To assess the appropriateness of security valuations, the Adviser may consider (i) comparing prior day prices and/or prices of comparable securities; (ii) comparing sale prices to the prior or current day prices and challenge those prices exceeding certain tolerance levels with the third-party pricing service or broker source; (iii) new rounds of financing; (iv) the performance of the market or the issuer’s industry; (v) the liquidity of the security; (vi) the size of the holding in a fund; and/or (vii) any other appropriate information. The determination of a security’s fair value price often involves the consideration of a number of subjective factors and is therefore subject to the unavoidable risk that the value assigned to a security may be higher or lower than the security’s value would be if a reliable market quotation for the security was readily available. Fair value determinations are subject to review, approval, and ratification by the Funds’ Board of Directors at its next regularly scheduled meeting covering the calendar quarter in which the fair valuation was determined. Fair valuation methods used by the Funds may include, but are not limited to, valuing securities initially at cost (excluding commissions)
| SELECTED FUNDS | Notes to Financial Statements – (Continued) |
| | December 31, 2021 |
NOTE 1 - SUMMARY OF SIGNIFICANT ACCOUNTING POLICIES – (CONTINUED)
Security Valuation - (Continued)
and subsequently adjusting the value due to: additional transactions by the issuer, changes in company specific fundamentals and changes in the value of similar securities. Values may be further adjusted for any discounts related to security-specific resale restrictions.
Short-term investments purchased within 60 days to maturity are valued at amortized cost, which approximates market value.
The Funds’ valuation procedures are reviewed and subject to approval by the Board of Directors. There have been no significant changes to the fair valuation procedures during the period.
Fair Value Measurements - Fair value is defined as the price that the Funds would receive upon selling an investment in an orderly transaction to an independent buyer in the principal market for the investment. Various inputs are used to determine the fair value of the Funds’ investments. These inputs are summarized in the three broad levels listed below.
Level 1 –
| quoted prices in active markets for identical securities |
Level 2 –
| other significant observable inputs (including quoted prices for similar investments, interest rates, prepayment speeds, credit risk, etc.) |
Level 3 –
| significant unobservable inputs (including the Fund’s own assumptions in determining the fair value of investments) |
The inputs or methodologies used for valuing securities are not necessarily an indication of the risks associated with investing in those securities nor can it be assured that the Funds can obtain the fair value assigned to a security if they were to sell the security.
The following is a summary of the inputs used as of December 31, 2021 in valuing each Fund’s investments carried at value:
| | Investments in Securities at Value |
| | Selected | | Selected |
| | American Shares | | International Fund |
Valuation Inputs | | | | | |
| Level 1 – Quoted Prices: | | | | | |
Common Stock: | | | | | |
| Communication Services | $ | 292,147,735 | | $ | 2,206,674 |
| Consumer Discretionary | | 197,034,657 | | | 16,465,699 |
| Consumer Staples | | 19,634,963 | | | – |
| Financials | | 916,385,001 | | | 24,791,308 |
| Health Care | | 142,113,561 | | | – |
| Industrials | | 28,741,723 | | | 2,350,271 |
| Information Technology | | 340,264,974 | | | 10,434,466 |
| Materials | | 17,677,035 | | | 545,851 |
| Total Level 1 | | 1,953,999,649 | | | 56,794,269 |
| Level 2 – Other Significant Observable Inputs: | | | | | |
| Short-Term Investments | | 18,311,000 | | | 2,490,000 |
| Total Level 2 | | 18,311,000 | | | 2,490,000 |
| Level 3 – Significant Unobservable Inputs: | | | | | |
Common Stock: | | | | | |
| Communication Services | | 1,193,517 | | | – |
Preferred Stock: | | | | | |
| Consumer Discretionary | | 13,875,000 | | | – |
| Total Level 3 | | 15,068,517 | | | – |
| Total Investments | $ | 1,987,379,166 | | $ | 59,284,269 |
| SELECTED FUNDS | Notes to Financial Statements – (Continued) |
| | December 31, 2021 |
NOTE 1 - SUMMARY OF SIGNIFICANT ACCOUNTING POLICIES – (CONTINUED)
Fair Value Measurements - (Continued)
The following table reconciles the valuation of assets in which significant unobservable inputs (Level 3) were used in determining fair value during the year ended December 31, 2021. The net change in unrealized appreciation (depreciation) during the period on Level 3 securities still held at December 31, 2021 was $(4,633,692)* for Selected American Shares. The cost of purchases or proceeds from sales may include securities received or delivered through corporate actions or exchanges. Realized and unrealized gains (losses) are included in the related amounts on investments in the Statements of Operations.
| | | Beginning Balance at January 1, 2021 | | Cost of Purchases | | Proceeds from Sales | | Net Change in Unrealized Appreciation (Depreciation)* | | Net Realized Gain (Loss) | | Transfers into Level 3 | | Transfers out of Level 3** | | | Ending Balance at December 31, 2021 |
| Selected American Shares | | | | | | | | | | | | | | | | | | | | | | | | |
| Investments in Securities: | | | | | | | | | | | | | | | | | | | | | | | | |
| Common Stock | | $ | 1,202,209 | | $ | – | | $ | – | | $ | (8,692) | | $ | – | | $ | – | | $ | – | | $ | 1,193,517 |
| Preferred Stock | | | 51,115,177 | | | 18,500,000 | | | – | | | 14,602,556 | | | – | | | – | | | (70,342,733) | | | 13,875,000 |
| Total Level 3 | | $ | 52,317,386 | | $ | 18,500,000 | | $ | – | | $ | 14,593,864 | | $ | – | | $ | – | | $ | (70,342,733) | | $ | 15,068,517 |
Selected International Fund | | | | | | | | | | | | | | | | | | | | | | | | |
| Investments in Securities: | | | | | | | | | | | | | | | | | | | | | | | | |
| Preferred Stock | | $ | 5,197,134 | | $ | – | | $ | – | | $ | 2,960,090 | | $ | – | | $ | – | | $ | (8,157,224) | | $ | – |
| Total Level 3 | | $ | 5,197,134 | | $ | – | | $ | – | | $ | 2,960,090 | | $ | – | | $ | – | | $ | (8,157,224) | | $ | – |
*Any difference between net change in unrealized appreciation (depreciation) and net change in unrealized appreciation (depreciation) on securities still held at December 31, 2021, may be due to investments no longer held or categorized as Level 3 at year end.
**During the year ended December 31, 2021, certain securities fair valued at $70,342,733 and $8,157,224 for Selected American Shares and Selected International Fund, respectively, transferred out of Level 3 because observable market data became available for the securities.
The following table is a summary of those assets in which significant unobservable inputs (Level 3) were used by the Adviser in determining fair value. Note that these amounts exclude any valuations provided by a pricing service or broker.
| | | Fair Value at December 31, 2021 | | Valuation Technique | | Unobservable Input | | Amount | | Impact to Valuation from an Increase in Input |
| Selected American Shares | | | | | | | | | | | |
| Investments in Securities: | | | | | | | | | | | |
| Common Stock | | $ | 1,193,517 | | Discounted Cash Flow | | Annualized Yield | | 1.726% | | Decrease |
Preferred Stock | | | 13,875,000 | | Market Approach | | Adjusted Transaction Price | | $7.50 | | Increase |
| Total Level 3 | | $ | 15,068,517 | | | | | | | | |
The significant unobservable inputs listed in the above table are used in the fair value measurement of equity securities, and if changed, would affect the fair value of the Funds’ investments. The transaction price input is attributable to private securities and includes assumptions made from private transactions. The “Impact to Valuation from an Increase in Input” represents the change in fair value measurement resulting from an increase in the corresponding input. A decrease in the input would have the opposite effect.
| SELECTED FUNDS | Notes to Financial Statements – (Continued) |
| | December 31, 2021 |
NOTE 1 - SUMMARY OF SIGNIFICANT ACCOUNTING POLICIES – (CONTINUED)
Master Repurchase Agreements - The Funds, along with other affiliated funds, may transfer uninvested cash balances into one or more master repurchase agreement accounts. These balances are invested in one or more repurchase agreements, secured by U.S. Government securities. A custodian bank holds securities pledged as collateral for repurchase agreements until the agreements mature. Each agreement requires that the market value of the collateral be sufficient to cover payments of interest and principal; however, in the event of default by the other party to the agreement, retention of the collateral may be subject to legal proceedings.
Currency Translation - The market values of all assets and liabilities denominated in foreign currencies are recorded in the financial statements after translation to the U.S. Dollar on the date of valuation using exchange rates determined as of the close of trading on the Exchange. The cost basis of such assets and liabilities is determined based upon historical exchange rates. Income and expenses are translated at average exchange rates in effect as accrued or incurred.
Foreign Currency - The Funds may enter into forward purchases or sales of foreign currencies to hedge certain foreign currency denominated assets and liabilities against declines in market value relative to the U.S. Dollar. Forward currency contracts are marked-to-market daily and the change in market value is recorded by the Funds as an unrealized gain or loss. When the forward currency contract is closed, the Funds record a realized gain or loss equal to the difference between the value of the forward currency contract at the time it was opened and value at the time it was closed. Investments in forward currency contracts may expose the Funds to risks resulting from unanticipated movements in foreign currency exchange rates or failure of the counter-party to the agreement to perform in accordance with the terms of the contract. There were no forward contracts entered into by the Funds.
Reported net realized foreign exchange gains or losses arise from the sales of foreign currencies, currency gains or losses realized between the trade and settlement dates on security transactions, the difference between the amounts of dividends, interest, and foreign withholding taxes recorded on the Funds’ books, and the U.S. Dollar equivalent of the amounts actually received or paid. Net unrealized foreign exchange gains or losses arise from changes in the value of assets and liabilities, other than investments in securities at fiscal period end, resulting from changes in the exchange rate. The Funds include foreign currency gains and losses realized on the sales of investments together with market gains and losses on such investments in the Statements of Operations.
Federal Income Taxes - It is each Fund’s policy to comply with the requirements of the Internal Revenue Code applicable to regulated investment companies, and to distribute substantially all of its taxable income, including any net realized gains on investments not offset by loss carryovers, to shareholders. Therefore, no provision for federal income or excise tax is required. The Adviser analyzed the Funds’ tax positions taken on federal and state income tax returns for all open tax years and concluded that as of December 31, 2021, no provision for income tax is required in the Funds’ financial statements related to these tax positions. The Funds’ federal and state (Arizona) income and federal excise tax returns for tax years for which the applicable statutes of limitations have not expired are subject to examination by the Internal Revenue Service and state Department of Revenue. The earliest tax year that remains subject to examination by these jurisdictions is 2018.
During the year ended December 31, 2021, the Selected International Fund utilized $1,061,419 in capital loss carryforwards and thus did not have unused capital loss carryforwards available for federal income tax purposes at the end of the year.
Under current tax regulations, ordinary losses realized after October 31 (“post-October” losses; for the period from November 1, 2021 through December 31, 2021) may be deferred and treated as occurring on the first business day of the following fiscal year. At December 31, 2021, the Selected International Fund had ordinary post-October losses in the amount of $139,778.
Additionally, based on the Funds’ understanding of the tax rules and rates related to income, gains, and transactions for the foreign jurisdictions in which they invest, the Funds will provide for foreign taxes, and where appropriate, deferred foreign taxes.
| SELECTED FUNDS | Notes to Financial Statements – (Continued) |
| | December 31, 2021 |
NOTE 1 - SUMMARY OF SIGNIFICANT ACCOUNTING POLICIES – (CONTINUED)
Federal Income Taxes - (Continued)
At December 31, 2021, the aggregate cost of investments and unrealized appreciation (depreciation) for federal income tax purposes were as follows:
| | | Selected | | Selected |
| | | American Shares | | International Fund |
| Cost | | $ | 1,020,781,902 | | $ | 54,772,649 |
Unrealized appreciation | | | 1,042,490,402 | | | 11,513,217 |
| Unrealized depreciation | | | (75,893,138) | | | (7,001,597) |
| Net unrealized appreciation | | $ | 966,597,264 | | $ | 4,511,620 |
Securities Transactions and Related Investment Income - Securities transactions are accounted for on the trade date (date the order to buy or sell is executed) with realized gain or loss on the sale of securities being determined based upon identified cost. Dividend income is recorded on the ex-dividend date. Interest income, which includes accretion of discount and amortization of premium, is accrued as earned.
Dividends and Distributions to Shareholders - Dividends and distributions to shareholders are recorded on the ex-dividend date. Net investment income (loss), net realized gains (losses), and net unrealized appreciation (depreciation) on investments [collectively “Distributable earnings (losses)”] may differ for financial statement and tax purposes primarily due to permanent and temporary differences which may include wash sales, foreign currency transactions, equalization, corporate actions, partnership income, Directors’ deferred compensation, net operating losses, deferred post-October losses, and passive foreign investment company shares. The character of dividends and distributions made during the fiscal year from net investment income and net realized securities gains may differ from their ultimate characterization for federal income tax purposes. Also, due to the timing of dividends and distributions, the fiscal year in which amounts are distributed may differ from the fiscal year in which income or realized gain was recorded by the Funds. The Funds adjust certain components of capital to reflect permanent differences between financial statement amounts and net income and realized gains/losses determined in accordance with income tax rules. The Funds’ net assets have not been affected by these reclassifications. During the year ended December 31, 2021, amounts have been reclassified to reflect increases (decreases) as follows:
| | Selected American Shares | | Selected International Fund |
Distributable earnings | $ | (9,655,279) |
| $ | – |
Paid-in capital | | 9,655,279 | |
| –
|
The tax character of distributions paid during the years ended December 31, 2021 and 2020 was as follows:
| | Ordinary Income | | Long-Term Capital Gain | | Total |
| Selected American Shares | | | | | | | | |
| 2021 | $ | 8,193,658 | | $ | 230,959,131 | | $ | 239,152,789 |
| 2020 | | 14,732,914 | | | 38,507,660 | | | 53,240,574 |
Selected International Fund | | | | | | | | |
| 2021 | $ | 824,807 | | $ | – | | $ | 824,807 |
| 2020 | | 275,743 | | | 1,196,286 | | | 1,472,029 |
As of December 31, 2021, the components of distributable earnings on a tax basis were as follows:
| | Selected American Shares | | Selected International Fund |
| Undistributed ordinary income | $ | 1,745,332 | | $ | – |
| Undistributed long-term capital gain | | 48,761,619 | | | 998,905 |
Net unrealized appreciation on investments and foreign currency transactions | | 966,595,763 | | | 4,510,478 |
| Deferred ordinary post-October losses | | – | | | (139,778) |
| Other temporary differences | | (1,547,787) | | | (27,573) |
| Total | $ | 1,015,554,927 | | $ | 5,342,032 |
| SELECTED FUNDS | Notes to Financial Statements – (Continued) |
| | December 31, 2021 |
NOTE 1 - SUMMARY OF SIGNIFICANT ACCOUNTING POLICIES – (CONTINUED)
Indemnification - Under the Funds’ organizational documents, their officers and directors are indemnified against certain liabilities arising out of the performance of their duties to the Funds. In addition, some of the Funds’ contracts with their service providers contain general indemnification clauses. The Funds’ maximum exposure under these arrangements is unknown since the amount of any future claims that may be made against the Funds cannot be determined and the Funds have no historical basis for predicting the likelihood of any such claims.
Use of Estimates in Financial Statements - In preparing financial statements in conformity with accounting principles generally accepted in the United States of America, management makes estimates and assumptions that affect the reported amounts of assets and liabilities and disclosure of contingent assets and liabilities at the date of the financial statements, as well as the reported amounts of income and expenses during the reporting period. Actual results may differ from these estimates.
Directors Fees and Expenses - The Funds set up a Rabbi Trust to provide for the deferred compensation plan for Independent Directors that enables them to elect to defer receipt of all or a portion of annual fees they are entitled to receive. The value of an eligible Director’s account is based upon years of service and fees paid to each Director during the years of service. The amount paid to the Director by the Trust under the plan will be determined based upon the performance of the Funds in which the amounts are invested.
NOTE 2 - PURCHASES AND SALES OF SECURITIES
The cost of purchases and proceeds from sales of investment securities (excluding short-term investments) during the year ended December 31, 2021 were as follows:
| | Selected American Shares | | Selected International Fund |
| Cost of purchases | $ | 404,007,850 | | $ | 16,273,895 |
| Proceeds from sales | | 583,556,176 | | | 17,765,561 |
NOTE 3 - FEES AND OTHER TRANSACTIONS WITH SERVICE PROVIDERS (INCLUDING AFFILIATES)
Davis Selected Advisers-NY, Inc. (“DSA-NY”), a wholly-owned subsidiary of the Adviser, acts as sub-adviser to the Funds. DSA-NY performs research and portfolio management services for the Funds under a Sub-Advisory Agreement with the Adviser. The Funds pay no fees directly to DSA-NY.
All officers of the Funds (including Interested Directors) hold positions as executive officers with the Adviser or its affiliates.
As of December 31, 2021, related shareholders with greater than 20% of outstanding shares were as follows:
Selected American Shares | | Selected International Fund |
| n/a | | 26% |
Investment activities of this shareholder could have a material impact on the Fund.
Investment Advisory Fees and Reimbursement of Expenses - Advisory fees are paid monthly to the Adviser. The annual rate for Selected American Shares is 0.55% of the average net assets for the first $3 billion, 0.54% on the next $1 billion, 0.53% on the next $1 billion, 0.52% on the next $1 billion, 0.51% on the next $1 billion, 0.50% on the next $3 billion, and 0.485% of the average net assets in excess of $10 billion. Advisory fees paid during the year ended December 31, 2021 approximated 0.55% of the average net assets for Selected American Shares. The fixed annual rate for Selected International Fund is 0.55% of the average net assets. The Adviser is contractually committed to waive fees and/or reimburse Selected International Fund’s expenses to the extent necessary to cap total annual Fund operating expenses (Class S shares, 1.05%, and Class D shares, 0.80%) until May 1, 2022. After that date, there is no assurance that the Adviser will continue to cap expenses. The expense cap cannot be terminated prior to that date without the consent of the Board of Directors. During the year ended December 31, 2021, such reimbursements for Class S and Class D of Selected International Fund amounted to $38,726 and $61,477, respectively, and are not subject to future recoupment.
| SELECTED FUNDS | Notes to Financial Statements – (Continued) |
| | December 31, 2021 |
NOTE 3 - FEES AND OTHER TRANSACTIONS WITH SERVICE PROVIDERS (INCLUDING AFFILIATES) – (CONTINUED)
Transfer Agent and Accounting Fees - DST Asset Manager Solutions, Inc. is the Funds’ primary transfer agent. The Adviser is also paid for certain transfer agent services. The fees paid to the Adviser during the year ended December 31, 2021 were $175,194 and $15,729 for Selected American Shares and Selected International Fund, respectively. State Street Bank and Trust Company (“State Street Bank”) is the Funds’ primary accounting provider. Fees for such services are included in the custodian fees as State Street Bank also serves as the Funds’ custodian.
Distribution Service Fees - For services under the distribution agreement, the Funds’ Class S shares pay an annual fee of 0.25% of average daily net assets. During the year ended December 31, 2021, Selected American Shares and Selected International Fund incurred distribution service fees totaling $1,503,997 and $30,024 respectively.
There are no distribution service fees for the Funds’ Class D shares.
NOTE 4 - CAPITAL STOCK
At December 31, 2021, there were 600 million shares of capital stock of Selected American Shares ($1.25 par value per share) and 50 million shares of capital stock of Selected International Fund ($0.25 par value per share) authorized. Transactions in capital stock were as follows:
| | Year ended December 31, 2021 |
| | | Sold | | | Reinvestment of Distributions | | | Redeemed* | | | Net Increase (Decrease) |
| Selected American Shares | | | | | | | | | | | |
| Shares: Class S | | 174,329 | | | 1,516,893 | | | (2,152,205) | | | (460,983) |
| Class D | | 1,269,967 | | | 3,607,734 | | | (3,029,621) | | | 1,848,080 |
| Value: Class S | $ | 8,132,046 | | $ | 67,182,983 | | $ | (97,521,479) | | $ | (22,206,450) |
| Class D | | 59,019,262 | | | 159,965,469 | | | (138,449,831) | | | 80,534,900 |
| | | | | | | | | | | | |
| Selected International Fund | | | | | | | | | | | |
| Shares: Class S | | 233,254 | | | 6,370 | | | (588,297) | | | (348,673) |
| Class D | | 154,526 | | | 60,923 | | | (324,266) | | | (108,817) |
| Value: Class S | $ | 3,564,535 | | $ | 75,486 | | $ | (7,494,245) | | $ | (3,854,224) |
| Class D | | 2,116,040 | | | 725,598 | | | (4,523,996) | | | (1,682,358) |
| | | | | | | | | | | | |
* Selected International Fund: net of short-term trading fees amounting to $2,253 and $2 for Class S and Class D, respectively.
| | Year ended December 31, 2020 |
| | | Sold | | | Reinvestment of Distributions | | | Redeemed* | | | Net Increase (Decrease) |
| Selected American Shares | | | | | | | | | | | |
| Shares: Class S | | 413,658 | | | 371,821 | | | (4,718,406) | ^ | | (3,932,927) |
| Class D | | 1,931,264
| ^
| | 883,397 | | | (5,050,947) | | | (2,236,286) |
| Value: Class S | $ | 12,134,434 | | $ | 14,802,200 | | $ | (159,669,968) | ^ | $ | (132,733,334) |
| Class D | | 63,489,972
| ^
| | 35,238,673 | | | (174,402,621) | | | (75,673,976) |
| | | | | | | | | | | | |
| Selected International Fund | | | | | | | | | | | |
| Shares: Class S | | 436,143 | | | 15,264 | | | (56,780) | | | 394,627 |
| Class D | | 79,125 | | | 83,507 | | | (323,772) | | | (161,140) |
| Value: Class S | $ | 5,926,228 | | $ | 220,415 | | $ | (731,760) | | $ | 5,414,883 |
| Class D | | 1,008,534 | | | 1,212,517 | | | (4,041,432) | | | (1,820,381) |
| | | | | | | | | | | | |
* Selected International Fund: net of short-term trading fees amounting to $129 and $253 for Class S and Class D, respectively.
^ Includes Class S to Class D conversions as disclosed in Note 1 of the Notes to Financial Statements.
NOTE 5 - SECURITIES LOANED
The Funds have entered into a securities lending arrangement with State Street Bank. Under the terms of the agreement, the Funds receive fee income from lending transactions; in exchange for such fees, State Street Bank is authorized to loan securities on behalf of the Funds, against receipt of collateral at least equal to the value of the securities loaned. As of December 31, 2021, the Funds did not have any securities on loan. The Funds bear the risk of any deficiency in the amount of the collateral available for return to a borrower due to a loss in an approved investment.
| SELECTED FUNDS | Notes to Financial Statements – (Continued) |
| | December 31, 2021 |
NOTE 6 - RESTRICTED SECURITIES
Restricted securities are not registered under the Securities Act of 1933 and may have contractual restrictions on resale. They are fair valued under methods approved by the Board of Directors. The aggregate value of restricted securities in Selected American Shares amounted to $15,068,517 or 0.76% of the Fund’s net assets as of December 31, 2021. Information regarding restricted securities is as follows:
| Fund | | Security | | Initial Acquisition Date | | Units/Shares | | Cost per Unit/ Share | | Valuation per Unit/Share as of December 31, 2021 |
Selected American Shares | | ASAC II L.P. | | 10/10/13 | | 1,174,606 | | $ | 1.00 | | $ | 1.0161 |
Selected American Shares | | Chengxin Technology, Inc., Series A-1, Pfd. | | 03/29/21 | | 1,597,009 | | $ | 10.00 | | $ | 7.50 |
Selected American Shares | | Full Trillion Development Ltd., Class A, Pfd. | | 03/29/21 | | 252,991 | | $ | 10.00 | | $ | 7.50 |
The following financial information represents selected data for each share of capital stock outstanding throughout each period: |
| | | Income (Loss) from Investment Operations |
| | Net Asset Value, Beginning of Period | Net Investment Income (Loss)a | Net Realized and Unrealized Gains (Losses) | Total from Investment Operations |
| Selected American Shares Class S: | | | | |
| Year ended December 31, 2021 | $40.41 | $0.08 | $7.16 | $7.24 |
| Year ended December 31, 2020 | $37.22 | $0.14 | $4.17 | $4.31 |
| Year ended December 31, 2019 | $29.94 | $0.19 | $8.97 | $9.16 |
| Year ended December 31, 2018 | $40.53 | $0.20 | $(5.35) | $(5.15) |
| Year ended December 31, 2017 | $35.76 | $0.15 | $7.46 | $7.61 |
| Selected American Shares Class D: | | | | |
| Year ended December 31, 2021 | $40.50 | $0.23 | $7.18 | $7.41 |
| Year ended December 31, 2020 | $37.29 | $0.24 | $4.20 | $4.44 |
| Year ended December 31, 2019 | $29.99 | $0.30 | $8.99 | $9.29 |
| Year ended December 31, 2018 | $40.59 | $0.33 | $(5.36) | $(5.03) |
| Year ended December 31, 2017 | $35.80 | $0.28 | $7.47 | $7.75 |
| Selected International Fund Class S: | | | | |
| Year ended December 31, 2021 | $14.92 | $0.06 | $(3.33) | $(3.27) |
| Year ended December 31, 2020 | $12.56 | $(0.03) | $2.64 | $2.61 |
| Year ended December 31, 2019 | $10.45 | $0.04 | $2.77 | $2.81 |
| Year ended December 31, 2018 | $14.44 | $0.04 | $(3.23) | $(3.19) |
| Year ended December 31, 2017 | $10.45 | $(0.03) | $4.02 | $3.99 |
| Selected International Fund Class D: | | | | |
| Year ended December 31, 2021 | $15.00 | $0.09 | $(3.34) | $(3.25) |
| Year ended December 31, 2020 | $12.62 | $(0.01) | $2.66 | $2.65 |
| Year ended December 31, 2019 | $10.50 | $0.06 | $2.80 | $2.86 |
| Year ended December 31, 2018 | $14.53 | $0.09 | $(3.26) | $(3.17) |
| Year ended December 31, 2017 | $10.50 | $0.05 | $4.03 | $4.08 |
a | Per share calculations were based on average shares outstanding for the period. |
| | |
b | Assumes hypothetical initial investment on the business day before the first day of the fiscal period, with all dividends and distributions reinvested in additional shares on the reinvestment date, and redemption at the net asset value calculated on the last business day of the fiscal period. |
| | |
c | The ratios in this column reflect the impact, if any, of certain reimbursements. |
| Dividends and Distributions | | | | Ratios to Average Net Assets | |
Dividends from Net Investment Income | Distributions from Realized Gains | Return of Capital | Total Distributions | Net Asset Value, End of Period | Total Returnb | Net Assets, End of Period (in millions) | Gross Expense Ratio | Net Expense Ratioc | Net Investment Income (Loss) Ratio | Portfolio Turnoverd |
| | | | | | | | | | | |
| $(0.07) | $(5.24) | $– | $(5.31) | $42.34 | 17.72% | $560 | 0.98% | 0.98% | 0.18% | 20% |
| $(0.15) | $(0.97) | $– | $(1.12) | $40.41 | 11.61% | $553 | 0.98% | 0.98% | 0.39% | 12% |
| $(0.41) | $(1.47) | $– | $(1.88) | $37.22 | 31.15% | $656 | 0.98% | 0.98% | 0.56% | 11% |
| $(0.19) | $(5.25) | $– | $(5.44) | $29.94 | (14.00)% | $656 | 0.97% | 0.97% | 0.52% | 24% |
| $(0.15) | $(2.69) | $– | $(2.84) | $40.53 | 21.77% | $911 | 0.97% | 0.97% | 0.39% | 13% |
| | | | | | | | | | | |
| $(0.22) | $(5.24) | $– | $(5.46) | $42.45 | 18.10% | $1,422 | 0.67% | 0.67% | 0.49% | 20% |
| $(0.26) | $(0.97) | $– | $(1.23) | $40.50 | 11.95% | $1,282 | 0.67% | 0.67% | 0.70% | 12% |
| $(0.52) | $(1.47) | $– | $(1.99) | $37.29 | 31.57% | $1,264 | 0.66% | 0.66% | 0.88% | 11% |
| $(0.32) | $(5.25) | $– | $(5.57) | $29.99 | (13.71)% | $1,025 | 0.65% | 0.65% | 0.84% | 24% |
| $(0.27) | $(2.69) | $– | $(2.96) | $40.59 | 22.18% | $1,344 | 0.65% | 0.65% | 0.71% | 13% |
| | | | | | | | | | | |
| $(0.13) | $– | $– | $(0.13) | $11.52 | (21.94)% | $7 | 1.37% | 1.05% | 0.39% | 22% |
| $(0.03) | $(0.22) | $– | $(0.25) | $14.92 | 20.77% | $14 | 1.44% | 1.11% | (0.28)% | 23% |
| $(0.34) | $(0.36) | $– | $(0.70) | $12.56 | 27.15% | $7 | 1.50% | 1.15% | 0.27% | 9% |
| $(0.01) | $(0.79) | $– | $(0.80) | $10.45 | (22.27)% | $9 | 1.31% | 1.26% | 0.30% | 31% |
$–e | $– | $– | $–e | $14.44 | 38.22% | $34 | 1.28% | 1.25% | (0.07)% | 12% |
| | | | | | | | | | | |
| $(0.17) | $– | $– | $(0.17) | $11.58 | (21.72)% | $53 | 0.90% | 0.80% | 0.64% | 22% |
| $(0.05) | $(0.22) | $– | $(0.27) | $15.00 | 21.08% | $70 | 0.89% | 0.87% | (0.04)% | 23% |
| $(0.38) | $(0.36) | $– | $(0.74) | $12.62 | 27.45% | $61 | 0.90% | 0.90% | 0.52% | 9% |
| $(0.07) | $(0.79) | $– | $(0.86) | $10.50 | (22.05)% | $48 | 0.89% | 0.89% | 0.67% | 31% |
| $(0.05) | $– | $– | $(0.05) | $14.53 | 38.90% | $69 | 0.87% | 0.87% | 0.31% | 12% |
d | The lesser of purchases or sales of portfolio securities for a period, divided by the monthly average of the market value of portfolio securities owned during the period. Securities with a maturity or expiration date at the time of acquisition of one year or less are excluded from the calculation. |
| | |
e | Less than $0.005 per share. |
| |
| See Notes to Financial Statements |
| SELECTED FUNDS | Report of Independent Registered Public Accounting Firm |
The Shareholders and Board of Directors
Selected American Shares, Inc. and Selected International Fund, Inc.:
Opinion on the Financial Statements
We have audited the accompanying statements of assets and liabilities of Selected American Shares, Inc. and Selected International Fund, Inc. (the “Funds”), including the schedules of investments, as of December 31, 2021, the related statements of operations for the year then ended, the statements of changes in net assets for each of the years in the two-year period then ended, and the related notes (collectively, the financial statements) and the financial highlights for each of the years in the five-year period then ended. In our opinion, the financial statements and financial highlights present fairly, in all material respects, the financial position of the Funds as of December 31, 2021, the results of their operations for the year then ended, the changes in their net assets for each of the years in the two-year period then ended, and the financial highlights for each of the years in the five-year period then ended, in conformity with U.S. generally accepted accounting principles.
Basis for Opinion
These financial statements and financial highlights are the responsibility of the Funds’ management. Our responsibility is to express an opinion on these financial statements and financial highlights based on our audits. We are a public accounting firm registered with the Public Company Accounting Oversight Board (United States) (“PCAOB”) and are required to be independent with respect to the Funds in accordance with the U.S. federal securities laws and the applicable rules and regulations of the Securities and Exchange Commission and the PCAOB.
We conducted our audits in accordance with the standards of the PCAOB. Those standards require that we plan and perform the audit to obtain reasonable assurance about whether the financial statements and financial highlights are free of material misstatement, whether due to error or fraud. Our audits included performing procedures to assess the risks of material misstatement of the financial statements and financial highlights, whether due to error or fraud, and performing procedures that respond to those risks. Such procedures included examining, on a test basis, evidence regarding the amounts and disclosures in the financial statements and financial highlights. Such procedures also included confirmation of securities owned as of December 31, 2021, by correspondence with the custodian and brokers or by other appropriate auditing procedures. Our audits also included evaluating the accounting principles used and significant estimates made by management, as well as evaluating the overall presentation of the financial statements and financial highlights. We believe that our audits provide a reasonable basis for our opinion.
KPMG LLP
We have served as the auditor of one or more Selected Funds investment companies since 1998.
Denver, Colorado
February 18, 2022
| SELECTED FUNDS | Federal Income Tax Information ( Unaudited) |
In early 2022, shareholders received information regarding all dividends and distributions paid to them by the Funds during the calendar year 2021. Regulations of the U.S. Treasury Department require the Funds to report this information to the Internal Revenue Service.
The information and distributions reported herein may differ from the information reported as distributions taxable to certain shareholders for the calendar year 2021 with their 2021 Form 1099-DIV.
The information is presented to assist shareholders in reporting dividends and distributions received from the Funds to the Internal Revenue Service. Because of the complexity of the federal regulations that may affect your individual tax return and the many variations in state and local tax regulations, we recommend that you consult your tax adviser for specific guidance.
Each Fund designates the following amounts distributed during the calendar year ended December 31, 2021, if any, as dividends eligible for the corporate dividends-received deduction, qualified dividend income, and long-term capital gain distributions.
| | | | Selected American Shares | | | Selected International Fund |
Income dividends* | | $ | 8,193,658 | | $ | 914,411 |
| Income qualifying for corporate dividends-received deduction | | $ | 8,193,658 | | $ | – |
| | | 100% | | | –% |
| Qualified dividend income | | $ | 8,193,658 | | $ | 773,389 |
| | | 100% | | | 85% |
Long-term capital gain distributions** | | $ | 230,959,131 | | $ | – |
*Includes foreign tax credit pass-through, if applicable.
**Selected American Shares paid long-term capital gain distributions in the amount of $230,959,131. The Fund utilized equalization accounting for tax purposes, whereby a portion of redemption payments were treated as distributions of long-term capital gain. As a result, the Fund designated long-term capital gain distributions in the amount of $240,614,410.
Pursuant to Section 853 of the Internal Revenue Code, the Selected International Fund designates $89,604 as foreign taxes paid during the year ended December 31, 2021. Approximately 100% of the ordinary income distribution deemed to be paid during the year ended December 31, 2021 was derived from foreign sourced income of $1,211,791. Selected International Fund did not derive any income from ineligible foreign sources as defined under Section 901(j) of the Internal Revenue Code. Foreign taxes paid for purposes of Section 853 may be less than actual foreign taxes paid for financial statement purposes.
| SELECTED FUNDS | Privacy Notice and Householding |
Privacy Notice
While you generally will be dealing with a broker-dealer or other financial adviser, we may collect information about you from your account application and other forms that you may deliver to us. We use this information to process your requests and transactions; for example, to provide you with additional information about our Funds, to open an account for you, or to process a transaction. In order to service your account and execute your transactions, we may provide your personal information to firms that assist us in servicing your account, such as our transfer agent. We may also provide your name and address to one of our agents for the purpose of mailing to you your account statement and other information about our products and services. We may also gather information through the use of “cookies” when you visit our website. These files help us to recognize repeat visitors and allow easy access to and use of the website. We require these outside firms and agents to protect the confidentiality of your information and to use the information only for the purpose for which the disclosure is made. We do not provide customer names and addresses to outside firms, organizations, or individuals except in furtherance of our business relationship with you or as otherwise allowed by law.
We restrict access to nonpublic personal information about you to those employees who need to know that information to provide products or services to you. We maintain physical, electronic, and procedural safeguards that comply with federal standards to guard your personal information.
Householding
The Funds may, on occasion, mail notices, reports, prospectuses, or proxy material to shareholders. To avoid sending duplicate copies of materials to households, the Funds will mail only one copy of these items to shareholders having the same last name and address on the Funds’ records. The consolidation of these mailings, called householding, benefits the Funds through reduced mailing expense. If you have a direct account with the Funds and you do not want the mailing of these documents to be combined with those to other members of your household, please contact Selected Funds by phone at 1-800-243-1575. Your instructions will become effective within 30 days of your notice to the Funds.
For the purpose of their service as Directors to the Selected Funds, the business address for each of the Directors is 2949 E. Elvira Road, Suite 101, Tucson, AZ 85756. Each Director serves until retirement, resignation, death, or removal. After turning 75, each Director will be annually reviewed by the Independent Directors, and a majority of the Independent Directors (with such Director abstaining) may request such Director’s resignation as of the last business day of the year. Subject to further exceptions and exemptions that may be granted by the Independent Directors, Directors must retire from the Board and cease being a Director at the close of business on the last day of the calendar year in which the Director attains age 80.
Name, Date of Birth, Position(s) Held with Funds, Length of Service | Principal Occupation(s) During Past Five Years | Number of Portfolios Overseen | Other Directorships |
Independent Directors
| | | | |
Francisco L. Borges (11/17/51) Director since 2006 | Chairman and Managing Partner, Landmark Partners, LLC (private equity firm) since March 1999. | 3 | Chairman and Trustee, John S. and James L. Knight Foundation; Chairman/Director, Assured Guaranty Ltd. (financial guaranty insurance business); Director, Jefferies Financial Group (holding company); Trustee, Millbrook School; Trustee, Clipper Funds Trust (consisting of one portfolio); Director, Hartford HealthCare (healthcare network). |
| | | | |
Lawrence E. Harris (09/16/56) Director since 2015 | Fred V. Keenan Chair in Finance of the Marshall School of Business, University of Southern California, Los Angeles, CA. | 3 | Director, Interactive Brokers Group, Inc.; Trustee, Clipper Funds Trust (consisting of one portfolio). |
| | | | |
Steven N. Kearsley (09/29/41) Director since 2015 | Private Investor, Real Estate Development. | 3 | Trustee, Clipper Funds Trust (consisting of one portfolio). |
| | | | |
Katherine L. MacWilliams (01/19/56) Director since 1997 | Retired; Chief Financial Officer, Caridian BCT, Inc. (medical device company) 2008-2012. | 3 | Trustee, Clipper Funds Trust (consisting of one portfolio). |
| | | | |
James J. McMonagle (10/01/44) Director since 1990 Chairman since 1997 | Of Counsel to Vorys, Sater, Seymour and Pease LLP (law firm) since 2002. | 3 | Chairman/Trustee, Clipper Funds Trust (consisting of one portfolio). |
| | | | |
Richard O’Brien (09/12/45) Director since 1996 | Retired; Corporate Economist, HP Inc. | 3 | Trustee, Clipper Funds Trust (consisting of one portfolio). |
Interested Directors*
| | | | |
Andrew A. Davis (06/25/63) Director since 1998 | President or Vice President of each Selected Fund, Clipper Fund, and Davis Fund; President, Davis Selected Advisers, L.P., and also serves as an executive officer of certain companies affiliated with the Adviser. | 16 | Director, Davis Funds (consisting of 13 portfolios); Trustee, Clipper Funds Trust (consisting of one portfolio). |
| | | | |
Christopher C. Davis (07/13/65) Director since 1998 | President or Vice President of each Selected Fund, Davis Fund, Clipper Fund, and Davis ETF; Chairman, Davis Selected Advisers, L.P., and also serves as an executive officer of certain companies affiliated with the Adviser, including sole member of the Adviser’s general partner, Davis Investments, LLC. | 16 | Director, Davis Funds (consisting of 13 portfolios); Trustee, Clipper Funds Trust (consisting of one portfolio); Lead Independent Director, Graham Holdings Company (educational and media company); Director, The Coca-Cola Company (beverage company); Director, Berkshire Hathaway Inc. (financial services). |
* Andrew A. Davis and Christopher C. Davis own partnership units (directly, indirectly, or both) of the Adviser and are considered to be “interested persons” of the Funds as defined in the Investment Company Act of 1940. Andrew A. Davis and Christopher C. Davis are brothers.
Officers
Lisa J. Cohen (born 04/25/89, Selected Funds officer since 2021). Vice President and Secretary of Selected Funds (consisting of two portfolios), Davis Funds (consisting of 13 portfolios), Clipper Funds Trust (consisting of one portfolio), and Davis Fundamental ETF Trust (consisting of four portfolios); Vice President, Senior Attorney, and Secretary, Davis Selected Advisers, L.P., and also serves as an executive officer of certain companies affiliated with the Adviser.
Andrew A. Davis (born 06/25/63, Selected Funds officer since 1998). See description in the section on Interested Directors.
Christopher C. Davis (born 07/13/65, Selected Funds officer since 1998). See description in the section on Interested Directors.
Kenneth C. Eich (born 08/14/53, Selected Funds officer since 1997). Executive Vice President and Principal Executive Officer of Selected Funds (consisting of two portfolios), Davis Funds (consisting of 13 portfolios), and Clipper Funds Trust (consisting of one portfolio); Trustee/Chairman, Executive Vice President, and Principal Executive Officer of Davis Fundamental ETF Trust (consisting of four portfolios); Chief Operating Officer, Davis Selected Advisers, L.P., and also serves as an executive officer of certain companies affiliated with the Adviser.
Douglas A. Haines (born 03/04/71, Selected Funds officer since 2004). Vice President, Treasurer, Chief Financial Officer, Principal Financial Officer, and Principal Accounting Officer of Selected Funds (consisting of two portfolios), Davis Funds (consisting of 13 portfolios), Clipper Funds Trust (consisting of one portfolio), and Davis Fundamental ETF Trust (consisting of four portfolios); Vice President and Director of Fund Accounting, Davis Selected Advisers, L.P.
Randi J. Roessler (born 06/26/81, Selected Funds officer since 2018). Vice President and Chief Compliance Officer of Selected Funds (consisting of two portfolios), Davis Funds (consisting of 13 portfolios), Clipper Funds Trust (consisting of one portfolio), and Davis Fundamental ETF Trust (consisting of four portfolios); Vice President and Chief Compliance Officer, Davis Selected Advisers, L.P., and also serves as an executive officer of certain companies affiliated with the Adviser.
| Investment Adviser |
Davis Selected Advisers, L.P. |
2949 East Elvira Road, Suite 101 |
Tucson, Arizona 85756 |
| |
| Distributor |
Davis Distributors, LLC |
2949 East Elvira Road, Suite 101 |
Tucson, Arizona 85756 |
| |
| Custodian |
State Street Bank and Trust Co. |
c/o The Selected Funds |
One Lincoln Street |
Boston, Massachusetts 02111 |
| |
| Transfer Agent |
DST Asset Manager Solutions, Inc. |
c/o The Selected Funds |
P.O. Box 219662 |
Kansas City, Missouri 64121-9662 |
| |
Overnight Address: |
430 West 7th Street, Suite 219662 |
Kansas City, Missouri 64105-1407 |
| |
| Legal Counsel |
Greenberg Traurig, LLP |
77 West Wacker Drive, Suite 3100 |
Chicago, Illinois 60601 |
| |
| Independent Registered Public Accounting Firm |
KPMG LLP |
1225 17th Street, Suite 800 |
Denver, Colorado 80202 |
| |
For more information about the Selected Funds including management fee, charges, and expenses, see the current prospectus, which must precede or accompany this report. The Funds’ Statement of Additional Information contains additional information about the Funds’ Directors and is available without charge upon request by calling 1-800-243-1575 or on the Funds’ website at www.selectedfunds.com. Quarterly Fact Sheets are available on the Funds’ website at www.selectedfunds.com.
ITEM 2. CODE OF ETHICS
The registrant has adopted a code of ethics that applies to the registrant’s principal executive officer, principal financial officer, principal accounting officer or controller, or persons performing similar functions.
A copy of the code of ethics is filed as an exhibit to this form N-CSR.
No substantive amendments were approved or waivers granted to this code of ethics during the period covered by this report.
ITEM 3. AUDIT COMMITTEE FINANCIAL EXPERT
The registrant’s Board of Directors has determined that independent director Katherine MacWilliams qualifies as the “audit committee financial expert”, as defined in Item 3 of form N-CSR.
ITEM 4. PRINCIPAL ACCOUNTANT FEES AND SERVICES
(a)
| Audit Fees. The aggregate Audit Fees billed by KPMP LLP ("KPMG") for professional services rendered for the audits of the audits of the financial statements, or services that are normally provided in connection with statutory and regulatory filings or engagements for the fiscal year ends December 31, 2021 and December 31, 2020 were $22,848 and $22,400, respectively. |
| | |
(b)
| Audit-Related Fees. The aggregate Audit-Related Fees billed by KPMG for services rendered for assurance and related services that are not reasonably related to the performance of the audit or review of the fund financial statements, but not reported as Audit Fees for fiscal year ends December 31, 2021 and December 31, 2020 were $0 and $0, respectively. |
| | |
(c)
| Tax Fees. The aggregate Tax Fees billed by KPMG for professional services rendered for tax compliance, tax advice and tax planning for the fiscal year ends December 31, 2021 and December 31, 2020 were $8,910 and $8,475, respectively. Fees included in the Tax Fee category comprise all services performed by professional staff in the independent accountant's tax division except those services related to the audit. These services include preparation of tax returns, tax advice related to mergers and a review of the fund income and capital gain distributions. |
| | |
(d)
| All Other Fees. The aggregate Other Fees billed by KPMG for all other non-audit services rendered to the fund for the fiscal year ends December 31, 2021 and December 31, 2020 were $1,175 and $2,850, respectively. |
| | |
(e)(1)
| Audit Committee Pre-Approval Policies and Procedures. The fund Audit Committee must pre-approve all audit and non-audit services provided by the independent accountant relating to the operations or financial reporting of the funds. Prior to the commencement of any audit or non-audit services to a fund, the Audit Committee reviews the services to determine whether they are appropriate and permissible under applicable law. The fund Audit Committee has adopted a policy whereby audit and non-audit services performed by the fund independent accountant require pre-approval in advance at regularly scheduled Audit Committee meetings. If such a service is required between regularly scheduled Audit Committee meetings, pre-approval may be authorized by the Audit Committee Chairperson with ratification at the next scheduled audit committee meeting. |
| | |
(e)(2)
| No services included in (b) – (d) above were approved pursuant to paragraph (c)(7)(i)(C) of Rule 2-1 of Regulation S-X. |
| | |
(f)
| Not applicable |
| | |
(g)
| The Funds’ independent accountant did not provide any services to the investment advisor or any affiliate for the fiscal years ended December 31, 2021 and December 31, 2020. The fund has not paid any fees for non-audit not previously disclosed in items 4 (b) – (d). |
| | |
(h)
| The registrant’s audit committee of the Board of Directors has considered whether the provision of non-audit services that were rendered to the registrant’s investment adviser, and any entity controlling, controlled by, or under common control with the investment adviser that provides ongoing services to the registrant that not pre-approved pursuant to paragraph (c)(7)(ii) of Rule 2-01 of Regulation S-X is compatible with maintaining the principal accountant’s independence. No such services were rendered. |
ITEM 5. AUDIT COMMITTEE OF LISTED REGISTRANTS
Not Applicable
ITEM 6. SCHEDULE OF INVESTMENTS
(a)
| Not Applicable. The complete Schedule of Investments is included in Item 1 of this Form N-CSR |
| | |
(b)
| Not Applicable. |
ITEM 7. DISCLOSURE OF PROXY VOTING POLICIES AND PROCEDURES FOR CLOSED-END MANAGEMENT INVESTMENT COMPANIES
Not Applicable
ITEM 8. PORTFOLIO MANAGERS OF CLOSED-END MANAGEMENT INVESTMENT COMPANIES
Not Applicable
ITEM 9. PURCHASES OF EQUITY SECURITIES BY CLOSED-END MANAGEMENT INVESTMENT COMPANIES AND AFFILIATED PURCHASERS
Not Applicable
ITEM 10. SUBMISSION OF MATTERS TO A VOTE OF SECURITY HOLDERS
There have been no changes to the procedure by which shareholders may recommend nominees to the registrant’s Board of Directors.
ITEM 11. CONTROLS AND PROCUDURES
(a)
| The registrant’s principal executive officer and principal financial officer have concluded that the registrant’s disclosure controls and procedures (as defined in Rule 30a-3 (c) under the Investment Company Act of 1940, as amended) are effective as of a date within 90 days of the filing date of this report. |
| | |
(b)
| There have been no significant changes in the registrant’s internal controls or in other factors that could significantly affect these controls. |
ITEM 12. DISCLOSURE OF SECURITIES LENDING ACTIVITIES FOR CLOSED-END MANAGEMENT INVESTMENT COMPANIES
Not Applicable.
ITEM 13. EXHIBITS
(a)(1)
| The registrant’s code of ethics pursuant to Item 2 of Form N-CSR is filed as an exhibit to this form N-CSR. |
| | |
(a)(2)
| Certifications pursuant to Section 302 of the Sarbanes-Oxley Act of 2002 are attached. |
| | |
(b)
| Certifications pursuant to Section 906 of the Sarbanes-Oxley Act of 2002 are attached. |
SIGNATURES
Pursuant to the requirements of the Securities Exchange Act of 1934 and the Investment Company Act of 1940, the registrant has duly caused this report to be signed on its behalf by the undersigned, thereunto duly authorized.
SELECTED INTERNATIONAL FUND, INC.
By | /s/ Kenneth C. Eich |
| | Kenneth C. Eich |
| | Principal Executive Officer |
| |
Date: February 18, 2022 |
Pursuant to the requirements of the Securities Exchange Act of 1934 and the Investment Company Act of 1940, this report has been signed below by the following persons on behalf of the registrant and in the capacities and on the dates indicated.
By | /s/ Kenneth C. Eich |
| | Kenneth C. Eich |
| | Principal Executive Officer |
| |
Date: February 18, 2022 |
By | /s/ Douglas A. Haines |
| | Douglas A. Haines |
| | Principal Financial Officer and Principal Accounting Officer |
| |
Date: February 18, 2022 |