Table of Contents
UNITED STATES
SECURITIES AND EXCHANGE COMMISSION
Washington, D.C. 20549
SCHEDULE 14A
Proxy Statement Pursuant to Section 14(a) of the Securities
Exchange Act of 1934 (Amendment No. )
| Filed by the Registrant þ | |
| Filed by a Party other than the Registrant o | |
| Check the appropriate box: |
| þ Preliminary Proxy Statement | |
| o Confidential, for Use of the Commission Only (as permitted by Rule 14a-6(e)(2)) | |
| o Definitive Proxy Statement | |
| o Definitive Additional Materials | |
| o Soliciting Material Pursuant to §240.14a-12 |
IBT BANCORP, INC.
(Name of Registrant as Specified In Its Charter)
(Name of Person(s) Filing Proxy Statement, if other than the Registrant)
Payment of Filing Fee (Check the appropriate box):
| þ No fee required. | |
| o Fee computed on table below per Exchange Act Rules 14a-6(i)(4) and 0-11. |
| 1) Title of each class of securities to which transaction applies: |
| 2) Aggregate number of securities to which transaction applies: |
| 3) Per unit price or other underlying value of transaction computed pursuant to Exchange Act Rule 0-11 (set forth the amount on which the filing fee is calculated and state how it was determined): |
| 4) Proposed maximum aggregate value of transaction: |
| 5) Total fee paid: |
| o Fee paid previously with preliminary materials. |
| o Check box if any part of the fee is offset as provided by Exchange Act Rule 0-11(a)(2) and identify the filing for which the offsetting fee was paid previously. Identify the previous filing by registration statement number, or the Form or Schedule and the date of its filing. |
| 1) Amount Previously Paid: |
| 2) Form, Schedule or Registration Statement No.: |
| 3) Filing Party: |
| 4) Date Filed: |
| SEC 1913 (02-02) | Persons who are to respond to the collection of information contained in this form are not required to respond unless the form displays a currently valid OMB control number. |
TABLE OF CONTENTS
Table of Contents
IBT BANCORP, INC.
200 East Broadway
Mount Pleasant, Michigan 48858
200 East Broadway
Mount Pleasant, Michigan 48858
NOTICE OF THE ANNUAL MEETING OF SHAREHOLDERS
To Be Held May 13, 2008
To Be Held May 13, 2008
Notice is hereby given that the Annual Meeting of Shareholders of IBT Bancorp, Inc. will be held on Tuesday, May 13, 2008 at 5:00 p.m. Eastern Standard Time, at the Comfort Inn, 2424 S. Mission Street, Mount Pleasant, Michigan. The meeting is for the purpose of considering and acting upon the following:
1. The election of three directors.
2. Approval of an amendment to the Articles of Incorporation to increase the number of authorized shares of Common Stock from 10,000,000 to 15,000,000.
3. Approval of an amendment to the Articles of Incorporation to change the name of the Corporation from IBT Bancorp, Inc. to Isabella Bank Corporation.
4. Such other business as may properly come before the meeting, or any adjournment or adjournments thereof.
The Board of Directors has fixed April 1, 2008 as the record date for determination of shareholders entitled to notice of, and to vote at, the meeting or any adjournments thereof.
Your vote is important. Even if you plan to attend the meeting, please date and sign the enclosed proxy form, indicate your choice with respect to the matters to be voted upon, and return it promptly in the enclosed envelope. Note that if stock is held in more than one name, all parties should sign the proxy form.
By order of the Board of Directors

Debra Campbell, Secretary
Dated: April 25, 2008
Table of Contents
IBT BANCORP, INC.
200 East Broadway
Mount Pleasant, Michigan 48858
200 East Broadway
Mount Pleasant, Michigan 48858
PROXY STATEMENT
General Information
This Proxy Statement is furnished in connection with the solicitation of proxies by the Board of Directors of IBT Bancorp, Inc. (the Corporation) a Michigan financial holding company, to be voted at the Annual Meeting of Shareholders of the Corporation to be held on Tuesday, May 13, 2008 at 5:00 p.m. at the Comfort Inn, 2424 S. Mission Street, Mount Pleasant, Michigan, or at any adjournment or adjournments thereof, for the purposes set forth in the accompanying Notice of Annual Meeting of Shareholders and in this Proxy Statement.
This Proxy Statement has been mailed on April 25, 2008 to all holders of record of common stock as of the record date. If a shareholder’s shares are held in the name of a broker, bank or other nominee, then that party should give the shareholder instructions for voting the shareholder’s shares.
Voting at the Meeting
The Board of Directors of the Corporation has fixed the close of business on April 1, 2008 as the record date for the determination of shareholders entitled to notice of, and to vote at, the Annual Meeting of Shareholders and any adjournment thereof. The Corporation has only one class of common stock and no preferred stock. As of April 1, 2008, there were 7,522,718 shares of common stock of the Corporation outstanding. Each outstanding share entitles the holder thereof to one vote on each separate matter presented for vote at the meeting. Shareholders may vote on matters that are properly presented at the meeting by either attending the meeting and casting a vote or by signing and returning the enclosed proxy. If the enclosed proxy is executed and returned, it may be revoked at any time before it is exercised at the meeting. All shareholders are encouraged to date and sign the enclosed proxy, indicate their choice with respect to the matters to be voted upon, and return it to the Corporation.
The Corporation will hold the Annual Meeting of Shareholders if holders of a majority of the Corporation’s shares of common stock entitled to vote are represented in person or by proxy at the meeting. If a shareholder signs and returns the proxy, those shares will be counted to determine whether the Corporation has a quorum, even if the shareholder abstains or fails to vote on any of the proposals listed on the proxy.
If a shareholder’s shares are held in the name of a nominee, and the shareholder does not tell the nominee how to vote the shares (referred to as broker non-votes), then the nominee can vote them as they see fit only on matters that are determined to be routine and not on any other proposal. Broker non-votes will be counted as present to determine if a quorum exists but will not be counted as present and entitled to vote on any nonroutine proposals.
In the election of directors, director nominees receiving a plurality of votes cast at the meeting will be elected directors of the Corporation. Shares not voted, including broker non-votes, have no effect on the election of directors. In connection with the approval of the two proposals to amend the Corporation’s Articles of Incorporation, the affirmative vote of two-thirds of the outstanding shares of common stock is required to approve each amendment. In determining whether a proposal has received the requisite number of affirmative votes, abstentions and broker non-votes will have the same effect as a vote against the amendment.
Proposal # 1:
Election of Directors
Election of Directors
The Board of Directors is divided into three classes, with the directors in each class being elected for a term of three years. At the Annual Meeting of Shareholders, three directors will be elected for terms ending with the annual meeting of shareholders in 2011.
Except as otherwise specified in the proxy, proxies will be voted for election of the three nominees named below. If a nominee becomes unable or unwilling to serve, proxies will be voted for such other person, if any, as shall
Table of Contents
be designated by the Board of Directors. However, the Corporation’s management now knows of no reason to anticipate that this will occur. The three nominees for election as directors who receive the greatest number of votes cast will be elected directors. Each of the nominees has agreed to serve as a director if elected.
Nominees for election and current directors are listed below. Also shown for each nominee and each current director is his or her principal occupation for the last five or more years, age and length of service as a director of the Corporation.
David W. Hole and Ronald E. Schumacher retired as members of the Corporation’s Board of Directors on December 31, 2007. Effective January 1, 2008, Mr. Theodore W.(Ted) Kortes was appointed to the Board as part of the Greenville Financial Corporation Merger agreement which occurred effective January 1, 2008. Mr. Kortes will serve on the Board until the earlier of his attainment of age 70 or the date of the 2010 annual shareholders meeting of the Corporation.
The Board of Directors recommends that shareholders vote FOR the election of each of the three director nominees nominated by the Board of Directors.
Director Nominees for Terms Ending in 2011
Richard J. Barz (age 59) has been a director of the Corporation since 2002. He has been a director of Isabella Bank since 2000. Mr. Barz also serves on the Board of Financial Group Information Services and is a member of the Finance and Planning Committee. Mr. Barz has been President and CEO of Isabella Bank since December 30, 2001. Prior to his appointment as President and CEO he served as Executive Vice President of Isabella Bank. Mr. Barz was Chairman of the Central Michigan Community Hospital in 2007 and was the recipient of the 2007 Mount Pleasant Area Chamber of Commerce Citizen of the year award.
Sandra L. Caul (age 64) has been a director of the Corporation since 2005. She currently serves as director of Isabella Bank, and serves on the Audit Committee, and the Compensation and Human Resource Committee. Ms. Caul is Vice Chair of Central Michigan Community Hospital Board of Directors and is Chair of the Central Michigan American Red Cross. Ms. Caul retired in January 2005 as a state representative of the Michigan State House of Representatives. Ms. Caul is a registered nurse.
W. Michael McGuire (age 58) was appointed director of the Corporation on March 22, 2007, and serves on the Audit Committee, Finance and Planning Committee, and the Compensation and Human Resource Committee. He is a director of the Farwell division of Isabella Bank. Mr. McGuire is currently an attorney and Director of the Office of the Corporate Secretary and Assistant Secretary of The Dow Chemical Company, a manufacturer of chemicals, plastics and agricultural products.
Current Directors with Terms Ending in 2010
James C. Fabiano (age 64) has been a director of Isabella Bank since 1979 and of the Corporation since 1988, of which he is currently serving as Chairperson and is an ex-officio member of all committees. He also serves as an ex-officio member of the entire Corporation’s subsidiary Boards of Directors. Mr. Fabiano is Chairman of Fabiano Brothers, Inc., a wholesale distributor of beer, wine and certain specialty beverages. Mr. Fabiano is a past recipient of the Mount Pleasant Area Chamber of Commerce Citizen of the year award, he was also the past chairman of Central Michigan University board of trustees.
Dale D. Weburg(age 64) has served on the Board of the Corporation since 2000 and is a member of the Financial Group Information Services Board of Directors. He also serves on the Nominating and Corporate Governance Committee, Audit Committee, and the Compensation and Human Resource Committee. He has been a director of the Farmers division of Isabella Bank since 1987, of which he is currently serving as Chairperson. Mr. Weburg is President of Weburg Farms, a cash crop farm operation. Mr. Weburg also serves as a board of trustee for Gratiot Health System.
Theodore W. Kortes (age 67) was appointed director of the Corporation on January 1, 2008, and serves on the Finance and Planning Committee and the Compensation and Human Resource Committee. He is a director and
2
Table of Contents
Chairman of the Greenville division of Isabella Bank. Mr. Kortes was President and CEO of Greenville Community Bank and Greenville Community Financial Corporation since its founding in 1998, until his retirement in 2007.
Current Directors with Terms Ending in 2009
Dennis P. Angner (age 52) has been a director of the Corporation since 2000. He also serves as an ex-officio member of all of the Corporation’s subsidiary Boards of Directors, the Nominating and Corporate Governance Committee, and the Finance and Planning Committee. Mr. Angner has been President and CEO of the Corporation since December 30, 2001. Prior to his appointment as President and CEO, he served as Executive Vice President of the Corporation. Mr. Angner is the Chair of the Michigan Bankers Association and has served on the Central Michigan American Red Cross board for over 20 years.
David J. Maness (age 54) has been a director of the Corporation since 2004, and serves on the Audit Committee, the Compensation and Human Resource Committee, and is currently chairperson on the Finance and Planning Committee. He also serves on the Board of Directors of Isabella Bank and is chairperson of Financial Group Information Services. He is President of Maness Petroleum, a geological and geophysical consulting service. Mr. Maness served as a school board member of the Mount Pleasant School board.
W. Joseph Manifold (age 56) has been a director of the Corporation since 2003, and serves on the Nominating and Corporate Governance Committee, the Compensation and Human Resource Committee, and serves as chairperson of the Audit Committee. Mr. Manifold is a Certified Public Accountant and President of Federal Broach & Machine Company, a manufacturing company. In the past he was a senior auditor with Ernst & Young Certified Public Accounting firm working principally on external bank audits, and was CFO of the Delfield Corporation. Prior to joining IBT Bancorp Mr. Manifold also served on the Isabella Community Credit Union Board and was Chair of the Mount Pleasant School Board.
William J. Strickler (age 67) has been a director of the Corporation since 2002, and serves on the Nominating and Corporate Governance Committee, the Finance and Planning Committee, and the Compensation and Human Resource Committee. He has been a director of Isabella Bank since 1995 and is currently serving as Chairperson. Mr. Strickler is President of Michiwest Energy, an oil and gas producer. Prior to joining the Corporation and Bank Board he served as a director of the National City Community Bank Board.
Each of the directors has been engaged in their stated professions for more than five years. The principal occupation of Dennis P. Angner is with the Corporation, and he has been employed by Isabella Bankand/or the Corporation since 1984. Other executive officers of the Corporation include: Richard J. Barz, President of Isabella Bank, an employee of Isabella Bankand/or the Corporation since 1972; Timothy M. Miller (age 56), President of the Farmers division of Isabella Bank, an employee of Farmers State Bankand/or the Corporation since 1985; Peggy L. Wheeler (age 48), Senior Vice President and Controller of the Corporation, employed by Isabella Bankand/or the Corporation since 1977; Steven D. Pung (age 58), Senior Vice President of Isabella Bank, employed by Isabella Bankand/or the Corporation since 1978. All officers of the Corporation serve at the pleasure of the Board of Directors.
Proposal # 2: Amendment of
The Articles of Incorporation to Increase the Number of
Authorized Shares of Common Stock From 10,000,000 to 15,000,000
The Articles of Incorporation to Increase the Number of
Authorized Shares of Common Stock From 10,000,000 to 15,000,000
Introduction
The Corporation’s Articles of Incorporation provide that the authorized number of shares of common stock is 10,000,000 (“Common Stock”). As of April 1, 2008 there were 7,522,718 shares of Common Stock outstanding and 5,782 shares reserved for issuance under the Isabella Bank and Trust Employee Stock Ownership Plan (“ESOP”) and 33,068 shares reserved for issuance under the IBT Bancorp, Inc. Stockholder Dividend Reinvestment and Employee Stock Purchase Plan (“Dividend Reinvestment Plan”). There were 198,939 authorized but unissued shares under the Directors Nonqualified Deferred Compensation Director plan (“Directors’ Plan”).
3
Table of Contents
The Board of Directors on February 28, 2008, unanimously approved an amendment to the Corporation’s Articles of Incorporation to increase the number of authorized shares of Common Stock from 10,000,000 shares to 15,000,000 shares and unanimously recommends to the shareholders that they approve such amendment. The additional shares of Common Stock for which authorization is sought would be a part of the existing class of shares of Common Stock and, if and when issued, would have the same rights and privileges as the shares of Common Stock presently outstanding.
Purposes and Effects of Proposed Amendment
The Board of Directors considers it advisable to increase the authorized number of shares of Common Stock to 15,000,000. The additional authorized common shares will be available for any purpose for which shares of common stock may be issued under the Michigan Business Corporation Act. For example, this could include, among other things, possible issuance from time to time pursuant to the ESOP or other employee benefit plans, the Directors Nonqualified Deferred Compensation Plan, the Employee and director Stock Purchase program, the Dividend Reinvestment Plan, acquisitions, private placements, public offerings for cash and stock splits or stock dividends. The Corporation currently has no plans, arrangements, understandings or commitments for the issuance of the additional Common Stock. It is considered advisable, however, to have the authorization to issue such shares in order to enable the Corporation, as the need may arise, to move promptly to take advantage of market conditions and the availability of other opportunities without the delay and expense involved in calling a shareholders’ meeting for such purpose. The cost, prior notice requirements and delay involved in obtaining shareholder approval at the time that corporate action may become necessary, could eliminate the opportunity to effect the action or reduce the expected benefits.
There are no preemptive rights with respect to the authorization or issuance of the additional authorized Common Stock and those shares may be issued without further action by shareholders. Any issuance of Common Stock must be for proper business purposes and for proper consideration from the recipient. Issuance of additional Common Stock could, under some circumstances, dilute the voting rights, equity and earnings per share of existing common shareholders. Nevertheless, the Corporation anticipates that it would receive value for any additional Common Stock issued, thereby reducing or eliminating the economic effect of such dilution to shareholders.
Although the decision of the Board of Directors to propose an increase in the number of shares of Common Stock authorized for issuance did not result from any effort, known to the Corporation, by any person to accumulate Common Stock or to affect a change in control of the Corporation, one effect of an increase in authorized Common Stock may be to make more difficult certain types of attempts to obtain control of the Corporation not approved by the Board of Directors. However, the Board of Directors does not intend or view the proposed increase in authorized Common Stock as an anti-takeover measure and is not proposing the increase in response to any attempt or plan to obtain control of the Corporation.
Vote Required
The affirmative vote of two-thirds of the outstanding shares of Common Stock is required to approve the amendment. If the amendment is approved by the shareholders, the amendment will become effective upon the filing of a certificate of amendment with the Michigan Department of Labor and Economic Growth, which filing is expected to occur promptly after the Annual Meeting.
Your Board of Directors Recommends a VoteForthe Proposal to Amend the Corporation’s Articles of Incorporation to Increase the Number of Authorized Shares of Common Stock
4
Table of Contents
Proposal #3: Amendment of
The Articles of Incorporation to Change the Corporation’s
Name From IBT Bancorp, Inc. to Isabella Bank Corporation
The Articles of Incorporation to Change the Corporation’s
Name From IBT Bancorp, Inc. to Isabella Bank Corporation
Introduction
The Board of Directors on February 28, 2008 unanimously approved an amendment to the Corporation’s Articles of Incorporation to change the Corporation’s name from IBT Bancorp, Inc. to Isabella Bank Corporation and unanimously recommends to the shareholders that they approve such amendment.
Purposes and Effects of Proposed Amendment
The Board of Directors has determined that it is in the best interests of the Corporation to change its name to Isabella Bank Corporation. Over the past two years an ad-hoc committee of IBT Bancorp reviewed the branding of its subsidiary banks. The committee consisted of representation from each subsidiary and the Corporation. The committee assignment was to determine if its banking subsidiary should continue to operate with independent brands with unifying signage, lettering, and logo or as a branded house. The committee utilized the service of a professional marketing firm, conducted market surveys and reviewed other financial institutions branding models. After extensive discussion the committee unanimously recommended that IBT Bancorp and its subsidiaries operate under a single brand: Isabella Bank for the banking division and Isabella Bank Corporation for the Corporation, with both adopting a new logo. The Board of Directors of both IBT Bancorp and Isabella Bank and Trust voted to approve the committee’s recommendation at its November 2007 meeting.
The Board of Directors believes its rebranding will enhance our position in the market, provide enhanced customer access to our 24 hour banking locations, simplify the marketing of our products and services, and eliminate confusion with similarly named public companies.
The change of the Corporation’s name will not affect, in any way, the validity or transferability of currently outstanding stock certificates, nor will the Corporation’s shareholders be required to surrender or exchange any stock certificates that they currently hold as a result of the name change. If the Corporation’s name change is approved at the Annual Meeting, the Corporation expects to thereafter change its trading symbol on the OTC Pink Sheets Electronic Quotation Service. The Corporation’s new OTC Pink Sheets Electronic Quotation Service trading symbol will be determined at the time the name change becomes effective.
Vote Required
The affirmative vote of two thirds of the outstanding shares of Common Stock is required to approve the amendment. If the amendment is approved by the shareholders, the amendment will become effective upon the filing of a certificate of amendment with the Michigan Department of Labor and Economic Growth, which filing is expected to occur promptly after the Annual Meeting.
Your Board of Directors Recommends a VoteFor the Proposal to Amend the Corporation’s Articles of Incorporation to Change the Corporation’s Name from IBT Bancorp, Inc. to Isabella Bank Corporation
Corporate Governance
Director Independence
The Corporation has adopted the director independence standards as defined in NASDAQ Marketplace Rule 4200(a) (15). The Board has determined that James C. Fabiano, Dale D. Weburg, David J. Maness, W. Joseph Manifold, William J. Strickler, Sandra L. Caul, W. Michael McGuire, and Ted W. Kortes are independent directors. David W. Hole and Ronald E. Schumacher, who both retired as members of the Corporation’s Board of Directors on December 31, 2007 were also determined to be independent directors. Dennis P. Angner is not independent as he is
5
Table of Contents
employed as President and Chief Executive Officer of the Corporation. Richard J. Barz is not independent as he is employed as President and Chief Executive Officer of Isabella Bank.
Committees of the Board of Directors and Meeting Attendance
The Board of Directors of the Corporation met 14 times during 2007. All incumbent directors attended 75% or more of the meetings held in 2007. The Board of Directors has an Audit Committee, a Nominating and Corporate Governance Committee, a Compensation and Human Resource Committee, and a Finance and Planning Committee.
Audit Committee
The Audit Committee is composed of independent directors who meet the requirements for independence as defined in NASDAQ Marketplace Rule 4200(a) (15). Information regarding the functions performed by the Committee, its membership, and the number of meetings held during the year, is set forth in the “Report of the Audit Committee” included elsewhere in this annual proxy statement. The Audit Committee is governed by a written charter approved by the Board of Directors and is included as Appendix A to this proxy statement. In accordance with the provisions of the Sarbanes-Oxley Act of 2002, Director Manifold meets the requirements of Audit Committee Financial Expert and has been so designated by the Board of Directors. The committee also consists of directors Caul, Fabiano, Maness, McGuire and Weburg.
Nominating and Corporate Governance Committee
The Corporation has a standing Nominating and Corporate Governance Committee consisting of independent directors who meet the requirements for independence as defined in NASDAQ Marketplace Rule 4200(a) (15). The Committee consists of directors Manifold, Strickler and Weburg. The Nominating and Corporate Governance Committee held three meetings in 2007, and all directors attended 75% or more of the meetings in 2007. (The Board of Directors has approved a Nominating and Corporate Governance Committee Charter and it is included as Appendix B in this proxy statement.) The Nominating and Corporate Governance Committee is responsible for evaluating and recommending individuals for nomination to the Board of Directors for approval. In making its selections and recommendations, the Nominating and Corporate Governance Committee considers a variety of factors, which generally include the candidate’s personal and professional integrity, independence, business judgment, and communication skills.
The Nominating and Corporate Governance Committee will consider as potential nominees, persons recommended by shareholders. Recommendations should be submitted in writing to the Secretary of the Corporation, 200 East Broadway, Mount Pleasant, Michigan 48858 and include the shareholder’s name, address and number of shares of the Corporation owned by the shareholder. The recommendation should also include the name, age, address and qualifications of the recommended candidate for nomination. Recommendations for the 2009 Annual Meeting of Shareholders should be delivered no later than December 27, 2008. The Nominating and Corporate Governance Committee does not evaluate potential nominees for director differently based on whether they are recommended to the Nominating and Corporate Governance Committee by a shareholder.
Compensation and Human Resource Committee
The Compensation and Human Resource Committee of the Corporation is responsible for reviewing and recommending to the Corporation’s Board of Directors the compensation of the President and executive officers of the Corporation, benefit plans and the overall percentage increase in salaries. The committee consists of all independent directors, Fabiano, Caul, Kortes, McGuire, Maness, Manifold, Strickler, and Weburg. This committee is governed by a written charter approved by the Board of Directors that was attached as Appendix A to the Corporation’s proxy statement for the 2007 Annual Shareholder’s Meeting.
6
Table of Contents
Finance and Planning Committee
The Finance and Planning Committee evaluates new business opportunities and business acquisitions, assists management in establishing financial goals, reviews all strategic plans of subsidiaries to assure consistency with overall corporate goals, and reviews interest rate risks, credit risks and insurance coverage. The committee consists of directors Maness, Barz, Kortes, McGuire, and Strickler.
Communications with the Board
Shareholders may communicate with the Corporation’s Board of Directors by sending written communications to the Corporation’s Secretary, IBT Bancorp, Inc., 200 East Broadway, Mount Pleasant, Michigan 48858. Communications will be forwarded to the Board of Directors or the appropriate committee, as soon as practicable.
Code of Ethics
The Corporation has adopted a Code of Business Conduct and Ethics that is applicable to the Corporation’s principal executive officer, the principal financial officer and controller. The Corporation’s Code of Business Conduct and Ethics may be obtained free of charge by sending a request to Debra Campbell, Secretary, IBT Bancorp, Inc., 200 East Broadway, Mount Pleasant, Michigan 48858.
7
Table of Contents
Report of the Audit Committee
The Audit Committee oversees the Corporation’s financial reporting process on behalf of the Board of Directors. The Committee consists of directors Fabiano, Caul, Maness, Manifold, McGuire, and Weburg.
The Audit Committee is responsible for pre-approving all auditing services and permitted non-audit services over $5,000 for the Corporation by its independent auditors or any other auditing or accounting firm, except as noted below. The Audit Committee has established general guidelines for the permissible scope and nature of any permitted non-audit services in connection with its annual review of the audit plan and reviews the guidelines with the Board of Directors.
Management has the primary responsibility for the consolidated financial statements and the reporting process including the systems of internal controls. In fulfilling its oversight responsibilities, the Committee reviewed the audited consolidated financial statements in the Annual Report with management including a discussion of the quality, not just the acceptability, of the accounting principles, the reasonableness of significant judgments, and the clarity of disclosures in the consolidated financial statements. The Committee also reviewed with management and the independent auditors, management’s assertion on the design and effectiveness of the Corporation’s internal control over financial reporting as of December 31, 2007.
The Committee reviewed with the independent auditors, who are responsible for expressing an opinion on the conformity of those audited consolidated financial statements with accounting principles generally accepted in the United States of America, their judgments as to the quality, not just the acceptability, of the Corporation’s accounting principles and such other matters as are required to be discussed with the Committee by the standards of the Public Company Accounting Oversight Board (United States), including those described in SAS 61, as may be modified or supplemented. In addition, the Committee has received the written disclosures and the letter from the independent accountants required by Independence Standards Board Standard No. 1 as may be modified or supplemented, and has discussed with the independent accountant the independent accountant’s independence.
The Committee discussed with the Corporation’s internal and independent auditors the overall scope and plans for their respective audits. The Committee meets with the internal and independent auditors, with and without management present, to discuss the results of their examinations, their evaluations of the Corporation’s internal controls and the overall quality of the Corporation’s financial reporting process. The Committee held six meetings during 2007, and all directors attended 75% or more of the meetings held in 2007.
In reliance on the reviews and discussions referred to above, the Committee recommended to the Board of Directors (and the Board has approved) that the audited consolidated financial statements be included in the Annual Report onForm 10-K for the year ended December 31, 2007 for filing with the Securities and Exchange Commission. The Committee has appointed Rehmann Robson as the independent auditors for the 2008 audit.
Respectfully submitted,
W. Joseph Manifold, Audit Committee Chairperson
James C. Fabiano
David J. Maness
Sandra L. Caul
W. Michael McGuire
Dale D. Weburg
8
Table of Contents
Compensation Discussion and Analysis
The Compensation and Human Resource Committee (the “Committee”) is responsible for the compensation and benefits for the President and executive officers of the Corporation. The Committee evaluates and approves the executive officer and senior management compensation plans, policies and programs of the Corporation and its affiliates. The Committee also evaluates and establishes the compensation of the President and Chief Executive Officer of the Corporation. The President and Chief Executive Officer, Dennis P. Angner conducts annual performance reviews for all Named Executive Officers, excluding himself. Mr. Angner recommends an appropriate salary increase to the Committee based on the performance review and years of service along with competitive market data.
Compensation Objectives
The Committee considers asset growth and earnings per share to be the primary ratios in measuring financial performance. The Corporation’s philosophy is to maximize long-term return to shareholders consistent with safe and sound banking practices while maintaining our commitment to superior customer and community service. We believe that the performance of our executive officers in managing our business should be the basis for determining overall compensation. Consideration is also given to overall economic conditions and current competitive forces in the market place. The objectives of the Committee are to effectively balance salaries with potential compensation to an officer’s individual management responsibilities and to realize their potential for future contribution to the Corporation. We strive to attract and retain high performing executive officers who will lead the Corporation while attaining the Corporation’s earnings and performance goals.
What the Compensation Programs are Designed to Reward
The compensation programs are designed to reward dedicated and conscientious employment with the Corporation, loyalty in terms of continued employment, attainment of job related goals and overall profitability of the Corporation. In measuring an executive officer’s contributions to the Corporation, the Committee considers numerous factors including, among other things, the Corporation’s growth in terms of asset size, and increase in earnings per share. In rewarding loyalty and long-term service, the Corporation provides attractive retirement benefits.
Elements of Compensation
The Corporation’s executive compensation program has consisted primarily of base salary and benefits, annual cash bonus incentives, stock awards, and participation in the Corporation’s retirement plans.
Why Each of the Elements of Compensation is Chosen
Base Salary and Benefitsare set to provide competitive levels of compensation to attract and retain officers with strong motivated leadership. Each officer’s performance, current compensation and responsibilities within the Corporation are considered by the Committee when establishing base salaries. The Corporation also believes it is best to pay sufficient base salary because it believes an over-reliance on equity incentive compensation could potentially skew incentives toward short-term maximization of shareholder value as opposed to building long-term shareholder value. Base salary encourages management to operate the Corporation in a safe and sound manner even when incentive goals may prove unattainable.
Annual Cash Bonus Incentivesare used to reward executive officers for the Corporation’s overall financial performance. This element of the Corporation’s compensation programs is included in the overall compensation in order to reward employees above and beyond their base salaries when the Corporation’s performance and profitability exceed established annual targets. The inclusion of incentive compensation encourages management to be more creative, diligent and exhaustive in managing the Corporation to achieve specified financial goals.
Stock Awardsare also provided as stock awards are the element of compensation that is most effective in aligning the financial interests of management with those of shareholders and because stock awards are a traditional and well-proven element of compensation among community banks and bank holding companies. These stock
9
Table of Contents
awards take the form of director fees that eligible executive officers elect to defer under the Directors Nonqualified Deferred Compensation Plan (“Directors’ Plan”). These deferred fees are converted on a quarterly basis into stock units of the Corporations’ common stock. The directors of the Corporation and its subsidiaries are required to defer at least 25% of their earned board fees into the Director’s Plan.
Retirement Plans. The Corporation’s retirement plans are designed to assist executives in providing themselves with a financially secure retirement. Our retirement plans include: a frozen defined benefit pension plan, a 401(k) plan, and a non-leveraged employee stock ownership plan (ESOP), and a retirement bonus plan.
How the Corporation Chose Amounts for Each Element
The Committee’s approach to determining the annual base salary of executive officers is to offer competitive salaries in comparison with other comparable financial institutions. The Committee utilizes regional compensation surveys which provide salary ranges for financial institutions and periodically collects information from other bank holding companies within its peer group for comparison. Specific factors used to decide where an executive officer salary should be within the established range include the historical financial performance, financial performance outlook, years of service, and job performance.
The annual cash bonus incentive is based on goals set on individual performance and recognition of individual performance. A subjective analysis is conducted by the Chief Executive Officer. The Chief Executive Officer makes a recommendation to the Committee for the appropriate amount for each individual executive officer. The Committee reviews, modifies and approves the recommendations of the Chief Executive Officer. The Committee reviews the performance of the Chief Executive Officer. The Committee uses the following factors as quantitative measures of corporate performance in determining annual cash bonus amounts to be paid.
| • | peer group financial performance compensation; | |
| • | 1 and 5 year shareholder returns; | |
| • | earnings per share and earnings per share growth; | |
| • | budgeted as compared to actual annual operating performance; | |
| • | community and industry involvement; | |
| • | results of audit and regulatory exams; and | |
| • | other strategic goals as established by the board of directors |
While no particular weight is given to any specific factor, the Committee gives at least equal weight to the subjective analyses as described above.
Stock awards take the form of deferred director fees which are converted on a quarterly basis into stock units of the Corporation’s common stock under the Directors’ Plan. The deferred fees are converted on a quarterly basis into stock units based on the purchase price for a share of common stock under the Corporation’s Dividend Reinvestment Plan. Stock units credited to a participant’s account under the Directors’ Plan are eligible for stock and cash dividends as declared.
Retirement plans. The Corporation has a frozen defined benefit pension plan covering substantially all of its employees. The benefits were based on years of service and the employee’s five highest consecutive years of compensation out of the last ten years of service. The funding policy is to contribute annually the maximum amount that can be deducted for federal income tax purposes. Contributions are intended to provide not only for benefits attributed to services to date but also for those expected to be earned in the future.
In December 2006, the Board of Directors voted to curtail the defined benefit plan effective March 1, 2007. The effect of the curtailment was recognized in the first quarter of 2007, the current participant’s accrued benefits were frozen as of March 1, 2007. The participation in the plan was limited to eligible employees as of December 31, 2006.
The Corporation has a 401(k) plan in which substantially all employees are eligible to participate. Employees may contribute up to 100% of their compensation subject to certain limits based on federal tax laws. As a result of
10
Table of Contents
the curtailment of the defined benefit plan noted above, the Corporation decided to increase the contributions to the Corporation’s 401(k) plan effective January 1, 2007. The enhancement includes an automatic 3.0% contribution for all eligible employees and matching contributions equal to 50% of the first 4.0% of an employee’s compensation contributed to the Plan during the year. Employees are 0% vested through their first three years of employment and are 100% vested after 6 years of service.
The Corporation maintains a non-leveraged employee stock ownership plan (ESOP) which covers substantially all of its employees. Contributions to the plan is discretionary and approved by the Board of Directors.
The Corporation maintains a plan for officers to provide death benefits to each participant. Insurance policies, designed primarily to fund death benefits, have been purchased on the life of each participant with the Corporation as the sole owner and beneficiary of the policies.
The retirement bonus plan is a nonqualified plan of deferred compensation benefits for eligible employees effective January 1, 2007. An initial amount has been credited for each eligible employee as of January 1, 2007. Subsequent amounts shall be credited on each allocation date thereafter as defined in the plan. The amount of the initial allocation and the annual allocation shall be determined pursuant the payment schedule adopted by the sole and exclusive discretion of the Board of Directors, as set forth in the plan.
How Elements Fit into Overall Compensation Objectives
The elements of the Corporation’s compensation are structured to reward past and current performance, continued service and motivate its leaders to excel in the future. The Corporation’s salary compensation has generally been used to retain and attract motivated leadership. The Corporation intends to continually ensure its salaries are sufficient to attract and retain exceptional officers. The Corporation’s cash bonus incentive rewards current performance based upon personal and corporate, goals and targets. The Corporation makes stock awards to motivate its officers to enhance value for its shareholders by aligning the interests of management with those of its shareholders.
As part of its goal of attracting and retaining quality team members, the Corporation has developed employee benefit plans that make it stand out from the rest of the competition. Management feels that the combination of all of the plans listed above makes the Corporation’s total compensation packages attractive.
Compensation and Human Resource Committee Report
The following Report of the Compensation and Human Resource Committee does not constitute soliciting material and should not be deemed filed or incorporated by reference into any other Corporation filing under the Securities Act of 1933 or the Securities Exchange Act of 1934, expect to the extent the Corporation specifically incorporates this Report by reference therein.
The Compensation and Human Resource Committee, which includes the independent directors of the board, has reviewed and discussed the Compensation Discussion and Analysis required by Item 402(b) of SECRegulation S-K with management, and based on such review and discussion, the Compensation and Human Resource Committee recommended to the Board of Directors that the Compensation Discussion and Analysis be included in this Proxy Statement and Annual Report onForm 10-K.
Submitted by the Compensation and Human Resource Committee of IBT Bancorp’s Board of Directors:
James C. Fabiano, Chairperson
Sandra L. Caul
Ted W. Kortes
David J. Maness
W. Joseph Manifold
W. Michael McGuire
William J. Strickler
Dale D. Weburg
11
Table of Contents
Executive Officers
Executive Officers of the Corporation are compensated in accordance with their employment with the applicable entity. The following table shows information on compensation earned from the Corporation or its subsidiaries during the year ended December 31, 2007, by the President and Chief Executive Officer, the Principal Financial Officer, and the corporation’s three most highly compensated executive officers.
Summary Compensation Table
| Change in Pension | ||||||||||||||||||||||||||||
| Value and | ||||||||||||||||||||||||||||
| Non-Qualified | ||||||||||||||||||||||||||||
| Deferred | ||||||||||||||||||||||||||||
| Compensation | All Other | |||||||||||||||||||||||||||
| Salary | Bonus | Stock Awards | Earnings | Compensation | Total | |||||||||||||||||||||||
Name and Principal Position | Year | ($)(1) | ($)(1) | ($) | ($)(2) | ($)(3) | ($) | |||||||||||||||||||||
| Dennis P. Angner | 2007 | $ | 288,101 | $ | 8,225 | $ | 26,280 | $ | (7,000 | ) | $ | 18,715 | $ | 334,321 | ||||||||||||||
| President and CEO of IBT Bancorp, Inc. | 2006 | 255,237 | 10,000 | 16,228 | 70,646 | 8,233 | 360,344 | |||||||||||||||||||||
| Peggy L. Wheeler | 2007 | 100,000 | 3,000 | — | (3,000 | ) | 2,023 | 102,023 | ||||||||||||||||||||
| Principal Financial Officer, Sr. Vice President and Controller of IBT Bancorp, Inc. | 2006 | 88,500 | — | — | 14,339 | 685 | 103,524 | |||||||||||||||||||||
| Richard J. Barz | 2007 | 274,706 | 7,875 | 18,125 | — | 23,226 | 323,932 | |||||||||||||||||||||
| Executive Vice President of IBT Bancorp, Inc. and President & CEO of Isabella Bank | 2006 | 237,175 | 14,400 | 15,100 | 134,235 | 10,948 | 411,858 | |||||||||||||||||||||
| Timothy M. Miller | 2007 | 155,171 | — | 7,880 | (1,000 | ) | 14,167 | 176,218 | ||||||||||||||||||||
| Vice President of IBT Bancorp, Inc. and President of the Farmers State Bank division of Isabella Bank | 2006 | 149,117 | 3,567 | 7,223 | 17,030 | 5,778 | 182,715 | |||||||||||||||||||||
| Steven D. Pung(4) | 2007 | 108,100 | 3,625 | 1,800 | — | 14,194 | 127,719 | |||||||||||||||||||||
| Sr. Vice President of Isabella Bank | ||||||||||||||||||||||||||||
| (1) | Includes compensation voluntarily deferred under the Corporation’s 401(k). Directors fees paid in cash are also included, for calendar years 2007 and 2006 respectively as follows: Dennis P. Angner $23,870 and $20,237; Richard J. Barz $20,475 and $12,175; and Timothy M. Miller $20,940 and $18,117. | |
| (2) | For 2006 approximately 75% of the change in the present value of the defined benefit is related to prior service, a decrease in the assumed discount rate, and a change in the actuarial mortality table. Amounts were determined using assumptions consistent with those used in the Corporation’s financial statements. The Board of Directors approved a curtailment of this plan in December 2006 effective March 1, 2007. Assumptions were consistent to those that were presented in the consolidated financial statements. | |
| (3) | For all noted executives all other Compensation includes 401(k) matching contributions. For Richard J. Barz and Steven D. Pung this also includes club dues and auto allowance. For Dennis P. Angner and Timothy M. Miller, this also includes auto allowance. | |
| (4) | Not a named executive officer prior to 2007. |
12
Table of Contents
2007 Pension Benefits
The following table indicates the present value of accumulated benefits as of December 31, 2007 for each named executive in the summary compensation table.
| Number of | ||||||||||||||
| Years of | Present | |||||||||||||
| Credited | Value of | |||||||||||||
| Service as | Accumulated | Payments | ||||||||||||
| of 01/01/08 | Benefit | During Last | ||||||||||||
Name | Plan name | (#) | ($) | Fiscal Year | ||||||||||
| Dennis P. Angner | IBT Bancorp Pension Plan | 23 | $ | 242,000 | $ | — | ||||||||
| IBT Bancorp Retirement Bonus Plan | 23 | 132,979 | ||||||||||||
| Peggy L. Wheeler | IBT Bancorp Pension Plan | 30 | 66,000 | — | ||||||||||
| IBT Bancorp Retirement Bonus Plan | 30 | 35,981 | ||||||||||||
| Richard J. Barz | IBT Bancorp Pension Plan | 35 | 531,000 | — | ||||||||||
| IBT Bancorp Retirement Bonus Plan | 35 | 168,591 | ||||||||||||
| Timothy M. Miller | IBT Bancorp Pension Plan | 8 | 53,000 | — | ||||||||||
| Steven D. Pung | IBT Bancorp Pension Plan | 28 | 265,000 | |||||||||||
| IBT Bancorp Retirement Bonus Plan | 28 | 87,197 | — | |||||||||||
Defined benefit pension plan. The Corporation sponsors a frozen defined benefit pension plan. In December 2006, the Board of Directors voted to curtail the defined benefit plan effective March 1, 2007. The effect of the curtailment, which was recognized in the first quarter of 2007, froze the current participant’s accrued benefits as of March 1, 2007 and limited participation in the plan to eligible employees as of December 31, 2006.
Annual contributions are made to the plan as required by accepted actuarial principles, applicable federal tax law, and expenses of operating and maintaining the plan. The amount of contributions on behalf of any one participant cannot be separately or individually computed.
Pension plan benefits are based on years of service and the employees’ five highest consecutive years of compensation out of the last ten years of service, effective through December 31, 2006.
A participant may earn a benefit for up to 35 years of accredited service. Earned benefits are 100 percent vested after five years of service. Benefit payments normally start when a participant reaches age 65. A participant with more than five years of service may elect to take early retirement benefits anytime after reaching age 55. Benefits payable under early retirement are reduced actuarially for each month prior to age 65 in which benefits begin.
Richard J. Barz, Timothy M. Miller, and Steven D. Pung are eligible for early retirement under the IBT Bancorp Pension Plan. Under the provisions of the Plan, participants are eligible for early retirement after reaching the age of 55 with at least 5 years of service. The early retirement benefit amount is the accrued benefit payable at normal retirement date reduced by5/9% for each of the first 60 months and5/18% for each of the next 60 months that the benefit commencement date precedes the normal retirement date.
Retirement bonus plan. The retirement bonus plan is a nonqualified plan of deferred compensation benefits for eligible employees effective January 1, 2007. This plan is intended to provide eligible employees with additional retirement benefits. To be eligible the employee needed to be employed by the Corporation on January 1, 2007, and be a participant in the Corporation’s frozen Executive Supplemental Income Agreement. They also must be an officer of the Corporation with at least 10 years of service as of December 31, 2006. The Corporation has sole and exclusive discretion to add new participants to the plan by authorizing such participation pursuant to action of the Corporation’s Board of Directors.
An initial amount has been credited for each eligible employee as of January 1, 2007. Subsequent amounts shall be credited on each allocation date thereafter as defined in the plan. The amount of the initial allocation and the annual allocation shall be determined pursuant the payment schedule adopted by the sole and exclusive discretion of the Board of Directors, as set forth in the plan.
13
Table of Contents
Richard J. Barz, Timothy M. Miller, and Steven D. Pung are eligible for early retirement under the IBT Bancorp Retirement Bonus Plan. Under the provisions of the Plan, participants are eligible for early retirement upon attaining 55 years of age. There is no difference between the calculation of benefits payable upon early retirement and normal retirement.
2007 Nonqualified Deferred Compensation
| Executive | Aggregate | Aggregate | ||||||||||
| Contributions in | Earnings in | Balance at | ||||||||||
| Last FY | Last FY | Last FYE | ||||||||||
Name | ($) | ($) | ($) | |||||||||
| Dennis P. Angner | $ | 26,280 | $ | 728 | $ | 43,236 | ||||||
| Peggy L. Wheeler | — | — | — | |||||||||
| Richard J. Barz | 18,125 | 604 | 33,829 | |||||||||
| Timothy M. Miller | 7,880 | 295 | 15,398 | |||||||||
| Steven D. Pung | 1,800 | 94 | 4,819 | |||||||||
The directors of the Corporation and its subsidiaries are required to defer at least 25% of their earned board fees into the Directors’ Plan. These amounts are reflected in the 2007 nonqualified deferred compensation table above. These deferred fees are converted on a quarterly basis into stock units of the Corporation’s common stock under the Directors’ Plan. The deferred fees are converted to stock units based on the purchase price for a share of common stock under the Corporation’s Dividend Reinvestment Plan. Stock units credited to a participant’s account are eligible for stock and cash dividends as declared.
Distribution from the Directors’ Plan occurs when the participant terminates service with the Corporationand/or attains age 65. Distributions must take the form of shares of Corporation common stock equal to the number of stock units credited to the participant’s account. Any Corporation common stock issued under the Directors’ Plan will be considered restricted stock under the Securities Act of 1933, as amended.
Potential Payments Upon Termination or Change in Control
The estimated pay outs payable to each named executive officer upon severance from employment, retirement, termination upon death or disability or termination following a change in control of the Corporation are described below. For all termination scenarios, the figures assume such termination took place as of December 31, 2007.
Any Severance of Employment
Regardless of the manner in which a named executive officer’s employment terminates, he or she is entitled to receive amounts earned during his or her term of employment. Such amounts include:
| • | Amounts accrued and vested through the Defined benefit pension plan. | |
| • | Amounts accrued and vested through the Retirement Bonus plan. | |
| • | Amounts deferred in the Directors’ Plan. | |
| • | Unused vacation pay. |
Retirement
In the event of the retirement of an executive officer the officer would receive the items identified above. As of December 31, 2007, the named executive officers listed had no unused vacation days.
Death or Disability
In the event of death or disability of an executive officer, in addition to the benefits listed above, the executive officer will also receive payments under the Corporation’s life insurance plan or benefits under the Corporation’s disability plan as appropriate.
14
Table of Contents
In addition to potential payments upon termination available to all employees, the estates for the executive officers listed below would receive the following payments upon death:
| Bank Owned | ||||
| Life | ||||
| Insurance | ||||
Name | Policies | |||
| Dennis P. Angner | $ | 792,000 | ||
| Peggy L. Wheeler | 300,000 | |||
| Richard J. Barz | 762,000 | |||
| Timothy M. Miller | 402,000 | |||
| Steven D. Pung | 324,000 | |||
Change in Control
The Corporation currently does not have a change in control agreement with any of the executive officers, provided however pursuant to the Retirement Bonus Plan each participant would become 100% vested in their benefit under the plan if, following a change in control, they voluntarily terminate employment or are terminated without just cause.
Director Compensation
The following table summarizes the Compensation of each non-employee director who served on the Board of Directors during 2007.
| Change in | ||||||||||||||||
| Pension Value | ||||||||||||||||
| and Non- | ||||||||||||||||
| Fees | Qualified | |||||||||||||||
| Earned or | Deferred | |||||||||||||||
| Paid in | Stock | Compensation | ||||||||||||||
| Cash | Awards | Earnings | Total | |||||||||||||
Name | ($) | ($) | ($) | ($) | ||||||||||||
| Sandra Caul | $ | — | $ | 38,075 | $ | 7,011 | $ | 45,086 | ||||||||
| James Fabiano | — | 49,925 | 20,308 | 70,233 | ||||||||||||
| David Maness | — | 42,700 | 2,812 | 45,512 | ||||||||||||
| W. Joseph Manifold | — | 27,425 | 1,904 | 29,329 | ||||||||||||
| W. Michael McGuire | — | 23,125 | 1,027 | 24,152 | ||||||||||||
| William Strickler | — | 36,000 | 8,650 | 44,650 | ||||||||||||
| Dale Weburg | — | 35,145 | 4,322 | 39,467 | ||||||||||||
The Corporation paid a $4,000 retainer and $950 per board meeting to its directors during 2007 and $225 per committee meeting attended.
The Corporation sponsors a nonqualified deferred compensation plan for directors (the Directors’ Plan). Under the Directors’ Plan, deferred directors’ fees are converted on a quarterly basis into stock units of the Corporation’s common stock. The fees are converted based on the purchase price for a share of the Corporation’s common stock under the Corporation’s Dividend Reinvestment Plan. Pursuant to the terms of the Directors’ Plan, directors of the Corporation and its subsidiaries are required to defer at least 25% of their earned board fees. The amount deferred under the terms of the Directors’ Plan in 2007 was $468,748, resulting in 18,085 stock units being credited to participants’ accounts. As of December 31, 2007, there were 198,939 stock units credited to participants’ accounts, as adjusted for the 10% stock dividend paid on February 29, 2008. Stock units credited to a participant’s account are eligible for cash and stock dividends as payable. All amounts deferred are unsecured claims against the Corporation’s general assets. The plan does not allow for cash settlement. The net cost of this benefit to the Corporation was $120,789 in 2007.
Distribution from the Directors’ Plan occurs when the participant terminates service with the Corporationand/or attains age 65. Distributions must take the form of shares of Corporation common stock equal to the number of stock units credited to the participant’s account. Any Corporation common stock issued under the Directors’ Plan will be considered restricted stock under the Securities Act of 1933, as amended.
15
Table of Contents
Compensation and Human Resource Committee Interlocks and Insider Participation
The Compensation and Human Resource Committee of the Corporation is responsible for reviewing and recommending to the Corporation’s Board of Directors the compensation of the President and executive officers of the Corporation, benefit plans and the overall percentage increase in salaries. The committee consists of directors Fabiano, Caul, Kortes, McGuire, Maness, Manifold, Strickler, and Weburg.
Certain Relationships and Related Transactions with Management
Certain directors and officers of the Corporation and members of their families were loan customers of Isabella Bank, or have been directors or officers of corporations, or partners of partnerships which have had transactions with the subsidiary Bank. In management’s opinion, all such transactions are made in the ordinary course of business and are substantially on the same terms, including collateral and interest rates, as those prevailing at the same time for comparable transactions with customers not related to the Bank. These transactions do not involve more than normal risk of collectability or present other unfavorable features. Total loans to these customers were approximately $10,461,000 as of December 31, 2007. The Corporation addresses transactions with related parties in its’Code of Business Conduct and Ethics’policy. Conflicts of interest are prohibited as a matter of Corporation policy, except under guidelines approved by the Board of Directors or committees of the Board.
Security Ownership of Certain Beneficial Owners and Management
As of April 1, 2008 the Corporation does not have any person who is known to the Corporation to be the beneficial owner of more than 5% of the common stock of the Corporation.
The following table sets forth certain information as of April 1, 2008 as to the common stock of the Corporation owned beneficially by each director and director nominee, by each named executive officer, and by all directors, director nominees and executive officers of the Corporation as a group.
| Amount and Nature of Beneficial Ownership | ||||||||||||||||
| Sole Voting | Shared Voting | Total | Percentage of | |||||||||||||
| and Investment | and Investment | Beneficial | Common Stock | |||||||||||||
Name of Owner | Powers | Powers | Ownership | Outstanding | ||||||||||||
| Dennis P. Angner* | 16,485 | — | 16,485 | 0.22 | % | |||||||||||
| Richard J Barz* | 18,732 | — | 18,732 | 0.25 | % | |||||||||||
| Sandra L. Caul | — | 10,000 | 10,000 | 0.13 | % | |||||||||||
| James C. Fabiano | 251,997 | 5,916 | 257,913 | 3.43 | % | |||||||||||
| Theodore W. Kortes | — | 16,626 | 16,626 | 0.22 | % | |||||||||||
| W. Joseph Manifold | 530 | — | 530 | 0.01 | % | |||||||||||
| W. Michael McGuire | 6,032 | — | 6,032 | 0.08 | % | |||||||||||
| David J. Maness | 419 | 929 | 1,348 | 0.02 | % | |||||||||||
| William J. Strickler | 73,283 | 12,722 | 86,005 | 1.14 | % | |||||||||||
| Dale D. Weburg | 25,842 | 30,267 | 56,109 | 0.75 | % | |||||||||||
| Timothy M. Miller | 52 | 3,441 | 3,493 | 0.05 | % | |||||||||||
| Steven D. Pung | 8,763 | 6,705 | 15,468 | 0.21 | % | |||||||||||
| Peggy L. Wheeler | 3,937 | 2,330 | 6,267 | 0.08 | % | |||||||||||
| All Directors, nominees and Executive Officers as a Group (13 persons) | 406,072 | 88,936 | 495,008 | 6.59 | % | |||||||||||
| * | Trustees of the ESOP who vote ESOP stock. |
Independent Registered Public Accounting Firm
The Audit Committee has appointed Rehmann Robson as the independent auditors of the Corporation for the year ending December 31, 2008.
16
Table of Contents
A representative of Rehmann Robson is expected to be present at the Annual Meeting of Shareholders to respond to appropriate questions from shareholders and to make any comments they believe appropriate.
Fees for Professional Services Provided by Rehmann Robson P.C.
The following table shows the aggregate fees billed by Rehmann Robson for the audit and other services provided to the Corporation for 2007 and 2006.
| 2007 | 2006 | |||||||
| Audit Fee | $ | 371,860 | $ | 464,172 | ||||
| Audit Related Fees | 31,365 | 18,785 | ||||||
| Tax Fees | 28,750 | 31,085 | ||||||
| Other Professional Services Fees | 16,450 | 33,292 | ||||||
| Total | $ | 448,425 | $ | 547,334 | ||||
The audit fees were for performing the audit of the Corporation’s consolidated annual financial statements, audit of internal controls over financial reporting, review of interim quarterly financial statements included in the Corporation’sForms 10-Q, and services that are normally provided by Rehmann Robson in connection with statutory and regulatory filings or engagements.
The audit related fees for 2007 were for regulatory filings related to the acquisition of Greenville Financial Corporation and for discussions related to the adoption and interpretation of new Accounting pronouncements.
The audit related fees for 2006 were for regulatory filings related to the acquisition of Farwell State Savings Bank and for discussion of technical accounting issues.
The tax fees were for the preparation of the Corporation and its subsidiaries’ state and federal tax returns and for consultation with the Corporation on various tax matters.
Other professional service fees for 2006 were for Federal Home Loan Bank required procedures and out of pocket costs.
The Audit Committee has considered whether the services provided by Rehmann Robson other than the audit fees, are compatible with maintaining Rehmann Robson independence and believes that the other services provided are compatible.
Pre-approval Policies and Procedures
All audit and non-audit services to be performed by Rehmann Robson must be approved in advance by the Audit Committee. As permitted by the SEC’s rules, the Audit Committee has authorized its Chairperson to pre-approve audit, audit-related, tax and non-audit services, provided that such approved service is reported to the full Audit Committee at its next meeting.
As early as practicable in each calendar year, the independent auditor provides to the Audit Committee a schedule of the audit and other services that the independent auditor expects to provide or may provide during the next twelve months. The schedule will be specific as to the nature of the proposed services, the proposed fees, and other details that the Audit Committee may request. The Audit Committee will by resolution authorize or decline the proposed services. Upon approval, this schedule will serve as the budget for fees by specific activity or service for the next twelve months.
A schedule of additional services proposed to be provided by the independent auditor, or proposed revisions to services already approved, along with associated proposed fees, may be presented to the Audit Committee for their consideration and approval at any time. The schedule will be specific as to the nature of the proposed service, the proposed fee, and other details that the Audit Committee may request. The Audit Committee will by resolution authorize or decline authorization for each proposed new service.
Applicable SEC rules and regulations permit waiver of the pre-approval requirements for services other than audit, review or attest services if certain conditions are met. Out of the services characterized above as Audit-
17
Table of Contents
Related, Tax and Professional Services, none were billed pursuant to these provisions in 2007 and 2006 without pre-approval.
Shareholder Proposals
Any proposals which shareholders of the Corporation intend to present at the next annual meeting of the Corporation must be received before December 27, 2008 to be considered for inclusion in the Corporation’s proxy statement and proxy for that meeting. Proposals should be made in accordance with Securities and Exchange CommissionRule 14a-8.
Directors’ Attendance at the Annual Meeting of Shareholders
The Corporation’s directors are encouraged to attend the annual meeting of shareholders. At the 2007 annual meeting, all directors were in attendance, with the exception of Mr. McGuire.
Section 16(a) Beneficial Ownership Reporting Compliance
Section 16(a) of the Securities Exchange Act of 1934 requires the Corporation’s directors and certain officers and persons who own more than ten percent of the Corporation’s common stock, to file with the SEC initial reports of ownership and reports of changes in ownership of the Corporation’s common stock. These officers, directors, and greater than ten percent shareholders are required by SEC regulation to furnish the Corporation with copies of these reports.
To the Corporation’s knowledge, based solely on review of the copies of such reports furnished to the Corporation, during the year ended December 31, 2007 all Section 16(a) filing requirements were satisfied, with respect to the applicable officers, directors, and greater than 10 percent beneficial owners.
Other Matters
The cost of soliciting proxies will be borne by the Corporation. In addition to solicitation by mail, officers and other employees of the Corporation may solicit proxies by telephone or in person, without compensation other than their regular compensation.
As to Other Business Which May Come Before the Meeting
Management of the Corporation does not intend to bring any other business before the meeting for action. However, if any other business should be presented for action, it is the intention of the persons named in the enclosed form of proxy to vote in accordance with their judgment on such business.
By order of the Board of Directors
Debra Campbell, Secretary
18
Table of Contents
IBT Bancorp, Inc.
Financial Information Index
19
Table of Contents
SUMMARY OF SELECTED FINANCIAL DATA
| 2007 | 2006 | 2005 | 2004 | 2003 | ||||||||||||||||
| (Dollars in thousands except per share data) | ||||||||||||||||||||
| INCOME STATEMENT DATA | ||||||||||||||||||||
| Total interest income | $ | 53,972 | $ | 44,709 | $ | 36,882 | $ | 33,821 | $ | 35,978 | ||||||||||
| Net interest income | 28,013 | 24,977 | 23,909 | 23,364 | 23,528 | |||||||||||||||
| Provision for loan losses | 1,211 | 682 | 777 | 735 | 1,455 | |||||||||||||||
| Net income | 7,930 | 7,001 | 6,776 | 6,645 | 7,205 | |||||||||||||||
| BALANCE SHEET DATA | ||||||||||||||||||||
| End of year assets | $ | 957,282 | $ | 910,127 | $ | 741,654 | $ | 678,034 | $ | 664,079 | ||||||||||
| Daily average assets | 925,631 | 800,174 | 700,624 | 675,157 | 659,323 | |||||||||||||||
| Daily average deposits | 727,762 | 639,046 | 576,091 | 567,145 | 563,600 | |||||||||||||||
| Daily average loans/net | 596,739 | 515,539 | 459,310 | 430,854 | 399,008 | |||||||||||||||
| Daily average equity | 119,246 | 91,964 | 74,682 | 70,787 | 65,770 | |||||||||||||||
| PER SHARE DATA(1) | ||||||||||||||||||||
| Earnings per share | ||||||||||||||||||||
| Basic | $ | 1.14 | $ | 1.12 | $ | 1.14 | $ | 1.13 | $ | 1.24 | ||||||||||
| Diluted | 1.11 | 1.08 | 1.14 | 1.13 | 1.24 | |||||||||||||||
| Cash dividends | 0.62 | 0.58 | 0.55 | 0.52 | 0.50 | |||||||||||||||
| Book value (at year end) | 17.58 | 16.61 | 13.44 | 12.25 | 11.76 | |||||||||||||||
| FINANCIAL RATIOS | ||||||||||||||||||||
| Shareholders’ equity to assets (at year end) | 12.86 | % | 12.72 | % | 10.91 | % | 10.71 | % | 10.38 | % | ||||||||||
| Return on average equity | 6.65 | 7.61 | 9.07 | 9.39 | 10.95 | |||||||||||||||
| Return on average tangible equity | 8.54 | % | 8.31 | % | 9.12 | % | 10.01 | % | 11.99 | % | ||||||||||
| Cash dividend payout to net income | 54.27 | 53.89 | 48.02 | 46.20 | 39.99 | |||||||||||||||
| Return on average assets | 0.86 | 0.87 | 0.97 | 0.98 | 1.09 | |||||||||||||||
| 2007 | 2006 | |||||||||||||||||||||||||||||||
| 4th | 3rd | 2nd | 1st | 4th | 3rd | 2nd | 1st | |||||||||||||||||||||||||
| Quarterly Operating Results: | ||||||||||||||||||||||||||||||||
| Total interest income | $ | 13,747 | $ | 13,794 | $ | 13,539 | $ | 12,892 | $ | 12,754 | $ | 11,312 | $ | 10,675 | $ | 9,968 | ||||||||||||||||
| Interest expense | 6,466 | 6,690 | 6,554 | 6,249 | 5,980 | 5,164 | 4,526 | 4,062 | ||||||||||||||||||||||||
| Net interest income | 7,281 | 7,104 | 6,985 | 6,643 | 6,774 | 6,148 | 6,149 | 5,906 | ||||||||||||||||||||||||
| Provision for loan losses | 593 | 268 | 224 | 126 | 54 | 245 | 216 | 167 | ||||||||||||||||||||||||
| Noninterest income | 2,605 | 2,719 | 2,227 | 2,411 | 2,355 | 2,406 | 2,336 | 2,001 | ||||||||||||||||||||||||
| Noninterest expenses | 6,597 | 6,995 | 6,833 | 6,804 | 6,537 | 5,659 | 5,969 | 6,308 | ||||||||||||||||||||||||
| Net income | 2,268 | 2,096 | 1,756 | 1,810 | 1,962 | 2,031 | 1,794 | 1,214 | ||||||||||||||||||||||||
| Per Share of Common Stock:(1) | ||||||||||||||||||||||||||||||||
| Earnings per share | ||||||||||||||||||||||||||||||||
| Net income | $ | 0.33 | $ | 0.30 | $ | 0.25 | $ | 0.26 | $ | 0.28 | $ | 0.34 | $ | 0.30 | $ | 0.20 | ||||||||||||||||
| Diluted | 0.32 | 0.29 | 0.25 | 0.25 | 0.27 | 0.33 | 0.29 | 0.19 | ||||||||||||||||||||||||
| Cash dividends | 0.29 | 0.11 | 0.11 | 0.11 | 0.28 | 0.10 | 0.10 | 0.10 | ||||||||||||||||||||||||
| Book value (at quarter end) | 17.58 | 17.38 | 17.04 | 16.77 | 16.61 | 14.26 | 13.76 | 13.56 | ||||||||||||||||||||||||
| (1) | Retroactively restated for the 10% stock dividend paid February 29, 2008. |
20
Table of Contents
REPORT OF INDEPENDENT REGISTERED PUBLIC ACCOUNTING FIRM
Shareholders and Board of Directors
IBT Bancorp, Inc.
Mt. Pleasant, Michigan
We have audited the accompanying consolidated balance sheets ofIBT Bancorp, Inc.as of December 31, 2007 and 2006, and the related consolidated statements of changes in shareholders’ equity, income, comprehensive income, and cash flows for each of the years in the three-year period ended December 31, 2007. We also have auditedIBT Bancorp, Inc’sinternal control over financial reporting as of December 31, 2007, based on criteria established in theInternal Control-Integrated Frameworkissued by the Committee of Sponsoring Organizations of the Treadway Commission (COSO).IBT Bancorp, Inc.’s management is responsible for these consolidated financial statements, for maintaining effective internal control over financial reporting, and for its assessment of the effectiveness of internal control over financial reporting. Our responsibility is to express an opinion on these consolidated financial statements and an opinion on the effectiveness of theIBT Bancorp, Inc.’s internal control over financial reporting, based on our audits.
We conducted our audits in accordance with the standards of the Public Company Accounting Oversight Board (United States). Those standards require that we plan and perform the audits to obtain reasonable assurance about whether the consolidated financial statements are free of material misstatement and whether effective internal control over financial reporting was maintained in all material respects. Our audits of the consolidated financial statements included examining, on a test basis, evidence supporting the amounts and disclosures in the consolidated financial statements, assessing the accounting principles used and significant estimates made by management, and evaluating the overall financial statement presentation. Our audit of internal control over financial reporting included obtaining an understanding of internal control over financial reporting, assessing the risk that a material misstatement exists, and testing and evaluating the design and operating effectiveness of internal control based on the assessed risk. We believe that our audits provide a reasonable basis for our opinions.
A corporation’s internal control over financial reporting is a process designed to provide reasonable assurance regarding the reliability of financial reporting and the preparation of consolidated financial statements for external purposes in accordance with generally accepted accounting principles. A corporation’s internal control over financial reporting includes those policies and procedures that (1) pertain to the maintenance of records that, in reasonable detail, accurately and fairly reflect the transactions and dispositions of the assets of the corporation; (2) provide reasonable assurance that transactions are recorded as necessary to permit preparation of consolidated financial statements in accordance with generally accepted accounting principles, and that receipts and expenditures of the corporation are being made only in accordance with authorizations of management and directors of the corporation; and (3) provide reasonable assurance regarding prevention or timely detection of unauthorized acquisition, use, or disposition of the corporation’s assets that could have a material effect on the consolidated financial statements.
Because of its inherent limitations, internal control over financial reporting may not prevent or detect misstatements. Also, projections of any evaluation of effectiveness to future periods are subject to the risk that controls may become inadequate because of changes in conditions, or that the degree of compliance with the policies or procedures may deteriorate.
As described in Notes 3 and 18 to the consolidated financial statements, effective January 1, 2007 the Corporation elected the early adoption of Statements of Financial Accounting Standards (SFAS) No.’s 159,The Fair Value Option for Financial Assets and Financial Liabilities,and 157,Fair Value Measurements,and effective December 31, 2006 changed its method of accounting for defined benefit pension and other postretirement plans in accordance with SFAS No. 158,Employer’s Accounting for Defined Benefit Pension and Other Postretirement Plans.
21
Table of Contents
In our opinion, the consolidated financial statements referred to above present fairly, in all material respects, the consolidated financial position ofIBT Bancorp, Inc. as of December 31, 2007 and 2006, and the consolidated results of their operations and their cash flows for each of the years in the three-year period ended December 31, 2007 in conformity with accounting principles generally accepted in the United States of America. Also, in our opinionIBT Bancorp, Inc.maintained, in all material respects, effective internal control over financial reporting as of December 31, 2007, based on criteria established in theInternal Control-Integrated Frameworkissued by the Committee of Sponsoring Organizations of the Treadway Commission (COSO).

Rehmann Robson P.C.
Saginaw, Michigan
February 29, 2008
22
Table of Contents
CONSOLIDATED BALANCE SHEETS
| December 31 | ||||||||
| 2007 | 2006 | |||||||
| (Dollars in thousands ) | ||||||||
ASSETS | ||||||||
| Cash and demand deposits due from banks | $ | 25,583 | $ | 31,359 | ||||
| Trading securities | 25,064 | — | ||||||
| Investment securities available for sale (amortized cost of $212,285 in 2007 and $214,600 in 2006) | 213,127 | 213,450 | ||||||
| Mortgage loans available for sale | 2,214 | 2,734 | ||||||
| Net loans | ||||||||
| Loans | 612,687 | 591,042 | ||||||
| Less allowance for loan losses | 7,301 | 7,605 | ||||||
Total net loans | 605,386 | 583,437 | ||||||
| Premises and equipment | 22,516 | 20,754 | ||||||
| Corporate-owned life insurance policies | 13,195 | 12,763 | ||||||
| Accrued interest receivable | 5,948 | 5,765 | ||||||
| Acquisition intangibles and goodwill, net | 27,010 | 27,288 | ||||||
| Equity securities without readily determinable fair values | 7,353 | 3,480 | ||||||
| Other assets | 9,886 | 9,097 | ||||||
Total assets | $ | 957,282 | $ | 910,127 | ||||
LIABILITIES AND SHAREHOLDERS’ EQUITY | ||||||||
| Deposits | ||||||||
| Noninterest bearing | $ | 84,846 | $ | 83,902 | ||||
| NOW accounts | 105,526 | 111,406 | ||||||
| Certificates of deposit and other savings | 410,782 | 388,176 | ||||||
| Certificates of deposit over $100,000 | 132,319 | 142,356 | ||||||
Total deposits | 733,473 | 725,840 | ||||||
| Other borrowed funds ($7,523 at fair value in 2007) | 92,887 | 58,303 | ||||||
| Escrow funds payable | 1,912 | 2,416 | ||||||
| Accrued interest and other liabilities | 5,930 | 7,819 | ||||||
Total liabilities | 834,202 | 794,378 | ||||||
| Shareholders’ Equity | ||||||||
| Common stock — no par value 10,000,000 shares authorized; outstanding — 6,364,120 in 2007 (6,335,861 in 2006) | 116,319 | 114,785 | ||||||
| Retained earnings | 7,027 | 4,451 | ||||||
| Accumulated other comprehensive loss | (266 | ) | (3,487 | ) | ||||
Total shareholders’ equity | 123,080 | 115,749 | ||||||
Total liabilities and shareholders’ equity | $ | 957,282 | $ | 910,127 | ||||
The accompanying notes are an integral part of these consolidated financial statements.
23
Table of Contents
CONSOLIDATED STATEMENTS OF CHANGES IN SHAREHOLDERS’ EQUITY
| Year Ended December 31 | ||||||||||||
| 2007 | 2006 | 2005 | ||||||||||
| (Dollars in thousands) | ||||||||||||
Number of shares of common stock outstanding | ||||||||||||
| Balance at beginning of year | 6,335,861 | 4,974,715 | 4,896,412 | |||||||||
| Common stock dividends | — | 497,299 | — | |||||||||
| Issuance of common stock | 71,479 | 66,372 | 78,303 | |||||||||
| Shares issued in exchange for bank acquisition | — | 797,475 | — | |||||||||
| Common stock repurchased | (43,220 | ) | — | — | ||||||||
Balance end of year | 6,364,120 | 6,335,861 | 4,974,715 | |||||||||
Common stock | ||||||||||||
| Balance at beginning of year | $ | 114,785 | $ | 72,296 | $ | 66,908 | ||||||
| Common stock dividends | — | 20,887 | — | |||||||||
| Transfer | — | (12,000 | ) | — | ||||||||
| Issuance of common stock | 2,657 | 33,132 | 2,684 | |||||||||
| Share-based payment awards under equity compensation plan | 758 | 470 | 2,704 | |||||||||
| Common stock repurchased | (1,881 | ) | — | — | ||||||||
Balance end of year | 116,319 | 114,785 | 72,296 | |||||||||
Retained earnings | ||||||||||||
| Balance at beginning of year | 4,451 | 10,112 | 6,590 | |||||||||
| Cumulative adjustment to initially apply the fair value option of FASB Statement No. 159, net of tax | (1,050 | ) | ||||||||||
| Net income | 7,930 | 7,001 | 6,776 | |||||||||
| Common stock dividends | — | (20,887 | ) | — | ||||||||
| Transfer | — | 12,000 | — | |||||||||
| Cash dividends ($0.62 per share in 2007, $0.58 per share in 2006, $0.55 per share in 2005) | (4,304 | ) | (3,775 | ) | (3,254 | ) | ||||||
Balance end of year | 7,027 | 4,451 | 10,112 | |||||||||
Accumulated other comprehensive loss | ||||||||||||
| Balance at beginning of year | (3,487 | ) | (1,506 | ) | (904 | ) | ||||||
| Cumulative adjustment to initially apply the fair value option of FASB Statement No. 159, net of tax | 897 | |||||||||||
| Cumulative adjustment to initially apply FASB Statement No. 158, net of tax | — | (2,728 | ) | — | ||||||||
| Other comprehensive income (loss) | 2,324 | 747 | (602 | ) | ||||||||
Balance end of year | (266 | ) | (3,487 | ) | (1,506 | ) | ||||||
Total shareholders’ equity end of year | $ | 123,080 | $ | 115,749 | $ | 80,902 | ||||||
The accompanying notes are an integral part of these consolidated financial statements.
24
Table of Contents
CONSOLIDATED STATEMENTS OF INCOME
| Year Ended December 31 | ||||||||||||
| 2007 | 2006 | 2005 | ||||||||||
| (Dollars in thousands | ||||||||||||
| except per share data) | ||||||||||||
Interest income | ||||||||||||
| Loans, including fees | $ | 43,808 | $ | 36,575 | $ | 30,682 | ||||||
| Investment securities | ||||||||||||
| Taxable | 3,751 | 4,948 | 3,487 | |||||||||
| Nontaxable | 3,657 | 2,797 | 2,398 | |||||||||
| Trading account securities | 2,097 | — | — | |||||||||
| Federal funds sold and other | 659 | 389 | 315 | |||||||||
Total interest income | 53,972 | 44,709 | 36,882 | |||||||||
Interest expense | ||||||||||||
| Deposits | 22,605 | 17,164 | 11,374 | |||||||||
| Borrowings | 3,354 | 2,568 | 1,599 | |||||||||
Total interest expense | 25,959 | 19,732 | 12,973 | |||||||||
Net interest income | 28,013 | 24,977 | 23,909 | |||||||||
| Provision for loan losses | 1,211 | 682 | 777 | |||||||||
Net interest income after provision for loan losses | 26,802 | 24,295 | 23,132 | |||||||||
Noninterest income | ||||||||||||
| Service charges and fees | 5,894 | 5,490 | 4,928 | |||||||||
| Title insurance revenue | 2,192 | 2,389 | 2,351 | |||||||||
| Gain on sale of mortgage loans | 209 | 207 | 270 | |||||||||
| Net gain on trading securities | 460 | — | — | |||||||||
| Other | 1,207 | 1,012 | 927 | |||||||||
Total noninterest income | 9,962 | 9,098 | 8,476 | |||||||||
Noninterest expenses | ||||||||||||
| Compensation and benefits | 15,618 | 13,869 | 13,548 | |||||||||
| Occupancy | 1,766 | 1,730 | 1,553 | |||||||||
| Furniture and equipment | 3,297 | 2,868 | 2,657 | |||||||||
| Other | 6,548 | 6,006 | 5,126 | |||||||||
Total noninterest expenses | 27,229 | 24,473 | 22,884 | |||||||||
Income before federal income taxes | 9,535 | 8,920 | 8,724 | |||||||||
| Federal income taxes | 1,605 | 1,919 | 1,948 | |||||||||
Net income | $ | 7,930 | $ | 7,001 | $ | 6,776 | ||||||
Earnings per share | ||||||||||||
| Basic | $ | 1.14 | $ | 1.12 | $ | 1.14 | ||||||
| Diluted | $ | 1.11 | $ | 1.08 | $ | 1.14 | ||||||
The accompanying notes are an integral part of these consolidated financial statements.
25
Table of Contents
CONSOLIDATED STATEMENTS OF COMPREHENSIVE INCOME
| Year Ending December 31 | ||||||||||||
| 2007 | 2006 | 2005 | ||||||||||
| (Dollars in thousands ) | ||||||||||||
Net income | $ | 7,930 | $ | 7,001 | $ | 6,776 | ||||||
| Unrealized holding gains (losses) on available-for-sale securities: | ||||||||||||
| Unrealized gains (losses) arising during period | 614 | 1,020 | (2,749 | ) | ||||||||
| Reclassification adjustment for net realized losses (gains) included in net income | 19 | 112 | (2 | ) | ||||||||
| Net unrealized gains (losses) | 633 | 1,132 | (2,751 | ) | ||||||||
| Tax effect | (216 | ) | (385 | ) | 935 | |||||||
| Unrealized gains (losses), net of tax | 417 | 747 | (1,816 | ) | ||||||||
| Reduction of unrecognized pension cost, primarily as a result of plan curtailment | 2,890 | — | — | |||||||||
| Tax effect | (983 | ) | — | — | ||||||||
| Net gain on defined benefit pension plan | 1,907 | — | — | |||||||||
| Reduction in unrecognized actuarial loss of defined benefit pension plan | — | — | 1,839 | |||||||||
| Tax effect | — | — | (625 | ) | ||||||||
| Reduction in unrecognized actuarial loss of defined benefit pension plan | — | — | 1,214 | |||||||||
Other comprehensive income (loss), net of tax | 2,324 | 747 | (602 | ) | ||||||||
Comprehensive income | $ | 10,254 | $ | 7,748 | $ | 6,174 | ||||||
The accompanying notes are an integral part of these consolidated financial statements.
26
Table of Contents
CONDENSED CONSOLIDATED STATEMENTS OF CASH FLOWS (UNAUDITED)
| Year Ended December 31 | ||||||||||||
| 2007 | 2006 | 2005 | ||||||||||
| (Dollars in thousands) | ||||||||||||
Operating activities | ||||||||||||
| Net income | $ | 7,930 | $ | 7,001 | $ | 6,776 | ||||||
| Reconciliation of net income to cash provided by (used in) operations: | ||||||||||||
| Provision for loan losses | 1,211 | 682 | 777 | |||||||||
| Provision for foreclosed asset losses | 109 | — | — | |||||||||
| Depreciation | 1,960 | 1,852 | 1,735 | |||||||||
| Net amortization of investment securities | 216 | 705 | 957 | |||||||||
| Realized loss (gain) on sale of investment securities | 19 | 112 | (2 | ) | ||||||||
| Unrealized gains on trading securities | (460 | ) | — | — | ||||||||
| Unrealized losses on borrowings measured at their fair market value | 66 | — | — | |||||||||
| Amortization and impairment of mortgage servicing rights | 201 | 184 | 140 | |||||||||
| Earnings on corporate owned life insurance policies | (432 | ) | (404 | ) | (365 | ) | ||||||
| Amortization of acquisition intangibles | 278 | 160 | 94 | |||||||||
| Deferred income taxes | 301 | 274 | 263 | |||||||||
| Share-based payment awards | 758 | 470 | 2,704 | |||||||||
| Net changes in operating assets and liabilities which provided (used) cash: | ||||||||||||
| Trading securities | 53,235 | — | — | |||||||||
| Loans held for sale | 520 | (1,990 | ) | 1,595 | ||||||||
| Accrued interest receivable | (183 | ) | (626 | ) | (471 | ) | ||||||
| Other assets | (4,667 | ) | (1,424 | ) | (1,787 | ) | ||||||
| Escrow funds payable | (504 | ) | (7,407 | ) | 8,098 | |||||||
| Accrued interest and other liabilities | (171 | ) | (1,378 | ) | (2,406 | ) | ||||||
Net cash provided by (used in) operating activities | 60,387 | (1,789 | ) | 18,108 | ||||||||
Investing activities | ||||||||||||
| Activity in available-for-sale securities | ||||||||||||
| Maturities, calls, and sales | 54,997 | 57,577 | 31,962 | |||||||||
| Purchases | (132,115 | ) | (70,140 | ) | (57,044 | ) | ||||||
| Activity in held to maturity securities | ||||||||||||
| Maturities, calls, and sales | — | — | 523 | |||||||||
| Loan principal originations, net | (24,455 | ) | (44,805 | ) | (31,597 | ) | ||||||
| Proceeds from sales of foreclosed assets | 662 | 524 | 1,272 | |||||||||
| Purchases of premises and equipment | (3,722 | ) | (2,467 | ) | (2,374 | ) | ||||||
| Acquisition of Farwell State Savings Bank, net of cash acquired | — | (2,713 | ) | — | ||||||||
| Purchase of corporate owned life insurance policies | — | (499 | ) | — | ||||||||
Net cash used in investing activities | (104,633 | ) | (62,523 | ) | (57,258 | ) | ||||||
Financing activities | ||||||||||||
| Net increase (decrease) in noninterest bearing deposits | 944 | (409 | ) | 8,103 | ||||||||
| Net increase in interest bearing deposits | 6,689 | 60,433 | 20,499 | |||||||||
| Net increase in other borrowed funds | 34,365 | 6,138 | 21,183 | |||||||||
| Cash dividends paid on common stock | (4,304 | ) | (3,775 | ) | (3,254 | ) | ||||||
| Proceeds from the issuance of common stock | 2,657 | 2,459 | 2,684 | |||||||||
| Common stock repurchased | (1,881 | ) | — | — | ||||||||
Net cash provided by financing activities | 38,470 | 64,846 | 49,215 | |||||||||
(Decrease) increase in cash and cash equivalents | (5,776 | ) | 534 | 10,065 | ||||||||
| Cash and cash equivalents at beginning of year | 31,359 | 30,825 | 20,760 | |||||||||
Cash and cash equivalents at end of year | $ | 25,583 | $ | 31,359 | $ | 30,825 | ||||||
| Supplemental cash flows information: | ||||||||||||
| Interest paid | $ | 25,872 | $ | 19,392 | $ | 12,814 | ||||||
| Federal income taxes paid | 1,776 | 1,516 | 1,000 | |||||||||
| Transfer of loans to foreclosed assets | 1,295 | 433 | 928 | |||||||||
See notes to consolidated financial statements.
27
Table of Contents
NOTES TO CONSOLIDATED FINANCIAL STATEMENTS
(Dollars in thousands except per share amounts)
(Dollars in thousands except per share amounts)
Note 1 — Summary of Significant Accounting Policies
Basis of Presentation and Consolidation:
The consolidated financial statements include the accounts of IBT Bancorp, Inc. (the “Corporation”), a financial services holding company, and its wholly owned subsidiaries, Isabella Bank and Trust, IBT Title and Insurance Agency, Inc., Financial Group Information Services, and its majority owned subsidiaries, IBT Personnel, LLC (79%), and IB&T Employee Leasing, LLC (79%). All intercompany balances and accounts have been eliminated in consolidation.
Nature of Operations:
IBT Bancorp, Inc. is a financial services holding company offering a wide array of financial products and services in mid-Michigan. Its banking subsidiary, Isabella Bank and Trust, offers banking services through 24 locations,24-hour banking services locally and nationally through shared automatic teller machines, 24-hour online banking, and direct deposits to businesses, institutions, and individuals. Lending services offered include commercial real estate loans and lines of credit, agricultural loans, residential real estate loans, consumer loans, student loans, and credit cards. Deposit services include interest and noninterest bearing checking accounts, savings accounts, money market accounts, and certificates of deposit. Other related financial products include trust services, safe deposit box rentals, and credit life insurance. Active competition, principally from other commercial banks, savings banks and credit unions, exists in all of the Bank’s principal markets. The Corporation’s results of operations can be significantly affected by changes in interest rates or changes in the local economic environment.
In April 2007, the Corporation consolidated the charters of FSB Bank and Isabella Bank and Trust. The consolidation into a single charter helped to further reduce operating expenses through the elimination of duplications in memberships, licensing, service contracts, compliance, computer platforms, and computer processing. The legal reorganization had no significant effect on the Corporation’s consolidated financial statements (See “Note 23 — Operating Segments”).
On January 1, 2008, the Corporation acquired 100 percent of Greenville Community Financial Corporation (GCFC). As a result of this acquisition, Greenville Community Bank, a wholly-owned subsidiary of GCFC, merged with and into the Bank. As of December 31, 2007 GCFC had assets of $107,986 (See “Note 24 — Subsequent Events”).
IBT Title and Insurance Agency, Inc. (IBT Title) does business under the names Isabella County Abstract and Title, Mecosta County Abstract and Title, IBT Title Clare, Benchmark Title of Greenville, Milltown Title, and Pere Marquette Abstract and Title Agency, LLC. IBT Title provides title insurance and abstract searches, and closes real estate loans.
Financial Group Information Services provides information technology services to IBT Bancorp and its subsidiaries.
IBT Personnel and IB&T Employee Leasing provide payroll services, benefit administration, and other human resource services to IBT Bancorp and subsidiaries.
Use of Estimates:
In preparing consolidated financial statements in conformity with accounting principles generally accepted in the United States of America, management is required to make estimates and assumptions that affect the reported amounts of assets and liabilities as of the date of the consolidated balance sheet and reported amounts of revenues and expenses during the reporting year. Actual results could differ from those estimates.
Material estimates that are particularly susceptible to significant change in the near term relate to the determination of the allowance for loan losses, the valuation of real estate acquired in connection with foreclosures or in satisfaction of loans, valuation of goodwill and intangible assets, determinations of assumptions in accounting
28
Table of Contents
NOTES TO CONSOLIDATED FINANCIAL STATEMENTS — (Continued)
for the defined benefit pension plans, and other post-retirement liabilities. In connection with the determination of the allowance for loan losses and the carrying value of foreclosed real estate, management obtains independent appraisals for significant properties.
Significant Group Concentrations of Credit Risk:
Most of the Corporation’s activities conducted are with customers located within the central Michigan area. A significant amount of its outstanding loans are secured by real estate or are made to finance agricultural production. Other than these types of loans, there is no significant concentration to any other industry or customer.
Cash and Cash Equivalents:
For purposes of the consolidated statements of cash flows, cash and cash equivalents include cash and balances due from banks, federal funds sold, and other deposit accounts, all of which have original maturity dates within ninety days. Generally, federal funds sold are for a one day period. The Corporation maintains deposit accounts in various financial institutions which generally exceed federally insured limits or are not insured.
Trading Securities:
Effective January 1, 2007, in conjunction with the early adoption of the fair value option of SFAS No. 159 (Note 3), the Corporation engages in trading activities for its own account. Securities that are held principally for resale in the near term are recorded in the trading assets account at fair value with unrealized changes in fair value recorded in earnings. Interest and dividends are included in net interest income.
Available-For-Sale Investment Securities:
Securities classified as “available-for-sale” are recorded at fair value, with unrealized gains and losses, net of the effect of deferred income taxes, excluded from earnings and reported in other comprehensive income.
Purchase premiums and discounts are recognized in interest income using the interest method over the terms of the securities. Declines in the fair value of held-to-maturity and available-for-sale securities below their cost that are deemed to be other than temporary are reflected in earnings as realized losses. In determining whether other-then-temporary impairment losses impairments exist, management considers (1) the length of time and the extent to which the fair value has been less than cost, (2) the financial condition and near-term prospects of the issuer, and (3) the intent and ability of the Corporation to retain its investment in the issuer for a period of time sufficient to allow for any anticipated recovery in fair value. Gains and losses on the sale of securities are recorded on the trade date and are determined using the specific identification method.
Loans:
Loans that management has the intent and ability to hold for the foreseeable future or until maturity or payoff are reported at their outstanding principal balance adjusted for any charge offs, the allowance for loans losses, and any deferred fees or costs on originated loans. Interest income on loans is accrued over the term of the loan based on the principal amount outstanding. Loan origination fees and certain direct loan origination costs are capitalized and recognized as a component of interest income over the term of the loan using the constant yield method.
The accrual of interest on mortgage and commercial loans is discontinued at the time the loan is 90 days or more past due unless the credit is well-secured and in the process of collection. Credit card loans and other personal loans are typically charged off no later than 180 days past due. Past due status is based on contractual terms of the loan. In all cases, loans are placed on nonaccrual or charged off at an earlier date if collection of principal or interest is considered doubtful.
For loans that are placed on non-accrual status or charged-off, all interest accrued in the current calendar year, but not collected, is reversed against interest income while interest accrued in prior calendar years, but not collected is charged against the allowance for loan losses. The interest on these loans is accounted for on the cash-basis or
29
Table of Contents
NOTES TO CONSOLIDATED FINANCIAL STATEMENTS — (Continued)
cost-recovery method, until qualifying for return to accrual status. Loans are returned to accrual status when all principal and interest amounts contractually due are brought current and future payments are reasonably assured. For impaired loans not classified as nonaccrual, interest income continues to be accrued over the term of the loan based on the principal amount outstanding.
Allowance for Loan Losses:
The allowance for loan losses is established as losses are estimated to have occurred through a provision for loan losses charged to earnings. Loan losses are charged against the allowance when management believes the uncollectibility of the loan balance is confirmed. Subsequent recoveries, if any, are credited to the allowance.
The allowance for loan losses is evaluated on a regular basis by management and is based upon management’s periodic review of the collectibility of the loans in light of historical experience, the nature and volume of the loan portfolio, adverse situations that may affect the borrower’s ability to repay, estimated value of any underlying collateral and prevailing economic conditions. This evaluation is inherently subjective as it requires estimates that are susceptible to significant revision as more information becomes available.
The allowance consists of specific, general and unallocated components. The specific component relates to loans that are classified as doubtful, substandard or special mention. For such loans that are also classified as impaired, an allowance is established when the discounted cash flows (or collateral value or observable market price) of the impaired loan is lower than the carrying value of that loan. The general component covers non-classified loans and is based on historical loss experience adjusted for qualitative factors. An unallocated component is maintained to cover uncertainties that management believes affect its estimate of probable losses. The unallocated component of the allowance reflects the margin of imprecision inherent in the underlying assumptions used in the methodologies for estimating specific and general losses in the portfolio.
A loan is considered impaired when, based on current information and events, it is probable that the Bank will be unable to collect the scheduled payments of principal or interest when due according to the contractual terms of the loan agreement. Factors considered by management in determining impairment include payment status, collateral value, and the probability of collecting scheduled principal and interest payments when due. Loans that experience insignificant payment delays and payment shortfalls generally are not classified as impaired. Management determines the significance of payment delays and payment shortfalls on acase-by-case basis, taking into consideration all of the circumstance surrounding the loan and the borrower, including the length of the delay, the reason for the delay, the borrower’s prior payment record, and the amount of the shortfall in relation to the principal and interest owed. Impairment is measured on a loan by loan basis for commercial and construction loans by either the present value of expected future cash flows discounted at the loan’s effective interest rate, the loan’s obtainable market price, or the fair value of the collateral if the loan is collateral dependent.
Large groups of smaller balance homogeneous loans are collectively evaluated for impairment. Accordingly, the Corporation does not separately identify individual consumer and residential loans for impairment disclosures.
Loans Held for Sale:
Mortgage loans originated and intended for sale in the secondary market are carried at fair value as determined by aggregating outstanding commitments from investors or current investor yield requirements. Net unrealized losses, if any, are recognized through a valuation allowance by charges to income.
Mortgage loans held for sale are generally sold with the mortgage servicing rights retained by the Bank. The carrying value of mortgage loans sold is reduced by the cost allocated to the associated mortgage servicing rights. Gains or losses on sales of mortgage loans are recognized based on the difference between the selling price and the carrying value of the related mortgage loans sold.
30
Table of Contents
NOTES TO CONSOLIDATED FINANCIAL STATEMENTS — (Continued)
Transfers of Financial Assets:
Transfers of financial assets, including held for sale mortgage loans, as described above, and participation loans are accounted for as sales when control over the assets has been surrendered. Control over transferred assets is determined to be surrendered when 1) the assets have been isolated from the Bank, 2) the transferee obtains the right (free of conditions that constrain it from taking advantage of the right) to pledge or exchange the transferred assets and 3) the Bank does not maintain effective control over the transferred assets through an agreement to repurchase them before their maturity.
Servicing:
Servicing assets are recognized as separate assets when rights are acquired through purchase or through sale of financial assets. The Corporation has no purchased servicing rights. For sales of mortgage loans, a portion of the cost of originating the loan is allocated to the servicing right based on relative fair value. Fair value is based on market prices for comparable mortgage servicing contracts, when available, or alternatively, is based on a valuation model that calculates the present value of estimated future net servicing income. The valuation model incorporates assumptions that market participants would use in estimating future net servicing income, such as the cost to service, the discount rate, the custodial earnings rate, an inflation rate, ancillary income, prepayment speeds and default rates and losses.
Servicing assets are evaluated for impairment based upon the fair value of the rights as compared to amortized cost. Impairment is determined by stratifying rights into tranches based on predominant risk characteristics, such as interest rate, loan type, and investor type. Impairment is recognized through a valuation allowance for an individual tranche, to the extent that fair value is less than the capitalized amount for the tranche. If the Corporation later determines that all or a portion of the impairment no longer exists for a particular tranche, a reduction of the allowance may be recorded as an increase to income. Capitalized servicing rights are reported in other assets and are amortized into non-interest income in proportion to, and over the period of, the estimated future net servicing income of the underlying financial assets.
Servicing fee income is recorded for fees earned for servicing loans. The fees are based on a contractual percentage of the outstanding principal; or a fixed amount per loan and are recorded as income when earned. The amortization of mortgage servicing rights is netted against loan servicing fee income, a component of noninterest income.
Loans Acquired Through Transfer:
American Institute of Certified Public Accountants’ Statement of Position (SOP)03-3 requires that a valuation allowance for loans acquired in a transfer, including in a business combination, reflect only losses incurred after acquisition, and should not be recorded at acquisition. It applies to any loan acquired in a transfer that shows evidence of credit quality deterioration since it was originated. The effect on results of operations and financial position of the Corporation’s acquisition of the allowance for loan losses carried over from Farwell State Savings Bank (“Farwell”) (see Note 2) was not material in 2006 due to the limited number of troubled loans held by Farwell.
Foreclosed Assets:
Assets acquired through, or in lieu, of loan foreclosure are initially recorded at the lower of the Bank’s carrying amount or fair value less estimated selling costs at the date of transfer, establishing a new cost basis. Any write-downs based on the asset’s fair value at the date of acquisition are charged to the allowance for loan losses. After foreclosure, property held for sale is carried at the lower of the new cost basis or fair value less costs to sell. Impairment losses on property to be held and used are measured at the amount by which the carrying amount of property exceeds its fair value. Costs relating to holding these assets are expensed as incurred. Valuations are periodically performed by management, and any subsequent write-downs are recorded as a charge to operations, if necessary, to reduce the carrying value of a property to the lower of its cost or fair value less costs to sell.
31
Table of Contents
NOTES TO CONSOLIDATED FINANCIAL STATEMENTS — (Continued)
Off-Balance-Sheet Credit Related Financial Instruments:
In the ordinary course of business, the Corporation has entered into commitments to extend credit, including commitments under credit card arrangements, home equity lines of credit, commercial letters of credit, and standby letters of credit. Such financial instruments are recorded only when funded.
Premises and Equipment:
Land is carried at cost. Buildings and equipment are carried at cost less accumulated depreciation. Depreciation is computed principally by the straight line method based upon the useful lives of the assets which generally range from 5 to 30 years. Maintenance, repairs and minor alterations are charged to current operations as expenditures occur and major improvements are capitalized.
Equity Securities Without Readily Determinable Fair Values:
Included in equity securities without readily determinable fair values are restricted securities of $6,253 in 2007 and $3,480 in 2006. Restricted securities include stock of the Federal Reserve Bank and the Federal Home Loan Bank, which are carried at cost and have no contractual maturity.
Stock Compensation Plans:
In December 2004, the Financial Accounting Standards Board (FASB) issued Statement of Financial Accounting Standards (SFAS) No. 123 (revised 2004),Share-Based Payment. SFAS No. 123(R) requires that the compensation costs relating to share-based payment transactions are recognized in the financial statements and that this cost be measured based on the fair value of the equity or liability instruments issued. SFAS No. 123(R) covers a wide range of share-based compensation arrangements including stock options, restricted share plans, performance-based awards, share appreciation rights, and employee share purchase plans. SFAS 123(R) applies to new awards and awards modified, repurchased, or cancelled after January 1, 2006. Compensation expense is based on the fair value of the awards, which is generally the market price of the stock on the measurement date and is recognized ratably over the service period of the award.
The Corporation adopted SFAS No. 123(R) on December 31, 2005, and elected the modified prospective method. Compensation cost has been measured using the fair value of an award on the grant dates and is recognized over the service period, which is usually the vesting period. Compensation cost related to the non-vested portion of the awards outstanding as of the date was based on the grant date fair value of those awards as calculated under the original provisions of SFAS No. 123; that is, the Corporation was not required to re-measure the grant date fair value estimate of the unvested portion of awards granted prior to the effective date of SFAS No. 123(R).
Corporate Owned Life Insurance:
The Corporation has purchased life insurance policies on key members of management. In the event of death of one of these individuals, the Corporation would receive a specified cash payment equal to the face value of the policy. Such policies are recorded at their cash surrender value, or the amount that can be realized. Increases in cash surrender value in excess of premiums paid are reported as other noninterest income.
To date, no compensation expense has been required to be recognized in the Corporation’s financial statements to accrue for the mortality and related costs of maintaining the life insurance policies in effect during the covered officers’ postretirement periods.
Emerging Issues Task Force (“EITF”) IssueNo. 06-4,Accounting for Deferred Compensation and Postretirement Benefit Aspects of Endorsement Split-Dollar Life Insurance Arrangements,ratified by the FASB in September, 2006, requires that policyholders recognize a liability for any postretirement benefits provided through the Corporation’s program. As of December 31, 2007, the nature and amount of benefits promised by the Corporation to the covered employees is estimated to be $1,561, net of tax. An accrued liability will begin to be
32
Table of Contents
NOTES TO CONSOLIDATED FINANCIAL STATEMENTS — (Continued)
recorded by the Corporation effective January 1, 2008 to recognize the initial and ongoing costs of maintaining these policies.
Acquisition Intangibles and Goodwill:
Isabella Bank and Trust previously acquired branch facilities and related deposits in a business combination accounted for as a purchase. During October 2006, Isabella Bank acquired Farwell State Savings Bank (“Farwell”) resulting in identified core deposit intangibles and goodwill (see Note 2). The acquisition of the branches included amounts related to the valuation of customer deposit relationships (core deposit intangibles). Such core deposit intangibles are included in other assets and are being amortized on the straight line basis over nine years. Core deposit intangibles arising from the acquisition of Farwell are being amortized on a 10 year sum-of-year’s digits amortization schedule. Goodwill is included in other assets and is not amortized but is evaluated for impairment at least annually, or on an interim basis if an event occurs or circumstances change that would more likely than not reduce the fair value of the reporting unit below the carrying value.
Federal Income Taxes:
Deferred income tax assets and liabilities are determined using the liability (or balance sheet) method. Under this method, the net deferred tax assets or liability is determined based on the tax effects of the temporary differences between the book and tax bases on the various balance sheet assets and liabilities and gives current recognition to changes in tax rates and laws.
Advertising Costs:
Advertising costs are expensed as incurred (see Note 12).
Earnings Per Common Share:
Basic earnings per share represents income available to common stockholders divided by the weighted — average number of common shares outstanding during the period. Diluted earnings per share reflects additional common shares that would have been outstanding if dilutive potential common shares had been issued, as well as any adjustments to income that would result from the assumed issuance. Potential common shares that may be issued by the Corporation relate solely to outstanding shares in the Corporation’s Deferred Director fee plan (see Note 18).
Earnings per common share have been computed based on the following:
| December 31 | ||||||||||||
| 2007 | 2006 | 2005 | ||||||||||
| Average number of common shares outstanding* | 6,973,508 | 6,269,465 | 5,958,657 | |||||||||
| Effect of shares in the Deferred Director fee plan* | 197,055 | 181,280 | — | |||||||||
| Average number of common shares outstanding used to calculate diluted earnings per common share | 7,170,563 | 6,450,745 | 5,958,657 | |||||||||
| * | As adjusted for the 10% stock dividend paid February 29, 2008 (Note 24) |
Reclassifications:
Certain amounts reported in the 2006 and 2005 consolidated financial statements have been reclassified to conform to the 2007 presentation.
Recent Accounting Pronouncements:
In June 2006, the Financial Accounting Standards Board (“FASB”) issued Financial Accounting Standards Interpretation No. 48 (“ FIN 48”),Accounting for Uncertainty in Income Taxes. FIN 48 clarifies the accounting for
33
Table of Contents
NOTES TO CONSOLIDATED FINANCIAL STATEMENTS — (Continued)
uncertainty in income taxes recognized in an enterprise’s financial statements in accordance with FASB Statement No. 109,Accounting for Income Taxes. FIN 48 prescribes a recognition threshold and measurement attributable for the financial statement recognition and measurement of a tax position taken or expected to be taken in a tax return. On January 1, 2007, the Corporation adopted FIN 48. The adoption of this standard had no significant impact on the Corporation’s consolidated financial statements.
In September 2006, Emerging Issues Task Force (“EITF”) IssueNo. 06-5,Accounting for Purchases of Life Insurance-Determining the Amount That Could Be Realized in Accordance with FASB TechnicalBulletin No. 85-4, ratified by the FASB, states that a policyholder should consider certain additional amounts included in the contractual terms of the policy in determining the amount that could be realized under the insurance contract. This issue was effective for fiscal years beginning after December 15, 2006. The provisions ofEITF 06-5 did not have an impact on the Corporation’s consolidated financial statements.
In February 2006, the FASB issued SFAS No. 155Accounting for Certain Hybrid Instruments, which allows financial instruments that have embedded derivatives to be accounted for as a whole (eliminating the need to bifurcate the derivative from its host) if the holder elects to account for the whole instrument on a fair value basis. The issuance of Statement No. 155 provides the following: 1.) Clarifies which interest-only strips and principal-only strips are not subject to the requirements of Statement No. 133; 2.) Establishes a requirement to evaluate interests in securitized financial assets to identify interests that are freestanding derivatives or that are hybrid financial instruments that contain an embedded derivative requiring bifurcation; 3.) Clarifies that concentrations of credit risk in the form of subordination are not embedded derivatives; and 4.) Amends Statement No. 140 to eliminate the prohibition on a qualifying special purpose entity from holding a derivative financial instrument that pertains to a beneficial interest other than another derivative financial instrument. SFAS No. 155 is effective for all financial instruments acquired or issued after the beginning of the first fiscal year beginning after September 15, 2006. The Corporation adopted SFAS No. 155 on January 1, 2007 and it did not have a material impact on the Corporation’s consolidated financial statements.
In March 2006 the FASB issued SFAS No. 156,Accounting for Servicing of Financial Assets, which affects the accounting for servicing rights, which includes mortgage servicing rights and those associated with other types of financial assets transferred in securitizations such as auto loans, student loans, credit cards, commercial real estate and equipment financing. Specifically, Statement No. 156 requires that all separately recognized servicing rights be initially measured at fair value, if practicable. For subsequent accounting for servicing assets and liabilities, entities would choose either to amortize and recognize over a period of estimated net servicing income or net servicing loss (currently required under Statement No. 140) or remeasure at fair value at each subsequent reporting date. The choice to measure at fair value would make it easier to account for hedges of servicing rights, which currently are difficult to apply under Statement No. 133. Statement No. 156 is effective for all servicing assets or liabilities acquired or assumed after the beginning of the first fiscal year beginning after September 15, 2006. In addition, an entity may elect to apply fair value measurement to existing servicing rights upon adoption. The Corporation adopted SFAS No. 156 on January 1, 2007 and it did not have a material impact on the Corporation’s consolidated financial statements.
In September of 2006, EITF IssueNo. 06-4,Accounting for Deferred Compensation and Postretirement Benefit Aspects of Endorsement Split-Dollar Life Insurance Arrangement,was ratified by the FASB. The EITF reached a consensus that for an endorsement split-dollar life insurance arrangement within the scope of this Issue, an employer should recognize a liability for future benefits. IBT Bancorp has purchased corporation-owned life insurance on certain of its employees. The cash surrender value of these policies is carried as an asset on the consolidated balance sheets. The carrying value was $13,195 at December 31, 2007. These life insurance policies are generally subject to endorsement split-dollar life insurance arrangements. These arrangements were designed to provide a pre-and postretirement benefit for senior officers of the Corporation. The Corporation is required to apply EITF IssueNo. 06-4 beginning January 1, 2008, and while it is currently evaluating the effect the implementation of EITF IssueNo. 06-4 will have on the consolidated financial statements, management expects to recognize an initial liability of approximately $1,561, net of tax, with periodic policy maintenance costs not material in any one year.
34
Table of Contents
NOTES TO CONSOLIDATED FINANCIAL STATEMENTS — (Continued)
In September 2006, the FASB issued SFAS No. 157,Fair Value Measurements. SFAS No. 157 establishes a common definition for fair value to be applied to GAAP guidance requiring use of fair value, establishes a framework for measuring fair value, and expands disclosure about such fair value measurements. SFAS No. 157 clarifies the principle that fair value should be based on the assumptions market participants would use when pricing an asset or liability and establishes a fair value hierarchy that prioritizes the information used to develop those assumptions. Under the standard, fair value measurements would be separately disclosed by level within the fair value hierarchy. SFAS No. 157 is effective for fiscal years beginning after November 15, 2007 unless SFAS No. 159 is adopted, in which SFAS No. 157 would need to be adopted concurrently. The results of the adoption of this standard are disclosed in Note 3.
In February 2007, the FASB issued SFAS No. 159,The Fair Value Option for Financial Assets and Financial Liabilities,which provides entities with an option to report selected financial assets and liabilities at fair value, with the objective to reduce both the complexity in accounting for financial instruments and the volatility in earnings caused by measuring related assets and liabilities differently. SFAS No. 159 permits fair value to be used for both the initial and subsequent measurements on acontract-by-contract election, with changes in fair value to be recognized in earnings as those changes occur. SFAS No. 159 also revises provisions of SFAS No. 115 that apply to available-for-sale and trading securities. This statement is effective for fiscal years beginning after November 15, 2007, with an option to early adopt effective January 1, 2007. After review of the standard, the Corporation has early adopted the standard. The impact of the adoption of this statement is presented in Note 3.
In September 2006, the Securities and Exchange Commission (SEC) released Staff Accounting Bulletin No. 108,Considering the Effects of Prior Year Misstatements when Quantifying Misstatements in Current Year Financial Statements(SAB 108), which is effective for fiscal years ending on or after November 15, 2006. SAB 108 provides guidance on how the effects of prior-year uncorrected financial statement misstatements should be considered in quantifying a current year misstatement. SAB 108 requires public companies to quantify misstatements using both an income statement (rollover) and balance sheet (iron curtain) approach and evaluate whether either approach results in a misstatement that, when all relevant quantitative and qualitative factors are considered, is material. If prior year errors that had been previously considered immaterial now are considered material based on either approach, no restatement is required so long as management properly applied its previous approach and all relevant facts and circumstances were considered. Adjustments considered immaterial in prior years under the method previously used, but now considered material under the dual approach required by SAB 108, are to be recorded upon initial adoption of SAB 108. The adoption of this standard did not have a material effect on the Corporation’s consolidated financial statements.
In December 2007, the Financial Accounting Standards Board issued Statement of Financial Accounting Standards No. 141R (SFAS No 141R)Accounting for Business Combinations. The objective ofSFAS 141-R is to improve the relevance, representational faithfulness, and comparability of the information that a reporting entity provides in its financial reports about a business combination and its effects. To accomplish that, this Statement establishes principles and requirements for how the acquirer recognizes and measures the identifiable assets acquired, the liabilities assumed, and any noncontrolling interest acquired, in its financial statements. The acquirer must also recognize and measure the goodwill acquired in the business combination or a gain from a bargain purchase, and determine what information to disclose to enable users of the financial statements to evaluate the nature and financial effects of the business combination.SFAS No. 141-R is effective January 1, 2009 and is expected to have a significant impact on the Corporation’s accounting for business combinations closing on or after January 1, 2009.
In December, 2007, the Financial Accounting Standards Board issued Statement of Financial Accounting Standards No. 160,Noncontrolling Interests in Consolidated financial statements. The objective of SFAS No. 160 is to improve the relevance, comparability, and transparency of the financial information that a reporting entity provides in its consolidated financial statements by establishing accounting and reporting standards for the noncontrolling interest in a subsidiary. SFAS No. 160 is effective January 1, 2009 and is not expected to have a significant impact on the Corporation’s consolidated financial position and results of operations.
35
Table of Contents
NOTES TO CONSOLIDATED FINANCIAL STATEMENTS — (Continued)
On February 14, 2008, the Financial Accounting Standards Board issued Staff Position FAS 157 — 1,Application of FASB Statement No. 157 to FASB Statement No. 13 and Other Accounting Pronouncements that address Fair Value Measurements for Purposes of Lease Classification or Measurement under Statement 13. This FSP amends FASB Statement No. 157,Fair Value Measurements, to exclude FASB Statement No. 13,Accounting for Leases, and other accounting pronouncements that address fair value measurements for purposes of lease classification or measurement under Statement No. 13. However, this scope exception does not apply to assets acquired and liabilities assumed in a business combination that are required to be measured at fair value under FASB Statement No. 141,Business Combinations, or No. 141 (revised 2007),Business Combinations, regardless of whether those assets and liabilities are related to leases. This FSP shall be effective upon the initial adoption of Statement No. 157. An enterprise that applied Statement No. 157 in a manner consistent with the provisions of this FSB would continue to apply the provisions of this FSP from the date of the initial adoption of Statement No. 157. However, an enterprise that did not apply Statement No. 157 in a manner consistent with the provisions of this FSP shall retrospectively apply the provisions in this FSP to the date of the initial adoption of Statement No. 157.FAS 157-1 did not have a significant impact on the Corporation’s consolidated financial statements.
On February 20, 2008, the Financial Accounting Standards Board issued Staff Position FAS 140 — 3,Accounting for Transfers of Financial Assets and Repurchase Financing Transactions. The objective of this FSP is to provide guidance on accounting for a transfer of a financial asset and a repurchase financing. This FSP presumes that an initial transfer of a financial asset and a repurchase financing are considered part of the same arrangement (linked transaction) under Statement No. 140. However, if certain criteria are met, the initial transfer and repurchase financing shall not be evaluated as a linked transaction and shall be evaluated separately under Statement No. 140. This FSP shall be effective for financial statements issued for fiscal years beginning after November 15, 2008, and interim periods within those fiscal years. Earlier application is not permitted.FAS 140-3 is not expected to have a significant impact on the Corporation’s consolidated financial statements.
Note 2 — Business Combination
On October 3, 2006, the Bank acquired 100 percent of Farwell State Savings Bank (Farwell). As a result of this acquisition, Farwell merged with and into the Bank. Under the terms of the merger agreement, each share of Farwell common stock was automatically converted into the right to receive 3.0382 shares of IBT common stock and $29.00 in cash. As a result of this acquisition, the Corporation issued 797,475 shares of IBT Bancorp, Inc. common stock valued at $30,448 and paid a total of $7,612 in cash to Farwell shareholders. Included in the purchase price was $382 of transaction costs. The total consideration exchanged including the value of the common stock issued, cash paid to shareholders, plus cash paid for transaction costs resulted in a total purchase cost of $38,442. The acquisition of Farwell has increased the overall market share for IBT Bancorp in furtherance of the Bank’s strategic plan to pursue certain acquisitions.
36
Table of Contents
NOTES TO CONSOLIDATED FINANCIAL STATEMENTS — (Continued)
The following table summarizes the estimated fair values of the assets acquired and liabilities assumed at the date of the acquisition.
| Fair Value | ||||||||||||
| Adjustments of | ||||||||||||
| Farwell | Nonintangible | Fair Value | ||||||||||
| October 3, | Net Assets | of Net Assets | ||||||||||
| 2006 | Acquired | Acquired | ||||||||||
ASSETS | ||||||||||||
| Cash and cash equivalents | $ | 5,281 | $ | — | $ | 5,281 | ||||||
| Securities available for sale | 17,166 | — | 17,166 | |||||||||
| Loans, net | 63,874 | (470 | ) | 63,404 | ||||||||
| Bank premises and equipment | 307 | 600 | 907 | |||||||||
| Other assets | 2,416 | 15 | 2,431 | |||||||||
Total assets acquired | 89,044 | 145 | 89,189 | |||||||||
LIABILITIES AND SHAREHOLDERS’ EQUITY | ||||||||||||
Liabilities | ||||||||||||
| Deposits | 73,731 | (393 | ) | 73,338 | ||||||||
| Accrued interest and other liabilities | 1,114 | — | 1,114 | |||||||||
Total liabilities assumed | 74,845 | (393 | ) | 74,452 | ||||||||
Net assets acquired | $ | 14,199 | $ | 538 | 14,737 | |||||||
| Core deposit intangible | 1,442 | |||||||||||
| Goodwill | 22,263 | |||||||||||
Total consideration paid | $ | 38,442 | ||||||||||
The fair value adjustments are being amortized over two years using the straight line amortization method. The core deposit intangible is being amortized using a 10 year sum-of-the-years’ digits amortization schedule. Goodwill, which is not amortized, is tested for impairment at least annually. As the acquisition was considered a stock transaction, goodwill is not deductible for federal income tax purposes.
The 2007 and 2006 consolidated statements of income include operating results of Farwell since the date of acquisition.
The unaudited pro forma information presented in the following table has been prepared based on IBT Bancorp’s historical results combined with Farwell. The information has been combined to present the results of operations as if the acquisition had occurred at the beginning of the periods presented. The pro forma results are not necessarily indicative of the results which would have actually been attained if the acquisition had been consummated in the past or what may be attained in the future and have not been adjusted for the 10% stock dividend paid February 29, 2008:
| Year Ended December 31 | ||||||||
| 2006 | 2005 | |||||||
| Net interest income | $ | 27,499 | $ | 27,371 | ||||
| Net income | $ | 8,023 | $ | 8,288 | ||||
| Basic earnings per share | $ | 1.28 | $ | 1.33 | ||||
37
Table of Contents
NOTES TO CONSOLIDATED FINANCIAL STATEMENTS — (Continued)
Note 3 — Financial Instruments Recorded at Fair Value
In February 2007, the FASB issued SFAS No. 159,The Fair Value Option for Financial Assets and Financial Liabilities(“SFAS No. 159”). SFAS No. 159 expands the use of fair value accounting but does not affect existing standards which require assets or liabilities to be carried at fair value. Under SFAS No. 159, the Corporation may elect to measure many financial instruments and certain other assets and liabilities at fair value (“fair value option” — FVO). The fair value measurement option is not allowable for deposit or withdrawable on demand liabilities. If the use of fair value is elected, any upfront costs and fees related to the item must be recognized in earnings and cannot be deferred, e.g., debt issue costs. The fair value election is irrevocable and is generally made on aninstrument-by-instrument basis, even if the Corporation has similar instruments that it elects not to measure based on fair value. At the adoption date, unrealized gains and losses on existing items for which fair value has been elected are reported as a cumulative adjustment to beginning retained earnings as of January 1, 2007. Subsequent to the adoption of SFAS No. 159, changes in fair value are recognized in earnings. Although SFAS No. 159 is effective for fiscal years beginning after November 15, 2007 and would have been required to be adopted by IBT Bancorp in the first quarter of fiscal 2008, IBT Bancorp elected to early adopt SFAS No. 159 effective January 1, 2007, the impact of which is detailed in the table below.
As shown in the following table, the Corporation elected to transfer $77,839 of its $213,450 available-for-sale securities investment portfolio to trading status to facilitate more active trading of these securities. In determining which available-for-sale securities to transfer, the Corporation considered interest rates, duration, marketability, and balance sheet management strategies. The securities transferred included obligations of US Government Agencies, variable rate Federal National Mortgage Association and Federal Home Loan Mortgage Corporation mortgage backed securities, taxable municipal bonds, and a limited number of tax exempt bonds. During 2007, the Corporation sold $47,334 of trading securities and purchased $7,654 of trading securities. During the year ended December 31, 2007, the Corporation had $14,914 of calls and maturities in its trading portfolio. The Corporation’s goal is to maintain an overall trading securities position to approximately 2.0% to 3.0% of total assets. Management believes this level to be the optimum amount needed to provide liquidity and interest margin protection.
The Corporation also elected to report $7,256 of long-term, relatively high interest rate, Federal Home Loan Bank advances at their fair value upon the early adoption of SFAS No. 159 to provide a hedge against significant movement in interest rates. These advances had an outstanding principal balance of $7,225 as of December 31, 2007. During 2007, there were no changes in borrowings measured at fair value. During the year, the Corporation recognized losses of $66 as a result of changes in the fair market value of these borrowings.
| Balance Sheet | Net Gain/ | Balance Sheet | ||||||||||
| 1/1/2007 Prior to | (Loss) Upon | 1/1/2007 After | ||||||||||
| Early Adoption | Early Adoption | Early Adoption | ||||||||||
| of FVO | of FVO | of FVO | ||||||||||
| Investment securities | $ | 79,198 | $ | (1,359 | ) | $ | 77,839 | |||||
| FHLB borrowings included in other borrowed funds | (7,256 | ) | (232 | ) | (7,488 | ) | ||||||
| Pretax cumulative loss effect of early adoption of the fair value option | (1,591 | ) | ||||||||||
| Increase in deferred tax asset | 541 | |||||||||||
| Cumulative loss effect of early adoption of the fair value option (charged as a reduction to retained earnings as of January 1, 2007) | $ | (1,050 | ) | |||||||||
In September 2006, the FASB issued SFAS No. 157Fair Value Measurements(SFAS No. 157). SFAS No. 157 establishes a common definition for fair value to be applied to GAAP guidance requiring use of fair value, establishes a framework for measuring fair value, and expands disclosure about such fair value measurements. SFAS No. 157 clarifies the principle that fair value should be based on the assumptions market participants would use when pricing an asset or liability and establishes a fair value hierarchy that prioritizes the information used to
38
Table of Contents
NOTES TO CONSOLIDATED FINANCIAL STATEMENTS — (Continued)
develop those assumptions. Under the standard, fair value measurements would be separately disclosed by level within the fair value hierarchy. SFAS No. 157 is effective for fiscal years beginning after November 15, 2007. As the Corporation has elected early adoption of SFAS No. 159, it has also early adopted SFAS No. 157, as required by SFAS No. 159.
Fair value is the price that would be received to sell an asset or transfer a liability in an orderly transaction between market participants at the measurement date. To increase consistency and comparability in fair value measurements and related disclosures, the fair value hierarchy prioritizes the inputs to valuation techniques used to measure fair value into three broad levels. The fair value hierarchy gives the highest priority to quoted prices (unadjusted) in active markets for identical assets or liabilities (Level 1) and the lowest priority to unobservable inputs (Level 3). In some cases, the inputs used to measure fair value might fall in different levels of the fair value hierarchy. The level in the fair value hierarchy within which the fair value measurement in its entirety falls shall be determined based on the lowest level input that is significant to the fair value measurement in its entirety.
The adoption of SFAS No. 159 resulted in a cumulative effect adjustment, net of tax, in the amount of $1,050 as a reduction to retained earnings. Of this amount, $897 was essentially a reclassification within shareholders equity of net unrealized losses on investments from accumulated other comprehensive loss directly to retained earnings. The new standard resulted in the recognition of a net pretax gain of $460 on trading activities which were offset by $66 of losses related to changes in the fair value of borrowings measured at their fair value for the year ended December 31, 2007 in the Consolidated Statements of Income.
Level 1 instruments are those assets for which the identical item is traded on an active exchange, such as publicly-traded instruments. The majority of the fair value amounts included in current period earnings resulted from Level 2 fair value methodologies; that is, the Corporation values the assets and liabilities based on observable market data for similar instruments. The Corporation has no instruments that meet the definition of Level 3, which are unobservable inputs.
| Fair Value Measurements at | ||||||||||||||||||||||||
| December 31, 2007 Using | Changes in Fair Value for the Year Ended December 31, 2007 for Items Measured at Fair Value Pursuant to Election of the Fair Value Option | |||||||||||||||||||||||
| Quoted Prices | Significant | Total Changes in | ||||||||||||||||||||||
| in Active | Other | Fair Values | ||||||||||||||||||||||
| Fair Value | Markets for | Observable | Trading | Other | Included in | |||||||||||||||||||
| Measurements | Identical Assets | Inputs | Gains and | Gains and | Current Period | |||||||||||||||||||
Description | 12/31/2007 | (Level 1) | (Level 2) | (Losses) | (Losses) | Earnings | ||||||||||||||||||
Recurring Items | ||||||||||||||||||||||||
| Trading securities | $ | 25,064 | $ | — | $ | 25,064 | $ | 460 | $ | — | $ | 460 | ||||||||||||
| Investment securities available for sale | 213,127 | 3,984 | 209,143 | — | — | — | ||||||||||||||||||
| Mortgage loans available for sale | 2,214 | — | 2,214 | — | — | — | ||||||||||||||||||
| Other borrowed funds | 7,523 | — | 7,523 | — | (66 | ) | (66 | ) | ||||||||||||||||
Nonrecurring Items | ||||||||||||||||||||||||
| Mortgage servicing rights | 2,198 | — | 2,198 | — | (5 | ) | (5 | ) | ||||||||||||||||
| Other real estate owned | 1,376 | — | 1,376 | — | (109 | ) | (109 | ) | ||||||||||||||||
During 2007, in accordance with the provisions of SFAS No. 156, mortgage servicing rights with a carrying amount of $2,203 were written down to their fair value of $2,198, resulting in an impairment charge of $5. This adjustment was included in earnings for 2007.
During 2007, in accordance with the provisions of SFAS No. 144, other real estate owned with a carrying amount of $1,485 was written down to its fair value of $1,376, resulting in an impairment charge of $109. This adjustment was included in earnings for 2007.
39
Table of Contents
NOTES TO CONSOLIDATED FINANCIAL STATEMENTS — (Continued)
Note 4 — Trading Securities
Trading securities, at fair value, consist of the following investments at December 31, 2007:
| Trading Securities | ||||
| Government-sponsored enterprises | $ | 4,024 | ||
| States and political subdivisions | 10,324 | |||
| Corporate | 1,004 | |||
| Mortgage-backed | 9,712 | |||
Total trading securities | $ | 25,064 | ||
During 2007, the Corporation sold $47,334 of trading securities. The net gain on trading securities, which includesmark-to-market adjustments, totaled $460 in 2007, of which $246 relates to securities that were held in the Corporation’s trading portfolio as of December 31, 2007. There were no trading securities held by the Corporation in 2006 or 2005.
| Note 5 — | Investment Securities |
The amortized cost and fair value of investment securities available for sale, with gross unrealized gains and losses, are as follows as of December 31:
| 2007 | ||||||||||||||||
| Gross | Gross | |||||||||||||||
| Amortized | Unrealized | Unrealized | Fair | |||||||||||||
| Cost | Gains | Losses | Value | |||||||||||||
SecuritiesAvailable-for-Sale | ||||||||||||||||
| U.S. Government and federal agencies | $ | 3,983 | $ | 75 | $ | — | $ | 4,058 | ||||||||
| Government-sponsored enterprises | 49,631 | 556 | 6 | 50,181 | ||||||||||||
| States and political subdivisions | 130,772 | 611 | 427 | 130,956 | ||||||||||||
| Corporate | 24,300 | — | — | 24,300 | ||||||||||||
| Mortgage-backed | 3,599 | 33 | — | 3,632 | ||||||||||||
Total | $ | 212,285 | $ | 1,275 | $ | 433 | $ | 213,127 | ||||||||
| 2006 | ||||||||||||||||
| Gross | Gross | |||||||||||||||
| Amortized | Unrealized | Unrealized | Fair | |||||||||||||
| Cost | Gains | Losses | Value | |||||||||||||
SecuritiesAvailable-for-Sale | ||||||||||||||||
| U.S. Government and federal agencies | $ | 7,014 | $ | — | $ | 94 | $ | 6,920 | ||||||||
| Government-sponsored enterprises | 62,472 | 54 | 426 | 62,100 | ||||||||||||
| States and political subdivisions | 112,966 | 434 | 646 | 112,754 | ||||||||||||
| Corporate | 11,089 | 1 | 37 | 11,053 | ||||||||||||
| Mortgage-backed | 21,059 | 25 | 461 | 20,623 | ||||||||||||
Total | $ | 214,600 | $ | 514 | $ | 1,664 | $ | 213,450 | ||||||||
40
Table of Contents
NOTES TO CONSOLIDATED FINANCIAL STATEMENTS — (Continued)
The Corporation had pledged investments in the following amounts as of December 31:
| 2007 | 2006 | |||||||
| Pledged for public deposits and for other purposes necessary or required by law | $ | 26,289 | $ | 24,990 | ||||
| Pledged to secure repurchase agreements | 16,072 | 6,500 | ||||||
Total | $ | 42,361 | $ | 31,490 | ||||
The amortized cost and fair value ofavailable-for-sale securities by contractual maturity at December 31, 2007 are as follows:
Expected maturities may differ from contractual maturities because issuers have the right to call or prepay obligations.
| Available for Sale | ||||||||
| Amortized | Fair | |||||||
| Cost | Value | |||||||
| Within 1 year | $ | 19,885 | $ | 19,910 | ||||
| Over 1 year through 5 years | 45,996 | 46,534 | ||||||
| After 5 years through 10 years | 72,477 | 72,871 | ||||||
| Over 10 years | 70,328 | 70,180 | ||||||
| 208,686 | 209,495 | |||||||
| Mortgage-backed securities | 3,599 | 3,632 | ||||||
| $ | 212,285 | $ | 213,127 | |||||
Because of their variable payments, mortgage-backed securities are not reported by a specific maturity group.
A summary of the activity related to the sale ofavailable-for-sale securities during the years ended December 31 is as follows:
| 2007 | 2006 | 2005 | ||||||||||
| Proceeds from sales of securities | $ | 5,396 | $ | 15,257 | $ | 4,588 | ||||||
| Gross realized gains | $ | 12 | $ | — | $ | 9 | ||||||
| Gross realized losses | (31 | ) | (112 | ) | (7 | ) | ||||||
| Net realized (losses) gains | $ | (19 | ) | $ | (112 | ) | $ | 2 | ||||
| Applicable income tax benefit | $ | 6 | $ | 38 | $ | — | ||||||
Information pertaining to securities with gross unrealized losses at December 31 aggregated by investment category and length of time that individual securities have been in continuous loss position, follows:
| December 31, 2007 | ||||||||||||||||||||
| Less Than Twelve Months | Over Twelve Months | |||||||||||||||||||
| Gross | Gross | Total | ||||||||||||||||||
| Unrealized | Fair | Unrealized | Fair | Unrealized | ||||||||||||||||
| Losses | Value | Losses | Value | Losses | ||||||||||||||||
SecuritiesAvailable-for-Sale | ||||||||||||||||||||
| Government-sponsored enterprises | $ | 6 | $ | 994 | $ | — | $ | — | $ | 6 | ||||||||||
| States and political subdivisions | 276 | 32,309 | 151 | 17,065 | 427 | |||||||||||||||
Total securitiesavailable-for-sale | $ | 282 | $ | 33,303 | $ | 151 | $ | 17,065 | $ | 433 | ||||||||||
41
Table of Contents
NOTES TO CONSOLIDATED FINANCIAL STATEMENTS — (Continued)
| December 31, 2006 | ||||||||||||||||||||
| Less Than Twelve Months | Over Twelve Months | |||||||||||||||||||
| Gross | Gross | Total | ||||||||||||||||||
| Unrealized | Fair | Unrealized | Fair | Unrealized | ||||||||||||||||
| Losses | Value | Losses | Value | Losses | ||||||||||||||||
SecuritiesAvailable-for-Sale | ||||||||||||||||||||
| Government-sponsored enterprises | $ | — | $ | — | $ | 94 | $ | 6,920 | $ | 94 | ||||||||||
| U.S. Government and federal agency | 12 | 15,592 | 414 | 30,482 | 426 | |||||||||||||||
| States and political subdivisions | 80 | 20,688 | 566 | 40,472 | 646 | |||||||||||||||
| Corporate | 6 | 4,994 | 31 | 2,472 | 37 | |||||||||||||||
| Mortgage-backed | 3 | 1,960 | 458 | 16,431 | 461 | |||||||||||||||
Total securitiesavailable-for-sale | $ | 101 | $ | 43,234 | $ | 1,563 | $ | 96,777 | $ | 1,664 | ||||||||||
Management evaluates securities forother-than-temporary impairment at least on a quarterly basis, or more frequently when economic for market concerns warrant such evaluation. Consideration is given to (1) length of time and the extent to which the fair value has been less than cost, (2) the financial condition and near term prospects of the issuer, and (3) the intent and ability of the Corporation to retains its investments in the issuer for a period of time sufficient to allow for any anticipated recovery in fair value.
In analyzing an issuer’s financial condition, management considers whether the securities are issued by the federal government or its agencies, whether downgrades by bond rating agencies have occurred, and industry analysts’ reports. As the Corporation has the ability to hold debt securities until maturity, or for the foreseeable future, no declines are deemed to beother-than-temporary.
The unrealized losses are largely due to increases in market interest rates over the yields available at the time the underlying securities were purchased. The fair value is expected to recover as bonds approach their maturity date or repricing date, or if market yields for such securities decline. Accordingly, as of December 31, 2007 and 2006, management believes the impairments detailed above are notother-than-temporary and, as such, no impairment loss has been realized in the Corporation’s consolidated income statements.
42
Table of Contents
NOTES TO CONSOLIDATED FINANCIAL STATEMENTS — (Continued)
| Note 6 — | Loans |
The Bank grants commercial, agricultural, consumer and residential loans to customers situated primarily in Isabella, Gratiot, Mecosta, Southwestern Midland, Western Saginaw, Northern Montcalm and Southern Clare counties in mid-Michigan. The ability of the borrowers to honor their repayment obligations is often dependent upon the real estate, agricultural, and general economic conditions of this region. Substantially all of the consumer and residential mortgage loans are secured by various items of property, while commercial loans are secured primarily by real estate, business assets and personal guarantees; a portion of loans are unsecured.
A summary of the major classifications of loans is as follows:
| December 31 | ||||||||
| 2007 | 2006 | |||||||
| Mortgage loans on real estate | ||||||||
| Residential 1-4 family | $ | 227,304 | $ | 225,612 | ||||
| Commercial | 158,982 | 142,464 | ||||||
| Agricultural | 19,951 | 29,223 | ||||||
| Construction | 15,060 | 24,412 | ||||||
| Second mortgages | 36,393 | 30,815 | ||||||
| Equity lines of credit | 19,180 | 19,811 | ||||||
| Total mortgage loans | 476,870 | 472,337 | ||||||
| Commercial and agricultural loans | ||||||||
| Commercial | 79,324 | 70,237 | ||||||
| Agricultural production | 27,456 | 18,079 | ||||||
| Total commercial and agricultural loans | 106,780 | 88,316 | ||||||
| Consumer installment loans | 29,037 | 30,389 | ||||||
| Total loans | 612,687 | 591,042 | ||||||
| Less: Allowance for loan losses | 7,301 | 7,605 | ||||||
Loans, net | $ | 605,386 | $ | 583,437 | ||||
A summary of changes in the allowance for loan losses follows:
| Year Ended December 31 | ||||||||||||
| 2007 | 2006 | 2005 | ||||||||||
| Balance at beginning of year | $ | 7,605 | $ | 6,899 | $ | 6,444 | ||||||
| Allowance of acquired bank | — | 726 | — | |||||||||
| Loans charged off | (2,146 | ) | (1,149 | ) | (643 | ) | ||||||
| Recoveries | 631 | 447 | 321 | |||||||||
| Provision charged to income | 1,211 | 682 | 777 | |||||||||
Balance at end of year | $ | 7,301 | $ | 7,605 | $ | 6,899 | ||||||
The following is a summary of information pertaining to impaired loans at December 31:
| 2007 | 2006 | |||||||
| Impaired loans with a valuation allowance (equal to total impaired loans) | $ | 3,779 | $ | 3,928 | ||||
| Total impaired loans accruing interest | $ | 1,292 | $ | 1,059 | ||||
| Valuation allowance related to impaired loans | $ | 703 | $ | 594 | ||||
| Total nonaccrual loans | $ | 4,156 | $ | 3,444 | ||||
| Accruing loans past due 90 days or more | $ | 1,727 | $ | 1,185 | ||||
| Average investment in impaired loans | $ | 3,768 | $ | 3,043 | ||||
| Total restructured loans | $ | 685 | $ | 697 | ||||
43
Table of Contents
NOTES TO CONSOLIDATED FINANCIAL STATEMENTS — (Continued)
Interest income recognized on impaired loans was not significant during any of the three years ended December 31, 2007. No additional funds are committed to be advanced in connection with impaired loans.
| Note 7 — | Servicing |
Residential mortgage loans serviced for others are not included in the accompanying consolidated balance sheets. The unpaid principal balances of mortgages serviced for others was $255,839, $255,577, and $256,358 at December 31, 2007, 2006, and 2005 respectively; such loans are not included in the accompanying consolidated balance sheets. The fair value of servicing rights was determined using a discount rate of 9.2%, prepayment speeds ranging from 6.0% to 24.3%, depending upon the stratification of the specific right and a weighted average default rate of 0.0%. Servicing loans for others generally consists of collecting mortgage payments, maintaining escrow accounts, disbursing payments to investors and taxing authorities, and foreclosure processing.
The following table summarizes the changes in each year of the carrying value of mortgage servicing rights included in other assets as of December 31:
| 2007 | 2006 | 2005 | ||||||||||
| Balance at beginning of year | $ | 2,155 | $ | 2,125 | $ | 2,046 | ||||||
| Mortgage servicing rights capitalized | 2,869 | 2,655 | 2,520 | |||||||||
| Accumulated amortization | (2,785 | ) | (2,589 | ) | (2,429 | ) | ||||||
| Impairment valuation allowance | (41 | ) | (36 | ) | (12 | ) | ||||||
Balance at end of year | $ | 2,198 | $ | 2,155 | $ | 2,125 | ||||||
| Impairment increases (reductions) | $ | 5 | $ | 24 | $ | (10 | ) | |||||
| Note 8 — | Premises and Equipment |
A summary of premises and equipment at December 31 follows:
| 2007 | 2006 | |||||||
| Land | $ | 3,997 | $ | 3,089 | ||||
| Buildings and improvements | 16,067 | 15,235 | ||||||
| Furniture and equipment | 23,226 | 21,501 | ||||||
| Total | 43,290 | 39,825 | ||||||
| Less: Accumulated depreciation | 20,774 | 19,071 | ||||||
Premises and equipment, net | $ | 22,516 | $ | 20,754 | ||||
Depreciation expense amounted to $1,960, $1,852 and $1,735 in 2007, 2006, and 2005, respectively.
| Note 9 — | Goodwill and other Intangible Assets |
The change in the carrying amount of goodwill for the year is as follows:
| 2007 | 2006 | |||||||
| Balance January 1 | $ | 25,889 | $ | 3,136 | ||||
| Goodwill assigned to Farwell acquisition | — | 22,263 | ||||||
| Other acquisitions | — | 490 | ||||||
Balance at December 31 | $ | 25,889 | $ | 25,889 | ||||
44
Table of Contents
NOTES TO CONSOLIDATED FINANCIAL STATEMENTS — (Continued)
Acquired intangible assets at year end were as follows:
| 2007 | ||||||||||||
| Gross | Net | |||||||||||
| Intangible | Accumulated | Intangible | ||||||||||
| Assets | Amortization | Assets | ||||||||||
| Amortizable intangible assets: | ||||||||||||
| Core deposit premium resulting from the Farwell acquisition in 2006 | $ | 1,442 | $ | 321 | $ | 1,121 | ||||||
| Core deposit premium resulting from previous acquisitions | 2,451 | 2,451 | — | |||||||||
Total | $ | 3,893 | $ | 2,772 | $ | 1,121 | ||||||
| 2006 | ||||||||||||
| Gross | Net | |||||||||||
| Intangible | Accumulated | Intangible | ||||||||||
| Assets | Amortization | Assets | ||||||||||
| Amortizable intangible assets: | ||||||||||||
| Core deposit premium resulting from the Farwell acquisition in 2006 | $ | 1,442 | $ | 66 | $ | 1,376 | ||||||
| Core deposit premium resulting from previous acquisitions | 2,451 | 2,428 | 23 | |||||||||
Total | $ | 3,893 | $ | 2,494 | $ | 1,399 | ||||||
Amortization expense associated with identified intangible assets was $278, $160, and $94 in 2007, 2006, and 2005, respectively.
Estimated amortization expense associated with identifiable intangibles for each of the next five years is as follows:
Year | Amount | |||
| 2008 | $ | 229 | ||
| 2009 | 203 | |||
| 2010 | 177 | |||
| 2011 | 151 | |||
| 2012 | 125 | |||
| Thereafter | 236 | |||
| $ | 1,121 | |||
| NOTE 10 — | DEPOSITS |
Scheduled maturities of time deposits for the years succeeding December 31, 2007 are as follows:
Year | Amount | |||
| 2008 | $ | 227,465 | ||
| 2009 | 34,062 | |||
| 2010 | 42,835 | |||
| 2011 | 23,067 | |||
| 2012 | 18,853 | |||
| Thereafter | 137 | |||
| $ | 346,419 | |||
45
Table of Contents
NOTES TO CONSOLIDATED FINANCIAL STATEMENTS — (Continued)
Interest expense on time deposits greater than $100 was $6,649 in 2007, $5,195 in 2006, and $2,751 in 2005.
| Note 11 — | Borrowed Funds |
Borrowed funds consist of the following obligations at December 31:
| 2007 | 2006 | |||||||
| Federal Home Loan Bank advances | $ | 66,023 | $ | 50,756 | ||||
| Federal Funds purchased | 15,883 | 6,765 | ||||||
| Securities sold under agreements to repurchase without stated maturity dates | 981 | 724 | ||||||
| Securities sold under agreements to repurchase with stated maturity dates | 10,000 | — | ||||||
| Unsecured note payable | — | 58 | ||||||
| $ | 92,887 | $ | 58,303 | |||||
The Federal Home Loan Bank borrowings are collateralized by a blanket lien on all qualified 1-to-4 family whole mortgage loans and U.S. government and federal agency securities. Advances are also secured by FHLB stock owned by the Bank.
The maturity and weighted average interest rates of FHLB advances are as follows at December 31:
| 2007 | 2006 | |||||||||||||||
| Amount | Rate | Amount | Rate | |||||||||||||
| Fixed rate advances due 2007 | $ | — | — | $ | 16,000 | 4.79 | % | |||||||||
| Fixed rate advances due 2008 | 6,131 | 4.79 | % | 6,000 | 4.79 | % | ||||||||||
| Fixed rate advances due 2009 | 11,500 | 4.95 | % | 8,500 | 4.88 | % | ||||||||||
| Fixed rate advances due 2010 | 18,392 | 5.08 | % | 5,256 | 5.17 | % | ||||||||||
| One year putable advance due 2010 | 3,000 | 4.98 | % | 3,000 | 4.98 | % | ||||||||||
| One year putable advances due 2012 | 15,000 | 4.10 | % | — | — | |||||||||||
| Fixed rate advances due 2012 | 2,000 | 4.90 | % | 2,000 | 4.90 | % | ||||||||||
| Fixed rate advances due 2015 | 10,000 | 4.84 | % | 10,000 | 4.84 | % | ||||||||||
| $ | 66,023 | 4.76 | % | $ | 50,756 | 4.87 | % | |||||||||
Securities sold under agreements to repurchase are classified as secured borrowings. Securities sold under agreements to repurchase without stated maturity dates generally mature within one to four days from the transaction date. Securities sold under agreements to repurchase are reflected at the amount of cash received in connection with the transaction. The U.S. government agency securities underlying the agreements have a carrying value and a fair value of $16,072 and $6,500 at December 31, 2007 and 2006, respectively. Such securities remain under the control of the Corporation. The Corporation may be required to pledge additional collateral based on the fair value of the underlying securities.
The maturity and weighted average interest rates of securities sold under agreements to repurchase with stated maturity dates are as follows at December 31, 2007:
| Amount | Rate | |||||||
| Repurchase agreements due 2010 | $ | 5,000 | 4.00 | % | ||||
| Repurchase agreements due 2013 | 5,000 | 4.51 | % | |||||
| $ | 10,000 | 4.26 | % | |||||
The Corporation had no securities sold under agreements to repurchase with stated maturity dates in 2006.
46
Table of Contents
NOTES TO CONSOLIDATED FINANCIAL STATEMENTS — (Continued)
| Note 12 — | Other Non-Interest Expenses |
A summary of expenses included in Other Noninterest Expenses are as follows for the year ended December 31:
| 2007 | 2006 | 2005 | ||||||||||
| Director fees | $ | 796 | $ | 584 | $ | 604 | ||||||
| Marketing and advertising | 642 | 697 | 624 | |||||||||
| Audit and SOX compliance fees | 583 | 1,010 | 606 | |||||||||
| Other, not individually significant | 4,527 | 3,715 | 3,292 | |||||||||
| $ | 6,548 | $ | 6,006 | $ | 5,126 | |||||||
| Note 13 — | Federal Income Taxes |
Components of the consolidated provision for income taxes are as follows for the year ended December 31:
| 2007 | 2006 | 2005 | ||||||||||
| Currently payable | $ | 1,304 | $ | 1,645 | $ | 1,685 | ||||||
| Deferred | 301 | 274 | 263 | |||||||||
Federal income taxes | $ | 1,605 | $ | 1,919 | $ | 1,948 | ||||||
The reconciliation of the provision for federal income taxes and the amount computed at the federal statutory tax rate of 34% of income before federal income taxes is as follows for the year ended December 31:
| 2007 | 2006 | 2005 | ||||||||||
| Income taxes at 34% statutory rate | $ | 3,242 | $ | 3,033 | $ | 2,966 | ||||||
| Effect of nontaxble income | (1,782 | ) | (1,239 | ) | (1,100 | ) | ||||||
| Effect of nondeductible expenses | 145 | 125 | 82 | |||||||||
Federal income taxes | $ | 1,605 | $ | 1,919 | $ | 1,948 | ||||||
47
Table of Contents
NOTES TO CONSOLIDATED FINANCIAL STATEMENTS — (Continued)
Deferred income taxes reflect the net tax effects of temporary differences between the carrying amounts of assets and liabilities for financial reporting purposes and the amounts used for income tax purposes. Significant components of the Corporation’s deferred tax assets and liabilities, included in other assets, are as follows as of December 31:
| 2007 | 2006 | |||||||
Deferred tax assets | ||||||||
| Allowance for loan losses | $ | 1,658 | $ | 1,728 | ||||
| Deferred directors’ fees | 1,803 | 1,359 | ||||||
| Employee benefit plans | 33 | 307 | ||||||
| Core deposit premium and acquisition expenses | 116 | — | ||||||
| Net unrealizd losses on trading securities | 119 | — | ||||||
| Net unrecognized actuarial loss on pension plan | 424 | 1,405 | ||||||
| Net unrealized loss on available-for-sale securities | — | 392 | ||||||
| Other | 209 | 78 | ||||||
Total deferred tax assets | 4,362 | 5,269 | ||||||
Deferred tax liabilities | ||||||||
| Prepaid pension asset | 899 | 794 | ||||||
| Premises and equipment | 606 | 638 | ||||||
| Accretion on securities | 47 | 66 | ||||||
| Core deposit premium and acquisition expenses | 315 | 157 | ||||||
| Net unrealized gains on available-for-sale securities | 286 | — | ||||||
| Other | 194 | 178 | ||||||
Total deferred tax liabilities | 2,347 | 1,833 | ||||||
Net deferred tax assets | $ | 2,015 | $ | 3,436 | ||||
In July 2006, the Financial Accounting Standards Board (FASB) issued Interpretation No. 48,Accounting for Uncertainty in Income Taxes(FIN No. 48), an interpretation of Statement of Financial Accounting Standards (SFAS) No. 109,Accounting for Income Taxes. FIN No. 48 seeks to reduce the significant diversity in practice associated with financial statement recognition and measurement in accounting for income taxes and prescribes a recognition threshold and measurement attribute for disclosure of tax positions taken or expected to be taken on an income tax return, in order for those tax provisions to be recognized in the Corporation’s financial statements. During 2007, the Corporation adopted the provisions of FIN No. 48. The adoption had no effect on the Corporation’s financial statements.
The Corporation and its subsidiaries are subject to U.S. federal income tax. The Corporation is no longer subject to examination by taxing authorities for years before 2004. The Corporation does not expect the total amount of unrecognized tax benefits to significantly increase in the next twelve months.
The Corporation recognizes interestand/or penalties related to income tax matters in income tax expense. The Corporation does not have any amounts accrued for interest and penalties at December 31, 2007 and is not aware of any claims for such amounts by federal income tax authorities.
| Note 14 — | Off-Balance-Sheet Activities |
Credit-Related Financial Instruments
The Corporation is party to credit related financial instruments with off-balance-sheet risk. These financial instruments are entered into in the normal course of business to meet the financing needs of its customers. These
48
Table of Contents
NOTES TO CONSOLIDATED FINANCIAL STATEMENTS — (Continued)
financial instruments, which include commitments to extend credit and standby letters of credit, involve, to varying degrees, elements of credit and interest rate risk in excess of the amounts recognized in the consolidated balance sheets. The contract or notional amounts of these instruments reflect the extent of involvement the Corporation has in a particular class of financial instrument.
| Contract Amount | ||||||||
| 2007 | 2006 | |||||||
| Unfunded commitments under lines of credit | $ | 87,969 | $ | 85,077 | ||||
| Commercial and standby letters of credit | 4,405 | 4,079 | ||||||
The Corporation’s exposure to credit-related loss in the event of nonperformance by the counter parties to the financial instruments for commitments to extend credit and standby letters of credit is represented by the contractual notional amount of those instruments. The Corporation uses the same credit policies in deciding to make these commitments as it does for extending loans to customers.
Standby letters of credit are conditional commitments issued by the Corporation to guarantee the performance of a customer to a third party. Those guarantees are primarily issued to support private borrowing arrangements, including commercial paper, bond financing, and similar transactions.
The Corporation considers standby letters of credit to be guarantees. These commitments to extend credit and letters of credit mature within one year. The credit risk involved in these transactions is essentially the same as that involved in extending loans to customers. The Corporation evaluates each customer’s credit worthiness on acase-by-case basis. The amount of collateral obtained, if deemed necessary by the Corporation upon the extension of credit, is based on management’s credit evaluation of the borrower. Collateral held varies but may include accounts receivable, inventory, property, plant and equipment, and other income producing assets. Guarantees that are not derivative contracts have been recorded on the Corporation’s consolidated balance sheet at their fair values at inception.
| Note 15 — | On-Balance Sheet Activities |
Derivative Loan Commitments
Mortgage loan commitments are referred to as derivative loan commitments if the loan that will result from exercise of the commitment will be held for sale upon funding. The Corporation enters into commitments to fund residential mortgage loans at specific times in the future, with the intention that these loans will subsequently be sold in the secondary market. A mortgage loan commitment binds the Corporation to lend funds to a potential borrower at a specified interest rate within a specified period of time, generally up to 60 days after inception of the rate lock.
Outstanding derivative loan commitments expose the Corporation to the risk that the price of the loans arising from the exercise of the loan commitment might decline from the inception of the rate lock to funding of the loan due to increases in mortgage interest rates. If interest rates increase, the value of these loan commitments decreases. Conversely, if interest rates decrease, the value of these loan commitments increases. The notional amount of undesignated interest rate lock commitments was $311 and $532 at December 31, 2007 and 2006, respectively.
Forward Loan Sale Commitments
To protect against the price risk inherent in derivative loan commitments, the Corporation utilized both “mandatory delivery” and “best efforts” forward loan sale commitments to mitigate the risk of potential decreases in the values of loan that would result from the exercise of the derivative loan commitments.
With a “mandatory delivery” contract, the Corporation commits to deliver a certain principal amount of mortgage loans to an investor at a specified price on or before a specified date. If the Corporation fails to deliver the amount of mortgages necessary to fulfill the commitment by the specified date, it is obligated to pay a “pair-off” fee, based on then current market prices, to the investor to compensate the investor for the shortfall.
49
Table of Contents
NOTES TO CONSOLIDATED FINANCIAL STATEMENTS — (Continued)
With a “best efforts” contract, the Corporation commits to deliver an individual mortgage loan of a specified principal amount and quality to an investor if the loan to the underlying borrower closes. Generally, the price the investor will pay the seller for an individual loan is specified prior to the loan being funded (e.g. on the same day the lender commits to lend funds to a potential borrower).
The Corporation expects that these forward loan sale commitments will experience changes in fair value opposite to change in fair value of derivate loan commitments. The notional amount of undesignated forward loan sale commitments was $2,525 and $3,266 at December 31, 2007 and 2006, respectively.
The fair values of the rate lock loan commitments related to the origination of mortgage loans that will be held for sale and the forward loan sale commitments are deemed insignificant by management and, accordingly, are not recorded in the accompanying consolidated financial statements.
| Note 16 — | Commitments and other Matters |
Banking regulations require banks to maintain cash reserve balances in currency or as deposits with the Federal Reserve Bank. At December 31, 2007 and 2006, the reserve balances amounted to $370 and $979, respectively.
Isabella Bank and Trust sponsors the IBT Foundation (the “Foundation”), which is a nonprofit entity formed for the purpose of distributing charitable donations to recipient organizations generally located in the communities serviced by Isabella Bank and Trust. The Bank periodically makes charitable contributions in the form of cash transfers to the Foundation. The Foundation is administered by members of the Isabella Bank and Trust Board of Directors. The assets and transactions of the Foundation are not included in the consolidated financial statements of IBT Bancorp, Inc. No donations were made to the Foundation by Isabella Bank and Trust during the years ended December 31, 2007, 2006 and 2005. The assets of the Foundation as of December 31, 2007 and 2006 were $1,069 and $1,318, respectively.
Banking regulations limit the transfer of assets in the form of dividends, loans, or advances from the Bank to the Corporation. At December 31, 2007, substantially all of the Bank’s assets were restricted from transfer to the Corporation in the form of loans or advances. Consequently, bank dividends are the principal source of funds for the Corporation. Payment of dividends without regulatory approval is limited to the current years retained net income plus retained net income for the preceding two years, less any required transfers to capital surplus. At January 1, 2007, the amount available for dividends without regulatory approval was approximately $7,192.
The Bank has obtained approval to borrow up to $100,000 from the Federal Home Loan Bank (FHLB) of Indianapolis. Under the terms of the agreement, the Bank may obtain advances at the stated rate at the time of the borrowings. The Bank has agreed to pledge eligible mortgage loans and U.S. Treasury and governmental agencies as collateral for any such borrowings. The Corporation also has a $10,000 line of credit with LaSalle Bank that the Corporation has agreed to pledge stock for any advances.
| Note 17 — | Minimum Regulatory Capital Requirements |
The Corporation (on a consolidated basis) and the Bank are subject to various regulatory capital requirements administered by the Federal Reserve Bank and the Federal Deposit Insurance Corporation (The Regulators). Failure to meet minimum capital requirements can initiate mandatory and possibly additional discretionary actions by The Regulators that if undertaken, could have a material effect on the Corporation’s and Bank’s financial statements. Under The Regulators’ capital adequacy guidelines and the regulatory framework for prompt corrective action, the Corporation and the Bank must meet specific capital guidelines that include quantitative measures of their assets, liabilities, capital, and certain off-balance-sheet items, as calculated under regulatory accounting standards. The Bank’s capital amounts and classifications are also subject to qualitative judgments by The Regulators about components, risk weightings, and other factors. Prompt corrective action provisions are not applicable to bank holding companies.
Quantitative measures established by regulation to ensure capital adequacy require the Corporation and the Bank to maintain minimum amounts and ratios (set forth in the following table) of total and Tier 1 capital (as
50
Table of Contents
NOTES TO CONSOLIDATED FINANCIAL STATEMENTS — (Continued)
defined in the regulations) to risk-weighted assets (as defined) and Tier 1 capital to average assets (as defined). Management believes, as of December 31, 2007 and 2006, that the Corporation and the Bank meet all capital adequacy requirements to which they are subject.
As of December 31, 2007, the most recent notifications from The Regulators categorized the Bank as well capitalized under the regulatory framework for prompt corrective action. To be categorized as well capitalized, an institution must maintain total risk-based, Tier 1 risk-based, and Tier 1 leverage ratios as set forth in the following tables. There are no conditions or events since the notifications that management believes has changed the Bank’s categories. The Corporation’s and each Bank’s actual capital amounts (in thousands) and ratios are also presented in the table.
| Minimum to be | ||||||||||||||||||||||||
| Well Capitalized | ||||||||||||||||||||||||
| Minimum | Under Prompt | |||||||||||||||||||||||
| Capital | Corrective Action | |||||||||||||||||||||||
| Actual | Requirement | Provisions | ||||||||||||||||||||||
| Amount | Ratio | Amount | Ratio | Amount | Ratio | |||||||||||||||||||
December 31, 2007 | ||||||||||||||||||||||||
| Total capital to risk weighted assets | ||||||||||||||||||||||||
| Isabella Bank & Trust | $ | 75,769 | 12.7 | % | $ | 47,705 | 8.0 | % | $ | 59,632 | 10.0 | % | ||||||||||||
| Consolidated | 103,436 | 17.0 | 48,636 | 8.0 | N/A | N/A | ||||||||||||||||||
| Tier 1 capital to risk weighted assets | ||||||||||||||||||||||||
| Isabella Bank & Trust | 68,468 | 11.5 | 23,853 | 4.0 | 35,779 | 6.0 | ||||||||||||||||||
| Consolidated | 96,135 | 15.8 | 24,318 | 4.0 | N/A | N/A | ||||||||||||||||||
| Tier 1 capital to average assets | ||||||||||||||||||||||||
| Isabella Bank & Trust | 68,468 | 7.7 | 35,723 | 4.0 | 44,654 | 5.0 | ||||||||||||||||||
| Consolidated | 96,135 | 10.7 | 35,936 | 4.0 | N/A | N/A | ||||||||||||||||||
December 31, 2006 | ||||||||||||||||||||||||
| Total capital to risk weighted assets | ||||||||||||||||||||||||
| Isabella Bank & Trust | $ | 51,484 | 12.2 | % | $ | 33,748 | 8.0 | % | $ | 42,185 | 10.0 | % | ||||||||||||
| FSB Bank | 30,660 | 20.4 | 12,025 | 8.0 | 15,032 | 10.0 | ||||||||||||||||||
| Consolidated | 96,792 | 16.6 | 46,552 | 8.0 | N/A | N/A | ||||||||||||||||||
| Tier 1 capital to risk weighted assets | ||||||||||||||||||||||||
| Isabella Bank & Trust | 46,917 | 11.1 | 16,874 | 4.0 | 25,311 | 6.0 | ||||||||||||||||||
| FSB Bank | 28,767 | 19.1 | 6,013 | 4.0 | 9,019 | 6.0 | ||||||||||||||||||
| Consolidated | 89,514 | 15.4 | 23,276 | 4.0 | N/A | N/A | ||||||||||||||||||
| Tier 1 capital to average assets | ||||||||||||||||||||||||
| Isabella Bank & Trust | 46,917 | 7.5 | 25,146 | 4.0 | 31,432 | 5.0 | ||||||||||||||||||
| FSB Bank | 28,767 | 12.3 | 9,337 | 4.0 | 11,672 | 5.0 | ||||||||||||||||||
| Consolidated | 89,514 | 11.6 | 30,926 | 4.0 | N/A | N/A | ||||||||||||||||||
| Note 18 — | Benefit Plans |
Defined Benefit Pension Plan
The Corporation has a non-contributory defined benefit pension plan covering substantially all of its employees. In December 2006, the Board of Directors voted to curtail the defined benefit plan effective March 1, 2007. The effect of the curtailment, which was recognized in the first quarter of 2007, suspended the current participant’s accrued benefits as of March 1, 2007 and limited participation in the plan to eligible employees as of December 31, 2006. As a result of the curtailment, the Corporation changed its method of accounting for the plan to be in accordance with SFAS No. 88Employers’ Accounting for Settlements and Curtailments of Defined Benefit
51
Table of Contents
NOTES TO CONSOLIDATED FINANCIAL STATEMENTS — (Continued)
Pension Plans and for Termination Benefits. Due to the curtailment, future salary increases will not be considered and the benefits are based on years of service and the employees’ five highest consecutive years of compensation out of the last ten years of service through March 1, 2007. As a result of the curtailment, the Corporation does not anticipate contributing to the plan in the future.
The curtailment resulted in a reduction of $2,939 in the projected benefit obligation, which served to reduce unrecognized net actuarial loss of $2,939, a component of accumulated other comprehensive loss.
Subsequent to the decision to curtail the defined benefit plan, the Corporation decided to increase the contributions to the Corporation’s 401(k) plan effective January 1, 2007 (see “Other Employee Benefit Plans”)
Changes in the projected benefit obligation and plan assets during each year, the funded status of the plan, and the amount recognized on the Corporation’s consolidated balance sheets using an actuarial measurement date of December 31, are summarized as follows during the years ended December 31:
| 2007 | 2006 | |||||||
| Change in benefit obligation | ||||||||
| Benefit obligation, January 1 | $ | 10,996 | $ | 9,557 | ||||
| Service cost | 109 | 593 | ||||||
| Interest cost | 489 | 607 | ||||||
| Actuarial loss | 51 | 724 | ||||||
| Benefits paid, including plan expenses | (500 | ) | (485 | ) | ||||
| Plan curtailment | (2,939 | ) | — | |||||
Benefit obligation, December 31 | 8,206 | 10,996 | ||||||
| Change in plan assets | ||||||||
| Fair value of plan assets, January 1 | 9,199 | 7,609 | ||||||
| Investment return | 558 | 947 | ||||||
| Corporation contribution | 350 | 1,128 | ||||||
| Benefits paid, including plan expenses | (500 | ) | (485 | ) | ||||
Fair value of plan assets, December 31 | 9,607 | 9,199 | ||||||
Funded status (deficiency) at December 31 | $ | 1,401 | $ | (1,797 | ) | |||
| 2007 | 2006 | |||||||
| Change in prepaid (accrued) pension benefit costs | ||||||||
| Prepaid (accrued) benefit cost at January 1 | $ | (1,797 | ) | $ | 2,148 | |||
| Contributions to the plan | 350 | 1,128 | ||||||
| Net periodic benefit cost for the year | (2 | ) | (939 | ) | ||||
| Plan curtailment loss | (40 | ) | — | |||||
| Net change in unrecognized actuarial loss and prior service cost | 2,890 | (4,134 | ) | |||||
Prepaid (accrued) pension benefit cost at December 31 | $ | 1,401 | $ | (1,797 | ) | |||
During 2006, the Corporation adopted the provisions of Statement of Financial Accounting Standards No. 158,Employers’ Accounting for Defined Benefit Pension and Other Postretirement Plans(“SFAS No. 158”) and in accordance therewith reflected the under funded status of the plan in its consolidated balance sheet at December 31, 2006. Prospectively, the Corporation will adjust the liability to reflect the current funded status of the plan. Any gains or losses that arise during the period but are not recognized as components of net periodic benefit cost will be recognized as a component of other comprehensive income (loss).
52
Table of Contents
NOTES TO CONSOLIDATED FINANCIAL STATEMENTS — (Continued)
The adoption of SFAS No. 158 had no effect on the Corporation’s consolidated statement of operations for the year ended December 31, 2006, and it will not affect the Corporation’s operating results in future periods.
The incremental effects of applying FASB Statement No. 158 on individual line items in the consolidated statement of financial position as of the December 31, 2006 implementation date are as follows:
| Before | SFAS No. 158 | After | ||||||||||
| Application of | Application | Application of | ||||||||||
| SFAS No. 158 | Adjustments | SFAS No. 158 | ||||||||||
| (Prepaid) accrued liability for pension benefits | $ | (2,337 | ) | $ | 4,134 | $ | 1,797 | |||||
| Deferred income tax assets | 2,030 | 1,406 | 3,436 | |||||||||
| Total liabilities | 792,581 | 1,797 | 794,378 | |||||||||
| Accumulated other comprehensive loss | (759 | ) | (2,728 | ) | (3,487 | ) | ||||||
| Total shareholders’ equity | 118,477 | (2,728 | ) | 115,749 | ||||||||
Amounts recognized in accumulated other comprehensive loss consist of:
| December 31 | ||||||||||||
| 2007 | 2006 | 2005 | ||||||||||
| Reduction of unrecognized pension cost, primarily as a result of plan curtailment | $ | 2,890 | $ | — | $ | — | ||||||
| Tax effect | (983 | ) | — | — | ||||||||
| Net of tax amount | 1,907 | — | — | |||||||||
| Additional minimum pension liability | — | — | (1,839 | ) | ||||||||
| Tax effect | — | — | 625 | |||||||||
| Net of tax amount | — | — | (1,214 | ) | ||||||||
| Adjustment to initially apply FASB Statement No. 158 | — | (4,134 | ) | — | ||||||||
| Tax effect | — | 1,406 | — | |||||||||
| Net of tax amount | — | (2,728 | ) | — | ||||||||
Total | $ | 1,907 | $ | (2,728 | ) | $ | (1,214 | ) | ||||
The accumulated benefit obligation was $8,206 and $8,072 at December 31, 2007 and 2006, respectively. The $4,134 adjustment to initially apply SFAS No. 158 in 2006 consisted primarily of previously unrecognized net actuarial losses.
An adjustment to the additional minimum pension liability in the amount of $1,839 was recorded as of December 31, 2005, which resulted in a reduction to other comprehensive loss.
53
Table of Contents
NOTES TO CONSOLIDATED FINANCIAL STATEMENTS — (Continued)
The components of net periodic benefit cost and other pension related amounts recognized in other comprehensive income (loss) are as follows for the years ended December 31:
| 2007 | 2006 | 2005 | ||||||||||
Net periodic benefit cost | ||||||||||||
| Service cost on benefits earned for services rendered during the year | $ | 109 | $ | 637 | $ | 558 | ||||||
| Interest cost on projected benefit obligation | 489 | 607 | 540 | |||||||||
| Expected return on plan assets | (628 | ) | (555 | ) | (463 | ) | ||||||
| Amortization of unrecognized prior service cost | — | 18 | 18 | |||||||||
| Amortization of unrecognized actuarial net loss | 32 | 232 | 201 | |||||||||
Net periodic benefit cost | $ | 2 | $ | 939 | $ | 854 | ||||||
Other changes in plan assets and benefit obligations recognized in other comprehensive income (loss) | ||||||||||||
| Net reduction of unrecognized pension cost as a result of plan curtailment, net of tax | $ | 1,907 | $ | — | $ | — | ||||||
| Adjustment to record the additional minimum pension liability, net of tax | — | — | 1,214 | |||||||||
Total recognized in other comprehensive income | $ | 1,907 | $ | — | $ | 1,214 | ||||||
Accumulated other comprehensive loss at December 31, 2007 includes net actuarial losses of $1,244, of which $18 is expected to be amortized during the year ending December 31, 2008.
Actuarial assumptions used in determining the projected benefit obligation are as follows for the year ended December 31:
| 2007 | 2006 | 2005 | ||||||||||
| Weighted average discount rate | 6.44 | % | 6.00 | % | 6.25 | % | ||||||
| Rate of increase in future compensation | N/A | 4.50 | % | 4.50 | % | |||||||
| Expected long-term rate of return | 7.00 | % | 7.50 | % | 7.50 | % | ||||||
The actual weighted average assumptions used in determining the net periodic pension costs are as follows for the year ended December 31:
| 2007 | 2006 | 2005 | ||||||||||
| Discount rate | 6.44 | % | 6.00 | % | 6.25 | % | ||||||
| Rate of compensation increase | N/A | 4.50 | % | 4.50 | % | |||||||
| Expected long-term return on plan assets | 7.00 | % | 7.00 | % | 7.50 | % | ||||||
The expected long term rate of return is an estimate of anticipated future long term rates of return on the Corporation’s plan assets as measured on a market value basis. Factors considered in arriving at this assumption include:
| • | Historical longer term rates of return for broad asset classes. | |
| • | Actual past rates of return achieved by the plan. | |
| • | The general mix of assets held by the plan. | |
| • | The stated investment policy for the plan. |
The selected rate of return is net of anticipated investment related expenses.
54
Table of Contents
NOTES TO CONSOLIDATED FINANCIAL STATEMENTS — (Continued)
The Corporation’s actual pension plan weighted-average asset allocations by asset category are as follows at December 31:
Asset Category | 2007 | 2006 | ||||||
| Money market | 4.0 | % | 100.0 | % | ||||
| Equity securities | 38.0 | % | — | |||||
| Debt securities | 58.0 | % | — | |||||
| Total | 100.00 | % | 100.00 | % | ||||
As of December 31, 2007, the plan held $371 (4.0% of total plan assets) of funds in a money market account with Isabella Bank and Trust. The remaining funds are invested in two mutual funds managed by its investment advisors. These funds had $3,695 in equity investments and $5,541 in debt securities as of December 31, 2007.
As a result of the Corporation changing investment advisors as of year end 2006, all of the plan’s assets were invested in money market accounts as of December 31, 2006. These funds were substantially re-invested by January 15, 2007.
The Corporation’s investment policy for the benefit plan includes asset holdings in publicly traded equities, U.S. Government agency obligations and investment grade corporate and municipal bonds. The policy restricts equity investment to less than 20% of equity investments in any sector and to less than 4% of plans assets in any one company.
The asset mix, the sector weighting of equity investments, and debt issues to hold are based on a third party investment advisor retained by the Corporation to manage the plan. The Corporation reviews the performance of the advisor no less than annually.
The Corporation does not expect to make contributions to the pension plan in 2008.
Estimated future benefit payments, which reflect expected future service, as appropriate, are as follows for the next ten years:
Year | Amount | |||
| 2008 | $ | 346 | ||
| 2009 | 350 | |||
| 2010 | 374 | |||
| 2011 | 392 | |||
| 2012 | 444 | |||
| Years 2013 – 2017 (total) | 3,165 | |||
Other Employee Benefit Plans
The Corporation maintains a nonqualified supplementary employee retirement plan (SERP) for qualified officers to provide supplemental retirement benefits to each participant. Expenses related to this program for 2007, 2006, and 2005 were $202, $97, and $85, respectively, and are being recognized over the participants’ expected years of service. As a result of curtailing IBT Bancorp’s defined benefit plan in March 2007, the Corporation established an additional SERP to maintain the benefit levels for all employees that were at least forty years old and had at least 15 years of service. The cost to provide this benefit was $120 for 2007.
The Corporation maintains a non-leveraged employee stock ownership plan (ESOP) and a profit sharing plan which cover substantially all of its employees. Contributions to the plans are discretionary and are approved by the Board of Directors and recorded as compensation expense. Expenses related to the plans for 2007, 2006, and 2005 was $115, $13, and $11, respectively. Total allocated shares outstanding related to the ESOP at December 31, 2007, 2006, and 2005 were 149,154 , 161,762, and 159,987, respectively, were included in the computation of dividends
55
Table of Contents
NOTES TO CONSOLIDATED FINANCIAL STATEMENTS — (Continued)
and earnings per share in each of the respective years and have not been adjusted for the 10% stock dividend paid February 29, 2008.
The Corporation maintains a self-funded medical plan under which the Corporation is responsible for the first $50 per year of claims made by a covered family. Medical claims are subject to a lifetime maximum of $5,000 per covered individual. Expenses are accrued based on estimates of the aggregate liability for claims incurred and the Corporation’s experience. Expenses were $1,804 in 2007, $1,316 in 2006 and $1,650 in 2005.
The Corporation offers dividend reinvestment, and employee and director stock purchase plans. The dividend reinvestment plan allows shareholders to purchase previously unissued IBT Bancorp common shares. The stock purchase plan allows employees and directors to purchase IBT Bancorp common stock through payroll deduction. The number of shares reserved for issuance under these plans are 280,000, with 38,850 shares unissued at December 31, 2007, as adjusted for the 10% stock dividend paid February 29, 2008. During 2007, 2006 and 2005, 63,233 shares were issued for $2,657, 61,258 shares were issued for $2,459, and 58,019 shares were issued for $2,180, respectively, in cash pursuant to these plans, exclusive of the effects of the 10% stock dividend paid February 29, 2008.
401(k) Plan
The Corporation has a 401(k) plan in which substantially all employees are eligible to participate. Employees may contribute up to 100% of their compensation subject to certain limits based on federal tax laws. The Corporation began making matching contributions equal to 25% of the first 3% of an employee’s compensation contributed to the plan in 2005. Employees are 0% vested through their first two years of employment and are 100% vested after 6 years of service.
As a result of the curtailment of the defined benefit plan noted above, the Corporation decided to increase the contributions to the Corporation’s 401(k) plan effective January 1, 2007. The enhancement includes an automatic 3.0% contribution for all eligible employees and matching contributions equal to 50% of the first 4.0% of an employee’s compensation contributed to the Plan during the year. For the year ended December 31, 2007 and 2006, expenses attributable to the Plan were $439 and $47, respectively.
The Corporation’s 401(k) plan was amended in November 2007. Pursuant to this amendment, the Corporation combined its ESOP and 401(k) plans. As of December 31, 2007, the ESOP funds are in the process of being transferred into the 401(k) plan. This transfer will be complete on April 1, 2008.
Equity Compensation Plan
Pursuant to the terms of the Deferred Director fee plan, directors of the Corporation and its subsidiaries are required to defer at least 25% of their earned board fees. Deferred fees are converted on a quarterly basis into stock units of the Corporation’s common stock. The fees are converted to stock units based on the purchase price for a share of common stock under the Corporation’s Dividend Reinvestment Plan. Stock units credited to a participant’s account are eligible for stock and cash dividends as declared. Upon retirement from the board, a participant is eligible to receive one share of common stock for each one stock unit. The Plan as modified does not allow for cash settlement, and therefore such share-based payment awards qualify for classification as equity. All authorized but unissued shares of common stock are eligible for issuance under this Plan. As of 2007 and 2006, respectively, 198,939 and 188,116 shares were to be issued under the plan, as adjusted for the 10% stock dividend paid on February 29, 2008 pursuant to an existing antidilution provision required by the plan.
| Note 19 — | Comprehensive Income (Loss) |
Comprehensive income (loss) includes net income (loss) as well as unrealized gains and losses, net of tax, on available-for-sale investment securities owned and changes (beginning in 2007) in the funded status of the Corporation’s defined benefit pension plan, which are excluded from net income. Unrealized investment securities gains and losses and changes in the funded status of the pension plan, net of tax, are excluded from net income, and
56
Table of Contents
NOTES TO CONSOLIDATED FINANCIAL STATEMENTS — (Continued)
are reflected as a direct charge or credit to shareholders’ equity. Comprehensive income (loss) and the related components are disclosed in the accompanying consolidated statements of comprehensive income for each of the years ended December 31, 2007, 2006, and 2005.
The following is a summary of the components compromising the balance of accumulated other comprehensive loss reported on the consolidated balance sheets as of December 31 (presented net of tax):
| 2007 | 2006 | |||||||
| Unrealized gains (losses) on available-for-sale investment securities | $ | 555 | $ | (759 | ) | |||
| Unrecognized pension costs | (821 | ) | (2,728 | ) | ||||
Accumulated other comprehensive loss | $ | (266 | ) | $ | (3,487 | ) | ||
| Note 20 — | Related Party Transactions |
In the ordinary course of business, the Bank has granted loans to principal officers and directors and their affiliates (including their families and companies in which they have 10% or more ownership). Annual activity consisted of the following:
| 2007 | 2006 | |||||||
| Beginning balance | $ | 10,749 | $ | 9,679 | ||||
| New loans | 8,720 | 12,521 | ||||||
| Repayments | (9,008 | ) | (11,451 | ) | ||||
| Ending Balance | $ | 10,461 | $ | 10,749 | ||||
Total deposits of these principal officers and directors and their affiliates amounted to $10,526 and $10,467 at December 31, 2007 and 2006, respectively. In addition, IBT Bancorp’s defined benefit plan and the Employee Stock Ownership Plan (Note 18) held deposits with the Bank aggregating $370 and $928, and $4,000 and $862, respectively, at December 31, 2007 and 2006.
| Note 21 — | Fair Values of Financial Instruments |
The fair value of a financial instrument is the current amount that would be exchanged between willing parties, other than in a forced liquidation. Fair value is best determined based upon quoted market prices. However, in many instances, there are no quoted market prices for the Corporation’s various financial instruments. In cases where quoted market prices are not available, fair values are based on estimates using present value or other valuation techniques. Those techniques are significantly affected by the assumptions used, including the discount rate and estimates of future cash flows. Accordingly, the fair value estimates may not be realized in an immediate settlement of the instrument. SFAS No. 107 excludes certain financial instruments and all non-financial instruments from its disclosure requirements. These include, among other elements, the estimated earning power of core deposit accounts, the trained work force, customer goodwill and similar items. Accordingly, the aggregate of the fair value amounts presented are not necessarily indicative of the underlying fair value of the Corporation.
The following methods and assumptions were used by the Corporation in estimating fair value disclosures for financial instruments.
Cash and cash equivalents:
The carrying amounts of cash and short-term instruments approximate fair values.
Investment securities:
Fair values for investment securities are based on quoted market prices, where available. If quoted market prices are unavailable, fair values are based on quoted market prices of comparable instruments.
57
Table of Contents
NOTES TO CONSOLIDATED FINANCIAL STATEMENTS — (Continued)
Mortgage loans held for sale:
Fair values of mortgage loans held for sale are based on commitments on hand from investors or prevailing market prices.
Loans receivable:
For variable-rate loans that reprice frequently and with no significant change in credit risk, fair values are based on carrying values. Fair values for other loans (e.g. , real estate mortgage, agricultural, commercial, and installment) are estimated using discounted cash flow analyses, using interest rates currently being offered for loans with similar terms to borrowers of similar credit quality. The resulting amounts are adjusted to estimate the effect of declines, if any, in the credit quality of borrowers since the loans were originated. Fair values for non-performing loans are estimated using discounted cash flow analyses or underlying collateral values, where applicable.
Mortgage servicing rights:
Fair value is determined using prices for similar assets with similar characteristics when applicable, or based upon discounted cash flow analyses.
Deposit liabilities:
Demand, savings, and money market deposits are, by definition, equal to the amount payable on demand at the reporting date (i.e., their carrying amounts). Fair values for variable rate certificates of deposit approximate their recorded book balance. Fair values for fixed-rate certificates of deposit are estimated using discounted cash flow calculation that applies interest rates currently being offered on certificates to a schedule of aggregated expected monthly maturities on time deposits.
Short-term borrowings:
The carrying amounts of federal funds purchased, borrowings under repurchase agreements, and other short-term borrowings maturing within ninety days approximate their fair values. Fair values of other short-term borrowings are estimated using discounted cash flow analyses based on the Corporation’s current incremental borrowing rates for similar types of borrowings arrangements.
Borrowings:
The fair values of the Corporation’s long-term borrowings are estimated using discounted cash flow analyses based on the Corporation’s current incremental borrowing arrangements. The carrying amounts of federal funds purchased and borrowings under repurchase agreements approximate their fair value. The fair values of other borrowings are estimated using discounted cash flow analyses based on the Corporation’s current incremental borrowing rates for similar types of borrowing arrangements.
Accrued interest:
The carrying amounts of accrued interest approximate fair value.
Derivative financial instruments:
Fair values for derivative loan commitments and forward loan sale commitments are based on fair values of the underlying mortgage loans and the probability of such commitments being exercised.
Off-balance-sheet credit-related instruments:
Fair values for off-balance-sheet lending commitments are based on fees currently charged to enter into similar agreements, taking into consideration the remaining terms of the agreements and the counterparties’ credit
58
Table of Contents
NOTES TO CONSOLIDATED FINANCIAL STATEMENTS — (Continued)
standings. The Corporation does not charge fees for lending commitments; thus it is not practicable to estimate the fair value of these instruments.
The following sets forth the estimated fair value and recorded carrying values of the Corporation’s financial instruments as of December 31:
| 2007 | 2006 | |||||||||||||||
| Estimated | Carrying | Estimated | Carrying | |||||||||||||
| Fair Value | Value | Fair Value | Value | |||||||||||||
ASSETS | ||||||||||||||||
| Cash and demand deposits due from banks | $ | 25,583 | $ | 25,583 | $ | 31,359 | $ | 31,359 | ||||||||
| Trading securities | 25,064 | 25,064 | — | — | ||||||||||||
| Investment securities available for sale | 213,127 | 213,127 | 213,450 | 213,450 | ||||||||||||
| Mortgage loans available for sale | 2,228 | 2,214 | 2,765 | 2,734 | ||||||||||||
| Net loans | 606,840 | 605,386 | 585,703 | 583,437 | ||||||||||||
| Accrued interest receivable | 5,948 | 5,948 | 5,765 | 5,765 | ||||||||||||
| Mortgage servicing rights | 2,198 | 2,198 | 2,155 | 2,155 | ||||||||||||
| LIABILITIES | ||||||||||||||||
| Deposits with no stated maturities | 387,054 | 387,054 | 373,309 | 373,309 | ||||||||||||
| Deposits with stated maturities | 348,488 | 346,419 | 352,595 | 352,531 | ||||||||||||
| Borrowed funds | 91,897 | 92,887 | 58,390 | 58,303 | ||||||||||||
| Accrued interest payable | 1,284 | 1,284 | 1,197 | 1,197 | ||||||||||||
| Note 22 — | Parent Company Only Financial Information (Unaudited) |
Condensed Balance Sheets
| December 31 | ||||||||
| 2007 | 2006 | |||||||
ASSETS | ||||||||
| Cash on deposit at subsidiary Bank | $ | 14,265 | $ | 4,075 | ||||
| Securities available for sale | 2,210 | 2,534 | ||||||
| Investments in subsidiaries | 77,486 | 83,801 | ||||||
| Premises and equipment | 3,637 | 3,094 | ||||||
| Other assets | 26,309 | 25,258 | ||||||
Total Assets | $ | 123,907 | $ | 118,762 | ||||
| LIABILITIES AND SHAREHOLDERS’ EQUITY | ||||||||
| Other liabilities | $ | 827 | $ | 3,013 | ||||
| Shareholders’ equity | 123,080 | 115,749 | ||||||
Total Liabilities and Shareholders’ Equity | $ | 123,907 | $ | 118,762 | ||||
59
Table of Contents
NOTES TO CONSOLIDATED FINANCIAL STATEMENTS — (Continued)
Condensed Statements of Income
| Year Ended December 31 | ||||||||||||
| 2007 | 2006 | 2005 | ||||||||||
| Income | ||||||||||||
| Dividends from subsidiaries | $ | 15,975 | $ | 4,025 | $ | 7,275 | ||||||
| Interest income | 177 | 305 | 182 | |||||||||
| Management fee and other | 1,517 | 1,280 | 1,384 | |||||||||
Total income | 17,669 | 5,610 | 8,841 | |||||||||
| Expenses | 3,890 | 3,872 | 2,808 | |||||||||
| Income before income tax benefit and equity in undistributed earnings of subsidiaries | 13,779 | 1,738 | 6,033 | |||||||||
| Federal income tax benefit | 773 | 825 | 478 | |||||||||
| 14,552 | 2,563 | 6,511 | ||||||||||
| (Distributions in excess) undistributed earnings of subsidiaries | (6,622 | ) | 4,438 | 265 | ||||||||
Net income | $ | 7,930 | $ | 7,001 | $ | 6,776 | ||||||
60
Table of Contents
NOTES TO CONSOLIDATED FINANCIAL STATEMENTS — (Continued)
Condensed Statements of Cash Flows
| Year Ended December 31 | ||||||||||||
| 2007 | 2006 | 2005 | ||||||||||
Operating Activities | ||||||||||||
| Net income | $ | 7,930 | $ | 7,001 | $ | 6,776 | ||||||
| Adjustments to reconcile net income to cash provided by operations | ||||||||||||
| Distributions in excess (undistributed earnings) of subsidiaries | 6,622 | (4,438 | ) | (265 | ) | |||||||
| Share based payment awards | 758 | 470 | — | |||||||||
| Depreciation | 592 | 591 | 533 | |||||||||
| Net amortization of investment securities | 4 | 21 | 27 | |||||||||
| Realized loss on sale of investment securities | — | 8 | — | |||||||||
| Deferred income tax (benefit) expense | (165 | ) | 128 | 680 | ||||||||
| Changes in operating assets and liabilities which (used) provided cash | ||||||||||||
| Interest receivable | (2 | ) | 29 | (29 | ) | |||||||
| Other assets | (776 | ) | (522 | ) | (746 | ) | ||||||
| Accrued interest and other expenses | (389 | ) | 138 | (894 | ) | |||||||
Net Cash Provided by Operating Activities | 14,574 | 3,426 | 6,082 | |||||||||
Investing Activities | ||||||||||||
| Activity in available-for-sale securities | ||||||||||||
| Maturities, calls, and sales | 595 | 6,650 | 344 | |||||||||
| Purchases | (266 | ) | (4,380 | ) | (1,523 | ) | ||||||
| Purchases of equipment and premises | (1,135 | ) | (660 | ) | (3,455 | ) | ||||||
| (Advances to) repayment of investment in subsidiaries | (50 | ) | (8,394 | ) | 652 | |||||||
Net Cash Used in Investing Activities | (856 | ) | (6,784 | ) | (3,982 | ) | ||||||
Financing Activities | ||||||||||||
| Cash dividends paid on common stock | (4,304 | ) | (3,775 | ) | (3,254 | ) | ||||||
| Proceeds from the issuance of common stock | 2,657 | 2,459 | 2,684 | |||||||||
| Common stock repurchased | (1,881 | ) | — | — | ||||||||
Net Cash Used in Financing Activities | (3,528 | ) | (1,316 | ) | (570 | ) | ||||||
Increase (Decrease) in Cash and Cash Equivalents | 10,190 | (4,674 | ) | 1,530 | ||||||||
| Cash and cash equivalents at beginning of year | 4,075 | 8,749 | 7,219 | |||||||||
Cash and Cash Equivalents at End of Year | $ | 14,265 | $ | 4,075 | $ | 8,749 | ||||||
Note 23 — Operating Segments |
In prior years, the Corporation’s reportable segments were based on legal entities that account for at least 10% of operating results. In April 2007, the individual bank charters of Isabella Bank and Trust and FSB Bank were consolidated into one bank charter as a part of the Corporation’s strategy to increase efficiencies. Retail banking operations for 2007, 2006, and 2005 represent approximately 90% or greater of the Corporation’s total assets and operating results. As such, no additional segment information is presented.
61
Table of Contents
NOTES TO CONSOLIDATED FINANCIAL STATEMENTS — (Continued)
| Note 24 — | Subsequent Events |
On January 1, 2008, IBT Bancorp acquired 100 percent of Greenville Community Financial Corporation (GCFC) in a transaction valued at $33,927. As a result of this acquisition, Greenville Community Bank, a wholly owned subsidiary of GCFC, merged with and into the Bank. Under the terms of the merger agreement, each share of GCFC common stock was automatically converted into the right to receive 0.6659 shares of IBT Bancorp common stock and $14.70 in cash. Exclusive of the effects of the 10% stock dividend paid February 29, 2008, the Corporation issued 514,809 shares of IBT Bancorp, Inc. common stock valued at $22,652 and paid a total of $11,365 in cash to GCFC shareholders.
IBT Bancorp is in the process of renaming the Corporation and the Bank. Effective February 15, 2008, Isabella Bank and Trust became Isabella Bank. On April 21, 2008, a new logo will be introduced and the banking divisions of The Farmers State Bank of Breckenridge, Farwell State Savings Bank, and Greenville Community Bank will be renamed Isabella Bank with a community identifier. Additionally, at the May 13, 2008 annual meeting, the shareholders will vote to approve the IBT Bancorp, Inc.’s Board of Director’s recommendation to change IBT Bancorp, Inc.’s name to Isabella Bank Corporation.
On January 1, 2008, IBT Personnel, LLC merged with and into IB&T Employee Leasing, LLC. As a result of this merger, the Corporation is now a 100 percent owner of IB&T Employee Leasing, LLC. The purpose of this consolidation was to help reduce operating expenses through the elimination of duplications in processes and fees. The legal reorganization is not anticipated to have a significant impact on the Corporation’s consolidated financial statements.
On March 1, 2008, IBT Title and Insurance Agency, Inc. merged its assets and liabilities with Corporate Title Agency, LLC, a third-party title business based in Traverse City, Michigan, to form CT/IBT Title Agency, LLC. As a result of this transaction, the Corporation became a 50 percent joint venture owner in CT/IBT Title Agency, LLC and will not be the managing partner. The purpose of this joint venture was to help IBT Title and Insurance Agency, Inc. expand its service area and to take advantage of economies of scale.
A 10% common stock dividend was declared on December 20, 2007, with a record date of January 1, 2008 and paid on February 29, 2008. All references to per-share amounts have been adjusted to give retroactive effect to this stock dividend, unless otherwise noted.
62
Table of Contents
Management’s Discussion and Analysis of Financial Condition and Results of Operations
IBT BANCORP FINANCIAL REVIEW
(All dollars in thousands)
The following is management’s discussion and analysis of the financial condition and results of operations for IBT Bancorp, Inc. (the “Corporation”). This discussion and analysis is intended to provide a better understanding of the consolidated financial statements and statistical data included elsewhere in the Annual Report. The Corporation’s significant acquisition of Farwell State Savings Bank during 2006 was accounted for as a purchase transaction, and as such, the related results of Farwell’s operations are included from the date of acquisition of Farwell State Savings Bank. See “Note 2 — Business and Acquisition” in the accompanying Notes to the Consolidated Financial Statements included elsewhere in the report.
Critical Accounting Policies:
The Corporation’s significant accounting policies are set forth in Note 1 of the Consolidated Financial Statements. Of these significant accounting policies, the Corporation considers its policies regarding the allowance for loan losses and acquisition intangibles to be its most critical accounting policies.
The allowance for loan losses requires management’s most subjective and complex judgment. Changes in economic conditions can have a significant impact on the allowance for loan losses and, therefore, the provision for loan losses and results of operations. The Corporation has developed appropriate policies and procedures for assessing the adequacy of the allowance for loan losses, recognizing that this process requires a number of assumptions and estimates with respect to its loan portfolio. The Corporation’s assessments may be impacted in future periods by changes in economic conditions, the impact of regulatory examinations, and the discovery of information with respect to borrowers that is not known to management at the time of the issuance of the consolidated financial statements. For additional discussion concerning the Corporation’s allowance for loan losses and related matters, see Provision for Loan Losses and Allocation of the Allowance for Loan Losses.
Generally accepted accounting principles require the Corporation to determine the fair value of all of the assets and liabilities of an acquired entity, and record their fair value on the date of acquisition. The Corporation employs a variety of means in determination of the fair value, including the use of discounted cash flow analysis, market comparisons, and projected future revenue streams. For certain items that management believes it has the appropriate expertise to determine the fair value, management may choose to use its own calculations of the value. In other cases, where the value is not easily determined, the Corporation consults with outside parties to determine the fair value of the asset or liability. Once valuations have been adjusted, the net difference between the price paid for the acquired company and the value of its balance sheet is recorded as goodwill. This goodwill is not amortized, but is tested for impairment on at least an annual basis.
63
Table of Contents
DISTRIBUTION OF ASSETS, LIABILITIES, AND SHAREHOLDERS’ EQUITY
INTEREST RATE AND INTEREST DIFFERENTIAL
INTEREST RATE AND INTEREST DIFFERENTIAL
The following schedules present the daily average amount outstanding for each major category of interest earning assets, nonearning assets, interest bearing liabilities, and noninterest bearing liabilities for the last three years. This schedule also presents an analysis of interest income and interest expense for the periods indicated. All interest income is reported on a fully taxable equivalent (FTE) basis using a 34% federal income tax rate. Nonaccruing loans, for the purpose of the following computations, are included in the average loan amounts outstanding. Federal Reserve and Federal Home Loan Bank Equity holdings which are restricted are included in Other Assets.
| 2007 | 2006 | 2005 | ||||||||||||||||||||||||||||||||||
| Tax | Average | Tax | Average | Tax | Average | |||||||||||||||||||||||||||||||
| Average | Equivalent | Yield/ | Average | Equivalent | Yield/ | Average | Equivalent | Yield/ | ||||||||||||||||||||||||||||
| Balance | Interest | Rate | Balance | Interest | Rate | Balance | Interest | Rate | ||||||||||||||||||||||||||||
INTEREST EARNING ASSETS: | ||||||||||||||||||||||||||||||||||||
| Loans | $ | 604,342 | $ | 43,808 | 7.25 | % | $ | 522,726 | $ | 36,575 | 7.00 | % | $ | 466,001 | $ | 30,682 | 6.58 | % | ||||||||||||||||||
| Taxable investment securities | 68,398 | 3,751 | 5.48 | % | 123,316 | 4,948 | 4.01 | % | 106,025 | 3,487 | 3.29 | % | ||||||||||||||||||||||||
| Nontaxable investment securities | 96,789 | 5,726 | 5.92 | % | 75,712 | 4,423 | 5.84 | % | 63,271 | 3,818 | 6.03 | % | ||||||||||||||||||||||||
| Trading account securities | 50,904 | 2,298 | 4.51 | % | — | — | — | — | — | — | ||||||||||||||||||||||||||
| Federal funds sold | 6,758 | 342 | 5.06 | % | 2,762 | 139 | 5.03 | % | 3,882 | 116 | 2.99 | % | ||||||||||||||||||||||||
| Other | 7,143 | 317 | 4.44 | % | 5,012 | 250 | 4.99 | % | 5,060 | 199 | 3.93 | % | ||||||||||||||||||||||||
Total earning assets | 834,334 | 56,242 | 6.74 | % | 729,528 | 46,335 | 6.35 | % | 644,239 | 38,302 | 5.95 | % | ||||||||||||||||||||||||
NON EARNING ASSETS: | ||||||||||||||||||||||||||||||||||||
| Allowance for loan losses | (7,603 | ) | (7,187 | ) | (6,691 | ) | ||||||||||||||||||||||||||||||
| Cash and due from banks | 20,588 | 24,351 | 19,955 | |||||||||||||||||||||||||||||||||
| Premises and equipment | 21,507 | 17,690 | 17,544 | |||||||||||||||||||||||||||||||||
| Accrued income and other assets | 56,805 | 35,792 | 25,577 | |||||||||||||||||||||||||||||||||
Total assets | $ | 925,631 | $ | 800,174 | $ | 700,624 | ||||||||||||||||||||||||||||||
INTEREST BEARING LIABILITIES: | ||||||||||||||||||||||||||||||||||||
| Interest bearing demand deposits | $ | 109,370 | $ | 1,880 | 1.72 | % | $ | 105,476 | $ | 1,664 | 1.58 | % | $ | 103,684 | $ | 1,001 | 0.97 | % | ||||||||||||||||||
| Savings deposits | 188,323 | 4,232 | 2.25 | % | 158,327 | 2,675 | 1.69 | % | 157,238 | 1,571 | 1.00 | % | ||||||||||||||||||||||||
| Time deposits | 349,941 | 16,493 | 4.71 | % | 301,593 | 12,825 | 4.25 | % | 245,559 | 8,802 | 3.58 | % | ||||||||||||||||||||||||
| Other borrowed funds | 68,586 | 3,354 | 4.89 | % | 53,256 | 2,568 | 4.82 | % | 37,209 | 1,599 | 4.30 | % | ||||||||||||||||||||||||
Total interest bearing liabilities | 716,220 | 25,959 | 3.62 | % | 618,652 | 19,732 | 3.19 | % | 543,690 | 12,973 | 2.39 | % | ||||||||||||||||||||||||
NONINTEREST BEARING LIABILITIES: | ||||||||||||||||||||||||||||||||||||
| Demand deposits | 80,128 | 73,650 | 69,610 | |||||||||||||||||||||||||||||||||
| Other | 10,037 | 15,908 | 12,642 | |||||||||||||||||||||||||||||||||
| Shareholders’ equity | 119,246 | 91,964 | 74,682 | |||||||||||||||||||||||||||||||||
Total liabilities and equity | $ | 925,631 | $ | 800,174 | $ | 700,624 | ||||||||||||||||||||||||||||||
Net interest income (FTE) | $ | 30,283 | $ | 26,603 | $ | 25,329 | ||||||||||||||||||||||||||||||
Net yield on interest earning assets (FTE) | 3.63 | % | 3.65 | % | 3.93 | % | ||||||||||||||||||||||||||||||
64
Table of Contents
Net Interest Income
The Corporation derives the majority of its gross income from interest earned on loans and investments, while its most significant expense is the interest cost incurred for funds used. Net interest income is the amount by which interest income on earning assets exceeds the interest cost of deposits and borrowings. Net interest income is influenced by changes in the balance and mix of assets and liabilities and market interest rates. Management exerts some control over these factors; however, Federal Reserve monetary policy and competition have a significant impact. Interest income includes loan fees of $1,330 in 2007, $1,172 in 2006, and $1,142 in 2005. For analytical purposes, net interest income is adjusted to a “taxable equivalent” basis by adding the income tax savings from interest on tax-exempt loans and securities, thus making year-to-year comparisons more meaningful.
VOLUME AND RATE VARIANCE ANALYSIS
The following table details the dollar amount of changes in FTE net interest income for each major category of interest earning assets and interest bearing liabilities and the amount of change attributable to changes in average balances (volume) or average rates. The change in interest due to both volume and rate has been allocated to volume and rate changes in proportion to the relationship of the absolute dollar amounts of the change in each.
| 2007 Compared to 2006 | 2006 Compared to 2005 | |||||||||||||||||||||||
| Increase (Decrease) Due to | Increase (Decrease) Due to | |||||||||||||||||||||||
| Volume | Rate | Net | Volume | Rate | Net | |||||||||||||||||||
CHANGES IN INTEREST INCOME: | ||||||||||||||||||||||||
| Loans | $ | 5,878 | $ | 1,355 | $ | 7,233 | $ | 3,889 | $ | 2,004 | $ | 5,893 | ||||||||||||
| Taxable investment securities | (2,647 | ) | 1,450 | (1,197 | ) | 622 | 839 | 1,461 | ||||||||||||||||
| Nontaxable investment securities | 1,246 | 57 | 1,303 | 730 | (125 | ) | 605 | |||||||||||||||||
| Trading account securities | 2,298 | — | 2,298 | — | — | — | ||||||||||||||||||
| Federal funds sold | 202 | 1 | 203 | (40 | ) | 63 | 23 | |||||||||||||||||
| Other | 97 | (30 | ) | 67 | (2 | ) | 53 | 51 | ||||||||||||||||
Total changes in interest income | 7,074 | 2,833 | 9,907 | 5,199 | 2,834 | 8,033 | ||||||||||||||||||
CHANGES IN INTEREST EXPENSE: | ||||||||||||||||||||||||
| Interest bearing demand deposits | 63 | 153 | 216 | 18 | 645 | 663 | ||||||||||||||||||
| Savings deposits | 568 | 989 | 1,557 | 11 | 1,093 | 1,104 | ||||||||||||||||||
| Time deposits | 2,189 | 1,479 | 3,668 | 2,215 | 1,808 | 4,023 | ||||||||||||||||||
| Other borrowings | 749 | 37 | 786 | 755 | 214 | 969 | ||||||||||||||||||
Total changes in interest expense | 3,569 | 2,658 | 6,227 | 2,999 | 3,760 | 6,759 | ||||||||||||||||||
Net change in interest margin (FTE) | $ | 3,505 | $ | 175 | $ | 3,680 | $ | 2,200 | $ | (926 | ) | $ | 1,274 | |||||||||||
The Corporation has experienced a decline in the net yield on interest earning assets since 2005. The main contributing factors are:
| • | An inverted or essentially flat yield curve for much of the period. | |
| • | Rates paid on interest bearing liabilities have increased at a faster rate than those earned on interest earning assets. | |
| • | The Corporation’s increased reliance on higher cost time deposits and other borrowed funds. |
The Corporation, as well as all other financial institutions, has been coping with an essentially flat or inverted yield curve since the third quarter of 2005. A flat yield curve results when short term interest rates are essentially the same as long term rates (over two years), and an inverted yield curve is where short term rates are higher than long term rates. In either case, the yield curve encouraged customers to invest their funds in short term deposits and to borrow long term with fixed rate loans. Banks typically make money through the assumption of credit and interest rate risk. Interest rate risk is related to borrowing funds short term and investing them long term. This yield curve,
65
Table of Contents
however, has provided the Corporation with little opportunity to do this effectively. Over the past two years, the yield curve has also been the main reason why the rates paid on interest bearing liabilities have been rising faster than those earned on interest earning assets.
Overall FTE net interest income increased $3,680 for the year ended December 31, 2007 when compared to the same period in 2006. The net increase from the change in volume of interest earning assets and interest bearing liabilities was $3,505 in 2007. Net interest income increased $175 as a result of interest rate changes. During 2007, the rates paid on interest bearing liabilities increased 0.43%, while those earned on interest earning assets increased 0.39%. The decline in interest rate spread is a direct result of the continued use of high cost funding sources such as certificates of deposit and other borrowed funds. The increase in the cost of these deposits in relation to other sources is a result of continued competition for retail deposits.
To offset the decreases in interest spreads from the unfavorable rate environment, the Corporation has taken a measured growth posture. Most of this growth has come in the form of commercial loans and investments. This growth has allowed the Corporation to increase net interest income through volume. During the third and fourth quarters of 2007, the Corporation earned an additional $1,254 in FTE interest income when compared to the first and second quarters of 2007.
The Corporation elected early adoption of Statement of Financial Accounting Standards (“SFAS”) No. 159,The Fair Value Option for Financial Assets and Financial Liabilities, and SFAS No. 157,Fair Value Measurements. SFAS No. 159, which was issued in February 2007, generally permits the measurement of selected eligible financial instruments at fair value at specified election dates. Subsequent to the issuance of SFAS No. 159, the Corporation’s Audit Committee, Board of Directors, management, and investment advisors reviewed the Corporation’s assets and liabilities to determine which fluctuate in value based on changes in market interest rates to determine the potential impact of the new standard. As a result of these considerations, IBT elected early adoption of the new accounting standard effective January 1, 2007. The purpose of the early adoption of this standard was to provide IBT an opportunity to accelerate the restructuring of its balance sheet to better manage interest rate risk now and in the future.
The impact of the Corporation’s balance sheet restructuring plan implemented during 2007 increased FTE net interest margin by 0.31% when the quarter ended December 31, 2007 is compared to the quarter ended March 31, 2007. Management does anticipate that interest margins will increase during 2008 when compared to 2007.
Since July 2007, the Federal Reserve Bank (“The Fed”) lowered its target Fed Funds rate by 2.00%, which included a 1.25% decrease in January 2008. The Fed’s actions are a result of turbulence in the financial markets resulting from the collapse of the sub-prime residential market and investments, derivatives, and other financial products using these mortgages as collateral. The Fed’s actions are an attempt to avoid or lessen the likelihood of a severe economic downturn.
As of December 31, 2007, the Corporation’s balance sheet was well positioned to protect interest margins in a decreasing rate environment. The overall impact on financial performance could be negative if economic conditions in its principal market deteriorate significantly as a result of a material economic downturn.
As shown in the above tables, when comparing year ending December 31, 2006 to 2005, fully taxable equivalent (FTE) net interest income increased $1,274 or 5.03%. An increase of 13.24% in average interest earning assets provided $5,199 of FTE interest income. The majority of this growth was funded by a 13.79% increase in interest bearing liabilities, resulting in $2,999 of additional interest expense. Overall, changes in volume resulted in $2,200 in additional FTE interest income. The average FTE interest rate earned on assets increased by 0.40%, increasing FTE interest income by $2,834, and the average rate paid on deposits and borrowings increased by 0.80%, increasing interest expense by $3,760.
Provision for Loan Losses
The provision for loan losses represents the current period loan cost associated with maintaining an appropriate allowance for loan losses as determined by management. Periodic fluctuations in the provision for loan losses result from management’s best estimates as to the adequacy of the allowance for loan losses to absorb probable losses within the existing loan portfolio. The provision for loan losses for each period is further dependent upon many
66
Table of Contents
factors, including loan growth, net charge-offs, changes in the composition of the loan portfolio, delinquencies, assessment by management, third parties and banking regulators of the quality of the loan portfolio, the value of the underlying collateral on problem loans and the general economic conditions in the market areas.
The following schedule shows the composition of the provision for loan losses and the allowance for loan losses.
| Year Ended December 31 | ||||||||||||||||||||
| 2007 | 2006 | 2005 | 2004 | 2003 | ||||||||||||||||
| Allowance for loan losses — January 1 | $ | 7,605 | $ | 6,899 | $ | 6,444 | $ | 6,204 | $ | 5,593 | ||||||||||
| Allowance of acquired bank | — | 726 | — | — | — | |||||||||||||||
| Loans charged off | ||||||||||||||||||||
| Commercial and agricultural | 905 | 368 | 101 | 561 | 578 | |||||||||||||||
| Real estate mortgage | 659 | 252 | 166 | — | 117 | |||||||||||||||
| Consumer | 582 | 529 | 376 | 374 | 445 | |||||||||||||||
Total loans charged off | 2,146 | 1,149 | 643 | 935 | 1,140 | |||||||||||||||
| Recoveries | ||||||||||||||||||||
| Commercial and agricultural | 297 | 136 | 105 | 191 | 93 | |||||||||||||||
| Real estate mortgage | 49 | 53 | — | 62 | 29 | |||||||||||||||
| Consumer | 285 | 258 | 216 | 187 | 174 | |||||||||||||||
Total recoveries | 631 | 447 | 321 | 440 | 296 | |||||||||||||||
| Net loans charged off | 1,515 | 702 | 322 | 495 | 844 | |||||||||||||||
| Provision charged to income | 1,211 | 682 | 777 | 735 | 1,455 | |||||||||||||||
Allowance for loan losses — December 31 | $ | 7,301 | $ | 7,605 | $ | 6,899 | $ | 6,444 | $ | 6,204 | ||||||||||
YTD Average Loans | $ | 604,342 | $ | 522,726 | $ | 466,001 | $ | 437,438 | $ | 404,453 | ||||||||||
Net loans charged off to average loans outstanding | 0.25 | % | 0.13 | % | 0.07 | % | 0.11 | % | 0.21 | % | ||||||||||
Year End Loans | $ | 612,687 | $ | 591,042 | $ | 483,242 | $ | 452,895 | $ | 421,860 | ||||||||||
Allowance for loan losses as a% of loans | 1.19 | % | 1.29 | % | 1.43 | % | 1.42 | % | 1.47 | % | ||||||||||
The nationwide increase in residential mortgage loans past due and in foreclosures has received considerable attention by both the press and regulatory agencies. Based on information provided by The Mortgage Bankers Association, the increases in both past dues and foreclosures are related to fixed and adjustable rate sub-prime mortgages. Additionally, a substantial portion of sub-prime adjustable rate mortgages are scheduled to reset at higher rates in the next 6 months. As a result of the rate resetting on these mortgages, it is expected that troubled sub-prime loans nationally will increase substantially through the end of 2008. The increase in troubled residential mortgage loans and a tightening of underwriting standards will most likely result in a further increased inventory of unsold homes from its current level of over 10 months. The inventory of unsold homes has not reached these levels since the 1991 recession. The combination of all of these factors will most likely further reduce average home values and thus homeowner’s equity on a national level.
The Corporation originates and sells fixed rate residential real estate mortgages to the Federal Home Loan Mortgage Corporation. The Corporation has not originated loans for either trading or its own portfolio that would be classified as sub prime, nor has it originated adjustable rate mortgages or finance loans for more than 80% of market value unless insured by private third party insurance.
While the Corporation does not originate variable rate mortgages (other than home equity lines of credit), nor does it hold sub-prime mortgage loans, the difficulties experienced in the sub-prime market has the potential to
67
Table of Contents
adversely impact the entire market, and thus the overall credit quality of the IBT residential real estate mortgage portfolio.
With increases in the net loans charged off to average loans, nonperforming loans as a percentage of total loans, and continued growth in the loan portfolio, the Corporation increased its provision charged to income in 2007. Overall, the allowance for loan losses as a percentage of loans declined in 2007. The primary factors affecting the decline in the allowance as a percentage of loans in 2006 was the acquisition of Farwell State Savings Bank in the fourth quarter of 2006 and the mix of the loan portfolio that was purchased combined with strong loan growth in 2006. Management also believes its conservative credit underwriting standards have allowed the Corporation, to date, to avoid significant credit losses. Management will continue to closely monitor its overall credit quality during 2008.
Based on management’s analysis of the allowance for loan losses, the calculated range for the required allowance was $3,684 to $10,215. As such, the allowance for loan losses of $7,301 is considered adequate as of December 31, 2007.
Allocation of the Allowance for Loan Losses
The allowance for loan losses has been allocated according to the amount deemed to be reasonably necessary to reflect for the probability of losses being incurred within the following categories as of December 31:
| 2007 | 2006 | 2005 | 2004 | 2003 | ||||||||||||||||||||||||||||||||||||
| % of Each | % of Each | % of Each | % of Each | % of Each | ||||||||||||||||||||||||||||||||||||
| Category | Category | Category | Category | Category | ||||||||||||||||||||||||||||||||||||
| Allowance | to Total | Allowance | to Total | Allowance | to Total | Allowance | to Total | Allowance | to Total | |||||||||||||||||||||||||||||||
| Amount | Loans | Amount | Loans | Amount | Loans | Amount | Loans | Amount | Loans | |||||||||||||||||||||||||||||||
| Commercial and agricultural | $ | 2,458 | 46.0 | % | $ | 2,687 | 43.3 | % | $ | 2,771 | 46.9 | % | $ | 2,634 | 42.3 | % | $ | 2,140 | 41.5 | % | ||||||||||||||||||||
| Real estate mortgage | 1,341 | 48.6 | % | 1,367 | 50.9 | % | 1,192 | 46.8 | % | 1,463 | 50.5 | % | 1,584 | 47.8 | % | |||||||||||||||||||||||||
| Consumer installment | 2,195 | 4.8 | % | 2,434 | 5.1 | % | 2,286 | 5.8 | % | 1,606 | 6.6 | % | 1,614 | 9.6 | % | |||||||||||||||||||||||||
| Impaired loans | 703 | 0.6 | % | 594 | 0.7 | % | 184 | 0.5 | % | 304 | 0.6 | % | 622 | 1.1 | % | |||||||||||||||||||||||||
| Unallocated | 604 | 0.0 | % | 523 | 0.0 | % | 466 | 0.0 | % | 437 | 0.0 | % | 244 | 0.0 | % | |||||||||||||||||||||||||
Total | $ | 7,301 | 100.0 | % | $ | 7,605 | 100.0 | % | $ | 6,899 | 100.0 | % | $ | 6,444 | 100.0 | % | $ | 6,204 | 100.0 | % | ||||||||||||||||||||
Management has evaluated impaired loans and believes the valuation allowance related to these loans to be adequate.
Nonperforming Assets
Loans are generally placed on nonaccrual status when they become 90 days past due, unless they are well secured and in the process of collection. When a loan is placed on nonaccrual status, any interest previously accrued and not collected is generally reversed from income or charged off against the allowance for loan losses. Loans are charged off when management determines that collection has become unlikely. Restructured loans are those where a concession has been granted on either principal or interest paid due to financial difficulties of the borrower. Other real estate owned (OREO) consists of real property acquired through foreclosure on the related collateral underlying defaulted loans.
68
Table of Contents
The following table presents nonperforming assets for the past five years:
| Year Ended December 31 | ||||||||||||||||||||
| 2007 | 2006 | 2005 | 2004 | 2003 | ||||||||||||||||
| Nonaccrual loans | $ | 4,156 | $ | 3,444 | $ | 1,375 | $ | 1,900 | $ | 4,121 | ||||||||||
| Accruing loans past due 90 days or more | 1,727 | 1,185 | 1,058 | 702 | 1,380 | |||||||||||||||
| Restructured loans | 685 | 697 | 725 | 686 | — | |||||||||||||||
Total nonperforming loans | 6,568 | 5,326 | 3,158 | 3,288 | 5,501 | |||||||||||||||
| Other real estate owned | 1,376 | 562 | 122 | 40 | 552 | |||||||||||||||
Total nonperforming assets | $ | 7,944 | $ | 5,888 | $ | 3,280 | $ | 3,328 | $ | 6,053 | ||||||||||
Nonperforming loans as a % of total loans | 1.07 | % | 0.90 | % | 0.65 | % | 0.73 | % | 1.30 | % | ||||||||||
Nonperforming assets as a % of total assets | 0.83 | % | 0.65 | % | 0.44 | % | 0.49 | % | 0.91 | % | ||||||||||
Since September 2006, the Corporation has experienced an increase in the percent of loans classified as nonperforming. While the Corporation has seen increases in its nonperforming loans, net loans charged off as a percentage of loans have remained relatively stable. Management does not anticipate the level of net chargeoffs to change significantly during 2008. Management has evaluated the properties held as other real estate owned and has adjusted the carrying value of each property to the lower of the cost or fair value less costs to sell, as necessary.
As of December 31, 2007, there were no other interest bearing assets which required classification. Management is not aware of any recommendations by regulatory agencies that, if implemented, would have a material impact on the Corporation’s liquidity, capital, or operations.
69
Table of Contents
Noninterest Income
The following table shows the changes in noninterest income between the years ended December 31, 2007, 2006, and 2005 respectively.
| Year Ended December 31 | ||||||||||||||||||||||||||||
| Change | Change | |||||||||||||||||||||||||||
| 2007 | 2006 | $ | % | 2005 | $ | % | ||||||||||||||||||||||
| Service charges and fee income | ||||||||||||||||||||||||||||
| NSF and overdraft fees | $ | 2,961 | $ | 2,950 | $ | 11 | 0.4 | % | $ | 2,586 | $ | 364 | 14.1 | % | ||||||||||||||
| Trust fees | 1,035 | 866 | 169 | 19.5 | % | 828 | 38 | 4.6 | % | |||||||||||||||||||
| Freddie Mac servicing fee | 635 | 635 | — | 0.0 | % | 619 | 16 | 2.6 | % | |||||||||||||||||||
| ATM and debit card fees | 737 | 545 | 192 | 35.2 | % | 452 | 93 | 20.6 | % | |||||||||||||||||||
| Service charges on deposit accounts | 328 | 315 | 13 | 4.1 | % | 247 | 68 | 27.5 | % | |||||||||||||||||||
| All other | 198 | 179 | 19 | 10.6 | % | 196 | (17 | ) | −8.7 | % | ||||||||||||||||||
Total service charges and fees | 5,894 | 5,490 | 404 | 7.4 | % | 4,928 | 562 | 11.4 | % | |||||||||||||||||||
| Title insurance revenue | 2,192 | 2,389 | (197 | ) | −8.2 | % | 2,351 | 38 | 1.6 | % | ||||||||||||||||||
| Gain on sale of mortgage loans | 209 | 207 | 2 | 1.0 | % | 270 | (63 | ) | −23.3 | % | ||||||||||||||||||
| Net gain on trading securities | 460 | — | 460 | N/A | — | — | N/A | |||||||||||||||||||||
| Other | ||||||||||||||||||||||||||||
| Increase in cash value of corporate owned life insurance policies | 432 | 404 | 28 | 6.9 | % | 364 | 40 | 11.0 | % | |||||||||||||||||||
| Brokerage and advisory fees | 276 | 213 | 63 | 29.6 | % | 187 | 26 | 13.9 | % | |||||||||||||||||||
| (Loss) gain on sale of investment securities | (19 | ) | (112 | ) | 93 | −83.0 | % | 2 | (114 | ) | −5700.0 | % | ||||||||||||||||
| Net decrease in the fair market value of borrowings measured at their fair value | (66 | ) | — | (66 | ) | N/A | — | — | N/A | |||||||||||||||||||
| All other | 584 | 507 | 77 | 15.2 | % | 374 | 133 | 35.6 | % | |||||||||||||||||||
Total other | 1,207 | 1,012 | 195 | 19.3 | % | 927 | 85 | 9.2 | % | |||||||||||||||||||
Total noninterest income | $ | 9,962 | $ | 9,098 | $ | 864 | 9.5 | % | $ | 8,476 | $ | 622 | 7.3 | % | ||||||||||||||
70
Table of Contents
As shown in the above table, noninterest income increased 9.5% when the year ended December 31, 2007 is compared to 2006 and 7.3% when 2006 is compared to 2005. However, to make the information more comparable, the following table outlines the changes in non interest income excluding the effects of the acquisition of Farwell State Savings Bank in October 2006.
Noninterest Income (excluding the effects of the acquisition of the Farwell State Savings Bank in 2006)
| Year Ended December 31 | ||||||||||||||||||||||||||||
| Change | Change | |||||||||||||||||||||||||||
| 2007 | 2006 | $ | % | 2005 | $ | % | ||||||||||||||||||||||
| Service charges and fee income | ||||||||||||||||||||||||||||
| NSF and overdraft fees | $ | 2,761 | $ | 2,914 | $ | (153 | ) | −5.3 | % | $ | 2,586 | $ | 328 | 12.7 | % | |||||||||||||
| Trust fees | 1,035 | 866 | 169 | 19.5 | % | 828 | 38 | 4.6 | % | |||||||||||||||||||
| Freddie Mac servicing fee | 635 | 635 | — | 0.0 | % | 619 | 16 | 2.6 | % | |||||||||||||||||||
| ATM and debit card fees | 730 | 545 | 185 | 33.9 | % | 452 | 93 | 20.6 | % | |||||||||||||||||||
| Service charges on deposit accounts | 276 | 302 | (26 | ) | −8.6 | % | 247 | 55 | 22.3 | % | ||||||||||||||||||
| All other | 158 | 215 | (57 | ) | −26.5 | % | 196 | 19 | 9.7 | % | ||||||||||||||||||
Total service charges and fees | 5,595 | 5,477 | 118 | 2.2 | % | 4,928 | 549 | 11.1 | % | |||||||||||||||||||
| Title insurance revenue | 2,192 | 2,389 | (197 | ) | −8.2 | % | 2,351 | 38 | 1.6 | % | ||||||||||||||||||
| Gain on sale of mortgage loans | 207 | 207 | — | 0.0 | % | 270 | (63 | ) | −23.3 | % | ||||||||||||||||||
| Net gain on trading securities | 460 | — | 460 | N/A | — | — | N/A | |||||||||||||||||||||
| Other | ||||||||||||||||||||||||||||
| Increase in cash value of corporate owned life insurance policies | 428 | 404 | 24 | 5.9 | % | 364 | 40 | 11.0 | % | |||||||||||||||||||
| Brokerage and advisory fees | 276 | 213 | 63 | 29.6 | % | 187 | 26 | 13.9 | % | |||||||||||||||||||
| (Loss) gain on sale of investment securities | (19 | ) | (112 | ) | 93 | −83.0 | % | 2 | (114 | ) | —5700.0 | % | ||||||||||||||||
| Net decrease in the fair market value of borrowings measured at their fair value | (66 | ) | — | (66 | ) | N/A | — | — | N/A | |||||||||||||||||||
| All other | 562 | 495 | 67 | 13.5 | % | 374 | 121 | 32.4 | % | |||||||||||||||||||
Total other | 1,181 | 1,000 | 181 | 18.1 | % | 927 | 73 | 7.9 | % | |||||||||||||||||||
Total noninterest income | $ | 9,635 | $ | 9,073 | $ | 562 | 6.2 | % | $ | 8,476 | $ | 597 | 7.0 | % | ||||||||||||||
There were no significant changes to service charges during 2007. Total service charges and fees increased by $118 in 2007, compared to an increase of $549 in 2006. Trust fee income did increase as a result of increased marketing efforts by the trust department. During 2006, the Corporation observed substantial increases in service charges and fee income. The 2006 increases were driven by increases in NSF and overdraft fees which were the result of the Bank increasing the per item overdraft fees that they charge their customers, to align the Bank’s fees with its competitors. However, during 2007, the Corporation observed a decrease in NSF and overdraft fees income when compared to 2006. This decrease was a result of decreased customer overdraft items. Management does not expect service charges and fees to increase substantially in 2008 as management does not anticipate raising the NSF per item fee, which is the largest component of service charges and fees.
In 2007, title insurance revenues decreased by 8.2% as compared to an increase of 1.6% in 2006. The small growth in 2006 and the decline in 2007 is a result of the continued slow demand in residential mortgage activity. Management anticipates that the mortgage market will continue to be soft throughout much of 2008, and as such does not anticipate significant increases during the upcoming year.
71
Table of Contents
The gains recognized on trading securities as well as the decrease in the fair value of borrowings measured at their fair value during 2007 are the result of the Corporation electing to early adopt SFAS No. 159 (see Note 3 of the consolidated financial statements). As a result of decreases in interest rates, the Corporation recognized gains from trading securities, as there is an inverse relationship between the value of the trading portfolio and changes in interest rates. These gains were offset by losses associated with the changes in fair value of borrowings as there is a direct relationship between the value of these borrowings and changes in interest rates. Management does expect the gains and losses associated with assets carried at fair value to stabilize throughout 2008.
The years ended December 31, 2007 and 2006 have been some of most productive years in the Corporation’s history for brokerage and advisory services. These results are due to the increased confidence of consumers in the stock market as well as an increase in customer base and a conscious effort by management to expand the Bank’s presence in the local market. The Corporation anticipates this trend to continue during 2008.
The losses from the sale of investment securities were a result of the Corporation selling investments nearing maturity at low interest rates and reinvesting the proceeds in higher yielding, longer term securities as part of asset and liability management.
The increases in all other noninterest income between 2006 and 2005 are mainly related to the fact that in 2006, the Bank started collecting monthly commissions related to its sold credit card portfolio.
72
Table of Contents
Noninterest Expenses
The following table shows the changes in noninterest expenses between the years ended December 31, 2007, 2006, and 2005 respectively.
| Year Ended December 31 | ||||||||||||||||||||||||||||
| Change | Change | |||||||||||||||||||||||||||
| 2007 | 2006 | $ | % | 2005 | $ | % | ||||||||||||||||||||||
| Compensation | ||||||||||||||||||||||||||||
| Leased employee salaries | $ | 11,362 | $ | 10,105 | $ | 1,257 | 12.4 | % | $ | 9,610 | $ | 495 | 5.2 | % | ||||||||||||||
| Leased employee benefits | 4,096 | 3,608 | 488 | 13.5 | % | 3,846 | (238 | ) | −6.2 | % | ||||||||||||||||||
| All other | 160 | 156 | 4 | 2.6 | % | 92 | 64 | 69.6 | % | |||||||||||||||||||
Total compensation | 15,618 | 13,869 | 1,749 | 12.6 | % | 13,548 | 321 | 2.4 | % | |||||||||||||||||||
| Occupancy | ||||||||||||||||||||||||||||
| Depreciation | 448 | 412 | 36 | 8.7 | % | 363 | 49 | 13.5 | % | |||||||||||||||||||
| Outside services | 332 | 334 | (2 | ) | −0.6 | % | 306 | 28 | 9.2 | % | ||||||||||||||||||
| Property taxes | 384 | 322 | 62 | 19.3 | % | 308 | 14 | 4.5 | % | |||||||||||||||||||
| Utilities | 344 | 320 | 24 | 7.5 | % | 289 | 31 | 10.7 | % | |||||||||||||||||||
| Building rent | 72 | 163 | (91 | ) | −55.8 | % | 125 | 38 | 30.4 | % | ||||||||||||||||||
| Building repairs | 147 | 129 | 18 | 14.0 | % | 114 | 15 | 13.2 | % | |||||||||||||||||||
| All other | 39 | 50 | (11 | ) | −22.0 | % | 48 | 2 | 4.2 | % | ||||||||||||||||||
Total occupancy | 1,766 | 1,730 | 36 | 2.1 | % | 1,553 | 177 | 11.4 | % | |||||||||||||||||||
| Furniture and equipment | ||||||||||||||||||||||||||||
| Depreciation | 1,512 | 1,440 | 72 | 5.0 | % | 1,372 | 68 | 5.0 | % | |||||||||||||||||||
| Computer/Service Contracts | 1,254 | 1,101 | 153 | 13.9 | % | 973 | 128 | 13.2 | % | |||||||||||||||||||
| ATM and debit card fees | 433 | 263 | 170 | 64.6 | % | 247 | 16 | 6.5 | % | |||||||||||||||||||
| All other | 98 | 64 | 34 | 53.1 | % | 65 | (1 | ) | −1.5 | % | ||||||||||||||||||
Total furniture and equipment | 3,297 | 2,868 | 429 | 15.0 | % | 2,657 | 211 | 7.9 | % | |||||||||||||||||||
| Other | ||||||||||||||||||||||||||||
| Audit and SOX compliance fees | 583 | 1,010 | (427 | ) | −42.3 | % | 606 | 404 | 66.7 | % | ||||||||||||||||||
| Marketing | 642 | 697 | (55 | ) | −7.9 | % | 624 | 73 | 11.7 | % | ||||||||||||||||||
| Directors fees | 796 | 584 | 212 | 36.3 | % | 604 | (20 | ) | −3.3 | % | ||||||||||||||||||
| Printing and supplies | 462 | 377 | 85 | 22.5 | % | 431 | (54 | ) | −12.5 | % | ||||||||||||||||||
| Education and travel | 412 | 360 | 52 | 14.4 | % | 258 | 102 | 39.5 | % | |||||||||||||||||||
| Postage and freight | 459 | 445 | 14 | 3.1 | % | 400 | 45 | 11.3 | % | |||||||||||||||||||
| Legal | 296 | 229 | 67 | 29.3 | % | 198 | 31 | 15.7 | % | |||||||||||||||||||
| Amortization of deposit premium | 278 | 160 | 118 | 73.8 | % | 94 | 66 | 70.2 | % | |||||||||||||||||||
| Consulting | 176 | 208 | (32 | ) | −15.4 | % | 172 | 36 | 20.9 | % | ||||||||||||||||||
| All other | 2,444 | 1,936 | 508 | 26.2 | % | 1,739 | 197 | 11.3 | % | |||||||||||||||||||
Total other | 6,548 | 6,006 | 542 | 9.0 | % | 5,126 | 880 | 17.2 | % | |||||||||||||||||||
Total noninterest expenses | $ | 27,229 | $ | 24,473 | $ | 2,756 | 11.3 | % | $ | 22,884 | $ | 1,589 | 6.9 | % | ||||||||||||||
73
Table of Contents
As shown in the above table, noninterest expenses increased 11.3% when the year ended December 31, 2007 is compared to 2006 and 6.9% when 2006 is compared to 2005. However, to make the information more comparable, the following table outlines the changes in noninterest expenses excluding the effects of the acquisition of Farwell State Savings Bank in October 2006.
Noninterest Expenses (excluding the effects of the acquisition of the Farwell State Savings Bank in 2006)
| Year Ended December 31 | ||||||||||||||||||||||||||||
| Change | Change | |||||||||||||||||||||||||||
| 2007 | 2006 | $ | % | 2005 | $ | % | ||||||||||||||||||||||
| Compensation | ||||||||||||||||||||||||||||
| Leased employee salaries | $ | 10,613 | $ | 9,935 | $ | 678 | 6.8 | % | $ | 9,610 | $ | 325 | 3.4 | % | ||||||||||||||
| Leased employee benefits | 3,781 | 3,563 | 218 | 6.1 | % | 3,846 | (283 | ) | −7.4 | % | ||||||||||||||||||
| All other | 128 | 156 | (28 | ) | −17.9 | % | 92 | 64 | 69.6 | % | ||||||||||||||||||
Total compensation | 14,522 | 13,654 | 868 | 6.4 | % | 13,548 | 106 | 0.8 | % | |||||||||||||||||||
| Occupancy | ||||||||||||||||||||||||||||
| Depreciation | 433 | 412 | 21 | 5.1 | % | 363 | 49 | 13.5 | % | |||||||||||||||||||
| Outside services | 328 | 334 | (6 | ) | −1.8 | % | 306 | 28 | 9.2 | % | ||||||||||||||||||
| Property taxes | 368 | 322 | 46 | 14.3 | % | 308 | 14 | 4.5 | % | |||||||||||||||||||
| Utilities | 323 | 316 | �� | 7 | 2.2 | % | 289 | 27 | 9.3 | % | ||||||||||||||||||
| Building rent | 72 | 163 | (91 | ) | −55.8 | % | 125 | 38 | 30.4 | % | ||||||||||||||||||
| Building repairs | 126 | 117 | 9 | 7.7 | % | 114 | 3 | 2.6 | % | |||||||||||||||||||
| All other | 39 | 50 | (11 | ) | −22.0 | % | 48 | 2 | 4.2 | % | ||||||||||||||||||
Total occupancy | 1,689 | 1,714 | (25 | ) | −1.5 | % | 1,553 | 161 | 10.4 | % | ||||||||||||||||||
| Furniture and equipment | ||||||||||||||||||||||||||||
| Depreciation | 1,479 | 1,440 | 39 | 2.7 | % | 1,372 | 68 | 5.0 | % | |||||||||||||||||||
| Computer/Service Contracts | 1,081 | 1,081 | — | 0.0 | % | 973 | 108 | 11.1 | % | |||||||||||||||||||
| ATM and debit card fees | 417 | 258 | 159 | 61.6 | % | 247 | 11 | 4.5 | % | |||||||||||||||||||
| All other | 72 | 51 | 21 | 41.2 | % | 65 | (14 | ) | −21.5 | % | ||||||||||||||||||
Total furniture and equipment | 3,049 | 2,830 | 219 | 7.7 | % | 2,657 | 173 | 6.5 | % | |||||||||||||||||||
| Other | ||||||||||||||||||||||||||||
| Audit and SOX compliance fees | 570 | 1,006 | (436 | ) | —43.3 | % | 606 | 400 | 66.0 | % | ||||||||||||||||||
| Marketing | 624 | 694 | (70 | ) | −10.1 | % | 624 | 70 | 11.2 | % | ||||||||||||||||||
| Directors fees | 720 | 577 | 143 | 24.8 | % | 604 | (27 | ) | −4.5 | % | ||||||||||||||||||
| Printing and supplies | 446 | 371 | 75 | 20.2 | % | 431 | (60 | ) | −13.9 | % | ||||||||||||||||||
| Education and travel | 402 | 359 | 43 | 12.0 | % | 258 | 101 | 39.1 | % | |||||||||||||||||||
| Postage and freight | 420 | 434 | (14 | ) | −3.2 | % | 400 | 34 | 8.5 | % | ||||||||||||||||||
| Legal | 282 | 221 | 61 | 27.6 | % | 198 | 23 | 11.6 | % | |||||||||||||||||||
| Amortization of deposit premium | 278 | 160 | 118 | 73.8 | % | 94 | 66 | 70.2 | % | |||||||||||||||||||
| Consulting | 174 | 208 | (34 | ) | −16.3 | % | 172 | 36 | 20.9 | % | ||||||||||||||||||
| All other | 2,114 | 1,892 | 222 | 11.7 | % | 1,739 | 153 | 8.8 | % | |||||||||||||||||||
Total other | 6,030 | 5,922 | 108 | 1.8 | % | 5,126 | 796 | 15.5 | % | |||||||||||||||||||
Total noninterest expenses | $ | 25,290 | $ | 24,120 | $ | 1,170 | 4.9 | % | $ | 22,884 | $ | 1,236 | 5.4 | % | ||||||||||||||
74
Table of Contents
Leased employee salaries continue to increase as a result of annual merit increases and the continued growth of the Corporation. In 2006, the Corporation changed its health insurance administrators, and as a result recognized a significant decrease in health insurance related costs when compared to prior years. The 2007 increases were the result of increases in both the cost to provide health care to its employees as well as due to increases in the size of the Corporation.
Upon completion of a new Canadian Lakes branch location in 2006, the building lease for the facility that had previously housed the Canadian Lakes office was terminated. This lease termination resulted in a one time penalty of $37, which was included in rent expense in 2006. The completion of the project also resulted in an increase in building depreciation expense beginning in June 2006.
Management has been diligently working to decrease audit and (Sarbanes Oxley) SOX compliance fees. In 2007, this became a reality. These fees decreased as a result of the following factors:
| • | Many similar processes between subsidiaries have been centralized. | |
| • | Testing previously outsourced is now being performed internally as a result of an expanded internal audit department. |
The reasons for the high level of audit and SOX compliance fees in 2006 was the fact that a significant portion of the 2005 year end audit procedures were performed in 2006 coupled with the fact that a large portion of the 2006 year end audit procedures were performed prior to December 31, 2006.
The increases in director fees are a result of additional meetings related to ongoing strategic planning.
The Corporation places a strong emphasis on continuing education. These educational programs help provide team members with a competitive edge in the market place. In the third and fourth quarters of 2006 and during the first six months of 2007, the Corporation offered structured leadership training to its employees. This program is designed to help develop and optimize the communication skills of its participants. Management feels that this investment in its employees today will pay dividends for years to come.
The increase in the amortization of deposit premium is related to the October 2006 acquisition of Farwell.
Consulting fees increased in 2006 as a result of the Corporation hiring an outside marketing consultant.
All other expenses include title insurance expenses as well as other miscellaneous expenses. The main reasons for the increases in this line item were related to expenses of approximately $130 incurred to convert the Farwell Division to Isabella Bank and Trust’s core banking platform in August of 2007. The other expenses are not individually significant.
Federal Income Taxes
Federal income tax expense for 2007 was $1,605 or 16.8% of pre-tax income compared to $1,919 or 21.5% of pre-tax income in 2006 and $1,948 or 22.3% in 2005. The decrease in the 2007 effective rate is a result of a substantial increase in the Corporation’s municipal bond portfolio and the tax free income earned on these investments. A reconcilement of actual federal income tax expense reported and the amount computed at the federal statutory rate of 34% is found in Note 13, “Federal Income Taxes”, in the Notes to the accompanying Consolidated Financial Statements.
75
Table of Contents
ANALYSIS OF CHANGES IN FINANCIAL CONDITION
As shown in the following tables, the Corporation experienced another year of solid asset growth. This growth has been the result of the Corporation’s continued growth strategies.
| December 31 | ||||||||||||||||
| 2007 | 2006 | $ Change | % Change | |||||||||||||
ASSETS | ||||||||||||||||
| Cash and cash equivalents | $ | 25,583 | $ | 31,359 | $ | (5,776 | ) | −18.42 | % | |||||||
| Trading account securities | 25,064 | — | 25,064 | 100.00 | % | |||||||||||
| Securities available for sale | 213,127 | 213,450 | (323 | ) | −0.15 | % | ||||||||||
| Mortgage loans available for sale | 2,214 | 2,734 | (520 | ) | −19.02 | % | ||||||||||
| Loans | 612,687 | 591,042 | 21,645 | 3.66 | % | |||||||||||
| Allowance for loan losses | (7,301 | ) | (7,605 | ) | 304 | −4.00 | % | |||||||||
| Bank premises and equipment | 22,516 | 20,754 | 1,762 | 8.49 | % | |||||||||||
| Equity securities without readily determinable fair values | 7,353 | 3,480 | 3,873 | 111.29 | % | |||||||||||
| Other assets | 56,039 | 54,913 | 1,126 | 2.05 | % | |||||||||||
Total assets | $ | 957,282 | $ | 910,127 | $ | 47,155 | 5.18 | % | ||||||||
LIABILITIES AND SHAREHOLDERS’ EQUITY | ||||||||||||||||
Liabilities | ||||||||||||||||
| Deposits | $ | 733,473 | $ | 725,840 | $ | 7,633 | 1.05 | % | ||||||||
| Other borrowed funds | 92,887 | 58,303 | 34,584 | 59.32 | % | |||||||||||
| Escrow funds payable | 1,912 | 2,416 | (504 | ) | −20.86 | % | ||||||||||
| Accrued interest and other liabilities | 5,930 | 7,819 | (1,889 | ) | −24.16 | % | ||||||||||
Total liabilities | 834,202 | 794,378 | 39,824 | 5.01 | % | |||||||||||
Shareholders’ equity | 123,080 | 115,749 | 7,331 | 6.33 | % | |||||||||||
Total liabilities and shareholders’ equity | $ | 957,282 | $ | 910,127 | $ | 47,155 | 5.18 | % | ||||||||
A discussion of changes in balance sheet amounts by major categories follows.
Trading account securities
As previously mentioned, the Corporation commenced a balance sheet reorganization strategy in 2007 which resulted in a transfer ofavailable-for-sale securities to trading securities. The Corporation’s overall intent was to maintain a trading portfolio to enhance the ongoing restructuring of assets and liabilities as part of our interest rate risk management objectives (See Note 3 of the Consolidated Financial Statements).
Since January 1, 2007, the Corporation has reduced its trading securities by $52,775 primarily as a result of sales, calls, and maturities. Management has used these proceeds to help fund loan growth. Deposits have remained essentially unchanged since December 31, 2006.
In addition to the balance sheet restructuring resulting from the sales of trading securities, as investments securities are sold, called, or matured, IBT implemented a strategy to purchase high quality tax exempt municipal bonds funded by fixed rate Federal Home Loan Bank advances.
Investment Securities
The primary objective of the Corporation’s investing activities is to provide for safety of the principal invested. Secondary considerations include the need for earnings, liquidity, and the Corporation’s overall exposure to changes in interest rates. Securities are currently classified asavailable-for-sale or trading and are stated at fair value.
76
Table of Contents
The following is a schedule of the carrying value of investment securities available for sale:
| December 31 | ||||||||||||
| 2007 | 2006 | 2005 | ||||||||||
| Available for sale | ||||||||||||
| U.S. Government and federal agencies | $ | 54,239 | $ | 69,020 | $ | 52,913 | ||||||
| States and political subdivisions | 130,956 | 112,754 | 95,435 | |||||||||
| Corporate | 24,300 | 11,053 | 13,220 | |||||||||
| Mortgage-backed | 3,632 | 20,623 | 21,838 | |||||||||
Total | $ | 213,127 | $ | 213,450 | $ | 183,406 | ||||||
The following is a schedule of the carrying value of trading securities:
| December 31 | ||||
| 2007 | ||||
| Trading Securities | ||||
| U.S. Government and federal agencies | $ | 4,024 | ||
| States and political subdivisions | 10,324 | |||
| Corporate | 1,004 | |||
| Mortgage-backed | 9,712 | |||
Total | $ | 25,064 | ||
Excluding those holdings of the investment portfolio in U.S. Government and federal agencies, there were no investments in securities of any one issuer that exceeded 10% of shareholders’ equity. The Corporation has a policy prohibiting investments in securities that it deems are unsuitable due to their inherent credit or market risks. Prohibited investments include stripped mortgage backed securities, zero coupon bonds, nongovernment agency asset backed securities, and structured notes.
The following is a schedule of maturities of available for sale investment securities (at carrying value) and their weighted average yield as of December 31, 2007. Weighted average yields have been computed on a fully taxable-equivalent basis using a tax rate of 34%. Mortgage-backed securities and collateralized mortgage obligations are included in maturity categories based on their stated maturity date. Expected maturities may differ from contractual maturities because issuers may have the right to call or prepay obligations. Trading securities have been excluded as they are not expected to be held to maturity.
| Maturing | ||||||||||||||||||||||||||||||||
| After One Year But | After Five Years But | |||||||||||||||||||||||||||||||
| Within One Year | Within Five Years | Within Ten Years | After Ten Years | |||||||||||||||||||||||||||||
| Amount | Yield | Amount | Yield | Amount | Yield | Amount | Yield | |||||||||||||||||||||||||
| Available for Sale | ||||||||||||||||||||||||||||||||
| U.S. Government and federal agencies | $ | 3,509 | 5.04 | $ | 20,385 | 5.48 | $ | 30,345 | 5.53 | $ | — | — | ||||||||||||||||||||
| States and political subdivisions | 4,401 | 5.74 | 26,149 | 5.86 | 42,526 | 5.52 | 57,880 | 5.87 | ||||||||||||||||||||||||
| Mortgage-backed | — | — | 384 | 5.20 | 3,248 | 5.37 | — | — | ||||||||||||||||||||||||
| Corporate | 12,000 | 6.10 | — | — | — | — | 12,300 | 6.08 | ||||||||||||||||||||||||
Total | $ | 19,910 | 5.83 | $ | 46,918 | 5.69 | $ | 76,119 | 5.52 | $ | 70,180 | 5.91 | ||||||||||||||||||||
Loans
The largest component of earning assets is loans. The proper management of credit and market risk inherent in the loan portfolio is critical to the financial well-being of the Corporation. To control these risks, the Corporation has adopted strict underwriting standards. The standards include prohibitions against lending outside the
77
Table of Contents
Corporation’s defined market areas, lending limits to a single borrower, and strict loan to collateral value limits. The Corporation also monitors and limits loan concentrations extended to volatile industries. The Corporation has no foreign loans and there were no concentrations greater than 10% of total loans that are not disclosed as a separate category in the following table.
The following table presents the composition of the loan portfolio for the years ended December 31:
| 2007 | 2006 | 2005 | 2004 | 2003 | ||||||||||||||||
| Commercial | $ | 238,306 | $ | 212,701 | $ | 179,541 | $ | 146,152 | $ | 129,392 | ||||||||||
| Agricultural | 47,407 | 47,302 | 49,424 | 49,179 | 52,044 | |||||||||||||||
| Residential real estate mortgage | 297,937 | 300,650 | 226,251 | 227,421 | 199,455 | |||||||||||||||
| Installment | 29,037 | 30,389 | 28,026 | 30,143 | 40,969 | |||||||||||||||
| $ | 612,687 | $ | 591,042 | $ | 483,242 | $ | 452,895 | $ | 421,860 | |||||||||||
The following table presents the change in the loan categories for the years ended December 31:
| 2007 | 2006 | 2005 | ||||||||||||||||||||||
| $ Change | % Change | $ Change | % Change | $ Change | % Change | |||||||||||||||||||
| Commercial | $ | 25,605 | 12.0 | % | $ | 33,160 | 18.5 | % | $ | 33,389 | 22.8 | % | ||||||||||||
| Agricultural | 105 | 0.2 | % | (2,122 | ) | −4.3 | % | 245 | 0.5 | % | ||||||||||||||
| Residential real estate mortgage | (2,713 | ) | −0.9 | % | 74,399 | 32.9 | % | (1,170 | ) | −0.5 | % | |||||||||||||
| Installment | (1,352 | ) | −4.4 | % | 2,363 | 8.4 | % | (2,117 | ) | −7.0 | % | |||||||||||||
| $ | 21,645 | 3.7 | % | $ | 107,800 | 22.3 | % | $ | 30,347 | 6.7 | % | |||||||||||||
The following table presents the change in loan categories between December 31, 2006 and December 31, 2005, excluding the loans acquired from Farwell:
| Less | ||||||||||||||||||||||||
| Loans | Adjusted | |||||||||||||||||||||||
| Consolidated | Acquired | Consolidated | Consolidated | |||||||||||||||||||||
| 12/31/06 | from Farwell | 12/31/06 | 12/31/05 | $ Change | % Change | |||||||||||||||||||
| Commercial | $ | 212,701 | $ | 1,361 | $ | 211,340 | $ | 179,541 | $ | 31,799 | 17.7 | % | ||||||||||||
| Agricultural | 47,302 | — | 47,302 | 49,424 | (2,122 | ) | −4.3 | % | ||||||||||||||||
| Residential real estate mortgage | 300,650 | 59,040 | 241,610 | 226,251 | 15,359 | 6.8 | % | |||||||||||||||||
| Installment | 30,389 | 3,729 | 26,660 | 28,026 | (1,366 | ) | −4.9 | % | ||||||||||||||||
| $ | 591,042 | $ | 64,130 | $ | 526,912 | $ | 483,242 | $ | 43,670 | 9.0 | % | |||||||||||||
The growth in commercial loans is a result of the Corporation’s efforts to increase the commercial loan portfolio as a percentage of total loans. A significant portion of this growth has been driven by the Corporation’s new business development team. Management expects to see continued growth in the commercial loan portfolio in 2008.
Agricultural and residential real estate mortgages loans have remained essentially unchanged since December 31, 2006. Management does anticipate, however, that these groups will increase slightly during 2008.
Excluding the effects of the Farwell acquisition, installment loans have been steadily decreasing over the past few years. This is a result of the increased competition from credit unions and financing offered from other non-financial institutions. Management does expect the current declining trend to continue in the future.
Equity securities without readily determinable fair values
The largest components of equity securities without readily determinable fair values are Federal Home Loan Bank Stock and Federal Reserve Bank Stock. The Corporation has purchased additional shares of stock as a result of the consolidation of the Bank’s charter as well as to fulfill stock requirements to borrow additional funds from the Federal Home Loan Bank.
78
Table of Contents
Deposits
The main source of funds for the Corporation is deposits. The deposit portfolio represents various types of non transaction accounts as well as savings accounts and time deposits.
The following table presents the composition of our deposit portfolio as of December 31:
| 2007 | 2006 | 2005 | ||||||||||
| Noninterest bearing demand deposits | $ | 84,846 | $ | 83,902 | $ | 73,839 | ||||||
| Interest bearing demand deposits | 105,526 | 111,406 | 104,251 | |||||||||
| Savings deposits | 196,682 | 178,001 | 153,397 | |||||||||
| Certificates of deposit | 311,976 | 320,226 | 250,246 | |||||||||
| Brokered certificates of deposit | 28,197 | 27,446 | 7,076 | |||||||||
| Internet certificates of deposit | 6,246 | 4,859 | 3,669 | |||||||||
Total | $ | 733,473 | $ | 725,840 | $ | 592,478 | ||||||
The following table presents the change in the deposit categories for the years ended December 31:
| 2007 | 2006 | 2005 | ||||||||||||||||||||||
| $ Change | % Change | $ Change | % Change | $ Change | % Change | |||||||||||||||||||
| Noninterest bearing demand deposits | $ | 944 | 1.1 | % | $ | 10,063 | 13.6 | % | $ | 8,103 | 12.3 | % | ||||||||||||
| Interest bearing demand deposits | (5,880 | ) | −5.3 | % | 7,155 | 6.9 | % | 2,889 | 2.9 | % | ||||||||||||||
| Savings deposits | 18,681 | 10.5 | % | 24,604 | 16.0 | % | (9,119 | ) | −5.6 | % | ||||||||||||||
| Certificates of deposit | (8,250 | ) | −2.6 | % | 69,980 | 28.0 | % | 15,984 | 6.8 | % | ||||||||||||||
| Brokered certificates of deposit | 751 | 2.7 | % | 20,370 | 287.9 | % | 7,076 | 100.0 | % | |||||||||||||||
| Internet certificates of deposit | 1,387 | 28.5 | % | 1,190 | 32.4 | % | 3,669 | 100.0 | % | |||||||||||||||
Total | $ | 7,633 | 1.1 | % | $ | 133,362 | 22.5 | % | $ | 28,602 | 5.1 | % | ||||||||||||
The following table presents the change in deposit categories for the year ended December 31, 2006, excluding the deposits acquired from The Farwell State Savings Bank:
| Less | ||||||||||||||||||||||||
| Deposits | Adjusted | |||||||||||||||||||||||
| Consolidated | Acquired | Consolidated | Consolidated | |||||||||||||||||||||
| 12/31/06 | from Farwell | 12/31/06 | 12/31/05 | $ Change | % Change | |||||||||||||||||||
| Noninterest bearing demand deposits | $ | 83,902 | $ | 10,472 | $ | 73,430 | $ | 73,839 | $ | (409 | ) | −0.6 | % | |||||||||||
| Interest bearing demand deposits | 111,406 | 8,660 | 102,746 | 104,251 | (1,505 | ) | −1.4 | % | ||||||||||||||||
| Savings deposits | 178,001 | 17,704 | 160,297 | 153,397 | 6,900 | 4.5 | % | |||||||||||||||||
| Certificates of deposit | 320,226 | 35,507 | 284,719 | 250,246 | 34,473 | 13.8 | % | |||||||||||||||||
| Brokered certificates of deposit | 27,446 | 995 | 26,451 | 7,076 | 19,375 | 273.8 | % | |||||||||||||||||
| Internet certificates of deposit | 4,859 | — | 4,859 | 3,669 | 1,190 | 32.4 | % | |||||||||||||||||
Total | $ | 725,840 | $ | 73,338 | $ | 652,502 | $ | 592,478 | $ | 60,024 | 10.1 | % | ||||||||||||
As shown in the preceding tables, the Corporation has observed consistent deposit growth over the past two years. In 2006, much of this growth came in the form of time sensitive deposits, including brokered and internet certificates of deposit. The majority of the 2007 growth was in savings deposits, which includes money market accounts. This change in mix is a direct result of the current interest rate environment. The rates paid on money market accounts have increased significantly during 2007 due to the increased competition for these deposits.
Within the banking industry there is agreement that competition from mutual funds and annuities has had a significant impact on deposit growth. In response, the Corporation now offers mutual funds and annuities to its customers. The Corporation’s trust department also offers a variety of financial products in addition to traditional estate services.
79
Table of Contents
The following table shows the average balances and corresponding interest rates paid on deposit accounts as of December 31:
| 2007 | 2006 | 2005 | ||||||||||||||||||||||
| Amount | Rate | Amount | Rate | Amount | Rate | |||||||||||||||||||
| Noninterest bearing demand deposits | $ | 80,128 | $ | 73,650 | $ | 69,610 | ||||||||||||||||||
| Interest bearing demand deposits | 109,370 | 1.72 | % | 105,476 | 1.58 | % | 103,684 | 0.97 | % | |||||||||||||||
| Savings deposits | 188,323 | 2.25 | % | 158,327 | 1.69 | % | 157,238 | 1.00 | % | |||||||||||||||
| Time deposits | 349,941 | 4.71 | % | 301,593 | 4.25 | % | 245,559 | 3.58 | % | |||||||||||||||
Total | $ | 727,762 | $ | 639,046 | $ | 576,091 | ||||||||||||||||||
The time remaining until maturity of time certificates and other time deposits of $100 or more at December 31, 2007 was as follows:
| Maturity | ||||
| Within 3 months | $ | 37,363 | ||
| Within 3 to 6 months | 29,011 | |||
| Within 6 to 12 months | 25,363 | |||
| Over 12 months | 40,582 | |||
Total | $ | 132,319 | ||
Borrowed Funds
As a result of the Corporation’s recent loan growth, desire to increase its investment in high quality tax exempt municipal bonds, and the increased level of competition for deposits, the Corporation has increased its other borrowings significantly over the past year. Management does anticipate that the Corporation will continue to increase its borrowings throughout 2008 (See Note 11 of the Consolidated Financial Statements).
Escrow Funds Payable
The Corporation observed a decrease in escrow funds payable during 2007. This decrease can be attributed to Internal Revenue Code Section (“IRC”) 1031 exchange account balances being reinvested by customers of IBT Title and Insurance Agency, Inc. (“IBT Title”). These IRC 1031 accounts allow owners of business or investment property to defer realized gains from the sale of business or investment property if the funds are reinvested in another property. As such, these balances can fluctuate significantly between periods as the funds are reinvested. The Corporation does not anticipate escrow funds payable to fluctuate significantly from current levels in 2008.
Accrued Interest and Other Liabilities
The Corporation observed a significant decline in accrued interest and other liabilities during 2007. This decrease can primarily be attributed to a decrease of $2,890 in the net amount recognized for the Corporation’s defined benefit pension plan primarily as a result of the plan curtailment (See Note 18 of the Consolidated Financial Statements).
Capital
The capital of the Corporation consists solely of common stock, capital surplus, retained earnings, and accumulated other comprehensive income / (loss). The Corporation offers dividend reinvestment and employee and director stock purchase plans. Under the provisions of these Plans, the Corporation issued 63,233 shares of common stock generating $2,657 of capital during 2007, and 61,258 shares of common stock generating $2,459 of capital in 2006. The Corporation also offers share based payment awards through its equity compensation plan (See Note 18 of the consolidated financial statements). Pursuant to this plan, the Corporation generated $758 and $470 of capital in 2007 and 2006, respectively. On March 22, 2007 the Board of Directors amended its repurchase plan to allow
80
Table of Contents
management to repurchase up to 150,000 shares of the Corporation’s common stock. Subsequent to this amendment, the Corporation repurchased 30,620 shares of stock. The Corporation also repurchased 12,600 shares of common stock during the first quarter of 2007 under the plan’s previous provisions. During 2007, a total of 43,220 shares were repurchased at an average price of $43.51 per share, without being adjusted for the 10% stock dividend paid February 29, 2008. There were no shares repurchased in 2006 or 2005. Accumulated other comprehensive loss decreased $3,221 and consists of a $417 increase in unrealized gain onavailable-for-sale investment securities, a $1,907 reduction in unrecognized actuarial losses of the defined benefit pension plan, principally attributable to a plan curtailment in March, 2007, and an $897 implementation adjustment related to the early adoption on January 1, 2007 of FASB Statement No. 159 (See Note 3 of the Consolidated Financial Statements). All of these adjustments are net of tax.
The Federal Reserve Board’s current recommended minimum primary capital to assets requirement is 6.0%. The Corporation’s primary capital to average assets, which consists of shareholders’ equity plus the allowance for loan losses less acquisition intangibles, was 11.50% at year end 2007. There are no commitments for significant capital expenditures.
The Federal Reserve Board has established a minimum risk based capital standard. Under this standard, a framework has been established that assigns risk weights to each category of on and off-balance-sheet items to arrive at risk adjusted total assets. Regulatory capital is divided by the risk adjusted assets with the resulting ratio compared to the minimum standard to determine whether a corporation has adequate capital. The minimum standard is 8%, of which at least 4% must consist of equity capital net of goodwill. The following table sets forth the percentages required under the Risk Based Capital guidelines and the Corporation’s values at December 31, 2007:
Percentage of Capital to Risk Adjusted Assets:
| IBT Bancorp | ||||||||
| December 31, 2007 | ||||||||
| Required | Actual | |||||||
| Equity Capital | 4.00 | % | 15.81 | % | ||||
| Secondary Capital | 4.00 | % | 1.20 | % | ||||
Total Capital | 8.00 | % | 17.01 | % | ||||
IBT Bancorp’s secondary capital includes only the allowance for loan losses. The percentage for the secondary capital under the required column is the maximum amount allowed from all sources.
The Federal Reserve also prescribes minimum capital requirements for the Corporation’s subsidiary Bank. At December 31, 2007, the Bank exceeded these minimums. For further information regarding the Bank’s capital requirements, refer to Note 17 of the Notes to the accompanying Consolidated Financial Statements, “Minimum Regulatory Capital Requirements”.
Liquidity
The primary sources of the Corporation’s liquidity are cash and cash equivalents, trading securities, andavailable-for-sale investment securities. These categories totaled $263,774 or 27.6% of assets as of December 31, 2007 as compared to $244,809 or 26.9% in 2006. Liquidity is important for financial institutions because of their need to meet loan funding commitments, depositor withdrawal requests and various other commitments discussed in the accompanying notes to consolidated financial statements. Liquidity varies significantly daily, based on customer activity.
Operating activities provided $60,387 of cash in 2007 as compared to using $1,789 in 2006. Net cash provided by financing activities equaled $38,470 in 2007 and $64,846 in 2006. The Corporation’s investing activities used cash amounting to $104,633 in 2007 and $62,533 in 2006. The accumulated effect of the Corporation’s operating, investing, and financing activities used $5,776 of cash in 2007 and provided $534 of cash in 2006.
The primary source of funds for the Bank is deposits. The Bank emphasizes interest-bearing time deposits as part of their funding strategy. The Bank also seeks noninterest bearing deposits, or checking accounts, which reduce the Bank’s cost of funds in an effort to expand the customer base.
81
Table of Contents
In recent periods, the Corporation has experienced some competitive challenges in obtaining additional deposits to fuel growth. As depositors continue to have wider access to the Internet and other real-time interest rate monitoring resources, deposit sourcing and pricing has become more competitive. Deposit growth is achievable, but at a competitive price. As a result of this increased competition, the Corporation (as discussed above) has begun to rely more and more on brokered, internet deposits, and other borrowed funds as a key funding source.
In addition to these primary sources of liquidity, the Corporation has the ability to borrow in the federal funds market and at both the Federal Reserve Bank and the Federal Home Loan Bank. The Bank has over $100,000 of available credit from these secondary sources. The Corporation’s liquidity is considered adequate by the management of the Corporation.
Interest Rate Sensitivity
Interest rate sensitivity is determined by the amount of earning assets and interest bearing liabilities repricing within a specific time period, and their relative sensitivity to a change in interest rates. Management also strives to achieve reasonable stability in the net interest margin through periods of changing interest rates. One tool used by management to measure interest rate sensitivity is gap analysis. As shown in the following table, the gap analysis depicts the Corporation’s position for specific time periods and the cumulative gap as a percentage of total assets.
Investment securities and other investments are scheduled according to their contractual maturity. Fixed rate loans are included in the appropriate time frame based on their scheduled amortization. Variable rate loans are included in the time frame of their earliest repricing. Of the $612,687 in total loans, $90,687 are variable rate loans. Time deposit liabilities are scheduled based on their contractual maturity except for variable rate time deposits in the amount of $1,960 that are included in the 0 to 3 month time frame.
Savings, NOW accounts, and money market accounts have no contractual maturity date and are believed to be predominantly noninterest rate sensitive by management. These accounts have been classified in the gap table according to their estimated withdrawal rates based upon management’s analysis of deposit runoff over the past five years. Management believes this runoff experience is consistent with its expectation for the future. As of December 31, 2007, the Corporation had $75,297 more liabilities than assets maturing within one year. A negative gap position results when more liabilities, within a specified time frame, mature or reprice than assets.
82
Table of Contents
Interest Rate Sensitivity
The following table shows the time periods and the amount of assets and liabilities available for interest rate repricing as of December 31, 2007. The interest rate sensitivity information for investment securities is based on the expected prepayments and call dates verses stated maturities. For purposes of this analysis, nonaccrual loans and the allowance for loan losses are excluded.
| 0 to 3 | 4 to 12 | 1 to 5 | Over 5 | |||||||||||||
| Months | Months | Years | Years | |||||||||||||
| Interest Sensitive Assets | ||||||||||||||||
| Trading securities | $ | 25,064 | $ | — | $ | — | $ | — | ||||||||
| Investment securities | 34,580 | 40,370 | 43,480 | 94,697 | ||||||||||||
| Loans | 126,723 | 88,411 | 335,360 | 58,037 | ||||||||||||
Total | $ | 186,367 | $ | 128,781 | $ | 378,840 | $ | 152,734 | ||||||||
| Interest Sensitive Liabilities | ||||||||||||||||
| Borrowed funds | $ | 24,387 | $ | 6,000 | $ | 47,500 | $ | 15,000 | ||||||||
| Time deposits | 73,266 | 154,784 | 118,232 | 137 | ||||||||||||
| Savings | 63,017 | 25,715 | 107,950 | — | ||||||||||||
| Interest bearing demand | 39,332 | 3,944 | 62,250 | — | ||||||||||||
Total | $ | 200,002 | $ | 190,443 | $ | 335,932 | $ | 15,137 | ||||||||
| Cumulative gap (deficiency) | $ | (13,635 | ) | $ | (75,297 | ) | $ | (32,389 | ) | $ | 105,208 | |||||
| Cumulative gap (deficiency) as a % of assets | (1.43 | )% | (7.87 | )% | (3.39 | )% | 11.00 | % | ||||||||
The following table shows the maturity of commercial and agricultural loans outstanding at December 31, 2007. Also provided are the amounts due after one year, classified according to the sensitivity to changes in interest rates.
| Due in | ||||||||||||||||
| 1 Year | 1 to 5 | Over 5 | ||||||||||||||
| or Less | Years | Years | Total | |||||||||||||
| Commercial and agricultural | $ | 65,822 | $ | 189,964 | $ | 29,927 | $ | 285,713 | ||||||||
| Interest Sensitivity | ||||||||||||||||
| Loans maturing after one year that have: | ||||||||||||||||
| Fixed interest rates | $ | 172,200 | $ | 28,530 | ||||||||||||
| Variable interest rates | 17,764 | 1,397 | ||||||||||||||
Total | $ | 189,964 | $ | 29,927 | ||||||||||||
Item 7 A. Quantitative and Qualitative Disclosures about Market Risk
The Corporation’s primary market risks are interest rate risk and, to a lesser extent, liquidity risk. The Corporation has no significant foreign exchange risk, holds limited loans outstanding to oil and gas concerns, and does not utilize interest rate swaps or derivatives, except for interest rate locks, in the management of its interest rate risk. Any changes in foreign exchange rates or commodity prices would have an insignificant impact, if any, on the Corporation’s interest income and cash flows. The Corporation does have a significant amount of loans extended to borrowers in agricultural production. The cash flow of such borrowers and ability to service debt is largely dependent on the commodity prices for corn, soybeans, sugar beets, milk, beef, and a variety of dry beans. The Corporation mitigates these risks by using conservative price and production yields when calculating a borrower’s available cash flow to service their debt.
Interest rate risk (“IRR”) is the exposure of the Corporation’s net interest income, its primary source of income, to changes in interest rates. IRR results from the difference in the maturity or repricing frequency of a financial
83
Table of Contents
institution’s interest earning assets and its interest bearing liabilities. IRR is the fundamental method in which financial institutions earn income and create shareholder value. Excessive exposure to IRR could pose a significant risk to the Corporation’s earnings and capital.
The Federal Reserve, the Corporation’s primary Federal regulator, has adopted a policy requiring the Board of Directors and senior management to effectively manage the various risks that can have a material impact on the safety and soundness of the Corporation. The risks include credit, interest rate, liquidity, operational, and reputational. The Corporation has policies, procedures and internal controls for measuring and managing these risks. Specifically, the IRR policy and procedures include defining acceptable types and terms of investments and funding sources, liquidity requirements, limits on investments in long term assets, limiting the mismatch in repricing opportunity of assets and liabilities, and the frequency of measuring and reporting to the Board of Directors.
The Corporation uses several techniques to manage IRR. The first method is gap analysis. Gap analysis measures the cash flowsand/or the earliest repricing of the Corporation’s interest bearing assets and liabilities. This analysis is useful for measuring trends in the repricing characteristics of the balance sheet. Significant assumptions are required in this process because of the imbedded repricing options contained in assets and liabilities. A substantial portion of the Corporation’s assets are invested in loans and investment securities with issuer call options. Loans have imbedded options that allow the borrower to repay the balance prior to maturity without penalty. The amount of prepayments is dependent upon many factors, including the interest rate of a given loan in comparison to the current interest rate for residential mortgages, the level of sales of used homes, and the overall availability of credit in the market place. Generally, a decrease in interest rates will result in an increase in the Corporation’s cash flows from these assets. A significant portion of the Corporation’s securities are callable. The call option is more likely to be exercised in a period of decreasing interest rates. Investment securities, other than those that are callable, do not have any significant imbedded options. Savings and checking deposits may generally be withdrawn on request without prior notice. The timing of cash flows from these deposits is estimated based on historical experience. Time deposits have penalties that discourage early withdrawals.
The second technique used in the management of IRR is to combine the projected cash flows and repricing characteristics generated by the gap analysis and the interest rates associated with those cash flows to project future interest income. By changing the amount and timing of the cash flows and the repricing interest rates of those cash flows, the Corporation can project the effect of changing interest rates on its interest income. Based on the projections prepared for the year ended December 31, 2007 the Corporation’s net interest income would increase during a period of decreasing interest rates.
84
Table of Contents
The following tables provide information about the Corporation’s assets and liabilities that are sensitive to changes in interest rates as of December 31, 2007 and 2006. The Corporation has no interest rate swaps, futures contracts, or other derivative financial options. The principal amounts of assets and time deposits maturing were calculated based on the contractual maturity dates. Savings and NOW accounts are based on management’s estimate of their future cash flows.
| December 31, 2007 | Fair Value | |||||||||||||||||||||||||||||||
| 2008 | 2009 | 2010 | 2011 | 2012 | Thereafter | Total | 12/31/07 | |||||||||||||||||||||||||
| (Dollars in thousands) | ||||||||||||||||||||||||||||||||
| Rate sensitive assets | ||||||||||||||||||||||||||||||||
| Other interest bearing assets | $ | 1,457 | $ | — | $ | — | $ | — | $ | — | $ | — | $ | 1,457 | $ | 1,457 | ||||||||||||||||
| Average interest rates | 3.21 | % | — | — | — | — | — | 3.21 | % | |||||||||||||||||||||||
| Trading securities | $ | 9,342 | $ | 2,213 | $ | 3,269 | $ | 2,750 | $ | 2,820 | $ | 4,670 | $ | 25,064 | $ | 25,064 | ||||||||||||||||
| Average interest rates | 4.86 | % | 4.86 | % | 4.20 | % | 4.34 | % | 3.50 | % | 6.98 | % | 4.96 | % | ||||||||||||||||||
| Fixed interest rate securities | $ | 74,950 | $ | 24,122 | $ | 8,450 | $ | 8,082 | $ | 2,826 | $ | 94,697 | $ | 213,127 | $ | 213,127 | ||||||||||||||||
| Average interest rates | 5.54 | % | 4.98 | % | 4.57 | % | 3.99 | % | 4.13 | % | 3.94 | % | 4.65 | % | ||||||||||||||||||
| Fixed interest rate loans | $ | 124,447 | $ | 99,132 | $ | 98,275 | $ | 78,152 | $ | 63,957 | $ | 58,037 | $ | 522,000 | $ | 523,454 | ||||||||||||||||
| Average interest rates | 6.72 | % | 6.65 | % | 6.87 | % | 7.25 | % | 7.28 | % | 6.50 | % | 6.86 | % | ||||||||||||||||||
| Variable interest rate loans | $ | 41,596 | $ | 14,613 | $ | 18,792 | $ | 4,796 | $ | 6,435 | $ | 4,455 | $ | 90,687 | $ | 90,687 | ||||||||||||||||
| Average interest rates | 7.94 | % | 7.67 | % | 7.66 | % | 7.52 | % | 7.31 | % | 7.56 | % | 7.75 | % | ||||||||||||||||||
| Rate sensitive liabilities | ||||||||||||||||||||||||||||||||
| Borrowed funds | $ | 30,387 | $ | 6,500 | $ | 24,000 | $ | — | $ | 17,000 | $ | 15,000 | $ | 92,887 | $ | 91,897 | ||||||||||||||||
| Average interest rates | 4.77 | % | 4.34 | % | 4.69 | % | — | 4.19 | % | 4.73 | % | 4.61 | % | |||||||||||||||||||
| Savings and NOW accounts | $ | 132,008 | $ | 71,320 | $ | 69,183 | $ | 23,972 | $ | 5,725 | $ | — | $ | 302,208 | $ | 302,208 | ||||||||||||||||
| Average interest rates | 2.61 | % | 1.15 | % | 0.62 | % | 0.59 | % | 0.86 | % | 0.00 | % | 1.62 | % | ||||||||||||||||||
| Fixed interest rate time deposits | $ | 226,090 | $ | 33,477 | $ | 42,835 | $ | 23,067 | $ | 18,853 | $ | 137 | $ | 344,459 | $ | 346,528 | ||||||||||||||||
| Average interest rates | 4.61 | % | 4.42 | % | 4.53 | % | 4.81 | % | 4.63 | % | 4.40 | % | 4.60 | % | ||||||||||||||||||
| Variable interest rate time deposits | $ | 1,375 | $ | 585 | $ | — | $ | — | $ | — | $ | — | $ | 1,960 | $ | 1,960 | ||||||||||||||||
| Average interest rates | 4.09 | % | 4.10 | % | — | — | — | — | 4.09 | % | ||||||||||||||||||||||
| December 31, 2006 | Fair Value | |||||||||||||||||||||||||||||||
| 2007 | 2008 | 2009 | 2010 | 2011 | Thereafter | Total | 12/31/06 | |||||||||||||||||||||||||
| Rate sensitive assets | ||||||||||||||||||||||||||||||||
| Other interest bearing assets | $ | 2,992 | $ | — | $ | — | $ | — | $ | — | $ | — | $ | 2,992 | $ | 2,992 | ||||||||||||||||
| Average interest rates | 4.63 | % | — | — | — | — | — | 4.63 | % | |||||||||||||||||||||||
| Fixed interest rate securities | $ | 76,761 | $ | 48,239 | $ | 21,380 | $ | 15,064 | $ | 12,983 | $ | 39,023 | $ | 213,450 | $ | 213,450 | ||||||||||||||||
| Average interest rates | 3.87 | % | 4.41 | % | 4.14 | % | 4.04 | % | 3.75 | % | 3.88 | % | 4.03 | % | ||||||||||||||||||
| Fixed interest rate loans | $ | 108,771 | $ | 100,331 | $ | 95,442 | $ | 75,359 | $ | 74,773 | $ | 37,267 | $ | 491,943 | $ | 494,209 | ||||||||||||||||
| Average interest rates | 6.45 | % | 6.41 | % | 6.47 | % | 6.55 | % | 7.17 | % | 6.25 | % | 6.56 | % | ||||||||||||||||||
| Variable interest rate loans | $ | 66,850 | $ | 12,598 | $ | 13,118 | $ | 4,301 | $ | 1,425 | $ | 807 | $ | 99,099 | $ | 99,099 | ||||||||||||||||
| Average interest rates | 5.93 | % | 8.81 | % | 8.63 | % | 8.76 | % | 8.26 | % | 9.21 | % | 6.84 | % | ||||||||||||||||||
| Rate sensitive liabilities | ||||||||||||||||||||||||||||||||
| Borrowed funds | $ | 23,489 | $ | 6,058 | $ | 8,500 | $ | 8,256 | $ | — | $ | 12,000 | $ | 58,303 | $ | 58,390 | ||||||||||||||||
| Average interest rates | 5.01 | % | 4.78 | % | 4.88 | % | 5.10 | % | — | 4.85 | % | 4.95 | % | |||||||||||||||||||
| Savings and NOW accounts | $ | 114,322 | $ | 78,084 | $ | 68,816 | $ | 22,601 | $ | 5,584 | $ | — | $ | 289,407 | $ | 289,407 | ||||||||||||||||
| Average interest rates | 3.14 | % | 1.37 | % | 0.70 | % | 0.73 | % | 0.92 | % | — | 1.85 | % | |||||||||||||||||||
| Fixed interest rate time deposits | $ | 231,238 | $ | 43,789 | $ | 22,518 | $ | 31,822 | $ | 16,433 | $ | 531 | $ | 346,331 | $ | 346,395 | ||||||||||||||||
| Average interest rates | 4.63 | % | 4.21 | % | 4.17 | % | 4.47 | % | 4.79 | % | 5.27 | % | 4.54 | % | ||||||||||||||||||
| Variable interest rate time deposits | $ | 5,771 | $ | 424 | $ | 5 | $ | — | $ | — | $ | — | $ | 6,200 | $ | 6,200 | ||||||||||||||||
| Average interest rates | 4.16 | % | 4.28 | % | 4.34 | % | — | — | — | 4.17 | % | |||||||||||||||||||||
85
Table of Contents
Forward Looking Statements
This report contains certain forward-looking statements within the meaning of Section 27A of the Securities Act of 1933, as amended, and Section 21E of the Securities Exchange Act of 1934, as amended. The Corporation intends such forward-looking statements to be covered by the safe harbor provisions for forward-looking statements contained in the Private Securities Reform Act of 1995, and is including this statement for purposes of these safe harbor provisions. Forward-looking statements, which are based on certain assumptions and describe future plans, strategies and expectations of the Corporation, are generally identifiable by use of the words “believe,” “expect,” “intend,” “anticipate,” “estimate,” “project,” or similar expressions. The Corporation’s ability to predict results or the actual effect of future plans or strategies is inherently uncertain. Factors which could have a material adverse effect on the operations and future prospects of the Corporation and the subsidiaries include, but are not limited to, changes in interest rates, general economic conditions, legislative/regulatory changes, monetary and fiscal policies of the U.S. Government including policies of the U.S. Treasury and the Federal Reserve Board, the quality or composition of the loan or investment portfolios, demand for loan products, deposit flows, competition, demand for financial services in the Corporation’s market area, and accounting principles, policies and guidelines. These risks and uncertainties should be considered in evaluating forward-looking statements and undue reliance should not be placed on such statements. Further information concerning the Corporation and its business, including additional factors that could materially affect the Corporation’s financial results, is included in the Corporation’s filings with the Securities and Exchange Commission.
COMMON STOCK AND DIVIDEND INFORMATION
There is no established market for the Corporation’s common stock or public information with respect to its market price. There are occasional sales by shareholders of which management of the Corporation is aware. The prices were reported to management in only some of the transactions and management cannot confirm the prices that were reported during this period. All of the information has been adjusted to reflect the 10% stock dividend, paid February 29, 2008.
| Number of | Number of | Sale Price | ||||||||||||||
Period | Sales | Shares | Low | High | ||||||||||||
| 2007 | ||||||||||||||||
| First Quarter | 52 | 43,366 | $ | 40.00 | $ | 40.00 | ||||||||||
| Second Quarter | 70 | 34,189 | 40.00 | 40.00 | ||||||||||||
| Third Quarter | 53 | 37,491 | 40.00 | 40.00 | ||||||||||||
| Fourth Quarter | 60 | 19,114 | 40.00 | 40.00 | ||||||||||||
| 235 | 134,160 | |||||||||||||||
| 2006 | ||||||||||||||||
| First Quarter | 27 | 20,903 | 40.00 | 40.00 | ||||||||||||
| Second Quarter | 46 | 33,663 | 40.00 | 40.00 | ||||||||||||
| Third Quarter | 45 | 14,876 | 40.00 | 40.00 | ||||||||||||
| Fourth Quarter | 46 | 22,359 | 40.00 | 40.00 | ||||||||||||
| 164 | 91,801 | |||||||||||||||
86
Table of Contents
The following table sets forth the cash dividends paid for the following quarters, adjusted for the 10% stock dividend paid on February 29, 2008.
| Per Share | ||||||||
| 2007 | 2006 | |||||||
| First Quarter | $ | 0.11 | $ | 0.10 | ||||
| Second Quarter | 0.11 | 0.10 | ||||||
| Third Quarter | 0.11 | 0.10 | ||||||
| Fourth Quarter | 0.29 | 0.28 | ||||||
Total | $ | 0.62 | $ | 0.58 | ||||
IBT Bancorp’s authorized common stock consists of 10,000,000 shares, of which 6,364,120 shares are issued and outstanding as of December 31, 2007. As of that date, there were 2,715 shareholders of record.
On March 22, 2007, the Board of Directors amended its repurchase plan to allow for the repurchase of up to 150,000 shares of the Corporation’s common stock. This authorization does not have an expiration date. The following table provides information as of December 31, 2007, with respect to this plan, and has not been adjusted for the 10% stock dividend paid February 29, 2008:
| Total Number of | ||||||||||||||||
| Shares Purchased | Maximum Number of | |||||||||||||||
| Shares Repurchased | as Part of Publicly | Shares That May Yet Be | ||||||||||||||
| Average Price | Announced Plan | Purchased Under the | ||||||||||||||
| Number | Per Share | or Program | Plans or Programs | |||||||||||||
| Balance, September 30, 2007 | 121,172 | |||||||||||||||
| October 1 - 31, 2007 | 1,792 | $ | 44.00 | 1,792 | 119,380 | |||||||||||
| November 1 - 30, 2007 | — | — | — | 119,380 | ||||||||||||
| December 1 - 31, 2007 | — | — | — | 119,380 | ||||||||||||
Balance, December 31, 2007 | 1,792 | $ | 44.00 | 1,792 | 119,380 | |||||||||||
Information concerning Securities Authorized for Issuance Under Equity Compensation Plans appears under “Item 12. Security Ownership of Certain Beneficial Owners and Management and Related Shareholder Matters” included elsewhere in this annual report onForm 10-K.
87
Table of Contents
Stock Performance
The following graph compares the cumulative total shareholder return on Corporation common stock for the last five years with the cumulative total return on (1) the NASDAQ Stock Market Index, which is comprised of all United States common shares traded on the NASDAQ and (2) the NASDAQ Bank Stock Index, which is comprised of bank and bank holding company common shares traded on the NASDAQ over the same period. The graph assumes the value of an investment in the Corporation and each index was $100 at December 31, 2002 and all dividends are reinvested.
Stock Performance
Five-Year Total Return
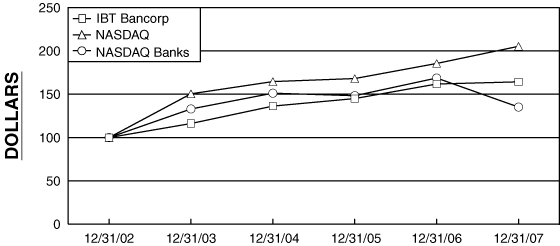
The dollar values for total shareholder return plotted in the graph above are shown in the table below:
Comparison of Five Year Cumulative
Among IBT Bancorp, NASDAQ Stock Market,
and NASDAQ Bank Stock
Among IBT Bancorp, NASDAQ Stock Market,
and NASDAQ Bank Stock
| NASDAQ | ||||||||||||
Year | IBT Bancorp | NASDAQ | Banks | |||||||||
| 12/31/2002 | 100.0 | 100.0 | 100.0 | |||||||||
| 12/31/2003 | 116.2 | 150.5 | 133.0 | |||||||||
| 12/31/2004 | 136.3 | 164.6 | 151.2 | |||||||||
| 12/31/2005 | 145.0 | 168.1 | 148.3 | |||||||||
| 12/31/2006 | 161.8 | 185.5 | 168.7 | |||||||||
| 12/31/2007 | 164.3 | 205.3 | 135.2 | |||||||||
88
Table of Contents
SHAREHOLDERS’ INFORMATION
Annual Meeting
The Annual Meeting of Shareholders will be held at 5:00 p.m., Tuesday, May 13, 2008, Comfort Inn, 2424 S. Mission Street, Mt. Pleasant, Michigan.
Financial Information andForm 10-K
Copies of the 2007 Annual Report, IBT BancorpForm 10-K, and other financial information not contained herein may be obtained, without charge, by writing to:
| Debra Campbell |
Secretary
IBT Bancorp
200 East Broadway
Mt. Pleasant, Michigan 48858
Mission Statement
The mission of IBT Bancorp shall be:
To create an operating environment that will provide shareholders with sustained growth in their investment while maintaining our independence and subsidiaries’ autonomy.
Equal Employment Opportunity
The equal employment opportunity clauses in Section 202 of the Executive Order 11246, as amended; 38 USC 2012, Vietnam Era Veterans Readjustment Act of 1974; Section 503 of the Rehabilitation Act of 1973, as amended; relative to equal employment opportunity and implementing rules and regulations of the Secretary of Labor are adhered to and supported by IBT Bancorp, and its subsidiaries.
89
Table of Contents
Appendix A

CHARTER OF THE AUDIT COMMITTEE OF THE
BOARD OF DIRECTORS OF IBT BANCORP, INC.
| I. | ORGANIZATION |
The members of the Audit Committee are appointed annually by the Board of Directors (the “Board”) of IBT Bancorp, Inc. (the “Corporation”) from among the Corporation’s directors. The members shall serve until their successors are duly elected and qualified by the Board. The Board determines the number of members on the Audit Committee from time to time, but the number will not be less than the minimum number prescribed by applicable law or the Corporation’s Bylaws. In no event will such number of members be less than five (5). Audit Committee members must fully satisfy independence and experience requirements as prescribed by Rule 4200(a) (15) of the National Association of Securities Dealers’ listing standards, Section 10A of the Securities Exchange Act of 1934 (the “Exchange Act”) and the rules and regulations of the Securities and Exchange Commission (“SEC”), and the Federal Deposit Insurance Corporation Improvement Act of 1991 (“FDICIA”) and applicable rules and regulations there under. In general, these rules require that the Audit Committee member not have any relationship which would interfere with the exercise of independent judgment in carrying out the responsibilities of a director.
At least one member of the Audit Committee shall be a “financial expert” as defined by the rules of the SEC. In general, to be considered a “financial expert”, an audit committee member must have the following attributes:
| • | An understanding of generally accepted accounting principles (“GAAP”) and financial statements; | |
| • | The ability to assess the general application of GAAP in connection with the accounting for estimates, accruals and reserves; | |
| • | Experience preparing, auditing, analyzing or evaluating financial statements that present a breadth and level of complexity of accounting issues that are generally comparable to the breadth and complexity of issues that can reasonably be expected to be raised by the Corporation’s financial statements, or experience actively supervising one or more persons engaged in such activities; | |
| • | An understanding of internal controls and procedures for financial reporting; and | |
| • | An understanding of audit committee functions. |
All members of the Audit Committee shall have a strong level of accounting or financial acumen and shall be able to read and understand fundamental financial statements at the time of their appointment to the Audit Committee. No member of the Audit Committee may be an “affiliated person” of the Corporation or any of its subsidiaries (as defined in the federal securities laws). In general, an affiliated person is a person who is an employee of the Corporation or who was an employee of the Corporation within the three previous years.
Director’s fees are the only compensation that an Audit Committee member may receive directly or indirectly from or on behalf of the Corporation.
The Board will appoint one of the members of the Audit Committee to serve as Audit Committee Chair. The Audit Committee may also appoint a Secretary, who need not be a director.
The Audit Committee has the authority, to the extent it deems necessary or appropriate, to retain independent legal, accounting or other advisors. The Audit Committee shall also have the authority, to the extent it deems necessary or appropriate, to ask the Corporation to provide the Audit Committee with the support of one or more Corporation employees to assist it in carrying out its duties. The Corporation shall provide for appropriate funding, as determined solely by the Audit Committee, for payment of compensation to the independent auditors for the purpose of rendering or issuing an audit report and to any other advisors employed by the Audit Committee, and for
A-1
Table of Contents
the ordinary administrative expenses of the Audit Committee that are necessary or appropriate in carrying out its duties. The Audit Committee may request any officer or employee of the Corporation or the Corporation’s outside counsel, independent auditors or other advisors to attend a meeting of the Audit Committee or to meet with any members of, or consultant to, the Audit Committee.
The Audit Committee is directly and solely responsible for the appointment, compensation, and oversight of the work of the independent auditor (including resolution of disagreements between management and the auditors regarding financial reporting) for the purpose of preparing or issuing an audit report or related work. The independent auditors shall report directly to the Audit Committee.
The Audit Committee shall provide assistance to the corporate directors in fulfilling their responsibility to the shareholders, potential shareholders, outside auditors, government agencies, and investment community relating to corporate accounting, reporting practices of the Corporation, and the quality and integrity of the financial reports of the Corporation. In so doing, it is the responsibility of the Audit Committee to maintain free and open means of communication between the directors, the independent auditors, the internal auditors, and the senior management of the Corporation.
| II. | STATEMENT OF POLICY AND PURPOSE OF THE AUDIT COMMITTEE |
The Audit Committee shall provide assistance to the Board by monitoring:
| 1) | the integrity of the financial statements of the Corporation; | |
| 2) | the independent auditors’ qualifications and independence; | |
| 3) | the performance of the Corporation’s and its subsidiaries’ internal audit function and independent auditors; | |
| 4) | the Corporation’s system of internal controls; | |
| 5) | the Corporation’s financial reporting and system of disclosure controls; and | |
| 6) | the compliance by the Corporation with legal and regulatory requirements and with the Corporation’s Code of Business Conduct and Ethics. |
The Audit Committee shall prepare the Audit Committee report required by the rules of the SEC to be included in the Corporation’s annual proxy statement.
The Audit Committee’s job is one of oversight as set forth in this charter. It is not the duty of the Audit Committee to prepare the Corporation’s financial statements, to plan or conduct audits, or to determine that the Corporation’s financial statements are complete and accurate and are in accordance with GAAP. The Corporation’s management is responsible for preparing the Corporation’s financial statements and for maintaining internal controls, and the independent auditors are responsible for auditing the financial statements. Nor is it the duty of the Audit Committee to conduct investigations or to assure compliance with laws and regulations and the Corporation’s Code of Business Conduct and Ethics.
III. RESPONSIBILITIES OF THE AUDIT COMMITTEE
A. Charter Review
| 1. | Review and reassess the adequacy of this charter at least annually and recommend to the Board any proposed changes to this charter; and | |
| 2. | Publicly disclose the charter and any such amendments at the times and in the manner as required by the SECand/or any other regulatory body having authority over the Corporation. |
B. Financial Reporting/Internal Controls
| 1. | Review and discuss with the internal auditors and the independent auditors their respective annual audit plans, reports and the results of their respective audits; |
A-2
Table of Contents
| 2. | Review and discuss with management and the independent auditors the Corporation’s quarterly financial statements and itsForm 10-Q (prior to filing the same as required by the Exchange Act), including disclosures made in the section regarding management’s discussion and analysis, the results of the independent auditors’ reviews of the quarterly financial statements, and determine whether the quarterly financial statements should be included in the Corporation’s Form10-Q; | |
| 3. | Review and discuss with management and the independent auditors the Corporation’s annual audited financial statements and its Form10-K (prior to filing the same as required by the Exchange Act), including disclosures made in the section regarding management’s discussion and analysis, and recommend to the Board whether the audited financial statements should be included in the Corporation’sForm 10-K; | |
| 4. | Review and discuss with management, and where appropriate, the independent auditors, the Corporation’s financial disclosures in its registration statements, press releases, earnings releases, current reports, real time disclosures, or other public disclosures before the same are filed, posted, disseminated or released, including the use of “pro forma” or “adjusted” non-GAAP information, all reconciliations of the same, and any earnings guidance, as well as all financial information provided to rating agenciesand/or securities analysts including presentations at industry, investor or other conferences; | |
| 5. | Review and discuss with the Corporation’s Chief Executive Officer and Chief Financial Officer all matters such officers are required to certify in connection with the Corporation’sForm 10-Q and10-K or other filings or reports; | |
| 6. | Discuss with management and the independent auditors, significant financial reporting issues and judgments made in connection with the preparation of the Corporation’s financial statements, including any significant changes in the Corporation’s selection or application of accounting principles, the development, selection and disclosure of critical accounting estimates and principles and the use thereof, and analyses of the effect of alternative assumptions, estimates, principles or GAAP methods on the Corporation’s financial statements; | |
| 7. | Discuss with management and the independent auditors the effect of regulatory and accounting initiatives and off-balance sheet transactions on the Corporation’s financial statements, conditions or results and any necessary disclosures related thereto; | |
| 8. | Discuss with management the Corporation’s major financial risk exposures and the steps management has taken to monitor and control such exposures, including the Corporation’s risk assessment and risk management policies; | |
| 9. | Discuss with management, the Corporation’s major components of internal control over financial reporting and steps management has taken to ensure adequate internal control over financial reporting exists; |
| 10. | Discuss with the independent auditors the matters required to be discussed by Statement of Auditing Standards No. 61, Regulation S-X, Rule 207 and Independence Standard 1. These matters include, but are not limited to: |
a. The auditor’s responsibility under generally accepted auditing standards.
b. Significant findings from the audit
c. Significant accounting polices.
d. Management’s judgments and accounting estimates.
e. Significant audit adjustments.
f. The auditor’s judgments about the quality of the Corporation’s accounting practices.
g. Other information in documents containing audited financial statements.
A-3
Table of Contents
h. Disagreements with management.
i. Consultation with other accountants.
j. Major issues discussed with management prior to retention.
k. Major issues, if any, arising from the audit that were discussed, or the subject of correspondence, with management, such as any management letter or schedule of unadjusted differences .
l. Difficulties encountered in performing the audit.
m. Independence.
| 11. | Discuss with the independent auditors any deficiencies in internal control over financial reporting as required by Auditing Standards No. 2; | |
| 12. | Confirm that the Corporation’s independent auditors report to the Audit Committee all of the Corporation’s critical accounting policies and procedures and alternative accounting treatments of financial information within GAAP that have been discussed with management, including the ramifications of the use of such alternative treatments and disclosures and the treatment preferred by the independent auditors; | |
| 13. | Confirm that the Corporation’s independent auditors share with the Audit Committee all material written communication between the auditors and management; | |
| 14. | Discuss with the Corporation’s independent auditors, internal auditors, and management their assessments of the adequacy of the Corporation’s internal controls and disclosure controls and procedures; | |
| 15. | Assess whether management is resolving any internal control weaknesses diligently; | |
| 16. | Discuss with the Corporation’s independent auditors, internal auditors and management as appropriate the Corporation’s FDICIA internal controls report and the attestation of the Corporation’s independent auditors to the same; | |
| 17. | Discuss with the Corporation’s independent auditors, internal auditors and management as appropriate any weaknesses or deficiencies that any of the foregoing have identified relating to financial reporting, internal controls or other related matters and their proposals for rectifying such weaknesses or deficiencies; | |
| 18. | Monitor the Corporation’s progress in promptly addressing and correcting any and all identified weaknesses or deficiencies in financial reporting, internal controls or related matters; | |
| 19. | Receive periodic reports from the independent auditors and appropriate officers of the Corporation on significant accounting or reporting developments proposed by the Financial Accounting Standards Board or the SEC that may impact the Corporation; and | |
| 20. | Receive periodic reports from independent auditors and appropriate officers of the Corporation on significant financial reporting, internal controls or other related matters of the Corporation’s subsidiaries. |
C. Independent Auditors
| 1. | Retain, terminate, compensate, review and oversee the work of the independent auditors (including resolution of disagreements between management and the auditors regarding financial reporting); | |
| 2. | The outside auditor is ultimately responsible to the Board of Directors and the Audit Committee, as representatives of the shareholders. In connection with this duty, the Committee shall receive on an annual basis a written statement from the outside auditor detailing all relationships between the outside auditor and the Corporation; |
A-4
Table of Contents
| 3. | Review the experience, rotation and qualifications of the senior members of the independent auditors’ team; | |
| 4. | Monitor the independence, qualifications and performance of the independent auditors including, but not limited to, consideration of whether the provision of any non-audit services is compatible with maintaining the auditors’ independence, and taking into account the opinions of management and the internal auditors; | |
| 5. | Meet with the independent auditors prior to each annual audit to discuss the planning and staffing of the audit; | |
| 6. | Pre-approve all auditing services and permitted non-audit services to be performed for the Corporation by the independent auditors or any other auditing or accounting firm, except as provided in this paragraph. In no event shall the independent auditors perform any non-audit services for the Corporation which are prohibited by Section 10A(g) of the Exchange Act or the rules of the SEC or the Public Company Accounting Oversight Board (or other similar body as may be established from time to time). Examples of the types of services that are generally prohibited include: |
| a. | Bookkeeping or other services related to the accounting records or financial statements of the audit client; | |
| b. | Financial information systems design and implementation; | |
| c. | Appraisal or valuation services, fairness opinions, orcontribution-in-kind reports; |
| d. | Actuarial services; |
| e. | Internal audit outsourcing services; |
| f. | Management functions or human resources; |
| g. | Broker or dealer, investment adviser, or investment banking services; | |
| h. | Legal services and expert services unrelated to the audit; and |
| i. | Any other service that the Public Company Accounting Oversight Board determines, by regulation, is impermissible. |
| 7. | The Audit Committee shall establish general guidelines for the permissible scope and nature of any permitted non-audit services in connection with its annual review of the audit plan and shall review such guidelines with the Board. Pre-approval may be granted by action of the full Audit Committee or, in the absence of such Audit Committee, action by the Audit Committee Chair whose action shall be considered to be that of the entire Audit Committee. Pre-approval shall not be required for the provision of non-audit services if (i) the aggregate amount of all such non-audit services constitutes no more than 5% of the total amount of revenues paid by the Corporation to the auditors during the fiscal year in which the non-audit services are provided, (ii) such services were not recognized by the Corporation at the time of engagement to be non-audit services, and (iii) such services are promptly brought to the attention of the Audit Committee and approved prior to the completion of the audit. Approval of a non-audit service to be performed by the auditors and, if applicable, the guidelines pursuant to which such services were approved, shall be disclosed when required as promptly as practicable in the Corporation’s quarterly or annual reports required by Section 13(a) of the Exchange Act; | |
| 8. | Oversee the rotation of the lead (or coordinating) audit partner having primary responsibility for the audit and the audit partner responsible for reviewing the audit at least once every five years and considering whether, in order to assure continuing auditor independence, it is appropriate to rotate the auditing firm itself from time to time; | |
| 9. | Recommend to the Board, policies for the Corporation’s hiring of employees or former employees of the independent auditors who participated in any capacity in an audit of the Corporation, including in |
A-5
Table of Contents
| particular the prohibition on employment under Section 10A (1) of the Exchange Act as chief executive officer, controller, chief financial officer, chief accounting officer, or any person serving in an equivalent position for the Corporation, during the preceding one-year period; and |
| 10. | Ensure that the independent auditors have access to all necessary Corporation personnel, records or other resources. |
| D. | Internal Audit Function |
| 1. | Review and oversee the appointment, performance and replacement of the senior internal audit executive; | |
| 2. | Review and approve any plan to outsource the internal audit function and if so approved, review and oversee the appointment, performance and replacement of the auditors; | |
| 3. | Review the internal audit plan and assess whether it is consistent with the Corporation’s needs; | |
| 4. | To the extent applicable, review the significant reports to management prepared by the internal auditing department and management’s responses; | |
| 5. | Review and discuss with the internal auditors the results of their work (including their audit report) as well as their control risk assessment; | |
| 6. | Ensure that internal auditors do not have responsibilities that conflict with their monitoring role; | |
| 7. | Discuss with the independent auditors and approve the internal audit department responsibilities, budget and staffing and any recommended changes in the planned scope of the internal audit; | |
| 8. | Ensure that internal auditors adhere to professional standards and receive adequate training annually; and | |
| 9. | Ensure that the internal auditors have access to all necessary Corporation resources. |
| E. | Compliance Oversight |
| 1. | Discuss with management and the internal auditors the Corporation’s processes regarding compliance with applicable laws and regulations and with the Corporation’s Code of Business Conduct and Ethics, obtain information from management, the Corporation’s senior internal auditing executive and the independent auditors regarding compliance by the Corporation and its subsidiary/affiliated entities with applicable legal requirements and the Corporation’s Code of Business Conduct and Ethics and from time to time advise the Board with respect to the same; | |
| 2. | Obtain from the independent auditors any reports required to be furnished to the Audit Committee under Section 10A of the Exchange Act or an assurance that Section 10A of the Exchange Act has not been implicated (Section 10A requires the independent auditors to report certain illegal acts. In addition, Section 10A addresses reports of critical accounting policies and practices used, alternative treatments of financial information within GAAP that have been discussed with management and other material written communications between the independent auditors and management); | |
| 3. | Review procedures designed to identify related party transactions that are material to the financial statements or otherwise require disclosure; | |
| 4. | Establish procedures and require the Corporation to obtain or provide the necessary resources and mechanisms for (i) the receipt, retention and treatment of complaints received by the Corporation regarding accounting, internal accounting controls or auditing matters, and (ii) the confidential, anonymous submission by employees of the Corporation of concerns regarding questionable accounting or auditing matters; | |
| 5. | Discuss with management and the independent auditors any correspondence with regulators or governmental agencies and any employee complaints or published reports which raise material |
A-6
Table of Contents
| issues regarding the Corporation’s financial statements or accounting policies or compliance with the Corporation’s Code of Business Conduct and Ethics; and |
| 6. | Discuss with the Corporation’s general counsel legal matters that may have a material impact on the financial statements and that may have an impact on the Corporation’s compliance policies. |
| F. | General |
| 1. | Meet as often as the Audit Committee or the Audit Committee Chair determines, but not less frequently than quarterly; | |
| 2. | On a regular basis, as appropriate, meet separately with management (especially the Chief Financial Officer), the internal auditors, and with the independent auditors; | |
| 3. | Report to the Board on the Audit Committee’s activities at each Board meeting; | |
| 4. | Maintain minutes or other records of the Audit Committee’s meetings and activities; | |
| 5. | Review and assess the quality and clarity of the information provided to the Audit Committee and make recommendations to management, and the independent auditors as the Audit Committee deems appropriate from time to time for improving such materials; | |
| 6. | Form and delegate authority to subcommittees or members when appropriate; | |
| 7. | Prepare, or oversee the preparation of, the Audit Committee report to be included in the Corporation’s proxy statement when and as required by the rules of the SEC; and | |
| 8. | Annually review the performance of the Audit Committee. |
In performing their duties and responsibilities, Audit Committee members are entitled to rely in good faith on information, opinions, reports or statements prepared or presented by:
| • | One or more officers or employees of the Corporation whom the Audit Committee member reasonably believes to be reliable and competent in the matters presented; | |
| • | Counsel, independent auditors, or other persons as to matters which the Audit Committee member reasonably believes to be within the professional or expert competence of such person; or | |
| • | Another committee of the Board as to matters within its designated authority which committee the Audit Committee member reasonably believes to merit confidence. |
Reviewed and approved by IBT Bancorp Audit Committee: May 7, 2007
Approved by IBT Bancorp Board of Directors: May 17, 2007
A-7
Table of Contents
Appendix B
IBT BANCORP, INC.
NOMINATING AND CORPORATE GOVERNANCE COMMITTEE CHARTER
NOMINATING AND CORPORATE GOVERNANCE COMMITTEE CHARTER
Purpose
The primary objectives of the Nominating and Corporate Governance Committee of the Board of Directors of IBT Bancorp, Inc. are to identify individuals qualified to become Board members, and to recommend that the Board elect the director nominees for the next annual meeting of shareholders or to elect such directors in the interim; to lead in the annual review of Board performance; and to engage in such other activities as may be delegated to the Committee from time to time by the Board of Directors.
Membership
The Committee shall be comprised of no fewer than 3 members, all independent under NASD Rule 4200 (a)(15) and shall satisfy such other requirements as shall be provided in the Corporation’s Bylaws or as the Board shall otherwise determine.
The members of the Committee and the Committee Chair shall be appointed, and may be replaced, by the Board upon consideration of the recommendations of the Nominating Committee. Changes in Committee composition and leadership shall be considered at the annual organizational meeting of the Board. However, the Board reserves the authority to make changes to Committee composition and leadership at any time. Committee members and the Chair shall serve until they are replaced, they resign, or their successors are duly elected and qualified.
Meetings
The Committee shall meet as often as may be deemed necessary or appropriate, but no fewer than 2 times annually. The Committee may ask members of management or others to attend meetings or to provide relevant information. The Committee shall periodically meet in executive session absent management.
The Nominating and Corporate Governance Committee shall maintain a high degree of independence both in establishing its agenda and directly accessing various members of management.
Responsibilities and Duties
The Committee shall be responsible for matters related to service on the Board of Directors of the Corporation and associated issues of corporate governance. To fulfill its responsibilities, the Committee shall:
| 1. | Review with the Board the criteria for Board membership. | |
| 2. | Review the qualifications of individuals for consideration as director candidates and recommend individual director candidates for election. Among the qualifications considered in the selection of candidates: business skills and experiences, prominence and reputation in their profession, a broad business and social perspective, concern for the long-term interests of the shareholders, and personal integrity and sound judgment. In addition, directors must have time available to devote to Board activities. | |
| 3. | Prior to each annual meeting of shareholders, recommend to the Board of Directors the individuals to constitute the nominees of the Board of Directors, for whom the Board will solicit proxies. | |
| 4. | Recommend to the Board of Directors candidates to fill any vacancies on the Board of Directors. | |
| 5. | After consultation with the Chairman and Chief Executive Officer, formally review each Director’s continuation on the Board prior to their nomination for re-election. | |
| 6. | After consultation with the Chairman and Chief Executive Officer and taking into consideration the preference of individual directors, recommend to the Board the membership, including the chair, of each standing committee. |
B-1
Table of Contents
| 7. | Be responsible for the orientation process for new Directors and advising independent Directors on suggestions for their continuing education. | |
| 8. | Make recommendations annually to the Board as to the independence of Directors as defined by the Corporation’s Bylaws and the NASD and SEC. | |
| 9. | In consultation with the Chairman and Chief Executive Officer, assure review at Board meetings of topics suggested by Directors. |
| 10. | Periodically review and recommend to the Board revisions, as appropriate, to the Board’s Code of Business Conduct and Ethics and other corporate governance guidelines. | |
| 11. | Receive comments from all Directors and review annually the overall effectiveness of the Board and recommend improvements where warranted. | |
| 12. | Periodically review the adequacy of this Charter. | |
| 13. | Regularly report on Committee activities and findings to the Board. | |
| 14. | To review and recommend nominees for membership of subsidiary board of directors to IBT Bancorp’s Board of Directors. | |
| 15. | Have and exercise such other powers, authority and responsibilities as may be determined by the Board of Directors. |
The responsibilities and duties set forth above are meant to serve as a guide, with the understanding that the Committee may diverge from the specific duties enumerated as necessary or appropriate given the circumstances.
Committee Authority
The Committee shall undertake any other action or exercise such other powers, authority and responsibilities as necessary or appropriate to the discharge of the responsibilities and duties set forth in this Charter or the Corporation’s Bylaws, or otherwise required by other applicable laws, rules or regulations, or as shall otherwise be determined by the Board.
In discharging its responsibilities and duties, the Committee is empowered to investigate any matter brought to its attention that it determines to be within the scope of its authority with full access to all books, records, facilities and personnel of the Corporation. The Committee has the power to retain outside counsel or other consultants or experts for this purpose, or to advise the Committee, and shall receive funding from the Corporation to engage such advisors.
The Committee shall have the sole authority to retain (and terminate), set retention terms and approve the fees of any search firm used to identify director candidates or any outside counsel or advisor it seeks to provide such advice as the Committee shall deem necessary to the discharge of its responsibilities and duties.
The Committee may delegate authority to individuals or subcommittees when it deems appropriate. However, in delegating authority it shall not absolve itself from the responsibilities it bears under the terms of this Charter.
B-2
Table of Contents
IBT BANCORP PROXY
200 EAST BROADWAY
MT. PLEASANT, MI 48858
200 EAST BROADWAY
MT. PLEASANT, MI 48858
THIS PROXY IS SOLICITED ON BEHALF OF THE BOARD OF DIRECTORS
The undersigned hereby appoints Richard J. Barz, Sandra L. Caul, and W. Michael McGuire as proxies, each with the power to appoint his/her substitute, and hereby authorizes them to represent and to vote as designated below, all the shares of Common Stock of IBT Bancorp held of record by the undersigned on April 1, 2008 at the annual meeting of shareholders to be held on May 13, 2008 or any adjournments thereof.
| 1) | ELECTION OF DIRECTORS: | |||||||
| FOR ALL NOMINEES LISTED BELOW EXCEPT AS MARKED TO THE CONTRARY BELOW | o | WITHHOLD AUTHORITY TO VOTE FOR ALL NOMINEES LISTED | o |
(INSTRUCTION: TO WITHHOLD AUTHORITY TO VOTE FOR ANY INDIVIDUAL NOMINEE, CIRCLE THE NOMINEE’S NAME IN THE LIST BELOW.)
WILLIAM J. STRICKLER DALE WEBURG DAVID J. MANESS
(CONTINUED AND TO BE SIGNED ON OTHER SIDE)
Table of Contents
| 2) | To approve the amendment to the Articles of Incorporation to increase the number of authorized shares of Common Stock from 10,000,000 to 15,000,000 | |||||
| ___ IN FAVOR OF AMENDMENT | ___ OPPOSED TO AMENDMENT | ___ ABSTAIN | ||||
| 3) | To approve the amendment to the Articles of Incorporation to change the name of the Corporation from IBT Bancorp, Inc. to Isabella Bank Corporation. | |||||
| ___ IN FAVOR OF AMENDMENT | ___ OPPOSED TO AMENDMENT | ___ ABSTAIN | ||||
This proxy, when properly executed, will be voted in the manner directed herein by the undersigned shareholder. IF NO DIRECTION IS MADE, THIS PROXY WILL BE VOTED TO ELECT ALL NOMINEES AND FOR PROPOSALS 2 and 3. The shares represented by this proxy will be voted in the discretion of the proxies on any other matters which may come before the meeting.
Please sign below as your name appears on the label. When shares are held by joint tenants, both should sign. When signing as attorney, executor, administrator, trustee or guardian, please give full title as such. If a corporation, please sign full corporate name by the President or other authorized officer. If a partnership, please sign in partnership name by authorized person.
Dated: , 2008 Please mark, sign, date and return Proxy card promptly using the enclosed envelope. | ||||