
Subordinated Notes Offering June 2020 David J. Nasca President & Chief Executive Officer John B. Connerton Executive Vice President & Chief Financial Officer Dale M. McKim III Executive Vice President & Chief Risk Officer Exhibit 99.2
Safe Harbor Statement This presentation includes "forward looking statements" within the meaning of the Private Securities Litigation Reform Act of 1995. Such forward-looking statements include, but are not limited to, statements concerning future business, revenue and earnings. These statements are not historical facts or guarantees of future performance, events or results. There are risks, uncertainties and other factors that could cause the actual results of Evans Bancorp to differ materially from the results expressed or implied by such statements. Factors that may cause actual results to differ materially from those contemplated by such forward-looking statements include the impacts from COVID-19, competitive pressures among financial services companies, interest rate trends, general economic conditions, changes in legislation or regulatory requirements, effectiveness at achieving stated goals and strategies, and difficulties in achieving operating efficiencies. These risks and uncertainties are more fully described in Evans Bancorp’s Annual and Quarterly Reports filed with the Securities and Exchange Commission. Forward-looking statements speak only as of the date they are made. Evans Bancorp undertakes no obligation to publicly update or revise forward-looking information, whether as a result of new, updated information, future events or otherwise.
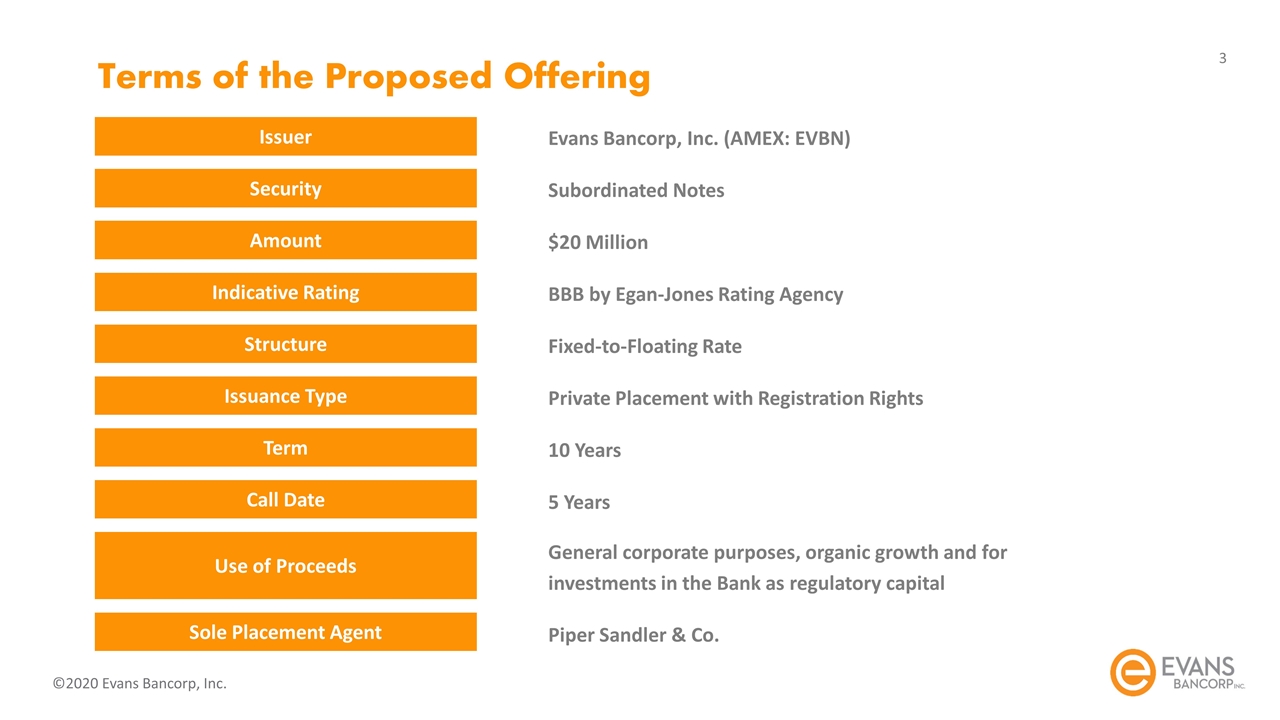
Terms of the Proposed Offering Security Amount Indicative Rating Structure Issuance Type Term Call Date Use of Proceeds Issuer Evans Bancorp, Inc. (AMEX: EVBN) Sole Placement Agent Subordinated Notes $20 Million BBB by Egan-Jones Rating Agency Fixed-to-Floating Rate Private Placement with Registration Rights 10 Years 5 Years General corporate purposes, organic growth and for investments in the Bank as regulatory capital Piper Sandler & Co.
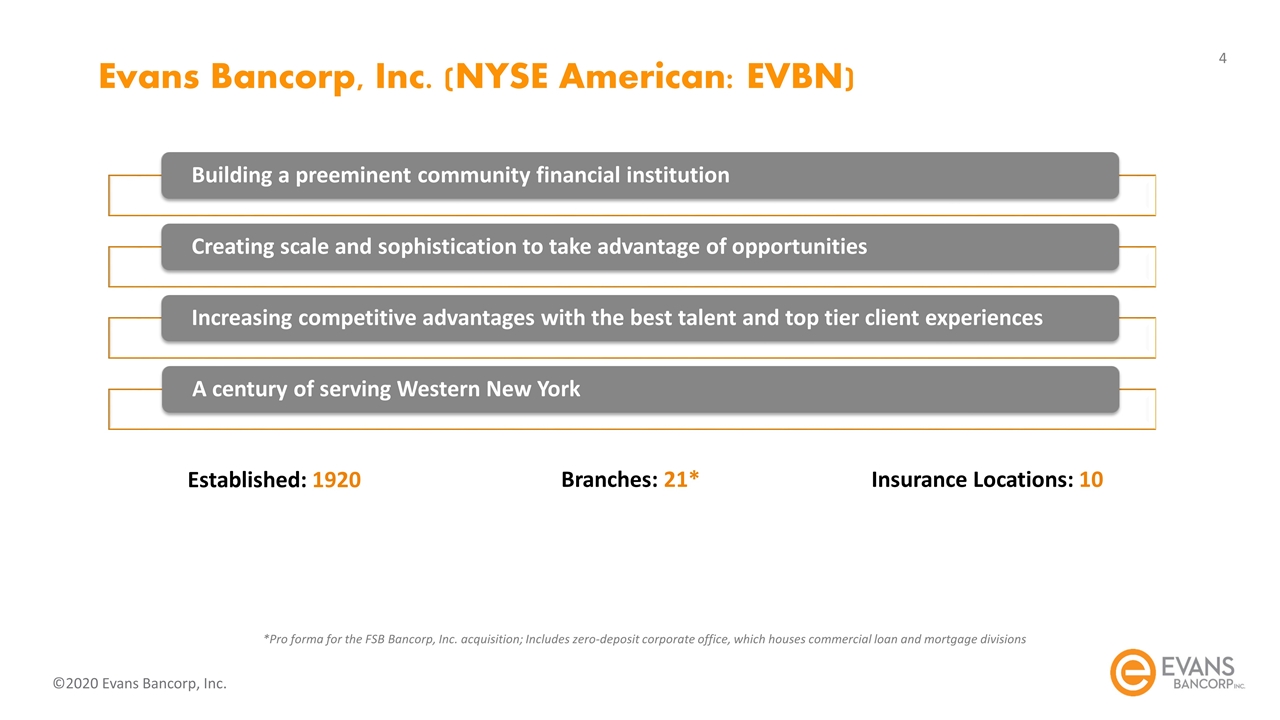
Evans Bancorp, Inc. (NYSE American: EVBN) *Pro forma for the FSB Bancorp, Inc. acquisition; Includes zero-deposit corporate office, which houses commercial loan and mortgage divisions Established: 1920 Branches: 21* Insurance Locations: 10 Building a preeminent community financial institution Creating scale and sophistication to take advantage of opportunities Increasing competitive advantages with the best talent and top tier client experiences A century of serving Western New York
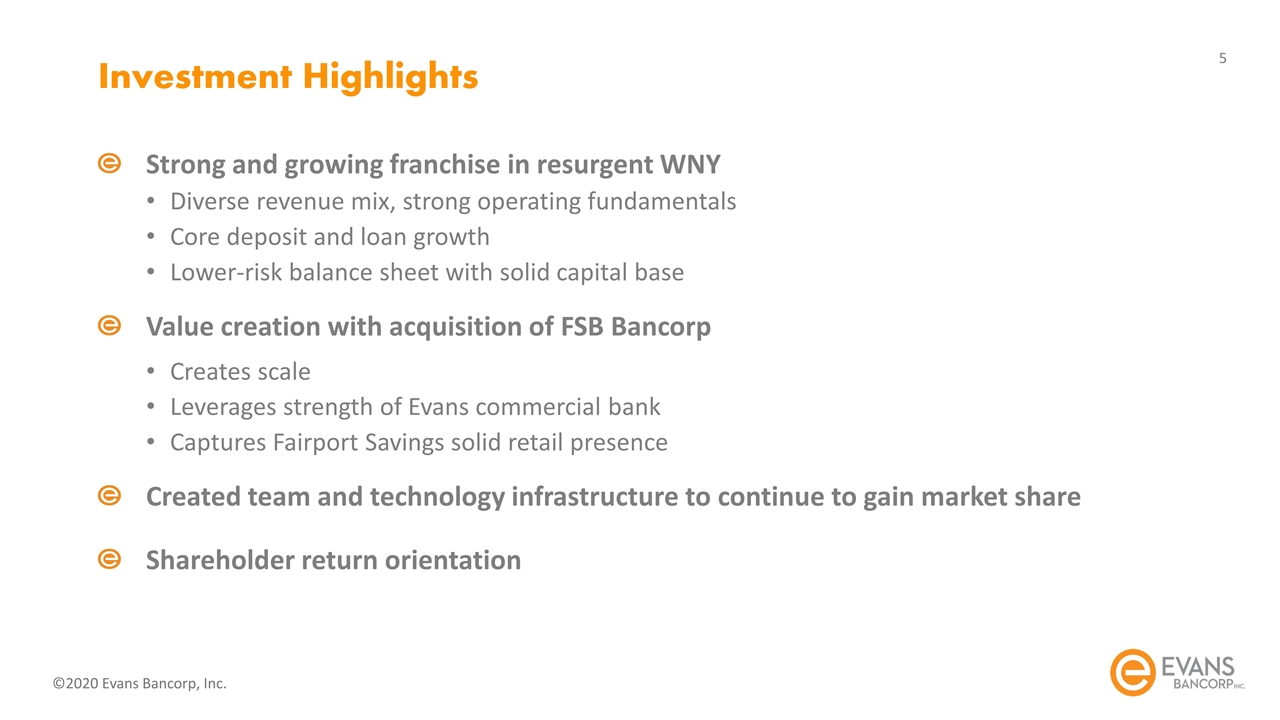
Investment Highlights Strong and growing franchise in resurgent WNY Diverse revenue mix, strong operating fundamentals Core deposit and loan growth Lower-risk balance sheet with solid capital base Value creation with acquisition of FSB Bancorp Creates scale Leverages strength of Evans commercial bank Captures Fairport Savings solid retail presence Created team and technology infrastructure to continue to gain market share Shareholder return orientation
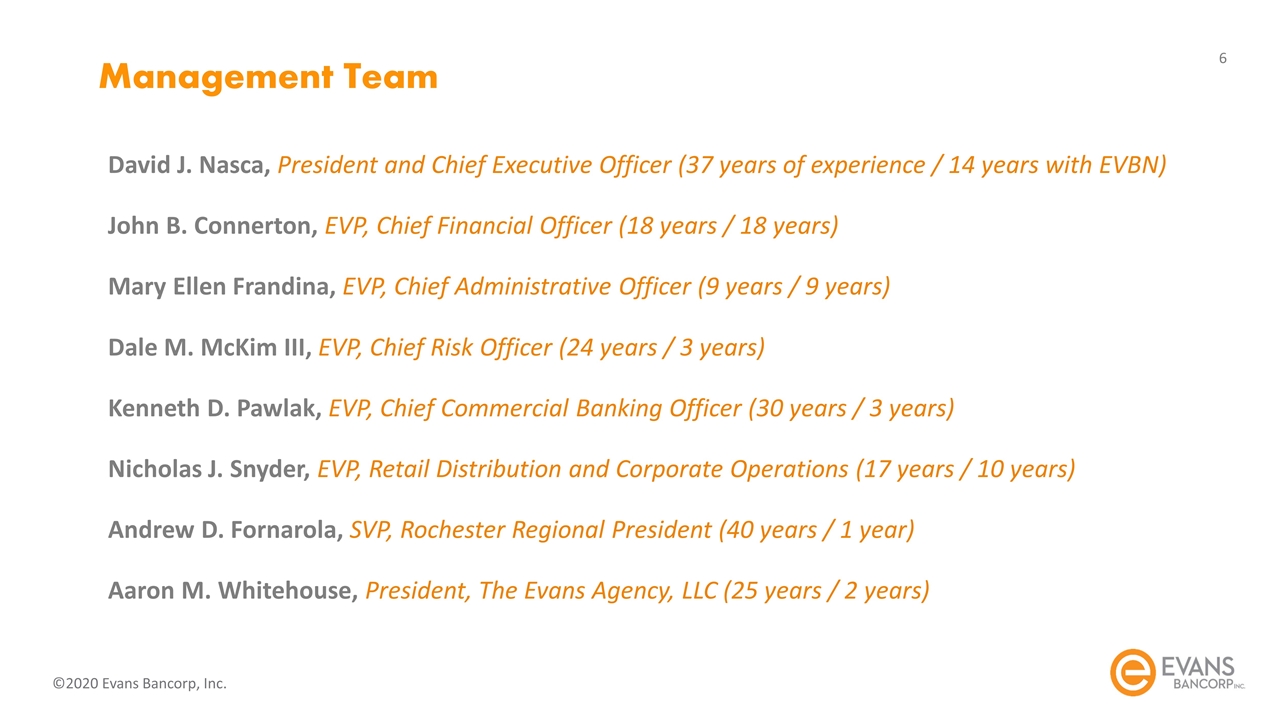
Management Team David J. Nasca, President and Chief Executive Officer (37 years of experience / 14 years with EVBN) John B. Connerton, EVP, Chief Financial Officer (18 years / 18 years) Mary Ellen Frandina, EVP, Chief Administrative Officer (9 years / 9 years) Dale M. McKim III, EVP, Chief Risk Officer (24 years / 3 years) Kenneth D. Pawlak, EVP, Chief Commercial Banking Officer (30 years / 3 years) Nicholas J. Snyder, EVP, Retail Distribution and Corporate Operations (17 years / 10 years) Andrew D. Fornarola, SVP, Rochester Regional President (40 years / 1 year) Aaron M. Whitehouse, President, The Evans Agency, LLC (25 years / 2 years)
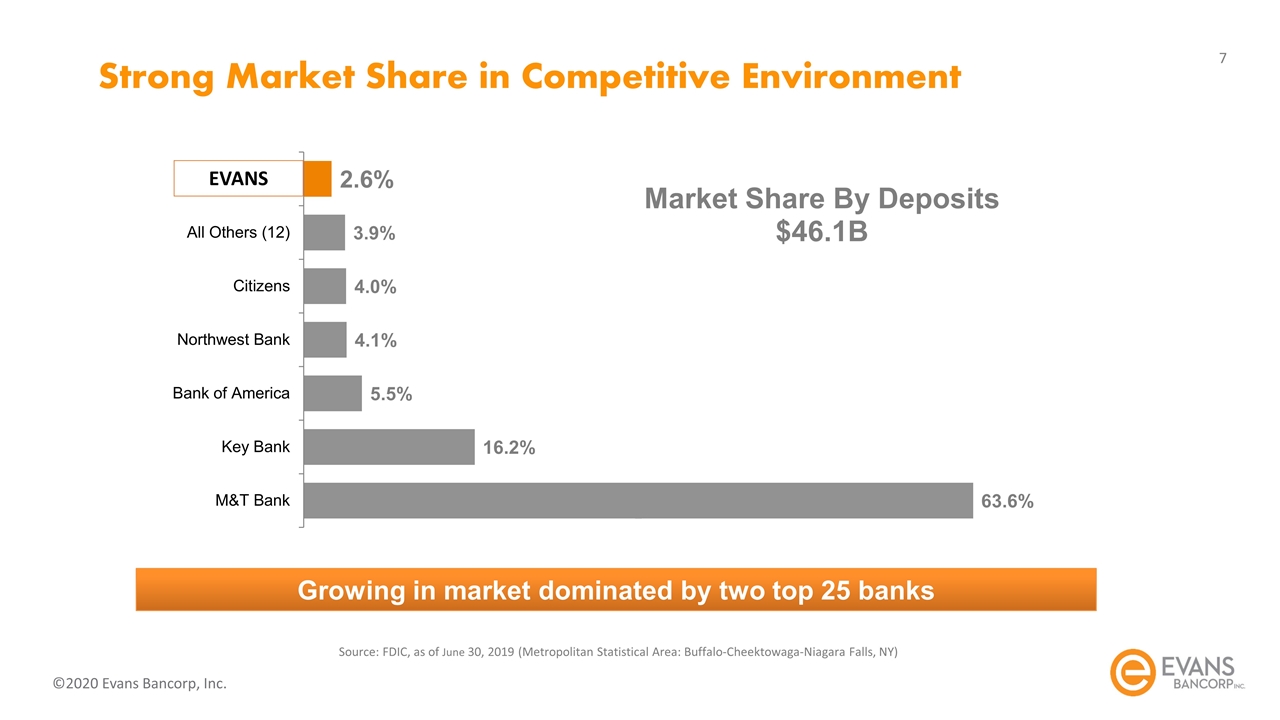
Source: FDIC, as of June 30, 2019 (Metropolitan Statistical Area: Buffalo-Cheektowaga-Niagara Falls, NY) Strong Market Share in Competitive Environment EVANS Growing in market dominated by two top 25 banks
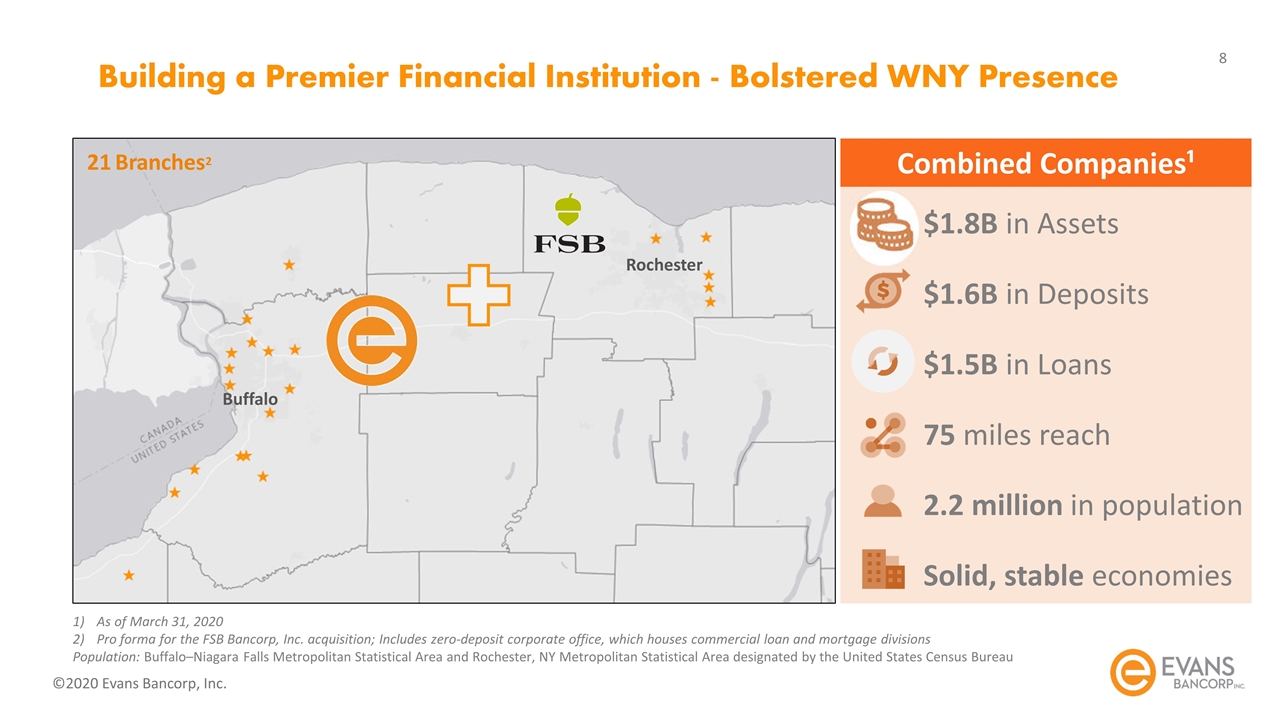
Building a Premier Financial Institution - Bolstered WNY Presence $1.8B in Assets $1.6B in Deposits $1.5B in Loans 75 miles reach 2.2 million in population Solid, stable economies Combined Companies¹ As of March 31, 2020 Pro forma for the FSB Bancorp, Inc. acquisition; Includes zero-deposit corporate office, which houses commercial loan and mortgage divisions Population: Buffalo–Niagara Falls Metropolitan Statistical Area and Rochester, NY Metropolitan Statistical Area designated by the United States Census Bureau 21 Branches2 Buffalo Rochester
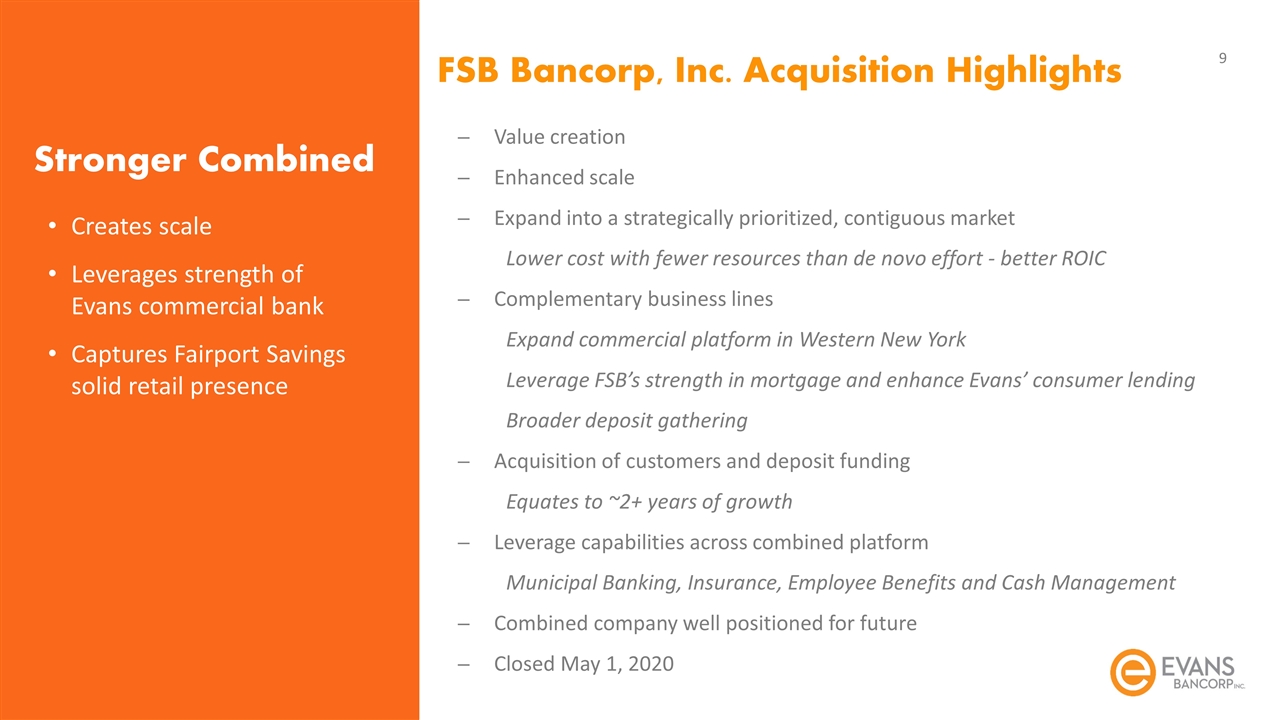
FSB Bancorp, Inc. Acquisition Highlights Value creation Enhanced scale Expand into a strategically prioritized, contiguous market Lower cost with fewer resources than de novo effort - better ROIC Complementary business lines Expand commercial platform in Western New York Leverage FSB’s strength in mortgage and enhance Evans’ consumer lending Broader deposit gathering Acquisition of customers and deposit funding Equates to ~2+ years of growth Leverage capabilities across combined platform Municipal Banking, Insurance, Employee Benefits and Cash Management Combined company well positioned for future Closed May 1, 2020 Creates scale Leverages strength of Evans commercial bank Captures Fairport Savings solid retail presence Stronger Combined
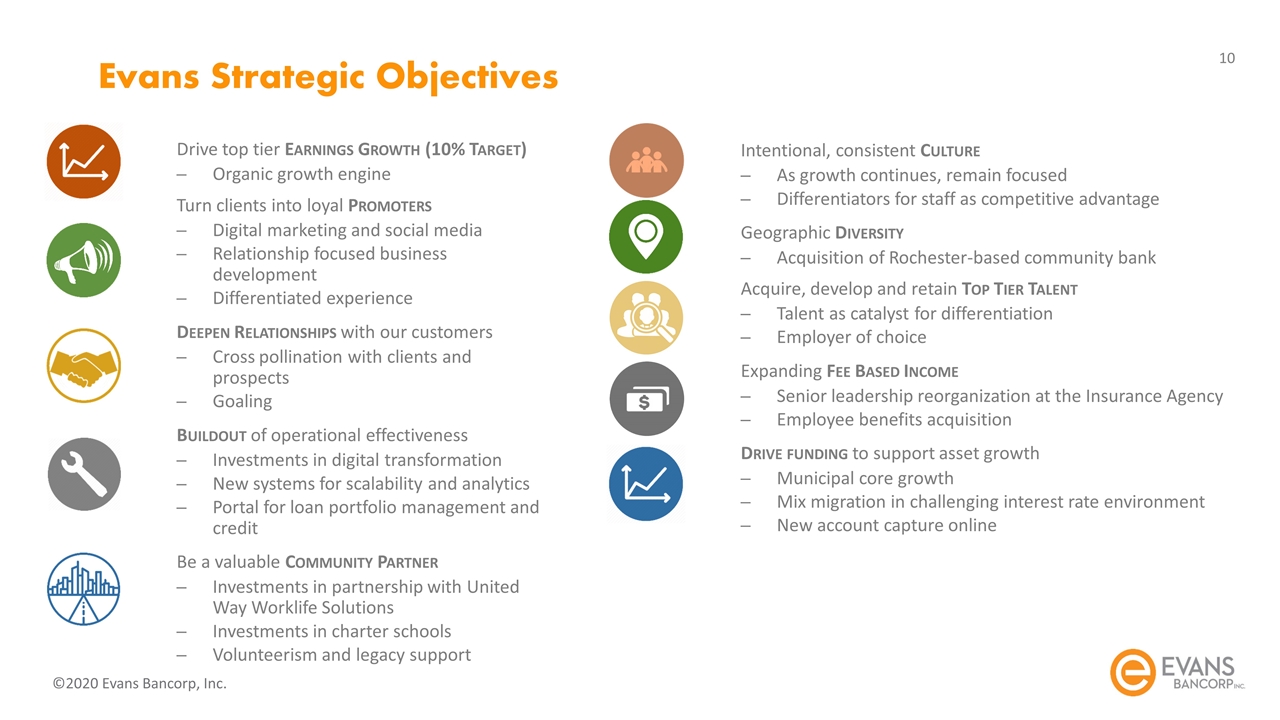
Evans Strategic Objectives Drive top tier Earnings Growth (10% Target) Organic growth engine Turn clients into loyal Promoters Digital marketing and social media Relationship focused business development Differentiated experience Deepen Relationships with our customers Cross pollination with clients and prospects Goaling Buildout of operational effectiveness Investments in digital transformation New systems for scalability and analytics Portal for loan portfolio management and credit Be a valuable Community Partner Investments in partnership with United Way Worklife Solutions Investments in charter schools Volunteerism and legacy support Intentional, consistent Culture As growth continues, remain focused Differentiators for staff as competitive advantage Geographic Diversity Acquisition of Rochester-based community bank Acquire, develop and retain Top Tier Talent Talent as catalyst for differentiation Employer of choice Expanding Fee Based Income Senior leadership reorganization at the Insurance Agency Employee benefits acquisition Drive funding to support asset growth Municipal core growth Mix migration in challenging interest rate environment New account capture online
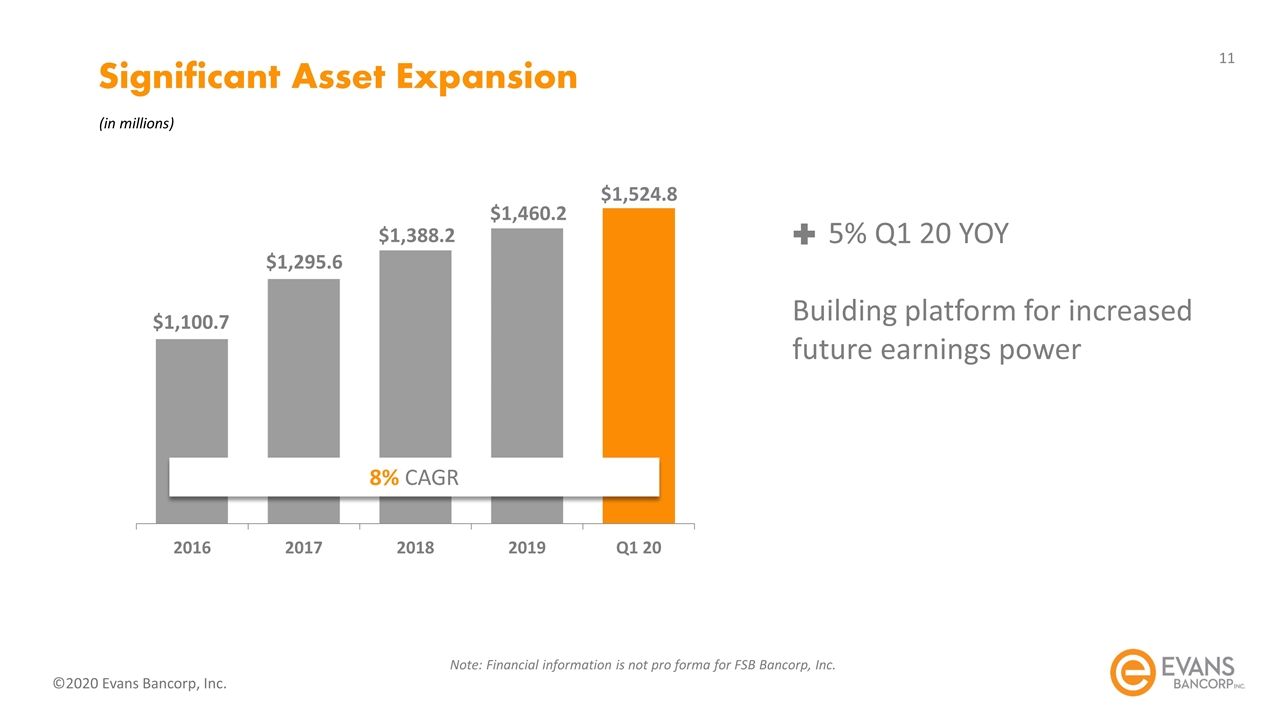
Significant Asset Expansion (in millions) 5% Q1 20 YOY Building platform for increased future earnings power 8% CAGR Note: Financial information is not pro forma for FSB Bancorp, Inc.
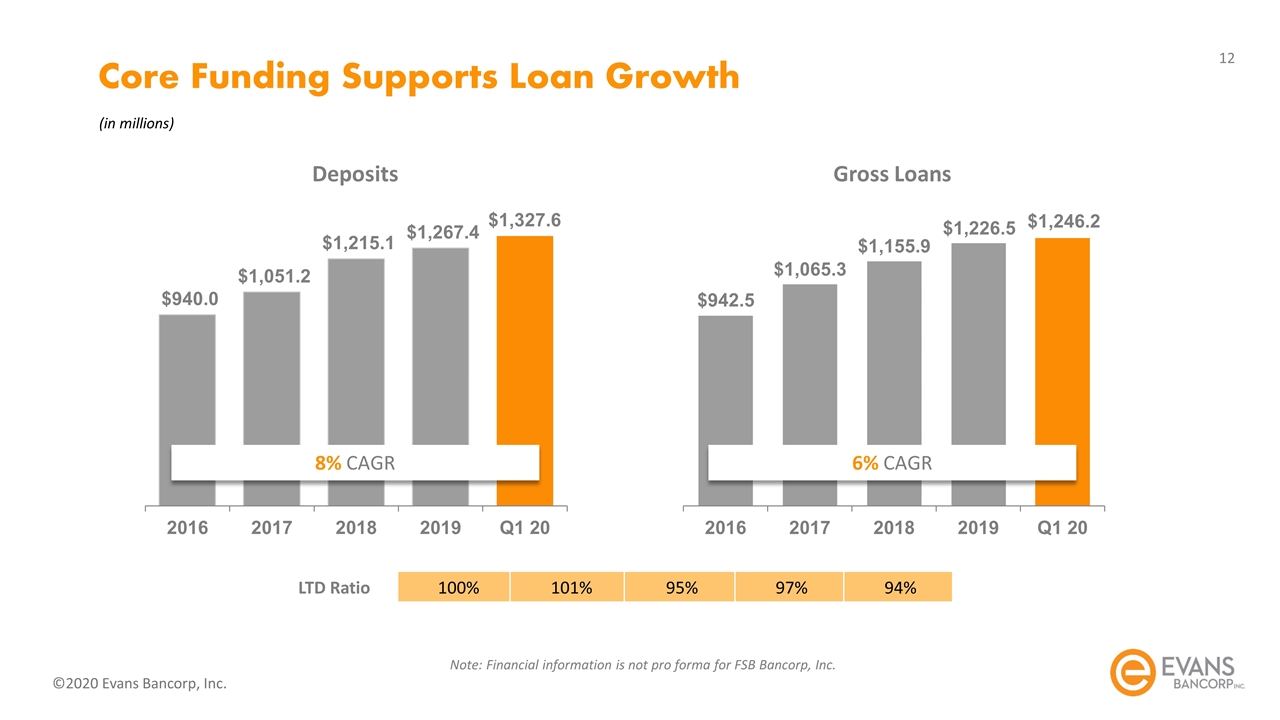
100% 101% 95% 97% 94% LTD Ratio 6% CAGR 8% CAGR Deposits Gross Loans Core Funding Supports Loan Growth (in millions) Note: Financial information is not pro forma for FSB Bancorp, Inc.
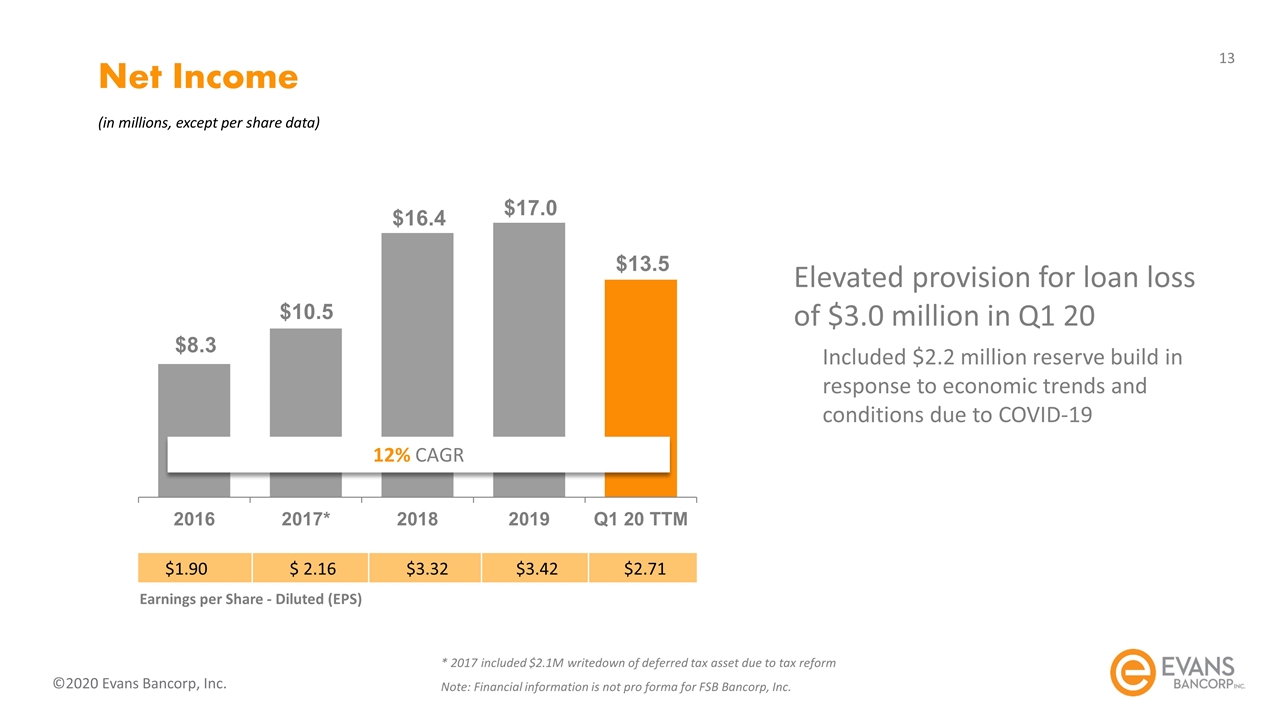
Net Income (in millions, except per share data) Elevated provision for loan loss of $3.0 million in Q1 20 Included $2.2 million reserve build in response to economic trends and conditions due to COVID-19 * 2017 included $2.1M writedown of deferred tax asset due to tax reform Note: Financial information is not pro forma for FSB Bancorp, Inc. 12% CAGR $1.90 $ 2.16 $3.32 $3.42 $2.71 Earnings per Share - Diluted (EPS)
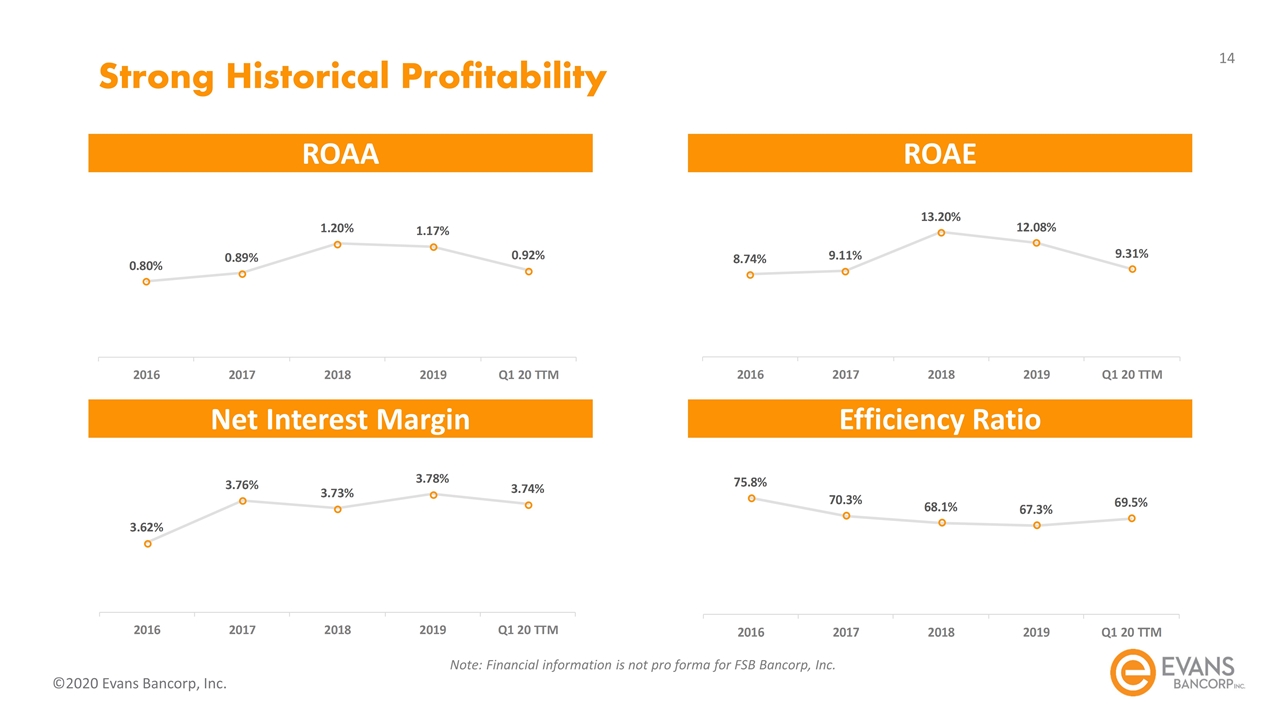
Strong Historical Profitability ROAA ROAE Net Interest Margin Efficiency Ratio Note: Financial information is not pro forma for FSB Bancorp, Inc.
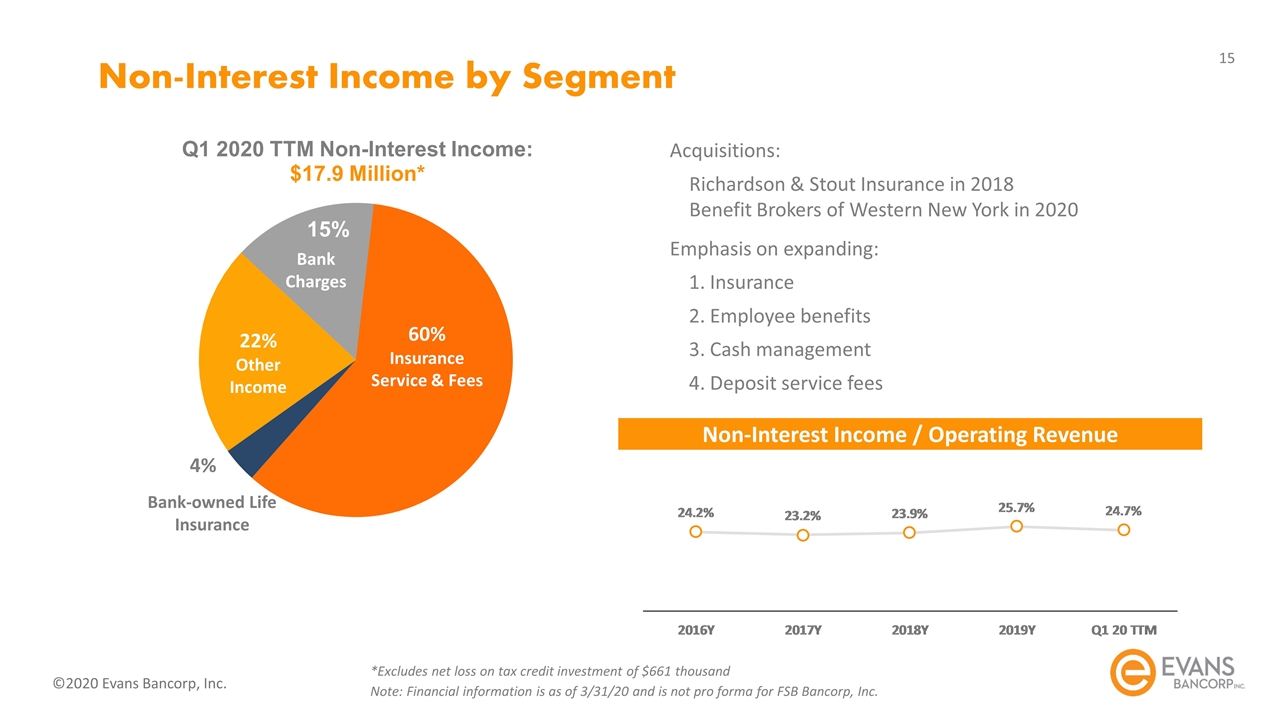
Non-Interest Income by Segment Acquisitions: Richardson & Stout Insurance in 2018 Benefit Brokers of Western New York in 2020 Emphasis on expanding: 1. Insurance 2. Employee benefits 3. Cash management 4. Deposit service fees 22% Other Income 60% Insurance Service & Fees Bank-owned Life Insurance Bank Charges *Excludes net loss on tax credit investment of $661 thousand Note: Financial information is as of 3/31/20 and is not pro forma for FSB Bancorp, Inc. Non-Interest Income / Operating Revenue
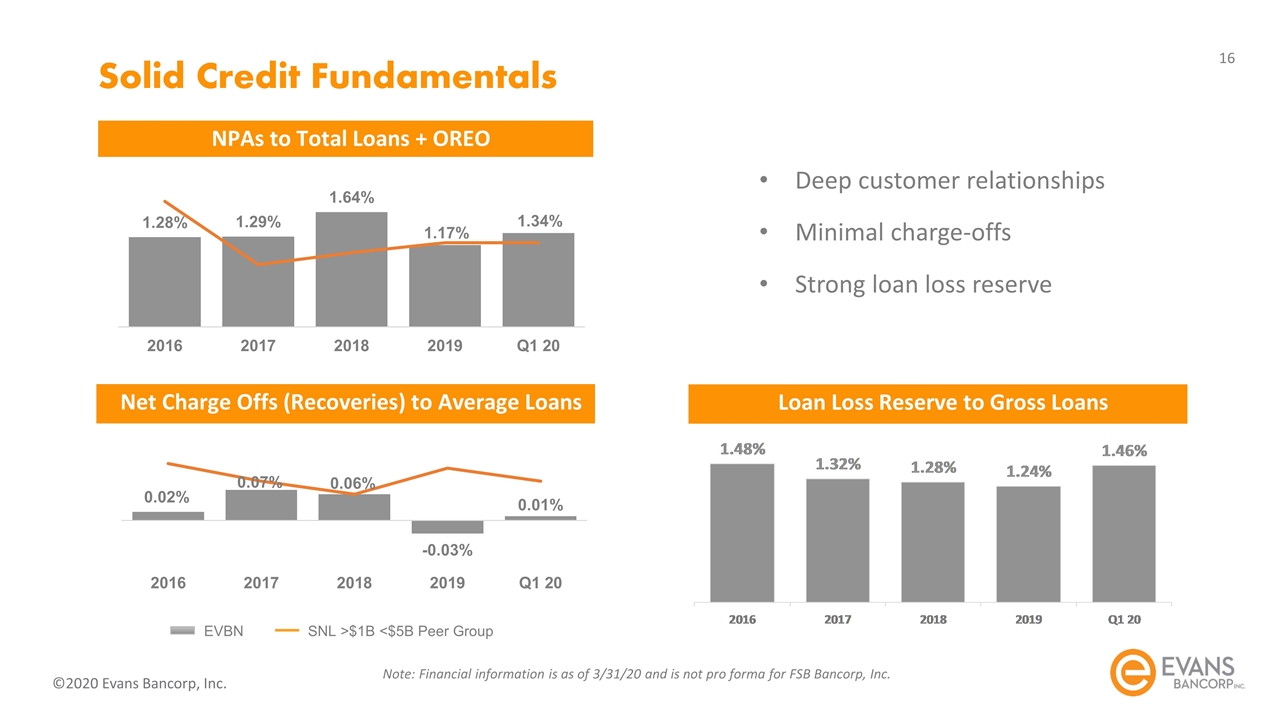
Solid Credit Fundamentals Deep customer relationships Minimal charge-offs Strong loan loss reserve Net Charge Offs (Recoveries) to Average Loans NPAs to Total Loans + OREO EVBN SNL >$1B <$5B Peer Group Note: Financial information is as of 3/31/20 and is not pro forma for FSB Bancorp, Inc. Loan Loss Reserve to Gross Loans
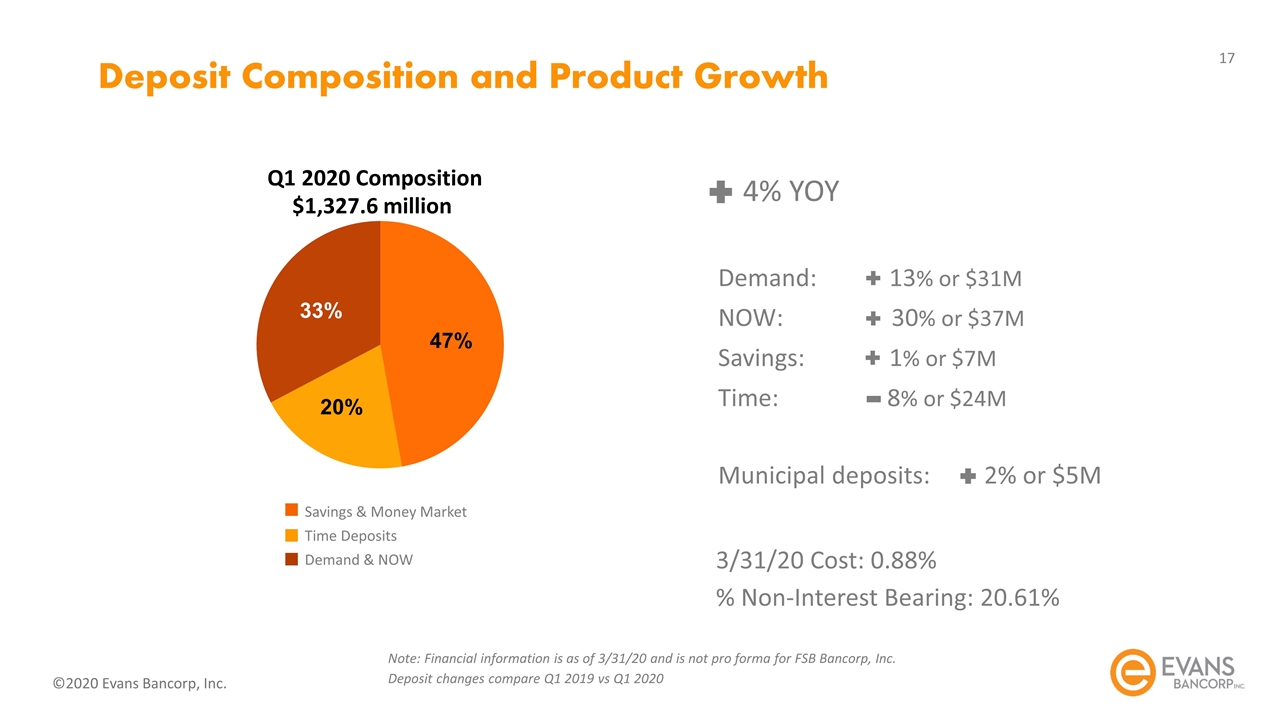
Deposit Composition and Product Growth Municipal deposits: 2% or $5M 4% YOY Note: Financial information is as of 3/31/20 and is not pro forma for FSB Bancorp, Inc. Deposit changes compare Q1 2019 vs Q1 2020 Demand: 13% or $31M NOW: 30% or $37M Savings: 1% or $7M Time: 8% or $24M Q1 2020 Composition Savings & Money Market Time Deposits Demand & NOW $1,327.6 million 3/31/20 Cost: 0.88% % Non-Interest Bearing: 20.61%
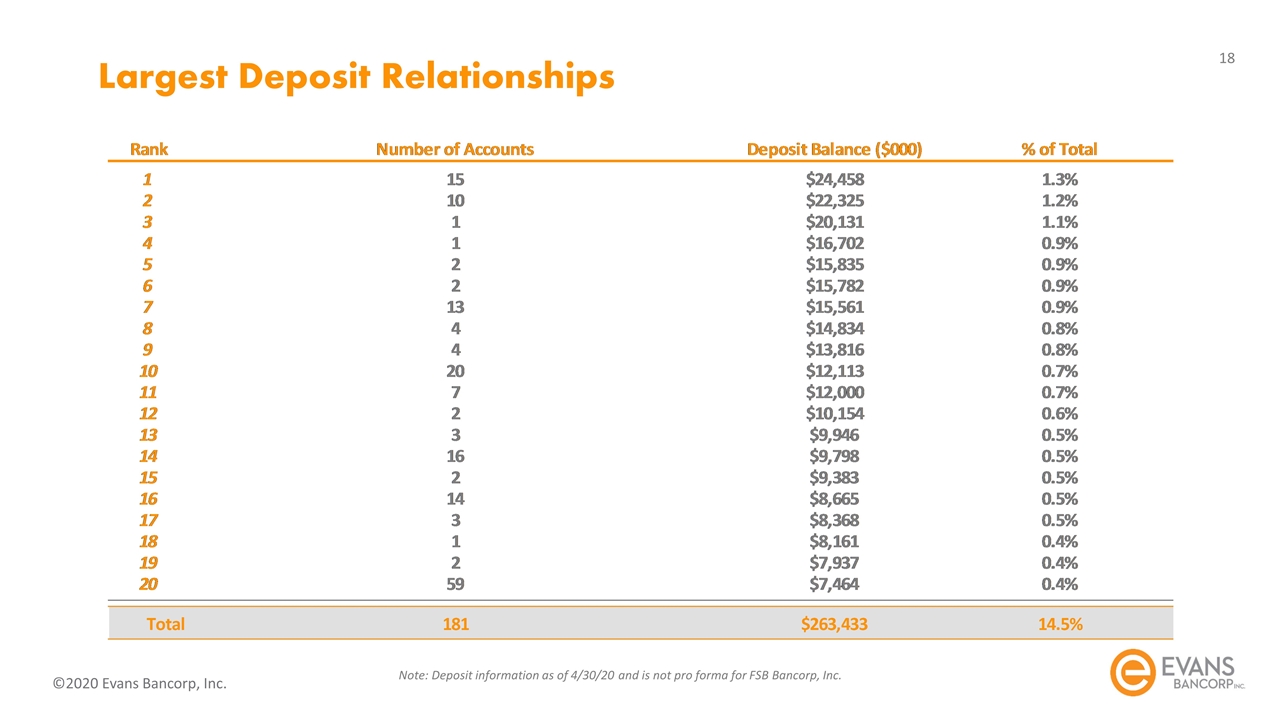
Largest Deposit Relationships Note: Deposit information as of 4/30/20 and is not pro forma for FSB Bancorp, Inc.
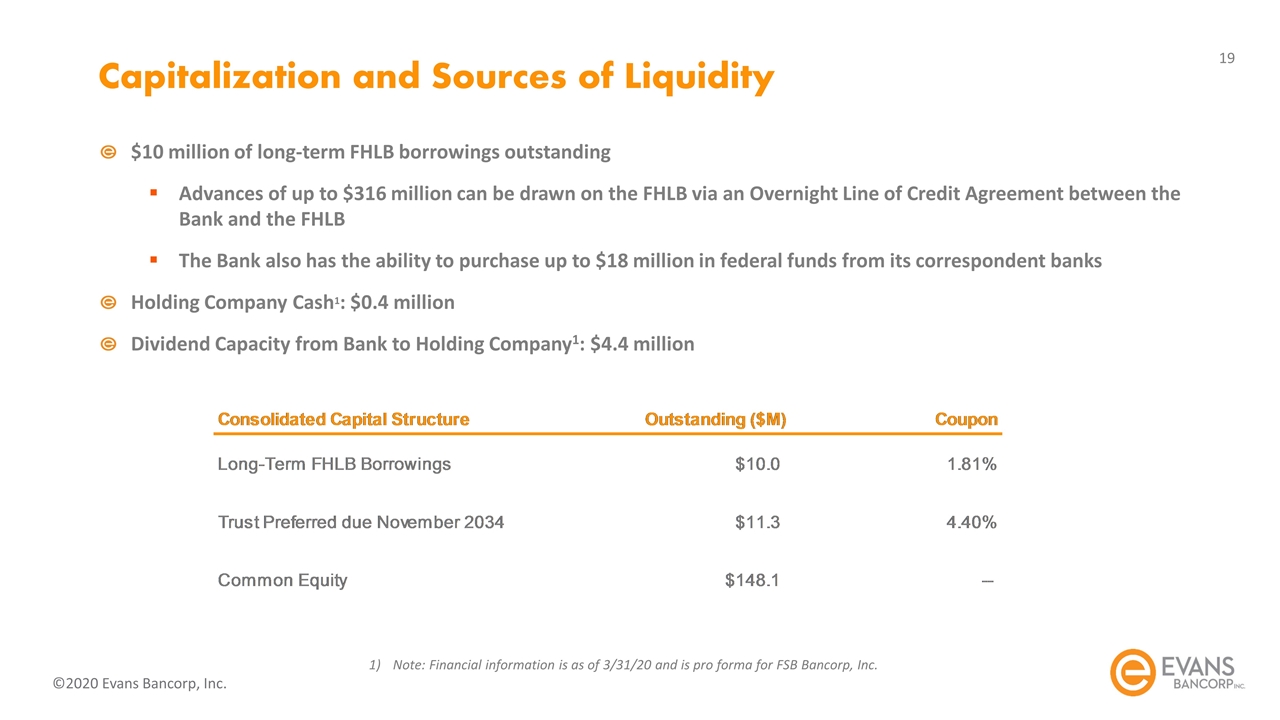
Capitalization and Sources of Liquidity $10 million of long-term FHLB borrowings outstanding Advances of up to $316 million can be drawn on the FHLB via an Overnight Line of Credit Agreement between the Bank and the FHLB The Bank also has the ability to purchase up to $18 million in federal funds from its correspondent banks Holding Company Cash1: $0.4 million Dividend Capacity from Bank to Holding Company1: $4.4 million Note: Financial information is as of 3/31/20 and is pro forma for FSB Bancorp, Inc.
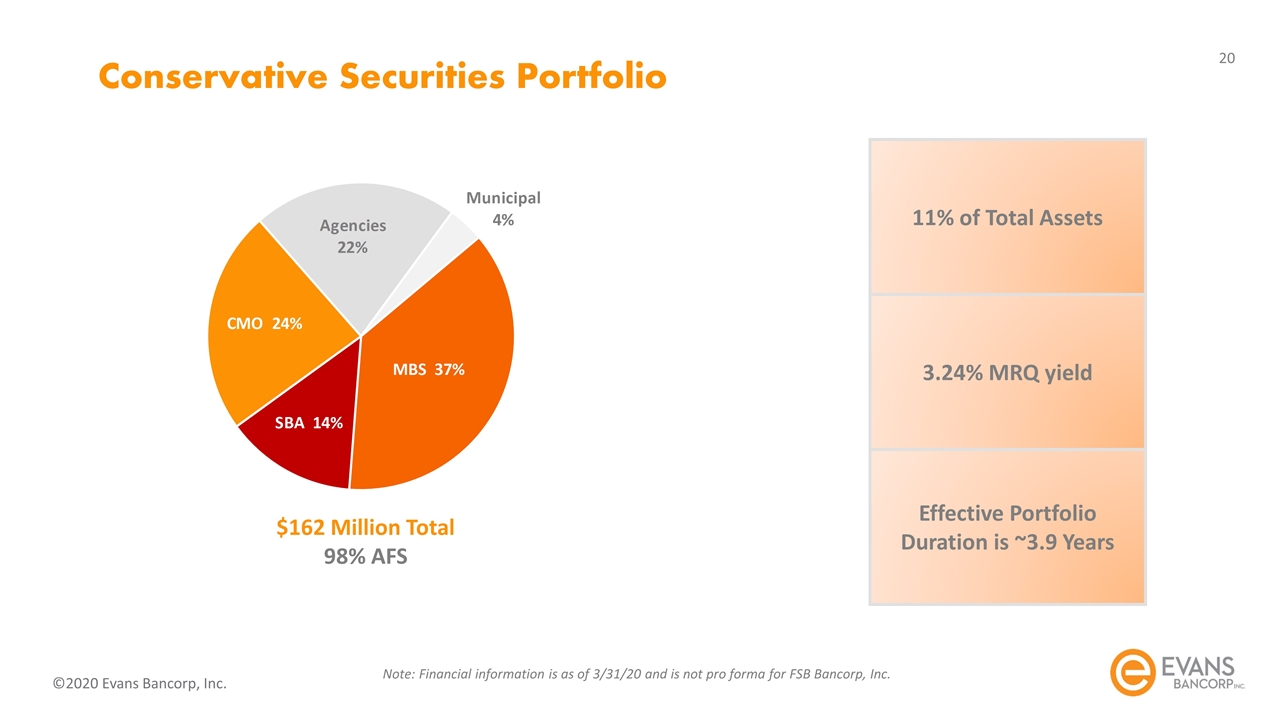
Conservative Securities Portfolio 11% of Total Assets 3.24% MRQ yield Effective Portfolio Duration is ~3.9 Years $162 Million Total 98% AFS Note: Financial information is as of 3/31/20 and is not pro forma for FSB Bancorp, Inc.
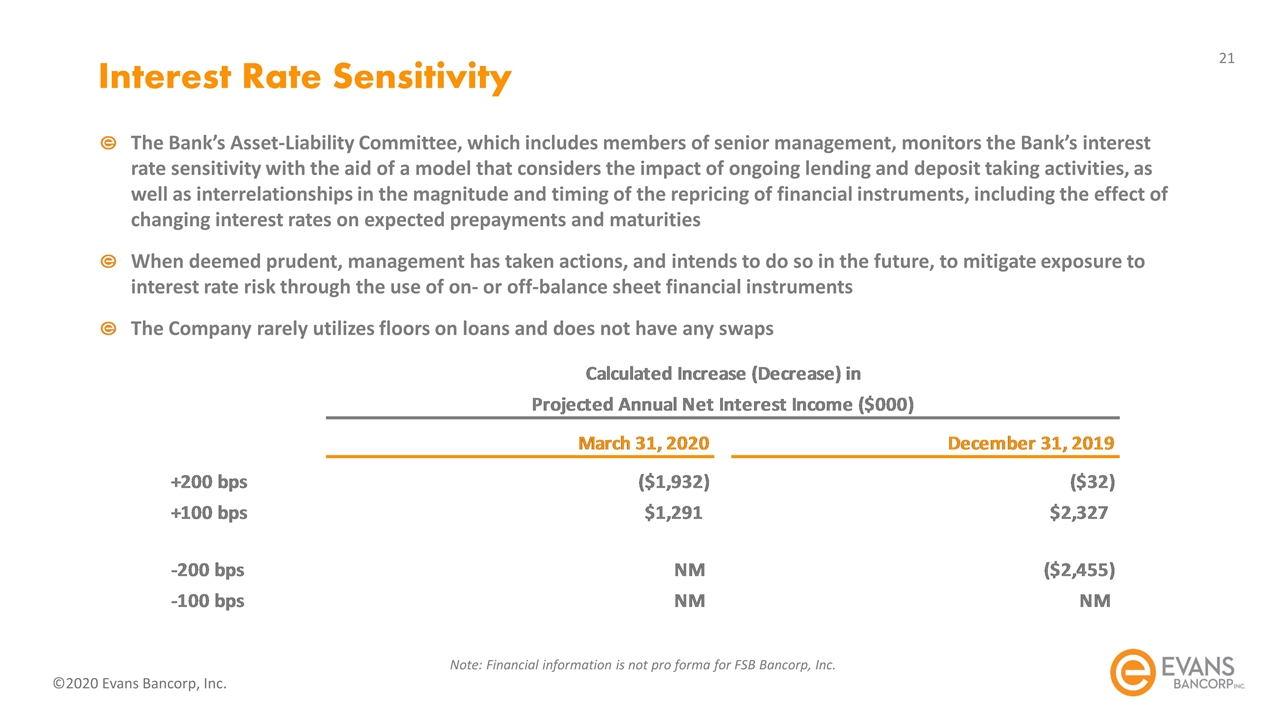
Interest Rate Sensitivity The Bank’s Asset-Liability Committee, which includes members of senior management, monitors the Bank’s interest rate sensitivity with the aid of a model that considers the impact of ongoing lending and deposit taking activities, as well as interrelationships in the magnitude and timing of the repricing of financial instruments, including the effect of changing interest rates on expected prepayments and maturities When deemed prudent, management has taken actions, and intends to do so in the future, to mitigate exposure to interest rate risk through the use of on- or off-balance sheet financial instruments The Company rarely utilizes floors on loans and does not have any swaps Note: Financial information is not pro forma for FSB Bancorp, Inc.
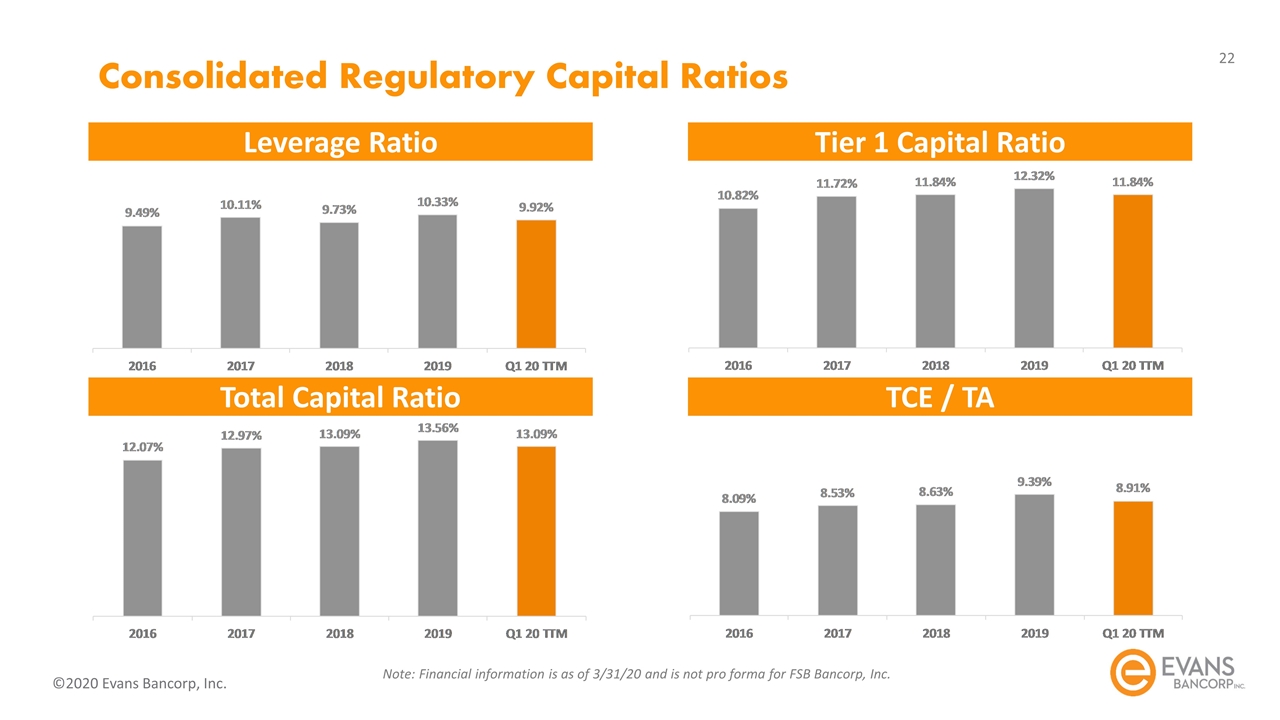
Consolidated Regulatory Capital Ratios Leverage Ratio Tier 1 Capital Ratio Total Capital Ratio TCE / TA Note: Financial information is as of 3/31/20 and is not pro forma for FSB Bancorp, Inc.
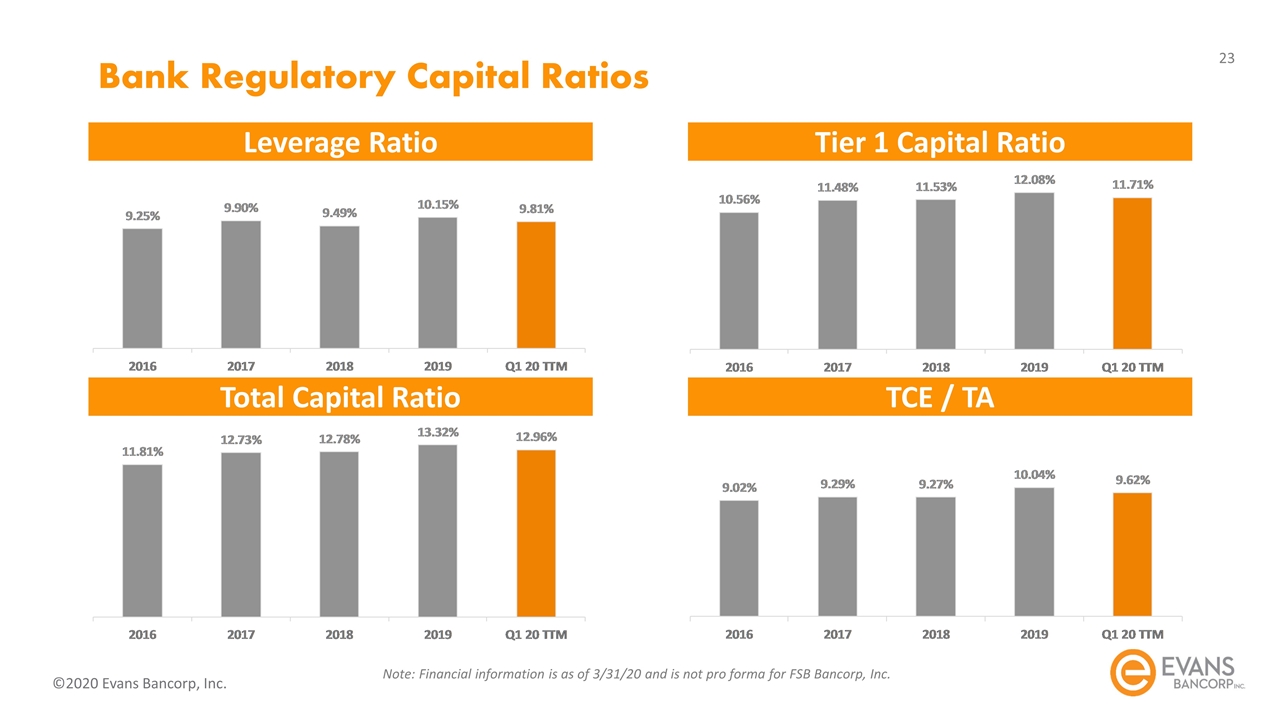
Bank Regulatory Capital Ratios Leverage Ratio Tier 1 Capital Ratio Total Capital Ratio TCE / TA Note: Financial information is as of 3/31/20 and is not pro forma for FSB Bancorp, Inc.
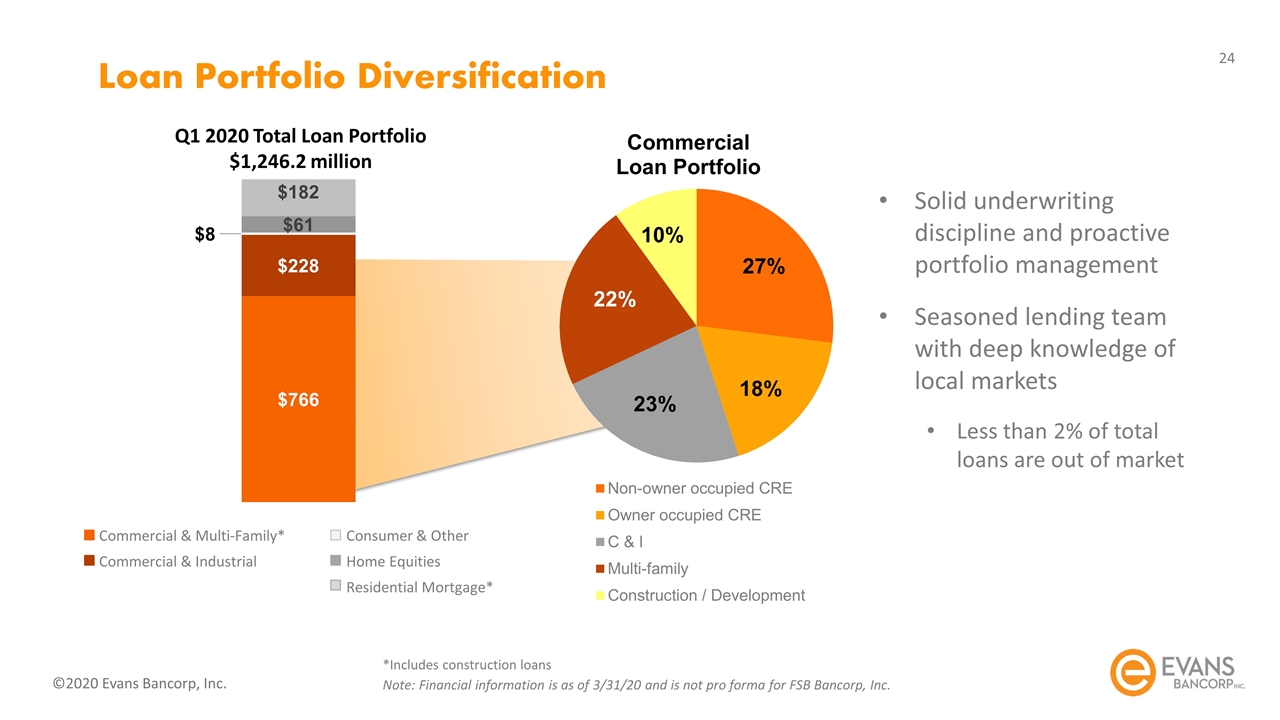
Loan Portfolio Diversification Q1 2020 Total Loan Portfolio $1,246.2 million Commercial & Multi-Family* Commercial & Industrial Consumer & Other Home Equities Residential Mortgage* *Includes construction loans Note: Financial information is as of 3/31/20 and is not pro forma for FSB Bancorp, Inc. Solid underwriting discipline and proactive portfolio management Seasoned lending team with deep knowledge of local markets Less than 2% of total loans are out of market
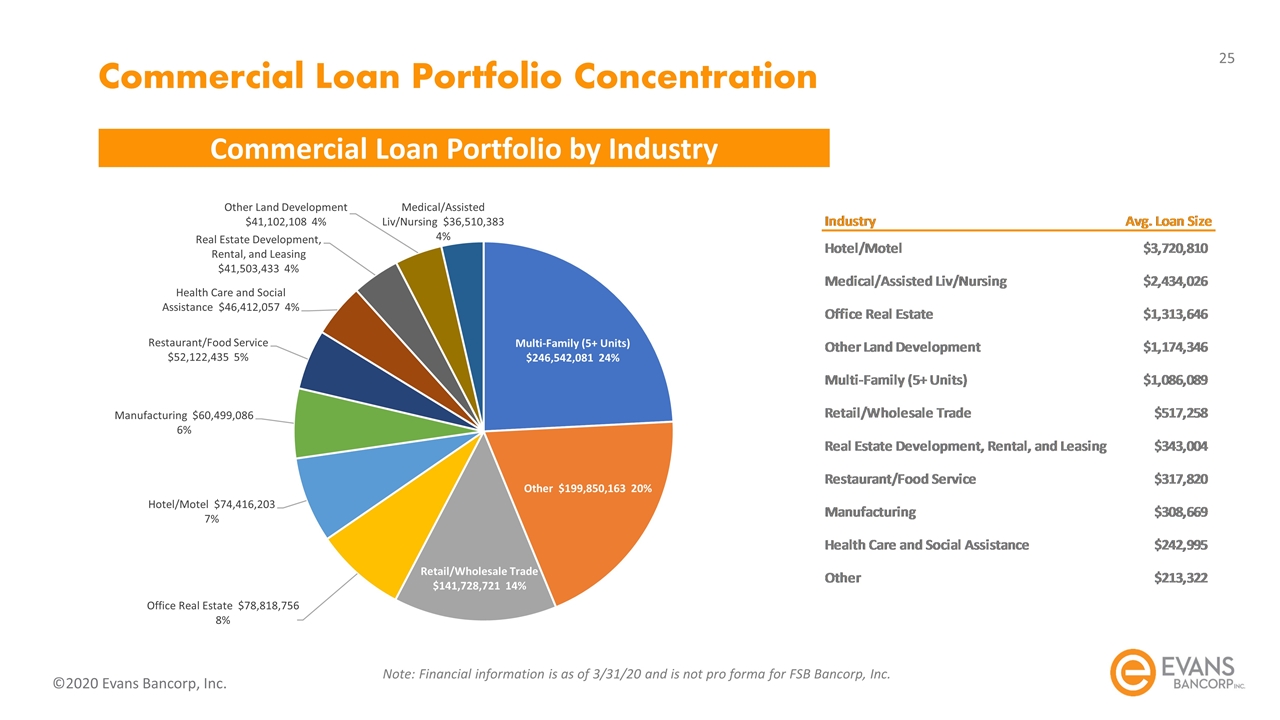
Commercial Loan Portfolio Concentration Commercial Loan Portfolio by Industry Note: Financial information is as of 3/31/20 and is not pro forma for FSB Bancorp, Inc.
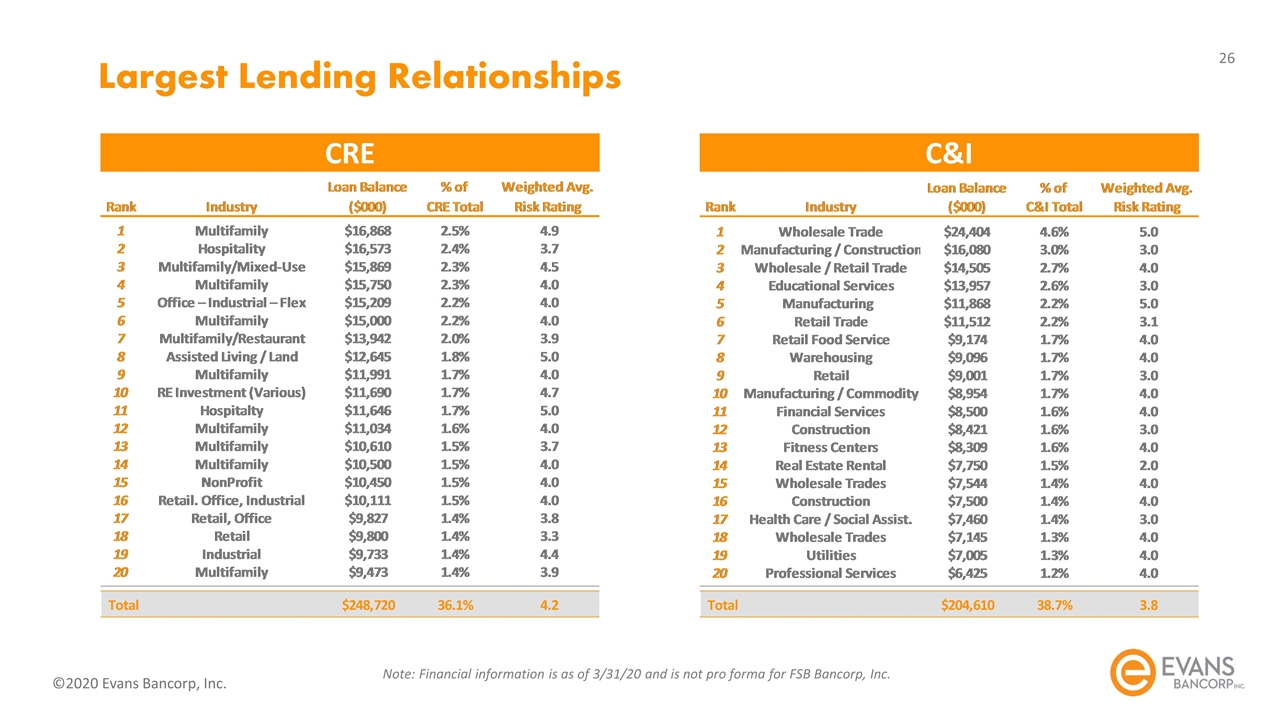
Largest Lending Relationships CRE C&I Note: Financial information is as of 3/31/20 and is not pro forma for FSB Bancorp, Inc.
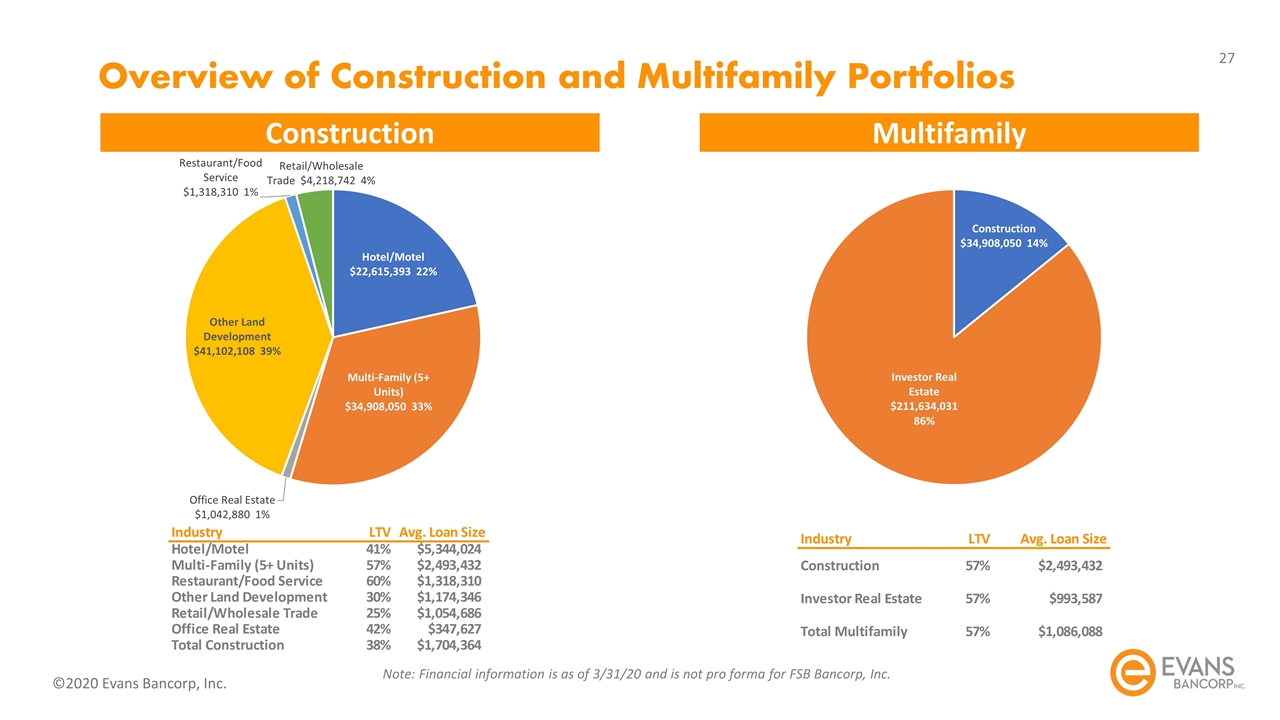
Construction Multifamily Overview of Construction and Multifamily Portfolios Note: Financial information is as of 3/31/20 and is not pro forma for FSB Bancorp, Inc.
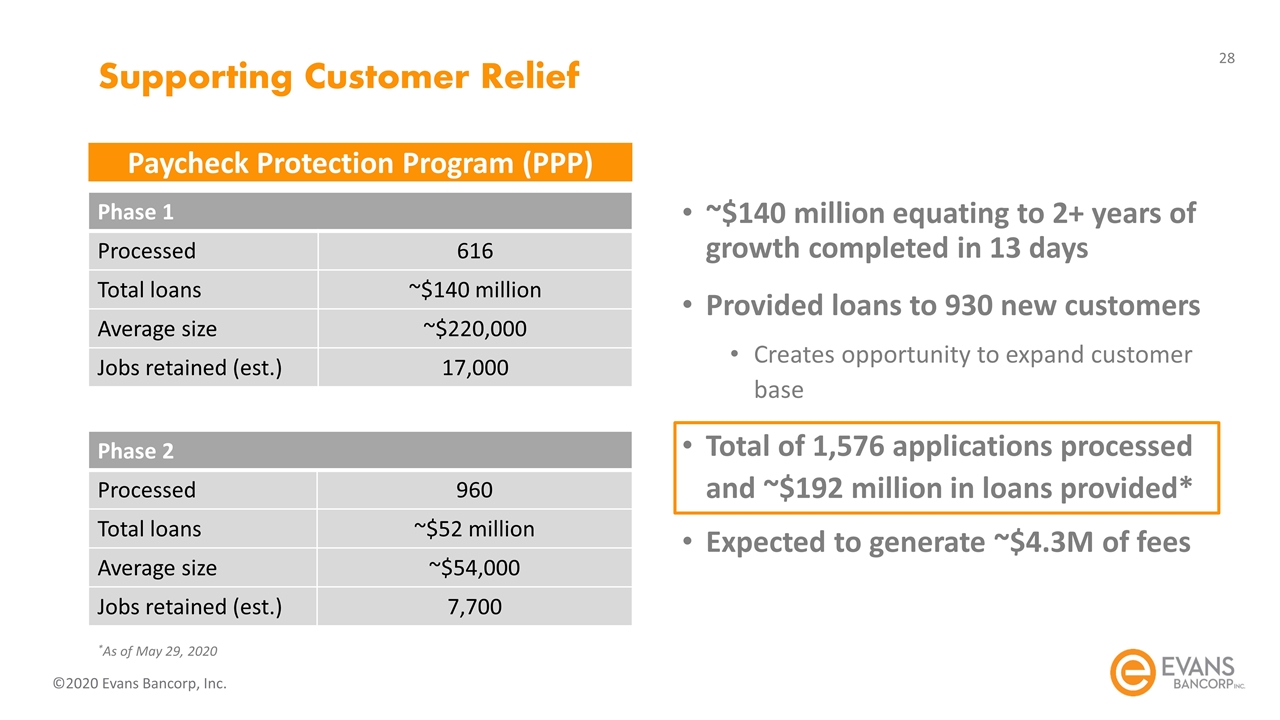
Supporting Customer Relief ~$140 million equating to 2+ years of growth completed in 13 days Provided loans to 930 new customers Creates opportunity to expand customer base Total of 1,576 applications processed and ~$192 million in loans provided* Expected to generate ~$4.3M of fees Phase 1 Processed 616 Total loans ~$140 million Average size ~$220,000 Jobs retained (est.) 17,000 Phase 2 Processed 960 Total loans ~$52 million Average size ~$54,000 Jobs retained (est.) 7,700 *As of May 29, 2020 Paycheck Protection Program (PPP)
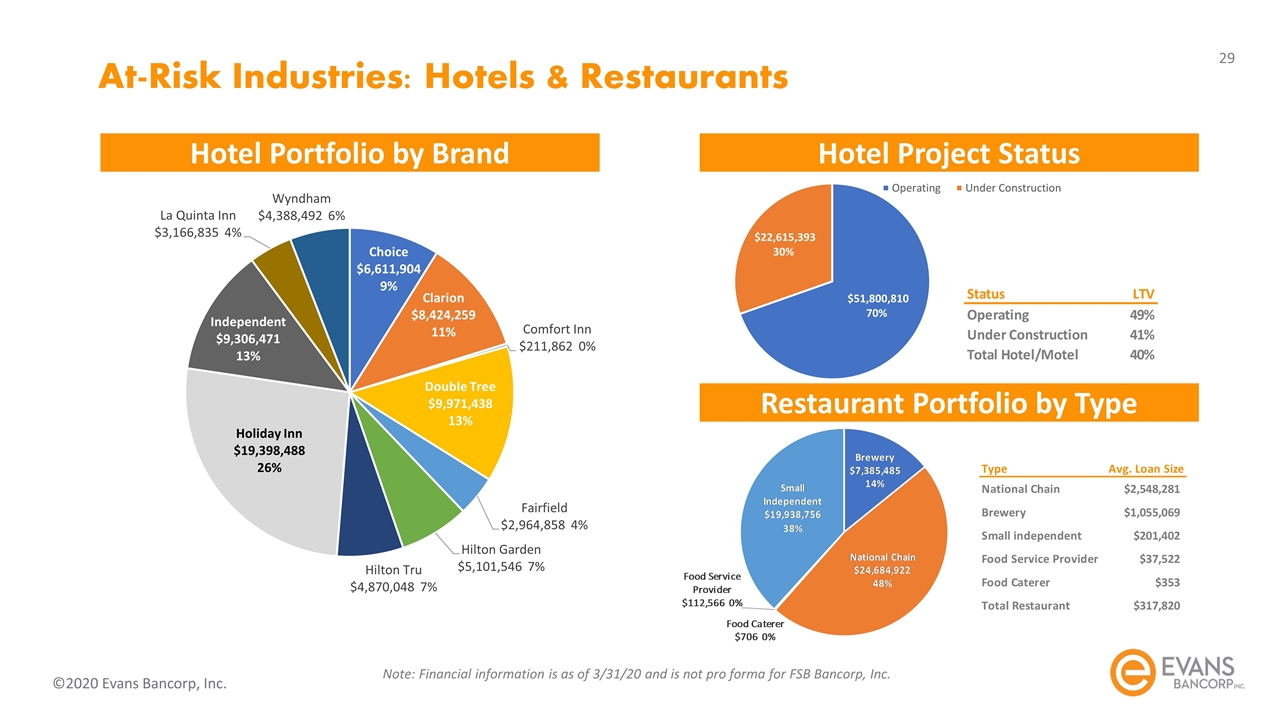
Hotel Portfolio by Brand Hotel Project Status At-Risk Industries: Hotels & Restaurants Restaurant Portfolio by Type Note: Financial information is as of 3/31/20 and is not pro forma for FSB Bancorp, Inc.
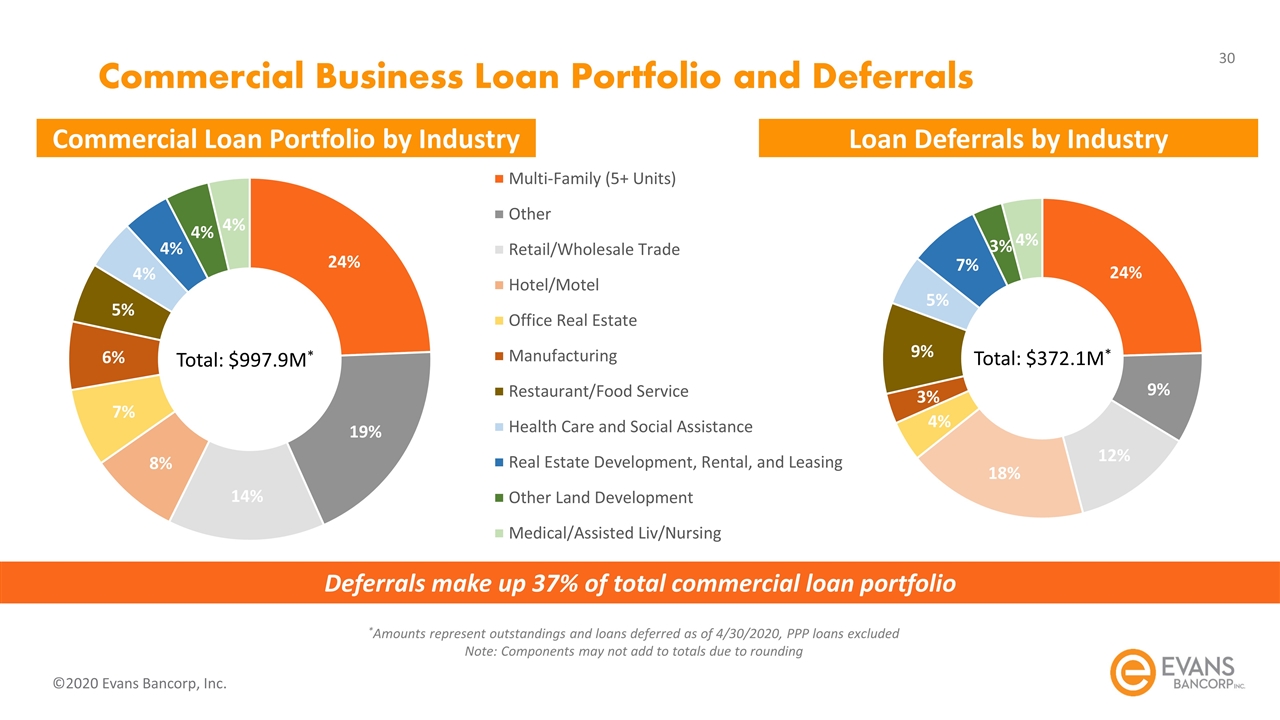
Commercial Business Loan Portfolio and Deferrals Deferrals make up 37% of total commercial loan portfolio Total: $372.1M* Total: $997.9M* *Amounts represent outstandings and loans deferred as of 4/30/2020, PPP loans excluded Note: Components may not add to totals due to rounding Commercial Loan Portfolio by Industry Loan Deferrals by Industry
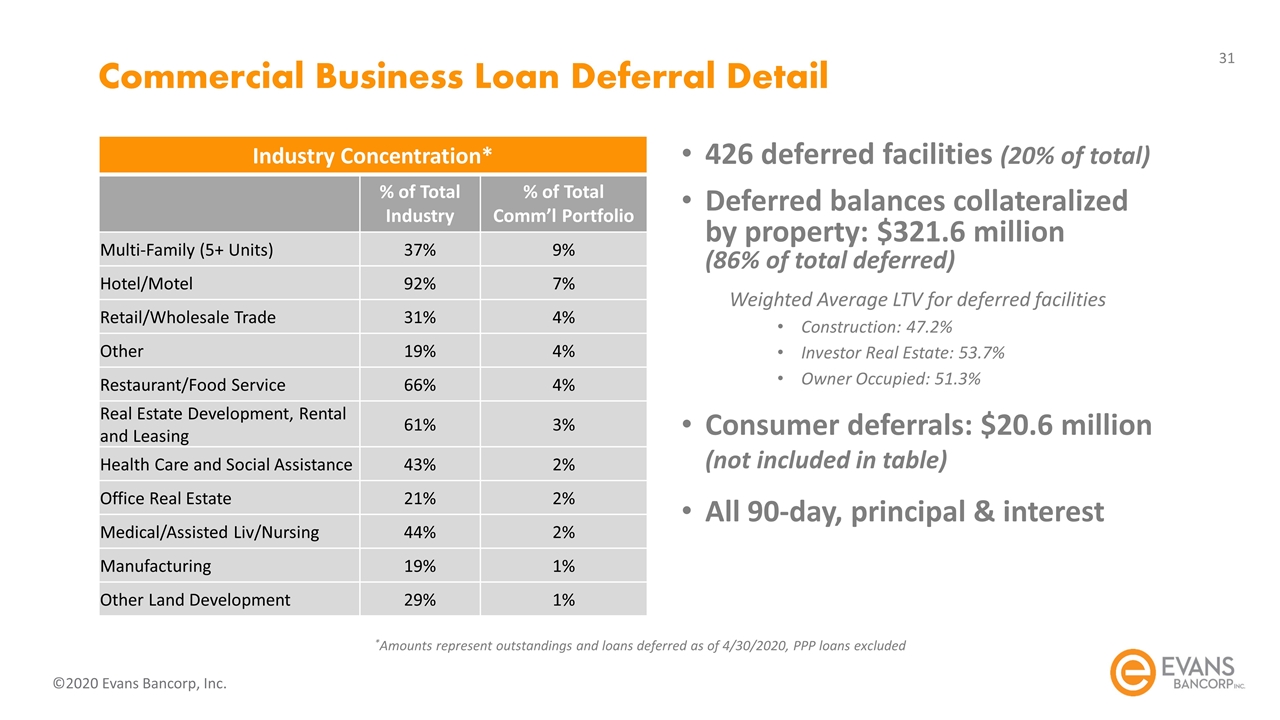
Commercial Business Loan Deferral Detail 426 deferred facilities (20% of total) Deferred balances collateralized by property: $321.6 million (86% of total deferred) Weighted Average LTV for deferred facilities Construction: 47.2% Investor Real Estate: 53.7% Owner Occupied: 51.3% Consumer deferrals: $20.6 million (not included in table) All 90-day, principal & interest Industry Concentration* % of Total Industry % of Total Comm’l Portfolio Multi-Family (5+ Units) 37% 9% Hotel/Motel 92% 7% Retail/Wholesale Trade 31% 4% Other 19% 4% Restaurant/Food Service 66% 4% Real Estate Development, Rental and Leasing 61% 3% Health Care and Social Assistance 43% 2% Office Real Estate 21% 2% Medical/Assisted Liv/Nursing 44% 2% Manufacturing 19% 1% Other Land Development 29% 1% *Amounts represent outstandings and loans deferred as of 4/30/2020, PPP loans excluded
Appendix
Recent Developments The Company expects to have a very stable Q2, with higher net income and a lower provision than Q1 Loan portfolio continues to be closely monitored Q2 provision expected to be $0.5-$1.0 million, compared to $3.0 million in Q1 Large percentage of deferrals expected to roll off Loan growth below typical levels Estimated Q2 balance sheet highlights Assets: $2.1B Loans: $1.7B Deposits: $1.8B Service charge income has decreased due to COVID-19 Note: Financial information is estimated for 6/30/20 and is pro forma for FSB Bancorp, Inc.
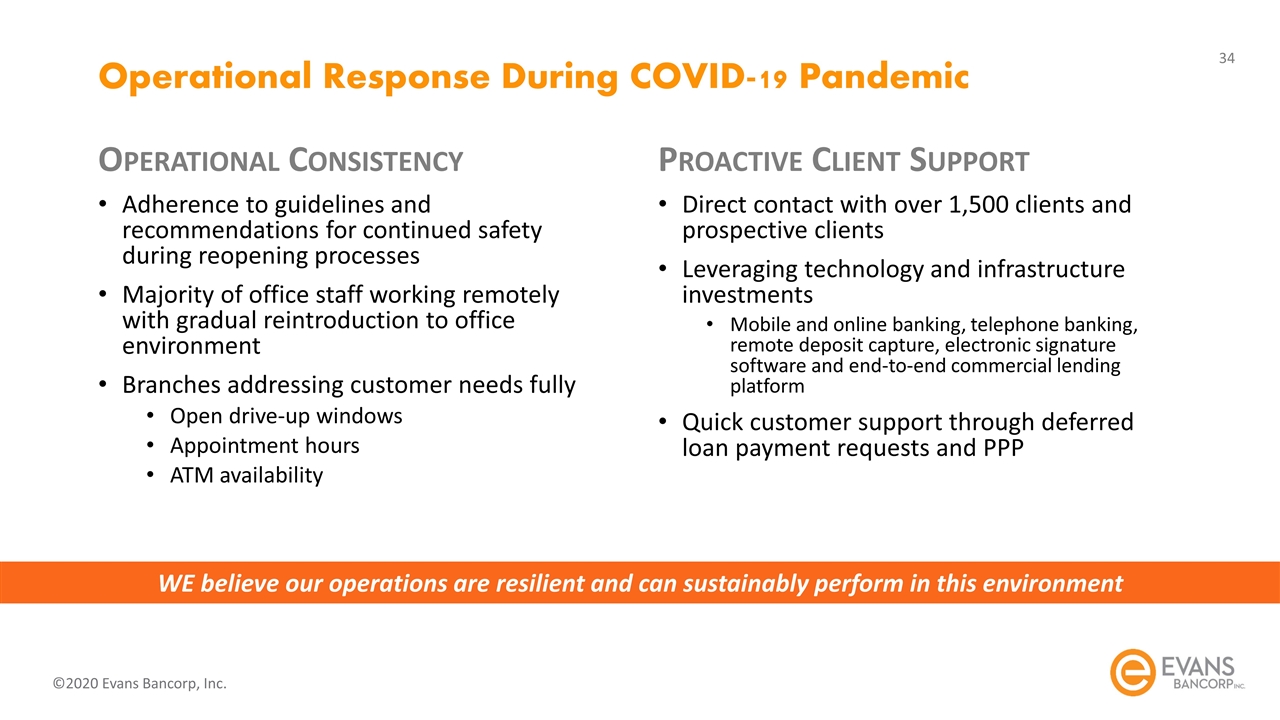
Operational Response During COVID-19 Pandemic Operational Consistency Adherence to guidelines and recommendations for continued safety during reopening processes Majority of office staff working remotely with gradual reintroduction to office environment Branches addressing customer needs fully Open drive-up windows Appointment hours ATM availability Proactive Client Support Direct contact with over 1,500 clients and prospective clients Leveraging technology and infrastructure investments Mobile and online banking, telephone banking, remote deposit capture, electronic signature software and end-to-end commercial lending platform Quick customer support through deferred loan payment requests and PPP WE believe our operations are resilient and can sustainably perform in this environment
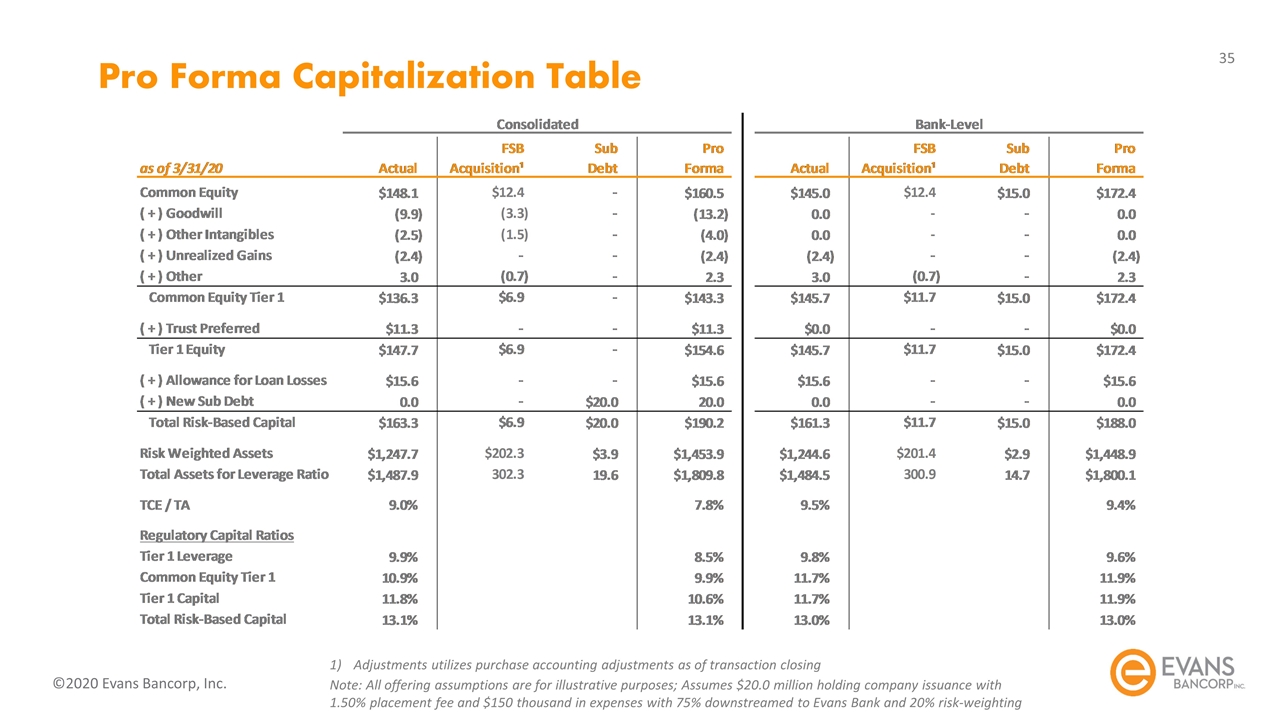
Pro Forma Capitalization Table Adjustments utilizes purchase accounting adjustments as of transaction closing Note: All offering assumptions are for illustrative purposes; Assumes $20.0 million holding company issuance with 1.50% placement fee and $150 thousand in expenses with 75% downstreamed to Evans Bank and 20% risk-weighting
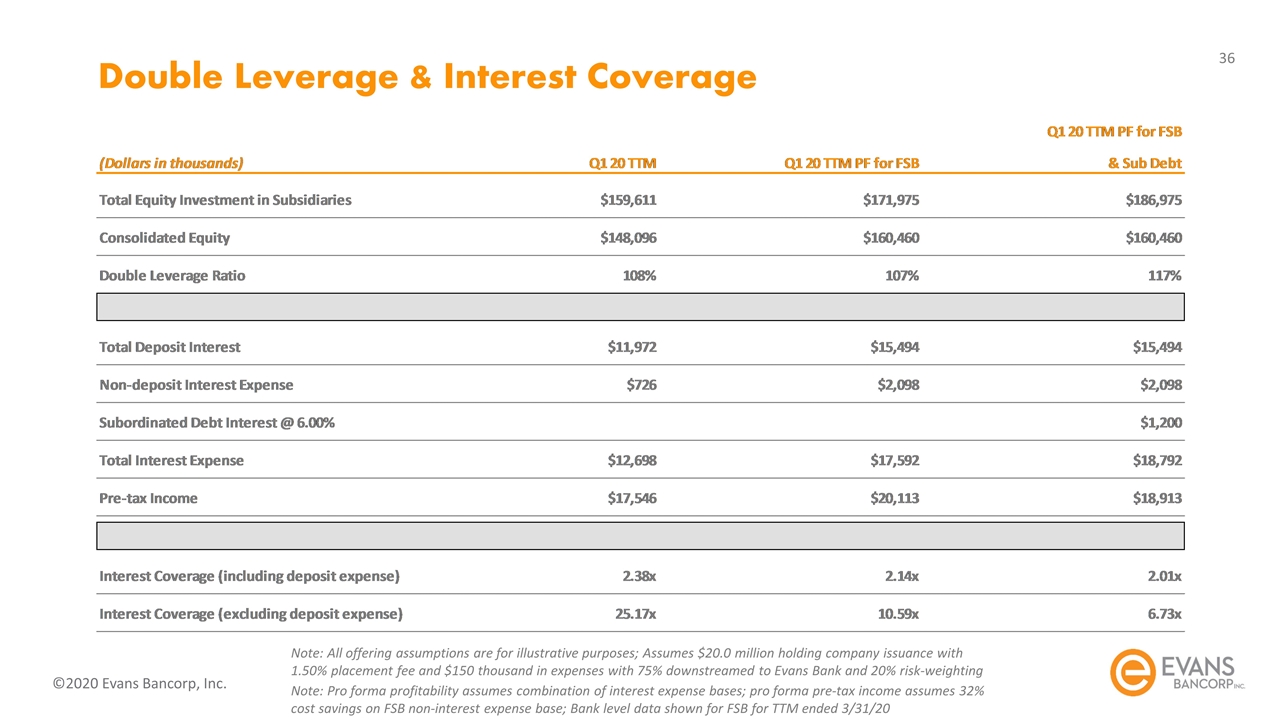
Double Leverage & Interest Coverage Note: All offering assumptions are for illustrative purposes; Assumes $20.0 million holding company issuance with 1.50% placement fee and $150 thousand in expenses with 75% downstreamed to Evans Bank and 20% risk-weighting Note: Pro forma profitability assumes combination of interest expense bases; pro forma pre-tax income assumes 32% cost savings on FSB non-interest expense base; Bank level data shown for FSB for TTM ended 3/31/20
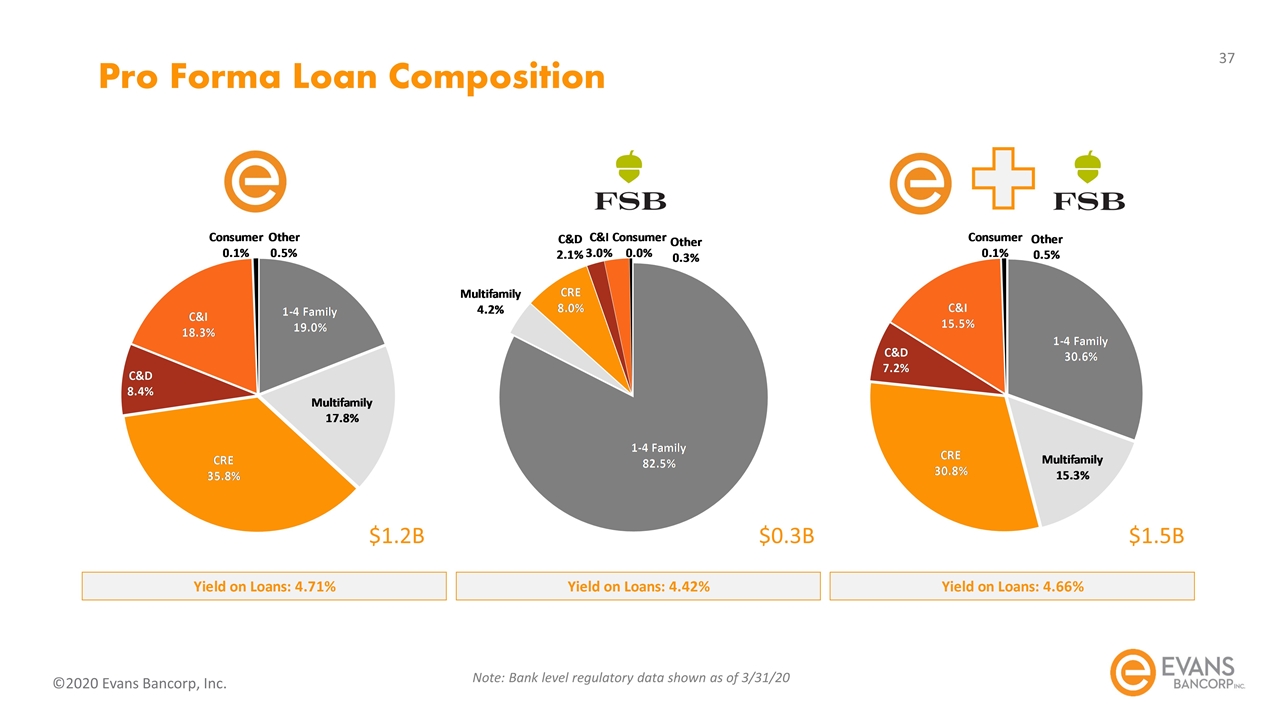
Pro Forma Loan Composition Note: Bank level regulatory data shown as of 3/31/20 $1.2B $0.3B $1.5B
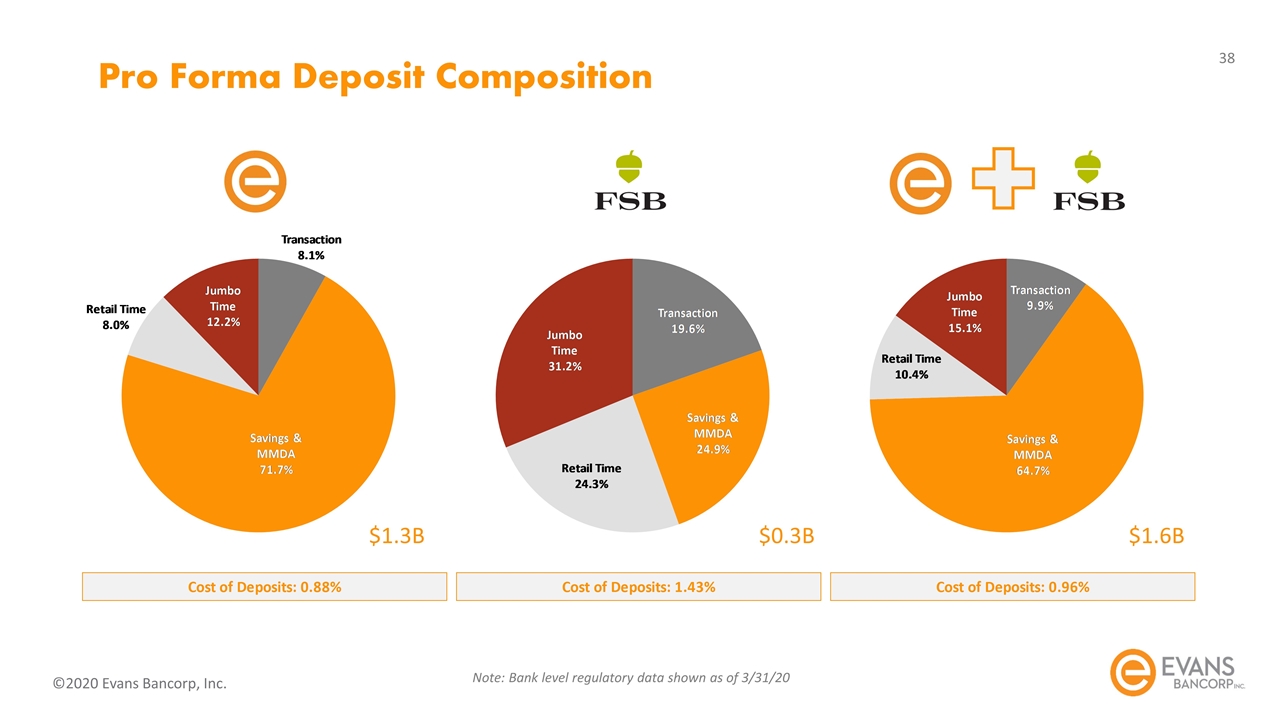
Pro Forma Deposit Composition Note: Bank level regulatory data shown as of 3/31/20 $1.3B $0.3B $1.6B


