2004 Fiscal Year and Fourth Quarter
Public Earnings Call
March 9, 2005
A Heartland Industrial Partners’ Company

This document contains “forward-looking” statements, as that term is defined by the federal securities laws, about our financial
condition, results of operations and business. Forward-looking statements include certain anticipated, believed, planned, forecasted,
expected, targeted and estimated results along with TriMas’ outlook concerning future results. The words “estimates,” “expects,”
“anticipates,” “projects,” “plans,” “intends,” “believes,” “forecasts,” or future or conditional verbs, such as “will,” “should,” “could,”
or “may,” and variations of such words or similar expressions are intended to identify forward-looking statements. All forward-
looking statements, including, without limitation, management’s examination of historical operating trends and data are based upon
our current expectations and various assumptions. Our expectations, beliefs and projections are expressed in good faith and we
believe there is a reasonable basis for them. However, there can be no assurance that management’s expectations, beliefs and
projections will be achieved. These forward-looking statements are subject to numerous assumptions, risks and uncertainties and
accordingly, actual results may differ materially from those expressed or implied by the forward-looking statements. We caution
readers not to place undue reliance on the statements, which speak only as of the date of this document. The cautionary statements set
forth above should be considered in connection with any subsequent written or oral forward-looking statements that we or persons
acting on our behalf may issue. We do not undertake any obligation to review or confirm analysts’ expectations or estimates or to
release publicly any revisions to any forward-looking statements to reflect events or circumstances after the date of this document or to
reflect the occurrence of unanticipated events. Risks and uncertainties that could cause actual results to vary materially from those
anticipated in the forward-looking statements included in this document include general economic conditions in the markets in which
we operate and industry-based factors such as: technological developments that could competitively disadvantage us, increases in our
raw material, energy, and healthcare costs, our dependence on key individuals and relationships, exposure to product liability, recall
and warranty claims, compliance with environmental and other regulations, and competition within our industries. In addition,
factors more specific to us could cause actual results to vary materially from those anticipated in the forward-looking statements
included in this document such as our substantial leverage, limitations imposed by our debt instruments, our ability to successfully
pursue our stated growth strategies and opportunities, including our ability to identify attractive and other strategic acquisition
opportunities and to successfully integrate acquired businesses and complete actions we have identified as providing cost
-saving opportunities.
Safe Harbor Statement
1
Agenda
2004 Fiscal Year and Fourth Quarter Financial Highlights
2004 Fourth Quarter Operating Highlights
2004 Fiscal Year and Fourth Quarter Financial Performance
TriMas Capitalization
2005 Key Performance Drivers
Q&A
Appendix
2
2004 Fiscal Year and Fourth Quarter Financial Highlights
Full Year 2004 Highlights
TriMas had net sales of $1,045.2 million for the fiscal year 2004, representing an increase of $139.8 million or 15.4%
over 2003.
When adjusted for steel surcharges recovered from customers, sales increased 11.7% year over year.
Each of our business groups had solid revenue growth reflecting the changing focus within TriMas from “Integration” to new
product introductions and market share attainment.
TriMas incurred $43.0 million in capital expenditures and $15.4 million in restructuring costs in 2004. These
expenditures essentially complete our restructuring / integration initiatives.
Adjusted EBITDA was 120.2 million for the year (including charges related to asbestos litigation defense costs of $2.7
million and write-off of deferred equity offering costs of $1.1 million), representing an increase of $6.4 million or
5.7% over 2003.
Operating income for the year was $62.4 million, representing an increase of $33.6 million or 117.0% over 2003.
The reported net loss of $2.2 million represented a $28.7 million improvement over the net loss of $30.9 million in
2003.
As stated, TriMas has completed its multi-year restructuring and integration activities and is now well positioned to
focus on market share growth, profitability and cash flow generation coming into 2005.
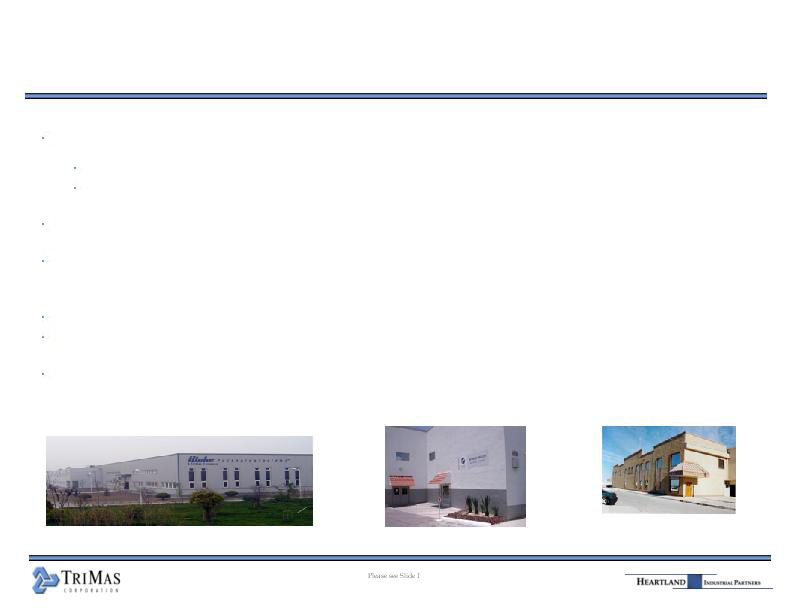
Cequent Commercial
Structural Products
Juarez, MX Facility
Cequent Electrical Product
Reynosa, MX Facility
Rieke Packaging Systems
Hangzhou, China
3
2004 Fiscal Year and Fourth Quarter Financial Highlights
Fourth Quarter 2004 Highlights
TriMas had sales of $243.0 million in the quarter, representing an increase of $41.7 million or 20.7% over Q4- 2003.
Excluding steel surcharges recovered from customers, sales still increased a solid 14.8% over the prior year’s
quarter.
Each of our business groups had solid revenue growth reflecting new product introductions and market share gains.
Adjusted for recovery of steel price increases, sales levels at Rieke, Cequent, Industrial Specialties and Fastening Systems
increased 12.5%, 19.5%, 12.5% and 9.0%, respectively.
Adjusted EBITDA within the quarter was $18.4 million (excluding charges related to asbestos litigation defense
costs of $2.7 million and write-off of deferred equity offering costs of $1.1 million), representing an increase of $3.0
million or 19.1% compared to Q4-2003.
The operating loss of $9.6 million represented a $4.7 million improvement over the operating loss of $14.3 million
in Q4-2003.
The operating loss in the quarter includes negative gross margin impact of $2.5 million due to steel cost increases not able to be
recovered from customers.
The operating loss for the quarter also included charges of $19.0 million which negatively impacted our operational earnings.
These charges included:
$10.7 million non-cash charge for abandoned buildings, equipment and other assets due to integration activities
$4.5 million non-cash charge for impairment of customer relationship intangibles
$2.7 million reserve charge related to asbestos litigation defense costs
$1.1 million write-off of deferred equity offering costs
Fourth quarter net loss was $15.5 million or $0.78 per share vs. the prior year quarter’s net loss of $26.2 million or
$1.31 per share.
TriMas ended the quarter with $786.0 million of combined debt and receivables securitization. Additional working
capital at Cequent, which added to our debt levels, of approximately $25 million is expected to be worked down in
early 2005.
4
2004 Fourth Quarter Financial Highlights
The Company’s bank LTM EBITDA was $154.9 million which supports our lending ratios:
The Company’s leverage ratio was 5.08x vs. the leverage covenant of 5.25x.
The interest coverage ratio was 2.41x vs. the interest coverage covenant of 2.25x.
The Company amended its credit agreement within the quarter to modify financial covenants to
enhance financial flexibility. The Company expects no liquidity issues in 2005.
Given our re-alignment in steel supply, aggressive market pricing, and cost controls, the
momentum established earlier in the year was re-established in the fourth quarter.
5
2004 Fourth Quarter Operating Highlights
Increased steel costs continued to be a significant but “waning” challenge in the quarter with its most direct impact on
our Cequent and Fastening Systems businesses. Un-recovered steel costs negatively impacted EBITDA within the
quarter by an estimated $2.5 million. TriMas believes it has recovered via pricing and surcharges, approximately 80%
of commodity / supply increases during the quarter.
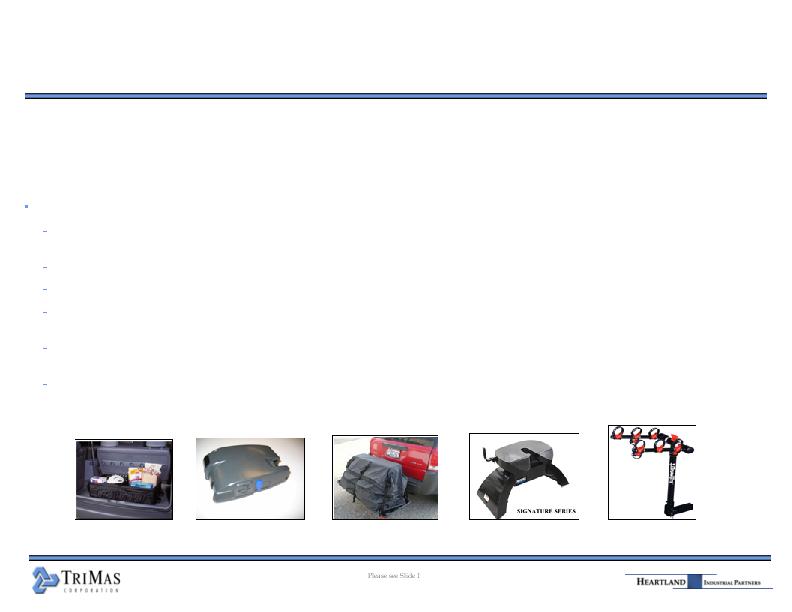
Cequent Transportation Accessories
Fourth quarter net sales increased 26.1%, and were up 19.5% after adjusting for steel surcharges recovered from
customers as compared to 2003.
Quarterly operating profit was $2.2 million compared to $1.0 million in the year ago period.
Our order fill performance is at 90+% versus historical average of 70+% resulting in higher customer satisfaction.
The group reduced its working capital in the fourth quarter and will continue to focus on its inventory levels as it
enters its primary selling season in 2005.
Absent the challenges of steel costs and erratic demand, Cequent continues to build its leadership position in the
“life-style” cargo management after market.
The order activity levels, general customer demand and channel inventories would suggest sales momentum
continuing as we enter 2005.
6

2004 Fourth Quarter Operating Highlights
Rieke Packaging Systems
Net sales for the quarter were $31.1 million, up 15.2% compared to fourth quarter 2003.
Core product sales volume increased by 7.5% while new specialty dispensing product revenues increased to
$4.3 million in the quarter or an increase of $1.7 million over Q4-2003.
Rieke launched 4 new product programs within the quarter and expects continued momentum as we enter
2005.
Operating income for the fourth quarter was $5.9 million or 18.9% of revenue, compared to $3.4 million and
12.8% in 2003.
Our Hangzhou, China facility is operating cash flow positive after 6 months and is expected to support $8.0
million in revenue on a full run rate basis in 2005.
7
2004 Fourth Quarter Operating Highlights
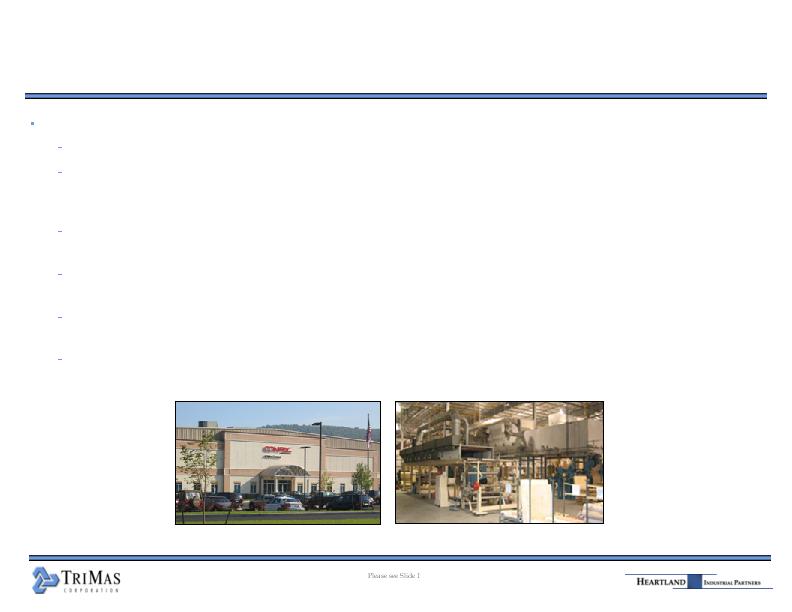
Fastening Systems
Sales were $41.2 million, an increase of 17.0% as compared to 2003, or 9.0% when adjusted for steel surcharges.
Operating loss of $11.6 million in Q4-2004 included $12.2 million of non-cash charges for asset write-offs at Lakewood and the
impairment of customer relationship intangibles.
Demand for industrial fastener products remains very strong.
Steel cost increases negatively impacted results in Q4 by an estimated $0.8 million. The unshipped order backlog for industrial
fasteners improved by $3.9 from Q3-2004 but remains at $6.1 at quarter end. We continue to make progress related to these
orders. Backlog will be neutralized early in 2005 with reasonable support of our customer base.
Pricing realization expected to lag underlying cost impact into early 2005. TriMas expects to enter 2005 with approximately 80%
of increased steel costs recovered via pricing and surcharges.
Our largest customers are working with us on pricing, however, our tier-one O.E. automotive customers have been difficult.
Aggressive stances have been taken with selected customers who were trying to ignore steel prices.
Fastening Systems continues to see strong revenue growth across its agriculture, heavy equipment, heavy truck and aerospace
markets.
Our new Frankfort, Indiana campus is complete; the former Lakewood, Ohio facility is being evaluated for sale.
Our Monogram Aerospace business continues to gain customer acceptance for its new OSI blind fastener, the next generation of
IP protected product and a significant market share opportunity within the industry.
Frankfort, IN Distribution
Frankfort, IN Manufacturing
8
2004 Fourth Quarter Operating Highlights
Industrial Specialties
Net sales for the quarter were $64.6 million, or an increase of 17.4% compared to 2003.
Operating income was $0.2 million and included a $2.7 million charge related to asbestos litigation defense
costs, a $2.3 million non-cash asset impairment charge and approximately $0.7million of non-recurring costs
related to the Compac facility consolidation, as compared to an operating loss of $4.1 million in Q4-2003.
The Compac facility consolidation was completed during Q4-2004 with negotiations under way to sell its
Netcong, New Jersey facility.
The group has experienced modest material economics through 2004 with pass-through generally accepted in
the form of pricing increases.
Revenue growth was driven primarily by new product introductions such as residential vapor facings,
medical cutting tools, new engine line replacement parts and international gasket sales.
The group has had stable demand all year and expects this momentum to continue in 2005.
Hackettstown, NJ
9
2004 Fiscal Year and Fourth Quarter Financial Performance
(1) The Company has established Earnings Before Interest, Taxes, Depreciation and Amortization ("EBITDA") as an indicator of our operating performance and as a measure of our cash generating capabilities. The Company defines “Adjusted EBITDA” as net income
before interest, taxes, depreciation, amortization, impairment of goodwill, non-cash losses on sale-leaseback of property and equipment, legacy stock award expense, write-off of equity offering costs and asbestos litigation defense costs.
(2) Represents certain charges related to our consolidation, restructuring and integration activities intended to eliminate duplicative costs or achieve cost efficiencies related to integrating acquisitions or other restructurings related to expense reduction efforts. Such
costs are not eliminated in the determination of Company Adjusted EBITDA, however we would eliminate these costs to better evaluate our underlying business performance.
($ in millions)
10
Three Months Ended December 31
Year Ended December 31
Net Sales
2004
2003
Variance
2004
2003
Variance
Cequent Transportation Accessories…………………..
106.1
$
84.1
$
26.1%
511.3
$
427.4
$
19.6%
Rieke Packaging Systems……………………………..
31.1
27.0
15.2%
129.2
119.1
8.5%
Fastening Systems………………………………..……………………………..
41.2
35.2
17.0%
156.0
141.0
10.6%
Industrial Specialties………………………………..……………………………..
64.6
55.0
17.4%
248.7
217.9
14.1%
Total Net Sales ……………………..
243.0
$
201.3
$
20.7%
1,045.2
$
905.4
$
15.4%
Operating Profit
Cequent Transportation Accessories……………..
2.2
$
1.0
$
133.7%
51.6
$
37.4
$
38.1%
Rieke Packaging Systems………………………..
5.9
3.4
70.6%
30.0
25.3
18.5%
Fastening Systems………………………………..……………………………..
(11.6)
(7.9)
47.8%
(17.4)
(16.0)
8.8%
Industrial Specialties………………………………..……………………………..
0.2
(4.1)
103.9%
20.2
7.4
170.8%
Corporate………………………………..……………………………..
(6.3)
(5.6)
11.5%
(22.0)
(20.6)
7.1%
Stock Awards………………………………..……………………………..
-
(1.1)
N/A
-
(4.8)
N/A
Total Operating Profit……………………..
(9.6)
$
(14.3)
$
32.8%
62.4
$
28.7
$
117.0%
% Margin………………………………..……………………………..
(3.9%)
(7.1%)
3.2%
6.0%
3.2%
2.8%
Adjusted EBITDA
(1)
Cequent Transportation Accessories……………………..
6.7
$
6.6
$
1.1%
70.3
$
57.7
$
21.7%
Rieke Packaging Systems……………………………………..
8.3
8.1
2.7%
39.0
37.2
4.7%
Fastening Systems………………………………..……………………………..
2.1
(1.1)
283.2%
1.2
7.3
(82.9%)
Industrial Specialties………………………………..…………..
6.9
7.7
10.5%
32.4
31.6
2.6%
Segment Adjusted EBITDA
.................................................................
24.0
$
21.3
$
12.6%
142.9
$
133.8
$
6.7%
% Margin………………………………..……………………………..
9.9%
10.6%
(0.7%)
13.7%
14.8%
(1.1%)
Corporate operating expenses and management fee…………..
(5.0)
(5.4)
7.2%
(20.6)
(20.5)
0.1%
Corporate other income (expense)……………………..
(0.6)
(0.5)
N/A
(2.1)
0.4
N/A
Total Company Adjusted EBITDA
..........................................
18.4
$
15.4
$
19.1%
120.2
$
113.7
$
5.7%
% Margin………………………………..……………………………..
7.6%
7.7%
(0.1%)
11.5%
12.6%
(1.1%)
Memo Items:
Restructuring, consolidation and integration costs
(2)
......................
(2.1)
$
(3.6)
$
1.5
$
(15.4)
$
(15.4)
$
-
$
Legacy stock award expense…………..
-
$
(1.1)
$
1.1
$
-
$
(4.8)
$
4.8
$
Equity offering costs…………………..
1.1
$
-
$
1.1
$
1.1
$
-
$
1.1
$
Asbestos defense costs………………..
2.7
$
-
$
2.7
$
2.7
$
-
$
2.7
$
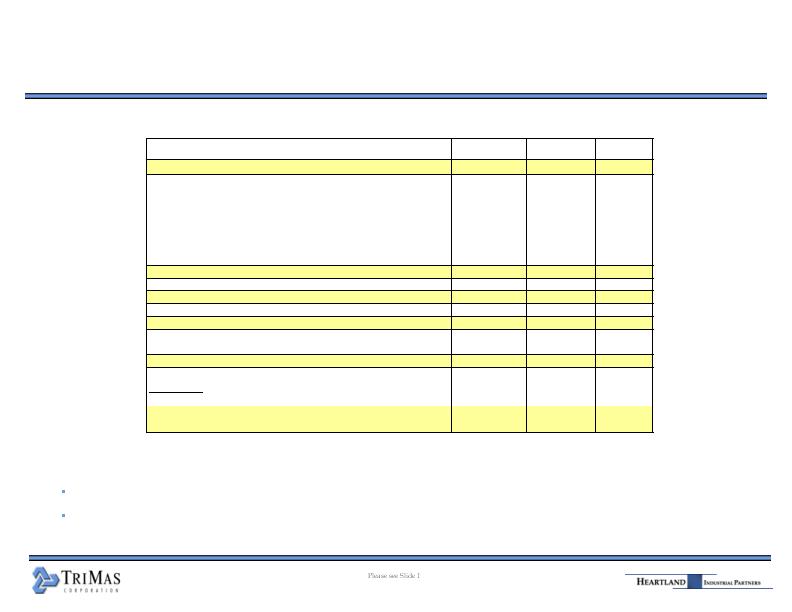
TriMas Capitalization
Fourth Quarter 2004 Update:
TriMas had $3.1 million of cash and cash equivalents at December 31, 2004.
The Credit Agreement leverage ratio was5.08x Bank LTM EBITDA at December 31, 2004.
($ in millions)
11
September
30, 2004
December 31,
2004
% of Total
Cash and Cash Equivalents……………………………..……………
3.2
$
3.1
$
Working Capital Revolver……………………………..……………
50.0
$
12.8
$
1.1%
Term Loan B……………………………..……………
289.6
288.9
25.3%
Other Debt……………………………..……………
0.1
0.1
0.0%
Subtotal, Senior Secured Debt……………………………..……………
339.7
301.8
26.4%
9.875% Senior Sub Notes due 2012……………………………..……………
436.2
436.2
38.2%
Total Debt……………………………..……………
775.9
$
738.0
$
64.6%
Total Shareholders' Equity……………………………..……………
409.2
$
405.2
$
35.4%
Total Capitalization……………………………..……………
1,185.1
$
1,143.2
$
100.0%
Memo: A/R Securitization……………………………..……………
7.8
$
48.0
$
Total Debt + A/R Securitization……………………………..……………
783.7
$
786.0
$
Key Ratios:
Bank LTM EBITDA……………………………..……………
158.6
$
154.9
$
Coverage Ratio……………………………..……………
2.53x
2.41x
Leverage Ratio ……………………………..……………
4.94x
5.08x
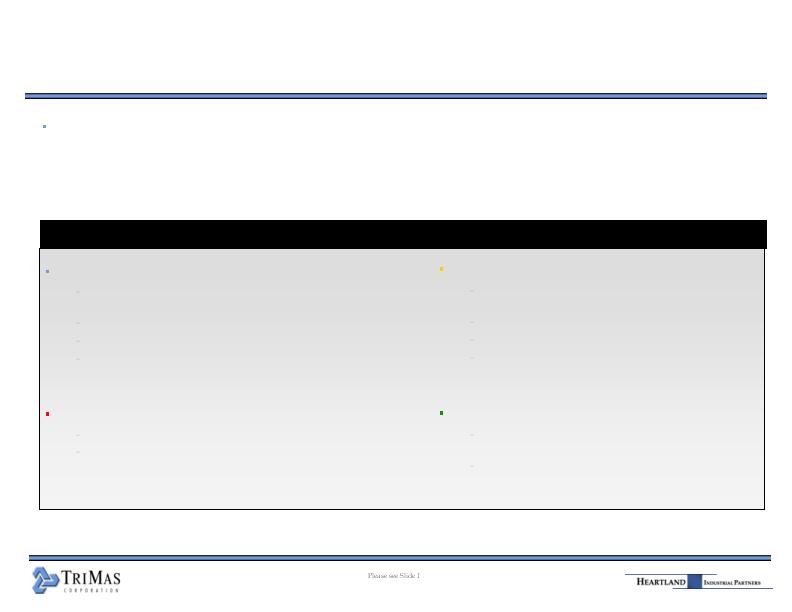
2005 Key Performance Drivers
In aggregate, TriMas gained substantial positive momentum over the course of 2004. This momentum was
clear during the first half of the year, abated for several reasons in the third quarter and was re-established
during the fourth quarter. The issues of the third quarter drove steel supplier realignment, customer pricing
and operations “right-sizing”. We believe this momentum will continue into 2005 and drive increased free
cash flow.
Fastening Systems
Enters 2005 with large backlog with steel
supply in place and strong demand
Plant consolidation complete
Impact of price negotiations expected
Improved operational efficiencies being
achieved
Industrial Specialties
Solid growth in all six businesses expected
to continue into 2005
Core customers forecasting continued
revenue expansion
Cequent Transportation Accessories
Attack market share and continue to drive customer
satisfaction with above market order fill performance
Focused on moderating working capital investment
New product launches gaining momentum
Inventory levels in customer channels at moderate levels.
The 2005 season is positioned to be strong!
Rieke Packaging Systems
Orders from new product launches continue to accelerate
Solid performance expected in core industrial business
Business Group Performance Drivers
12

2005 Key Performance Drivers (cont’d)
TriMas is well positioned to drive EBITDA and free cash flow expansion as we enter 2005.
Restructuring initiatives completed in 2004 with minimal non-recurring expenses trailing into
2005.
Return to normalized capital expenditure levels.
Focused on reduced working capital investment in the form of inventory reductions primarily in
Cequent’s aftermarket group.
2005 will be first “clean” year without unusual charges.
Foreign buying office; up and running.
TriMas is poised to fully realize these benefits of our initiatives in the form of margin expansion
and a return to free cash flow generation.
Entering 2005 stronger than ever!
13

Q & A
Appendix
Condensed Balance Sheet
(unaudited - in millions)
16
2004
2003
Assets
Current Assets
Cash & Cash Equivalents……………………………..……………
3.1
$
6.8
$
Receivables……………………………..……………
93.4
119.0
Inventories……………………………..……………
180.0
124.1
Deferred Income Taxes……………………………..……………
17.5
10.9
Prepaid Expenses and Other Current Assets…………
8.5
8.4
Total Current Assets……………………………..……………
302.5
$
269.2
$
Property & Equipment, net……………………………..……………
198.6
187.4
Goodwill……………………………..……………
658.0
658.9
Other Intangibles……………………………..……………
304.9
322.7
Other Assets……………………………..……………
58.2
61.8
Total Assets……………………………..……………
1,522.2
$
1,500.0
$
Liabilities and Shareholders' Equity
Current Liabilities:
Current Maturities, Long-Term Debt……………………………..……………
3.0
$
10.9
$
Accounts Payable……………………………..……………
135.2
94.1
Accrued Liabilities……………………………..……………
68.2
75.1
Due to Metaldyne……………………………..……………
2.6
4.4
Total Current Liabilities……………………………..……………
209.0
$
184.5
$
Long-Term Debt……………………………..……………
735.0
725.1
Deferred Income Taxes……………………………..……………
133.5
149.0
Other Long-Term Liabilities……………………………..……………
35.2
37.8
Due to Metaldyne……………………………..……………
4.3
6.9
Total Liabilities……………………………..……………
1,117.0
$
1,103.3
$
Total Shareholders' Equity……………………………..……………
405.2
$
396.7
$
Total Liabilities and Shareholders' Equity……………………………..……………
1,522.2
$
1,500.0
$
As of December 31,

Condensed Statement of Operations
(unaudited - in millions, except per share amounts)
2004
2003
Net sales
243.0
$
201.3
$
Cost of sales
(191.6)
(153.8)
Gross profit
51.4
47.5
Selling, general and administrative expenses
(49.4)
(52.3)
Asset impairments
(10.7)
(7.6)
Loss on dispositions of property & equipment
(0.9)
(1.9)
Operating profit
(9.6)
(14.3)
Other expense, net
(18.1)
(15.4)
Loss before income taxes
(27.7)
(29.7)
Income tax benefit
12.2
3.5
Net loss
(15.5)
$
(26.2)
$
Basic loss per share
(0.78)
$
(1.31)
$
Diluted loss per share
(0.78)
$
(1.31)
$
Weighted average common shares - basic
20.0
20.0
Weighted average common shares - diluted
20.0
20.0
December 31,
For the Three Months Ended
17

Cash Flow Highlights
(unaudited - in millions)
2004
2003
Cash provided by operating activities………………
42.6
$
41.4
$
Capital expenditures……………………………..……………
(43.0)
(31.7)
Proceeds from sales of fixed assets……………
1.7
76.2
Acquisition of businesses, net of cash acquired……
(5.5)
(205.8)
Cash used for investing activities………
(46.8)
$
(161.3)
$
Proceeds from senior credit facility, net……………
9.9
32.4
Payments on notes payable and other …………
(9.4)
(2.4)
Proceeds from sales of common stock, net…………
-
15.2
Metaldyne financing items, net………………
-
(18.9)
Cash provided by financing activites……………
0.5
$
26.3
$
Net change in cash and cash equivalents…………
(3.7)
$
(93.6)
$
18
For the Years Ended December 31

Key Covenant Calculations
($ in millions)
19
Leverage Ratio:
Total Indebtedness at December 31, 2004
(1)
……………………………..……………
786.0
$
LTM EBITDA, as defined
(2)
……………………………..……………
154.9
$
Leverage Ratio - Actual……………………………..……………
5.08x
Leverage Ratio - Covenant……………………………..……………
5.25x
Coverage Ratio:
LTM EBITDA, as defined
(2)
……………………………..……………
154.9
$
Cash Interest Expense
(2)
……………………………..……………
64.3
$
Coverage Ratio - Actual……………………………..……………
2.41x
Coverage Ratio - Covenant……………………………..……………
2.25x
Notes:
(1) As defined in our Credit Agreement, as amended and restated June 6, 2003.
(2) LTM EBITDA, as defined and cash interst expense is based on preliminary estimates, subject to adjustment.