
2005 First Quarter Review
Public Earnings Call
May 10, 2005
A Heartland Industrial Partners’ Company
This document contains “forward-looking” statements, as that term is defined by the federal securities laws, about our financial
condition, results of operations and business. Forward-looking statements include certain anticipated, believed, planned, forecasted,
expected, targeted and estimated results along with TriMas’ outlook concerning future results. The words “estimates,” “expects,”
“anticipates,” “projects,” “plans,” “intends,” “believes,” “forecasts,” or future or conditional verbs, such as “will,” “should,” “could,”
or “may,” and variations of such words or similar expressions are intended to identify forward-looking statements. All forward-
looking statements, including, without limitation, management’s examination of historical operating trends and data are based upon
our current expectations and various assumptions. Our expectations, beliefs and projections are expressed in good faith and we
believe there is a reasonable basis for them. However, there can be no assurance that management’s expectations, beliefs and
projections will be achieved. These forward-looking statements are subject to numerous assumptions, risks and uncertainties and
accordingly, actual results may differ materially from those expressed or implied by the forward-looking statements. We caution
readers not to place undue reliance on the statements, which speak only as of the date of this document. The cautionary statements set
forth above should be considered in connection with any subsequent written or oral forward-looking statements that we or persons
acting on our behalf may issue. We do not undertake any obligation to review or confirm analysts’ expectations or estimates or to
release publicly any revisions to any forward-looking statements to reflect events or circumstances after the date of this document or to
reflect the occurrence of unanticipated events. Risks and uncertainties that could cause actual results to vary materially from those
anticipated in the forward-looking statements included in this document include general economic conditions in the markets in which
we operate and industry-based factors such as: technological developments that could competitively disadvantage us, increases in our
raw material, energy, and healthcare costs, our dependence on key individuals and relationships, exposure to product liability, recall
and warranty claims, compliance with environmental and other regulations, and competition within our industries. In addition,
factors more specific to us could cause actual results to vary materially from those anticipated in the forward-looking statements
included in this document such as our substantial leverage, limitations imposed by our debt instruments, our ability to successfully
pursue our stated growth strategies and opportunities, including our ability to identify attractive and other strategic acquisition
opportunities and to successfully integrate acquired businesses and complete actions we have identified as providing cost
-saving opportunities.
Safe Harbor Statement
1
Agenda
2005 First Quarter Financial Highlights
2005 First Quarter Operating Highlights
2005 First Quarter Financial Performance
TriMas Capitalization
TriMas Corporation - 2005 Focus and Priorities
Q&A
Appendix
2
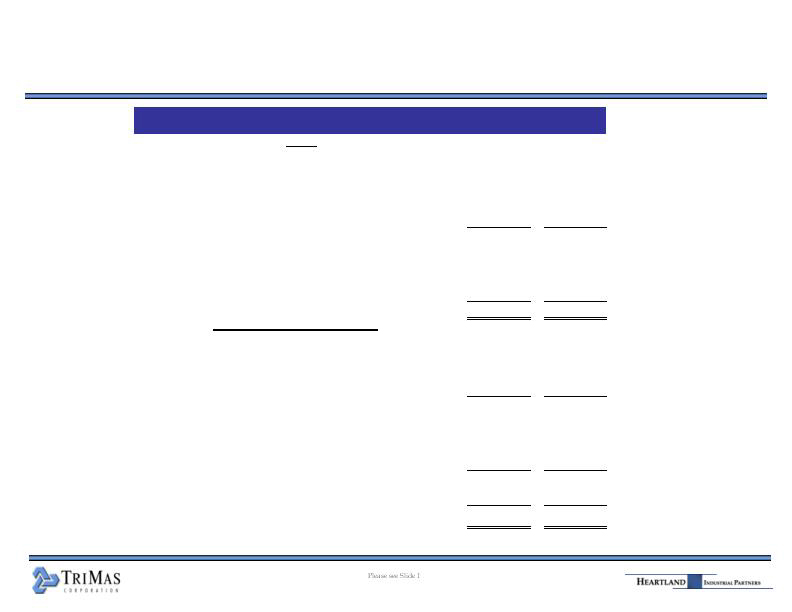
2005 First Quarter Financial Highlights
TriMas had sales of $292.7 million in the quarter, representing an increase of $31.8 million or 12.2% over Q1 2004.
Excluding steel surcharges recovered from customers, sales still increased a solid 6.2% over first quarter 2004.
With the exception of our Cequent Transportation Accessories segment, each of our business segments had
strong year-over-year revenue growth in the quarter reflecting new product introductions, market share gains
and overall economic expansion.
Adjusted for recovery of steel price increases, sales levels at Rieke, Cequent, Industrial Specialties and
Fastening Systems increased 10.4%, 1.9%, 15.0% and 3.5%, respectively, on a unit volume basis.
Adjusted EBITDA within the quarter was $32.7 million, representing an increase of $2.6 million or 8.6% compared
to Q1 2004.
The Company reported Q1 2005 operating income of $23.2 million, an increase of $3.1 million over the operating
income of $20.1 million in Q1 2004.
Operating income reported in Q1 2005 includes a negative gross margin impact of approximately $1.5 million
due to steel cost increases not recovered from customers.
Expenses related to plant consolidation and restructuring activities decreased $3.9 million to $1.5 million in Q1
2005 compared to $5.4 million in Q1 2004.
Excluding the impact of steel, reductions in labor and other variable costs during the quarter were more than
offset by pricing compression in Cequent’s retail aftermarket business and increases in non-steel material costs
including resins, energy, and freight.
First quarter 2005 net income was $2.5 million or $0.13 per share versus first quarter 2004 net income of $2.2
million or $0.11 per share. This represented an increase in reported net income of 13.1% in Q1 2005 versus Q1
2004.
3

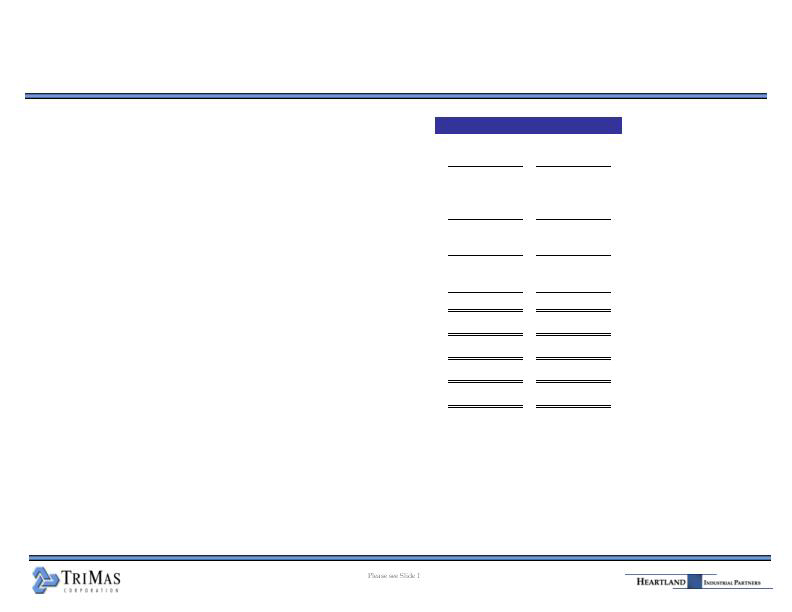
2005 First Quarter Financial Highlights
Increased steel costs continued to challenge operating margins in the quarter with its most direct impact on our
Cequent and Fastening Systems businesses. Unrecovered steel costs negatively impacted EBITDA within the
quarter by approximately $1.5 million.
TriMas believes it is currently recovering approximately 85% of steel cost increases from customers via
pricing; however we were also challenged during the quarter with non-steel cost increases including amounts
paid for resins, energy, and freight.
TriMas ended the quarter with $813.4 million of combined debt and receivables securitization compared to $786.0
million at December 31, 2004 and $792.0 million at March 31, 2004.
The approximate $27 million increase in leverage from year end is due primarily to higher accounts
receivable balances at March 31, 2005 as a result of increased sales during the quarter.
The Company’s bank LTM EBITDA was $149.2million which supports our lending ratios:
The Company’s leverage ratio was 5.45x vs. the leverage covenant of 5.50x.
The interest coverage ratio was 2.25x vs. the interest coverage covenant of 2.00x.
4
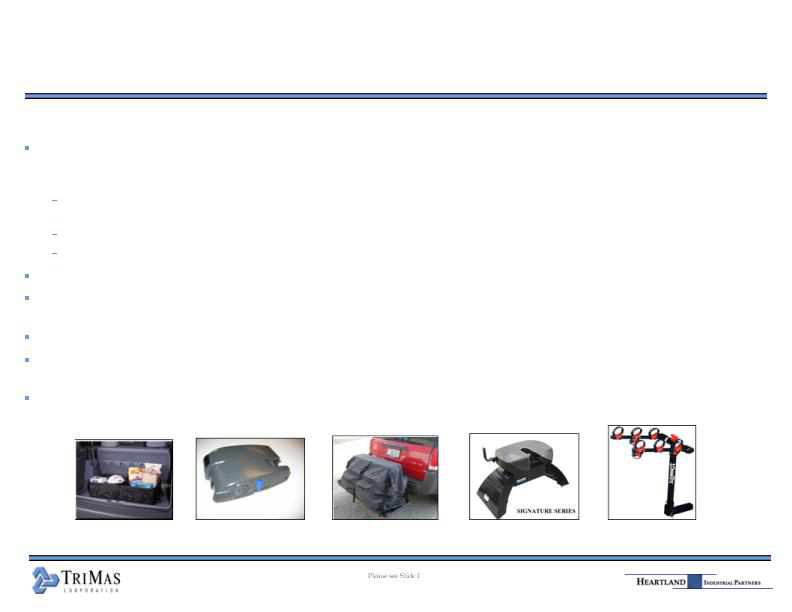
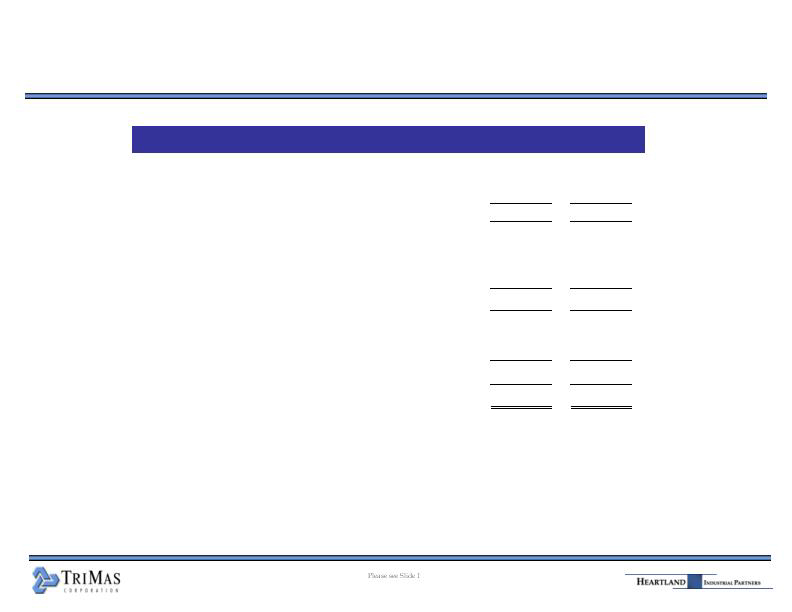
2005 First Quarter Operating Highlights
Cequent Transportation Accessories
First quarter 2005 sales increased $11.1 million to $140.6 million, or 8.6%, from amounts reported in Q1 2004
of $129.5 million. Excluding the impacts of steel, sales in the quarter increased only 1.9% compared to Q1
2004.
Cequent experienced soft demand for towing products in the wholesale distributor and installer markets due to
adequate inventory levels in the channels.
Significant competitive pricing pressures impacted margins across all our channels, but especially retail.
Sales in Q1 2004 were extremely strong as customers bought ahead of steel-related price increases.
Adjusted EBITDA in Q1 2005 decreased $1.4 million to $16.9 million from $18.3 million in Q1 2004.
Quarterly operating profit was $12.3 million (8.7% of sales) compared to $13.8 million (10.7% of sales) in the
year ago period.
Our order fill performance is excellent.
Continued pricing pressure is expected as market demand remains flat and increased competition from
Southeast Asia continues in many of our product categories.
Cequent is aggressively implementing actions to address challenges related to earnings performance and the
potential of a softer than expected selling season.
5
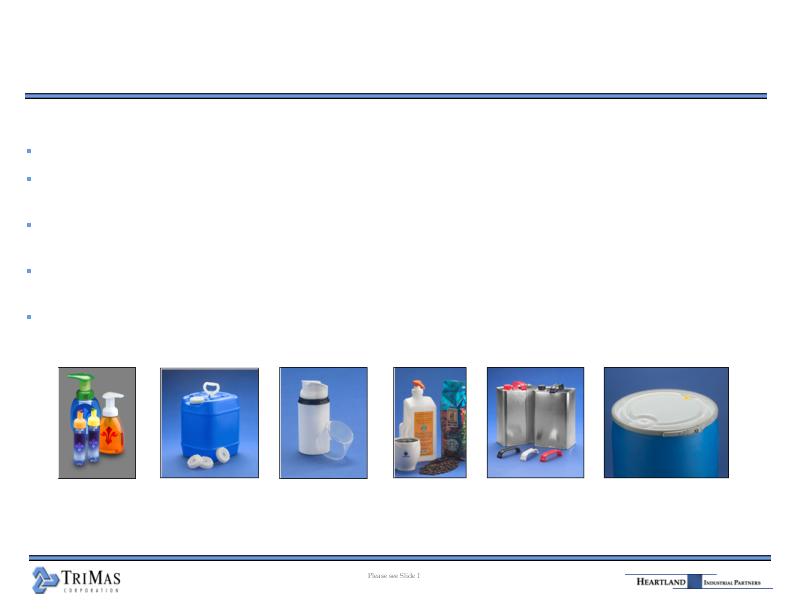
2005 First Quarter Operating Highlights
Rieke Packaging Systems
Net sales for the quarter were $34.1 million, up 12.2% compared to first quarter 2004.
Core product sales volume increased approximately 4.0% while new specialty dispensing product
revenues increased to $4.3 million in the quarter or an increase of $1.7 million over Q1 2004.
Rieke launched 8 new pump dispensing products within first quarter 2005 and expects continued
momentum over the remainder of the year.
Operating income for first quarter 2005 increased $1.3 million to $7.3 million (21.3% of sales) from $6.0
million (19.6% of sales) in first quarter 2004.
Order intake during Q1 2005 increased almost 20% compared to the same period a year ago and Rieke
expects demand to remain solid in 2005.
6
2005 First Quarter Operating Highlights
Fastening Systems
Q1 2005 sales increased 14.2% or $5.5 million to $44.2 million from $38.7 million in Q1 2004. Excluding steel price
increases recovered from customers, the year-over-year sales increase in the quarter approximated 3.5%.
Sales of industrial fastener products remained strong in the quarter as Lake Erie Products was able to reduce its
unshipped order backlog from approximately $7.0 million at year end to less than $2.0 million at March 31, 2005.
Sales of aerospace fasteners in the quarter increased 8.9% compared to the prior year as strong industry plane
build forecasts for 2006 and beyond drove increased buying to replenish inventory levels. Our order backlog for
aerospace fasteners at quarter end approximated $19.0 million.
Operating income for the quarter was $0.8 million, a $2.4 million improvement from the operating loss reported in
first quarter 2004 of $1.6 million.
Adjusted EBITDA in the quarter was $2.3 million compared to $0.1 million in Q1 2004. Pricing realization is
expected to lag underlying cost impact into Q2 2005. The group expects to recover approximately 90% of
increased steel costs via pricing and surcharges over the remainder of 2005.
For the quarter, incremental costs associated with Lake Erie Products’ restructuring activities decreased $1.8
million between years as the consolidation of our Lakewood facility into our Frankfort facility was essentially
completed in Q4 2004.
Manufacturing activity levels have reached targeted production levels at Frankfort and Wood Dale facilities.
Revenue growth is now the focus within Lake Erie Products.
Our two fastening SBU’s both expect continued momentum across 2005.
7
2005 First Quarter Operating Highlights
Industrial Specialties
Net sales for Q1 2005 were $73.8 million, an increase of 18.4% compared to the same period a year ago driven by new
product introductions, market share gains and economic expansion. Excluding the impact of steel, year-over-year
sales increased approximately 15.0%.
Lamons had record quarterly sales and benefited from significant oil refinery “turnaround” activity with major
customers such as Exxon, Dow, BP and Citgo.
Sales of Arrow’s engines and replacement parts increased 56.1% versus the year ago period as it benefited from
high levels of drilling activity in the U.S. and Canada and continued high oil and natural gas prices.
Compac’s sales in the quarter were flat compared to Q1 2004 due to softness in the commercial building market.
Norris Cylinder sales increased 14.2% as adjusted for steel over Q1 2004 with a strong backlog.
Precision Tool is beginning to see real growth in its strategic initiative of selling into specialty medical. Revenue
was up 12.8% as compared to Q1 2004.
Operating income for the quarter increased 10.7% to $8.5 million from $7.7 million in the year ago period.
Adjusted EBITDA for the quarter was $10.4 million compared to $9.5 million in the period a year ago.
For the quarter, incremental costs associated with facility consolidation and other restructuring activities decreased
$0.6 million between years as the move into Compac’s Hackettstown facility was essentially completed in Q4 2004.
Compac completed the sale of its Netcong, New Jersey facility during Q1 2005.
This group of companies expects continued momentum across 2005.
8
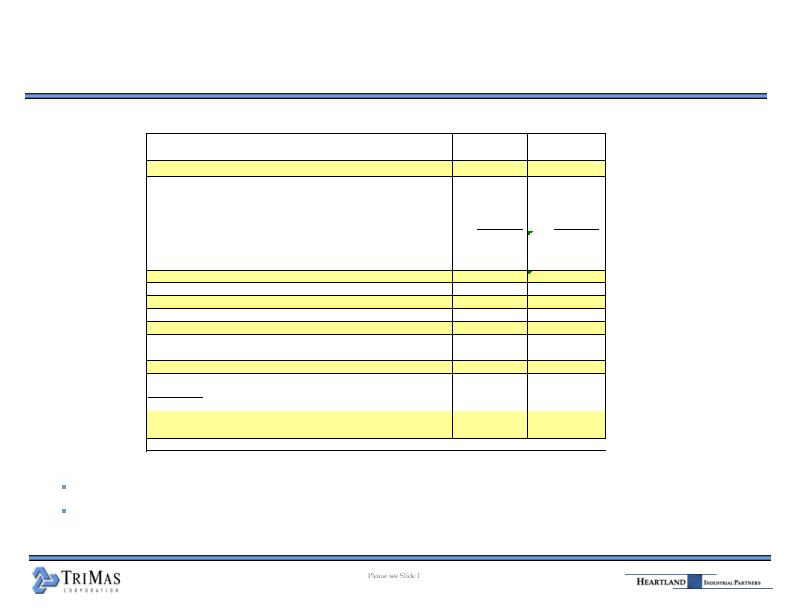
Three Months Ended March 31,
LTM Ended March 31,
Net Sales
2005
2004
Variance
2005
2004
Variance
Cequent Transportation Accessories
140.6
$
129.5
$
8.6%
522.5
$
458.0
$
14.1%
Rieke Packaging Systems
34.1
30.4
12.2%
132.9
119.2
11.5%
Fastening Systems
44.2
38.7
14.2%
161.5
144.7
11.6%
Industrial Specialties
73.8
62.3
18.4%
260.1
226.4
14.9%
Total Net Sales
292.7
$
260.9
$
12.2%
1,077.0
$
948.3
$
13.6%
Operating Profit
Cequent Transportation Accessories
12.3
$
13.8
$
(11.1%)
50.1
$
44.2
$
13.3%
Rieke Packaging Systems
7.3
6.0
22.2%
31.3
24.5
27.7%
Fastening Systems
0.8
(1.6)
152.9%
(15.0)
(14.6)
3.2%
Industrial Specialties
8.5
7.7
10.7%
21.0
15.2
38.7%
Corporate
(5.7)
(5.8)
2.4%
(21.9)
(21.8)
0.2%
Stock Awards
-
-
N/A
-
(3.6)
N/A
Total Operating Profit
23.2
$
20.1
$
15.4%
65.5
$
43.9
$
49.1%
% Margin
7.9%
7.7%
0.2%
6.1%
4.6%
1.5%
Adjusted EBITDA
(1)
Cequent Transportation Accessories
16.9
$
18.3
$
(7.6%)
68.9
$
63.6
$
8.3%
Rieke Packaging Systems
9.4
8.4
11.2%
40.0
36.2
10.2%
Fastening Systems
2.3
0.1
3816.7%
3.5
3.8
(5.6%)
Industrial Specialties
10.4
9.5
9.0%
30.5
32.7
(6.5%)
Segment Adjusted EBITDA
39.0
$
36.3
$
7.5%
142.9
$
136.3
$
4.9%
% Margin
13.3%
13.9%
(0.6%)
13.3%
14.4%
(1.1%)
Corporate office, management fee and other
(6.3)
(6.2)
1.9%
(22.8)
(22.2)
3.2%
Total Company Adjusted EBITDA
32.7
$
30.1
$
8.6%
120.1
$
114.1
$
5.2%
% Margin
11.2%
11.5%
(0.3%)
11.1%
12.0%
(0.9%)
Memo Items:
Restructuring, consolidation and integration costs(2)
(1.5)
$
(5.4)
$
3.9
$
(11.5)
$
(17.4)
$
5.9
$
Asbestos litigation defense costs
(0.4)
$
-
$
(0.4)
$
(3.1)
$
-
$
(3.1)
$
($ in millions)
(1) The Company has established Earnings Before Interest, Taxes, Depreciation and Amortization ("EBITDA") as an indicator of our operating performance and as a measure of our cash generating capabilities. The Company defines
“Adjusted EBITDA” as net income before interest, taxes, depreciation, amortization, non-cash asset and goodwill impairment write-offs, non-cash losses on sale-leaseback of property and equipment, legacy restricted stock award expense,
and write-off of equity offering costs.
(2) Represents certain charges related to our consolidation, restructuring and integration activities intended to eliminate duplicative costs or achieve cost efficiencies related to integrating acquisitions or other restructurings related to
expense reduction efforts. These costs and asbestos litigation defense costs are not eliminated in the determination of Company Adjusted EBITDA, however we would exclude these costs to better evaluate our underlying business
performance.
2005 First Quarter Financial Performance
TriMas Capitalization
March 31,
2005
December 31,
2004
Cash and Cash Equivalents
3.9
$
3.1
$
Working Capital Revolver
29.4
$
12.8
$
Term Loan B
288.2
288.9
Other Debt
-
0.1
Subtotal, Senior Secured Debt
317.6
301.8
9.875% Senior Sub Notes due 2012
436.3
436.2
Total Debt
753.9
$
738.0
$
Total Shareholders' Equity
404.0
$
405.2
$
Total Capitalization
1,157.9
$
1,143.2
$
Memo: A/R Securitization
59.5
$
48.0
$
Total Debt + A/R Securitization
813.4
$
786.0
$
Key Ratios:
Bank LTM EBITDA
149.2
$
154.9
$
Coverage Ratio
2.25x
2.41x
Leverage Ratio
5.45x
5.08x
10
($ in millions)
First Quarter 2005 Update:
TriMas had$3.9 million of cash and cash equivalents at March 31, 2005.
The Credit Agreement leverage ratio was5.45x Bank LTM EBITDA at March 31, 2005.
TriMas Corporation - 2005 Focus and Priorities
In first quarter 2005, TriMas achieved substantial year-over-year sales and earnings growth within
Rieke Packaging Systems, Fastening Systems and Industrial Specialties business segments.
Twelve (12) of our fourteen (14) businesses are well-positioned to maintain positive sales and earnings
growth as we move through 2005.
Cequent Transportation Accessories does have potential earnings challenges within its Towing
Products and Consumer Products businesses given the following considerations:
Flat market conditions at best for Towing
Competitive pricing pressures – especially in retail channels
Material cost inflation: steel and plastic
Overall unit volume weakness began to manifest itself in March. Daily order levels have continued to soften
across the group in April with the exception of retail.
Selling season cannot be “called” but is a concern!
In reaction to the potential of a softer than expected selling season, Cequent is implementing the following:
Salaried headcount reductions
Lower production levels
Continued price increase in certain product lines
Ship from stock, build to order
Continued discipline around discretionary spending and investment
Continued drive to shrink fixed cost base
Continue to increase import levels with certain accessory product lines
11
Key Second Quarter Initiatives and Beyond:
Working capital reductions and free cash flow, positively impacted by lower capex and non-
recurring activity, will drive substantial debt reduction by year end.
SG&A costs will be flexed across all of TriMas consistent with demand in end customer markets.
All discretionary spending on a hold. All capital spending required to be approved by CEO & CFO.
Focus will be on measured actions in managing earnings volatility:
TriMas has real, positive year-over-year momentum in twelve (12) of fourteen (14) businesses.
Lean vs. Disable.
Continue to drive earnings expansion and debt reduction
TriMas Corporation - 2005 Focus and Priorities
12
Q & A

Appendix
Condensed Balance Sheet
(unaudited - in millions)
Mar. 31,
Dec. 31,
2005
2004
Assets
Current Assets
Cash & Cash Equivalents
3.9
$
3.1
$
Receivables
127.4
93.4
Inventories
176.6
180.0
Deferred Income Taxes
17.5
17.5
Prepaid Expenses and Other Current Assets
7.3
8.5
Total Current Assets
332.7
302.5
Property & Equipment, Net
193.3
198.6
Goodwill
655.7
658.0
Other Intangibles, Net
300.9
304.9
Other Assets
57.3
58.2
Total Assets
1,539.9
$
1,522.2
$
Liabilities and Shareholders' Equity
Current Liabilities:
Current Maturities, Long-Term Debt
2.9
$
3.0
$
Accounts Payable
132.9
135.2
Accrued Liabilities
74.6
68.2
Due to Metaldyne
2.7
2.6
Total Current Liabilities
213.1
209.0
Long-Term Debt
751.0
735.0
Deferred Income Taxes
133.4
133.5
Other Long-Term Liabilities
34.1
35.2
Due to Metaldyne
4.3
4.3
Total Liabilities
1,135.9
1,117.0
Total Shareholders' Equity
404.0
405.2
Total Liabilities and Shareholders' Equity
1,539.9
$
1,522.2
$
15
Condensed Statement of Operations
(unaudited - in millions, except per share amounts)
2005
2004
Net sales
292.7
$
260.9
$
Cost of sales
(227.2)
(196.8)
Gross profit
65.5
64.1
Selling, general and administrative expenses
(42.5)
(43.7)
Gain (loss) on dispositions of property & equipment
0.2
(0.3)
Operating profit
23.2
20.1
Other expense, net
(19.3)
(16.6)
Income before income taxes
3.9
3.5
Income tax expense
(1.4)
(1.3)
Net income
2.5
$
2.2
$
Basic earnings per share
0.13
$
0.11
$
Diluted earnings per share
0.13
$
0.11
$
Weighted average common shares - basic
20.0
20.0
Weighted average common shares - diluted
20.0
20.4
16
Cash Flow Highlights
(unaudited - in millions)
2005
2004
Cash provided by (used for) operating activities
(11.4)
$
21.6
$
Capital expenditures
(4.5)
(14.8)
Proceeds from sales of fixed assets
0.9
0.2
Acquisition of businesses, net of cash acquired
-
(5.5)
Cash used for investing activities
(3.6)
(20.1)
Proceeds from senior credit facility, net
15.9
6.3
Payments on notes payable and other
(0.1)
(7.7)
Cash provided by (used for) financing activites
15.8
(1.4)
Net increase in cash and cash equivalents
0.8
$
0.1
$
17
For the Three Months Ended March 31,
Key Covenant Calculations
($ in millions)
Leverage Ratio:
Total Indebtedness at March 31, 2005(1)
813.4
$
LTM EBITDA, as defined(2)
149.2
$
Leverage Ratio - Actual
5.45x
Leverage Ratio - Covenant
5.50x
Coverage Ratio:
LTM EBITDA, as defined(2)
149.2
$
Cash Interest Expense(2)
66.4
$
Coverage Ratio - Actual
2.25x
Coverage Ratio - Covenant
2.0x
Notes:
(1) As defined in our Credit Agreement, as amended and restated June 6, 2003.
(2) LTM EBITDA, as defined and cash interest expense is based on preliminary estimates, subject to adjustment.
18