Presentation to Investors
June 15, 2005

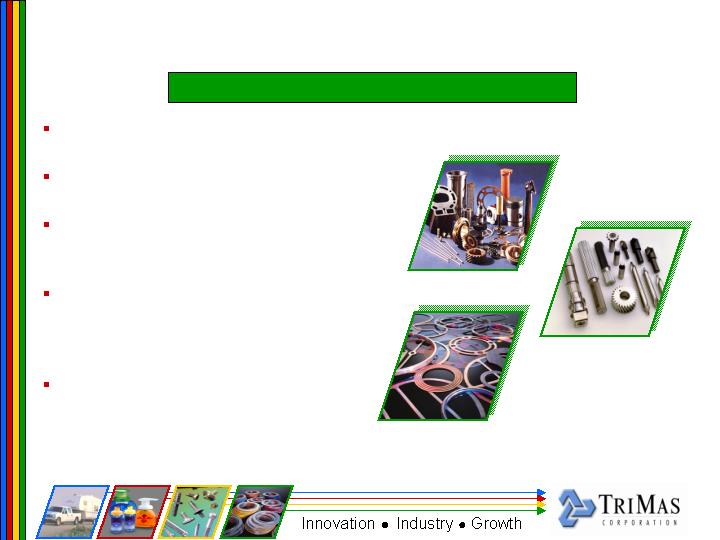
Agenda
Welcome
Compac Overview & Plant Tour
TriMas Overview
Rieke Presentation
Fastening Systems & Industrial Specialties Presentation
Cequent Presentation
Lunch – Q&A
2

Company Overview
Grant Beard
President & Chief Executive Officer

Q1 2005 Financial Highlights
First quarter sales $292.8 million, increase of 12.2% over
Q1 2004
Adjusted EBITDA* within quarter was $32.7 million, an
increase of $2.6 million compared to Q1 2004
Q1 2005 operating income was $23.3 million, an
increase of $3.1 million compared to Q1 2004
Net income within the quarter was $2.5 million or $0.13
per share vs. Q1 2004 net income of $2.2 million or
$0.11 per share
*The Company defines “Adjusted EBITDA” as net income before interest, taxes, depreciation, amortization, non-cash asset and goodwill impairment write-
offs, non-cash losses on sale-leaseback of property and equipment, legacy restricted stock award expense, and write-off of equity offering costs.
4
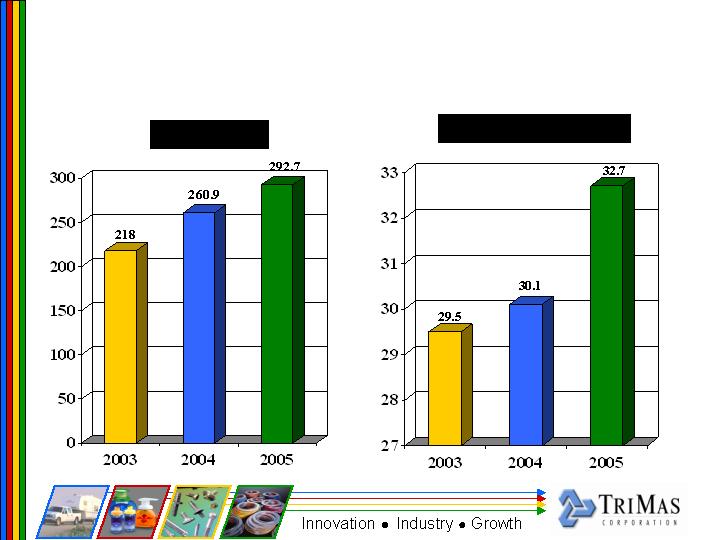
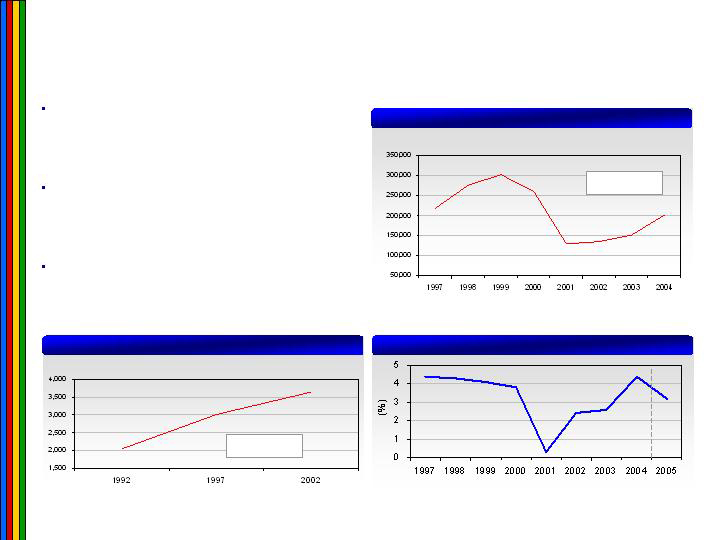
Q1 2005 Financial Highlights
($ in millions)
Q1 Revenue
Q1 Adjusted EBITDA
5

Q1 2005 Financial Highlights
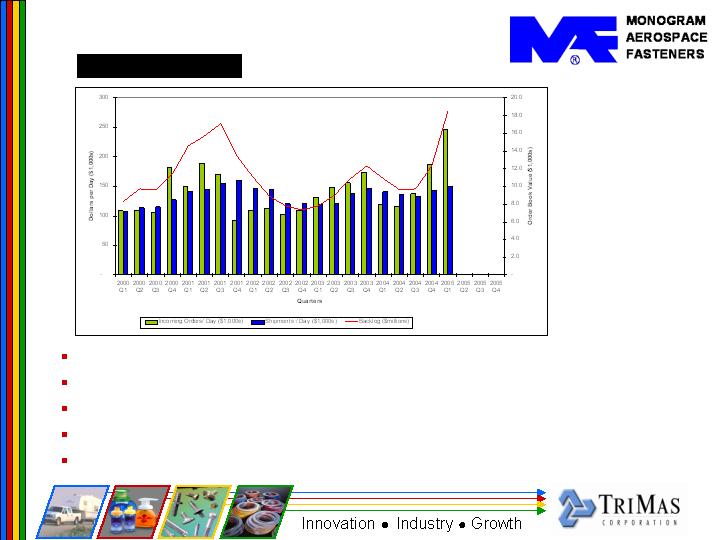
Steel costs continued to challenge operating margins in
the quarter – most direct impact on Cequent and
Fastening Systems
Recovering approximately 85% of steel cost increases from
customers via pricing
TriMas ended quarter with $813.4 million of combined
debt and receivables securitization compared to $786.0
million at 12/31/04 and $792.0 million at 3/31/04
Approximate $27 million increase in leverage due to higher
accounts receivable balances at 3/31/05 as a result of increased
sales in Q1 2005
6
Q1 2005 Operating Highlights
Q1 2005 sales increased $11.1 million to
$140.6 million
Unit volume essentially flat when
adjusted for steel
Softer than expected demand for
towing products in wholesale
distributor and installer markets after
strong E.O.P. in Q4 2004
Competitive pricing pressures across
all channels, especially retail
Adjusted EBITDA in Q1 2005 decreased
$1.4 million to $16.9 million
Q1 2005 operating profit was $12.3
million (8.7% of sales)
Order fill performance is excellent
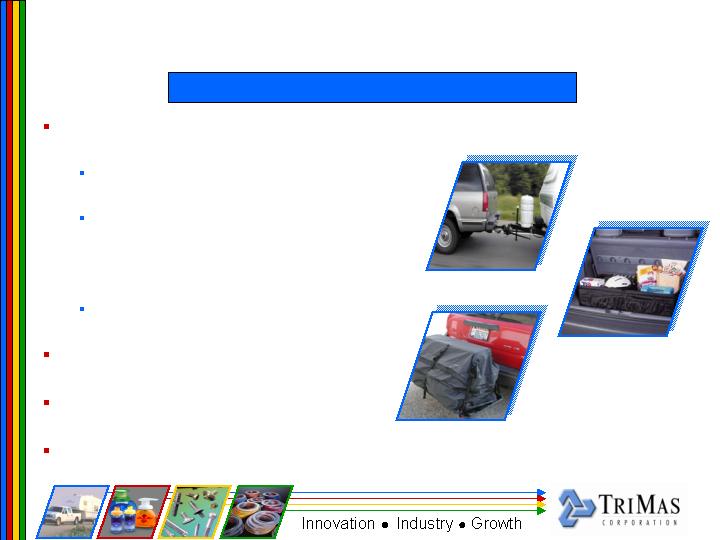
Cequent Transportation Accessories
7
Q1 2005 Operating Highlights
Net sales for the quarter were $34.1
million, up 12.2% compared to Q1
2004
Core product sales volume increased
approximately $4.0% while new
specialty dispensing product revenues
increased $4.3 million in the quarter
Rieke launched 8 new pump
dispensing products within Q1 2005
Operating income for Q1 2005
increased $1.3 million to $7.3 million
(21.3% of sales)
Order intake during Q1 2005
increased almost 20% compared to
the same period a year ago
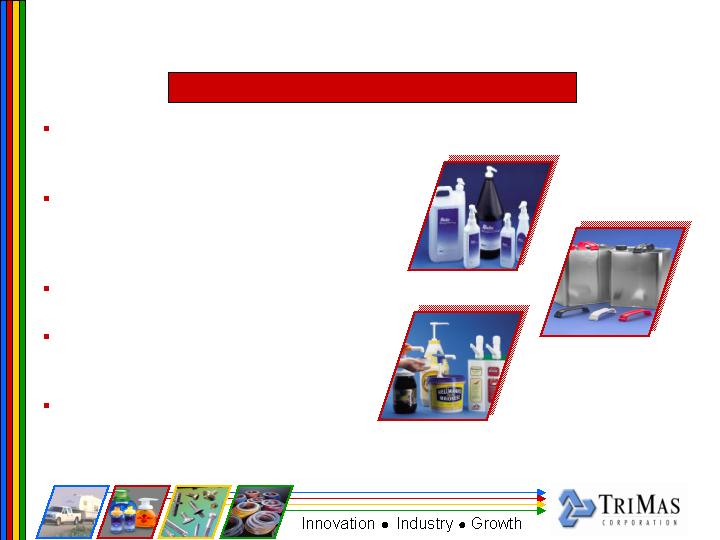
Rieke Packaging Systems
8
Q1 2005 Operating Highlights
Q1 2005 sales increased 14.2% or
$5.5 million to $44.2 million
Sales of industrial fastener products
remained strong in the quarter
Sales of aerospace fasteners in the
quarter increased 8.9% compared to
prior year
Operating income for Q1 2005 was
$0.8 million, a $2.4 million
improvement from Q1 2004
Adjusted EBITDA in Q1 2005 was
$2.3 million compared to $0.1 million
in Q1 2004
Manufacturing activity levels
reached targeted production levels
at Frankfort and Wood Dale
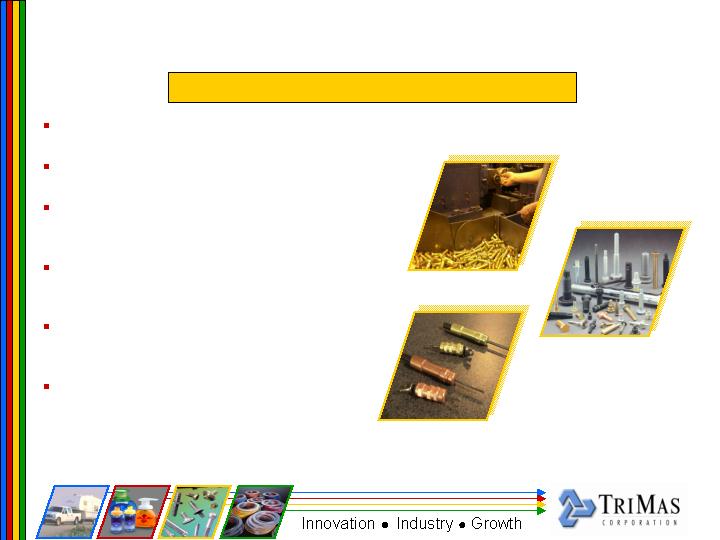
Fastening Systems Group
9
Q1 2005 Operating Highlights
Net sales for Q1 2005 were $73.8
million, increase of 18.4%
Operating income for the quarter
increased 10.7% to $8.5 million
Adjusted EBITDA for the quarter
was $10.4 million compared to
$9.5 million in Q1 2004
Incremental costs associated with
facility consolidation and
restructuring activities decreased
$0.6 million
Industrial Specialties companies
expect continued momentum
across 2005
Industrial Specialties Group
10
Q1 2005 New Sales
Product
Customer
Run Rate
Gaskets
National Oilwell
2.6
$
Gaskets
Total Petroleum
0.2
Gaskets
Imperial Oil
0.2
Gaskets
Tat Lee
0.3
Engine Parts
Weatherford
TBD
SSL Tape
John Manville
1.00
Cartridge Cases
Dept. of Defense & Other
1.60
Total ISG
5.9
$
Industrial Specialties Group
11
($ millions)
Product
Customer
Run Rate
Tie Downs
Canadian Tire
3.0
$
Towing Accessories
Home Depot
1.0
Cargo Management
Costco
TBD
Tie Downs & Electrical
Sears
TBD
Trailer Hitches
Honda
TBD
Misc. Products
Toyota
TBD
Misc. Products
Land Rover
TBD
Total Cequent
4.0
$
Cequent Transportation Accessories
Product
Customer
Run Rate
Aerospace Fasteners
Airbus & Satair
2.7
$
Aerospace Fasteners
Northrop
TBD
Bolts
Caterpillar
0.4
Fasteners
Hendrickson
0.8
Fasteners
Other
TBD
Total FSG
3.9
$
Fastening Systems Group
Product
Customer
Run Rate
Dispenser
Ecolab
1.2
$
Dispenser
Starbucks
0.2
Dispenser
Hershey's
0.1
Dispenser
Colgate
TBD
Dispenser
Others
0.4
Total Rieke
2.7
$
Rieke Packaging Systems

2005 Focus & Priorities
Working capital reductions and free cash flow, positively
impacted by lower capex and non-recurring activity, will
drive substantial debt reduction by year end
SG&A costs will be flexed across all of TriMas consistent
with demand in end customer markets – especially within
the Cequent SBU’s
Discretionary spending on hold – capex approvals by
CEO & CFO
Measured actions in managing earnings volatility:
TriMas has positive year-over-year momentum in 12 of 14
businesses
Lean vs. Disable
12

Financial Overview
Skip Autry
Chief Financial Officer
(unaudited - in millions)
Mar. 31,
Dec. 31,
2005
2004
Assets
Current Assets
Cash & Cash Equivalents
3.9
$
3.1
$
Receivables
127.4
93.4
Inventories
176.6
180.0
Deferred Income Taxes
17.5
17.5
Prepaid Expenses and Other Current Assets
7.3
8.5
Total Current Assets
332.7
302.5
Property & Equipment, Net
193.3
198.6
Goodwill
655.7
658.0
Other Intangibles, Net
300.9
304.9
Other Assets
57.3
58.2
Total Assets
1,539.9
$
1,522.2
$
Liabilities and Shareholders' Equity
Current Liabilities:
Current Maturities, Long-Term Debt
2.9
$
3.0
$
Accounts Payable
132.9
135.2
Accrued Liabilities
74.6
68.2
Due to Metaldyne
2.7
2.6
Total Current Liabilities
213.1
209.0
Long-Term Debt
751.0
735.0
Deferred Income Taxes
133.4
133.5
Other Long-Term Liabilities
34.1
35.2
Due to Metaldyne
4.3
4.3
Total Liabilities
1,135.9
1,117.0
Total Shareholders' Equity
404.0
405.2
Total Liabilities and Shareholders' Equity
1,539.9
$
1,522.2
$
14
Condensed Balance Sheet
(unaudited - in millions, except per share amounts)
Q1 2005
Q1 2004
Net sales
292.7
$
260.9
$
Cost of sales
(227.2)
(196.8)
Gross profit
65.5
64.1
Selling, general and administrative expenses
(42.5)
(43.7)
Gain (loss) on dispositions of property & equipment
0.2
(0.3)
Operating profit
23.2
20.1
Other expense, net
(19.3)
(16.6)
Income before income taxes
3.9
3.5
Income tax expense
(1.4)
(1.3)
Net income
2.5
$
2.2
$
Basic earnings per share
0.13
$
0.11
$
Diluted earnings per share
0.13
$
0.11
$
Weighted average common shares - basic
20.0
20.0
Weighted average common shares - diluted
20.0
20.4
15
Condensed Statement of Operations
Cash Flow Highlights
(unaudited - in millions)
2005
2004
Cash provided by (used for) operating activities
(11.4)
$
21.6
$
Capital expenditures
(4.5)
(14.8)
Proceeds from sales of fixed assets
0.9
0.2
Acquisition of businesses, net of cash acquired
-
(5.5)
Cash used for investing activities
(3.6)
(20.1)
Proceeds from senior credit facility, net
15.9
6.3
Payments on notes payable and other
(0.1)
(7.7)
Cash provided by (used for) financing activites
15.8
(1.4)
Net increase in cash and cash equivalents
0.8
$
0.1
$
16
For the Three Months Ended March 31,

Cost Reduction/Profit Improvement
Initiatives
Represents a continuation of our
game plan
Mentioned a $10 million run rate
target in Cequent in the earnings
call
Goal has now expanded to
approximately $13 million
Are now ready to expand the
program across TriMas:
Improve earnings and cash flow
performance
Make the company more IPO
ready
Inventory reduction plan in place –
focus on Cequent & FSG
Stated goal is to improve profits
on a $25 million run rate basis
Actions are being formally rolled
out in Q2 with implementation
underway and continuing
throughout Q3
No cost area will be exempted
Roughly ½ people and ½ other
costs
Will focus on G&A/Selling/Indirect
Headcount
Investigating an SBU liquidation to
drive balance sheet strength
Utilization of NOL
17

Q2 Bank Compliance
Leverage covenant is 5.5x in Q2, 5.25x in Q3 and 5.0x in
Q4
Have been close in each of the last two quarters – no
way to live!
Steel increases in 2005 cost the Company $75 to $100
million in liquidity (e.g. higher inventory and receivable
levels, lower payables levels and lower EBITDA)
Actively managing working capital
Expect to meet our Q2 leverage covenant
18

Guidance
Have not given guidance historically
Aftermarket business is not precisely predictable
(receive orders on day “1” and ship on day “2”) – no
backlog
ISG businesses are all on positive trends
Rieke continues to see market expansion
FSG has stabilized but now needs higher sales levels as
we work through the backlog at Lake Erie. Monogram
continues to redefine itself with new products and a
record backlog.
19

Rieke Packaging Systems
Lynn Brooks
Group President
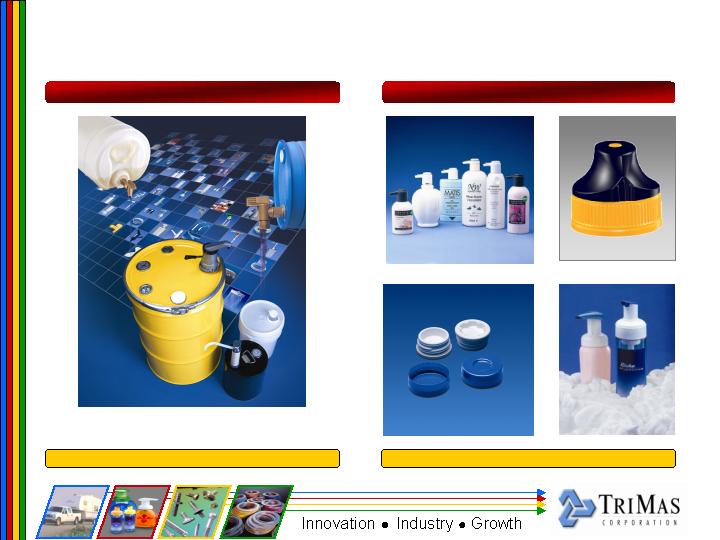
Rieke Packaging Systems
Consumer Products
Core Products
"Razor-blade" model with strong operating leverage
Promising growth prospects
21
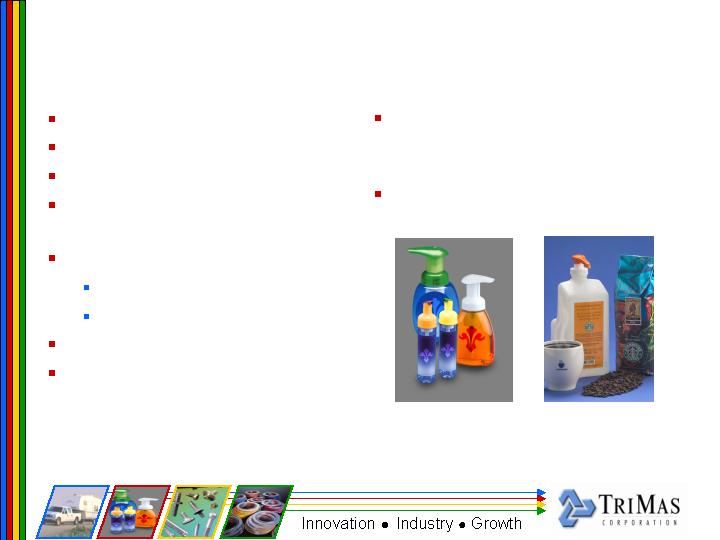
Rieke Packaging Systems
50% of products IP-protected
Diverse end markets
Leading market shares
Benefiting from industrial
recovery
Strong growth drivers:
New product launches
Bundling and cross selling
International business
New plastic injection molding
facility in China to supply
specialty dispensing products
Pass-through on material
economics – metal and plastic
resins
Accelerating growth rate
22
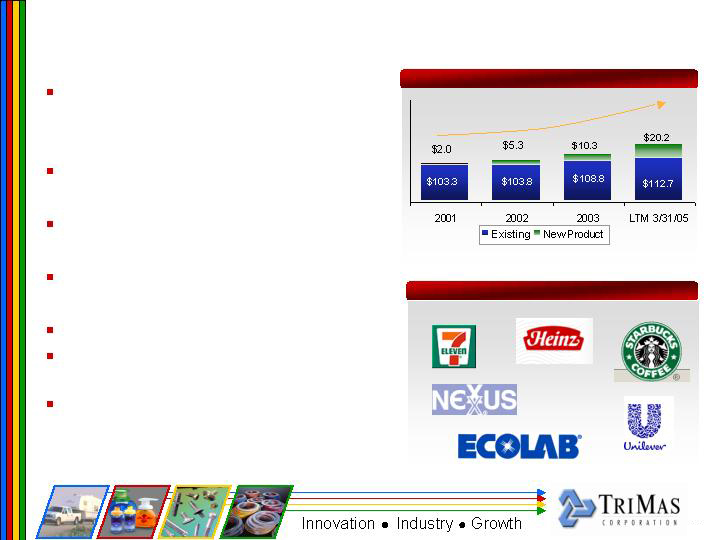
Rieke New Products
Target market size is estimated at
$300 million and is growing at 9%
annually
36 new products introduced from
late 2002 through Q1 2005
Average concept to launch: 15
months
Margins are similar to core
products
Capacity in place
New markets in food, beverage,
personal care and pharmaceutical
Highly engineered products
23
Revenue Opportunity & Awarded Business ($mm)
Major Business Awards
Rieke Customer Forecast – Remainder of 2005
Petroleum – 5-10% growth in
2005
Chemical – Overall, double
digit growth
Ag Chem – Overall, double
digit growth
Paints – Overall, flat to 5%
Steel Drums – Flat to down
Medical – Flat
Ag Chem – Flat
Steel Drums – Flat to down
Plastic Drum – 5% increase
Petroleum – Flat to 2% growth
Paints – Flat to down
North America
Europe
24
Fastening Systems & Industrial
Specialties
Grant Beard
Interim Group President
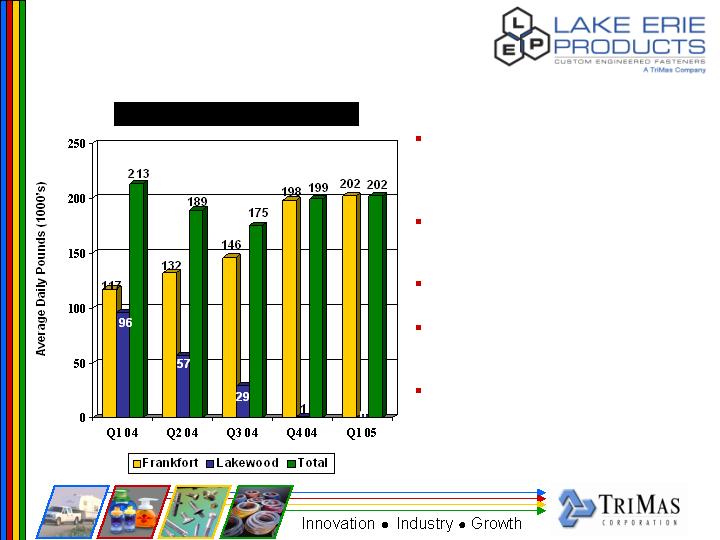
Production very good at
Frankfort and Wood Dale in Q1
– Combined daily average of
281,000 lbs.
Reduced past due orders from
over $7 million in January to
under $2 million at end of March
Reduced spending in all major
categories
Inventory grew through first
quarter, will be adjusted during
Q2
Notification of steel price
reduction in Q1, no customer
effect until Q3
Frankfort Bolt-Making Comparison
26
Sales up from budgeted levels despite challenging production
environment at GM and Ford
Significant market share gains at Mark IV Automotive
Contribution margins exceeded budget due to favorable customer
recoveries relative to premium steel costs
Inventory levels increased in Q1 due to steel move to Republic and
strategic build of finished goods for new business growth
2004
Actual
2005
Impact
2006
Impact
2007
Impact
2008
Impact
Status
Legacy
15.52
15.52
15.52
15.52
15.52
Bud Inc.
0.82
0.82
0.82
0.82
Partially awarded
Steel Recoveries
0.73
1.15
1.15
1.15
1.15
B&E Closure
0.33
0.5
0.5
0.5
Awarded
AGS Standards
0.22
0.8
0.8
0.8
Awarded
TI, ITT, Other
0.15
0.35
0.45
0.55
Partially awarded
Curtis Maruyasu
0.4
0.5
0.65
Partially awarded
AMI
0.05
0.25
0.35
0.4
Highly likely
AZ Spacers, Net
0.6
2.25
3.1
Highly likely
MartinRea GMT900
0.15
0.45
0.53
Highly likely
Total Revenue
16.25
18.24
20.54
22.8
24.02
27
($ in millions)
New Business Update
Record incoming orders of $15.8 million
March 2005 record production month of 42.4k pieces per day
Production for Q1 up 32% over 2004 average
Improved productivity of 6.5% for the quarter over 2004
Incoming business and total backlog reached record levels in Q1
Bookings and Backlog
28

Drilling activity at 4/8/05 shows 1,329 active rigs, represents 10%
improvement over prior 12 months
Good indication of future production
Engine sales expected to remain strong especially on Climax engine
line
Projecting engine sales in 2005 to be approximately 70% ahead of
2004
Continue to push product
development in Waukesha
market for VHP and
Intermediate parts
29
During Q1 experienced weak sales in
January combined with depressed material
margins, resulting in shortfalls in both
revenue and EBITDA
Sales in Q2 expected to improve due to
further selling price increases and
business growth from export and new
business opportunities
Purchasing initiatives implemented saving
$400K per year
Netcong, NJ facility sold March 31, 2005.
Will reduce majority of non-recurring
expenses beginning in May.
Fiberglass manufacturers enjoy sold-out
situation – production at an all time high
level
Finishing Department
Laminator
30

Q1 2005 largest revenue
quarter in Lamons’ history
Major turnarounds with: Exxon,
Premcor, BP, Citgo, Dow and
Bayer
Canadian operations expanding
into refining industry – new
contracts with Imperial Oil and
North Atlantic Refining
Latin America/Europe sales on plan in Q1 2005 - $647K vs. $418K in Q1
2004
Plan to grow business in UK through Novus Sealing and Mexico through
Auge
Signed Tat Lee (former Flexitallic licensee) as our distributor for spiral
wound and RTJ gaskets in Far East Asia
31
Revenue strong for Q1 2005 with
order strength continuing into Q2
Steel more available but prices
continued to rise in Q1. Indication
of prices being flat or giving back
for Q2 deliveries
March was record
production/shipping month over last
five years with over 30,000 units
produced
Secured first order for EU acetylene
products and DOT/ISO LHP
cylinders in Europe
32
FMS shipped record number of launchers in
Q1 2005 -7,310
LAW next generation – Nammo version in
prototype stages, Talley version in design
stage and should be available for review in
Q3
LAW relocation to Pennsylvania – complete
2005 assembly requirements in August at
Amarillo, move equipment and residual
inventory to Johnstown in Q3, first
production order scheduled in December
Flexible projectile line on track, requesting
$7 million for 2006
33
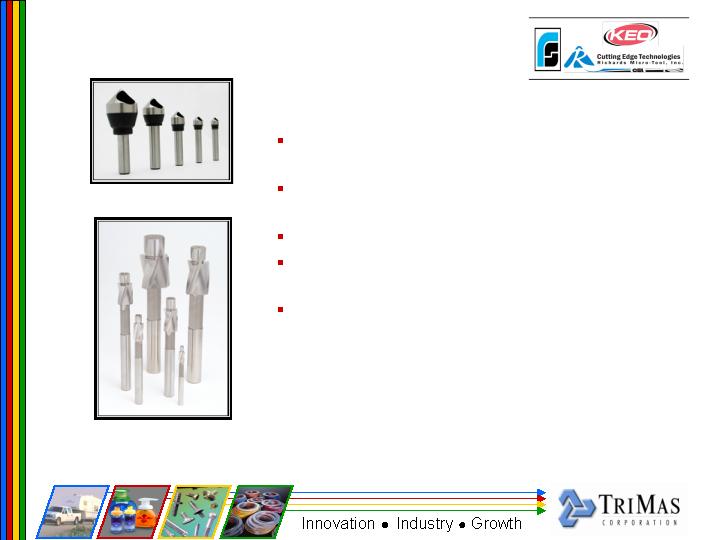
Orders continued strong for both Keo and
Richards Micro-Tool in Q1 2005
Sales into medical market exceeded budget
(>$250K)
Cost of steel continues to increase
Implemented second price increase in last six
months
New product sales for Keo brand (ZErO Flute
Countersinks, Kounterbores) were 12%
above budget
ZErO Flute Countersinks
KEO Kounterbores
34

Cequent Transportation Accessories
Ed Schwartz
Group President
Plymouth, Michigan
Plymouth, Michigan
Cequent
Towing Products
Cequent
Towing Products
Cequent
Trailer Products
Cequent
Trailer Products
Cequent
Australia
Cequent
Australia
Cequent
Consumer Products
Cequent
Consumer Products
Cequent
Electrical Products
Cequent
Electrical Products
Plymouth, Michigan
Plymouth, Michigan
Mosinee, Wisconsin
Mosinee, Wisconsin
Melbourne, Australia
Melbourne, Australia
Solon, Ohio
Solon, Ohio
Tekonsha, Michigan
Tekonsha, Michigan
Plymouth, Michigan
Plymouth, Michigan
Cequent
Towing Products
Cequent
Towing Products
Cequent
Trailer Products
Cequent
Trailer Products
Cequent
Australia
Cequent
Electrical Products
Cequent
Consumer Products
Cequent
Consumer Products
Cequent
Electrical Products
Cequent
Australia
Plymouth, Michigan
Plymouth, Michigan
Mosinee, Wisconsin
Mosinee, Wisconsin
Melbourne, Australia
Tekonsha, Michigan
Solon, Ohio
Solon, Ohio
Tekonsha, Michigan
Melbourne, Australia
Manufacturing – Goshen, IN;
Huntsville, ON; Elkhart, IN
Products – Towing Products,
Functional Vehicle Accessories
and Cargo Management
Solutions
Distribution – Installers,
Distributors, Automotive OEM,
and retail segments
Manufacturing –Sheffield, PA
Products – Towing Products,
Functional Vehicle Accessories
and Cargo Management
Solutions
Distribution –Mass
Merchants, Auto Specialty,
Program/Buying Groups
Manufacturing – Wakerley,
Brisbane, Sydney, Australia
Products – Towing, Trailering,
vehicle accessory, and cargo
management solutions
Distribution –Automotive OE
andAftermarket
Products – Brake Controls,
Breakaway Systems, Brake
Accessories, Electrical
Converters
Distribution –Automotive
OEM, Trailer OEM, Marine,
RV, Agricultural/Utility, and
Retail segments
Manufacturing – Tekonsha,
MI; Albion, IN; Reynosa, MX
Manufacturing – Mosinee, WI;
Juarez, MX
Products – Trailer Products
and Accessories
Distribution –Trailer OEM,
Wholesale-distributor, and
retail segments
LTM Ended Mar. 31
2005
2004
Net Sales .
$522.5
$458.0
Segment Adjusted EBITDA
69
64
% margin
13.2%
13.9%
37
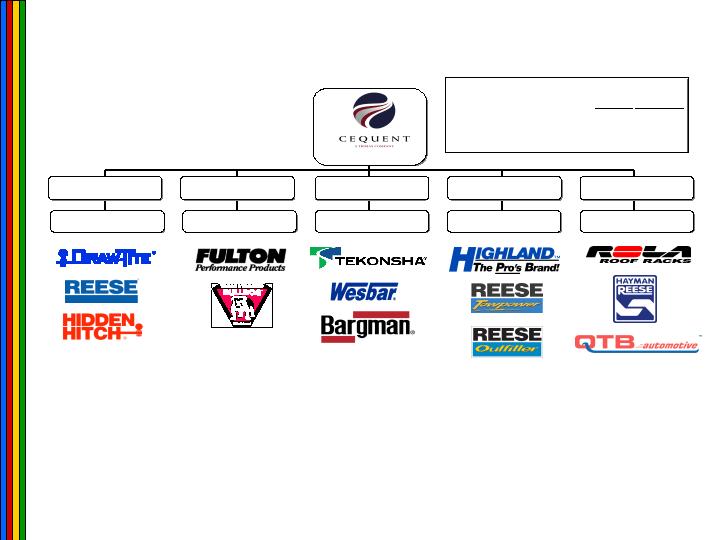
Cequent Operating Units

Cequent Major Facilities
Goshen, IN
South Bend, IN
Mosinee, WI
Juarez, Mexico
Tekonsha, MI
Plymouth, MI
38
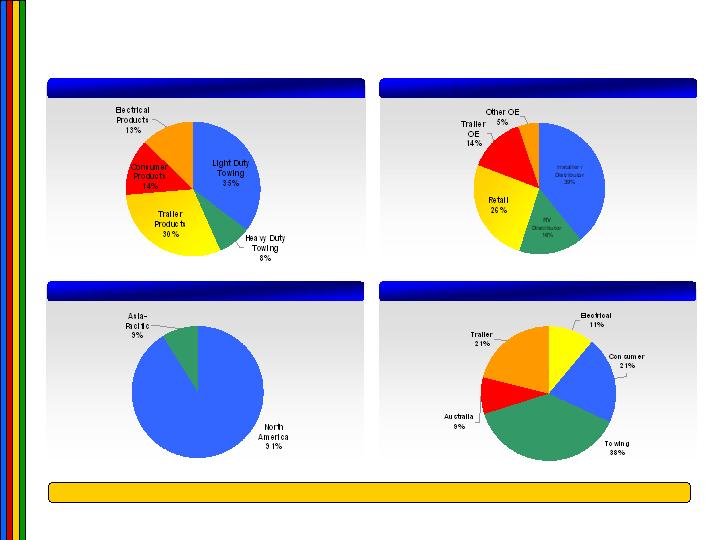
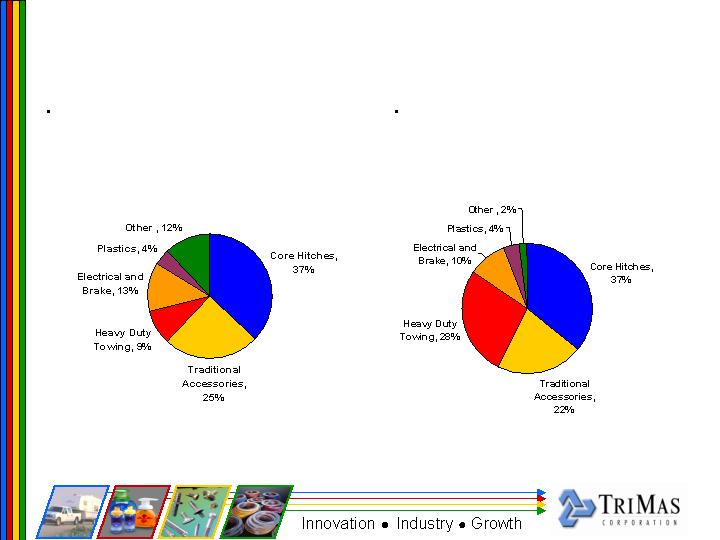
Cequent’s Sales Mix
Cequent Sales by Region
2005 (March 31, LTM) Total Cequent Net Sales . $522.5 Million
Cequent Sales by Business Unit
Cequent Sales by Product Group
Cequent Sales by Distribution Channel
39
Channel Strategic Plan - INSTALLER/WD
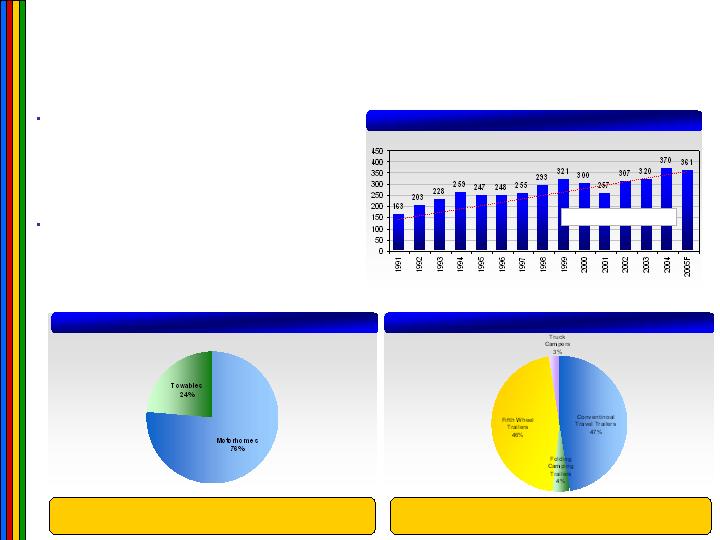
Market Overview - Recreational Vehicle Segment
U.S. RV Segment by Product Group
SOURCE: RVIA
2004 U.S. RV Market ...... $14.0 billion
(Retail Value)
Total U.S. Towable RV Trailer Market
SOURCE: RVIA
2004 U.S. Towable Trailer Market ... $5.8 billion
(Retail Value)
SOURCE: Recreation Vehicle Industry Association, Crove Capital Markets Research
NOTE: Does not include conversion vehicle shipments; dotted line represents a normalized
shipment trend, which was calculated using regression analysis.
RV Shipment Historical Volume Growth
1991-2005 CAGR . 5.8%
While the U.S. economy was on a roller coaster throughout
much of 2003, the RV industry performed solidly. Shipments to
retailers of all RVs rose 3.2% to 320,800 units in 2003—the
second best year in a quarter century. Towable RVs grew 3.3%
to 258,900 units, the best total for these products in 27 years.
Motor home shipments also increased, rising 2.5% over
the prior year on shipments to retailers of 61,900 units.
Perhaps the best news of all for the RV industry was the
increase in dollar values of shipments. Total retail value of all
RV shipments in 2003 rose an impressive 9.8% to set an all-
time re c o rd high of $12 billion dollars. The continued strength
in RV shipments as demonstrated by these growth trends
reflects the strong appeal of the RV lifestyle to a broadening
consumer base.
Total Shipments
(in thousands)
40
Channel Strategic Plan - COMMERCIAL
Market Overview – RV Segment Demand Drivers
SOURCE: Econstats.com
SOURCE: Energy Information Administration, conventional regular gasoline prices, U.S. Gulf Coast delivered.
The U.S prime lending rate is the
lowest it has been in the past six
years providing low financing rates
for major capital purchases such as
recreational vehicles.
The U.S. population by age group
statistics indicate that the high
income age groups from 40 years
old to 60 years olds, baby boomers,
have increased by over 7.6 million
since 1998.
Growth in the high income age
group is a positive factor in
supporting recreational vehicle and
aftermarket accessory product
consumer demand.
Regular unleaded gasoline prices
have remained high through most
of 2004, somewhat, offsetting the
positive effects of low interest rates.
Gasoline prices are not perceived
to be a major deterrent in buying a
new recreational vehicle due to the
expectation for gasoline prices to
once again stabilize to a lower price
due to the cyclicality of oil prices.
SOURCE: U.S. Census Bureau.
Driving Age Population Growth is Driving Fleet Growth and Increased Consumer spending
Regular Unleaded Gasoline Prices Have Been on the Rise
U.S. Prime Lending Rate
(U.S. population)
U.S. Prime Lending Rate Feb 2004 . 6.0%
U.S. Wholesale Price of Unleaded Regular Gas Jan-05 . $1.41
41
Channel Strategic Plan - COMMERCIAL
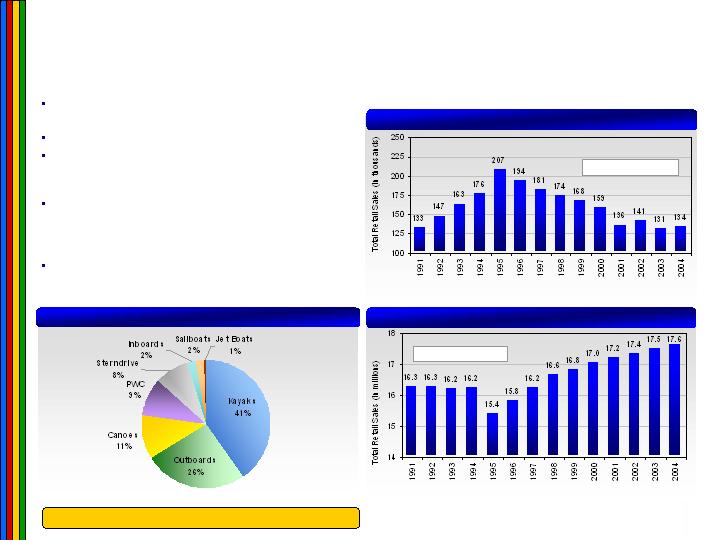
Market Overview - Marine Segment
U.S. Marine Segment by Type of Product
2004 Total Unit Sales ....... 838,500
Total Recreational Boats Owned in the U.S.
SOURCE: NMMA
Boat Trailer Unit Sales
SOURCE: NMMA
SOURCE: NMMA
Boat trailer sales peaked in 1995 and have declined
steadily until 2001, growing slightly in 2002.
2002 showed signs of a cyclical rebound in trailer sales.
The total estimated number of boats owned has
increased over the past eleven years at slow rate of 0.6%
annually.
The type of watercraft owned in the U.S is broad,
including kayaks, outboard power boats, canoes,
personal watercrafts, stern drive boats, inboard boats,
sailboats and jet boats.
All of the marine product segments require a towing,
trailer or accessory product to transport, providing
additional demand for towing and trailer products.
1991-2004 CAGR ........ 0.6%
1991-2004 CAGR ........ 0.1%
42
Channel Strategic Plan - COMMERCIAL
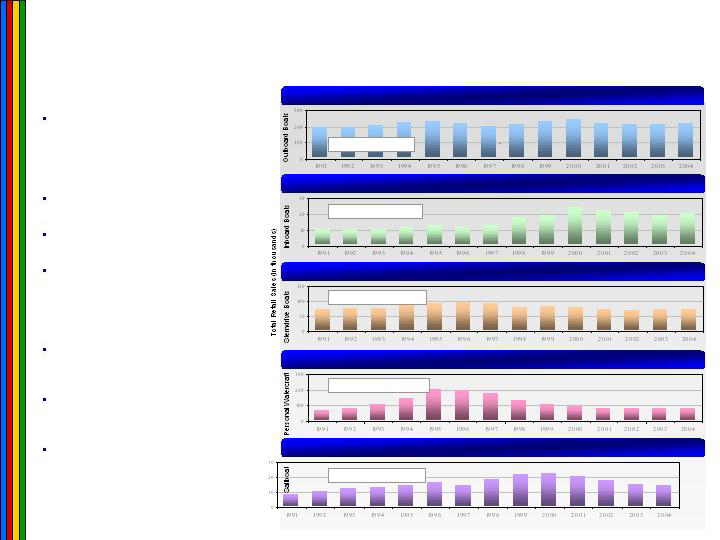
Market Overview - Marine Segment Volume Drivers
SOURCE: NMMA, 1991-2002 Annual Sailing Business Review.
Outboard Boats Sales
Inboard Boat Sales
Stern Drive Boat Sales
1991-2004 CAGR ........ 0.8%
1991-2004 CAGR ........ 5.7%
1991-2004 CAGR ........ –0.2%
The marine segment consists of a
mixture of different boat types such as
outboard engine boats, inboard
engine boats, stern drive boats,
personal watercraft and sail boats.
Most all of these boats require the use
of towing and trailer products.
The demand trend is mixed due to
varying trends with boats sales.
In general, inboard boat sales and
sailboat sales have been the strongest
among all boats types with a 7.1%
annual growth rate and a 6.8% annual
growth rate, respectively.
Outboard boat sales and stern drive
boats sales have basically been flat
over the past twelve years.
Personal watercraft sales peaked in
1995 and have dropped more than
50% below the peak volume by 2002.
The marine segment trend generally
moves with the economy due to luxury
product status of the product.
Personal Watercraft Sales
1991-2004 CAGR ........ 1.2%
Sailboat Sales
1991-2004 CAGR ........ 3.9%
43
Channel Strategic Plan - COMMERCIAL
Market Overview - Cequent’s Other Market Segments
U.S. Equestrian(1) Population
SOURCE: Census of Agriculture 1992 and 2002
(1) Horses and ponies and farms reporting horses and ponies.
(horses in
thousands)
CAGR
1992-2002... 12.2%
U.S. Industrial Trailer Production
SOURCE: Trailer Body Builders
(Industrial
trailers in units)
CAGR
1997-2002... - 1.7%
Equestrian trailer industry has very few published
statistics to track demand, however, the U.S. farm
population of horses has increased at an annual rate of
1.7% over the past ten years providing an indicator of
corresponding growth in the equestrian trailer market.
The U.S. trailer production cycle over the past six years
has followed GDP growth, which bodes well for trailer
production and suppliers and should lead to strong
growth from a depressed production low in 2001 and
2002.
The light industrial and utility trailer segments generally
follow the same trends as light vehicle aftermarket
macro demand as most of these consumers are using
these trailers for personal use hobbies.
U.S. Gross Domestic Product YOY % Change
SOURCE: U.S. Census Bureau
44
Channel Strategic Plan - COMMERCIAL
Market Overview - Agricultural Equipment Segment
North American Agricultural Equipment Demand
SOURCE: Freedonia
SOURCE: U.S. Census Bureau
U.S. Farm Machinery and Equipment Shipments
($ millions)
The three largest agricultural equipment buying regions of the World are Western Europe, Asia-Pacific and North
America accounting for 88% of total World demand.
Fredonia predicts demand in North America for agricultural equipment will grow at an average annual rate of 3.5% over
the next five years.
Historically, agricultural equipment demand in North America has grown more slowly at 1.0%, however, this
measurement in growth does not account for peak demand in the mid-1990’s.
A recent positive indicator, U.S. farm machinery and equipment shipments are on the rise, 10% higher in January over a
seasonally adjusted low in April 2003.
CAGR
1989-2004... 1.9%
2004-2009... 3.3%
Forecast
($ millions)
45
Cequent Market Share - Towing
Cequent
Towing
Products
63%
Cequent
Towing
Products
49%
Source: Internal company estimates
46
Cequent Market Share - Trailer
Cequent
Trailer
Products
61%
Cequent
Trailer
Products
49%
Jacks
Couplers
Source: Internal company estimates
47
Cequent Market Share - Electrical
Cequent
Electrical
Products
63%
Cequent
Towing
Products
49%
Source: Internal company estimates
48
Cequent Market Share - Consumer
Cequent
Consumer
Products
37%
Cequent
Consumer
Products
31%
Loading Ramps
Tie Downs & Stretch Cords
Source: Internal company estimates
49
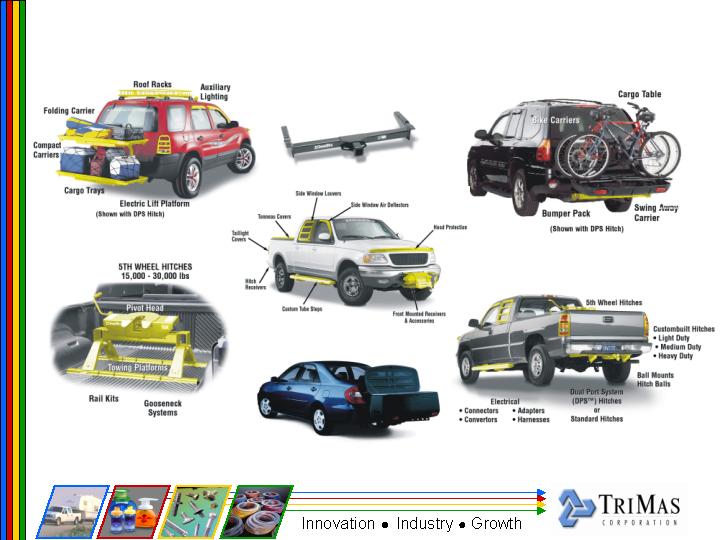
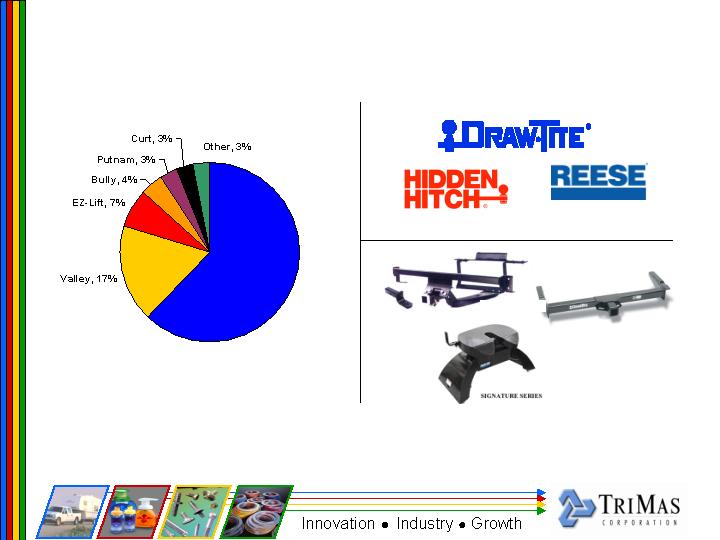
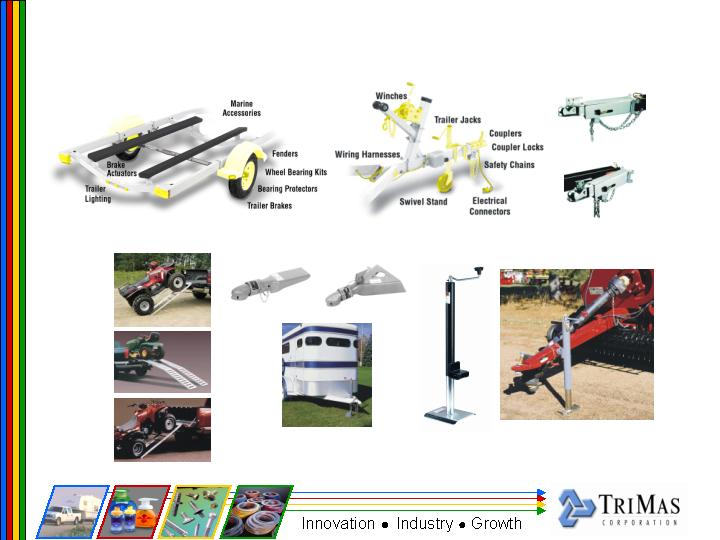
Cequent Towing: Extensive Product Portfolio
Standard Hitch
Storage Box
50
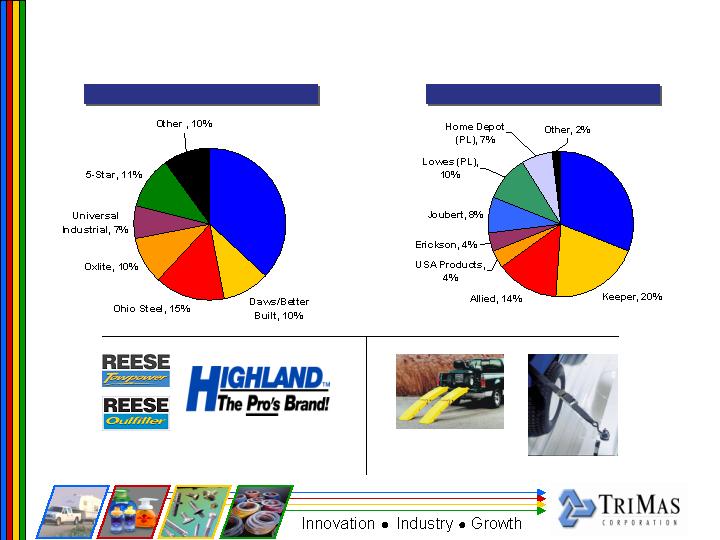
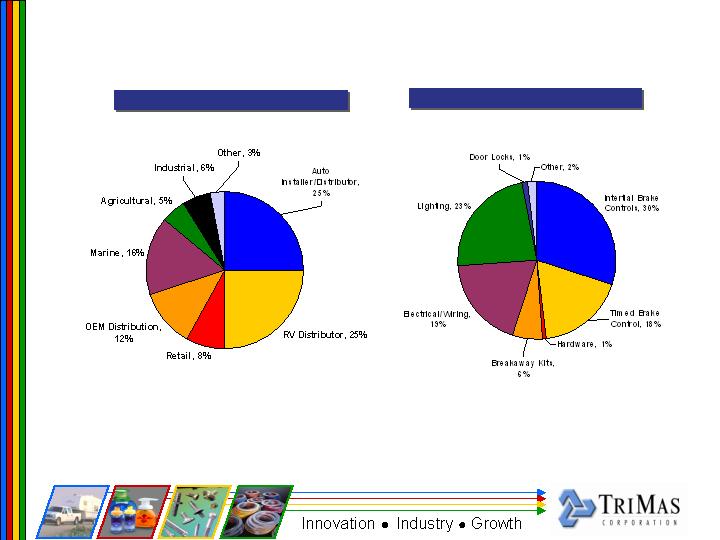
Cequent Towing: Channels of Distribution
RV Distributors
The Reese brand is more important in this channel. The
product mix is oriented towards heavy duty hitches (i.e., fifth
wheel), core-line hitches, and traditional accessories. Product
line sales generated through this channel are estimated as
follows:
Auto Aftermarket Installer/Distribution Channel
The Draw-Tite and Hidden Hitch brands operate through a
network of 60 two-step distributors and over 450 independent
installer shops (“Hitch Pros”) which carry the Draw-tite and
Hidden Hitch brands as an exclusive, or at least preferred,
brand. A sales breakdown to the auto aftermarket channel by
product type include:
51
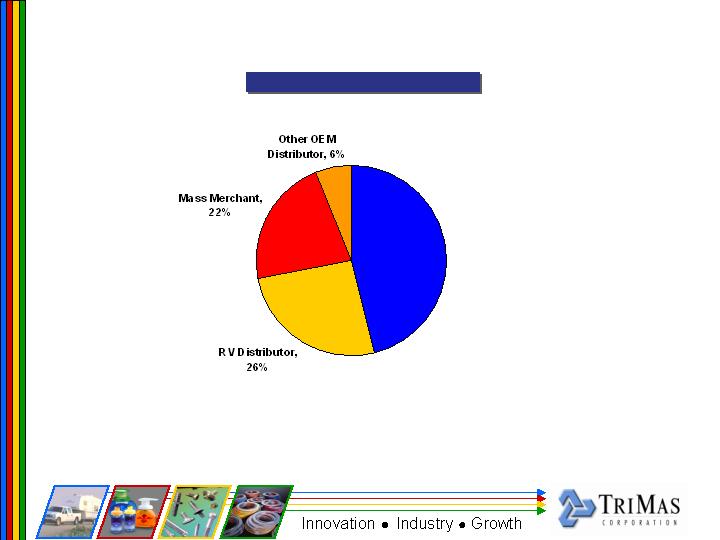
Cequent Towing: Sales by Channel
Estimated Sales by Channel
Auto Installer/
Distributor,
46%
52
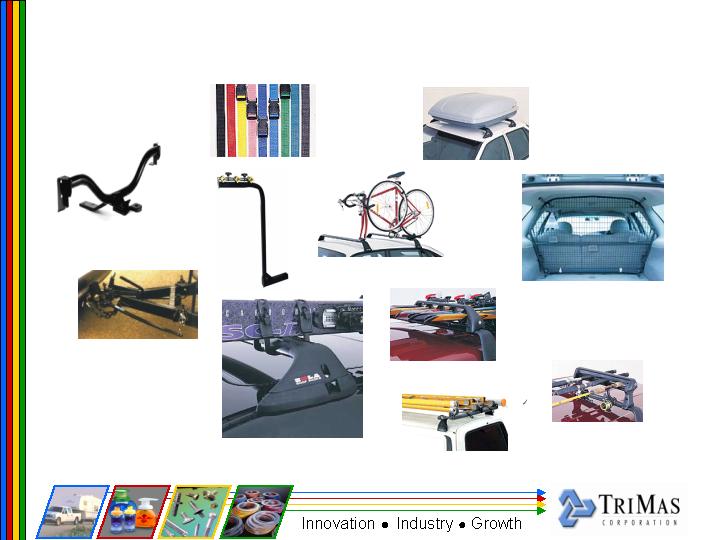
Cequent Trailer: Extensive Product Portfolio
Ramps
Bull Dog Couplers
Bull Dog Jacks
Swing Away
Tongue
53
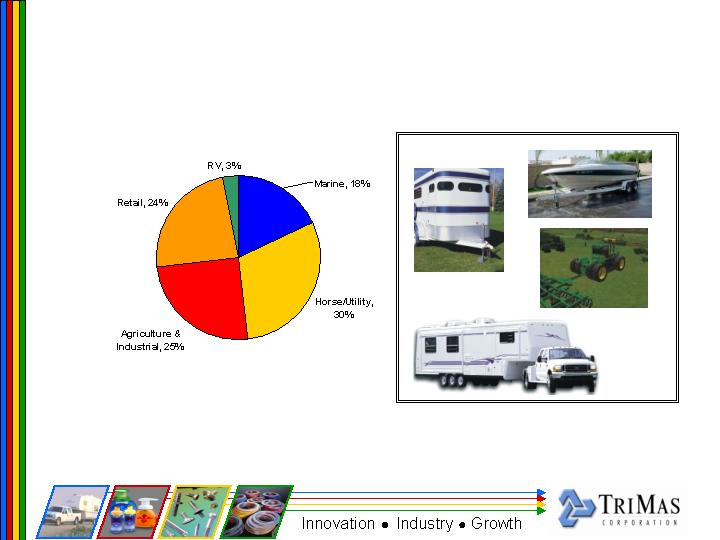
Cequent Trailer: Sales Breakdown
54
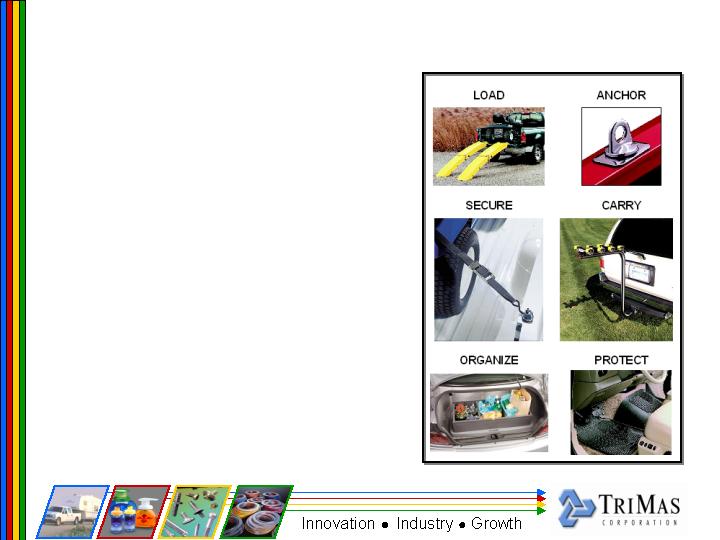
Cequent Consumer: Product Portfolio
Load: Champ ramps and Ramparts ramp kits provide sturdy,
safe loading of motorcycles, ATVs, lawn tractors and
other equipment.
Anchor: A full line of anchor systems and hardware to anchor
heavy loads, attach tie downs, truck caps, toolboxes,
camper shells, over-the-rail bedliners, tonneau covers, CB
antenna mounts, cab extenders and more.
Secure: A complete line of tie downs, tarp straps, stretch cords
and bungee cords to meet all securing needs. Products are
available in a wide number of styles to match specific use.
Carry: Highland products which expand carrying capacity
include rooftop, rear and hitch mount carriers for
luggage, bikes and construction.
Organize: A wide range of products to organize vehicle and garage,
including the new award winning Space Master cargo
organizer, truck and storage nets, cargo bars, and a
complete line of garage organization products.
Protect: Keeps vehicles looking SHOWROOM NEW with Cargo
Liners, Floor Guards, All Weather Floor Mats, Hump
Liners, and Splash Guards. Custom fit vehicle protection
for trucks, cars, vans, and SUV’s.
55
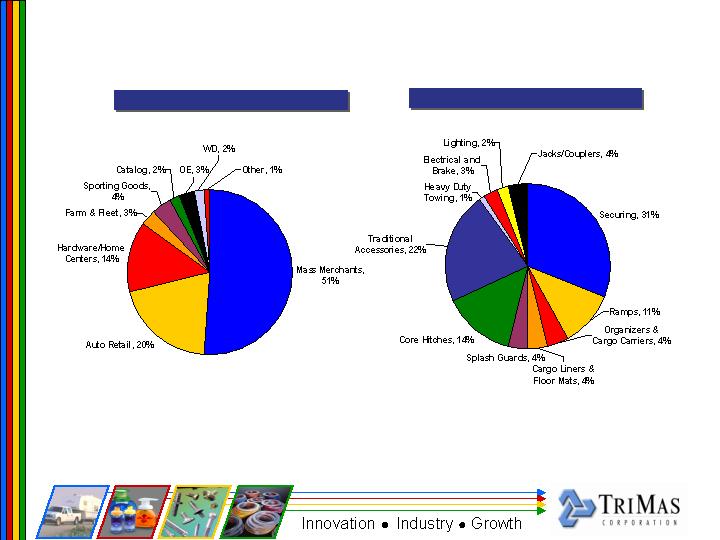
Cequent Consumer: Channels of Distribution
Estimated Sales by Channel
Estimated Sales by Product
56
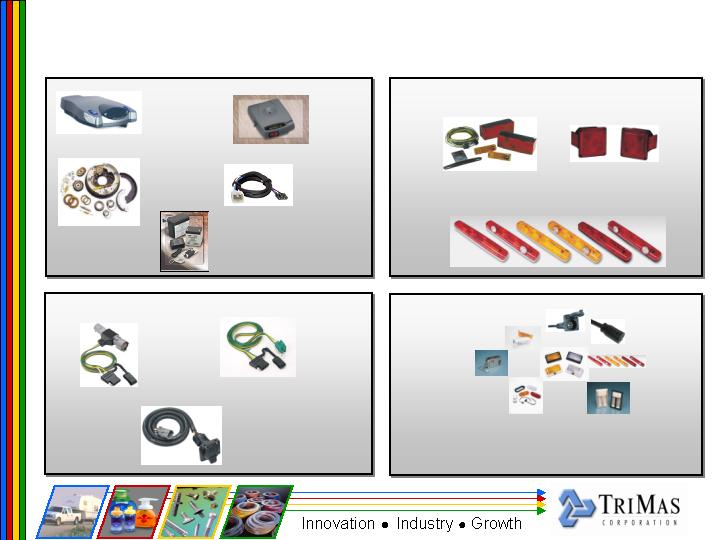
Cequent Electrical: Product Portfolio
Inertial
Brake
Control
Breakaway
Kits
Brake Control
Harness
Proportional
Brake Control
Brake
Hardware
T-One
Connector
Wiring
Harness
5, 6, 7
Way Connectors
Trailer
Lighting
Tail-light
Wiring Kits
Interior and Exterior Illumination Products
Electrical Accessories
Locks and Latches
57
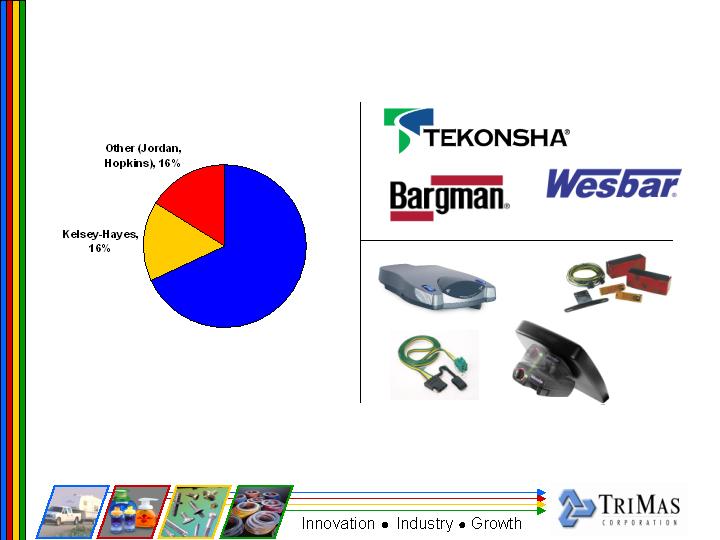
Cequent Electrical: Channels of Distribution
Estimated Sales by Channel
Estimated Sales by Product
58
Cequent Australia: Product Portfolio
Ladder Rack System
Fishing Rod
Locking Arms
Snow Ski Diagonal
Locking Arms
Bike Carrier
Tie Downs
Luggage Pods
Luggage Pods
Cargo Barriers
Hitch-Mounted
Bike Rack
Tow Bar
Weight Distribution
59
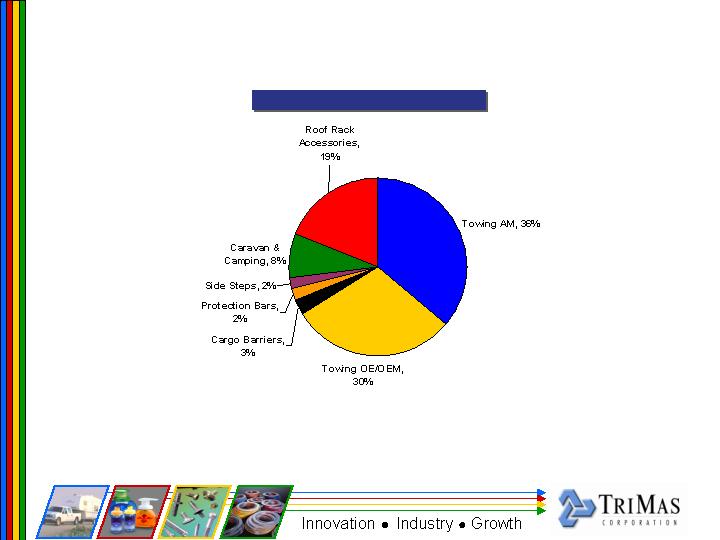
Cequent Australia: Sales by Product
Estimated Gross Sales by Product
60

Wrap-Up
Events beyond our control are impacting the Company
Steel
End market demand – Cequent
We are dealing with these events on a number of fronts
Cost reductions – continuing the journey
Price increases
Customer/market tough decisions
We appreciate your support and thank you for attending
Q&A?
61