
October 19, 2005
Innovation
A Heartland Industrial Partners’ Company
Investor Communications Meeting
Growth
Industry

This document contains “forward-looking” statements, as that term is defined by the federal securities laws, about our financial condition, results of operations and business. Forward-looking statements include certain anticipated, believed, planned, forecasted, expected, targeted and estimated results along with TriMas’ outlook concerning future results. The words “estimates,” “expects,” “anticipates,” “projects,” “plans,” “intends,” “believes,” “forecasts,” or future or conditional verbs, such as “will,” “should,” “could,” or “may,” and variations of such words or similar expressions are intended to identify forward-looking statements. All forward-looking statements, including, without limitation, management’s examination of historical operating trends and data are based upon our current expectations and various assumptions. Our expectations, beliefs and projections are expressed in good faith and we believe there is a reasonable basis for them. However, there can be no assurance that management’s expectations, beliefs and projections will be achieved. These forward-looking statements are subject to numerous assumptions, risks and uncertainties and accordingly, actual results may differ materially from those expressed or implied by the forward-looking statements. We caution readers not to place undue reliance on the statements, which speak only as of the date of this document. The cautionary statements set forth above should be considered in connection with any subsequent written or oral forward-looking statements that we or persons acting on our behalf may issue. We do not undertake any obligation to review or confirm analysts’ expectations or estimates or to release publicly any revisions to any forward-looking statements to reflect events or circumstances after the date of this document or to reflect the occurrence of unanticipated events. Risks and uncertainties that could cause actual results to vary materially from those anticipated in the forward-looking statements included in this document include general economic conditions in the markets in which we operate and industry-based factors such as: technological developments that could competitively disadvantage us, increases in our raw material, energy, and healthcare costs, our dependence on key individuals and relationships, exposure to product liability, recall and warranty claims, compliance with environmental and other regulations, and competition within our industries. In addition, factors more specific to us could cause actual results to vary materially from those anticipated in the forward-looking statements included in this document such as our substantial leverage, limitations imposed by our debt instruments, our ability to successfully pursue our stated growth strategies and opportunities, including our ability to identify attractive and other strategic acquisition opportunities and to successfully integrate acquired businesses and complete actions we have identified as providing cost-saving opportunities.
Safe Harbor Statement
2

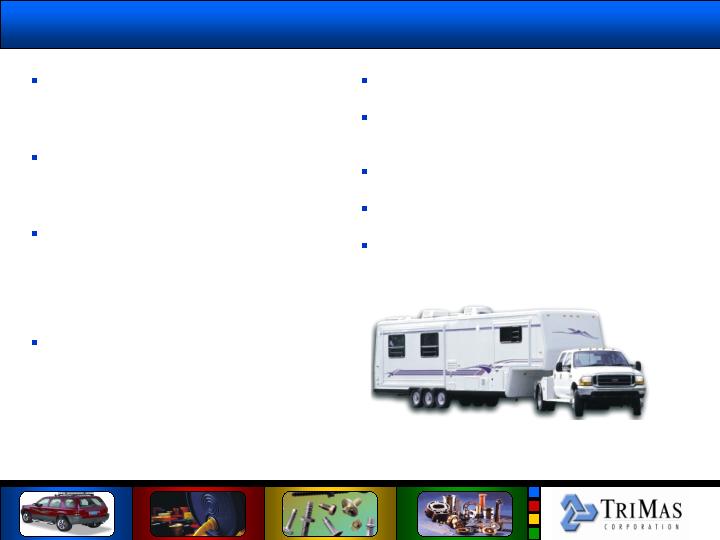
Manufacturing – Goshen, IN;
Huntsville, ON; Elkhart, IN
Products – Towing Products,
Functional Vehicle Accessories
and Cargo Management
Solutions
Distribution – Installers,
Distributors, Automotive OEM,
and retail segments
Manufacturing –Sheffield, PA
Products – Towing Products,
Functional Vehicle Accessories
and Cargo Management
Solutions
Distribution –Mass
Merchants, Auto Specialty,
Program/Buying Groups
Manufacturing – Wakerley,
Brisbane, Sydney, Australia;
Chonburi Province, Thailand
Products – Towing, Trailering,
vehicle accessory, and cargo
management solutions
Distribution –Automotive OE
andAftermarket
Products – Brake Controls,
Breakaway Systems, Brake
Accessories, Electrical
Converters
Distribution –Automotive
OEM, Trailer OEM, Marine,
RV, Agricultural/Utility
Manufacturing – Tekonsha,
MI; Albion, IN; Reynosa, MX
Manufacturing – Mosinee, WI;
Juarez, MX
Products – Trailer Products
and Accessories
Distribution –Trailer OEM,
Wholesale-distributor
Six Months Ended June 30
16.4%
11.2%
% margin ……………………
46.0
31.6
Segment Adjusted EBITDA …
$
280.0
$
283.0
Net Sales ….…….…….…..….
2004
2005
Plymouth, Michigan
Plymouth, Michigan
Melbourne, Australia
Solon, Ohio
Tekonsha, Michigan
Mosinee, Wisconsin
Cequent
Australia
Cequent
Consumer Products
Cequent
Electrical Products
Cequent
Trailer Products
Cequent
Towing Products
3
Cequent Transportation Accessories
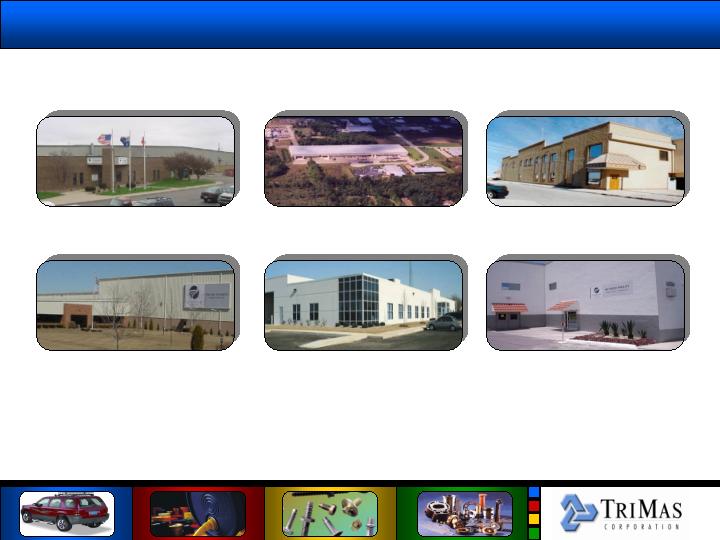
Cequent Major Facilities
Goshen, IN
South Bend, IN
Mosinee, WI
Juarez, Mexico
Tekonsha, MI
Reynosa, Mexico
4

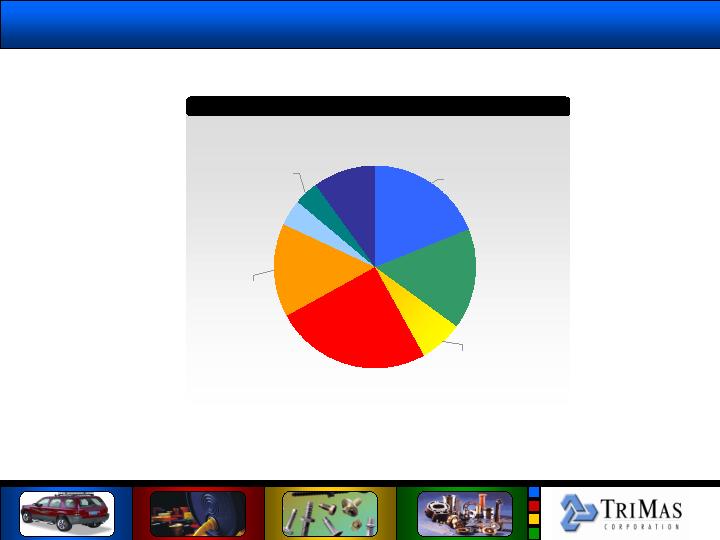
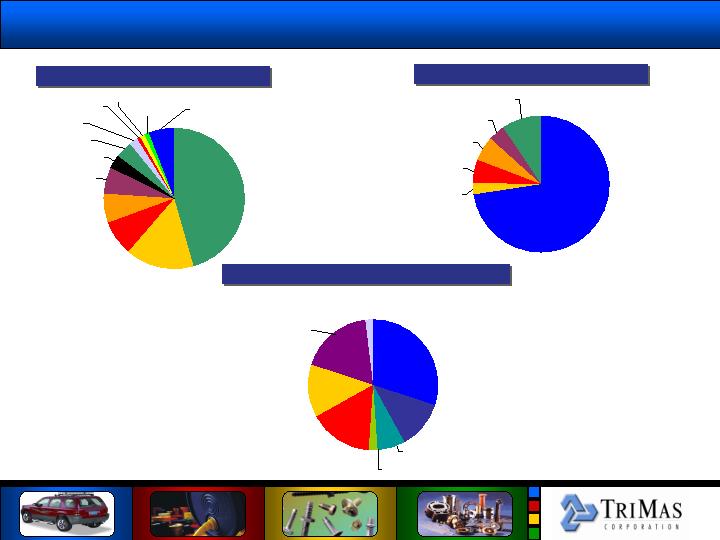
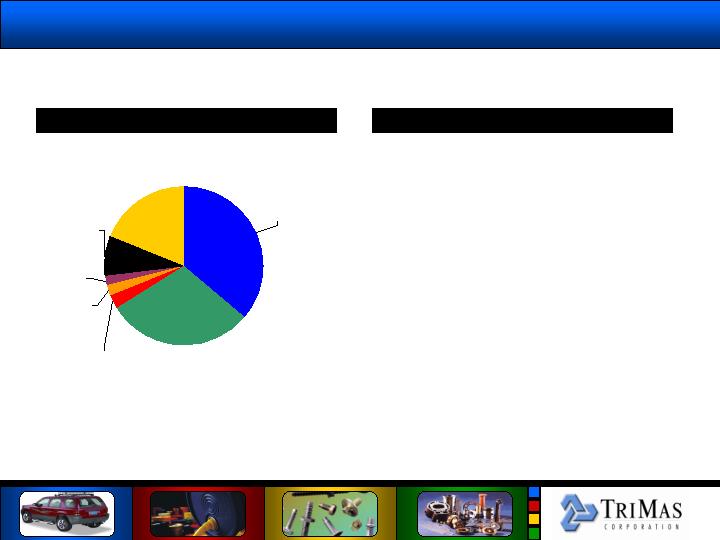
2005 (June 30, LTM) Total Cequent Net Sales …. $514.3 Million
Cequent Sales by Business Unit
Cequent Sales by Region
Cequent’s Sales Mix
Trailer
20%
Australia
11%
Towing
36%
Consumer
22%
Electrical
11%
Asia-
Pacific
11%
North
America
89%
5
Cequent’s Sales Mix
Cequent Sales by Distribution Channel
Installer 19%
Big Box
Retail
16%
Spec. Retail
7%
RV
25%
Ag/Utility
15%
Auto OEM
4%
Marine
4%
Auto Dealer
10%
6

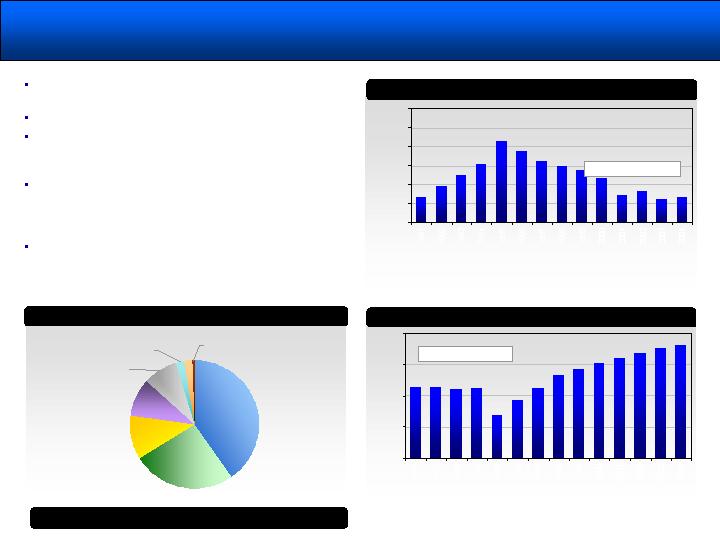
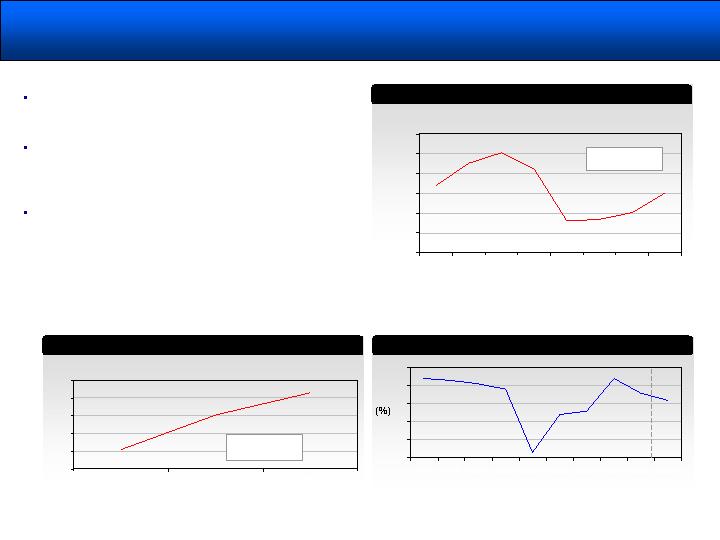
Market Overview - Recreational Vehicle Segment
U.S. RV Segment by Product Group
SOURCE: RVIA
2004 U.S. RV Market ……. $14.0 billion
(Retail Value)
Total U.S. Towable RV Trailer Market
SOURCE: RVIA
2004 U.S. Towable Trailer Market … $5.8 billion
(Retail Value)
RV Shipment Historical Volume Growth
Total Shipments
(in thousands)
*Pull ahead due to Katrina
0
50
100
150
200
250
300
350
400
450
163
203
228
259
247
248
255
293
321
300
257
307
320
370
370*
340
1991
1992
1993
1994
1995
1996
1997
1998
1999
2000
2001
2002
2003
2004
2005F
2006F
Towables
24%
Motorhomes
76%
Truck
Campers
3%
Folding
Camping
Trailers
4%
Conventional
Travel Trailers
47%
Fifth Wheel
Trailers
46%
1991-2005 CAGR ……. 5.8%
Total unit shipments will be down slightly in 2005.
Katrina caused a significant pull ahead into 2005,
normalized shipments expected to be flat 2005 to
2006. Industry expect volumes to reach 500,000 as
demographics continue to improve.
Perhaps the best news of all for the RV industry was
the increase in dollar values of shipments. Total
retail value of all RV shipments in 2004 rose an
impressive 15% to set an all time record high of over
$15 billion. The continued strength in RV shipments
as demonstrated by these growth trends reflects the
strong appeal of the RV lifestyle to a broadening
consumer base.
7
SOURCE:
Recreation Vehicle Industry Association, Crove Capital Markets Research
NOTE:
Does not include conversion vehicle shipments; dotted line represents a normalized
shipment trend, which was calculated using regression analysis.
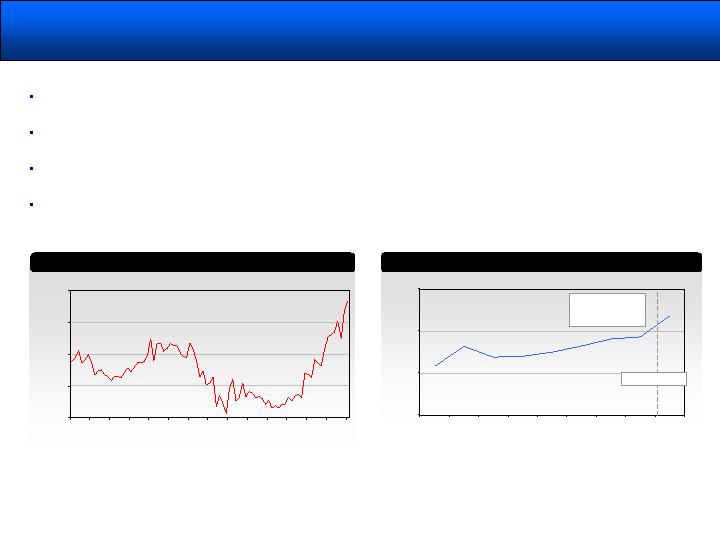
Market Overview – RV Segment Demand Drivers
SOURCE: Econstats.com
SOURCE: Energy Information Administration, conventional regular gasoline prices, U.S. Gulf Coast delivered.
(Cents per
Gallon)
(%
rate)
SOURCE: U.S. Census Bureau.
(U.S. population)
($ in
millions)
Jan- 98
Jan- 99
Jan- 00
Jan. 01
Jan. 02
Jan. 03
Jan. 04
Jan. 05
Sep. 05
0
2
4
6
8
10
2000
2004
Under 5
15 to 19
30 to 34
45 to 49
60 to 64
75 to 79
90 to 94
0
5
10
15
20
25
0
20
40
60
80
100
120
140
160
180
Jan-98
Jan-99
Jan-00
Jan. 01
Jan. 02
Jan. 03
Jan. 04
Jan. 05
June. 05
Sep. 05
( Years)
U.S. Population by Age Group
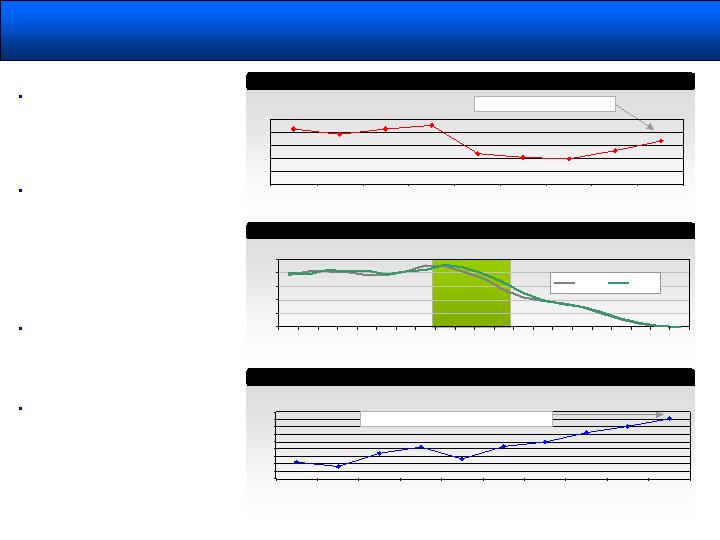
Regular Unleaded Gasoline Prices Have Been on the Rise
Driving Age Population Growth is Driving Fleet Growth and Increased Consumer Spending
U.S. Prime Lending Rate Sept. 2005 – 6.75%
U.S. Prime Lending Rate
U.S. Wholesale Price of Unleaded Regular Gas Sept. -05 ... $2.80
The U.S. prime lending rate has
been increasing. Industry experts
believe that increasing lending rates
have more impact on RV demand
than the price of gasoline. Length of
trip can always be reduced.
The U.S. population by age group
statistics indicate that the high
income age groups from 40 years old
to 60 years olds, baby boomers,
have increased by over 7.6 million
since 1998. By the end of the
decade, the number of consumers
aged 50 to 64 will total 57 million,
38% higher than in 2000.
Growth in the high income age group
is a positive factor in supporting
recreational vehicle and aftermarket
accessory product consumer
demand.
Regular unleaded gasoline prices,
while at all time highs, have less
impact on RV demand than interest
rates and disposable income which
rose 1.4% in Q2 of 2005 vs. the
2.9% decline in Q1.
8
Market Overview - Marine Segment
SOURCE: NMMA
SOURCE: NMMA
SOURCE: NMMA
Total
Retail
Sales
(in
thou-
sands)
Total
Retail
Sales
(in mil-
lions)
100
125
150
175
200
225
250
1991
1992
1993
1994
1995
1996
1997
1998
1999
2000
2001
2002
2003
2004
133
147
163
176
207
194
181
174
168
136
141
131
134
14
15
16
17
18
16.3
16.3
16.2
16.2
15.4
15.8
16.2
16.6
16.8
17.0
17.2
17.4
17.5
17.6
1991
1992
1993
1994
1995
1996
1997
1998
1999
2000
2001
2002
2003
2004
Canoes
11%
PWC
9%
Outboards
26%
Sterndrive
8%
Kayaks
41%
Sailboats
2%
Jet Boats
1%
Inboards
2%
Boat trailer sales peaked in 1995 and have declined
steadily until 2001, growing slightly in 2002.
2002 showed signs of a cyclical rebound in trailer sales.
The total estimated number of boats owned has
increased over the past eleven years at slow rate of 0.6%
annually.
The type of watercraft owned in the U.S is broad,
including kayaks, outboard power boats, canoes,
personal watercrafts, stern drive boats, inboard boats,
sailboats and jet boats.
All of the marine product segments require a towing,
trailer or accessory product to transport, providing
additional demand for towing and trailer products.
Boat Trailer Unit Sales
U.S. Marine Segment by Type of Product
Total Recreational Boats Owned in the U.S.
1991-2004 CAGR ……. 0.6%
2004 Total Unit Sales ……. 838,500
1991-2004 CAGR ……. 0.1%
9
Market Overview - Other Market Segments
SOURCE: Census of Agriculture 1992 and 2002
(1) Horses and ponies and farms reporting horses and ponies.
(horses in
thousands)
SOURCE: Trailer Body Builders
(Industrial
trailers in units)
��
SOURCE: U.S. Census Bureau
1997
1998
1999
2000
2001
2002
2003
2004
50,000
100,000
150,000
200,000
250,000
300,000
350,000
1,500
2,000
2,500
3,000
3,500
4,000
1992
1997
2002
1997
1998
1999
2000
2001
2002
2003
2004
2005
2006
0
1
2
3
4
5
The U.S. trailer production cycle typically follows GDP
growth. Current estimates of GDP growth in 2005 and
2006 are 3.6% and 3.2%, respectively.
The light industrial and utility trailer segments generally
follow the same trends as light vehicle aftermarket macro
demand as most of these consumers are using these
trailers for personal use hobbies.
Equestrian trailer industry has very few published
statistics to track demand, however, the U.S. farm
population of horses has increased at an annual rate of
1.7% over the past ten years providing an indicator of
corresponding growth in the equestrian trailer market.
CAGR
1997-2002… - 1.7%
CAGR
1992-2002 … 12.2%
U.S. Equestrian(1) Population
U.S. Gross Domestic Product YOY % Change
U.S. Industrial Trailer Production
10
Market Overview - Agricultural Equipment
North American Agricultural Equipment Demand
SOURCE: Freedonia
SOURCE: U.S. Census Bureau
U.S. Farm Machinery and Equipment Shipments
($ millions)
CAGR
1989-2004 … 1.9%
2004-2009 … 3.3%
Forecast
($ millions)
Jan-98
Jul-98
Jan-99
Jul-99
Jan-00
Jul-00
Jan-01
Jul-01
Jan-02
Jul-02
Jan-03
Jul-03
Jan-04
Jul-04
Jan-05
$20,000
$22,000
$24,000
$26,000
$28,000
$5,000
$10,000
$15,000
$20,000
1989
1994
1999
2000
2001
2002
2003
2004
2009
The three largest agricultural equipment buying regions of the World are Western Europe, Asia-Pacific and North America
accounting for 88% of total World demand.
Fredonia predicts demand in North America for agricultural equipment will grow at an average annual rate of 3.5% over the
next five years.
Historically, agricultural equipment demand in North America has grown more slowly at 1.0%, however, this measurement
in growth does not account for peak demand in the mid-1990’s.
A recent positive indicator, U.S. farm machinery and equipment shipments are on the rise, 10% higher in January over a
seasonally adjusted low in April 2003.
11

Cequent Road to Recovery(Profit Improvement)
Removed a layer of management
Elimination of 99 salaried positions
Initiated closure of four plants
Simplifying towing distribution systems
30% Towing SKU reduction project
Transfer Trailer products to Mexico
On Target to Exceed $15 Million Cost Structure Reduction
Aggressive stance with
retail/consumer customers
Offset operational cost (due to freight,
etc.) when possible
Reduce Cost Structure
Aggressive off-shore sourcing plan
Maximize leverage with steel supply
options
Raise Prices
Reduce Material Spending
12

Tom Benson, President
Industry
A Heartland Industrial Partners’ Company
Cequent Towing Products
Innovation
Growth
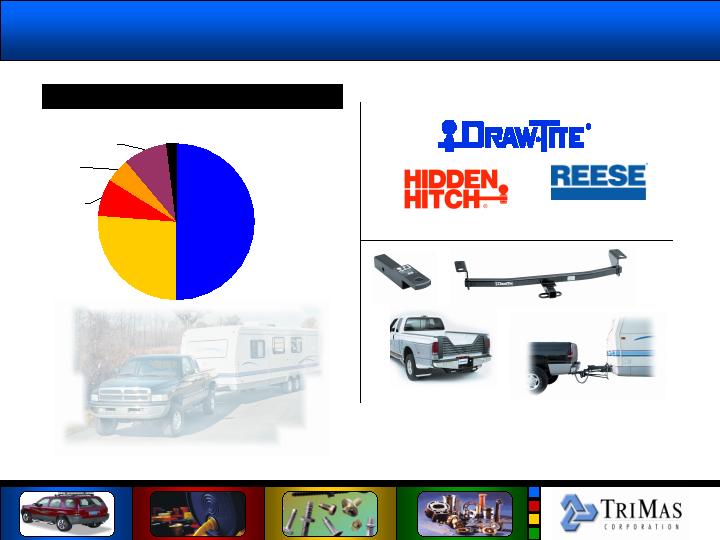
Cequent Towing Products – Market Share
Towing Products Market Share
Source: Internal company estimates
Cequent
Towing,
50%
Other, 2%
Curt, 9%
Putnam,
5%
EZ-Lift, 8%
Valley, 26%
14
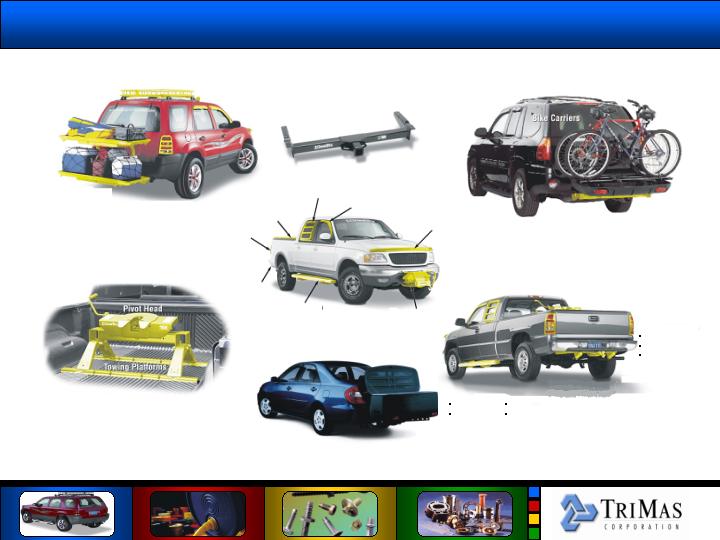
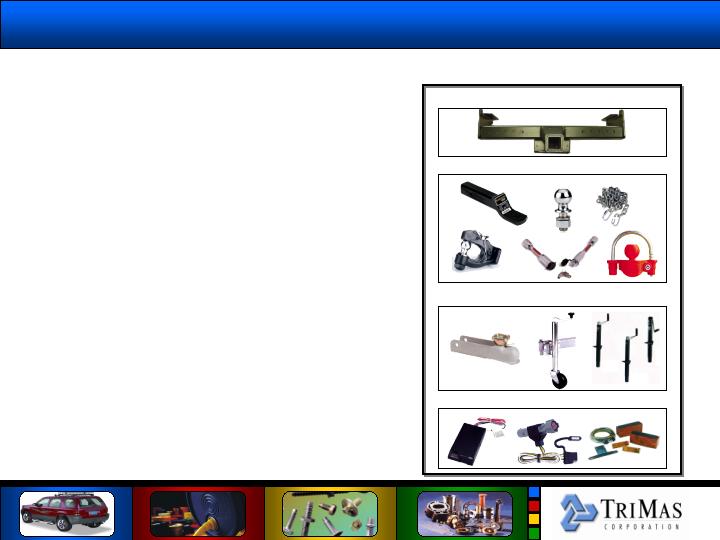
Cequent Towing: Extensive Product Portfolio
Standard Hitch
Storage Box
Roof Racks
Auxiliary
Lighting
Electric Lift Platform
(Shown with DPS Hitch)
Cargo Trays
Compact
Carriers
Folding Carrier
5TH WHEEL HITCHES
15,000 - 30,000 lbs
Rail Kits
Gooseneck
Systems
Custom Tube Steps
Side Window Air Deflector
Side Window Louvers
Tonneau Covers
Taillight
Covers
Hitch
Receivers
Cargo Table
Swing Away
Carrier
Bumper Pack
(Shown with DPS Hitch)
5th Wheel Hitches
Custombuilt Hitches
Ball Mounts
Hitch Balls
Dual Port System
(DPSTM) Hitches
or
Standard Hitches
Connectors
Convertors
Adapters
Harnesses
Electrical
Hood Protection
Light Duty
Medium Duty
Heavy Duty
Front Mounted Receivers
& Accessories
15
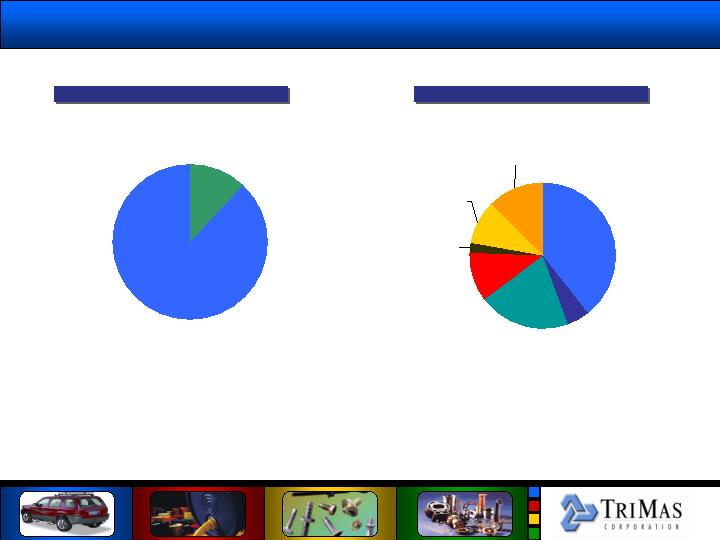
Cequent Towing Trade Sales Breakdown
Source: Internal company estimates
Installer/WD,
88%
OE, 12%
Balls &
Mounts,
5.0%
Fifth Wheel,
20.3%
WDH, 10.7%
Sway
Controls,
2.3%
Brake
Controls,
9.7%
Other
(wiring, pins,
racks),
12.5%
Hitches,
39.5%
Installer Sales by Product Line
Sales by Channel
16

Cequent Towing Top Customers
Stag Parkway – Largest RV WD in
North America
Channel: RVWD
Toyota/Flex-N-Gate – TMMNA
635 Tacoma Project
Channel: Auto OE
U-Haul – Largest Purchaser of
Trailer Hitches of any Installer in
the US
Channel: Installer
17
Cequent Towing Top Customers
Rigid Hitch – Telemarketing-based
Business with no Field Sales
Force
Channel: Installer
E-Trailer – Leader in E-Commerce
Business in Towing Category
Channel: E-Commerce
Meyer Distribution – Third Largest
Truck Accessory Distributor in the
US
Channel: Truck Accessories
18

Cequent Towing - Market Update
19
Current Market Conditions
$3.00 gas has slowed the RV market and reduced disposable income (RV towables are down 7.9%
YTD)
Boat sales are off 1.8% YTD
End of automotive incentives have slowed vehicle sales
This is the slow time of the year
Opportunities
Expect a pick-up in Class I and II sales as more passenger cars are sold versus “already hitched”
SUV’s
Improved sales due to increased FTM (first to market) activity
Expect a slight increase in WDH (weight distributing hitch) sales as FEMA trailers hit the Gulf Coast
Threats
Concerns about interest rates and inflation have caused the RV trade to expect lower sales
Considerable talk in the marketplace about large distributors going offshore on a direct basis

Bob Lewis, President
Innovation
A Heartland Industrial Partners’ Company
Cequent Trailer & Electrical Products
Industry
Growth
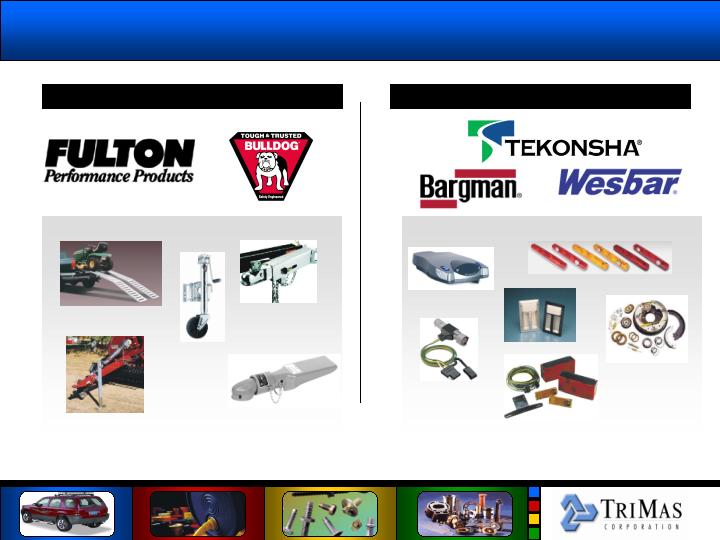
Cequent Trailer & Electrical Products
Trailer Products
Electrical Products
21
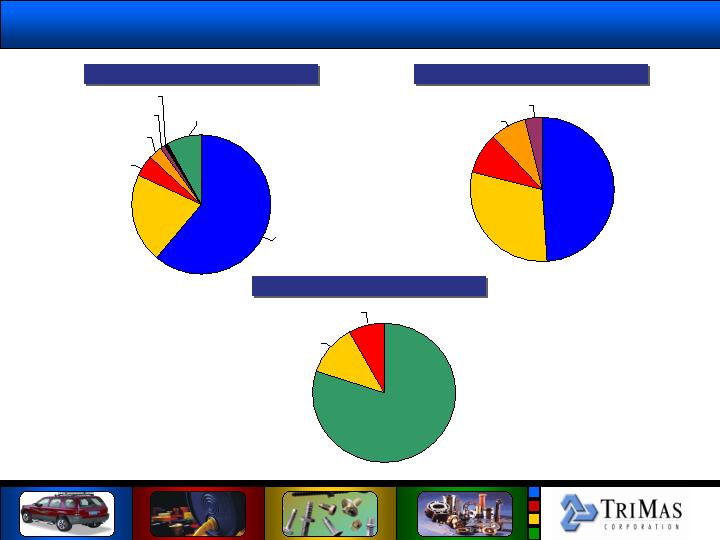
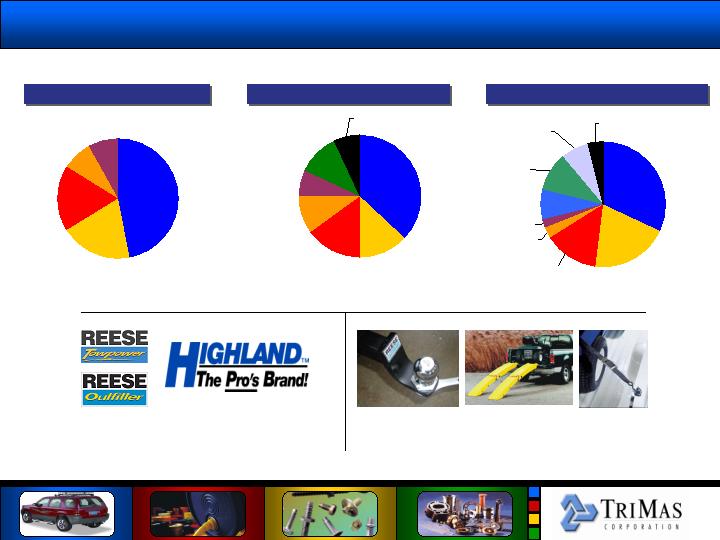
Cequent Trailer & Electrical – Market Share
Trailer - Jacks
Trailer - Couplers
Source: Internal company estimates
Electrical Products
Atwood, 21%
Shelby, 5%
Dutton
Lainson, 3%
Stallion, 1%
Binkley, 1%
Other, 8%
Cequent, 80%
Other (Jordan,
Hopkins), 8%
Kelsey-Hayes,
12%
Cequent, 49%
Other, 4%
Lainson, 8%
Shelby, 9%
Atwood, 30%
Cequent, 61%
22
Cequent Trailer & Electrical Products
Trailer/Electrical Trade Sales by Channel
Electrical – Sales by Product Line
Source: Internal company estimates
Trailer – Sales by Product Line
Jacks, 46%
Lights, Kits &
Wiring, 6%
Locks, 3%
Accessories, 4%
Brakes, 2%
Fenders, 1%
Mounts, 1%
Service Kits, 1%
Winches, 8%
ATV Acc., 7%
Other, 6%
Couplers, 16%
Lighting
Products, 9.4%
Breakaway
Systems, 5.5%
Electrical &
Wiring, 5.8%
Other, 4.0%
Brake Controls,
72.6%
Brake
Hardware, 2.7%
Marine, 12%
OE Auto, 7%
OE RV, 2%
Retail, 16%
WD RV, 13%
Export/Misc.,
2%
AG & Indust.,
18%
Horse/Utility,
30%
23

Cequent Trailer & Electrical – Top Customers
24
Trailer/Electrical2005 Initiatives – Revenue Growth
Trailer & Electrical 2005 Initiatives
25
Target opportunities include additional trailer
brake control options, manufactured electrical
control modules and integrated connectivity
within automotive OEM
Target opportunities for expansion in RV and
Specialty OEM include LED taillights and
couplers and jacks where Cequent has not
pursued business in the past
Target opportunities for expansion in RV
distribution include an LED taillights
replacement program, enhanced lighting line,
new trailer brake control technology and
couplers/ jacks where Cequent is not a
market share leader
Target opportunities in Horse, Livestock &
Utility include the introduction of new
electric jack, the introduction of new
gooseneck couplers in a HD capacity, the
enhanced lighting program and an enhanced
line of connectivity
Target opportunities in Marine Trailer
Manufacturers, Marine Distribution & Marine
Retail include LED based illumination, our
import jack expansion and the introduction of
our pivot coupler and actuator
The launch of a Bargman branded electrical t-
connect line in Q4
Electrical harness opportunities within the
Agricultural and Industrial channel
New category growth of couplers and jacks
within the RV OEM channel

Cequent Trailer Products – Market Update
26
Current Market Conditions
Trailer OEM Feeders currently busy with FEMA orders (dump and construction
trailers in high demand)
Marine suffering from years of decreased demand, will be impacted by fuel costs
even more
Ag and Industrial has been steady, impacted by fuel prices that consume budgets in
lieu of capital purchases
Q4 will be stronger than previous estimates, could see some FEMA trailer build
impact, some peripheral RV support
Opportunities
RV manufacturer penetration with steel parts and electrical
Off-shore sourcing
More Mexico production
Threats
Fuel prices impact travel, capital budgets for equipment, the “blue collar” marine
purchases
Chinese imports and infringement of our patents, below market pricing

Cequent Electrical Products – Market Update
27
Trailer OEM Feeders currently busy with FEMA orders (dump and construction
trailers in high demand)
RV distributors working off inventories this year, should buy into the Q4 dating for
upcoming Q1 ’06 shows
RV OEM will add one month of sales of lighting products for FEMA in Q4
Auto OEM will remain constant in Q4
RV manufacturer penetration with steel parts and electrical with our consolidated
sales channel approach
Lighting line expansion, new catalog, new products (i.e. LED)
Q1 ’06 rebuild of RV inventories on dealer lots
Chinese imports, below market pricing
Fuel prices on RV buyers
Cequent Electrical Products – Market Update
Cequent Electrical Products – Market Update
Current Market Conditions
Opportunities
Threats

Craig Manchen, President
Innovation
A Heartland Industrial Partners’ Company
Cequent Consumer Products
Industry
Growth
Cequent Consumer – Market Share
Loading Ramps
Tie Downs & Stretch Cords
Source: Internal company estimates
Towing Accessories
Valley, 19%
MasterLock,
18%
Bully, 8%
Other, 8%
Cequent, 47%
Daws/Better
Built, 13%
Ohio Steel, 15%
Oxlite, 10%
Universal
Industrial, 7%
5-Star, 11%
Other , 7%
Cequent, 37%
Keeper, 20%
Allied, 14%
USA Products,
3%
Erickson, 2%
Joubert, 8%
Other, 4%
Home Depot
(PL), 7%
Lowes (PL),
10%
Cequent, 32%
29
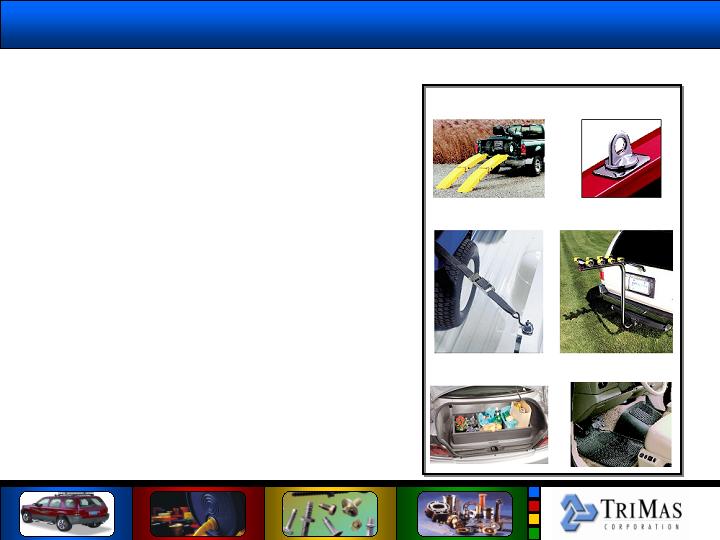
Cequent Consumer Products
Load:
Anchor:
Secure:
Carry:
Organize:
Protect:
Cargo Management Products
LOAD
ANCHOR
SECURE
CARRY
ORGANIZE
PROTECT
A full line of aluminum, steel and plastic loading
ramps and ramp kits provide sturdy, safe loading of
motorcycles, ATVs, lawn tractors and other
equipment.
Anchor systems and hardware to anchor heavy
loads, attach tie downs, truck caps, toolboxes,
camper shells, over-the-rail bedliners, tonneau
covers, antenna mounts, cab extenders and more.
A complete line of tie downs, tarp straps, stretch
cords and bungee cords to meet all securing needs.
Products are available in a wide number of styles to
match specific use.
Products which expand vehicle carrying capacity,
which include roof top, rear and hitch mount carriers
for luggage, bikes and construction.
A wide range of products to organize vehicle and
garage, including the new award winning Space
Master cargo organizer, truck and storage nets,
cargo bars, and a complete line of garage
organization products.
Keeps vehicles looking SHOWROOM NEW with
Cargo Liners, Floor Guards, All Weather Floor Mats,
Hump Liners, and Splash Guards. Custom fit vehicle
protection for trucks, cars, vans, and SUVs.
30
Cequent Consumer Products
HITCHES
TOWING ACCESSORIES
TRAILER ACCESSORIES
ELECTRICAL & LIGHTING
Towing, Trailering and Electrical Products
31
Hitches:
Multi-fit and customer fit hitches for a wide range of
vehicles, from light duty to heavy duty applications.
Towing:
Complete range of towing accessories for any usage
application, including ball mounts, hitch balls, locking
accessories, heavy duty towing products, and safety
chains. Hitch Balls and ball mounts feature our
exclusive InterLock™ design.
Trailer:
Full line of trailer accessories to fit marine, utility and
agricultural trailers. Products include couplers, jacks,
winches, and wheel bearing kits.
Electrical:
Products that connect the towing vehicle to the
trailer, including, brake controls, adapters, universal
and custom electrical connectors, and wiring kits.
Lighting:
A broad line of trailer and towing lights for marine,
utility and agricultural trailers. Products provide
added safety and visibility, and include clearance
markers, reflectors, stop/turn/tail lights and
submersible light kits.

Cequent Consumer – Market Update
Retail sales of Towing/Tie Down/Trailer Products has been growing at a rate
of 3-5% over the last four years
Retail sales in 2005 started very strong earlier in the year: 10% sales growth
Now experiencing softness in sales due to high gas prices (less disposable
income and lower store traffic) – flat with last year
Retail market share growing on DIY (Do It Yourself) Towing Accessories
(e.g., non-application-specific hitches, balls, ball mounts, locks, etc.)
Retail market share also growing on DIY Tie Downs and Trailer Products
(easy to use products priced at a value)
Application-specific hitches buying through OE or Installer (hard to install,
substantial retailer inventory commitment)
Consumers are looking for value (quality, name brand products, at fair prices)
32
Cequent Consumer – Opportunities & Threats
Competition is more experienced in off-
shore sourcing – CCP now has major
initiatives underway
Competition has focused on innovation to
penetrate our shelves – increasing our focus
on innovation
Consolidation of retail customers has
created extremely large customers with high
leverage
Some of these customers are looking to
source our products directly from Asian
sources
Reese brand name stand for quality to both
the consumer and retailer
Retailers understand the importance of the
Reese brand – worked with us during our
integration hardships in 2004
Currently raising pricing/profits on towing
items as customer service improves
Extending the Reese brand into other
product categories (Tie Downs, Electrical,
Lighting, Marine)
Switching production to lower cost Asian
sources, while maintaining strict quality
specifications
Consolidating warehousing/shipping of all
retail products for cost savings and ease of
servicing customers
Expect profitability and sales to grow
substantially in 2006 and beyond
Threats
Opportunities
33
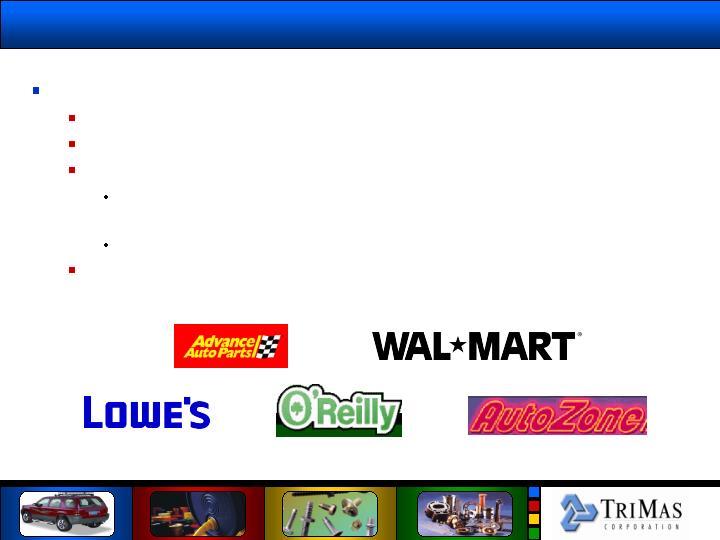
Cequent Consumer - Opportunities (cont’d)
Top accounts offer significant growth potential
Major retailers are committed to double-digit growth
Combined, these retailers open hundreds of new stores each year
Acquisitions by major retailers are common, e.g.,
Advance Auto recently acquired American International (65 stores)
and Lappens Auto Parts (18 stores)
O’Reilly recently purchased Midwest Auto (65 stores)
Wal-Mart expanding globally
34

Ed Schwartz, Group President
Cequent Transportation Accessories
A Heartland Industrial Partners’ Company
Cequent Australia
Industry
Innovation
Growth
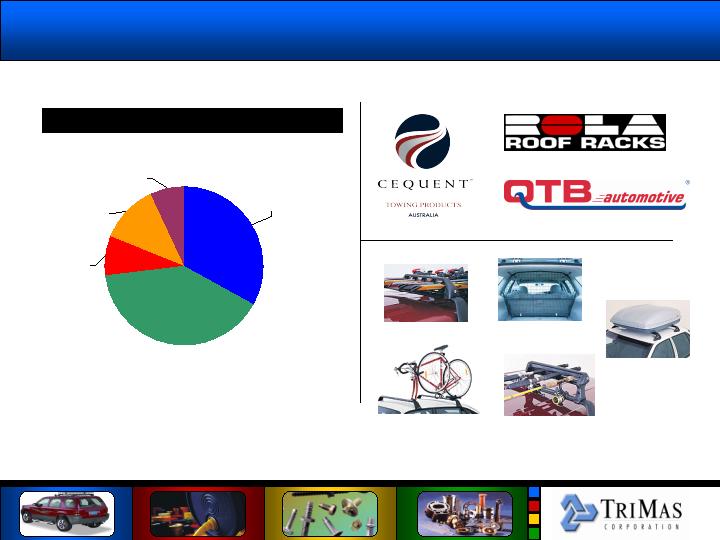
Cequent Australia
Australia Sales by Channel
Other, 7%
Towing
Aftermarket,
33%
Roof Racks
OE, 12%
Roof Racks
Aftermarket,
8%
Towing OE,
40%
36
Cequent Australia
Estimated Sales by Product
Top Customers
Toyota
Ford
Nissan
GM Holden
Subaru
Towing OE,
30%
Side Steps,
2%
Caravan &
Camping,
8%
Protection
Bars, 2%
Cargo
Barriers, 3%
Roof Rack
Accessories,
19%
Towing
Aftermarket,
36%
37
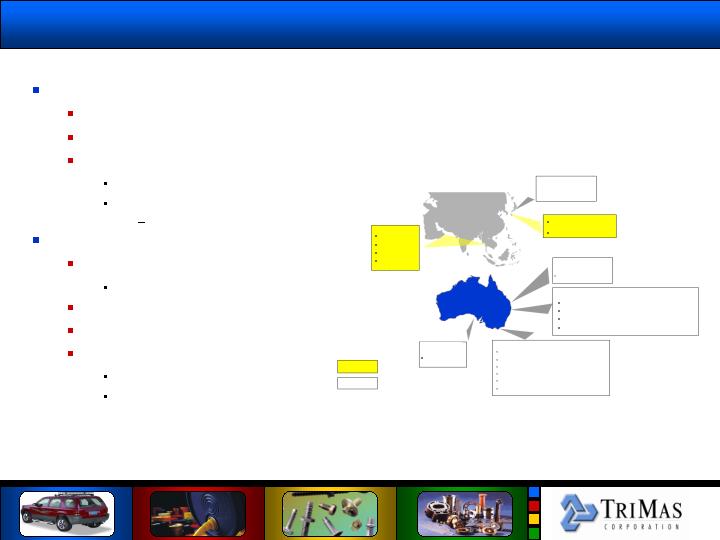
2006 Imperatives - Business Partners
TriMotive enjoys tremendous relationships with OE vehicle manufacturers
Represented with every marquee in Australia
Relationships with parent overseas (Japan, Thailand, Korea)
Awarded supplier
Q1
Toyota President Award
Nomination yearly since 2000
Established Corporate Organizations
Trust
IP
Stringent standards
Long term relationship building
Recognize value add
Expect continued investment
Innovation
Japan
FHI - Subaru
Brisbane OLD
Planned
Current
Ford
Mitsubishi
Nissan
Toyota
Subaru
Audi
Daewoo
SsangYong
Hidden
BMW
Daimler Chrysler
Porsche
Honda
AdelaideSA
Sydney NSW
Melbourne Victoria
38
Mitsubishi
Suzuki - Mayfair
Hyundai / Mobis
GM Daewoo
Toyota
Ford
Nissan
Renault
Mazda
Suzuki
Toyota Engineering
Alfa
Citroen
Mobis / Hyundai

Cequent Wrap-Up
Events beyond our control are impacting the Cequent group of companies
Gas prices
Weather (Katrina/Rita)
Economy
We are dealing with these events on a number of fronts
Sales initiatives
Cost reductions – Road to Recovery
Price increases – Road to Recovery
Customer/market tough decisions
We appreciate your support and thank you for attending
Q&A?
39

Thank You!
Innovation
A Heartland Industrial Partners’ Company
Industry
Growth