Exhibit 99.2 | |
| Third Quarter 2006 Earnings Call November 14, 2006 |
| This document contains “forward-looking” statements, as that term is defined by the federal securities laws, about our financial condition, results of operations and business. Forward-looking statements include certain anticipated, believed, planned, forecasted, expected, targeted and estimated results along with TriMas’ outlook concerning future results. The words “estimates,” “expects,” “anticipates,” “projects,” “plans,” “intends,” “believes,” “forecasts,” or future or conditional verbs, such as “will,” “should,” “could,” or “may,” and variations of such words or similar expressions are intended to identify forward-looking statements. All forward-looking statements, including, without limitation, management’s examination of historical operating trends and data are based upon our current expectations and various assumptions. Our expectations, beliefs and projections are expressed in good faith and we believe there is a reasonable basis for them. However, there can be no assurance that management’s expectations, beliefs and projections will be achieved. These forward-looking statements are subject to numerous assumptions, risks and uncertainties and accordingly, actual results may differ materially from those expressed or implied by the forward-looking statements. We caution readers not to place undue reliance on the statements, which speak only as of the date of this document. The cautionary statements set forth above should be considered in connection with any subsequent written or oral forward-looking statements that we or persons acting on our behalf may issue. We do not undertake any obligation to review or confirm analysts’ expectations or estimates or to release publicly any revisions to any forward-looking statements to reflect events or circumstances after the date of this document or to reflect the occurrence of unanticipated events. Risks and uncertainties that could cause actual results to vary materially from those anticipated in the forward-looking statements included in this document include general economic conditions in the markets in which we operate and industry-based factors such as: technological developments that could competitively disadvantage us, increases in our raw material, energy, and healthcare costs, our dependence on key individuals and relationships, exposure to product liability, recall and warranty claims, work stoppages at our facilities, or our customers or suppliers, risks associated with international markets, protection of or liability associated with our intellectual property, lower cost foreign manufacturers, compliance with environmental and other regulations, and competition within our industries. In addition, factors more specific to us could cause actual results to vary materially from those anticipated in the forward-looking statements included in this document such as our substantial leverage, limitations imposed by our debt instruments, our ability to successfully pursue our stated growth strategies and opportunities, including our ability to identify attractive and other strategic acquisition opportunities and to successfully integrate acquired businesses and complete actions we have identified as providing cost-saving opportunities. Safe Harbor Statement |
| Agenda 2006 Third Quarter Highlights 2006 Third Quarter Operating Highlights 2006 Third Quarter Financial Performance TriMas Capitalization Summary Q&A Appendix |

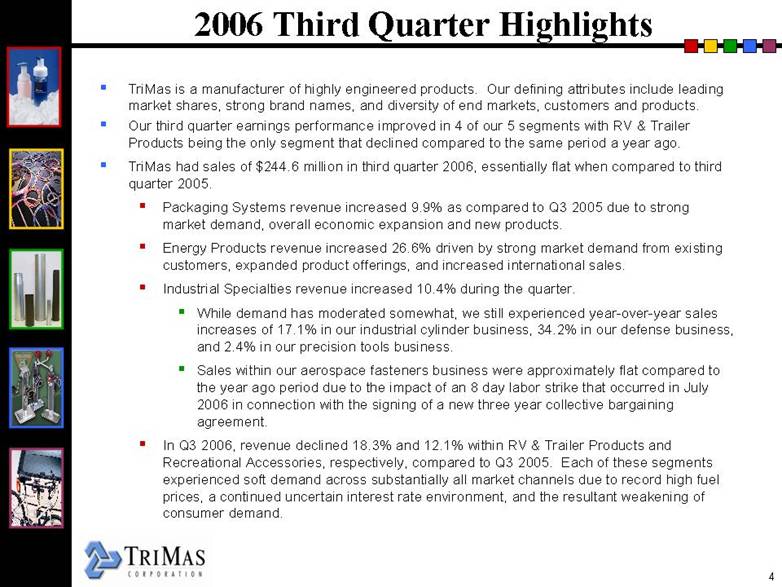
| 2006 Third Quarter Highlights TriMas is a manufacturer of highly engineered products. Our defining attributes include leading market shares, strong brand names, and diversity of end markets, customers and products. Our third quarter earnings performance improved in 4 of our 5 segments with RV & Trailer Products being the only segment that declined compared to the same period a year ago. TriMas had sales of $244.6 million in third quarter 2006, essentially flat when compared to third quarter 2005. Packaging Systems revenue increased 9.9% as compared to Q3 2005 due to strong market demand, overall economic expansion and new products. Energy Products revenue increased 26.6% driven by strong market demand from existing customers, expanded product offerings, and increased international sales.Industrial Specialties revenue increased 10.4% during the quarter. While demand has moderated somewhat, we still experienced year-over-year sales increases of 17.1% in our industrial cylinder business, 34.2% in our defense business, and 2.4% in our precision tools business. Sales within our aerospace fasteners business were approximately flat compared to the year ago period due to the impact of an 8 day labor strike that occurred in July 2006 in connection with the signing of a new three year collective bargaining agreement. In Q3 2006, revenue declined 18.3% and 12.1% within RV & Trailer Products and Recreational Accessories, respectively, compared to Q3 2005. Each of these segments experienced soft demand across substantially all market channels due to record high fuel prices, a continued uncertain interest rate environment, and the resultant weakening of consumer demand. |
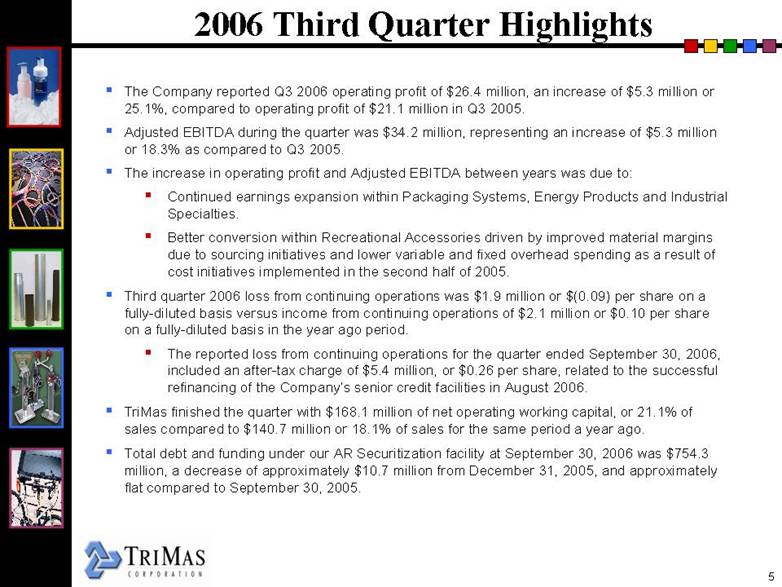
| 2006 Third Quarter Highlights The Company reported Q3 2006 operating profit of $26.4 million, an increase of $5.3 million or 25.1%, compared to operating profit of $21.1 million in Q3 2005. Adjusted EBITDA during the quarter was $34.2 million, representing an increase of $5.3 million or 18.3% as compared to Q3 2005. The increase in operating profit and Adjusted EBITDA between years was due to: Continued earnings expansion within Packaging Systems, Energy Products and Industrial Specialties. Better conversion within Recreational Accessories driven by improved material margins due to sourcing initiatives and lower variable and fixed overhead spending as a result of cost initiatives implemented in the second half of 2005. Third quarter 2006 loss from continuing operations was $1.9 million or $(0.09) per share on a fully-diluted basis versus income from continuing operations of $2.1 million or $0.10 per share on a fully-diluted basis in the year ago period. The reported loss from continuing operations for the quarter ended September 30, 2006, included an after-tax charge of $5.4 million, or $0.26 per share, related to the successful refinancing of the Company’s senior credit facilities in August 2006. TriMas finished the quarter with $168.1 million of net operating working capital, or 21.1% of sales compared to $140.7 million or 18.1% of sales for the same period a year ago. Total debt and funding under our AR Securitization facility at September 30, 2006 was $754.3 million, a decrease of approximately $10.7 million from December 31, 2005, and approximately flat compared to September 30, 2005. |
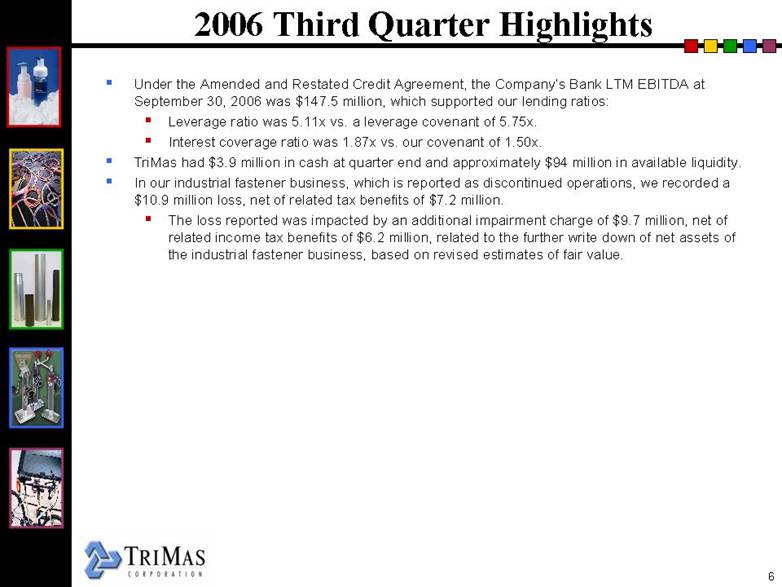
| 2006 Third Quarter Highlights Under the Amended and Restated Credit Agreement, the Company’s Bank LTM EBITDA at September 30, 2006 was $147.5 million, which supported our lending ratios: Leverage ratio was 5.11x vs. a leverage covenant of 5.75x. Interest coverage ratio was 1.87x vs. our covenant of 1.50x. TriMas had $3.9 million in cash at quarter end and approximately $94 million in available liquidity. In our industrial fastener business, which is reported as discontinued operations, we recorded a $10.9 million loss, net of related tax benefits of $7.2 million. The loss reported was impacted by an additional impairment charge of $9.7 million, net of related income tax benefits of $6.2 million, related to the further write down of net assets of the industrial fastener business, based on revised estimates of fair value. |
| Operating Highlights |
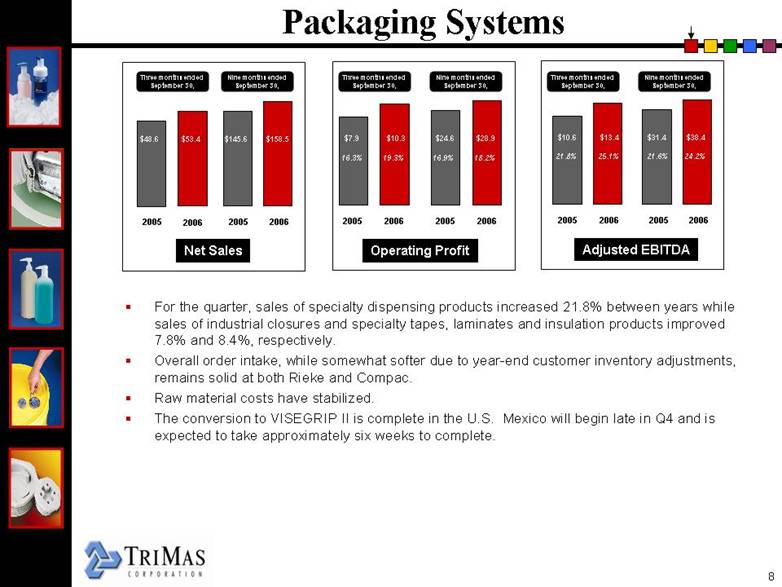
| Packaging Systems Net Sales 2006 2005 2006 $145.6 $158.5 Three months ended September 30, Nine months ended September 30, 2005 $48.6 $53.4 Adjusted EBITDA 2006 2005 2006 $31.4 $38.4 2005 21.6% 24.2% $10.6 $13.4 21.8% 25.1% Operating Profit 2006 2005 2006 $24.6 $28.9 2005 16.9% 18.2% $7.9 $10.3 16.3% 19.3% For the quarter, sales of specialty dispensing products increased 21.8% between years while sales of industrial closures and specialty tapes, laminates and insulation products improved 7.8% and 8.4%, respectively. Overall order intake, while somewhat softer due to year-end customer inventory adjustments, remains solid at both Rieke and Compac. Raw material costs have stabilized. The conversion to VISEGRIP II is complete in the U.S. Mexico will begin late in Q4 and is expected to take approximately six weeks to complete. Three months ended September 30, Nine months ended September 30, Nine months ended September 30, Three months ended September 30, |
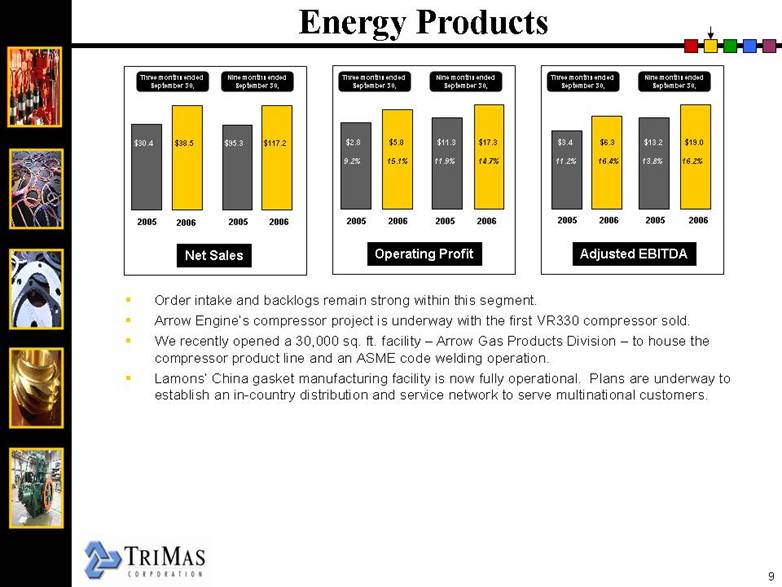
| Energy Products Order intake and backlogs remain strong within this segment. Arrow Engine’s compressor project is underway with the first VR330 compressor sold. We recently opened a 30,000 sq. ft. facility – Arrow Gas Products Division – to house the compressor product line and an ASME code welding operation. Lamons’ China gasket manufacturing facility is now fully operational. Plans are underway to establish an in-country distribution and service network to serve multinational customers. Net Sales $95.3 $117.2 $30.4 $38.5 Adjusted EBITDA $13.2 $19.0 13.8% 16.2% $3.4 $6.3 11.2% 16.4% Operating Profit $11.3 $17.3 11.9% 14.7% $2.8 $5.8 9.2% 15.1% Three months ended September 30, Nine months ended September 30, Three months ended September 30, Nine months ended September 30, Nine months ended September 30, Three months ended September 30, 2006 2005 2006 2005 2006 2005 2006 2005 2006 2005 2006 2005 |
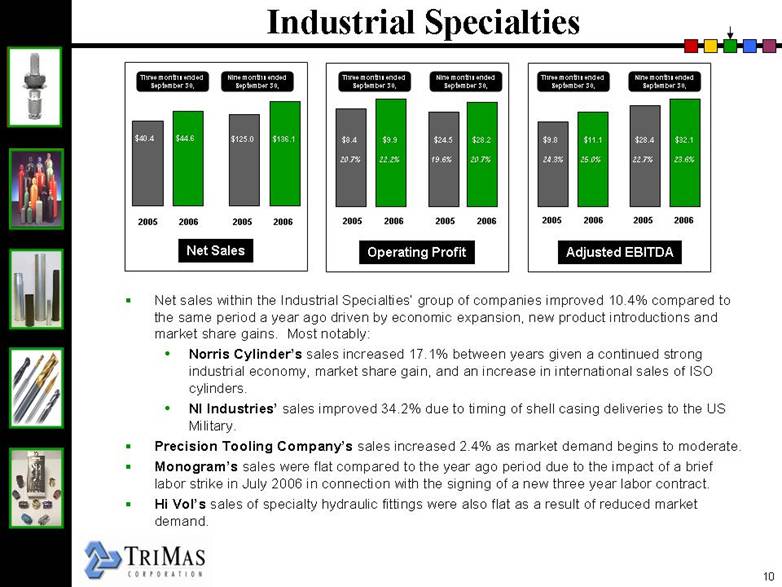
| Industrial Specialties Net Sales $125.0 $136.1 $40.4 $44.6 Adjusted EBITDA $28.4 $32.1 22.7% 23.6% $9.8 $11.1 24.3% 25.0% Operating Profit $24.5 $28.2 19.6% 20.7% $8.4 $9.9 20.7% 22.2% Net sales within the Industrial Specialties’ group of companies improved 10.4% compared to the same period a year ago driven by economic expansion, new product introductions and market share gains. Most notably: Norris Cylinder’s sales increased 17.1% between years given a continued strong industrial economy, market share gain, and an increase in international sales of ISO cylinders. NI Industries’ sales improved 34.2% due to timing of shell casing deliveries to the US Military. Precision Tooling Company’s sales increased 2.4% as market demand begins to moderate. Monogram’s sales were flat compared to the year ago period due to the impact of a brief labor strike in July 2006 in connection with the signing of a new three year labor contract. Hi Vol’s sales of specialty hydraulic fittings were also flat as a result of reduced market demand. Three months ended September 30, Nine months ended September 30, Three months ended September 30, Nine months ended September 30, Nine months ended September 30, Three months ended September 30, 2006 2005 2006 2005 2006 2005 2006 2005 2006 2005 2006 2005 |
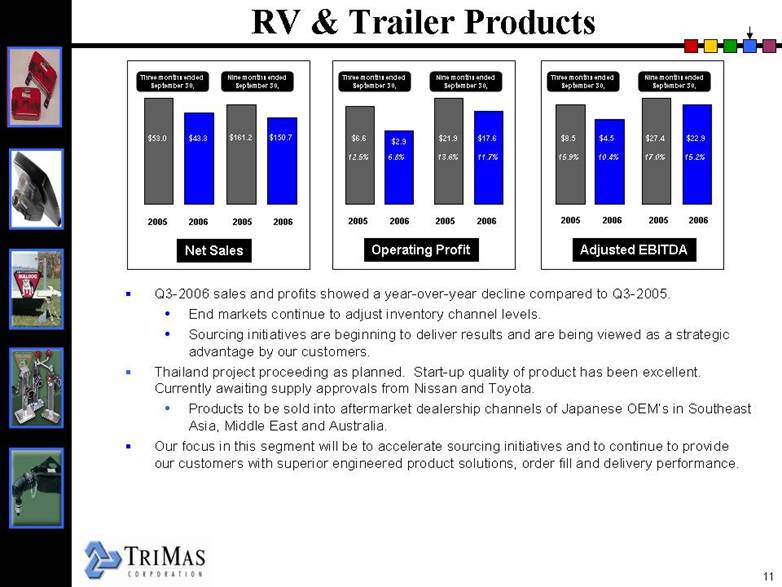
| RV & Trailer Products Net Sales Operating Profit $53.0 $43.3 $21.9 $17.6 13.6% 11.7% $161.2 $150.7 Adjusted EBITDA $27.4 $22.9 17.0% 15.2% $8.5 $4.5 15.9% 10.4% $6.6 $2.9 12.5% 6.8% Q3-2006 sales and profits showed a year-over-year decline compared to Q3-2005.End markets continue to adjust inventory channel levels. Sourcing initiatives are beginning to deliver results and are being viewed as a strategic advantage by our customers. Thailand project proceeding as planned. Start-up quality of product has been excellent. Currently awaiting supply approvals from Nissan and Toyota. Products to be sold into aftermarket dealership channels of Japanese OEM’s in Southeast Asia, Middle East and Australia. Our focus in this segment will be to accelerate sourcing initiatives and to continue to provide our customers with superior engineered product solutions, order fill and delivery performance. Three months ended September 30, Nine months ended September 30, Three months ended September 30, Nine months ended September 30, Nine months ended September 30, Three months ended September 30, 2006 2005 2006 2005 2006 2005 2006 2005 2006 2005 2006 2005 |
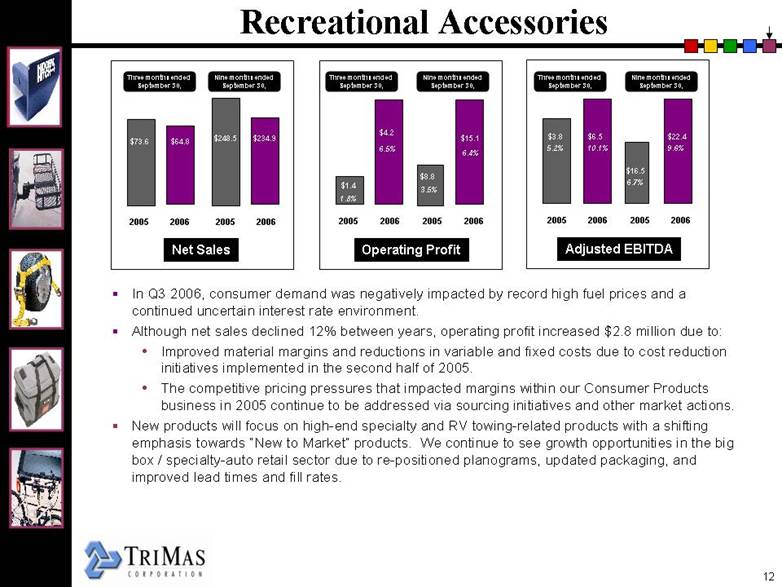
| Recreational Accessories In Q3 2006, consumer demand was negatively impacted by record high fuel prices and a continued uncertain interest rate environment. Although net sales declined 12% between years, operating profit increased $2.8 million due to: Improved material margins and reductions in variable and fixed costs due to cost reduction initiatives implemented in the second half of 2005. The competitive pricing pressures that impacted margins within our Consumer Products business in 2005 continue to be addressed via sourcing initiatives and other market actions. New products will focus on high-end specialty and RV towing-related products with a shifting emphasis towards “New to Market” products. We continue to see growth opportunities in the big box / specialty-auto retail sector due to re-positioned planograms, updated packaging, and improved lead times and fill rates. $73.6 $64.8 Net Sales $248.5 $234.9 Adjusted EBITDA 6.7% $3.8 $6.5 $16.5 $22.4 5.2% 10.1% 6.7% 9.6% Operating Profit 6.7% 7.9% $4.2 $8.8 $15.1 1.8% 6.5% $1.4 3.5% 6.4% Three months ended September 30, Nine months ended September 30, Three months ended September 30, Nine months ended September 30, Nine months ended September 30, Three months ended September 30, 2006 2005 2006 2005 2006 2005 2006 2005 2006 2005 2006 2005 |
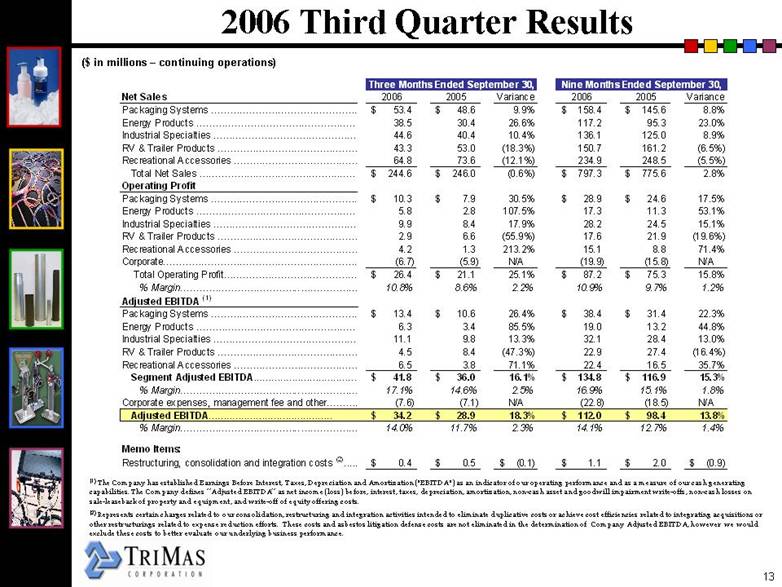
| 2006 Third Quarter Results (1) The Company has established Earnings Before Interest, Taxes, Depreciation and Amortization ("EBITDA") as an indicator of our operating performance and as a measure of our cash generating capabilities. The Company defines “Adjusted EBITDA” as net income (loss) before, interest, taxes, depreciation, amortization, non-cash asset and goodwill impairment write-offs, non-cash losses on sale-leaseback of property and equipment, and write-off of equity offering costs. (2) Represents certain charges related to our consolidation, restructuring and integration activities intended to eliminate duplicative costs or achieve cost efficiencies related to integrating acquisitions or other restructurings related to expense reduction efforts. These costs and asbestos litigation defense costs are not eliminated in the determination of Company Adjusted EBITDA, however we would exclude these costs to better evaluate our underlying business performance. ($ in millions – continuing operations) ($ in millions –continuing operations) Three Months Ended September 30, Nine Months Ended September 30, Net Sales 2006 2005 Variance 2006 2005 Variance Packaging Systems $53.4 $ 48.6 9.9% $ 158.4 $ 145.6 8.8% Energy Products 38.5 30.4 26.6% 117.2 95.3 23.0% Industrial Specialties 44.6 40.4 10.4% 136.1 125.0 8.9% RV & Trailer Products … 43.3 53.0 (18.3%) 150.7 161.2 (6.5%) Recreational Accessories … 64.8 73.6 (12.1%) 234.9 248.5 (5.5%) Total Net Sales … $ 244.6 $ 246.0 (0.6%) $ 797.3 $ 775.6 2.8% Operating Profit Packaging Systems $ 10.3 $ 7.9 30.5% $ 28.9 $ 24.6 17.5% Energy Products 5.8 2.8 107.5% 17.3 11.3 53.1% Industrial Specialties 9.9 8.4 17.9% 28.2 24.5 15.1% RV & Trailer Products 2.9 6.6 (55.9%) 17.6 21.9 (19.6%) Recreational Accessories 4.2 1.3 213.2% 15.1 8.8 71.4% Corporate (6.7) (5.9) N/A (19.9) (15.8) N/A Total Operating Profit $ 26.4 $ 21.1 25.1% $ 87.2 $ 75.3 15.8% % Margin 10.8% 8.6% 2.2% 10.9% 9.7% 1.2% Adjusted EBITDA (1) Packaging Systems $ 13.4 $ 10.6 26.4% $ 38.4 $ 31.4 22.3% Energy Products … 6.3 3.4 85.5% 19.0 13.2 44.8% Industrial Specialties 11.1 9.8 13.3% 32.1 28.4 13.0% RV & Trailer Products 4.5 8.4 (47.3%) 22.9 27.4 (16.4%) Recreational Accessories 6.5 3.8 71.1% 22.4 16.5 35.7% Segment Adjusted EBITDA $ 41.8 $ 36.0 16.1% $ 134.8 $ 116.9 15.3% % Margin 17.1% 14.6% 2.5% 16.9% 15.1% 1.8% Corporate expenses, management fee and other (7.6) (7.1) N/A (22.8) (18.5) N/A Adjusted EBITDA $ 34.2 $ 28.9 18.3% $ 112.0 $ 98.4 13.8% % Margin 14.0% 11.7% 2.3% 14.1% 12.7% 1.4% Memo Items: Restructuring, consolidation and integration costs (2) $ 0.4 $ 0.5 $ (0.1) $ 1.1 $ 2.0 $ (0.9) |
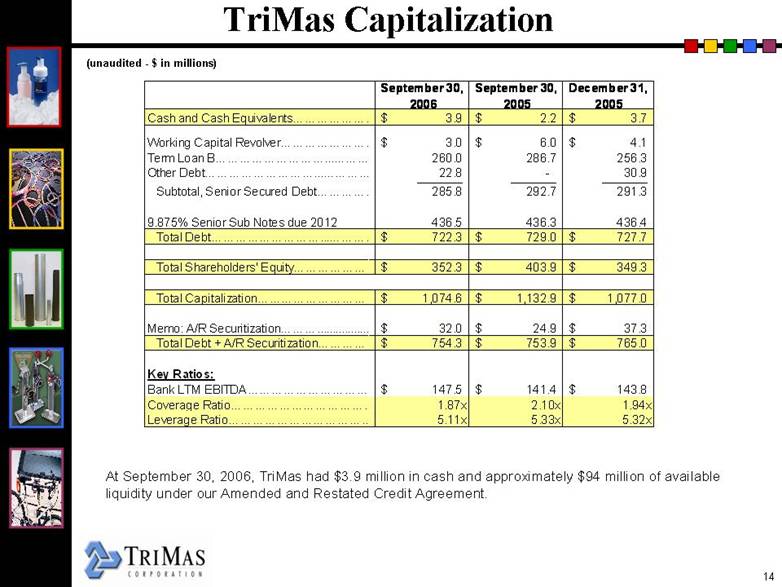
| TriMas Capitalization (unaudited - $ in millions) At September 30, 2006, TriMas had $3.9 million in cash and approximately $94 million of available liquidity under our Amended and Restated Credit Agreement. (unaudited -$ in millions) September 30, September 30, December 31, 2006 2005 2005 Cash and Cash Equivalents $ 3.9 $ 2.2 $ 3.7 Working Capital Revolver $ 3.0 $ 6.0 $ 4.1 Term Loan B 260.0 286.7 256.3 Other Debt 22.8 - 30.9 Subtotal, Senior Secured Debt 285.8 292.7 291.3 9.875% Senior Sub Notes due 2012 436.5 436.3 436.4 Total Debt $ 722.3 $ 729.0 $ 727.7 Total Shareholders' Equity $ 352.3 $ 403.9 $ 349.3 Total Capitalization $ 1,074.6 $ 1,132.9 $ 1,077.0 Memo: A/R Securitization $ 32.0 $ 24.9 $ 37.3 Total Debt + A/R Securitization $ 754.3 $ 753.9 $ 765.0 Key Ratios: Bank LTM EBITDA $ 147.5 $ 141.4 $ 143.8 Coverage Ratio 1.87x 2.10x 1.94x Leverage Ratio 5.11x 5.33x 5.32x |
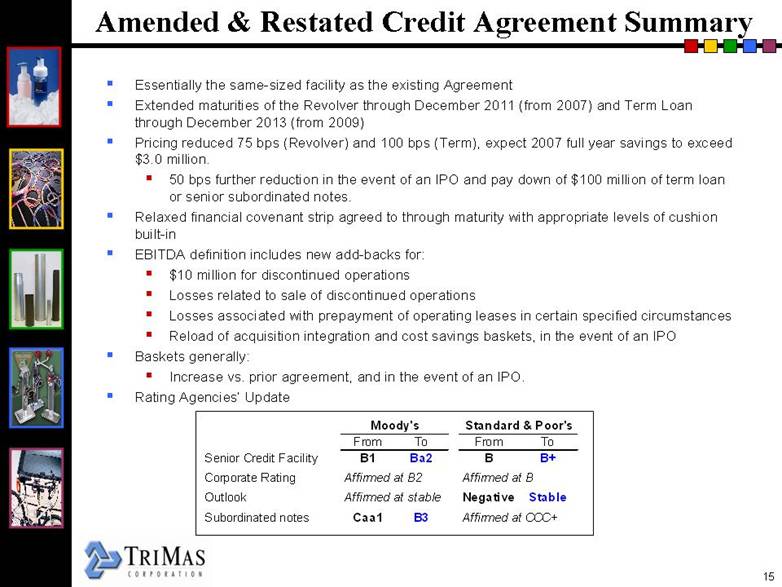
| Amended & Restated Credit Agreement Summary Essentially the same-sized facility as the existing Agreement Extended maturities of the Revolver through December 2011 (from 2007) and Term Loan through December 2013 (from 2009) Pricing reduced 75 bps (Revolver) and 100 bps (Term), expect 2007 full year savings to exceed $3.0 million. 50 bps further reduction in the event of an IPO and pay down of $100 million of term loan or senior subordinated notes. Relaxed financial covenant strip agreed to through maturity with appropriate levels of cushion built-in EBITDA definition includes new add-backs for: $10 million for discontinued operations Losses related to sale of discontinued operations Losses associated with prepayment of operating leases in certain specified circumstancesReload of acquisition integration and cost savings baskets, in the event of an IPO Baskets generally: Increase vs. prior agreement, and in the event of an IPO.Rating Agencies’ Update FromToFromToSenior Credit FacilityB1Ba2BB+Corporate RatingAffirmed at B2Affirmed at BOutlookAffirmed at stableNegativeStableSubordinated notesCaa1B3Affirmed at CCC+Standard & Poor'sMoody's |
| Summary TriMas had a solid third quarter. TriMas improved operating earnings. The Company and our team are focused on expanding sales growth initiatives, continued earnings improvement and debt reduction. Strengthening our balance sheet remains a critical tactical objective. Free cash flow Selected asset dispositions TriMas continues to see outstanding growth opportunities across our portfolio. Economic outlook appears positive for the majority of our companies, but we are closely watching short-term demand in the end markets of our Recreational Accessories and RV & Trailer Products businesses. TriMas’ goals are very simple -- drive credibility via sales and earnings performance, lower our debt and continue to build our Company with discipline. |
| Q & A |
| Appendix |
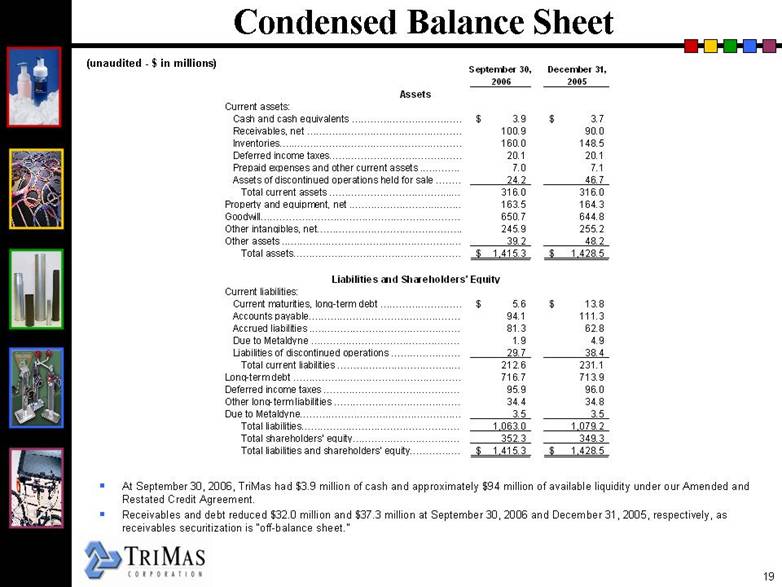
| Condensed Balance Sheet At September 30, 2006, TriMas had $3.9 million of cash and approximately $94 million of available liquidity under our Amended and Restated Credit Agreement. Receivables and debt reduced $32.0 million and $37.3 million at September 30, 2006 and December 31, 2005, respectively, as receivables securitization is “off-balance sheet.” (unaudited - $ in millions) (unaudited -$ in millions) September 30, December 31, 2006 2005 Assets Current assets: Cash and cash equivalents $ 3.9 $ 3.7 Receivables, net 100.9 90.0 Inventories 160.0 148.5 Deferred income taxes 20.1 20.1 Prepaid expenses and other current assets 7.0 7.1 Assets of discontinued operations held for sale 24.2 46.7 Total current assets 316.0 316.0 Property and equipment, net 163.5 164.3 Goodwill 650.7 644.8 Other intangibles, net 245.9 255.2 Other assets 39.2 48.2 Total assets $ 1,415.3 $ 1,428.5 Liabilities and Shareholders' Equity Current liabilities: Current maturities, long-term debt $ 5.6 $ 13.8 Accounts payable 94.1 111.3 Accrued liabilities 81.3 62.8 Due to Metaldyne 1.9 4.9 Liabilities of discontinued operations 29.7 38.4 Total current liabilities 212.6 231.1 Long-term debt 716.7 713.9 Deferred income taxes 95.9 96.0 Other long-term liabilities 34.4 34.8 Due to Metaldyne 3.5 3.5 Total liabilities 1,063.0 1,079.2 Total shareholders' equity 352.3 349.3 Total liabilities and shareholders' equity $ 1,415.3 $ 1,428.5 |
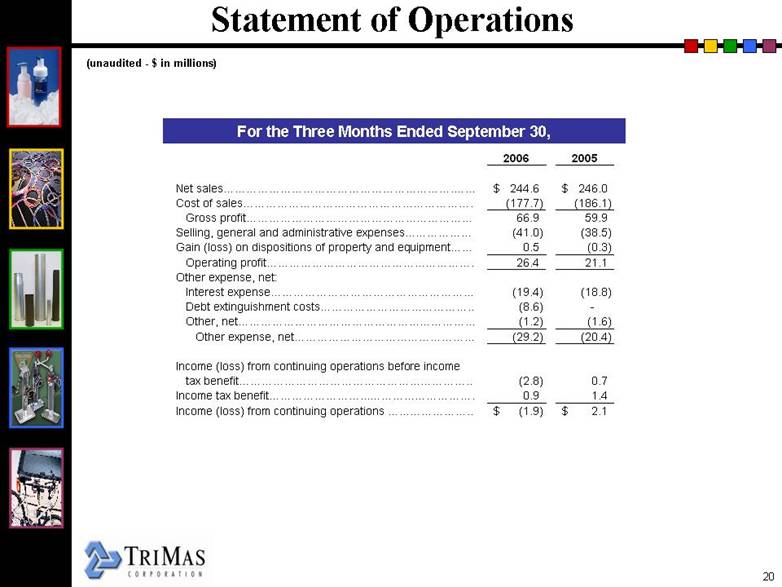
| Statement of Operations For the Three Months Ended September 30, (unaudited - $ in millions) For the Three Months Ended September 30, 2006 2005 Net sales $ 244.6 $ 246.0 Cost of sales (177.7) (186.1) Gross profit 66.9 59.9 Selling, general and administrative expenses (41.0) (38.5) Gain (loss) on dispositions of property and equipment. 0.5 (0.3) Operating profit 26.4 21.1 Other expense, net: Interest expense (19.4) (18.8) Debt extinguishment costs. (8.6) - Other, net (1.2) (1.6) Other expense, net (29.2) (20.4) Income (loss) from continuing operations before income tax benefit (2.8) 0.7 Income tax benefit 0.9 1.4 Income (loss) from continuing operations $ (1.9) $ 2.1 |
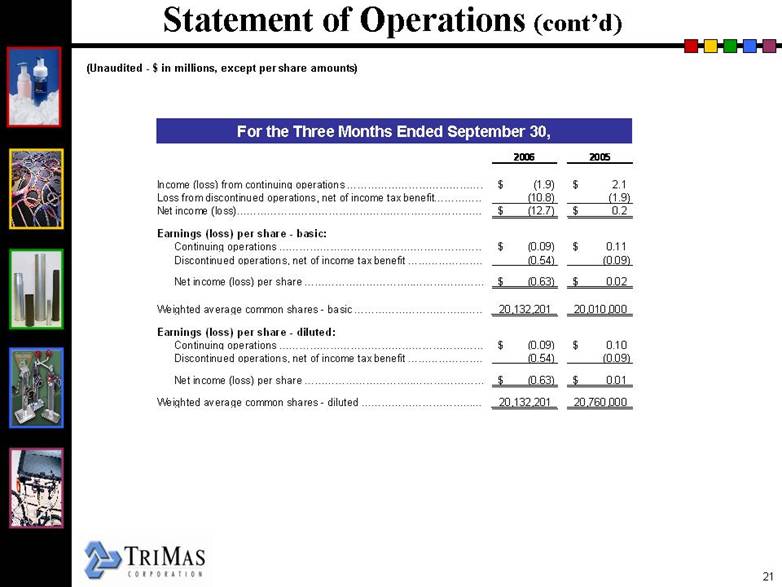
| Statement of Operations(cont’d) For the Three Months Ended September 30, (Unaudited - $ in millions, except per share amounts) For the Three Months Ended September 30, 2006 2005 Income (loss) from continuing operations $ (1.9) $ 2.1 Loss from discontinued operations, net of income tax benefit (10.8) (1.9) Net income (loss) $ (12.7) $ 0.2 Earnings (loss) per share - basic: Continuing operations $ (0.09) $ 0.11 Discontinued operations, net of income tax benefit (0.54) (0.09) Net income (loss) per share $ (0.63) $ 0.02 Weighted average common shares - basic 20,132,201 20,010,000 Earnings (loss) per share - diluted: Continuing operations $ (0.09) $ 0.10 Discontinued operations, net of income tax benefit (0.54) (0.09) Net income (loss) per share $ (0.63) $ 0.01 Weighted average common shares - diluted 20,132,201 20,760,000 |
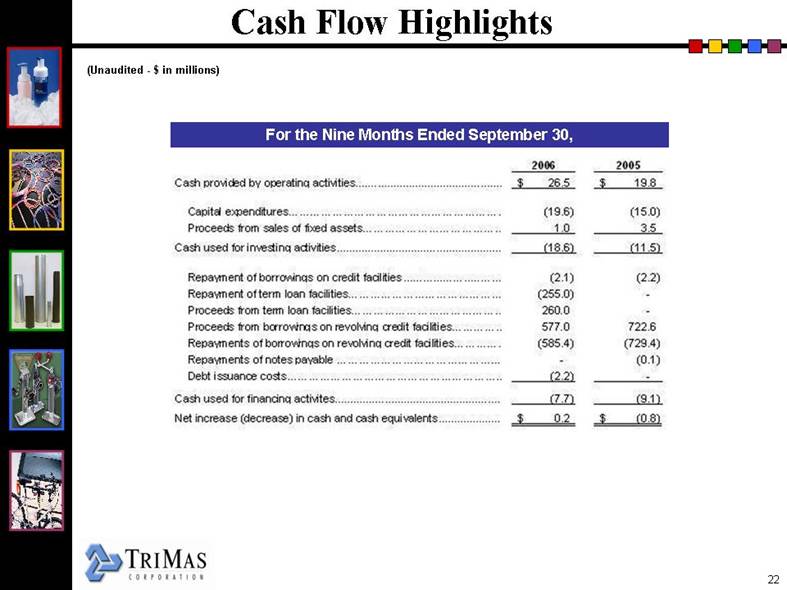
| Cash Flow Highlights For the Nine Months Ended September 30, (Unaudited - $ in millions) (Unaudited -$ in millions) For the Nine Months Ended September 30, 2006 2005 Cash provided by operating activities. $ 26.5 $ 19.8 Capital expenditures (19.6) (15.0) Proceeds from sales of fixed assets 1.0 3.5 Cash used for investing activities (18.6) (11.5) Repayment of borrowings on credit facilities, net (2.1) (2.2) Repayment of term loan facilities (255.0) - Proceeds from term loan facilities 260.0 - Proceeds from borrowings on revolving credit facilities 577.0 722.6 Repayments of borrowings on revolving credit facilities (585.4) (729.4) Repayments of notes payable - (0.1) Debt issuance costs (2.2) - Cash used for financing activites (7.7) (9.1) Net increase (decrease) in cash and cash equivalents. $ 0.2 $ (0.8) |
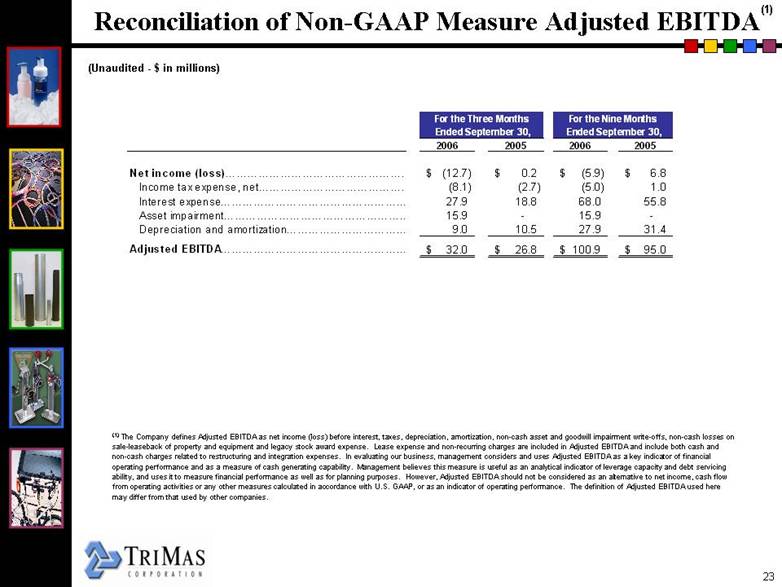
| Reconciliation of Non-GAAP Measure Adjusted EBITDA (1) The Company defines Adjusted EBITDA as net income (loss) before interest, taxes, depreciation, amortization, non-cash asset and goodwill impairment write-offs, non-cash losses on sale-leaseback of property and equipment and legacy stock award expense. Lease expense and non-recurring charges are included in Adjusted EBITDA and include both cash and non-cash charges related to restructuring and integration expenses. In evaluating our business, management considers and uses Adjusted EBITDA as a key indicator of financial operating performance and as a measure of cash generating capability. Management believes this measure is useful as an analytical indicator of leverage capacity and debt servicing ability, and uses it to measure financial performance as well as for planning purposes. However, Adjusted EBITDA should not be considered as an alternative to net income, cash flow from operating activities or any other measures calculated in accordance with U.S. GAAP, or as an indicator of operating performance. The definition of Adjusted EBITDA used here may differ from that used by other companies. (1) (Unaudited - $ in millions) (Unaudited -$ in millions) For the Three Months For the Nine Months Ended September 30, Ended September 30, 2006 2005 2006 2005 Net income (loss) $ (12.7) $ 0.2 $ (5.9) $ 6.8 Income tax expense, net (8.1) (2.7) (5.0) 1.0 Interest expense 27.9 18.8 68.0 55.8 Asset impairment 15.9 - 15.9 - Depreciation and amortization 9.0 10.5 27.9 31.4 Adjusted EBITDA $ 32.0 $ 26.8 $ 100.9 $ 95.0 |
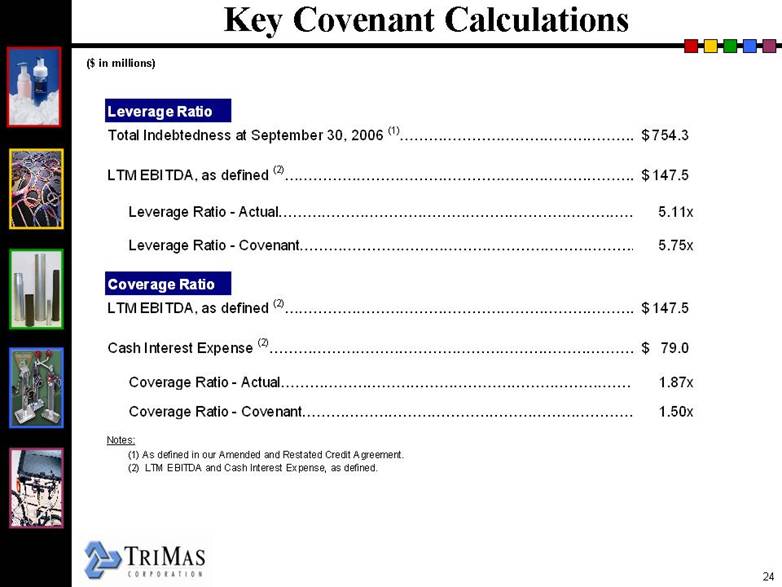
| Key Covenant Calculations ($ in millions) Leverage Ratio Total Indebtedness at September 30, 2006 (1) $ 754.3 LTM EBITDA, as defined (2) $ 147.5 Leverage Ratio - Actual 5.11x Leverage Ratio - Covenant 5.75x Coverage Ratio LTM EBITDA, as defined (2) $ 147.5 Cash Interest Expense (2) $ 79.0 Coverage Ratio - Actual 1.87x Coverage Ratio - Covenant 1.50x Notes: (1) As defined in our Amended and Restated Credit Agreement. (2) LTM EBITDA and Cash Interest Expense, as defined. ($ in millions) |
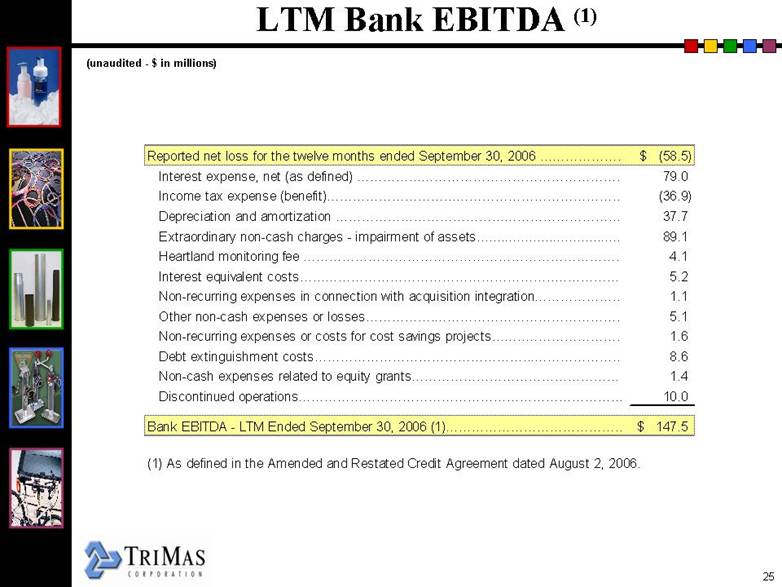
| LTM Bank EBITDA(1) (unaudited - $ in millions) (unaudited -$ in millions) Reported net loss for the twelve months ended September 30, 2006 $ (58.5) Interest expense, net (as defined) 79.0 Income tax expense (benefit) (36.9) Depreciation and amortization 37.7 Extraordinary non-cash charges - impairment of assets. 89.1 Heartland monitoring fee 4.1 Interest equivalent costs 5.2 Non-recurring expenses in connection with acquisition integration 1.1 Other non-cash expenses or losses 5.1 Non-recurring expenses or costs for cost savings projects 1.6 Debt extinguishment costs 8.6 Non-cash expenses related to equity grants 1.4 Discontinued operations 10.0 Bank EBITDA - LTM Ended September 30, 2006 (1) $ 147.5 (1) As defined in the Amended and Restated Credit Agreement dated August 2, 2006. |