Exhibit 99.2
| March 13, 2008 Fourth Quarter 2007 Earnings Presentation |
| 2 This document contains “forward-looking” statements, as that term is defined by the federal securities laws, about our financial condition, results of operations and business. Forward-looking statements include certain anticipated, believed, planned, forecasted, expected, targeted and estimated results along with TriMas’ outlook concerning future results. The words “estimates,” “expects,” “anticipates,” “projects,” “plans,” “intends,” “believes,” “forecasts,” or future or conditional verbs, such as “will,” “should,” “could,” or “may,” and variations of such words or similar expressions are intended to identify forward-looking statements. All forward-looking statements, including, without limitation, management’s examination of historical operating trends and data are based upon our current expectations and various assumptions. Our expectations, beliefs and projections are expressed in good faith and we believe there is a reasonable basis for them. However, there can be no assurance that management’s expectations, beliefs and projections will be achieved. These forward-looking statements are subject to numerous assumptions, risks and uncertainties and accordingly, actual results may differ materially from those expressed or implied by the forward-looking statements. We caution readers not to place undue reliance on the statements, which speak only as of the date of this document. The cautionary statements set forth above should be considered in connection with any subsequent written or oral forward-looking statements that we or persons acting on our behalf may issue. We do not undertake any obligation to review or confirm analysts’ expectations or estimates or to release publicly any revisions to any forward-looking statements to reflect events or circumstances after the date of this document or to reflect the occurrence of unanticipated events. Risks and uncertainties that could cause actual results to vary materially from those anticipated in the forward-looking statements included in this document include general economic conditions in the markets in which we operate and industry-based factors such as: technological developments that could competitively disadvantage us, increases in our raw material, energy, and healthcare costs, our dependence on key individuals and relationships, exposure to product liability, recall and warranty claims, work stoppages at our facilities, or our customers or suppliers, risks associated with international markets, protection of or liability associated with our intellectual property, lower cost foreign manufacturers, compliance with environmental and other regulations, and competition within our industries. In addition, factors more specific to us could cause actual results to vary materially from those anticipated in the forward-looking statements included in this document such as our substantial leverage, limitations imposed by our debt instruments, our ability to successfully pursue our stated growth strategies and opportunities, including our ability to identify attractive and other strategic acquisition opportunities and to successfully integrate acquired businesses and complete actions we have identified as providing cost-saving opportunities. Safe Harbor Statement |
| 3 Agenda ·Full Year and Fourth Quarter 2007 Highlights ·Segment Highlights ·Financial Highlights ·Summary and Outlook ·Questions and Answers ·Appendix |
| Full Year and Fourth Quarter 2007 Highlights |

| 5 2007 Major Accomplishments ·Completed IPO in May 2007 ·Achieved record sales from continuing operations of $1,068.3 million, a 5.4% increase over 2006 ·Launched new products across all five operating segments ·Initiated new revenue programs in Europe, South America, Australia and South Africa ·Grew foreign-based and export sales by 12% ·Offset end-market demand decline in RV & Trailer and Recreational Accessories segments ·Generated operating cash flow of $65.0 million ·Reduced leverage ratio a full turn to 4.08x |
| 6 2007 Major Accomplishments (cont.) ·Continued cost management initiatives ·Continued to leverage Asian sourcing and production efficiency opportunities ·Expanded and additionally utilized manufacturing facilities in China, Thailand and Mexico ·Increased focus on strong end markets ·Increased penetration in robust aerospace industry ·Expanded into the attractive medical device space through acquisition of DEW Technologies, Inc. ·Launched new, specialty dispensing products |
| 7 2007 Special Items ·As previously announced, TriMas incurred: ·One-time costs and expenses related the use of IPO proceeds of $14.2 million and $7.4 million to early retire $100 million of senior subordinated notes ·$9.0 million in costs and expenses related to the Huntsville facility closure ·$3.9 million Canadian benefit plan liability settlement expense ·Non-cash goodwill and indefinite-lived intangible asset impairment charges of $171.2 million ·$100.8 million in RV & Trailer Products segment ·$70.4 million in Recreational Accessories segment ·Incorporates more cautious view of demand in segment end markets and impact of declines in stock price ·Believe we can build and achieve long-term value realization from this portfolio of businesses Note: Please see Appendix slides 35 and 36 for Additional Information Regarding Special Items Impacting Reported GAAP Financial Measures |
| 8 2007 Full Year Summary ·Record full year sales of $1,068.3 million, increasing 5.4% from 2006 ·Excluding the impact of Special Items(1): ·2007 Operating Profit improved 5.7% to $106.5 million, as compared to $100.8 million in 2006 ·2007 Adjusted EBITDA from continuing operations was $143.8 million, up 6.6% from $134.9 million in 2006 ·If Adjusted EBITDA from businesses discontinued during Q4-2007 was to be considered for comparability purposes, Adjusted EBITDA, excluding Special Items, would have been $150.2 million, in line with guidance ·2007 Net Income from continuing operations improved 100.5% to $22.4 million, compared to $11.2 million in 2006 ·2007 Diluted EPS was $0.79 per share, compared to $0.55 per share in 2006 ·Net cash provided from operating activities was $65.0 million, versus $15.9 million in 2006 ·Reduced leverage ratio to 4.08x driven by growth in EBITDA, strong free cash flow generation and IPO proceeds (1) Excluding Special Items described on Appendix slides 35 and 36: Additional Information Regarding Special Items Impacting Reported GAAP Financials. |
| 9 2007 Fourth Quarter Summary ·Record fourth quarter sales of $237.5 million, increasing 7.1% from Q4-2006 ·Excluding the impact of Special Items(1): ·Fourth quarter 2007 Adjusted EBITDA, before corporate expenses, was up $2.4 million. However, corporate expenses were up $3.0 million due to costs to comply with SOX and the timing of compensation expenses, partially offset by the elimination of the advisory services monitoring fee ·Fourth quarter 2007 net income and diluted EPS were at an approximate break-even position compared to a loss of $2.1 million, or $0.10 per share in Q4-2006 (1) Excluding Special Items described on Appendix slides 35 and 36: Additional Information Regarding Special Items Impacting Reported GAAP Financials. |
| Segment Highlights |

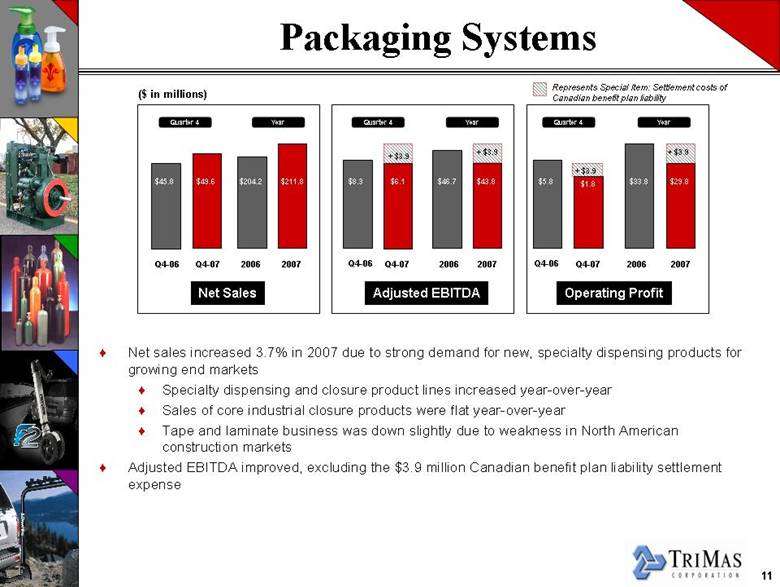
| 11 Packaging Systems ($ in millions) ·Net sales increased 3.7% in 2007 due to strong demand for new, specialty dispensing products for growing end markets ·Specialty dispensing and closure product lines increased year-over-year ·Sales of core industrial closure products were flat year-over-year ·Tape and laminate business was down slightly due to weakness in North American construction markets ·Adjusted EBITDA improved, excluding the $3.9 million Canadian benefit plan liability settlement expense Net Sales Adjusted EBITDA Q4-07 2006 2007 $204.2 $211.8 Quarter 4 Year Q4-06 Q4-07 2006 2007 $46.7 $43.8 Quarter 4 Year Q4-06 Operating Profit Q4-07 2006 2007 $33.8 $29.8 Quarter 4 Year Q4-06 $45.8 $49.6 $8.3 $6.1 $5.8 $1.8 + $3.9 + $3.9 + $3.9 + $3.9 Represents Special Item: Settlement costs of Canadian benefit plan liability |
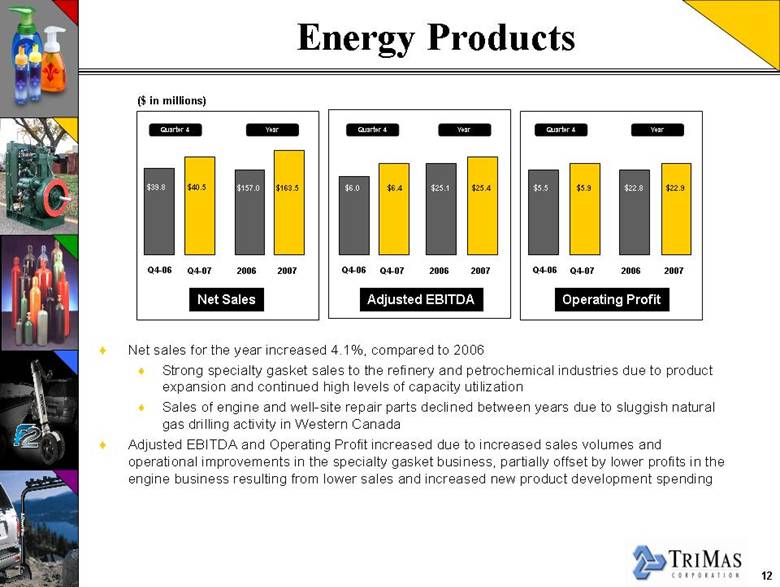
| 12 Energy Products ·Net sales for the year increased 4.1%, compared to 2006 ·Strong specialty gasket sales to the refinery and petrochemical industries due to product expansion and continued high levels of capacity utilization ·Sales of engine and well-site repair parts declined between years due to sluggish natural gas drilling activity in Western Canada ·Adjusted EBITDA and Operating Profit increased due to increased sales volumes and operational improvements in the specialty gasket business, partially offset by lower profits in the engine business resulting from lower sales and increased new product development spending ($ in millions) Net Sales Q4-07 2006 2007 $157.0 $163.5 Quarter 4 Year Q4-06 Adjusted EBITDA Q4-07 2006 2007 $25.1 $25.4 Quarter 4 Year Q4-06 Operating Profit Q4-07 2006 2007 $22.8 $22.9 Quarter 4 Year Q4-06 $39.8 $40.5 $6.0 $6.4 $5.5 $5.9 |
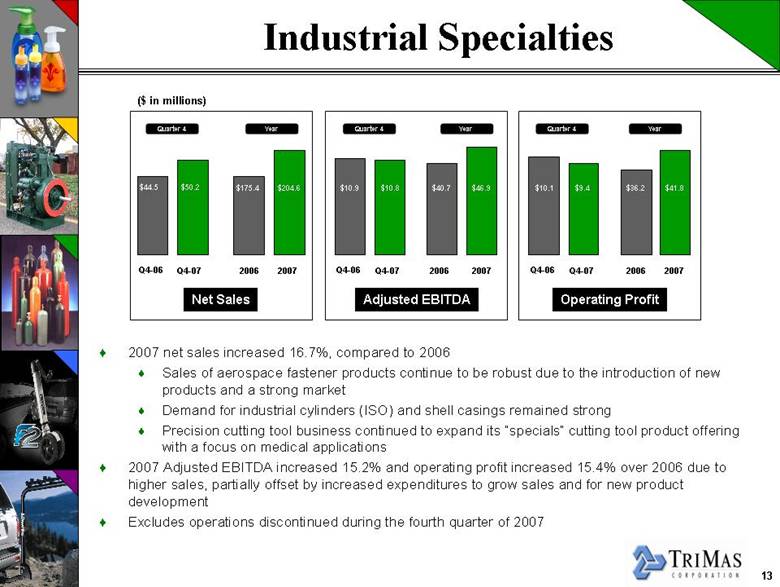
| 13 Industrial Specialties ($ in millions) ·2007 net sales increased 16.7%, compared to 2006 ·Sales of aerospace fastener products continue to be robust due to the introduction of new products and a strong market ·Demand for industrial cylinders (ISO) and shell casings remained strong ·Precision cutting tool business continued to expand its “specials” cutting tool product offering with a focus on medical applications ·2007 Adjusted EBITDA increased 15.2% and operating profit increased 15.4% over 2006 due to higher sales, partially offset by increased expenditures to grow sales and for new product development ·Excludes operations discontinued during the fourth quarter of 2007 Net Sales Q4-07 2006 2007 $175.4 $204.6 Quarter 4 Year Q4-06 Adjusted EBITDA Q4-07 2006 2007 $40.7 $46.9 Quarter 4 Year Q4-06 Operating Profit Q4-07 2006 2007 $36.2 $41.8 Quarter 4 Year Q4-06 $44.5 $50.2 $10.9 $10.8 $10.1 $9.4 |
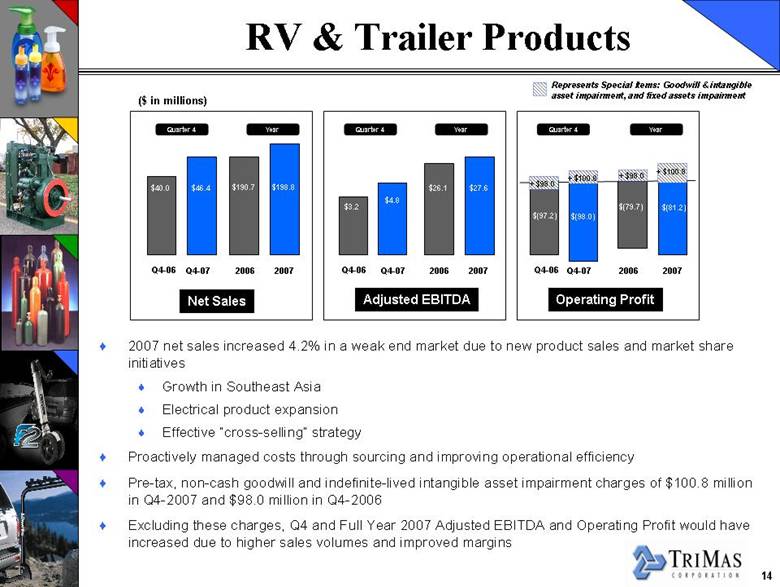
| 14 RV & Trailer Products ($ in millions) ·2007 net sales increased 4.2% in a weak end market due to new product sales and market share initiatives ·Growth in Southeast Asia ·Electrical product expansion ·Effective “cross-selling” strategy ·Proactively managed costs through sourcing and improving operational efficiency ·Pre-tax, non-cash goodwill and indefinite-lived intangible asset impairment charges of $100.8 million in Q4-2007 and $98.0 million in Q4-2006 ·Excluding these charges, Q4 and Full Year 2007 Adjusted EBITDA and Operating Profit would have increased due to higher sales volumes and improved margins Net Sales Adjusted EBITDA Operating Profit Q4-07 2006 2007 $40.0 $46.4 Quarter 4 Year Q4-06 Q4-07 2006 2007 $26.1 $27.6 Quarter 4 Year Q4-06 Q4-07 2006 2007 $(79.7) $(81.2) Quarter 4 Year Q4-06 $190.7 $198.8 $3.2 $4.8 $(97.2) $(98.0) + $100.8 + $100.8 + $98.0 + $98.0 Represents Special Items: Goodwill & intangible asset impairment, and fixed assets impairment |
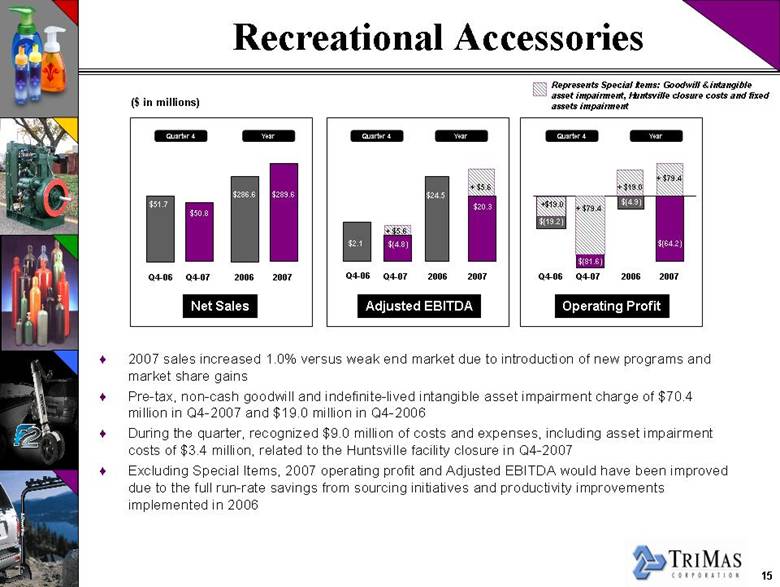
| 15 Recreational Accessories ($ in millions) ·2007 sales increased 1.0% versus weak end market due to introduction of new programs and market share gains ·Pre-tax, non-cash goodwill and indefinite-lived intangible asset impairment charge of $70.4 million in Q4-2007 and $19.0 million in Q4-2006 ·During the quarter, recognized $9.0 million of costs and expenses, including asset impairment costs of $3.4 million, related to the Huntsville facility closure in Q4-2007 ·Excluding Special Items, 2007 operating profit and Adjusted EBITDA would have been improved due to the full run-rate savings from sourcing initiatives and productivity improvements implemented in 2006 Q4-06 Q4-07 $51.7 $50.8 Net Sales Adjusted EBITDA Operating Profit 2006 2007 $286.6 $289.6 $2.1 $(4.8) $24.5 $20.3 Q4-06 Q4-07 2006 2007 Quarter 4 Year Quarter 4 Year $(81.6) $(4.9) $(64.2) Quarter 4 Year Q4-06 Q4-07 2006 2007 Represents Special Items: Goodwill & intangible asset impairment, Huntsville closure costs and fixed assets impairment + $5.6 + $79.4 + $5.6 + $19.0 $(19.2) +$19.0 + $79.4 |
| Financial Highlights |

| 17 Summary of Special Items . Costs and expenses related to use of IPO proceeds . (Corporate) . Expense related to settlement of Canadian benefit plan liability . (Packaging Systems) . Huntsville facility closure costs . (Recreational Accessories) . Non-cash goodwill and intangible asset impairment charges . (RV & Trailer and Recreational Accessories) |
| 18 Goodwill and Intangible Asset Impairment . Process overview . Pre-tax, non-cash goodwill and indefinite-lived asset impairment charges of $171.2 million . $100.8 million in RV & Trailer Products segment . $70.4 million in Recreational Accessories segment . After-tax impact of $159.9 million |
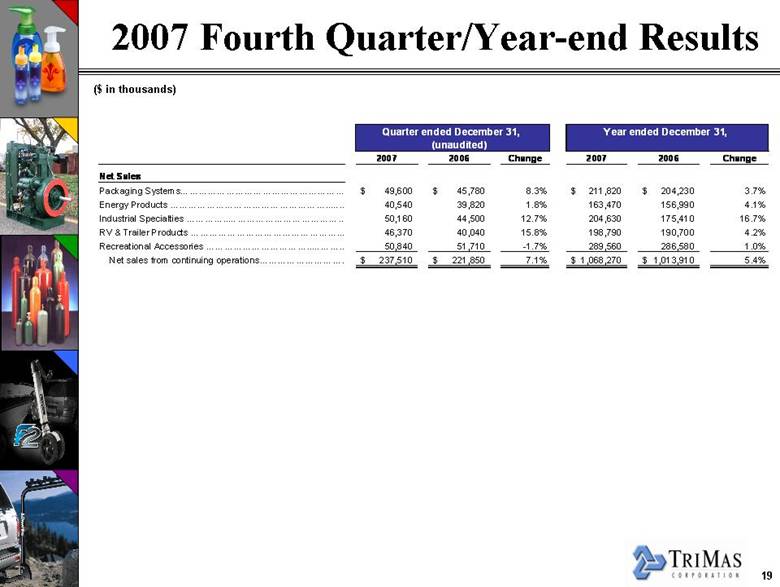
| 19 2007 Fourth Quarter/Year-end Results (unaudited) 2007 2006 Change 2007 2006 Change Net Sales Packaging Systems 49,600 $ 45,780 $ 8.3% 211,820 $ 204,230 $ 3.7% Energy Products 40,540 39,820 1.8% 163,470 156,990 4.1% Industrial Specialties 50,160 44,500 12.7% 204,630 175,410 16.7% RV & Trailer Products 46,370 40,040 15.8% 198,790 190,700 4.2% Recreational Accessories 50,840 51,710 -1.7% 289,560 286,580 1.0% Net sales from continuing operations 237,510 $ 221,850 $ 7.1% 1,068,270 $ 1,013,910 $ 5.4% Quarter ended December 31, Year ended December 31, ($ in thousands) |
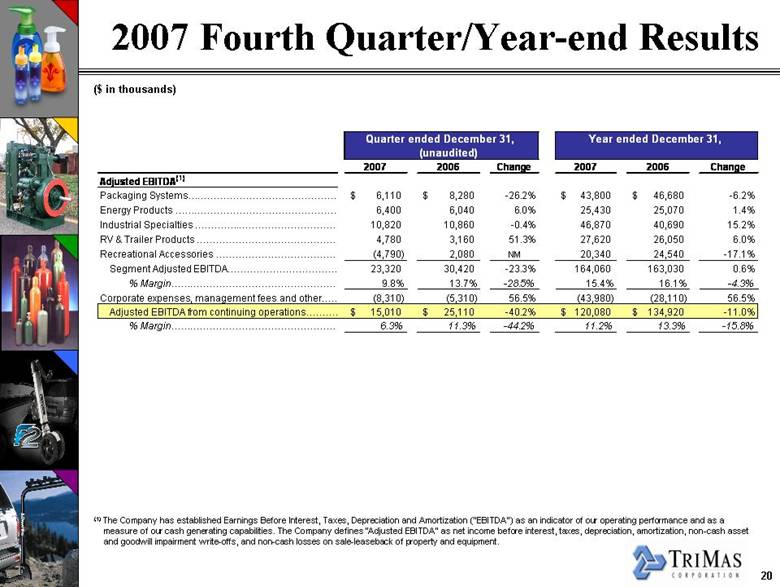
| 20 2007 Fourth Quarter/Year-end Results (1) The Company has established Earnings Before Interest, Taxes, Depreciation and Amortization ("EBITDA") as an indicator of our operating performance and as a measure of our cash generating capabilities. The Company defines “Adjusted EBITDA” as net income before interest, taxes, depreciation, amortization, non-cash asset and goodwill impairment write-offs, and non-cash losses on sale-leaseback of property and equipment. (unaudited) 2007 2006 Change 2007 2006 Change Adjusted EBITDA(1) Packaging Systems 6,110 $ 8,280 $ -26.2% 43,800 $ 46,680 $ -6.2% Energy Products 6,400 6,040 6.0% 25,430 25,070 1.4% Industrial Specialties 10,820 10,860 -0.4% 46,870 40,690 15.2% RV & Trailer Products 4,780 3,160 51.3% 27,620 26,050 6.0% Recreational Accessories (4,790) 2,080 NM 20,340 24,540 -17.1% Segment Adjusted EBITDA 23,320 30,420 -23.3% 164,060 163,030 0.6% %Margin 9.8% 13.7% -28.5% 15.4% 16.1% -4.3% Corporate expenses, management fees and other (8,310) (5,310 ) 56.5% (43,980 ) (28,11 0) 56.5% Adjusted EBITDA from continuing operations 15,010 $ 25,110 $ -40.2% 120,080 $ 134,920 $ -11.0% % Margin 6.3% 11.3% -4 4.2% 11.2% 13.3% -15.8% Quarter ended December 31, Year ended December 31, ($ in thousands) |
| 21 Statement of Operations ($ in thousands) 2007 2006 2007 2006 Net sales 237,510 $ 221,850 $ 1,068,270 $ 1,013,910 $ Cost of sales (176,190) (164,480) (779,380) (743,550) Gross profit 61,320 57,370 288,890 270,360 Selling, general and administrative expenses (52,400) (39,510) (185,910) (169,050) Advisory services agreement termination fee - - (10,000) - Costs for early termination of operating leases - - (4,230) - Settlement of Canadian benefit plan liability (3,870) - (3,870) - Loss on dispositions of property and equipment (390) (370) (2,070) (550) Impairment of assets (3,370) (510) (3,370) (510) Impairment of goodwill and indefinite-lived intangible assets (171,210) (116,500) (171,210) (116,500) Operating loss (169,920) (99,520) (91,770) (16,250) Other expense, net: Interest expense (15,390) (19,740) (68,310) (79,060) Debt extinguishment costs - - (7,440) (8,610) Other, net (430) (1,040) (3,880) (4,150) Other expense, net (15,820) (20,780) (79,630) (91,820) Loss from continuing operations before income tax benefit (expense) (185,740) (120,300) (171,400) (108,070) Income tax benefit (expense) 17,310 2,580 12,080 (1,700) Loss from continuing operations (168,430) (117,720) (159,320) (109,770) Income (loss) from discontinued operations, net of income taxes (440) (4,170) 890 (19,140) Net loss (168,870) $ (121,890) $ (158,430) $ (128,910) $ Quarter ended December 31, Year ended (unaudited) December 31, |

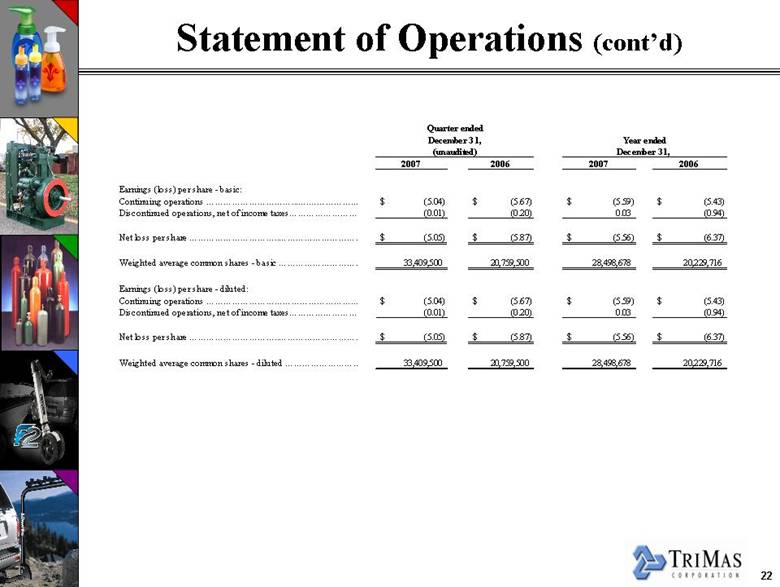
| 22 Statement of Operations (cont’d) 2007 2006 2007 2006 Earnings (loss) per share - basic: Continuing operations (5.04) $ (5.67) $ (5.59) $ (5.43) $ Discontinued operations, net of income taxes (0.01) (0.20) 0.03 (0.94) Net loss per share (5.05) $ (5.87) $ (5.56) $ (6.37) $ Weighted average common shares - basic 33,409,500 20,759,500 28,498,678 20,229,716 Earnings (loss) per share - diluted: Continuing operations (5.04) $ (5.67) $ (5.59) $ (5.43) $ Discontinued operations, net of income taxes (0.01) (0.20) 0.03 (0.94) Net loss per share (5.05) $ (5.87) $ (5.56) $ (6.37) $ Weighted average common shares - diluted 33,409,500 20,759,500 28,498,678 20,229,716 Quarter ended December 31, Year ended (unaudited) December 31, |
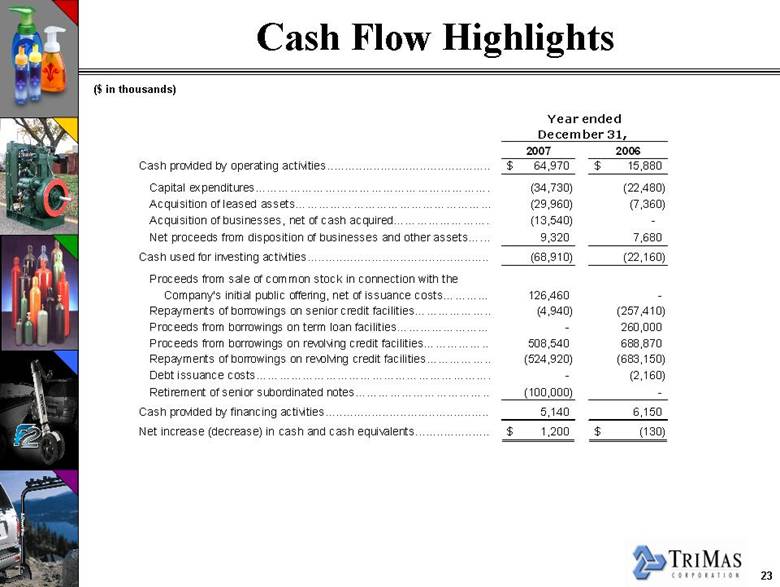
| 23 Cash Flow Highlights ($ in thousands) 2007 2006 Cash provided by operating activities 64,970 $ 15,880 $ Capital expenditures (34,730) (22,480) Acquisition of leased assets (29,960) (7,360) Acquisition of businesses, net of cash acquired (13,540) - Net proceeds from disposition of businesses and other assets 9,320 7,680 Cash used for investing activities (68,910) (22,160) Proceeds from sale of common stock in connection with the Company's initial public offering, net of issuance costs 126,460 - Repayments of borrowings on senior credit facilities (4,940) (257,410) Proceeds from borrowings on term loan facilities - 260,000 Proceeds from borrowings on revolving credit facilities 508,540 688,870 Repayments of borrowings on revolving credit facilities (524,920) (683,150) Debt issuance costs - (2,160) Retirement of senior subordinated notes (100,000) - Cash provided by financing activities 5,140 6,150 Net increase (decrease) in cash and cash equivalents 1,200 $ (130) $ December 31, Year ended |
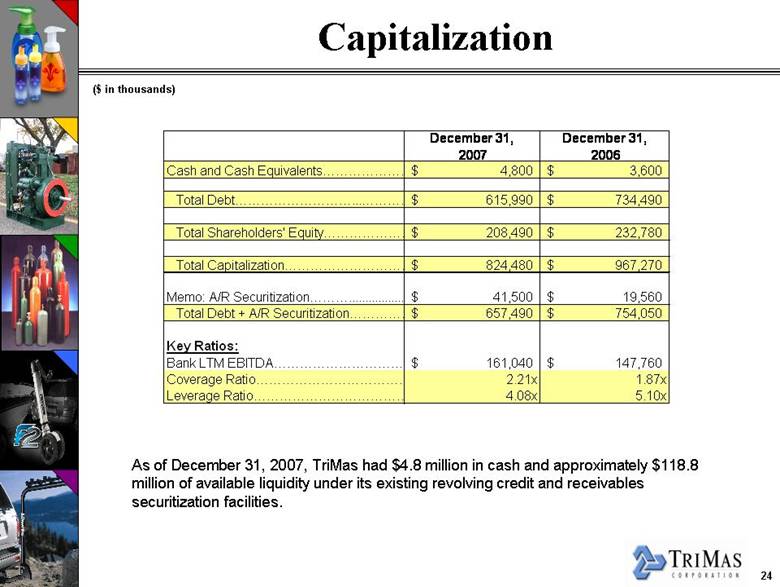
| 24 Capitalization As of December 31, 2007, TriMas had $4.8 million in cash and approximately $118.8 million of available liquidity under its existing revolving credit and receivables securitization facilities. ($ in thousands) December 31, 2007 December 31, 2006 Cash and Cash Equivalents 4,800 $ 3,600 $ Total Debt 615,990 $ 734,490 $ Total Shareholders' Equity 208,490 $ 232,780 $ Total Capitalization 824,480 $ 967,270 $ Memo: A/R Securitization 41,500 $ 19,560 $ Total Debt + A/R Securitization 657,490 $ 754,050 $ Key Ratios: Bank LTM EBITDA 161,040 $ 147,760 $ Coverage Ratio 2.21x 1.87x Leverage Ratio 4.08x 5.10x |
| Summary and Outlook |
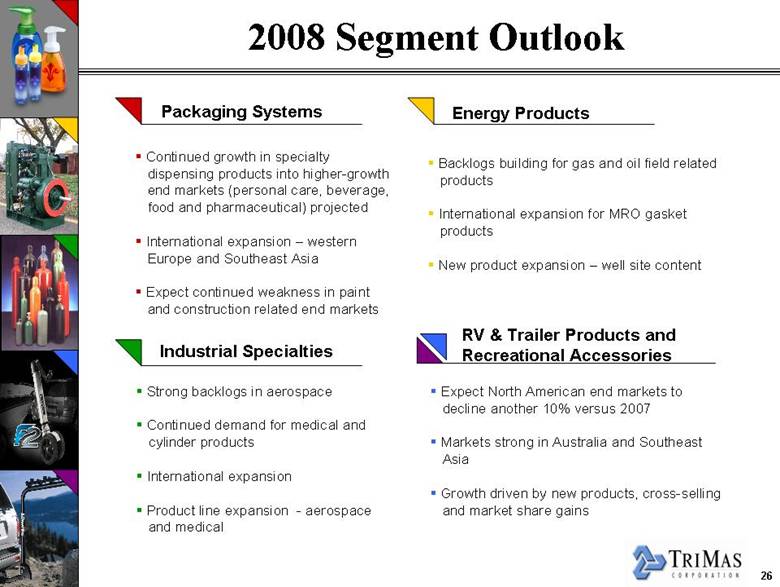
| 26 2008 Segment Outlook Packaging Systems Energy Products Industrial Specialties RV & Trailer Products and Recreational Accessories Continued growth in specialty dispensing products into higher-growth end markets (personal care, beverage, food and pharmaceutical) projected International expansion – western Europe and Southeast Asia Expect continued weakness in paint and construction related end markets Backlogs building for gas and oil field related products International expansion for MRO gasket products New product expansion – well site content Strong backlogs in aerospace Continued demand for medical and cylinder products International expansion Product line expansion - aerospace and medical Expect North American end markets to decline another 10% versus 2007 Markets strong in Australia and Southeast Asia Growth driven by new products, cross-selling and market share gains |
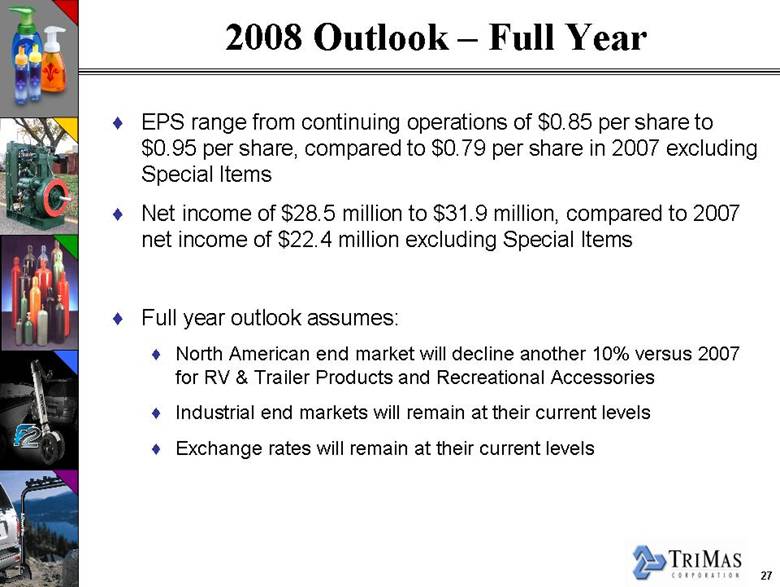
| 27 2008 Outlook – Full Year ·EPS range from continuing operations of $0.85 per share to $0.95 per share, compared to $0.79 per share in 2007 excluding Special Items ·Net income of $28.5 million to $31.9 million, compared to 2007 net income of $22.4 million excluding Special Items ·Full year outlook assumes: ·North American end market will decline another 10% versus 2007 for RV & Trailer Products and Recreational Accessories ·Industrial end markets will remain at their current levels ·Exchange rates will remain at their current levels |
| 28 2008 Outlook – First Quarter ·EPS range from continuing operations of $0.21 per share to $0.24 per share, compared to $0.37 per share during Q1- 2007 ·Net income from continuing operations of $6.9 million to $8.1 million, relatively flat in comparison to net income in Q1-2007 ·Weighted average share count of approximately 33.6 million shares in comparison to approximately 20.8 million shares for the first quarter of 2007 |
| 29 TriMas Initiatives ·Focus on continued organic growth ·Develop new, innovative products for growing end markets – Medical, Specialty Packaging, Aerospace and Energy ·Expand internationally to service existing customers and acquire new customers . Cross-sell product portfolio across customer bases ·Leverage brand positioning to increase market share ·Decrease leverage ·Complete small, targeted acquisitions in growing end markets ·Niche product-based companies ·Leading market positions and strong brand names and margins ·Manage costs and drive operational efficiency |
| Q & A |

| Appendix |
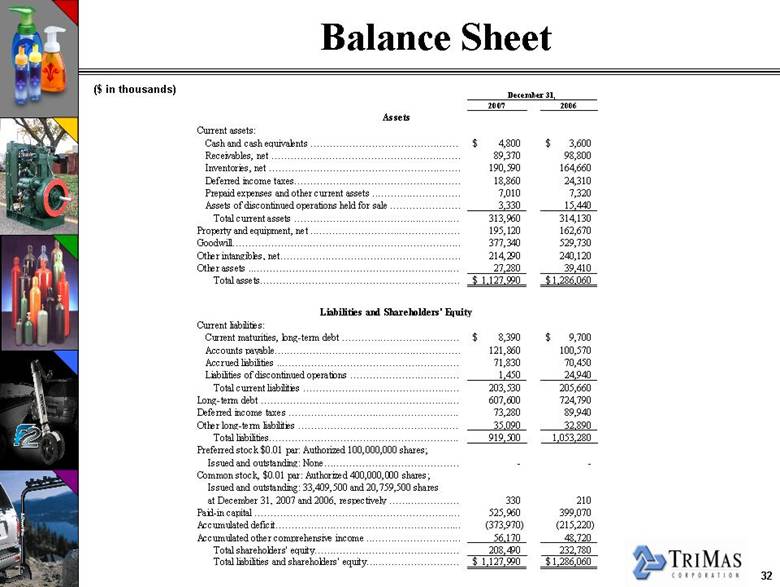
| 32 Balance Sheet ($ in thousands) 2007 2006 Current assets: Cash and cash equivalents 4,800 $ 3,600 $ Receivables, net 89,370 98,800 Inventories, net 190,590 164,660 Deferred income taxes 18,860 24,310 Prepaid expenses and other current assets 7,010 7,320 Assets of discontinued operations held for sale 3,330 15,440 Total current assets 313,960 314,130 Property and equipment, net 195,120 162,670 Goodwill 377,340 529,730 Other intangibles, net 214,290 240,120 Other assets 27,280 39,410 Total assets 1,127,990 $ 1,286,060 $ Current liabilities: Current maturities, long-term debt 8,390 $ 9,700 $ Accounts payable 121,860 100,570 Accrued liabilities 71,830 70,450 Liabilities of discontinued operations 1,450 24,940 Total current liabilities 203,530 205,660 Long-term debt 607,600 724,790 Deferred income taxes 73,280 89,940 Other long-term liabilities 35,090 32,890 Total liabilities 919,500 1,053,280 Preferred stock $0.01 par: Authorized 100,000,000 shares; Issued and outstanding: None - - Common stock, $0.01 par: Authorized 400,000,000 shares; Issued and outstanding: 33,409,500 and 20,759,500 shares at December 31, 2007 and 2006, respectively 330 210 Paid- in capital 525,960 399,070 Accumulated deficit (373,970) (215,220) Accumulated other comprehensive income 56,170 48,720 Total shareholders' equity 208,490 232,780 Total liabilities and shareholders' equity 1,127,990 $ 1,286,060 $ Assets Liabilities and Shareholders' Equity December 31, |
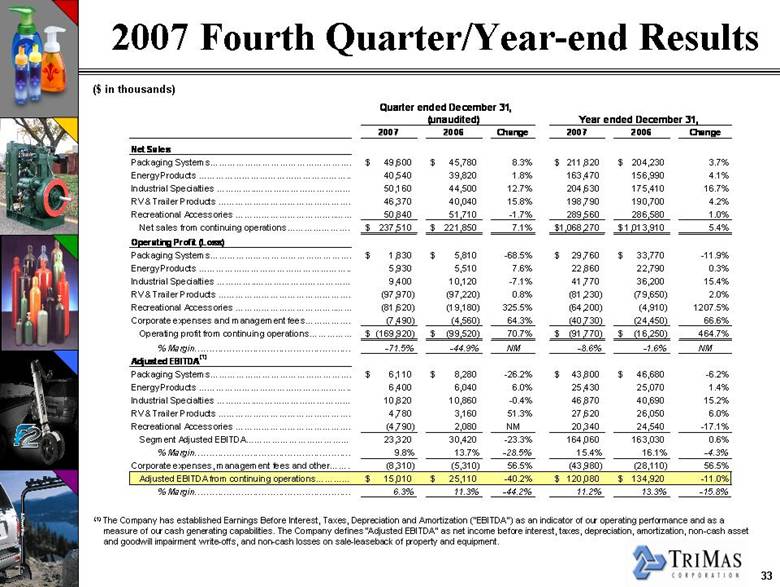
| 33 2007 Fourth Quarter/Year-end Results ($ in thousands) (1) The Company has established Earnings Before Interest, Taxes, Depreciation and Amortization ("EBITDA") as an indicator of our operating performance and as a measure of our cash generating capabilities. The Company defines “Adjusted EBITDA” as net income before interest, taxes, depreciation, amortization, non-cash asset and goodwill impairment write-offs, and non-cash losses on sale-leaseback of property and equipment. (unaudited) 2007 2006 Change 2007 2006 Change Net Sales Packaging Systems 49,600 $ 45,780 $ 8.3% 211,820 $ 204,230 $ 3.7% Energy Products 40,540 39,820 1.8% 163,470 156,990 4.1% Industrial Specialties 50,160 44,500 12.7% 204,630 175,410 16.7% RV & Trailer Products 46,370 40,040 15.8% 198,790 190,700 4.2% Recreational Accessories 50,840 51,710 -1.7% 289,560 286,580 1.0% Net sales from continuing operations 237,510 $ 221,850 $ 7.1% 1,068,270 $ 1,013,910 $ 5.4% Operating Profit (Loss) Packaging Systems 1,830 $ 5,810 $ -68.5% 29,760 $ 33,770 $ -11.9% Energy Products 5,930 5,510 7.6% 22,860 22,790 0.3% Industrial Specialties 9,400 10,120 -7.1% 41,770 36,200 15.4% RV & Trailer Products (97,970) (97,220) 0.8% (81,230) (79,650) 2.0% Recreational Accessories (81,620) (19,180) 325.5% (64,200) (4,910) 1207.5% Corporate expenses and management fees (7,490) (4,560) 64.3% (40,730) (24,450) 66.6% Operating profit from continuing operations (169,920) $ (99,520) $ 70.7% (91,770) $ (16,250) $ 464.7% % Margin -71.5% -44.9% NM -8.6% -1.6% NM Adjusted EBITDA(1) Packaging Systems 6,110 $ 8,280 $ -26.2% 43,800 $ 46,680 $ -6.2% Energy Products 6,400 6,040 6.0% 25,430 25,070 1.4% Industrial Specialties 10,820 10,860 -0.4% 46,870 40,690 15.2% RV & Trailer Products 4,780 3,160 51.3% 27,620 26,050 6.0% Recreational Accessories (4,790) 2,080 NM 20,340 24,540 -17.1% Segment Adjusted EBITDA 23,320 30,420 -23.3% 164,060 163,030 0.6% % Margin 9.8% 13.7% -28.5% 15.4% 16.1% -4.3% Corporate expenses, management fees and other (8,310) (5,310) 56.5% (43,980) (28,110) 56.5% Adjusted EBITDA from continuing operations 15,010 $ 25,110 $ -40.2% 120,080 $ 134,920 $ -11.0% % Margin 6.3% 11.3% -44.2% 11.2% 13.3% -15.8% Quarter ended December 31, Year ended December 31, |
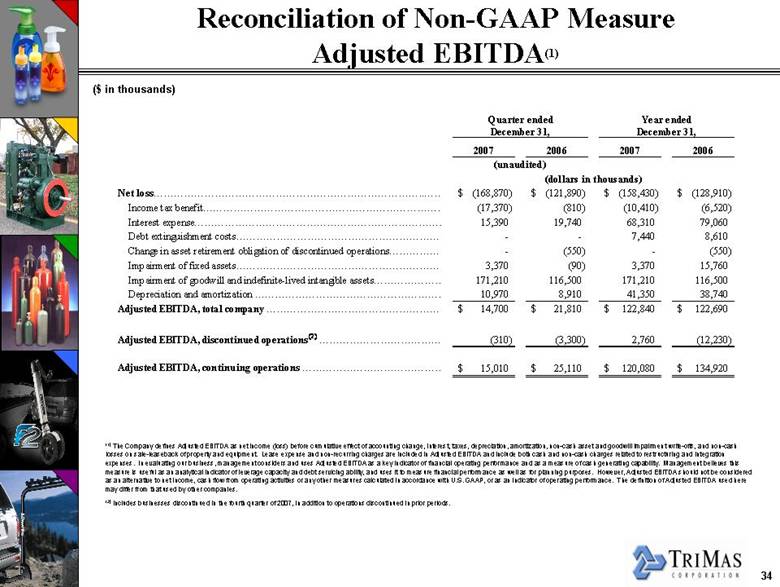
| 34 Reconciliation of Non-GAAP Measure Adjusted EBITDA(1) (1) The Company defines Adjusted EBITDA as net income (loss) before cumulative effect of accounting change, interest, taxes, depreciation, amortization, non-cash asset and goodwill impairment write- offs, and non-cash losses on sale-leaseback of property and equipment Lease expense and non-recurring charges are included in Adjusted EBITDA and include both cash and non-cash charges related to restructuring and integration expenses. In evaluating our business, management considers and uses Adjusted EBITDA as a key indicator of financial operating performance and as a measure of cash generating capability. Management believes this measure is useful as an analytical indicator of leverage capacity and debt servicing ability, and uses it to measure financial performance as well as for planning purposes. However, Adjusted EBITDA should not be considered as an alternative to net income, cash flow from operating activities or any other measures calculated in accordance with U.S. GAAP, or as an indicator of operating performance. The definition of Adjusted EBITDA used here may differ from that used by other companies. Quarter ended Year ended December 31, December 31, 2007 2006 2007 2006 (dollars in thousands) Net loss (168,870) $ (121,890) $ (158,430) $ (128,910) $ Income tax benefit (17,370) (810) (10,410) (6,520) Interest expense 15,390 19,740 68,310 79,060 Debt extinguishment costs - - 7,440 8,610 Change in asset retirement obligation of discontinued operations - (550) - (550) Impairment of fixed assets 3,370 (90) 3,370 15,760 Impairment of goodwill and indefinite-lived intangible assets 171,210 116,500 171,210 116,500 Depreciation and amortization 10,970 8,910 41,350 38,740 Adjusted EBITDA, total company 14,700 $ 21,810 $ 122,840 $ 122,690 $ Adjusted EBITDA, discontinued operations(2) (310) (3,300) 2,760 (12,230) Adjusted EBITDA, continuing operations 15,010 $ 25,110 $ 120,080 $ 134,920 $ (unaudited) (2) Includes businesses discontinued in the fourth quarter of 2007, in addition to operations discontinued in prior periods. ($ in thousands) |
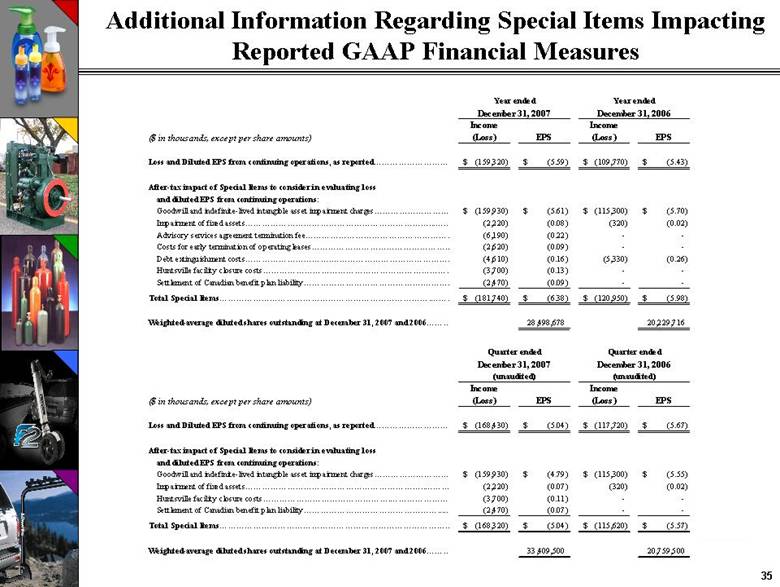
| 35 Additional Information Regarding Special Items Impacting Reported GAAP Financial Measures Year ended Year ended December 31, 2006 ($ in thousands, except per share amounts) Income (Loss) EPS Income (Loss) EPS Loss and Diluted EPS from continuing operations, as reported (159,320) $ (5.59) $ (109,770) $ (5.43) $ After-tax impact of Special Items to consider in evaluating loss and diluted EPS from continuing operations: Goodwill and indefinite-lived intangible asset impairment charges (159,930) $ (5.61) $ (115,300) $ (5.70) $ Impairment of fixed assets (2,220) (0.08) (320) (0.02) Advisory services agreement termination fee (6,190) (0.22) - - Costs for early termination of operating leases (2,620) (0.09) - - Debt extinguishment costs (4,610) (0.16) (5,330) (0.26) Huntsville facility closure costs (3,700) (0.13) - - Settlement of Canadian benefit plan liability (2,470) (0.09) - - Total Special Items (181,740) $ (6.38) $ (120,950) $ (5.98) $ Weighted-average diluted shares outstanding at December 31, 2007 and 2006 28,498,678 20,229,716 December 31, 2007 December 31, 2006 ($ in thousands, except per share amounts) Income (Loss) EPS Income (Loss) EPS Loss and Diluted EPS from continuing operations, as reported (168,430) $ (5.04) $ (117,720) $ (5.67) $ After-tax impact of Special Items to consider in evaluating loss and diluted EPS from continuing operations: Goodwill and indefinite-lived intangible asset impairment charges (159,930) $ (4.79) $ (115,300) $ (5.55) $ Impairment of fixed assets (2,220) (0.07) (320) (0.02) Huntsville facility closure costs (3,700) (0.11) - - Settlement of Canadian benefit plan liability (2,470) (0.07) - - Total Special Items (168,320) $ (5.04) $ (115,620) $ (5.57) $ Weighted-average diluted shares outstanding at December 31, 2007 and 2006 33,409,500 20,759,500 December 31, 2007 Quarter ended (unaudited) Quarter ended (unaudited) |
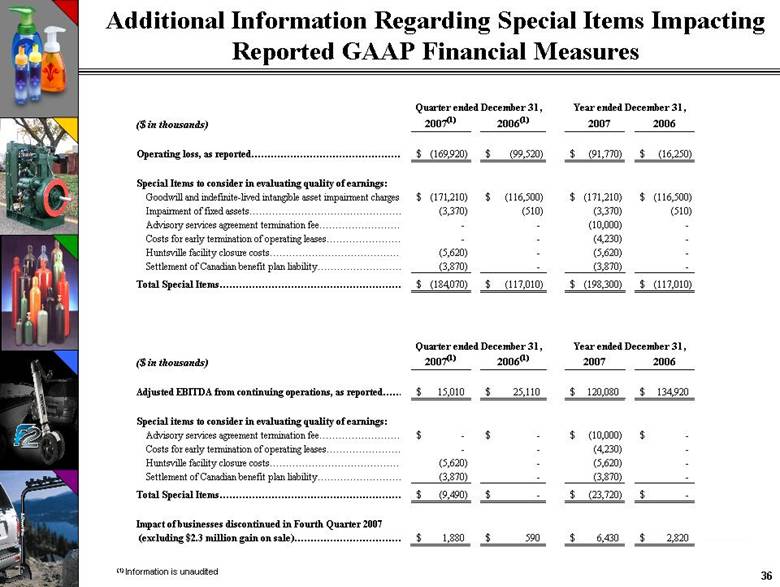
| 36 Additional Information Regarding Special Items Impacting Reported GAAP Financial Measures Year ended December 31, ($ in thousands) 2007(1) 2006(1) 2007 2006 Operating loss, as reported (169,920) $ (99,520) $ (91,770) $ (16,250) $ Special Items to consider in evaluating quality of earnings: Goodwill and indefinite-lived intangible asset impairment charges (171,210) $ (116,500) $ (171,210) $ (116,500) $ Impairment of fixed assets (3,370) (510) (3,370) (510) Advisory services agreement termination fee - - (10,000) - Costs for early termination of operating leases - - (4,230) - Huntsville facility closure costs (5,620) - (5,620) - Settlement of Canadian benefit plan liability (3,870) - (3,870) - Total Special Items (184,070) $ (117,010) $ (198,300) $ (117,010) $ ($ in thousands) 2007(1) 2006(1) 2007 2006 Adjusted EBITDA from continuing operations, as reported 15,010 $ 25,110 $ 120,080 $ 134,920 $ Special items to consider in evaluating quality of earnings: Advisory services agreement termination fee - $ - $ (10,000) $ - $ Costs for early termination of operating leases - - (4,230) - Huntsville facility closure costs (5,620) - (5,620) - Settlement of Canadian benefit plan liability (3,870) - (3,870) - Total Special Items (9,490) $ - $ (23,720) $ - $ Impact of businesses discontinued in Fourth Quarter 2007 (excluding $2.3 million gain on sale ) 1,880 $ 590 $ 6,430 $ 2,820 $ Quarter ended December 31, Year ended December 31, Quarter ended December 31, (1) Information is unaudited |
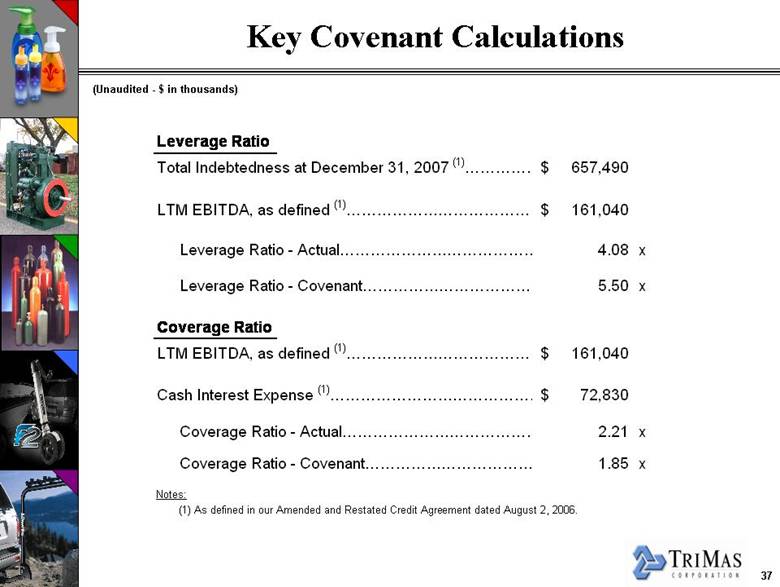
| 37 (Unaudited - $ in thousands) Key Covenant Calculations Leverage Ratio Total Indebtedness at December 31, 2007 (1) 657,490 $ LTM EBITDA, as defined (1) 161,040 $ Leverage Ratio - Actual 4.08 X Leverage Ratio - Covenant 5.50 X Coverage Ratio LTM EBITDA, as defined (1) 161,040 $ Cash Interest Expense (1) 72,830 $ Coverage Ratio - Actual 2.21 X Coverage Ratio - Covenant 1.85 X Notes: (1) As defined in our Amended and Restated Credit Agreement dated August 2, 2006. |
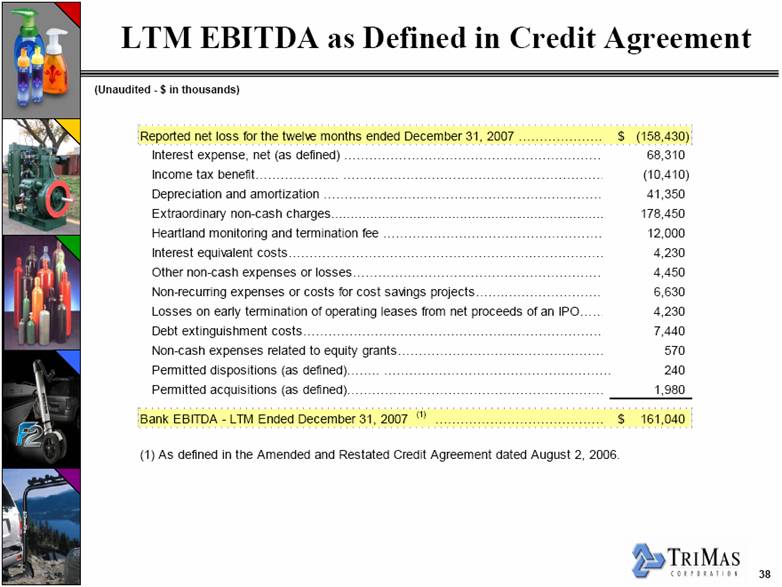
| 38 (Unaudited - $ in thousands) LTM EBITDA as Defined in Credit Agreement Reported net loss for the twelve months ended December 31, 2007 (158,430) $ Interest expense, net (as defined) 68,310 Income tax benefit (10,410) Depreciation and amortization 41,350 Extraordinary non-cash charges 178,450 Heartland monitoring and termination fee 12,000 Interest equivalent costs 4,230 Other non-cash expenses or losses 4,450 Non-recurring expenses or costs for cost savings projects 6,630 Losses on early termination of operating leases from net proceeds of an IPO 4,230 Debt extinguishment costs 7,440 Non-cash expenses related to equity grants 570 Permitted dispositions (as defined) 240 Permitted acquisitions (as defined) 1,980 Bank EBITDA - LTM Ended December 31, 2007 (1) 161,040 $ (1) As defined in the Amended and Restated Credit Agreement dated August 2, 2006. |