Exhibit 99.1
| TriMas Analyst Day NASDAQ MarketSite • May 13, 2010 |
| Safe Harbor Statement Any “forward-looking” statements contained herein, including those relating to market conditions or the Company’s financial condition and results, expense reductions, liquidity expectations, business goals and sales growth, involve risks and uncertainties, including, but not limited to, risks and uncertainties with respect to general economic and currency conditions, various conditions specific to the Company’s business and industry, the Company’s substantial leverage, liabilities imposed by the Company’s debt instruments, market demand, competitive factors, the Company’s ability to maintain compliance with the listing requirements of NASDAQ, supply constraints, material and energy costs, technology factors, litigation, government and regulatory actions, the Company’s accounting policies, future trends, and other risks which are detailed in the Company’s Annual Report on Form 10-K for the fiscal year ending December 31, 2009, and in the Company’s Quarterly Reports on Form 10-Q. These risks and uncertainties may cause actual results to differ materially from those indicated by the forward-looking statements. All forward-looking statements made herein are based on information currently available, and the Company assumes no obligation to update any forward-looking statements. |
| 3 Agenda 8:00 AM – 8:45 AM Registration and Continental Breakfast 8:45 AM – 9:00 AM Welcome and TriMas Vision: Dave Wathen, TriMas President & CEO 9:00 AM – 10:00 AM Growth Strategy Presentations: Various Businesses Packaging – Rieke: Lynn Brooks, President Aerospace & Defense – Monogram Aerospace: Dave Wathen, TriMas President & CEO Energy – Arrow Engine: Len Tuner, President 10:00 AM – 10:15 AM Break 10:15 AM – 10:35 AM Growth Strategy Presentations: Various Businesses (Continued) Energy – Lamons: Kurt Allen, President 10:35 AM – 10:55 AM Growth Strategy Q&A 10:55 AM – 11:00 AM Break 11:00 AM – 11:45 AM Productivity Panel Mark Zeffiro, TriMas CFO • Tom Aepelbacher, VP Global Sourcing • Tom Benson, President – Cequent Performance Products • John Aleva, President – Cequent Consumer Products • Jerry VanAuken, President – Norris Cylinder • Eli Crotzer, President – Precision Tool Company & Hi-Vol 11:45 AM – 12:00 PM TriMas Value Proposition: Mark Zeffiro, TriMas CFO 12:00 PM – 12:30 PM Q & A 12:30 PM Closing Remarks & Lunch with Management: Dave Wathen, TriMas President & CEO |
| Welcome and TriMas Vision Dave Wathen • President & CEO |
| TriMas • Key Messages Collection of diverse businesses with common characteristics Highly-engineered products serving defensible, focused markets TriMas Operating Model is working well and delivering results Strong continuous productivity – used to fund growth, drive additional productivity, enhance margin, generate cash and offset inflation Many small, well-managed growth programs add up to on-going incremental revenue Business units managed by experienced leaders and industry experts Focused on continually enhancing stakeholder value. |
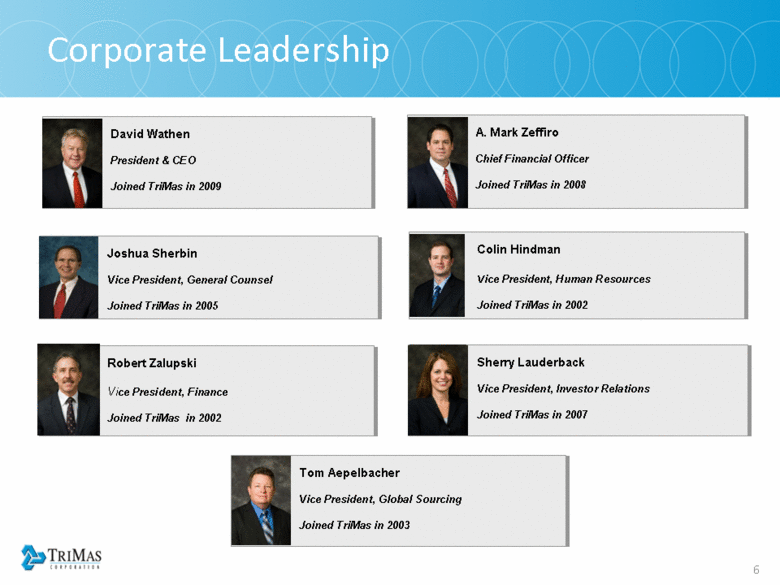
| David Wathen President & CEO Joined TriMas in 2009 A. Mark Zeffiro Chief Financial Officer Joined TriMas in 2008 Colin Hindman Vice President, Human Resources Joined TriMas in 2002 Corporate Leadership Tom Aepelbacher Vice President, Global Sourcing Joined TriMas in 2003 Robert Zalupski Vice President, Finance Joined TriMas in 2002 Sherry Lauderback Vice President, Investor Relations Joined TriMas in 2007 Joshua Sherbin Vice President, General Counsel Joined TriMas in 2005 |
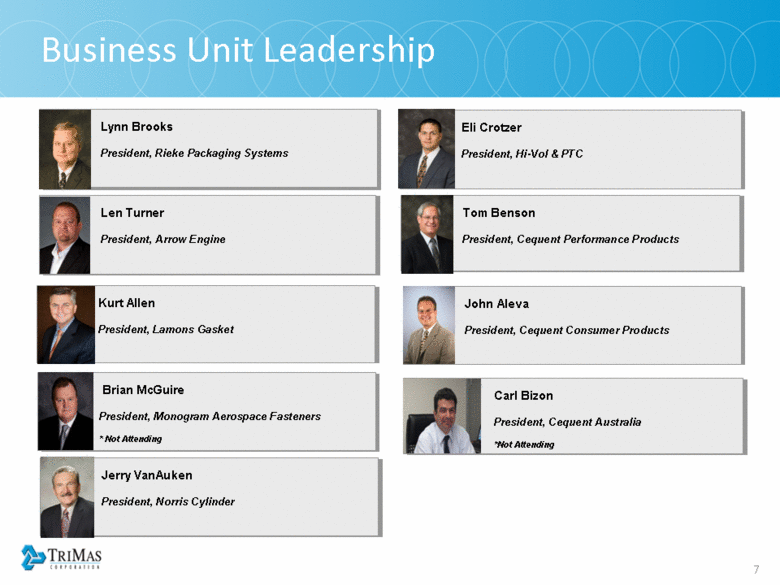
| Len Turner President, Arrow Engine Eli Crotzer President, Hi-Vol & PTC Business Unit Leadership Lynn Brooks President, Rieke Packaging Systems Kurt Allen President, Lamons Gasket Jerry VanAuken President, Norris Cylinder Brian McGuire President, Monogram Aerospace Fasteners * Not Attending Carl Bizon President, Cequent Australia *Not Attending Tom Benson President, Cequent Performance Products John Aleva President, Cequent Consumer Products |
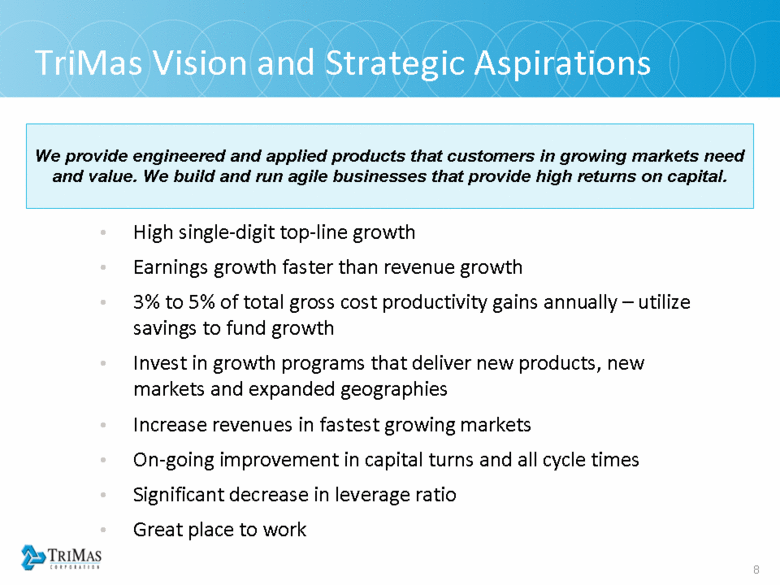
| TriMas Vision and Strategic Aspirations We provide engineered and applied products that customers in growing markets need and value. We build and run agile businesses that provide high returns on capital. High single-digit top-line growth Earnings growth faster than revenue growth 3% to 5% of total gross cost productivity gains annually – utilize savings to fund growth Invest in growth programs that deliver new products, new markets and expanded geographies Increase revenues in fastest growing markets On-going improvement in capital turns and all cycle times Significant decrease in leverage ratio Great place to work |
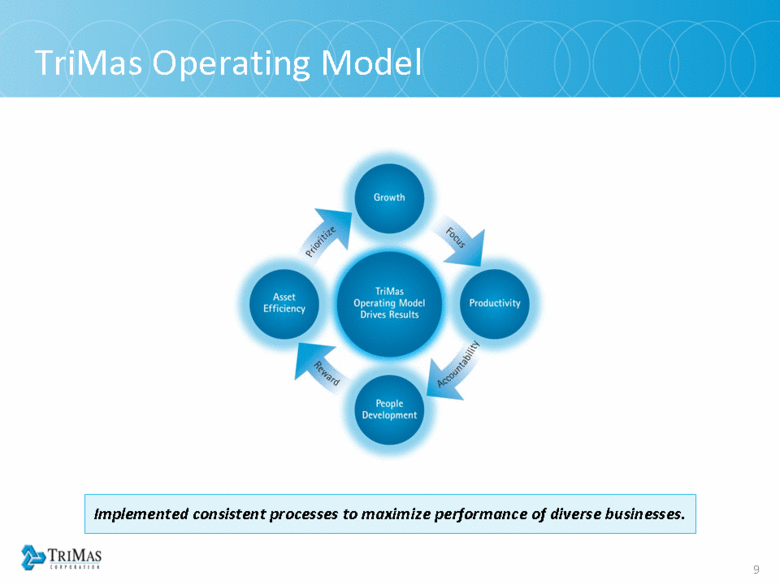
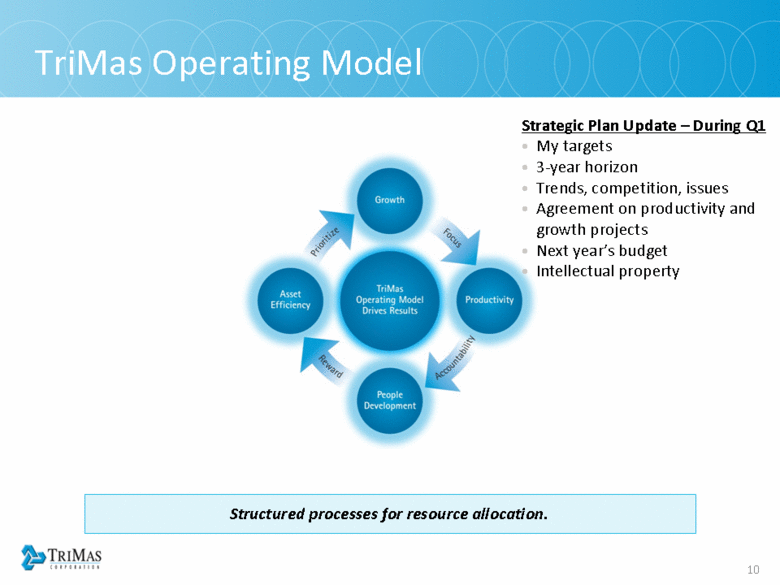
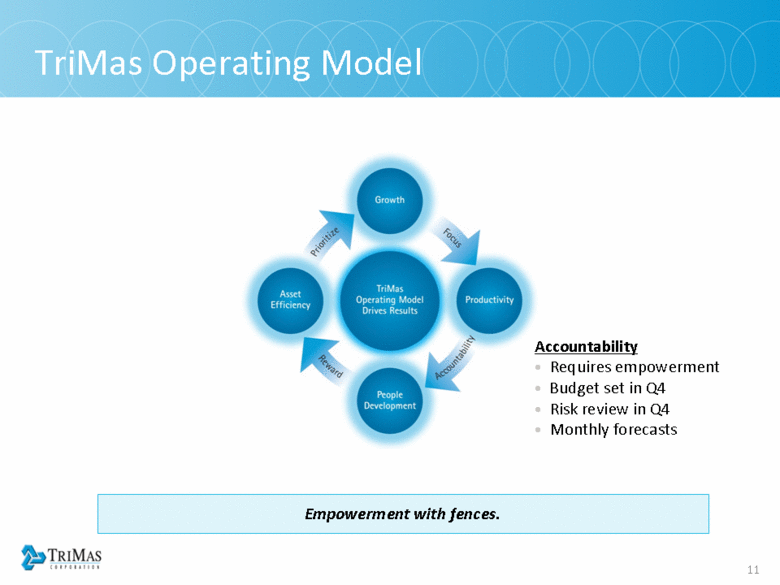
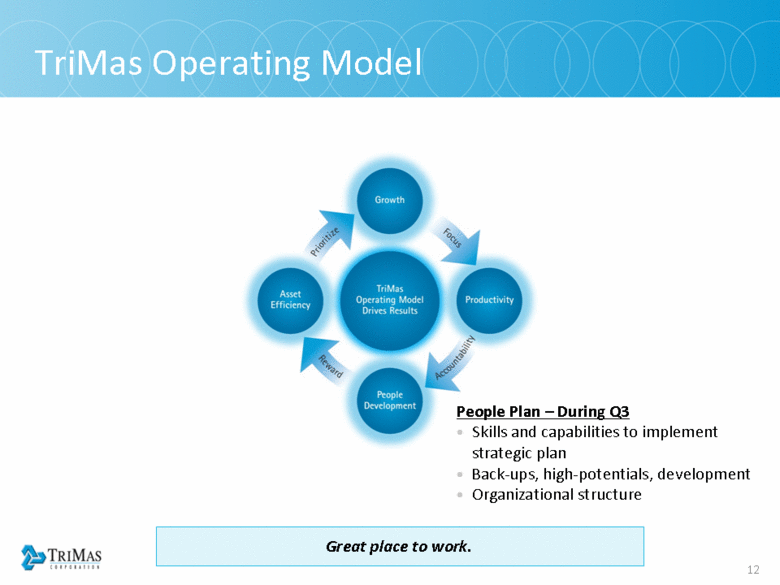
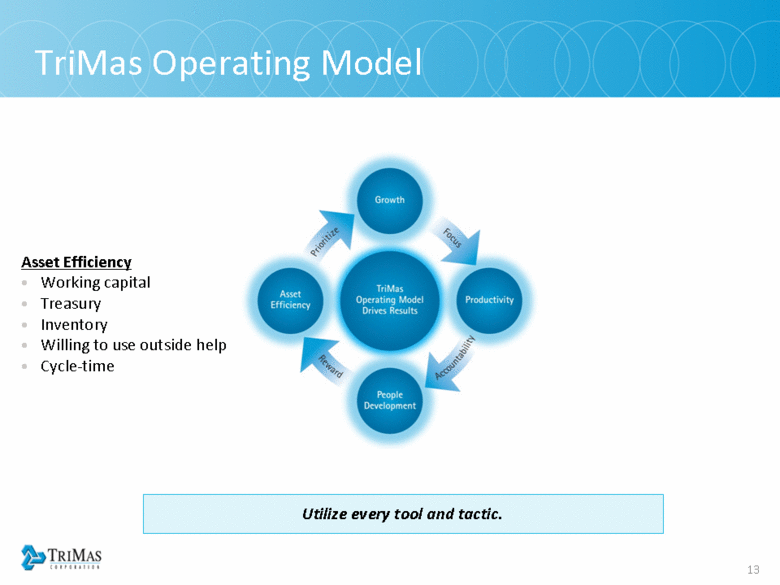
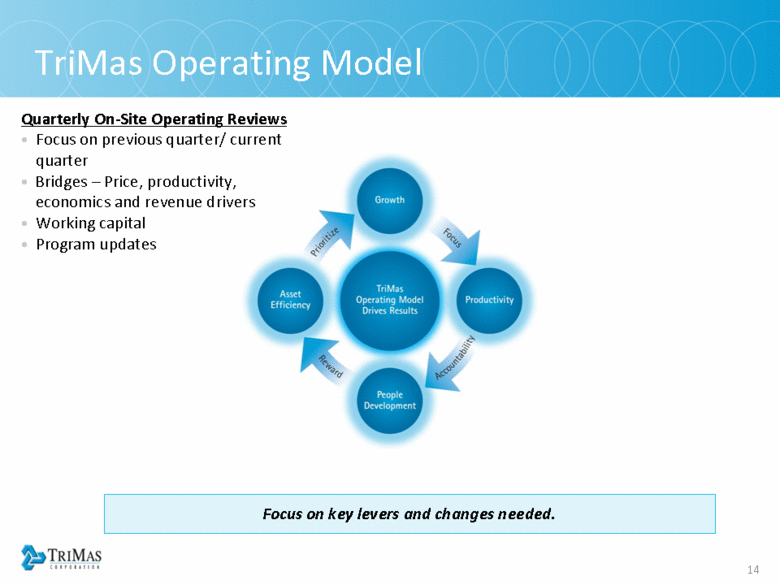
| TriMas Operating Model Implemented consistent processes to maximize performance of diverse businesses. |
| TriMas Operating Model Strategic Plan Update – During Q1 My targets 3-year horizon Trends, competition, issues Agreement on productivity and growth projects Next year’s budget Intellectual property Structured processes for resource allocation. |
| TriMas Operating Model Accountability Requires empowerment Budget set in Q4 Risk review in Q4 Monthly forecasts Empowerment with fences. |
| TriMas Operating Model People Plan – During Q3 Skills and capabilities to implement strategic plan Back-ups, high-potentials, development Organizational structure Great place to work. |
| TriMas Operating Model Utilize every tool and tactic. Asset Efficiency Working capital Treasury Inventory Willing to use outside help Cycle-time |
| TriMas Operating Model Focus on key levers and changes needed. Quarterly On-Site Operating Reviews Focus on previous quarter/ current quarter Bridges – Price, productivity, economics and revenue drivers Working capital Program updates |
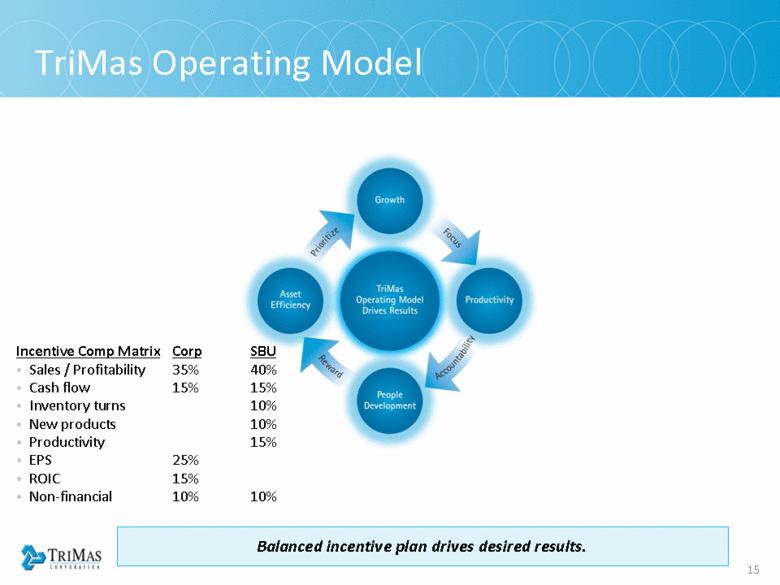
| TriMas Operating Model Balanced incentive plan drives desired results. Incentive Comp Matrix Corp SBU Sales / Profitability 35% 40% Cash flow 15% 15% Inventory turns 10% New products 10% Productivity 15% EPS 25% ROIC 15% Non-financial 10% 10% |
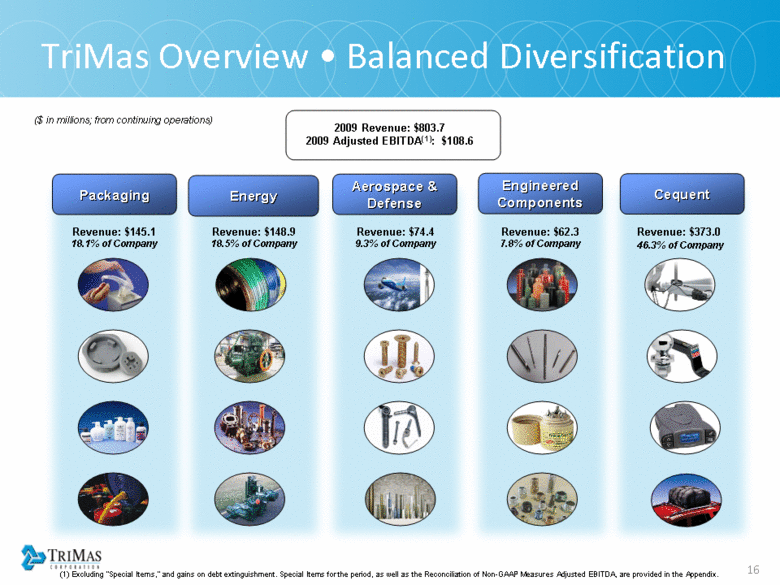
| Cequent Engineered Components Revenue: $74.4 9.3% of Company Aerospace & Defense Energy Packaging Revenue: $148.9 18.5% of Company Revenue: $145.1 18.1% of Company Revenue: $62.3 7.8% of Company Revenue: $373.0 46.3% of Company ($ in millions; from continuing operations) 2009 Revenue: $803.7 2009 Adjusted EBITDA(1): $108.6 TriMas Overview • Balanced Diversification (1) Excluding “Special Items,” and gains on debt extinguishment. Special Items for the period, as well as the Reconciliation of Non-GAAP Measures Adjusted EBITDA, are provided in the Appendix. |
| TriMas • Common Business Characteristics Leaders in very defined and defensible markets Strong brands, full product lines – customers know and need us Difficult to design and produce products Expert, experienced management teams Multiple growth programs underway and staged Multiple productivity projects underway and staged Same incentive plan across management teams Growth upside in non-U.S. markets Productivity upside in material and sourcing |
| Packaging – Rieke Packaging Systems Lynn Brooks • President |
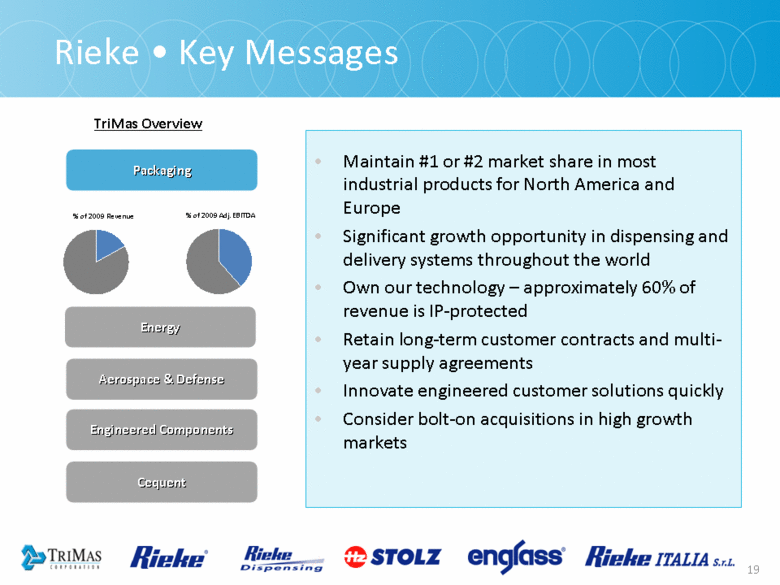
| Rieke • Key Messages Maintain #1 or #2 market share in most industrial products for North America and Europe Significant growth opportunity in dispensing and delivery systems throughout the world Own our technology – approximately 60% of revenue is IP-protected Retain long-term customer contracts and multi-year supply agreements Innovate engineered customer solutions quickly Consider bolt-on acquisitions in high growth markets TriMas Overview Engineered Components Aerospace & Defense Energy Packaging % of 2009 Revenue % of 2009 Adj. EBITDA Cequent |
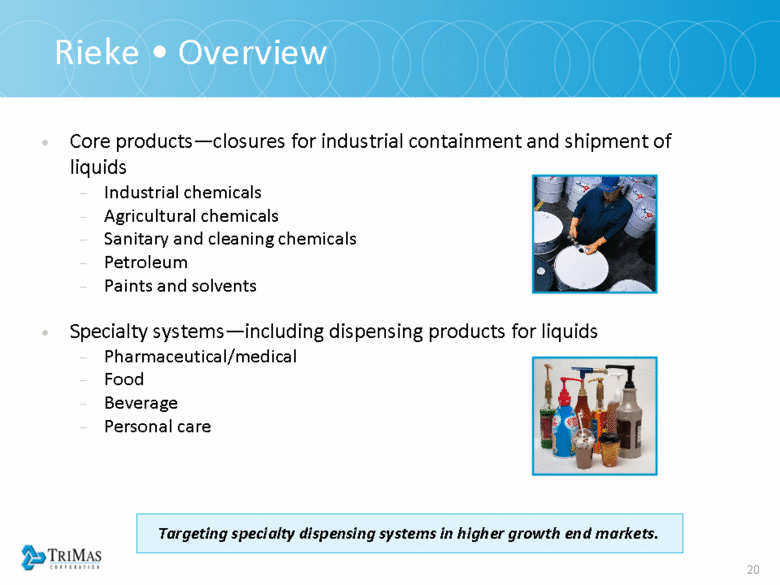
| Rieke • Overview Targeting specialty dispensing systems in higher growth end markets. Core products—closures for industrial containment and shipment of liquids Industrial chemicals Agricultural chemicals Sanitary and cleaning chemicals Petroleum Paints and solvents Specialty systems—including dispensing products for liquids Pharmaceutical/medical Food Beverage Personal care |
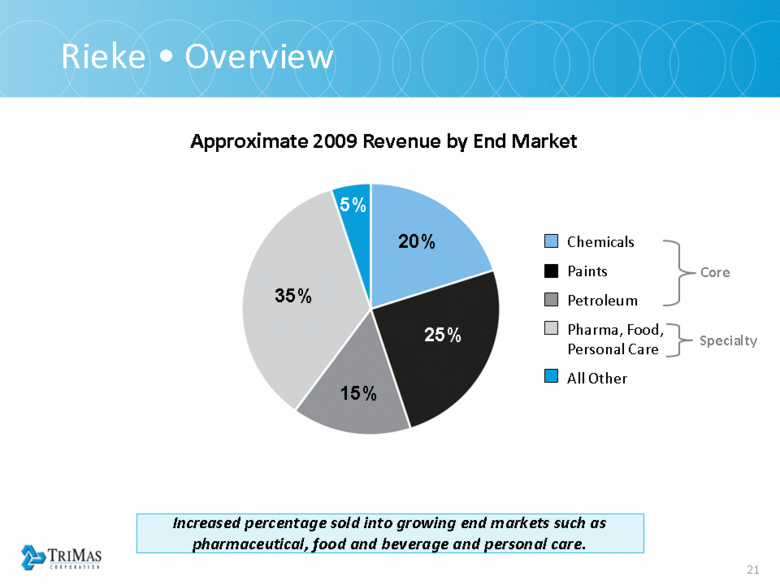
| Rieke • Overview Increased percentage sold into growing end markets such as pharmaceutical, food and beverage and personal care. Chemicals Paints Petroleum Pharma, Food, Personal Care All Other 20% 25% 15% 35% 5% Approximate 2009 Revenue by End Market Core Specialty |
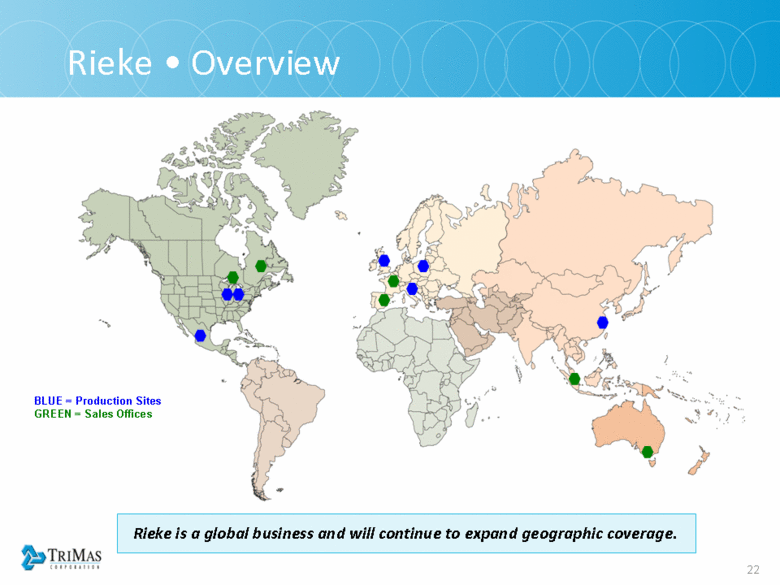
| BLUE = Production Sites GREEN = Sales Offices Rieke • Overview Rieke is a global business and will continue to expand geographic coverage. |
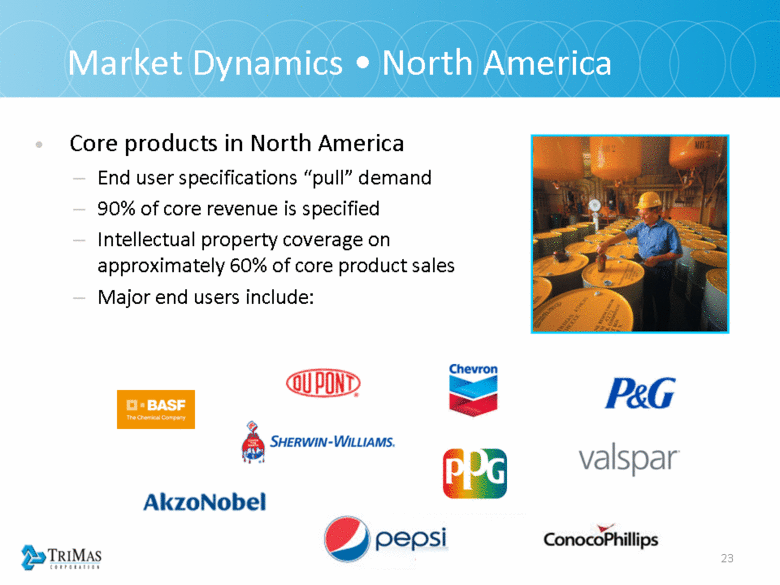
| 23 Market Dynamics • North America Core products in North America End user specifications “pull” demand 90% of core revenue is specified Intellectual property coverage on approximately 60% of core product sales Major end users include: |
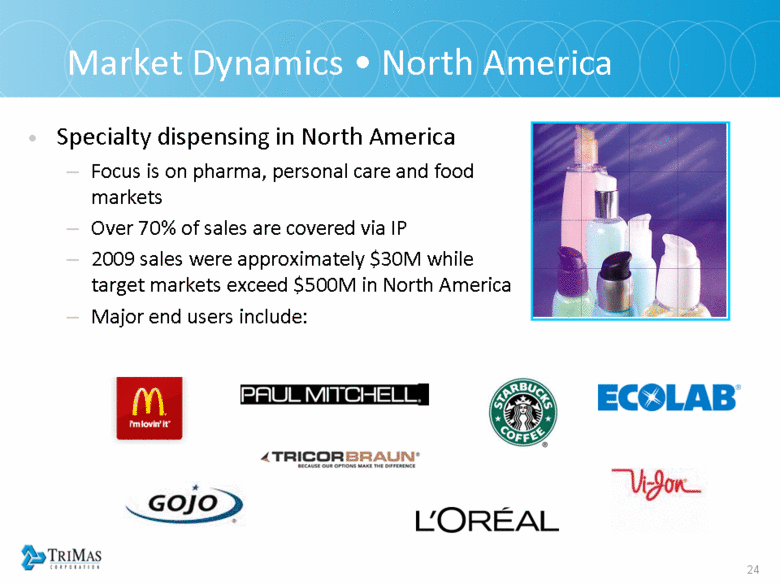
| Market Dynamics • North America Specialty dispensing in North America Focus is on pharma, personal care and food markets Over 70% of sales are covered via IP 2009 sales were approximately $30M while target markets exceed $500M in North America Major end users include: |
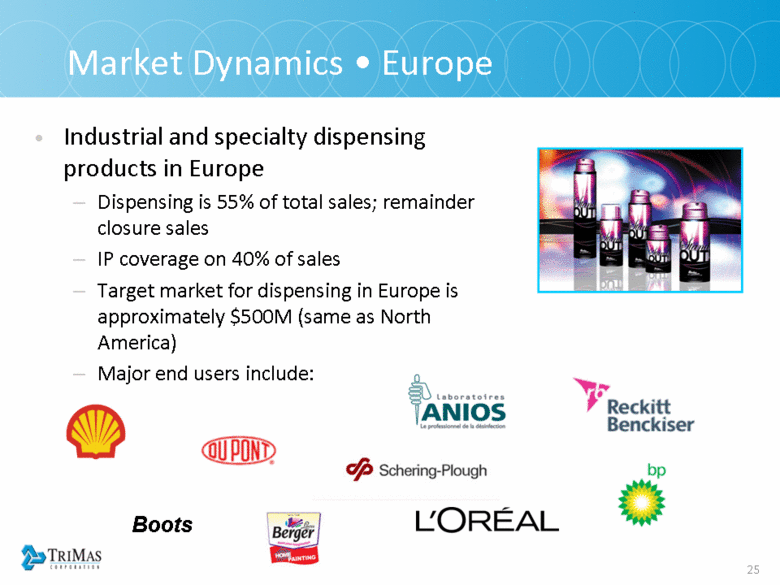
| Market Dynamics • Europe Industrial and specialty dispensing products in Europe Dispensing is 55% of total sales; remainder closure sales IP coverage on 40% of sales Target market for dispensing in Europe is approximately $500M (same as North America) Major end users include: Boots |
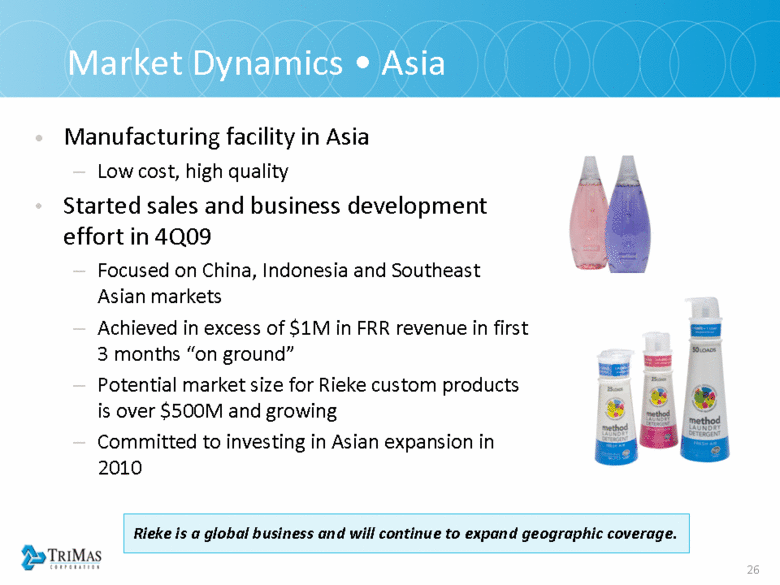
| Market Dynamics • Asia Manufacturing facility in Asia Low cost, high quality Started sales and business development effort in 4Q09 Focused on China, Indonesia and Southeast Asian markets Achieved in excess of $1M in FRR revenue in first 3 months “on ground” Potential market size for Rieke custom products is over $500M and growing Committed to investing in Asian expansion in 2010 Rieke is a global business and will continue to expand geographic coverage. |
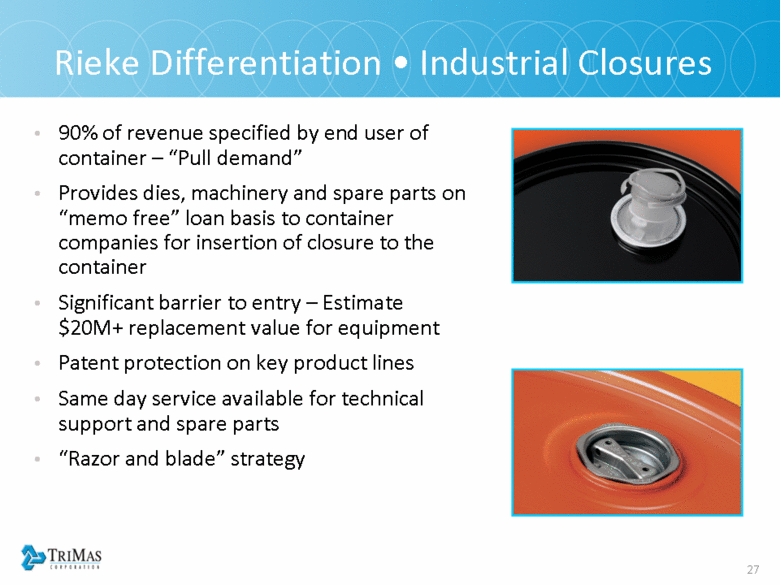
| 90% of revenue specified by end user of container – “Pull demand” Provides dies, machinery and spare parts on “memo free” loan basis to container companies for insertion of closure to the container Significant barrier to entry – Estimate $20M+ replacement value for equipment Patent protection on key product lines Same day service available for technical support and spare parts “Razor and blade” strategy Rieke Differentiation • Industrial Closures |
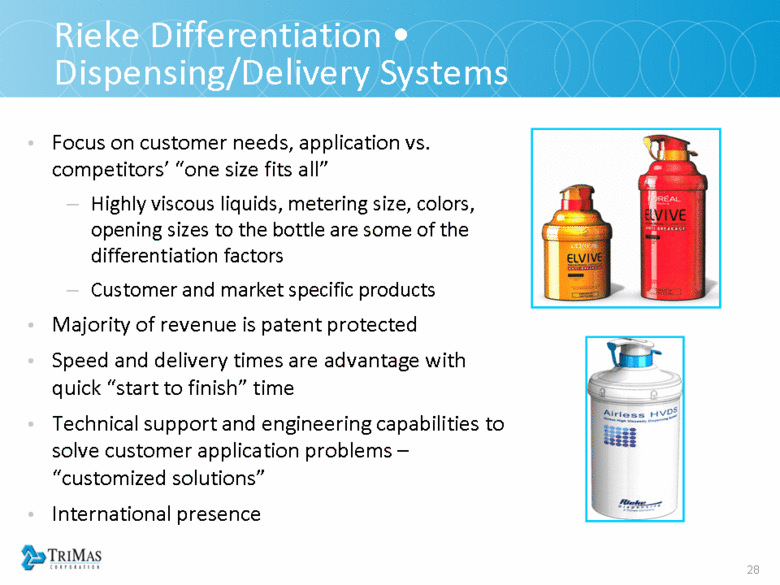
| Focus on customer needs, application vs. competitors’ “one size fits all” Highly viscous liquids, metering size, colors, opening sizes to the bottle are some of the differentiation factors Customer and market specific products Majority of revenue is patent protected Speed and delivery times are advantage with quick “start to finish” time Technical support and engineering capabilities to solve customer application problems –“customized solutions” International presence Rieke Differentiation • Dispensing/Delivery Systems |
| Rieke • Growth Strategy Plan in place with identified target customer, markets and regions. Focus new product development on growing markets Pharmaceutical Food and beverage Personal care Medical Focus on Asian market and begin to cultivate other geographic opportunities Transact bolt-on acquisitions that serve the growing markets Continue to grow in niche market areas Ensure new products continue to have barriers to entry Maintain market share of key core (industrial) products |
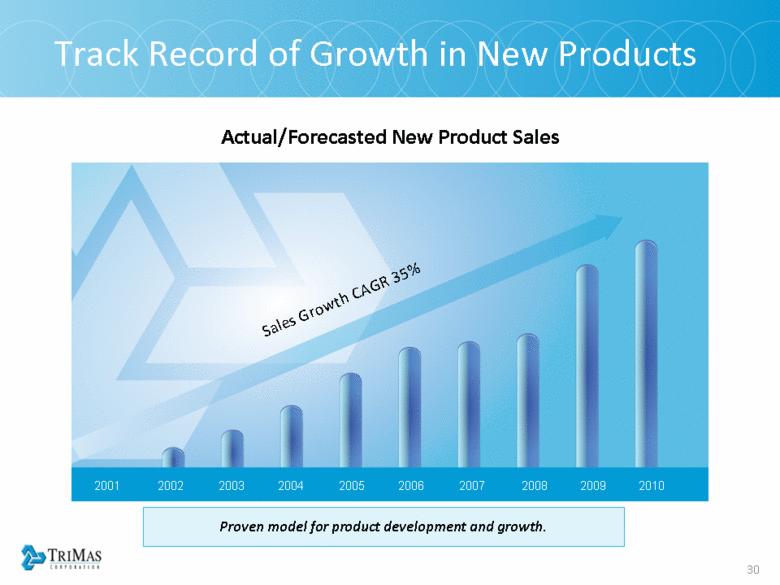
| Actual/Forecasted New Product Sales Proven model for product development and growth. Track Record of Growth in New Products Sales Growth CAGR 35% 2001 2002 2003 2004 2005 2006 2007 2008 2009 2010 |
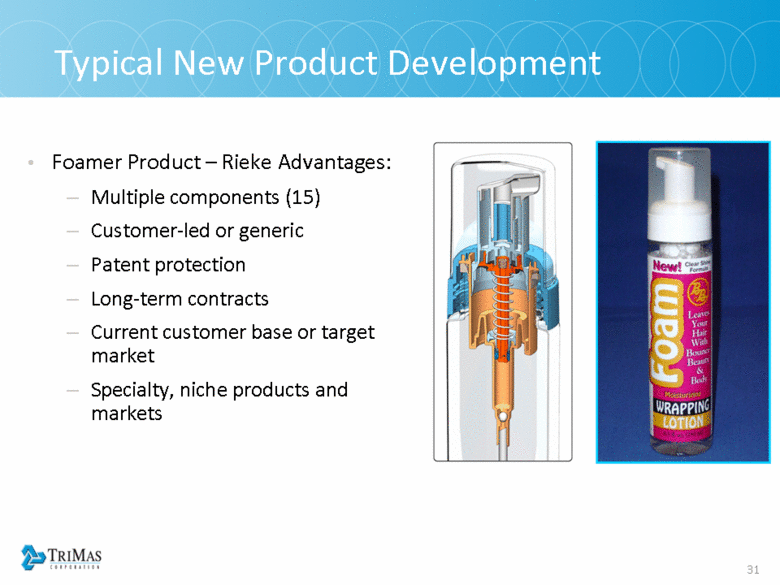
| Foamer Product – Rieke Advantages: Multiple components (15) Customer-led or generic Patent protection Long-term contracts Current customer base or target market Specialty, niche products and markets Typical New Product Development |
| Rieke • Key Messages Maintain #1 or #2 market share in most industrial products for North America and Europe Significant growth opportunity in dispensing and delivery systems throughout the world Own our technology – approximately 60% of revenue is IP-protected Retain long-term customer contracts and multi-year supply agreements Innovate engineered customer solutions quickly Consider bolt-on acquisitions in high growth markets |
| Aerospace & Defense – Monogram Aerospace Dave Wathen • TriMas President & CEO |
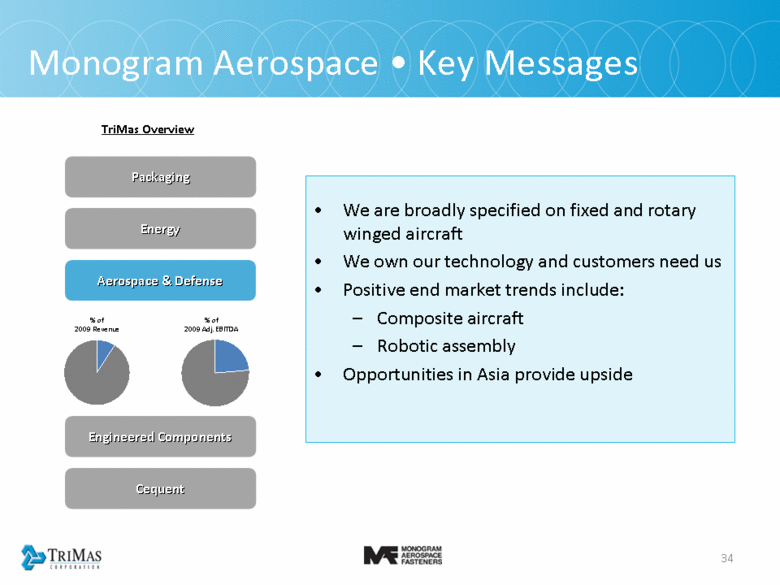
| 34 Monogram Aerospace • Key Messages TriMas Overview Packaging Engineered Components Energy Aerospace & Defense % of 2009 Revenue % of 2009 Adj. EBITDA Cequent We are broadly specified on fixed and rotary winged aircraft We own our technology and customers need us Positive end market trends include: Composite aircraft Robotic assembly Opportunities in Asia provide upside |
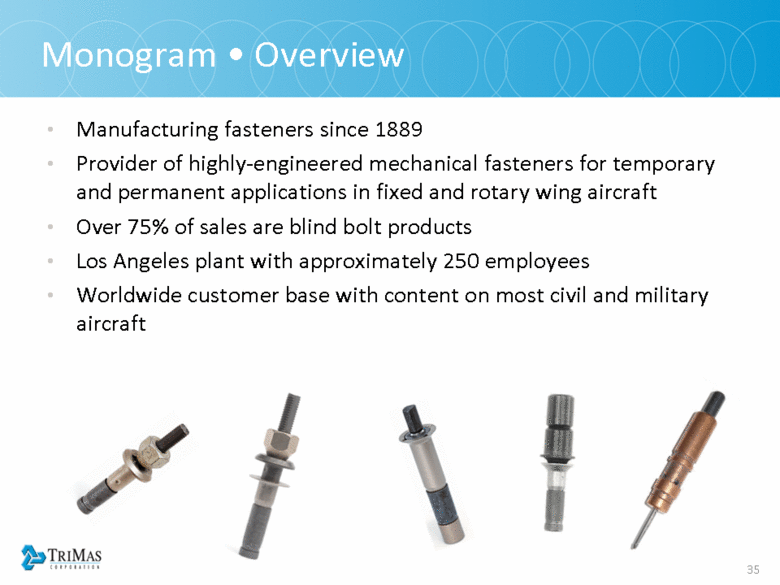
| Monogram • Overview Manufacturing fasteners since 1889 Provider of highly-engineered mechanical fasteners for temporary and permanent applications in fixed and rotary wing aircraft Over 75% of sales are blind bolt products Los Angeles plant with approximately 250 employees Worldwide customer base with content on most civil and military aircraft |
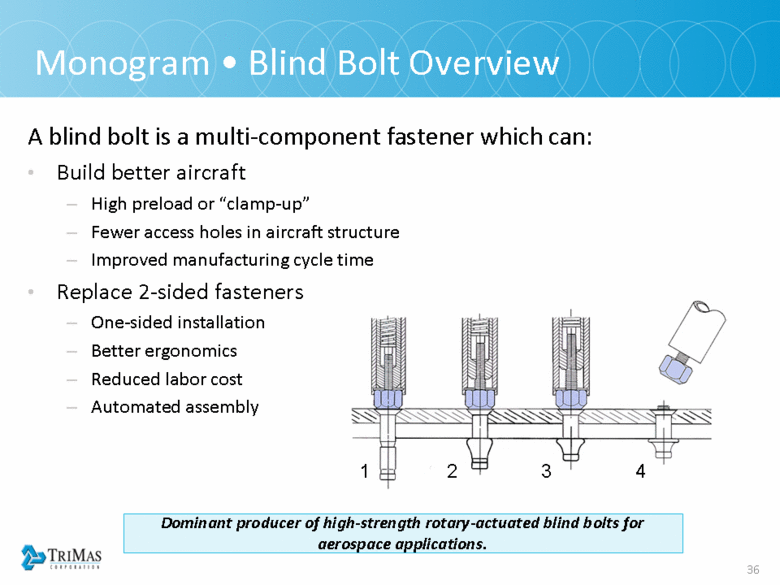
| A blind bolt is a multi-component fastener which can: Build better aircraft High preload or “clamp-up” Fewer access holes in aircraft structure Improved manufacturing cycle time Replace 2-sided fasteners One-sided installation Better ergonomics Reduced labor cost Automated assembly Monogram • Blind Bolt Overview 1 3 2 4 Dominant producer of high-strength rotary-actuated blind bolts for aerospace applications. |
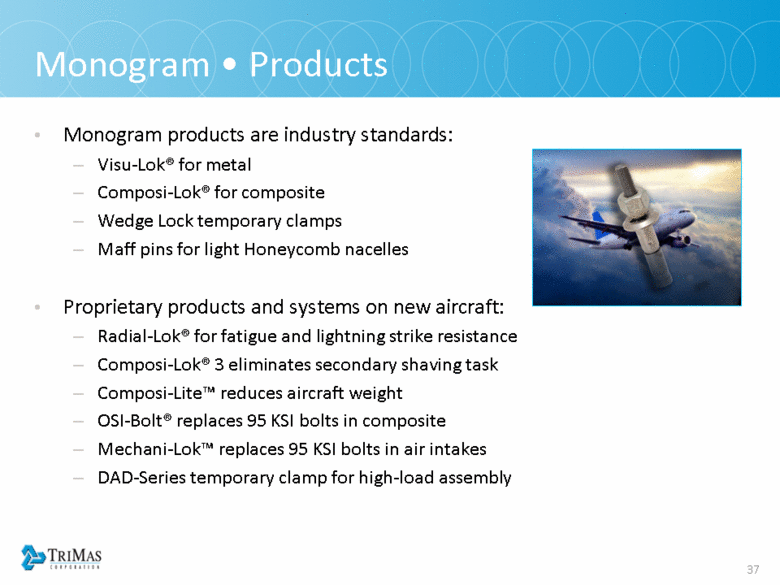
| Monogram • Products Monogram products are industry standards: Visu-Lok® for metal Composi-Lok® for composite Wedge Lock temporary clamps Maff pins for light Honeycomb nacelles Proprietary products and systems on new aircraft: Radial-Lok® for fatigue and lightning strike resistance Composi-Lok® 3 eliminates secondary shaving task Composi-Lite™ reduces aircraft weight OSI-Bolt® replaces 95 KSI bolts in composite Mechani-Lok™ replaces 95 KSI bolts in air intakes DAD-Series temporary clamp for high-load assembly |
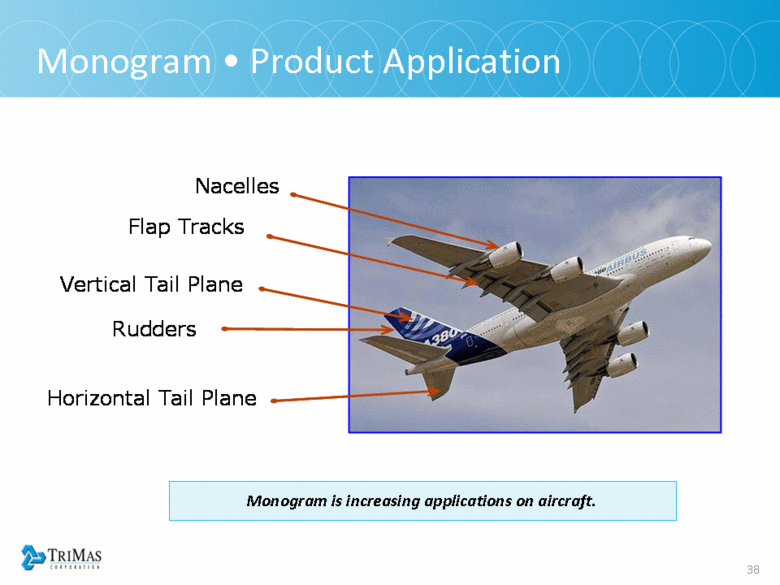
| Monogram • Product Application Monogram is increasing applications on aircraft. Vertical Tail Plane Flap Tracks Horizontal Tail Plane Nacelles Rudders |
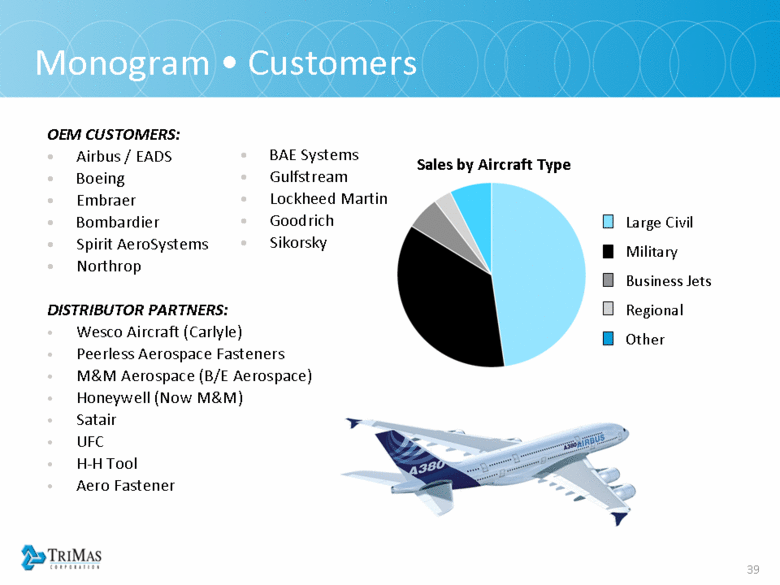
| Monogram • Customers OEM CUSTOMERS: Airbus / EADS Boeing Embraer Bombardier Spirit AeroSystems Northrop DISTRIBUTOR PARTNERS: Wesco Aircraft (Carlyle) Peerless Aerospace Fasteners M&M Aerospace (B/E Aerospace) Honeywell (Now M&M) Satair UFC H-H Tool Aero Fastener OEM CUSTOMERS: BAE Systems Gulfstream Lockheed Martin Goodrich Sikorsky Sales by Aircraft Type Large Civil Military Business Jets Regional Other |
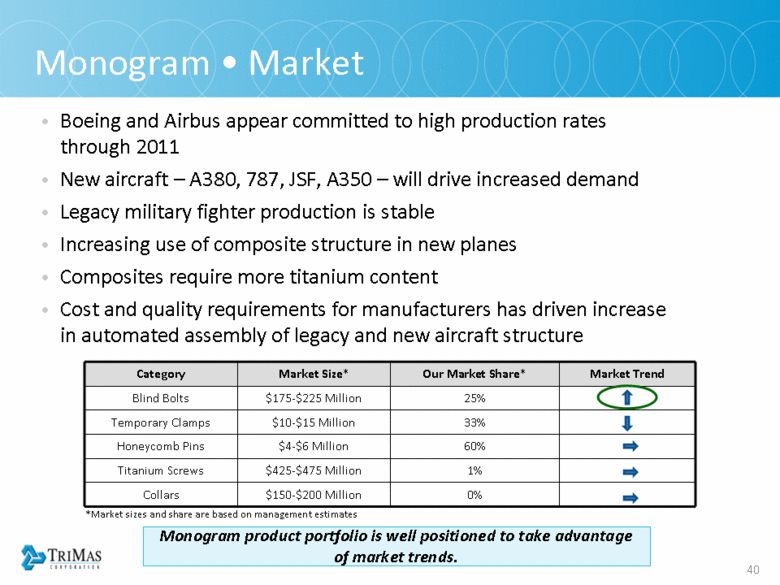
| Category Market Size* Our Market Share* Market Trend Blind Bolts $175-$225 Million 25% Temporary Clamps $10-$15 Million 33% Honeycomb Pins $4-$6 Million 60% Titanium Screws $425-$475 Million 1% Collars $150-$200 Million 0% Monogram • Market *Market sizes and share are based on management estimates Monogram product portfolio is well positioned to take advantage of market trends. Boeing and Airbus appear committed to high production rates through 2011 New aircraft – A380, 787, JSF, A350 – will drive increased demand Legacy military fighter production is stable Increasing use of composite structure in new planes Composites require more titanium content Cost and quality requirements for manufacturers has driven increase in automated assembly of legacy and new aircraft structure |
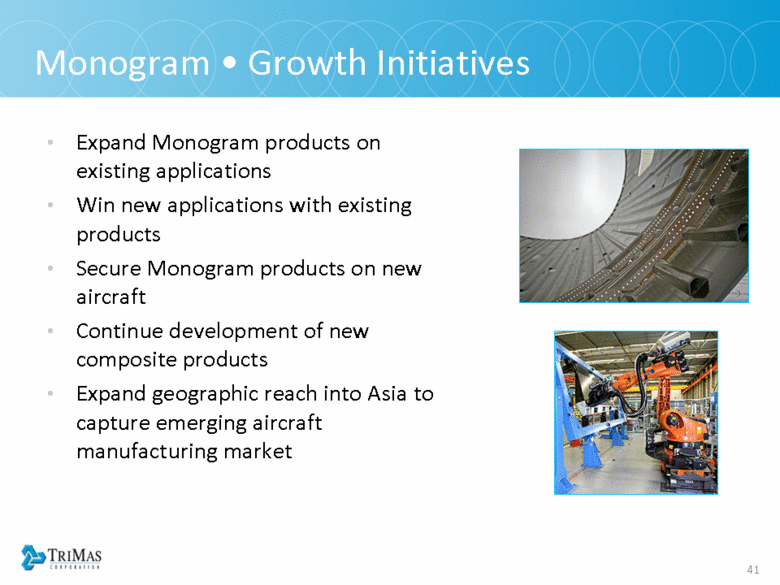
| Monogram • Growth Initiatives Expand Monogram products on existing applications Win new applications with existing products Secure Monogram products on new aircraft Continue development of new composite products Expand geographic reach into Asia to capture emerging aircraft manufacturing market |
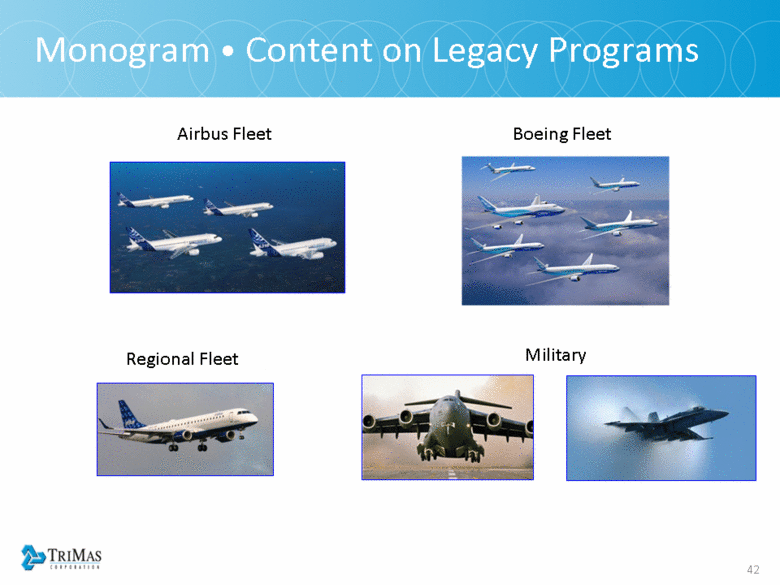
| Monogram • Content on Legacy Programs Airbus Fleet Boeing Fleet Military Regional Fleet |
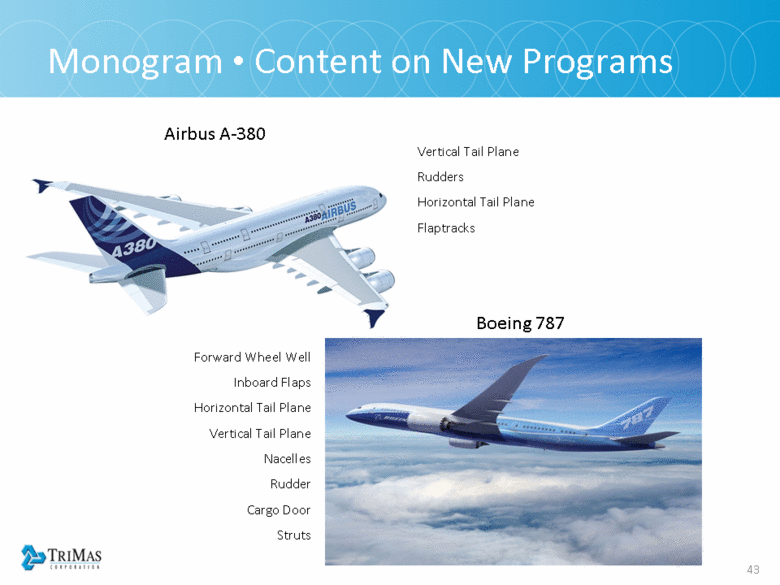
| Monogram • Content on New Programs Forward Wheel Well Inboard Flaps Horizontal Tail Plane Vertical Tail Plane Nacelles Rudder Cargo Door Struts Boeing 787 Airbus A-380 Vertical Tail Plane Rudders Horizontal Tail Plane Flaptracks |
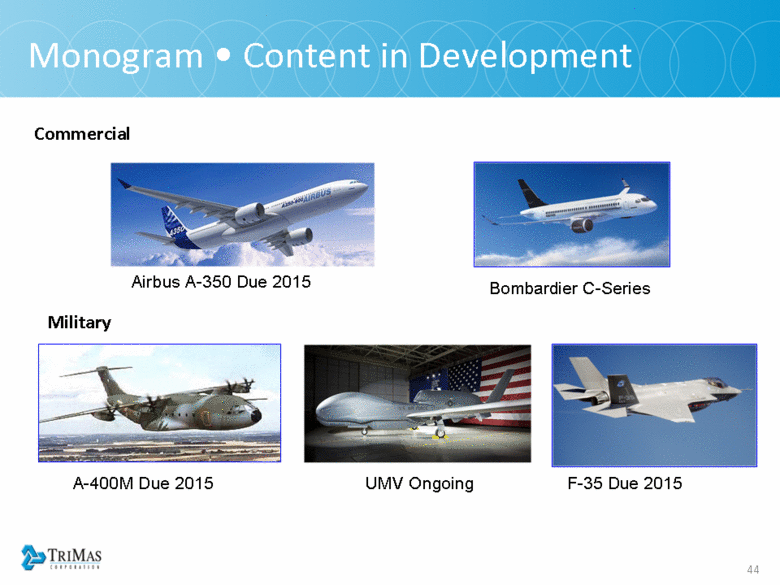
| Monogram • Content in Development Commercial Military Bombardier C-Series A-400M Due 2015 UMV Ongoing F-35 Due 2015 Airbus A-350 Due 2015 |
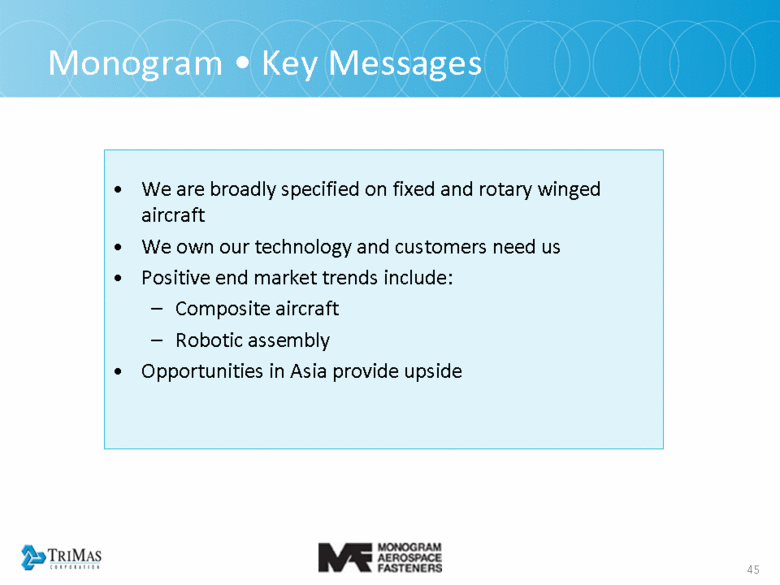
| Monogram • Key Messages We are broadly specified on fixed and rotary winged aircraft We own our technology and customers need us Positive end market trends include: Composite aircraft Robotic assembly Opportunities in Asia provide upside |
| Energy – Arrow Engine Len Turner • President |
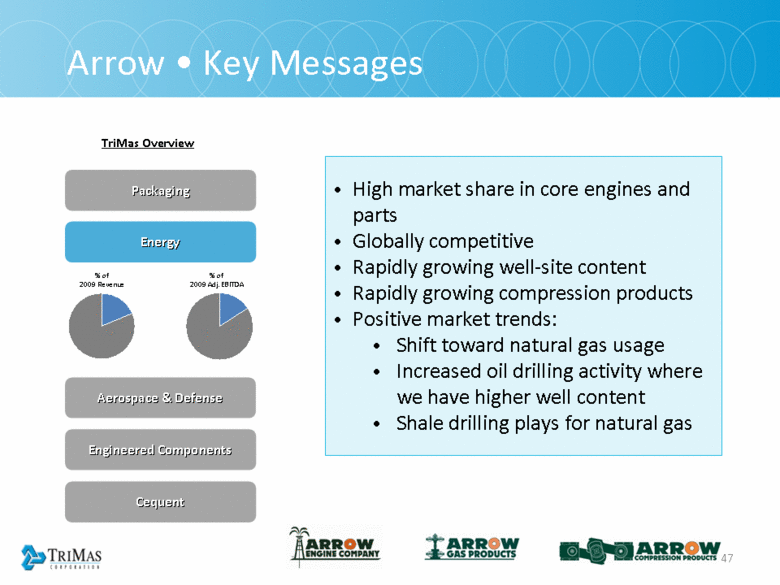
| 47 Arrow • Key Messages High market share in core engines and parts Globally competitive Rapidly growing well-site content Rapidly growing compression products Positive market trends: Shift toward natural gas usage Increased oil drilling activity where we have higher well content Shale drilling plays for natural gas TriMas Overview Packaging Engineered Components Energy Aerospace & Defense % of 2009 Revenue % of 2009 Adj. EBITDA Cequent |
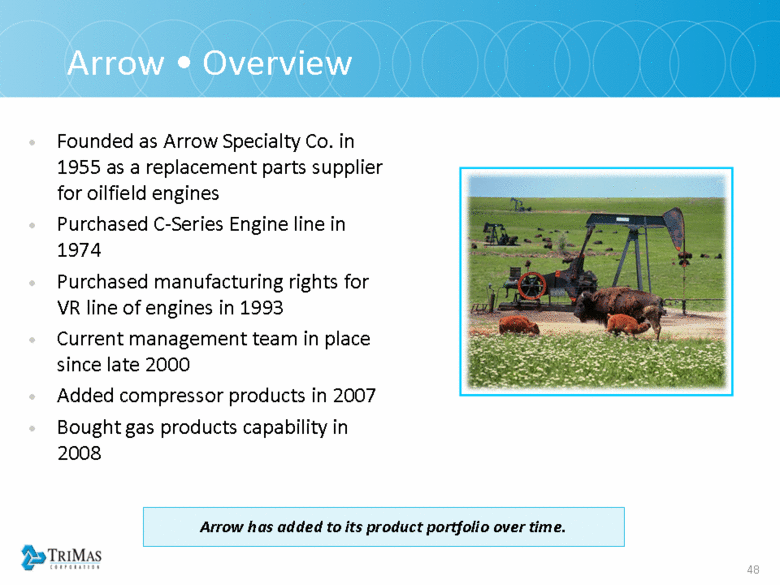
| Founded as Arrow Specialty Co. in 1955 as a replacement parts supplier for oilfield engines Purchased C-Series Engine line in 1974 Purchased manufacturing rights for VR line of engines in 1993 Current management team in place since late 2000 Added compressor products in 2007 Bought gas products capability in 2008 Arrow • Overview Arrow has added to its product portfolio over time. |
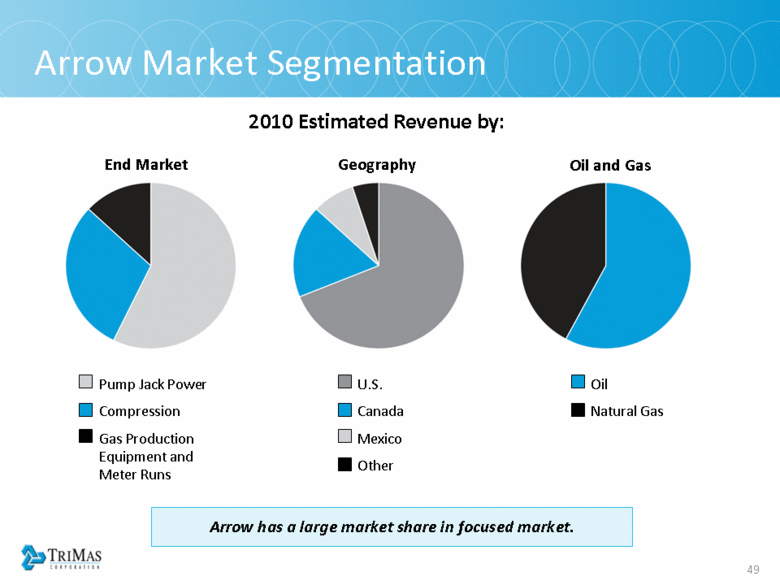
| Arrow Market Segmentation Pump Jack Power Compression Gas Production Equipment and Meter Runs U.S. Canada Mexico Other Oil Natural Gas End Market Oil and Gas 2010 Estimated Revenue by: Geography Arrow has a large market share in focused market. |
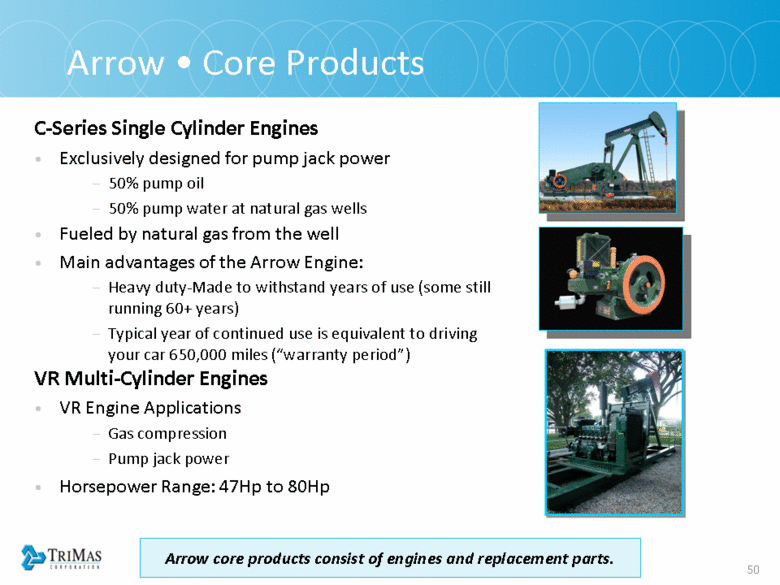
| Arrow • Core Products Arrow core products consist of engines and replacement parts. C-Series Single Cylinder Engines Exclusively designed for pump jack power 50% pump oil 50% pump water at natural gas wells Fueled by natural gas from the well Main advantages of the Arrow Engine: Heavy duty-Made to withstand years of use (some still running 60+ years) Typical year of continued use is equivalent to driving your car 650,000 miles (“warranty period”) VR Multi-Cylinder Engines VR Engine Applications Gas compression Pump jack power Horsepower Range: 47Hp to 80Hp |
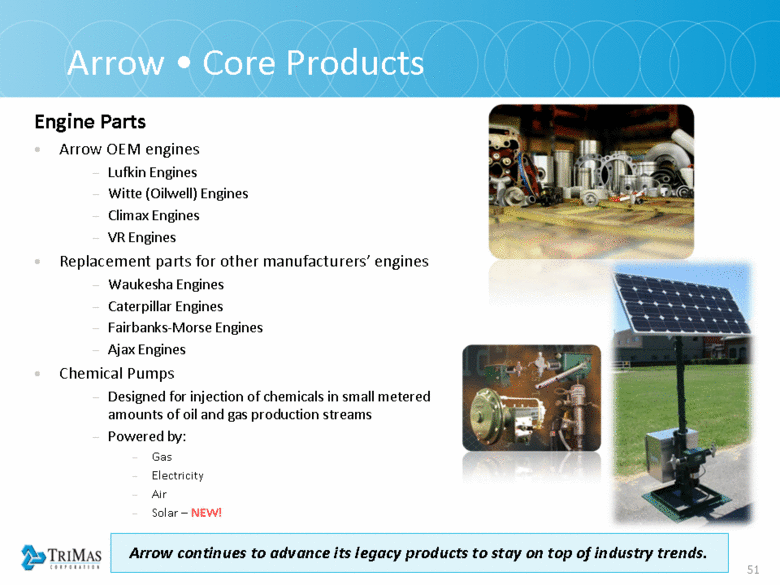
| Arrow • Core Products Engine Parts Arrow OEM engines Lufkin Engines Witte (Oilwell) Engines Climax Engines VR Engines Replacement parts for other manufacturers’ engines Waukesha Engines Caterpillar Engines Fairbanks-Morse Engines Ajax Engines Chemical Pumps Designed for injection of chemicals in small metered amounts of oil and gas production streams Powered by: Gas Electricity Air Solar – NEW! Arrow continues to advance its legacy products to stay on top of industry trends. |
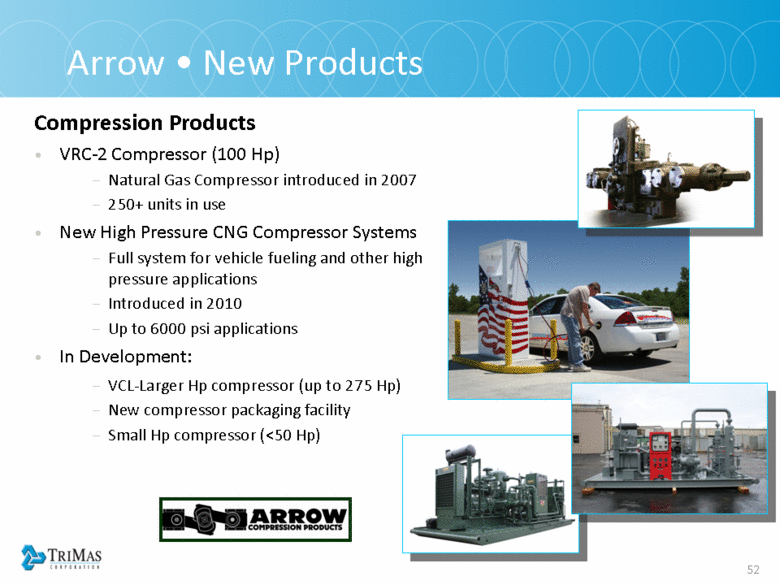
| Arrow • New Products Compression Products VRC-2 Compressor (100 Hp) Natural Gas Compressor introduced in 2007 250+ units in use New High Pressure CNG Compressor Systems Full system for vehicle fueling and other high pressure applications Introduced in 2010 Up to 6000 psi applications In Development: VCL-Larger Hp compressor (up to 275 Hp) New compressor packaging facility Small Hp compressor (<50 Hp) |
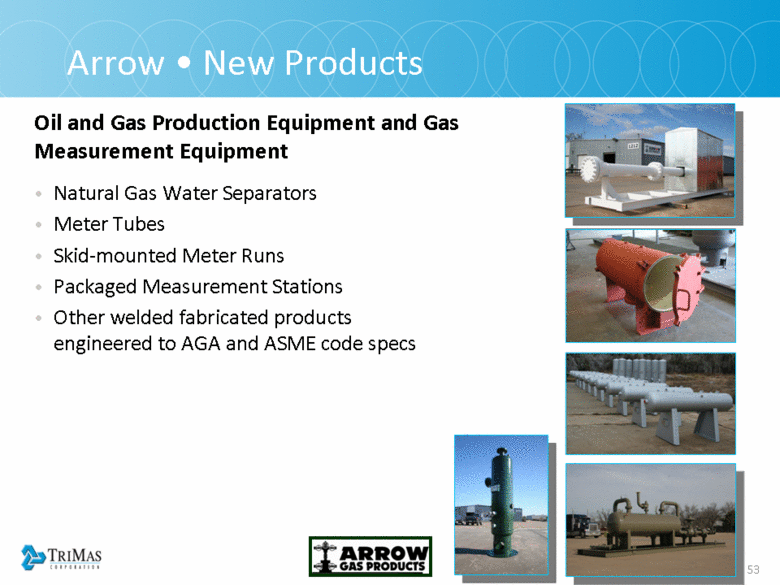
| Arrow • New Products Oil and Gas Production Equipment and Gas Measurement Equipment Natural Gas Water Separators Meter Tubes Skid-mounted Meter Runs Packaged Measurement Stations Other welded fabricated products engineered to AGA and ASME code specs |
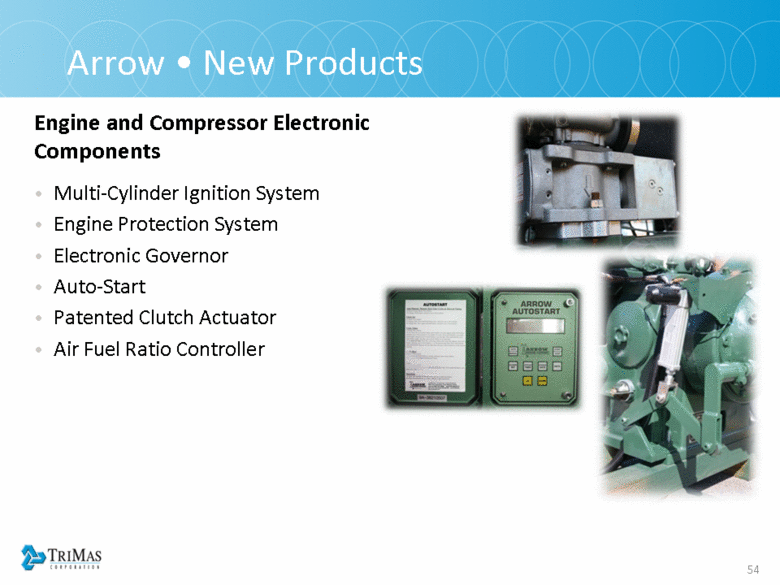
| Arrow • New Products Engine and Compressor Electronic Components Multi-Cylinder Ignition System Engine Protection System Electronic Governor Auto-Start Patented Clutch Actuator Air Fuel Ratio Controller |
| Arrow • Product Growth Summary Growth fueled by new products and new applications. In 2015, approximately 50% of sales is expected to be from new products. Product Breakout as Percentage of Sales Mid-2000’s 2015 Projection Core Engine Parts Engines Chemical Pumps Compressors/Access. Gas Products Compressor Packaging Other Electronics Meter Runs |
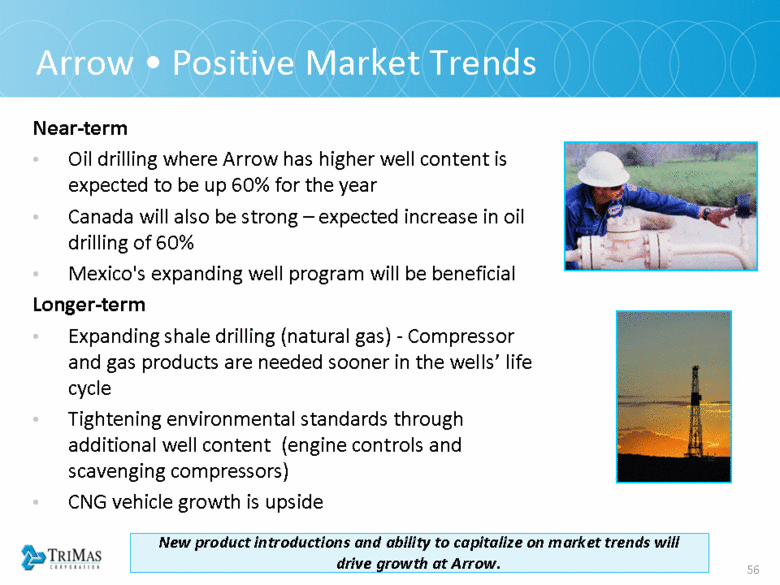
| Near-term Oil drilling where Arrow has higher well content is expected to be up 60% for the year Canada will also be strong – expected increase in oil drilling of 60% Mexico's expanding well program will be beneficial Longer-term Expanding shale drilling (natural gas) - Compressor and gas products are needed sooner in the wells’ life cycle Tightening environmental standards through additional well content (engine controls and scavenging compressors) CNG vehicle growth is upside Arrow • Positive Market Trends New product introductions and ability to capitalize on market trends will drive growth at Arrow. |
| Arrow • Key Messages High market share in core engines and parts Globally competitive Rapidly growing well-site content Rapidly growing compression products Positive market trends: Shift toward natural gas usage Increased oil drilling activity where we have higher well content Shale drilling plays for natural gas |
| Energy – Lamons Kurt Allen • President |
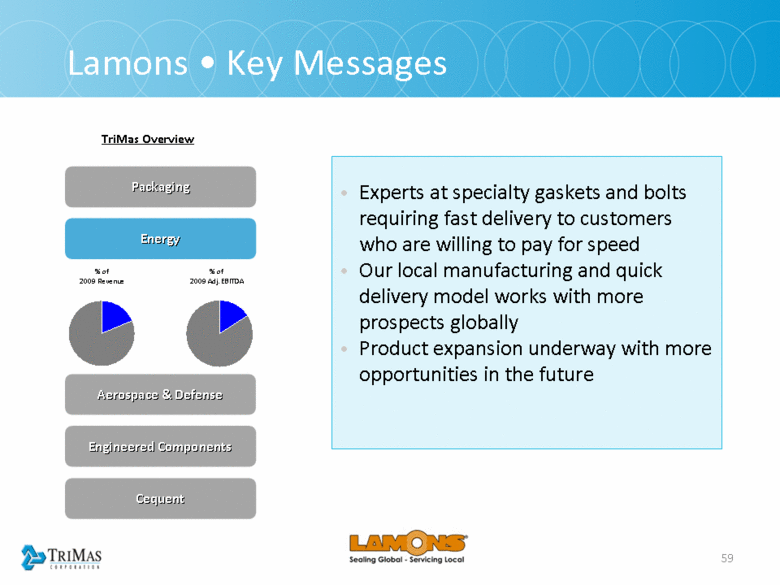
| 59 Lamons • Key Messages Experts at specialty gaskets and bolts requiring fast delivery to customers who are willing to pay for speed Our local manufacturing and quick delivery model works with more prospects globally Product expansion underway with more opportunities in the future TriMas Overview Packaging Engineered Components Energy Aerospace & Defense % of 2009 Revenue % of 2009 Adj. EBITDA Cequent |
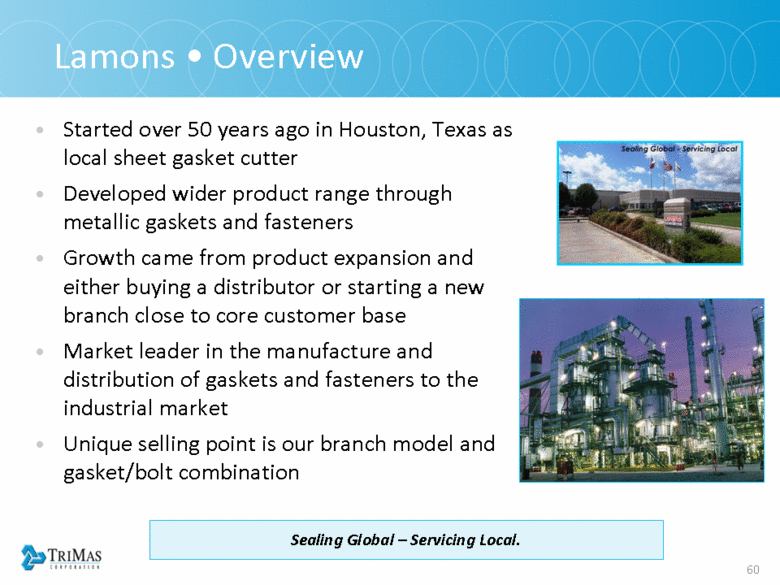
| Lamons • Overview Started over 50 years ago in Houston, Texas as local sheet gasket cutter Developed wider product range through metallic gaskets and fasteners Growth came from product expansion and either buying a distributor or starting a new branch close to core customer base Market leader in the manufacture and distribution of gaskets and fasteners to the industrial market Unique selling point is our branch model and gasket/bolt combination Sealing Global – Servicing Local. |
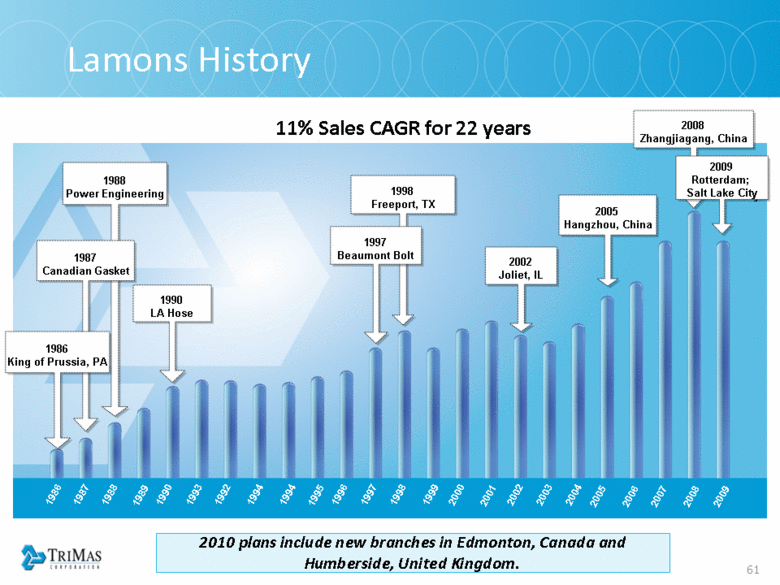
| 1990 LA Hose 1988 Power Engineering 1987 Canadian Gasket 1986 King of Prussia, PA 1998 Freeport, TX 2002 Joliet, IL 1997 Beaumont Bolt 2008 Zhangjiagang, China 2005 Hangzhou, China 1986 2004 2006 1988 1990 1992 1994 1996 1998 2000 2002 2008 Lamons History 11% Sales CAGR for 22 years 2009 2009 Rotterdam; Salt Lake City 2010 plans include new branches in Edmonton, Canada and Humberside, United Kingdom. 2007 2005 2003 2001 1999 1997 1995 1994 1993 1989 1987 |
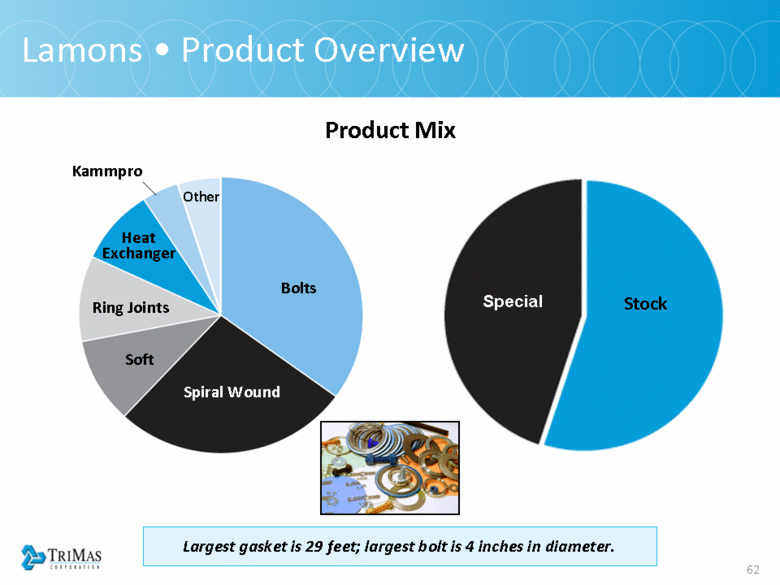
| Lamons • Product Overview Stock 55% Largest gasket is 29 feet; largest bolt is 4 inches in diameter. Product Mix Special Stock Bolts Heat Exchanger Ring Joints Soft Spiral Wound Kammpro Other |
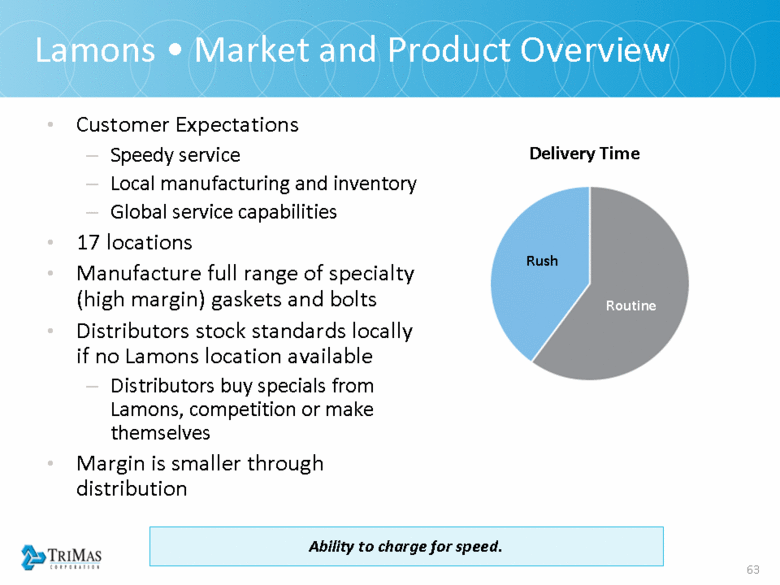
| Lamons • Market and Product Overview Customer Expectations Speedy service Local manufacturing and inventory Global service capabilities 17 locations Manufacture full range of specialty (high margin) gaskets and bolts Distributors stock standards locally if no Lamons location available Distributors buy specials from Lamons, competition or make themselves Margin is smaller through distribution Ability to charge for speed. Delivery Time Routine Rush |
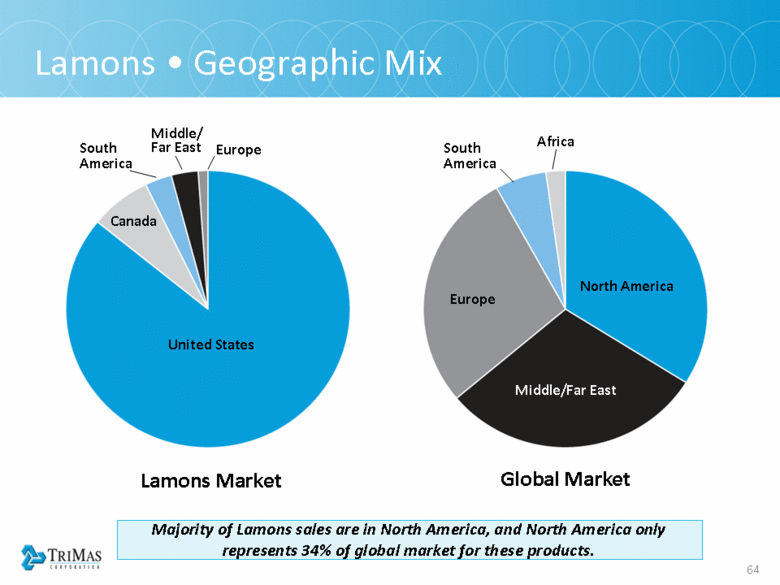
| Lamons • Geographic Mix Lamons Market Global Market United States Majority of Lamons sales are in North America, and North America only represents 34% of global market for these products. Middle/Far East Europe North America Middle/Far East Europe South America Africa South America Canada |
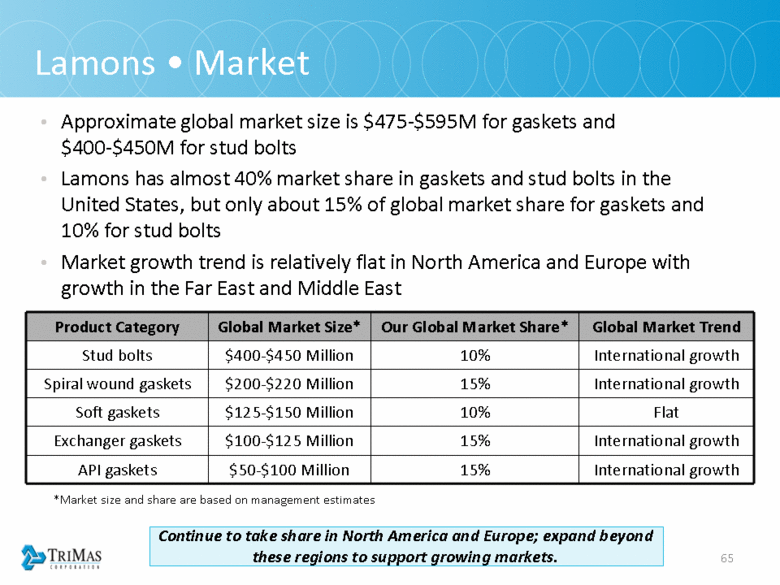
| 65 Lamons • Market Approximate global market size is $475-$595M for gaskets and $400-$450M for stud bolts Lamons has almost 40% market share in gaskets and stud bolts in the United States, but only about 15% of global market share for gaskets and 10% for stud bolts Market growth trend is relatively flat in North America and Europe with growth in the Far East and Middle East Product Category Global Market Size* Our Global Market Share* Global Market Trend Stud bolts $400-$450 Million 10% International growth Spiral wound gaskets $200-$220 Million 15% International growth Soft gaskets $125-$150 Million 10% Flat Exchanger gaskets $100-$125 Million 15% International growth API gaskets $50-$100 Million 15% International growth Continue to take share in North America and Europe; expand beyond these regions to support growing markets. *Market size and share are based on management estimates |
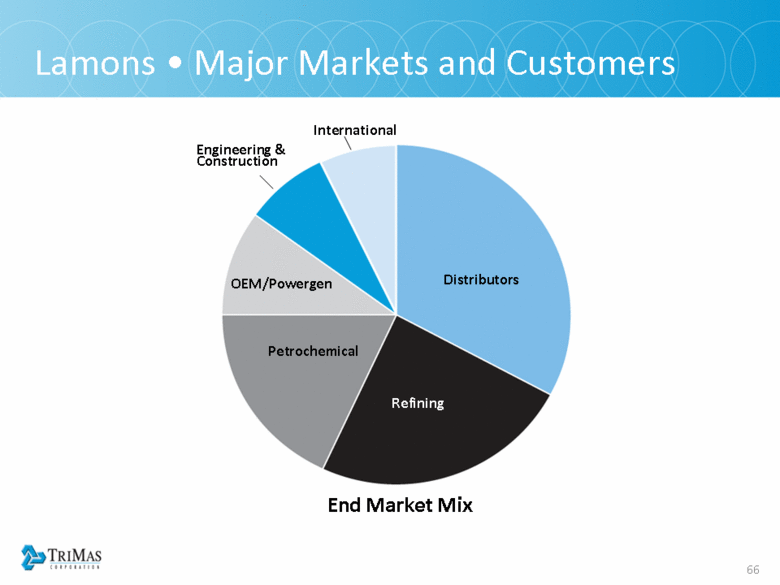
| Lamons • Major Markets and Customers End Market Mix Distributors Refining Petrochemical OEM/Powergen Engineering & Construction International |
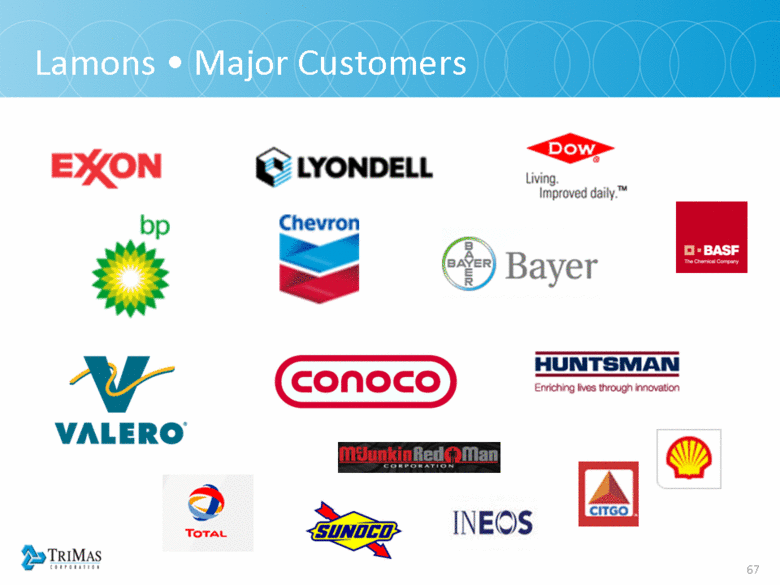
| Lamons • Major Customers |
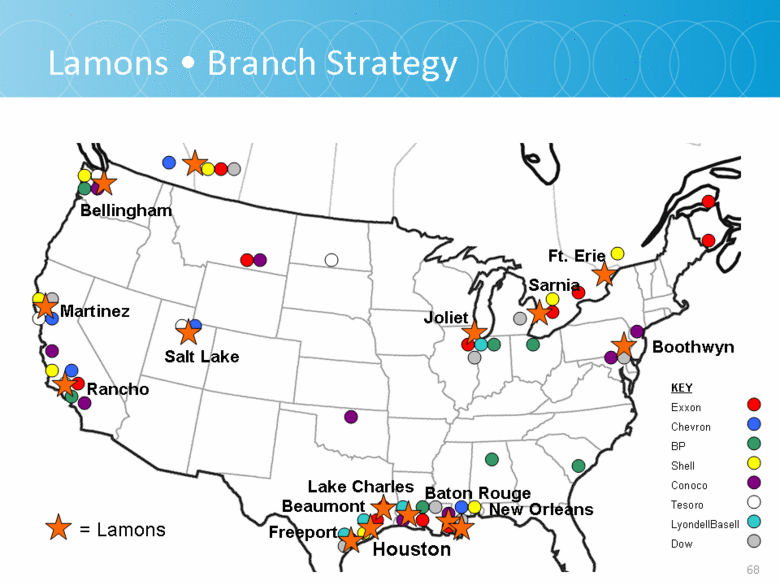
| KEY Exxon Chevron BP Shell Conoco Tesoro LyondellBasell Dow Beaumont Bellingham Ft. Erie Sarnia Freeport Salt Lake Boothwyn Joliet Martinez Rancho New Orleans Baton Rouge Lake Charles Houston = Lamons Lamons • Branch Strategy |
| France Italy Spain Germany Bel Czech Republic Belarus Ukraine Poland Norway Sweden Finland Ireland Croatia Albania Switz Austria Hungary Slovakia Romania Lithuania Latvia Estonia Portugal Greece Turkey Bulgaria KEY Exxon Chevron BP Shell Conoco LyondellBasell Dow Rotterdam Lamons • Branch Strategy = Lamons |
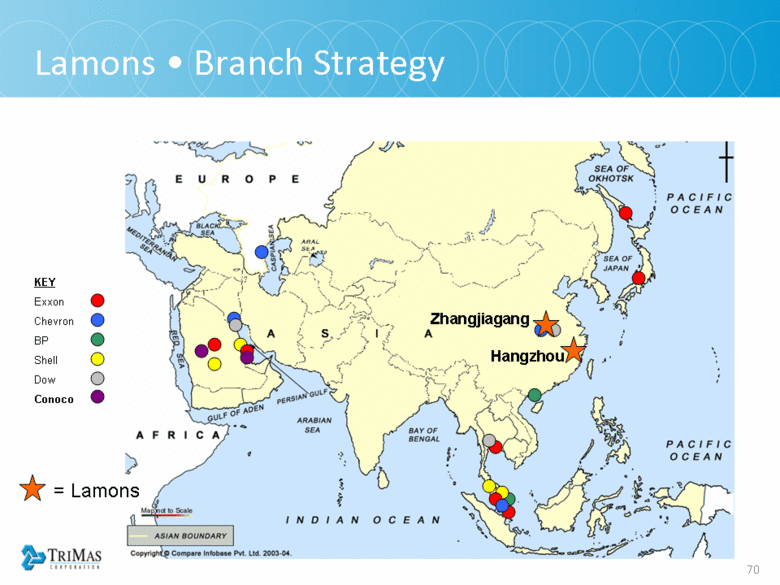
| KEY Exxon Chevron BP Shell Dow Conoco Zhangjiagang Hangzhou Lamons • Branch Strategy = Lamons |
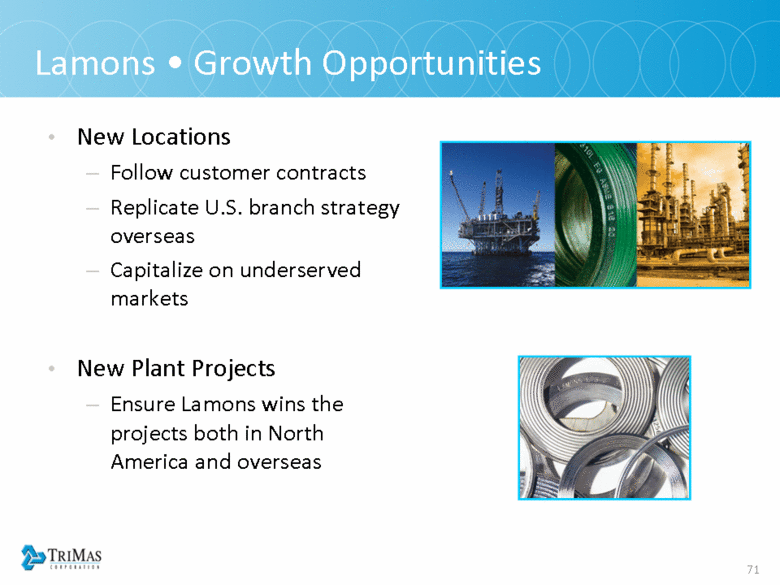
| Lamons • Growth Opportunities New Locations Follow customer contracts Replicate U.S. branch strategy overseas Capitalize on underserved markets New Plant Projects Ensure Lamons wins the projects both in North America and overseas |
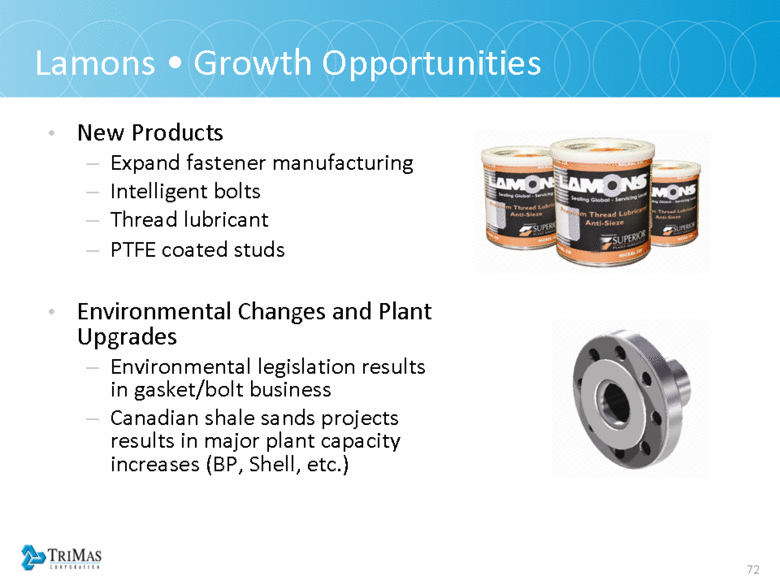
| Lamons • Growth Opportunities New Products Expand fastener manufacturing Intelligent bolts Thread lubricant PTFE coated studs Environmental Changes and Plant Upgrades Environmental legislation results in gasket/bolt business Canadian shale sands projects results in major plant capacity increases (BP, Shell, etc.) |
| Lamons • Key Messages Experts at specialty gaskets and bolts requiring fast delivery to customers who are willing to pay for speed Our local manufacturing and quick delivery model works with more prospects globally Product expansion underway with more opportunities in the future |
| Productivity Panel Mark Zeffiro • Chief Financial Officer |
| 75 Productivity • Key Messages New organization and new processes Wide range of opportunities for all businesses Funds growth, expands margins and protects us from inflationary/competitive pressures |
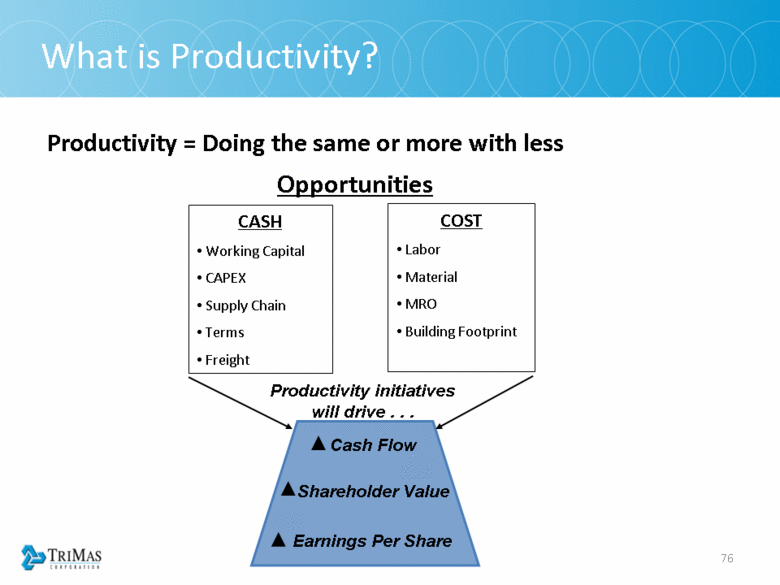
| 76 What is Productivity? Productivity = Doing the same or more with less CASH Working Capital CAPEX Supply Chain Terms Freight COST Labor Material MRO Building Footprint Productivity initiatives will drive . . . Earnings Per Share Cash Flow Shareholder Value Opportunities |
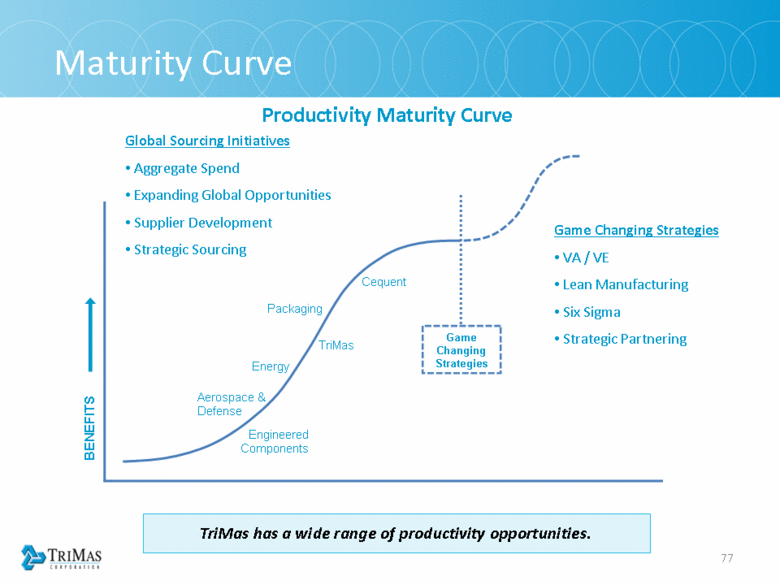
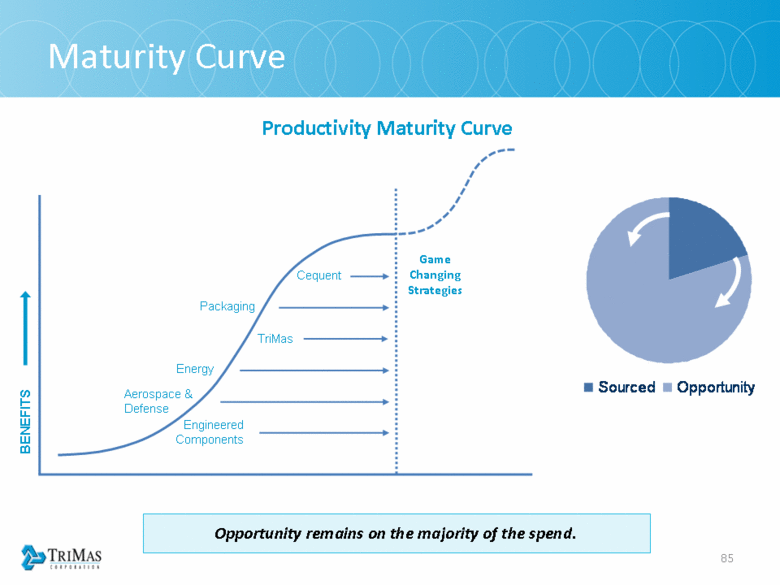
| 77 Maturity Curve TriMas has a wide range of productivity opportunities. Engineered Components Aerospace & Defense Energy TriMas Packaging Cequent Game Changing Strategies VA / VE Lean Manufacturing Six Sigma Strategic Partnering BENEFITS Game Changing Strategies Global Sourcing Initiatives Aggregate Spend Expanding Global Opportunities Supplier Development Strategic Sourcing Productivity Maturity Curve |
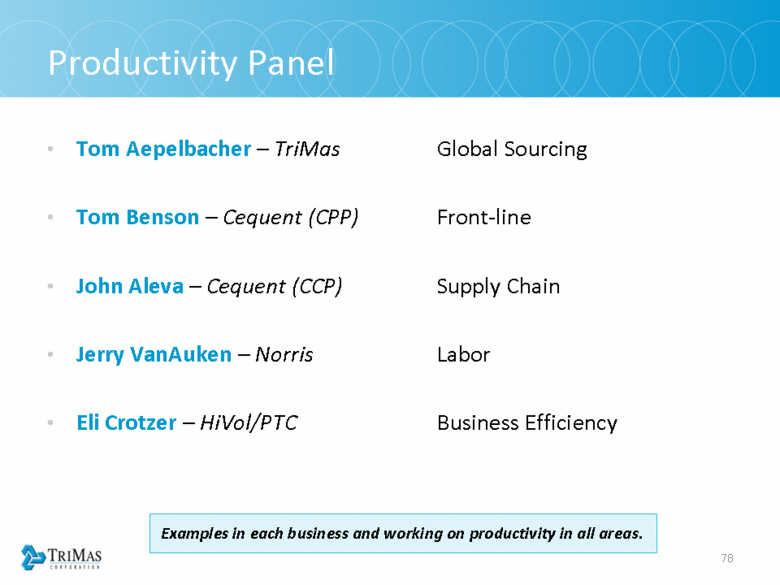
| 78 Productivity Panel Tom Aepelbacher – TriMas Global Sourcing Tom Benson – Cequent (CPP) Front-line John Aleva – Cequent (CCP) Supply Chain Jerry VanAuken – Norris Labor Eli Crotzer – HiVol/PTC Business Efficiency Examples in each business and working on productivity in all areas. |
| Productivity Panel Tom Aepelbacher • Vice President – Global Sourcing |
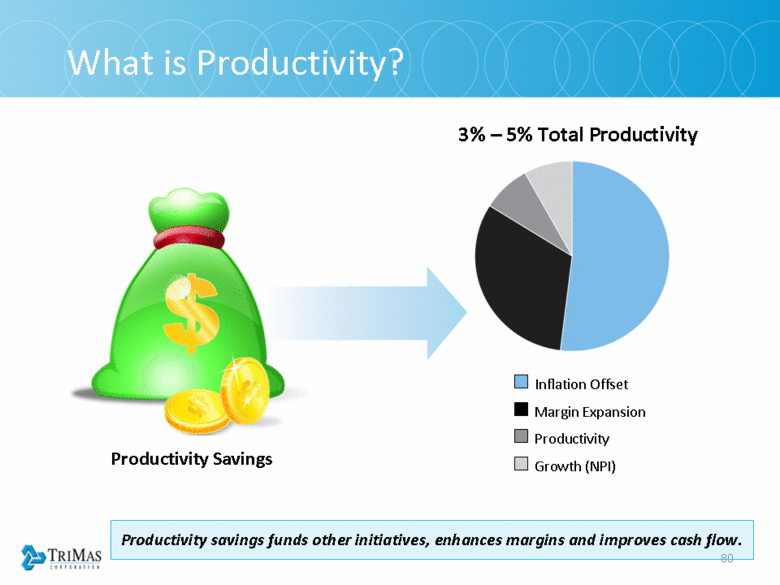
| 80 What is Productivity? Productivity Savings Productivity savings funds other initiatives, enhances margins and improves cash flow. 3% – 5% Total Productivity Inflation Offset Margin Expansion Productivity Growth (NPI) |
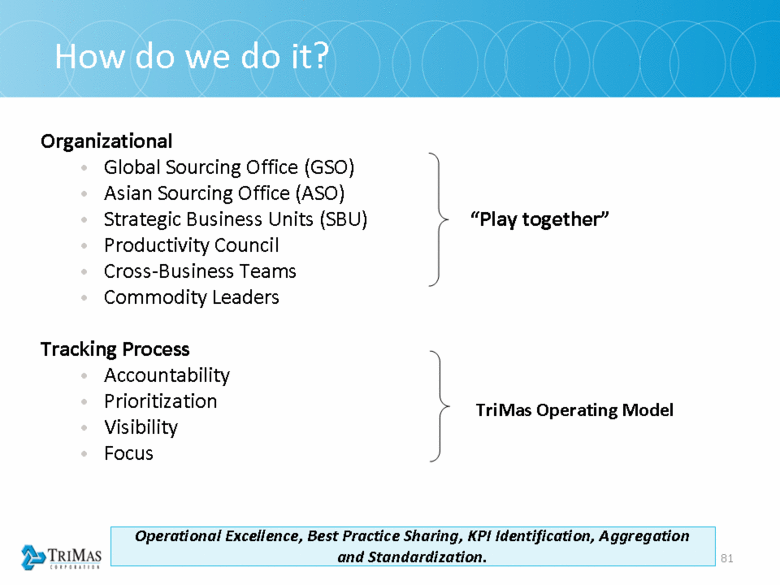
| 81 How do we do it? Organizational Global Sourcing Office (GSO) Asian Sourcing Office (ASO) Strategic Business Units (SBU) Productivity Council Cross-Business Teams Commodity Leaders Tracking Process Accountability Prioritization Visibility Focus “Play together” TriMas Operating Model Operational Excellence, Best Practice Sharing, KPI Identification, Aggregation and Standardization. |
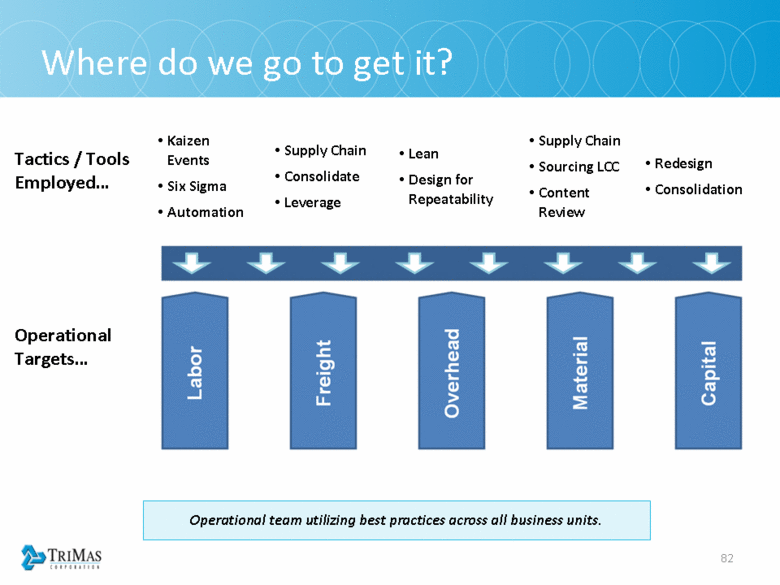
| 82 Where do we go to get it? Operational team utilizing best practices across all business units. Operational Targets Kaizen Events Six Sigma Automation Tactics / Tools Employed Supply Chain Consolidate Leverage Lean Design for Repeatability Supply Chain Sourcing LCC Content Review Redesign Consolidation |
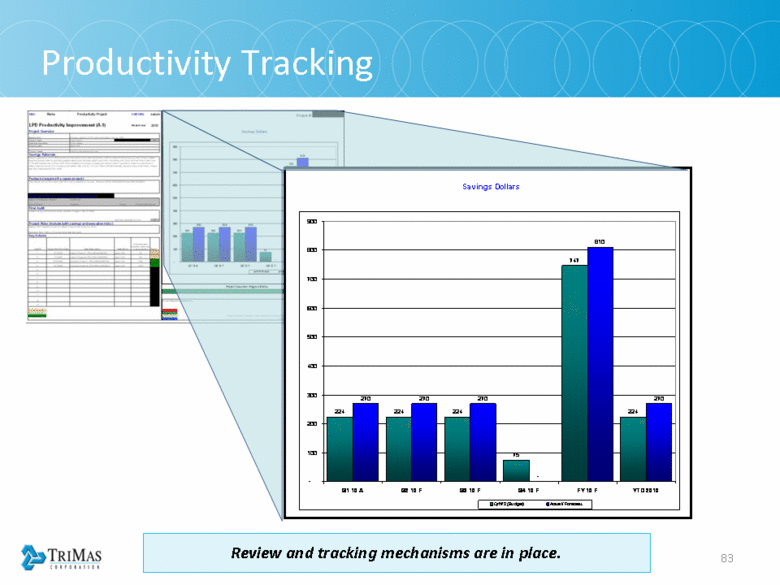
| 83 Productivity Tracking Review and tracking mechanisms are in place. |
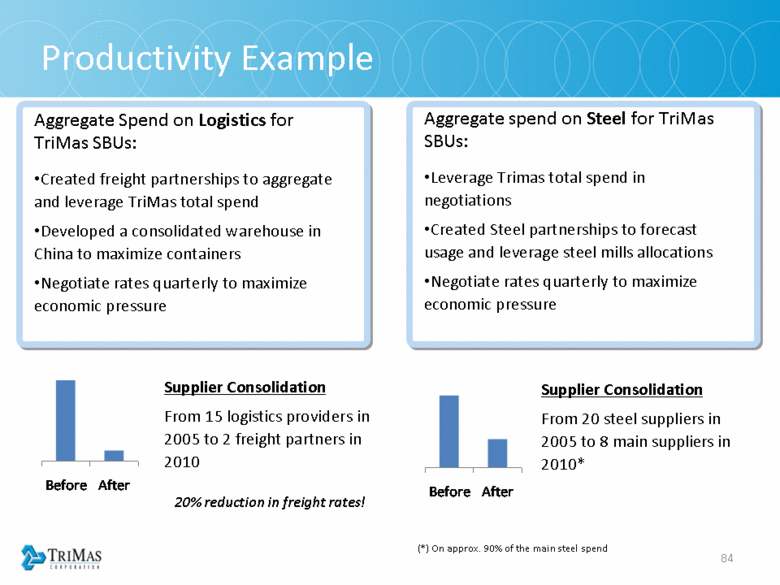
| 84 Aggregate Spend on Logistics for TriMas SBUs: Created freight partnerships to aggregate and leverage TriMas total spend Developed a consolidated warehouse in China to maximize containers Negotiate rates quarterly to maximize economic pressure Productivity Example Aggregate spend on Steel for TriMas SBUs: Leverage Trimas total spend in negotiations Created Steel partnerships to forecast usage and leverage steel mills allocations Negotiate rates quarterly to maximize economic pressure Supplier Consolidation From 15 logistics providers in 2005 to 2 freight partners in 2010 20% reduction in freight rates! Supplier Consolidation From 20 steel suppliers in 2005 to 8 main suppliers in 2010* (*) On approx. 90% of the main steel spend Before After |
| 85 Maturity Curve Opportunity remains on the majority of the spend. Engineered Components Aerospace & Defense Energy TriMas Packaging Cequent BENEFITS Game Changing Strategies Productivity Maturity Curve Sourced Opportunity |
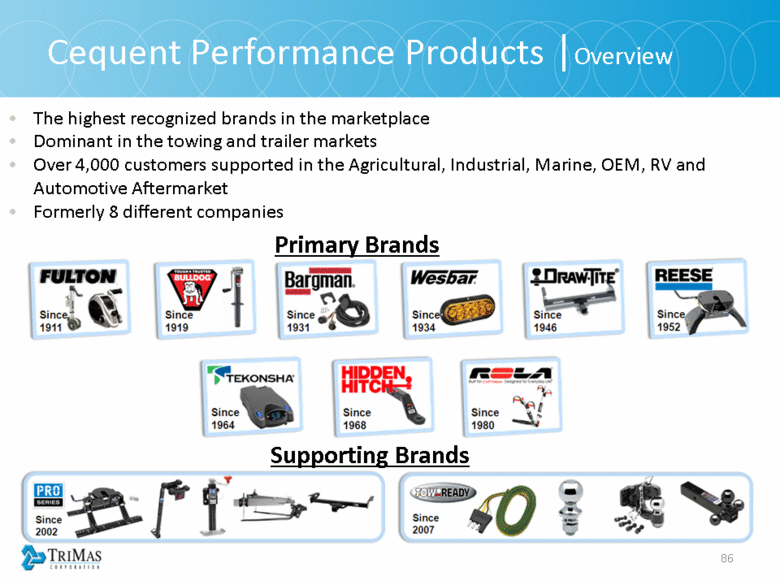
| 86 The highest recognized brands in the marketplace Dominant in the towing and trailer markets Over 4,000 customers supported in the Agricultural, Industrial, Marine, OEM, RV and Automotive Aftermarket Formerly 8 different companies Cequent Performance Products |Overview Primary Brands Supporting Brands |
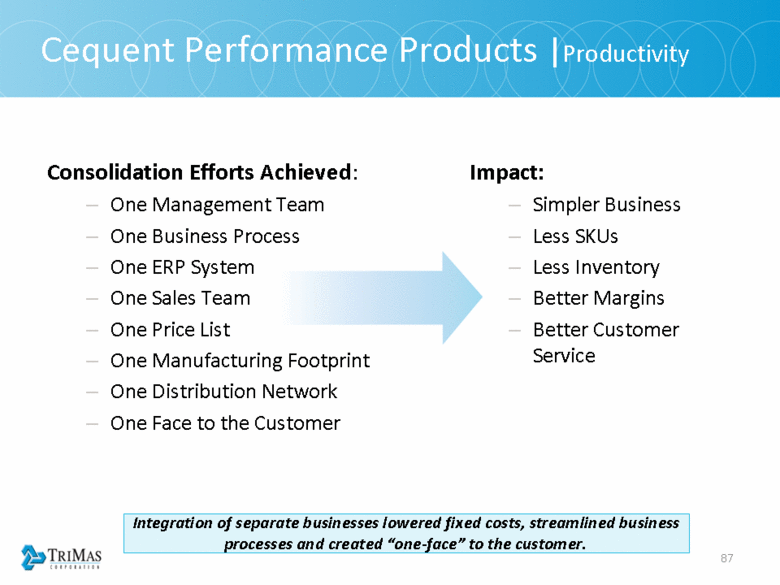
| 87 Cequent Performance Products |Productivity Consolidation Efforts Achieved: One Management Team One Business Process One ERP System One Sales Team One Price List One Manufacturing Footprint One Distribution Network One Face to the Customer Impact: Simpler Business Less SKUs Less Inventory Better Margins Better Customer Service Integration of separate businesses lowered fixed costs, streamlined business processes and created “one-face” to the customer. |
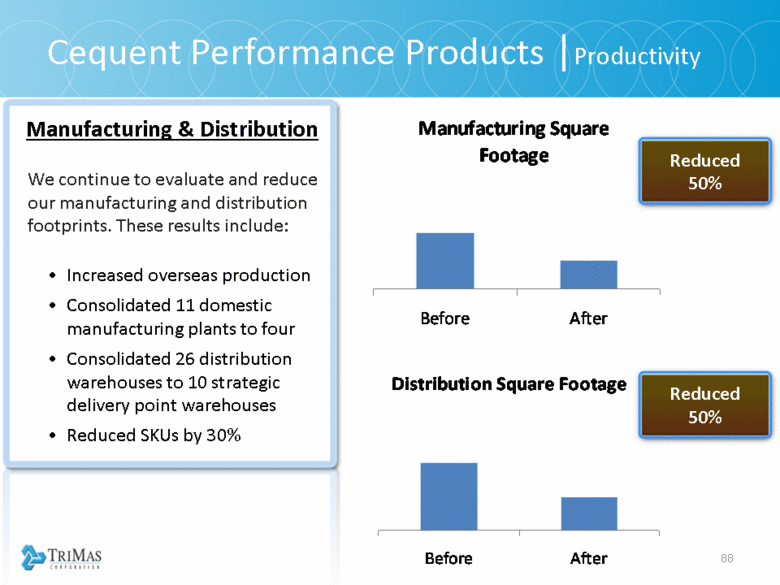
| 88 Cequent Performance Products |Productivity Manufacturing & Distribution We continue to evaluate and reduce our manufacturing and distribution footprints. These results include: Increased overseas production Consolidated 11 domestic manufacturing plants to four Consolidated 26 distribution warehouses to 10 strategic delivery point warehouses Reduced SKUs by 30% Reduced 50% Reduced 50% Manufacturing Square Footage Before After Distribution Square Footage Before After |
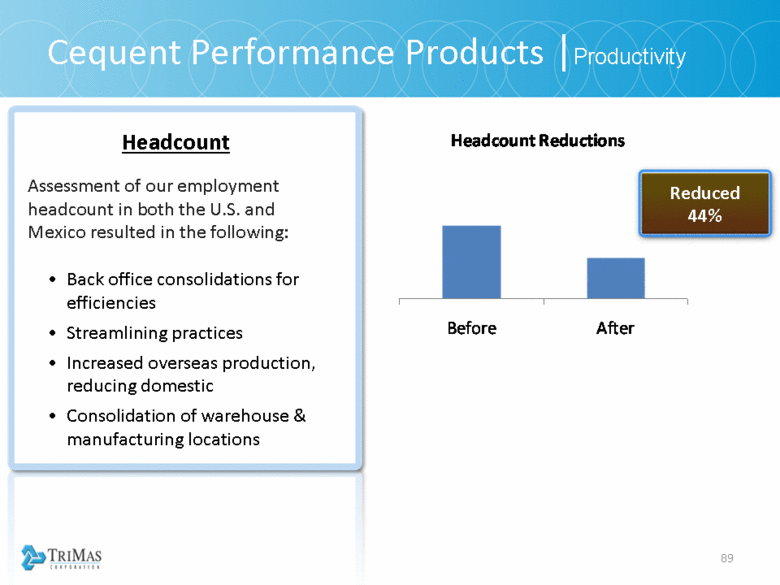
| 89 Headcount Assessment of our employment headcount in both the U.S. and Mexico resulted in the following: Back office consolidations for efficiencies Streamlining practices Increased overseas production, reducing domestic Consolidation of warehouse & manufacturing locations Cequent Performance Products |Productivity Reduced 44% Headcount Reductions Before After |
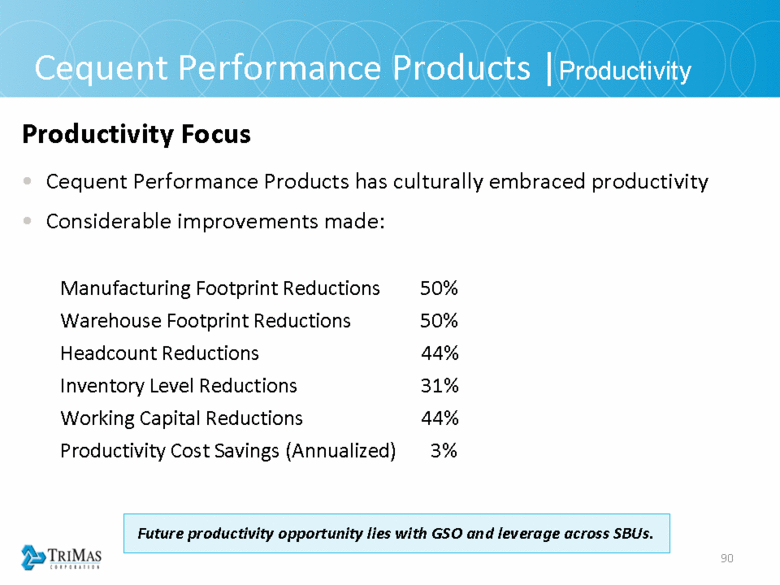
| 90 Productivity Focus Cequent Performance Products has culturally embraced productivity Considerable improvements made: Manufacturing Footprint Reductions 50% Warehouse Footprint Reductions 50% Headcount Reductions 44% Inventory Level Reductions 31% Working Capital Reductions 44% Productivity Cost Savings (Annualized) 3% Cequent Performance Products |Productivity Future productivity opportunity lies with GSO and leverage across SBUs. |
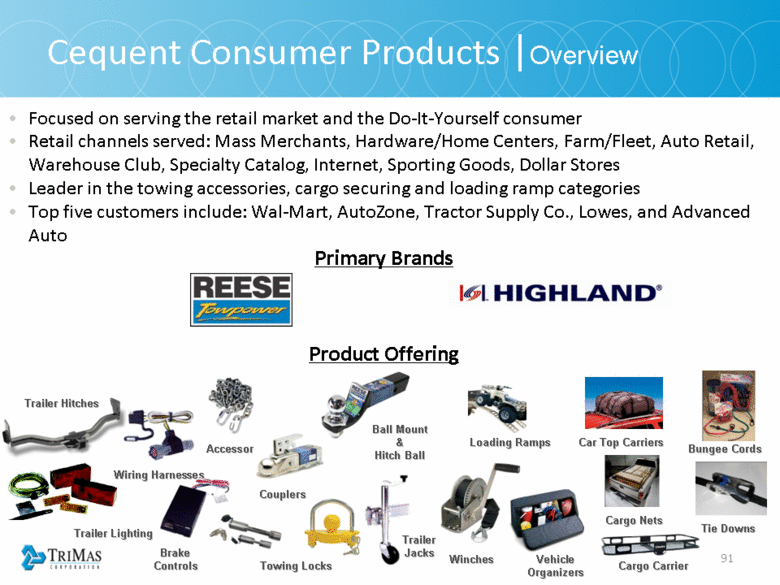
| 91 Focused on serving the retail market and the Do-It-Yourself consumer Retail channels served: Mass Merchants, Hardware/Home Centers, Farm/Fleet, Auto Retail, Warehouse Club, Specialty Catalog, Internet, Sporting Goods, Dollar Stores Leader in the towing accessories, cargo securing and loading ramp categories Top five customers include: Wal-Mart, AutoZone, Tractor Supply Co., Lowes, and Advanced Auto Cequent Consumer Products |Overview Primary Brands Trailer Hitches Trailer Lighting Ball Mount & Hitch Ball Car Top Carriers Wiring Harnesses Cargo Carrier Loading Ramps Accessor Towing Locks Brake Controls Trailer Jacks Couplers Winches Cargo Nets Bungee Cords Tie Downs Vehicle Organizers Product Offering |
| 92 Goal: Leverage our Retail channel access and our Low Cost Country sourcing to expand and grow our revenue: Cequent Consumer Products |Objective Defend and grow existing channels and product categories Expand into new product categories (e.g. Cargo Management, Trailer Wiring and ATV accessories) Expand into new channels (e.g. Military, Food and Drug) Expand international sales through distribution partners Continue to bring new and innovative products and packaging to support the retail markets |
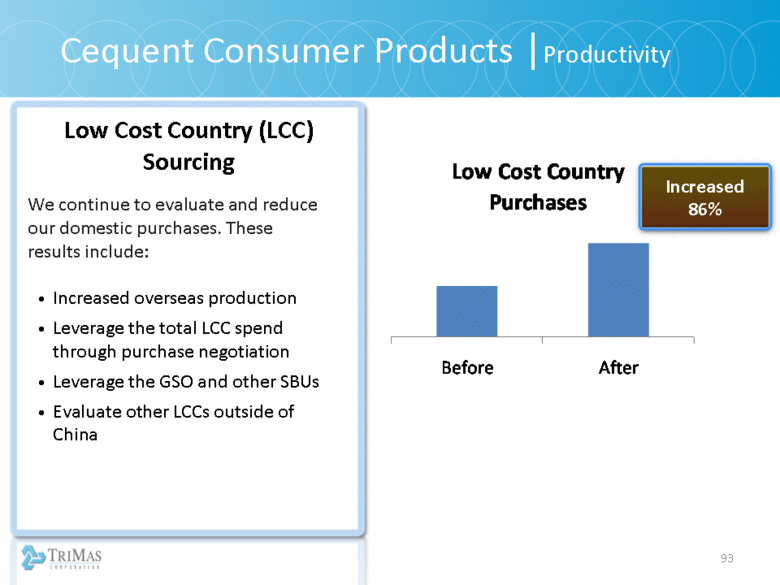
| 93 Cequent Consumer Products |Productivity Low Cost Country (LCC) Sourcing We continue to evaluate and reduce our domestic purchases. These results include: Increased overseas production Leverage the total LCC spend through purchase negotiation Leverage the GSO and other SBUs Evaluate other LCCs outside of China Increased 86% Low Cost Country Purchases Before After |
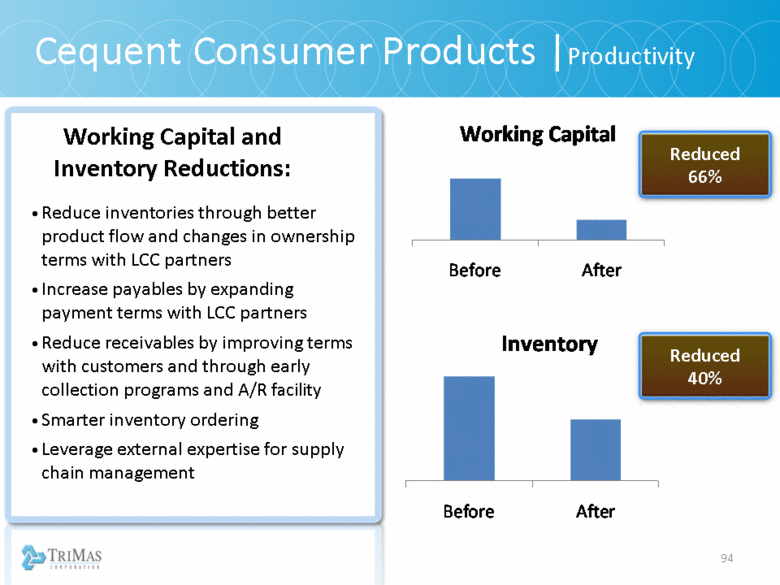
| 94 Reduce inventories through better product flow and changes in ownership terms with LCC partners Increase payables by expanding payment terms with LCC partners Reduce receivables by improving terms with customers and through early collection programs and A/R facility Smarter inventory ordering Leverage external expertise for supply chain management Cequent Consumer Products |Productivity Reduced 66% Working Capital and Inventory Reductions: Working Capital Before After Inventory Before After Reduced 40% |
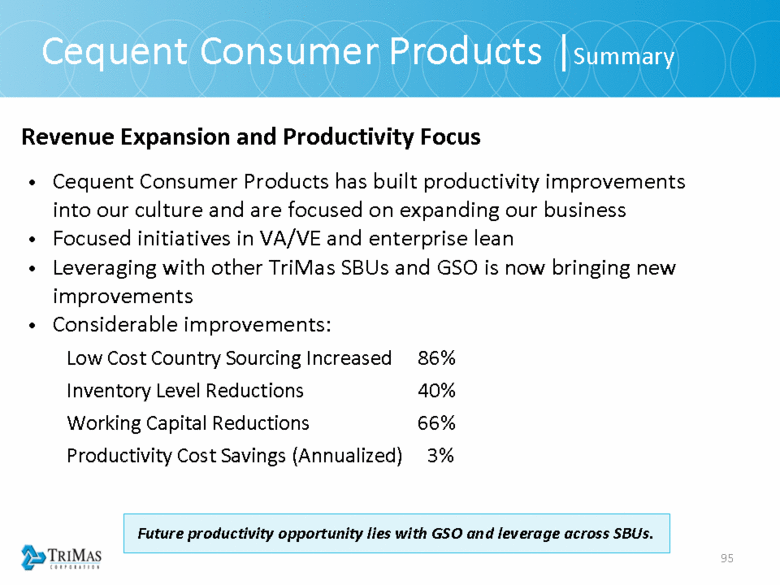
| 95 Revenue Expansion and Productivity Focus Cequent Consumer Products has built productivity improvements into our culture and are focused on expanding our business Focused initiatives in VA/VE and enterprise lean Leveraging with other TriMas SBUs and GSO is now bringing new improvements Considerable improvements: Low Cost Country Sourcing Increased 86% Inventory Level Reductions 40% Working Capital Reductions 66% Productivity Cost Savings (Annualized) 3% Cequent Consumer Products |Summary Future productivity opportunity lies with GSO and leverage across SBUs. |
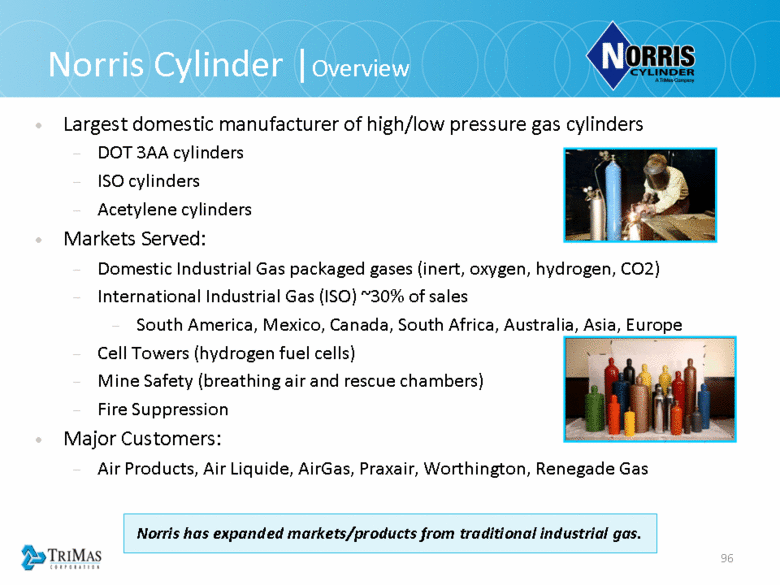
| 96 Norris Cylinder |Overview Largest domestic manufacturer of high/low pressure gas cylinders DOT 3AA cylinders ISO cylinders Acetylene cylinders Markets Served: Domestic Industrial Gas packaged gases (inert, oxygen, hydrogen, CO2) International Industrial Gas (ISO) ~30% of sales South America, Mexico, Canada, South Africa, Australia, Asia, Europe Cell Towers (hydrogen fuel cells) Mine Safety (breathing air and rescue chambers) Fire Suppression Major Customers: Air Products, Air Liquide, AirGas, Praxair, Worthington, Renegade Gas Norris has expanded markets/products from traditional industrial gas. |
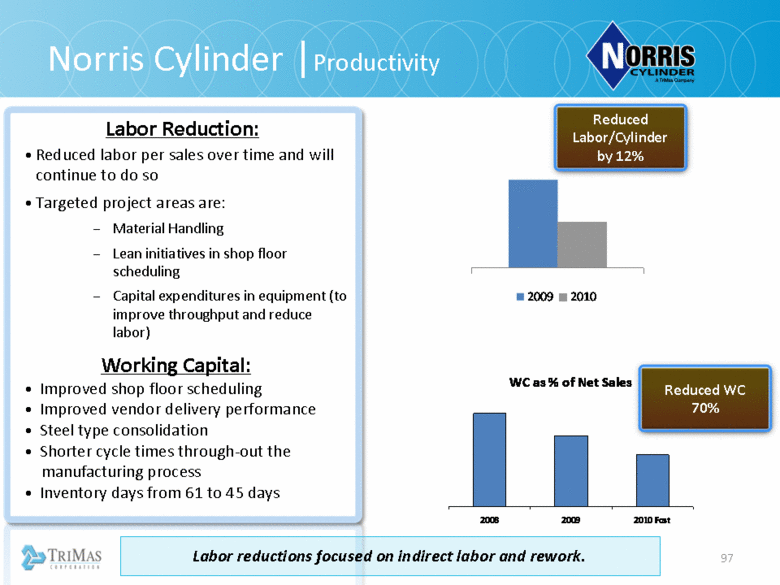
| 97 Reduced labor per sales over time and will continue to do so Targeted project areas are: Material Handling Lean initiatives in shop floor scheduling Capital expenditures in equipment (to improve throughput and reduce labor) Improved shop floor scheduling Improved vendor delivery performance Steel type consolidation Shorter cycle times through-out the manufacturing process Inventory days from 61 to 45 days Labor Reduction: Norris Cylinder |Productivity Reduced Labor/Cylinder by 12% Working Capital: Reduced WC 70% Labor reductions focused on indirect labor and rework. 2009 2010 WC as % of Net Sales 2008 2009 2010 Fcst |
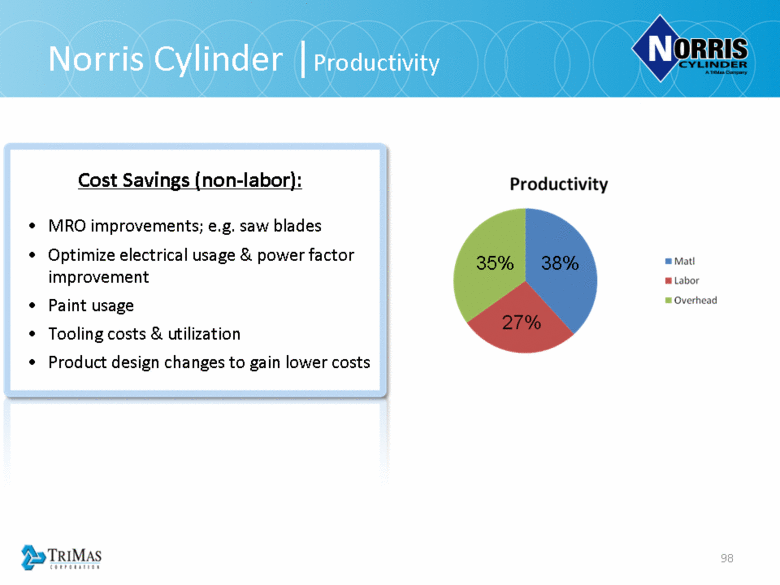
| 98 Cost Savings (non-labor): MRO improvements; e.g. saw blades Optimize electrical usage & power factor improvement Paint usage Tooling costs & utilization Product design changes to gain lower costs 35% 38% Norris Cylinder |Productivity |
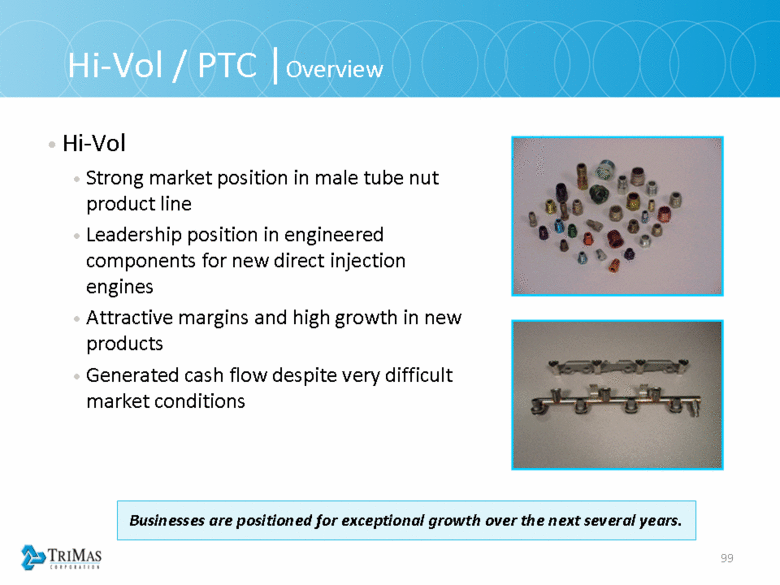
| 99 Hi-Vol / PTC |Overview Hi-Vol Strong market position in male tube nut product line Leadership position in engineered components for new direct injection engines Attractive margins and high growth in new products Generated cash flow despite very difficult market conditions Businesses are positioned for exceptional growth over the next several years. |
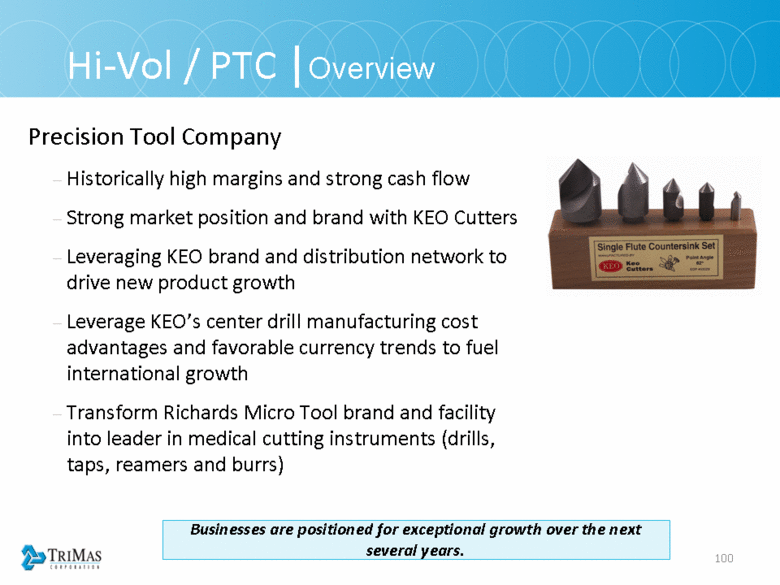
| 100 Hi-Vol / PTC |Overview Precision Tool Company Historically high margins and strong cash flow Strong market position and brand with KEO Cutters Leveraging KEO brand and distribution network to drive new product growth Leverage KEO’s center drill manufacturing cost advantages and favorable currency trends to fuel international growth Transform Richards Micro Tool brand and facility into leader in medical cutting instruments (drills, taps, reamers and burrs) Businesses are positioned for exceptional growth over the next several years. |
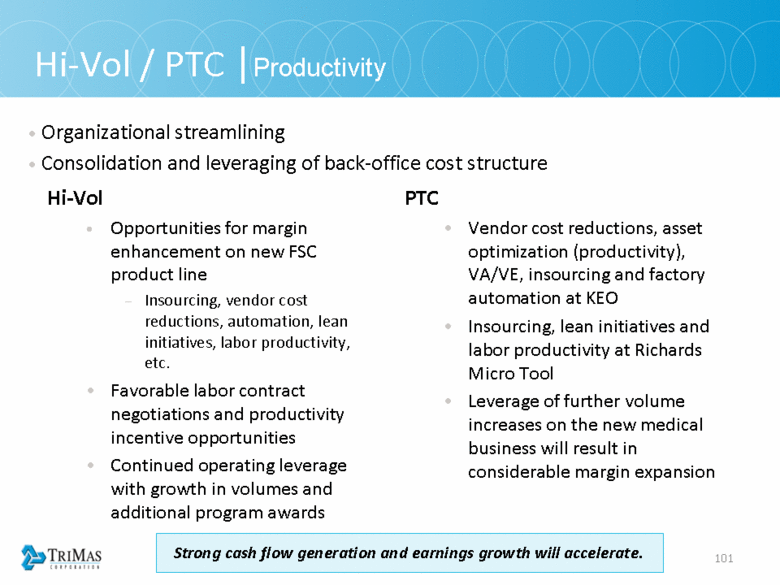
| 101 Hi-Vol / PTC |Productivity Hi-Vol Opportunities for margin enhancement on new FSC product line Insourcing, vendor cost reductions, automation, lean initiatives, labor productivity, etc. Favorable labor contract negotiations and productivity incentive opportunities Continued operating leverage with growth in volumes and additional program awards PTC Vendor cost reductions, asset optimization (productivity), VA/VE, insourcing and factory automation at KEO Insourcing, lean initiatives and labor productivity at Richards Micro Tool Leverage of further volume increases on the new medical business will result in considerable margin expansion Organizational streamlining Consolidation and leveraging of back-office cost structure Strong cash flow generation and earnings growth will accelerate. |
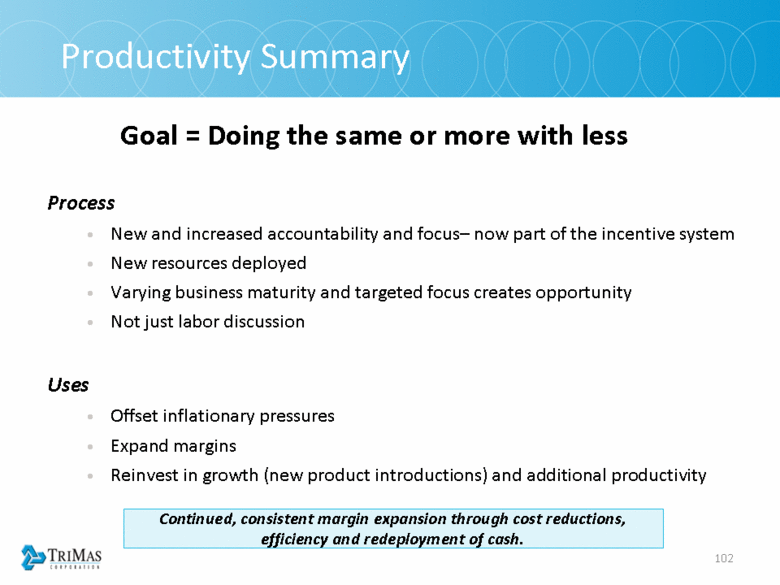
| 102 Productivity Summary Goal = Doing the same or more with less Process New and increased accountability and focus– now part of the incentive system New resources deployed Varying business maturity and targeted focus creates opportunity Not just labor discussion Uses Offset inflationary pressures Expand margins Reinvest in growth (new product introductions) and additional productivity Continued, consistent margin expansion through cost reductions, efficiency and redeployment of cash. |
| 103 Productivity • Key Messages New organization and new processes Wide range of opportunities for all businesses Funds growth, expands margins and protects us from inflationary/competitive pressures |
| TriMas Value Proposition Mark Zeffiro • CFO |
| 105 TriMas Value Proposition Stability Margin expansion High single-digit growth Energy Aerospace Industrial Consumer Agricultural Geographic diversity Customer diversity Balanced Portfolio Many small opportunities = big results Geographic Product Customer penetration Services Growth Opportunities X Rationalization Optimization of global supply chain Low cost position Purchasing effect Manufacturing effect Productivity X Earnings growth > sales Strong cash flow dynamics Deleverage Increased ROIC Increased Enterprise Value = Strong, defensible businesses + new management + enhanced processes = value opportunity. |
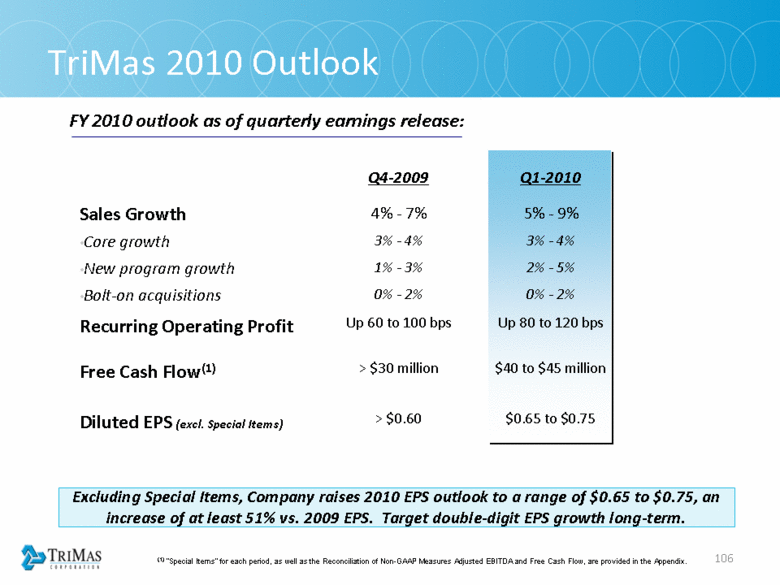
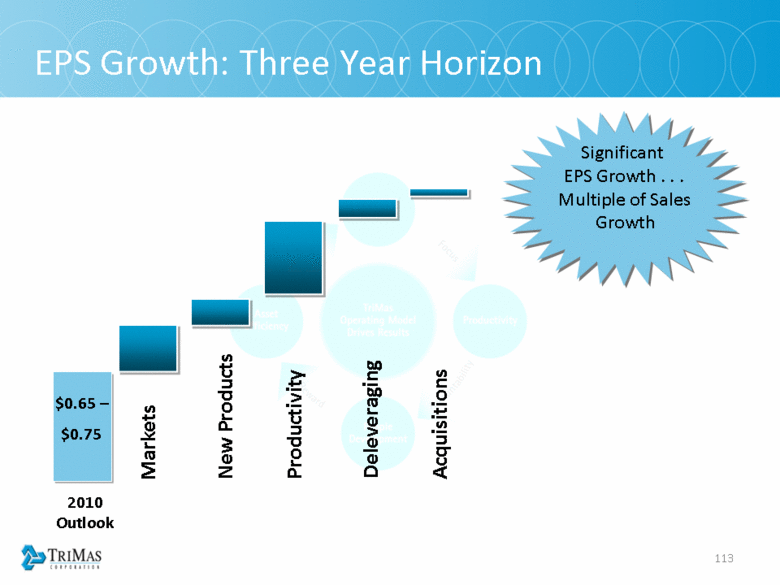
| 106 TriMas 2010 Outlook Q4-2009 Q1-2010 Sales Growth 4% - 7% 5% - 9% Core growth 3% - 4% 3% - 4% New program growth 1% - 3% 2% - 5% Bolt-on acquisitions 0% - 2% 0% - 2% Recurring Operating Profit Up 60 to 100 bps Up 80 to 120 bps Free Cash Flow(1) > $30 million $40 to $45 million Diluted EPS (excl. Special Items) > $0.60 $0.65 to $0.75 (1) “Special Items” for each period, as well as the Reconciliation of Non-GAAP Measures Adjusted EBITDA and Free Cash Flow, are provided in the Appendix. FY 2010 outlook as of quarterly earnings release: Excluding Special Items, Company raises 2010 EPS outlook to a range of $0.65 to $0.75, an increase of at least 51% vs. 2009 EPS. Target double-digit EPS growth long-term. |
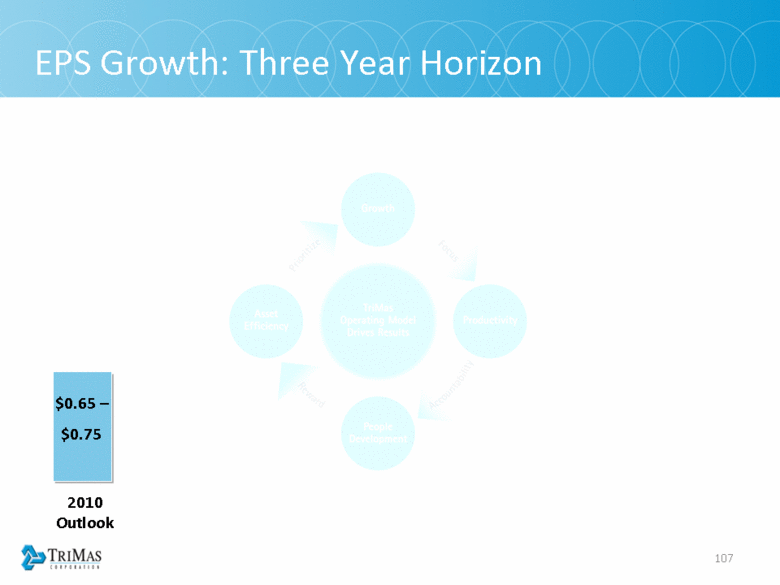
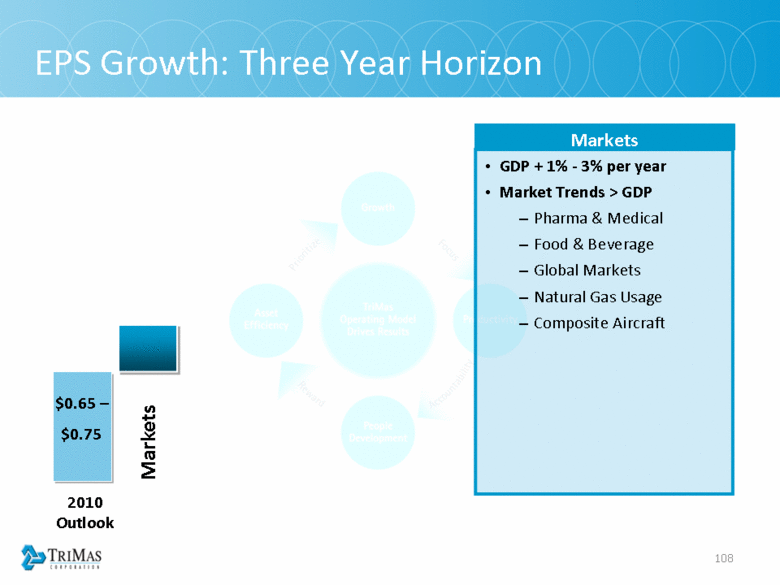
| 107 EPS Growth: Three Year Horizon 2010 Outlook $0.65 – $0.75 |
| 108 EPS Growth: Three Year Horizon GDP + 1% - 3% per year Market Trends > GDP Pharma & Medical Food & Beverage Global Markets Natural Gas Usage Composite Aircraft Markets Markets 2010 Outlook $0.65 – $0.75 |
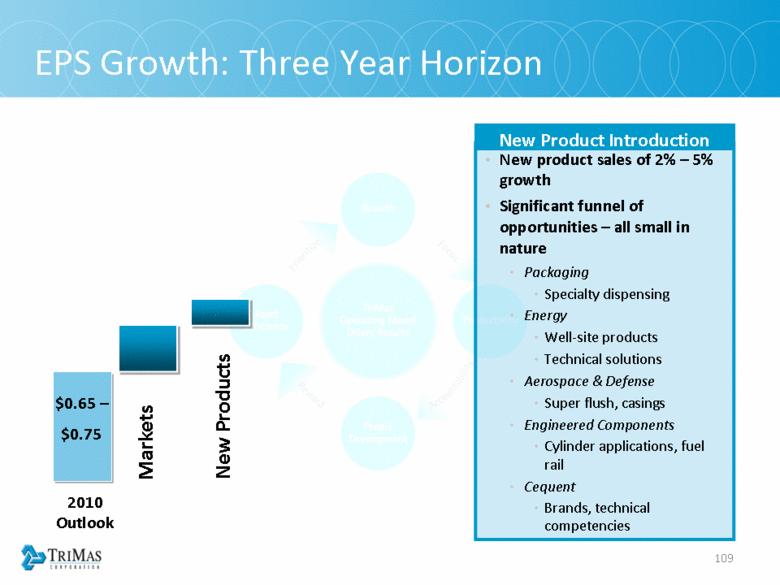
| 109 EPS Growth: Three Year Horizon New product sales of 2% – 5% growth Significant funnel of opportunities – all small in nature Packaging Specialty dispensing Energy Well-site products Technical solutions Aerospace & Defense Super flush, casings Engineered Components Cylinder applications, fuel rail Cequent Brands, technical competencies New Product Introduction New Products Markets 2010 Outlook $0.65 – $0.75 |
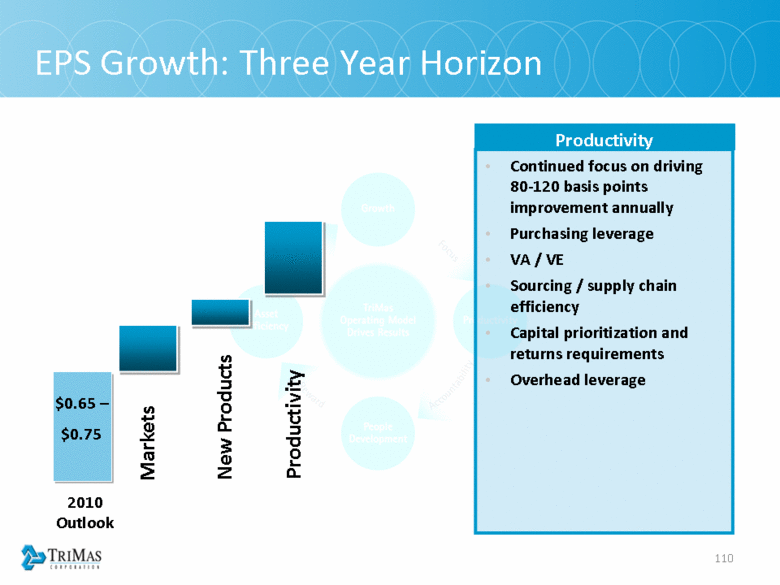
| 110 EPS Growth: Three Year Horizon Continued focus on driving 80-120 basis points improvement annually Purchasing leverage VA / VE Sourcing / supply chain efficiency Capital prioritization and returns requirements Overhead leverage Productivity New Products Markets Productivity 2010 Outlook $0.65 – $0.75 |
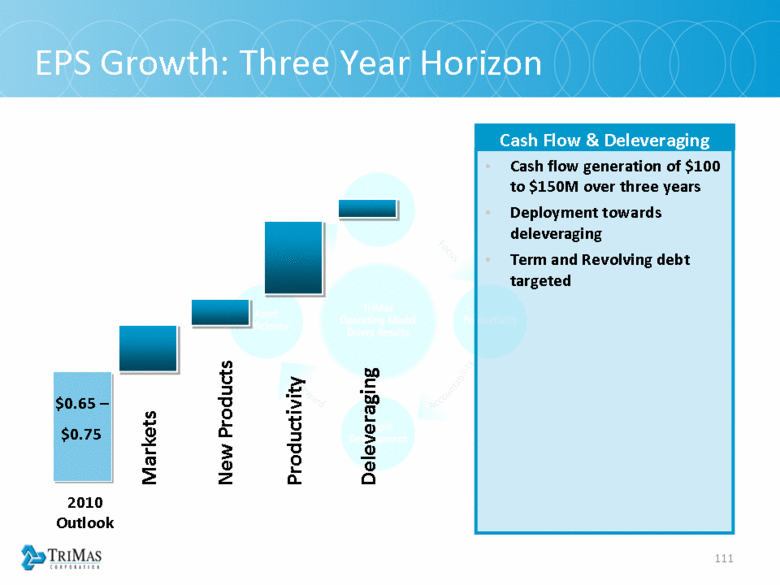
| 111 EPS Growth: Three Year Horizon Cash flow generation of $100 to $150M over three years Deployment towards deleveraging Term and Revolving debt targeted Cash Flow & Deleveraging New Products Markets Productivity Deleveraging 2010 Outlook $0.65 – $0.75 |
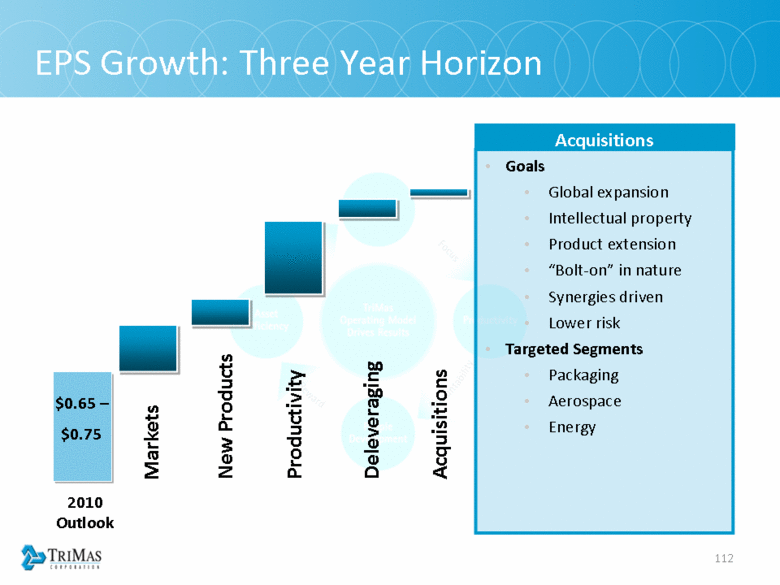
| 112 EPS Growth: Three Year Horizon Goals Global expansion Intellectual property Product extension “Bolt-on” in nature Synergies driven Lower risk Targeted Segments Packaging Aerospace Energy Acquisitions New Products Markets Productivity Deleveraging Acquisitions 2010 Outlook $0.65 – $0.75 |
| 113 EPS Growth: Three Year Horizon Significant EPS Growth . . . Multiple of Sales Growth New Products Markets Productivity Deleveraging Acquisitions 2010 Outlook $0.65 – $0.75 |
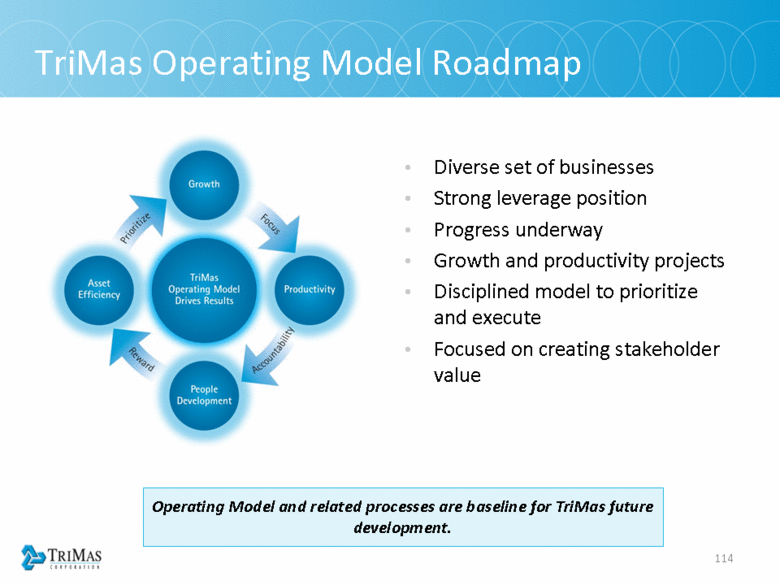
| 114 TriMas Operating Model Roadmap Diverse set of businesses Strong leverage position Progress underway Growth and productivity projects Disciplined model to prioritize and execute Focused on creating stakeholder value Operating Model and related processes are baseline for TriMas future development. |
| Questions and Answers All |
| Closing Dave Wathen • President & CEO |
| 117 TriMas • Key Messages Collection of diverse businesses with common characteristics Highly-engineered products serving defensible, focused markets TriMas Operating Model is working well and delivering results Strong continuous productivity – used to fund growth, drive additional productivity, enhance margin, generate cash and offset inflation Many small, well-managed growth programs add up to on-going incremental revenue Business units managed by experienced leaders and industry experts Focused on continually enhancing stakeholder value. |
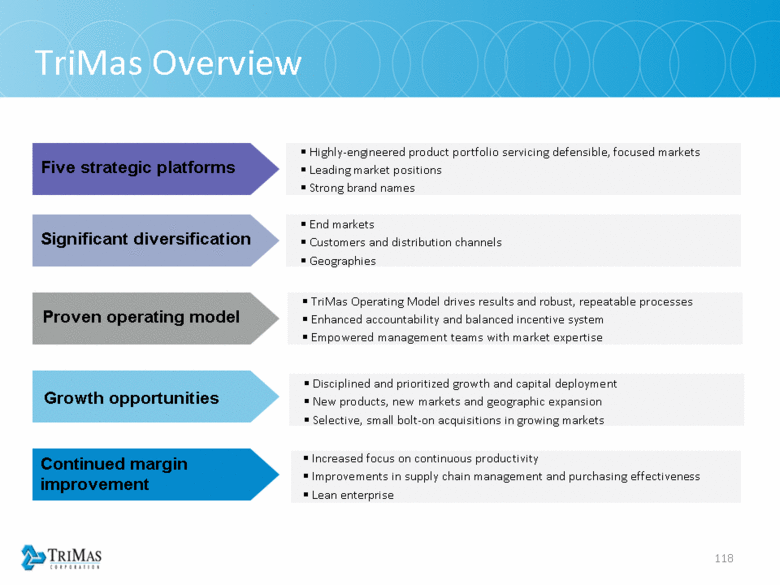
| 118 TriMas Overview Five strategic platforms Highly-engineered product portfolio servicing defensible, focused markets Leading market positions Strong brand names Significant diversification End markets Customers and distribution channels Geographies Proven operating model TriMas Operating Model drives results and robust, repeatable processes Enhanced accountability and balanced incentive system Empowered management teams with market expertise Growth opportunities Disciplined and prioritized growth and capital deployment New products, new markets and geographic expansion Selective, small bolt-on acquisitions in growing markets Continued margin improvement Increased focus on continuous productivity Improvements in supply chain management and purchasing effectiveness Lean enterprise |
| TriMas Analyst Day NASDAQ MarketSite • May 13 2010 |
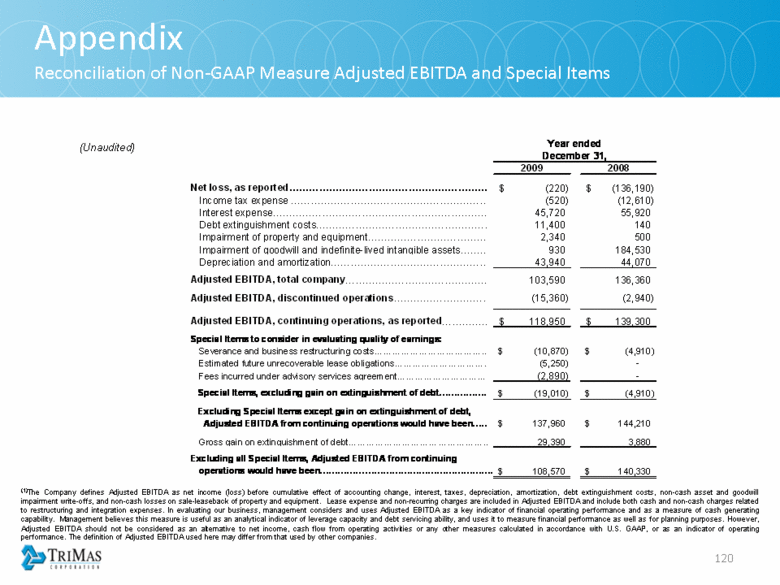
| 120 Appendix Reconciliation of Non-GAAP Measure Adjusted EBITDA and Special Items (1)The Company defines Adjusted EBITDA as net income (loss) before cumulative effect of accounting change, interest, taxes, depreciation, amortization, debt extinguishment costs, non-cash asset and goodwill impairment write-offs, and non-cash losses on sale-leaseback of property and equipment. Lease expense and non-recurring charges are included in Adjusted EBITDA and include both cash and non-cash charges related to restructuring and integration expenses. In evaluating our business, management considers and uses Adjusted EBITDA as a key indicator of financial operating performance and as a measure of cash generating capability. Management believes this measure is useful as an analytical indicator of leverage capacity and debt servicing ability, and uses it to measure financial performance as well as for planning purposes. However, Adjusted EBITDA should not be considered as an alternative to net income, cash flow from operating activities or any other measures calculated in accordance with U.S. GAAP, or as an indicator of operating performance. The definition of Adjusted EBITDA used here may differ from that used by other companies. (Unaudited) (Unaudited) Year ended December 31, 2009 2008 Net loss, as reported $ (220) $ (136,190) Income tax expense (520) (12,610) Interest expense 45,720 55,920 Debt extinguishment costs 11,400 140 Impairment of property and equipment 2,340 500 Impairment of goodwill and indefinite-lived intangible assets 930 184,530 Depreciation and amortization 43,940 44,070 Adjusted EBITDA, total company 103,590 136,360 Adjusted EBITDA, discontinued operations (15,360) (2,940) Adjusted EBITDA, continuing operations, as reported $ 118,950 $ 139,300 Special Items to consider in evaluating quality of earnings: Severance and business restructuring costs $ (10,870) $ (4,910) Estimated future unrecoverable lease obligations (5,250) - Fees incurred under advisory services agreement (2,890) - Special Items, excluding gain on extinguishment of debt $ (19,010) $ (4,910) Excluding Special Items except gain on extinguishment of debt, Adjusted EBITDA from continuing operations would have been $ 137,960 $ 144,210 Gross gain on extinguishment of debt 29,390 3,880 Excluding all Special Items, Adjusted EBITDA from continuing operations would have been $ 108,570 $ 140,330 |
