 Spin-Off of TriMas’ Cequent Businesses Separation Will Create Two New, Industry-Leading Companies December 8, 2014 NASDAQ • TRS Exhibit 99.1 |
 Forward-Looking Statements Any "forward-looking" statements contained herein, including those relating to market conditions or the Company's financial condition and results, expense reductions, liquidity expectations, business goals and sales growth, involve risks and uncertainties, including, but not limited to, risks and uncertainties with respect to the Company’s plans for successfully executing the spin-off within the expected timeframe or at all, the taxable nature of the spin-off, future prospects of the companies as independent companies, general economic and currency conditions, various conditions specific to the Company's business and industry, the Company’s ability to integrate Allfast and attain the expected synergies, and the acquisition being accretive, the Company's leverage, liabilities imposed by the Company's debt instruments, market demand, competitive factors, supply constraints, material and energy costs, technology factors, litigation, government and regulatory actions, the Company's accounting policies, future trends, and other risks which are detailed in the Company's Annual Report on Form 10-K for the fiscal year ended December 31, 2013, and in the Company's Quarterly Reports on Form 10-Q. These risks and uncertainties may cause actual results to differ materially from those indicated by the forward-looking statements. All forward-looking statements made herein are based on information currently available, and the Company assumes no obligation to update any forward-looking statements. In this presentation, certain non-GAAP financial measures may be used. Reconciliations of these non-GAAP financial measures to the most directly comparable GAAP financial measure may be found at the end of this presentation or in the earnings releases available on the Company’s website. Additional information is available at www.trimascorp.com under the “Investors” section. 2 |
 Agenda • Transaction Overview • New Stand-alone Cequent • New TriMas • Summary • Questions and Answers • Appendix 3 |
 Transaction Overview |
 Strategic Rationale • Significant progress has been made over the last several years to improve and refine the portfolio and strengthen TriMas’ financial position • Thorough review of strategic options led to the decision to spin-off Cequent businesses • Spin-off will result in two independent, publicly traded companies with increased strategic flexibility • Value creation for shareholders, customers and employees: • Allows each company to pursue a more focused strategy that leverages its strengths • Optimizes the financial profiles of each company to pursue distinct investment, growth and capital allocation strategies • Provides two different and compelling investment opportunities that can be achieved in a tax efficient manner 5 We believe a tax-free spin-off will create value for shareholders, customers and employees while accelerating strategic transformation. |
 Transaction Overview • Creates two strong, highly competitive stand-alone public companies • Distribute 100% of shares to TriMas shareholders • Expected to be tax-free to TriMas’ U.S. shareholders • Completion targeted for mid-year 2015 • Subject to customary closing conditions, final approval by the TriMas Board of Directors and tax-free opinion • Third party and legal entity reorganization-related expenses estimated to be approximately $20 million over the next several quarters 6 Transaction will result in two companies better positioned to increase long-term value for shareholders. |
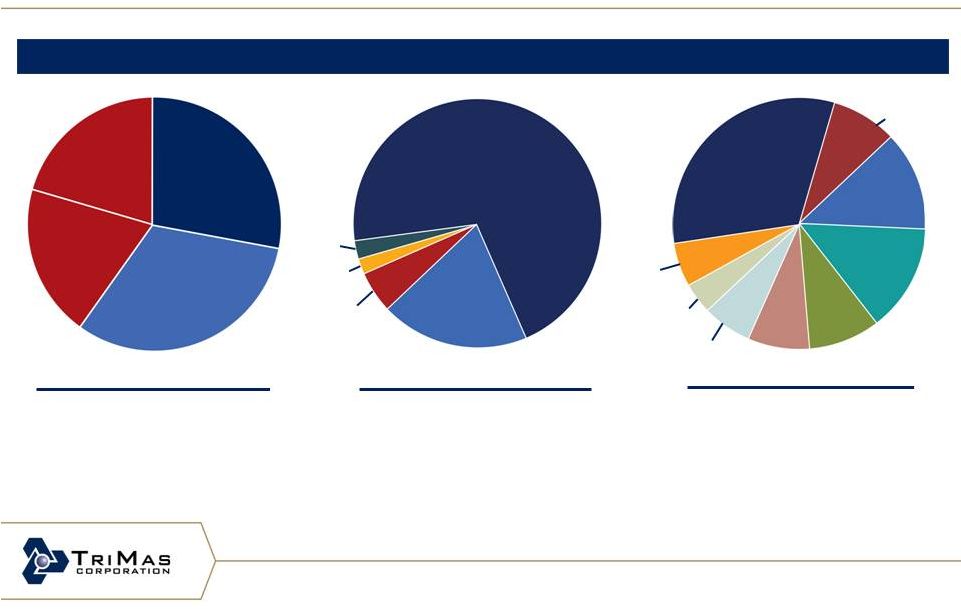
 7 Creating Two Strong Public Companies (TTM figures as 9/30/14; Dollars in millions; from continuing operations) Two independent publicly traded companies with unique characteristics. New TriMas New “Cequent” • TTM Revenue: $855 million • TTM Segment Operating Profit (1) : $131 million • Operating Margin (1) %: ~15% • President & CEO: Dave Wathen • TTM Revenue: $614 million • TTM Segment Operating Profit (1) : $48 million • Operating Margin (1) %: ~8% • Future President & CEO: Mark Zeffiro PACKAGING Revenue: $335.2 Op. profit margin (1) : 23.4% AEROSPACE Revenue: $113.7 Op. profit margin: 18.8% ENERGY Revenue: $199.6 Op. profit margin (1) : 0.7% ENGINEERED COMPONENTS Revenue: $206.6 Op. profit margin: 14.5% CEQUENT AMERICAS Revenue: $445.8 Op. profit margin (1) : 7.8% CEQUENT APEA Revenue: $167.8 Op. profit margin (1) : 7.7% (1) All figures are trailing twelve months (TTM) as of September 30, 2014. Operating profit margin excludes “Special Items.” TTM figures and Special Items are provided in the Appendix. |
 Two Strong Companies with Unique Characteristics 8 Different approaches will accelerate value creation; spin-off will drive enhanced focus on distinct growth and margin improvement initiatives. TriMas Cequent Main Growth Drivers New products; growing middle-class economies; new geographies Additional content in markets already served; construction, agriculture and consumer exposure Market Share High share; narrowly focused markets High share in certain channels and geographies; broad-line provider Products IP protected; highly-engineered; many newer technologies IP protected; full-line of products with well-established brands Margins Higher margins; lower cost country manufacturing opportunities Opportunity with recent low cost country moves Customer Relationships Business to business; longer-term customer contracts Closer to consumer Auto Exposure None Medium E-commerce Impact Transactional Growth platform Outsourced Manufacturing Low Medium Material Specifications High Medium |
 Strategic Aspirations – Impact to “New” TriMas 9 GENERATE high single-digit top-line growth INVEST in growing end markets through new products, global expansion and acquisitions ENHANCE margins through productivity initiatives, leveraging costs and business mix GROW earnings faster than revenue growth OPTIMIZE capital structure STRIVE to be a great place to work Neutral Impact of Spin-off: Neutral Spin-off of Cequent accelerates TriMas’ achievement of its Strategic Aspirations. |
 New Stand-alone “Cequent” |
 Cequent – A Growing Global Company • Margin expansion • “Heavy lifting” complete – optimization • Product line assessments • Acquisition improvement • Global/local customer-centric growth platforms • Asia • South America • Europe • Africa • Capital allocation 11 Cequent Net Sales (includes Cequent APEA and Cequent Americas segments) (1) Operating profit excludes “Special Items” and corporate expense (in calculation of segment contribution). Special Items and separate Cequent APEA and Cequent Americas financial data for each period are provided in the Appendix. ($ in millions) Net Sales & Operating Profit Margins (1) Key Initiatives Financial Snapshot Globalize presence; increase margins and return on invested capital. $373 $529 5.1% 9.6% 9.9% 9.5% $415 $478 8.2% $589 $614 7.8% 2009 2010 2011 2012 2013 TTM 9/30/14 |
 Cequent – A Unique Position as a Global Market Leader 12 • Market leader in North America and Asia • Footprint established for emerging markets • Recent acquisitions to penetrate the European market • Portfolio of well-established brands serving each channel • Leverage existing product and customer relationships for global growth • Broadest product set available • Market-leading products • Flexibility to serve current and future transportation trends OES Retail/ E-commerce OEM Aftermarket Approximate Revenue (1) By: North America Asia Pacific Africa Europe South America Heavy Duty Towing Hitches Trailer Accessories Towing Accessories Brake Controllers Cargo Management Vehicle Protection Electrical Other Channel Geography Product Position as one global company for customers – only global provider with full product line. (1) Based on management estimates. |
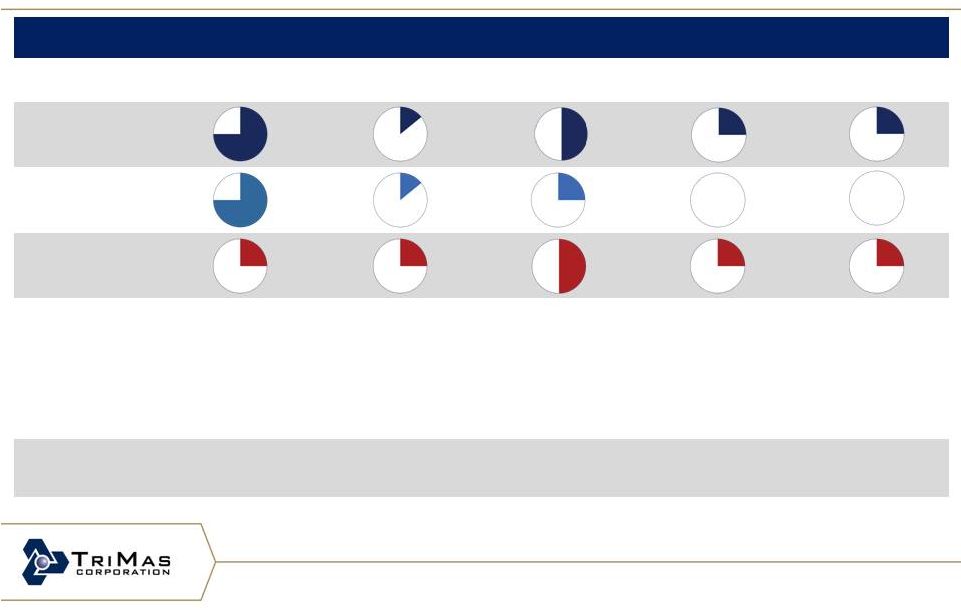 Cequent – Opportunities for the Future Following our major customers into key regional markets; opportunities to drive enhanced growth, margins and ROIC. 13 Future Opportunities for Cequent Product Set (1) North America Europe Asia Pacific Africa South America Aftermarket Retail/ E-commerce OEM/OES Key Initiatives • Expand TriMotive (OEM/OES) presence • Drive improvement in manufacturing footprint and costs • Participate in E-commerce expansion • Foundation in place with aftermarket and OE product set • Expand presence into Retail/E-commerce • Margin improvement of acquisitions • Low cost footprint in place • New market growth in China – in infancy • Leverage existing OE relationships • Leverage footprint in South Africa • Towing common, also driven by mining sector • Leverage footprint in South America • Towing becoming more popular • Opportunities for tubular products Market Indicator (Approximate annual vehicle sales) 16M units 11M units 23M units 2M units 7M units (1) Based on management estimates – for illustrative purposes only. Opportunity potential indicated by white portion of pie. |
 Cequent – Advantages as One Global Company • Global platform for global customers • Local platform for local relevance and supply • Broadest product set • Strong brand equity • Leading technology • Talented, experienced management team 14 Opportunity to create significant shareholder value through growth, productivity and capital allocation. |
 New TriMas |
 New TriMas – Positioned for the Future • Simplified portfolio of engineered and applied products • Well-positioned in attractive growth and higher margin markets within Packaging and Aerospace • Multiple platforms for long-term organic and acquisition growth • Strong brand recognition and customer loyalty driven by quality, speed, agility and innovation • Higher margins with opportunities for continued improvement Spin-off better positions TriMas to drive its strategic initiatives of organic revenue growth and margin expansion. 16 |
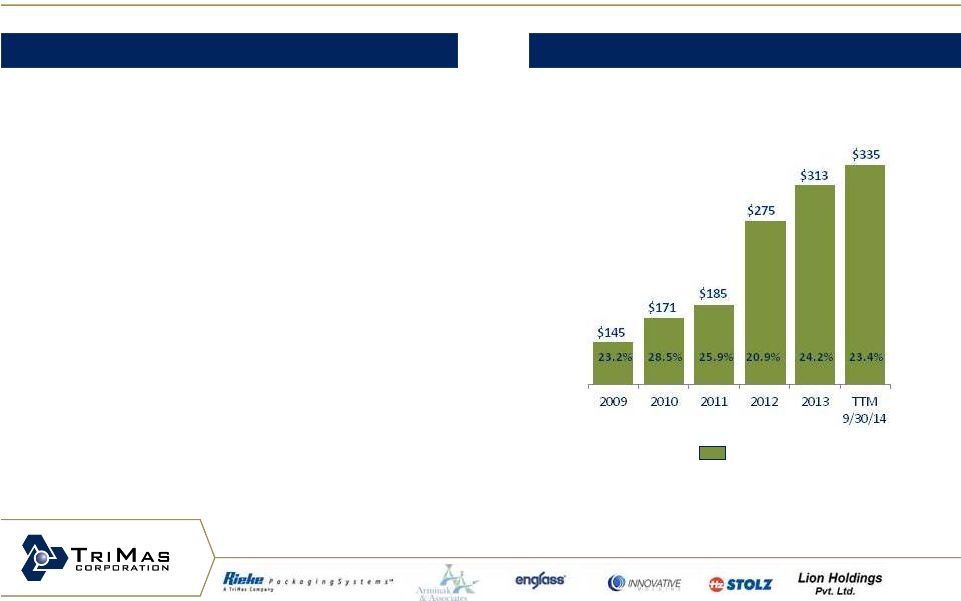 Packaging (1) Operating profit excludes “Special Items” and corporate expense (in calculation of segment contribution). Special Items for each period are provided in the Appendix. 23.2% 28.5% 25.9% 21.8% • Target specialty dispensing and closure products in higher growth end markets • Beverage, food, nutrition, personal care and pharmaceutical • Increase focus on Asian market and other emerging market opportunities • Ramp-up plants in Asia to improve cost structure and flexibility • Provide customized solutions focused on intellectual property, customer needs, differentiation and delivery speed • Further integrate acquisitions into global sales network, while expanding margins Key Initiatives Net Sales Financial Snapshot ($ in millions) Net Sales & Operating Profit Margins (1) Proven model for product development and growth. 17 |
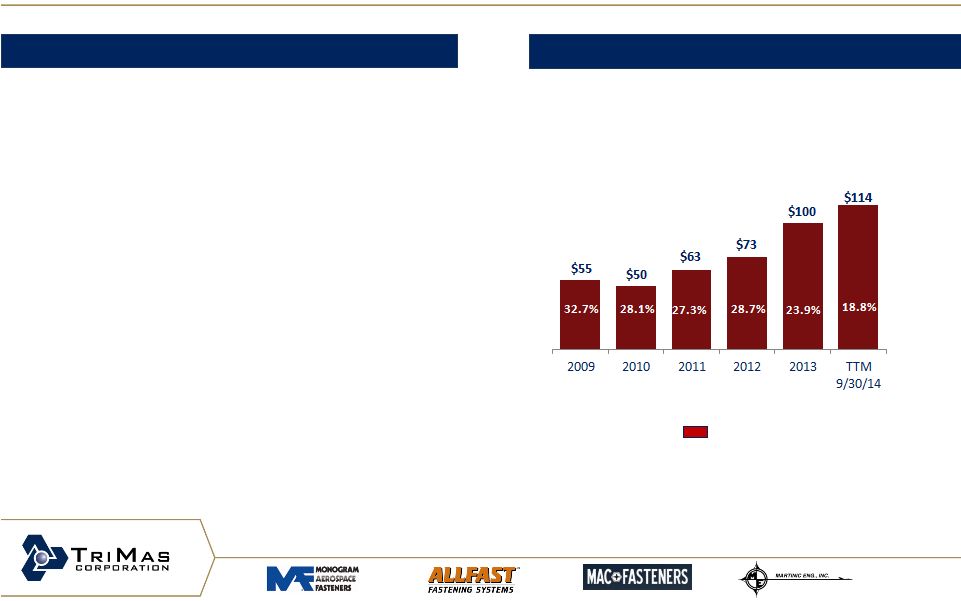 Aerospace • Integrate Allfast Fastening Systems • Optimize Martinic Engineering and Mac Fasteners acquisitions • Expand aerospace fastener product lines to increase content and applications per aircraft • Leverage positive end market trends including composite aircraft and robotic assembly • Capture incremental opportunities in emerging markets • Drive ongoing lean initiatives 18 (1) Operating profit excludes “Special Items” and corporate expense (in calculation of segment contribution). Special Items for each period are provided in the Appendix. Net Sales Key Initiatives Financial Snapshot Combining four distinct businesses into TriMas Aerospace to drive an integrated go-to-market strategy and margin expansion. ($ in millions) Net Sales & Operating Profit Margins (1) |
 Energy Energy • Optimize and refine manufacturing footprint and branch strategy • Reduce costs of standard products – preliminary decision to move portion of Houston facility to new Lamons facility in Mexico • Design and sell additional highly-engineered specialty products • Vertically integrate, maximize supply chain and drive lean initiatives to lower costs and improve margins • Install upgraded SIOP processes to reduce cycle time and inventory • Expand business capabilities with major customers globally 19 Net Sales (1) Operating profit excludes “Special Items” and corporate expense (in calculation of segment contribution). Special Items for each period are provided in the Appendix. ($ in millions) Net Sales & Operating Profit Margins (1) Key Initiatives Financial Snapshot Focus on increasing margins and optimizing the footprint. |
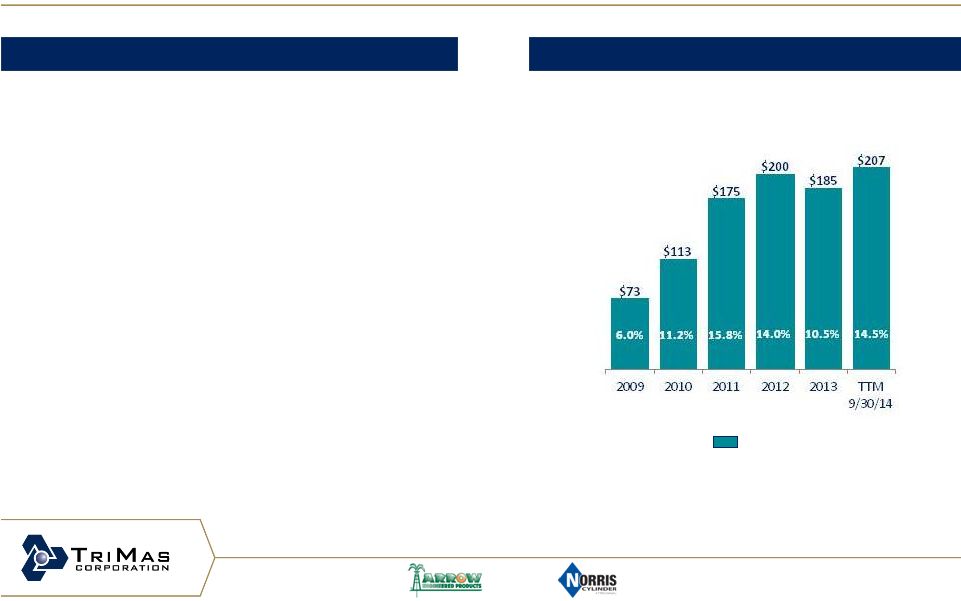 Engineered Components • Expand complementary product lines at well-site and grow compression products • Grow products to support the shift toward increased use of natural gas and production in shale formations • Further integrate cost structure of cylinder acquisition • Continue to expand product offering and geographies 20 Net Sales (1) Operating profit excludes “Special Items” and corporate expense (in calculation of segment contribution). Special Items for each period are provided in the Appendix. ($ in millions) Net Sales & Operating Profit Margins (1) Key Initiatives Financial Snapshot Create new products and new applications; capture emerging market growth. |
 Summary |
 Summary • We believe the decision to spin-off the Cequent businesses is the next step in transforming and improving TriMas • We believe this transaction will create value for shareholders, customers and employees • Spin-off will result in two independent, publicly traded companies with increased strategic flexibility • We have established a comprehensive plan which we are focused on executing • More information to come; plan on a mid-2015 completion 22 We believe a tax-free spin-off of our Cequent businesses will accelerate our strategic transformation and create value for shareholders, customers and employees. |
 Strategic Aspirations 23 GENERATE high single-digit top-line growth INVEST in growing end markets through new products, global expansion and acquisitions ENHANCE margins through productivity initiatives, leveraging costs and business mix GROW earnings faster than revenue growth OPTIMIZE capital structure STRIVE to be a great place to work |
 Questions and Answers |
 Appendix |
 Business Segment TTM Financial Information 26 (Unaudited, dollars in thousands) Trailing Twelve Months 12/31/2013 3/31/2014 6/30/2014 9/30/2014 9/30/2014 Packaging Net sales...................................................................................................... 78,220 $ 81,430 $ 86,250 $ 89,320 $ 335,220 $ Operating profit.............................................................................................. 18,220 $ 18,360 $ 20,540 $ 20,770 $ 77,890 $ Special Items to consider in evaluating operating profit: Severance and business restructuring costs.............................................. - $ - $ - $ 620 $ 620 $ Excluding Special Items, operating profit would have been………….. 18,220 $ 18,360 $ 20,540 $ 21,390 $ 78,510 $ Energy Net sales...................................................................................................... 44,160 $ 52,780 $ 52,320 $ 50,290 $ 199,550 $ Operating profit (loss)..................................................................................... (3,910) $ 2,600 $ (630) $ (1,100) $ (3,040) $ Special Items to consider in evaluating operating profit: Severance and business restructuring costs.............................................. - $ - $ 2,350 $ 2,080 $ 4,430 $ Excluding Special Items, operating profit would have been……………….. (3,910) $ 2,600 $ 1,720 $ 980 $ 1,390 $ Aerospace Net sales...................................................................................................... 27,300 $ 27,180 $ 31,820 $ 27,410 $ 113,710 $ Operating profit.............................................................................................. 7,010 $ 4,850 $ 5,690 $ 3,870 $ 21,420 $ Engineered Components Net sales...................................................................................................... 41,540 $ 55,430 $ 54,320 $ 55,310 $ 206,600 $ Operating profit.............................................................................................. 5,000 $ 7,880 $ 8,950 $ 8,090 $ 29,920 $ "New TriMas" Net sales 191,220 $ 216,820 $ 224,710 $ 222,330 $ 855,080 $ Operating profit 26,320 $ 33,690 $ 34,550 $ 31,630 $ 126,190 $ Total Special Items to consider in evaluating operating profit - $ - $ 2,350 $ 2,700 $ 5,050 $ Excluding Special Items, operating profit would have been 26,320 $ 33,690 $ 36,900 $ 34,330 $ 131,240 $ Operating profit margin excluding special items 13.8% 15.5% 16.4% 15.4% 15.3% Quarter To Date …………………………………………………………………………. ………………………………………………………………… ………….. …………. (2) (1) |
 Business Segment TTM Financial Information (cont.) 27 (Unaudited, dollars in thousands) Cequent APEA Net sales...................................................................................................... 40,290 $ 39,470 $ 43,800 $ 44,290 $ 167,850 $ Operating profit.............................................................................................. 4,620 $ 2,500 $ 2,220 $ 3,210 $ 12,550 $ Special Items to consider in evaluating operating profit: Severance and business restructuring costs.................................................. - $ - $ - $ 380 $ 380 $ Excluding Special Items, operating profit would have been............................ 4,620 $ 2,500 $ 2,220 $ 3,590 $ 12,930 $ Cequent Americas Net sales...................................................................................................... 88,680 $ 109,090 $ 134,490 $ 113,500 $ 445,760 $ Operating profit (loss)..................................................................................... (12,180) $ 5,710 $ 16,940 $ 8,660 $ 19,130 $ Special Items to consider in evaluating operating profit (loss): Severance and business restructuring costs.................................................. 13,000 $ 980 $ 1,460 $ 360 $ 15,800 $ Excluding Special Items, operating profit would have been............................ 820 $ 6,690 $ 18,400 $ 9,020 $ 34,930 $ "New Cequent" (2) Net sales...................................................................................................... 128,970 $ 148,560 $ 178,290 $ 157,790 $ 613,610 $ Operating profit........................................................................................... (7,560) $ 8,210 $ 19,160 $ 11,870 $ 31,680 $ Total Special Items to consider in evaluating operating profit.................... 13,000 $ 980 $ 1,460 $ 740 $ 16,180 $ Excluding Special Items, operating profit would have been.................. 5,440 $ 9,190 $ 20,620 $ 12,610 $ 47,860 $ Operating profit margin excluding special items 4.2% 6.2% 11.6% 8.0% 7.8% Corporate Expenses Operating loss............................................................................................... (8,320) $ (9,640) $ (9,270) $ (11,230) $ (38,460) $ TriMas Total Company Net sales...................................................................................................... 320,190 $ 365,380 $ 403,000 $ 380,120 $ 1,468,690 $ Operating profit........................................................................................... 10,440 $ 32,260 $ 44,440 $ 32,270 $ 119,410 $ Total Special Items to consider in evaluating operating profit.................... 13,000 $ 980 $ 3,810 $ 3,440 $ 21,230 $ Excluding Special Items, operating profit would have been.................. 23,440 $ 33,240 $ 48,250 $ 35,710 $ 140,640 $ Operating profit margin excluding special items 7.3% 9.1% 12.0% 9.4% 9.6% (1) Results have been adjusted for the discontinued operations of NI in the third quarter 2014 (2) Represents operating results before corporate expense allocations Discontinued Operations (1) Net sales......................................................................................................................................... 3,240 $ 2,360 $ 980 $ - $ 6,580 $ Operating profit............................................................................................................................... 1,420 $ 330 $ (400) $ - $ 1,350 $ Trailing Twelve Months 12/31/2013 3/31/2014 6/30/2014 9/30/2014 9/30/2014 Quarter To Date |
 Cequent – Historical Breakdown by Segment 28 (Unaudited, dollars in thousands) Trailing Twelve Months 12/31/2009 12/31/2010 12/31/2011 12/31/2012 12/31/2013 9/30/2014 Cequent APEA Net sales....................................................................................... 63,930 $ 75,990 $ 94,290 $ 128,560 $ 151,620 $ 167,850 $ Operating profit............................................................................... 7,990 $ 12,050 $ 13,900 $ 12,300 $ 13,920 $ 12,550 $ Special Items to consider in evaluating operating profit: Severance and business restructuring costs................................... 270 $ - $ - $ 3,150 $ - $ 380 $ Excluding Special Items, operating profit would have been............. 8,260 $ 12,050 $ 13,900 $ 15,450 $ 13,920 $ 12,930 $ Cequent Americas Net sales....................................................................................... 309,020 $ 339,270 $ 383,710 $ 400,400 $ 437,280 $ 445,760 $ Operating profit (loss)...................................................................... (3,160) $ 27,840 $ 32,730 $ 27,420 $ 8,850 $ 19,130 $ Special Items to consider in evaluating operating profit (loss): Severance and business restructuring costs................................... 13,820 $ - $ 520 $ 7,530 $ 25,570 $ 15,800 $ Excluding Special Items, operating profit would have been............. 10,660 $ 27,840 $ 33,250 $ 34,950 $ 34,420 $ 34,930 $ "New Cequent" (1) Net sales...................................................................................... 372,950 $ 415,260 $ 478,000 $ 528,960 $ 588,900 $ 613,610 $ Operating profit............................................................................ 4,830 $ 39,890 $ 46,630 $ 39,720 $ 22,770 $ 31,680 $ Total Special Items to consider in evaluating operating profit.... 14,090 $ - $ 520 $ 10,680 $ 25,570 $ 16,180 $ Excluding Special Items, operating profit would have been... 18,920 $ 39,890 $ 47,150 $ 50,400 $ 48,340 $ 47,860 $ Operating profit margin excluding special items 5.1% 9.6% 9.9% 9.5% 8.2% 7.8% (1) Represents operating results before corporate expense allocations Year To Date |