Exhibit 99.3

| | |
 | | Forecast Update December 2015 |
Introduction
The Forecast Update provides revised information about Nova Scotia’s fiscal outlook, including updated information about the major components of revenue and expenses as set out in the 2015–2016 Budget Estimates.
While Departmental Expenses are within 0.05 per cent of budget, revenue has been vulnerable to negative swings driven by economic and other factors.
Relative to the 2015–2016 Budget, the forecasted deficit is projected to grow due to decreased revenue growth and negative Prior Year Adjustments which reduce revenue.
| • | | There is continued vulnerability in the Province’s fiscal position. |
| • | | Progress has been made in expense areas under immediate decision-making of government, such as Departmental Expenses. |
| • | | Fiscal discipline, including controlling spending, is necessary to achieve sustainable finances, which is important as it allows Government to invest in priority areas such as healthcare and education. |
1
| | |
| Forecast Update December 2015 | |  |
Overview
The Province of Nova Scotia is forecasting a deficit of $241.2 million for 2015–2016, an increase of $143.6 million from the Budget of $97.6 million, and an increase of $118.6 million from the 2015 September Forecast Update.
Departmental Expenses are forecast to remain essentially as budgeted. The difference is mainly the result of revenue growing slower than expected, and negative changes to the Consolidation and Accounting Adjustments.
Provincial tax revenues are forecasted to decline by $79.5 million from the Budget Estimates. There is also $86.1 million in negative Prior Year Adjustment reducing
revenue from provincial sources. Total Provincial Revenue, including Net Income from Government Business Enterprises, is forecast to be $9.8 billion, a decrease of $135.0 million from the 2015–2016 Budget.
Total Expenses are forecast to be $10.0 billion; $4.3 million lower than budget. Marginally higher Departmental Expenses are offset by reductions to Refundable Tax Credit Expenses for Scientific Research and Experimental Development and Digital Media Tax Credits.
Changes in Consolidation and Accounting Adjustments results in a $12.9 million negative impact to the provincial deficit position.
Fiscal Summary 2015–2016 | ($ thousands) |
| | | | | | | | | | | | | | | | |
| | | Budget | | | September
Update | | | December
Update | | | Increase (Decrease)
from Budget | |
General Revenue Fund | | | | | | | | | | | | | | | | |
Revenue | | | | | | | | | | | | | | | | |
Ordinary Revenue | | | 9,036,661 | | | | 9,004,229 | | | | 8,875,122 | | | | (161,539 | ) |
Ordinary Recoveries | | | 531,238 | | | | 537,354 | | | | 537,495 | | | | 6,257 | |
Net Income from Government Business Enterprises | | | 352,109 | | | | 368,415 | | | | 372,403 | | | | 20,294 | |
| | | | | | | | | | | | | | | | |
Total Revenue | | | 9,920,008 | | | | 9,909,998 | | | | 9,785,020 | | | | (134,988 | ) |
| | | | | | | | | | | | | | | | |
Expenses | | | | | | | | | | | | | | | | |
Departmental Expenses | | | 8,910,013 | | | | 8,924,581 | | | | 8,914,457 | | | | 4,444 | |
Refundable Tax Credits | | | 150,968 | | | | 151,011 | | | | 142,344 | | | | (8,624 | ) |
Pension Valuation Adjustment | | | 90,654 | | | | 90,654 | | | | 90,654 | | | | — | |
Debt Servicing Costs | | | 872,612 | | | | 869,571 | | | | 872,478 | | | | (134 | ) |
| | | | | | | | | | | | | | | | |
Total Expenses | | | 10,024,247 | | | | 10,035,817 | | | | 10,019,933 | | | | (4,314 | ) |
| | | | | | | | | | | | | | | | |
Consolidation and Accounting | | | | | | | | | | | | | | | | |
Adjustments for Government Units | | | 6,664 | | | | 3,286 | | | | (6,245 | ) | | | (12,909 | ) |
| | | | | | | | | | | | | | | | |
Provincial Surplus (Deficit) | | | (97,575 | ) | | | (122,533 | ) | | | (241,158 | ) | | | (143,583 | ) |
| | | | | | | | | | | | | | | | |
2
| | |
| | Forecast Update December 2015 |
Revenue
Total Revenue, including Ordinary Recoveries of $537.5 million, and Net Income from Government Business Enterprises of $372.4 million, is forecast to be $9.8 billion, $135.0 million less than the 2015–2016 Budget Estimates and $125.0 million lower than the September Update.
This represents a decrease in provincial tax revenue of $79.5 million from Budget Estimates, as well as negative Prior Year Adjustments of $86.1 million from provincial sources.
Federal source revenues are forecast to be $2.6 million higher than Budget primarily as a result of a positive Prior Year Adjustment in the area of Canada Health Transfers. Ordinary Recoveries are higher by $6.3 million, and Net Income from Government Business Enterprises is up by $20.3 million, primarily as a result of higher video and other lottery revenue, and higher sales revenue at the Nova Scotia Liquor Corporation.
Provincial Tax Revenue
Personal Income Tax revenue is forecast to decline by $18.2 million or 0.7 per cent from the 2015–2016 Budget Estimates as a result of decreases in the projected yield in both 2015 (down 0.3 per cent) and 2016 (down 0.8 per cent), as well as a decline in personal taxable income in 2016 (down 0.2 per cent). These declines are partially offset by higher personal taxable income in 2015 (up 0.6 per cent). Growth in compensation of employees is lower than projected in the 2015–2016 Budget Estimates and is partially offset with higher growth in employment insurance income.
Corporate Income Tax revenue is forecast to decline by $44.9 million or 9.1 per cent from the 2015–2016 Budget Estimates. This is due to decreases in both 2015 (down 0.6 per cent) and 2016 (down 2.3 per cent) for the level of national corporate taxable income based upon federal estimates. The province’s projected share of taxable income is down 2.8 per cent in 2015 and 1.8 per cent in 2016. The combination of these factors reduces the province’s corporate taxable income by $146 million in 2015 and by $182 million in 2016.
Harmonized Sales Tax revenue is forecast to decline by $3.6 million or 0.2 per cent from the 2015–2016 Budget Estimates primarily as a result of lower forecasts for consumer expenditure growth in both 2015 (down 0.7 per cent) and 2016 (down 1.5 per cent). This is partially offset by higher than projected growth in residential housing investment in 2015 (up 6.0 per cent) and 2016 (up 2.0 per cent).
Motive Fuel Tax revenue is forecast to be down $5.0 million or 1.9 per cent from the 2015–2016 Budget Estimates based upon lower projected consumption of both gasoline (down 0.6 per cent) and diesel oil (down 4.0 per cent), primarily as the result of lower levels of labour income forecasted for both 2015 and 2016.
Tobacco Tax revenue is forecast to decline by $5.3 million or 2.4 per cent from the 2015–2016 Budget Estimates as a result of the province’s ban on flavoured tobacco products and declines in consumption. This is partially offset by the Consumer Price Index for tobacco products growing slower than previously estimated.
3
| | |
| Forecast Update December 2015 | | |
Ordinary Revenue 2015–2016 | ($ thousands) |
| | | | | | | | | | | | | | | | |
| | | Budget | | | September
Update | | | December
Update | | | Increase (Decrease)
from Budget | |
Provincial Revenue Sources | | | | | | | | | | | | | | | | |
Tax Revenue: | | | | | | | | | | | | | | | | |
Personal Income Tax | | | 2,524,962 | | | | 2,510,833 | | | | 2,506,780 | | | | (18,182 | ) |
Corporate Income Tax | | | 493,193 | | | | 486,135 | | | | 448,279 | | | | (44,914 | ) |
Harmonized Sales Tax | | | 1,761,253 | | | | 1,754,646 | | | | 1,757,693 | | | | (3,560 | ) |
Motive Fuel Taxes | | | 262,276 | | | | 258,767 | | | | 257,323 | | | | (4,953 | ) |
Tobacco Tax | | | 217,792 | | | | 213,462 | | | | 212,498 | | | | (5,294 | ) |
Other Tax Revenue | | | 158,855 | | | | 157,899 | | | | 156,209 | | | | (2,646 | ) |
| | | | | | | | | | | | | | | | |
| | | 5,418,331 | | | | 5,381,742 | | | | 5,338,782 | | | | (79,549 | ) |
Other Provincial Revenue: | | | | | | | | | | | | | | | | |
Registry of Motor Vehicles | | | 126,949 | | | | 126,830 | | | | 127,724 | | | | 775 | |
Royalties – Petroleum | | | 19,405 | | | | 17,986 | | | | 16,767 | | | | (2,638 | ) |
Other Provincial Sources | | | 142,609 | | | | 144,535 | | | | 144,648 | | | | 2,039 | |
TCA Cost Shared Revenue | | | 1,750 | | | | 1,750 | | | | 1,994 | | | | 244 | |
Other Fees and Charges | | | 63,176 | | | | 63,684 | | | | 63,220 | | | | 44 | |
Prior Years’ Adjustments | | | — | | | | — | | | | (86,100 | ) | | | (86,100 | ) |
| | | | | | | | | | | | | | | | |
| | | 353,889 | | | | 354,785 | | | | 268,253 | | | | (85,636 | ) |
Investment Income: | | | | | | | | | | | | | | | | |
Interest Revenues | | | 79,031 | | | | 79,629 | | | | 78,110 | | | | (921 | ) |
Sinking Fund Earnings | | | 99,549 | | | | 99,477 | | | | 101,525 | | | | 1,976 | |
| | | | | | | | | | | | | | | | |
| | | 178,580 | | | | 179,106 | | | | 179,635 | | | | 1,055 | |
| | | | | | | | | | | | | | | | |
Total – Provincial Revenue Sources | | | 5,950,800 | | | | 5,915,633 | | | | 5,786,670 | | | | (164,130 | ) |
Federal Revenue Sources | | | | | | | | | | | | | | | | |
Equalization Payments | | | 1,768,921 | | | | 1,768,921 | | | | 1,768,921 | | | | — | |
Canada Health Transfer | | | 896,863 | | | | 896,863 | | | | 895,694 | | | | (1,169 | ) |
Canada Social Transfer | | | 341,579 | | | | 341,579 | | | | 341,134 | | | | (445 | ) |
Offshore Accord Offset Payments | | | 36,779 | | | | 36,779 | | | | 36,779 | | | | — | |
Crown Share | | | 7,437 | | | | 7,470 | | | | 5,372 | | | | (2,065 | ) |
Other Federal Sources | | | 2,319 | | | | 5,021 | | | | 4,762 | | | | 2,443 | |
TCA Cost Shared Revenue | | | 31,963 | | | | 31,963 | | | | 31,991 | | | | 28 | |
Prior Years’ Adjustments | | | — | | | | — | | | | 3,799 | | | | 3,799 | |
| | | | | | | | | | | | | | | | |
Total – Federal Revenue Sources | | | 3,085,861 | | | | 3,088,596 | | | | 3,088,452 | | | | 2,591 | |
Total – Ordinary Recoveries | | | 531,238 | | | | 537,354 | | | | 537,495 | | | | 6,257 | |
Net Income from | | | | | | | | | | | | | | | | |
Government Business Enterprises (GBE) | | | | | | | | | | | | | | | | |
Nova Scotia Liquor Corporation | | | 228,229 | | | | 229,690 | | | | 234,706 | | | | 6,477 | |
Nova Scotia Provincial Lotteries and Casino Corporation | | | 111,300 | | | | 125,300 | | | | 123,200 | | | | 11,900 | |
Halifax-Dartmouth Bridge Commission | | | 11,607 | | | | 12,452 | | | | 13,524 | | | | 1,917 | |
Highway 104 Western Alignment Corporation | | | 973 | | | | 973 | | | | 973 | | | | — | |
| | | | | | | | | | | | | | | | |
Total – Net Income from GBE | | | 352,109 | | | | 368,415 | | | | 372,403 | | | | 20,294 | |
| | | | | | | | | | | | | | | | |
Total Revenue | | | 9,920,008 | | | | 9,909,998 | | | | 9,785,020 | | | | (134,988 | ) |
| | | | | | | | | | | | | | | | |
4
| | |
| | Forecast Update December 2015 |
Other Provincial Sources
Other Provincial Revenues are forecast to be down by $85.6 million or 24.2 per cent from Budget Estimates. The decrease results primarily from negative Prior Year Adjustments, totaling $86.1 million, from major revenue sources.
Offshore Royalty revenue is forecast to decline by $2.6 million or 13.6 per cent from the 2015–2016 Budget Estimates based upon continued weakness of natural gas prices and the in-year impact of a revised forecast for decommissioning (abandonment) costs for the Sable Offshore Energy Project.
The negative $86.1 million Prior Year Adjustments are allocated as follows:
| • | | Personal Income Tax +$70.4 million (2014 yield) |
| • | | Corporate Income Tax -$65.2 million (2014 share) |
| • | | Offshore Royalties -$98.2 million (decommissioning estimate) |
| • | | Harmonized Sales Tax +$10.4 million (revised 2014 tax base) |
| • | | Capital Tax -$3.0 million (re-assessment) |
| • | | Crown Share -$0.5 million (2014 profitability) |
Other Provincial Sources revenue is up $2.0 million or 1.4 per cent primarily from fees at the Securities Commission and Pharmacare premiums.
Investment Income is forecast to be $1.1 million or 0.6 per cent higher than the Budget Estimates and $0.5 million higher than the September Update, primarily as a result of increased returns on sinking fund holdings.
Federal Revenue Sources
Equalization is based upon the Province’s election to receive payments calculated according to the Expert Panel approach. This is a one-estimate, one-payment approach and as a result the forecast is equal to the 2015–2016 Budget Estimates.
The Province also expects to receive a Cumulative Best-of Guarantee payment of $79.3 million in 2015–2016 pursuant to the clarification reached with the Federal Government in October 2007. An update to this forecast will be provided by the Federal Government to the Province before the end of December 2015.
The Canada Health Transfer forecast is down by $1.2 million or 0.1 per cent compared to the 2015–2016 Budget Estimates. This is based upon revised federal estimates of the Province’s share of national population released by the Federal Government in the fall of 2015.
The Canada Social Transfer forecast is down by $0.4 million or 0.1 per cent compared to the 2015–2016 Budget Estimates. This is based upon revised federal estimates of the Province’s share of national population released by the federal government in the fall of 2015. Crown Share Adjustment Payments are down by $2.1 million or 27.8 per cent from the 2015–2016 Budget Estimates as a result of reduced profitability from offshore natural resource projects.
Prior Year Adjustments from federal sources are currently forecast to be positive $3.8 million. Prior Year Adjustments result from revised federal estimates of tax point transfers and share of national population for open years and are allocated as follows:
5
| | |
| Forecast Update December 2015 | | |
| • | | Canada Health Transfer +$3.9 million |
| • | | Canada Social Transfer -$0.1 million |
Ordinary Recoveries
Ordinary Recovery revenue is forecast to be $6.3 million, or 1.2 per cent higher than budget, and mostly unchanged from the September Update.
Transportation and Infrastructure Renewal has a $1.7 million increase in its recoveries forecast primarily as a result of the repayment of a lien holder bond related to the Nova Star Ferry, partially offset by lower third-party recoveries.
The Department of Health and Wellness is forecasting an increase of $1.8 million, primarily due to reciprocal billings from other provinces for health services. Labour and Advanced Education is forecasting an increase of $1.4 million as a result of increased recoverable spending for the Canada Job Fund.
The Department of Internal Services is projecting increased recoveries of $0.9 million related to insurance costs at the Housing Authorities.
Education and Early Childhood Development is projecting $0.9 million in increased recoveries for French program services.
Net Income from Government Business Enterprises (GBE)
The total Net Income from Government Business Enterprises is forecast to be $20.3 million or 5.8 per cent higher than the Budget Estimates, and up $4.0 million from the September Update.
The Nova Scotia Provincial Lotteries and Casinos Corporation is forecasting an increase in net income of $11.9 million or 10.7 per cent as a result of higher video and other lottery revenue.
The Nova Scotia Liquor Corporation is projecting a net income increase of $6.5 million or 2.8 per cent above budget due to higher sales revenue and lower expenses.
The Halifax-Dartmouth Bridge Commission is forecasting net income to be $1.9 million or 16.5 per cent above budget primarily because of lower than expected amortization charges and operating costs.
6
| | |
| | Forecast Update December 2015 |
Expenses
Total Expenses for 2015–2016 are forecast to be $10.0 billion, $4.3 million lower than the original Budget Estimates.
Marginally higher Departmental Expenses of $4.4 million are offset by an $8.6 million
forecasted reduction of Refundable Tax Credit expenses – largely for the Scientific Research and Experimental Development and Digital Media tax credits.
Departmental Expenses 2015–2016 | ($ thousands) |
| | | | | | | | | | | | | | | | |
| | | Budget | | | September
Update | | | December
Update | | | Increase (Decrease)
from Budget | |
Agriculture | | | 61,536 | | | | 61,534 | | | | 61,535 | | | | (1 | ) |
Business | | | 114,143 | | | | 116,980 | | | | 116,980 | | | | 2,837 | |
Communities, Culture and Heritage | | | 61,837 | | | | 61,837 | | | | 61,837 | | | | — | |
Community Services | | | 915,410 | | | | 915,410 | | | | 929,808 | | | | 14,398 | |
Education and Early Childhood Development | | | 1,244,607 | | | | 1,245,453 | | | | 1,245,477 | | | | 870 | |
Energy | | | 30,160 | | | | 30,160 | | | | 30,160 | | | | — | |
Environment | | | 25,343 | | | | 25,343 | | | | 25,343 | | | | — | |
Finance and Treasury Board | | | 14,415 | | | | 14,415 | | | | 14,415 | | | | — | |
Fisheries and Aquaculture | | | 9,883 | | | | 9,880 | | | | 9,883 | | | | — | |
Health and Wellness | | | 4,137,741 | | | | 4,143,441 | | | | 4,141,441 | | | | 3,700 | |
Internal Services | | | 180,300 | | | | 180,718 | | | | 179,731 | | | | (569 | ) |
Justice | | | 327,593 | | | | 327,593 | | | | 327,593 | | | | — | |
Labour and Advanced Education | | | 362,931 | | | | 364,104 | | | | 364,301 | | | | 1,370 | |
Assistance to Universities | | | 376,084 | | | | 375,734 | | | | 375,034 | | | | (1,050 | ) |
Municipal Affairs | | | 167,474 | | | | 167,474 | | | | 160,522 | | | | (6,952 | ) |
Natural Resources | | | 82,983 | | | | 82,983 | | | | 83,352 | | | | 369 | |
Public Service | | | 200,947 | | | | 201,435 | | | | 201,360 | | | | 413 | |
Seniors | | | 1,496 | | | | 1,426 | | | | 1,385 | | | | (111 | ) |
Transportation and Infrastructure Renewal | | | 419,277 | | | | 422,808 | | | | 421,543 | | | | 2,266 | |
Restructuring Costs | | | 175,853 | | | | 175,853 | | | | 162,757 | | | | (13,096 | ) |
| | | | | | | | | | | | | | | | |
Total – Departmental Expenses | | | 8,910,013 | | | | 8,924,581 | | | | 8,914,457 | | | | 4,444 | |
| | | | | | | | | | | | | | | | |
7
| | |
| Forecast Update December 2015 | | |
Departmental Expenses
Total Departmental Expenses for 2015–2016 are forecast to be $8.9 billion or $4.4 million higher than the budget.
The Department of Business is forecasting to be $2.8 million over budget due to the divestiture of Keltic Lodge.
The Department of Community Services is forecasting to be $14.4 million over budget. The department is forecasting pressures of $8.9 million in the Disability Support program due to higher client care costs, $8.7 million in the Child, Youth and Family Support program due primarily to children in care, $4.2 million in the Pharmacare program due to new drug therapies, $2.8 million in administration due to lower than expected staff vacancy savings, and $1.4 million in Discretionary Grants. The pressures are offset by a net underspend of $11.0 million in the Employment Support and Income Assistance program due to declining caseloads as well as a net underspend of $0.6 million in various miscellaneous items.
The Department of Education and Early Childhood Development is forecasting to be $870 thousand over budget primarily due to French Language programming expenses of $847 thousand, which is recoverable from the Federal Government. There are $1.3 million in vacancy savings which are offsetting group benefit pressures and other various program pressures.
The Department of Health and Wellness is forecasting to be $3.7 million over budget primarily due to $17.9 million in the Home Care program due to increased utilization, and $2.7 million for the Personal Health Record project, which is recoverable from Canada Health Infoway, and $2.0 million for Canadian Blood
Services due to the increased exchange rate for products purchased from the United States. The pressures are offset by a net underspend in capital and other projects of $15.0 million due to project delays and changes in cash flow requirements, as well as $3.9 million net underspend in various program budgets. The Department of Internal Services is forecasting to be $569 thousand under budget primarily due to a decrease in amortization costs, which is partially offset by an increase in recoverable third party work.
The Department of Labour and Advanced Education is forecasting to be $1.4 million over budget due to federal employment programs which are recoverable from the Federal Government.
Assistance to Universities is forecasting to be $1.1 million under budget due to an adjustment to the student bursary allocation in order to properly reflect the number of Nova Scotia students studying in Nova Scotia Universities.
The Department of Municipal Affairs is forecasting to be $6.9 million under budget mainly due to the delayed implementation of the Building Canada Fund Small Communities projects of $2.8 million and Building Canada Fund National and Regional Projects of $4.1 million of which $1.4 million is recoverable from the Federal Government.
The Department of Natural Resources is forecasting to be $369 thousand over budget due to out of province fire-fighting expenses of $293 thousand which are recoverable from other provinces and operating expenses related to the Shubenacadie Wildlife Park of $76 thousand, also recoverable.
8
| | |
| | Forecast Update December 2015 |
Public Service Offices are forecasting to be $413 thousand over budget primarily due to Elections Nova Scotia costs related to the July 2015 by-elections held in Cape Breton Centre, Dartmouth South, and Sydney Whitney Pier; offset by Legislative Services under budget projection.
The Department of Transportation and Infrastructure Renewal is forecasting to be $2.3 million over budget primarily due to $3.0 million in snow and ice removal costs and equipment repairs extending into 2015–2016 and $1.0 million in funding required to conduct a feasibility study related to P3 highway tolling. These pressures are partially offset by amortization savings resulting from the timing of completion of capital projects and cost savings associated with third party recoverable work.
Overall the Restructuring Costs are forecasted to be $13.1 million under budget due to lower than anticipated funding requirements for corporate initiatives.
Refundable Tax Credits
Refundable Tax Credits are forecasted to be $8.6 million below budget. The main changes are attributable to two tax credits. The Scientific Research and Experimental Development is down by $5.0 million or 27.2 per cent from the 2015–2016 Budget. Estimates reflect lower actual amounts for 2014 based upon updated administrative data received from the federal government and the inclusion of a negative $2.5 million Prior Year Adjustment.
The Digital Media Tax Credit is down by $3.2 million or 42.2 per cent from the 2015–2016 Budget Estimates, including a negative $1.8 million Prior Year Adjustment.
Debt Servicing Costs
Total Debt Servicing Costs are forecast to be $872.5 million, which is essentially equal to the Budget Estimate but $2.9 million above the September Update because of higher interest rates.
Consolidation and Accounting Adjustments
Consolidation and accounting adjustments for government units are forecasted to be $12.9 million below budget primarily due to a $12.9 million forecast reduction in the Department of Health and Wellness capital grants.
9
| | |
| Forecast Update December 2015 | | |
Capital
Tangible Capital Assets (TCA)
The Province is forecasting capital purchase requirements to be under budget due to reduced projected spending on buildings, IT projects and land as well as a reduction in the contingency. This is partially offset by increased spending on highways and structures as well as vehicles and equipment spending.
Capital Grants
The Province is forecasting capital grant requirements to be under budget by $12.9 million mainly due to design and construction delays for South Shore Regional Hospital Expansion, North Cumberland Health Centre project and Purdy Building Services relocation and demolition.
Capital Spending 2015–2016 | ($ thousands) |
| | | | | | | | | | | | | | | | |
| | | Budget | | | September
Update | | | December
Update | | | Increase (Decrease)
from Budget | |
Highways and Structures | | | 222,470 | | | | 225,992 | | | | 225,992 | | | | 3,522 | |
Buildings | | | 112,812 | | | | 102,503 | | | | 109,379 | | | | (3,433 | ) |
Information Technology | | | 47,370 | | | | 44,990 | | | | 39,529 | | | | (7,841 | ) |
Land Purchases | | | 2,000 | | | | 1,550 | | | | 1,550 | | | | (450 | ) |
Vehicles and Equipment | | | 15,266 | | | | 15,461 | | | | 15,931 | | | | 665 | |
Contingency | | | 26,236 | | | | 23,000 | | | | 21,000 | | | | (5,236 | ) |
| | | | | | | | | | | | | | | | |
Total – Departmental | | | 426,154 | | | | 413,496 | | | | 413,381 | | | | (12,773 | ) |
Capital Grants | | | 63,846 | | | | 59,846 | | | | 50,935 | | | | (12,911 | ) |
| | | | | | | | | | | | | | | | |
Total – Capital Spending | | | 490,000 | | | | 473,342 | | | | 464,316 | | | | (25,684 | ) |
| | | | | | | | | | | | | | | | |
10
| | |
| | Forecast Update December 2015 |
Economic Performance and Outlook: 2015 and 2016
Prior to receiving results of actual tax revenues collected, the Province relies on economic forecasts and statistical relationships with historical administrative data to estimate tax revenues. Nominal Gross Domestic Product (GDP) is the broadest measure of the potential tax base, and components of nominal GDP provide indications of growth in specific tax bases, including household income, consumer expenditures, and residential construction.
External Conditions
Global economic growth is expected to fall short of prior expectations in 2015. The International Monetary Fund now expects real GDP growth of 3.1 per cent, after two downward revisions to the outlook since April. For 2016, global economic growth is expected to rise to 3.6 per cent growth.
Growth in advanced economies is strengthening but some continue to face lower investment, demographic challenges, and weak productivity growth. A recovery in the Euro Area economy continues as accommodative monetary policy, previous reforms and fiscal improvements support growth of the domestic economy. The United Kingdom continues to have solid growth.
China’s economy is slowing as it realigns towards domestic-driven growth. Volatility in the Chinese equity market and foreign exchange policy spilled over into elevated global uncertainty over the summer of 2015.
Nova Scotia is more exposed to the performance of its largest trading partners – the American and Canadian economies.
United States (US) economic growth picked up in the second (3.9%, seasonally adjusted annualized rate) and third quarter (2.1%); poor
weather and temporary shutdowns slowed growth in the first quarter (0.6%). Recent US economic expansion relied on solid growth in consumer spending, employment, business investment, and housing. Net exports have contributed less to growth as the US dollar appreciates against other major currencies. The US Federal Reserve is expected to raise policy interest rates in the short term as slack in the labour market has diminished.
In 2015, Canadian economic growth was negative over the first half of the year but returned to positive growth of 2.3 per cent (annualized) in the third quarter. Lower commodity prices, particularly crude oil, has weighed on investment in Canada’s resource sector. Domestic indicators in the most resource-intensive provinces have also turned downwards. A lower Canadian dollar and stronger US growth have lifted non-energy exports over the past year.
The effects of the oil price shock are expected to abate in the second half of 2015. The shift in the Canadian economy to non-energy sectors will continue into 2016. The Bank of Canada lowered the target for the overnight rate twice in 2015 and borrowing rates for household and business remain accommodative. Average Canadian employment growth continues to be positive, expanding 0.9 per cent over the first eleven months of the year. However, the unemployment rate has increased from 6.6 per cent in January 2015 to 7.1 per cent in November, 2015.
Overall inflation has slowed with falling energy prices, but core inflation remains above 2.0 per cent as import prices have risen with a depreciating Canadian Dollar. Forecasts of the US-Canada exchange rate expect it to remain around 75 US cents through 2016.
11
| | |
| | Forecast Update December 2015 |
Current Economic Outlook for Nova Scotia
The Department of Finance and Treasury Board has revised its economic outlook incorporating information and data released through November 10, 2015. This includes year-to-date information for 2015.
In addition, this economic outlook includes Statistics Canada’s recently released historical revisions to the Provincial Economic Accounts. This revision results in substantial changes to GDP growth and its components for 2013 and prior years. Real GDP growth for 2014 was also revised down from Statistics Canada’s preliminary estimate of 1.6 per cent.
Data released after November 10, 2015 is discussed in the Economic Performance and Key Risks and will be incorporated into future outlooks.
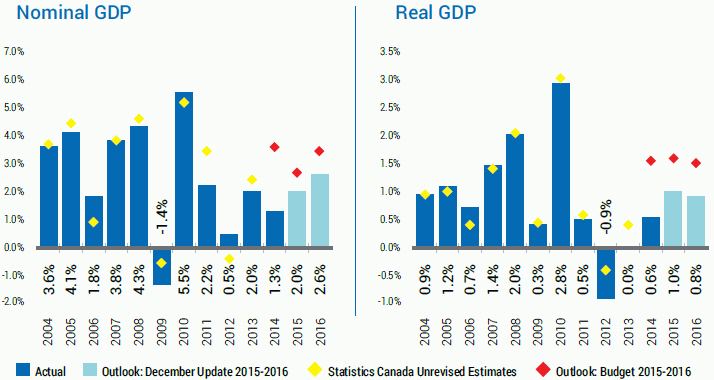
The outlook for Nova Scotia’s economy has been revised down, mainly due to Statistics Canada’s historical revisions and softer labour market
results for 2015. Since the 2015–2016 Budget, the 2015 forecast for nominal GDP growth has been reduced from 2.7 per cent to 2.0 per cent. The outlook for real GDP growth has been reduced from 1.7 per cent to 1.0 per cent.
For 2016, nominal GDP is expected to increase 2.6 per cent with compensation of employees and household consumption increasing at a slower pace than previously anticipated. Declining natural gas production is projected to be a smaller drag on export activity in 2016. Real GDP in 2016 is forecast to gain 0.8 per cent with inflation moving back closer to 2 per cent.
The Province’s forecast for 2015 real GDP growth continues to be in line with the latest private sector projections (also revised down) in the range of 0.5 to 1.8 per cent. The nominal GDP forecast also remains below the private sector average. The outlook for 2016 is below the private sector average on both measures.
| | |
| Nova Scotia GDP Growth | | (Per Cent Change) |
12
| | |
| | Forecast Update December 2015 |
Nova Scotia Economic Performance
GDP Growth: Nova Scotia’s GDP growth of 0.6 per cent in 2014 follows a year of no growth in 2013 and a 0.9 per cent decline in 2012. Growth in 2014 was supported with increased natural gas output from Deep Panuke helping to lift international exports. Household consumption activity increased as imports fell. Declines in residential construction and exports to other provinces partially offset the areas of growth. For 2015, indicators for residential construction and non-energy exports have been positive, but declining natural gas output and moderate labour income increases have weighed on the economic outlook.
Labour Market: For the first eleven months of 2015, employment and the labour force have been mostly stable. Employment grew by 0.1 per cent, while the labour force declined by 0.2 per cent. The unemployment rate has averaged 8.6 per cent through the first eleven months of 2015. Employment declined in the goods-producing sector (-1,800) with a decrease in construction and manufacturing but an increase in resources. Services-producing sectors have gained 2,400 jobs. Average weekly wages have grown 1.9 per cent over the first nine months of 2015 while employee compensation has grown by 2.0 per cent.
Inflation: The all-items Consumer Price Index inflation is up by an average of 0.3 per cent in the first ten months of 2015, relative to the same period in 2014. Lower oil prices have dropped the Nova Scotia energy index by 14.1 per cent and food prices are up 4.5 per cent.
Retail Sales: Retail sales picked up from a sharp decline over the winter months but continue to be weighed down with the lower value of sales at gasoline stations. Excluding gasoline station sales, retail sales are up 3.0 per cent due to increased sales from motor vehicles and parts dealers and to a lesser extent sales at health and general merchandise stores.
Construction: Housing activity rebounded in 2015 with growth of 11.3 per cent in residential investments for the first three quarters of the year. Residential building permits and housing starts have had several very positive months with increased construction of multi-unit dwellings. However, resale home prices in Halifax have been flat. For the first three quarters of 2015, non-residential building investment is up 7.6 per cent with a pickup in Halifax commercial building construction offsetting declines in the industrial and institutional, and governmental sectors.
International Exports: In 2015, Nova Scotia continues to see strong non-energy export activity – increasing 9.9 per cent over the first ten months of the year. Gains were seen in forestry, fishing, tires, and consumer products. Energy exports have declined 68.5 per cent. Volumes of output at the Sable platform are 2.5 per cent lower and Deep Panuke’s move to seasonal operations has reduced volumes by 67.7 per cent over the first ten months of the year, compared with peak output in 2014. Overall, international merchandise exports have declined 2.0 per cent for the first ten months of the year.
13
| | |
| Forecast Update December 2015 | | |
Key Risks
Economic
Economic indicators for at least three quarters of 2015 and preliminary economic accounts for 2014 are now available so there is now greater certainty about the economy for 2015–2016.
Downside risks for the year appear to have materialized in Nova Scotia’s labour market with employment and labour income growing slower than projected in Budget Estimates. Demographic pressure may continue to factor into growth in these areas. However, higher employment insurance benefits and positive inter-provincial migration may reflect workers returning after investment projects slow in the resource sector. Fewer inter-provincial workers may result in lower income remittance and associated consumption spending for Nova Scotian households.
Major project activity has generally proceeded as expected with work beginning on shipbuilding, energy projects, and Halifax construction projects. Changes to the timing and scope of projects will continue to be a risk to the outlook with projects playing a large role in Nova Scotia’s short term growth.
With natural gas exports falling, Nova Scotia’s international goods exports are below what was forecasted in the Budget Estimates. The final figures for 2015 depend on seasonal production at the end of the year. Export growth has been negative in certain sectors compared to broad-based growth seen in 2014; although manufacturing sales have increased 5.3 per cent over the first nine months. These risks could weigh on prospects for economic growth and corporate net operating surplus.
With commodity prices expected to remain low for longer, the Canadian economy is expected to shift production resources (capital, labour) into other sectors and adjust to a lower exchange rate. This rebalancing of the Canadian economy presents both upside and downside risks for Nova Scotia. In an environment of commodity price instability, there is also a risk that higher commodity prices may reverse these shifts. Federal Government restraint has been a negative factor for Nova Scotia’s employee compensation and GDP for the past few years and changes to the Federal Government’s fiscal plan will continue to be a risk to the outlook.
External risks among Nova Scotia’s primary trading partners (US and Europe) have diminished as economic recovery solidified in 2015. Recently negotiated trade agreements (Canada-European Union Comprehensive Economic and Trade Agreement, Trans-Pacific Partnership) are a source of upside risk to the medium-term outlook. The US Federal Reserve’s timing for increasing its policy interest rate has potential to impact foreign exchange rates and the pace of US recovery.
Revenue
Provincial own-source revenues are strongly influenced by several key factors in the economic outlook. In addition, the revenue models use administrative data, external factors and historical relationships between factors to arrive at forecasted revenues. The revenue estimates are updated as new actual tax data is available. All factors are subject to change throughout the fiscal year and can contribute to significant variations in revenues. Final personal and corporate income tax
14
| | |
| | Forecast Update December 2015 |
assessments for the 2014 taxation year will not be received until the spring of 2016, thereby creating Prior Year Adjustments.
Slower growth in the level of compensation of employees continues to pose a downside risk to personal income tax revenues – the Province’s largest source of revenue. Unprecedented yield growth in 2014 has created a significant Prior Year Adjustment but is unlikely to be repeated. Increases in employment insurance benefits create only a temporary benefit and cannot fully offset declines in growth for the compensation of employees.
Lower levels of personal income usually lead to slower growth in consumer expenditures, which accounts for more than 70 per cent of Harmonized Sales Tax revenues. Improvements in the level of residential housing expenditures are relatively small compared to consumer expenditures.
The forecast of corporate income tax revenues is highly dependent upon national corporate taxable income which is on the decline. A low oil price environment combined with global uncertainty presents substantial risks to corporate income tax revenues. The province’s share declined sharply in 2014 creating a large negative Prior Year Adjustment. The share is forecasted to remain below initial estimates into 2016 and the medium term.
Deep Panuke production issues, a low price environment for natural gas, and increased decommissioning costs for the Sable Offshore Energy Project are key concerns for offshore royalties. Increases in the estimated decommissioning costs will continue to create significant negative Prior Year Adjustments.
Tobacco tax revenues continue to be influenced by cessation and reduced consumption.
Federal policy and budget changes could affect major revenues if effective in 2016. The new Federal Government has committed to making changes to the Universal Child Care Benefit (UCCB) program that could have a negative impact on provincial revenues in the 2015-2016 fiscal year if implemented in 2016.
The final estimate for the province’s Cumulative Best-of Guarantee payment will be received before the end of December 2015 and will impact current year revenues.
15
| | |
| Forecast Update December 2015 | | |
Current Economic Outlook Assumptions
| | | | | | | | | | | | | | | | | | |
| | | Budget 2015–2016 | | | | | Revised December 2015 | |
| Per cent change, except where noted | | 2015 | | | 2016 | | | | | 2015 | | | 2016 | |
Real GDP ($2007 chained) | | | 1.7% | | | | 1.5% | | | | | | 1.0% | | | | 0.8% | |
Nominal GDP | | | 2.7% | | | | 3.4% | | | | | | 2.0% | | | | 2.6% | |
Compensation of Employees | | | 3.4% | | | | 3.6% | | | | | | 2.2% | | | | 2.4% | |
Household Final Consumption | | | 3.4% | | | | 3.5% | | | | | | 2.2% | | | | 2.6% | |
Retail Sales | | | 1.0% | | | | 2.7% | | | | | | 0.1% | | | | 1.8% | |
Consumer Price Index | | | 0.7% | | | | 2.3% | | | | | | 0.6% | | | | 1.9% | |
Investment in Residential Structures | | | 3.4% | | | | 2.9% | | | | | | 7.4% | | | | -1.0% | |
Net Operating Surplus: Corporations | | | 1.9% | | | | 5.6% | | | | | | -1.5% | | | | 2.6% | |
Exports of Goods to Other Countries | | | 0.1% | | | | 3.4% | | | | | | 0.4% | | | | 4.1% | |
Population at July 1 (thousands) | | | 943.7 | | | | 944.5 | | | | | | 943.7 | | | | 944.5 | |
Employment (thousands) | | | 450.1 | | | | 452.2 | | | | | | 448.1 | | | | 448.8 | |
Unemployment Rate, Annual Average | | | 8.5% | | | | 7.9% | | | | | | 8.9% | | | | 8.6% | |
Note: Budget Estimates economic forecast was made with data and information as of February 12, 2015. The revised December forecast was made with data and information as of November 10, 2015.

16