Exhibit 99.4
All dollar amounts in this Exhibit are expressed in Canadian dollars.
FORWARD-LOOKING STATEMENTS
This exhibit includes forward-looking statements. The Province of Nova Scotia has based these forward-looking statements on its current expectations and projections about future events. These forward-looking statements are subject to risks, uncertainties, and assumptions about the Province of Nova Scotia, including, among other things:
| | • | | the Province of Nova Scotia’s economic and political trends; and |
| | • | | the Province of Nova Scotia’s ability to control expenses and maintain revenues. |
In light of these risks, uncertainties and assumptions, the forward-looking events discussed in this exhibit might not occur.
| | |
Forecast Update September 20, 2016 The Honourable Randy Delorey Minister of Finance and Treasury Board 
| |  |
| |
| | |
 | | Forecast Update September 2016 |
Introduction
The Forecast Update provides revised information about Nova Scotia’s fiscal outlook, including updated information about the major components of revenue and expenses as set out in the 2016–17 Budget.
Relative to the 2016–17 Budget, the forecasted surplus is projected to improve slightly. The Province of Nova Scotia is forecasting a net position of $18.9 million for 2016–17, an increase of $1.8 million from the Budget’s net position of $17.1 million.
Revenue and expenses are both up, primarily as a result of government taking advantage of the new federal-provincial cost-sharing programs to make investments in areas such as clean drinking water and wastewater projects, post-secondary institutions, transportation infrastructure, and innovative oceans research in Nova Scotia.
The majority of the increases in departmental expenses are offset by increased revenue that is recoverable from the federal government.
Government continues to follow its fiscal plan, as laid out in Budget 2016-17, investing in strategic sectors of the economy, in education, and creating more opportunities for young Nova Scotians.
1
| | |
| Forecast Update September 2016 | |  |
Overview
The Province of Nova Scotia is forecasting a surplus of $129.2 million and a net position of $18.9 million, after allocating $110.3 million towards future fiscal capacity. This represents an improvement of $1.8 million from the 2016-17 Budget. The $110.3 million revenue is a one-time revenue recognition of annual capital contributions from federal and municipal governments towards the new Halifax Convention Centre, as required by public sector accounting standards.
Total Provincial Revenue is forecast to be $10.3 billion, an increase of $65.1 million from the 2016–17 Budget.
Forecast changes in Ordinary Revenue include a $0.3 million decrease in provincial tax revenue, an increase in Other Provincial Revenue Sources of $6.2 million, a decrease in Investment Income of $0.9 million, and a $2.4 million increase in Federal Revenue Sources.
Ordinary Recoveries Revenue is forecast to increase by $62.4 million from the Budget, primarily due to new cost-shared federal programs. Net Income from Government Business Enterprises is forecasted to decrease by $4.6 million from Budget.
Fiscal Summary 2016–2017 | ($ thousands) |
| | | | | | | | | | | | |
| | | Budget | | | Forecast | | | Increase (Decrease)
from Budget | |
General Revenue Fund | | | | | | | | | | | | |
Revenue | | | | | | | | | | | | |
Ordinary Revenue | | | 9,329,495 | | | | 9,336,834 | | | | 7,339 | |
Ordinary Recoveries | | | 552,529 | | | | 614,909 | | | | 62,380 | |
Net Income from Government Business Enterprises | | | 382,228 | | | | 377,603 | | | | (4,625 | ) |
| | | | | | | | | | | | |
Total Revenue | | | 10,264,252 | | | | 10,329,346 | | | | 65,094 | |
| | | | | | | | | | | | |
Expenses | | | | | | | | | | | | |
Departmental Expenses | | | 9,100,049 | | | | 9,177,558 | | | | 77,509 | |
Refundable Tax Credits | | | 137,602 | | | | 137,247 | | | | (355 | ) |
Pension Valuation Adjustment | | | 66,251 | | | | 66,251 | | | | — | |
Debt Servicing Costs | | | 841,712 | | | | 836,895 | | | | (4,817 | ) |
| | | | | | | | | | | | |
Total Expenses | | | 10,145,614 | | | | 10,217,951 | | | | 72,337 | |
| | | | | | | | | | | | |
Consolidation and Accounting | | | | | | | | | | | | |
Adjustments for Government Units | | | 8,773 | | | | 17,844 | | | | 9,071 | |
| | | | | | | | | | | | |
Provincial Surplus (Deficit) | | | 127,411 | | | | 129,239 | | | | 1,828 | |
| | | | | | | | | | | | |
Contribution to Fiscal Capacity | | | (110,300 | ) | | | (110,300 | ) | | | — | |
| | | | | | | | | | | | |
Net Position | | | 17,111 | | | | 18,939 | | | | 1,828 | |
| | | | | | | | | | | | |
2
| | |
| | Forecast Update September 2016 |
Total Expenses are forecast to be $10.2 billion; $72.3 million higher than the Budget. This is mainly due to participation in federal programs, which increased Departmental Expenses. However, these increased Departmental Expenses are mostly offset by recoveries revenue.
Debt Servicing Costs are down $4.8 million as a result of low interest rates. Changes in Consolidation and Accounting Adjustments result in a $9.1 million positive impact to the provincial surplus position.
Revenue
Total Revenue, including Ordinary Recoveries of $614.9 million and Net Income from Government Business Enterprises of $377.6 million, is forecast to be $10.3 billion, $65.1 million (0.6 per cent) more than the 2016–17 Budget.
This represents a $0.3 million decrease in Provincial Tax Revenue (0.005 per cent), an increase in Other Provincial Revenue Sources of $6.2 million (1.5 per cent), a decrease of Investment Income of $0.9 million (0.5 per cent), and a decrease in Net Income from Government Business Enterprises of $4.6 million (1.2 per cent). Ordinary Recoveries are up by $62.4 million (11.3 per cent) and Federal Revenue Sources are up by $2.4 million (0.1 per cent).
Provincial Tax Revenue
Prior to receiving results of actual tax revenues collected, the Province relies on economic forecasts and historical administrative data to estimate provincial tax revenues. This forecast presents updated projections based on new data received since Budget.
Personal Income Tax (PIT) revenue is forecast to increase by $2.6 million (0.1 per cent) from the 2016-17 Budget, as a result of marginal increases in the projected yield in both 2016 (0.06 per cent) and
2017 (0.16 per cent) partially offset by a decline in the projected growth for personal taxable income in 2016 (0.02 per cent). Higher personal taxable income is being forecasted for 2017 (0.1 per cent).
Corporate Income Tax (CIT) revenue is forecast to increase by $11.0 million (2.4 per cent) from the 2016-17 Budget. This is due to a forecasted increase in both 2016 (3.0 per cent) and 2017 (0.3 per cent) levels of national corporate taxable income based upon federal estimates. The province’s projected share of national taxable income is unchanged at 1.4 per cent—the 3 year historical average of the actual share (2012–14).
Harmonized Sales Tax (HST) revenue is forecast to decline by $14.2 million (0.8 per cent) from the 2016-17 Budget. This is primarily a result of lower forecasts for consumer expenditure growth in both 2016 (0.06 per cent) and 2017 (0.2 per cent), as well as weakened growth forecast for residential housing investment, lowering the taxable base for housing in 2016 (5.2 per cent) and 2017 (5.69 per cent). The declines are partially offset by stronger growth in the public sector and business tax bases.
Tobacco Tax revenue is forecast to increase by $2.4 million (1.0 per cent) from the 2016-17 Budget. Although tobacco consumption is decreasing each year, the projected decline is not as great as was estimated for 2016–17 at Budget, based on actual data received since then.
Motive Fuel Tax revenue is forecast to be down $4.5 million (1.7 per cent) from the 2016-17 Budget. This is due to the consumption of both gasoline and diesel being lower than projected at Budget, based on actual data received since then.
Other taxes are up by $2.5 million (1.6 per cent) as a result of higher than projected revenue from the levy on private sale of used vehicles.
3
| | |
| Forecast Update September 2016 | | |
Total Revenue 2016–17 | ($ thousands) |
| | | | | | | | | | | | |
| | | Budget | | | Forecast | | | Increase (Decrease) from Budget | |
Provincial Revenue Sources | | | | | | | | | | | | |
Tax Revenue: | | | | | | | | | | | | |
Personal Income Tax | | | 2,671,599 | | | | 2,674,184 | | | | 2,585 | |
Corporate Income Tax | | | 466,644 | | | | 477,644 | | | | 11,000 | |
Harmonized Sales Tax | | | 1,814,007 | | | | 1,799,789 | | | | (14,218 | ) |
Motive Fuel Taxes | | | 271,718 | | | | 267,224 | | | | (4,494 | ) |
Tobacco Tax | | | 227,252 | | | | 229,620 | | | | 2,368 | |
Other Tax Revenue | | | 158,745 | | | | 161,249 | | | | 2,504 | |
| | | | | | | | | | | | |
| | | 5,609,965 | | | | 5,609,710 | | | | (255 | ) |
Other Provincial Revenue: | | | | | | | | | | | | |
Registry of Motor Vehicles | | | 127,534 | | | | 131,624 | | | | 4,090 | |
Royalties – Petroleum | | | 10,508 | | | | 9,581 | | | | (927 | ) |
Other Provincial Sources | | | 146,136 | | | | 148,270 | | | | 2,134 | |
TCA Cost Shared Revenue | | | 59,900 | | | | 61,228 | | | | 1,328 | |
Other Fees and Charges | | | 61,978 | | | | 61,508 | | | | (470 | ) |
| | | | | | | | | | | | |
| | | 406,056 | | | | 412,211 | | | | 6,155 | |
Investment Income: | | | | | | | | | | | | |
Interest Revenues | | | 77,901 | | | | 77,307 | | | | (594 | ) |
Sinking Fund Earnings | | | 91,660 | | | | 91,336 | | | | (324 | ) |
| | | | | | | | | | | | |
| | | 169,561 | | | | 168,643 | | | | (918 | ) |
| | | | | | | | | | | | |
Total – Provincial Revenue Sources | | | 6,185,582 | | | | 6,190,564 | | | | 4,982 | |
| | | | | | | | | | | | |
Federal Revenue Sources | | | | | | | | | | | | |
Equalization Payments | | | 1,738,321 | | | | 1,738,321 | | | | — | |
Canada Health Transfer | | | 942,770 | | | | 942,770 | | | | — | |
Canada Social Transfer | | | 348,901 | | | | 348,901 | | | | — | |
Offshore Accord Offset Payments | | | 33,255 | | | | 33,255 | | | | — | |
Crown Share | | | 1,427 | | | | 681 | | | | (746 | ) |
Other Federal Sources | | | 6,115 | | | | 6,115 | | | | — | |
TCA Cost Shared Revenue | | | 73,124 | | | | 76,227 | | | | 3,103 | |
| | | | | | | | | | | | |
Total – Federal Revenue Sources | | | 3,143,913 | | | | 3,146,270 | | | | 2,357 | |
| | | | | | | | | | | | |
Total – Ordinary Revenue | | | 9,329,495 | | | | 9,336,834 | | | | 7,339 | |
| | | | | | | | | | | | |
Total – Ordinary Recoveries | | | 552,529 | | | | 614,909 | | | | 62,380 | |
| | | | | | | | | | | | |
Net Income from | | | | | | | | | | | | |
Government Business Enterprises (GBE) | | | | | | | | | | | | |
Nova Scotia Liquor Corporation | | | 234,022 | | | | 234,022 | | | | — | |
Nova Scotia Provincial Lotteries and Casino Corporation | | | 127,700 | | | | 122,700 | | | | (5,000 | ) |
Halifax-Dartmouth Bridge Commission | | | 12,098 | | | | 12,473 | | | | 375 | |
Highway 104 Western Alignment Corporation | | | 8,408 | | | | 8,408 | | | | — | |
| | | | | | | | | | | | |
Total – Net Income from GBE | | | 382,228 | | | | 377,603 | | | | (4,625 | ) |
| | | | | | | | | | | | |
Total – Revenue | | | 10,264,252 | | | | 10,329,346 | | | | 65,094 | |
| | | | | | | | | | | | |
4
| | |
| | Forecast Update September 2016 |
Other Provincial Sources
Other Provincial Revenues are forecast to be up by $6.2 million (1.5 per cent). This is due to updated information showing increased registration activity and higher year-end actual revenue for the Registry of Motor Vehicles since Budget, increased cost-shared revenue from tangible capital assets, and sale of provincial assets.
Offshore Royalty revenue is forecast to decline by $0.9 million (8.8 per cent) from the 2016-17 Budget based on lower production volumes for offshore energy projects.
Investment Income
Investment income is $0.9 million lower than Budget primarily as a result of lower interest rates.
Federal Revenue Sources
Equalization is based upon the Province’s election to receive payments calculated according to the Expert Panel approach. This is a one-estimate, one-payment approach and as a result the forecast is equal to the 2016-17 Budget. The Province also expects to receive a cumulative best-of-guarantee payment of $16.0 million in 2016-17 pursuant to the clarification reached with the Federal Government in October 2007. An update to this forecast will be provided by the Federal Government to the Province before the end of 2016.
Offshore Accord Payments are also based on a one-estimate, one-payment approach and as a result the forecast is equal to the 2016-17 Budget.
The Canada Health Transfer (CHT) forecast is unchanged from the 2016-17 Budget. Revised federal estimates of the Province’s share of national population will be released by the Federal Government in the fall of 2016.
The Canada Social Transfer (CST) forecast is unchanged from the 2016-17 Budget. Revised federal estimates of the Province’s share of national population will be released by the Federal Government in the fall of 2016.
Crown Share Adjustment Payments are down by $0.7 million (52.3 per cent) from the 2016-17 Budget as a result of reduced profitability from offshore natural resource projects.
Federal revenue for tangible capital assets is up $3.1 million (4.2 per cent), primarily as a result of Post-Secondary Institutions Strategic Investment Funding.
The Province is not forecasting Prior Year Adjustments (PYAs) from federal sources. This will be updated in future forecasts as information is received from the Federal Government.
Ordinary Recoveries
Ordinary Recoveries Revenue is forecast to be $62.4 million (11.3 per cent) higher than budget.
The Department of Business is forecasting increased recoveries of $2.7 million for the Centre for Ocean Ventures and Entrepreneurship (COVE) project approved as part of the federal Post-Secondary Institutions Strategic Investment Fund. COVE is an ocean technology project in Dartmouth.
The Department of Health and Wellness is forecasting $1.8 million in decreased recoveries as a result of several programs that have been transferred to the Health Authorities.
The Department of Internal Services is forecasting increased recoveries of $1.2 million related to
IT recoverable work and third-party recoverable insurance claims with the Housing Authorities.
5
| | |
| Forecast Update September 2016 | | |
The Department of Justice is forecasting $0.9 million in decreased recoveries from municipalities due to lower than anticipated costs associated with the RCMP contract.
The Department of Labour and Advanced Education is forecasting increased recoveries of $7.5 million primarily as a result of increased recoverable spending of $6.8 million for the Labour Market Development Agreement.
Assistance to Universities is forecasting increased recoveries of $16.6 million for university capital projects approved as part of the federal Post-Secondary Institutions Strategic Investment Fund. The projects include a new state of the art facility for the Nova Scotia Community College campus in Pictou County and a Science Complex for Acadia University.
The Department of Municipal Affairs is forecasting increased recoveries of $36.5 million as a result of new federal programs comprised of $20.3 million under the Canada-Nova Scotia Bilateral Agreement for Clean Water and Wastewater Fund and $16.5 million for the Public Transit Infrastructure Fund. The programs include 73 clean, reliable water sources and waste-water projects across Nova Scotia and enhanced public transportation.
Net Income from Government Business Enterprises (GBE)
The total Net Income from Government Business Enterprises is forecast to be $4.6 million (1.2 per cent) lower than the Budget.
The Nova Scotia Provincial Lotteries and Casinos Corporation is forecasting a decrease in net income of $5.0 million (3.9 per cent) as a result of lower than projected growth in video lottery revenue.
The Halifax-Dartmouth Bridge Commission is forecasting Net Income to be $0.4 million (3.1 per cent) above budget primarily because of higher than expected toll and investment revenue and lower than expected amortization charges and operating costs.
The Nova Scotia Liquor Corporation and Highway 104 Western Alignment Corporation is projecting no change in forecasted net operating income.
6
| | |
| | Forecast Update September 2016 |
Expenses
Total Expenses for 2016-17 are forecast to be $10.2 billion, $72.3 million higher than the original 2016-17 Budget.
An increase in Departmental Expenses of $77.5 million is partially offset by a reduction in Debt Servicing Costs of $4.8 million and a reduction of Refundable Tax Credit expenses of $0.4 million.
Departmental Expenses 2016–17 | ($ thousands) |
| | | | | | | | | | | | |
| | | Budget | | | Forecast | | | Increase (Decrease)
from Budget | |
Agriculture | | | 60,217 | | | | 60,360 | | | | 143 | |
Business | | | 137,450 | | | | 140,503 | | | | 3,053 | |
Communities, Culture and Heritage | | | 81,689 | | | | 82,131 | | | | 442 | |
Community Services | | | 929,957 | | | | 929,957 | | | | — | |
Education and Early Childhood Development | | | 1,279,532 | | | | 1,279,921 | | | | 389 | |
Energy | | | 29,597 | | | | 29,597 | | | | — | |
Environment | | | 36,800 | | | | 36,800 | | | | — | |
Finance and Treasury Board | | | 22,782 | | | | 22,782 | | | | — | |
Fisheries and Aquaculture | | | 12,464 | | | | 12,464 | | | | — | |
Health and Wellness | | | 4,132,209 | | | | 4,130,295 | | | | (1,914 | ) |
Internal Services | | | 185,447 | | | | 186,134 | | | | 687 | |
Justice | | | 330,388 | | | | 328,919 | | | | (1,469 | ) |
Labour and Advanced Education | | | 364,271 | | | | 371,763 | | | | 7,492 | |
Assistance to Universities | | | 380,605 | | | | 400,271 | | | | 19,666 | |
Municipal Affairs | | | 184,383 | | | | 230,479 | | | | 46,096 | |
Natural Resources | | | 76,487 | | | | 79,987 | | | | 3,500 | |
Public Service | | | 205,869 | | | | 205,388 | | | | (481 | ) |
Seniors | | | 1,598 | | | | 1,598 | | | | — | |
Transportation and Infrastructure Renewal | | | 460,766 | | | | 460,671 | | | | (95 | ) |
Restructuring Costs | | | 187,538 | | | | 187,538 | | | | — | |
| | | | | | | | | | | | |
Total – Departmental Expenses | | | 9,100,049 | | | | 9,177,558 | | | | 77,509 | |
| | | | | | | | | | | | |
7
| | |
| Forecast Update September 2016 | | |
Departmental Expenses
Total Departmental Expenses for 2016-17 are forecast to be $9.2 billion or $77.5 million higher than the budget.
The Department of Business is forecasting to be $3.1 million over budget due to $3.9 million in increased expenditures for the COVE project approved as part of the federal Post-Secondary Institutions Strategic Investment Fund, of which $2.7 million is recoverable from the federal government; partially offset by changes in cash flow requirements as the result of other project delays.
The Department of Health and Wellness is forecasting to be $1.9 million under budget primarily due to several programs that have been transferred to the Health Authorities. There is a corresponding $1.8 million decrease in recoveries mainly related to these programs.
The Department of Internal Services is forecasting to be $0.7 million over budget due to an increase in third-party recoverable spending of $1.2 million, offset by a reduction in amortization spending of $0.5 million.
The Department of Justice is forecasting to be $1.5 million under budget primarily due to lower than anticipated costs associated with the RCMP contract resulting in a decrease of $0.9 million in recoveries from municipalities for their share of RCMP costs.
The Department of Labour and Advanced Education is forecasting to be $7.5 million over budget primarily due to amendments totaling $6.8 million to both the Labour Market Development Agreement and the Canada-Nova
Scotia Job Fund Agreement for 2016-17.
Assistance to Universities is forecasting to be $19.7 million over budget due to administration and contribution toward specified university capital projects approved as part of the Federal Post-
Secondary Institutions Strategic Investment Fund, $16.6 million of this increase is recoverable from the Federal Government.
The Department of Municipal Affairs is forecasting to be $46.1 million over budget primarily due to Canada-Nova Scotia Bilateral Agreement-related spending, including $30.5 million for Clean Water and Wastewater Fund of which $20.3 million is recoverable, and $16.5 million in recoverable spending for Public Transit Infrastructure Fund. These increases are offset by $0.819 million in Build Canada Fund Communities component decreases due to timing of cash flows.
The Department of Natural Resources is forecasting to be $3.5 million over budget primarily due to additional costs to address several wildfires during the month of August 2016.
8
| | |
| | Forecast Update September 2016 |
Refundable Tax Credits
Refundable Tax Credits are forecasted almost at budget, $0.4 million (0.3 per cent) lower than originally anticipated. The variance is entirely related to revised estimates of the cost of the Scientific Research and Experimental Development credit, based upon a slight decline in the projected growth rate of the tax credit.
Debt Servicing Costs
Total Debt Servicing Costs are forecast to be $836.9 million, which is $4.8 million (0.6 per cent) lower than budget as a result of lower interest rates.
Consolidation and Accounting Adjustments
Consolidation and Accounting Adjustments for Government Units are forecasted to be $9.1 million above budget primarily due to a federal contribution of $5.0 million for Housing Nova Scotia for the Federal Investment in Affordable Housing and a $3.9 million increase in capital grants for the COVE project.
9
| | |
| Forecast Update September 2016 | | |
Capital
The Province is forecasting total capital spending to be equal to Budget. Projected spending increases on highways and structures, buildings, vehicles and equipment and projected increased capital grant requirements, primarily related to the COVE project,
are offset by projected reductions on IT projects and a reduction in the contingency to allow for participation in the Federal Strategic Infrastructure Fund.
Capital Spending 2016–17 | ($ thousands) |
| | | | | | | | | | | | |
| | | Budget | | | Forecast | | | Increase (Decrease)
from Budget | |
Highways and Structures | | | 222,448 | | | | 222,517 | | | | 69 | |
Buildings | | | 273,575 | | | | 282,449 | | | | 8,874 | |
Information Technology | | | 30,154 | | | | 28,412 | | | | (1,742 | ) |
Land Purchases | | | 2,500 | | | | 2,500 | | | | — | |
Vehicles and Equipment | | | 18,369 | | | | 19,013 | | | | 644 | |
Capital Grants | | | 61,349 | | | | 64,727 | | | | 3,378 | |
Contingency | | | 36,605 | | | | 25,382 | | | | (11,223 | ) |
| | | | | | | | | | | | |
Total – Capital Spending | | | 645,000 | | | | 645,000 | | | | 0 | |
| | | | | | | | | | | | |
10
| | |
| | Forecast Update September 2016 |
Economic Performance and Outlook: 2016 and 2017
External Outlook
Projections for world economic growth have been lowered following the United Kingdom’s (UK) referendum on European Union membership. Uncertainty around the UK-Europe economic relationship has damaged confidence, investment, and financial conditions among advanced European economies. The International Monetary Fund’s July 2016 outlook expects real growth of 3.1 per cent in 2016, similar to 2015, before rising to 3.4 per cent in 2017.
The UK economy grew 1.8 per cent and 2.4 per cent in Quarter 1(Q1) and Q2 of 2016 (seasonally adjusted annualized rate), but is expected to see slower growth in the second half of the year as domestic demand weakens. In response to the weaker outlook, the Bank of England lowered its Bank Rate to 0.25 per cent and expanded bond purchases. The Euro Area economy reports modest real growth of 2.1 per cent and 1.2 per cent in Q1 and Q2 as a result of expanding consumption, supportive monetary policy, employment growth, and relative low oil prices. The Euro Area future outlooks remains uncertain in light of concerns over banking system stability, refugees, and Brexit.
United States (US) real economic growth was 1.1 per cent in Q2 of 2016, following growth of 0.8 per cent in Q1. The US reported strong gains in labour markets, residential investment, and consumer confidence. However, business investment has been weak in the energy sector and a stronger US dollar has tempered exports. After raising its policy interest rate in December 2015, the Federal Reserve has not moved to raise rates further. US inflation remains below long-run objectives, global economic risks are biased downward and growth is expected to be stronger in the second half of 2016. US economic growth is projected to be 2.1 per cent for all of 2016 and 2.3 per cent in 2017.
The Canadian economy continues to adjust to the oil price shock; output and labour are being reallocated from the resource sectors to other areas of the economy. Canadian household spending continues to grow moderately while the housing market has been particularly strong in some markets. GDP growth in the first quarter was 2.5 per cent but Q2 GDP declined by 1.6 per cent due to the disruptions from the Alberta wildfires. Growth in Canada in the coming months is expected to be lifted by US demand, federal infrastructure spending and tax measures, accommodative financial conditions, and a weakened dollar.
The Bank of Canada has maintained the overnight rate at 0.5 per cent in 2016. Inflation in the first seven months of 2016 has been 1.5 per cent, as low oil prices and slack in the economy offset import price pressure coming from the lower Canadian dollar. The Canadian dollar is expected to remain between 75 and 80 cents over the next two years, boosting non-resource exports.
Canadian real economic growth is projected to be 1.4 per cent in 2016 and 2.2 per cent in 2017 with the economy continuing to operate below capacity during this period.
11
| | |
| Forecast Update September 2016 | | |
Current Economic Outlook for Nova Scotia
The 2016-17 Budget used the Province’s Economic Outlook, with data and information up to January 22, 2016. A revised economic forecast was published in the 2015-16 Public Accounts in August 2016, with data and information up to May 31, 2016 and is reflected in the provincial tax revenue forecast presented in this update, consistent with previous practice. New information released after this date is discussed in the Economic Performance and Key Risks sections and will be incorporated into future economic outlooks.
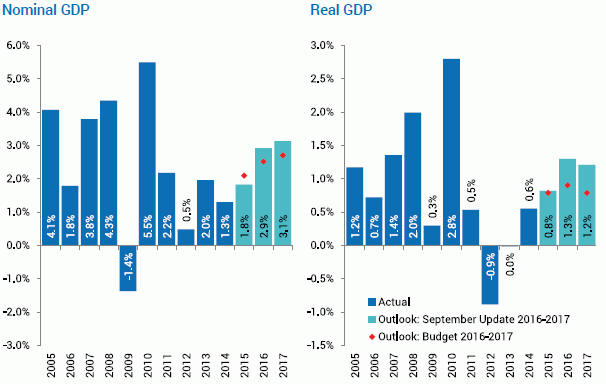
Gross Domestic Product (GDP) provides the broadest forecast of the economy’s overall tax base, while household income, consumer expenditures, and residential construction provide indicators of growth for specific tax bases.
The outlook for Nova Scotia’s nominal and real GDP growth rates have been revised upward for 2016 and 2017, with the incorporation of economic activity associated with expected federal Infrastructure spending and tax measures confirmed in the 2016-17 federal Budget. The forecast for nominal GDP growth has been increased from 2.5 per cent (from the 2016–17 Budget) to 2.9 per cent in 2016 and from 2.7 per cent to 3.1 per cent in 2017. Forecasted real GDP growth has been revised upwards from 0.9 per cent to 1.3 per cent in 2016 and from 0.8 per cent to 1.2 per cent in 2017.
The Budget economic assumptions were below most private sector economists’ expectations and excluded prospective federal stimulus measures. After incorporating announced stimulus measures, the Province’s forecast for real GDP is in line with recent private sector projections that average 1.3 per cent growth in 2016 and 1.3 per cent growth in 2017.
| | |
| Nova Scotia GDP Growth | | (Per Cent Change) |
12
| | |
| | Forecast Update September 2016 |
Current Economic Outlook Assumptions
| | | | | | | | | | | | | | | | | | | | |
| | | Budget 2016–17 | | | | | | Revised May 2016 | |
| Per cent change, except where noted | | 2016 | | | 2017 | | | | | | 2016 | | | 2017 | |
Real GDP ($2007 chained) | | | 0.9% | | | | 0.8% | | | | | | | | 1.3% | | | | 1.2% | |
Nominal GDP | | | 2.5% | | | | 2.7% | | | | | | | | 2.9% | | | | 3.1% | |
Compensation of Employees | | | 2.5% | | | | 2.4% | | | | | | | | 2.7% | | | | 2.7% | |
Household Income | | | 2.5% | | | | 2.5% | | | | | | | | 2.5% | | | | 2.5% | |
Household Final Consumption | | | 2.7% | | | | 3.2% | | | | | | | | 2.6% | | | | 3.1% | |
Retail Sales | | | 1.2% | | | | 2.4% | | | | | | | | 1.4% | | | | 2.3% | |
Consumer Price Index | | | 1.5% | | | | 1.9% | | | | | | | | 1.6% | | | | 2.3% | |
Investment in Residential Structures | | | 3.1% | | | | -3.5% | | | | | | | | 2.0% | | | | -4.0% | |
Net Operating Surplus: Corporations | | | 2.9% | | | | 2.8% | | | | | | | | 1.8% | | | | 1.9% | |
Exports of Goods to Other Countries | | | 4.7% | | | | 2.8% | | | | | | | | 4.9% | | | | 2.8% | |
Population at July 1 (thousands) | | | 945.3 | | | | 946.4 | | | | | | | | 945.3 | | | | 946.4 | |
Employment (thousands) | | | 450.8 | | | | 451.2 | | | | | | | | 449.3 | | | | 450.0 | |
Unemployment Rate, Annual Average | | | 8.4% | | | | 8.1% | | | | | | | | 8.5% | | | | 8.2% | |
Note: Budget Estimates economic forecast was made with data and information as of January 22, 2016. The revised May forecast was made with data and information as of May 31, 2016.
Nova Scotia Economic Performance
GDP Growth: After zero growth in 2013, Nova Scotia’s real GDP was up 0.6 per cent in 2014. Preliminary GDP data, measured at basic prices, suggest the economy expanded again in 2015, by 0.8 per cent. In the goods sectors, agriculture, fishing, and manufacturing grew in 2015 as the lower Canadian dollar supported rising exports and shipbuilding activity began. Lower production at the Deep Panuke offshore platform led to lower output in the mining, quarrying and oil and gas sector. Nova Scotia’s service sectors grew 0.9 per cent with gains across most subsectors.
Growth in 2016 continues to be supported through growing non-energy exports, shipbuilding, and ongoing work on major projects such as the
Macdonald Bridge re-decking, the Halifax Convention Centre, and the Maritime Link.
Labour Market: For the first eight months of 2016, employment and labour force have shown small declines, falling 0.3 per cent and 0.4 per cent respectively. An aging population continues to put downward pressure on the participation rate and the employment rate. The unemployment rate has averaged 8.6 per cent over the first eight months. Average weekly earnings have risen 2.0 per cent over first six months of the year relative to 2015 and employee compensation (total wages, salaries, and employers’ social contribution) in the first half grew 2.1 per cent relative to the first half of 2015.
13
| | |
| Forecast Update September 2016 | | |
Inflation: The Consumer Price Index (CPI) inflation rate has averaged 1.1 per cent over the first seven months of 2016 in Nova Scotia. Lower energy prices continue to put downward pressure on total inflation and offset import price pressure coming from the lower Canadian dollar. The CPI index, excluding energy, increased 2.3 per cent over the first seven months of 2016 relative to the same months in 2015.
Retail Sales: Retail sales have been robust for the first six months of the year in Nova Scotia, growing 4.9 per cent over 2015 levels. Lower sales due to a severe winter were seen in 2015 and account for some of the stronger growth seen in 2016. Sales of motor vehicles, building materials, and general merchandise have seen stronger sales in 2016, offsetting declines reported in food and beverage stores and gas stations.
Construction: After significant multi-unit dwelling activity began in 2015, residential permits and housing starts have declined back towards historical levels in 2016. Renovation expenditures have also
been lower so far in 2016. Home prices in the Halifax market continue to remain flat as they have for the past few years. For the first half of 2016, non-residential building construction expenditures are down 3.0 per cent compared to last year as building construction has ebbed in the Halifax market.
International Exports: The last two years have seen strong growth for Nova Scotia international goods exports, and momentum has carried into 2016. Non-energy international merchandise exports have increased 5.3 per cent over the first seven months of 2016. Farm, fishing and intermediate food products, consumer products, and motor vehicle parts have all seen increased shipments in 2016. Energy exports have declined as output of natural gas has fallen at Deep Panuke and to a lesser extent at the Sable Offshore Energy Project.
14
| | |
| | Forecast Update September 2016 |
Key Risks
Economic
The Current Economic Outlook reflects information and data up to May 31, 2016. Since then, a number of economic events and indicators have been published and not incorporated into this outlook, and will be considered in future economic forecasts.
The UK transition out of the European Union is still unfolding and will continue to be a source of uncertainty in the global economy. The immediate effects have been concentrated in Europe, but financial conditions and confidence could be weakened more broadly going forward. The US election has the potential to add further uncertainty into the global economy. New restrictions to markets in both the US and Europe for Canadian exporters have been proposed, and if implemented, Nova Scotia’s export prospects would be weaker.
Several major projects and federal stimulus initiatives have been included in the latest forecast. The timing and magnitude of these projects are subject to change and present risk to the investment and GDP forecast, in particular stimulus-related activity has been anticipated to begin in 2016.
An expected decline in natural gas production has been incorporated into the forecast. Further, changes to price, reserves, output, and exploration activity will alter the impact of the energy sector on the projections.
Data on residential construction was down 16.9 per cent in the first half due to lower renovation activity and, along with the lower housing starts and building permits numbers seen in 2016, present a downside risk to the forecast of residential investment.
The aging population presents uncertainty to the forecast, the rate of retirements affects the short-run employment and labour force forecast but may
have other effects on the economy. Employment and the labour force declined over the summer months so year to date numbers are now tracking below projections for 2016. This could be partially offset by the population increases from immigration.
The Canadian economy continues to be in a vulnerable position and destabilizing factors such as natural disasters, prolonged low oil prices, household deleveraging, or housing sector rebalancing could materialize. Further shocks to the Canadian economy could require policy responses, including by the Bank of Canada that would results in deviations from the growth, the exchange rate, and interest rates assumed in the forecast.
Revenue
Provincial own-source revenues are strongly influenced by several key factors in the economic outlook. In addition, the revenue models use administrative data, external factors, and historical relationships between factors to arrive at forecasted revenues. All factors are subject to change throughout the fiscal year and can contribute to significant variations in revenues.
PYA are updates to prior year revenue estimates after new revenue information is received. The best information on open taxation years is received later in the fall and is incorporated in the revenue estimates for 2016–17.
Final personal and corporate income tax assessments for the 2015 taxation year will not be received until the spring of 2017.
Slower growth in the level of compensation of employees could pose a downside risk to personal income tax revenues – the Province’s largest source of revenue. Unprecedented yield growth in 2014 is unlikely to be repeated. The forecast of yield growth
15
| | |
| Forecast Update September 2016 | | |
estimates for the 2015 and subsequent taxation years could be lower than expected once reliable data is made available to the province in the fall of 2016.
Lower levels of personal income usually lead to slower growth in consumer expenditures, which accounts for more than 70 per cent of Harmonized Sales Tax (HST) revenues. Declines in the projected level of residential housing expenditures will also place downward pressure on HST revenues.
The forecast of corporate income tax revenues is highly dependent upon national corporate taxable income, which has been experiencing greater volatility as the result of a low oil price environment combined with global uncertainty. This can present substantial risks to corporate income tax revenues. The province’s share has been on the decline and a continuation of this trend will negatively impact corporate income tax revenues.
Annual tobacco consumption is declining. Tobacco tax revenues continue to be influenced by cessation, reduced consumption and substitution for e-cigarettes.
16