 oanoke Electric Steel Corporation and its wholly-owned subsidiaries are engaged in the manufacturing, fabricating and marketing of merchant steel products, specialty steel sections, billets, open-web steel joists and reinforcing bars.
 Each subsidiary is either a supplier to the parent company or a purchaser of its finished product and billets.
The main plant of Roanoke Electric Steel Corporation is a state-of-the-art steel mini-mill located in Roanoke, Virginia. This facility melts scrap steel in electric furnaces and continuously casts the molten steel into billets. These billets are rolled into merchant steel products consisting of angles, plain rounds, flats, channels and reinforcing bars of various lengths and sizes. Excess steel billet production is sold to mills without melting facilities.
Roanoke Electric Steel Corporation markets its products to steel service centers and fabricators in 22 states east of the Mississippi River.
1
 ike the main plant, Steel of West Virginia, Inc., is a steel mini-mill operating in Huntington, West Virginia. A steel fabricating subsidiary, Marshall Steel, Inc., is located in Memphis, Tennessee.
 These locations produce specialty steel sections and custom-finished products and serve niche markets throughout the continental United States.
Shredded Products Corporation, a subsidiary with operations in Rocky Mount and Montvale, Virginia, extracts scrap steel and other metals from junked automobiles and other waste materials.
These facilities supply the main plant with a substantial amount of its raw materials. Nonferrous metals generated in the process are sold to unrelated customers.

3
 ohn W. Hancock, Jr., Inc. and Socar, Inc. are steel fabrication subsidiaries located in Salem, Virginia, Florence, South Carolina and Continental, Ohio.
 All three operations purchase rounds and angles from the main plant to fabricate long- and short-span open-web steel joists. These joists are used as horizontal supports for floors and roofs in commercial and industrial buildings.
RESCO Steel Products Corporation, a Salem, Virginia based subsidiary, fabricates concrete reinforcing steel by cutting and bending it to contractor specifications.
5
To Our Shareholders
2002 Results
The steel industry suffered through another year of the most prolonged downturn in business conditions in recent memory. In fiscal 2002, many steel producers reported losses or lower earnings.
Contributing factors include:
· | Lower selling prices |
· | Slower construction activity |
· | Increased competition |
· | Deteriorating business conditions |
Compared with our segment of the industry, Roanoke Electric Steel fared better than most. We remain in a strong financial condition after suffering our first loss since our infancy in 1956. Our loss was $6,008,897 compared to a profit of $1,348,022 in 2001. That amounted to $.55 per share ($.55 diluted) compared with earnings per share of $.12 ($.12 diluted) for last year. Sales were down 14.3% ($263,773,709 vs. $307,674,605).
As we began the year, prospects were not bright for an early recovery, and, as the year progressed, construction activity slowed even further, competition intensified, and business conditions worsened within certain niche markets. Shipment volumes fell 16% for fabricated products, 14% for specialty steel products and 3% for merchant bar products.
Average selling prices fell 16% for fabricated products, and specialty steel prices were off 3%, after falling 9% in 2001 and 10% in 2000. On the brighter side, selling prices for bar products had increased 16% at year-end from their lowest point during the year, resulting in a 1% increase in average selling price from last year. The increase was significant, as it was the result of three consecutive increases in prices for bar products during the year, following declines in selling prices of 15% last year and 20% in 2000.
6
Financial Condition
Conservative management practices once again proved their value as our financial condition remained strong.
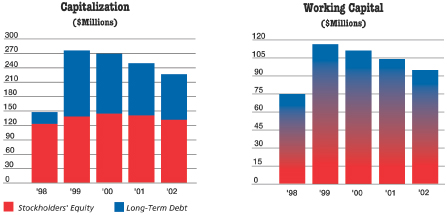
· | At year-end, cash and investments were $26,155,381; working capital was $94,675,819 and stockholders’ equity amounted to $130,988,698. These numbers represent a decrease from last year but remain at good levels. |
· | The current ratio (3.2 to 1) remained the same. The quick ratio declined slightly to a healthy 1.6 to 1. |
· | We curtailed debt by $15,039,488. Long-term debt as a percentage of total capital improved to 37.6% from 40.4% last year. |
· | After subtracting cash and investments from long-term debt, net long-term debt as a percentage of total capital was 28.7% — a more desirable level. |
· | The ratio of debt to equity improved to 1.2. |
In our opinion, cash and investments combined with cash provided from operations will provide the liquidity and capital resources required to fund operations, meet required debt retirement and remain competitive.
Shareholder Value
During the year, the S&P 500 fell more than 16%, while our share price declined 10.5%. After subtracting our dividend yield, the net decline was closer to 7%. Our shares were trading at 89% of book value at year-end, and our share performance compared favorably with many steel stocks. The steel sector continues out-of-favor with investors.
In October 2002, the Board of Directors declared the 176th (44 years) consecutive quarterly dividend. The amount was 5 cents per share, payable November 25, 2002. That is a 50% reduction but necessary to maintain our strong financial position. Our dividend for the year amounted to $.35 per share, which equated to a 3.3% yield at year-end and annual dividends paid to shareholders of $3,826,922.
7
Outlook for 2003
Business conditions are similar to last year, and they will slow during the winter. Selling prices for bar products are slightly lower. Our margins are about the same because of a decline in prices for scrap steel, our main raw material.
We project 2003 first quarter results to be significantly improved from last year, although they will be down from the recently completed fourth quarter.
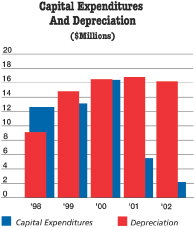
Preserving our financial condition and improving profitability remain our priorities. Capital expenditures were held to just over $2,000,000 in 2002 to preserve cash, but we cannot overlook the need in the future to spend, as a minimum, the amount of our depreciation for capital expenditures in order to remain competitive and provide future growth.
Thanks
We are grateful for the leadership of Paul E. Torgersen and John D.Wilson who retired as directors. We shall miss them.
We appreciate the sacrifice of our dedicated employees and extend our thanks to customers and shareholders for their support and investment.

Donald G. Smith
Chairman of the Board
Chief Executive Officer
8
Selected Financial Data
| Year Ended October 31, | 2002 | 2001 | 2000 | 1999 | 1998 | |||||||||||
Operations | ||||||||||||||||
| Sales | $ | 263,773,709 | $ | 307,674,605 | $ | 372,728,108 | $ | 372,962,950 | $ | 295,203,974 | ||||||
| Gross earnings | 17,601,055 | 34,931,300 | 62,461,062 | 75,191,805 | 57,485,426 | |||||||||||
| Interest expense-net | 5,497,761 | 7,152,141 | 7,049,342 | 6,964,578 | 830,743 | |||||||||||
| Income tax expense (benefit) | (4,459,535 | ) | 904,072 | 8,744,301 | 14,176,230 | 11,448,066 | ||||||||||
| Net earnings (loss) | (6,008,897 | ) | 1,348,022 | 14,061,449 | 22,479,179 | 19,760,570 | ||||||||||
Financial Position | ||||||||||||||||
| Working capital | $ | 94,675,819 | $ | 104,919,632 | $ | 111,444,079 | $ | 117,241,158 | $ | 75,703,207 | ||||||
| Total assets | 289,717,573 | 316,886,778 | 339,678,909 | 352,045,812 | 189,996,218 | |||||||||||
| Long-term debt | 78,792,278 | 93,835,033 | 108,874,521 | 123,910,558 | 24,291,667 | |||||||||||
| Stockholders’ equity | 130,988,698 | 138,606,184 | 144,721,829 | 137,158,131 | 120,233,217 | |||||||||||
Selected Ratios | ||||||||||||||||
| Gross profit margin | 6.7% | 11.4% | 16.8% | 20.2% | 19.5% | |||||||||||
| Operating income (loss) margin | (2.3% | ) | 0.4% | 3.8% | 6.0% | 6.7% | ||||||||||
| Effective tax (benefit) rate | (42.6% | ) | 40.1% | 38.3% | 38.7% | 36.7% | ||||||||||
| Current ratio | 3.2 | 3.2 | 3.1 | 3.5 | 3.5 | |||||||||||
| Quick ratio | 1.6 | 1.8 | 1.6 | 1.8 | 2.3 | |||||||||||
| Fundeddebt as a percentage of total capital | 41.7% | 44.0% | 46.1% | 50.3% | 19.2% | |||||||||||
| Return on average stockholders’equity | (4.5% | ) | 1.0% | 10.0% | 17.5% | 17.4% | ||||||||||
Per Share Data | ||||||||||||||||
| Net earnings (loss): | ||||||||||||||||
| Basic | $ | (0.55 | ) | $ | 0.12 | $ | 1.28 | $ | 2.03 | $ | 1.77 | |||||
| Diluted | (0.55 | ) | 0.12 | 1.28 | 2.02 | 1.76 | ||||||||||
| Cash dividends | 0.35 | 0.40 | 0.40 | 0.39 | 0.37 | |||||||||||
| Stockholders’ equity | 11.97 | 12.70 | 13.28 | 12.44 | 10.86 | |||||||||||
Weighted average common shares outstanding | 10,934,380 | 10,908,584 | 10,952,529 | 11,065,531 | 11,132,910 | |||||||||||
9
Consolidated Financial Statements
Consolidated Statements Of Earnings (Loss)
Year Ended October 31, | ||||||||||||
2002 | 2001 | 2000 | ||||||||||
| SALES | $ | 263,773,709 | $ | 307,674,605 | $ | 372,728,108 | ||||||
| COST OF SALES | 246,172,654 | 272,743,305 | 310,267,046 | |||||||||
| GROSS EARNINGS | 17,601,055 | 34,931,300 | 62,461,062 | |||||||||
| OTHER OPERATING EXPENSES (INCOME) | ||||||||||||
| Administrative | 22,543,027 | 25,405,447 | 28,681,911 | |||||||||
| Interest, net | 5,497,761 | 7,152,141 | 7,049,342 | |||||||||
| Profit sharing | 658,699 | 822,609 | 5,093,651 | |||||||||
| Antitrust litigation settlement | — | (700,991 | ) | (1,169,592 | ) | |||||||
| Officer life insurance proceeds | (630,000 | ) | — | — | ||||||||
| Total | 28,069,487 | 32,679,206 | 39,655,312 | |||||||||
| EARNINGS (LOSS) BEFORE INCOME TAXES | (10,468,432 | ) | 2,252,094 | 22,805,750 | ||||||||
| INCOME TAX EXPENSE (BENEFIT) | (4,459,535 | ) | 904,072 | 8,744,301 | ||||||||
| NET EARNINGS (LOSS) | $ | (6,008,897 | ) | $ | 1,348,022 | $ | 14,061,449 | |||||
| NET EARNINGS (LOSS) PER SHARE OF COMMON STOCK | ||||||||||||
| Basic | $ | (0.55 | ) | $ | 0.12 | $ | 1.28 | |||||
| Diluted | $ | (0.55 | ) | $ | 0.12 | $ | 1.28 | |||||
| CASH DIVIDENDS PER SHARE OF COMMON STOCK | $ | 0.35 | $ | 0.40 | $ | 0.40 | ||||||
Consolidated Statements Of Stockholders’ Equity And Comprehensive Earnings (Loss)
Common Stock | Retained Earnings | Accumulated Other Comprehensive Income (Loss) | Treasury Stock (At Cost) | Comprehensive Earnings (Loss) | |||||||||||||||||||
Shares | Amount | Shares | Amount | ||||||||||||||||||||
| BALANCE, NOVEMBER 1, 1999 | 12,298,902 | $ | 3,699,678 | $ | 134,276,321 | — | 1,273,114 | $ | 817,868 | ||||||||||||||
| Repurchase and retirement of common stock | (155,000 | ) | — | (2,390,688 | ) | — | — | — | |||||||||||||||
| Stock options exercised | 30,275 | 269,087 | — | — | — | — | |||||||||||||||||
| Net earnings | — | — | 14,061,449 | — | — | — | $ | 14,061,449 | |||||||||||||||
| Cash dividends | — | — | (4,376,150 | ) | — | — | — | ||||||||||||||||
| BALANCE, OCTOBER 31, 2000 | 12,174,177 | 3,968,765 | 141,570,932 | — | 1,273,114 | 817,868 | |||||||||||||||||
| Stock options exercised | 10,500 | 98,000 | — | — | — | — | |||||||||||||||||
| Net earnings | — | — | 1,348,022 | — | — | — | $ | 1,348,022 | |||||||||||||||
| Cash dividends | — | — | (4,363,575 | ) | — | — | — | ||||||||||||||||
| Cumulative effect of change in accounting for derivative financial instruments | — | — | — | $ | 1,663,516 | — | — | 1,663,516 | |||||||||||||||
| Change in derivative financial instruments | — | — | — | (4,861,608 | ) | — | — | (4,861,608 | ) | ||||||||||||||
| Total comprehensive loss | — | — | — | — | — | — | $ | (1,850,070 | ) | ||||||||||||||
| BALANCE, OCTOBER 31, 2001 | 12,184,677 | 4,066,765 | 138,555,379 | (3,198,092 | ) | 1,273,114 | 817,868 | ||||||||||||||||
| Stock options exercised | 31,250 | 328,124 | — | — | — | ||||||||||||||||||
| Net loss | — | — | (6,008,897 | ) | — | — | — | $ | (6,008,897 | ) | |||||||||||||
| Cash dividends | — | — | (3,826,922 | ) | — | — | — | ||||||||||||||||
| Change in derivative financial instruments | — | — | 1,397,985 | — | — | 1,397,985 | |||||||||||||||||
| Amortization of past hedging relationships | — | — | — | 492,224 | — | — | 492,224 | ||||||||||||||||
| Total comprehensive loss | — | — | — | — | — | — | $ | (4,118,688 | ) | ||||||||||||||
| BALANCE, OCTOBER 31, 2002 | 12,215,927 | $ | 4,394,889 | $ | 128,719,560 | $ | (1,307,883 | ) | 1,273,114 | $ | 817,868 | ||||||||||||
See notes to consolidated financial statements.
10
Consolidated Balance Sheets
October 31, | ||||||||
2002 | 2001 | |||||||
| ASSETS | ||||||||
| CURRENT ASSETS | ||||||||
| Cash and cash equivalents | $ | 12,051,362 | $ | 26,106,683 | ||||
| Investments | 14,104,019 | 12,477,755 | ||||||
| Accounts receivable, net of allowances of $1,863,746 in 2002 and $2,551,000 in 2001 | 40,301,324 | 41,954,349 | ||||||
| Refundable income taxes | 4,178,418 | 1,749,696 | ||||||
| Inventories | 62,362,602 | 62,689,319 | ||||||
| Prepaid expenses | 1,118,692 | 1,011,674 | ||||||
| Deferred income taxes | 4,330,671 | 5,602,455 | ||||||
| Total current assets | 138,447,088 | 151,591,931 | ||||||
| PROPERTY, PLANT AND EQUIPMENT | ||||||||
| Land | 7,977,522 | 8,010,036 | ||||||
| Buildings | 44,466,848 | 43,563,921 | ||||||
| Other property and equipment | 174,975,640 | 195,239,094 | ||||||
| Assets under construction | 2,023,915 | 2,986,435 | ||||||
| Total | 229,443,925 | 249,799,486 | ||||||
| Less-accumulated depreciation | 93,518,440 | 99,849,499 | ||||||
| Property, plant and equipment, net | 135,925,485 | 149,949,987 | ||||||
| GOODWILL | 13,868,647 | 13,868,647 | ||||||
| OTHER ASSETS | 1,476,353 | 1,476,213 | ||||||
| TOTAL | $ | 289,717,573 | $ | 316,886,778 | ||||
| LIABILITIES AND STOCKHOLDERS’ EQUITY | ||||||||
| CURRENT LIABILITIES | ||||||||
| Current portion of long-term debt | $ | 15,042,755 | $ | 15,039,488 | ||||
| Accounts payable | 16,892,695 | 18,061,711 | ||||||
| Dividends payable | 547,141 | 1,091,156 | ||||||
| Employees’ taxes withheld | 329,926 | 246,008 | ||||||
| Accrued profit sharing contribution | 604,723 | 786,937 | ||||||
| Accrued wages and expenses | 10,354,029 | 11,446,999 | ||||||
| Total current liabilities | 43,771,269 | 46,672,299 | ||||||
| LONG-TERM DEBT | 78,792,278 | 93,835,033 | ||||||
| DEFERRED INCOME TAXES | 30,481,620 | 29,833,680 | ||||||
| OTHER LIABILITIES | 5,683,708 | 7,939,582 | ||||||
| COMMITMENTS AND CONTINGENT LIABILITIES (NOTE 8) | ||||||||
| STOCKHOLDERS’ EQUITY | ||||||||
| Common stock-no par value-authorized 20,000,000 shares, issued 12,215,927 shares in 2002 and 12,184,677 in 2001 | 4,394,889 | 4,066,765 | ||||||
| Retained earnings | 128,719,560 | 138,555,379 | ||||||
| Accumulated other comprehensive loss | (1,307,883 | ) | (3,198,092 | ) | ||||
| Total | 131,806,566 | 139,424,052 | ||||||
| Less-treasury stock, 1,273,114 shares at cost | 817,868 | 817,868 | ||||||
| Total stockholders’ equity | 130,988,698 | 138,606,184 | ||||||
| TOTAL | $ | 289,717,573 | $ | 316,886,778 | ||||
| See notes to consolidated financial statements. | ||||||||
11
Consolidated Statements Of Cash Flows
Year Ended October 31, | ||||||||||||
2002 | 2001 | 2000 | ||||||||||
| CASH FLOWS FROM OPERATING ACTIVITIES | ||||||||||||
| Net earnings (loss) | $ | (6,008,897 | ) | $ | 1,348,022 | $ | 14,061,449 | |||||
| Adjustments to reconcile net earnings (loss) to net cash provided by operating activities: | ||||||||||||
| Deferred compensation liability | (53,203 | ) | (18,057 | ) | 180,982 | |||||||
| Postretirement liabilities | 198,856 | 228,432 | 313,913 | |||||||||
| Depreciation and amortization | 16,959,166 | 17,518,626 | 17,048,402 | |||||||||
| Loss on sale of investments and property, plant and equipment | 654 | 4,861 | 19,842 | |||||||||
| Deferred income taxes | 378,921 | 779,957 | 952,427 | |||||||||
| Changes in assets and liabilities which provided (used) cash, exclusive of changes shown separately | (1,764,966 | ) | 16,036,029 | (11,723,839 | ) | |||||||
| Net cash provided by operating activities | 9,710,531 | 35,897,870 | 20,853,176 | |||||||||
| CASH FLOWS FROM INVESTING ACTIVITIES | ||||||||||||
| Expenditures for property, plant and equipment | (2,088,490 | ) | (5,330,622 | ) | (16,315,186 | ) | ||||||
| Proceeds from sale of property, plant and equipment | 59,015 | 80,533 | 9,144 | |||||||||
| Purchases of investments | (13,938,270 | ) | (12,201,673 | ) | (7,645,800 | ) | ||||||
| Proceeds from sales of investments | 12,252,956 | 12,441,673 | 6,639,866 | |||||||||
| Other | 89,913 | (134,172 | ) | (215,768 | ) | |||||||
| Net cash used in investing activities | (3,624,876 | ) | (5,144,261 | ) | (17,527,744 | ) | ||||||
| CASH FLOWS FROM FINANCING ACTIVITIES | ||||||||||||
| Cash dividends | (3,826,922 | ) | (4,363,575 | ) | (4,376,150 | ) | ||||||
| Increase (decrease) in dividends payable | (544,015 | ) | 1,050 | (12,473 | ) | |||||||
| Proceeds from exercise of common stock options | 328,124 | 98,000 | 269,087 | |||||||||
| Payment of long-term debt | (15,039,488 | ) | (15,036,469 | ) | (15,033,699 | ) | ||||||
| Repurchase of common stock | — | — | (2,390,688 | ) | ||||||||
| Loan costs | (316,474 | ) | (414,375 | ) | — | |||||||
| Interest rate swap termination fee | (742,201 | ) | — | — | ||||||||
| Net cash used in financing activities | (20,140,976 | ) | (19,715,369 | ) | (21,543,923 | ) | ||||||
| NET INCREASE (DECREASE) IN CASH AND CASH EQUIVALENTS | (14,055,321 | ) | 11,038,240 | (18,218,491 | ) | |||||||
| CASH AND CASH EQUIVALENTS, BEGINNING OF YEAR | 26,106,683 | 15,068,443 | 33,286,934 | |||||||||
| CASH AND CASH EQUIVALENTS, END OF YEAR | $ | 12,051,362 | $ | 26,106,683 | $ | 15,068,443 | ||||||
| CHANGES IN ASSETS AND LIABILITIES WHICH PROVIDED (USED) CASH, EXCLUSIVE OF CHANGES SHOWN SEPARATELY | ||||||||||||
| (Increase) decrease in accounts receivable | $ | 1,653,025 | $ | 8,063,416 | $ | 6,974,739 | ||||||
| (Increase) decrease in refundable income taxes | (2,428,722 | ) | (535,651 | ) | (1,214,045 | ) | ||||||
| (Increase) decrease in inventories | 326,717 | 13,759,893 | (11,923,593 | ) | ||||||||
| (Increase) decrease in prepaid expenses | (107,018 | ) | 173,359 | 291,528 | ||||||||
| Increase (decrease) in accounts payable | (1,169,016 | ) | (484,935 | ) | (3,575,218 | ) | ||||||
| Increase (decrease) in accrued profit sharing contribution | (182,214 | ) | (2,934,264 | ) | (2,632,410 | ) | ||||||
| Increase (decrease) in accrued income taxes | — | — | (411,874 | ) | ||||||||
| Increase (decrease) in other liabilities | 142,262 | (2,005,789 | ) | 767,034 | ||||||||
| Total | $ | (1,764,966 | ) | $ | 16,036,029 | $ | (11,723,839 | ) | ||||
See notes to consolidated financial statements.
12
Notes To Consolidated Financial Statements
NOTE 1—SUMMARY OF SIGNIFICANT ACCOUNTING POLICIES
Principles of Consolidation- The consolidated financial statements include the accounts of Roanoke Electric Steel Corporation and its wholly-owned subsidiaries, Shredded Products Corporation, John W. Hancock, Jr., Inc., Socar, Inc., RESCO Steel Products Corporation, Roanoke Technical Treatment & Services, Inc. and Steel of West Virginia, Inc. (the “Company”).All significant inter-company accounts and transactions have been eliminated. The Company operates in a single business segment.
Inventories- Inventories of the Company are valued at cost on a first-in, first-out method or market, if lower (see Note 2).
Property, Plant and Equipment- These assets are stated at cost. Depreciation expense is computed by straight-line and declining-balance methods. Maintenance and repairs are charged against operations as incurred. Major items of renewals and betterments are capitalized and depreciated over their estimated useful lives. Upon retirement or other disposition of plant and equipment, the cost and related accumulated depreciation are removed from the property and allowance accounts, and the resulting gain or loss is reflected in earnings (see Notes 1 and 3).
Income Taxes- The Company applies the provisions of Statement of Financial Accounting Standards (“SFAS”) No. 109, “Accounting for Income Taxes”. Under SFAS No. 109, deferred income taxes are provided by the asset and liability method, which requires the recognition of deferred tax assets and liabilities for the future tax consequences of temporary differences between tax bases and financial reporting bases of other assets and liabilities (see Note 5).
Cash and Cash Equivalents- The Company considers all highly liquid debt instruments purchased with an original maturity of three months or less to be cash equivalents.
Investments- Investments consist primarily of debt securities which mature between 2002 and 2031. The Company complies with SFAS No.115, “Accounting for Certain Investments in Debt and Equity Securities”. In accordance with the provisions of SFAS No. 115, management has classified its entire debt securities portfolio as “available for sale”. Under SFAS No. 115, “available for sale” securities are reported at fair value with unrealized gains and losses reported as other comprehensive income. These investments are carried on the balance sheets at fair value, which approximates amortized cost.Accordingly, there were no adjustments to other comprehensive income at October 31, 2002, 2001 and 2000.
Revenue Recognition- Revenues from sales are recognized when products are shipped to customers, except for fabrication products which are recognized by the percentage-of-completion method in accordance with industry practice. There were no sales to an unaffiliated customer in excess of 10% of consolidated sales for 2002, 2001 or 2000.
Goodwill- In June 2001, SFAS No. 142, “Goodwill and Other Intangible Assets”, was issued, addressing financial accounting and reporting for acquired goodwill and other intangible assets. SFAS No. 142 eliminates amortization of goodwill and other intangible assets that are determined to have an indefinite useful life and, instead, requires goodwill to be tested for impairment, at least annually, and more frequently if an event occurs which indicates the goodwill may be impaired. The Company adopted SFAS No. 142 on November 1, 2001 and subsequently ceased goodwill amortization (see Note 15).
Concentration of Credit Risk- The Company sells to a large customer base of steel fabricators, steel service centers and construction contractors, most all of which deal primarily on 30-day credit terms. The Company believes its concentration of credit risk to be minimal in any one geographic area or market segment. The Company performs periodic credit evaluations of its customers’ financial condition and generally does not require collateral. Credit losses have not been significant in the past, with the exception of fiscal year 2000, and are generally within management’s expectations.
Fair Value of Financial Instruments- At October 31, 2002, the fair value of the Company’s cash and cash equivalents, accounts receivable, investments and long-term debt approximated amounts recorded in the accompanying consolidated financial statements (see Notes 1 and 6).
Stock Options- SFAS No. 123, “Accounting for Stock-Based Compensation”, adopts a “fair value based method” of accounting for employee stock option plans or similar stock-based compensation plans. Under the fair value based method, compensation cost is measured at the grant date based on the fair value of the award and is recognized over the service or vesting period. The statement does allow entities to continue to measure compensation using the “intrinsic value based method” of Accounting Principles Board Opinion (“APB”) No. 25, “Accounting for Stock Issued to Employees”, provided that they make pro forma disclosures on net earnings and earnings per common share as if the fair value based method of accounting had been applied. The Company has elected to continue to follow APB No. 25 (see Note 12).
Use of Estimates in the Preparation of Financial Statements- The preparation of financial statements in conformity with generally accepted accounting principles requires management to make estimates and assumptions that affect the reported amounts of assets and liabilities and disclosure of contingent assets and liabilities at the date of the financial statements and the reported amounts of revenues and expenses during the reporting period.Actual results could differ from those estimates.
Derivative Instruments- In June 1998, SFAS No. 133, “Accounting for Derivative Instruments and Hedging Activities”, was issued, establishing standards for accounting and reporting derivative instruments, including certain derivative instruments embedded in other contracts (collectively referred to as derivatives), and for hedging activities. Effective November 1, 2000, the
13
Company adopted the policy of accounting and reporting the fair value of derivatives used as cash flow hedging activities, as referred to in SFAS No. 133, through other comprehensive income (See Note 7).
Recent Accounting Pronouncements- In June 2001, SFAS No. 141, “Business Combinations”, was issued, establishing accounting and reporting standards for all business combinations initiated after June 30, 2001 and establishing specific criteria for the recognition of intangible assets separately from goodwill. SFAS No. 141 eliminates the pooling-of-interest method of accounting and requires all acquisitions consummated subsequent to June 30, 2001 to be accounted for under the purchase method. The Company’s previous acquisitions have been accounted for under the purchase method, and therefore, the November 1, 2001 Company adoption of SFAS No. 141 had no material impact on its results of operations and financial condition.
In June 2001, SFAS No. 143, “Accounting for Asset Retirement Obligations”, was issued, addressing financial accounting and reporting for obligations associated with the retirement of tangible long-lived assets and associated costs. SFAS No. 143 requires that the discounted fair value of a liability for an asset retirement obligation be recognized in the period in which it is incurred if a reasonable estimate of the fair value can be made. The associated asset retirement costs are capitalized as part of the carrying amount of the long-lived asset. The provisions of SFAS No. 143 will be effective for fiscal years beginning after June 15, 2002. The Company is considering the applications of this statement, and at present has not determined the impact of adopting SFAS No. 143.
In August 2001, SFAS No. 144, “Accounting for the Impairment or Disposal of Long-Lived Assets”, was issued, establishing an accounting model for long-lived assets to be disposed of by sale, whether previously held and used or newly acquired, and broadening the presentation of discontinued operations to include more disposal transactions. Adoption of this statement is required for fiscal years beginning after December 15, 2001. The Company is in the process of reviewing the impact this standard may have on its operations and financial position.
In April 2002, SFAS No. 145, “Rescission of SFAS No. 4, 44, and 64,Amendment of SFAS No. 13, and Technical Corrections as of April 2002”, was issued, which is effective for fiscal years beginning after May 15, 2002. SFAS No. 145 rescinds SFAS No. 4 which required that all gains and losses from extinguishment of debt be aggregated, and if material, classified as an extraordinary item. As a result, gains and losses from debt extinguishment are to be classified as extraordinary only if they meet the criteria set forth in APB No. 30, “Reporting the Results of Operations—Reporting the Effects of Disposal of a Segment of a Business, and Extraordinary, Unusual and Infrequently Occurring Events and Transactions”. SFAS No. 145 also requires that sale-leaseback accounting be used for capital lease modifications with economic effects similar to sale-leaseback transactions. The Company does not expect implementation of SFAS No. 145 to have a significant effect on its results of operations or financial condition.
In July 2002, SFAS No. 146, “Accounting for Costs Associated with Exit or Disposal Activities”, was issued, requiring companies to recognize costs associated with exit or disposal activities when they are incurred rather than at the date of a commitment to an exit or disposal plan. SFAS No. 146 replaces EITF Issue No. 94-3, “Liability Recognition for Certain Employee Termination Benefits and Other Costs to Exit an Activity (including Certain Costs Incurred in a Restructuring)”. SFAS No. 146 is to be applied prospectively to exit or disposal activities initiated after December 31, 2002. The Company has not yet determined the impact, if any, of the adoption of SFAS No. 146.
Reclassifications- Certain amounts included in the consolidated financial statements for prior years have been reclassified from their original presentation to conform with the current year presentation.
NOTE 2—INVENTORIES
Inventories include the following major classifications:
October 31, | |||||||||
2002 | 2001 | 2000 | |||||||
| Scrap steel | $ | 5,277,486 | $ | 4,162,011 | $ | 5,721,583 | |||
| Melt supplies | 2,796,460 | 2,908,676 | 3,318,385 | ||||||
| Billets | 10,334,185 | 6,927,793 | 17,266,805 | ||||||
| Mill supplies | 3,972,626 | 4,083,757 | 3,485,332 | ||||||
| Work-in-process | 6,919,731 | 5,576,565 | 6,877,954 | ||||||
| Finished steel | 33,062,114 | 39,030,517 | 39,779,153 | ||||||
| Total inventories | $ | 62,362,602 | $ | 62,689,319 | $ | 76,449,212 | |||
NOTE 3—PROPERTIES AND DEPRECIATION
Depreciation expense for the years ended October 31, 2002, 2001 and 2000 amounted to $16,073,507, $16,755,708 and $16,332,341, respectively. Generally, the rates of depreciation range from 3.3% to 20% for buildings and improvements and 5% to 33% for machinery and equipment. Property additions included no capitalized interest for 2002, 2001 and 2000.
NOTE 4—SHORT-TERM DEBT
On December 15, 1998, the Company replaced its existing credit facility with a new syndicated loan facility, part of which provided a five-year $30,000,000 revolver, as explained in Note 6. There also existed a $5,000,000 line of credit to be used to cover overdrafts in a demand deposit account. These lines of credit were unused at October 31, 2001. However, with adjustments needed to meet various financial covenants, the Company modified certain provisions of its credit agreement in January 2002, resulting in the elimination of both unused credit facilities mentioned above.
14
NOTE 5—INCOME TAXES
The Company files a consolidated federal income tax return. The federal income tax returns through October 31, 1999 have been examined by the Internal Revenue Service with all issues settled.
The following is a reconciliation of income tax expense (benefit) per consolidated statements of earnings (loss) to that computed by using the federal statutory tax rate of 35% for 2002, 34% for 2001 and 35% for 2000:
Year Ended October 31, | |||||||||||
2002 | 2001 | 2000 | |||||||||
| Federal tax at the statutory rate | $ | (3,663,951 | ) | $ | 765,712 | $ | 7,982,013 | ||||
| Increase (decrease) in taxes resulting from: | |||||||||||
| State income taxes, net of federal tax benefit | (651,004 | ) | (48,231 | ) | 473,894 | ||||||
| Other items, net | (144,580 | ) | 186,591 | 288,394 | |||||||
| Income taxes per consolidated statements of earnings (loss) | $ | (4,459,535 | ) | $ | 904,072 | $ | 8,744,301 | ||||
| The components of income tax expense(benefit) are as follows: | |||||||||||
Year Ended October 31, | |||||||||||
2002 | 2001 | 2000 | |||||||||
| Current income taxes: | |||||||||||
| Federal | $ | (3,925,324 | ) | $ | 361,433 | $ | 7,351,210 | ||||
| State | (913,132 | ) | (237,318 | ) | 440,664 | ||||||
| Total current income taxes | (4,838,456 | ) | 124,115 | $ | 7,791,874 | ||||||
| Deferred income taxes: | |||||||||||
| Federal | 467,334 | 615,717 | 664,023 | ||||||||
| State | (88,413 | ) | 164,240 | 288,404 | |||||||
| Total deferred income taxes | 378,921 | 779,957 | 952,427 | ||||||||
| Total income taxes | $ | (4,459,535 | ) | $ | 904,072 | $ | 8,744,301 | ||||
Deferred income taxes reflect the net tax effects of temporary differences between the carrying amounts of assets and liabilities for financial reporting purposes and the amounts used for tax purposes. There are no valuation allowances. The deferred tax liabilities and assets are as follows:
October 31, | ||||||
2002 | 2001 | |||||
| Deferred tax liabilities: | ||||||
| Depreciation | $ | 28,902,768 | $ | 27,854,757 | ||
| Fixed assets written up under purchase accounting | 1,578,852 | 1,578,852 | ||||
| Other | — | 400,071 | ||||
| Total deferred tax liabilities | 30,481,620 | 29,833,680 | ||||
| Deferred tax assets: | ||||||
| Reserves and accruals | 1,758,403 | 1,863,769 | ||||
| Self-insurance | 1,108,100 | 1,390,601 | ||||
| Uniform capitalization | 147,153 | 401,910 | ||||
| Derivative transactions | 584,986 | 348,260 | ||||
| Other | 732,029 | 1,597,915 | ||||
| Total deferred tax assets | 4,330,671 | 5,602,455 | ||||
| Net deferred tax liabilities | $ | 26,150,949 | $ | 24,231,225 | ||
NOTE 6—LONG-TERM DEBT
October 31, | ||||||
2002 | 2001 | |||||
| Long-term debt consisted of the following: | ||||||
| Syndicated term loan, secured by equipment, payable in quarterly installments of $3,750,000. Interest payable quarterly at the LIBOR rate of 1.81% plus 4.00%. Due January 3, 2006 | $ | 93,750,000 | $ | 108,750,000 | ||
| Other notes payable | 85,033 | 124,521 | ||||
| Revolving credit agreement | — | — | ||||
| Total | 93,835,033 | 108,874,521 | ||||
| Less-current portion | 15,042,755 | 15,039,488 | ||||
| Long-term debt | $ | 78,792,278 | $ | 93,835,033 | ||
15
In December 1998, the Company entered into a $30,000,000 revolving credit agreement with a group of banks that extended through December 15, 2003. Under the revolving credit agreement, interest was payable at October 31, 2001, at the LIBOR rate of 2.60% plus 1.75%. The agreement required the Company to pay a facility fee at an annual rate of .35% for 2001. In January 2002, the Company modified certain provisions of its credit agreement, which eliminated the unused revolving credit facility.
The Company does not use derivatives for trading purposes. Interest rate swaps, a form of derivative, are used to manage interest costs. On June 25, 1999, the Company did a reverse swap, converting $40,000,000 of term debt to a variable interest rate from a fixed rate. A fee of $1,300,000 was received and is being recorded in income ratably over the 6 1/2 years which remained to maturity of the term loan. On April 1, 2002, the Company effected an early termination, or unwind, of its interest rate swap agreements, resulting in the conversion of $75,000,000 of fixed-rate term debt into variable-rate borrowings. This reverse swap created a termination fee of $3,000,179 due the Lender, to be paid over the remaining term of the debt. The difference between fixed rate and floating rate interest was recognized as an adjustment to interest expense in the period incurred. The remaining $93,750,000 of variable rate term debt is subject to the risk of fluctuations in short-term interest rates; however, cash and investments at October 31, 2002 provided a partial hedge against rising interest rates.
Under the loan agreements, as modified, the Company must maintain consolidated current assets of not less than 1.5 times consolidated current liabilities and maintain consolidated funded debt of not greater than .50 times consolidated total capitalization. In addition, consolidated EBITDA could not be less than $0 for the year ended October 31, 2002. The Company was in compliance with the loan agreements, as modified, as of October 31, 2002 and 2001.
Annual aggregate long-term debt maturities are approximately $15,000,000 for 2003, 2004, 2005 and $48,750,000 for 2006.
NOTE 7—DERIVATIVE INSTRUMENTS
Effective November 1, 2000, the Company adopted SFAS No. 133. In the 2001 first quarter, in accordance with the transition provisions of SFAS No. 133, the Company recorded a cumulative effect earnings adjustment, after applicable taxes, of $1,663,516 in other comprehensive income to recognize the fair value of all derivatives designated as cash flow hedging instruments.
For certain hedging relationships, SFAS No. 133 eliminates special accounting formerly provided by U.S. GAAP. The Company has traditionally entered into interest rate swap and similar instruments to manage its exposure to movements in interest rates paid on corporate debt. Such instruments are matched with underlying borrowings. SFAS No. 133 eliminates special hedge accounting if the swap agreements do not meet certain criteria, thus requiring the Company to reflect all changes in their fair value in its current earnings. Since the Company’s prior swap agreements met the required criteria necessary to use special hedge accounting, the Company recorded a $875,595 after-tax earnings adjustment and a $4,339,218 after-tax loss adjustment, for the years ended October 31, 2002, and 2001, respectively, through other comprehensive income (loss), as a result of the change in the fair value of these swap instruments. As of April 1, 2002, the Company effected an early termination, or unwind, of its interest rate swap agreements, resulting in the conversion of fixed-rate debt into variable-rate borrowings. This swap unwind created a termination fee of $3,000,179 due the Lender, to be paid over the remaining term of the debt. For the year ended October 31, 2002, the reclassification, and subsequent amortization, of these past hedging relationships resulted in the Company recording an after-tax earnings adjustment of $492,224 through other comprehensive income (loss). Due to fluctuations in interest rates and volatility in market expectations, the fair market value of interest rate swap instruments can be expected to appreciate or depreciate over time. The Company plans to continue its practice of economically hedging various components of its debt. However, as a result of SFAS No. 133, such swap instruments may now create volatility in future reported earnings or other comprehensive income (loss).
In the 2001 third quarter, the Company entered into a one-year derivative financial instrument to minimize the exposure of price risk related to certain natural gas purchases used in the manufacturing process. The contracts used to mitigate the price risk related to natural gas purchases were designated as effective cash flow hedges for a portion of the natural gas usage over the period in the agreement. Unrealized gains and losses associated with marking the contracts to market were recorded as a component of other comprehensive income (loss) and included in the stockholders’ equity section of the balance sheet as part of accumulated comprehensive income (loss). These gains and losses were recognized in earnings in the month in which the related natural gas was used, or in the month a hedge was determined to be ineffective. For the years ended October 31, 2002 and 2001, the Company recorded an after-tax earnings adjustment of $522,390 and an after-tax loss adjustment of $522,390, respectively, through other comprehensive income (loss), related to future transactions, which were expected to be recognized in earnings within the one- year contract term. The cash flow hedge became ineffective on April 30, 2002, with the maturity, and termination, of both the gas and commodity derivative contracts.
NOTE 8—COMMITMENTS AND CONTINGENT LIABILITIES
At October 31, 2002, the Company was committed for $285,000 for purchases of equipment and production facilities.
The Company is not involved in any legal proceedings or environmental matters outside the ordinary course of business. In the opinion of management, amounts accrued for potential awards or assessments in connection with these matters at this time are adequate, and the outcome of such environmental and legal concerns currently pending will not have a material effect on the
16
Company’s consolidated financial position, results of operations, or cash flows. The Company reassesses these matters as new facts and cases are brought to management’s attention.
NOTE 9—COMMON STOCK AND EARNINGS PER SHARE
Outstanding common stock consists of 560,000 shares, issued prior to October 31, 1967, at no stated value; 750,656 shares issued subsequent to October 31, 1967, at a stated value of $.50 per share; 1,310,656 shares issued in 1981 at no stated value; 1,310,656 shares, less the equivalent of 42 fractional shares, issued in 1986 at no stated value; 1,965,963 shares, less the equivalent of 151 fractional shares, issued in 1988 at no stated value; 800 shares issued in 1989 at no stated value; 3,000 shares issued in 1992 at no stated value; 1,200 shares issued in 1993 at no stated value; 44,000 shares issued in 1994 at no stated value; 3,023,804 shares, less the equivalent of 152 fractional shares, issued in 1995 at no stated value; 23,750 shares issued in 1996 at no stated value; 35,950 shares issued in 1997 at no stated value; 4,572,870 shares, less the equivalent of 158 fractional shares, issued in 1998 at no stated value, less 1,253,800 treasury (repurchased) shares retired during 1998; 75,900 shares issued in 1999 at no stated value, less 126,000 treasury (repurchased) shares retired during 1999; 30,275 shares issued in 2000 at no stated value, less 155,000 treasury (repurchased) shares retired during 2000; 10,500 shares issued in 2001 at no stated value and 31,250 shares issued in 2002 at no stated value. During the years ended October 31, 1986 and October 31, 1996, the Company increased authorized common stock from 4,000,000 shares to 10,000,000 shares, and from 10,000,000 shares to 20,000,000 shares, respectively. The Company retired in 1998, 1999 and 2000 all of its treasury stock applicable to the shares acquired through its common stock repurchase plans.
SFAS No. 128, “Earnings per Share”, requires the presentation of “basic” earnings per share and “diluted” earnings per share on the face of the statement of earnings. Basic earnings per share is computed by dividing the net income available to common stockholders by the weighted average shares of outstanding common stock. The calculation of diluted earnings per share is similar to basic earnings per share except that the denominator includes dilutive common stock equivalents such as stock options and warrants. Basic earnings per share have been computed based on the weighted average number of shares outstanding of 10,934,380 for 2002, 10,908,584 for 2001 and 10,952,529 for 2000. The average number of shares outstanding was weighted after giving effect to stock options exercised and/or repurchased common stock during 2002, 2001 and 2000. Diluted earnings per share have been computed based on the weighted average number of shares outstanding (including outstanding and exercisable stock options) of 10,967,904 for 2002, 10,950,723 for 2001 and 10,990,032 for 2000.
NOTE 10—PROFIT SHARING PLANS
The Company, including Shredded Products Corporation, RESCO Steel Products Corporation, Socar, Inc. and Steel of West Virginia, Inc. (“SWVA”), has qualified profit sharing plans which cover substantially all employees. John W. Hancock, Jr., Inc. has an unqualified plan. Socar, Inc.’s annual contribution is discretionary while the other plans’, except SWVA, annual contribution cannot exceed 20% of their combined earnings before income taxes. SWVA’s annual contribution cannot exceed 17% of its pretax profit for bargaining unit employees, with comparable amounts contributed ratably to the nonbargaining group. Total contributions of all Companies shall not exceed the maximum amount deductible for such year under the Internal Revenue Code and amounted to $658,699 for 2002, $822,609 for 2001 and $5,093,651 for 2000.
NOTE 11—INTEREST EXPENSE
Interest expense is stated net of interest income of $1,055,175 in 2002, $1,518,196 in 2001 and $2,028,208 in 2000.
NOTE 12—STOCK OPTIONS
Under a nonqualified stock option plan approved by the stockholders in 1989, the Company may issue 112,500 shares of unissued common stock to employees of the Company each plan year. Under a non-statutory stock option plan approved by the Board in 1997, the Company may issue 25,000 shares of unissued common stock to directors of the Company over the life of the plan. There were no stock options granted in 2002. Options for 112,500 shares were granted for 2001, 112,500 shares for 2000, 112,500 shares for 1999, 84,000 shares for 1998, 82,000 shares for 1997, 75,000 shares for 1996, 41,500 shares for 1995, 36,000 shares for 1992 and 32,500 shares for 1990. Three-for-two stock splits in 1998 and 1995 increased these grants an additional 117,275 and 32,300 shares, respectively. These options are exercisable for a term of 5 years for employees and 10 years for directors from the date of grant, and a summary follows:
17
Weighted Average Exercise Price Per Share | Shares | |||||
| Balance, November 1, 1999 | $ | 12.57 | 333,825 | |||
| Granted | 14.45 | 112,500 | ||||
| Exercised | 7.56 | (30,275 | ) | |||
| Expired or terminated | — | — | ||||
| Balance, October 31, 2000 | 13.44 | 416,050 | ||||
| Granted | 9.61 | 112,500 | ||||
| Exercised | 7.93 | (10,500 | ) | |||
| Expired or terminated | 7.93 | (16,500 | ) | |||
| Balance, October 31, 2001 | 12.88 | 501,550 | ||||
| Granted | — | — | ||||
| Exercised | 8.93 | (31,250 | ) | |||
| Expired or terminated | 12.87 | (27,000 | ) | |||
| Balance, October 31, 2002 | 13.16 | 443,300 | ||||
| Shares available for grant at year-end | None | |||||
The Company applies APB No. 25 and related Interpretations in accounting for the nonqualified stock option plans. Accordingly, compensation cost of $0, $191,250 and $286,875 for the years ended October 31, 2002, 2001 and 2000, respectively, was recognized for the difference between the exercise price and the fair value of the stock price at the grant date. Had compensation cost been determined based on the fair value at the grant dates consistent with the method of SFAS No. 123, the Company’s net earnings (loss) and earnings (loss) per share would have been reduced to the pro forma amounts indicated below:
Year Ended October 31, | ||||||||||
2002 | 2001 | 2000 | ||||||||
| Net earnings (loss): | ||||||||||
| As reported | $ | (6,008,897 | ) | $ | 1,348,022 | $ | 14,061,449 | |||
| Pro forma | $ | (6,008,897 | ) | $ | 1,270,487 | $ | 13,870,069 | |||
| Basic net earnings (loss) per share: | ||||||||||
| As reported | $ | (0.55 | ) | $ | 0.12 | $ | 1.28 | |||
| Pro forma | $ | (0.55 | ) | $ | 0.12 | $ | 1.27 | |||
| Diluted net earnings (loss) per share: | ||||||||||
| As reported | $ | (0.55 | ) | $ | 0.12 | $ | 1.28 | |||
| Pro forma | $ | (0.55 | ) | $ | 0.12 | $ | 1.26 | |||
The fair value of options granted during the years ended October 31, 2001 and 2000 was $3.99 and $6.89, respectively. The following table summarizes information about stock options outstanding and exercisable at October 31, 2002:
Exercise Prices | Number Outstanding and Exercisable | Remaining Contractual Life in Years | ||
| $ 9.61 | 112,500 | 3.25 | ||
| 10.50 | 10,000 | 4.33 | ||
| 13.71 | 97,000 | 1.21 | ||
| 14.45 | 106,500 | 2.25 | ||
| 14.56 | 7,500 | 1.79 | ||
| 14.88 | 96,300 | .25 | ||
| 17.50 | 13,500 | 5.25 | ||
| 443,300 | ||||
The fair value of each option is estimated on the date of grant using the Black-Scholes option-pricing model with the following weighted average assumptions used for grants in 2001 and 2000, respectively: dividend yield of 3.02% and 2.59%; expected volatility of 37.19% and 41.41%; risk-free interest rates of 4.87% and 5.81%; and an expected life of 5 years.
NOTE 13—HEALTH BENEFITS AND POSTRETIREMENT COSTS
The Company currently provides certain health care benefits for terminated employees who have completed 10 years of continuous service after age 45, and SFAS No. 106, “Employers’ Accounting for Postretirement Benefits Other Than Pensions”, requires the Company to accrue the estimated cost of such benefit payments during the years the employee provides services. The Company
18
previously expensed the cost of these benefits as claims were incurred. SFAS No. 106 allows recognition of the cumulative effect of the liability in the year of adoption or the amortization of the obligation over a period of up to 20 years. The Company has elected to recognize this obligation of approximately $1,381,000 over a period of 20 years. Cash flows are not affected by implementation of SFAS No.106, but implementation decreased net earnings from continuing operations for 2002, 2001 and 2000 by $124,722, $142,062, and $195,442, respectively.
The Company’s postretirement benefit plan is not funded. The accrued postretirement benefit cost recognized in the balance sheets at October 31 is as follows:
2002 | 2001 | 2000 | ||||||||||
| Accumulated postretirement benefit obligation: | ||||||||||||
| Retirees | $ | 429,775 | $ | 215,498 | $ | 293,272 | ||||||
| Fully eligible plan participants | 1,155,688 | 867,634 | 928,845 | |||||||||
| Other active plan participants | 1,393,857 | 1,099,553 | 1,067,075 | |||||||||
| Accumulated postretirement benefit obligation | 2,979,320 | 2,182,685 | 2,289,192 | |||||||||
| Unrecognized net actuarial gains | 136,118 | 802,897 | 536,958 | |||||||||
| Unrecognized transition obligation | (760,000 | ) | (829,000 | ) | (898,000 | ) | ||||||
| Accrued postretirement benefit cost | $ | 2,355,438 | $ | 2,156,582 | $ | 1,928,150 | ||||||
| Net postretirement benefit cost consisted of the following components: | ||||||||||||
| Service cost | $ | 182,150 | $ | 181,275 | $ | 215,030 | ||||||
| Interest cost on accumulated postretirement benefit obligation | 142,169 | 139,290 | 143,275 | |||||||||
| Net amortization | 795 | (11,477 | ) | 58,703 | ||||||||
| Net postretirement benefit cost | $ | 325,114 | $ | 309,088 | $ | 417,008 | ||||||
The assumed health care cost trend rate used in measuring the accumulated postretirement benefit obligation was 8.0% for 2000, decreasing linearly each successive year until it reaches 5.0% in 2012, after which it remains constant.A one-percentage-point increase in the assumed health care cost trend rate for each year would increase the accumulated postretirement benefit obligation by $159,186 and the net postretirement benefit cost by $34,582. The assumed discount rate used in determining the accumulated postretirement benefit obligation was 6.75% and 7.0% for the years ended October 31, 2002 and 2001, respectively.
NOTE 14—UNAUDITED QUARTERLY FINANCIAL DATA
Summarized unaudited quarterly financial data for 2002 follows:
Three Months Ended | ||||||||||||||||
January 31 | April 30 | July 31 | October 31 | |||||||||||||
| Sales | $ | 57,939,910 | $ | 64,118,964 | $ | 69,779,452 | $ | 71,935,383 | ||||||||
| Gross earnings (loss) | $ | (654,765 | ) | $ | 6,302,207 | $ | 6,003,101 | $ | 5,950,512 | |||||||
| Net earnings (loss) | $ | (4,874,542 | ) | $ | (224,361 | ) | $ | (594,620 | ) | $ | (315,374 | ) | ||||
| Net earnings (loss) per share: | ||||||||||||||||
| Basic | $ | (.45 | ) | $ | (.02 | ) | $ | (.05 | ) | $ | (.03 | ) | ||||
| Diluted | $ | (.45 | ) | $ | (.02 | ) | $ | (.05 | ) | $ | (.03 | ) | ||||
Summarized unaudited quarterly financial data for 2001 follows:
Three Months Ended | |||||||||||||
January 31 | April 30 | July 31 | October 31 | ||||||||||
| Sales | $ | 74,771,535 | $ | 77,925,125 | $ | 79,420,173 | $ | 75,557,772 | |||||
| Gross earnings | $ | 9,627,159 | $ | 8,641,338 | $ | 8,571,720 | $ | 8,091,083 | |||||
| Net earnings (loss) | $ | 624,637 | $ | 872,719 | $ | 81,646 | $ | (230,980 | ) | ||||
| Net earnings (loss) per share: | |||||||||||||
| Basic | $ | .06 | $ | .08 | $ | .01 | $ | (.02 | ) | ||||
| Diluted | $ | .06 | $ | .08 | $ | .01 | $ | (.02 | ) | ||||
NOTE 15—GOODWILL
At fiscal year-end October 31, 2001, the Company had net goodwill of $13,868,647, accumulated amortization of $2,328,313 and had incurred $809,848 in goodwill amortization in the statement of earnings for the year then ended. The Company early adopted SFAS No. 142 on November 1, 2001 and subsequently discontinued goodwill amortization. The Company completed the first step of the transitional goodwill impairment test and determined that the fair value exceeded the recorded book value at October 31, 2001 and, thus, no goodwill impairment loss existed. Ongoing, the Company intends to perform its impairment testing during the third
19
quarter of each year. Any subsequent impairment losses, if any, will be reflected in operating income in the statement of earnings. The Company reevaluated its impairment testing of goodwill during the 2002 third quarter and determined that no goodwill impairment loss existed as of July 31, 2002. The carrying value of goodwill is periodically reviewed based upon an assessment of operations of the acquired entity. Such a review was performed as of October 31, 2002, with findings of no impairment loss.
Had the Company been accounting for its goodwill and other intangible assets under SFAS No. 142, the Company’s net earnings (loss) and earnings (loss) per share would have been as follows:
Year Ended October 31, | ||||||||||
2002 | 2001 | 2000 | ||||||||
| Reported net earnings (loss) | $ | (6,008,897 | ) | $ | 1,348,022 | $ | 14,061,449 | |||
| Add: goodwill amortization, net of tax | — | 809,848 | 809,848 | |||||||
| Adjusted net earnings (loss) | $ | (6,008,897 | ) | $ | 2,157,870 | $ | 14,871,297 | |||
| Basic and diluted net earnings (loss) per share: | ||||||||||
| Reported net earnings (loss) | $ | (0.55 | ) | $ | 0.12 | $ | 1.28 | |||
| Goodwill amortization, net of tax | — | 0.08 | 0.08 | |||||||
| Adjusted basic and diluted net earnings (loss) per share | $ | (0.55 | ) | $ | 0.20 | $ | 1.36 | |||
Note 16—SUPPLEMENTAL CASH FLOW INFORMATION
Year Ended October 31, | ||||||||||
2002 | 2001 | 2000 | ||||||||
| Cash paid during the period for: | ||||||||||
| Interest (net of amounts capitalized) | $ | 6,542,485 | $ | 8,591,557 | $ | 9,093,070 | ||||
| Income taxes (net of cash received) | $ | (2,409,734 | ) | $ | 659,766 | $ | 9,417,793 | |||
Note 17—DEFERRED COMPENSATION PLAN
The Company maintains a nonqualified deferred compensation plan (the “Executive Deferred Compensation Plan”). The purpose of the Executive Deferred Compensation Plan is to provide to certain eligible employees of the Company the opportunity to: (1) defer elements of their compensation (including any investment income thereon) which might not otherwise be deferrable under the current plans; and (2) receive the benefit of additions to their deferral comparable to those obtainable under the current plans in the absence of certain restrictions and limitations in the Internal Revenue Code. Amounts deferred are paid into a trust owned by the Company and are included in other assets. The Company’s liability and trust asset under the Executive Deferred Compensation Plan as of October 31, 2002 and 2001 was $470,293 and $523,496, respectively.
NOTE 18—ENTERPRISE-WIDE INFORMATION
The Company’s business consists of one industry segment, which is the extracting of scrap metal from discarded automobiles and the manufacturing, fabricating and marketing of merchant steel bar products and specialty steel sections, reinforcing bars, open-web steel joists and billets. The industry segment consists of three classes of products—merchant steel products and specialty steel sections, fabricated bar joists and reinforcing bars and billets.
Financial Information Relating to Classes of Products | |||||||||
2002 | 2001 | 2000 | |||||||
| Sales to unaffiliated customers: | |||||||||
| Merchant steel and specialty steel sections | $ | 172,654,655 | $ | 190,631,577 | $ | 228,202,644 | |||
| Bar joists and rebar | 73,575,373 | 101,985,847 | 122,549,851 | ||||||
| Billets | 17,543,681 | 15,057,181 | 21,975,613 | ||||||
| Total consolidated sales | $ | 263,773,709 | $ | 307,674,605 | $ | 372,728,108 | |||
Information relating to geographic areas indicates that significantly all of the consolidated sales are domestic, as foreign revenues are not material.
20
Independent Auditors’ Report
To the Stockholders and Board of Directors of Roanoke Electric Steel Corporation:
We have audited the accompanying consolidated balance sheets of Roanoke Electric Steel Corporation and its wholly-owned subsidiaries as of October 31, 2002 and 2001, and the related consolidated statements of earnings (loss), stockholders’ equity and comprehensive earnings (loss), and cash flows for each of the three years in the period ended October 31, 2002. These financial statements are the responsibility of the Company’s management. Our responsibility is to express an opinion on these financial statements based on our audits.
We conducted our audits in accordance with auditing standards generally accepted in the United States of America. Those standards require that we plan and perform the audit to obtain reasonable assurance about whether the financial statements are free of material misstatement. An audit includes examining, on a test basis, evidence supporting the amounts and disclosures in the financial statements. An audit also includes assessing the accounting principles used and significant estimates made by management, as well as evaluating the overall financial statement presentation. We believe that our audits provide a reasonable basis for our opinion.
In our opinion, such consolidated financial statements present fairly, in all material respects, the financial position of Roanoke Electric Steel Corporation and its wholly-owned subsidiaries at October 31, 2002 and 2001, and the results of their operations and their cash flows for each of the three years in the period ended October 31, 2002 in conformity with accounting principles generally accepted in the United States of America.
As discussed in Note 7 to the consolidated financial statements, effective November 1, 2000, the Company changed its method for accounting and reporting derivative instruments.
Raleigh, North Carolina
November 15, 2002
Stock Activity
The Common Stock of Roanoke Electric Steel Corporation is traded on the Nasdaq National Market using the symbol RESC. At year-end, there were approximately 625 shareholders of record.
2002 Stock Prices | 2001 Stock Prices | Cash Dividends | ||||||||||||
High | Low | High | Low | 2002 | 2001 | |||||||||
| First Quarter | 15.10 | 10.76 | 12.31 | 9.81 | $ | .10 | $ | .10 | ||||||
| Second Quarter | 16.31 | 11.71 | 16.00 | 10.50 | .10 | .10 | ||||||||
| Third Quarter | 16.50 | 11.70 | 17.50 | 13.50 | .10 | .10 | ||||||||
| Fourth Quarter | 12.61 | 9.25 | 17.70 | 11.01 | .05 | .10 | ||||||||
21
Management’s Discussion And Analysis Of Financial Condition And Results Of Operations
Results of Operations
Sales
Sales for 2000 were flat in comparison to 1999. Sales for the year included Steel of West Virginia, Inc.’s (“SWVA”) revenues for the entire period, whereas sales for 1999 included only the portion of SWVA’s revenues from the date of their acquisition, December 16, 1998. Improved selling prices for billets and bar products favorably impacted sales, also. However, sales were negatively affected by a 46% decrease in billet shipments, reduced bar and fabricated products shipments and lower selling prices for fabricated products. The dramatic reduction in billet shipments and changed billet market conditions the past two years was attributable to the financial condition and eventual bankruptcy of a major customer. Shipments to this customer were purposely curtailed to reduce the exposure to bad debts. The Company was not able to place the lost tonnage with alternate sources, other than the tons used internally by SWVA. Billet selling prices were higher due to increased prices of scrap steel, our main raw material, which normally trigger changes in billet prices. Average selling prices for bar products increased 1.2% for the year, but list prices had fallen sharply by the end of the year as a result of increased foreign and domestic competition. The increased competition and price uncertainty reduced order entry and backlogs and caused a 2.3% decrease in bar products shipments. The decline in fabricated products selling prices and shipments was caused by increased competition within the construction industry, even though business conditions continued strong and backlogs were high. The decline in fabricated products shipments was also affected by shortages of structural steel components.
In 2001, sales declined 17.5% as a result of depressed economic conditions within the steel industry, construction industry and certain niche markets. Selling prices for merchant bar products, fabricated products and specialty products declined 15%, 3% and 9%, respectively, due to heightened foreign and domestic competition. Selling prices for billets were 6.1% lower, mostly attributable to falling scrap steel costs. Shipment volumes were, also, negatively affected by poor business conditions. Shipments of specialty products were down 15.5%, primarily, as a result of depressed economic conditions within major market segments. Fabricated products shipments decreased 16% as construction activity slowed dramatically during the latter part of the year. Billet shipments declined 27% due to poor market conditions and the loss of the major customer referred to earlier. However, sales were positively affected by a 9% increase in tons shipped of merchant bar products due to new product offerings and declining inventory levels at steel service centers.
In 2002, poor business conditions continued and competition intensified, resulting in a 14.3% reduction in sales. Fabricated products suffered the greatest decline, as both selling prices and shipments were over 16% lower, due to much weaker construction activity and increased competitive pressures. In addition, a further softening in demand, caused by poor economic conditions within certain niche markets, resulted in a 14.8% decline in shipments of specialty steel products, while selling prices declined 3.6% due to heightened competition and product mix. Demand for merchant bar products diminished near year-end, resulting in a 3.2% decline in shipments and contributing to the decline in sales for the year. Also, selling prices for billets declined 1.6%, in spite of rising scrap costs, due to changes in the mix of products and customers. Sales were positively impacted by a .6% increase in selling prices for bar products and an 18.5% improvement in billet shipments. The selling price increase, although small, was significant in that it represented three increases in the list prices for bar products during the year, in spite of less than desirable market conditions and was, primarily, the result of rising scrap costs. Billet shipments spiked with the temporary return during the year of the major customer referred to above.
Cost of Sales and Gross Margins
In 2000, cost of sales increased, mainly, as a result of the impact of SWVA’s costs for the full year and a significant increase in the cost of scrap steel. Cost of sales declined in 2001 due, primarily, to the decreased tons shipped of billets, fabricated products and specialty products, together with the lower scrap costs. In 2002, cost of goods sold declined, principally, as a result of the decreased tons shipped of fabricated products, specialty steel products and merchant bar products, in spite of higher billet shipments and scrap steel costs.
In 2000, the percentage of gross earnings to sales dropped substantially from 20.2% to 16.8% due, primarily, to a 20% increase in the average cost of scrap steel and lower selling prices for specialty steel sections and fabricated products. Gross earnings as a percentage of sales fell further in 2001 to 11.5%, mostly, as a result of the declines in selling prices for all product classes, in spite of the lower scrap costs. In 2002, the percentage continued its slide to 6.7%, mainly, due to higher scrap
22
costs and lower selling prices for specialty steel products, fabricated products and billets.
Reduced margins for all product classes and significantly lower billet shipments were, mainly, responsible for the lower gross and net earnings in 2000. Further reductions in margins and reduced volumes for most product classes accounted for the lower gross and net earnings in 2001. In 2002, lower margins and volumes for fabricated products and specialty steel sections were the main reason for the decline in gross and net earnings.
Administrative Expenses
A charge to bad debts of $2.5 million due to the bankruptcy of a major billet customer accounted for most of the increase in administrative expenses in 2000. The inclusion of SWVA’s expenses in 2000 covering a longer period than in 1999, also, contributed to the increase, combined with higher professional fees and insurance expense. A number of expenses declined, including executive and management compensation, contributions and advertising. Administrative expenses as a percentage of 2000 sales rose to 7.7%, however, without the charge for bad debts, the percentage would have increased to only 7.0%.
In 2001, administrative expenses declined due to reduced bad debts and executive and other management compensation. Other expenses such as insurance and professional fees were higher. Administrative expenses as a percentage of sales increased to 8.3%, resulting from the significant decline in sales.
In 2002, administrative expenses decreased, as a result of reductions in almost all categories of expense. Major declines were made in executive and management compensation, travel, directors fees and contributions. In addition, the November 1, 2001 adoption of the new accounting standard for intangibles eliminated goodwill amortization during the current year, while 2001 and 2000 included amortization expense of $809,848. A few expenses increased such as bad debts and taxes other than payroll and income. Administrative expenses as a percentage of sales increased to 8.5%, due to the substantial decline in sales.
Interest Expense
In 2000, interest expense increased only slightly, in spite of lower average borrowings and increased interest income of $2,028,208, as a result of higher interest rates and no reduction for capitalized interest. Interest expense was, again, slightly higher in 2001 due to higher interest rates and lower interest income of $1,518,196, which more than offset reduced average borrowings. In 2002, interest expense declined due to reduced average borrowings and lower average interest rates, in spite of lower interest income of $1,055,175.
Profit Sharing Expense and Income Taxes
Contributions to various profit sharing plans are determined as a proportion of earnings before income taxes and should normally increase and decrease with earnings. However, in 2002, profit sharing expense was accrued, even though operating losses were incurred because two plans accrued benefits, as a result of incurred earnings by the sponsoring companies. One plan provided no benefits due to losses by the sponsoring company.
Income tax expense as a percentage of pretax income declined in 2000 due to the over accrual of prior years’state income taxes, which offset the effects of increased nondeductible amortization and lower recycling credits. In 2001, the effective rate increased due to the effect of nondeductible amortization and other expenses on the lower book income. In 2002, the effective rate for income tax benefits was higher due to higher income tax rates and refunds received in 2002 for research and development tax credits.
Financial Condition, Liquidity and Capital Resources
At year-end, working capital was $94,675,819, cash and investments were $26,155,381, the current ratio was 3.2 to 1 and the quick ratio was 1.6 to 1. All are sound indicators of ample liquidity and a healthy financial condition. Current debt maturities are $15,000,000 annually, which will affect future liquidity and working capital. The cash and investments, combined with internally generated funds should provide the liquidity and capital resources necessary to remain competitive, fund operations and meet required debt retirement. However, the Company modified certain provisions of its credit agreement in January, 2002. The modification resulted in the elimination of the Company’s unused $30,000,000 revolving credit facility and higher interest rate spreads, which negatively affected liquidity, capital resources and earnings. Also, the modification made certain financial covenants less restrictive and limited capital expenditures and acquisitions.
At October 31, 2002, there were commitments for the purchase of property, plant and equipment of approximately $285,000. These commitments will also affect working capital and future liquidity and will be financed from internally generated funds and existing cash reserves. In 2002, depreciation and amortization, alone, provided over $16,000,000 of cash flows for the replacement and modernization of our facilities.
During the year, borrowings decreased to $93,835,033, and the ratio of debt to equity improved to 1.2 to 1. The percentage of long-term debt to total capitalization decreased from 40.4% to 37.6% at year-end. However, net long-term debt, after deducting cash
23
and investments, as a percentage of total capitalization was only 28.7%, which is more respectable. With debt comprising a higher percentage of our capital structure and much tighter credit markets, the availability of capital resources could be more limited than in the past.
During the year, we terminated the interest rate swap, that was accounted for as a hedge, which, effectively, converted $75,000,000 of fixed-rate debt into variable-rate borrowings, placing the Company at risk for future increases in market interest rates. However, the conversion to currently lower variable rates has resulted in interest savings of $1,649,739 to date.
The Company has no material off-balance sheet financing arrangements nor does it have any transactions, arrangements or other relationships with any unconsolidated structured finance or special purpose entities.
The Company successfully completed its efforts to ensure Year 2000 readiness for all of its critical computer systems. As a result, the Company experienced no interruption of its operations during the transition to the Year 2000. The cost of the Company’s Year 2000 efforts was approximately $590,000.
Management is of the opinion that adoption of the Clean Air Act Amendments or any other environmental concerns will not have a materially adverse effect on the Company’s operations, capital resources or liquidity (see Note 8). Additional future capital expenditures are presently estimated to be less than $10,000,000 and will be completed and funded as the Company’s financial resources permit.
Critical Accounting Policies and Estimates Critical Accounting Policies and Estimates
The Registrant’s discussion and analysis of its financial condition and results of operations is based upon the Company’s consolidated financial statements, which have been prepared in accordance with accounting principles generally accepted in the United States of America. Estimates and assumptions are made, during the preparation of these financial statements, that affect the amounts reported. Periodically, the Company evaluates its estimates, including those related to contracts, warranties, taxes, insurance and environment. Under different assumptions and conditions, actual costs may vary from these estimates.
The Company believes the following critical accounting policies affect its more significant judgments and estimates used in the preparation of its consolidated financial statements. Allowances for doubtful accounts are maintained to provide for estimated losses resulting from the inability of its customers to make required payments. If the financial condition of these customers became worse, resulting in their inability to make payments, additional allowances may be required. The Company periodically reviews for impairment of its long-lived assets, and whenever changes in circumstances indicate that the carrying amount of the assets may not be recoverable, records an impairment charge if necessary. Compliance issues, associated with environmental laws and regulations established by federal, state and local authorities, could subject the Company to various related costs. The Company makes provision for these costs, but if the environmental laws and regulations or the varying underlying assumptions change, adjustment to the reserves may be necessary. Provision is also made for estimated costs associated with coverages for workers’compensation insurance and self-insured health plans. These estimates and related reserves could require revision if circumstances and conditions warrant.
Forward-Looking Statements
From time to time, the Company may publish forward-looking statements relating to such matters as anticipated financial performance, business prospects, technological developments, new products, research and development activities and similar matters. The Private Securities Litigation Reform Act of 1995 provides a safe harbor for forward-looking statements. In order to comply with the terms of the safe harbor, the Company notes that a variety of factors could cause the Company’s actual results and experience to differ materially from the anticipated results or other expectations expressed in the Company’s forward-looking statements. The risks and uncertainties that may affect the operations, performance, development and results of the Company’s business include conomic and industry conditions, availability and prices of supplies, prices of steel products, competition, governmental regulations, interest rates, inflation, labor relations, environmental concerns and others.
24