Exhibit 13

CELEBRATING OUR 50TH ANNIVERSARY
Roanoke Electric Steel
Annual Report 2005

GOLDEN ANNIVERSARY, GOLDEN YEAR.
Record Earnings
Record Sales
Record Shareholder Equity
1
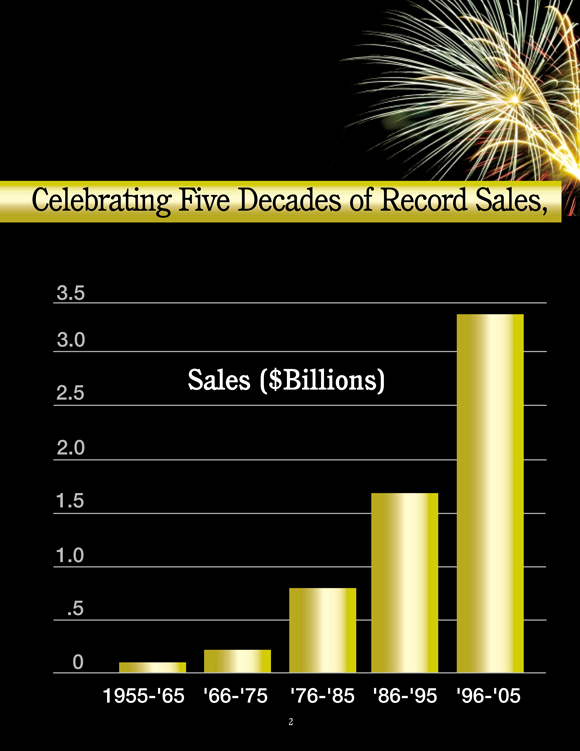
Celebrating Five Decades of Record Sales,
3.5
3.0
2.5
2.0
1.5
1.0
.5
0
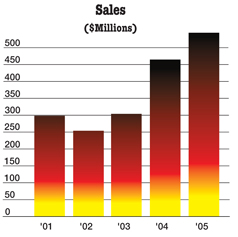
Sales ($Billions)
1955-’65
’66-’75
’76-’85
’86-’95
’96-’05
2
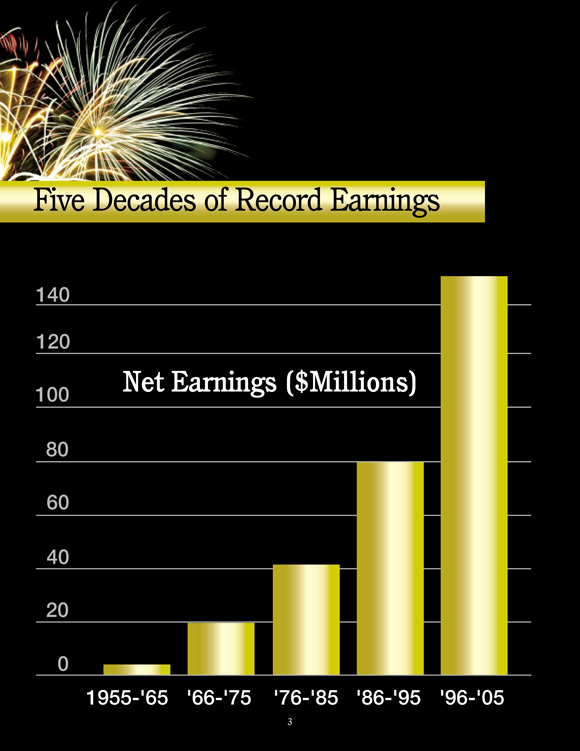
Five Decades of Record Earnings
140
120
100
80
60
40
20
0
Net Earnings ($Millions)
1955-’65
’66-’75
’76-’85
’86-’95
’96-’05
3
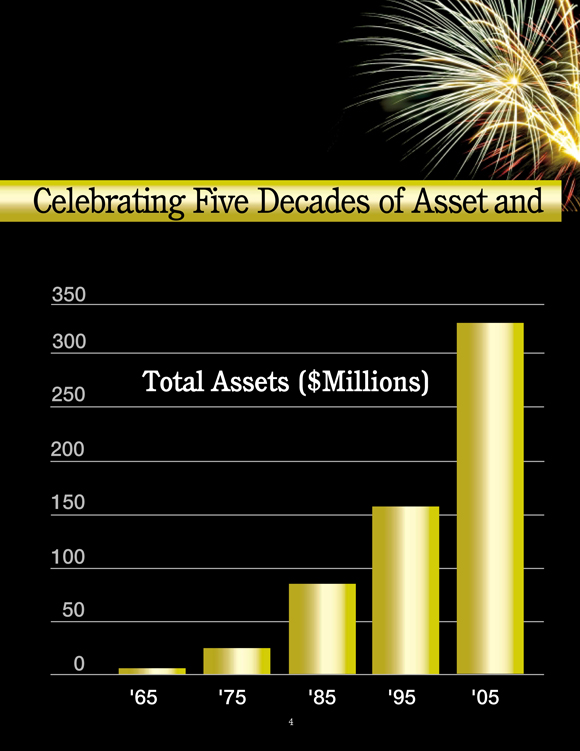
Celebrating Five Decades of Asset and
350
300
250
200
150
100
50
0
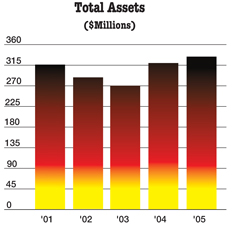
Total Assets ($Millions)
’65
’75
’85
’95
’05
4
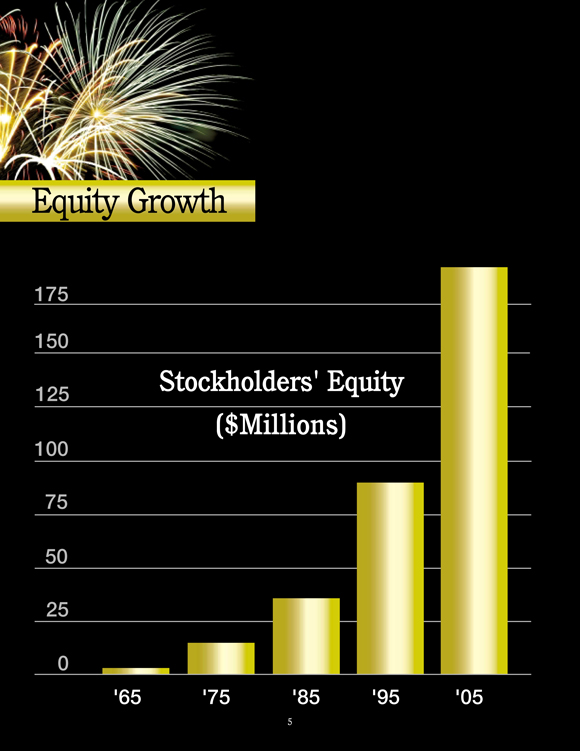
Equity Growth
175
150
125
100
75
50
25
0
Stockholders’ Equity
($Milions)
’65
’75
’85
’95
’05
5

1955 to 1965
On April 6, 1955, Roanoke Electric Steel Corporation (RESCO) was organized, under the laws of Virginia, by John W. Hancock, Jr.
Initial capitalization consisted of 2,165 shares of common stock issued for $216,500; $433,000 borrowed on second mortgage bonds; and $350,500 borrowed on first mortgage bonds.
Operations began in 1956 with less than 100 company employees and a 6 ton electric furnace. Our first full year of operations produced earnings of $94,000 on sales of $2,663,000.
Steady growth ensued. In only five years, RESCO was operating at peak production. To grow, new facilities were needed. So, in 1960, we purchased a 10 ton furnace. With two furnaces in operation, production in 1961 was nearly triple our initial 1957 level.
In 1962, RESCO became the first commercial continuous steel casting plant in the United States. Our conversion eliminated the inefficiencies of producing ingots by pouring molten metal into molds.
RESCO began operating the Bowie Steel Division, in Bowie, Maryland, in 1964. A reinforcing bar fabricating plant, the Bowie Steel Division gave us greater diversification while at the same time provided an outlet for some of RESCO’s products.
We also acquired the land, building, and equipment of Donalson Steel Corporation in Salem, Virginia. This facility produced merchant steel products from billets produced at the Roanoke Plant.
By 1965, the end of our first decade, sales exceeded $12 million, earnings were $700 thousand, assets were $6 million and stockholders’ equity exceeded $3 million.
October 1965, RESCO declares its 28th consecutive quarterly dividend.
Celebrating 188 Consecutive Quarters of Cash
1966 to 1975
Roanoke Electric Steel Corporation’s third electric furnace, another 10 ton model, went into operation in 1966. This same year, a new pollution control system was installed.
Major modernization of plant facilities began in 1969 to expand our rolling mill capacity.
In 1974, RESCO purchased the common stock of Shredded
Productions Corporation in Montvale, Virginia. This acquisition, which recycles junked automobiles, guaranteed a supply of up to 8,000 tons a month of scrap steel to our Roanoke plant.
Another substantial mill modernization program was undertaken. A larger and more efficient reheat furnace was constructed and a new tandem breakdown mill was installed. The mill building was extended to accommodate these improvements.
In 1975, John W. Hancock, Jr., Inc., a major customer of RESCO engaged in the manufacture of open web steel joists, was merged into Roanoke Electric Steel Corporation. Acquiring this Hancock subsidiary gave RESCO additional diversification.
Soon we were ready to expand again. This time, we installed a 20 ton electric furnace, double the size of our largest furnaces. Our first electric furnace was retired after 20 years of service.
By 1975, the end of our second decade, sales reached $39 million, earnings were $3 million, assets grew to $25 million and stockholders’ equity was $15 million.
October 1975, RESCO declares its 68th consecutive quarterly dividend.
1976 to 1985
Production by 1977 had increased more than 7 times over RESCO’s first year.
With one 20 ton and two 10 ton electric furnaces, our melt shop capacity was greatly increased. Again, we needed to expand. Along with needed mill improvements, we added a new straightener and storage building, and a second finishing mill.
By 1980, after twenty-five years in business, Roanoke Electric Steel Corporation’s total assets exceeded $40 million. Owners’ equity was in excess of $25 million. Payroll exceeded $15 million. From fewer than 100 employees in 1957, total employment grew to over 850.
In the early 80’s a major melt shop expansion program was completed. Included were a new 40 ton furnace and 4-strand continuous casting machine. This doubled production capacity.
In 1985 RESCO acquired Socar, Inc., a bar joist manufacturer who was a major customer prior to the acquisition and operated plants in Florence, S.C. and Continental, Ohio.
At the end of our third decade, 1985 sales were $119 million, earnings were $6 million, assets grew to $86 million and stockholders’ equity was $36 million.
October 1985, RESCO declares its 108th consecutive quarterly dividend.
6

Dividends to Shareholders
1986 to 1995
To increase capacity and lower cost of production, a major rolling mill expansion and modernization program was completed in the mid 80’s. The project included a larger, more efficient reheat furnace, automatic in-line straightening, shearing and bundling equipment, additional mill stands and an extension of the cooling bed.
The new reheat furnace dramatically reduced energy costs with natural gas consumption substantially decreased. Labor costs were substantially reduced due to automation. Increased rolling mill capacity and higher gross margins, due to lower production cost per ton, would benefit RESCO for years to come.
By the early-90’s the nation and the steel industry were experiencing an economic downtown. The cost efficiencies generated by the modernization program allowed RESCO to weather this downturn.
By 1995, the end of our fourth decade, RESCO exceeded all previous performance records with sales of $260 million, earnings of $20 million, assets totalling $159 million and stockholders’ equity of $91 million.
From 1985 to 1995, capital expenditures totaled $97 million and acquisitions amounted to $21 million. The record results of the mid-90’s could not have been attained without these outlays.
October 1995, RESCO declares its 148th consecutive quarterly dividend.
1996 to 2005
In 1996, RESCO experienced its second-best year on record. Fabricating subsidiaries attained record earnings and RESCO installed a new ladle furnace and upgraded an electric arc furnace.
Through the late 90’s, RESCO announced four consecutive years of record sales and earnings.
Forbes Magazine named RESCO “One of the 200 Best Small Companies in America”. RESCO was “Ranked #1 in Customer Satisfaction” by Jacobson & Associates, a steel industry consultant.
In 1999, RESCO acquired Steel of West Virginia, Inc. (“SWVA”) at a cost of approximately $117 million. The acquisition of SWVA, a producer of steel beams, channels and special sections, provided RESCO a greater range of products, excellent growth opportunities, market expansion, and a captive outlet for excess billet capacity.
Soon after the turn of the century, business conditions began to deteriorate. Slow construction activity, lower selling prices and increased foreign competition took its toll on the U.S. steel industry with many producers filing for bankruptcy.
Due, in large part, to its mid-80’s investment in plant modernization and cost efficiencies, along with its history of customer satisfaction, RESCO survived the worst downturn in its history. And by 2004, RESCO was again announcing record earnings, record sales and record shareholders’ equity.
By 2005, the end of our fifth decade, RESCO again exceeded previous performance records and celebrates its 50th anniversary with sales of $547 million, earnings of $40 million, total assets of $333 million and stockholders’ equity of $192 million.
October 2005, RESCO declares its 188th consecutive quarterly dividend.
John W. Hancock, Jr. President 1955 to 1967
William M. Meador President 1967 to 1985
Donald G. Smith President 1985 to 2004
T. Joe Crawford President 2004 to present
7
Roanoke Electric Steel Corporation
The Company is a domestic steel manufacturing company. The Company, directly and through its subsidiaries, is engaged in the manufacturing, fabricating and marketing of merchant steel products, specialty steel sections, billets and open-web steel joists. Each subsidiary is either a supplier to the parent company or a purchaser of its finished product and billets. The Company sells products through its sales force to its customers, which include service centers, original equipment manufacturers, and fabricators.
Roanoke Electric Steel Corporation, the parent company, is a state-of-the-art steel mini-mill located in Roanoke, Virginia. This facility melts scrap steel in electric furnaces and continuously casts the molten steel into billets. These billets are rolled into merchant steel products consisting of angles, plain rounds, flats and channels of various lengths and sizes. Excess steel billet production is sold to mills without sufficient melting capacities or facilities. Roanoke Electric Steel Corporation markets its products to steel service centers and fabricators.
Steel of West Virginia, Inc., through its subsidiary, SWVA, Inc., is a steel mini-mill and steel fabricating facility operating in Huntington, West Virginia. A steel fabricating subsidiary, Marshall Steel, Inc., is located in Memphis, Tennessee. These locations produce or fabricate specialty steel sections and custom-finished products and serve niche markets.
Shredded Products Corporation, a subsidiary with operations in Rocky Mount and Montvale, Virginia, extracts scrap steel and other metals from junked automobiles and other waste materials. These facilities supply the parent company with a substantial amount of its raw materials. Nonferrous metals generated in the process are sold to unrelated customers.
John W. Hancock, Jr., Inc. and Socar, Inc. are steel fabrication subsidiaries located in Salem, Virginia, Florence, South Carolina and Continental, Ohio. All three operations purchase rounds and angles from the parent company to fabricate steel joists and joist girders. These joists and joist girders are used as horizontal supports for floors and roofs in commercial and industrial buildings. The Hancock facility also manufactures structural pallet rack and structural cantilever rack. This rack is used for heavy storage in retail, warehouses and distribution centers.
RESCO Steel Products Corporation, a Salem, Virginia based subsidiary, fabricated concrete reinforcing steel by cutting and bending it to contractor specifications, until its sale on January 27, 2005 (see Note 1 - Discontinued Operations).
8
To Our Shareholders
2005 Results
Fiscal 2005, our 50th year in business, was the best year in the history of our company. We are especially pleased because this marks the second year in a row of record sales and earnings. We are also proud to report the achievement of a number of financial records during the year:
| • | Record sales of $546,612,163 |
| • | Record earnings of $40,319,433 |
| • | Record earnings per share of $3.63 |
| • | Record shareholders’ equity of $192,449,434 |
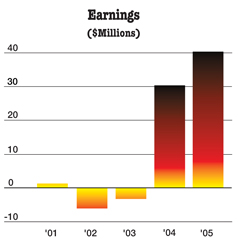
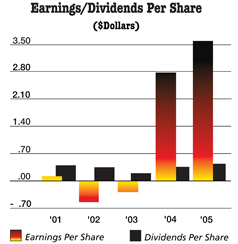
In 2005, the company had earnings of $40,319,433, an increase of 32.4% over the previous record earnings of $30,446,248 achieved last year. Basic earnings per share were $3.63 in 2005, compared to basic earnings per share of $2.78 in 2004.
The upward momentum experienced by our company in 2004 continued in 2005. Sales for 2005 of $546,612,163 increased 17.4% from the previous record level set in 2004, due to improved average selling prices for most of our products. The improvement in average selling prices was principally due to the continued volatile scrap market, which prompted industry-wide price increases due to the rising cost of scrap steel. In fact, average selling prices increased during the year by 12.6% for merchant bar products, by 18.4% for specialty steel products, by 34.0% for fabricated products and by 11.7% for billets. Our gross margins also improved during the year, as increases in average selling prices exceeded the increases in average scrap costs.
 |  | |
9
Financial Condition
Our financial condition continued to improve during the year. In October 2004, the company finalized a new 5-year loan facility with its banking syndicate, providing a revolving credit line and less restrictive covenants than the prior agreement. In addition, at year-end the company reported:
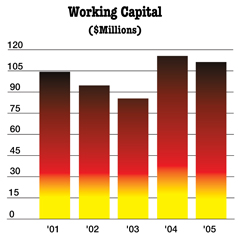
| • | Working capital of $111,181,959 |
| • | A current ratio of 2.1 to 1, and a quick ratio of .9 to 1 |
| • | A reduction in net debt (funded debt less cash and cash equivalents) of $51,336,687 |
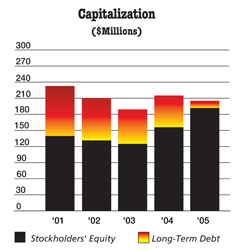
| • | Long-term debt as a percentage of total capital at 6.6%, down from 27.5% last year |
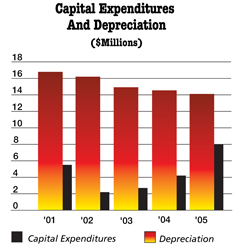
Throughout our history, a hallmark of our company has been continued investment in equipment, processes and technology. However, capital expenditures were limited during the last few years, due to one of the most prolonged and difficult downturns ever experienced in the steel industry. During 2005, we were able to address needed capital expenditures due to our improved financial position and increased free cash flows resulting from the company’s improved results, ensuring our position as a low-cost producer and further enhancing shareholder value.
 |  | |
10
Shareholder Value
Continuing the trend from 2004, when our share price increased by 47%, the company continued to create value for our shareholders in 2005, as our share price increased by 50% during the year. In addition, the cash dividends for our shareholders increased from $.36 in 2004 to $.44 in 2005, more than a 22% increase. The company also declared its 188th consecutive quarterly dividend in the amount of 11 cents per share, payable November 25, 2005. Based on the share price at year-end, the annual yield on our common stock was approximately 2%.
Looking Forward
As we look to fiscal 2006, we sadly see the 50-year history of Roanoke Electric Steel Corporation as an independent company coming to a close. But, we are equally excited and looking forward with anticipation to the beginning of our next 50 years with Steel Dynamics, Inc. The merger will place our company in a much better position to undertake necessary capital projects, meet increasing competitive pressures and serve customers more efficiently. The financial strength and resources of Steel Dynamics will present greater opportunities for the company to grow and prosper in the future.
 |  | |
11
It has been our pleasure to report the progress made by our company over the last 50 years. Traveling the road of success, from our beginning in 1955 to the close of our 50th year, culminating in sales of over one half billion dollars and earnings of over $40 million, has been a remarkable and wonderful journey. None of this would have been possible without the dedication of our past and present employees, and we thank them for their years of loyalty, hard work and commitment to excellence. We would also like to thank our many valued customers for their contribution to our success over the years. To you, our shareholders, we greatly appreciate your interest, confidence and investment in Roanoke Electric Steel Corporation.
Finally, we all owe a special debt of gratitude to the one individual who, 50 years ago, took a vision to reality by creating a company, which throughout its history, has achieved almost unprecedented results in the steel industry - Mr. John W. “Jack” Hancock, Jr. His dream, his perseverance and unending drive, his dedication and many years of stewardship, his loyalty to those around him and, especially, his honesty, integrity and keen business sense all combined to mold this company into what it has become today. We know that he would be proud of what our company has accomplished in our first 50 years and that he would be fully behind the direction we have chosen for our next 50 years. Thank you, Jack, for what has been a great ride and for paving the road to what promises to be an exciting and prosperous future.
 |  | |||
| T. Joe Crawford | Donald G. Smith | |||
| President Chief Operating Officer | Chairman of the Board Chief Executive Officer | |||
 |  | |
12
Selected Financial Data
Year Ended October 31, | 2005 | 2004* | 2003* | 2002* | 2001* | |||||||||||||||
Operations | ||||||||||||||||||||
Sales | $ | 546,612,163 | $ | 465,586,429 | $ | 303,569,211 | $ | 253,471,036 | $ | 298,387,071 | ||||||||||
Gross earnings | 102,505,950 | 81,836,414 | 22,206,273 | 15,639,384 | 33,028,819 | |||||||||||||||
Interest expense | 3,412,641 | 4,480,195 | 5,435,464 | 6,552,936 | 8,670,337 | |||||||||||||||
Income tax expense (benefit) | 24,675,957 | 18,317,681 | (1,706,927 | ) | (4,420,665 | ) | 1,013,926 | |||||||||||||
Earnings (loss) from continuing operations before cumulative effect of change in accounting principle | 41,245,394 | 30,620,387 | (2,521,834 | ) | (5,944,794 | ) | 1,528,200 | |||||||||||||
Earnings (loss) from continuing operations | 41,245,394 | 30,620,387 | (2,750,244 | ) | (5,944,794 | ) | 1,528,200 | |||||||||||||
Loss on discontinued operations (see Note 1) | (925,961 | ) | (174,139 | ) | (474,709 | ) | (64,103 | ) | (180,178 | ) | ||||||||||
Net earnings (loss) | 40,319,433 | 30,446,248 | (3,224,953 | ) | (6,008,897 | ) | 1,348,022 | |||||||||||||
Financial Position | ||||||||||||||||||||
Working capital | $ | 111,181,959 | $ | 115,500,754 | $ | 85,281,889 | $ | 94,675,819 | $ | 104,919,632 | ||||||||||
Total assets | 333,410,067 | 318,971,033 | 270,867,486 | 289,717,573 | 316,886,778 | |||||||||||||||
Long-term debt and capital lease obligation, excluding current portion | 13,625,213 | 58,941,362 | 63,958,948 | 78,792,278 | 93,835,033 | |||||||||||||||
Stockholders’ equity | 192,449,434 | 155,395,361 | 126,065,624 | 130,988,698 | 138,606,184 | |||||||||||||||
Selected Ratios | ||||||||||||||||||||
Gross profit margin | 18.8 | % | 17.6 | % | 7.3 | % | 6.2 | % | 11.1 | % | ||||||||||
Operating income (loss) margin | 7.5 | % | 6.6 | % | (0.9 | %) | (2.3 | %) | 0.5 | % | ||||||||||
Effective tax (benefit) rate | 37.4 | % | 37.4 | % | (40.4 | %) | (42.6 | %) | 39.9 | % | ||||||||||
Current ratio | 2.1 | 2.6 | 2.9 | 3.2 | 3.2 | |||||||||||||||
Quick ratio | 0.9 | 1.0 | 1.4 | 1.6 | 1.8 | |||||||||||||||
Funded debt as a percentage of total capital | 15.5 | % | 29.5 | % | 36.2 | % | 41.7 | % | 44.0 | % | ||||||||||
Return on average stockholders’ equity | 23.2 | % | 21.6 | % | (2.5 | %) | (4.5 | %) | 1.0 | % | ||||||||||
Per Share Data | ||||||||||||||||||||
Earnings (loss) from continuing operations before cumulative effect of accounting change: | ||||||||||||||||||||
Basic | $ | 3.71 | $ | 2.79 | $ | (0.23 | ) | $ | (0.54 | ) | $ | 0.14 | ||||||||
Diluted | 3.67 | 2.77 | (0.23 | ) | (0.54 | ) | 0.14 | |||||||||||||
Loss on discontinued operations: | ||||||||||||||||||||
Basic | (0.08 | ) | (0.02 | ) | (0.04 | ) | (0.01 | ) | (0.02 | ) | ||||||||||
Diluted | (0.08 | ) | (0.02 | ) | (0.04 | ) | (0.01 | ) | (0.02 | ) | ||||||||||
Net earnings (loss): | ||||||||||||||||||||
Basic | 3.63 | 2.78 | (0.29 | ) | (0.55 | ) | 0.12 | |||||||||||||
Diluted | 3.59 | 2.76 | (0.29 | ) | (0.55 | ) | 0.12 | |||||||||||||
Cash dividends | 0.44 | 0.36 | 0.20 | 0.35 | 0.40 | |||||||||||||||
Stockholders’ equity | 17.26 | 14.11 | 11.53 | 11.97 | 12.70 | |||||||||||||||
Weighted average common shares outstanding: | ||||||||||||||||||||
Basic | 11,118,490 | 10,957,586 | 10,938,999 | 10,934,380 | 10,908,584 | |||||||||||||||
Diluted | 11,243,655 | 11,034,445 | 10,945,346 | 10,967,904 | 10,950,723 | |||||||||||||||
| * | Certain profit sharing costs relating to production employees have been reclassified from their original presentation to conform with the current year presentation. |
13
Consolidated Financial Statements
Consolidated Statements Of Earnings (Loss)
| Year Ended October 31, | ||||||||||||
| 2005 | 2004 | 2003 | ||||||||||
SALES | $ | 546,612,163 | $ | 465,586,429 | $ | 303,569,211 | ||||||
COSTS | ||||||||||||
Cost of sales | 435,660,134 | 376,017,112 | 280,304,764 | |||||||||
Profit sharing | 8,446,079 | 7,732,903 | 1,058,174 | |||||||||
Total | 444,106,213 | 383,750,015 | 281,362,938 | |||||||||
GROSS EARNINGS | 102,505,950 | 81,836,414 | 22,206,273 | |||||||||
OTHER OPERATING EXPENSES (INCOME) | ||||||||||||
Administrative | 31,526,927 | 30,026,395 | 21,735,226 | |||||||||
Interest expense | 3,412,641 | 4,480,195 | 5,435,464 | |||||||||
Profit sharing | 1,958,434 | 1,661,270 | 218,862 | |||||||||
Interest income | (215,501 | ) | (207,694 | ) | (433,558 | ) | ||||||
Antitrust litigation settlement | (97,902 | ) | (3,061,820 | ) | (520,960 | ) | ||||||
Total | 36,584,599 | 32,898,346 | 26,435,034 | |||||||||
EARNINGS (LOSS) FROM CONTINUING OPERATIONS BEFORE INCOME TAXES AND CUMULATIVE EFFECT OF CHANGE IN ACCOUNTING PRINCIPLE | 65,921,351 | 48,938,068 | (4,228,761 | ) | ||||||||
INCOME TAX EXPENSE (BENEFIT) | 24,675,957 | 18,317,681 | (1,706,927 | ) | ||||||||
EARNINGS (LOSS) FROM CONTINUING OPERATIONS BEFORE CUMULATIVE EFFECT OF CHANGE IN ACCOUNTING PRINCIPLE | 41,245,394 | 30,620,387 | (2,521,834 | ) | ||||||||
CUMULATIVE EFFECT OF CHANGE IN ACCOUNTING PRINCIPLE | — | — | (228,410 | ) | ||||||||
EARNINGS (LOSS) FROM CONTINUING OPERATIONS | 41,245,394 | 30,620,387 | (2,750,244 | ) | ||||||||
DISCONTINUED OPERATIONS (NOTE 1): | ||||||||||||
LOSS ON DISCONTINUED OPERATIONS BEFORE INCOME TAXES (INCLUDING LOSS ON SALE) | (1,518,263 | ) | (271,974 | ) | (756,458 | ) | ||||||
INCOME TAX BENEFIT | (592,302 | ) | (97,835 | ) | (281,749 | ) | ||||||
LOSS ON DISCONTINUED OPERATIONS | (925,961 | ) | (174,139 | ) | (474,709 | ) | ||||||
NET EARNINGS (LOSS) | $ | 40,319,433 | $ | 30,446,248 | $ | (3,224,953 | ) | |||||
EARNINGS (LOSS) PER SHARE OF COMMON STOCK: | ||||||||||||
BASIC: | ||||||||||||
EARNINGS (LOSS) FROM CONTINUING OPERATIONS BEFORE CUMULATIVE EFFECT OF ACCOUNTING CHANGE | $ | 3.71 | $ | 2.79 | $ | (0.23 | ) | |||||
CUMULATIVE EFFECT OF ACCOUNTING CHANGE | — | — | (0.02 | ) | ||||||||
EARNINGS (LOSS) FROM CONTINUING OPERATIONS | 3.71 | 2.79 | (0.25 | ) | ||||||||
LOSS ON DISCONTINUED OPERATIONS | (0.08 | ) | (0.02 | ) | (0.04 | ) | ||||||
NET EARNINGS (LOSS) PER SHARE OF COMMON STOCK | $ | 3.63 | $ | 2.78 | $ | (0.29 | ) | |||||
DILUTED: | ||||||||||||
EARNINGS (LOSS) FROM CONTINUING OPERATIONS BEFORE CUMULATIVE EFFECT OF ACCOUNTING CHANGE | $ | 3.67 | $ | 2.77 | $ | (0.23 | ) | |||||
CUMULATIVE EFFECT OF ACCOUNTING CHANGE | — | — | (0.02 | ) | ||||||||
EARNINGS (LOSS) FROM CONTINUING OPERATIONS | 3.67 | 2.77 | (0.25 | ) | ||||||||
LOSS ON DISCONTINUED OPERATIONS | (0.08 | ) | (0.02 | ) | (0.04 | ) | ||||||
NET EARNINGS (LOSS) PER SHARE OF COMMON STOCK | $ | 3.59 | $ | 2.76 | $ | (0.29 | ) | |||||
CASH DIVIDENDS PER SHARE OF COMMON STOCK | $ | 0.44 | $ | 0.36 | $ | 0.20 | ||||||
See notes to consolidated financial statements.
14
Consolidated Balance Sheets
| October 31, | ||||||
| 2005 | 2004 | |||||
ASSETS | ||||||
CURRENT ASSETS | ||||||
Cash and cash equivalents | $ | 17,699,681 | $ | 869,000 | ||
Accounts receivable, net of allowances of $1,813,500 in 2005 and $4,312,451 in 2004 | 69,832,819 | 75,558,674 | ||||
Inventories | 111,148,498 | 102,099,659 | ||||
Prepaid expenses and other current assets | 2,745,513 | 1,898,841 | ||||
Deferred income taxes | 9,259,363 | 8,011,122 | ||||
Total current assets | 210,685,874 | 188,437,296 | ||||
PROPERTY, PLANT AND EQUIPMENT | ||||||
Land | 7,589,354 | 7,734,589 | ||||
Land improvements | 8,659,969 | 8,800,131 | ||||
Buildings | 39,979,492 | 44,811,189 | ||||
Manufacturing machinery and equipment | 120,985,300 | 136,230,189 | ||||
Other property and equipment | 26,503,800 | 30,560,246 | ||||
Assets under construction | 3,695,866 | 2,205,425 | ||||
Total | 207,413,781 | 230,341,769 | ||||
Less-accumulated depreciation | 101,557,193 | 117,318,369 | ||||
Property, plant and equipment, net | 105,856,588 | 113,023,400 | ||||
GOODWILL | 13,868,647 | 13,868,647 | ||||
OTHER ASSETS | 2,998,958 | 3,641,690 | ||||
TOTAL | $ | 333,410,067 | $ | 318,971,033 | ||
LIABILITIES AND STOCKHOLDERS’ EQUITY | ||||||
CURRENT LIABILITIES | ||||||
Current portion of long-term debt and capital lease obligation | $ | 21,607,281 | $ | 6,019,598 | ||
Bank overdraft | — | 4,777,540 | ||||
Accounts payable and other accrued expenses | 38,287,878 | 27,874,916 | ||||
Dividends payable | 1,226,315 | 1,211,740 | ||||
Employees’ taxes withheld | 232,503 | 248,408 | ||||
Accrued profit sharing contribution | 7,302,741 | 7,281,552 | ||||
Accrued wages and related expenses | 21,182,355 | 15,376,015 | ||||
Accrued income taxes | 9,664,842 | 10,146,773 | ||||
Total current liabilities | 99,503,915 | 72,936,542 | ||||
LONG-TERM DEBT AND CAPITAL LEASE OBLIGATION | 13,625,213 | 58,941,362 | ||||
DEFERRED INCOME TAXES | 24,710,596 | 28,152,620 | ||||
OTHER LIABILITIES | 3,120,909 | 3,545,148 | ||||
COMMITMENTS AND CONTINGENT LIABILITIES (NOTE 7) | ||||||
STOCKHOLDERS’ EQUITY | ||||||
Common stock-no par value-authorized 20,000,000 shares, issued 12,421,427 shares in 2005 and 12,288,927 in 2004 | 6,967,686 | 5,333,829 | ||||
Additional paid-in capital | 1,063,177 | 885,427 | ||||
Retained earnings | 185,146,709 | 149,731,709 | ||||
Accumulated other comprehensive income | 89,730 | 262,264 | ||||
Total | 193,267,302 | 156,213,229 | ||||
Less-treasury stock, 1,273,114 shares at cost | 817,868 | 817,868 | ||||
Total stockholders’ equity | 192,449,434 | 155,395,361 | ||||
TOTAL | $ | 333,410,067 | $ | 318,971,033 | ||
See notes to consolidated financial statements.
15
Consolidated Statements Of Stockholders’
Equity And Comprehensive Earnings (Loss)
| Common Stock | Additional Paid-in Capital | Retained Earnings | Accumulated Other Comprehensive Income (Loss) | Treasury Stock (At Cost) | Comprehensive Earnings (Loss) | |||||||||||||||||||||
| Shares | Amount | Shares | Amount | |||||||||||||||||||||||
BALANCE, NOVEMBER 1, 2002 | 12,215,927 | $ | 4,394,889 | — | $ | 128,719,560 | $ | (1,307,883 | ) | 1,273,114 | $ | 817,868 | ||||||||||||||
Comprehensive loss: | ||||||||||||||||||||||||||
Net loss | — | — | — | (3,224,953 | ) | — | — | — | $ | (3,224,953 | ) | |||||||||||||||
Other comprehensive earnings, net of tax: | ||||||||||||||||||||||||||
Unrealized gain on “available for sale” securities | — | — | — | — | 67,688 | — | — | 67,688 | ||||||||||||||||||
Accretion of past hedging relationships | — | — | — | — | 510,419 | — | — | 510,419 | ||||||||||||||||||
Change in derivative financial instruments | — | — | — | — | (18,525 | ) | — | — | (18,525 | ) | ||||||||||||||||
Other comprehensive earnings | — | — | — | — | — | — | — | 559,582 | ||||||||||||||||||
Comprehensive loss | — | — | — | — | — | — | — | $ | (2,665,371 | ) | ||||||||||||||||
Repurchase and retirement of common stock | (10,000 | ) | — | — | (70,140 | ) | — | — | — | |||||||||||||||||
Cash dividends | — | — | — | (2,187,563 | ) | — | — | — | ||||||||||||||||||
BALANCE, OCTOBER 31, 2003 | 12,205,927 | 4,394,889 | — | 123,236,904 | (748,301 | ) | 1,273,114 | 817,868 | ||||||||||||||||||
Comprehensive earnings: | ||||||||||||||||||||||||||
Net earnings | — | — | — | 30,446,248 | — | — | — | $ | 30,446,248 | |||||||||||||||||
Other comprehensive earnings, net of tax: | ||||||||||||||||||||||||||
Unrealized loss on “available for sale” securities | — | — | — | — | (26,077 | ) | — | — | (26,077 | ) | ||||||||||||||||
Accretion of past hedging relationships | — | — | — | — | 797,464 | — | — | 797,464 | ||||||||||||||||||
Change in derivative financial instruments | — | — | — | — | 239,178 | — | — | 239,178 | ||||||||||||||||||
Other comprehensive earnings | — | — | — | — | — | — | — | 1,010,565 | ||||||||||||||||||
Comprehensive earnings | — | — | — | — | — | — | — | $ | 31,456,813 | |||||||||||||||||
Stock options exercised or expired | 83,000 | 938,940 | $ | 885,427 | — | — | — | — | ||||||||||||||||||
Cash dividends | — | — | — | (3,951,443 | ) | — | — | — | ||||||||||||||||||
BALANCE, OCTOBER 31, 2004 | 12,288,927 | 5,333,829 | 885,427 | 149,731,709 | 262,264 | 1,273,114 | 817,868 | |||||||||||||||||||
Comprehensive earnings: | ||||||||||||||||||||||||||
Net earnings | — | — | — | 40,319,433 | — | — | — | $ | 40,319,433 | |||||||||||||||||
Other comprehensive loss, net of tax: | ||||||||||||||||||||||||||
Unrealized loss on “available for sale” securities | — | — | — | — | (41,611 | ) | — | — | (41,611 | ) | ||||||||||||||||
Change in derivative financial instruments | — | — | — | — | (130,923 | ) | — | — | (130,923 | ) | ||||||||||||||||
Other comprehensive loss | — | — | — | — | — | — | — | (172,534 | ) | |||||||||||||||||
Comprehensive earnings | — | — | — | — | — | — | — | $ | 40,146,899 | |||||||||||||||||
Stock options exercised | 123,500 | 1,633,857 | — | — | — | — | — | |||||||||||||||||||
Restricted stock awards granted | 9,000 | — | 177,750 | — | — | — | — | |||||||||||||||||||
Cash dividends | — | — | — | (4,904,433 | ) | — | — | — | ||||||||||||||||||
BALANCE, OCTOBER 31, 2005 | 12,421,427 | $ | 6,967,686 | $ | 1,063,177 | $ | 185,146,709 | $ | 89,730 | 1,273,114 | $ | 817,868 | ||||||||||||||
See notes to consolidated financial statements.
16
Consolidated Statements Of Cash Flows
| Year Ended October 31, | ||||||||||||
| 2005 | 2004 | 2003 | ||||||||||
CASH FLOWS FROM OPERATING ACTIVITIES | ||||||||||||
Net earnings (loss) | $ | 40,319,433 | $ | 30,446,248 | $ | (3,224,953 | ) | |||||
Adjustments to reconcile net earnings (loss) to net cash provided by (used in) operating activities: | ||||||||||||
Stock-based compensation expense | 1,747,324 | — | — | |||||||||
Cumulative effect of change in accounting principle | — | — | 228,410 | |||||||||
Directors’ retirement plan liability | 874,776 | — | — | |||||||||
Postretirement liabilities | (386,696 | ) | (152,849 | ) | 229,274 | |||||||
Landfill closure obligation | 36,066 | 33,634 | 31,367 | |||||||||
Depreciation and amortization | 14,304,297 | 15,851,231 | 15,897,881 | |||||||||
Write-off of deferred financing cost | — | 375,624 | — | |||||||||
(Gain) loss on sale of investments | — | (34,953 | ) | 86,811 | ||||||||
(Gain) loss on sale of property, plant and equipment | 78,026 | (10,771 | ) | 38,852 | ||||||||
Deferred income tax benefit | (4,602,983 | ) | (4,933,072 | ) | (2,095,404 | ) | ||||||
Workers’ compensation insurance deposit | — | (1,000,000 | ) | (676,000 | ) | |||||||
Loss on sale of subsidiary | 790,685 | — | — | |||||||||
Changes in assets and liabilities which provided (used) cash, exclusive of changes shown separately | 5,123,797 | (46,686,288 | ) | 9,031,743 | ||||||||
Net cash provided by (used in) operating activities | 58,284,725 | (6,111,196 | ) | 19,547,981 | ||||||||
CASH FLOWS FROM INVESTING ACTIVITIES | ||||||||||||
Expenditures for property plant and equipment | (8,026,478 | ) | (4,216,791 | ) | (2,694,137 | ) | ||||||
Proceeds from sale of property plant and equipment | 127,612 | 54,981 | 7,440 | |||||||||
Purchases of investments | — | (1,143,794 | ) | (2,743,053 | ) | |||||||
Proceeds from sales of investments | — | 5,146,030 | 12,974,436 | |||||||||
Proceeds from sale of subsidiary | 4,206,829 | — | — | |||||||||
Net cash provided by (used in) investing activities | (3,692,037 | ) | (159,574 | ) | 7,544,686 | |||||||
CASH FLOWS FROM FINANCING ACTIVITIES | ||||||||||||
Cash dividends | (4,904,433 | ) | (3,951,443 | ) | (2,187,563 | ) | ||||||
Increase (decrease) in dividends payable | 14,575 | 665,099 | (500 | ) | ||||||||
Proceeds from exercise of common stock options | 1,633,857 | 938,940 | — | |||||||||
Payments of long-term debt | (64,208,868 | ) | (71,792,278 | ) | (22,542,755 | ) | ||||||
Proceeds from long-term debt | 34,500,000 | 65,252,012 | — | |||||||||
Repurchase of common stock | — | — | (70,140 | ) | ||||||||
Financing costs paid | — | (770,758 | ) | (285,000 | ) | |||||||
Interest rate swap termination fee | — | (1,382,780 | ) | (863,581 | ) | |||||||
Proceeds from (repayment of) bank overdraft | (4,777,540 | ) | 4,777,540 | — | ||||||||
Capital lease obligation | — | — | 234,557 | |||||||||
Payment of capital lease principal | (19,598 | ) | (18,606 | ) | (7,003 | ) | ||||||
Net cash used in financing activities | (37,762,007 | ) | (6,282,274 | ) | (25,721,985 | ) | ||||||
NET INCREASE (DECREASE) IN CASH AND CASH EQUIVALENTS | 16,830,681 | (12,553,044 | ) | 1,370,682 | ||||||||
CASH AND CASH EQUIVALENTS, BEGINNING OF YEAR | 869,000 | 13,422,044 | 12,051,362 | |||||||||
CASH AND CASH EQUIVALENTS, END OF YEAR | $ | 17,699,681 | $ | 869,000 | $ | 13,422,044 | ||||||
CHANGES IN ASSETS AND LIABILITIES WHICH PROVIDED (USED) CASH, EXCLUSIVE OF CHANGES SHOWN SEPARATELY | ||||||||||||
(Increase) decrease in accounts receivable | $ | 3,380,277 | $ | (29,089,394 | ) | $ | (6,167,956 | ) | ||||
(Increase) decrease in refundable income taxes | — | 608,244 | 3,570,174 | |||||||||
(Increase) decrease in inventories | (10,863,193 | ) | (42,534,414 | ) | 2,797,357 | |||||||
(Increase) decrease in prepaid expenses and other current assets | (584,951 | ) | (64,910 | ) | (347,484 | ) | ||||||
(Increase) decrease in other assets | (53,032 | ) | (81,905 | ) | (120,064 | ) | ||||||
Increase (decrease) in accounts payable and other accured expenses | 10,432,962 | 5,798,052 | 6,889,798 | |||||||||
Increase (decrease) in accrued profit sharing contribution | 21,189 | 5,941,910 | 734,919 | |||||||||
Increase (decrease) in accrued income taxes | (481,931 | ) | 10,146,773 | — | ||||||||
Increase (decrease) in other liabilities | 3,272,476 | 2,589,356 | 1,674,999 | |||||||||
Total | $ | 5,123,797 | $ | (46,686,288 | ) | $ | 9,031,743 | |||||
See notes to consolidated financial statements.
17
Notes To Consolidated Financial Statements
NOTE 1 - SUMMARY OF SIGNIFICANT ACCOUNTING POLICIES
Principles of Consolidation - Roanoke Electric Steel Corporation is both an operating company and a holding company with both direct and indirect subsidiaries. The consolidated financial statements include the accounts of Roanoke Electric Steel Corporation and its wholly-owned subsidiaries, Shredded Products Corporation, John W. Hancock, Jr., Inc., Socar, Inc., RESCO Steel Products Corporation, Roanoke Technical Treatment & Services, Inc. and Steel of West Virginia, Inc. (collectively, the “Company”). All significant intercompany accounts and transactions have been eliminated. The Company operates in a single business segment. For purposes of this annual report, the defined term “Company” will, depending on the context, refer to Roanoke Electric Steel Corporation and its subsidiaries on a consolidated basis or refer to Roanoke Electric Steel Corporation as an operating company.
Cash and Cash Equivalents - Cash in excess of operating requirements is invested in short-term instruments which are carried at fair value, which approximates cost. The Company considers all highly liquid debt instruments purchased with an original maturity of three months or less to be cash equivalents. Cash equivalents were approximately $17,984,000 and $3,953,000 at October 31, 2005 and 2004, respectively.
Investments - During 2004, the Company sold substantially all of its investments. Historically, investments consisted primarily of debt securities which were classified as “available for sale”. “Available for sale” securities were reported at fair value with unrealized gains and losses reported as other comprehensive income.
Inventories - Inventories of the Company are valued at the lower of cost or market. Cost is determined principally using either the first-in, first-out (“FIFO”) or cost averaging method of accounting and includes materials, costs of production and manufacturing overhead. The determination of market includes such factors as utility of goods, the ability to dispose of the goods in the ordinary course of business, physical obsolescence and changes in price levels (see Note 2).
Property, Plant and Equipment - These assets are stated at cost. Depreciation expense is computed by straight-line and declining-balance methods. Maintenance and repairs are charged against operations as incurred. Major items of renewals and betterments are capitalized and depreciated over their estimated useful lives. Upon retirement or other disposition of plant and equipment, the cost and related accumulated depreciation are removed from the balance sheet, and the resulting gain or loss is reflected in earnings (see Note 3).
The Company reviews long-lived assets for impairment whenever events or changes in circumstances indicate the carrying amount of such assets may not be recoverable. Impairment losses are recorded on long-lived assets used in operations when indicators of impairment are present and the undiscounted cash flows estimated to be generated during the life of those assets are less than the assets’ carrying amounts. The impairment loss is measured by comparing the fair value of the asset to its carrying amount.
Goodwill - The Company applies the provisions of Statement of Financial Accounting Standards (“SFAS”) No. 142, “Goodwill and Other Intangible Assets”, which requires allocating goodwill to each reporting unit and testing for impairment using a two-step approach. Based on the Company’s current reporting structure, it has determined that it operates as three reporting units and, therefore, has assigned goodwill at the operating division level. Fair value is measured using a valuation based on market multiples, comparable transactions and discounted cash flow methodologies. The goodwill impairment test is performed annually as of May 31 or whenever an event has occurred that would more likely than not reduce the fair value of a reporting unit below its carrying amount (see Note 12).
Deferred Financing Costs - Deferred financing costs are included in other long-term assets and represent costs related to issuing the Company’s long-term debt. Such amounts are being amortized over the remaining term of the related financing, using the effective interest method, and are included in interest expense (see Note 5).
Income Taxes - Deferred income taxes are provided by the asset and liability method, which requires the recognition of deferred tax assets and liabilities for the future tax consequences of temporary differences between tax bases and financial reporting bases of other assets and liabilities (see Note 4).
Revenue Recognition - Revenue is recognized when title transfers upon shipment. Additionally, revenue is recognized on certain fabricated products sold pursuant to construction contracts utilizing the percentage-of-completion method. Percentage of completion is
18
measured principally based on steel consumed on finished product as a percentage of the estimated steel required for each contract. The Company recognizes profit at the time revenue is recognized, based on its estimates as to the project status and the remaining steel to be consumed to complete a particular project. If actual consumption exceeds estimated consumption, then the percentage of completion method is adjusted to prorate revenue up to the amount allowed by the contract in the period determined. Costs and estimated earnings on uncompleted contracts were $6,668,645 as of October 31, 2005 and $3,367,434 as of October 31, 2004, and are included in accounts receivable. Such fabricated products accounted for 17%, 16%, and 18% of the Company’s consolidated sales for the years ending October 31, 2005, 2004 and 2003, respectively.
The Company records shipping and handling expenses in accordance with Emerging Issues Task Force (“EITF”) Issue No. 00-10, “Accounting for Shipping and Handling Fees and Cost”. Shipping and handling charges, billed to the customer, are included in sales revenues and the costs associated with such shipments are included in cost of sales. There were no sales to an unaffiliated customer in excess of 10% of consolidated sales for 2005, 2004 or 2003.
Concentration of Credit Risk - The Company sells to a large customer base of steel fabricators, steel service centers, original equipment manufacturers and construction contractors, most all of which deal primarily on 30-day credit terms. The Company believes its concentration of credit risk to be minimal in any one geographic area or market segment. The Company performs periodic credit evaluations of its customers’ financial condition and generally does not require collateral. Credit losses are generally within management’s expectations.
Fair Value of Financial Instruments- At October 31, 2005, the fair value of the Company’s cash and cash equivalents, accounts receivable, and long-term debt approximated amounts recorded in the accompanying consolidated financial statements.
Stock-Based Compensation - On January 28, 2005, the shareholders of the Company approved the “Roanoke Electric Steel Corporation 2005 Stock Incentive Plan” (the “2005 Stock Plan”). The 2005 Stock Plan is integral to the Company’s compensation strategy and programs and is intended to help the Company recruit, motivate and retain the caliber of employees and outside directors essential to the Company’s success, and will further align the interests of those employees and outside directors with the interests of the Company’s shareholders.
A maximum of 1,750,000 shares of the Company’s common stock is available for issuance under the 2005 Stock Plan, subject to adjustment upon the occurrence of any stock dividend or other distribution, stock split, merger, consolidation, combination, share repurchase or exchange or other similar transaction or event. No more than 1,500,000 shares of the Company’s common stock may be issued under incentive awards to employees of the Company or its subsidiaries, and no more than 250,000 shares of the Company’s common stock may be issued to outside directors.
The 2005 Stock Plan provides for the grant of stock options, restricted stock, restricted stock units, stock appreciation rights, performance grants, and deferred shares and is administered by the Compensation Committee of the Company’s Board of Directors. The 2005 Stock Plan does not amend the Employees’ Stock Option Plan or the Non-Employee Director Stock Option Plan. There are 0 and 1,000 shares available for future issuance under these existing plans. As of October 31, 2005, options covering 217,500 and 19,500 shares of the Company’s common stock were outstanding under the Employee’s Stock Option Plan and Non-Employee Director Stock Option Plan, respectively.
On January 28, 2005, the Compensation Committee approved, and the Board of Directors ratified, an aggregate of 192,080 performance grants to certain executives under the 2005 Stock Plan. A performance grant is an award of a base number of performance shares. Of these awards, 34,570 performance shares have a one-year performance period ending on October 31, 2005, 69,140 have a two-year performance period ending on October 31, 2006, and 88,370 have a three-year performance period ending on October 31, 2007. An employee is entitled to receive one share of the Company’s common stock for each performance share that vests at the end of a specified performance period. For any performance shares to vest, an employee must remain in continuous employment (subject to certain exceptions for death, disability, or retirement) until the end of the specified performance period. The number of performance shares that vest will be determined based on the Company’s average return on invested capital relative to the average return on invested capital of peer companies, with none of the base number of shares vesting if the Company’s relative average return on invested capital is less than the 45th percentile, and 25%, 100%, and 200% of the base number of shares vesting if the Company’s relative average return on invested capital equals the 45th, 75th and 95th percentile, respectively. Notwithstanding the vesting schedule, if the Company’s average return on invested capital is negative for a performance period, no more than 25% of the base number of performance shares will vest. In the event of a change of control, 100% of the base number of performance shares will vest (see Note 19).
Also on January 28, 2005, each of the Company’s six outside directors received an award of 1,500 shares of restricted stock of the Company pursuant to the terms of the 2005 Stock Plan. The shares of restricted stock will become fully vested and transferable if the outside director remains in continuous service on the Board of Directors until January 28, 2006.
19
Prior to November 1, 2004, the Company accounted for share-based payments under the intrinsic value method recognition and measurement principles of Accounting Principles Board (“APB”) Opinion No. 25, “Accounting for Stock Issued to Employees”, and related Interpretations. In accordance with APB No. 25, compensation cost was recognized over the applicable service period for the difference between the exercise price of the award and the fair value of the stock price on the grant date. No options were granted in fiscal 2005. During 2004 and 2003, options were granted for 112,500 shares in each year. There was full recognition of the compensation cost of $205,875 and $167,625 during the years ended October 31, 2004 and 2003, respectively, which represented the excess of the fair market value over the exercise price of the common stock.
The following table illustrates the effect on net earnings (loss) and earnings (loss) per share if the Company had applied the fair value recognition provisions of SFAS No. 123, “Accounting for Stock-Based Compensation”, to stock-based employee compensation:
| Year Ended October 31, | ||||||||
| 2004 | 2003 | |||||||
Net earnings (loss): | ||||||||
As reported | $ | 30,446,248 | $ | (3,224,953 | ) | |||
Deduct total stock-based compensation expense determined under fair value method for all awards, net of tax | (88,313 | ) | (206,177 | ) | ||||
Pro forma | $ | 30,357,935 | $ | (3,431,130 | ) | |||
Basic net earnings (loss) per share: | ||||||||
As reported | $ | 2.78 | $ | (0.29 | ) | |||
Pro forma | $ | 2.77 | $ | (0.31 | ) | |||
Diluted net earnings (loss) per share: | ||||||||
As reported | $ | 2.76 | $ | (0.29 | ) | |||
Pro forma | $ | 2.75 | $ | (0.31 | ) | |||
The fair value of each option is estimated on the date of grant using the Black-Scholes option-pricing model with the following weighted average assumptions used for grants in 2004 and 2003, respectively: dividend yield of 2.70% and 1.58%; expected volatility of 37.94% and 67.24%; risk-free interest rates of 3.18% and 3.25%; and an expected life of 5 years.
The Company’s stock option plans are described more fully in Note 10.
On November 1, 2004, the Company early adopted SFAS No. 123R, “Share-Based Payment”. SFAS No. 123R requires all share-based payments to employees, including grants of employee stock options and purchases under employee stock purchase plans, to be recognized as an operating expense in the income statement. The cost of such share-based payments is to be recognized over the requisite service period based on fair values measured on the grant date of the award. The Company adopted SFAS No. 123R using the modified prospective method. Under this method, SFAS No. 123R applies to new awards and to awards modified, repurchased, or cancelled after October 31, 2004. Additionally, compensation cost for the portion of awards for which the requisite service has not been rendered that are outstanding as of October 31, 2004 is recognized as the requisite service is rendered. The adoption of SFAS No. 123R had no effect on the Company’s financial statements at the date of adoption, since the requisite service had been rendered for all awards outstanding as of October 31, 2004.
Under SFAS No. 123R, the fair value of each performance grant and each share of restricted stock issued on January 28, 2005, is equal to the market price of the Company’s common stock on that date. Unamortized compensation cost of $3,414,222 related to 172,872 performance shares will be recognized over the weighted average requisite service period of 1.63 years and may be adjusted based on management’s future estimates of the amount of performance shares that will vest based on the Company’s performance relative to its peers. Compensation expense of $1,569,574 is reflected in the consolidated statement of earnings for the year ended October 31, 2005. The total fair value of 9,000 restricted fully vested shares awarded to directors of $177,750 was recognized during the year ended October 31, 2005. Under the terms of the award, the actual number of performance grants that vest depends upon the Company’s average return on invested capital relative to the average return on invested capital of peer companies, with the potential ranging from 0% to 200% of each award. However, upon the occurrence of a change of control involving the Company, 100% of the performance grants vest and are settled in cash rather than shares of the Company’s common stock. Accordingly, these awards have been classified in current liabilities (see Note 19).
20
The total income tax benefit recognized in the statements of earnings for share-based compensation arrangements was $653,499, $76,997 and $67,721 for the years ended October 31, 2005, 2004 and 2003, respectively.
Use of Estimates in the Preparation of Financial Statements - The preparation of financial statements in conformity with U.S. generally accepted accounting principles requires management to make estimates and assumptions that affect the reported amounts of assets and liabilities and disclosure of contingent assets and liabilities at the date of the financial statements and the reported amounts of revenues and expenses during the reporting period. Actual results could differ from those estimates.
Derivative Instruments - The fair value of derivatives used as cash flow hedging activities is recorded on the balance sheets, and the change in fair value is recorded through other comprehensive income (see Note 6).
Discontinued Operations - On January 27, 2005, RESCO Steel Products Corporation (“RESCO”), a wholly-owned subsidiary of the Company, sold its reinforcing bar fabrication assets, which represented substantially all of its assets, to Rockingham Steel, Inc. (“Rockingham Steel”), a reinforcing bar fabricator located in Harrisonburg, Virginia. The agreed upon price for the assets sold by RESCO was $4.2 million. In connection with the close of operations of RESCO, the Company incurred one-time charges of $550,000 associated with the sale, representing (1) $330,000 for costs associated with termination of employees, including severance, accrued vacation, insurance and other miscellaneous benefits and (2) $220,000 for transaction costs, including legal, investment banking, accounting and other professional fees, and other miscellaneous costs of the transaction. Such costs are included in the loss from discontinued operations in the accompanying statement of earnings for the year ended October 31, 2005. The results of RESCO are presented as discontinued operations in the accompanying consolidated statements of earnings and include a pre-tax loss on the sale of RESCO of $1,340,685.
Revenues of $4,045,515 and pre-tax loss of $1,518,263 (which includes the $1,340,685 loss on sale) related to RESCO are included in discontinued operations for the year ended October 31, 2005. Revenues of $13,790,759 and $8,521,745 and pre-tax losses of $271,974 and $756,458 related to RESCO are included in discontinued operations for the years ended October 31, 2004 and 2003, respectively. The carrying amounts as of October 31, 2004 of the major classes of assets and liabilities disposed were as follows: accounts receivable of $2,589,211, inventories of $1,891,114, and net property, plant and equipment of $864,090.
Recently Adopted and Recently Issued Accounting Pronouncements - On November 1, 2004, the Company early adopted SFAS No. 123R, “Share-Based Payment”. SFAS No. 123R requires all share-based payments to employees, including grants of employee stock options and purchases under employee stock purchase plans, to be recognized as an operating expense in the income statement. The cost of such share-based payments is to be recognized over the requisite service period based on fair values measured on the grant date of the award. The Company adopted SFAS No. 123R using the modified prospective method. Under this method, SFAS No. 123R applies to new awards and to awards modified, repurchased, or cancelled after October 31, 2004. Additionally, compensation cost for the portion of awards for which the requisite service has not been rendered that are outstanding as of October 31, 2004 is recognized as the requisite service is rendered. The adoption of SFAS No. 123R had no effect on the Company’s financial statements for the first quarter of 2005 since the requisite service had been rendered for all awards outstanding as of October 31, 2004. During 2005, the Company began to recognize compensation cost for awards issued on January 28, 2005, reflected in the 2005 statement of earnings, related to its stock plans in accordance with the provisions of SFAS No. 123R.
In November 2004, the FASB issued SFAS No. 151, “Inventory Costs - an amendment of ARB No. 43, Chapter 4”. SFAS No. 151 amends the guidance in ARB No. 43, Chapter 4, “Inventory Pricing,” to clarify the accounting for abnormal amounts of idle facility expense, freight, handling costs, and wasted material (spoilage) and requires these costs be treated as current period charges. In addition, SFAS No. 151 requires that allocation of fixed production overheads to the costs of conversion be based on the normal capacity of the production facilities. The provisions of SFAS No. 151 are effective for inventory costs incurred during fiscal years beginning after June 15, 2005. The Company does not believe that the adoption of SFAS No. 151 will have a material impact on its results of operations or financial condition.
In December 2004, the FASB issued SFAS No. 153, “Exchanges of Nonmonetary Assets, an amendment of APB Opinion No. 29”. SFAS No. 153 replaces the exception from fair value measurement included in APB Opinion No. 29 for nonmonetary exchanges of similar productive assets with a general exception from fair value measurement for exchanges of nonmonetary assets that do not have commercial substance. A nonmonetary exchange has commercial substance if the future cash flows of the entity are expected to change significantly as a result of the exchange. This Statement will be applied prospectively and is effective for nonmonetary asset exchanges occurring in fiscal periods beginning after June 15, 2005. The Company does not believe adoption of this statement will have a material impact on the Company’s results of operations or financial condition.
In December 2004, the FASB issued FASB Staff Position (“FSP”) No. FAS 109-1, “Application of FASB Statement No. 109, Accounting for Income Taxes, to the Tax Deduction on Qualified Production Activities Provided by the American Jobs Creation Act of 2004 (the Act)”. FSP No. FAS 109-1 clarifies that the tax deduction for manufacturers provided for in the Act should be accounted for as a special
21
deduction rather than as a tax rate reduction. The manufacturers’ deduction is not available to the company until fiscal year 2006. The company is evaluating the effect the manufacturers’ deduction will have in future fiscal years.
In March 2005, FASB Interpretation No. (“FIN”) 47, “Accounting for Conditional Asset Retirement Obligations - an Interpretation of SFAS No. 143”, was issued. This Interpretation clarifies that the term “conditional asset retirement obligation”, as used in SFAS No. 143, “Accounting for Asset Retirement Obligations”, refers to a legal obligation to perform an asset retirement activity in which the timing and (or) method of settlement are conditional on a future event that may or may not be within the control of the entity. Accordingly, an entity is required to recognize a liability for the fair value of a conditional asset retirement obligation if the fair value of the liability can be reasonably estimated. This Interpretation is effective no later than the end of fiscal years ending after December 15, 2005. Retrospective application for interim financial information is permitted but is not required. The Company has not determined whether adoption of this Interpretation will have a material impact on the Company’s results of operations or financial condition.
In May 2005, the FASB issued SFAS No. 154, “Accounting Changes and Error Corrections–a replacement of APB Opinion No. 20 and FASB Statement No. 3”. This Statement replaces APB Opinion No. 20, “Accounting Changes”, and FASB Statement No. 3, “Reporting Accounting Changes in Interim Financial Statements”, and changes the requirements for the accounting for and reporting of a change in accounting principle. SFAS No. 154 applies to all voluntary changes in accounting principle. This Statement requires retrospective application to prior periods’ financial statements of changes in accounting principle, unless it is impracticable to determine either the period-specific effects or the cumulative effect of the change. It also requires that retrospective application of a change in accounting principle be limited to the direct effects of the change. Indirect effects of a change in accounting principle should be recognized in the period of the accounting change. This Statement is effective for accounting changes and corrections of errors made in fiscal years beginning after December 15, 2005. The Company does not believe that the adoption of SFAS No. 154 will have a material impact on its results of operations or financial condition.
Reclassifications - Certain amounts included in the consolidated financial statements for prior years have been reclassified from their original presentation to conform with the current year presentation.
NOTE 2 - INVENTORIES
Inventories include the following major classifications:
| October 31, | ||||||
| 2005 | 2004 | |||||
Scrap Steel | $ | 11,791,963 | $ | 13,839,442 | ||
Melt supplies | 4,173,109 | 4,216,074 | ||||
Billets | 15,282,590 | 12,226,288 | ||||
Mill supplies | 5,912,424 | 4,840,071 | ||||
Work-in-process | 13,112,126 | 14,568,837 | ||||
Finished steel | 60,876,286 | 52,408,947 | ||||
Total inventories | $ | 111,148,498 | $ | 102,099,659 | ||
NOTE 3 - PROPERTIES AND DEPRECIATION
Depreciation expense for the years ended October 31, 2005, 2004 and 2003 amounted to $14,150,145, $14,554,355 and $14,896,157, respectively. Asset useful lives are from 30 to 40 years for buildings and land improvements, 10 to 15 years for manufacturing machinery and equipment, up to 10 years for other property and equipment, and 3 years for software. Property additions included no capitalized interest for 2005, 2004 and 2003.
22
NOTE 4 - INCOME TAXES
The Company files a consolidated federal income tax return.
The following is a reconciliation of income tax expense (benefit) before discontinued operations per the consolidated statements of earnings (loss) to that computed by using the federal statutory tax rate of 35%:
| Year Ended October 31, | ||||||||||
| 2005 | 2004 | 2003 | ||||||||
Federal tax at the statutory rate | $ | 23,072,473 | $ | 17,128,324 | $ | (1,480,067 | ) | |||
Increase (decrease) in taxes resulting from: | ||||||||||
State income taxes, net of federal tax benefit | 1,460,001 | 876,646 | (159,570 | ) | ||||||
Executive compensation | — | 270,431 | — | |||||||
Other items, net | 143,483 | 42,280 | (67,290 | ) | ||||||
Income taxes per consolidated statements of earnings (loss) | $ | 24,675,957 | $ | 18,317,681 | $ | (1,706,927 | ) | |||
The components of income tax expense (benefit) before discontinued operations are as follows:
| Year Ended October 31, | ||||||||||||
| 2005 | 2004 | 2003 | ||||||||||
Current income taxes: | ||||||||||||
Federal | $ | 25,779,352 | $ | 19,657,690 | $ | (15,113 | ) | |||||
State | 3,543,495 | 2,935,214 | 415,543 | |||||||||
Total current income taxes | 29,322,847 | 22,592,904 | 400,430 | |||||||||
Deferred income taxes: | ||||||||||||
Federal | (3,349,551 | ) | (3,482,627 | ) | (1,556,113 | ) | ||||||
State | (1,297,339 | ) | (792,596 | ) | (551,244 | ) | ||||||
Total deferred income taxes | (4,646,890 | ) | (4,275,223 | ) | (2,107,357 | ) | ||||||
Total income taxes | $ | 24,675,957 | $ | 18,317,681 | $ | (1,706,927 | ) | |||||
Deferred income taxes reflect the net tax effects of temporary differences between the carrying amounts of assets and liabilities for financial reporting purposes and the amounts used for tax purposes. There are no valuation allowances. The deferred tax liabilities and assets are as follows:
| October 31, | ||||||
| 2005 | 2004 | |||||
Deferred tax liabilities: | ||||||
Depreciation | $ | 24,710,596 | $ | 28,152,620 | ||
Deferred tax assets: | ||||||
Accruals and allowances | 4,262,159 | 3,347,955 | ||||
Accrued self-insurance expenses | 2,932,065 | 2,884,111 | ||||
Postretirement costs | 761,153 | 904,896 | ||||
Inventories | 550,702 | 466,230 | ||||
Executive compensation | 721,875 | 303,418 | ||||
Other | 31,409 | 104,512 | ||||
Total deferred tax assets | 9,259,363 | 8,011,122 | ||||
Net deferred tax liabilities | $ | 15,451,233 | $ | 20,141,498 | ||
Realization of certain deferred assets is dependent upon generating sufficient taxable income in the appropriate jurisdiction. The Company believes it is more likely than not the deferred net assets will be realized.
23
NOTE 5 - LONG-TERM DEBT
Long-term debt consisted of the following:
| October 31, | ||||||
| 2005 | 2004 | |||||
Syndicated term loan | $ | 24,000,000 | $ | 30,000,000 | ||
Revolving credit agreement | 11,043,144 | 34,752,012 | ||||
Total | 35,043,144 | 64,752,012 | ||||
Less - current portion | 21,586,640 | 6,000,000 | ||||
Long-term debt | $ | 13,456,504 | $ | 58,752,012 | ||
On October 4, 2004, the Company entered into an $85,000,000, five-year credit arrangement with a group of banks. The credit facility consists of a $30,000,000 term loan and a $55,000,000 long-term revolving loan. The credit facility permits the Company, upon request, to increase the aggregate amount by an additional $10,000,000, and establishes two sub-facilities pursuant to which one of the banks in the syndicate will issue letters of credit in the aggregate amount of up to $5,000,000 and will make swing-line loans in the aggregate amount of up to $5,000,000, with any such amounts to be applied to and reduce the amount available for borrowing under the revolving loan.
The loans bear interest at the Company’s option at (i) one, two, three, six or, if available, nine or twelve month LIBOR as selected by the Company, or (ii) the greater of (A) the prime rate publicly announced from time to time by the loans administrative agent, or (B) the effective federal funds rate quoted by the Federal Reserve Bank of New York plus 1/2 of 1%. Under the term loan agreement and a portion of the revolver, interest was payable at October 31, 2005 and 2004, at the one-month LIBOR rate of 4.09% plus 2.00% and 1.87% plus 2.00%, respectively. Under the remainder of the revolver, interest was payable at October 31, 2005 and 2004, at the bank’s base rate option of 7.75% and 5.75%, respectively. The term loan requires quarterly payments of principal in the amount of $1,500,000 plus interest, and the revolving loan requires quarterly payments of interest until the fifth anniversary of the credit facility at which time the outstanding principal balance of the revolving loan must be paid in full. The credit facility also requires quarterly payments of unused commitment fees of 1/2 of 1% on unused balances of the revolver. These unused commitment fees may be withdrawn under certain conditions such as default, and amounted to $117,154 and $7,510, for the years ended October 31, 2005 and 2004, respectively, and are included in interest expense in the respective consolidated statements of earnings.
The loans are secured by a pledge of the outstanding stock in each of the Company’s direct and indirect subsidiaries and by a lien on the tangible and intangible personal property of the Company and each of its subsidiaries. The Company may prepay the loans at any time at its option, and is required to make mandatory prepayments based on certain circumstances. Since such circumstances existed at October 31, 2005, and during the year then ended, $15,586,640 of the long-term revolver has been classified in current portion of long-term debt at October 31, 2005, and must be prepaid by January 31, 2006.
The loans are subject to various representations and warranties and affirmative and negative covenants, including the Company’s obligation to maintain a leverage ratio of less than or equal to 3:1, to maintain a fixed charge coverage ratio greater than or equal to 1.10:1, and to limit capital expenditures on a consolidated basis to no more than $75,000,000 over the term of the credit facility. The Company was in compliance with the covenants of its loan agreements as of October 31, 2005 and 2004.
Annual aggregate long-term debt maturities are approximately $21,586,640 for 2006, $6,000,000 for each of 2007 and 2008, and $1,456,504 for 2009.
On October 4, 2004, the Company’s previous syndicated term loan was repaid with proceeds from the new credit arrangement. In connection with the extinguishment, the Company wrote off remaining, unamortized deferred financing costs of $375,624, which is included in interest expense for the year ended October 31, 2004 in the consolidated statements of earnings.
24
NOTE 6 - DERIVATIVE INSTRUMENTS
Historically, the Company utilized interest rate swaps to manage its exposure to movements in interest rates paid on corporate debt and that qualified as cash flow hedges. On June 25, 1999, the Company entered into a reverse swap, converting $40,000,000 of existing term debt to a variable interest rate from a fixed rate. A fee of $1,300,000 was received and being recorded in income ratable over the 6 1/2 years which remained to maturity of the term loan.
Effective November 1, 2000, the Company adopted SFAS No. 133 and, in accordance with the transition provisions, recorded a cumulative effect adjustment of $1,663,516 in other comprehensive income to recognize the fair value of the swap as a cash flow hedging instrument. On April 1, 2002, the Company effected an early termination, or unwind, of its interest rate swap agreement and incurred a $3,000,179 termination fee payable to the counterparty over the term of the existing debt.
In connection with the Company’s debt refinancing on October 4, 2004, the remaining unamortized fee earned, $200,000, and unrecognized amounts included in other comprehensive loss related to these past hedges, $680,491 ($408,295 net of taxes), were recorded as adjustments to interest expense in the statement of earnings.
During fiscal years 2005, 2004 and 2003, the Company entered into derivative commodity instruments of one-year or less to minimize the exposure of price risk related to certain natural gas purchases used in the manufacturing process at its West Virginia facility. The contracts are used to mitigate the price risk related to natural gas purchases and are designated as effective cash flow hedges for a portion of the natural gas usage over the periods in the agreements. Unrealized gains and losses associated with marking the contracts to market are recorded as a component of other comprehensive income (loss) and included in the stockholders’ equity section of the balance sheet as part of accumulated comprehensive income (loss). These gains and losses are recognized in earnings in the month in which the related natural gas is used, or in the month a hedge is determined to be ineffective. There were no ineffective hedges at October 31, 2005.
25
The components of other comprehensive income (loss) are as follows:
| Year Ended October 31, | ||||||||||||||||||||||||||||||||||||
| 2005 | 2004 | 2003 | ||||||||||||||||||||||||||||||||||
Before-Tax Amount | Tax (Expense) Benefit | Net-of-Tax Amount | Before-Tax Amount | Tax (Expense) Benefit | Net-of-Tax Amount | Before-Tax Amount | Tax (Expense) Benefit | Net-of-Tax Amount | ||||||||||||||||||||||||||||
Unrealized gains (losses) on securities: | ||||||||||||||||||||||||||||||||||||
Unrealized holding gains (losses) arising during period | $ | (66,446 | ) | $ | 24,835 | $ | (41,611 | ) | $ | (26,677 | ) | $ | 10,834 | $ | (15,843 | ) | $ | 200,142 | $ | (80,273 | ) | $ | 119,869 | |||||||||||||
Reclassification adjustments for gains (losses) realized in net income | — | — | — | (17,233 | ) | 6,999 | (10,234 | ) | (86,811 | ) | 34,630 | (52,181 | ) | |||||||||||||||||||||||
Net unrealized gains (losses) | (66,446 | ) | 24,835 | (41,611 | ) | (43,910 | ) | 17,833 | (26,077 | ) | 113,331 | (45,643 | ) | 67,688 | ||||||||||||||||||||||
Unrealized losses on qualifying cash flow hedges: | ||||||||||||||||||||||||||||||||||||
Unrealized gains (losses) arising during period | (305,336 | ) | 114,123 | (191,213 | ) | 196,749 | (84,076 | ) | 112,673 | (32,567 | ) | 14,042 | (18,525 | ) | ||||||||||||||||||||||
Reclassification adjustments for gains (losses) realized in net income | 96,273 | (35,983 | ) | 60,290 | 220,902 | (94,397 | ) | 126,505 | — | — | — | |||||||||||||||||||||||||
Net unrealized gains (losses) | (209,063 | ) | 78,140 | (130,923 | ) | 417,651 | (178,473 | ) | 239,178 | (32,567 | ) | 14,042 | (18,525 | ) | ||||||||||||||||||||||
Accretion of past hedging relationships | — | — | — | 1,327,919 | (530,455 | ) | 797,464 | 849,163 | (338,744 | ) | 510,419 | |||||||||||||||||||||||||
Other comprehensive income (loss) | $ | (275,509 | ) | $ | 102,975 | $ | (172,534 | ) | $ | 1,701,660 | $ | (691,095 | ) | $ | 1,010,565 | $ | 929,927 | $ | (370,345 | ) | $ | 559,582 | ||||||||||||||
The components of accumulated other comprehensive income are as follows:
| October 31, | ||||||
| 2005 | 2004 | |||||
Unrealized gains on securities, net of taxes of $27,741 | — | $ | 41,611 | |||
Unrealized gains (losses) on qualifying cash flow hedges, net of taxes of $59,820 and $147,102 | $ | 89,730 | 220,653 | |||
Accumulated other comprehensive income | $ | 89,730 | $ | 262,264 | ||
NOTE 7 - COMMITMENTS AND CONTINGENT LIABILITIES
At October 31, 2005, the Company was committed to approximately $3,500,000 for purchases of equipment and production facilities. Partial settlements have been received in conjunction with a class action suit for antitrust litigation against the Company’s graphite electrode supplies. No further payments are expected under this settlement. The Company is not involved in any legal proceedings or environmental matters outside the ordinary course of business. In the opinion of management, amounts accrued for potential awards or assessments in connection with these matters at this time are adequate, and the outcome of such environmental and legal concerns currently pending will not have a material effect on the Company’s consolidated financial position, results of operations, or cash flows. The Company reassesses these matters as new facts and cases are brought to management’s attention.
NOTE 8 - COMMON STOCK AND EARNINGS PER SHARE
Basic earnings per share is computed by dividing the net income available to common stockholders by the weighted average shares of outstanding common stock. The calculation of diluted earnings per share is similar to basic earnings per share except that the denominator includes dilutive common stock equivalents such as stock options and performance grants. Earnings per share calculations do not include treasury shares, which are shares held by subsidiaries. Basic earnings (loss) per share have been computed based on the weighted average number of shares outstanding of 11,118,490 for 2005, 10,957,586 for 2004 and 10,938,999 for 2003. The average
26
number of shares outstanding was weighted after giving effect to stock options exercised, performance and restricted shares awarded, and/or repurchased common stock during 2005, 2004, and 2003. Diluted earnings (loss) per share have been computed based on the weighted average number of shares outstanding (including outstanding and exercisable stock options) of 11,243,655 for 2005, 11,034,445 for 2004 and 10,945,346 for 2003. No options were antidilutive at October 31, 2005. Options to purchase 107,000 and 323,000 shares of common stock were outstanding at October 31, 2004 and 2003, respectively, but were not included in the computation of diluted earnings (loss) per share because the effect would be antidilutive. Performance grants for 172,872 shares of common stock were outstanding at October 31, 2005, but were not included in the computation of diluted earnings per share because the effect would be antidilutive.
NOTE 9 - PROFIT SHARING PLANS
The Company, including Shredded Products Corporation, Socar, Inc. and Steel of West Virginia, Inc. (“SWVA”), has qualified profit sharing plans which cover substantially all employees. John W. Hancock, Jr., Inc. has an unqualified plan. Socar, Inc.’s annual contribution is discretionary while the other plans’, except SWVA, annual contribution cannot exceed 20% of their combined earnings before income taxes. SWVA’s annual contribution cannot exceed 17% of its pretax profit for bargaining unit employees, with comparable amounts contributed ratably to the nonbargaining group. Total retirement contributions of all Companies shall not exceed the maximum amount deductible for such year under the Internal Revenue Code and amounted to $10,652,245 for 2005, $9,622,733 for 2004, and $1,309,091 for 2003.
NOTE 10 - STOCK OPTIONS
Under a nonqualified stock option plan which expired during 2004, the Company could issue 112,500 shares of unissued common stock to employees of the Company each plan year. Under a non-statutory stock option plan which expired during 2004, the Company could issue 25,000 shares of unissued common stock to directors of the Company over the life of the plan. No stock options were granted in 2005. There were 112,500 stock options granted in 2004 and in 2003.
27
These options are exercisable for a term of 5 years for employees and 10 years for directors from the date of grant, and a summary follows:
| Weighted Average Exercise Price Per Share | Shares | |||||
Balance, November 1, 2002 | $ | 13.16 | 443,300 | |||
Granted | 8 .44 | 112,500 | ||||
Exercised | — | — | ||||
Expired or terminated | 14.19 | (126,300 | ) | |||
Balance, October 31, 2003 | 11.62 | 429,500 | ||||
Granted | 10.36 | 112,500 | ||||
Exercised | 9.61 | (83,000 | ) | |||
Expired or terminated | 13.78 | (92,500 | ) | |||
Balance, October 31, 2004 | 11.14 | 366,500 | ||||
Granted | — | — | ||||
Exercised | 13.23 | (123,500 | ) | |||
Expired or terminated | 10.80 | (6,000 | ) | |||
Balance, October 31, 2005 | 10.06 | 237,000 | ||||
Shares available for grant at year-end | 0 | |||||
As discussed in Note 1, effective November 1, 2004, the Company applies the provisions of SFAS No. 123R in accounting for the nonqualified stock option plans. Prior to November 1, 2004, the Company applied APB No. 25, and compensation cost of $205,875 and $167,625 for the years ended October 31, 2004 and 2003, respectively, was recognized for the difference between the exercise price and the fair value of the stock price at the grant date.
The fair value of options granted during the years ended October 31, 2004 and 2003 was $4.18 and $5.53, respectively. The total intrinsic value of options exercised during the years ended October 31, 2005, 2004 and 2003 was $771,848, $377,550 and $0, respectively. The tax benefit realized for the tax deductions from these exercises was $288,671, $141,204 and $0 for the years ended October 31, 2005, 2004 and 2003, respectively. The following table summarizes information about stock options outstanding and exercisable at October 31, 2005:
Exercise Prices | Number Outstanding and Exercisable | Remaining Contractual Life in Years | Aggregate Intrinsic Value | |||||
| $ | 8.44 | 54,500 | 2.09 | $ | 734,115 | |||
| 9.61 | 70,500 | 0.25 | 867,150 | |||||
| 10.36 | 92,500 | 3.25 | 1,068,375 | |||||
| 10.50 | 7,500 | 1.33 | 85,575 | |||||
| 17.50 | 12,000 | 2.25 | 52,920 | |||||
| 237,000 | $ | 2,808,135 | ||||||
A summary of the status of the Company’s performance shares (see Note 1) as of October 31, 2005, and changes during the year then ended, is presented below:
| Shares | Grant Date Fair Value Per share | |||||
Nonvested at November 1, 2004 | — | |||||
Granted | 172,872 | $ | 19.75 | |||
Vested | (31,113 | ) | 19.75 | |||
Forfeited | — | |||||
Nonvested at October 31, 2005 | 141,759 | |||||
28
NOTE 11 - HEALTH BENEFITS AND POSTRETIREMENT COSTS
Prior to July 1, 2003, the Company provided certain health care benefits for terminated employees who have completed 10 years of continuous service after age 45. On July 1, 2003 the Company amended the policy to discontinue coverage of employees that were not already qualified at the time. Those qualified were employees who were age 55 or more and had 10 years of service on July 1, 2003.
SFAS No. 132 (Revised 2003), “Employers’ Disclosures about Pensions and Other Postretirement Benefits”, requires disclosures about the assets, obligations, cash flows and net periodic benefit cost of defined benefit postretirement plans. The Company adopted the disclosure requirements of this statement at October 31, 2004.
Required disclosures under SFAS No. 132R as of, and for the years ended October 31, are as follows:
| 2005 | 2004 | 2003 | ||||||||||
Change in benefit obligation: | ||||||||||||
Benefit obligation at beginning of year | $ | 1,612,643 | $ | 1,720,021 | $ | 2,979,320 | ||||||
Service cost | — | — | 179,032 | |||||||||
Interest cost | 88,418 | 104,212 | 167,882 | |||||||||
Expected participant contributions | 53,576 | 71,938 | 96,073 | |||||||||
Expected benefits paid | (237,624 | ) | (328,297 | ) | (216,947 | ) | ||||||
Plan amendments | — | — | (1,355,485 | ) | ||||||||
Actuarial (gain)/loss | 107,637 | 44,769 | (129,854 | ) | ||||||||
Benefit obligation at end of year | $ | 1,624,650 | $ | 1,612,643 | $ | 1,720,021 | ||||||
Change in plan assets: | ||||||||||||
Employer contribution | $ | 184,048 | $ | 256,359 | $ | 120,874 | ||||||
Participant contributions | 53,576 | 71,938 | 96,073 | |||||||||
Benefits paid | (237,624 | ) | (328,297 | ) | (216,947 | ) | ||||||
Fair value of plan assets at end of year | $ | — | $ | — | $ | — | ||||||
Funded status | $ | (1,624,650 | ) | $ | (1,612,643 | ) | $ | (1,720,021 | ) | |||
Unrecognized prior service cost | (342,125 | ) | (470,422 | ) | (598,719 | ) | ||||||
Unrecognized net actuarial gain | (78,392 | ) | (197,710 | ) | (265,972 | ) | ||||||
Accrued benefit cost | $ | (2,045,167 | ) | $ | (2,280,775 | ) | $ | (2,584,712 | ) | |||
Accrued benefit cost account: | ||||||||||||
Accrued benefit cost at beginning of year | $ | (1,624,650 | ) | $ | (1,612,643 | ) | $ | (1,720,021 | ) | |||
Annual expense | (342,125 | ) | (470,422 | ) | (598,719 | ) | ||||||
Net benefit payments | (78,392 | ) | (197,710 | ) | (265,972 | ) | ||||||
Accrued benefit cost at end of year (per balance sheet) | $ | (2,045,167 | ) | $ | (2,280,775 | ) | $ | (2,584,712 | ) | |||
Weighted average discount rate assumption | 5.50 | % | 5.75 | % | 6.25 | % | ||||||
Components of net periodic postretirement benefit cost: | ||||||||||||
Service cost | — | — | $ | 179,032 | ||||||||
Interest cost | $ | 88,418 | $ | 104,212 | 167,882 | |||||||
Amortization of gain | (11,681 | ) | (23,493 | ) | — | |||||||
Amortization of prior service cost | (128,297 | ) | (128,297 | ) | (42,766 | ) | ||||||
Amortization of transition obligation | — | — | 46,000 | |||||||||
Net periodic postretirement benefit cost | $ | (51,560 | ) | $ | (47,578 | ) | $ | 350,148 | ||||
Expected net benefit payments (upcoming fiscal year) | $ | 170,935 | $ | 149,885 | $ | 105,271 | ||||||
29
The following table reflects total expected cash benefit payments (net of retiree contributions):
Year ended | Estimated Benefit Payments | ||
| 2006 | $ | 170,935 | |
| 2007 | 198,052 | ||
| 2008 | 215,109 | ||
| 2009 | 245,637 | ||
| 2010 | 282,470 | ||
| 2011-2015 | 934,243 | ||
The assumed health care cost trend rate used in measuring the accumulated postretirement benefit obligation at October 31, 2005 was 11.0% for 2005, decreasing by one-percentage-point per year until it reaches 5.0% in 2011. A one-percentage-point increase in the assumed health care cost trend rate for each year would increase the October 31, 2005 accumulated postretirement benefit obligation by $60,161 and the aggregate service and interest cost by $4,519.
NOTE 12 - GOODWILL
At fiscal year-end October 31, 2001, the Company had goodwill of $13,868,647, net of accumulated amortization of $2,328,313. The Company early adopted SFAS No. 142 on November 1, 2001 and, subsequently, discontinued goodwill amortization. Based on the Company’s current reporting structure, it has determined that it operates as three reporting units and, therefore, has assigned goodwill at the operating division level. On an ongoing basis, the Company performs annual goodwill impairment testing as of May 31. The Company performed annual goodwill impairment testing in each of 2003, 2004 and 2005, which indicated that the Company’s goodwill was not impaired. At least quarterly, the Company analyzes whether an event has occurred that more likely than not will reduce the reporting unit’s fair value below its carrying amount and, if necessary, a goodwill impairment test will be performed between the annual dates. Impairment adjustments recognized after adoption, if any, will be recognized as operating expenses.
NOTE 13 - SUPPLEMENTAL CASH FLOW INFORMATION
| Year Ended October 31, | ||||||||||
| 2005 | 2004 | 2003 | ||||||||
Cash paid during the year for: | ||||||||||
Interest | $ | 3,354,316 | $ | 3,959,443 | $ | 5,266,028 | ||||
Income taxes (net of cash received) | $ | 29,804,778 | $ | 11,706,806 | $ | (3,791,376 | ) | |||
NOTE 14 - DEFERRED COMPENSATION PLAN
The Company maintains a nonqualified deferred compensation plan (the “Executive Deferred Compensation Plan”). The purpose of the Executive Deferred Compensation Plan is to provide to certain eligible employees of the Company the opportunity to: (1) defer elements of their compensation (including any investment income thereon) which might not otherwise be deferrable under the current plans; and (2) receive the benefit of additions to their deferral comparable to those obtainable under the current plans in the absence of certain restrictions and limitations in the Internal Revenue Code. Amounts deferred are paid into a trust owned by the Company and are included in other assets. The Company’s liability and trust asset under the Executive Deferred Compensation Plan as of October 31, 2005 and 2004 was $540,773 and $614,382, respectively, and are included in other assets and other liabilities on the accompaning consolidated balance sheets.
NOTE 15 - ENTERPRISE-WIDE INFORMATION
The Company’s business consists of one industry segment, which is the extracting of scrap metal from discarded automobiles and the manufacturing, fabricating and marketing of merchant steel bar products and specialty steel sections, open-web steel joists and billets.
The industry segment consists of three classes of products - merchant steel products and specialty steel sections, fabricated bar joists and billets. Due to the January 27, 2005 sale of RESCO Steel Products Corporation, a wholly-owned reinforcing bar subsidiary, rebar sales have been excluded from the fabricated products class.
30
| Financial Information Relating to Classes of Products | |||||||||
| 2005 | 2004 | 2003 | |||||||
Sales to unaffiliated customers: | |||||||||
Merchant steel and specialty steel sections | $ | 386,780,959 | $ | 343,604,922 | $ | 211,209,483 | |||
Fabricated bar joists | 115,731,962 | 95,969,128 | 66,927,348 | ||||||
Billets | 44,099,242 | 26,012,379 | 25,432,380 | ||||||
Total consolidated sales | $ | 546,612,163 | $ | 465,586,429 | $ | 303,569,211 | |||
Information relating to geographic areas indicates that significantly all of the consolidated sales are domestic, as foreign revenues are not material. Additionally, the company has no foreign assets.
NOTE 16 - ASSET RETIREMENT OBLIGATIONS
SFAS No. 143, “Accounting for Asset Retirement Obligations”, requires that the discounted fair value of a liability for an asset retirement obligation be recognized in the period in which it is incurred if a reasonable estimate of the fair value can be made. The associated asset retirement costs are capitalized as part of the carrying amount of the long-lived asset.
Application of the statement encompasses an industrial landfill located on the site of the Company’s subsidiary, Shredded Products Corporation, which will operate for approximately thirty-three more years before closing.
On November 1, 2002, the date of adoption, an asset retirement obligation for landfill closure and post closure costs of $433,902 was recorded, compared to the associated long-lived asset, net of accumulated depreciation of $205,492. This resulted in a cumulative effect of adopting this statement of $228,410. The effect of this statement had it been applied during prior years would not have been material to the amounts presented or to the reported earnings per share.
At October 31, 2005 and 2004, the asset retirement obligation totaled $534,969 and $498,903, respectively, and is included in other non-current liabilities. Accretion expense was $36,066 in 2005 and $33,634 in 2004.
NOTE 17 - LEASES
The Company has non-cancelable operating leases for trucks and trailers used in hauling products and supplies, various manufacturing and office equipment, land used for storage and access purposes, and buildings used both as office and plant facilities and for product and supplies storage. Rental expense under operating leases was $1,897,645, $2,063,318, and $1,767,433 in 2005, 2004 and 2003, respectively.
The Company has a capital lease for land, with a carrying value of $234,557, used in the manufacturing process. The liability associated with the capital lease amounted to $189,350 and $208,948 at October 31, 2005 and 2004, respectively.
The future minimum lease payments under non-cancelable operating and capital leases as of October 31, 2005 are as follows:
| Operating Leases | Capital Leases | |||||
2006 | $ | 1,837,951 | $ | 30,000 | ||
2007 | 1,240,130 | 30,000 | ||||
2008 | 1,061,018 | 30,000 | ||||
2009 | 959,673 | 30,000 | ||||
2010 | 541,088 | 30,000 | ||||
Thereafter | — | 80,000 | ||||
Total minimum lease payments | $ | 5,639,860 | 230,000 | |||
Less amounts representing interest | 40,650 | |||||
Present value of net minimum lease payments | 189,350 | |||||
Less current portion under capital lease | 20,641 | |||||
Long-term obligation under capital lease | $ | 168,709 | ||||
31
NOTE 18 - UNAUDITED QUARTERLY FINANCIAL DATA
Summarized unaudited quarterly financial data for 2005 follows:
| Three Months Ended | ||||||||||||
| January 31 | April 30 | July 31 | October 31 | |||||||||
Sales | $ | 131,309,983 | $ | 137,868,454 | $ | 136,398,926 | $ | 141,034,800 | ||||
Gross earnings | $ | 25,738,135 | $ | 20,358,722 | $ | 19,119,887 | $ | 37,289,206 | ||||
Net earnings | $ | 8,937,554 | $ | 6,582,181 | $ | 7,311,280 | $ | 17,488,418 | ||||
Net earnings per share: | ||||||||||||
Basic | $ | 0.81 | $ | 0.59 | $ | 0.66 | $ | 1.57 | ||||
Diluted | $ | 0.80 | $ | 0.58 | $ | 0.65 | $ | 1.55 | ||||
Summarized unaudited quarterly financial data for 2004 follows:
| Three Months Ended | ||||||||||||
| January 31 | April 30 | July 31 | October 31 | |||||||||
Sales | $ | 85,173,685 | $ | 116,012,871 | $ | 125,262,181 | $ | 139,137,692 | ||||
Gross earnings | $ | 7,862,801 | $ | 16,744,115 | $ | 22,120,071 | $ | 35,109,427 | ||||
Net earnings | $ | 1,533,676 | $ | 5,222,056 | $ | 7,757,545 | $ | 15,932,971 | ||||
Net earnings per share: | ||||||||||||
Basic | $ | 0.14 | $ | 0.48 | $ | 0.71 | $ | 1.45 | ||||
Diluted | $ | 0.14 | $ | 0.47 | $ | 0.70 | $ | 1.44 | ||||
NOTE 19 - DEFINITIVE AGREEMENT OF MERGER
On October 18, 2005, Roanoke Electric Steel Corporation (“Roanoke”) and Steel Dynamics, Inc. (“SDI”) announced the execution of a definitive agreement of merger (the “Merger Agreement”) pursuant to which SDI will acquire Roanoke and all of its subsidiaries. Pursuant to the Merger Agreement, which has been unanimously approved by the Roanoke Board of Directors, Roanoke stockholders will receive a fixed consideration equal to 0.4 shares of SDI common stock and $9.75 in cash for each share of Roanoke common stock outstanding at the effective time of the merger. Completion of the merger is subject to approval by Roanoke’s stockholders, regulatory approval, including antitrust approval, and the satisfaction or waiver of customary conditions. The Merger Agreement contains certain termination rights for both parties and further provides for a termination fee to SDI of $7.5 million plus expenses if the transaction is terminated under certain circumstances.
32
Report Of Independent Registered Public Accounting Firm
The Board of Directors and Stockholders
Roanoke Electric Steel Corporation:
We have audited the accompanying consolidated balance sheet of Roanoke Electric Steel Corporation (the Company), as of October 31, 2005, and the related consolidated statements of earnings, stockholders’ equity and comprehensive earnings, and cash flows for the year then ended. These consolidated financial statements are the responsibility of the Company’s management. Our responsibility is to express an opinion on these consolidated financial statements based on our audit.
We conducted our audit in accordance with the standards of the Public Company Accounting Oversight Board (United States). Those standards require that we plan and perform the audit to obtain reasonable assurance about whether the financial statements are free of material misstatement. An audit includes examining, on a test basis, evidence supporting the amounts and disclosures in the financial statements. An audit also includes assessing the accounting principles used and significant estimates made by management, as well as evaluating the overall financial statement presentation. We believe that our audit provides a reasonable basis for our opinion.
In our opinion, the consolidated financial statements referred to above present fairly, in all material respects the financial position of Roanoke Electric Steel Corporation as of October 31, 2005, and the results of their operations and their cash flows for the year then ended, in conformity with U.S. generally accepted accounting principles.
As discussed in note 1 to the consolidated financial statements, effective November 1, 2004, the Company changed its method of accounting and reporting for share-based payments.
We also have audited, in accordance with the standards of the Public Company Accounting Oversight Board (United States), the effectiveness of the Company’s internal control over financial reporting as of October 31, 2005, based on criteria established in Internal Control – Integrated Framework issued by the Committee of Sponsoring Organizations of the Treadway Commission (COSO), and our report dated January 11, 2006 expressed an unqualified opinion on management’s assessment of, and the effective operation of, internal control over financial reporting.

Roanoke, Virginia
January 11, 2006
33
Report Of Independent Registered Public Accounting Firm
To the Board of Directors and Stockholders of
Roanoke Electric Steel Corporation
Roanoke, Virginia
We have audited the accompanying consolidated balance sheet of Roanoke Electric Steel Corporation and subsidiaries (the “Company”) as of October 31, 2004, and the related consolidated statements of earnings (loss), stockholders’ equity and comprehensive earnings (loss), and of cash flows for the years ended October 31, 2004 and 2003. These financial statements are the responsibility of the Company’s management. Our responsibility is to express an opinion on these financial statements based on our audits.
We conducted our audits in accordance with standards of the Public Company Accounting Oversight Board (United States). Those standards require that we plan and perform the audit to obtain reasonable assurance about whether the financial statements are free of material misstatement. An audit includes examining, on a test basis, evidence supporting the amounts and disclosures in the financial statements. An audit also includes assessing the accounting principles used and significant estimates made by management, as well as evaluating the overall financial statement presentation. We believe that our audits provide a reasonable basis for our opinion.
In our opinion, such consolidated financial statements present fairly, in all material respects, the financial position of Roanoke Electric Steel Corporation and subsidiaries as of October 31, 2004, and the results of their operations and their cash flows for the years ended October 31, 2004 and 2003, in conformity with accounting principles generally accepted in the United States of America.
As discussed in Note 16 to the consolidated financial statements, effective November 1, 2002, the Company changed its method for accounting for asset retirement obligations in accordance with Statement of Financial Accounting Standards No. 143, Accounting for Asset Retirement Obligations.
Raleigh, North Carolina
December 8, 2004, except for Note 1—Discontinued Operations,
as to which the date is January 11, 2006
34
Management’s Report On Internal Control Over Financial Reporting
Management has responsibility for establishing and maintaining adequate internal control over financial reporting. Internal control over financial reporting is a process designed to provide reasonable assurance regarding the reliability of financial reporting and the preparation of consolidated financial statements for external reporting purposes in accordance with U.S. generally accepted accounting principles. Because of its inherent limitations, internal control over financial reporting may not prevent or detect misstatements. Management has assessed the effectiveness of the Company’s internal control over financial reporting as of October 31, 2005. In making its assessment, Management has utilized the criteria set forth by the Committee of Sponsoring Organizations (COSO) of the Treadway Commission in Internal Control-Integrated Framework. Management concluded that based on its assessment, Roanoke Electric Steel Corporation’s internal control over financial reporting was effective as of October 31, 2005. Management’s assessment of the effectiveness of the Company’s internal control over financial reporting as of October 31, 2005 has been audited by KPMG LLP, an independent registered public accounting firm, as stated in their report, which appears in this Annual Report to Stockholders.
 |
| Donald G. Smith |
| Chairman and Chief Executive Officer |
 |
| Mark G. Meikle |
| Vice President-Finance and Chief Financial Officer |
35
Report Of Independent Registered Public Accounting Firm
The Board of Directors and Stockholders
Roanoke Electric Steel Corporation:
We have audited management’s assessment, included in the accompanying Management’s Report on Internal Control over Financial Reporting, that Roanoke Electric Steel Corporation (the Company) maintained effective internal control over financial reporting as of October 31, 2005, based on criteria established in Internal Control - Integrated Framework issued by the Committee of Sponsoring Organizations of the Treadway Commission (COSO). The Company’s management is responsible for maintaining effective internal control over financial reporting and for its assessment of the effectiveness of internal control over financial reporting. Our responsibility is to express an opinion on management’s assessment and an opinion on the effectiveness of the Company’s internal control over financial reporting based on our audit.
We conducted our audit in accordance with the standards of the Public Company Accounting Oversight Board (United States). Those standards require that we plan and perform the audit to obtain reasonable assurance about whether effective internal control over financial reporting was maintained in all material respects. Our audit included obtaining an understanding of internal control over financial reporting, evaluating management’s assessment, testing and evaluating the design and operating effectiveness of internal control, and performing such other procedures as we considered necessary in the circumstances. We believe that our audit provides a reasonable basis for our opinion.
A company’s internal control over financial reporting is a process designed to provide reasonable assurance regarding the reliability of financial reporting and the preparation of financial statements for external purposes in accordance with generally accepted accounting principles. A company’s internal control over financial reporting includes those policies and procedures that (1) pertain to the maintenance of records that, in reasonable detail, accurately and fairly reflect the transactions and dispositions of the assets of the company; (2) provide reasonable assurance that transactions are recorded as necessary to permit preparation of financial statements in accordance with generally accepted accounting principles, and that receipts and expenditures of the company are being made only in accordance with authorizations of management and directors of the company; and (3) provide reasonable assurance regarding prevention or timely detection of unauthorized acquisition, use, or disposition of the company’s assets that could have a material effect on the financial statements.
Because of its inherent limitations, internal control over financial reporting may not prevent or detect misstatements. Also, projections of any evaluation of effectiveness to future periods are subject to the risk that controls may become inadequate because of changes in conditions, or that the degree of compliance with the policies or procedures may deteriorate.
In our opinion, management’s assessment that the Company maintained effective internal control over financial reporting as of October 31, 2005, is fairly stated, in all material respects, based on criteria established in Internal Control - Integrated Framework issued by the Committee of Sponsoring Organizations of the Treadway Commission (COSO). Also, in our opinion, the Company maintained, in all material respects, effective internal control over financial reporting as of October 31, 2005, based on criteria established in Internal Control - Integrated Framework issued by the Committee of Sponsoring Organizations of the Treadway Commission (COSO).
We also have audited, in accordance with the standards of the Public Company Accounting Oversight Board (United States), the consolidated balance sheet of Roanoke Electric Steel Corporation as of October 31, 2005, and the related consolidated statements of earnings, stockholders’ equity and comprehensive earnings, and cash flows for the year then ended, and our report dated January 11, 2006, expressed an unqualified opinion on those consolidated financial statements. Our report refers to a change in the method of accounting and reporting for share-based payments.
Roanoke, Virginia
January 11, 2006
36
Management’s Discussion And Analysis
FORWARD-LOOKING STATEMENTS
From time to time, the Company may publish forward-looking statements relating to such matters as anticipated financial performance, business prospects, technological developments, new products, research and development activities and similar matters. The Private Securities Litigation Reform Act of 1995 provides a safe harbor for forward-looking statements. In order to comply with the terms of the safe harbor, the Company notes that a variety of factors could cause the Company’s actual results and experience to differ materially from the anticipated results or other expectations expressed in the Company’s forward-looking statements. The risks and uncertainties that may affect the operations, performance, development and results of the Company’s business include economic and industry conditions, availability and prices of utilities, supplies and raw materials, prices of steel products, foreign and domestic competition, foreign trade policies affecting imports and exports, governmental regulations, interest rates, inflation, labor relations, environmental concerns and compliance issues, the Company’s safety performance, the cyclical nature of the domestic steel industry, and others.
OVERVIEW
During our 2005 and 2004 fiscal years, the Company reported net earnings of $40,319,433 and $30,446,248, respectively. The steel industry as a whole has experienced two consecutive very robust years in terms of earnings. The Company was able to increase its profit margins in a period of rapidly rising costs and pricing environment, as discussed more fully below.
The Company is a domestic steel manufacturing company. The Company, directly and through its subsidiaries, is engaged in the manufacturing, fabricating and marketing of merchant steel products, specialty steel sections, billets and open-web steel joists. Each subsidiary is either a supplier to the parent company or a purchaser of its finished product and billets. The Company sells products through its sales force to its customers, which include service centers, original equipment manufacturers, and fabricators.
Roanoke Electric Steel Corporation, the parent company, is a state-of-the-art steel mini-mill located in Roanoke, Virginia. This facility melts scrap steel in electric furnaces and continuously casts the molten steel into billets. These billets are rolled into merchant steel products consisting of angles, plain rounds, flats and channels of various lengths and sizes. Excess steel billet production is sold to mills without sufficient melting capacities or facilities. Roanoke Electric Steel Corporation markets its products to steel service centers and fabricators. Steel of West Virginia, Inc., through its subsidiary, SWVA, Inc., is a steel mini-mill and steel fabricating facility operating in Huntington, West Virginia. A steel fabricating subsidiary, Marshall Steel, Inc., is located in Memphis, Tennessee. These locations produce or fabricate specialty steel sections and custom-finished products and serve niche markets. Shredded Products Corporation, a subsidiary with operations in Rocky Mount and Montvale, Virginia, extracts scrap steel and other metals from junked automobiles and other waste materials. These facilities supply the parent company with a substantial amount of its raw materials. Nonferrous metals generated in the process are sold to unrelated customers. John W Hancock, Jr., Inc. and Socar, Inc. are steel fabrication subsidiaries located in Salem, Virginia, Florence, South Carolina and Continental, Ohio. All three operations purchase rounds and angles from the parent company to fabricate steel joists and joist girders. These joists and joist girders are used as horizontal supports for floors and roofs in commercial and industrial buildings. The Hancock facility also manufactures structural pallet rack and structural cantilever rack. This rack is used for heavy storage in retail, warehouses and distribution centers. RESCO Steel Products Corporation, a Salem, Virginia based subsidiary, fabricated concrete reinforcing steel by cutting and bending it to contractor specifications, until its sale on January 27, 2005 (see Note 1 - Discontinued Operations).
ECONOMIC FACTORS AND STEEL INDUSTRY TRENDS AFFECTING OPERATING RESULTS
The Company’s sales are predominantly affected by the volume of products shipped to customers, the corresponding mix of products shipped and the associated sales prices of each product. These factors can be significantly impacted by general economic conditions, industry trends and competitive pressures. The Company has limited pricing power, and in general, prices will rise or fall based on market forces. The cost of the Company’s main raw material, scrap steel, is also based on market forces.
All direct and indirect manufacturing costs relating to production are included in cost of sales. The principle elements of cost of sales are raw materials, labor and benefits (including profit sharing for production employees), and energy. The primary components of raw materials include scrap and other additives, the costs of which are demand driven, and can be affected by available supply and inflationary pressures. The steel industry initiated a number of scrap surcharges and base-price increases during the past year due to the increased cost of scrap steel. Labor and benefit costs are influenced mainly by production and shipment levels. Profit sharing expenses are related to the Company’s various plans’ contributions which represent a percentage of earnings or IRS limitations. Energy costs are
37
associated with the Company’s utilization of both electricity and natural gas as its power sources, with electric arc furnaces using electricity and with reheat furnaces using natural gas. The arc furnaces are used in the actual melting of scrap steel (to produce billets), while the reheat furnaces are used to reheat the billets which are then rolled into a finished product. The availability of this power supply and the peak demands by the Company determine energy pricing.
INCOME STATEMENT CLASSIFICATIONS
Sales
The Company’s sales are a factor of net tons shipped, product mix and related pricing. Sales are determined by subtracting product returns, sales discounts, return allowances and claims from total sales.
Cost of Sales
The Company’s cost of sales represent all production related direct and indirect costs associated with the manufacture of our products. The principal elements of these costs are steel scrap, alloys, electrodes, labor and benefits (including profit sharing for production employees), energy, depreciation, and freight.
Other Operating Expenses (Income)
The Company’s other operating expenses are composed of four main areas. Administrative expenses consist of costs associated with our sales, finance and accounting, and administrative departments. These costs include labor and benefits, professional services, certain insurance expenses and various property taxes. Interest expense consists of interest and financing cost amortization associated with our credit facilities as described in the notes to our consolidated financial statements contained elsewhere in this report. Profit sharing expenses are related to the Company’s various plans’ contributions, for administrative employees, which represent a percentage of earnings or IRS limitations. Other income includes interest income and antitrust litigation settlements which are due to partial settlements received in conjunction with a class action suit for antitrust violations against the Company’s graphite electrode suppliers.
The following table sets forth amounts from our consolidated statements of earnings along with the dollar and percentage change for fiscal 2005 compared to fiscal 2004:
| 2005 | 2004 | $ Inc (Dec) | % Inc (Dec) | ||||||||||||
SALES | $ | 546,612,163 | $ | 465,586,429 | $ | 81,025,734 | 17.4 | % | |||||||
COSTS | |||||||||||||||
Cost of sales | 435,660,134 | 376,017,112 | 59,643,022 | 15.9 | % | ||||||||||
Profit sharing | 8,446,079 | 7,732,903 | 713,176 | 9.2 | % | ||||||||||
Total | 444,106,213 | 383,750,015 | 60,356,198 | 15.7 | % | ||||||||||
GROSS EARNINGS | 102,505,950 | 81,836,414 | 20,669,536 | 25.3 | % | ||||||||||
OTHER OPERATING EXPENSES (INCOME) | |||||||||||||||
Administrative | 31,526,927 | 30,026,395 | 1,500,532 | 5.0 | % | ||||||||||
Interest expense | 3,412,641 | 4,480,195 | (1,067,554 | ) | (23.8 | %) | |||||||||
Profit sharing | 1,958,434 | 1,661,270 | 297,164 | 17.9 | % | ||||||||||
Interest income | (215,501 | ) | (207,694 | ) | (7,807 | ) | (3.8 | %) | |||||||
Antitrust litigation settlement | (97,902 | ) | (3,061,820 | ) | 2,963,918 | 96.8 | % | ||||||||
Total | 36,584,599 | 32,898,346 | 3,686,253 | 11.2 | % | ||||||||||
EARNINGS FROM CONTINUING OPERATIONS BEFORE INCOME TAXES | 65,921,351 | 48,938,068 | 16,983,283 | 34.7 | % | ||||||||||
INCOME TAX EXPENSE | 24,675,957 | 18,317,681 | 6,358,276 | 34.7 | % | ||||||||||
EARNINGS FROM CONTINUING OPERATIONS | 41,245,394 | 30,620,387 | 10,625,007 | 34.7 | % | ||||||||||
DISCONTINUED OPERATIONS: | |||||||||||||||
LOSS ON DISCONTINUED OPERATIONS BEFORE INCOME TAXES (INCLUDING LOSS ON SALE) | (1,518,263 | ) | (271,974 | ) | (1,246,289 | ) | (458.2 | %) | |||||||
INCOME TAX BENEFIT | (592,302 | ) | (97,835 | ) | (494,467 | ) | (505.4 | %) | |||||||
LOSS ON DISCONTINUED OPERATIONS | (925,961 | ) | (174,139 | ) | (751,822 | ) | (431.7 | %) | |||||||
NET EARNINGS | $ | 40,319,433 | $ | 30,446,248 | $ | 9,873,185 | 32.4 | % | |||||||
38
The following table sets forth amounts from our consolidated statements of earnings (loss) along with the dollar and percentage change for fiscal 2004 compared to fiscal 2003:
| 2004 | 2003 | $ Inc (Dec) | % Inc (Dec) | ||||||||||||
SALES | $ | 465,586,429 | $ | 303,569,211 | $ | 162,017,218 | 53.4 | % | |||||||
COSTS | |||||||||||||||
Cost of sales | 376,017,112 | 280,304,764 | 95,712,348 | 34.1 | % | ||||||||||
Profit sharing | 7,732,903 | 1,058,174 | 6,674,729 | 630.8 | % | ||||||||||
Total | 383,750,015 | 281,362,938 | 102,387,077 | 36.4 | % | ||||||||||
GROSS EARNINGS | 81,836,414 | 22,206,273 | 59,630,141 | 268.5 | % | ||||||||||
OTHER OPERATING EXPENSES (INCOME) | 30,026,395 | 21,735,226 | 8,291,169 | 38.1 | % | ||||||||||
Administrative | 4,480,195 | 5,435,464 | (955,269 | ) | (17.6 | %) | |||||||||
Interest expense | |||||||||||||||
Profit sharing | 1,661,270 | 218,862 | 1,442,408 | 659.0 | % | ||||||||||
Interest income | (207,694 | ) | (433,558 | ) | 225,864 | 52.1 | % | ||||||||
Antitrust litigation settlement | (3,061,820 | ) | (520,960 | ) | (2,540,860 | ) | (487.7 | %) | |||||||
Total | 32,898,346 | 26,435,034 | 6,463,312 | 24.4 | % | ||||||||||
EARNINGS (LOSS) FROM CONTINUING OPERATIONS BEFORE INCOME TAXES AND CUMULATIVE EFFECT OF CHANGE IN ACCOUNTING PRINCIPLE | 48,938,068 | (4,228,761 | ) | 53,166,829 | 1,257.3 | % | |||||||||
INCOME TAX EXPENSE (BENEFIT) | 18,317,681 | (1,706,927 | ) | 20,024,608 | 1,173.1 | % | |||||||||
EARNINGS (LOSS) FROM CONTINUING OPERATIONS BEFORE CUMULATIVE EFFECT OF CHANGE IN ACCOUNTING PRINCIPLE | 30,620,387 | (2,521,834 | ) | 33,142,221 | 1,314.2 | % | |||||||||
CUMULATIVE EFFECT OF CHANGE IN ACCOUNTING PRINCIPLE | — | (228,410 | ) | 228,410 | 100.0 | % | |||||||||
EARNINGS (LOSS) FROM CONTINUING OPERATIONS | 30,620,387 | (2,750,244 | ) | 33,370,631 | 1,213.4 | % | |||||||||
DISCONTINUED OPERATIONS: | |||||||||||||||
LOSS ON DISCONTINUED OPERATIONS BEFORE INCOME TAXES | (271,974 | ) | (756,458 | ) | 484,484 | 64.0 | % | ||||||||
INCOME TAX BENEFIT | (97,835 | ) | (281,749 | ) | 183,914 | 65.3 | % | ||||||||
LOSS ON DISCONTINUED OPERATIONS | (174,139 | ) | (474,709 | ) | 300,570 | 63.3 | % | ||||||||
NET EARNINGS (LOSS) | $ | 30,446,248 | $ | (3,224,953 | ) | $ | 33,671,201 | 1,044.1 | % | ||||||
RESULTS OF OPERATIONS
Sales
Sales increased 53.4% in 2004 to $465,586,429 compared to $303,569,211 in 2003. Average price per ton for merchant bar products, specialty steel sections, fabricated products and billets increased 49.8%, 25.2%, 28.6% and 48.1%, respectively, due to both product mix and higher selling prices. The volatile scrap market prompted industry-wide price increases due to the rising cost of scrap steel. Tons shipped of merchant bar products, specialty products and fabricated products increased 15.3%, 21.4% and 15.6%, respectively. Billet shipments declined due to a greater demand for internal consumption, thus reducing the tons available for shipment to outside customers.
The momentum obtained in 2004 continued in 2005. Sales for 2005 increased 17.4% to $546,612,163 compared to $465,586,429 in 2004, mainly, due to improved average selling prices for merchant products, specialty products, fabricated products and billets of 12.6%, 18.4%, 34.0% and 11.7%, respectively. The improvement in average selling prices was principally due, again, to rising scrap steel costs, which kept prices for all product classes higher for the year, although bar product and billet prices began to trend lower near year-end. Tons shipped of billets increased 51.8%, while bar and fabricated product shipments dropped by 3.4% and 14.0%,
39
respectively, as specialty products shipment levels were flat. The higher billet selling prices were triggered by increased scrap prices, while improved demand and lower excess billet availability in the market resulted in the higher billet shipments. Improved product mix and favorable competitive conditions, within several market segments, brought higher average selling prices for specialty steel sections. An improvement in demand within several market segments offset a softening in demand within another single segment, resulting in flat shipment levels for the comparable years. The higher merchant product selling prices were directly related to the increased scrap costs of 5.2%. More cautious buying patterns and excess inventory levels at steel service centers caused temporary reductions in tons shipped of bar products, although market conditions continued to be strong. The improved fabricated product selling prices were influenced mainly by higher raw material costs, while shipment levels of fabricated products declined, primarily due to reduced activity and increased competitive conditions within the nonresidential construction segment.
Cost of Sales and Gross Margins
Cost of sales increased by 36.4% in 2004, mainly, as a result of the increased bar, specialty and fabricated product tons shipped, together with the higher scrap steel costs of 72.6% and a 630.8% increase in profit sharing costs (see the discussion on profit sharing plans below), even though billet shipments declined. Cost of sales increased by 15.7% in 2005, primarily, due to the increased billet shipments, together with higher costs of scrap steel and other raw materials of 5.2% and 17.9%, respectively, and a 9.2% increase in profit sharing costs, in spite of reduced shipment levels for bar and fabricated products.
Gross earnings as a percentage of sales increased from 7.3% in 2003 to 17.6% in 2004, primarily, as a result of the higher selling prices for all product classes, which more than offset higher scrap costs. Gross earnings as a percentage of sales increased from 17.6% in 2004 to 18.8% in 2005, mainly, due to the higher selling prices for all product classes, in spite of the increased volume of lower margin billets (which historically have a margin well below finished steel margins), and the effects of reduced raw steel (-1.3%) and mill (-6.8%) production levels on fixed costs, and higher scrap steel costs. The Company experienced a widening of our gross margins during 2005 and 2004 as our average selling price per ton increased quicker than our average scrap cost.
Repairs and maintenance expense, included in cost of sales, for the years ended October 31, 2005, 2004 and 2003 amounted to $31,452,935, $26,372,867, and $19,585,305, respectively. Repairs and maintenance fluctuates depending upon the required needs during each of the periods mentioned. The Company has no significant deferred maintenance and believes its facilities are operating within reasonable productive capacities.
Administrative Expenses
Administrative expenses increased 38.1% from 2003 to 2004. Executive and other management compensation increased by $4,518,611, insurance expense increased by $3,172,778 (relating mainly to claims for workers’ compensation and health benefits) and professional fees increased by $1,302,724 (most in relation to the Sarbanes-Oxley Act), more than offsetting the bad debt expense reduction of $ 1,254,059. Administrative expenses as a percentage of sales decreased from 7.2% to 6.4% due to the increase in sales.
Total administrative expenses increased in 2005, mainly, due to increases in executive and other management compensation of $2,656,668, professional fees of $1,370,904 (most in relation to the Sarbanes-Oxley Act), and directors’ retirement costs and fees of $1,004,026. These expenses more than offset declines in administrative insurance (workers’ compensation and health claims) expense of $2,663,075 and bad debt expense of $1,637,349. The above mentioned retirement costs relate to a directors’ retirement plan. Administrative expenses as a percentage of sales decreased to 5.8% in 2005 due to the increase in sales.
Interest Expense
In 2004, interest expense declined due to reduced average borrowings and lower average interest rates. Interest expense declined again in 2005, also as a result of reduced average borrowings and lower average interest rates. In October 2004 the Company entered into a new five-year loan agreement with its banking syndicate. The new facility provides for a revolving loan of up to $55,000,000 and a term loan of $30,000,000.
The new loans bear interest at the Company’s option at (i) one, two, three, six or, if available, nine or twelve month LIBOR as selected by the Company, or (ii) the greater of (A) the prime rate publicly announced from time to time by the loans administrative agent, or (B) the effective federal funds rate quoted by the Federal Reserve Bank of New York plus 1/2 of 1%. The term loan requires quarterly payments of principal in the amount of $1,500,000 plus interest, and the revolving loan requires quarterly payments of interest until the fifth anniversary of the credit facility at which time the outstanding principal balance of the revolving loan must be paid in full.
Profit Sharing Expense
Contributions to various profit sharing plans are determined as a proportion of earnings before income taxes and should normally increase or decrease with earnings. During 2004 profit sharing expense increased due to the improved profitability of the Company.
Again in 2005, each of the sponsoring companies accrued benefits under their respective plans as a result of current earnings, producing an increase from the 2004 levels resulting from higher profitability. Profit sharing expense included in
40
cost of sales is applicable to plan participants who work within the production areas of the various plants.
Interest Income
Interest income decreased in 2004 as a result of both reduced interest rates and level of investments. During 2005, interest rates began to improve, with virtually no change in investments, resulting in increased interest income.
Antitrust Litigation Settlement
Other operating expenses were reduced by $97,902, $3,061,820 and $520,960 for the years ended October 31, 2005, 2004 and 2003, respectively, as a result of partial settlements received in conjunction with a class action suit for antitrust litigation against the Company’s graphite electrode suppliers. No further payments are expected under this settlement.
Discontinued Operations
The January 27, 2005 sale and liquidation of RESCO Steel Products Corporation, a wholly-owned rebar subsidiary, resulted in the discontinued operations for the comparable years. The year ended October 31, 2003, 2004 and 2005 reflect losses, before tax benefits, from discontinued operations of $756,458, $271,974 and $177,578, respectively. The 2005 year also includes a loss of $1,340,685, representing the loss on the disposition of the subsidiary.
Income Taxes
In 2004, the effective income tax rate was lower compared to 2003, mainly, due to a significant increase in earnings before taxes and certain state income tax credits earned. The effective income tax rate was relatively constant in 2005 compared to 2004. The effective income tax rates for 2005, 2004 and 2003 were 37.4%, 37.4% and 40.4%, respectively.
FINANCIAL CONDITION, LIQUIDITY, AND CAPITAL RESOURCES
At October 31, 2005, working capital was $111,181,959, the current ratio was 2.1 to 1 and the quick ratio was 0.9 to 1. These are sound indicators of ample liquidity and a healthy financial condition, together with the repayment of the prior year’s overdraft position. Current debt maturities of $21,586,640 in 2006, $6,000,000 in 2007 and in 2008, and $1,456,504 in 2009 will affect future liquidity and working capital.
Net cash provided by operations was $58,284,725 for the year ended October 31, 2005. Net cash flows related to operating assets and liabilities increased $51,810,085 (2005 - $5,123,797; 2004 - ($46,686,288)), which was primarily attributable to decreases in accounts receivable and inventories, and an increase in accounts payable and other accrued expenses offsetting decreases in accrued profit sharing and accrued income taxes. Net earnings improved $9,873,185 (2005 - $40,319,433; 2004 - $30,446,248). Earnings for 2005 included a $97,902 payment received from graphite electrode plaintiffs in conjunction with a class action suit for antitrust violations. Amounts received related to this matter were $3,061,820 in 2004. The Company incurred a loss of $1,340,685 on the sale of a subsidiary, reflected in the 2005 year. With the continued favorable market conditions, the Company anticipates future positive cash flows, which should generate the cash needed to cover anticipated contractual obligations and various planned capital expenditures.
Net cash used in investing activities was ($3,692,037) for the year ended October 31, 2005. Expenditures for property, plant and equipment amounted to $8,026,478 for the year. During 2005 and 2004, net cash used in investing activities included net proceeds of $4,206,829 and $4,002,236, respectively, from the sale of a subsidiary and other investments, respectively, partially used to pay down debt.
Net cash used in financing activities was ($37,762,007) for the year ended October 31, 2005. Cash dividends of $4,904,433 were paid during 2005, compared to $3,951,443 in 2004, resulting from the Company’s increased dividend rate in late 2004. Net cash used in financing activities included payments on long-term debt of $64,208,868, with borrowings of $34,500,000 providing cash in 2005. The overdraft position of $4,777,540 at the 2004 year-end was repaid during 2005. Most of the 2005 debt activity related to the Company’s revolving credit facility. With this credit facility, the loans are secured by a pledge of the outstanding stock in each of the Company’s direct and indirect subsidiaries and by a lien on the tangible and intangible personal property of the Company and each of its subsidiaries. The Company may prepay the loans at any time at its option, and is required to make mandatory prepayments based on certain circumstances. Since such circumstances existed at October 31, 2005, and during the year then ended, $15,586,640 of the long-term revolver has been classified in current portion of long-term debt at October 31, 2005, and must be prepaid by January 31, 2006. The loans are subject to various representations and warranties and affirmative and negative covenants, including the Company obligation to maintain a leverage ratio of less than or equal to 3:1, to maintain a fixed charge coverage ratio greater than or equal to 1.10:1, and to limit capital expenditures on a consolidated basis to no more than $75,000,000 over the term of the credit facility. As to debt maturities, refer to contractual obligations below. The revolving loan requires quarterly payments of interest until the fifth anniversary date of the credit facility at which time the outstanding principle balance must be paid in full.
The Company’s ability to meet its debt service obligations and reduce its total debt will depend upon its future performance, which in turn, will depend upon general economic, financial and business conditions, along with competition, legislation and regulations that are largely beyond its control. The Company believes that cash flow from operations (improving with better market conditions and corporate earnings), together with availability on the new revolving credit facility, should provide
41
the liquidity and capital resources necessary to remain competitive, fund operations, and meet required debt retirement for at least the next twelve months.
The Company was in compliance with the covenants of its loan agreement as of October 31, 2005 (see Note 5).
At October 31, 2005, there were commitments for the purchase of property, plant and equipment of approximately $3,500,000. These commitments, together with current debt maturities, will affect future earnings, working capital and liquidity, and will be financed from available cash reserves, internally generated funds and the revolving credit facility.
During the year, borrowings decreased to $35,232,494 from $64,960,960, and the ratio of debt to equity declined to .7 to 1. The percentage of long-term debt to total capitalization decreased from 27.5% to 6.6% at year-end. These improvements resulted from the pay down and 2004 refinancing of long-term debt.
Management is of the opinion that adoption of the Clean Air Act Amendments or any other environmental concerns will not have a materially adverse effect on the Company’s operations, capital resources or liquidity (see Note 7). Applicable additional future capital expenditures are presently estimated to be less than $17,000,000 and will be completed and funded, as the Company’s financial resources permit.
The following table sets forth the Company’s contractual obligations at October 31, 2005, and the effect such obligations are expected to have on liquidity and cash flow in future periods:
| Payments Due by Period | |||||||||||||||
Contractual Obligations | Total | Less than 1 year | 1-3 years | 3-5 years | More than 5 years | ||||||||||
Long-Term Debt | $ | 35,043,144 | $ | 21,586,640 | $ | 12 000 000 | $ | 1,456,504 | — | ||||||
Interest on Long-Term Debt (1) | 3,300,000 | 1,500,000 | 1,600,000 | 200,000 | — | ||||||||||
Capital Lease Obligations | 189,350 | 20,641 | 44,638 | 49,520 | $ | 74,551 | |||||||||
Operating Lease Obligations | 5,639,860 | 1,837,951 | 2,301,148 | 1,500,761 | — | ||||||||||
Purchase Obligations | 3,470,179 | 3,470,179 | — | — | — | ||||||||||
Payments Under Derivative Commodity Instruments (2) | 100,000 | 100,000 | — | — | — | ||||||||||
Other Long-Term Liabilities | 3,120,909 | 360,000 | 725,000 | 745,000 | 1,290,909 | ||||||||||
Total | $ | 50,863,442 | $ | 28,875,411 | $ | 16,670,786 | $ | 3,951,785 | $ | 1,365,460 | |||||
| (1) | Reflects estimated future interest payments through the scheduled maturity date based on average borrowing rates, outstanding debt balances, and scheduled principal payments as of October 31, 2005. |
| (2) | Reflects the maximum amount that the Company might incur under these instruments. |
OFF- BALANCE SHEET FINANCING ARRANGEMENTS
The Company has no off-balance sheet arrangements that have, or are reasonably likely to have, a current or future effect on the Company’s financial condition, changes in financial condition, revenues or expenses, results of operations, liquidity, capital expenditures or capital resources.
CRITICAL ACCOUNTING POLICIES AND ESTIMATES
The Company’s discussion and analysis of its financial condition and results of operations is based upon its consolidated financial statements, which have been prepared in accordance with U.S. generally accepted accounting principles. Estimates and assumptions are made, during the preparation of these financial statements that affect the amounts reported. Periodically, the Company evaluates its estimates, including those related to contracts, warranties (if any), taxes, insurance and environment. Under different assumptions and conditions, actual costs may vary from these estimates. The Company’s senior management has reviewed these critical accounting policies and estimates with the audit committee.
The Company believes the following critical accounting policies affect its more significant judgments and estimates used in the preparation of its consolidated financial statements:
Allowance for Doubtful Accounts- Allowances for doubtful accounts are maintained to provide for estimated losses resulting from the inability of the Company’s customers to make required payments. Such allowances are estimated based on historical loss experience (relative to aging of accounts receivable) and current market economic conditions affecting our customers (i.e., bankruptcy filing). If the amount of actual losses exceeds our estimates, or if the financial condition of the Company’s customers were to deteriorate resulting in an impairment of their ability to make payments, additional allowances maybe required.
Impairments of Long-Lived Assets - The Company reviews long-lived assets for impairment whenever events or changes in circumstances indicate the carrying amount of such assets may
42
not be recoverable. Impairment losses are recorded on long-lived assets used in operations when indicators of impairment are present and the undiscounted cash flows estimated to be generated during the life of those assets are less than the assets’ carrying amounts. The impairment loss is measured by comparing the fair value of the asset to its carrying amount.
Self-Retained Insurance Risks - The company has self-retained insurance risks associated with coverage for workers’ compensation and insurance plans. Accrued liabilities have been recorded based on estimates of the ultimate costs to settle incurred and incurred but not reported claims. The Company’s estimates are based on judgments and actuarial assumptions regarding the frequency and severity of claims, historical claims loss data, economic conditions and claim management and settlement practices. If actual claims loss experience exceed our estimates, additional accruals may be required.
Revenue Recognition - Revenue is recognized when title transfers upon shipment. Additionally, revenue is recognized on certain fabricated products sold pursuant to construction contracts utilizing the percentage-of-completion method. Percentage of completion is measured principally based on steel consumed on finished product as a percentage of the estimated steel required for each contract. The Company recognizes profit at the time revenue is recognized, based on its estimates as to the project status and the costs remaining to complete a particular project. If actual consumption exceeds estimated consumption, then the percentage-of-completion method is adjusted to prorate revenue up to the amount allowed by the contract.
Contingencies - Compliance with environmental laws and regulations established by federal, state and local authorities may subject the Company to additional costs. The Company believes it is in compliance with such laws and regulations based on currently available facts and present laws and regulations.
RECENTLY ADOPTED AND RECENTLY ISSUED ACCOUNTING PRONOUNCEMENTS
On November 1, 2004, the Company early adopted SFAS No. 123 (Revised 2004), “Share-Based Payment”. SFAS No. 123R requires all share-based payments to employees, including grants of employee stock options and purchases under employee stock purchase plans, to be recognized as an operating expense in the income statement. The cost of such share-based payments is to be recognized over the requisite service period based on fair values measured on the grant date of the award. The Company adopted SFAS No. 123R using the modified prospective method. Under this method, SFAS No. 123R applies to new awards and to awards modified, repurchased, or cancelled after October 31, 2004. Additionally, compensation cost for the portion of awards for which the requisite service has not been rendered that are outstanding as of October 31, 2004 is recognized as the requisite service is rendered. The adoption of SFAS No. 123R had no effect on the Company’s financial statements for the first quarter of 2005 since the requisite service had been rendered for all awards outstanding as of October 31, 2004. During 2005, the Company began to recognize compensation cost for awards issued on January 28, 2005, reflected in the 2005 statement of earnings, related to its stock plans in accordance with the provisions of SFAS No. 123R.
In November 2004, the FASB issued SFAS No. 151, “Inventory Costs - an amendment of ARB No. 43, Chapter 4”. SFAS No. 151 amends the guidance in ARB No. 43, Chapter 4, “Inventory Pricing,” to clarify the accounting for abnormal amounts of idle facility expense, freight, handling costs, and wasted material (spoilage) and requires these costs be treated as current period charges. In addition, SFAS No. 151 requires that allocation of fixed production overheads to the costs of conversion be based on the normal capacity of the production facilities. The provisions of SFAS No. 151 are effective for inventory costs incurred during fiscal years beginning after June 15, 2005. The Company does not believe adoption of SFAS No. 151 will have a material impact on its financial position, results of operations and liquidity.
In December 2004, the FASB issued SFAS No. 153, “Exchanges of Nonmonetary Assets, an amendment of APB Opinion No. 29”. SFAS No. 153 replaces the exception from fair value measurement included in APB Opinion No. 29 for nonmonetary exchanges of similar productive assets with a general exception from fair value measurement for exchanges of nonmonetary assets that do not have commercial substance. A nonmonetary exchange has commercial substance if the future cash flows of the entity are expected to change significantly as a result of the exchange. This Statement will be applied prospectively and is effective for nonmonetary asset exchanges occurring in fiscal periods beginning after June 15, 2005. The Company does not believe adoption of this statement will have a material impact on the Company’s results of operations or financial condition.
In December 2004, the FASB issued FASB Staff Position (“FSP”) No. FAS 109-1, “Application of FASB Statement No. 109, Accounting for Income Taxes, to the Tax Deduction on Qualified Production Activities Provided by the American Jobs Creation Act of 2004 (the Act)”. FSP No. FAS 109-1 clarifies that the tax deduction for manufacturers provided for in the Act should be accounted for as a special deduction rather than as a tax rate reduction. The manufacturers’ deduction is not available to the company until fiscal year 2006. The company is evaluating the effect the manufacturers’ deduction will have in future fiscal years.
In March 2005, FASB Interpretation No. (“FIN”) 47, “Accounting for Conditional Asset Retirement Obligations - an Interpretation of SFAS No. 143”, was issued. This Interpretation clarifies that the term “conditional asset
43
retirement obligation”, as used in SFAS No. 143, “Accounting for Asset Retirement Obligations”, refers to a legal obligation to perform an asset retirement activity in which the timing and (or) method of settlement are conditional on a future event that may or may not be within the control of the entity. Accordingly, an entity is required to recognize a liability for the fair value of a conditional asset retirement obligation if the fair value of the liability can be reasonably estimated. This Interpretation is effective no later than the end of fiscal years ending after December 15, 2005. Retrospective application for interim financial information is permitted but is not required. The Company has not determined whether the adoption of this Interpretation will have a material impact on the Company’s results of operations or financial condition.
In May 2005, the FASB issued SFAS No. 154, “Accounting Changes and Error Corrections–a replacement of APB Opinion No. 20 and FASB Statement No. 3”. This Statement replaces APB Opinion No. 20, “Accounting Changes”, and FASB Statement No. 3, “Reporting Accounting Changes in Interim Financial Statements”, and changes the requirements for the accounting for and reporting of a change in accounting principle. SFAS No. 154 applies to all voluntary changes in accounting principle. This Statement requires retrospective application to prior periods’ financial statements of changes in accounting principle, unless it is impracticable to determine either the period-specific effects or the cumulative effect of the change. It also requires that retrospective application of a change in accounting principle be limited to the direct effects of the change. Indirect effects of a change in accounting principle should be recognized in the period of the accounting change. This Statement is effective for accounting changes and corrections of errors made in fiscal years beginning after December 15, 2005. The Company does not believe that the adoption of SFAS No. 154 will have a material impact on its results of operations or financial condition.
44
Stock Activity
The Common Stock of Roanoke Electric Steel Corporation is traded on the Nasdaq National Market using the symbol RESC. At year end, there were approximately 500 shareholders of record. All amounts below are per share.
2005 Stock Prices | 2004 Stock Prices | Cash Dividends | ||||||||||||||||
| High | Low | High | Low | 2005 | 2004 | |||||||||||||
First Quarter | $ | 21.90 | $ | 15.50 | $ | 13.26 | $ | 9.30 | $ | 0.11 | $ | 0.05 | ||||||
Second Quarter | 27.68 | 19.04 | 14.83 | 12.10 | 0.11 | 0.10 | ||||||||||||
Third Quarter | 20.56 | 15.36 | 14.57 | 11.60 | 0.11 | 0.10 | ||||||||||||
Fourth Quarter | 21.96 | 16.89 | 16.88 | 13.35 | 0.11 | 0.11 | ||||||||||||
45

A tribute to our founder, John W. Hancock, Jr.
John William Hancock, Jr.
1904-1994
He was an original.
A visionary businessman who almost lost his business, then took it to spectacular success.
A generous benefactor who shunned recognition.
A powerful leader who gave credit for his accomplishments to others.
Jack Hancock shaped the thinking of many and bettered the lives of us all.
This is a tribute to Mr. Hancock. And a remembrance of the integrity, loyalty and generosity that are his legacy to us.
Jack Hancock was born in Roanoke, Virginia August 7, 1904. He studied mining engineering at Virginia Tech and attended the Wharton School of Finance at the University of Pennsylvania. Upon graduation, he was employed by a New York investment banking firm, where he built a successful career selling securities. Fifteen years later, World War II broke out, and Jack Hancock joined the Air Force, attaining the rank of lieutenant colonel.
While overseas, he was intrigued by the acres and acres of Quonset huts. Learning how cheaply and quickly they could be built sparked an idea. The war had slowed down building in the United States. The postwar demand for office and storage space wouldn’t be met with conventional methods. This could be an opportunity. Returning to Roanoke in 1945, he set up a shop and began selling Quonset huts. Some of these “temporary” buildings still exist today.
By 1949, the building boom was going strong. Mr. Hancock knew there would be a need for steel joists to use as roof and floor supports, so he started manufacturing them. But he was increasingly frustrated by the erratic shipments of steel he got from Pittsburgh. How could you meet your own delivery commitments if you weren’t able to depend on your supplier? He decided what he needed was his own steel mill.
He studied, researched and even went to Germany. He learned that by firing furnaces with electricity instead of traditional coke ovens, a mini-mill could be built in a smaller space, for less capital, with fewer employees.
In 1955, Jack Hancock borrowed every dollar he could and sold stock for $100 per share to build Roanoke
46
Electric Steel, the first mini-mill in the Southeast.
A lot of people told him he made a mistake – the big mills would squeeze him out. It wasn’t long before doomsday predictions looked smart.
Within just a couple of weeks after starting production, the secondhand motor he’d bought broke down. He had all these employees, all this equipment, and no money to pay for having the motor rewound. On a somber Friday afternoon, he decided the plant would have to close. He kept the bad news to himself over the weekend.
Early Monday morning he answered a phone call from Irvin Bettman of the David J. Joseph Company, a Cincinnati scrap dealer he’d been negotiating with. “Can’t pay for scrap we ordered,” said Mr. Hancock. “I’m out of money, and we’re gonna close down.” Mr. Bettman quickly replied, “We’ll give you more time.” Shortly thereafter, Louis Zinn, president of Port Everglades Steel Corporation in Florida, dropped by. Upon hearing of the financial predicament, he told Mr. Hancock, “What you need is some business. I’m going to order 1,000 tons of steel today and I’ll give you some blanket orders to produce steel for my customers. Use them as you need them.”
Because of these two men, and with some additional money committed by Jack Hancock, the plant stayed open. Their generosity was never forgotten. From that day to this, Roanoke Electric Steel is still doing business with David J. Joseph Company and Port Everglades Steel Corporation.
But for some years, the tough times continued and the future of the young company looked tenuous. Mr. Hancock kept on seeking ways to expedite the steelmaking process.
The answer, he decided, was a continuous casting machine that would eliminate the waste of casting ingots in individual molds. The fact that there was no such machine in this country didn’t deter him a bit. In short order, he commissioned Babcock & Wilcox to build a casting machine as a joint venture with his company. If it failed, each would lose half a million dollars.
It worked. And in 1962, Roanoke Electric Steel became the nation’s first continuous casting plant. Today, 60 percent of steel companies in the United States and 90 percent of those in Japan use continuous casting.
The growth and success of Roanoke Electric Steel is a direct result of the creative thinking and tenacity of our founder. But he is remembered even more for the way he did business. With loyalty, truthfulness and respect.
His high principles were never merely words. He lived them every day.
47
Officers
Donald G. Smith, 70
Chairman, Treasurer and Chief Executive Officer
48 years of service
T. Joe Crawford, 50
President and Chief Operating Officer
28 years of service
Timothy R. Duke, 54
President and Chief Executive Officer,
Steel of West Virginia, Inc.
18 years of service
W. Rivers Claytor, Jr., 59
President, John W. Hancock, Jr., Inc.
34 years of service
J. Kenneth Charles, III, 52
President, Socar, Inc.
28 years of service
H. James Akers, Jr., 66
Vice President, Melt Operations
49 years of service
Daniel L. Board, 68
Vice President, Purchasing
45 years of service
Donald R. Higgins, 60
Vice President-Sales
40 years of service
Mark G. Meikle, 41
Vice President-Finance,
Assistant Treasurer and Chief Financial Officer
12 years of service
William M. Watson, Jr., 50
General Counsel and Secretary
2 years of service
Board Of Directors
George B. Cartledge, Jr.
Chairman,
Grand Home Furnishings, Inc.
T. Joe Crawford
President and Chief Operating Officer,
Roanoke Electric Steel Corporation
Timothy R. Duke
President and Chief Executive Officer,
Steel of West Virginia, Inc.
George W. Logan
Chairman,
Valley Financial Corporation
Charles I. Lunsford, II
Retired Chairman,
Charles Lunsford Sons & Associates
Thomas L. Robertson
Retired Chairman,
Carilion Foundation
Donald G. Smith
Chairman, Treasurer and Chief Executive Officer,
Roanoke Electric Steel Corporation
Charles W. Steger
President,
Virginia Polytechnic Institute and State University
Joseph H. Vipperman
Retired Executive Vice President - Corporate Services,
American Electric Power Company
Committees Of The Board
Executive:
D. G. Smith, Chairman;
T. L. Robertson, G. W. Logan,
G. B. Cartledge, Jr.
Audit:
T. L. Robertson, Chairman;
G. W. Logan, C. W. Steger
Compensation:
G. B. Cartledge, Jr., Chairman;
C. I. Lunsford, II, J. H. Vipperman
Profit Sharing:
C. I. Lunsford, II, Chairman;
D. G. Smith, M. G. Meikle
Nominating and Corporate Governance:
C. I. Lunsford, II, Chairman;
G. B. Cartledge Jr., C. W. Steger
Corporate Information
Outside Counsel
Woods Rogers P.L.C.
Roanoke, Virginia
Transfer Agent
Shareholder Inquiries:
Roanoke Electric Steel Corporation
c/o Computershare
P.O. Box 43012
Providence, RI 02940-3010
1-800-633-4236
www.equiserve.com
Dividend Reinvestment Plan
Roanoke Electric Steel offers its shareholders a dividend reinvestment plan through its transfer agent. For more information, please contact the transfer agent or William M. Watson, Jr., General Counsel and Secretary.
Independent Registered Public Accounting Firm
KPMG LLP
Roanoke, Virginia
Stock Listing
Nasdaq National Market
Symbol: RESC
Financial Information
Analysts, investors and others seeking financial information are requested to contact: Mark G. Meikle, Vice President-Finance or William M. Watson, Jr., General Counsel and Secretary.
Copies of the Corporation’s Annual Report or Form 10-K may be obtained without charge by writing to Mr. Watson at the address below.
Corporate Office
102 Westside Boulevard NW (zip 24017)
P. O. Box 13948
Roanoke, Virginia 24038-3948
540-342-1831
48
Roanoke Electric Steel Corporation
Steel Mini-mills
Parent:
Roanoke Electric Steel Corporation
102Westside Boulevard NW (zip 24017)
P. O. Box 13948
Roanoke, Virginia 24038-3948
Telephone: 540-342-1831 Sales: 800-753-3532 Fax: 540-342-6610
Web site: www.roanokesteel.com E-mail: sales@roanokesteel.com
Subsidiary:
SWVA, Inc.
17th Street & 2nd Avenue (zip 25703)
P.O. Box 2547
Huntington, West Virginia 25726-2547
Telephone: 304-696-8200 Sales: 800-624-3492 Fax: 304-529-1479
Web site: www.swvainc.com E-mail: steel@swvainc.com or sales@swvainc.com
Steel Fabricators
Subsidiaries:
John W. Hancock, Jr., Inc.
2535 Diuguids Lane
P.O. Box 3400
Salem, Virginia 24153
Telephone: 540-389-0211 Sales: 800-336-5773 Fax: 540-389-0378
Web site: www.hancockjoist.com E-mail: jwhmail@hancockjoist.com
Marshall Steel, Inc.
1555 Harbor Avenue
P. O. Box 13463
Memphis, Tennessee 38113-0463
Telephone: 901-946-1124 Fax: 901-946-5676
Web site: www.swvainc.com E-mail: sales@marshallsteel.com
Socar, Inc.
2527 East National Cemetery Road (zip 29506)
P.O. Box 671
Florence, South Carolina 29503
Telephone: 843-669-5183 Sales: 800-669-5183 Fax: 843-669-0675
Web site: www.socarinc.com E-mail: llm@socarinc.com
Socar of Ohio, Inc.
21739 Road E16
P.O. Box 219
Continental, Ohio 45831
Telephone: 419-596-3100 Fax: 419-596-3120
Web site: www.socarinc.com E-mail: socaroh@socarinc.com
Scrap Steel Processor
Subsidiary:
Shredded Products Corporation
700 Commerce Road
Rocky Mount, Virginia 24151
Telephone: 540-489-7599 Fax:540-489-8431
1144 Fluff Road
P. O. Box 159,
Montvale, Virginia 24122
Telephone: 540-947-2225 Toll free: 877-668-8253 Fax:540-947-5173