WASHINGTON, D. C. 20549
MAY 31, 2013 Semiannual Report to Shareholders |
| |
DWS Multi-Market Income Trust Ticker Symbol: KMM |
|
Contents
34 Statement of Assets and Liabilities 36 Statement of Operations 37 Statement of Cash Flows 38 Statement of Changes in Net Assets 41 Notes to Financial Statements 53 Dividend Reinvestment Plan 55 Additional Information |
The fund's investment objective is to provide high current income consistent with prudent total return asset management.
Closed-end funds, unlike open-end funds, are not continuously offered. There is a one time public offering and once issued, shares of closed-end funds are sold in the open market through a stock exchange. Shares of closed-end funds frequently trade at a discount to net asset value. The price of the fund's shares is determined by a number of factors, several of which are beyond the control of the fund. Therefore, the fund cannot predict whether its shares will trade at, below or above net asset value.
Bond investments are subject to interest-rate and credit risks. When interest rates rise, bond prices generally fall. Credit risk refers to the ability of an issuer to make timely payments of principal and interest. Investments in lower-quality ("junk bonds") and non-rated securities present greater risk of loss than investments in higher-quality securities. Investing in derivatives entails special risks relating to liquidity, leverage and credit that may reduce returns and/or increase volatility. Leverage results in additional risks and can magnify the effect of any gains or losses. Investing in foreign securities, particularly those of emerging markets, presents certain risks, such as currency fluctuations, political and economic changes, and market risks.
DWS Investments is part of the Deutsche Asset & Wealth Management division of Deutsche Bank AG.
NOT FDIC/NCUA INSURED NO BANK GUARANTEE MAY LOSE VALUE NOT A DEPOSIT NOT INSURED BY ANY FEDERAL GOVERNMENT AGENCY
Performance Summary May 31, 2013 (Unaudited)
Performance is historical, assumes reinvestment of all dividend and capital gain distributions, and does not guarantee future results. Investment return and principal value fluctuate with changing market conditions so that, when sold, shares may be worth more or less than their original cost. Current performance may be lower or higher than the performance data quoted. Please visit www.dws-investments.com for the Fund's most recent month-end performance.
Fund specific data and performance are provided for informational purposes only and are not intended for trading purposes.
Average Annual Total Returns as of 5/31/13 | |
| DWS Multi-Market Income Trust | | 6-Month‡ | | | 1-Year | | | 5-Year | | | 10-Year | |
Based on Net Asset Value(a) | | | 4.02 | % | | | 14.94 | % | | | 12.22 | % | | | 11.52 | % |
Based on Market Price(a) | | | 3.33 | % | | | 10.06 | % | | | 14.70 | % | | | 11.40 | % |
Credit Suisse High Yield Index(b) | | | 5.78 | % | | | 14.18 | % | | | 10.15 | % | | | 9.26 | % |
Morningstar Closed-End Multisector Bond Funds Category (based on Net Asset Value)(c) | | | 6.04 | % | | | 18.51 | % | | | 11.58 | % | | | 9.05 | % |
‡ Total returns shown for periods less than one year are not annualized.
(a) Total return based on net asset value reflects changes in the Fund's net asset value during each period. Total return based on market price reflects changes in market price. Each figure assumes that dividend and capital gain distributions, if any, were reinvested. These figures will differ depending upon the level of any discount from or premium to NAV at which the Fund's shares traded during the period. Expenses of the Fund include management fee, interest expense and other fund expenses. Total returns shown take into account these fees and expenses. The annualized expense ratio of the Fund for the six months ended May 31, 2013 was 1.68% (1.00% excluding interest expense).
(b) The Credit Suisse High Yield Index is an unmanaged, unleveraged, trader-priced portfolio constructed to mirror the global high-yield debt market. Index returns do not reflect any fees or expenses and it is not possible to invest directly into an index.
(c) Morningstar's Closed-End Multisector Bond Funds category represents multisector-bond portfolios that seek income by diversifying their assets among several fixed-income sectors, usually U.S. government obligations, U.S. corporate bonds, foreign bonds and high-yield U.S. debt securities. These portfolios typically hold 35% to 65% of bond assets in securities that are not rated or are rated by a major agency such as Standard & Poor's or Moody's at the level of BB (considered speculative for taxable bonds). Morningstar figures represent the average of the total returns based on net asset value reported by all of the closed-end funds designated by Morningstar, Inc. as falling into the Closed-End Multisector Bond Funds category. Category returns assume reinvestment of all distributions. It is not possible to invest directly in a Morningstar category.
| Net Asset Value and Market Price | |
| | | As of 5/31/13 | | | As of 11/30/12 | |
| Net Asset Value | | $ | 10.26 | | | $ | 10.29 | |
| Market Price | | $ | 10.41 | | | $ | 10.51 | |
Prices and net asset value fluctuate and are not guaranteed.
| Distribution Information | |
Six Months as of 5/31/13: Income Dividends | | $ | .46 | |
| May Income Dividend | | $ | .0700 | |
Current Annualized Distribution Rate (based on Net Asset Value) as of 5/31/13† | | | 8.19 | % |
Current Annualized Distribution Rate (based on Market Price) as of 5/31/13† | | | 8.07 | % |
† Current annualized distribution rate is the latest monthly dividend shown as an annualized percentage of net asset value/market price on May 31, 2013. Distribution rate simply measures the level of dividends and is not a complete measure of performance. Distribution rates are historical, not guaranteed and will fluctuate.
Gary Russell, CFA, Managing Director
Portfolio Manager of the fund. Joined the fund in 2006.
• Joined Deutsche Asset & Wealth Management in 1996. Served as the head of the High Yield group in Europe and as an Emerging Markets portfolio manager.
• Prior to that, four years at Citicorp as a research analyst and structurer of collateralized mortgage obligations. Prior to Citicorp, served as an officer in the US Army from 1988 to 1991.
• Head of US High Yield Bonds: New York.
• BS, United States Military Academy (West Point); MBA, New York University, Stern School of Business.
Portfolio Summary (Unaudited)
Investment Portfolio as of May 31, 2013 (Unaudited) | | | Principal Amount ($)(a) | | | Value ($) | |
| | | | |
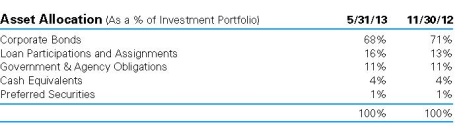
| Corporate Bonds 101.8% | |
| Consumer Discretionary 16.3% | |
| AMC Entertainment, Inc., 8.75%, 6/1/2019 | | | | 735,000 | | | | 806,662 | |
| AMC Networks, Inc., 7.75%, 7/15/2021 | | | | 130,000 | | | | 147,225 | |
| APX Group, Inc., 144A, 6.375%, 12/1/2019 | | | | 295,000 | | | | 294,262 | |
| Arcelik AS, 144A, 5.0%, 4/3/2023 | | | | 815,000 | | | | 819,075 | |
| Asbury Automotive Group, Inc.: | |
| 7.625%, 3/15/2017 | | | | 255,000 | | | | 262,334 | |
| 8.375%, 11/15/2020 | | | | 300,000 | | | | 336,000 | |
| Avis Budget Car Rental LLC: | |
| 144A, 5.5%, 4/1/2023 | | | | 290,000 | | | | 292,900 | |
| 8.25%, 1/15/2019 | | | | 365,000 | | | | 397,394 | |
| BC Mountain LLC, 144A, 7.0%, 2/1/2021 | | | | 280,000 | | | | 296,800 | |
| Block Communications, Inc., 144A, 7.25%, 2/1/2020 | | | | 580,000 | | | | 629,300 | |
| Boyd Gaming Corp., 9.0%, 7/1/2020 | | | | 215,000 | | | | 231,663 | |
| Bresnan Broadband Holdings LLC, 144A, 8.0%, 12/15/2018 | | | | 695,000 | | | | 752,337 | |
| Cablevision Systems Corp., 8.0%, 4/15/2020 | | | | 85,000 | | | | 96,263 | |
| Caesar's Entertainment Operating Co., Inc.: | |
| 8.5%, 2/15/2020 | | | | 575,000 | | | | 547,687 | |
| 11.25%, 6/1/2017 | | | | 1,075,000 | | | | 1,123,375 | |
| Carlson Wagonlit BV, 144A, 6.875%, 6/15/2019 | | | | 320,000 | | | | 336,800 | |
| CCO Holdings LLC: | |
| 5.25%, 9/30/2022 | | | | 2,035,000 | | | | 2,035,000 | |
| 5.75%, 1/15/2024 | | | | 365,000 | | | | 368,650 | |
| 6.625%, 1/31/2022 | | | | 675,000 | | | | 725,625 | |
| 7.375%, 6/1/2020 | | | | 85,000 | | | | 94,881 | |
| 8.125%, 4/30/2020 | | | | 95,000 | | | | 106,163 | |
| CDR DB Sub, Inc., 144A, 7.75%, 10/15/2020 | | | | 165,000 | | | | 172,013 | |
| Cequel Communications Holdings I LLC: | |
| 144A, 5.125%, 12/15/2021 | | | | 355,000 | | | | 348,344 | |
| 144A, 6.375%, 9/15/2020 | | | | 1,630,000 | | | | 1,703,350 | |
| 144A, 8.625%, 11/15/2017 | | | | 1,601,000 | | | | 1,708,267 | |
| Chester Downs & Marina LLC, 144A, 9.25%, 2/1/2020 | | | | 110,000 | | | | 106,700 | |
| Clear Channel Communications, Inc., 144A, 11.25%, 3/1/2021 | | | | 195,000 | | | | 211,088 | |
| Clear Channel Worldwide Holdings, Inc.: | |
| Series A, 144A, 6.5%, 11/15/2022 | | | | 355,000 | | | | 372,750 | |
| Series B, 144A, 6.5%, 11/15/2022 | | | | 525,000 | | | | 553,875 | |
| Series A, 7.625%, 3/15/2020 | | | | 85,000 | | | | 89,888 | |
| Series B, 7.625%, 3/15/2020 | | | | 865,000 | | | | 919,062 | |
| Cogeco Cable, Inc., 144A, 4.875%, 5/1/2020 | | | | 35,000 | | | | 34,913 | |
| Columbus International, Inc., 144A, 11.5%, 11/20/2014 | | | | 1,000,000 | | | | 1,112,500 | |
| Crown Media Holdings, Inc., 10.5%, 7/15/2019 | | | | 215,000 | | | | 245,100 | |
| Cumulus Media Holdings, Inc., 7.75%, 5/1/2019 | | | | 265,000 | | | | 271,625 | |
| DISH DBS Corp.: | |
| 4.625%, 7/15/2017 | | | | 1,160,000 | | | | 1,160,000 | |
| 144A, 5.0%, 5/15/2017 | | | | 375,000 | | | | 375,000 | |
| 6.75%, 6/1/2021 | | | | 110,000 | | | | 116,325 | |
| 7.125%, 2/1/2016 | | | | 345,000 | | | | 377,775 | |
| Fontainebleau Las Vegas Holdings LLC, 144A, 11.0%, 6/15/2015* | | | | 290,000 | | | | 0 | |
| Griffey Intermediate, Inc., 144A, 7.0%, 10/15/2020 | | | | 290,000 | | | | 293,625 | |
| Harron Communications LP, 144A, 9.125%, 4/1/2020 | | | | 605,000 | | | | 673,062 | |
| Hertz Corp., 144A, 4.25%, 4/1/2018 | | | | 2,160,000 | | | | 2,219,400 | |
| Jo-Ann Stores Holdings, Inc., 144A, 9.75%, 10/15/2019 (PIK) | | | | 520,000 | | | | 553,150 | |
| L Brands, Inc., 7.0%, 5/1/2020 | | | | 230,000 | | | | 268,237 | |
| Libbey Glass, Inc., 6.875%, 5/15/2020 | | | | 171,000 | | | | 185,108 | |
| Lions Gate Entertainment, Inc., 144A, 10.25%, 11/1/2016 | | | | 390,000 | | | | 420,712 | |
| LKQ Corp., 144A, 4.75%, 5/15/2023 | | | | 430,000 | | | | 428,925 | |
| MDC Partners, Inc., 144A, 6.75%, 4/1/2020 | | | | 215,000 | | | | 219,838 | |
| Mediacom Broadband LLC, 6.375%, 4/1/2023 | | | | 610,000 | | | | 634,400 | |
| Mediacom LLC: | |
| 7.25%, 2/15/2022 | | | | 165,000 | | | | 179,438 | |
| 9.125%, 8/15/2019 | | | | 530,000 | | | | 585,650 | |
| MGM Resorts International: | |
| 6.625%, 12/15/2021 | | | | 870,000 | | | | 942,862 | |
| 144A, 6.75%, 10/1/2020 | | | | 125,000 | | | | 136,250 | |
| 7.625%, 1/15/2017 | | | | 390,000 | | | | 445,087 | |
| 8.625%, 2/1/2019 | | | | 1,285,000 | | | | 1,519,512 | |
| 10.0%, 11/1/2016 | | | | 160,000 | | | | 193,400 | |
| National CineMedia LLC: | |
| 6.0%, 4/15/2022 | | | | 320,000 | | | | 343,200 | |
| 7.875%, 7/15/2021 | | | | 360,000 | | | | 403,200 | |
| Norcraft Companies LP, 10.5%, 12/15/2015 | | | | 620,000 | | | | 647,900 | |
| Palace Entertainment Holdings LLC, 144A, 8.875%, 4/15/2017 | | | | 285,000 | | | | 304,237 | |
| Petco Holdings, Inc., 144A, 8.5%, 10/15/2017 (PIK) | | | | 85,000 | | | | 87,019 | |
| Quebecor Media, Inc., 5.75%, 1/15/2023 | | | | 295,000 | | | | 302,375 | |
| Regal Entertainment Group, 5.75%, 2/1/2025 | | | | 70,000 | | | | 69,825 | |
| Rent-A-Center, Inc., 144A, 4.75%, 5/1/2021 | | | | 215,000 | | | | 210,700 | |
| SACI Falabella, 144A, 3.75%, 4/30/2023 | | | | 500,000 | | | | 478,750 | |
| Seminole Hard Rock Entertainment, Inc., 144A, 5.875%, 5/15/2021 | | | | 180,000 | | | | 178,875 | |
| Seminole Indian Tribe of Florida: | |
| 144A, 7.75%, 10/1/2017 | | | | 330,000 | | | | 352,275 | |
| 144A, 7.804%, 10/1/2020 | | | | 455,000 | | | | 493,675 | |
| SIWF Merger Sub, Inc., 144A, 6.25%, 6/1/2021 (b) | | | | 415,000 | | | | 412,925 | |
| Starz LLC, 5.0%, 9/15/2019 | | | | 230,000 | | | | 233,450 | |
| Taylor Morrison Communities, Inc., 144A, 5.25%, 4/15/2021 | | | | 360,000 | | | | 364,500 | |
| Toys "R" Us-Delaware, Inc., 144A, 7.375%, 9/1/2016 | | | | 260,000 | | | | 268,125 | |
| UCI International, Inc., 8.625%, 2/15/2019 | | | | 165,000 | | | | 170,775 | |
| Unitymedia Hessen GmbH & Co., KG: | |
| 144A, 5.5%, 1/15/2023 | | | | 1,320,000 | | | | 1,346,400 | |
| 144A, 7.5%, 3/15/2019 | | | | 300,000 | | | | 325,500 | |
| Unitymedia KabelBW GmbH, 144A, 9.625%, 12/1/2019 | EUR | | | 610,000 | | | | 883,073 | |
| Univision Communications, Inc.: | |
| 144A, 6.875%, 5/15/2019 | | | | 85,000 | | | | 90,313 | |
| 144A, 7.875%, 11/1/2020 | | | | 185,000 | | | | 202,575 | |
| 144A, 8.5%, 5/15/2021 | | | | 105,000 | | | | 113,663 | |
| UPC Holding BV, 144A, 8.375%, 8/15/2020 | EUR | | | 715,000 | | | | 1,023,275 | |
| Viking Cruises Ltd., 144A, 8.5%, 10/15/2022 | | | | 295,000 | | | | 331,875 | |
| Visant Corp., 10.0%, 10/1/2017 | | | | 305,000 | | | | 292,037 | |
| Visteon Corp., 6.75%, 4/15/2019 | | | | 244,000 | | | | 260,470 | |
| Yonkers Racing Corp., 144A, 11.375%, 7/15/2016 | | | | 240,000 | | | | 255,000 | |
| | | | | 40,923,614 | |
| Consumer Staples 3.5% | |
| Ajecorp BV, 144A, 6.5%, 5/14/2022 | | | | 850,000 | | | | 918,000 | |
| Alliance One International, Inc., 10.0%, 7/15/2016 | | | | 195,000 | | | | 204,994 | |
| B&G Foods, Inc., 4.625%, 6/1/2021 (b) | | | | 340,000 | | | | 339,150 | |
| Chiquita Brands International, Inc., 144A, 7.875%, 2/1/2021 | | | | 130,000 | | | | 139,750 | |
| Constellation Brands, Inc.: | |
| 3.75%, 5/1/2021 | | | | 360,000 | | | | 351,000 | |
| 6.0%, 5/1/2022 | | | | 150,000 | | | | 168,375 | |
| Controladora Mabe SA de CV, 144A, 7.875%, 10/28/2019 | | | | 1,000,000 | | | | 1,142,500 | |
| Del Monte Corp., 7.625%, 2/15/2019 | | | | 580,000 | | | | 601,025 | |
| FAGE Dairy Industry SA, 144A, 9.875%, 2/1/2020 | | | | 500,000 | | | | 552,500 | |
| JBS U.S.A. LLC, 144A, 8.25%, 2/1/2020 | | | | 240,000 | | | | 263,400 | |
| MHP SA, 144A, 8.25%, 4/2/2020 | | | | 1,300,000 | | | | 1,282,651 | |
| NBTY, Inc., 9.0%, 10/1/2018 | | | | 185,000 | | | | 203,500 | |
| Pilgrim's Pride Corp., 7.875%, 12/15/2018 | | | | 220,000 | | | | 239,250 | |
| Smithfield Foods, Inc.: | |
| 6.625%, 8/15/2022 | | | | 570,000 | | | | 648,375 | |
| 7.75%, 7/1/2017 | | | | 590,000 | | | | 685,875 | |
| Sun Products Corp., 144A, 7.75%, 3/15/2021 | | | | 505,000 | | | | 510,050 | |
| Tops Holding Corp., 144A, 8.875%, 12/15/2017 | | | | 145,000 | | | | 159,500 | |
| U.S. Foods, Inc., 8.5%, 6/30/2019 | | | | 290,000 | | | | 310,662 | |
| | | | | 8,720,557 | |
| Energy 15.3% | |
| Access Midstream Partners LP: | |
| 4.875%, 5/15/2023 | | | | 355,000 | | | | 350,563 | |
| 6.125%, 7/15/2022 | | | | 500,000 | | | | 535,000 | |
| Afren PLC, 144A, 10.25%, 4/8/2019 | | | | 700,000 | | | | 823,438 | |
| Arch Coal, Inc.: | |
| 7.0%, 6/15/2019 | | | | 165,000 | | | | 148,500 | |
| 7.25%, 10/1/2020 | | | | 150,000 | | | | 134,250 | |
| Berry Petroleum Co.: | |
| 6.375%, 9/15/2022 | | | | 285,000 | | | | 295,688 | |
| 6.75%, 11/1/2020 | | | | 615,000 | | | | 662,662 | |
| BreitBurn Energy Partners LP: | |
| 7.875%, 4/15/2022 | | | | 285,000 | | | | 309,225 | |
| 8.625%, 10/15/2020 | | | | 150,000 | | | | 165,000 | |
| Chaparral Energy, Inc., 7.625%, 11/15/2022 | | | | 255,000 | | | | 275,400 | |
| Chesapeake Energy Corp., 7.25%, 12/15/2018 | | | | 1,975,000 | | | | 2,276,187 | |
| Chesapeake Oilfield Operating LLC, 144A, 6.625%, 11/15/2019 | | | | 315,000 | | | | 330,750 | |
| CITGO Petroleum Corp., 144A, 11.5%, 7/1/2017 | | | | 375,000 | | | | 423,750 | |
| Cloud Peak Energy Resources LLC, 8.5%, 12/15/2019 | | | | 80,000 | | | | 88,000 | |
| Continental Resources, Inc.: | |
| 144A, 4.5%, 4/15/2023 | | | | 85,000 | | | | 85,850 | |
| 5.0%, 9/15/2022 | | | | 255,000 | | | | 263,925 | |
| 7.125%, 4/1/2021 | | | | 230,000 | | | | 258,175 | |
| 7.375%, 10/1/2020 | | | | 245,000 | | | | 276,238 | |
| Crestwood Midstream Partners LP, 7.75%, 4/1/2019 | | | | 445,000 | | | | 475,038 | |
| Crosstex Energy LP, 7.125%, 6/1/2022 | | | | 155,000 | | | | 165,850 | |
| Denbury Resources, Inc., 4.625%, 7/15/2023 | | | | 695,000 | | | | 672,412 | |
| Dresser-Rand Group, Inc., 6.5%, 5/1/2021 | | | | 585,000 | | | | 633,262 | |
| Eagle Rock Energy Partners LP, 8.375%, 6/1/2019 | | | | 115,000 | | | | 120,463 | |
| El Paso LLC, 7.25%, 6/1/2018 | | | | 405,000 | | | | 470,228 | |
| EP Energy LLC: | |
| 6.875%, 5/1/2019 | | | | 520,000 | | | | 561,600 | |
| 7.75%, 9/1/2022 | | | | 125,000 | | | | 139,375 | |
| 9.375%, 5/1/2020 | | | | 120,000 | | | | 136,050 | |
| EPE Holdings LLC, 144A, 8.125%, 12/15/2017 (PIK) | | | | 635,000 | | | | 677,862 | |
| EV Energy Partners LP, 8.0%, 4/15/2019 | | | | 1,280,000 | | | | 1,315,200 | |
| Frontier Oil Corp., 6.875%, 11/15/2018 | | | | 270,000 | | | | 292,950 | |
| Global Geophysical Services, Inc., 10.5%, 5/1/2017 | | | | 330,000 | | | | 295,350 | |
| Halcon Resources Corp.: | |
| 8.875%, 5/15/2021 | | | | 565,000 | | | | 574,888 | |
| 9.75%, 7/15/2020 | | | | 230,000 | | | | 238,913 | |
| Holly Energy Partners LP: | |
| 6.5%, 3/1/2020 | | | | 165,000 | | | | 175,313 | |
| 8.25%, 3/15/2018 | | | | 410,000 | | | | 441,775 | |
| HollyFrontier Corp., 9.875%, 6/15/2017 | | | | 620,000 | | | | 651,744 | |
| KazMunayGas National Co. JSC, 144A, 5.75%, 4/30/2043 | | | | 200,000 | | | | 191,000 | |
| Kodiak Oil & Gas Corp., 144A, 5.5%, 1/15/2021 | | | | 350,000 | | | | 363,125 | |
| Linn Energy LLC: | |
| 144A, 6.25%, 11/1/2019 | | | | 855,000 | | | | 861,412 | |
| 6.5%, 5/15/2019 | | | | 1,775,000 | | | | 1,806,062 | |
| MEG Energy Corp.: | |
| 144A, 6.375%, 1/30/2023 | | | | 1,175,000 | | | | 1,204,375 | |
| 144A, 6.5%, 3/15/2021 | | | | 325,000 | | | | 336,375 | |
| Memorial Production Partners LP, 144A, 7.625%, 5/1/2021 | | | | 505,000 | | | | 507,525 | |
| Midstates Petroleum Co., Inc.: | |
| 144A, 9.25%, 6/1/2021 | | | | 670,000 | | | | 666,650 | |
| 144A, 10.75%, 10/1/2020 | | | | 165,000 | | | | 176,550 | |
| Murray Energy Corp., 144A, 8.625%, 6/15/2021 | | | | 70,000 | | | | 72,100 | |
| Newfield Exploration Co., 5.75%, 1/30/2022 | | | | 305,000 | | | | 326,350 | |
| Northern Oil & Gas, Inc., 8.0%, 6/1/2020 | | | | 875,000 | | | | 910,000 | |
| Oasis Petroleum, Inc.: | |
| 6.5%, 11/1/2021 | | | | 240,000 | | | | 259,200 | |
| 6.875%, 1/15/2023 | | | | 175,000 | | | | 190,750 | |
| 7.25%, 2/1/2019 | | | | 750,000 | | | | 808,125 | |
| Odebrecht Drilling Norbe VIII/IX Ltd., 144A, 6.35%, 6/30/2021 | | | | 1,900,000 | | | | 2,048,200 | |
| Offshore Group Investment Ltd.: | |
| 144A, 7.125%, 4/1/2023 | | | | 580,000 | | | | 598,850 | |
| 7.5%, 11/1/2019 | | | | 420,000 | | | | 453,600 | |
| Pacific Drilling SA, 144A, 5.375%, 6/1/2020 (b) | | | | 340,000 | | | | 336,600 | |
| Plains Exploration & Production Co.: | |
| 6.125%, 6/15/2019 | | | | 345,000 | | | | 378,638 | |
| 6.75%, 2/1/2022 | | | | 760,000 | | | | 849,300 | |
| 6.875%, 2/15/2023 | | | | 740,000 | | | | 837,125 | |
| Quicksilver Resources, Inc., 11.75%, 1/1/2016 | | | | 565,000 | | | | 598,900 | |
| Range Resources Corp., 144A, 5.0%, 3/15/2023 | | | | 140,000 | | | | 141,400 | |
| Regency Energy Partners LP, 144A, 4.5%, 11/1/2023 | | | | 145,000 | | | | 143,550 | |
| Reliance Holdings U.S.A., Inc., 144A, 5.4%, 2/14/2022 | | | | 1,250,000 | | | | 1,366,775 | |
| Sabine Pass Liquefaction LLC: | |
| 144A, 5.625%, 2/1/2021 | | | | 980,000 | | | | 983,675 | |
| 144A, 5.625%, 4/15/2023 | | | | 220,000 | | | | 220,000 | |
| Sabine Pass LNG LP, 7.5%, 11/30/2016 | | | | 145,000 | | | | 161,675 | |
| SandRidge Energy, Inc., 7.5%, 3/15/2021 | | | | 720,000 | | | | 741,600 | |
| SESI LLC: | |
| 6.375%, 5/1/2019 | | | | 335,000 | | | | 361,800 | |
| 7.125%, 12/15/2021 | | | | 1,050,000 | | | | 1,178,625 | |
| Swift Energy Co., 7.875%, 3/1/2022 | | | | 410,000 | | | | 428,450 | |
| Talos Production LLC, 144A, 9.75%, 2/15/2018 | | | | 545,000 | | | | 545,000 | |
| Tesoro Corp., 5.375%, 10/1/2022 | | | | 215,000 | | | | 225,750 | |
| Venoco, Inc., 8.875%, 2/15/2019 | | | | 410,000 | | | | 410,000 | |
| WPX Energy, Inc., 5.25%, 1/15/2017 | | | | 955,000 | | | | 1,014,687 | |
| | | | | 38,444,673 | |
| Financials 16.9% | |
| Abengoa Finance SAU, 144A, 8.875%, 11/1/2017 | | | | 130,000 | | | | 124,800 | |
| AerCap Aviation Solutions BV, 6.375%, 5/30/2017 | | | | 1,040,000 | | | | 1,125,800 | |
| Akbank TAS, 144A, 5.125%, 7/22/2015 | | | | 480,000 | | | | 504,000 | |
| Ally Financial, Inc.: | |
| 6.25%, 12/1/2017 | | | | 740,000 | | | | 814,406 | |
| 8.0%, 3/15/2020 | | | | 870,000 | | | | 1,035,300 | |
| Alphabet Holding Co., Inc., 144A, 7.75%, 11/1/2017 (PIK) | | | | 145,000 | | | | 149,713 | |
| Altice Financing SA, 144A, 7.875%, 12/15/2019 | | | | 335,000 | | | | 370,594 | |
| AmeriGas Finance LLC: | |
| 6.75%, 5/20/2020 | | | | 165,000 | | | | 179,850 | |
| 7.0%, 5/20/2022 | | | | 165,000 | | | | 179,025 | |
| Antero Resources Finance Corp., 7.25%, 8/1/2019 | | | | 415,000 | | | | 448,200 | |
| Ashtead Capital, Inc., 144A, 6.5%, 7/15/2022 | | | | 455,000 | | | | 491,400 | |
| Ashton Woods U.S.A. LLC, 144A, 6.875%, 2/15/2021 | | | | 465,000 | | | | 481,856 | |
| AWAS Aviation Capital Ltd., 144A, 7.0%, 10/17/2016 | | | | 604,200 | | | | 632,899 | |
| Banco Bradesco SA, 144A, 5.75%, 3/1/2022 | | | | 1,420,000 | | | | 1,490,290 | |
| Banco Santander Brasil SA, 144A, 8.0%, 3/18/2016 | BRL | | | 1,000,000 | | | | 462,695 | |
| BOE Merger Corp., 144A, 9.5%, 11/1/2017 (PIK) | | | | 295,000 | | | | 307,538 | |
| Braskem America Finance Co., 144A, 7.125%, 7/22/2041 | | | | 1,000,000 | | | | 1,010,000 | |
| Caesar's Operating Escrow LLC, 144A, 9.0%, 2/15/2020 | | | | 365,000 | | | | 351,313 | |
| Case New Holland, Inc., 7.875%, 12/1/2017 | | | | 830,000 | | | | 975,250 | |
| CIT Group, Inc., 4.25%, 8/15/2017 | | | | 1,850,000 | | | | 1,905,500 | |
| CNH Capital LLC, 144A, 3.625%, 4/15/2018 | | | | 575,000 | | | | 579,312 | |
| E*TRADE Financial Corp.: | |
| 6.0%, 11/15/2017 | | | | 1,927,000 | | | | 2,008,897 | |
| 6.375%, 11/15/2019 | | | | 1,002,000 | | | | 1,052,100 | |
| 6.75%, 6/1/2016 | | | | 520,000 | | | | 556,400 | |
| Fibria Overseas Finance Ltd., 144A, 6.75%, 3/3/2021 | | | | 160,000 | | | | 175,200 | |
| Ford Motor Credit Co., LLC, 5.875%, 8/2/2021 | | | | 430,000 | | | | 489,798 | |
| Fresenius Medical Care U.S. Finance II, Inc.: | |
| 144A, 5.625%, 7/31/2019 | | | | 330,000 | | | | 362,175 | |
| 144A, 5.875%, 1/31/2022 | | | | 285,000 | | | | 319,200 | |
| Fresenius Medical Care U.S. Finance, Inc.: | |
| 144A, 5.75%, 2/15/2021 | | | | 255,000 | | | | 283,688 | |
| 144A, 6.5%, 9/15/2018 | | | | 170,000 | | | | 193,800 | |
| General Motors Financial Co., Inc., 144A, 3.25%, 5/15/2018 | | | | 145,000 | | | | 143,731 | |
| Hellas Telecommunications Finance SCA, 144A, 8.21%**, 7/15/2015 (PIK)* | EUR | | | 278,431 | | | | 0 | |
| Hexion U.S. Finance Corp.: | |
| 6.625%, 4/15/2020 | | | | 145,000 | | | | 150,800 | |
| 8.875%, 2/1/2018 | | | | 595,000 | | | | 621,031 | |
| International Lease Finance Corp.: | |
| 3.875%, 4/15/2018 | | | | 1,060,000 | | | | 1,061,325 | |
| 4.625%, 4/15/2021 | | | | 500,000 | | | | 496,250 | |
| 6.25%, 5/15/2019 | | | | 465,000 | | | | 508,012 | |
| 8.625%, 1/15/2022 | | | | 460,000 | | | | 573,850 | |
| Kinder Morgan Finance Co., LLC, 144A, 6.0%, 1/15/2018 | | | | 610,000 | | | | 673,409 | |
| Level 3 Financing, Inc.: | |
| 7.0%, 6/1/2020 | | | | 550,000 | | | | 573,375 | |
| 8.125%, 7/1/2019 | | | | 290,000 | | | | 313,925 | |
| 8.625%, 7/15/2020 | | | | 240,000 | | | | 264,000 | |
| Metalloinvest Finance Ltd., 144A, 6.5%, 7/21/2016 | | | | 1,000,000 | | | | 1,053,750 | |
| MPT Operating Partnership LP: | |
| (REIT), 6.375%, 2/15/2022 | | | | 270,000 | | | | 295,650 | |
| (REIT), 6.875%, 5/1/2021 | | | | 415,000 | | | | 458,575 | |
| National Money Mart Co., 10.375%, 12/15/2016 | | | | 450,000 | | | | 482,062 | |
| Neuberger Berman Group LLC: | |
| 144A, 5.625%, 3/15/2020 | | | | 245,000 | | | | 259,700 | |
| 144A, 5.875%, 3/15/2022 | | | | 405,000 | | | | 431,325 | |
| Nielsen Finance LLC, 144A, 4.5%, 10/1/2020 | | | | 70,000 | | | | 70,175 | |
| NII Capital Corp., 7.625%, 4/1/2021 | | | | 220,000 | | | | 183,150 | |
| Odebrecht Finance Ltd., 144A, 7.125%, 6/26/2042 | | | | 1,000,000 | | | | 1,070,000 | |
| Qtel International Finance Ltd., 144A, 3.25%, 2/21/2023 | | | | 1,000,000 | | | | 951,250 | |
| Reynolds Group Issuer, Inc.: | |
| 5.75%, 10/15/2020 | | | | 575,000 | | | | 583,625 | |
| 6.875%, 2/15/2021 | | | | 760,000 | | | | 811,300 | |
| 7.125%, 4/15/2019 | | | | 2,230,000 | | | | 2,374,950 | |
| 8.25%, 2/15/2021 | | | | 155,000 | | | | 158,100 | |
| 8.5%, 5/15/2018 | | | | 100,000 | | | | 105,000 | |
| 9.875%, 8/15/2019 | | | | 100,000 | | | | 109,000 | |
| Schaeffler Finance BV: | |
| 144A, 4.75%, 5/15/2021 | | | | 390,000 | | | | 383,175 | |
| 144A, 7.75%, 2/15/2017 | | | | 610,000 | | | | 686,250 | |
| Serta Simmons Holdings LLC, 144A, 8.125%, 10/1/2020 | | | | 165,000 | | | | 174,488 | |
| Sky Growth Acquisition Corp., 144A, 7.375%, 10/15/2020 | | | | 250,000 | | | | 265,625 | |
| Toys "R" Us Property Co. I, LLC, 10.75%, 7/15/2017 | | | | 360,000 | | | | 381,600 | |
| Tronox Finance LLC, 144A, 6.375%, 8/15/2020 | | | | 365,000 | | | | 358,613 | |
| Turkiye Halk Bankasi AS, 144A, 4.875%, 7/19/2017 | | | | 1,000,000 | | | | 1,046,870 | |
| U.S. Coatings Acquisition, Inc., 144A, 7.375%, 5/1/2021 | | | | 175,000 | | | | 184,625 | |
| UPCB Finance III Ltd., 144A, 6.625%, 7/1/2020 | | | | 2,115,000 | | | | 2,252,475 | |
| UPCB Finance V Ltd., 144A, 7.25%, 11/15/2021 | | | | 320,000 | | | | 352,800 | |
| UPCB Finance VI Ltd., 144A, 6.875%, 1/15/2022 | | | | 330,000 | | | | 356,400 | |
| Vale Overseas Ltd., 6.875%, 11/10/2039 | | | | 1,200,000 | | | | 1,292,414 | |
| Wind Acquisition Finance SA: | |
| 144A, 6.5%, 4/30/2020 | | | | 290,000 | | | | 297,975 | |
| 144A, 7.25%, 2/15/2018 | | | | 365,000 | | | | 380,513 | |
| WMG Acquisition Corp., 144A, 6.0%, 1/15/2021 | | | | 131,000 | | | | 138,205 | |
| | | | | 42,390,347 | |
| Health Care 6.6% | |
| Aviv Healthcare Properties LP, 7.75%, 2/15/2019 | | | | 730,000 | | | | 797,525 | |
| Biomet, Inc.: | |
| 144A, 6.5%, 8/1/2020 | | | | 500,000 | | | | 526,250 | |
| 144A, 6.5%, 10/1/2020 | | | | 145,000 | | | | 146,813 | |
| Community Health Systems, Inc.: | |
| 5.125%, 8/15/2018 | | | | 2,405,000 | | | | 2,507,212 | |
| 7.125%, 7/15/2020 | | | | 2,715,000 | | | | 2,979,712 | |
| HCA Holdings, Inc., 7.75%, 5/15/2021 | | | | 805,000 | | | | 889,525 | |
| HCA, Inc.: | |
| 5.875%, 3/15/2022 | | | | 415,000 | | | | 455,463 | |
| 6.5%, 2/15/2020 | | | | 2,865,000 | | | | 3,230,287 | |
| 7.5%, 2/15/2022 | | | | 1,245,000 | | | | 1,450,425 | |
| Hologic, Inc., 6.25%, 8/1/2020 | | | | 300,000 | | | | 320,625 | |
| IMS Health, Inc., 144A, 6.0%, 11/1/2020 | | | | 365,000 | | | | 385,988 | |
| Physio-Control International, Inc., 144A, 9.875%, 1/15/2019 | | | | 240,000 | | | | 271,200 | |
| STHI Holding Corp., 144A, 8.0%, 3/15/2018 | | | | 240,000 | | | | 261,600 | |
| Tenet Healthcare Corp.: | |
| 144A, 4.375%, 10/1/2021 | | | | 550,000 | | | | 533,500 | |
| 144A, 4.5%, 4/1/2021 | | | | 70,000 | | | | 68,775 | |
| 6.25%, 11/1/2018 | | | | 1,550,000 | | | | 1,716,625 | |
| | | | | 16,541,525 | |
| Industrials 8.7% | |
| Accuride Corp., 9.5%, 8/1/2018 | | | | 235,000 | | | | 244,988 | |
| Aguila 3 SA, 144A, 7.875%, 1/31/2018 | | | | 685,000 | | | | 737,231 | |
| Air Lease Corp.: | |
| 4.75%, 3/1/2020 | | | | 415,000 | | | | 421,225 | |
| 6.125%, 4/1/2017 | | | | 685,000 | | | | 738,087 | |
| BE Aerospace, Inc., 6.875%, 10/1/2020 | | | | 235,000 | | | | 257,912 | |
| Belden, Inc., 144A, 5.5%, 9/1/2022 | | | | 505,000 | | | | 518,887 | |
| Bombardier, Inc.: | |
| 144A, 5.75%, 3/15/2022 | | | | 650,000 | | | | 676,000 | |
| 144A, 7.75%, 3/15/2020 | | | | 1,700,000 | | | | 1,989,000 | |
| Casella Waste Systems, Inc., 7.75%, 2/15/2019 | | | | 785,000 | | | | 753,600 | |
| Clean Harbors, Inc., 5.125%, 6/1/2021 | | | | 375,000 | | | | 386,250 | |
| DigitalGlobe, Inc., 144A, 5.25%, 2/1/2021 | | | | 210,000 | | | | 211,575 | |
| Ducommun, Inc., 9.75%, 7/15/2018 | | | | 250,000 | | | | 277,500 | |
| DynCorp International, Inc., 10.375%, 7/1/2017 | | | | 635,000 | | | | 650,875 | |
| Ferreycorp SAA, 144A, 4.875%, 4/26/2020 | | | | 1,300,000 | | | | 1,288,950 | |
| Florida East Coast Railway Corp., 8.125%, 2/1/2017 | | | | 155,000 | | | | 165,075 | |
| FTI Consulting, Inc.: | |
| 144A, 6.0%, 11/15/2022 | | | | 295,000 | | | | 311,962 | |
| 6.75%, 10/1/2020 | | | | 1,095,000 | | | | 1,171,650 | |
| Garda World Security Corp., 144A, 9.75%, 3/15/2017 | | | | 235,000 | | | | 252,038 | |
| GenCorp, Inc., 144A, 7.125%, 3/15/2021 | | | | 1,040,000 | | | | 1,112,800 | |
| Georgian Railway JSC, 144A, 7.75%, 7/11/2022 | | | | 1,800,000 | | | | 2,088,000 | |
| Grupo KUO SAB de CV, 144A, 6.25%, 12/4/2022 | | | | 400,000 | | | | 422,000 | |
| Huntington Ingalls Industries, Inc., 7.125%, 3/15/2021 | | | | 85,000 | | | | 93,288 | |
| Interline Brands, Inc., 7.5%, 11/15/2018 | | | | 395,000 | | | | 422,650 | |
| Iron Mountain, Inc., 5.75%, 8/15/2024 | | | | 350,000 | | | | 354,375 | |
| Kenan Advantage Group, Inc., 144A, 8.375%, 12/15/2018 | | | | 575,000 | | | | 615,250 | |
| Meritor, Inc.: | |
| 6.75%, 6/15/2021 | | | | 260,000 | | | | 256,750 | |
| 10.625%, 3/15/2018 | | | | 225,000 | | | | 246,656 | |
| Navios Maritime Holdings, Inc.: | |
| 8.125%, 2/15/2019 | | | | 290,000 | | | | 282,025 | |
| 8.875%, 11/1/2017 | | | | 175,000 | | | | 184,188 | |
| Navios South American Logistics, Inc.: | |
| 144A, 9.25%, 4/15/2019 | | | | 40,000 | | | | 43,500 | |
| 9.25%, 4/15/2019 | | | | 205,000 | | | | 222,938 | |
| Nortek, Inc., 8.5%, 4/15/2021 | | | | 315,000 | | | | 344,925 | |
| Ply Gem Industries, Inc., 9.375%, 4/15/2017 | | | | 72,000 | | | | 78,480 | |
| Rexel SA, 144A, 5.25%, 6/15/2020 | | | | 390,000 | | | | 397,800 | |
| Spirit AeroSystems, Inc., 6.75%, 12/15/2020 | | | | 330,000 | | | | 353,100 | |
| Titan International, Inc.: | |
| 7.875%, 10/1/2017 | | | | 685,000 | | | | 732,950 | |
| 144A, 7.875%, 10/1/2017 | | | | 190,000 | | | | 203,300 | |
| TransDigm, Inc., 7.75%, 12/15/2018 | | | | 500,000 | | | | 545,625 | |
| U.S. Airways Group, Inc., 6.125%, 6/1/2018 | | | | 340,000 | | | | 331,075 | |
| United Rentals North America, Inc.: | |
| 6.125%, 6/15/2023 | | | | 35,000 | | | | 36,663 | |
| 7.375%, 5/15/2020 | | | | 455,000 | | | | 499,362 | |
| 7.625%, 4/15/2022 | | | | 455,000 | | | | 503,912 | |
| Watco Companies LLC, 144A, 6.375%, 4/1/2023 | | | | 220,000 | | | | 231,550 | |
| Welltec A/S, 144A, 8.0%, 2/1/2019 | | | | 200,000 | | | | 216,000 | |
| | | | | 21,871,967 | |
| Information Technology 3.5% | |
| Alliance Data Systems Corp., 144A, 5.25%, 12/1/2017 | | | | 370,000 | | | | 387,575 | |
| CDW LLC, 8.5%, 4/1/2019 | | | | 625,000 | | | | 691,406 | |
| CyrusOne LP, 144A, 6.375%, 11/15/2022 | | | | 145,000 | | | | 154,788 | |
| eAccess Ltd., 144A, 8.25%, 4/1/2018 | | | | 235,000 | | | | 260,263 | |
| EarthLink, Inc., 144A, 7.375%, 6/1/2020 | | | | 345,000 | | | | 339,825 | |
| Equinix, Inc.: | |
| 4.875%, 4/1/2020 | | | | 375,000 | | | | 381,562 | |
| 5.375%, 4/1/2023 | | | | 995,000 | | | | 1,027,337 | |
| 7.0%, 7/15/2021 | | | | 335,000 | | | | 372,688 | |
| First Data Corp.: | |
| 144A, 6.75%, 11/1/2020 | | | | 1,010,000 | | | | 1,055,450 | |
| 144A, 7.375%, 6/15/2019 | | | | 365,000 | | | | 385,075 | |
| 144A, 8.875%, 8/15/2020 | | | | 635,000 | | | | 701,675 | |
| 144A, 10.625%, 6/15/2021 | | | | 290,000 | | | | 291,450 | |
| 144A, 11.25%, 1/15/2021 | | | | 190,000 | | | | 194,275 | |
| Hughes Satellite Systems Corp.: | |
| 6.5%, 6/15/2019 | | | | 700,000 | | | | 764,750 | |
| 7.625%, 6/15/2021 | | | | 335,000 | | | | 374,362 | |
| IAC/InterActiveCorp., 144A, 4.75%, 12/15/2022 | | | | 285,000 | | | | 280,013 | |
| Jabil Circuit, Inc., 5.625%, 12/15/2020 | | | | 400,000 | | | | 431,000 | |
| NXP BV, 144A, 3.75%, 6/1/2018 | | | | 540,000 | | | | 531,900 | |
| VeriSign, Inc., 144A, 4.625%, 5/1/2023 | | | | 285,000 | | | | 286,425 | |
| | | | | 8,911,819 | |
| Materials 10.0% | |
| APERAM: | |
| 144A, 7.375%, 4/1/2016 | | | | 150,000 | | | | 151,125 | |
| 144A, 7.75%, 4/1/2018 | | | | 155,000 | | | | 154,225 | |
| Axiall Corp., 144A, 4.875%, 5/15/2023 | | | | 85,000 | | | | 85,425 | |
| Berry Plastics Corp.: | |
| 9.5%, 5/15/2018 | | | | 235,000 | | | | 257,325 | |
| 9.75%, 1/15/2021 | | | | 305,000 | | | | 352,275 | |
| Bluescope Steel Ltd., 144A, 7.125%, 5/1/2018 | | | | 215,000 | | | | 223,063 | |
| BOE Intermediate Holding Corp., 144A, 9.0%, 11/1/2017 (PIK) | | | | 430,000 | | | | 423,550 | |
| Cemex SAB de CV, 144A, 9.5%, 6/15/2018 | | | | 1,300,000 | | | | 1,452,750 | |
| Clearwater Paper Corp., 7.125%, 11/1/2018 | | | | 515,000 | | | | 557,487 | |
| Compass Minerals International, Inc., 8.0%, 6/1/2019 | | | | 325,000 | | | | 352,625 | |
| Crown Americas LLC, 6.25%, 2/1/2021 | | | | 70,000 | | | | 76,475 | |
| Eagle Spinco, Inc., 144A, 4.625%, 2/15/2021 | | | | 175,000 | | | | 176,313 | |
| Essar Steel Algoma, Inc.: | |
| 144A, 9.375%, 3/15/2015 | | | | 1,620,000 | | | | 1,506,600 | |
| 144A, 9.875%, 6/15/2015 | | | | 150,000 | | | | 115,500 | |
| Exopack Holding Corp., 10.0%, 6/1/2018 | | | | 335,000 | | | | 350,913 | |
| FMG Resources (August 2006) Pty Ltd.: | |
| 144A, 6.0%, 4/1/2017 | | | | 490,000 | | | | 496,125 | |
| 144A, 6.875%, 4/1/2022 | | | | 350,000 | | | | 353,500 | |
| 144A, 7.0%, 11/1/2015 | | | | 515,000 | | | | 530,450 | |
| 144A, 8.25%, 11/1/2019 | | | | 410,000 | | | | 432,550 | |
| Greif, Inc., 7.75%, 8/1/2019 | | | | 870,000 | | | | 1,026,600 | |
| Huntsman International LLC: | |
| 4.875%, 11/15/2020 | | | | 330,000 | | | | 333,300 | |
| 8.625%, 3/15/2020 | | | | 455,000 | | | | 502,775 | |
| 8.625%, 3/15/2021 | | | | 185,000 | �� | | | 206,738 | |
| IAMGOLD Corp., 144A, 6.75%, 10/1/2020 | | | | 435,000 | | | | 398,025 | |
| Inmet Mining Corp.: | |
| 144A, 7.5%, 6/1/2021 | | | | 810,000 | | | | 824,175 | |
| 144A, 8.75%, 6/1/2020 | | | | 475,000 | | | | 511,812 | |
| Inversiones CMPC SA, 144A, 4.375%, 5/15/2023 | | | | 500,000 | | | | 490,696 | |
| Kaiser Aluminum Corp., 8.25%, 6/1/2020 | | | | 395,000 | | | | 445,362 | |
| KGHM International Ltd., 144A, 7.75%, 6/15/2019 | | | | 900,000 | | | | 940,500 | |
| Novelis, Inc., 8.75%, 12/15/2020 | | | | 1,820,000 | | | | 2,033,850 | |
| OI European Group BV, 144A, 6.75%, 9/15/2020 | EUR | | | 255,000 | | | | 383,704 | |
| Packaging Dynamics Corp., 144A, 8.75%, 2/1/2016 | | | | 370,000 | | | | 387,113 | |
| Perstorp Holding AB, 144A, 8.75%, 5/15/2017 | | | | 400,000 | | | | 413,000 | |
| Polymer Group, Inc., 7.75%, 2/1/2019 | | | | 415,000 | | | | 447,162 | |
| PolyOne Corp., 144A, 5.25%, 3/15/2023 | | | | 820,000 | | | | 842,550 | |
| Polyus Gold International Ltd., 144A, 5.625%, 4/29/2020 | | | | 1,800,000 | | | | 1,836,000 | |
| Rain CII Carbon LLC: | |
| 144A, 8.0%, 12/1/2018 | | | | 370,000 | | | | 392,200 | |
| 144A, 8.25%, 1/15/2021 | | | | 225,000 | | | | 240,750 | |
| Samarco Mineracao SA, 144A, 4.125%, 11/1/2022 | | | | 1,200,000 | | | | 1,131,000 | |
| Sealed Air Corp., 144A, 5.25%, 4/1/2023 | | | | 70,000 | | | | 70,700 | |
| Turkiye Sise ve Cam Fabrikalari AS, 144A, 4.25%, 5/9/2020 | | | | 1,000,000 | | | | 981,250 | |
| Viskase Companies, Inc., 144A, 9.875%, 1/15/2018 | | | | 545,000 | | | | 581,787 | |
| Volcan Cia Minera SAA, 144A, 5.375%, 2/2/2022 | | | | 1,565,000 | | | | 1,596,300 | |
| Wolverine Tube, Inc., 6.0%, 6/28/2014 (PIK) | | | | 14,673 | | | | 14,673 | |
| | | | | 25,080,298 | |
| Telecommunication Services 15.5% | |
| Altice Finco SA, 144A, 9.875%, 12/15/2020 | | | | 335,000 | | | | 380,225 | |
| CenturyLink, Inc., Series V, 5.625%, 4/1/2020 | | | | 145,000 | | | | 149,894 | |
| Cincinnati Bell, Inc.: | |
| 8.375%, 10/15/2020 | | | | 1,360,000 | | | | 1,445,000 | |
| 8.75%, 3/15/2018 | | | | 1,185,000 | | | | 1,214,625 | |
| Colombia Telecomunicaciones SA ESP, 144A, 5.375%, 9/27/2022 | | | | 1,500,000 | | | | 1,473,750 | |
| CPI International, Inc., 8.0%, 2/15/2018 | | | | 180,000 | | | | 190,350 | |
| Cricket Communications, Inc., 7.75%, 10/15/2020 | | | | 2,140,000 | | | | 2,134,650 | |
| Crown Castle International Corp., 7.125%, 11/1/2019 | | | | 325,000 | | | | 352,625 | |
| Digicel Group Ltd.: | |
| 144A, 8.25%, 9/30/2020 | | | | 625,000 | | | | 665,625 | |
| 144A, 10.5%, 4/15/2018 | | | | 320,000 | | | | 347,488 | |
| Digicel Ltd.: | |
| 144A, 7.0%, 2/15/2020 | | | | 200,000 | | | | 207,500 | |
| 144A, 8.25%, 9/1/2017 | | | | 2,015,000 | | | | 2,095,600 | |
| ERC Ireland Preferred Equity Ltd., 144A, 7.69%**, 2/15/2017 (PIK)* | EUR | | | 281,038 | | | | 0 | |
| Frontier Communications Corp.: | |
| 7.125%, 1/15/2023 | | | | 1,925,000 | | | | 2,011,625 | |
| 7.625%, 4/15/2024 | | | | 155,000 | | | | 162,362 | |
| 8.25%, 4/15/2017 | | | | 441,000 | | | | 513,765 | |
| 8.5%, 4/15/2020 | | | | 665,000 | | | | 761,425 | |
| 8.75%, 4/15/2022 | | | | 85,000 | | | | 95,838 | |
| Intelsat Jackson Holdings SA: | |
| 144A, 5.5%, 8/1/2023 (b) | | | | 870,000 | | | | 852,600 | |
| 144A, 6.625%, 12/15/2022 (b) | | | | 340,000 | | | | 354,025 | |
| 7.25%, 10/15/2020 | | | | 1,625,000 | | | | 1,763,125 | |
| 7.5%, 4/1/2021 | | | | 1,605,000 | | | | 1,763,494 | |
| 8.5%, 11/1/2019 | | | | 835,000 | | | | 916,412 | |
| Intelsat Luxembourg SA: | |
| 144A, 7.75%, 6/1/2021 | | | | 945,000 | | | | 993,431 | |
| 144A, 8.125%, 6/1/2023 | | | | 145,000 | | | | 155,150 | |
| 11.25%, 2/4/2017 | | | | 820,000 | | | | 867,560 | |
| Level 3 Communications, Inc., 8.875%, 6/1/2019 | | | | 45,000 | | | | 48,825 | |
| Lynx I Corp., 144A, 5.375%, 4/15/2021 | | | | 200,000 | | | | 208,000 | |
| MetroPCS Wireless, Inc.: | |
| 6.625%, 11/15/2020 | | | | 600,000 | | | | 642,000 | |
| 144A, 6.625%, 4/1/2023 | | | | 360,000 | | | | 380,700 | |
| 7.875%, 9/1/2018 | | | | 580,000 | | | | 632,200 | |
| Millicom International Cellular SA, 144A, 4.75%, 5/22/2020 | | | | 800,000 | | | | 790,000 | |
| Pacnet Ltd., 144A, 9.25%, 11/9/2015 | | | | 512,000 | | | | 529,920 | |
| SBA Communications Corp., 144A, 5.625%, 10/1/2019 | | | | 285,000 | | | | 293,550 | |
| SBA Telecommunications, Inc., 8.25%, 8/15/2019 | | | | 97,000 | | | | 106,215 | |
| Sprint Nextel Corp.: | |
| 6.0%, 12/1/2016 | | | | 2,950,000 | | | | 3,186,000 | |
| 6.0%, 11/15/2022 | | | | 495,000 | | | | 509,850 | |
| 9.125%, 3/1/2017 | | | | 235,000 | | | | 274,950 | |
| Syniverse Holdings, Inc., 9.125%, 1/15/2019 | | | | 90,000 | | | | 98,325 | |
| Telemar Norte Leste SA, 144A, 5.5%, 10/23/2020 | | | | 1,300,000 | | | | 1,300,000 | |
| Telesat Canada, 144A, 6.0%, 5/15/2017 | | | | 3,330,000 | | | | 3,479,850 | |
| tw telecom holdings, Inc., 5.375%, 10/1/2022 | | | | 400,000 | | | | 414,000 | |
| Windstream Corp.: | |
| 6.375%, 8/1/2023 | | | | 350,000 | | | | 345,625 | |
| 7.0%, 3/15/2019 | | | | 340,000 | | | | 346,800 | |
| 7.5%, 6/1/2022 | | | | 240,000 | | | | 254,400 | |
| 7.5%, 4/1/2023 | | | | 590,000 | | | | 619,500 | |
| 7.75%, 10/15/2020 | | | | 250,000 | | | | 266,875 | |
| 7.75%, 10/1/2021 | | | | 490,000 | | | | 526,750 | |
| 7.875%, 11/1/2017 | | | | 1,155,000 | | | | 1,328,250 | |
| 8.125%, 9/1/2018 | | | | 535,000 | | | | 580,475 | |
| | | | | 39,031,204 | |
| Utilities 5.5% | |
| AES Corp.: | |
| 4.875%, 5/15/2023 | | | | 145,000 | | | | 142,463 | |
| 8.0%, 10/15/2017 | | | | 255,000 | | | | 298,988 | |
| 8.0%, 6/1/2020 | | | | 375,000 | | | | 450,000 | |
| Calpine Corp.: | |
| 144A, 7.5%, 2/15/2021 | | | | 576,000 | | | | 624,960 | |
| 144A, 7.875%, 7/31/2020 | | | | 639,000 | | | | 702,900 | |
| Centrais Eletricas Brasileiras SA, 144A, 6.875%, 7/30/2019 | | | | 2,545,000 | | | | 2,844,035 | |
| DPL, Inc., 6.5%, 10/15/2016 | | | | 1,885,000 | | | | 2,031,087 | |
| Energy Future Holdings Corp., Series Q, 6.5%, 11/15/2024 | | | | 400,000 | | | | 292,000 | |
| Energy Future Intermediate Holding Co., LLC: | |
| 10.0%, 12/1/2020 | | | | 100,000 | | | | 113,875 | |
| 11.0%, 10/1/2021 | | | | 770,000 | | | | 850,850 | |
| Instituto Costarricense de Electricidad, 144A, 6.95%, 11/10/2021 | | | | 1,500,000 | | | | 1,665,000 | |
| IPALCO Enterprises, Inc., 5.0%, 5/1/2018 | | | | 662,392 | | | | 712,072 | |
| Mexico Generadora de Energia S de rl, 144A, 5.5%, 12/6/2032 | | | | 1,300,000 | | | | 1,306,110 | |
| NRG Energy, Inc.: | |
| 7.625%, 1/15/2018 | | | | 285,000 | | | | 321,337 | |
| 8.25%, 9/1/2020 | | | | 90,000 | | | | 100,913 | |
| Transportadora de Gas del Peru SA, 144A, 4.25%, 4/30/2028 | | | | 1,400,000 | | | | 1,326,500 | |
| | | | | 13,783,090 | |
Total Corporate Bonds (Cost $246,432,013) | | | | 255,699,094 | |
| | |
| Government & Agency Obligations 16.7% | |
| Sovereign Bonds | |
| Dominican Republic, 144A, 7.5%, 5/6/2021 | | | | 3,300,000 | | | | 3,737,250 | |
| Federative Republic of Brazil, 12.5%, 1/5/2016 | BRL | | | 2,070,000 | | | | 1,077,622 | |
| Mexican Bonos: | |
| Series M, 7.75%, 5/29/2031 | MXN | | | 820,000 | | | | 74,787 | |
| Series M 20, 8.5%, 5/31/2029 | MXN | | | 820,000 | | | | 80,674 | |
| Republic of Argentina-Inflation Linked Bond, 5.83%, 12/31/2033 | ARS | | | 816 | | | | 174 | |
| Republic of Belarus, REG S, 8.75%, 8/3/2015 | | | | 1,500,000 | | | | 1,560,000 | |
| Republic of Croatia: | |
| 144A, 6.25%, 4/27/2017 | | | | 1,065,000 | | | | 1,152,021 | |
| 144A, 6.375%, 3/24/2021 | | | | 3,560,000 | | | | 3,887,413 | |
| Republic of El Salvador, 144A, 7.65%, 6/15/2035 | | | | 1,235,000 | | | | 1,321,450 | |
| Republic of Ghana, 144A, 8.5%, 10/4/2017 | | | | 175,000 | | | | 196,875 | |
| Republic of Hungary: | |
| 4.125%, 2/19/2018 | | | | 1,640,000 | | | | 1,634,260 | |
| 5.375%, 2/21/2023 | | | | 3,430,000 | | | | 3,417,138 | |
| Republic of Lithuania, 144A, 7.375%, 2/11/2020 | | | | 1,450,000 | | | | 1,801,625 | |
| Republic of Panama, 9.375%, 1/16/2023 | | | | 2,610,000 | | | | 3,732,300 | |
| Republic of Poland, 5.125%, 4/21/2021 | | | | 3,710,000 | | | | 4,220,125 | |
| Republic of Serbia, 144A, 7.25%, 9/28/2021 | | | | 1,740,000 | | | | 1,929,660 | |
| Republic of South Africa, 6.875%, 5/27/2019 | | | | 185,000 | | | | 220,381 | |
| Republic of Venezuela, 9.25%, 9/15/2027 | | | | 1,090,000 | | | | 991,900 | |
| Russian Federation: | |
| 144A, 5.0%, 4/29/2020 | | | | 8,005,000 | | | | 8,905,562 | |
| REG S, 7.5%, 3/31/2030 | | | | 1,561,315 | | | | 1,896,998 | |
| Series 6207, 8.15%, 2/3/2027 | RUB | | | 2,000,000 | | | | 66,550 | |
Total Government & Agency Obligations (Cost $37,625,375) | | | | 41,904,765 | |
| | |
| Loan Participations and Assignments 24.4% | |
| Senior Loans** 22.9% | |
| Consumer Discretionary 8.3% | |
| Buffets, Inc., Letter of Credit, First Lien, LIBOR plus, 9.25%, 4/22/2015* | | | | 36,046 | | | | 16,852 | |
| Burger King Corp., Term Loan B, 3.75%, 9/27/2019 | | | | 731,325 | | | | 739,289 | |
| Caesars Entertainment Operating Co., Term Loan B6, 5.443%, 1/26/2018 | | | | 122,153 | | | | 109,508 | |
| Charter Communications Operating LLC, Term Loan E, 3.0%, 4/10/2020 | | | | 2,345,000 | | | | 2,336,945 | |
| Clear Channel Communications, Inc., Term Loan B, 3.844%, 1/29/2016 | | | | 372,389 | | | | 346,944 | |
| Cumulus Media Holdings, Inc., Second Lien Term Loan, 7.5%, 9/16/2019 | | | | 495,000 | | | | 514,387 | |
| Goodyear Tire & Rubber Co., Second Lien Term Loan, 4.75%, 4/30/2019 | | | | 3,520,000 | | | | 3,551,785 | |
| PETCO Animal Supplies, Inc., Term Loan, 4.0%, 11/24/2017 | | | | 546,207 | | | | 552,352 | |
| Pilot Travel Centers LLC: | |
| Term Loan B, 3.75%, 3/30/2018 | | | | 1,015,740 | | | | 1,004,952 | |
| Term Loan B2, 4.25%, 8/7/2019 | | | | 2,512,375 | | | | 2,497,929 | |
| Seminole Tribe of Florida, Term Loan, 3.0%, 4/29/2020 | | | | 3,940,000 | | | | 3,952,805 | |
| Tomkins LLC: | | | | | | | | | |
| First Lien Term Loan, 5.0%, 11/9/2018 | | | | 643,388 | | | | 651,163 | |
| Term Loan B2, 3.75%, 9/29/2016 | | | | 4,044,961 | | | | 4,082,903 | |
| Univision Communications, Inc., Term Loan, 4.5%, 3/2/2020 | | | | 583,601 | | | | 583,342 | |
| | | | | 20,941,156 | |
| Consumer Staples 2.8% | |
| Albertson's LLC: | |
| Term Loan, 5.75%, 3/21/2016 | | | | 1,290,000 | | | | 1,299,882 | |
| Term Loan B1, 4.25%, 3/21/2016 | | | | 440,967 | | | | 444,345 | |
| Term Loan B2, 4.75%, 3/21/2019 | | | | 839,033 | | | | 842,703 | |
| Del Monte Foods Co., Term Loan, 4.0%, 3/8/2018 | | | | 1,405,853 | | | | 1,415,265 | |
| HJ Heinz Co., Term Loan B2, 3.5%, 3/27/2020 | | | | 2,570,000 | | | | 2,596,445 | |
| Pinnacle Foods Finance LLC, Term Loan G, 3.25%, 4/29/2020 | | | 445,000 | | | | 446,159 | |
| | | | | 7,044,799 | |
| Energy 3.5% | |
| Chesapeake Energy Corp., Term Loan, 5.75%, 12/1/2017 | | | 1,340,000 | | | | 1,377,989 | |
| MEG Energy Corp., Term Loan, 3.75%, 3/31/2020 | | | 2,340,000 | | | | 2,359,012 | |
| NRG Energy, Inc., Term Loan B, 2.75%, 7/2/2018 | | | | 1,472,273 | | | | 1,465,662 | |
| Ruby Western Pipeline Holdings LLC, Term Loan B, 3.5%, 3/27/2020 | | | | 295,000 | | | | 297,213 | |
| Samson Investment Co., Second Lien Term Loan, 6.0%, 9/25/2018 | | | | 2,000,000 | | | | 2,018,120 | |
| Tallgrass Operations LLC, Term Loan, 5.25%, 11/13/2018 | | | 1,118,539 | | | | 1,129,725 | |
| | | | | 8,647,721 | |
| Financials 0.9% | |
| Calpine Construction Finance Co., LP, Term Loan 1, 3.0%, 4/24/2020 | | | | 2,345,000 | | | | 2,336,206 | |
| Health Care 1.1% | |
| Par Pharmaceutical Companies, Inc., Term Loan B, 4.25%, 9/30/2019 | | | | 1,213,908 | | | | 1,219,364 | |
| Warner Chilcott Co., LLC, Term Loan B2, 4.25%, 3/15/2018 | | | 142,811 | | | | 144,132 | |
| Warner Chilcott Corp.: | |
| Incremental Term Loan B1, 4.3%, 3/15/2018 | | | | 175,439 | | | | 177,061 | |
| Term Loan B1, 4.25%, 3/15/2018 | | | | 403,022 | | | | 406,751 | |
| WC Luxco SARL, Term Loan B3, 4.25%, 3/15/2018 | | | | 317,586 | | | | 320,524 | |
| WP Prism, Inc., Term Loan, 6.25%, 5/31/2018 | | | | 450,000 | | | | 452,250 | |
| | | | | 2,720,082 | |
| Industrials 1.8% | |
| Buffalo Gulf Coast Terminals LLC, Term Loan, 5.25%, 10/31/2017 | | | | 771,125 | | | | 786,547 | |
| Transdigm, Inc., Term Loan C, 3.75%, 2/28/2020 | | | | 2,056,734 | | | | 2,084,500 | |
| WP CPP Holdings LLC, First Lien Term Loan, 4.75%, 12/27/2019 | | | | 1,561,088 | | | | 1,566,942 | |
| | | | | 4,437,989 | |
| Information Technology 1.1% | |
| First Data Corp., Term Loan, 4.193%, 3/24/2017 | | | | 2,840,000 | | | | 2,838,765 | |
| Telecommunication Services 3.4% | |
| Crown Castle International Corp., Term Loan, 3.25%, 1/31/2019 | | | | 4,408,071 | | | | 4,430,133 | |
| DigitalGlobe, Inc., Term Loan B, 3.75%, 1/31/2020 | | | | 55,000 | | | | 55,440 | |
| Kabel Deutschland GmbH, Term Loan F1, 3.25%, 2/1/2019 | | | 3,990,000 | | | | 3,998,978 | |
| | | | | 8,484,551 | |
| Sovereign Loans 1.5% | |
| Financials 1.4% | |
| Bank of Moscow, 144A, 6.699%, 3/11/2015 | | | | 1,385,000 | | | | 1,467,338 | |
| Sberbank of Russia, 144A, 5.125%, 10/29/2022 | | | | 1,000,000 | | | | 986,540 | |
| VTB Bank OJSC, 144A, 6.315%, 2/22/2018 | | | | 985,000 | | | | 1,067,937 | |
| | | | | 3,521,815 | |
| Materials 0.1% | |
| Uralkali OJSC, 144A, 3.723%, 4/30/2018 | | | | 200,000 | | | | 194,000 | |
Total Loan Participations and Assignments (Cost $60,727,944) | | | | 61,167,084 | |
| | |
| Convertible Bonds 0.4% | |
| Consumer Discretionary 0.2% | |
| Group 1 Automotive, Inc., 3.0%, 3/15/2020 | | | | 235,000 | | | | 421,678 | |
| Materials 0.2% | |
| GEO Specialty Chemicals, Inc., 144A, 7.5%, 3/31/2015 (PIK) | | | 428,424 | | | | 663,543 | |
Total Convertible Bonds (Cost $659,066) | | | | 1,085,221 | |
| | |
| Preferred Security 0.3% | |
| Materials | |
| Hercules, Inc., 6.5%, 6/30/2029 (Cost $449,395) | | | | 675,000 | | | | 624,375 | |
| | | Units | | | Value ($) | |
| | | | |
| Other Investments 0.1% | |
| Consumer Discretionary | |
| AOT Bedding Super Holdings LLC* (c) (Cost $15,000) | | | 45 | | | | 156,492 | |
| | | Shares | | | Value ($) | |
| | | | |
| Common Stocks 0.0% | |
| Consumer Discretionary 0.0% | |
| Buffets Restaurants Holdings, Inc.* | | | 323 | | | | 1,938 | |
| Trump Entertainment Resorts, Inc.* | | | 32 | | | | 0 | |
| Vertis Holdings, Inc.* | | | 294 | | | | 0 | |
| | | | | | | | 1,938 | |
| Industrials 0.0% | |
| Congoleum Corp.* | | | 7,900 | | | | 0 | |
| Materials 0.0% | |
| GEO Specialty Chemicals, Inc.* | | | 7,125 | | | | 4,236 | |
| GEO Specialty Chemicals, Inc. 144A* | | | 649 | | | | 386 | |
| Wolverine Tube, Inc.* | | | 2,790 | | | | 50,555 | |
| | | | | | | | 55,177 | |
Total Common Stocks (Cost $164,008) | | | | 57,115 | |
| | |
| Preferred Stock 0.2% | |
| Financials | |
| Ally Financial, Inc. 144A, 7.0% (Cost $563,169) | | | 600 | | | | 588,263 | |
| | |
| Warrants 0.0% | |
| Consumer Discretionary 0.0% | |
| Reader's Digest Association, Inc., Expiration Date 2/19/2014* | | | 589 | | | | 0 | |
| Materials 0.0% | |
| GEO Specialty Chemicals, Inc., Expiration Date 3/31/2015* | | | 39,514 | | | | 23,199 | |
| Hercules Trust II, Expiration Date 3/31/2029* | | | 400 | | | | 5,972 | |
| | | | | | | | 29,171 | |
Total Warrants (Cost $87,876) | | | | 29,171 | |
| | | Contracts | | | Value ($) | |
| | | | |
| Call Options Purchased 0.0% | |
| Options on Interest Rate Swap Contracts | |
| Pay Fixed Rate — 3.583% - Receive Floating — LIBOR, Swap Expiration Date 5/11/2026, Option Expiration Date 5/9/2016 | | | 300,000 | | | | 14,227 | |
| Pay Fixed Rate — 3.635% - Receive Floating — LIBOR, Swap Expiration Date 4/27/2026, Option Expiration Date 4/25/2016 | | | 900,000 | | | | 40,534 | |
| Pay Fixed Rate — 3.72% - Receive Floating — LIBOR, Swap Expiration Date 4/22/2026, Option Expiration Date 4/20/2016 | | | 900,000 | | | | 37,829 | |
Total Call Options Purchased (Cost $103,005) | | | | 92,590 | |
| | | Shares | | | Value ($) | |
| | | | |
| Cash Equivalents 6.5% | |
| Central Cash Management Fund, 0.07% (d) (Cost $16,362,639) | | | 16,362,639 | | | | 16,362,639 | |
| | | % of Net Assets | | | Value ($) | |
| | | | |
Total Investment Portfolio (Cost $363,189,490)† | | | 150.4 | | | | 377,766,809 | |
| Other Assets and Liabilities, Net | | | (4.6 | ) | | | (11,573,056 | ) |
| Notes Payable | | | (45.8 | ) | | | (115,000,000 | ) |
| Net Assets | | | 100.0 | | | | 251,193,753 | |
The following table represents bonds and senior loans that are in default:
| Securities | | Coupon | | Maturity Date | Principal Amount | | | Cost ($) | | | Value ($) | |
| Buffets, Inc.* | | LIBOR plus 9.25% | | 4/22/2015 | USD | | | 36,046 | | | | 35,155 | | | | 16,852 | |
| ERC Ireland Preferred Equity Ltd.* | | | 7.69 | % | 2/15/2017 | EUR | | | 281,038 | | | | 382,577 | | | | 0 | |
| Fontainebleau Las Vegas Holdings LLC* | | | 11.0 | % | 6/15/2015 | USD | | | 290,000 | | | | 292,813 | | | | 0 | |
| Hellas Telecommunications Finance SCA* | | | 8.21 | % | 7/15/2015 | EUR | | | 278,431 | | | | 79,885 | | | | 0 | |
| | | | | | | | | | | | | | 790,430 | | | | 16,852 | |
* Non-income producing security.
** Floating rate securities' yields vary with a designated market index or market rate, such as the coupon-equivalent of the U.S. Treasury Bill rate. These securities are shown at their current rate as of May 31, 2013.
† The cost for federal income tax purposes was $363,814,440. At May 31, 2013, net unrealized appreciation for all securities based on tax cost was $13,952,369. This consisted of aggregate gross unrealized appreciation for all securities in which there was an excess of value over tax cost of $17,249,132 and aggregate gross unrealized depreciation for all securities in which there was an excess of tax cost over value of $3,296,763.
(a) Principal amount stated in U.S. dollars unless otherwise noted.
(b) When-issued security.
(c) The Fund may purchase securities that are subject to legal or contractual restrictions on resale ("restricted securities"). Restricted securities are securities which have not been registered with the Securities and Exchange Commission under the Securities Act of 1933. The Fund may be unable to sell a restricted security and it may be more difficult to determine a market value for a restricted security. Moreover, if adverse market conditions were to develop during the period between the Fund's decision to sell a restricted security and the point at which the Fund is permitted or able to sell such security, the Fund might obtain a price less favorable than the price that prevailed when it decided to sell. This investment practice, therefore, could have the effect of increasing the level of illiquidity of the Fund. The future value of these securities is uncertain and there may be changes in the estimated value of these securities.
| Schedule of Restricted Securities | Acquisition Date | | Cost ($) | | | Value ($) | | | Value as % of Net Assets | |
| AOT Bedding Super Holdings LLC | June 2010 | | | 15,000 | | | | 156,492 | | | | 0.06 | |
(d) Affiliated fund managed by Deutsche Investment Management Americas Inc. The rate shown is the annualized seven-day yield at period end.
144A: Security exempt from registration under Rule 144A of the Securities Act of 1933. These securities may be resold in transactions exempt from registration, normally to qualified institutional buyers.
LIBOR: London Interbank Offered Rate
PIK: Denotes that all or a portion of the income is paid in-kind in the form of additional principal.
REG S: Securities sold under Regulation S may not be offered, sold or delivered within the United States or to, or for the account or benefit of, U.S. persons, except pursuant to an exemption from, or in a transaction not subject to, the registration requirements of the Securities Act of 1933.
REIT: Real Estate Investment Trust
The Fund can invest in certain Senior Loan agreements that include the obligation to make additional loans in certain circumstances. The Fund reserves against such contingent obligations by segregating cash, liquid securities and liquid Senior Loans. At May 31, 2013, the Fund had an unfunded loan commitment of $520,000, which could be extended at the option of the borrower, pursuant to the following loan agreement:
| Borrower | | Unfunded Loan Commitment ($) | | | Value ($) | | | Unrealized Appreciation ($) | |
| Tallgrass Operations LLC, Term Delay Draw, 11/13/2017 | | | 520,000 | | | | 520,000 | | | | — | |
At May 31, 2013, open written options contracts were as follows:
| Options on Interest Rate Swap Contracts | |
| | Swap Effective/ Expiration Date | | Contract Amount | | Option Expiration Date | | Premiums Received ($) | | | Value ($) (e) | |
Call Options Receive Fixed — 4.083% - Pay Floating — LIBOR | 5/11/2016 5/11/2026 | | | 300,000 | | 5/9/2016 | | | 10,200 | | | | (9,869 | ) |
| Receive Fixed — 4.135% - Pay Floating — LIBOR | 4/27/2016 4/27/2026 | | | 900,000 | | 4/25/2016 | | | 33,300 | | | | (27,944 | ) |
| Receive Fixed — 4.22% - Pay Floating — LIBOR | 4/22/2016 4/22/2026 | | | 900,000 | | 4/20/2016 | | | 32,085 | | | | (26,052 | ) |
| Total | | | 75,585 | | | | (63,865 | ) |
(e) Unrealized appreciation on written options on interest rate swap contracts at May 31, 2013 was $11,720.
At May 31, 2013, open credit default swap contracts sold were as follows:
Effective/ Expiration Date | | Notional Amount ($) (f) | | | Fixed Cash Flows Received | | Underlying Debt Obligation/ Quality Rating (g) | | Value ($) | | | Upfront Payments Paid/ (Received) ($) | | | Unrealized Appreciation ($) | |
6/21/2010 9/20/2013 | | | 1,285,000 | 1 | | | 5.0 | % | Ford Motor Co., 6.5%, 8/1/2018, BBB- | | | 32,161 | | | | (6,395 | ) | | | 38,556 | |
6/21/2010 9/20/2015 | | | 1,555,000 | 2 | | | 5.0 | % | Ford Motor Co., 6.5%, 8/1/2018, BBB- | | | 172,182 | | | | (35,560 | ) | | | 207,742 | |
12/20/2011 3/20/2017 | | | 565,000 | 3 | | | 5.0 | % | CIT Group, Inc., 5.5%, 2/15/2019, BB- | | | 82,039 | | | | 18,113 | | | | 63,926 | |
9/20/2012 12/20/2017 | | | 720,000 | 4 | | | 5.0 | % | General Motors Co., 3.3%, 12/20/2017, BB+ | | | 104,504 | | | | 48,750 | | | | 55,754 | |
12/20/2012 12/20/2017 | | | 1,500,000 | 2 | | | 5.0 | % | Markit Dow Jones CDX North America High Yield Index | | | 104,248 | | | | 29,897 | | | | 74,351 | |
| Total unrealized appreciation | | | | 440,329 | |
(f) The maximum potential amount of future undiscounted payments that the Fund could be required to make under a credit default swap contract would be the notional amount of the contract. These potential amounts would be partially offset by any recovery values of the referenced debt obligation or net amounts received from the settlement of buy protection credit default swap contracts entered into by the Fund for the same referenced debt obligation, if any.
(g) The quality ratings represent the higher of Moody's Investors Service, Inc. ("Moody's") or Standard & Poor's Corporation ("S&P") credit ratings and are unaudited.
Counterparties:
1 The Goldman Sachs & Co.
2 Bank of America
3 Credit Suisse
4 UBS AG
At May 31, 2013, the Fund had the following open forward foreign currency exchange contracts:
| Contracts to Deliver | | In Exchange For | | Settlement Date | | Unrealized Depreciation ($) | | Counterparty |
| EUR | | | 1,789,623 | | USD | | | 2,321,409 | | 6/19/2013 | | | (4,890 | ) | Citigroup, Inc. |
| Currency Abbreviations |
ARS Argentine Peso BRL Brazilian Real EUR Euro MXN Mexican Peso RUB Russian Ruble USD United States Dollar |
For information on the Fund's policy and additional disclosures regarding options purchased, credit default swap contracts, forward foreign currency exchange contracts and written options contracts, please refer to Note B in the accompanying Notes to Financial Statements.
Fair Value Measurements
Various inputs are used in determining the value of the Fund's investments. These inputs are summarized in three broad levels. Level 1 includes quoted prices in active markets for identical securities. Level 2 includes other significant observable inputs (including quoted prices for similar securities, interest rates, prepayment speeds and credit risk). Level 3 includes significant unobservable inputs (including the Fund's own assumptions in determining the fair value of investments). The inputs or methodology used for valuing securities are not necessarily an indication of the risk associated with investing in those securities.
The following is a summary of the inputs used as of May 31, 2013 in valuing the Fund's investments. For information on the Fund's policy regarding the valuation of investments, please refer to Note A in the accompanying Notes to Financial Statements.
| Assets | | Level 1 | | | Level 2 | | | Level 3 | | | Total | |
| | |
| Fixed Income Investments (h) | |
| Corporate Bonds | | $ | — | | | $ | 255,684,421 | | | $ | 14,673 | | | $ | 255,699,094 | |
| Government & Agency Obligations | | | — | | | | 41,904,765 | | | | — | | | | 41,904,765 | |
| Loan Participations and Assignments | | | — | | | | 61,167,084 | | | | — | | | | 61,167,084 | |
| Convertible Bonds | | | — | | | | 421,678 | | | | 663,543 | | | | 1,085,221 | |
| Preferred Securities | | | — | | | | 624,375 | | | | — | | | | 624,375 | |
| Other Investments | | | — | | | | — | | | | 156,492 | | | | 156,492 | |
| Common Stocks (h) | | | — | | | | 1,938 | | | | 55,177 | | | | 57,115 | |
| Preferred Stock | | | — | | | | 588,263 | | | | — | | | | 588,263 | |
| Warrants (h) | | | — | | | | — | | | | 29,171 | | | | 29,171 | |
| Short-Term Investments | | | 16,362,639 | | | | — | | | | — | | | | 16,362,639 | |
| Derivatives (i) | |
| Purchased Options | | | — | | | | 92,590 | | | | — | | | | 92,590 | |
| Credit Default Swaps | | | — | | | | 440,329 | | | | — | | | | 440,329 | |
| Total | | $ | 16,362,639 | | | $ | 360,925,443 | | | $ | 919,056 | | | $ | 378,207,138 | |
| Liabilities | |
| Derivatives (i) | |
| Written Options | | $ | — | | | $ | (63,865 | ) | | $ | — | | | $ | (63,865 | ) |
| Forward Foreign Currency Exchange Contracts | | | — | | | | (4,890 | ) | | | — | | | | (4,890 | ) |
| Total | | $ | — | | | $ | (68,755 | ) | | $ | — | | | $ | (68,755 | ) |
During the period ended May 31, 2013, the amount of transfers between Level 2 and Level 3 was $291. Investments were transferred from Level 2 to Level 3 because of the lack of observable market data due to a decrease in market activity.
Transfers between price levels are recognized at the beginning of the reporting period.
(h) See Investment Portfolio for additional detailed categorizations.
(i) Derivatives include value of options purchased, unrealized appreciation (depreciation) on open credit default swap contracts, forward foreign currency exchange contracts and written options, at value.
The accompanying notes are an integral part of the financial statements.
Statement of Assets and Liabilities | as of May 31, 2013 (Unaudited) | |
| Assets | |
Investments: Investments in non-affiliated securities, at value (cost $346,826,851) | | $ | 361,404,170 | |
| Investment in Central Cash Management Fund (cost $16,362,639) | | | 16,362,639 | |
| Total investments in securities, at value (cost $363,189,490) | | | 377,766,809 | |
| Cash | | | 3,492,947 | |
| Foreign currency, at value (cost $350) | | | 318 | |
| Receivable for investments sold | | | 3,872,767 | |
| Receivable for investments sold — when-issued securities | | | 2,039,444 | |
| Interest receivable | | | 4,971,490 | |
| Unrealized appreciation on swap contracts | | | 440,329 | |
| Upfront payments paid on swap contracts | | | 96,760 | |
| Other assets | | | 5,046 | |
| Total assets | | | 392,685,910 | |
| Liabilities | |
| Payable for investments purchased | | | 21,565,536 | |
| Payable for investments purchased — when-issued securities | | | 4,372,377 | |
| Notes payable | | | 115,000,000 | |
| Interest on notes payable | | | 153,700 | |
| Options written, at value (premiums received $75,585) | | | 63,865 | |
| Unrealized depreciation on forward foreign currency exchange contracts | | | 4,890 | |
| Upfront payments received on swap contracts | | | 41,955 | |
| Accrued management fee | | | 179,030 | |
| Accrued Trustees' fees | | | 7,667 | |
| Other accrued expenses and payables | | | 103,137 | |
| Total liabilities | | | 141,492,157 | |
| Net assets, at value | | $ | 251,193,753 | |
The accompanying notes are an integral part of the financial statements.
Statement of Assets and Liabilities as of May 31, 2013 (Unaudited) (continued) | |
| Net Assets Consist of | |
| Undistributed net investment income | | | 1,496,188 | |
Net unrealized appreciation (depreciation) on: Investments | | | 14,577,319 | |
| Swap contracts | | | 440,329 | |
| Foreign currency | | | (9,513 | ) |
| Written options | | | 11,720 | |
| Accumulated net realized gain (loss) | | | (12,788,402 | ) |
| Paid-in capital | | | 247,466,112 | |
| Net assets, at value | | $ | 251,193,753 | |
| Net Asset Value | |
Net Asset Value per share ($251,193,753 ÷ 24,488,347 outstanding shares of beneficial interest, $.01 par value, unlimited shares authorized) | | $ | 10.26 | |
The accompanying notes are an integral part of the financial statements.
| for the six months ended May 31, 2013 (Unaudited) | |
| Investment Income | |
Income: Interest | | $ | 11,070,346 | |
| Dividends | | | 18,457 | |
| Income distributions — Central Cash Management Fund | | | 6,511 | |
| Total income | | | 11,095,314 | |
Expenses: Management fee | | | 1,079,576 | |
| Services to shareholders | | | 10,555 | |
| Custodian fee | | | 34,216 | |
| Professional fees | | | 38,926 | |
| Reports to shareholders | | | 51,023 | |
| Trustees' fees and expenses | | | 8,315 | |
| Interest expense | | | 866,307 | |
| Stock exchange listing fees | | | 11,888 | |
| Other | | | 30,744 | |
| Total expenses | | | 2,131,550 | |
| Net investment income | | | 8,963,764 | |
| Realized and Unrealized Gain (Loss) | |
Net realized gain (loss) from: Investments | | | 6,799,620 | |
| Swap contracts | | | 104,441 | |
| Written options | | | 30,441 | |
| Foreign currency | | | (77,490 | ) |
| | | | 6,857,012 | |
Change in net unrealized appreciation (depreciation) on: Investments | | | (5,661,083 | ) |
| Swap contracts | | | 134,542 | |
| Unfunded loan commitments | | | (2,600 | ) |
| Written options | | | (30,069 | ) |
| Foreign currency | | | 72,874 | |
| | | | (5,486,336 | ) |
| Net gain (loss) | | | 1,370,676 | |
| Net increase (decrease) in net assets resulting from operations | | $ | 10,334,440 | |
The accompanying notes are an integral part of the financial statements.
| for the six months ended May 31, 2013 (Unaudited) | |
Increase (Decrease) in Cash: Cash Flows from Operating Activities | |
| Net increase (decrease) in net assets resulting from operations | | $ | 10,334,440 | |
Adjustments to reconcile net increase (decrease) in net assets resulting from operations to net cash provided (used) by operating activities: Purchases of long-term investments | | | (174,405,224 | ) |
| Net purchases, sales and maturities of short-term investments | | | (3,858,850 | ) |
| Net amortization of premium/(accretion of discount) | | | 193,879 | |
| Proceeds from sales and maturities of long-term investments | | | 157,717,305 | |
| (Increase) decrease in interest receivable | | | 274,367 | |
| (Increase) decrease in other assets | | | 5,217 | |
| Increase (decrease) in written options, at value | | | (3,981 | ) |
| (Increase) decrease in receivable for investments sold | | | (1,478,252 | ) |
| (Increase) decrease in receivable for investments sold — when-issued securities | | | (1,810,881 | ) |
| Increase (decrease) in interest on notes payable | | | (16,962 | ) |
| Increase (decrease) in payable for investments purchased | | | 13,918,558 | |
| Increase (decrease) in payable for investments purchased — when-issued securities | | | 2,652,377 | |
| (Increase) decrease in upfront payments paid/received on swap contracts | | | (76,272 | ) |
| Increase (decrease) in other accrued expenses and payables | | | 12,990 | |
| Change in unrealized (appreciation) depreciation on investments | | | 5,661,083 | |
| Change in unrealized (appreciation) depreciation on swaps | | | (134,542 | ) |
| Change in unrealized (appreciation) depreciation on forward foreign currency exchange contracts | | | (77,481 | ) |
| Change in unrealized (appreciation) depreciation in unfunded commitments | | | 2,600 | |
| Net realized (gain) loss from investments | | | (6,799,620 | ) |
| Cash provided (used) by operating activities | | $ | 2,110,751 | |
| Cash Flows from Financing Activities | |
| Net increase (decrease) in notes payable | | | 12,000,000 | |
| Distributions paid (net of reinvestment of distributions) | | | (10,670,059 | ) |
| Cash provided (used) by financing activities | | | 1,329,941 | |
| Increase (decrease) in cash | | | 3,440,692 | |
| Cash at beginning of period (including foreign currency) | | | 52,573 | |
| Cash at end of period (including foreign currency) | | $ | 3,493,265 | |
| Supplemental Disclosure | |
| Reinvestment of distributions | | $ | 460,786 | |
| Interest paid on notes | | $ | (883,269 | ) |
The accompanying notes are an integral part of the financial statements.
Statement of Changes in Net Assets | Increase (Decrease) in Net Assets | | Six Months Ended May 31, 2013 (Unaudited) | | | Year Ended November 30, 2012 | |
Operations: Net investment income | | $ | 8,963,764 | | | $ | 19,724,007 | |
| Net realized gain (loss) | | | 6,857,012 | | | | 5,581,569 | |
| Change in net unrealized appreciation (depreciation) | | | (5,486,336 | ) | | | 19,493,194 | |
| Net increase (decrease) in net assets resulting from operations | | | 10,334,440 | | | | 44,798,770 | |
Distributions to shareholders from: Net investment income | | | (11,130,845 | ) | | | (22,541,628 | ) |
Fund share transactions: Net proceeds from reinvestment of distributions | | | 460,786 | | | | 929,263 | |
| Net increase (decrease) in net assets from Fund share transactions | | | 460,786 | | | | 929,263 | |
| Increase (decrease) in net assets | | | (335,619 | ) | | | 23,186,405 | |
| Net assets at beginning of period | | | 251,529,372 | | | | 228,342,967 | |
| Net assets at end of period (including undistributed net investment income of $1,496,188 and $3,663,269, respectively) | | $ | 251,193,753 | | | $ | 251,529,372 | |
| Other Information | |
| Shares outstanding at beginning of period | | | 24,445,323 | | | | 24,353,061 | |
| Shares issued to shareholders from reinvestment of distributions | | | 43,024 | | | | 92,262 | |
| Shares outstanding at end of period | | | 24,488,347 | | | | 24,445,323 | |
The accompanying notes are an integral part of the financial statements.
| | | | | | Years Ended November 30, | |
| | | Six Months Ended 5/31/13 (Unaudited) | | | 2012 | | | 2011 | | | 2010 | | | 2009 | | | 2008 | |
| Selected Per Share Data | |
| Net asset value, beginning of period | | $ | 10.29 | | | $ | 9.38 | | | $ | 9.75 | | | $ | 8.99 | | | $ | 6.52 | | | $ | 9.61 | |
Income (loss) from investment operations: Net investment incomea | | | .37 | | | | .81 | | | | .87 | | | | .90 | | | | .76 | | | | .67 | |
| Net realized and unrealized gain (loss) | | | .06 | | | | 1.02 | | | | (.33 | ) | | | .71 | | | | 2.49 | | | | (2.98 | ) |
| Total from investment operations | | | .43 | | | | 1.83 | | | | .54 | | | | 1.61 | | | | 3.25 | | | | (2.31 | ) |
Less distributions from: Net investment income | | | (.46 | ) | | | (.92 | ) | | | (.91 | ) | | | (.85 | ) | | | (.78 | ) | | | (.78 | ) |
| Net asset value, end of period | | $ | 10.26 | | | $ | 10.29 | | | $ | 9.38 | | | $ | 9.75 | | | $ | 8.99 | | | $ | 6.52 | |
| Market price, end of period | | $ | 10.41 | | | $ | 10.51 | | | $ | 9.98 | | | $ | 10.17 | | | $ | 8.28 | | | $ | 5.10 | |
| Total Return | |
Based on net asset value (%)b | | | 4.02 | ** | | | 20.20 | | | | 5.64 | | | | 18.71 | | | | 54.34 | | | | (24.55 | )c |
Based on market price (%)b | | | 3.33 | ** | | | 15.39 | | | | 7.65 | | | | 34.58 | | | | 81.73 | | | | (32.88 | ) |
| Ratios to Average Net Assets and Supplemental Data | |
| Net assets, end of period ($ millions) | | | 251 | | | | 252 | | | | 228 | | | | 237 | | | | 218 | | | | 158 | |
| Ratio of expenses before fee reductions (including interest expense) (%) | | | 1.68 | * | | | 1.66 | | | | 1.49 | | | | 1.62 | | | | 1.53 | | | | 1.49 | |
| Ratio of expenses after fee reductions (including interest expense) (%) | | | 1.68 | * | | | 1.66 | | | | 1.49 | | | | 1.62 | | | | 1.53 | | | | 1.48 | |
| Ratio of expenses after fee reductions (excluding interest expense) (%) | | | 1.00 | * | | | 1.00 | | | | 1.02 | | | | 1.07 | | | | 1.04 | | | | 1.04 | |
| Ratio of net investment income (%) | | | 7.06 | * | | | 8.09 | | | | 8.84 | | | | 9.57 | | | | 9.69 | | | | 7.56 | |
| Portfolio turnover rate (%) | | | 44 | ** | | | 45 | | | | 55 | | | | 78 | | | | 113 | | | | 35 | |
| Total debt outstanding end of period ($ thousands) | | | 115,000 | | | | 103,000 | | | | 98,247 | | | | 92,000 | | | | 88,500 | | | | 41,500 | |
Asset coverage per $1,000 of debtd | | | 3,184 | | | | 3,442 | | | | 3,324 | | | | 3,572 | | | | 3,464 | | | | 4,810 | |
a Based on average shares outstanding during the period. b Total return based on net asset value reflects changes in the Fund's net asset value during each period. Total return based on market price reflects changes in market price. Each figure assumes that dividend and capital gain distributions, if any, were reinvested. These figures will differ depending upon the level of any discount from or premium to NAV at which the Fund's shares trade during the period. c Total return would have been lower had certain fees not been reduced. d Asset coverage equals the total net assets plus borrowings of the Fund divided by the borrowings outstanding at period end. * Annualized ** Not annualized |
Notes to Financial Statements (Unaudited)
A. Organization and Significant Accounting Policies
DWS Multi-Market Income Trust (the "Fund") is registered under the Investment Company Act of 1940, as amended (the "1940 Act"), as a closed-end, diversified management investment company organized as a Massachusetts business trust.
The Fund's financial statements are prepared in accordance with accounting principles generally accepted in the United States of America which require the use of management estimates. Actual results could differ from those estimates. The policies described below are followed consistently by the Fund in the preparation of its financial statements.
Security Valuation. Investments are stated at value determined as of the close of regular trading on the New York Stock Exchange on each day the exchange is open for trading.
Various inputs are used in determining the value of the Fund's investments. These inputs are summarized in three broad levels. Level 1 includes quoted prices in active markets for identical securities. Level 2 includes other significant observable inputs (including quoted prices for similar securities, interest rates, prepayment speeds, and credit risk). Level 3 includes significant unobservable inputs (including the Fund's own assumptions in determining the fair value of investments). The inputs or methodology used for valuing securities are not necessarily an indication of the risk associated with investing in those securities.
Debt securities and loan participations and assignments are valued at prices supplied by independent pricing services approved by the Fund's Board. If the pricing services are unable to provide valuations, debt securities are valued at the most recent bid quotation or evaluated price and loan participations and assignments are valued at the mean of the most recent bid and ask quotations, as applicable, obtained from one or more broker-dealers. Such services may use various pricing techniques which take into account appropriate factors such as yield, quality, coupon rate, maturity, type of issue, trading characteristics and other data, as well as broker quotes. These securities are generally categorized as Level 2.
Equity securities are valued at the most recent sale price or official closing price reported on the exchange (U.S. or foreign) or over-the-counter market on which they trade and are categorized as Level 1 securities. Securities for which no sales are reported are valued at the calculated mean between the most recent bid and asked quotations on the relevant market or, if a mean cannot be determined, at the most recent bid quotation.
Investments in open-end investment companies are valued at their net asset value each business day and are categorized as Level 1.
Forward currency contracts are valued at the prevailing forward exchange rate of the underlying currencies and are categorized as Level 2.
Swap contracts are valued daily based upon prices supplied by a Board approved pricing vendor, if available, and otherwise are valued at the price provided by the broker-dealer. Swap contracts are generally categorized as Level 2.
Over-the-counter written or purchased options are valued at prices supplied by a Board-approved pricing vendor, if available, and otherwise are valued at the price provided by the broker-dealer with which the option was traded and are generally categorized as Level 2.
Securities and other assets for which market quotations are not readily available or for which the above valuation procedures are deemed not to reflect fair value are valued in a manner that is intended to reflect their fair value as determined in accordance with procedures approved by the Board and are generally categorized as Level 3. In accordance with the Fund's valuation procedures, factors used in determining value may include, but are not limited to, the type of the security; the size of the holding; the initial cost of the security; the existence of any contractual restrictions on the security's disposition; the price and extent of public trading in similar securities of the issuer or of comparable companies; quotations or evaluated prices from broker-dealers and/or pricing services; information obtained from the issuer, analysts, and/or the appropriate stock exchange (for exchange-traded securities); an analysis of the company's or issuer's financial statements; an evaluation of the forces that influence the issuer and the market(s) in which the security is purchased and sold; and with respect to debt securities, the maturity, coupon, creditworthiness, currency denomination and the movement of the market in which the security is normally traded. The value determined under these procedures may differ from published values for the same securities.
Disclosure about the classification of fair value measurements is included in a table following the Fund's Investment Portfolio.
New Accounting Pronouncement. In January 2013, Accounting Standard Update 2013-01 (ASU 2013-01), Clarifying the Scope of Disclosures about Offsetting Assets and Liabilities, replaced Accounting Standards Update 2011-11 (ASU 2011-11), Disclosures about Offsetting Assets and Liabilities. ASU 2013-01 is effective for fiscal years beginning on or after January 1, 2013, and interim periods within those annual periods. ASU 2011-11 was intended to enhance disclosure requirements on the offsetting of financial assets and liabilities. The ASU 2013-01 limits the scope of the new balance sheet offsetting disclosures to derivatives, repurchase agreements, and securities lending transactions to the extent that they are (1) offset in the financial statements or (2) subject to an enforceable master netting arrangement or similar agreement. Management is currently evaluating the application of ASU 2013-01 and its impact, if any, on the Fund's financial statements.
Securities Lending. The Fund lends securities to certain financial institutions. The Fund retains the benefits of owning the securities it has loaned and continues to receive interest and dividends generated by the securities and to participate in any changes in their market price. The Fund requires the borrowers of the securities to maintain collateral with the Fund consisting of either cash or liquid, unencumbered assets having a value at least equal to the value of the securities loaned. When the collateral falls below specified amounts, the lending agent will use its best efforts to obtain additional collateral on the next business day to meet required amounts under the security lending agreement. The Fund may invest the cash collateral into a joint trading account in an affiliated money market fund pursuant to Exemptive Orders issued by the SEC. The Fund receives compensation for lending its securities either in the form of fees or by earning interest on invested cash collateral net of borrower rebates and fees paid to a lending agent. Either the Fund or the borrower may terminate the loan. There may be risks of delay and costs in recovery of securities or even loss of rights in the collateral should the borrower of the securities fail financially. The Fund is also subject to all investment risks associated with the reinvestment of any cash collateral received, including, but not limited to, interest rate, credit and liquidity risk associated with such investments. The Fund had no securities on loan during the six months ended May 31, 2013.
Foreign Currency Translations. The books and records of the Fund are maintained in U.S. dollars. Investment securities and other assets and liabilities denominated in a foreign currency are translated into U.S. dollars at the prevailing exchange rates at period end. Purchases and sales of investment securities, income and expenses are translated into U.S. dollars at the prevailing exchange rates on the respective dates of the transactions.
Net realized and unrealized gains and losses on foreign currency transactions represent net gains and losses between trade and settlement dates on securities transactions, the acquisition and disposition of foreign currencies, and the difference between the amount of net investment income accrued and the U.S. dollar amount actually received. That portion of both realized and unrealized gains and losses on investments that results from fluctuations in foreign currency exchange rates is not separately disclosed, but is included with net realized and unrealized gain/appreciation and loss/depreciation on investments.
When-Issued/Delayed Delivery Securities. The Fund may purchase or sell securities with delivery or payment to occur at a later date beyond the normal settlement period. At the time the Fund enters into a commitment to purchase or sell a security, the transaction is recorded and the value of the transaction is reflected in the net asset value. The price of such security and the date when the security will be delivered and paid for are fixed at the time the transaction is negotiated. The value of the security may vary with market fluctuations. At the time the Fund enters into a purchase transaction it is required to segregate cash or other liquid assets at least equal to the amount of the commitment.
Certain risks may arise upon entering into when-issued or delayed delivery transactions from the potential inability of counterparties to meet the terms of their contracts or if the issuer does not issue the securities due to political, economic, or other factors. Additionally, losses may arise due to changes in the value of the underlying securities.
Loan Participations and Assignments. Senior loans are portions of loans originated by banks and sold in pieces to investors. These U.S. dollar-denominated fixed and floating rate loans ("Loans") in which the Fund invests, are arranged between the borrower and one or more financial institutions ("Lenders"). These Loans may take the form of Senior Loans, which are corporate obligations often issued in connection with recapitalizations, acquisitions, leveraged buy-outs and refinancings, and Sovereign Loans, which are debt instruments between a foreign sovereign entity and one or more financial institutions. The Fund invests in such Loans in the form of participations in Loans ("Participations") or assignments of all or a portion of Loans from third parties ("Assignments"). Participations typically result in the Fund having a contractual relationship only with the Lender, not with the borrower. The Fund has the right to receive payments of principal, interest and any fees to which it is entitled from the Lender selling the Participation and only upon receipt by the Lender of the payments from the borrower. In connection with purchasing Participations, the Fund generally has no right to enforce compliance by the borrower with the terms of the loan agreement relating to the Loan, or any rights of set-off against the borrower, and the Fund will not benefit directly from any collateral supporting the Loan in which it has purchased the Participation. As a result, the Fund assumes the credit risk of both the borrower and the Lender that is selling the Participation. Assignments typically result in the Fund having a direct contractual relationship with the borrower, and the Fund may enforce compliance by the borrower with the terms of the loan agreement. Loans held by the Fund are generally in the form of Assignments, but the Fund may also invest in Participations. All Loan Participations and Assignments involve interest rate risk, liquidity risk and credit risk, including the potential default or insolvency of the borrower.
Federal Income Taxes. The Fund's policy is to comply with the requirements of the Internal Revenue Code, as amended, which are applicable to regulated investment companies, and to distribute all of its taxable income to its shareholders.
Under the Regulated Investment Company Modernization Act of 2010, net capital losses incurred post-enactment may be carried forward indefinitely, and their character is retained as short-term and/or long-term. Previously, net capital losses were carried forward for eight years and treated as short-term losses. As a transition rule, the Act requires that post-enactment net capital losses be used before pre-enactment net capital losses.
At November 30, 2012, the Fund had a net tax basis capital loss carryforward of approximately $18,784,000 of pre-enactment losses, which may be applied against any realized net taxable capital gains of each succeeding year until fully utilized or until November 30, 2016 ($5,659,000) and November 30, 2017 ($13,125,000), the respective expiration dates, whichever occurs first.
The Fund has reviewed the tax positions for the open tax years as of November 30, 2012 and has determined that no provision for income tax is required in the Fund's financial statements. The Fund's federal tax returns for the prior three fiscal years remain open subject to examination by the Internal Revenue Service.
Distribution of Income and Gains. Distributions from net investment income of the Fund are declared and distributed to shareholders monthly. Net realized gains from investment transactions, in excess of available capital loss carryforwards, would be taxable to the Fund if not distributed, and, therefore, will be distributed to shareholders at least annually. The Fund may also make additional distributions for tax purposes if necessary.
The timing and characterization of certain income and capital gain distributions are determined annually in accordance with federal tax regulations which may differ from accounting principles generally accepted in the United States of America. These differences primarily relate to forward currency contracts, swap contracts, certain securities sold at a loss and premium amortization on debt securities. As a result, net investment income (loss) and net realized gain (loss) on investment transactions for a reporting period may differ significantly from distributions during such period. Accordingly, the Fund may periodically make reclassifications among certain of its capital accounts without impacting the net asset value of the Fund.
The tax character of current year distributions will be determined at the end of the current fiscal year.
Statement of Cash Flows. Information on financial transactions which have been settled through the receipt and disbursement of cash is presented in the Statement of Cash Flows. The cash amount shown in the Statement of Cash Flows represents the foreign currency position and cash position at the Fund's custodian bank at May 31, 2013.
Contingencies. In the normal course of business, the Fund may enter into contracts with service providers that contain general indemnification clauses. The Fund's maximum exposure under these arrangements is unknown as this would involve future claims that may be made against the Fund that have not yet been made. However, based on experience, the Fund expects the risk of loss to be remote.
Other. Investment transactions are accounted for on a trade date plus one basis for daily net asset value calculations. However, for financial reporting purposes, investment transactions are reported on trade date. Interest income is recorded on the accrual basis net of foreign withholding taxes. Dividend income is recorded on the ex-dividend date net of foreign withholding taxes. Realized gains and losses from investment transactions are recorded on an identified cost basis and may include proceeds from litigation. All premiums and discounts are amortized/accreted for financial reporting purposes, with the exception of securities in default of principal.
B. Derivative Instruments
Credit Default Swap Contracts. A credit default swap is a contract between a buyer and a seller of protection against pre-defined credit events for the reference entity. The Fund may enter into credit default swap contracts to gain exposure to an underlying issuer's credit quality characteristics without directly investing in that issuer or to hedge against the risk of a credit event on debt securities. As a seller in the credit default swap contract, the Fund is required to pay the par (or other agreed-upon) value of the referenced entity to the counterparty with the occurrence of a credit event by a third party, such as a U.S. or foreign corporate issuer, on the reference entity, which would likely result in a loss to the Fund. In return, the Fund receives from the counterparty a periodic stream of payments over the term of the contract provided that no credit event has occurred. If no credit event occurs, the Fund keeps the stream of payments with no payment obligations. This involves the risk that the contract may expire worthless. It also involves counterparty risk that the seller may fail to satisfy its payment obligations to the Fund with the occurrence of a credit event. When the Fund sells a credit default swap contract it will cover its commitment. This is achieved by, among other methods, maintaining cash or liquid assets equal to the aggregate notional value of the reference entities for all outstanding credit default swap contracts sold by the Fund. For the six months ended May 31, 2013, the Fund entered into credit default swap contracts to gain exposure to the underlying issuer's credit quality characteristics.
The value of the credit default swap is adjusted daily and the change in value, if any, is recorded daily as unrealized appreciation or depreciation in the Statement of Assets and Liabilities. An upfront payment, if any, made by the Fund is recorded as an asset in the Statement of Assets and Liabilities. An upfront payment, if any, received by the Fund is recorded as a liability in the Statement of Assets and Liabilities. Under the terms of the credit default swap contracts, the Fund receives or makes quarterly payments based on a specified interest rate on a fixed notional amount. These payments are recorded as a realized gain or loss in the Statement of Operations. Payments received or made as a result of a credit event or termination of the contract are recognized, net of a proportional amount of the upfront payment, as realized gains or losses in the Statement of Operations.
A summary of the open credit default swap contracts as of May 31, 2013 is included in a table following the Fund's Investment Portfolio. For the six months ended May 31, 2013, the investment in credit default swap contracts sold had a total notional value generally indicative of a range from $3,405,000 to $5,625,000.
Options. An option contract is a contract in which the writer (seller) of the option grants the buyer of the option, upon payment of a premium, the right to purchase from (call option), or sell to (put option), the writer a designated instrument at a specified price within a specified period of time. Certain options, including options on indices and interest rate options, will require cash settlement by the Fund if exercised. For the six months ended May 31, 2013, the Fund entered into options on interest rate swaps in order to hedge against potential adverse interest rate movements of portfolio assets.
If the Fund writes a covered call option, the Fund foregoes, in exchange for the premium, the opportunity to profit during the option period from an increase in the market value of the underlying security above the exercise price. If the Fund writes a put option it accepts the risk of a decline in the value of the underlying security below the exercise price. Over-the-counter options have the risk of the potential inability of counterparties to meet the terms of their contracts. The Fund's maximum exposure to purchased options is limited to the premium initially paid. In addition, certain risks may arise upon entering into option contracts including the risk that an illiquid secondary market will limit the Fund's ability to close out an option contract prior to the expiration date and that a change in the value of the option contract may not correlate exactly with changes in the value of the securities hedged.
A summary of the open purchased option contracts as of May 31, 2013 is included in the Fund's Investment Portfolio. A summary of open written option contracts is included in a table following the Fund's Investment Portfolio. For the six months ended May 31, 2013, the investment in written option contracts had a total value generally indicative of a range from approximately $54,000 to $68,000, and purchased option contracts had a total value generally indicative of a range from approximately $54,000 to $93,000.
Forward Foreign Currency Exchange Contracts. The Fund is subject to foreign exchange rate risk in its securities denominated in foreign currencies. Changes in exchange rates between foreign currencies and the U.S. dollar may affect the U.S. dollar value of foreign securities or the income or gains received on these securities. A forward foreign currency exchange contract (forward currency contract) is a commitment to purchase or sell a foreign currency at the settlement date at a negotiated rate. For the six months ended May 31, 2013, the Fund entered into forward currency contracts in order to hedge its exposure to changes in foreign currency exchange rates on its foreign currency denominated portfolio holdings and to facilitate transactions in foreign currency denominated securities.
Forward currency contracts are valued at the prevailing forward exchange rate of the underlying currencies and unrealized gain (loss) is recorded daily. On the settlement date of the forward currency contract, the Fund records a realized gain or loss equal to the difference between the value of the contract at the time it was opened and the value of the contract at the time it was closed. Certain risks may arise upon entering into forward currency contracts from the potential inability of counterparties to meet the terms of their contracts. The maximum counterparty credit risk to the Fund is measured by the unrealized gain on appreciated contracts. Additionally, when utilizing forward currency contracts to hedge, the Fund gives up the opportunity to profit from favorable exchange rate movements during the term of the contract.
A summary of the open forward currency contracts as of May 31, 2013 is included in a table following the Fund's Investment Portfolio. For the six months ended May 31, 2013, the investment in forward currency contracts short vs. U.S. dollars had a total contract value generally indicative of a range from approximately $2,321,000 to $4,014,000, and the investment in forward currency contracts long vs. U.S. dollars had a total contract value generally indicative of a range from $0 to approximately $769,000.
The following tables summarize the value of the Fund's derivative instruments held as of May 31, 2013 and the related location in the accompanying Statement of Assets and Liabilities presented by the primary underlying risk exposure:
| Asset Derivatives | | Purchased Options | | | Swap Contracts | | | Total | |
| Interest Rate Contracts (a) | | $ | 92,590 | | | $ | — | | | $ | 92,590 | |
| Credit Contracts (a) | | | — | | | | 440,329 | | | | 440,329 | |
| | | $ | 92,590 | | | $ | 440,329 | | | $ | 532,919 | |
Each of the above derivatives is located in the following Statement of Assets and Liabilities accounts:
(a) Investment in securities, at value (includes purchased options) and unrealized appreciation on swap contracts, respectively
| Liability Derivatives | | Written Options | | | Forward Contracts | | | Total | |
| Interest Rate Contracts (a) | | $ | (63,865 | ) | | $ | — | | | $ | (63,865 | ) |
| Foreign Exchange Contracts (b) | | | — | | | | (4,890 | ) | | | (4,890 | ) |
| | | $ | (63,865 | ) | | $ | (4,890 | ) | | $ | (68,755 | ) |
Each of the above derivatives is located in the following Statement of Assets and Liabilities accounts:
(a) Options written, at value
(b) Unrealized depreciation on forward foreign currency exchange contracts
Additionally, the amount of unrealized and realized gains and losses on derivative instruments recognized in Fund earnings during the six months ended May 31, 2013, and the related location in the accompanying Statement of Operations is summarized in the following tables by primary underlying risk exposure:
| Realized Gain (Loss) | | Written Options | | | Forward Contracts | | | Swap Contracts | | | Total | |
| Interest Rate Contracts (a) | | $ | 30,441 | | | $ | — | | | $ | — | | | $ | 30,441 | |
| Credit Contracts (a) | | | — | | | | | | | | 104,441 | | | | 104,441 | |
| Foreign Exchange Contracts (b) | | | — | | | | (59,193 | ) | | | — | | | | (59,193 | ) |
| | | $ | 30,441 | | | $ | (59,193 | ) | | $ | 104,441 | | | $ | 75,689 | |
Each of the above derivatives is located in the following Statement of Operations accounts:
(a) Net realized gain (loss) from written options and swap contracts, respectively
(b) Net realized gain (loss) from foreign currency (Statement of Operations includes both forward currency contracts and foreign currency transactions)
| Change in Net Unrealized Appreciation (Depreciation) | | Purchased Options | | | Written Options | | | Forward Contracts | | | Swap Contracts | | | Total | |
| Credit Contracts (a) | | $ | — | | | $ | — | | | $ | — | | | $ | 134,542 | | | $ | 134,542 | |
| Foreign Exchange Contracts (b) | | | — | | | | — | | | | 77,481 | | | | — | | | | 77,481 | |
| Interest Rate Contracts (a) | | | 38,524 | | | | (30,069 | ) | | | — | | | | — | | | | 8,455 | |
| | | $ | 38,524 | | | $ | (30,069 | ) | | $ | 77,481 | | | $ | 134,542 | | | $ | 220,478 | |
Each of the above derivatives is located in the following Statement of Operations accounts:
(a) Change in net unrealized appreciation (depreciation) on investments (includes purchased options), written options and swap contracts, respectively
(b) Change in net unrealized appreciation (depreciation) on foreign currency (Statement of Operations includes both forward currency contracts and foreign currency transactions)
C. Purchases and Sales of Securities
During the six months ended May 31, 2013, purchases and sales of investment securities (excluding short-term investments) aggregated $174,405,224 and $157,717,305, respectively.
For the six months ended May 31, 2013, transactions for written options on interest rate swaps were as follows:
| | | Contract Amount | | | Premiums | |
| Outstanding, beginning of period | | | 4,200,000 | | | $ | 109,635 | |
| Options closed | | | (2,100,000 | ) | | | (34,050 | ) |
| Outstanding, end of period | | | 2,100,000 | | | $ | 75,585 | |
D. Related Parties
Management Agreement. Under the Investment Management Agreement with Deutsche Investment Management Americas Inc. ("DIMA" or the "Advisor"), an indirect, wholly owned subsidiary of Deutsche Bank AG, the Advisor directs the investments of the Fund in accordance with its investment objectives, policies and restrictions. The Advisor determines the securities, instruments and other contracts relating to investments to be purchased, sold or entered into by the Fund. In addition to portfolio management services, the Advisor provides certain administrative services in accordance with the Investment Management Agreement. The management fee payable under the Investment Management Agreement is equal to an annualized rate of 0.85% of the Fund's average weekly net assets, computed and accrued daily and payable monthly.
Service Provider Fees. DWS Investments Service Company ("DISC"), an affiliate of the Advisor, is the transfer agent, dividend-paying agent and shareholder service agent for the Fund. Pursuant to a sub-transfer agency agreement between DISC and DST Systems, Inc. ("DST"), DISC has delegated certain transfer agent, dividend-paying agent and shareholder service agent functions to DST. DISC compensates DST out of the shareholder servicing fee it receives from the Fund. For the six months ended May 31, 2013, the amount charged to the Fund by DISC aggregated $6,491, of which $3,324 is unpaid.
Typesetting and Filing Service Fees. Under an agreement with DIMA, DIMA is compensated for providing typesetting and certain regulatory filing services to the Fund. For the six months ended May 31, 2013, the amount charged to the Fund by DIMA included in the Statement of Operations under "reports to shareholders" aggregated $10,872, of which $10,614 is unpaid.
Trustees' Fees and Expenses. The Fund paid retainer fees to each Trustee not affiliated with the Advisor, plus specified amounts to the Board Chairperson and Vice Chairperson and to each committee Chairperson.
Affiliated Cash Management Vehicle. The Fund may invest uninvested cash balances in Central Cash Management Fund, which is managed by the Advisor. The Fund indirectly bears its proportionate share of the expenses of Central Cash Management Fund. Central Cash Management Fund does not pay the Advisor an investment management fee. Central Cash Management Fund seeks a high level of current income consistent with liquidity and the preservation of capital.
E. Investing in High-Yield Securities
The Fund's performance could be hurt if a security declines in credit quality or goes into default, or if an issuer does not make timely payments of interest or principal. Because the issuers of high-yield debt securities or junk bonds (debt securities rated below the fourth-highest category) may be in uncertain financial health, the risk of loss from default by the issuer is significantly greater. Prices and yields of high-yield securities will fluctuate over time and, during periods of economic uncertainty, volatility of high-yield securities may adversely affect a fund's net asset value. Because the Fund may invest in securities not paying current interest or in securities already in default, these risks may be more pronounced.
F. Investing in Emerging Markets
Investing in emerging markets may involve special risks and considerations not typically associated with investing in developed markets. These risks include revaluation of currencies, high rates of inflation or deflation, repatriation restrictions on income and capital, and future adverse political, social and economic developments. Moreover, securities issued in these markets may be less liquid, subject to government ownership controls or delayed settlements, and may have prices that are more volatile or less easily assessed than those of comparable securities of issuers in developed markets.
G. Borrowings
During the period covered by the report, the Fund was party to a secured revolving line of credit with a commercial bank (the "Lender") in an amount up to $115,000,000 (the "Credit Facility"). The Credit Facility has an initial scheduled maturity date of June 21, 2013 (the "Initial Scheduled Maturity Date"). Unless the Credit Facility is terminated by either party or not extended by the Lender in accordance with its terms, (i) the Initial Scheduled Maturity Date automatically extends by six months on the date that is six months after June 21, 2012; and (ii) each subsequent Scheduled Maturity Date (as defined in the Credit Facility) automatically extends by six months on each date occurring every six months thereafter. Effective June 21, 2013, the Credit Facility was amended to increase the aggregate facility size to $125,000,000 and to modify the renewal terms as amended. The Credit Facility will automatically be renewed for a six-month period on each day after June 21, 2013 unless it is terminated by either party or not extended by the Lender in accordance with its terms.
Loans under the Credit Facility, at the option of the Fund and subject to certain conditions, typically bear interest with reference to LIBOR (a "LIBOR Loan") or, less frequently, with reference to a base rate (a "Base Rate Loan"). Each LIBOR Loan shall bear interest at a rate per annum equal to the applicable LIBOR rate (as defined in the Credit Facility) plus 1.25% (0.85% effective June 21, 2013). As a general matter, each Base Rate Loan shall bear interest at a rate per annum equal to the greatest of certain specified rates as set forth in the Credit Facility. At May 31, 2013, under the Credit Facility, the outstanding loans balance was $115,000,000. The borrowings were valued at cost, which approximates fair value.
Under the Credit Facility, the weighted average outstanding daily balance of all loans during the six months ended May 31, 2013 was approximately $113,478,000, with a weighted average annual borrowing cost of 1.53%. In addition, a commitment fee was charged to the Fund on the unused portion of the credit lines and is included with "interest expense" in the Statement of Operations.
Leverage involves risks and special considerations for the Fund's stockholders, including the likelihood of greater volatility of net asset value and market price of, and dividends on, the Fund's shares than a comparable portfolio without leverage; the risk that fluctuations in interest rates on such borrowings will reduce the return to stockholders; and the effect of leverage in a declining market, which is likely to cause a greater decline in the net asset value of the Fund's shares than if the Fund were not leveraged, which may result in a greater decline in the market price of the Fund's shares.
Changes in the value of the Fund's portfolio will be borne by the stockholders. If there is a net decrease (or increase) in the value of the Fund's investment portfolio, leverage will decrease (or increase) the net asset value per share to a greater extent than if leverage were not used. It is also possible that the Fund will be required to sell assets at a time when it would otherwise not do so, possibly at a loss, in order to meet payment obligations on borrowings to comply with asset coverage or other restrictions imposed by the Lender. The Fund is subject to certain restrictions on its investments, including asset coverage and portfolio composition requirements, under the terms of the Credit Facility. Such restrictions and covenants contained in the Credit Facility impose asset coverage and portfolio composition requirements that are more stringent than those imposed on the Fund by the 1940 Act.
There is no assurance that the Fund's leveraging strategy will be successful.
H. Share Repurchases
The Board has authorized the Fund to effect periodic repurchases of its outstanding shares in the open market from time to time when the Fund's shares trade at a discount to their net asset value. During the six months ended May 31, 2013 and the year ended November 30, 2012, the Fund did not repurchase shares in the open market.
Dividend Reinvestment Plan
A summary of the Fund's Dividend Reinvestment Plan (the "Plan") is set forth below. Shareholders may obtain a copy of the entire Plan by visiting the Fund's Web site at www.dws-investments.com or by writing or calling DWS Investment Service Company ("DISC") at:
P.O. Box 219066
Kansas City, Missouri 64121-9066
(800) 294-4366
If you wish to participate in the Plan and your shares are held in your own name, simply contact DISC for the appropriate form. If your shares are held in the name of a broker or other nominee, you should contact the broker or nominee in whose name your shares are held to determine whether and how you may participate in the Plan. The Fund's transfer agent and dividend disbursing agent (the "Transfer Agent") will establish a Dividend Investment Account (the "Account") for each shareholder participating in the Plan. The Transfer Agent will credit to the Account of each participant any cash dividends and capital gains distributions (collectively, "Distributions") paid on shares of the Fund (the "Shares"). Shares in a participant's Account are transferable upon proper written instructions to the Transfer Agent. Upon request to the Transfer Agent, a certificate for any or all full Shares in a participant's Account will be sent to the participant.
If, on the record date for a Distribution (the "Record Date"), Shares are trading at a discount from net asset value per Share, funds credited to a participant's Account will be used to purchase Shares (the "Purchase"). The Plan Agent (currently Computershare Inc.) will attempt, commencing five days prior to the Payment Date and ending at the close of business on the Payment Date ("Payment Date" as used herein shall mean the last business day of the month in which such Record Date occurs), to acquire Shares in the open market. If and to the extent that the Plan Agent is unable to acquire sufficient Shares to satisfy the Distribution by the close of business on the Payment Date, the Fund will issue to the Plan Agent, Shares valued at net asset value per Share in the aggregate amount of the remaining value of the Distribution. If, on the Record Date, Shares are trading at a premium over net asset value per Share, the Fund will issue on the Payment Date Shares valued at net asset value per Share on the Record Date to the Transfer Agent in the aggregate amount of the funds credited to the participants' Accounts. The Fund will increase the price at which Shares may be issued under the Plan to 95% of the fair market value of the shares on the Record Date if the net asset value per Share of the Shares on the Record Date is less than 95% of the fair market value of the Shares on the Record Date.
The reinvestment of Distributions does not relieve the participant of any tax that many be payable on the Distributions. The Transfer Agent will report to each participant the taxable amount of Distributions credited to his or her account. Participants will be treated for federal income tax purposes as receiving the amount of the Distributions made by the Fund, which amount generally will be either equal to the amount of the cash distribution the shareholder would have received if the shareholder had elected to receive cash or, for shares issued by the Fund, the fair market value of the shares issued to the shareholder.
The cost of Shares acquired for each participant's Account in connection with a Purchase shall be determined by the average cost per Share, including brokerage commissions, of the Shares acquired in connection with that Purchase. There will be no brokerage charges with respect to Shares issued directly by the Fund as a result of Distributions. However, each participant will pay a pro rata share of brokerage commissions incurred with respect to open market purchases. Brokerage charges for purchasing small amounts of Shares for individual Accounts through the Plan probably will be less than the usual brokerage charges for such transactions, as the Plan Agent will be purchasing Shares for all participants in blocks and prorating the lower commission thus attainable.
A participant may from time to time make voluntary cash contributions to his Account in a minimum amount of $100 (no more than $500 may be contributed per month). Participants making voluntary cash investments will be charged a $0.75 service fee for each such investment and will be responsible for their pro rata share of brokerage commissions. Please contact DISC for more information on voluntary cash contributions.
The Fund reserves the right to amend the Plan, including provisions with respect to any Distribution paid, subsequent to notice thereof sent to participants in the Plan at least ninety days before the record date for such Distribution, except when such amendment is necessary or appropriate to comply with applicable law or the rules or policies of the Securities and Exchange Commission or any other regulatory authority, in which case such amendment shall be effective as soon as practicable. The Plan may be terminated by the Fund.
Shareholders may withdraw from the Plan at any time by giving the Transfer Agent a written notice. A notice of withdrawal will be effective for the next Distribution following receipt of the notice by the Transfer Agent provided the notice is received by the Transfer Agent at least ten days prior to the Record Date for the Distribution. When a participant withdraws from the Plan, or when the Plan is terminated by the Fund, the participant will receive a certificate for full Shares in the Account, plus a check for any fractional Shares based on market price; or, if a participant so desires, the Transfer Agent will notify the Plan Agent to sell his Shares in the Plan and send the proceeds to the participant, less brokerage commissions and a $2.50 service fee.
Shareholders will receive tax information annually for personal records and to assist in preparation of their federal income tax returns.
| |
| Automated Information Line | | DWS Investments Closed-End Fund Info Line (800) 349-4281 |
| Web Site | | www.dws-investments.com Obtain fact sheets, financial reports, press releases and webcasts when available. |
| Written Correspondence | | Deutsche Investment Management Americas Inc. 345 Park Avenue New York, NY 10154 |
| Legal Counsel | | Vedder Price P.C. 222 North LaSalle Street Chicago, IL 60601 |
| Dividend Reinvestment Plan Agent | | Computershare Inc. P.O. Box 43078 Providence, RI 02940-3078 |
| Shareholder Service Agent and Transfer Agent | | DWS Investments Service Company P.O. Box 219066 Kansas City, MO 64121-9066 (800) 294-4366 |
| Custodian | | State Street Bank and Trust Company Lafayette Corporate Center 2 Avenue De Lafayette Boston, MA 02111 |
| Independent Registered Public Accounting Firm | | Ernst & Young LLP 200 Clarendon Street Boston, MA 02116 |
| Proxy Voting | | The fund's policies and procedures for voting proxies for portfolio securities and information about how the fund voted proxies related to its portfolio securities during the 12-month period ended June 30 are available on our Web site — www.dws-investments.com (click on "proxy voting"at the bottom of the page) — or on the SEC's Web site — www.sec.gov. To obtain a written copy of the fund's policies and procedures without charge, upon request, call us toll free at (800) 728-3337. |
| |
| Portfolio Holdings | | Following the fund's fiscal first and third quarter-end, a complete portfolio holdings listing is filed with the SEC on Form N-Q. This form will be available on the SEC's Web site at www.sec.gov, and it also may be reviewed and copied at the SEC's Public Reference Room in Washington, D.C. Information on the operation of the SEC's Public Reference Room may be obtained by calling (800) SEC-0330. The fund's portfolio holdings as of the month-end are posted on www.dws-investments.com on or after the last day of the following month. More frequent posting of portfolio holdings information may be made from time to time on www.dws-investments.com. |
| Investment Management | | Deutsche Investment Management Americas Inc. ("DIMA" or the "Advisor"), which is part of Deutsche Asset & Wealth Management, is the investment advisor for the fund. DIMA and its predecessors have more than 80 years of experience managing mutual funds and DIMA provides a full range of investment advisory services to both institutional and retail clients. DIMA is an indirect, wholly owned subsidiary of Deutsche Bank AG. Deutsche Bank AG is a major global banking institution engaged in a wide variety of financial services, including investment management, retail, private and commercial banking, investment banking and insurance. DWS Investments is the retail brand name in the U.S. for the asset management activities of Deutsche Bank AG and DIMA. As such, DWS is committed to delivering the investing expertise, insight and resources of this global investment platform to American investors. |
| NYSE Symbol | | KMM |
| CUSIP Number | | 23338L 108 |
| FACTS | | What Does DWS Investments Do With Your Personal Information? |
| Why? | | Financial companies choose how they share your personal information. Federal law gives consumers the right to limit some but not all sharing. Federal law also requires us to tell you how we collect, share and protect your personal information. Please read this notice carefully to understand what we do. |
| What? | | The types of personal information we collect and share can include: • Social Security number • Account balances • Purchase and transaction history • Bank account information • Contact information such as mailing address, e-mail address and telephone number |
| How? | | All financial companies need to share customers' personal information to run their everyday business. In the section below, we list the reasons financial companies can share their customers' personal information, the reasons DWS Investments chooses to share and whether you can limit this sharing. |
| Reasons we can share your personal information | Does DWS Investments share? | Can you limit this sharing? |
For our everyday business purposes — such as to process your transactions, maintain your account(s), respond to court orders or legal investigations | Yes | No |
For our marketing purposes — to offer our products and services to you | Yes | No |
| For joint marketing with other financial companies | No | We do not share |
For our affiliates' everyday business purposes — information about your transactions and experiences | No | We do not share |
For our affiliates' everyday business purposes — information about your creditworthiness | No | We do not share |
| For non-affiliates to market to you | No | We do not share |
| Questions? | Call (800) 728-3337 or e-mail us at dws-investments.info@dws.com |
| Who we are |
| Who is providing this notice? | | DWS Investments Distributors, Inc.; Deutsche Investment Management Americas Inc.; DeAM Investor Services, Inc.; DWS Trust Company; the DWS Funds |
| What we do |
| How does DWS Investments protect my personal information? | | To protect your personal information from unauthorized access and use, we use security measures that comply with federal law. These measures include computer safeguards and secured files and buildings. |
| How does DWS Investments collect my personal information? | | We collect your personal information, for example. When you: • open an account • give us your contact information • provide bank account information for ACH or wire transactions • tell us where to send money • seek advice about your investments |
| Why can't I limit all sharing? | | Federal law gives you the right to limit only • sharing for affiliates' everyday business purposes — information about your creditworthiness • affiliates from using your information to market to you • sharing for nonaffiliates to market to you State laws and individual companies may give you additional rights to limit sharing. |
| Definitions |
| Affiliates | | Companies related by common ownership or control. They can be financial or non-financial companies. Our affiliates include financial companies with the DWS or Deutsche Bank ("DB") name, such as DB AG Frankfurt and DB Alex Brown. |
| Non-affiliates | | Companies not related by common ownership or control. They can be financial and non-financial companies. Non-affiliates we share with include account service providers, service quality monitoring services, mailing service providers and verification services to help in the fight against money laundering and fraud. |
| Joint marketing | | A formal agreement between non-affiliated financial companies that together market financial products or services to you. DWS Investments does not jointly market. |
Notes
Pursuant to the requirements of the Securities Exchange Act of 1934 and the Investment Company Act of 1940, the registrant has duly caused this report to be signed on its behalf by the undersigned, thereunto duly authorized.
Pursuant to the requirements of the Securities Exchange Act of 1934 and the Investment Company Act of 1940, this report has been signed below by the following persons on behalf of the registrant and in the capacities and on the dates indicated.