AS FILED ELECTRONICALLY WITH THE SECURITIES AND EXCHANGE COMMISSION ON
SEPTEMBER 27, 2010
SECURITIES ACT FILE NO. 333-
SECURITIES AND EXCHANGE COMMISSION
Washington, D.C. 20549
FORM N-14
REGISTRATION STATEMENT
UNDER
THE SECURITIES ACT OF 1933 x
Pre-Effective Amendment No. ¨
Post-Effective Amendment No. ¨
RIVERSOURCE GLOBAL SERIES, INC.
(Exact Name of Registrant as Specified in Charter)
50606 Ameriprise Financial Center
Minneapolis, MN 55474
(Address of Principal Executive Offices) (Zip Code)
612-671-1947
(Registrant’s Area Code and Telephone Number)
Scott R. Plummer
5228 Ameriprise Financial Center
Minneapolis, MN 55474
(Name and Address of Agent for Service)
With a copy to:
Brian D. McCabe, Esq.
Ropes & Gray LLP
One International Place
Boston, Massachusetts 02110
TITLE OF SECURITIES BEING REGISTERED:
Class A, Class B, Class C, Class I, Class R, Class R4 and Class Z shares of the Columbia Global Equity Fund series of the Registrant.
Approximate Date of Proposed Public Offering: As soon as practicable after the effective date of this Registration Statement.
No filing fee is required because an indefinite number of shares have previously been registered pursuant to Rule 24f-2 under the Investment Company Act of 1940.
It is proposed that this filing will become effective on October 27, 2010 pursuant to Rule 488 under the Securities Act of 1933.
Threadneedle Global Equity Income Fund
Columbia Global Value Fund
Columbia World Equity Fund
COMBINED PROXY STATEMENT/PROSPECTUS
[—], 2010
This is a brief overview of the reorganization proposed for your fund. We encourage you to read the full text of the enclosed combined proxy statement/prospectus.
Q: Why am I being asked to vote?
Funds are required to obtain shareholder approval for certain kinds of changes, like the reorganizations proposed in the enclosed combined proxy statement/prospectus. As a shareholder of one of the above-listed funds, you are being asked to vote on a reorganization involving your fund.
Q: What is a fund reorganization?
A fund reorganization results in one fund transferring all of its assets and liabilities to another fund in exchange for shares of such fund. Once completed, shareholders of the selling fund will hold shares of the buying fund.
Q: Is my vote important?
Absolutely! While the Board of Directors or Board of Trustees (the “Board”) of each fund listed above has reviewed the proposed reorganizations and recommends that you approve them, these transactions generally cannot go forward without the approval of shareholders. Until a fund is sure that a quorum has been reached, it will continue to contact shareholders asking them to vote.
Q: On what am I being asked to vote?
In connection with the reorganization (a “Reorganization”) of one or more funds (each a “Selling Fund” and together, the “Selling Funds”) into another fund (the “Buying Fund”), you are being asked to vote on the Reorganizations of your Selling Fund(s) into the Buying Fund as noted in the table below:
| | |
Selling Fund | | Buying Fund |
| Columbia Global Value Fund | | Columbia Global Equity Fund (formerly, Threadneedle Global Equity Fund) |
| Columbia World Equity Fund | | Columbia Global Equity Fund (formerly, Threadneedle Global Equity Fund) |
| Threadneedle Global Equity Income Fund | | Columbia Global Equity Fund (formerly, Threadneedle Global Equity Fund) |
If the Reorganization of your Selling Fund is approved by shareholders and the other closing conditions are met, your shares of the Selling Fund will, in effect, be converted into shares of a corresponding class of the Buying Fund with the same aggregate net asset value as that of your Selling Fund shares at the time of the Reorganization. (Selling Funds and the Buying Fund are referred to individually or collectively as a “Fund” or the “Funds,” respectively, in the attached documents.) While the aggregate net asset value of your shares will not change as a result of the Reorganization, the number of shares you hold may differ based on each Fund’s net asset value.
We encourage you to read the full text of the enclosed combined proxy statement/prospectus to obtain a more detailed understanding of the issues relating to each proposed Reorganization.
Q: Why are the Reorganizations being proposed?
On May 1, 2010, Ameriprise Financial, Inc., the parent company of Columbia Management Investment Advisers, LLC (formerly known as RiverSource Investments, LLC), the Funds’ investment manager (“Columbia Management”), closed its acquisition of the long-term asset management business of Columbia Management Group, LLC and certain of its affiliated companies from Bank of America, N.A. (the “Transaction”). In connection with the Transaction, Columbia Management became the investment manager of the Columbia-branded funds, in addition to the RiverSource-, Seligman- and Threadneedle-branded funds.
The proposed Reorganizations are among the reorganizations recommended by Columbia Management following the Transaction. Columbia Management’s overall goal in proposing the reorganizations is twofold. First, by combining Columbia-, RiverSource-, Seligman- and Threadneedle-branded funds with generally similar investment objectives, strategies and policies, each combined investment portfolio will be larger, which tends to lead to greater efficiency. Second, by streamlining the product offering of the combined fund complex (the “Combined Fund Complex”), management, administration, distribution and other resources can be focused more effectively on a smaller group of funds. The Reorganization of each Selling Fund into the Buying Fund will enable shareholders of each Selling Fund to invest in a larger, potentially more efficient portfolio while continuing to pursue a similar investment strategy.
Q: Will there be any changes to the options or services associated with my account as a result of the mergers?
Account-level features and options such as dividend distributions, dividend diversification, automatic investment plans, systematic withdrawals and dollar cost averaging will automatically carry over from accounts in Selling Funds to accounts in the Buying Fund.
Q: Are there costs or tax consequences of the Reorganizations?
You will not pay any sales charge in connection with the Reorganizations. Reorganization costs will be allocated to each Fund only to the extent they are expected to be offset by the anticipated reduction in expenses borne by the Fund’s shareholders during the first year following the Reorganization. Each Reorganization is expected to be tax-free for U.S. federal income tax purposes. Accordingly, no gain or loss is expected to be recognized by the Selling Fund or its shareholders as a direct result of a Reorganization. A portion, which may be substantial, of the portfolio assets of a Buying or Selling Fund may be sold before or after the Reorganization in connection with its Reorganization. Such sales will result in such Fund incurring transaction costs and may result in a taxable distribution of gains to shareholders.
Q: If approved, when will the Reorganizations happen?
The Reorganizations will take place as soon as practicable following shareholder approval, and are expected to close before the end of the second quarter of 2011.
Q: How does my Board recommend that I vote?
After careful consideration, your Board recommends that you vote FOR the Reorganization of your Selling Fund.
Q: How can I vote?
You can vote in one of four ways:
| | • | | By telephone ([[phone number]]) |
| | • | | By internet ([[internet url]]) |
| | • | | By mail (using the enclosed postage prepaid envelope) |
-2-
| | • | | In person at the shareholder meeting scheduled to occur in [[XXXX location]] on [[MM/DD/YY]] |
The deadline for voting by telephone or internet is [[MM/DD/YY]]. We encourage you to vote as soon as possible to avoid the cost of additional solicitation efforts. Please refer to the enclosed proxy card for instructions for voting by telephone, internet or mail.
Q: Will I be notified of the results of the vote?
Please check www.columbiamanagement.com for updated information on the Reorganizations including voting results.
Q: Whom should I call if I have questions?
If you have questions about any of the proposals described in the combined proxy statement/prospectus or about voting procedures, please call the Selling Funds’ proxy solicitor, [—], toll free at [—].
-3-
NOTICE OF A JOINT SPECIAL MEETING OF SHAREHOLDERS
| | |
| Columbia Funds Series Trust | | RiverSource Global Series, Inc. |
Columbia Global Value Fund | | Threadneedle Global Equity Income Fund |
| Columbia Funds Series Trust I | | |
Columbia World Equity Fund | | |
To be held [—], 2011
A Joint Special Meeting of Shareholders (the “Meeting”) of each of the Funds listed above (each a “Selling Fund”) will be held at [—] [a.m./p.m.] on [—] 2011, at [—] in the [—] room on the [—] floor. At the Meeting, shareholders will consider the following proposal with respect to their Selling Fund:
To approve the Agreement and Plan of Reorganization (the “Agreement”) by and among Columbia Funds Series Trust, on behalf of its Columbia Global Value Fund series, Columbia Funds Series Trust I, on behalf of its Columbia World Equity Fund series, RiverSource Global Series, Inc. on behalf of its Threadneedle Global Equity Income Fund series, RiverSource Series Trust, on behalf of its Columbia Global Equity Fund (formerly, Threadneedle Global Equity Fund) series, certain other registered investment companies and Columbia Management Investment Advisers, LLC, pursuant to which each Selling Fund will transfer that portion of its assets attributable to each class of its shares (in aggregate, all of its assets) to the buying fund, as indicated below (the “Buying Fund”) in exchange for shares of a corresponding class of the Buying Fund and the assumption by the Buying Fund of all of the liabilities of the Selling Fund. The Buying Fund shares will be distributed proportionately to shareholders of the relevant class of the Selling Fund.
Shareholders of each Selling Fund will vote separately on the relevant proposal, as shown below.
| | | | |
Selling Fund | | Buying Fund | | Proposal # |
| Columbia Global Value Fund | | Columbia Global Equity Fund* (formerly, Threadneedle Global Equity Fund) | | 1 |
| Columbia World Equity Fund | | Columbia Global Equity Fund* (formerly, Threadneedle Global Equity Fund) | | 1 |
| Threadneedle Global Equity Income Fund | | Columbia Global Equity Fund* (formerly, Threadneedle Global Equity Fund) | | 1 |
| * | The Board of RiverSource Global Series, Inc. has approved the redomiciling of Columbia Global Equity Fund, a series of RiverSource Global Series, Inc., into a newly created series of RiverSource Series Trust that has also been named Columbia Global Equity Fund (the “Redomiciling”). The Redomiciling is subject to approval by shareholders of Columbia Global Equity Fund. If the Redomiciling is approved by shareholders of Columbia Global Equity Fund, it is expected that the Redomiciling will occur prior to the Reorganizations, in which case the Buying Fund will be the newly created series of RiverSource Series Trust. If the Redomiciling has not been completed prior to the closing of the Reorganization, the Buying Fund will be the existing series of RiverSource Global Series, Inc. |
Please take some time to read the enclosed combined proxy statement/prospectus. It discusses the proposal in more detail. If you were a shareholder on [[December 17]], 2010, you may vote at the Meeting or at any adjournment or postponement of the Meeting. You are welcome to attend the Meeting in person. If you cannot attend in person, please vote by mail, telephone or internet. Just
follow the instructions on the enclosed proxy card. If you have questions, please call the Selling Funds’ proxy solicitor toll free at [—]. It is important that you vote. The Board of Directors/Trustees of each Selling Fund recommends that you vote FOR its Reorganization.
By order of the Boards of Directors/Trustees

Scott R. Plummer, Secretary
[—], 2010
-2-
Threadneedle Global Equity Income Fund
Columbia Global Value Fund
Columbia World Equity Fund
COMBINED PROXY STATEMENT/PROSPECTUS
Dated [—], 2010
This document is a proxy statement for each Selling Fund (as defined below) and a prospectus for the Buying Fund (as defined below). The address and telephone number of each Selling Fund and the Buying Fund is c/o Columbia Management Investment Services Corp., P.O. Box 8081, Boston, MA 02266-8081, and 800.345.6611. This combined proxy statement/prospectus and the enclosed proxy card were first mailed to shareholders of each Selling Fund beginning on or about January [—], 2011. This combined proxy statement/prospectus contains information you should know before voting on the following proposal with respect to your Selling Fund, as indicated below:
| | | | |
Proposal | | To be voted on by shareholders of: |
| | To approve an Agreement and Plan of Reorganization by and among RiverSource Global Series, Inc., on behalf of its Threadneedle Global Equity Income Fund series, Columbia Funds Series Trust, on behalf of its Columbia Global Value Fund series, Columbia Funds Series Trust I, on behalf of its Columbia World Equity Fund series (each a “Selling Fund”), RiverSource Series Trust, on behalf of its Columbia Global Equity Fund series (a “Buying Fund”)*, each an open-end registered investment company, certain other registered investment companies and Columbia Management Investment Advisers, LLC. Under the agreement, each Selling Fund will transfer that portion of its assets attributable to each class of its shares (in aggregate, all of its assets) to the Buying Fund in exchange for shares of the corresponding class of the Buying Fund (as indicated below) and the assumption by the Buying Fund of all of the liabilities of the Selling Fund. The Buying Fund shares will be distributed proportionately to shareholders of the relevant class of the Selling Fund. | | Threadneedle Global Equity Income Fund, Columbia Global Value Fund and Columbia World Equity Fund |
| | | | |
Selling Funds | | | | Buying Fund |
| Class A | | g | | Class A |
| Class B | | g | | Class B |
| Class C | | g | | Class C |
| Class I | | g | | Class I |
| Class R** | | g | | Class R |
| Class R4 | | g | | Class R4 |
| Class Z | | g | | Class Z |
| * | The Board of RiverSource Global Series, Inc. has approved the redomiciling of Columbia Global Equity Fund, a series of RiverSource Global Series, Inc., into a newly created series of RiverSource Series Trust that has also been named Columbia Global Equity Fund (the “Redomiciling”). The Redomiciling is subject to approval by shareholders of Columbia Global Equity Fund. If the Redomiciling is approved by shareholders of Columbia Global Equity Fund, it is expected that the Redomiciling will occur prior to the Reorganizations, in which case the Buying Fund will be the newly created series of RiverSource Series Trust. If the Redomiciling has not been completed prior to the closing of the Reorganization, the Buying Fund will be the existing series of RiverSource Global Series, Inc. Except as otherwise noted, information contained herein relating to the Buying Fund applies to both the existing series of RiverSource Global Series, Inc. and the newly-created series of RiverSource Series Trust. |
| ** | Class R shares of Threadneedle Global Equity Income Fund and Columbia Global Equity Fund were formerly named Class R2 shares. |
The proposal will be considered by shareholders who owned shares of the Selling Funds on [[December 17]], 2010, at a joint special meeting of shareholders (the “Meeting”) that will be held at [—] [[a.m./p.m.]] on [—], 2011, at [—] in the [—] room on the [—] floor. Each of the Selling Funds and the Buying Fund (each a “Fund” and collectively, the “Funds”) is a registered open-end management investment company (or a series thereof). Please read this combined proxy statement/prospectus and keep it for future reference.
Although the Board of Directors/Trustees (the “Board”) of each Selling Fund* recommends that shareholders approve the reorganization of the Selling Fund into the Buying Fund (each a “Reorganization”), the Reorganization of each Selling Fund is not conditioned upon the Reorganization of any other Selling Fund. Accordingly, if shareholders of one Selling Fund approve its Reorganization, but shareholders of a second Selling Fund do not approve the second Selling Fund’s Reorganization, it is expected that the Reorganization of the first Selling Fund will take place as described in this combined proxy statement/prospectus. If shareholders of any Selling Fund fail to approve its Reorganization, the Board of such Selling Fund will consider what other actions, if any, may be appropriate.
| * | References to the Board of a Fund refer to the Board of the corporation or trust of which the Fund is a series. |
How Each Reorganization Will Work
| | • | | Each Selling Fund will transfer all of its assets to the Buying Fund in exchange for shares of such Buying Fund (“Reorganization Shares”) and the assumption by the Buying Fund of all of the Selling Fund’s liabilities. |
| | • | | The Buying Fund will issue Reorganization Shares with an aggregate net asset value equal to the aggregate value of the assets that it receives from the corresponding Selling Fund, less the liabilities it assumes from the corresponding Selling Fund. Each class of Reorganization Shares will be distributed to the shareholders of the corresponding class of the Selling Fund in liquidation of the Selling Fund in proportion to their holdings in such class of the Selling Fund. For example, holders of Class A shares of a Selling Fund will receive Class A shares of the Buying Fund with the same aggregate net asset value as their Selling Fund Class A shares at the time of the Reorganization. You will not pay any sales charge in connection with the receipt or distribution of Reorganization Shares. If you already have a Buying Fund account with exactly the same registration as your Selling Fund account, your Reorganization Shares typically will be added to that account. |
| | • | | Reorganization costs will be allocated to each Fund only to the extent they are expected to be offset by the anticipated reduction in expenses borne by the Fund’s shareholders during the first year following the Reorganization. Each Reorganization is expected to be tax-free for U.S. federal income tax purposes. Accordingly, no gain or loss is expected to be recognized by the Selling Fund or its shareholders as a direct result of a Reorganization. A portion, which may be substantial, of the portfolio assets of a Buying or Selling Fund may be sold before or after the Reorganization in connection with its Reorganization. Such sales will result in such Fund incurring transaction costs and may result in a taxable distribution of gains to shareholders. |
2
Where to Get More Information
The following documents have been filed with the Securities and Exchange Commission (the “SEC”) and are incorporated into this combined proxy statement/prospectus by reference:
| | • | | The Statement of Additional Information of the Buying Funds relating to the Reorganizations (the “Merger SAI”), dated [—], 2010; |
Columbia Global Value Fund
| | • | | the prospectuses of Columbia Global Value Fund, dated July 1, 2010, as supplemented to date; |
| | • | | the Statement of Additional Information of Columbia Global Value Fund dated July 1, 2010, as supplemented to date; |
| | • | | the Report of the Independent Registered Public Accounting Firm and the audited financial statements included in the Annual Report to Shareholders of Columbia Global Value Fund for the year ended February 28, 2010; |
Columbia World Equity Fund
| | • | | the prospectuses of Columbia World Equity Fund, dated August 1, 2010, as supplemented to date; |
| | • | | the Statement of Additional Information of Columbia World Equity Fund dated August 1, 2010, as supplemented to date; |
| | • | | the Report of the Independent Registered Public Accounting Firm and the audited financial statements included in the Annual Report to Shareholders of Columbia World Equity Fund for the year ended March 31, 2010; and |
Threadneedle Global Equity Income Fund
| | • | | the prospectus of Threadneedle Global Equity Income Fund, dated December 30, 2009, as supplemented to date; |
| | • | | the Statement of Additional Information of Threadneedle Global Equity Income Fund dated August 27, 2010, as supplemented to date; |
| | • | | the Report of the Independent Registered Public Accounting Firm and the audited financial statements included in the Annual Report to Shareholders of Threadneedle Global Equity Income Fund for the year ended October 31, 2009, and the unaudited financial statements included in the Semiannual Report to Shareholders of Threadneedle Global Equity Income Fund for the period ended April 30, 2010. |
For a free copy of any of the documents listed above and/or to ask questions about this combined proxy statement/prospectus, please call your Selling Fund’s proxy solicitor toll free at [—].
Each of the Funds is subject to the information requirements of the Securities Exchange Act of 1934 and the Investment Company Act of 1940, as amended (the “1940 Act”) and files reports, proxy materials and other information with the SEC. These reports, proxy materials and other information can be inspected and copied at the Public Reference Room maintained by the SEC. Copies may be obtained, after paying a duplicating fee, by electronic request at publicinfo@sec.gov, or by writing to the Public Reference Branch of the SEC, Office of Consumer Affairs and Information Services, 100 F Street, N.E., Washington, D.C. 20549-0102. In addition, copies of these documents may be viewed online or downloaded from the SEC’s website at www.sec.gov.
Please note that investments in the Funds are not bank deposits, are not federally insured, are not guaranteed by any bank or government agency and may lose value. There is no assurance that any Fund will achieve its investment objectives.
As with all open-end mutual funds, the SEC has not approved or disapproved these securities or passed on the adequacy of this combined proxy statement/prospectus. Any representation to the contrary is a criminal offense.
3
TABLE OF CONTENTS
4
SECTION A — REORGANIZATION PROPOSAL
The following information describes each proposed Reorganization.
SUMMARY
This combined proxy statement/prospectus is being used by each Selling Fund to solicit proxies to vote at a joint special meeting of shareholders. Shareholders of each Selling Fund will consider a proposal to approve the Agreement and Plan of Reorganization (the “Agreement”) providing for the Reorganization of their Selling Fund into the Buying Fund.
The following is a summary. More complete information appears later in this proxy statement/prospectus. You should read the entire proxy statement/prospectus and the exhibits because they contain details that are not included in this summary.
How Each Reorganization Will Work
| | • | | Each Selling Fund will transfer all of its assets to the Buying Fund in exchange for Reorganization Shares and the assumption by the Buying Fund of all of the Selling Fund’s liabilities. |
| | • | | The Buying Fund will issue Reorganization Shares with an aggregate net asset value equal to the aggregate value of the assets that it receives from the corresponding Selling Fund, less the liabilities it assumes from the corresponding Selling Fund. Reorganization Shares of each class of the Buying Fund will be distributed to the shareholders of the corresponding class of the corresponding Selling Fund in proportion to their holdings of such class of such Selling Fund. For example, holders of Class A shares of a Selling Fund will receive Class A shares of the Buying Fund with the same aggregate net asset value as the aggregate net asset value of their Selling Fund Class A shares at the time of the Reorganization. |
| | • | | As part of the Reorganization of your Selling Fund, systematic transactions (such as bank authorizations and systematic payouts) currently set up for your Selling Fund account may be transferred to your new Buying Fund account. Please contact your financial intermediary for additional details. |
| | • | | No shareholders of any Selling Fund will pay any sales charge in connection with acquiring Reorganization Shares. |
| | • | | After a Reorganization is completed, Selling Fund shareholders will be shareholders of the Buying Fund, and the Selling Fund will be dissolved. |
Tax Consequences
Each Reorganization is expected to be tax-free for U.S. federal income tax purposes and will not take place unless the Selling Fund and the Buying Fund receive a satisfactory opinion of tax counsel substantially to the effect that it will be tax-free, as described in more detail in the section entitled “Tax Status of the Reorganizations.” Accordingly, no gain or loss is expected to be recognized by the Selling Fund or its shareholders as a direct result of a Reorganization. A portion, which may be substantial, of the portfolio assets of a Buying or Selling Fund may be sold before or after the Reorganization in connection with its Reorganization. The actual tax effect of such sales will depend on the difference between the price at which such portfolio assets are sold and the tax basis in such assets of the Fund making that sale. Any capital gains recognized in those sales on a net basis, after reduction by any available capital losses, will be distributed to shareholders as capital gain dividends (to the extent of net realized long-term capital gains over net realized short-term capital losses) and/or ordinary dividends (to the extent of net realized short-term capital gains over net realized long-term capital losses) during or with respect to the year of sale, and such distributions will be taxable to shareholders. Additionally, because each Reorganization will end the tax year of the applicable Selling Fund, it will accelerate distributions to shareholders from the Selling Fund for its short tax year ending on the date of the Reorganization. Those tax year-end distributions will be taxable, and will include any distributable, but not previously distributed, capital gains resulting from portfolio turnover prior to consummation of the Reorganization. At any time prior to a Reorganization, a shareholder may redeem shares of a Selling Fund. This would likely result in the recognition of gain or loss by the shareholder for U.S. federal income tax purposes. If a shareholder holds Selling Fund shares in a non-taxable account, distributions and redemption proceeds with respect to those shares will not be taxable to the shareholder if those amounts remain in the non-taxable account.
The Selling Fund shareholders’ aggregate tax basis in the Reorganization Shares is expected to carry over from the shareholders’ Selling Fund shares, and the Selling Fund shareholders’ holding period in the Reorganization Shares is expected to include the shareholders’ holding period in the Selling Fund shares.
5
For more information about the U.S. federal income tax consequences of the Reorganizations, see the section entitled “Tax Status of the Reorganizations.”
Fees and Expenses
The following tables describe the fees and expenses that you may pay if you buy and hold shares of a Fund.
Annual fund operating expense ratios are based on expenses incurred during each Fund’s most recently completed fiscal year, and are expressed as a percentage (expense ratio) of the Fund’s average net assets during the period. Pro forma expense ratios shown are based on each Fund’s average net assets over the Buying Fund’s most recently completed fiscal year. As of the date of this combined proxy statement/prospectus, each Fund’s net assets may be lower or higher than the Fund’s average net assets over such period. In general, a Fund’s annual operating expense ratios will increase as the Fund’s assets decrease and will decrease as the Fund’s assets increase. Accordingly, each Fund’s annual operating expense ratios, if adjusted based on net assets as of the date of this combined proxy statement/prospectus, could be higher or lower than those shown in the tables below. The commitment by Columbia Management Investment Advisers, LLC (“Columbia Management”) and its affiliates to waive fees and/or to reimburse expenses, as noted below, limits the effect that any decrease in the Buying Fund’s net assets will have on its annual net operating expense ratios in the current fiscal year.
The fees and expenses below exclude one-time costs of the Reorganization. The costs of each Reorganization expected to be borne by each Fund are set forth in Exhibit A.
6
Fees and Expenses. Reorganization of each of Columbia Global Value Fund, Columbia World Equity Fund and Threadneedle Global Equity Income Fund into Columbia Global Equity Fund (formerly, Threadneedle Global Equity Fund)1
If the Reorganizations occur, certain Reorganization expenses, as described in Exhibit A, will be allocated to each Selling Fund, which will reduce such Selling Fund’s net asset value prior to the closing of the Reorganizations by less than $0.01 per share based on each Selling Fund’s shares outstanding as of August 31, 2010.
Current and Pro Forma Fees and Expenses for the Most Recent Fiscal Year
Shareholder Fees (fees paid directly from your investment)
| | | | | | | | | | | | | | | | | |
| Columbia Global Value Fund (Current) (Selling Fund) | | Class A | | | Class B | | | Class C | | | Class Z | | | | | | |
Maximum sales charge (load) imposed on purchases (as a percentage of offering price) | | 5.75 | %(a) | | N/A | | | N/A | | | N/A | | | | | | |
Maximum deferred sales charge (load) imposed on sales (as a percentage of net asset value at the time of your purchase or sale, whichever is lower) | | 1.00 | %(b) | | 5.00 | %(c) | | 1.00 | %(d) | | N/A | | | | | | |
| | | | | | | |
| Columbia World Equity Fund (Current) (Selling Fund) | | Class A | | | Class B | | | Class C | | | | | | | | | |
Maximum sales charge (load) imposed on purchases (as a percentage of offering price) | | 5.75 | %(a) | | N/A | | | N/A | | | | | | | | | |
Maximum deferred sales charge (load) imposed on sales (as a percentage of net asset value at the time of your purchase or sale, whichever is lower) | | 1.00 | %(b) | | 5.00 | %(c) | | 1.00 | %(d) | | | | | | | | |
| | | | | | | |
Threadneedle Global Equity Income Fund (Current)
(Selling Fund) | | Class A | | | Class B | | | Class C | | | Class I | | Class R(f) | | Class R4 | | |
Maximum sales charge (load) imposed on purchases (as a percentage of offering price) | | 5.75 | %(a) | | N/A | | | N/A | | | N/A | | N/A | | N/A | | |
Maximum deferred sales charge (load) imposed on sales (as a percentage of net asset value at the time of your purchase or sale, whichever is lower) | | 1.00 | %(b) | | 5.00 | %(c) | | 1.00 | %(d) | | N/A | | N/A | | N/A | | |
| | | | | | | |
Columbia Global Equity Fund (Current and Pro Forma)
(Buying Fund) | | Class A | | | Class B | | | Class C | | | Class I | | Class R(f) | | Class R4 | | Class Z |
Maximum sales charge (load) imposed on purchases (as a percentage of offering price) | | 5.75 | %(a) | | N/A | | | N/A | | | N/A | | N/A | | N/A | | N/A |
Maximum deferred sales charge (load) imposed on sales (as a percentage of net asset value at the time of your purchase or sale, whichever is lower) | | 1.00 | %(b) | | 5.00 | %(c) | | 1.00 | %(d) | | N/A | | N/A | | N/A | | N/A |
| 1 | All fee and expense, performance and capitalization information attributed to Columbia Global Equity Fund herein, including pro forma information, reflects information about the existing Columbia Global Equity Fund, even though the Buying Fund may be either the existing series or the newly created series. |
7
| (a) | This charge may be reduced depending on the total value of your investments in the Columbia-, RiverSource-, Threadneedle- and Seligman-branded funds (the “Combined Fund Complex”). |
| (b) | This charge applies to investors who buy between $1 million and $50 million of Class A shares and redeem them within 18 months of purchase, charged as follows: 1.00% CDSC if redeemed within 12 months of purchase, and 0.50% CDSC if redeemed more than 12, but less than 18, months after purchase, with certain limited exceptions. |
| (c) | This charge decreases over time. |
| (d) | This charge applies to investors who buy Class C shares and redeem them within one year of purchase, with certain limited exceptions. |
| (e) | Share classes shown reflect share classes added September 27, 2010. |
| (f) | Class R shares of Threadneedle Global Equity Income Fund and the Buying Fund were formerly named Class R2 shares. |
Annual Fund Operating Expenses (expenses that you pay each year as a percentage of the value of your investment):
| | | | | | | | | | | | |
| Columbia Global Value Fund (Current) (Selling Fund) | | Class A | | | Class B | | | Class C | | | Class Z | |
Management fees(1) | | 1.07 | % | | 1.07 | % | | 1.07 | % | | 1.07 | % |
Distribution and/or service (12b-1) fees | | 0.25 | % | | 1.00 | % | | 1.00 | % | | 0.00 | % |
Other expenses(2) | | 0.60 | % | | 0.60 | % | | 0.60 | % | | 0.60 | % |
| | | | | | | | | | | | |
Total annual Fund operating expenses(3) | | 1.92 | % | | 2.67 | % | | 2.67 | % | | 1.67 | % |
| | | | |
| Columbia World Equity Fund (Current) (Selling Fund) | | Class A | | | Class B | | | Class C | | | | |
Management fees(4) | | 0.65 | % | | 0.65 | % | | 0.65 | % | | | |
Distribution and/or service (12b-1) fees | | 0.25 | % | | 1.00 | % | | 1.00 | % | | | |
Other expenses(2) | | 0.72 | % | | 0.72 | % | | 0.72 | % | | | |
Acquired fund fees and expenses(5) | | 0.09 | % | | 0.09 | % | | 0.09 | % | | | |
| | | | | | | | | | | | |
Total annual Fund operating expenses(6) | | 1.71 | % | | 2.46 | % | | 2.46 | % | | | |
8
| | | | | | | | | | | | | | | | | | |
| Threadneedle Global Equity Income Fund (Current) (Selling Fund) | | Class A | | | Class B | | | Class C | | | Class I | | | Class R(12) | | | Class R4 | |
Management fees(7) | | 0.93 | % | | 0.93 | % | | 0.93 | % | | 0.93 | % | | 0.93 | % | | 0.93 | % |
Distribution and/or service (12b-1) fees | | 0.25 | % | | 1.00 | % | | 1.00 | % | | 0.00 | % | | 0.50 | % | | 0.00 | % |
Other expenses(8) | | 1.17 | % | | 1.17 | % | | 1.17 | % | | 0.95 | % | | 1.17 | % | | 1.25 | % |
| | | | | | | | | | | | | | | | | | |
Total annual Fund operating expenses | | 2.35 | % | | 3.10 | % | | 3.10 | % | | 1.88 | % | | 2.60 | % | | 2.18 | % |
Fee waiver/expense reimbursement(9) | | (0.85 | %) | | (0.85 | %) | | (0.85 | %) | | (0.79 | %) | | (0.85 | %) | | (0.79 | %) |
| | | | | | | | | | | | | | | | | | |
Net annual Fund operating expenses | | 1.50 | % | | 2.25 | % | | 2.25 | % | | 1.09 | % | | 1.75 | % | | 1.39 | % |
| | | | | | | | | | | | | | | | | | |
| Columbia Global Equity Fund (Current) (Buying Fund) | | Class A | | | Class B | | | Class C | | | Class I | | | Class R(12) | | | Class R4 | |
Management fees(10) | | 0.87 | % | | 0.87 | % | | 0.87 | % | | 0.87 | % | | 0.87 | % | | 0.87 | % |
Distribution and/or service (12b-1) fees | | 0.25 | % | | 1.00 | % | | 1.00 | % | | 0.00 | % | | 0.50 | % | | 0.00 | % |
Other expenses(8) | | 0.37 | % | | 0.37 | % | | 0.37 | % | | 0.08 | % | | 0.37 | % | | 0.38 | % |
| | | | | | | | | | | | | | | | | | |
Total annual Fund operating expenses | | 1.49 | % | | 2.24 | % | | 2.24 | % | | 0.95 | % | | 1.74 | % | | 1.25 | % |
Fee waiver/expense reimbursement(11) | | (0.13 | %) | | (0.13 | %) | | (0.13 | %) | | (0.06 | %) | | (0.13 | %) | | (0.06 | %) |
| | | | | | | | | | | | | | | | | | |
Net annual Fund operating expenses | | 1.36 | % | | 2.11 | % | | 2.11 | % | | 0.89 | % | | 1.61 | % | | 1.19 | % |
| 1. | Management fees are composed of an investment management services fee of 0.90% and an administration fee of 0.17%. |
| 2. | Other expenses have been adjusted to reflect changes in contractual transfer agency fee rates, effective September 4, 2010, and other changes to contractual fee rates, expected to be effective in the second quarter of 2011. |
| 3. | Columbia Management has voluntarily agreed to reimburse a portion of the Fund’s expenses so that the Fund’s ordinary operating expenses (excluding any distribution and service fees, brokerage commissions, interest, taxes and extraordinary expenses, but including custodian charges relating to overdrafts, if any), after giving effect to any balance credits from the Fund’s custodian, do not exceed 1.35% of the Fund’s average daily net assets on an annualized basis. If this arrangement were reflected in the table, Total annual Fund operating expenses would be 1.60% for Class A shares, 2.35 % for Class B shares, 2.35% for Class C shares and 1.35% for Class Z shares. Columbia Management, in its discretion, may revise or discontinue this arrangement at any time. |
| 4. | Management fees are composed of an investment management services fee of 0.40% and an administration fee of 0.25%. |
| 5. | Acquired fund fees and expenses include fees and expenses associated with the Fund’s investments in other investment companies and/or pooled investment vehicles. |
| 6. | Columbia Management has voluntarily agreed to reimburse a portion of the Fund’s expenses so that the Fund’s ordinary operating expenses (excluding any distribution and service fees, brokerage commissions, interest, taxes and extraordinary expenses, but including custodian charges relating to overdrafts, if any), after giving effect to any balance credits from the Fund’s custodian, do not exceed 1.15% of the Fund’s average daily net assets on an annualized basis. If this arrangement were reflected in the table, Total annual Fund operating expenses would be 1.49% for Class A shares, 2.24% for Class B shares and 2.24% for Class C shares. Columbia Management, in its discretion, may revise or discontinue this arrangement at any time. Columbia Management has voluntarily agreed to waive the investment advisory fee and administration fee charged to the Fund on its assets that are invested in Columbia Greater China Fund and Columbia Emerging Markets Fund. Columbia Management, in its discretion, may revise or discontinue this arrangement at any time. |
| 7. | Management fees are composed of an investment management services fee of 0.80%, a performance incentive adjustment of 0.05%, and an administration fee of 0.08%. |
| 8. | Other expenses have been adjusted to reflect changes in contractual transfer agency fee rates, effective September 4, 2010. |
| 9. | Columbia Management has contractually agreed to reimburse a portion of Threadneedle Global Equity Income Fund’s expenses so that Total annual Fund operating expenses (excluding acquired fund fees and expenses, if any), before giving effect to any performance incentive adjustment, do not exceed, on an annualized basis, 1.45% for Class A shares, 2.20% for Class B shares, 2.20% for Class C shares, 1.04% for Class I shares, 1.70% for Class R shares and 1.34% for Class R4 shares. The reimbursement arrangement shall continue in effect until at least December 31, 2010. |
| 10. | Management fees are composed of an investment management services fee of 0.79% and an administration fee of 0.08%. Management fees have been adjusted to reflect changes in contractual investment management fee rates (including the elimination of a performance incentive adjustment that decreased Management fees by 0.11%) expected to be effective in the second quarter of 2011, subject to shareholder approval and a transitional period during which investment management fees would be payable at the lower of the rate under the current and proposed rates. If the proposed changes were not reflected, Management fees shown would have been 0.76% (composed of an investment management services fee of 0.79%, a performance incentive adjustment of -0.11% and an administration fee of 0.08%), and Total annual Fund operating expenses would have been 1.38% for Class A shares, 2.13% for Class B shares, 2.13% for Class C shares, 0.84% for Class I shares, 1.63% for Class R shares, and 1.14% for Class R4 shares. |
| 11. | Columbia Management has contractually agreed to reimburse a portion of the Buying Fund’s expenses so that Total annual Fund operating expenses (excluding any brokerage commissions, interest, taxes and extraordinary expenses, but including custodian charges relating to overdrafts, if any), after giving effect to any balance credits from the Buying Fund’s custodian, do not exceed the net expenses shown. The reimbursement arrangement shall continue in effect until December 31, 2012. |
| 12. | Class R shares of Threadneedle Global Equity Income Fund and the Buying Fund were formerly named Class R2 shares. |
The number of Reorganizations that occur will affect the total annual Fund operating expenses of the Buying Fund on a pro forma combined basis after the Reorganizations. The tables below present the pro forma combined total annual Fund operating expenses of the Buying Fund assuming in each case that (1) certain, but not all, of the Reorganizations are consummated or (2) that all of the Reorganizations are consummated. Specifically, the first table shows the pro forma combined total annual Fund operating expenses of the Buying Fund assuming the
9
combination of Reorganizations that results in the highest possible total annual Fund operating expenses the Reorganization of only Columbia World Equity Fund, and the second table shows the pro forma combined total annual Fund operating expenses of the Buying Fund assuming the combination of Reorganizations that results in the lowest possible total annual Fund operating expenses, the Reorganization of all of the Selling Funds.
| | | | | | | | | | | | | | | | | | | | | |
| Columbia Global Equity Fund (Pro Forma – Highest) | | Class A | | | Class B | | | Class C | | | Class I | | | Class R | | | Class R4 | | | Class Z | |
Management fees(1) | | 0.87 | % | | 0.87 | % | | 0.87 | % | | 0.87 | % | | 0.87 | % | | 0.87 | % | | 0.87 | % |
Distribution and/or service (12b-1) fees | | 0.25 | % | | 1.00 | % | | 1.00 | % | | 0.00 | % | | 0.50 | % | | 0.00 | % | | 0.00 | % |
Other expenses(2) | | 0.33 | % | | 0.33 | % | | 0.33 | % | | 0.07 | % | | 0.33 | % | | 0.37 | % | | 0.33 | % |
| | | | | | | | | | | | | | | | | | | | | |
Total annual Fund operating expenses | | 1.45 | % | | 2.20 | % | | 2.20 | % | | 0.94 | % | | 1.70 | % | | 1.24 | % | | 1.20 | % |
Fee waiver/expense reimbursement(3) | | (0.09 | %) | | (0.09 | %) | | (0.09 | %) | | (0.03 | %) | | (0.09 | %) | | (0.03 | %) | | (0.09 | %) |
| | | | | | | | | | | | | | | | | | | | | |
Net annual Fund operating expenses | | 1.36 | % | | 2.11 | % | | 2.11 | % | | 0.91 | % | | 1.61 | % | | 1.21 | % | | 1.11 | % |
| | | | | | | | | | | | | | | | | | | | | |
| Columbia Global Equity Fund (Pro Forma – All/Lowest) | | Class A | | | Class B | | | Class C | | | Class I | | | Class R | | | Class R4 | | | Class Z | |
Management fees(4) | | 0.86 | % | | 0.86 | % | | 0.86 | % | | 0.86 | % | | 0.86 | % | | 0.86 | % | | 0.86 | % |
Distribution and/or service (12b-1) fees | | 0.25 | % | | 1.00 | % | | 1.00 | % | | 0.00 | % | | 0.50 | % | | 0.00 | % | | 0.00 | % |
Other expenses(2) | | 0.32 | % | | 0.32 | % | | 0.32 | % | | 0.07 | % | | 0.32 | % | | 0.37 | % | | 0.32 | % |
| | | | | | | | | | | | | | | | | | | | | |
Total annual Fund operating expenses | | 1.43 | % | | 2.18 | % | | 2.18 | % | | 0.93 | % | | 1.68 | % | | 1.23 | % | | 1.18 | % |
Fee waiver/expense reimbursement(3) | | (0.07 | %) | | (0.07 | %) | | (0.07 | %) | | 0.00 | % | | (0.07 | %) | | 0.00 | % | | (0.07 | %) |
| | | | | | | | | | | | | | | | | | | | | |
Net annual Fund operating expenses | | 1.36 | % | | 2.11 | % | | 2.11 | % | | 0.93 | % | | 1.61 | % | | 1.23 | % | | 1.11 | % |
| 1. | Management fees are composed of an investment management services fee of 0.79% and an administration fee of 0.08%. Management fees have been adjusted to reflect changes in contractual investment management fee rates (including the elimination of a performance incentive adjustment that decreased Management fees by 0.11%) expected to be effective in the second quarter of 2011, subject to shareholder approval. If the proposed changes were not reflected, Management fees shown would have been 0.76% (composed of an investment management services fee of 0.79%, a performance incentive adjustment of -0.11% and an administration fee of 0.08%), and Total annual Fund operating expenses would have been 1.34% for Class A shares, 2.09% for Class B shares, 2.09% for Class C shares, 0.83% for Class I shares, 1.59% for Class R shares, 1.13% for Class R4 shares, and 1.09% for Class Z shares. |
| 2. | Other expenses have been adjusted to reflect changes in contractual transfer agency fee rates, effective September 4, 2010. |
| 3. | Columbia Management has contractually agreed to reimburse a portion of the Buying Fund’s expenses so that Total Fund operating expenses (excluding any brokerage commissions, interest, taxes and extraordinary expenses, but including custodian charges relating to overdrafts, if any), after giving effect to any balance credits from the Buying Fund’s custodian, do not exceed the net expenses shown. The reimbursement arrangement shall continue in effect until December 31, 2012. |
| 4. | Management fees are composed of an investment management services fee of 0.78% and an administration fee of 0.08%. Management fees have been adjusted to reflect changes in contractual investment management fee rates (including the elimination of a performance incentive adjustment that decreased Management fees by 0.11%) expected to be effective in the second quarter of 2011, subject to shareholder approval and a transitional period during which investment management fees would be payable at the lower of the rate under the current and proposed rates. If the proposed changes were not reflected, management fees shown would have been 0.75% (composed of an investment management services fee of 0.78%, a performance incentive adjustment of -0.11% and an administration fee of 0.08%), and Total annual Fund operating expenses would have been 1.32% for Class A shares, 2.07% for Class B shares, 2.07% for Class C shares, 0.82% for Class I shares, 1.57% for Class R shares, 1.12% for Class R4 shares and 1.07% for Class Z shares. |
Expense examples: These examples are intended to help you compare the cost of investing in each Fund with the cost of investing in other mutual funds. These examples assume that you invest $10,000 in the applicable Fund for the time periods indicated and then redeem all of your shares at the end of those periods, both under the current arrangements and, for the Buying Fund, assuming completion of the proposed Reorganizations. These examples also assume that your investment has a 5% return each year and that each Fund’s operating expenses remain the same. The example includes any contractual fee waiver/expense reimbursement arrangement only for the period indicated in the Fund’s Annual Fund Operating Expenses table. Although your actual costs may be higher or lower, based on those assumptions your costs would be:
| | | | | | | | | | | | |
| Columbia Global Value Fund (Current) (Selling Fund) | | 1 year | | 3 years | | 5 years | | 10 years |
Class A | | $ | 759 | | $ | 1,143 | | $ | 1,552 | | $ | 2,689 |
Class B | | $ | 770 | | $ | 1,129 | | $ | 1,615 | | $ | 2,822 |
Class C | | $ | 370 | | $ | 829 | | $ | 1,415 | | $ | 3,003 |
Class Z | | $ | 170 | | $ | 526 | | $ | 907 | | $ | 1,976 |
10
| | | | | | | | | | | | |
| Columbia World Equity Fund (Current) (Selling Fund) | | 1 year | | 3 years | | 5 years | | 10 years |
Class A | | $ | 739 | | $ | 1,083 | | $ | 1,450 | | $ | 2,478 |
Class B | | $ | 749 | | $ | 1,067 | | $ | 1,511 | | $ | 2,611 |
Class C | | $ | 349 | | $ | 767 | | $ | 1,311 | | $ | 2,796 |
| | | | |
| Threadneedle Global Equity Income Fund (Current)(Selling Fund) | | 1 year | | 3 years | | 5 years | | 10 years |
Class A | | $ | 719 | | $ | 1,190 | | $ | 1,687 | | $ | 3,050 |
Class B | | $ | 728 | | $ | 1,178 | | $ | 1,752 | | $ | 3,180 |
Class C | | $ | 328 | | $ | 878 | | $ | 1,552 | | $ | 3,355 |
Class I | | $ | 111 | | $ | 515 | | $ | 944 | | $ | 2,142 |
Class R* | | $ | 178 | | $ | 728 | | $ | 1,305 | | $ | 2,876 |
Class R4 | | $ | 142 | | $ | 606 | | $ | 1,098 | | $ | 2,457 |
| | | | |
| Columbia Global Equity Fund (Current)(Buying Fund) | | 1 year | | 3 years | | 5 years | | 10 years |
Class A | | $ | 706 | | $ | 1,007 | | $ | 1,331 | | $ | 2,247 |
Class B | | $ | 714 | | $ | 988 | | $ | 1,389 | | $ | 2,380 |
Class C | | $ | 314 | | $ | 688 | | $ | 1,189 | | $ | 2,569 |
Class I | | $ | 91 | | $ | 297 | | $ | 521 | | $ | 1,165 |
Class R* | | $ | 164 | | $ | 536 | | $ | 933 | | $ | 2,046 |
Class R4 | | $ | 121 | | $ | 391 | | $ | 682 | | $ | 1,511 |
| | | | |
| Columbia Global Equity Fund (Pro Forma- Highest)(Buying Fund) | | 1 year | | 3 years | | 5 years | | 10 years |
Class A | | $ | 706 | | $ | 999 | | $ | 1,314 | | $ | 2,203 |
Class B | | $ | 714 | | $ | 980 | | $ | 1,371 | | $ | 2,337 |
Class C | | $ | 314 | | $ | 680 | | $ | 1,171 | | $ | 2,527 |
Class I | | $ | 93 | | $ | 297 | | $ | 517 | | $ | 1,152 |
Class R | | $ | 164 | | $ | 527 | | $ | 915 | | $ | 2,001 |
Class R4 | | $ | 123 | | $ | 390 | | $ | 678 | | $ | 1,497 |
Class Z | | $ | 113 | | $ | 372 | | $ | 651 | | $ | 1,447 |
| | | | |
Columbia Global Equity Fund (Pro Forma – All Reorganizations/
Lowest)(Buying Fund) | | 1 year | | 3 years | | 5 years | | 10 years |
Class A | | $ | 706 | | $ | 995 | | $ | 1,305 | | $ | 2,184 |
Class B | | $ | 714 | | $ | 975 | | $ | 1,363 | | $ | 2,318 |
Class C | | $ | 314 | | $ | 675 | | $ | 1,163 | | $ | 2,508 |
Class I | | $ | 95 | | $ | 296 | | $ | 515 | | $ | 1,143 |
Class R | | $ | 164 | | $ | 523 | | $ | 906 | | $ | 1,981 |
Class R4 | | $ | 125 | | $ | 390 | | $ | 676 | | $ | 1,489 |
Class Z | | $ | 113 | | $ | 368 | | $ | 642 | | $ | 1,426 |
| * | Class R shares of Threadneedle Global Equity Income Fund and the Buying Fund were formerly named Class R2 shares. |
If you owned or will own any class of shares other than Class B or Class C, you would pay the same costs shown in the tables above if you did not redeem your shares at the end of the periods indicated. If you owned or will own Class B or Class C shares, you would pay the following costs if you did not redeem your shares at the end of the periods indicated, which may be different than the costs shown in the tables above.
11
| | | | | | | | | | | | |
| Columbia Global Value Fund (Current) (Selling Fund) | | 1 year | | 3 years | | 5 years | | 10 years |
Class B | | $ | 270 | | $ | 829 | | $ | 1,415 | | $ | 2,822 |
Class C | | $ | 270 | | $ | 829 | | $ | 1,415 | | $ | 3,003 |
| | | | |
| Columbia World Equity Fund (Current)(Selling Fund) | | 1 year | | 3 years | | 5 years | | 10 years |
Class B | | $ | 249 | | $ | 767 | | $ | 1,311 | | $ | 2,611 |
Class C | | $ | 249 | | $ | 767 | | $ | 1,311 | | $ | 2,796 |
| | | | |
| Threadneedle Global Equity Income Fund (Current)(Selling Fund) | | 1 year | | 3 years | | 5 years | | 10 years |
Class B | | $ | 228 | | $ | 878 | | $ | 1,552 | | $ | 3,180 |
Class C | | $ | 228 | | $ | 878 | | $ | 1,552 | | $ | 3,355 |
| | | | |
| Columbia Global Equity Fund (Current)(Buying Fund) | | 1 year | | 3 years | | 5 years | | 10 years |
Class B | | $ | 214 | | $ | 688 | | $ | 1,189 | | $ | 2,380 |
Class C | | $ | 214 | | $ | 688 | | $ | 1,189 | | $ | 2,569 |
| | | | |
| Columbia Global Equity Fund (Pro Forma - Highest)(Buying Fund) | | 1 year | | 3 years | | 5 years | | 10 years |
Class B | | $ | 214 | | $ | 680 | | $ | 1,171 | | $ | 2,337 |
Class C | | $ | 214 | | $ | 680 | | $ | 1,171 | | $ | 2,527 |
| | | | |
Columbia Global Equity Fund (Pro Forma – All Reorganizations/
Lowest)(Buying Fund) | | 1 year | | 3 years | | 5 years | | 10 years |
Class B | | $ | 214 | | $ | 675 | | $ | 1,163 | | $ | 2,318 |
Class C | | $ | 214 | | $ | 675 | | $ | 1,163 | | $ | 2,508 |
Portfolio Turnover. Each Fund pays transaction costs, such as commissions, when it buys and sells securities (or “turns over” its portfolio). A higher portfolio turnover rate may indicate higher transaction costs and may result in higher taxes when Fund shares are held in a taxable account. Those costs, which are not reflected in annual Fund operating expenses or in the example expenses, affect a Fund’s performance. During the most recent fiscal year, each Fund’s portfolio turnover rate was the following percentage of the average value of the Fund’s portfolio.
| | |
Fund | | Percentage of the Average Value of the Fund’s Portfolio |
Columbia Global Value Fund (Selling Fund) | | 5% |
Columbia World Equity Fund (Selling Fund) | | 90% |
Threadneedle Global Equity Income Fund (Selling Fund) | | 45% |
Columbia Global Equity Fund (Buying Fund) | | 81% |
12
Comparison of Objectives, Strategies and Risks. Reorganization of each of Columbia Global Value Fund, Columbia World Equity Fund and Threadneedle Global Equity Income Fund into Columbia Global Equity Fund (formerly, Threadneedle Global Equity Fund)
Comparison of the Selling Funds and the Buying Fund
All of the Selling Funds and the Buying Fund:
| | • | | Have Columbia Management as investment manager. Threadneedle serves as subadviser for the Buying Fund and Threadneedle Global Equity Income Fund. Brandes Investment Partners, L.P. (“Brandes”) serves as subadviser for Columbia Global Value Fund. Columbia World Equity Fund is not subadvised. |
| | • | | Have the same policies for buying and selling shares and the same exchange rights. |
| | • | | Are structured as a series of an open-end management investment company. Columbia Global Value Fund is organized as a series of a Delaware statutory trust, Columbia World Equity Fund is organized as a series of a Massachusetts business trust and Threadneedle Global Equity Income Fund and the Buying Fund are organized as series of a Minnesota corporation. The Board of RiverSource Global Series, Inc. has approved the Redomiciling of Columbia Global Equity Fund, a series of RiverSource Global Series, Inc., into a newly created series of RiverSource Series Trust that has also been named Columbia Global Equity Fund. The Redomiciling is subject to approval by shareholders of Columbia Global Equity Fund. If the Redomiciling is approved by shareholders of Columbia Global Equity Fund, it is expected that the Redomiciling will occur prior to the Reorganizations, in which case the Buying Fund will be the newly created series of RiverSource Series Trust. If the Redomiciling has not been completed prior to the closing of the Reorganization, the Buying Fund will be the existing series of RiverSource Global Series, Inc. Please see Exhibit D to this proxy statement/prospectus for more information regarding the differences between the rights of shareholders of each Selling Fund and shareholders of the Buying Fund. |
Comparison of Investment Objectives
The investment objectives of the Funds are as follows:
Selling Fund: Columbia Global Value Fund seeks long-term capital appreciation.
Selling Fund: Columbia World Equity Fund seeks long-term capital appreciation.
Selling Fund: Threadneedle Global Equity Income Fund seeks to provide shareholders with a high level of current income and secondarily, growth of capital.
Buying Fund: Columbia Global Equity Fund seeks to provide shareholders with long-term capital growth.
Because any investment involves risk, there can be no assurance that any Fund’s investment objective will be achieved. The investment objective of each of the Buying Fund and Threadneedle Global Equity Income Fund may be changed only with shareholder approval, while the investment objective of each of Columbia Global Value Fund and Columbia World Equity Fund may be changed without shareholder approval.
13
Comparison of Principal Investment Strategies
The Selling Funds and the Buying Fund have similar principal investment strategies. Under normal market conditions, each Fund invests primarily in equity securities of both domestic and foreign companies. As part of its principal investment strategies, each of the Buying Fund and Threadneedle Global Equity Income Fund normally invests at least 40% of its net assets in non-U.S. companies, while Columbia Global Value Fund has no similar guidelines, and Columbia World Equity Fund diversifies its investments among developed countries and market sectors. Columbia Global Value Fund has additional limits on its investments to which the other Funds are not subject, including that it invests at least 80% of its net assets in equity securities of companies that have market capitalizations of more than $1 billion at the time of investment, whereas the other Funds do not state a limitation related to the market capitalization of companies in which they invest. Each of Columbia World Equity Fund, Threadneedle Global Equity Income Fund and the Buying Fund may invest in derivatives as a principal investment strategy, although the Buying Fund may use derivatives as a principal investment strategy only for hedging while Columbia World Equity Fund and Threadneedle Global Equity Income Fund may invest in derivatives for hedging and non-hedging purposes. Columbia Global Value Fund may invest in derivatives, but does not consider investment in derivatives part of its principal investment strategies. Each Fund’s 80% policy (described below) may be changed by the Fund’s Board without shareholder approval on sixty days notice to shareholders.
Additional information regarding the principal investment strategies of each Fund is set forth below:
| | | | | | |
Columbia Global Value Fund (Selling Fund) | | Columbia World Equity Fund (Selling Fund) | | Threadneedle Global Equity Income Fund (Selling Fund) | | Columbia Global Equity Fund (Buying Fund) |
| Under normal circumstances, the Fund invests at least 80% of its net assets in equity securities of domestic and foreign companies that have market capitalizations of more than $1 billion at the time of investment and that are believed to be undervalued. | | Under normal circumstances, the Fund invests at least 80% of net assets in equity securities (including, but not limited to, common stocks, preferred stocks and securities convertible into common or preferred stocks) of domestic and foreign companies. | | Under normal market conditions, the Fund will invest at least 80% of its net assets in equity securities. The Fund may invest in equity securities of companies located in developed and emerging markets. | | Under normal market conditions, at least 80% of the Fund’s net assets will be invested in equity securities, including companies located in developed and emerging countries. |
| | | |
The Fund typically invests in at least three countries, including the United States, at any one time and may invest in emerging market countries. The Fund generally will not invest more than 20% of its total assets in emerging market countries. The Fund typically invests up to the greater of (i) 20% of its total assets or (ii) 150% of the weighting of a single country or industry in the MSCI World Index (limited to less than 25% of its total assets in a single industry, other than U.S. government obligations) in a single country or industry. | | The Fund typically invests in at least three countries, including the United States, at any one time. | | Under normal market conditions, the Fund generally will invest at least 40% of its net assets in companies that maintain their principal place of business or conduct their principal business activities outside the U.S., have their securities traded on non-U.S. exchanges or have been formed under the laws of non-U.S. countries. The investment manager may reduce this 40% minimum investment amount to 30% if it believes that market conditions for these securities or specific foreign markets are unfavorable. The Fund considers a company to conduct its principal business activities outside the U.S. if it derives at least 50% of its revenue from business outside the U.S. or had at least 50% of its assets outside the U.S. | | Under normal market conditions, the Fund generally will invest at least 40% of its net assets in companies that maintain their principal place of business or conduct their principal business activities outside the U.S., have their securities traded on non-U.S. exchanges or have been formed under the laws of non-U.S. countries. The investment manager may reduce this 40% minimum investment amount to 30% if it believes that market conditions for these securities or specific foreign markets are unfavorable. The Fund considers a company to conduct its principal business activities outside the U.S. if it derives at least 50% of its revenue from business outside the U.S. or had at least 50% of its assets outside the U.S. |
14
| | | | | | |
Columbia Global Value Fund (Selling Fund) | | Columbia World Equity Fund (Selling Fund) | | Threadneedle Global Equity Income Fund (Selling Fund) | | Columbia Global Equity Fund (Buying Fund) |
| The Fund may from time to time emphasize one or more economic sectors in selecting its investments. | | Columbia Management intends to diversify the Fund’s investments among a number of developed countries and market sectors. | | The Fund may invest in any economic sector and, at times, it may emphasize one or more particular sectors. | | |
| | | |
| The Fund may, with respect to its foreign investments, invest directly in foreign equity securities and/or depositary receipts. Depositary receipts are receipts issued by a bank or trust company and evidence ownership of underlying securities issued by foreign companies. | | The Fund may, with respect to its investments in foreign companies, invest directly in foreign equity securities and/or indirectly through depositary receipts. Depositary receipts are receipts issued by a bank or trust company and evidence ownership of underlying securities issued by foreign companies. | | | | |
| | | |
| | The Fund may invest in derivatives, including futures, forwards, options, swap contracts and other derivative instruments. The Fund may invest in derivatives for both hedging and non-hedging purposes, including, for example, to seek to enhance returns or as a substitute for a position in an underlying asset. The Fund may attempt to hedge the effects of currency value fluctuations on the Fund’s investments. | | The Fund will normally have exposure to foreign currencies. Threadneedle closely monitors the Fund’s exposure to foreign currency. From time to time the team may use forward currency transactions or other derivative instruments to hedge against currency fluctuations. Threadneedle may use derivatives such as futures, options, swaps, forward contracts and structured investments, to produce incremental earnings, to hedge existing positions and/or currency fluctuations, or to increase flexibility. | | The Fund will normally have exposure to foreign currencies. The portfolio management team closely monitors the Fund’s exposure to foreign currency. From time to time the team may use forward currency transactions or other derivative instruments to hedge against currency fluctuations. |
| | | |
| The Fund normally invests no more than 5% of its total assets in a single security. | | | | | | |
15
| | | | | | |
Columbia Global Value Fund (Selling Fund) | | Columbia World Equity Fund (Selling Fund) | | Threadneedle Global Equity Income Fund (Selling Fund) | | Columbia Global Equity Fund (Buying Fund) |
| | | |
| The Fund normally invests in common stock, preferred stock and securities that are convertible into common stock. | | | | The securities in which the Fund invests will typically include dividend-paying common and preferred stocks that produce current income or that offer potential to produce income. | | |
| | | |
| Columbia Management has engaged Brandes to manage the Fund on a day-to-day basis, with Columbia Management retaining general investment management responsibility for the management of the Fund. Brandes uses the “Graham and Dodd” value approach to managing the Fund. Brandes invests in a company when its current price appears to be below what Brandes views as its “true” long-term - or intrinsic- value. | | | | Columbia Management is responsible for oversight of Threadneedle, an indirect wholly-owned subsidiary of Ameriprise Financial, Inc., the parent company of Columbia Management. | | Columbia Management is responsible for oversight of Threadneedle, an indirect wholly-owned subsidiary of Ameriprise Financial, Inc., the parent company of Columbia Management. |
Buying Fund Investment Style
A description of the investment style of the Buying Fund is set forth below:
Threadneedle chooses investments for the Buying Fund by:
| | • | | Deploying an integrated approach to equity research that incorporates regional analyses, a global sector strategy, and stock specific perspectives. |
| | • | | Conducting detailed research on companies in a consistent strategic and macroeconomic framework. |
| | • | | Looking for catalysts of change and identifying the factors driving markets, which will vary over economic and market cycles. |
| | • | | Implementing rigorous risk control processes that seek to ensure that the risk and return characteristics of the Fund’s portfolio are consistent with established portfolio management parameters. |
Using the global sector strategy, the Buying Fund’s portfolio management team constructs the portfolio using a Model List of stocks which represents the portfolio management team’s ideas and highest convictions. The portfolio is then constructed from this list along with other securities selected by the Buying Fund’s portfolio managers.
Stocks on the Model List are selected by:
| | • | | Evaluating the opportunities and risks within regions and sectors; |
| | • | | Assessing valuations; and |
| | • | | Evaluating one or more of the following: balance sheets and cash flows, the demand for a company’s products or services, its competitive position, or its management. |
16
A number of factors may prompt the portfolio management team to sell securities. A sale may result from a change in the composition of the Buying Fund’s benchmark or a change in sector strategy. A sale may also be prompted by factors specific to a stock, such as valuation or company fundamentals.
Differences between each Selling Fund’s principal investment strategies, fundamental and non-fundamental investment policies and holdings and those of the Buying Fund may expose the Selling Fund’s shareholders to new or increased risks. A comparison of the principal risks of investing in each Selling Fund and the Buying Fund is provided under “Comparison of Principal Risks” beginning on page [—].
Comparison of Fundamental Investment Policies
If the Reorganization occurs, the combined Fund will be subject to the fundamental investment policies of the Buying Fund. Columbia Management does not believe that the differences between the fundamental investment policies of each Selling Fund and the Buying Fund result in any material difference in the way the Funds have been managed or in the way the combined Fund will be managed. For purposes of this discussion, a “fundamental” investment policy is one that may not be changed without a shareholder vote.
The Funds’ fundamental investment policies are set forth below:
| | | | | | | | |
Policy | | Columbia Global Value Fund (Selling Fund) | | Columbia World Equity Fund (Selling Fund) | | Threadneedle Global Equity
Income Fund (Selling Fund) | | Columbia Global Equity Fund (Buying Fund) |
Borrowing/ Issuing Senior Securities | | The Fund may not borrow money or issue senior securities except to the extent permitted by the 1940 Act, the rules and regulations thereunder and any exemptive relief obtained by the Funds. | | The Fund may not borrow money or issue senior securities except to the extent permitted by the 1940 Act, the rules and regulations thereunder and any applicable exemptive relief. | | The Fund will not borrow money, except for temporary purposes (not for leveraging or investment) in an amount not exceeding 33 1/3% of its total assets (including the amount borrowed) less liabilities (other than borrowings) immediately after the borrowings. The Fund will not issue senior securities, except as permitted under the 1940 Act, the rules and regulations thereunder and any applicable exemptive relief. |
| | | |
| Commodities | | The Fund may not purchase or sell commodities, except that the Fund may to the extent consistent with its investment objective: (i) invest in securities of companies that purchase or sell commodities or which invest in such programs, and (ii) purchase and sell options, forward contracts, futures contracts, and options on futures contracts. This limitation does not apply to foreign currency transactions including without limitation forward currency contracts. | | The Fund may not purchase or sell commodities, except that the Fund may to the extent consistent with its investment objective: (i) invest in securities of companies that purchase or sell commodities or which invest in such programs, (ii) purchase and sell options, forward contracts, futures contracts, and options on futures contracts and (iii) enter into swap contracts and other financial transactions relating to commodities. This limitation does not apply to foreign currency transactions including without limitation forward currency contracts. | | The Fund will not buy or sell physical commodities unless acquired as a result of ownership of securities or other instruments, except this shall not prevent the Fund from buying or selling options and futures contracts or from investing in securities or other instruments backed by, or whose value is derived from, physical commodities. |
17
| | | | | | | | |
Policy | | Columbia Global Value Fund (Selling Fund) | | Columbia World Equity Fund (Selling Fund) | | Threadneedle Global Equity
Income Fund (Selling Fund) | | Columbia Global Equity Fund (Buying Fund) |
| Diversification | | The Fund may not purchase securities (except securities issued or guaranteed by the U.S. government, its agencies or instrumentalities) of any one issuer if, as a result, more than 5% of its total assets will be invested in the securities of such issuer or it would own more than 10% of the voting securities of such issuer, except that: (i) up to 25% of its total assets may be invested without regard to these limitations and (ii) a Fund’s assets may be invested in the securities of one or more management investment companies to the extent permitted by the 1940 Act, the rules and regulations thereunder, or any exemptive relief obtained by the Funds. | | The Fund may not purchase securities (except securities issued or guaranteed by the U.S. government, its agencies or instrumentalities) of any one issuer if, as a result, more than 5% of its total assets will be invested in the securities of such issuer or it would own more than 10% of the voting securities of such issuer, except that: (i) up to 25% of its total assets may be invested without regard to these limitations and (ii) the Fund’s assets may be invested in the securities of one or more management investment companies to the extent permitted by the 1940 Act, the rules and regulations thereunder, or any applicable exemptive relief. | | The Fund will not purchase securities (except securities issued or guaranteed by the U.S. government, its agencies or instrumentalities) of any one issuer if, as a result, more than 5% of its total assets will be invested in the securities of such issuer or it would own more than 10% of the voting securities of such issuer, except that: (a) up to 25% of its total assets may be invested without regard to these limitations; and (b) a fund’s assets may be invested in the securities of one or more management investment companies to the extent permitted by the 1940 Act, the rules and regulations thereunder, or any applicable exemptive relief. |
| | | |
| Industry Concentration | | The Fund may not purchase any securities which would cause 25% or more of the value of its total assets at the time of purchase to be invested in the securities of one or more issuers conducting their principal business activities in the same industry, provided that: (i) there is no limitation with respect to obligations issued or guaranteed by the U.S. government, any state or territory of the United States or any of their agencies, instrumentalities or political subdivisions; and (ii) notwithstanding this limitation or any other fundamental investment limitation, assets may be invested in the securities of one or more management investment companies to the extent permitted by the 1940 Act, the rules and regulations thereunder and any exemptive relief obtained by the Funds. | | The Fund may not purchase any securities which would cause 25% or more of the value of its total assets at the time of purchase to be invested in the securities of one or more issuers conducting their principal business activities in the same industry, provided that: (i) there is no limitation with respect to obligations issued or guaranteed by the U.S. government, any state or territory of the United States or any of their agencies, instrumentalities or political subdivisions; and (ii) notwithstanding this limitation or any other fundamental investment limitation, assets may be invested in the securities of one or more management investment companies to the extent permitted by the 1940 Act, the rules and regulations thereunder and any applicable exemptive relief. | | The Fund will not concentrate in any one industry. According to the present interpretation by the SEC, this means that up to 25% of the Fund’s total assets, based on current market value at the time of purchase, can be invested in any one industry. |
18
| | | | | | | | |
Policy | | Columbia Global Value Fund (Selling Fund) | | Columbia World Equity Fund (Selling Fund) | | Threadneedle Global Equity
Income Fund (Selling Fund) | | Columbia Global Equity Fund (Buying Fund) |
| Lending | | The Fund may not make loans, except to the extent permitted by the 1940 Act, the rules and regulations thereunder and any exemptive relief obtained by the Funds. | | The Fund may not make loans, except to the extent permitted by the 1940 Act, the rules and regulations thereunder and any applicable exemptive relief. | | The Fund will not lend securities or participate in an interfund lending program if the total of all such loans would exceed 33 1/3% of the Fund’s total assets except this fundamental investment policy shall not prohibit the Fund from purchasing money market securities, loans, loan participation or other debt securities, or from entering into repurchase agreements. |
| | | |
| Real Estate | | The Fund may not purchase or sell real estate, except the Fund may purchase securities of issuers which deal or invest in real estate and may purchase securities which are secured by real estate or interests in real estate. | | The Fund may not purchase or sell real estate, except the Fund may: (i) purchase securities of issuers which deal or invest in real estate, (ii) purchase securities which are secured by real estate or interests in real estate and (iii) hold and dispose of real estate or interests in real estate acquired through the exercise of its rights as a holder of securities which are secured by real estate or interests therein. | | The Fund will not buy or sell real estate, unless acquired as a result of ownership of securities or other instruments, except this shall not prevent the Fund from investing in securities or other instruments backed by real estate or securities of companies engaged in the real estate business or real estate investment trusts. For purposes of this policy, real estate includes real estate limited partnerships. |
19
| | | | | | | | |
Policy | | Columbia Global Value Fund (Selling Fund) | | Columbia World Equity Fund (Selling Fund) | | Threadneedle Global Equity
Income Fund (Selling Fund) | | Columbia Global Equity Fund (Buying Fund) |
| Underwriting | | The Fund may not underwrite any issue of securities within the meaning of the 1933 Act except when it might technically be deemed to be an underwriter either: (i) in connection with the disposition of a portfolio security; or (ii) in connection with the purchase of securities directly from the issuer thereof in accordance with the Fund’s investment objective. This restriction shall not limit the Fund’s ability to invest in securities issued by other registered investment companies. | | The Fund may not underwrite any issue of securities issued by other persons within the meaning of the 1933 Act except when it might be deemed to be an underwriter either: (i) in connection with the disposition of a portfolio security; or (ii) in connection with the purchase of securities directly from the issuer thereof in accordance with the Fund’s investment objective. This restriction shall not limit the Fund’s ability to invest in securities issued by other registered investment companies. | | The Fund will not act as an underwriter (sell securities for others). However, under the securities laws, the Fund may be deemed to be an underwriter when it purchases securities directly from the issuer and later resells them. |
Differences between each Selling Fund’s principal investment strategies, fundamental and non-fundamental investment policies and holdings and those of the Buying Fund may expose the Selling Fund’s shareholders to new or increased risks. A comparison of the principal risks of investing in each Selling Fund and the Buying Fund is provided under “Comparison of Principal Risks” beginning on page [—].
Comparison of Non-Fundamental Investment Policies:
If Reorganization occurs, the combined Fund will be subject to the non-fundamental investment policies (policies that may be changed without a shareholder vote) of the Buying Fund. Columbia Management does not believe that the differences between the non-fundamental polices of the Funds result in any material differences in the way the Funds have been managed or in the way the combined Funds will be managed.
The Funds’ non-fundamental investment policies are set forth below:
| | | | | | | | |
Policy | | Columbia Global Value Fund (Selling Fund) | | Columbia World Equity Fund (Selling Fund) | | Threadneedle Global Equity
Income Fund (Selling Fund) | | Columbia Global Equity Fund (Buying Fund) |
| Illiquid Securities | | The Fund may not invest more than 15% of its net assets in illiquid securities. | | No more than 15% of the Fund’s net assets will be held in securities and other instruments that are illiquid. |
20
| | | | | | | | |
Policy | | Columbia Global Value Fund (Selling Fund) | | Columbia World Equity Fund (Selling Fund) | | Threadneedle Global Equity
Income Fund (Selling Fund) | | Columbia Global Equity Fund (Buying Fund) |
| Investment in Other Investment Companies | | The Fund may not purchase securities of other investment companies except to the extent permitted by the 1940 Act, the rules and regulations thereunder and any applicable exemptive relief. If shares of the Fund are purchased by another fund in reliance on Section 12(d)(1)(G) of the 1940 Act, for so long as shares of the Fund are held by such fund, the Fund will not purchase securities of a registered open-end investment company or registered unit investment trust in reliance on Section 12(d)(1)(F) or Section 12(d)(1)(G) of the 1940 Act. | | No stated policy. |
| | |
| Short Sales | | The Fund may not sell securities short, except as permitted by the 1940 Act, the rules and regulations thereunder and any applicable exemptive relief. | | No stated policy. |
Differences between each Selling Fund’s principal investment strategies, fundamental and non-fundamental investment policies and holdings and those of the Buying Fund may expose the Selling Fund’s shareholders to new or increased risks. A comparison of the principal risks of investing in each Selling Fund and the Buying Fund is provided below.
Comparison of Principal Risks
Although the Funds describe them somewhat differently, the principal risks associated with investments in the Buying Fund and the Selling Funds are generally similar because the Funds have similar investment objectives, principal investment strategies and investment policies. The actual risks of investing in each Fund depend on the securities held in each Fund’s portfolio and on market conditions, both of which change over time. The Buying Fund is subject to the principal risks described below. Similarities and material differences between the Buying Fund’s principal risks and those of each Selling Fund are also described below.
| | • | | Active Management Risk. The Fund is actively managed and its performance therefore will reflect in part the ability of the portfolio managers to select securities and to make investment decisions that are suited to achieving the Fund’s investment objective. Due to its active management, the Fund could underperform other mutual funds with similar investment objectives. Each Selling Fund also is subject to this principal risk. |
| | • | | Derivatives Risk. Derivatives are financial instruments that have a value which depends upon, or is derived from, the value of something else, such as one or more underlying securities, pools of securities, options, futures, indexes or currencies. Losses involving derivative instruments may be substantial, because a relatively small price movement in the underlying security(ies), instrument, currency or index may result in a substantial loss for the Fund. In addition to the potential for increased losses, the use of derivative instruments may lead to increased volatility within the Fund. Derivative instruments in which the Fund invests will typically increase the Fund’s exposure to principal risks to which it is otherwise exposed, and may expose the Fund to additional risks, including counterparty credit risk, leverage risk, hedging risk, correlation risk and liquidity risk. Columbia World Equity Fund and Threadneedle Global Equity Income Fund also are subject to this risk. Columbia Global Value Fund is not subject to derivatives risk as a principal risk, but may be subject to such risk to the extent of its investments, if any, in derivatives. |
| | • | | Counterparty credit risk is the risk that a counterparty to the derivative instrument becomes bankrupt or otherwise fails to perform its obligations due to financial difficulties, and the Fund may obtain no recovery of its investment or may only obtain a limited recovery, and any recovery may be delayed. |
21
| | • | | Hedging risk is the risk that derivative instruments used to hedge against an opposite position may offset losses, but they may also offset gains. There is no guarantee that a hedging strategy will eliminate the risk which the hedging strategy is intended to offset, which may lead to losses within the Fund. |
| | • | | Correlation risk is related to hedging risk and is the risk that there may be an incomplete correlation between the hedge and the opposite position, which may result in increased or unanticipated losses. |
| | • | | Liquidity risk is the risk that the derivative instrument may be difficult or impossible to sell or terminate, which may cause the Fund to be in a position to do something the investment manager would not otherwise choose, including accepting a lower price for the derivative instrument, selling other investments or foregoing another, more appealing investment opportunity. Derivative instruments which are not traded on an exchange, including, but not limited to, forward contracts, swaps and over-the-counter options, may have increased liquidity risk. |
| | • | | Leverage risk is the risk that losses from the derivative instrument may be greater than the amount invested in the derivative instrument. |
| | • | | Risk of Foreign Investing. Foreign securities are securities of issuers based outside the United States. An issuer is deemed to be based outside the United States if it is organized under the laws of another country. Foreign securities are primarily denominated in foreign currencies. Each Selling Fund also is subject to this principal risk. In addition to the risks normally associated with domestic securities of the same type, foreign securities are subject to the following foreign risks: |
| | • | | Country risk includes the political, economic, and other conditions of the country. These conditions include lack of publicly available information, less government oversight (including lack of accounting, auditing, and financial reporting standards), the possibility of government-imposed restrictions, and even the nationalization of assets. The liquidity of foreign investments may be more limited than for most U.S. investments, which means that, at times it may be difficult to sell foreign securities at desirable prices. |
| | • | | Currency risk results from the constantly changing exchange rate between local currency and the U.S. dollar. Whenever the Fund holds securities valued in a foreign currency or holds the currency, changes in the exchange rate add to or subtract from the value of the investment. |
| | • | | Custody risk refers to the process of clearing and settling trades. It also covers holding securities with local agents and depositories. Low trading volumes and volatile prices in less developed markets make trades harder to complete and settle. Local agents are held only to the standard of care of the local market. Governments or trade groups may compel local agents to hold securities in designated depositories that are not subject to independent evaluation. The less developed a country’s securities market is, the greater the likelihood of problems occurring. |
| | • | | Emerging markets risk includes the dramatic pace of change (economic, social and political) in these countries as well as the other considerations listed above. These markets are in early stages of development and are extremely volatile. They can be marked by extreme inflation, devaluation of currencies, dependence on trade partners, and hostile relations with neighboring countries. |
| | • | | Geographic Concentration Risk. The Fund may be particularly susceptible to economic, political or regulatory events affecting companies and countries within the specific geographic region in which the Fund focuses its investments. Currency devaluations could occur in countries that have not yet experienced currency devaluation to date, or could continue to occur in countries that have already experienced such devaluations. As a result, the Fund may be more volatile than a more geographically diversified fund. Each Selling Fund also is subject to this principal risk. |
| | • | | Issuer Risk. An issuer may perform poorly, and therefore, the value of its stocks and bonds may decline. Poor performance may be caused by poor management decisions, competitive pressures, breakthroughs in technology, reliance on suppliers, labor problems or shortages, corporate restructurings, fraudulent disclosures or other factors. Each Selling Fund also is subject to this risk. |
| | • | | Market Risk. The market value of securities may fall or fail to rise. Market risk may affect a single issuer, sector of the economy, industry, or the market as a whole. The market value of securities may fluctuate, sometimes rapidly and unpredictably. This risk is generally greater for small and mid-sized companies, which tend to be more vulnerable to adverse developments. In addition, focus on a particular style, for example, investment in growth or value securities, may cause the Fund to underperform other mutual funds if that style falls out of favor with the market. Each Selling Fund also is subject to this principal risk. |
22
Performance
The following bar charts and tables provide some illustration of the risks of investing in the Funds by showing, respectively:
| | • | | How each Fund’s performance has varied for each full calendar year shown in the bar chart; and |
| | • | | How each Fund’s average annual total returns compare to certain measures of market performance shown in the table. |
Both the bar charts and the tables assume that all distributions have been reinvested. The performance of different classes varies because of differences in sales charges and other fees and expenses. How a Fund has performed in the past (before and after taxes) does not indicate how the Fund will perform in the future. The performance shown reflects any fee waiver or expense reimbursement arrangements in effect for the period reported. In the absence of such fee waiver or expense reimbursement arrangements, the performance would have been lower.
Bar Charts. Class A share information is shown in the bar charts; the sales charge for Class A shares is not reflected in the bar charts.
Tables. The tables below show total returns from hypothetical investments in the indicated classes of shares of each Fund. The inception date for Class Z shares of the Buying Fund is September 27, 2010; accordingly, performance information for this class is not shown. The returns shown are compared to the measures of market performance shown for the same periods. The performance calculation in the tables assume:
| | • | | the maximum sales charge for Class A shares; |
| | • | | sales at the end of the indicated period and deduction of the applicable contingent deferred sales charge (“CDSC”) for Class B and Class C shares; |
| | • | | no sales charge for Class I, Class R, Class R4 and Class Z shares; and |
| | • | | except as noted for Class A shares, no adjustments for taxes paid by an investor on reinvested income and capital gains. |
All fee and expense, performance and capitalization information herein attributed to Columbia Global Equity Fund, including pro forma information, reflects information about the existing Columbia Global Equity Fund, even though the Buying Fund may be either the existing series or the newly created series.
After-Tax Returns
After-tax returns are shown only for Class A shares. After-tax returns for the other share classes will vary. After-tax returns are calculated using the highest historical individual U.S. federal marginal income tax rate and do not reflect the effect of foreign, state or local taxes. Actual after-tax returns will depend on your tax situation and most likely will differ from the returns shown in the table. If you hold your shares in a tax-deferred account, such as a 401(k) plan or an IRA, the after-tax returns do not apply to you because you will not incur taxes until you begin to withdraw from your account.
The return after taxes on distributions for a period may be the same as the return before taxes for the same period if there were no distributions or if the distributions were small. The return after taxes on distributions and sale of Fund shares for a period may be greater than the return before taxes for the same period if there was a tax loss realized on the sale of Fund shares. The benefit of the tax loss (because it can be used to offset other gains) may result in a higher return.
23
Columbia Global Value Fund (Selling Fund)
CLASS A SHARE PERFORMANCE
(based on calendar years)
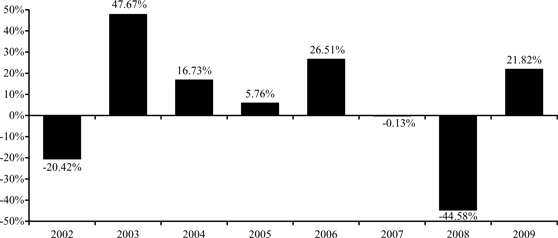
During the periods shown in the bar chart, the highest return for a calendar quarter was +29.11% (quarter ended June 30, 2003) and the lowest return for a calendar quarter was -24.15% (quarter ended September 30, 2002).
These returns do not reflect deductions of sales charges, if any, paid by investors and would be lower if they did. The performance of other share classes may vary from that shown because of differences in expenses.
The Fund’s Class A shares year-to-date return at June 30, 2010 was -10.36%.
24
Columbia World Equity Fund (Selling Fund)
CLASS A SHARE PERFORMANCE
(based on calendar years)
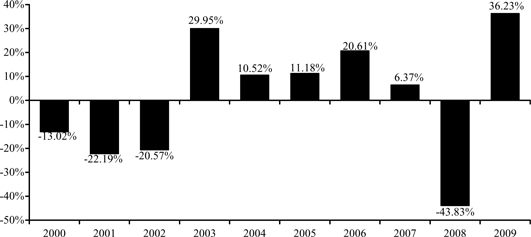
During the periods shown in the bar chart, the highest return for a calendar quarter was +22.35% (quarter ended June 30, 2009) and the lowest return for a calendar quarter was -24.56% (quarter ended December 31, 2008).
These returns do not reflect deductions of sales charges, if any, paid by investors and would be lower if they did. The performance of other share classes may vary from that shown because of differences in expenses.
The Fund’s Class A shares year-to-date return at June 30, 2010 was -8.13%.
Threadneedle Global Equity Income Fund (Selling Fund)
CLASS A SHARE PERFORMANCE
(based on calendar years)
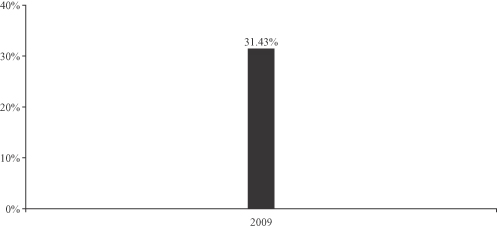
During the periods shown in the bar chart, the highest return for a calendar quarter was +19.45% (quarter ended June 30, 2009) and the lowest return for a calendar quarter was -11.85% (quarter ended March 31, 2009).
25
These returns do not reflect deductions of sales charges, if any, paid by investors and would be lower if they did. The performance of other share classes may vary from that shown because of differences in expenses.
The Fund’s Class A shares year-to-date return at June 30, 2010 was -8.39%.
Columbia Global Equity Fund (Buying Fund)
CLASS A SHARE PERFORMANCE
(based on calendar years)
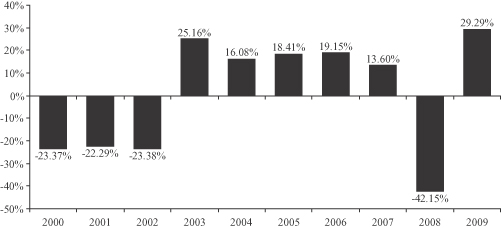
During the periods shown in the bar chart, the highest return for a calendar quarter was +17.75% (quarter ended June 30, 2009) and the lowest return for a calendar quarter was -19.76% (quarter ended December 31, 2008).
These returns do not reflect deductions of sales charges, if any, paid by investors and would be lower if they did. The performance of other share classes may vary from that shown because of differences in expenses.
The Fund formerly was a “feeder” fund in a master/feeder arrangement where the Fund invested all of its assets in a corresponding “master” fund with an identical investment objective and investment strategies. As of Nov. 8, 2005, the Fund became a stand-alone fund that invests directly in a portfolio of securities. The information shown in the table includes the activity of the Fund when it was a feeder in a master/feeder arrangement.
The Fund’s Class A shares year-to-date return at June 30, 2010 was -9.65%.
Average Annual Total Returns (for periods ended December 31, 2009)
| | | | | | | | | |
| | | 1 year | | | 5 years | | | Since Inception
(April 16, 2001) | |
Columbia Global Value Fund (Selling Fund): | | | | | | | | | |
Class A | | | | | | | | | |
Return before taxes | | +14.77 | % | | -3.20 | % | | +2.04 | % |
Return after taxes on distributions | | +13.45 | % | | -4.90 | % | | +0.64 | % |
Return after taxes on distributions and sale of Fund shares | | +10.08 | % | | -2.24 | % | | +1.86 | % |
Class B | | | | | | | | | |
Return before taxes | | +16.07 | % | | -2.97 | % | | +1.98 | % |
Class C | | | | | | | | | |
Return before taxes | | +20.06 | % | | -2.76 | % | | +1.97 | % |
Class Z | | | | | | | | | |
Return before taxes | | +22.25 | % | | -1.77 | % | | +3.02 | % |
26
Average Annual Total Returns (for periods ended December 31, 2009)
| | | | | | | | | |
| | | 1 year | | | 5 years | | | Since Inception
(April 16, 2001) | |
Morgan Stanley Capital International (MSCI) World Index(1)(2) (Net)(reflects reinvested dividends net of withholding taxes but reflects no deduction for fees, expenses or other taxes) | | +29.99 | % | | 2.01 | % | | +2.72 | % |
| (1) | The Morgan Stanley Capital International (MSCI) World Index is a managed, market capitalization-weighted benchmark index made up of equities from 23 countries, including the United States. |
| (2) | Investors cannot invest directly in an index. |
Average Annual Total Returns (for periods ended December 31, 2009)
| | | | | | | | | |
| | | 1 year | | | 5 years | | | 10 years | |
Columbia World Equity Fund (Selling Fund): | | | | | | | | | |
Class A | | | | | | | | | |
Return before taxes | | +28.39 | % | | +0.57 | % | | -2.28 | % |
Return after taxes on distributions | | +27.88 | % | | +0.01 | % | | -2.83 | % |
Return after taxes on distributions and sale of Fund shares | | +18.85 | % | | +0.59 | % | | -1.91 | % |
Class B | | | | | | | | | |
Return before taxes | | +30.28 | % | | +0.66 | % | | -2.44 | % |
Class C | | | | | | | | | |
Return before taxes | | +34.19 | % | | +0.99 | % | | -2.46 | % |
Morgan Stanley Capital International (MSCI) World Index(1)(2) (Net) (reflects reinvested dividends net of withholding taxes but reflects no deduction for fees, expenses or other taxes) | | +29.99 | % | | +2.01 | % | | -0.24 | % |
| (1) | The Morgan Stanley Capital International (MSCI) World Index is a managed, market capitalization-weighted benchmark index made up of equities from 23 countries, including the United States. |
| (2) | Investors cannot invest directly in an index. |
Average Annual Total Returns (for periods ended December 31, 2009)
| | | | | | |
| | | 1 year | | | Since
Inception
(8/1/2008) | |
Threadneedle Global Equity Income Fund (Selling Fund): | | | | | | |
Class A | | | | | | |
Return before taxes | | +23.87 | % | | -8.40 | % |
Return after taxes on distributions | | +22.15 | % | | -9.47 | % |
Return after taxes on distributions and sale of Fund shares | | +15.42 | % | | -7.75 | % |
Class B | | | | | | |
27
Average Annual Total Returns (for periods ended December 31, 2009)
| | | | | | |
| | | 1 year | | | Since
Inception
(8/1/2008) | |
Return before taxes | | +25.55 | % | | -7.73 | % |
Class C | | | | | | |
Return before taxes | | +29.47 | % | | -5.18 | % |
Class I | | | | | | |
Return before taxes | | +31.87 | % | | -4.12 | % |
Class R(1) | | | | | | |
Return before taxes | | +30.89 | % | | -4.77 | % |
Class R4 | | | | | | |
Return before taxes | | +31.46 | % | | -4.34 | % |
Morgan Stanley Capital International (MSCI) All Country World Index (Gross) (2)(3) (reflects reinvestment of all distributions and changes in market prices.) | | +35.41 | % | | -6.30 | % |
| (1) | Class R shares were formerly named Class R2 shares. |
| (2) | The Morgan Stanley Capital International (MSCI) All Country World Index, an unmanaged index of equity securities, is designed to measure equity market performance in the global developed and emerging markets. |
| (3) | Investors cannot invest directly in an index. |
Average Annual Total Returns (for periods ended December 31, 2009)
| | | | | | | | | | | | | | | | | | |
| | | 1 year | | | 5 years | | | 10 Years | | | Class C Since
Inception
(6/26/00) (2) | | | Class I Since
Inception
(8/01/08) (2) | | | Class R Since
Inception
(12/11/06) (2)(4) | |
| Columbia Global Equity Fund (Buying Fund)(1): | | | | | | | | | | | | | | | | | | |
Class A | | | | | | | | | | | | | | | | | | |
Return before taxes | | +21.86 | % | | +2.47 | % | | -2.85 | % | | N/A | | | N/A | | | N/A | |
Return after taxes on distributions | | +21.45 | % | | +2.24 | % | | -3.36 | % | | N/A | | | N/A | | | N/A | |
Return after taxes on distributions and sale of Fund shares | | +14.19 | % | | +1.98 | % | | -2.56 | % | | N/A | | | N/A | | | N/A | |
Class B | | | | | | | | | | | | | | | | | | |
Return before taxes | | +23.27 | % | | +2.54 | % | | -3.03 | % | | N/A | | | N/A | | | N/A | |
Class C | | | | | | | | | | | | | | | | | | |
Return before taxes | | +27.08 | % | | +2.89 | % | | N/A | | | -2.54 | % | | N/A | | | N/A | |
Class I | | | | | | | | | | | | | | | | | | |
Return before taxes | | +30.22 | % | | N/A | | | N/A | | | N/A | | | -6.83 | % | | N/A | |
Class R(3)(4) | | | | | | | | | | | | | | | | | | |
Return before taxes | | +28.83 | % | | N/A | | | N/A | | | N/A | | | N/A | | | -4.95 | % |
28
Average Annual Total Returns (for periods ended December 31, 2009)
| | | | | | | | | | | | | | | | | | |
| | | 1 year | | | 5 years | | | 10 Years | | | Class C Since
Inception
(6/26/00) (2) | | | Class I Since
Inception
(8/01/08) (2) | | | Class R Since
Inception
(12/11/06) (2)(4) | |
Class R4 | | | | | | | | | | | | | | | | | | |
Return before taxes | | +29.59 | % | | +3.88 | % | | -2.09 | % | | N/A | | | N/A | | | N/A | |
Morgan Stanley Capital International (MSCI) All Country World Index (Gross) (5)(7) (reflects reinvestment of all distributions and changes in market prices.) | | +35.41 | % | | +3.64 | % | | 0.90 | % | | +1.29 | % | | -6.30 | % | | -3.58 | % |
Lipper Global Funds Index(6)(7) (reflects reinvested dividends) | | +31.06 | % | | +3.20 | % | | +1.03 | % | | +1.11 | % | | -4.97 | % | | -3.88 | % |
| (1) | The Fund formerly was a “feeder” fund in a master/feeder arrangement where the Fund invested all of its assets in a corresponding “master” fund with an identical investment objective and investment strategies. As of Nov. 8, 2005, the Fund became a stand-alone fund that invests directly in a portfolio of securities. The information shown in the table includes the activity of the Fund when it was a feeder in a master/feeder arrangement. |
| (2) | For classes with less than 10 years performance. |
| (3) | Past performance for Class R for the period prior to the beginning of operations for that class may be calculated based on the performance of Class B. The blended class performance will be adjusted to reflect differences in sales charges, but not differences in annual Fund operating expenses (for example, 12b-1 fees). In such case, the use of blended performance generally results in a presentation of higher performance for classes with higher operating expenses than those of the class with which they are blended, and a presentation of lower performance for classes with lower operating expenses than those of the class with which they are blended. |
| (4) | Class R shares were formerly named Class R2 shares. |
| (5) | The Morgan Stanley Capital International (MSCI) All Country World Index, an unmanaged index of equity securities, is designed to measure equity market performance in the global developed and emerging markets. |
| (6) | The Lipper Global Funds Index includes the 30 largest global funds tracked by Lipper Inc. The Fund’s performance is currently measured against this index for purposes of determining the performance incentive adjustment. |
| (7) | Investors cannot invest directly in an index. |
29
ADDITIONAL INFORMATION ABOUT EACH REORGANIZATION
Terms of the Reorganizations
The Board of each Fund has approved the Agreement. While shareholders are encouraged to review the Agreement, which has been filed with the Securities and Exchange Commission as an exhibit to the registration statement of which this combined proxy statement/prospectus is a part, the following is a summary of certain terms of the Agreement:
| | • | | Each Reorganization is expected to occur before the end of the second quarter of 2011, pending shareholder approval, receipt of any necessary regulatory approvals and satisfaction of any other conditions to closing. However, following shareholder approval, each Reorganization may happen at any time agreed to by the applicable Selling Fund and the Buying Fund. |
| | • | | Each Selling Fund will transfer all of its assets to the Buying Fund and, in exchange, the Buying Fund will assume all the Selling Fund’s liabilities and will issue Reorganization Shares to the Selling Fund. The value of each Selling Fund’s assets, as well as the number of Reorganization Shares to be issued to the Selling Fund, will be determined in accordance with the Agreement. The Reorganization Shares will have an aggregate net asset value on the business day immediately preceding the closing of the Reorganization equal to the value of the assets received from the Selling Fund, less the liabilities assumed by the Buying Fund in the transaction. The Reorganization Shares will immediately be distributed to Selling Fund shareholders in proportion to their holdings of shares of the Selling Fund, in liquidation of the Selling Fund. As a result, shareholders of the Selling Fund will become shareholders of the Buying Fund. No shareholders of any Selling Fund will pay any sales charge in connection with its Reorganization. |
| | • | | The net asset value of each Selling Fund and the Buying Fund will be computed as of the close of regular trading on the New York Stock Exchange on the business day next preceding the closing date of the applicable Reorganization. |
The Board of RiverSource Global Series, Inc. has approved the Redomiciling of Columbia Global Equity Fund, a series of RiverSource Global Series, Inc., into a newly created series of RiverSource Series Trust that has also been named Columbia Global Equity Fund. The Redomiciling is subject to approval by shareholders of Columbia Global Equity Fund. If the Redomiciling is approved by shareholders of Columbia Global Equity Fund, it is expected that the Redomiciling will occur prior to the Reorganizations, in which case the Buying Fund will be the newly created series of RiverSource Series Trust. If the Redomiciling has not been completed prior to the closing of the Reorganization, the Buying Fund will be the existing series of RiverSource Global Series, Inc. which, if the Redomiciling is approved, may thereafter be redomiciled.
Conditions to Closing Each Reorganization
The completion of each Reorganization is subject to certain conditions described in the Agreement, including:
| | • | | The Selling Fund will have declared and paid a dividend that, together with all previous dividends, will distribute all of the Selling Fund’s net investment income and net capital gains, if any, to the shareholders of the Selling Fund for its tax years ending on or prior to the closing date of the Reorganization. |
| | • | | The Funds will have received any approvals, consents or exemptions from the SEC or any other regulatory body necessary to carry out the Reorganization. |
| | • | | A registration statement on Form N-14 relating to the Reorganization will have been filed with the SEC and become effective. |
| | • | | The shareholders of the Selling Fund will have approved the Agreement by the requisite vote. |
| | • | | The Selling Fund will have received an opinion of tax counsel to the effect that, as described in more detail in the section entitled “Tax Status of the Reorganizations,” the shareholders of the Selling Fund will not recognize gain or loss for U.S. federal income tax purposes upon the exchange of their Selling Fund shares for the Reorganization Shares of the Buying Fund in connection with the Reorganization. |
| | • | | Solely with respect to the Reorganization of Columbia Global Value Fund into Columbia Global Equity Fund, shareholders of Columbia Global Equity Fund will have approved the proposed investment management services agreement approved by its Board in September 2010. |
Termination of the Agreement
The Agreement and the transactions contemplated by it may be terminated and abandoned with respect to any Reorganization by resolution of the Board of any applicable Fund at any time prior to the closing date thereof. In the event of a termination, Columbia Management will bear all costs associated with the Reorganization.
30
Tax Status of the Reorganizations
Each Reorganization is intended to qualify for U.S. federal income tax purposes as a tax-free reorganization under section 368(a) of the Internal Revenue Code of 1986, as amended (the “Code”). As a condition to the closing of each Reorganization, each Selling Fund and the Buying Fund will receive an opinion from Ropes & Gray LLP to the effect that as further described below on the basis of existing provisions of the Code, U.S. Treasury regulations issued thereunder, current administrative rules, pronouncements and court decisions, for U.S. federal income tax purposes:
| | • | | The Reorganization will constitute a “reorganization” within the meaning of Section 368(a)(1) of the Code, and the Selling Fund and the Buying Fund will each be “a party to a reorganization” within the meaning of Section 368(b) of the Code. |
| | • | | Under Sections 361 and 357 of the Code, no gain or loss will be recognized by the Selling Fund upon the transfer of all of its assets to the Buying Fund in exchange for Reorganization Shares and the assumption by the Buying Fund of all of the liabilities of the Selling Fund, or upon the distribution of the Reorganization Shares by the Selling Fund to its shareholders in liquidation. |
| | • | | Under Section 354 of the Code, no gain or loss will be recognized by the shareholders of the Selling Fund upon the exchange of their Selling Fund shares for Reorganization Shares of the Buying Fund. |
| | • | | Under Section 358 of the Code, the aggregate tax basis of Reorganization Shares that a Selling Fund shareholder receives in the Reorganization will be the same as the aggregate tax basis of the Selling Fund shares exchanged therefor. |
| | • | | Under Section 1223(1) of the Code, a Selling Fund shareholder’s holding period for the Reorganization Shares received in the Reorganization will be determined by including the shareholder’s holding period for the Selling Fund shares exchanged therefor, provided the shareholder held such Selling Fund shares as capital assets. |
| | • | | Under Section 1032 of the Code, no gain or loss will be recognized by the Buying Fund upon the receipt of assets of the Selling Fund in exchange for Reorganization Shares and the assumption by the Buying Fund of all of the liabilities of the Selling Fund. |
| | • | | Under Section 362(b) of the Code, the Buying Fund’s tax basis in the assets of the Selling Fund transferred to the Buying Fund in the Reorganization will be the same as the Selling Fund’s tax basis in such assets immediately prior to the Reorganization. |
| | • | | Under Section 1223(2) of the Code, the Buying Fund’s holding periods in the assets received from the Selling Fund in the Reorganization will include the Selling Fund’s holding periods in such assets. |
| | • | | The Buying Fund will succeed to and take into account the items of the Selling Fund described in Section 381(c) of the Code, subject to the conditions and limitations specified in Sections 381, 382, 383 and 384 of the Code and the regulations thereunder. |
Ropes & Gray LLP will express no view with respect to the effect of a Reorganization on any transferred asset as to which any unrealized gain or loss is required to be recognized under U.S. federal income tax principles (i) at the end of a taxable year or upon the termination thereof, or (ii) upon the transfer of such asset regardless of whether such a transfer would otherwise be a non-taxable transaction.
Each opinion will be based on certain factual certifications made by the officers of the Selling Fund and the Buying Fund and will also be based on customary assumptions. Each opinion will note and distinguish certain published precedent. It is possible that the Internal Revenue Service (the “IRS”) or a court could disagree with Ropes & Gray LLP’s opinion which therefore cannot be free from doubt.
Opinions of counsel are not binding upon the IRS or the courts. If a Reorganization were consummated but did not qualify as a tax-free reorganization under the Code, a shareholder of the Selling Fund would recognize a taxable gain or loss equal to the difference between his or her tax basis in his or her Selling Fund shares and the fair market value of the Reorganization Shares of the Buying Fund he or she received. Shareholders of a Selling Fund should consult their tax advisors regarding the effect, if any, of the Reorganization in light of their individual circumstances.
A portion, including a substantial portion, of the portfolio assets of each Buying or Selling Fund may also be sold at any time before or after the Reorganization in connection with its Reorganization. The actual tax effect of such sales depends on the difference between the price at which such portfolio assets are sold and the tax basis in such assets of the Fund making the sale. Any capital gains recognized in these sales on a net basis, after reduction by any available capital
31
losses, will be distributed to shareholders as capital gain dividends (to the extent of net realized long-term capital gains over net realized short-term capital losses) and/or ordinary dividends (to the extent of net realized short-term capital gains over net realized long-term capital losses) during or with respect to the year of sale, and such distributions will be taxable to shareholders. Each Reorganization will end the tax year of the applicable Selling Fund, and will therefore accelerate any distributions to shareholders from the Selling Fund for its short tax year ending on the date of the Reorganization. Those tax year-end distributions will be taxable and will include any undistributed capital gains resulting from portfolio turnover prior to the Reorganization.
More generally, prior to the closing of each Reorganization, the Selling Fund will, and the Buying Fund may, declare a distribution to shareholders, which, together with all previous distributions, will have the effect of distributing to shareholders all of its investment company taxable income (computed without regard to the deduction for dividends paid), net tax-exempt income, if any, and net realized capital gains, if any, through the closing of the Reorganization, including any undistributed income or gains from prior years. These distributions will be taxable to shareholders, and such distributions by a Selling Fund will include any distributable, but undistributed, capital gains resulting from portfolio turnover prior to the Reorganization. If a shareholder holds shares of either Fund in a non-taxable account, distributions with respect to those shares will not be taxable to the shareholder if the amount distributed remains in the nontaxable account.
A Fund’s ability to carry forward capital losses and to use them to offset future gains may be limited as a result of the Reorganization. First, a Fund’s “pre-acquisition losses” (including capital loss carryforwards, net current-year capital losses, and unrealized losses that exceed certain thresholds) may become unavailable to offset gains of the combined Fund to the extent such pre-acquisition losses exceed an annual limitation amount. Second, one Fund’s pre-acquisition losses cannot be used to offset gains in another Fund that are “built in” (unrealized) at the time of the Reorganizations and that exceed certain thresholds (“non-de minimis built-in gains”) for five tax years. Third, a Selling Fund’s loss carryforwards, as limited under the previous two rules, are permitted to offset only that portion of the gains of the Buying Fund for the taxable year of the Reorganization that is equal to the portion of the Buying Fund’s taxable year that follows the date of the Reorganization (prorated according to number of days). Therefore, in certain circumstances, shareholders of a Fund may pay taxes sooner, or pay more taxes, than they would have had the Reorganizations not occurred.
In addition, the combined Fund will have tax attributes that reflect a blending of the tax attributes of each Fund at the time of the Reorganizations (including as affected by the rules described above). Therefore, the shareholders of the Selling Fund will in each case receive a proportionate share of any “built-in” (unrealized) gains in the combined Fund’s assets, as well as any taxable income or gains realized by the Buying Fund but not distributed to its shareholders prior to the Reorganization, when such income or gains are eventually distributed by the Buying Fund. As a result, shareholders of a Selling Fund may receive a greater amount of taxable distributions than they would have had the Reorganizations not occurred. In addition, any pre-acquisition losses of the Selling Fund (whether realized or unrealized) remaining after the operation of the limitation rules described above will become available to offset capital gains realized by the combined Fund after the Reorganizations and thus may reduce subsequent capital gain distributions to a broader group of shareholders than would have been the case absent such Reorganizations, such that the benefit of those losses to Selling Fund shareholders may be further reduced relative to what the benefit would have been had the Reorganizations not occurred.
The effect of the rules described above will depend on the relative sizes of, and the losses and gains (both realized and unrealized) in, each Fund at the time of the Reorganizations and thus cannot be calculated precisely prior to the Reorganizations.
The realized and unrealized gains and losses of each Fund at the time of its Reorganization, and the occurrence of other Reorganizations involving the same Buying Fund, will determine the extent to which the combining Funds’ respective losses, both realized and unrealized, will be available to reduce gains realized by the combined Fund following the Reorganization, and consequently the extent to which the combined Fund may be required to distribute gains to its shareholders earlier or in greater amounts than would have been the case absent the Reorganization. The following paragraphs provide a brief summary of the tax effect of each of the Reorganizations assuming all Reorganizations occurred on February 28, 2010. As noted above, the tax effect of a Reorganization depends on each Fund’s relative tax situation at the time of the Reorganization, which situation will be different than the tax situation on February 28, 2010 and cannot be calculated precisely prior to the Reorganization. Portfolio turnover in a Fund, market fluctuations, redemption activity or the nonoccurrence of one or more other Reorganizations into the same Buying Fund could cause the actual tax effect of the Reorganizations to differ substantially from that described below. For purposes of the following discussion, a Fund’s “net realized losses” consist of its capital loss carryforwards plus year-to-date net realized losses or net of year-to-date net realized gains, in each case as of February 28, 2010.
32
Reorganizations of Columbia Global Value Fund, Columbia World Equity Fund and Threadneedle Global Equity Income Fund into Columbia Global Equity Fund
As of February 28, 2010, Columbia Global Value Fund had net realized losses equal to approximately 125.4% of net assets, consisting of carryforward losses with seven- and eight-year expiration periods, and unrealized net losses equal to about 27.3% of net assets. Columbia World Equity Fund had net realized losses equal to approximately 33.8% of net assets, consisting of year-to-date losses and carryforward losses with an eight-year expiration period, and unrealized net gain equal to about 13.5% of net assets. Threadneedle Global Equity Income Fund had net realized losses equal to approximately 4.7% of net assets, consisting of carryforward losses with seven- and eight-year expiration periods, and unrealized net gain equal to about 13.6% of net assets. Columbia Global Equity Fund had net realized losses equal to approximately 72.9% of net assets, about half of which were due to expire in the next two years and the balance primarily in six to eight years, and unrealized net gain equal to about 8.5% of net assets.
If the Reorganizations had occurred on February 28, 2010, the Selling Funds would have become subject to annual loss limitations. The loss limitation rules would have limited the combined Fund’s ability to use the net realized losses of each Selling Fund to offset gains recognized by the combined Fund. The limitations potentially could have resulted in earlier and larger taxable distributions, and therefore a greater tax cost to shareholders, than if the Reorganizations had not occurred. However, the Buying Fund had significant losses that would not have been subject to limitation. Those Buying Fund losses would have reduced the potential tax cost of the Reorganization to shareholders of all Funds. Further, the Reorganizations would have permitted Columbia World Equity Fund and Threadneedle Global Equity Income Fund to spread their unrealized net gain across the larger combined Fund, thereby spreading the tax cost of such gain, if and when realized, over a larger group of shareholders than if the Reorganizations had not occurred, resulting in a potential tax benefit to the shareholders of those two Funds.
The tax principles described above will apply in each case and are not expected to change prior to the Reorganizations. However, the results of their application and, at a minimum, the specific percentages noted above will change prior to each Reorganization because of market developments and volatility in the marketplace, any pre-Reorganization realignments or other sales of portfolio securities that already have occurred or that might occur and shareholder activity in the Funds, among other changes.
This description of the U.S. federal income tax consequences of the Reorganizations is made without regard to the particular facts and circumstances of any shareholder. Shareholders are urged to consult their tax advisors regarding the effect, if any, of the Reorganization in light of their individual circumstances. Because the foregoing discussion relates only to the U.S. federal income tax consequences of the Reorganizations, shareholders of a Selling Fund should also consult their tax advisors as to the state, local and foreign tax consequences, if any, of the Reorganizations.
Reasons for the Proposed Reorganizations and Board Deliberations
Each Reorganization was reviewed by the Board of the Selling Fund involved therein, with the advice and assistance of Fund counsel and independent legal counsel to such Board. Threadneedle Global Equity Income Fund is overseen by one Board (the “RiverSource Board”); Columbia World Equity Fund is overseen by a second Board (the “Columbia Atlantic Board”); and Columbia Global Value Fund is overseen by a third Board (the “Columbia Nations Board”). At regular and special meetings of each Selling Fund’s Board in May, June and August 2010, each Board considered the Reorganization of each Selling Fund overseen by it, as proposed by Columbia Management. In connection with those Board meetings, Columbia Management and its affiliates provided background materials, analyses and other information to each Board regarding, among other things, the topics discussed below, including responses to specific requests by each Board, and responded to questions raised by each Board at those meetings. The Board also considered information provided in connection with various other proposals by Columbia Management to integrate the funds advised by Columbia Management into a single fund family with greater uniformity, including proposals to standardize fees charged by Columbia Management and its affiliates, as well as other service providers, for services provided to similar funds.
After each Board reviewed, evaluated and discussed the materials, analyses and information provided to it that the Board considered relevant to its deliberations, each Board, including the independent Board members thereof, unanimously approved the Reorganization of each Selling Fund overseen by it. Each Board, including the independent Board members thereof, also unanimously determined that participation by each Selling Fund overseen by it in its Reorganization was in the best interests of the Selling Fund and that the interests of existing shareholders of the Selling Fund would not be diluted as a result of the Reorganization.
33
The general factors considered by each Board in assessing and approving each applicable Reorganization included, among others, in no order of priority:
| | 1. | various potential benefits of the Reorganization to the shareholders of the Selling Fund; |
| | 2. | the Reorganization as part of Columbia Management’s overall commitment to streamline and to improve its fund offerings for the benefit of Fund shareholders; |
| | 3. | the investment objectives and principal investment strategies of the Selling Fund and the Buying Fund; |
| | 4. | the operating expenses that shareholders of each class of shares of the Selling Fund are expected to experience as shareholders of the Buying Fund after the Reorganization relative to the operating expenses currently borne by such shareholders, including that, on a net basis, such expenses are expected to decline as a result of the Reorganization and including Columbia Management’s contractual agreement to limit the total operating expenses of the Buying Fund (see “Fees and Expenses”); |
| | 5. | the current assets of the Selling Fund and the Buying Fund, and the anticipated combined pro forma assets of the Buying Fund after the Reorganization; |
| | 6. | the portfolio management team expected to be responsible for the combined Fund, and the historical performance of the Selling Fund and the Buying Fund, recognizing that no assurances can be given that the Buying Fund will achieve any particular level of performance after the Reorganization; |
| | 7. | the likelihood that the Selling Fund would achieve and/or maintain sufficient size to ensure its continued economic viability absent the Reorganization, and the Buying Fund’s relative prospects for attracting additional assets after the Reorganization; |
| | 8. | the anticipated tax-free nature of the exchange of shares in the Reorganization, and other expected U.S. federal income tax consequences of the Reorganization, including potential limitations on the Buying Fund’s use of the Fund’s pre-merger losses for U.S. federal income tax purposes after the Reorganization and the potential diminution of the Buying Fund’s ability to use those losses to offset future gains (see “Tax Status of the Reorganizations”); |
| | 9. | the potential benefits of the Reorganization to Columbia Management and its affiliates; |
| | 10. | that shareholders of the Selling Fund will experience no material change in shareholder services as a result of the Reorganization; |
| | 11. | any brokerage costs resulting from the Reorganization (e.g., the Selling Fund’s turnover associated with and resulting from the sale of any securities the Buying Fund cannot, or does not wish to, acquire); and |
| | 12. | that the direct costs associated with the Reorganization will be borne by the Selling Fund only to the extent that Columbia Management anticipates a reduction in expenses to shareholders of the Selling Fund in the first year following the Reorganization. |
In their deliberations, the Boards did not identify any single factor that was paramount or controlling and individual Board members may have attributed different weights to various factors. Each Board also evaluated the information available to it on a Selling Fund-by-Selling Fund basis, and made determinations separately in respect of each Selling Fund it oversees. Certain of the factors considered by each Board are discussed in more detail below.
STREAMLINED PRODUCT LINE
Each Board considered that the Reorganizations are intended, among other things, to streamline Columbia Management’s product offerings by reducing the number of funds in the Combined Fund Complex. Reducing the number of funds in the complex is intended to enhance the funds’ prospects for attracting additional assets by better differentiating the funds for potential shareholders (which should lead to a amore concentrated selling effort).
CONTINUITY OF INVESTMENT
Each Board took into account the fact that each applicable Selling Fund and the Buying Fund have similar investment objectives and principal investment strategies. Specifically, the relevant Board noted the following with respect to each Reorganization:
Columbia Global Value Fund into Columbia Global Equity Fund. The Columbia Nations Board noted that the Buying Fund seeks to provide shareholders with long-term capital growth and that Columbia Global Value Fund’s investment objective is substantially similar. The Columbia Nations Board considered that each Fund invests in domestic and foreign securities, although the Buying Fund may invest in the securities of small- and mid- capitalization companies to a greater extent than may Columbia Global Value Fund. The Columbia Nations Board also compared the management style of Brandes Investment Partners, L.P., the subadviser of Columbia Global Value Fund, which provides the day-to-day management of Columbia Global Value Fund, with that of Threadneedle International Limited, the subadviser to the Buying Fund, which provides the day-to-day management of the Buying Fund. The Columbia Nations Board noted that both subadvisers conduct research to identify potential investments based on in-depth fundamental analyses. While Columbia Global Value Fund focuses on undervalued companies with market capitalizations greater than $1 billion, the Buying Fund does not limit investments based on market capitalizations.
34
Columbia World Equity Fund into Columbia Global Equity Fund. The Columbia Atlantic Board noted that the Buying Fund seeks to provide shareholders with long-term capital growth and that Columbia World Equity Fund’s investment objective is substantially similar. The Columbia Atlantic Board also noted that each of Columbia World Equity Fund and the Buying Fund normally invests at least 80% of its net assets in equity securities. The Columbia Atlantic Board further noted that the Buying Fund normally invests at least 40% of its net assets in companies that maintain their principal place of business or conduct their principal business activities outside the U.S., have their securities traded on non-U.S. exchanges or have been formed under the laws of non-U.S. countries, while Columbia World Equity is not similarly constrained (though it typically invests in at least three countries, including the United States, at any one time). The Columbia Atlantic Board also considered that Threadneedle International Limited, as a subadviser, manages the Buying Fund’s assets.
Threadneedle Global Equity Income Fund into Columbia Global Equity Fund. The RiverSource Board noted that the Buying Fund seeks long-term capital growth, while Threadneedle Global Equity Income Fund seeks a high level of current income and, secondarily, growth of capital. In this regard, the RiverSource Board considered that the securities in which Threadneedle Global Equity Income Fund invests typically are dividend-paying common and preferred stocks that produce current income or that offer potential to produce income, while the Buying Fund has no similar stated preference. The Board noted though that, as a practical matter, a large portion of the Buying Fund’s portfolio is composed of income-paying securities. The RiverSource Board also noted that each of Threadneedle Global Equity Income Fund and the Buying Fund normally invests at least 80% of its net assets in equity securities and at least 40% of its net assets in companies that maintain their principal place of business or conduct their principal business activities outside the U.S., have their securities traded on non-U.S. exchanges or have been formed under the laws of non-U.S. countries. The RiverSource Board also considered that Threadneedle International Limited, as a subadviser, manages the Buying Fund’s assets.
INVESTMENT PERFORMANCE. Each Board considered the relative performance record of each Selling Fund overseen by it and of the Buying Fund, noting, however, that past performance is no guarantee of future results. Specifically, the relevant Board noted the following with respect to each Reorganization:
Proposal 1
Columbia Global Value Fund into Columbia Global Equity Fund. The Columbia Nations Board considered the relative performance of the Funds for periods ending February 28, 2010, during which Columbia Global Value Fund’s performance was better for the one-year period, but the Buying Fund’s performance was better for the three- and five-year periods. The Columbia Nations Board also considered that the Buying Fund received a higher risk-adjusted performance rating for the three- and five-year periods from an independent information provider.
Columbia World Equity Fund into Columbia Global Equity Fund. The Columbia Atlantic Board considered the relative performance of the Funds for periods ending February 28, 2010, during which Columbia World Equity Fund’s performance was better for the one- and ten-year periods, but the Buying Fund’s performance was better over the three- and five-year periods. The Columbia Atlantic Board also considered that the Buying Fund received a higher risk-adjusted performance rating for the three- and five-year periods, and that the Funds received identical ratings for the ten-year period, in each case from an independent information provider.
Threadneedle Global Equity Income Fund into Columbia Global Equity Fund. The RiverSource Board considered the relative performance of the Funds for the one-year period ending February 28, 2010, during which Threadneedle Global Equity Income Fund’s performance was better. The RiverSource Board also considered the Buying Fund’s performance and its risk-adjusted performance ratings for the three-, five- and ten-year periods from an independent information provider.
ECONOMIES OF SCALE.
Each Board observed that, in addition to the potential to realize immediate economies associated with consolidating a smaller Selling Fund into a larger combined Fund, such as the elimination of duplicative costs, the combined funds may be able to take advantage of other economies of scale associated with larger funds. For example, a larger fund may benefit from fee breakpoints more quickly, may have an enhanced ability to effect portfolio transactions on favorable terms and may have greater investment flexibility. Each Board also considered the potential benefits and economies of scale to Columbia Management resulting from the Reorganizations and whether those benefits were shared with Fund shareholders. Each Board also considered Columbia Management’s belief that each Buying Fund would be better positioned to experience growth in assets from investor inflows than each Selling Fund overseen by such Board.
35
Board Recommendation and Required Vote
The Board of each Selling Fund recommends that shareholders of the Selling Fund approve the proposed Agreement. For each Selling Fund, the Agreement must be approved by the affirmative vote of a majority of the outstanding voting securities of the Selling Fund, as defined in the 1940 Act. A vote of a majority of the outstanding voting securities of the Selling Fund is defined in the 1940 Act as the affirmative vote of the lesser of (a) 67% or more of the shares of the Selling Fund that are present or represented by proxy at the Meeting, if the holders of more than 50% of the outstanding shares of the Selling Fund are present or represented by proxy at the Meeting; or (b) more than 50% of the outstanding shares of the Selling Fund.
If the Agreement is not approved for a Selling Fund, the applicable Board will consider what further action should be taken with respect to the Selling Fund. The approval of the Reorganization of one Selling Fund is not conditioned upon the approval of the Reorganization of any other Selling Fund.
If shareholders approve the Reorganization of a Selling Fund, it is anticipated that the Reorganization would occur before the end of the second quarter of 2011.
36
SECTION B- PROXY VOTING AND SHAREHOLDER MEETING INFORMATION
Voting. Shareholders of record of each Selling Fund on [[December 17]], 2010 (the “Record Date”) are entitled to vote at the Meeting. With respect to each Reorganization, shares of each of Columbia World Equity Fund and Threadneedle Global Equity Income Fund are entitled to one vote for each dollar of net asset value, or a proportional fractional vote for each fractional dollar, represented by those shares on the Record Date, and shares of Columbia Global Value Fund are entitled to one vote per share or a proportionate fractional vote for each fractional share. All share classes of a Selling Fund will vote together as one class on the Selling Fund’s proposed Reorganization.
Quorum and Methods of Tabulation. A quorum is required for shareholders of a Selling Fund to take action at the Meeting. For Threadneedle Global Equity Income Fund, ten percent (10%) of the shares outstanding and entitled to vote, present at the Meeting in person or by proxy, constitutes a quorum. For Columbia Global Value Fund, thirty-three and one-third percent (33 1/3%) of the shares outstanding and entitled to vote, present at the Meeting in person or by proxy, constitutes a quorum. For Columbia World Equity Fund, thirty percent (30%) of the shares outstanding and entitled to vote, present at the Meeting in person or by proxy, constitutes a quorum.
All shares represented at the Meeting in person or by proxy will be counted for purposes of establishing a quorum. Broker non-votes will be counted for purposes of establishing a quorum but not toward the approval of any proposal. (Broker non-votes are shares for which the underlying owner has not voted and the broker holding the shares does not have authority to vote.) With respect to each Reorganization, abstentions and broker non-votes will have the effect of votes against the proposal. In certain circumstances in which a Fund has received sufficient votes to approve a Reorganization, the Fund may request that brokers and nominees, in their discretion, withhold submission of broker non-votes in order to avoid the need for solicitation of additional votes in favor of the proposal. A Fund may also request that selected brokers and nominees, in their discretion, submit broker non-votes, if doing so is necessary to obtain a quorum.
If your shares are held in an IRA account with Ameriprise Trust Company as custodian (the “IRA Custodian”), you have the right to instruct the IRA Custodian how to vote those shares. For each applicable Selling Fund, the IRA Custodian will vote any shares for which it has not received voting instructions in proportionately the same manner as other shareholders of that Selling Fund have voted.
Proxy Solicitation. If you properly authorize your proxy by internet or telephone, or by executing and returning the enclosed proxy card by mail, and your proxy is not subsequently revoked, your vote will be cast at the Meeting and at any postponement or adjournment thereof. If you give instructions, your vote will be cast in accordance with your instructions. If you return your signed proxy card without instructions, your vote will be cast in favor of the Reorganization of your Selling Fund.
Proxy Statement Delivery. “Householding” is the term used to describe the practice of delivering one copy of a document to a household of shareholders instead of delivering one copy of a document to each shareholder in the household. Certain shareholders of the Selling Funds who share a common address and who have not opted out of the householding process may receive a single copy of the combined proxy statement/prospectus along with the proxy cards. If you received more than one copy of the combined proxy statement/prospectus, you may elect to household in the future if permitted by your financial intermediary. Contact the financial intermediary through which you purchased your shares to determine whether householding is an option for your account. If you received a single copy of the combined proxy statement/prospectus, you may opt out of householding in the future by contacting your financial intermediary.
An additional copy of this combined proxy statement/prospectus may be obtained by writing to [—] at [—] or by calling the Selling Funds’ proxy solicitor, [—], toll free, at [—].
37
Revoking Your Proxy. If you execute, date and submit a proxy card with respect to your Selling Fund, you may revoke your proxy prior to the meeting by providing written notice to the Funds’ proxy solicitor at [•], or change your vote by submitting a subsequently executed and dated proxy card, by authorizing your proxy by internet or telephone on a later date or by attending the Meeting and casting your vote in person. If you authorize your proxy by internet or telephone, you may change your instructions prior to the meeting by authorizing a subsequent proxy by internet or telephone or by completing, signing and returning a proxy card dated as of a date that is later than your last internet or telephone proxy authorization or by attending the Meeting and casting your vote in person. Merely attending the Meeting without voting will not revoke your prior proxy.
Simultaneous Meetings. The meeting for each Selling Fund will be held simultaneously with the meeting for each other Selling Fund, with each proposal being voted on separately by the shareholders of the relevant Selling Fund. If any shareholder objects to the holding of simultaneous meetings, the shareholder may move for an adjournment of his or her Selling Fund’s meeting to a time after the Meeting so that a meeting for that Selling Fund may be held separately. If a shareholder makes this motion, the persons named as proxies will take into consideration the reasons for the objection in deciding whether to vote in favor of the adjournment, and may vote for or against the adjournment in their discretion.
Solicitation of Proxies. The Board of each Selling Fund is asking for your vote and for you to vote as promptly as possible. The expenses of the solicitation will be allocated to each Fund subject to the limitations described in Exhibit A. Supplementary solicitations may be made by internet, telephone or personal contact. [—] has been engaged to assist in the solicitation of proxies, at the estimated cost set forth below, plus expenses.
| | | | |
Fund | | Estimated Cost | |
Columbia Global Value Fund | | $ | [— | ] |
Columbia World Equity Fund | | $ | [— | ] |
Threadneedle Global Equity Income Fund | | $ | [— | ] |
Shareholder Proposals. The Selling Funds do not hold annual meetings of shareholders. Shareholders who wish to make a proposal not involving the nomination of a person for election as a director or trustee at a Selling Fund’s next special meeting that may be included in the Selling Fund’s proxy materials must notify the relevant Selling Fund a reasonable amount of time before the Selling Fund begins to print and mail its proxy materials. The fact that a Selling Fund receives such a shareholder proposal in a timely manner does not ensure inclusion of the proposal in the proxy materials, because there are other requirements in the proxy rules relating to such inclusion. [[In connection with an annual meeting (or special meeting in lieu of an annual meeting) at which directors or trustees are to be elected, a shareholder may nominate a person for election as director or trustee if the shareholder provides notice to the relevant Fund on Schedule 14N within the timeframe specified by such Fund in an 8-K filing in advance of such meeting and satisfies certain eligibility and other requirements set forth in Exchange Act Rule 14a-11.]]
Dissenters’ Right of Appraisal.
Shareholders of Threadneedle Global Equity Income Fund may be entitled to assert appraisal rights under Sections 302A.471 and 302A.473 of the Minnesota Business Corporation Act in connection with their Selling Fund’s Reorganization and to obtain payment of the “fair value” of their Selling Fund shares, provided that they comply with the requirements of Minnesota law. A copy of the relevant provisions of the Minnesota Business Corporation Act is attached as Exhibit B hereto.
Shareholders of Columbia Global Value Fund and Columbia World Equity Fund have no appraisal or dissenters’ rights.
Notwithstanding Minnesota law, the SEC has taken the position that the use of state appraisal procedures by a mutual fund, such as the Selling Funds, would be a violation of Rule 22c-1, the forward-pricing rule, under the 1940 Act. This rule states that no mutual fund may redeem its shares other than at the net asset value next computed after receipt of a request for redemption. It is the SEC’s position that Rule 22c-1 supersedes appraisal provisions in state statutes.
In the interest of ensuring equal valuation for all Selling Fund shareholders, dissenters’ rights will be determined in accordance with the SEC’s interpretation. As a result, if any shareholder elects to exercise dissenters’ rights under Minnesota law, the relevant Selling Fund intends to submit the question to a court of competent jurisdiction. In that event, a dissenting shareholder would not receive any payment until the end of the court proceeding.
38
Other Business. The Board of each Selling Fund does not know of any matters to be presented at the Meeting other than the Reorganizations. If other business should properly come before the Meeting, the persons named as proxies will vote thereon in their discretion.
Adjournment. If the quorum required for the Meeting has not been met for any Selling Fund, the persons named as proxies may propose adjournment of the Meeting and vote all shares that they are entitled to vote in favor of such adjournment. If the quorum required for the Meeting has been met, but sufficient votes in favor of one or more proposals are not received by the time scheduled for the Meeting, then the persons named as proxies may move for one or more adjournments of the Meeting as to one or more proposals to allow further solicitation of shareholders. The procedures for adjournment of the Meeting for each Selling Fund are as follows:
| | • | | For Columbia World Equity Fund, the Meeting may be adjourned by a majority of the votes properly cast upon the question, whether or not a quorum is present, and the Meeting may be held as adjourned within a reasonable time after the date set for the original Meeting without further notice. |
| | • | | For Columbia Global Value Fund, the Meeting may be adjourned, whether or not a quorum is present, by the vote of a majority of the shares represented at the Meeting, either in person or by proxy. If the Meeting is adjourned, notice does not need to be given of the adjourned Meeting date unless a new record date for the adjourned Meeting is set or unless the adjourned Meeting is to take place more than sixty (60) days from the date set for the original Meeting, in which case the Board would be required to set a new record date. |
| | • | | For Threadneedle Global Equity Income Fund, if a quorum is not present, the Meeting may be adjourned without notice other than notice at the Meeting, and may otherwise be adjourned by the affirmative vote of a majority of the shares of each series thereof (voting together as a single class) voted at the Meeting. |
The persons named as proxies will vote in favor of adjournment with respect to a proposal those shares they are entitled to vote in favor of such proposal. They will vote against any such adjournment those shares they are entitled to vote against such proposal. The costs of any additional solicitation and of any adjourned Meeting will be borne in the same manner as the other expenses of the Reorganizations. Any proposal for which sufficient favorable votes have been received may be acted upon and considered final regardless of whether the Meeting is adjourned to permit additional solicitation with respect to any other proposal.
39
SECTION C — CAPITALIZATION, OWNERSHIP OF FUND SHARES AND FINANCIAL HIGHLIGHTS
This section contains the following information about the Buying Fund and the Selling Funds (all information is shown for the most recently ended fiscal year unless otherwise noted):
| | |
Table | | Content |
C-1 | | Current and pro forma capitalization of each Selling Fund and the Buying Fund |
C-2 | | Current and pro forma ownership of shares of each Selling Fund and the Buying Fund |
C-3 | | Financial highlights of the Buying Fund |
The Funds’ Investment Manager and Distributor. Columbia Management Investment Advisers, LLC, 100 Federal Street, Boston, MA 02110, is the investment manager for each Fund. Columbia Management Investment Distributors, Inc., One Financial Center, Boston, MA 02111 is the distributor for each Fund.
Capitalization of Selling Funds and Buying Funds
The following table shows the capitalization of each Fund as of April 30, 2010 and on a pro forma basis, assuming the proposed Reorganization had taken place as of that date. The pro forma combined net assets are determined by adding the net assets of the Selling Funds and the net assets of the Buying Fund. The pro forma combined shares outstanding are determined by dividing the net assets of the Selling Funds by the net asset value per share of the Buying Fund and adding the actual shares outstanding of the Buying Fund.
Table C-1. Current and Pro Forma Capitalization of each Selling Fund and each Buying Fund
| | | | | | | | |
Columbia Global Value Fund (Selling Fund) | | |
Class A | | $ | 16,003,315 | | $ | 6.18 | | 2,588,962 |
Class B | | $ | 5,909,660 | | $ | 5.93 | | 996,294 |
Class C | | $ | 19,221,053 | | $ | 5.93 | | 3,240,041 |
Class Z | | $ | 11,726,050 | | $ | 6.24 | | 1,879,841 |
Total | | $ | 52,860,078 | | | | | 8,705,138 |
| |
Columbia World Equity Fund (Selling Fund) | | |
Class A | | $ | 53,015,027 | | $ | 11.27 | | 4,704,518 |
Class B | | $ | 899,635 | | $ | 10.68 | | 84,225 |
Class C | | $ | 899,620 | | $ | 10.67 | | 84,334 |
Total | | $ | 54,814,282 | | | | | 4,873,077 |
| |
Threadneedle Global Equity Income Fund (Selling Fund) | | |
Class A | | $ | 23,906,604 | | $ | 8.91 | | 2,682,621 |
Class B | | $ | 2,278,967 | | $ | 8.89 | | 256,312 |
Class C | | $ | 593,685 | | $ | 8.89 | | 66,809 |
Class I | | $ | 4,400,481 | | $ | 8.93 | | 493,000 |
Class R* | | $ | 9,195 | | $ | 8.92 | | 1,031 |
Class R4 | | $ | 11,034 | | $ | 8.92 | | 1,237 |
Total | | $ | 31,199,966 | | | | | 3,501,010 |
| |
Columbia Global Equity Fund (Buying Fund)(Current) | | |
Class A | | $ | 393,491,281 | | $ | 6.71 | | 58,684,062 |
Class B | | $ | 32,869,910 | | $ | 6.31 | | 5,212,537 |
Class C | | $ | 10,650,108 | | $ | 6.23 | | 1,708,282 |
Class I | | $ | 30,130,161 | | $ | 6.74 | | 4,470,917 |
Class R* | | $ | 37,219 | | $ | 6.77 | | 5,496 |
Class R4 | | $ | 6,977,037 | | $ | 6.76 | | 1,032,535 |
40
| | | | | | | | |
Class R5 | | $ | 18,357 | | $ | 6.74 | | 2,722 |
Class W | | $ | 4,299 | | $ | 6.73 | | 639 |
Total | | $ | 474,178,372 | | | | | 71,117,190 |
| |
Columbia Global Equity Fund (Pro Forma Combined)** | | |
Class A | | $ | 486,364,512 | | $ | 6.71 | | 72,525,081 |
Class B | | $ | 41,951,551 | | $ | 6.31 | | 6,651,783 |
Class C | | $ | 31,349,186 | | $ | 6.23 | | 5,030,766 |
Class I | | $ | 34,527,111 | | $ | 6.74 | | 5,123,283 |
Class R | | $ | 46,407 | | $ | 6.77 | | 6,853 |
Class R4 | | $ | 6,988,062 | | $ | 6.76 | | 1,034,166 |
Class R5 | | $ | 18,357 | | $ | 6.74 | | 2,722 |
Class W | | $ | 4,299 | | $ | 6.73 | | 639 |
Class Z | | $ | 11,717,231 | | $ | 6.71 | | 1,746,234 |
Total | | $ | 612,966,716 | | | | | 92,121,527 |
| * | Class R shares of Threadneedle Global Equity Income Fund and Columbia Global Equity Fund were formerly named Class R2 shares. |
| ** | Pro forma figures reflect the effect of estimated Reorganization costs. |
Ownership of Selling Fund and Buying Fund Shares
The following table provides information on each person who may be deemed to be a “control person” (as that term is defined in the 1940 Act) of a Fund as of [[December 17]], 2010 because it owns, directly or indirectly, of record more than 25% of the outstanding shares of the Fund, by virtue of its fiduciary roles with respect to its clients or otherwise. A control person may be able to facilitate shareholder approval of proposals it favors and to impede shareholder approval of proposals it opposes. In this regard, if a control person owns a sufficient number of a Fund’s outstanding shares, then, for certain shareholder proposals, such control person may be able to approve, or to prevent approval, of such proposals without regard to votes by other Fund shareholders.
[Table to be inserted]
The following table provides information on shareholders who owned of record or, to the knowledge of the Fund, beneficially, more than 5% of any class of a Fund’s outstanding shares as of [[December 17]], 2010. [[As of [[December 17]], 2010, the officers and directors/trustees of each Fund, as a group, owned less than 1% of the outstanding shares of each class of such Fund.]]
Table C-2. Current and Pro Forma Ownership of Fund Shares
| | | | | | | | |
Fund | | >5%
owners | | | Percent of
shares held | | | Percent of
shares held
following
Reorganization |
| |
Columbia Global Value Fund (Selling Fund) | | | |
Class A | | [— | ] | | [—] | % | | N/A |
Class B | | [— | ] | | [—] | % | | N/A |
Class C | | [— | ] | | [—] | % | | N/A |
Class Z | | [— | ] | | [—] | % | | N/A |
| |
Columbia World Equity Fund (Selling Fund) | | | |
Class A | | [— | ] | | [—] | % | | N/A |
Class B | | [— | ] | | [—] | % | | N/A |
Class C | | [— | ] | | [—] | % | | N/A |
| |
Threadneedle Global Equity Income Fund (Selling Fund) | | | |
Class A | | [— | ] | | [—] | % | | N/A |
41
| | | | | | | | | |
Fund | | >5%
owners | | | Percent of
shares held | | | Percent of
shares held
following
Reorganization | |
Class B | | [— | ] | | [—] | % | | N/A | |
Class C | | [— | ] | | [—] | % | | N/A | |
Class I | | [— | ] | | [—] | % | | N/A | |
Class R* | | [— | ] | | [—] | % | | N/A | |
Class R4 | | [— | ] | | [—] | % | | N/A | |
| |
Columbia Global Equity Fund (Buying Fund) (Current and Pro Forma) | | | | |
Class A | | [— | ] | | [—] | % | | [—] | % |
Class B | | [— | ] | | [—] | % | | [—] | % |
Class C | | [— | ] | | [—] | % | | [—] | % |
Class I | | [— | ] | | [—] | % | | [—] | % |
Class R* | | [— | ] | | [—] | % | | [—] | % |
Class R4 | | [— | ] | | [—] | % | | [—] | % |
Class R5 | | [— | ] | | [—] | % | | [—] | % |
Class W | | [— | ] | | [—] | % | | [—] | % |
Class Z | | [— | ] | | [—] | % | | [—] | % |
| (f) | Class R shares of Threadneedle Global Equity Income Fund and Columbia Global Equity Fund were formerly named Class R2 shares. |
42
Financial Highlights
The financial highlights tables below are designed to help you understand how the Buying Fund has performed for the past five full fiscal years or, if shorter, the Buying Fund’s period of operations. Certain information reflects financial results for a single Buying Fund share. The total return line indicates how much an investment in the Buying Fund would have earned each period assuming any dividends and distributions had been reinvested. The information shown below for Columbia Global Equity Fund for fiscal years ended on or after October 31, 2007 has been audited by Ernst & Young LLP, an independent registered public accounting firm, whose report, along with the Fund’s financial statements, is included in the Fund’s annual report to shareholders. The information shown for fiscal years ending on or before October 31, 2006 was audited by a different auditor, whose report reflected an unqualified audit opinion. The information shown for the six-month period ended April 30, 2010 is unaudited. The independent registered public accounting firm’s report and the Buying Fund’s financial statements are also incorporated by reference into the Merger SAI.
Table C-3. Financial Highlights of Buying Funds
Financial Highlights - Columbia Global Equity Fund
Selected data for a share outstanding throughout each period is as follows:
| | | | | | | | | | | | | | | | | | | | | | | | |
Columbia Global Equity Fund Class A Per share data | | Six months ended
April 30, 2010
(Unaudited) | | | Year ended Oct. 31, | |
| | | 2009 | | | 2008 | | | 2007 | | | 2006 | | | 2005 | |
Net asset value, beginning of period | | $ | 6.13 | | | $ | 5.21 | | | $ | 9.61 | | | $ | 7.52 | | | $ | 6.23 | | | $ | 5.16 | |
| | | | | | | | | | | | | | | | | | | | | | | | |
Income from investment operations: | | | | | | | | | | | | | | | | | | | | | | | | |
Net investment income (loss) | | | .00 | (a) | | | .05 | | | | .05 | | | | .02 | | | | .01 | | | | .02 | |
Net gains (losses) (both realized and unrealized) | | | .59 | | | | .95 | | | | (4.41 | ) | | | 2.13 | | | | 1.30 | | | | 1.08 | |
| | | | | | | | | | | | | | | | | | | | | | | | |
Total from investment operations | | | .59 | | | | 1.00 | | | | (4.36 | ) | | | 2.15 | | | | 1.31 | | | | 1.10 | |
| | | | | | | | | | | | | | | | | | | | | | | | |
Less distributions: | | | | | | | | | | | | | | | | | | | | | | | | |
Dividends from net investment income | | | (.02 | ) | | | (.08 | ) | | | (.04 | ) | | | (.06 | ) | | | (.02 | ) | | | (.03 | ) |
| | | | | | | | | | | | | | | | | | | | | | | | |
Proceeds from regulatory settlements | | | .01 | | | | .00 | (a) | | | — | | | | — | | | | — | | | | — | |
| | | | | | | | | | | | | | | | | | | | | | | | |
Net asset value, end of period | | $ | 6.71 | | | $ | 6.13 | | | $ | 5.21 | | | $ | 9.61 | | | $ | 7.52 | | | $ | 6.23 | |
| | | | | | | | | | | | | | | | | | | | | | | | |
Total return | | | 9.85 | %(b) | | | 19.39 | %(c) | | | (45.55 | %) | | | 28.82 | % | | | 21.01 | % | | | 21.48 | % |
Ratios to average net assets(d) | | | | | | | | | | | | | | | | | | | | | | | | |
Total expenses | | | 1.43 | %(e) | | | 1.44 | % | | | 1.46 | % | | | 1.39 | % | | | 1.51 | % | | | 1.57 | % |
| | | | | | | | | | | | | | | | | | | | | | | | |
Net investment income (loss) | | | .00 | %(a)(e) | | | .92 | % | | | .65 | % | | | .28 | % | | | .23 | % | | | .33 | % |
| | | | | | | | | | | | | | | | | | | | | | | | |
Supplemental data | | | | | | | | | | | | | | | | | | | | | | | | |
Net assets, end of period (in millions) | | $ | 393 | | | $ | 395 | | | $ | 380 | | | $ | 737 | | | $ | 608 | | | $ | 446 | |
| | | | | | | | | | | | | | | | | | | | | | | | |
Portfolio turnover rate | | | 32 | % | | | 81 | % | | | 97 | % | | | 100 | % | | | 112 | % | | | 93 | % |
| | | | | | | | | | | | | | | | | | | | | | | | |
See accompanying Notes to Financial Highlights
43
| | | | | | | | | | | | | | | | | | | | | | | | |
Columbia Global Equity Fund Class B Per share data | | Six months ended
April 30, 2010
(Unaudited) | | | Year ended Oct. 31, | |
| | |
| | | 2009 | | | 2008 | | | 2007 | | | 2006 | | | 2005 | |
Net asset value, beginning of period | | $ | 5.77 | | | $ | 4.87 | | | $ | 9.02 | | | $ | 7.06 | | | $ | 5.88 | | | $ | 4.87 | |
| | | | | | | | | | | | | | | | | | | | | | | | |
Income from investment operations: | | | | | | | | | | | | | | | | | | | | | | | | |
Net investment income (loss) | | | (.02 | ) | | | .01 | | | | (.01 | ) | | | (.04 | ) | | | (.01 | ) | | | (.02 | ) |
Net gains (losses) (both realized and unrealized) | | | .56 | | | | .89 | | | | (4.14 | ) | | | 2.00 | | | | 1.19 | | | | 1.03 | |
| | | | | | | | | | | | | | | | | | | | | | | | |
Total from investment operations | | | .54 | | | | .90 | | | | (4.15 | ) | | | 1.96 | | | | 1.18 | | | | 1.01 | |
| | | | | | | | | | | | | | | | | | | | | | | | |
Less distributions: | | | | | | | | | | | | | | | | | | | | | | | | |
Dividends from net investment income | | | (.01 | ) | | | — | | | | — | | | | .00 | (a) | | | — | | | | — | |
| | | | | | | | | | | | | | | | | | | | | | | | |
Proceeds from regulatory settlements | | | .01 | | | | .00 | (a) | | | — | | | | — | | | | — | | | | — | |
| | | | | | | | | | | | | | | | | | | | | | | | |
Net asset value, end of period | | $ | 6.31 | | | $ | 5.77 | | | $ | 4.87 | | | $ | 9.02 | | | $ | 7.06 | | | $ | 5.88 | |
| | | | | | | | | | | | | | | | | | | | | | | | |
Total return | | | 9.48 | %(b) | | | 18.48 | %(c) | | | (46.01 | %) | | | 27.81 | % | | | 20.07 | % | | | 20.74 | % |
| | | | | | | | | | | | | | | | | | | | | | | | |
Ratios to average net assets(d) | | | | | | | | | | | | | | | | | | | | | | | | |
Total expenses | | | 2.20 | %(e) | | | 2.21 | % | | | 2.23 | % | | | 2.15 | % | | | 2.28 | % | | | 2.34 | % |
| | | | | | | | | | | | | | | | | | | | | | | | |
Net investment income (loss) | | | (.77 | %)(e) | | | .22 | % | | | (.11 | %) | | | (.45 | %) | | | (.54 | %) | | | (.41 | %) |
| | | | | | | | | | | | | | | | | | | | | | | | |
Supplemental data | | | | | | | | | | | | | | | | | | | | | | | | |
Net assets, end of period (in millions) | | $ | 33 | | | $ | 33 | | | $ | 42 | | | $ | 104 | | | $ | 110 | | | $ | 102 | |
| | | | | | | | | | | | | | | | | | | | | | | | |
Portfolio turnover rate | | | 32 | % | | | 81 | % | | | 97 | % | | | 100 | % | | | 112 | % | | | 93 | % |
| | | | | | | | | | | | | | | | | | | | | | | | |
See accompanying Notes to Financial Highlights
44
| | | | | | | | | | | | | | | | | | | | | | | | |
Columbia Global Equity Fund Class C Per share data | | Six months ended
April 30, 2010
(Unaudited) | | | Year ended Oct. 31, | |
| | |
| | | 2009 | | | 2008 | | | 2007 | | | 2006 | | | 2005 | |
Net asset value, beginning of period | | $ | 5.71 | | | $ | 4.83 | | | $ | 8.93 | | | $ | 7.02 | | | $ | 5.85 | | | $ | 4.85 | |
| | | | | | | | | | | | | | | | | | | | | | | | |
Income from investment operations: | | | | | | | | | | | | | | | | | | | | | | | | |
Net investment income (loss) | | | (.02 | ) | | | .00 | (a) | | | (.01 | ) | | | (.04 | ) | | | (.01 | ) | | | (.02 | ) |
Net gains (losses) (both realized and unrealized) | | | .54 | | | | .89 | | | | (4.09 | ) | | | 1.98 | | | | 1.18 | | | | 1.03 | |
| | | | | | | | | | | | | | | | | | | | | | | | |
Total from investment operations | | | .52 | | | | .89 | | | | (4.10 | ) | | | 1.94 | | | | 1.17 | | | | 1.01 | |
| | | | | | | | | | | | | | | | | | | | | | | | |
Less distributions: | | | | | | | | | | | | | | | | | | | | | | | | |
Dividends from net investment income | | | (.01 | ) | | | (.01 | ) | | | — | | | | (.03 | ) | | | — | | | | (.01 | ) |
| | | | | | | | | | | | | | | | | | | | | | | | |
Proceeds from regulatory settlements | | | .01 | | | | .00 | (a) | | | — | | | | — | | | | — | | | | — | |
| | | | | | | | | | | | | | | | | | | | | | | | |
Net asset value, end of period | | $ | 6.23 | | | $ | 5.71 | | | $ | 4.83 | | | $ | 8.93 | | | $ | 7.02 | | | $ | 5.85 | |
| | | | | | | | | | | | | | | | | | | | | | | | |
Total return | | | 9.25 | %(b) | | | 18.39 | %(c) | | | (45.91 | %) | | | 27.76 | % | | | 20.03 | % | | | 20.89 | % |
| | | | | | | | | | | | | | | | | | | | | | | | |
Ratios to average net assets(d) | | | | | | | | | | | | | | | | | | | | | | | | |
Total expenses | | | 2.19 | %(e) | | | 2.20 | % | | | 2.22 | % | | | 2.15 | % | | | 2.27 | % | | | 2.33 | % |
| | | | | | | | | | | | | | | | | | | | | | | | |
Net investment income (loss) | | | (.76 | %)(e) | | | (.08 | %) | | | (.09 | %) | | | (.48 | %) | | | (.50 | %) | | | (.53 | %) |
| | | | | | | | | | | | | | | | | | | | | | | | |
Supplemental data | | | | | | | | | | | | | | | | | | | | | | | | |
Net assets, end of period (in millions) | | $ | 11 | | | $ | 11 | | | $ | 5 | | | $ | 8 | | | $ | 6 | | | $ | 2 | |
| | | | | | | | | | | | | | | | | | | | | | | | |
Portfolio turnover rate | | | 32 | % | | | 81 | % | | | 97 | % | | | 100 | % | | | 112 | % | | | 93 | % |
| | | | | | | | | | | | | | | | | | | | | | | | |
See accompanying Notes to Financial Highlights
45
| | | | | | | | | | | | |
Columbia Global Equity Fund Class I Per share data | | Six months ended
April 30, 2010
(Unaudited) | | | Year ended Oct. 31, | |
| | |
| | | 2009 | | | 2008(f) | |
Net asset value, beginning of period | | $ | 6.16 | | | $ | 5.25 | | | $ | 7.47 | |
| | | | | | | | | | | | |
Income from investment operations: | | | | | | | | | | | | |
Net investment income (loss) | | | .02 | | | | .09 | | | | .03 | |
Net gains (losses) (both realized and unrealized) | | | .59 | | | | .95 | | | | (2.25 | ) |
| | | | | | | | | | | | |
Total from investment operations | | | .61 | | | | 1.04 | | | | (2.22 | ) |
| | | | | | | | | | | | |
Less distributions: | | | | | | | | | | | | |
Dividends from net investment income | | | (.04 | ) | | | (.13 | ) | | | — | |
| | | | | | | | | | | | |
Proceeds from regulatory settlements | | | .01 | | | | .00 | (a) | | | — | |
| | | | | | | | | | | | |
Net asset value, end of period | | $ | 6.74 | | | $ | 6.16 | | | $ | 5.25 | |
| | | | | | | | | | | | |
Total return | | | 10.02 | %(b) | | | 20.21 | %(c) | | | (29.72 | %) |
| | | | | | | | | | | | |
Ratios to average net assets(d) | | | | | | | | | | | | |
Total expenses | | | .90 | %(e) | | | .84 | % | | | .85 | %(e) |
| | | | | | | | | | | | |
Net investment income (loss) | | | .52 | %(e) | | | 1.56 | % | | | 1.55 | %(e) |
| | | | | | | | | | | | |
Supplemental data | | | | | | | | | | | | |
Net assets, end of period (in millions) | | $ | 30 | | | $ | 33 | | | $ | — | |
| | | | | | | | | | | | |
Portfolio turnover rate | | | 32 | % | | | 81 | % | | | 97 | % |
| | | | | | | | | | | | |
See accompanying Notes to Financial Highlights
46
| | | | | | | | | | | | | | | | |
Columbia Global Equity Fund Class R Per share data | | Six months ended
April 30, 2010
(Unaudited) | | | Year ended Oct. 31, | |
| | |
| | | 2009 | | | 2008 | | | 2007(g) | |
Net asset value, beginning of period | | $ | 6.14 | | | $ | 5.23 | | | $ | 9.62 | | | $ | 7.89 | |
| | | | | | | | | | | | | | | | |
Income from investment operations: | | | | | | | | | | | | | | | | |
Net investment income (loss) | | | (.01 | ) | | | (.01 | ) | | | .05 | | | | (.01 | ) |
Net gains (losses) (both realized and unrealized) | | | .63 | | | | 1.00 | | | | (4.42 | ) | | | 1.84 | |
| | | | | | | | | | | | | | | | |
Total from investment operations | | | .62 | | | | .99 | | | | (4.37 | ) | | | 1.83 | |
| | | | | | | | | | | | | | | | |
Less distributions: | | | | | | | | | | | | | | | | |
Dividends from net investment income | | | — | | | | (.08 | ) | | | (.02 | ) | | | (.10 | ) |
Proceeds from regulatory settlements | | | .01 | | | | .00 | (a) | | | — | | | | — | |
| | | | | | | | | | | | | | | | |
Net asset value, end of period | | $ | 6.77 | | | $ | 6.14 | | | $ | 5.23 | | | $ | 9.62 | |
| | | | | | | | | | | | | | | | |
Total return | | | 10.26 | %(b) | | | 19.13 | %(c) | | | (45.48 | %) | | | 23.41 | % |
| | | | | | | | | | | | | | | | |
Ratios to average net assets(d) | | | | | | | | | | | | | | | | |
Gross expenses prior to expense waiver/reimbursement | | | 1.69 | %(e) | | | 1.69 | % | | | 1.79 | % | | | 1.74 | %(e) |
| | | | | | | | | | | | | | | | |
Net expenses after expense waiver/reimbursement(h) | | | 1.69 | %(e) | | | 1.69 | % | | | 1.54 | % | | | 1.74 | %(e) |
| | | | | | | | | | | | | | | | |
Net investment income (loss) | | | (.24 | %)(e) | | | (.16 | %) | | | .57 | % | | | (.13 | %)(e) |
| | | | | | | | | | | | | | | | |
Supplemental data | | | | | | | | | | | | | | | | |
Net assets, end of period (in millions) | | $ | — | | | $ | — | | | $ | — | | | $ | — | |
| | | | | | | | | | | | | | | | |
Portfolio turnover rate | | | 32 | % | | | 81 | % | | | 97 | % | | | 100 | % |
| | | | | | | | | | | | | | | | |
See accompanying Notes to Financial Highlights
47
| | | | | | | | | | | | | | | | | | | | | | | | |
Columbia Global Equity Fund Class R4 Per share data | | Six months ended
April 30, 2010
(Unaudited) | | | Year ended Oct. 31, | |
| | |
| | | 2009 | | | 2008 | | | 2007 | | | 2006 | | | 2005 | |
Net asset value, beginning of period | | $ | 6.18 | | | $ | 5.26 | | | $ | 9.70 | | | $ | 7.60 | | | $ | 6.29 | | | $ | 5.20 | |
| | | | | | | | | | | | | | | | | | | | | | | | |
Income from investment operations: | | | | | | | | | | | | | | | | | | | | | | | | |
Net investment income (loss) | | | .01 | | | | .06 | | | | .07 | | | | .04 | | | | .02 | | | | .04 | |
Net gains (losses) (both realized and unrealized) | | | .59 | | | | .96 | | | | (4.46 | ) | | | 2.13 | | | | 1.31 | | | | 1.09 | |
| | | | | | | | | | | | | | | | | | | | | | | | |
Total from investment operations | | | .60 | | | | 1.02 | | | | (4.39 | ) | | | 2.17 | | | | 1.33 | | | | 1.13 | |
| | | | | | | | | | | | | | | | | | | | | | | | |
Less distributions: | | | | | | | | | | | | | | | | | | | | | | | | |
Dividends from net investment income | | | (.03 | ) | | | (.10 | ) | | | (.05 | ) | | | (.07 | ) | | | (.02 | ) | | | (.04 | ) |
| | | | | | | | | | | | | | | | | | | | | | | | |
Proceeds from regulatory settlements | | | .01 | | | | .00 | (a) | | | — | | | | — | | | | — | | | | — | |
| | | | | | | | | | | | | | | | | | | | | | | | |
Net asset value, end of period | | $ | 6.76 | | | $ | 6.18 | | | $ | 5.26 | | | $ | 9.70 | | | $ | 7.60 | | | $ | 6.29 | |
| | | | | | | | | | | | | | | | | | | | | | | | |
Total return | | | 9.87 | %(b) | | | 19.72 | %(c) | | | (45.47 | %) | | | 28.85 | % | | | 21.26 | % | | | 21.90 | % |
| | | | | | | | | | | | | | | | | | | | | | | | |
Ratios to average net assets(d) | | | | | | | | | | | | | | | | | | | | | | | | |
Gross expenses prior to expense waiver/reimbursement | | | 1.19 | %(e) | | | 1.15 | % | | | 1.29 | % | | | 1.23 | % | | | 1.32 | % | | | 1.38 | % |
| | | | | | | | | | | | | | | | | | | | | | | | |
Net expenses after expense waiver/reimbursement(h) | | | 1.19 | %(e) | | | 1.15 | % | | | 1.28 | % | | | 1.23 | % | | | 1.32 | % | | | 1.38 | % |
| | | | | | | | | | | | | | | | | | | | | | | | |
Net investment income (loss) | | | .25 | %(e) | | | 1.22 | % | | | .83 | % | | | .45 | % | | | .44 | % | | | .49 | % |
| | | | | | | | | | | | | | | | | | | | | | | | |
Supplemental data | | | | | | | | | | | | | | | | | | | | | | | | |
Net assets, end of period (in millions) | | $ | 7 | | | $ | 6 | | | $ | 5 | | | $ | 10 | | | $ | 9 | | | $ | 6 | |
| | | | | | | | | | | | | | | | | | | | | | | | |
Portfolio turnover rate | | | 32 | % | | | 81 | % | | | 97 | % | | | 100 | % | | | 112 | % | | | 93 | % |
| | | | | | | | | | | | | | | | | | | | | | | | |
See accompanying Notes to Financial Highlights
Notes to Financial Highlights
| (b) | During the six months ended April 30, 2010, the Fund received proceeds from a regulatory settlement. Had the Fund not received these proceeds, the total return would have been lower by 0.09%. |
| (c) | During the year ended Oct. 31, 2009, the Fund received proceeds from a regulatory settlement. Had the Fund not received these proceeds, the total return would have been lower by 0.02% |
| (d) | Expense ratios include the impact of a performance incentive adjustment, if any. In addition to the fees and expenses which the Fund bears directly, the Fund indirectly bears a pro rata share of the fees and expenses of the acquired funds in which it invests. Such indirect expenses are not included in the reported expense ratios. |
| (f) | For the period from Aug. 1, 2008 (when shares became publicly available) to Oct. 31, 2008. |
| (g) | For the period from Dec. 11, 2006 (when shares became publicly available) to Oct. 31, 2007. |
| (h) | The Investment Manager and its affiliates have agreed to waive/reimburse certain fees and expenses (excluding fees and expenses of acquired funds), before giving effect to any performance incentive adjustment. |
48
Exhibit A
Costs of the Reorganizations
Each Selling Fund and the Buying Fund may bear a portion of the out-of-pocket expenses associated with its Reorganization. Out-of-pocket expenses associated with a Reorganization include, but are not limited to: (1) the expenses associated with the preparation, printing and mailing of any shareholder communications, including this proxy statement/prospectus, and any filings with the SEC and/or other governmental authorities in connection with the Reorganization; (2) the fees and expenses of any proxy solicitation firm retained in connection with the Reorganization; and (3) the legal and other fees and expenses incurred in connection with the Reorganization.
All fees paid to governmental authorities for the registration or qualification of the Buying Fund shares to be issued in the Reorganization and all transfer agency costs related to such shares will be allocated to the Buying Fund. All fees and expenses related to printing and mailing communications to Selling Fund shareholders will be allocated to the Selling Fund. All of the other out-of-pocket expenses of a Reorganization, including without limitation, accounting, legal and custodial expenses, will be allocated equally among the applicable Funds. Following this initial allocation among the Funds, Columbia Management limits the expenses actually borne by a Fund to the anticipated reduction in expenses to be incurred by that Fund over the first year following the Reorganization. Any reduction in the Reorganization expenses borne by a Fund as a result of this limitation is absorbed by Columbia Management, not by any other Fund. The estimated costs of each Reorganization expected to be borne by each Selling Fund and the Buying Fund, in the aggregate and on a per-share basis based on shares outstanding as of August 31, 2010, are set forth below:
| | | | | | |
Fund | | Costs Estimated
to be Borne |
| | Total | | Per Share |
Columbia Global Value Fund (Selling Fund) | | $ | 39,756 | | $ | 0.005 |
Columbia World Equity Fund (Selling Fund) | | $ | 21,194 | | $ | 0.005 |
Threadneedle Global Equity Income Fund (Selling Fund) | | $ | 25,032 | | $ | 0.007 |
Columbia Global Equity Fund (Buying Fund) | | $ | 0 | | $ | 0 |
Should any Reorganization fail to occur, Columbia Management will bear all costs associated with that Reorganization.
Based on the operating expense ratios shown in the Fees and Expenses section above for the Buying Fund, it is projected that, after the Reorganizations, assuming all of the Reorganizations are consummated, each class of each Selling Fund will benefit from expense savings that will offset the allocated Reorganization expenses. However, the benefit of those projected expense savings will not be realized immediately. It is projected that the aggregate expense savings for the Selling Funds will not exceed the allocated Reorganization expenses of each Selling Fund until approximately the number of months after its Reorganization set forth below.
| | |
Fund | | Number
of Months |
Columbia Global Value Fund | | 3 |
Columbia World Equity Fund | | 12 |
Threadneedle Global Equity Income Fund | | 12 |
If a shareholder redeems his or her shares prior to the indicated time, the shareholder will receive no net benefit from the projected expense savings.
A-1
Exhibit B
Minnesota Business Corporation Act Sections 302A.471 and 302A.473
If you are a shareholder of RiverSource Disciplined International Equity Fund, Threadneedle International Opportunity Fund or Threadneedle Global Equity Income Fund, Minnesota law requires that we provide you with a copy of the state law on dissenters’ rights. Notwithstanding the provisions of the law set out below, the SEC has taken the position that use of state appraisal procedures by a registered mutual fund would be a violation of Rule 22c-1, the forward pricing rule, under the 1940 Act. As a result, if any shareholder elects to exercise dissenters’ rights under Minnesota law, the applicable Selling Fund intends to submit this question to a court of competent jurisdiction. In that event, a dissenting shareholder would not receive any payment until the end of the court proceeding.
302A.471. Rights of dissenting shareholders
Subdivision 1. Actions creating rights. A shareholder of a corporation may dissent from, and obtain payment for the fair value of the shareholder’s shares in the event of, any of the following corporate actions:
| (a) | unless otherwise provided in the articles, an amendment of the articles that materially and adversely affects the rights or preferences of the shares of the dissenting shareholder in that it: |
| (1) | alters or abolishes a preferential right of the shares; |
| (2) | creates, alters, or abolishes a right in respect of the redemption of the shares, including a provision respecting a sinking fund for the redemption or repurchase of the shares; |
| (3) | alters or abolishes a preemptive right of the holder of the shares to acquire shares, securities other than shares, or rights to purchase shares or securities other than shares; |
| (4) | excludes or limits the right of a shareholder to vote on a matter, or to cumulate votes, except as the right may be excluded or limited through the authorization or issuance of securities of an existing or new class or series with similar or different voting rights; except that an amendment to the articles of an issuing public corporation that provides that section 302A.671 does not apply to a control share acquisition does not give rise to the right to obtain payment under this section; |
| (5) | eliminates the right to obtain payment under this subdivision; |
| (b) | a sale, lease, transfer, or other disposition of property and assets of the corporation that requires shareholder approval under section 302A.661, subdivision 2, but not including a disposition in dissolution described in section 302A.725, subdivision 2, or a disposition pursuant to an order of a court, or a disposition for cash on terms requiring that all or substantially all of the net proceeds of disposition be distributed to the shareholders in accordance with their respective interests within one year after the date of disposition; |
| (c) | a plan of merger, whether under this chapter or under chapter 322B, to which the corporation is a constituent organization, except as provided in subdivision 3, and except for a plan of merger adopted under section 302A.626; |
| (d) | a plan of exchange, whether under this chapter or under chapter 322B, to which the corporation is a party as the corporation whose shares will be acquired by the acquiring organization, except as provided in subdivision 3; |
| (e) | a plan of conversion adopted by the corporation; or |
| (f) | any other corporate action taken pursuant to a shareholder vote with respect to which the articles, the bylaws, or a resolution approved by the board directs that dissenting shareholders may obtain payment for their shares. |
B-1
Subdivision 2. Beneficial owners.
| (a) | A shareholder shall not assert dissenters’ rights as to less than all of the shares registered in the name of the shareholder, unless the shareholder dissents with respect to all the shares that are beneficially owned by another person but registered in the name of the shareholder and discloses the name and address of each beneficial owner on whose behalf the shareholder dissents. In that event, the rights of the dissenter shall be determined as if the shares as to which the shareholder has dissented and the other shares were registered in the names of different shareholders. |
| (b) | A beneficial owner of shares who is not the shareholder may assert dissenters’ rights with respect to shares held on behalf of the beneficial owner, and shall be treated as a dissenting shareholder under the terms of this section and section 302A.473, if the beneficial owner submits to the corporation at the time of or before the assertion of the rights a written consent of the shareholder. |
Subdivision 3. Rights not to apply.
| (a) | Unless the articles, the bylaws, or a resolution approved by the board otherwise provide, the right to obtain payment under this section does not apply to a shareholder of (1) the surviving corporation in a merger with respect to shares of the shareholder that are not entitled to be voted on the merger and are not canceled or exchanged in the merger or (2) the corporation whose shares will be acquired by the acquiring organization in a plan of exchange with respect to shares of the shareholder that are not entitled to be voted on the plan of exchange and are not exchanged in the plan of exchange. |
| (b) | If a date is fixed according to section 302A.445, subdivision 1, for the determination of shareholders entitled to receive notice of and to vote on an action described in subdivision 1, only shareholders as of the date fixed, and beneficial owners as of the date fixed who hold through shareholders, as provided in subdivision 2, may exercise dissenters’ rights. |
| (c) | Notwithstanding subdivision 1, the right to obtain payment under this section, other than in connection with a plan of merger adopted under section 302A.621, is limited in accordance with the following provisions: |
| (1) | The right to obtain payment under this section is not available for the holders of shares of any class or series of shares that is listed on the New York Stock Exchange, the American Stock Exchange, the NASDAQ Global Market, or the NASDAQ Global Select Market. |
| (2) | The applicability of clause (1) is determined as of: |
| (i) | the record date fixed to determine the shareholders entitled to receive notice of, and to vote at, the meeting of shareholders to act upon the corporate action described in subdivision 1; or |
| (ii) | the day before the effective date of corporate action described in subdivision 1 if there is no meeting of shareholders. |
| (3) | Clause (1) is not applicable, and the right to obtain payment under this section is available pursuant to subdivision 1, for the holders of any class or series of shares who are required by the terms of the corporate action described in subdivision 1 to accept for such shares anything other than shares, or cash in lieu of fractional shares, of any class or any series of shares of a domestic or foreign corporation, or any other ownership interest of any other organization, that satisfies the standards set forth in clause (1) at the time the corporate action becomes effective. |
Subdivision 4. Other rights. The shareholders of a corporation who have a right under this section to obtain payment for their shares, or who would have the right to obtain payment for their shares absent the exception set forth in paragraph (c) of subdivision 3, do not have a right at law or in equity to have a corporate action described in subdivision 1 set aside or rescinded, except when the corporate action is fraudulent with regard to the complaining shareholder or the corporation.
302A.473. Procedures for asserting dissenters’ rights
Subdivision 1. Definitions.
| (a) | For purposes of this section, the terms defined in this subdivision have the meanings given them. |
B-2
| (b) | “Corporation” means the issuer of the shares held by a dissenter before the corporate action referred to in section 302A.471, subdivision 1 or the successor by merger of that issuer. |
| (c) | “Fair value of the shares” means the value of the shares of a corporation immediately before the effective date of the corporate action referred to in section 302A.471, subdivision 1. |
| (d) | “Interest” means interest commencing five days after the effective date of the corporate action referred to in section 302A.471, subdivision 1, up to and including the date of payment, calculated at the rate provided in section 549.09 for interest on verdicts and judgments. |
Subdivision 2. Notice of action. If a corporation calls a shareholder meeting at which any action described in section 302A.471, subdivision 1 is to be voted upon, the notice of the meeting shall inform each shareholder of the right to dissent and shall include a copy of section 302A.471 and this section and a brief description of the procedure to be followed under these sections.
Subdivision 3. Notice of dissent. If the proposed action must be approved by the shareholders and the corporation holds a shareholder meeting, a shareholder who is entitled to dissent under section 302A.471 and who wishes to exercise dissenters’ rights must file with the corporation before the vote on the proposed action a written notice of intent to demand the fair value of the shares owned by the shareholder and must not vote the shares in favor of the proposed action.
Subdivision 4. Notice of procedure; deposit of shares.
| (a) | After the proposed action has been approved by the board and, if necessary, the shareholders, the corporation shall send to (i) all shareholders who have complied with subdivision 3, (ii) all shareholders who did not sign or consent to a written action that gave effect to the action creating the right to obtain payment under section 302A.471, and (iii) all shareholders entitled to dissent if no shareholder vote was required, a notice that contains: |
| (1) | the address to which a demand for payment and certificates of certificated shares must be sent in order to obtain payment and the date by which they must be received; |
| (2) | any restrictions on transfer of uncertificated shares that will apply after the demand for payment is received; |
| (3) | a form to be used to certify the date on which the shareholder, or the beneficial owner on whose behalf the shareholder dissents, acquired the shares or an interest in them and to demand payment; and |
| (4) | a copy of section 302A.471 and this section and a brief description of the procedures to be followed under these sections. |
| (b) | In order to receive the fair value of the shares, a dissenting shareholder must demand payment and deposit certificated shares or comply with any restrictions on transfer of uncertificated shares within 30 days after the notice required by paragraph (a) was given, but the dissenter retains all other rights of a shareholder until the proposed action takes effect. |
Subdivision 5. Payment; return of shares.
| (a) | After the corporate action takes effect, or after the corporation receives a valid demand for payment, whichever is later, the corporation shall remit to each dissenting shareholder who has complied with subdivisions 3 and 4 the amount the corporation estimates to be the fair value of the shares, plus interest, accompanied by: |
| (1) | the corporation’s closing balance sheet and statement of income for a fiscal year ending not more than 16 months before the effective date of the corporate action, together with the latest available interim financial statements; |
| (2) | an estimate by the corporation of the fair value of the shares and a brief description of the method used to reach the estimate; and |
| (3) | a copy of section 302A.471 and this section, and a brief description of the procedure to be followed in demanding supplemental payment. |
| (b) | The corporation may withhold the remittance described in paragraph (a) from a person who was not a shareholder on the date the action dissented from was first announced to the public or who is dissenting on behalf of a person who was not a beneficial owner |
B-3
| | on that date. If the dissenter has complied with subdivisions 3 and 4, the corporation shall forward to the dissenter the materials described in paragraph (a), a statement of the reason for withholding the remittance, and an offer to pay to the dissenter the amount listed in the materials if the dissenter agrees to accept that amount in full satisfaction. The dissenter may decline the offer and demand payment under subdivision 6. Failure to do so entitles the dissenter only to the amount offered. If the dissenter makes demand, subdivision 7 and 8 apply. |
| (c) | If the corporation fails to remit payment within 60 days of the deposit of certificates or the imposition of transfer restrictions on uncertificated shares, it shall return all deposited certificates and cancel all transfer restrictions. However, the corporation may again give notice under subdivision 4 and require deposit or restrict transfer at a later time. |
Subdivision 6. Supplemental payment; demand. If a dissenter believes that the amount remitted under subdivision 5 is less than the fair value of the shares plus interest, the dissenter may give written notice to the corporation of the dissenter’s own estimate of the fair value of the shares, plus interest, within 30 days after the corporation mails the remittance under subdivision 5, and demand payment of the difference. Otherwise, a dissenter is entitled only to the amount remitted by the corporation.
Subdivision 7. Petition; determination. If the corporation receives a demand under subdivision 6, it shall, within 60 days after receiving the demand, either pay to the dissenter the amount demanded or agreed to by the dissenter after discussion with the corporation or file in a court a petition requesting that the court determine the fair value of the shares, plus interest. The petition shall be filed in the county in which the registered office of the corporation is located, except that a surviving foreign corporation that receives a demand relating to the shares of a constituent domestic corporation shall file the petition in the county in this state in which the last registered office of the constituent corporation was located. The petition shall name as parties all dissenters who have demanded payment under subdivision 6 and who have not reached agreement with the corporation. The corporation shall, after filing the petition, serve all parties with a summons and copy of the petition under the rules of civil procedure. Nonresidents of this state may be served by registered or certified mail or by publication as provided by law. Except as otherwise provided, the rules of civil procedures apply to this proceeding. The jurisdiction of the court is plenary and exclusive. The court may appoint appraisers, with powers and authorities the court deems proper, to receive evidence on and recommend the amount of the fair value of the shares. The court shall determine whether the shareholder or shareholders in question have fully complied with the requirements of this section, and shall determine the fair value of the shares, taking into account any and all factors the court finds relevant, computed by any method or combination of methods that the court, in its discretion, sees fit to use, whether or not used by the corporation or by a dissenter. The fair value of the shares as determined by the court is binding on all shareholders, wherever located. A dissenter is entitled to judgment in cash for the amount by which the fair value of the shares as determined by the court, plus interest, exceeds the amount, if any, remitted under subdivision 5, but shall not be liable to the corporation for the amount, if any, by which the amount, if any, remitted to the dissenter under subdivision 5 exceeds the fair value of the shares as determined by the court, plus interest.
B-4
Subdivision 8. Costs; fees; expenses.
| (a) | The court shall determine the costs and expenses of a proceeding under subdivision 7, including the reasonable expenses and compensation of any appraisers appointed by the court, and shall assess those costs and expenses against the corporation, except that the court may assess part or all of those costs and expenses against a dissenter whose action in demanding payment under subdivision 6 is found to be arbitrary, vexatious, or not in good faith. |
| (b) | If the court finds that the corporation has failed to comply substantially with this section, the court may assess all fees and expenses of any experts or attorneys as the court deems equitable. These fees and expenses may also be assessed against a person who has acted arbitrarily, vexatiously, or not in good faith in bringing the proceeding, and may be awarded to a party injured by those actions. |
| (c) | The court may award, in its discretion, fees and expenses to an attorney for the dissenters out of the amount awarded to the dissenters, if any. |
B-5
Exhibit C
Additional Information Applicable to the Buying Funds
Below is information regarding the Buying Fund. All references to a Fund in this Exhibit C refer to the Buying Fund unless otherwise noted.
Fund Management and Compensation (for all Buying Funds)
Columbia Management, 100 Federal Street, Boston, MA 02110, is the investment manager to the Combined Fund Complex (including the Columbia-, RiverSource-, Seligman- and Threadneedle- branded funds), and is a wholly owned subsidiary of Ameriprise Financial. Ameriprise Financial is a financial planning and financial services company that has been offering solutions for clients’ asset accumulation, income management and protection needs for more than 110 years. In addition to managing investments for the Combined Fund Complex, Columbia Management manages investments for itself and its affiliates. For institutional clients, Columbia Management and its affiliates provide investment management and related services, such as separate account asset management and institutional trust and custody, as well as other investment products. For all of its clients, Columbia Management seeks to allocate investment opportunities in an equitable manner over time. See the Merger SAI for more information.
Subject to oversight by the Fund’s Board, Columbia Management manages the day-to-day operations of the Fund, determines what securities and other investments the Fund should buy or sell and executes the portfolio transactions. Although Columbia Management is responsible for the investment management of the Fund, Columbia Management may delegate certain of its duties to one or more investment subadvisers. Columbia Management may use the research and other capabilities of its affiliates and third parties in managing investments.
The Combined Fund Complex has received an order from the SEC that permits Columbia Management, subject to the approval of each Fund’s Board, to appoint a subadviser or change the terms of a subadvisory agreement for the Fund without first obtaining shareholder approval. The order permits the fund to add or change unaffiliated subadvisers or change the fees paid to subadvisers from time to time without the expense and delays associated with obtaining shareholder approval of the change. Columbia Management and its affiliates may have other relationships, including significant financial relationships, with current or potential subadvisers or their affiliates, which may create a conflict of interest. In making recommendations to each Fund’s Board to appoint or to change a subadviser, or to change the terms of a subadvisory agreement, Columbia Management does not consider any other relationship it or its affiliates may have with a subadviser, and Columbia Management discloses the nature of any material relationships it has with a subadviser to the Fund’s Board.
The Fund pays Columbia Management a fee for managing its assets. The fees paid by the Buying Fund for the most recent fiscal year were 0.68% percentage of the Buying Fund’s average daily net assets. The Buying Fund’s fee structure includes an adjustment in the form of a performance incentive arrangement. The adjustment is computed by comparing the Fund’s performance to the performance of an index of comparable funds published by Lipper Inc. The index against which the Fund’s performance is currently measured for purposes of the performance incentive adjustment is the Lipper Global Funds Index. In certain circumstances, the Fund’s Board may approve a change in the index without shareholder approval. The maximum adjustment (increase or decrease) is 0.12% of the Fund’s average net assets on an annual basis. The Board of Columbia Global Equity Fund has approved a revised investment management services fee arrangement that eliminates the performance incentive adjustment. This revised arrangement is subject to approval by shareholders of Columbia Global Equity Fund, which is being solicited separately. Such approval of this revised arrangement is a condition to closing the Reorganization of the respective Selling Funds into Columbia Global Equity Fund.
Under its Investment Management Services Agreement (the “IMS Agreement”), the Buying Fund also pays taxes, brokerage commissions and nonadvisory expenses. A discussion regarding the basis for the Fund’s Board approving the IMS Agreement is available in Columbia Global Equity Fund semiannual report for the period ended April 30, 2010.
The Fund may from time to time take temporary defensive investment positions that are inconsistent with the Fund’s principal investment strategies in attempting to respond to adverse market, economic, political or other conditions including, for example, investments in money market instruments or holdings of cash or cash equivalents. Investing defensively may prevent a Fund from achieving its investment objective.
C-1
Portfolio Managers
Information about the portfolio managers who are primarily responsible for overseeing the Fund’s investments is shown below. The Merger SAI provides more information about each portfolio manager’s compensation, other accounts managed by each portfolio manager and each portfolio manager’s ownership of securities in the Fund.
Columbia Global Equity Fund
Columbia Management selects, contracts with and compensates Threadneedle to manage the investment of the Fund’s assets. Columbia Management monitors the compliance of Threadneedle with the investment objective and related policies of the Fund, reviews the performance of Threadneedle, and reports periodically to the Fund’s Board. Threadneedle manages the Fund’s assets based upon its experience managing funds with investment goals and strategies substantially similar to those of the Fund.
Threadneedle
Threadneedle, located at 60 St. Mary Axe, London EC3A 8JQ, England, is an affiliate of Columbia Management, and an indirect wholly-owned subsidiary of Ameriprise Financial. The portfolio managers responsible for the day-to-day management of the Fund are:
Stephen Thornber, Portfolio Manager
| | • | | Managed the Fund since 2003. |
| | • | | Head of global oil sector. |
| | • | | Associated with Columbia Management or its predecessors since 1993. |
| | • | | Began investment career in 1987. |
| | • | | BA, Plymouth Polytechnic. |
Andrew Holiman, CFA, Deputy Portfolio Manager
| | • | | Deputy managed the Fund since 2008. |
| | • | | Associated with Columbia Management or its predecessors since 2004. |
| | • | | Began investment career in 1997 as an investment analyst and portfolio manager, Baillie Gifford & Co., 1997 to 2004. |
| | • | | BCom (Hons), University of Edinburgh; MSc, University of Stirling. |
Legal Proceedings
Ameriprise Financial and certain of its affiliates have historically been involved in a number of legal, arbitration and regulatory proceedings, including routine litigation, class actions and governmental actions, concerning matters arising in connection with the conduct of their business activities. Ameriprise Financial believes that each Fund is not currently the subject of, and that neither Ameriprise Financial or any of its affiliates is the subject of, any pending legal, arbitration or regulatory proceedings that are likely to have a material adverse effect on each Fund or the ability of Ameriprise Financial or its affiliates to perform under their contracts with each Fund. Information regarding certain pending and settled legal proceedings may be found in each Fund’s shareholder reports and in the Merger SAI. Additionally, Ameriprise Financial is required to make 10-Q, 10-K and, as necessary, 8-K filings with the SEC on legal and regulatory matters that relate to Ameriprise Financial and its affiliates. Copies of these filings may be obtained by accessing the SEC website at www.sec.gov.
Service Section
Choosing a Share Class
The Funds
Effective September 7, 2010, the Columbia funds (including the portfolios), Columbia Acorn funds and RiverSource funds (including the Seligman and Threadneedle branded funds) share the same policies and procedures for investor services, as described below. For example, for purposes of calculating the initial sales charge on the purchase of Class A shares of a fund, an investor or selling and/or servicing agent should consider the combined market value of all Columbia, Columbia Acorn, RiverSource, Seligman and Threadneedle funds owned by the investor or his/her “immediate family.” For details on this particular policy, see Reductions/Waivers of Sales Charges – Front-End Sales Charge Reductions.
For purposes of this service section, funds and portfolios bearing the “Columbia” and “Columbia Acorn” brands prior to September 27, 2010 are collectively referred to as the Legacy Columbia funds. The Funds that historically bore the RiverSource brand, including those renamed to bear the “Columbia” brand effective September 27, 2010 as well as certain other funds are collectively referred to as the Legacy RiverSource funds. Together the Legacy Columbia funds and the Legacy RiverSource funds are referred to as the Funds. References to the “Fund” are deemed to refer to one of the Funds or to the Buying Fund, as the context requires.
C-2
The Funds’ primary service providers are referred to as follows: Columbia Management or the investment manager refers to Columbia Management Investment Advisers, LLC (formerly RiverSource Investments, LLC), the Transfer Agent refers to Columbia Management Investment Services Corp. (formerly, RiverSource Services Corporation) and the Distributor refers to Columbia Management Investment Distributors, Inc. (formerly RiverSource Fund Distributors, Inc.).
Additional information about the Funds can be obtained at the Funds’ website, columbiamanagement.com, by calling toll-free 800.345.6611, or by writing (regular mail) to The Funds, c/o Columbia Management Investment Services Corp., P.O. Box 8081, Boston, MA 02266-8081 or (express mail) The Funds, c/o Columbia Management Investment Services Corp., 30 Dan Road, Canton, MA 02021-2809.
Comparison of Share Classes
Share Class Features
Not all Funds offer every class of shares. Each share class has its own investment eligibility criteria, cost structure and other features. You may not be eligible for every share class. If you purchase shares of the Fund through a retirement plan or other product or program sponsored by your selling and/or servicing agent, not all share classes may be made available to you.
The following summarizes the primary features of Class A, Class B, Class C, Class E, Class F, Class I, Class R, Class R3, Class R4, Class R5, Class T, Class W, Class Y and Class Z shares. Although Class B, Class E, Class F and Class T shares are generally closed to new and existing investors, information relating to these share classes is included in the table below because certain qualifying purchase orders are permitted, as described below. When deciding which class of shares to buy, you should consider, among other things:
| | • | | The amount you plan to invest. |
| | • | | How long you intend to remain invested in the Fund. |
| | • | | The expenses for each share class. |
| | • | | Whether you may be eligible for a reduction or waiver of sales charges when you buy or sell shares. |
FUNDamentalsTM
Selling and/or Servicing Agents
The terms “selling agent” and “servicing agent” refer to the financial intermediary that employs your financial advisor. Selling and/or servicing agents include, for example, brokerage firms, banks, investment advisors, third party administrators and other financial intermediaries.
Each investor’s personal situation is different and you may wish to discuss with your selling and/or servicing agent which share class is best for you. Your authorized selling and/or servicing agent can help you to determine which share class(es) is available to you and to decide which share class best meets your needs.
| | | | | | |
| | | Eligible Investors and Minimum Initial Investments(a) | | Investment Limits | | Conversion Features |
Class A* | | Available to the general public for investment; minimum initial investment is $2,000 for most investors.(e) | | none | | none |
Class B* | | Closed to new investors.(h) | | up to $49,999 | | Converts to Class A shares generally eight years after purchase.(i) |
Class C* | | Available to the general public for investment; minimum initial investment is $2,000 for most investors.(e) | | up to $999,999; no limit for eligible employee benefit plans.(j) | | none |
Class E | | Closed to new investors and new accounts.(k) | | none | | none |
C-3
| | | | | | |
| | | Eligible Investors and Minimum Initial Investments(a) | | Investment Limits | | Conversion Features |
| Class F | | Closed to new investors and new accounts.(k) | | up to $250,000. (l ) | | Converts to Class E shares eight years after purchase.(i) |
| Class I* | | Available only to the Funds (i.e., Fund-of-Fund investments). | | none | | none |
| Class R* | | Available only to eligible retirement plans and health savings accounts; no minimum initial investment. | | none | | none |
| Class R3* | | Effective after the close of business on December 31, 2010, Class R3 shares are closed to new investors; available only to qualified employee benefit plans, trust companies or similar institutions, 501(c)(3) charitable organizations, non-qualified deferred compensation plans whose participants are included in a qualified employee benefit plan described above, 529 plans, and health savings accounts.(n) | | none | | none |
| Class R4* | | Effective after the close of business on December 31, 2010, Class R4 shares are closed to new investors; available only to qualified employee benefit plans, trust companies or similar institutions, 501(c)(3) charitable organizations, non-qualified deferred compensation plans whose participants are included in a qualified employee benefit plan described above, 529 plans, and health savings accounts.(n) | | none | | none |
| Class R5* | | Effective after the close of business on December 31, 2010, Class R5 shares are closed to new investors; available only to qualified employee benefit plans, trust companies or similar institutions, 501(c)(3) charitable organizations, non-qualified deferred compensation plans whose participants are included in a qualified employee benefit plan described above, 529 plans, health savings accounts and, if approved by the Distributor, institutional or corporate accounts above a threshold established by the Distributor (currently $1 million per Fund or $10 million in all Funds) and bank trust departments.(n) | | none | | none |
| Class T | | Available only to investors who received (and who have continuously held) Class T shares in connection with the merger of certain Galaxy funds into various Columbia funds (formerly named Liberty funds). | | none | | none |
| Class W* | | Available only to investors purchasing through authorized investment programs managed by investment professionals, including discretionary managed account programs. | | none | | none |
| Class Y* | | Available to certain categories of investors which are subject to minimum initial investment requirements; currently offered only to former shareholders of the former Columbia Funds Institutional Trust.(q) | | none | | none |
Class Z* | | Available only to certain eligible investors, which are subject to different minimum initial investment requirements, ranging from $0 to $2,000. | | none | | none |
C-4
| | | | |
| | | Front-End Sales Charges(b) | | Contingent Deferred Sales Charges (CDSCs)(b) |
| Class A* | | 5.75% maximum, declining to 0.00% on investments of $1 million or more. None for money market Funds and certain other Funds.(f) | | CDSC on certain investments of between $1 million and $50 million redeemed within 18 months of purchase, charged as follows: 1.00% CDSC if redeemed within 12 months of purchase, and 0.50% CDSC if redeemed more than 12, but less than 18, months of purchase.(g) |
| Class B* | | none | | 5.00% maximum, gradually declining to 0.00% after six years.(i) |
| Class C* | | none | | 1.00% on certain investments redeemed within one year of purchase. |
| Class E | | 4.50% maximum, declining to 0.00% on investments of $500,000 or more. | | 1.00% on certain investments of between $1 million and $50 million redeemed within one year of purchase. |
| Class F | | none | | 5.00% maximum, gradually declining to 0.00% after six years. |
| Class I* | | none | | none |
| Class R* | | none | | none |
| Class R3* | | none | | none |
| Class R4* | | none | | none |
| Class R5* | | none | | none |
| Class T | | 5.75% maximum, declining to 0.00% on investments of $1 million or more. | | CDSC on certain investments of between $1 million and $50 million redeemed within 18 months of purchase, charged as follows: 1.00% CDSC if redeemed within 12 months of purchase, and 0.50% CDSC if redeemed more than 12, but less than 18, months of purchase.(p) |
| Class W* | | none | | none |
| Class Y* | | none | | none |
| Class Z* | | none | | none |
| | | | |
| | | Maximum Distribution and Service (12b-1) Fees(c) | | Non 12b-1
Service Fees(d) |
| Class A* | | Legacy Columbia funds: distribution fee up to 0.25% and service fee up to 0.25%; Legacy RiverSource funds: 0.25% distribution and service fees, except Columbia Money Market Fund, which pays 0.10%. | | none |
| Class B* | | 0.75% distribution fee and 0.25% service fee, with certain exceptions.(c) | | none |
| Class C* | | 0.75% distribution fee; 0.25% service fee. | | none |
| Class E | | 0.10% distribution fee and 0.25% service fee, with certain exceptions.(c) | | none |
| Class F | | 0.75% distribution fee; 0.25% service fee. | | none |
| Class I* | | none | | none |
C-5
| | | | |
| | | Maximum Distribution and Service (12b-1) Fees(c) | | Non 12b-1
Service Fees(d) |
| Class R* | | Legacy Columbia funds: 0.50% distribution fee; Legacy RiverSource funds: 0.50% fee, of which service fee can be up to 0.25%. | | none |
| Class R3* | | 0.25% distribution fee | | 0.25%(m) |
| Class R4* | | none | | 0.25%(m) |
| Class R5* | | none | | none |
| Class T | | none | | up to 0.50%.(o) |
| Class W* | | 0.25% distribution and service fees, with certain exceptions.(c) | | none |
| Class Y* | | none | | none |
| Class Z* | | none | | none |
| * | For money market Funds, new investments must be made in Class A, Class I, Class T, Class W or Class Z shares, subject to eligibility. Class C and Class R shares of the money market Funds are available as a new investment only to investors in the Distributor’s proprietary 401(k) products, provided that such investor is eligible to invest in the Class and transacts directly with the Fund or the Transfer Agent through a third party administrator or third party recordkeeper. The money market Funds offer other classes of shares only to facilitate exchanges with other Funds offering such share classes. |
| (a) | See Buying, Selling and Exchanging Shares – Opening an Account and Placing Orders for more details on the eligible investors and minimum initial and subsequent investment and account balance requirements. |
| (b) | Actual front-end sales charges and CDSCs vary among the Funds. For more information on applicable sales charges, see Choosing a Share Class – Sales Charges and Commissions, and for information about certain exceptions to these sales charge policies, see Choosing a Share Class – Reductions/Waivers of Sales Charges. |
| (c) | These are the maximum applicable distribution and/or shareholder service fees. Because these fees are paid out of Fund assets on an on-going basis, over time these fees will increase the cost of your investment and may cost you more than paying other types of distribution and/or shareholder service fees. For Legacy Columbia funds with Class A shares subject to both a distribution and service fee, the aggregate fees are limited to not more than 0.25%. Columbia Money Market Fund (formerly RiverSource Cash Management Fund) pays up to 0.75% distribution fee and up to 0.10% service fee on Class B shares, and 0.10% distribution and service fees on Class W shares. Columbia Money Market Fund pays a distribution and service fee of up to 0.10% on Class A shares, up to 0.75% distribution fee and up to 0.10% service fee on Class B shares, and 0.10% distribution and servicing fees on Class W shares. The Distributor has voluntarily agreed to waive all or a portion of distribution and/or service fees for certain classes of certain Funds. For information on these waivers, see Choosing a Share Class – Distribution and Service Fees. Compensation paid to selling and/or servicing agents may be suspended to the extent of the Distributor’s waiver of the 12b-1 fees on these specific Fund share classes. |
| (d) | For more information, see Class R3 and Class R4 Shares – Plan Administration Fees and Class T Shares – Shareholder Service Fees. |
| (e) | The minimum initial investment requirement is $5,000 for RiverSource Disciplined Small Cap Value Fund, Columbia Floating Rate Fund and Columbia Inflation Protected Securities Fund, and $10,000 for Columbia 120/20 Contrarian Equity Fund, Columbia Global Extended Alpha Fund and Columbia Absolute Return Currency and Income Fund. For more details on the minimum initial investment requirement applicable to other Funds, see Buying, Selling and Exchanging Shares – Opening an Account and Placing Orders. |
| (f) | The following Funds are not subject to a front-end sales charge or a CDSC on Class A shares: Columbia Large Cap Index Fund, Columbia Large Cap Enhanced Core Fund, Columbia Mid Cap Index Fund, Columbia Small Cap Index Fund, and RiverSource S&P 500 Index Fund. |
| (g) | There is no CDSC on Class A shares of the money market Funds or the Funds identified in footnote (f) above. Legacy Columbia fund Class A shareholders who purchased Class A shares without an initial sales charge because their accounts aggregated between $1 million and $50 million at the time of purchase and who purchased shares on or before September 3, 2010 will incur a 1.00% CDSC if those shares are redeemed within one year of purchase and redemptions after one year will not be subject to a CDSC. |
| (h) | The Funds no longer accept investments from new or existing investors in Class B shares, except through reinvestment of dividend and/or capital gain distributions by existing Class B shareholders, or a permitted exchange, as described in more detail under Buying, Selling and Exchanging Shares – Opening an Account and Placing Orders – Buying Shares – Class B Shares Closed. Unless contrary instructions are received in advance by the Fund, any purchase orders (except those submitted by a selling and/or servicing agent through the National Securities Clearing Corporation (NSCC) that are initial investments in Class B shares or that are orders for additional Class B shares of the Fund received from existing investors in Class B shares, including orders made through an active systematic investment plan, will automatically be invested in Class A shares of the Fund, without regard to the normal minimum initial investment requirement for Class A shares, but subject to the applicable front-end sales charge. Your selling and/or servicing agent may have different polices, including automatically redirecting the purchase order to a money market fund. See Choosing a Share Class – Class A Shares – Front-end Sales Charge for additional information about Class A shares. |
C-6
| (i) | Timing of conversion and CDSC schedule will vary depending on the Fund and the date of your original purchase of Class B shares. For more information on the timing of conversion of Class B shares to Class A shares, see Choosing a Share Class – Class B Shares – Conversion of Class B Shares to Class A Shares. Class B shares of Columbia Short Term Municipal Bond Fund do not convert to Class A shares. For information on the timing of the conversion of Class F shares to Class E shares, see Choosing a Share Class – Class F Shares – Commissions and Conversion to Class E Shares. |
| (j) | There is no investment limit on Class C shares purchased by employee benefit plans created under section 401(a), 401(k), 457 and 403(b), and qualified deferred compensation plans, that have a plan level or omnibus account maintained with the Fund or the Transfer Agent and transacts directly with the Fund or the Transfer Agent through a third party administrator or third party recordkeeper. |
| (k) | The Funds no longer accept investments from new or existing investors in Class E or Class F shares, except that existing Class E and/or Class F shareholders who opened and funded their account prior to September 22, 2006 may continue to invest in Class E and/or Class F shares, as described in more detail under Buying, Selling and Exchanging Shares – Opening an Account and Placing Orders – Buying Shares – Class E and Class F Shares Closed. Class E and Class F shares are designed for investors who wish to make an irrevocable gift to a child, grandchild or other individual. |
| (l) | If you hold Class F shares of the Fund and your account has a value of less than $250,000, you may purchase additional Class F shares of the Fund in amounts that increase your account value up to a maximum of $250,000. The value of your account, for this purpose, includes the value of all Class F shares in eligible accounts held by you and your “immediate family.” For more information about account value aggregation and eligible accounts, see Choosing a Share Class – Reductions/Waivers of Sales Charges. If you have reached the $250,000 limit, any additional amounts you invest in Class F shares of the Fund will be invested in Class E shares of the Fund, without regard to the normal minimum investment amount required for Class E shares. Such investments will, however, be subject to the applicable front-end sales charge. |
| (m) | For more information, see Class R3 and Class R4 Shares – Plan Administration Fees. |
| (n) | Shareholders who opened and funded a Class R3, Class R4 or Class R5 shares account with a Fund as of the close of business on December 31, 2010 (including accounts once funded that subsequently reached a zero balance) may continue to make additional purchases of the share class, and existing Class R3, Class R4 or Class R5 accounts may continue to allow new investors or participants to be established in their Fund account. For more information on eligible investors in these share classes and the closing of these share classes, see Buying Shares – Eligible Investors – Class R3 Shares, R4 Shares and Class R5 Shares. |
| (o) | For more information, see Class T Shares – Shareholder Service Fees. |
| (p) | Class T Shareholders who purchased Class T shares without a front-end sales charge because their accounts aggregated between $1 million and $50 million at the time of the purchase and who purchased shares on or before September 3, 2010 will incur a 1.00% CDSC if those shares are redeemed within one year of purchase and redemptions after one year will not be subject to a CDSC. |
| (q) | Class Y shares are available only to the following categories of investors: (i) individual investors and institutional clients (endowments, foundations, defined benefit plans, etc.) that invest at least $1 million in Class Y shares of a single Fund and (ii) group retirement plans (including 401(k) plans, 457 plans, employer-sponsored 403(b) plans, profit sharing and money purchase plans) with plan assets of at least $10 million. |
Sales Charges and Commissions
Sales charges, commissions and distribution and service fees (discussed in a separate sub-section below) compensate selling and/or servicing agents, and typically your financial advisor, for selling shares to you and for maintaining and servicing the shares held in your account with them. These charges, commissions and fees are intended to provide incentives for selling and/or servicing agents to provide these services.
Depending on which share class you choose, you will pay these charges either at the outset as a front-end sales charge, at the time you sell your shares as a contingent deferred sales charge (CDSC) and/or over time in the form of increased ongoing fees. Whether the ultimate cost is higher for one class over another depends on the amount you invest, how long you hold your shares and whether you are eligible for reduced or waived sales charges. We encourage you to consult with a financial advisor who can help you with your investment decisions.
Class A Shares — Front-End Sales Charge
You’ll pay a front-end sales charge when you buy Class A shares (other than shares of a money market Fund and certain other Funds) unless you qualify for a waiver of the sales charge or you buy the shares through reinvested distributions. See Choosing a Share Class – Reductions/Waivers of Sales Charges for more information.
The Distributor receives the sales charge and re-allows (or pays) a portion of the sales charge to the selling and/or servicing agent through which you purchased the shares. The Distributor retains the balance of the sales charge. The Distributor retains the full sales charge you pay when you purchase shares of the Fund directly from the Fund (not through a selling and/or servicing agent). Sales charges vary depending on the amount of your purchase.
FUNDamentalsTM
Front-End Sales Charge Calculation
The following tables present the front-end sales charge as a percentage of both the offering price and the net amount invested.
C-7
| | • | | The offering price per share is the net asset value per share plus any front-end sales charge that applies. |
| | • | | The net asset value (or NAV) per share is the price of a share calculated by the Fund every business day. |
The dollar amount of the sales charge is the difference between the offering price of the shares you buy (based on the applicable sales charge in the table) and the net asset value of those shares.
To determine the front-end sales charge you will pay when you buy your shares, the Fund will add the amount of your investment to the value of your account (and any other accounts eligible for aggregation of which you or your financial advisor notify the Fund) and base the sales charge on the aggregate amount. See Choosing a Share Class – Reductions/ Waivers of Sales Charges for a discussion of account value aggregation. There is no initial sales charge on reinvested dividend or capital gain distributions.
The front-end sales charge you’ll pay on Class A shares:
| | • | | depends on the amount you’re investing (generally, the larger the investment, the smaller the percentage sales charge), and |
| | • | | is based on the total amount of your purchase and the value of your account (and any other accounts eligible for aggregation of which you or your financial advisor notify the Fund). |
Class A Shares — Front-End Sales Charge — Breakpoint Schedule
| | | | | | | | | | | | |
Breakpoint Schedule For: | | Dollar amount of
shares bought(a) | | Sales
charge as a%
of the
offering
price(b) | | | Sales
charge as
a% of
the net
amount
invested(b) | | | Amount
retained by
or paid to
selling
and/or
servicing
agents as
a% of the
offering
price | |
| | $ | 0 – $49,999 | | 5.75 | % | | 6.10 | % | | 5.00 | % |
| | $ | 50,000 – $99,999 | | 4.50 | % | | 4.71 | % | | 3.75 | % |
| | $ | 100,000 – $249,999 | | 3.50 | % | | 3.63 | % | | 3.00 | % |
Equity Funds and Funds-of Funds (equity)* | | $ | 250,000 – $499,999 | | 2.50 | % | | 2.56 | % | | 2.15 | % |
| �� | $ | 500,000 – $999,999 | | 2.00 | % | | 2.04 | % | | 1.75 | % |
| | $ | 1,000,000 or more | | 0.00 | % | | 0.00 | % | | 0.00 | %(c)(d) |
| | | | |
| | $ | 0 – $49,999 | | 4.75 | % | | 4.99 | % | | 4.00 | % |
| | $ | 50,000 – $99,999 | | 4.25 | % | | 4.44 | % | | 3.50 | % |
| | $ | 100,000 – $249,999 | | 3.50 | % | | 3.63 | % | | 3.00 | % |
Fixed Income Funds (except those listed below) and Funds-of-Funds (fixed income)* | | $ | 250,000 – $499,999 | | 2.50 | % | | 2.56 | % | | 2.15 | % |
| | $ | 500,000 – $999,999 | | 2.00 | % | | 2.04 | % | | 1.75 | % |
| | $ | 1,000,000 or more | | 0.00 | % | | 0.00 | % | | 0.00 | %(c)(d) |
C-8
Class A Shares — Front-End Sales Charge — Breakpoint Schedule
| | | | | | | | | | | | |
Breakpoint Schedule For: | | Dollar amount of
shares bought(a) | | Sales
charge as a%
of the
offering
price(b) | | | Sales
charge as
a% of
the net
amount
invested(b) | | | Amount
retained by
or paid to
selling
and/or
servicing
agents as
a% of the
offering
price | |
Columbia Absolute Return Currency and Income Fund, Columbia Floating Rate Fund, Columbia Inflation Protected Securities Fund, RiverSource Intermediate Tax-Exempt Fund, Columbia Limited Duration Credit Fund and RiverSource Short Duration U.S. Government Fund | | $ | 0 –$99,999 | | 3.00 | % | | 3.09 | % | | 2.50 | % |
| | $ | 100,000 – $249,999 | | 2.50 | % | | 2.56 | % | | 2.15 | % |
| | $ | 250,000 – $499,999 | | 2.00 | % | | 2.04 | % | | 1.75 | % |
| | $ | 500,000 – $999,999 | | 1.50 | % | | 1.52 | % | | 1.25 | % |
| | $ | 1,000,000 or more | | 0.00 | % | | 0.00 | % | | 0.00 | %(c)(d) |
| | | | |
Columbia California Intermediate Municipal Bond Fund, Columbia Connecticut Intermediate Municipal Bond Fund, Columbia Georgia Intermediate Municipal Bond Fund, Columbia Intermediate Bond Fund, Columbia Intermediate Municipal Bond Fund, Columbia LifeGoal® Income Portfolio, Columbia Maryland Intermediate Municipal Bond Fund, Columbia Massachusetts Intermediate Municipal Bond Fund, Columbia New Jersey Intermediate Municipal Bond Fund, Columbia New York Intermediate Municipal Bond Fund, Columbia North Carolina Intermediate Municipal Bond Fund, Columbia Oregon Intermediate Municipal Bond Fund, Columbia Rhode Island Intermediate Municipal Bond Fund, Columbia Short-Intermediate Bond Fund, Columbia South Carolina Intermediate Municipal Bond Fund, Columbia Total Return Bond Fund and Columbia Virginia Intermediate Municipal Bond Fund | | $ | 0 – $99,999 | | 3.25 | % | | 3.36 | % | | 2.75 | % |
| | $ | 100,000 – $249,999 | | 2.50 | % | | 2.56 | % | | 2.15 | % |
| | $ | 250,000 – $499,999 | | 2.00 | % | | 2.04 | % | | 1.75 | % |
| | $ | 500,000 – $999,999 | | 1.50 | % | | 1.53 | % | | 1.25 | % |
| | $ | 1,000,000 or more | | 0.00 | % | | 0.00 | % | | 0.00 | %(c)(d) |
| | | | |
Columbia Short-Term Bond Fund and Columbia Short-Term Municipal Bond Fund | | $ | 0 – $99,999 | | 1.00 | % | | 1.01 | % | | 0.75 | % |
| | $ | 100,000 – $249,999 | | 0.75 | % | | 0.76 | % | | 0.50 | % |
| | $ | 250,000 – $999,999 | | 0.50 | % | | 0.50 | % | | 0.40 | % |
| | $ | 1,000,000 or more | | 0.00 | % | | 0.00 | % | | 0.00 | %(c)(d) |
| * | The following Funds are not subject to a front-end sales charge or a CDSC on Class A shares: Columbia Large Cap Index Fund, Columbia Large Cap Enhanced Core Fund, Columbia Mid Cap Index Fund, Columbia Small Cap Index Fund and RiverSource S&P 500 Index Fund. “Funds-of-Funds (equity)” includes — Columbia LifeGoal® Growth Portfolio, Columbia LifeGoal® Balanced Growth Portfolio, Columbia LifeGoal® Income and Growth Portfolio, Columbia Portfolio Builder Aggressive Fund, Columbia Portfolio Builder Moderate Aggressive Fund, Columbia Portfolio Builder Moderate Fund, Columbia Portfolio Builder Total Equity Fund, Columbia Retirement Plus 2010 Fund, Columbia Retirement Plus 2015 Fund, Columbia Retirement Plus 2020 Fund, Columbia Retirement Plus 2025 Fund, Columbia Retirement |
C-9
Plus 2030 Fund, Columbia Retirement Plus 2035 Fund, Columbia Retirement Plus 2040 Fund, Columbia Retirement Plus 2045 Fund, Seligman TargETFund 2045, Seligman TargETFund 2035, Seligman TargETFund 2025, Seligman TargETFund 2015 and Seligman TargETFund Core.
“Funds-of-Funds (fixed income)” includes — Columbia Income Builder Fund, Columbia Income Builder Fund II, Columbia Income Builder Fund III, Columbia Portfolio Builder Conservative Fund and Columbia Portfolio Builder Moderate Conservative Fund. Columbia Asset Allocation Fund, Columbia Asset Allocation Fund II, Columbia Balanced Fund and Columbia Liberty Fund are treated as equity Funds for purposes of the table.
| (a) | Purchase amounts and account values may be aggregated among all eligible Fund accounts for the purposes of this table. See Choosing a Share Class – Reductions/ Waivers of Sales Charges for a discussion of account value aggregation. |
| (b) | Because the offering price is calculated to two decimal places, the dollar amount of the sales charge as a percentage of the offering price and your net amount invested for any particular purchase of Fund shares may be higher or lower depending on whether downward or upward rounding was required during the calculation process. Purchase price includes the sales charge. |
| (c) | Although there is no sales charge for purchases with a total market value of $1 million or more, and therefore no re-allowance, the Distributor may pay selling and/or servicing agents the following amounts out of its own resources (except for the Funds listed below): 1.00% on purchases from $1 million up to but not including $3 million; 0.50% on purchases of $3 million up to but not including $50 million; and 0.25% on amounts of $50 million or more. The Distributor may be reimbursed if a CDSC is deducted when the shares are redeemed. Currently, the Distributor does not make such payments on purchases of the following Funds for purchases with a total market value of $1 million or more: Columbia Large Cap Enhanced Core Fund, Columbia Large Cap Index Fund, Columbia Mid Cap Index Fund, Columbia Small Cap Index Fund, Columbia U.S. Treasury Index Fund and RiverSource S&P 500 Index Fund. |
| (d) | For eligible employee benefit plans, selling and/or servicing agents are eligible to receive from the Distributor the following sales commissions on purchases that are coded as commission-eligible trades: 1.00% on all purchases up to but not including $3 million, including those in amounts of less than $1 million; up to 0.50% on all purchases of $3 million up to but not including $50 million; and up to 0.25% on all purchases of $50 million or more. |
Class A Shares — CDSC
In some cases, you’ll pay a CDSC if you sell Class A shares that you bought without an initial sales charge.
| | • | | If you bought Class A shares without an initial sales charge because your accounts aggregated between $1 million and $50 million at the time of purchase, you will incur a CDSC if you redeem those shares in accordance with the following policies: |
| | • | | Columbia fund shareholders who purchased shares of a legacy Columbia fund on or before September 3, 2010 will incur a 1.00% CDSC if those shares are redeemed within one year of purchase. |
| | • | | Fund shareholders who purchased shares after September 3, 2010 will incur a CDSC if those shares are redeemed within 18 months of purchase, which is charged as follows: 1.00% CDSC if shares are redeemed within12 months of purchase, and 0.50% CDSC if shares are redeemed more than 12, but less than 18, months after purchase. |
| | • | | Subsequent Class A share purchases that bring your aggregate account value to $1 million or more (but less than $50 million) will also be subject to a CDSC if you redeem them within the time periods noted above. |
The CDSC on Class A shares:
| | • | | is applied to the net asset value at the time of your purchase or sale, whichever is lower, and |
| | • | | will not be applied to any shares you receive through reinvested distributions. |
In certain circumstances, the CDSC may not apply. See Choosing a Share Class – Reductions/Waivers of Sales Charges for details.
FUNDamentalsTM
Contingent Deferred Sales Charge
A contingent deferred sales charge or CDSC is a sales charge applied at the time you sell your shares, unlike a front-end sales charge that is applied at the time of purchase. A CDSC varies based on the Fund and the length of time that you have held your shares.
For purposes of calculating the CDSC on shares of a Legacy Columbia fund and, for shares of a Legacy RiverSource fund purchased after the close of business on September 3, 2010, the start of the holding period is the first day of the month in which your purchase was made. For purposes of calculating the CDSC on shares of a Legacy RiverSource fund purchased on or before the close of business on September 3, 2010, the start of the holding period is the date your purchase was made. When you place an order to sell your shares, the Fund will first redeem any shares that aren’t subject to a CDSC, followed by those you have held the longest. This means that if a CDSC is imposed, you cannot designate the individual shares being redeemed for U.S. federal income tax purposes. You should consult your tax advisor about the tax consequences of investing in the Fund.
C-10
Class A Shares — Commissions
The Distributor may pay your selling and/or servicing agent an up-front commission when you buy Class A shares. The Distributor generally funds the commission through the applicable sales charge paid by you. The up-front commission on Class A shares, which varies by Fund, may be up to 5.00% of the offering price for Funds with a maximum front-end sales charge of 5.75%, up to 4.00% of the offering price for Funds with a maximum front-end sales charge of 4.75%, up to 2.75% of the offering price for Funds with a maximum front-end sales charge of 3.25%, up to 2.50% of the offering price for Funds with a maximum front-end sales charge of 3.00%, and up to 0.75% of the offering price for Funds with a maximum front-end sales charge of 1.00%.
The Distributor may also pay your selling and/or servicing agent a cumulative commission when you buy $1 million or more of Class A shares, according to the following schedule:
| | | |
| Class A Shares – Commission Schedule (Paid by the Distributor to Selling and/or Service Agents)* | |
| |
Purchase Amount | | Commission Level
(as a% of net
asset value per
share) | |
$1 million – $2,999,999 | | 1.00 | %** |
$3 million – $49,999,999 | | 0.50 | % |
$50 million or more | | 0.25 | % |
| * | Not applicable to Funds that do not assess a front-end sales charge. |
| ** | For eligible employee benefit plans, selling and/or servicing agents are eligible to receive from the Distributor sales commissions on purchases (that are coded as commission-eligible trades) in amounts of less than $1 million. |
Class B Shares — Sales Charges
The Funds no longer accept investments from new or existing investors in Class B shares, except for certain limited transactions involving existing investors in Class B shares as described in more detail below under Buying, Selling and Exchanging Shares – Buying Shares – Eligible Investors – Class B Shares Closed.
You don’t pay a front-end sales charge when you buy Class B shares, but you may pay a CDSC when you sell Class B shares.
Class B Shares — CDSC
The CDSC on Class B shares:
| | • | | is applied to the net asset value at the time of your purchase or sale, whichever is lower, |
| | • | | will not be applied to any shares you receive through reinvested distributions or on any amount that represents appreciation in the value of your shares, and |
| | • | | generally declines each year until there is no sales charge for redeeming shares. |
C-11
You’ll pay a CDSC if you sell Class B shares unless you qualify for a waiver of the CDSC or the shares you’re selling were bought through reinvested distributions. See Choosing a Share Class – Reductions/Waivers of Sales Charges for details. Also, you will not pay a CDSC on any amount that represents appreciation in the value of your shares. The CDSC you pay on Class B shares depends on how long you’ve held your shares:
| | | | |
| Class B Shares — CDSC Schedule for the Funds |
| |
| | | Applicable CDSC* |
Number of
Years Class B
Shares Held | | All Funds except those
listed to the right | | Columbia California Intermediate Municipal Bond Fund, Columbia Georgia Intermediate Municipal Bond Fund,
Columbia Connecticut Intermediate Municipal Bond Fund, Columbia Intermediate Bond Fund, Columbia
Intermediate Municipal Bond Fund, Columbia LifeGoal® Income Portfolio, Columbia Maryland Intermediate
Municipal Bond Fund, Columbia Massachusetts Intermediate Municipal Bond Fund, Columbia New Jersey
Intermediate Municipal Bond Fund, Columbia New York Intermediate Municipal Bond Fund, Columbia North
Carolina Intermediate Municipal Bond Fund, Columbia Oregon Intermediate Municipal Bond Fund, Columbia
Rhode Island Intermediate Municipal Bond Fund, Columbia Short Term Bond Fund, Columbia South Carolina
Intermediate Municipal Bond Fund, Columbia Total Return Bond Fund and Columbia Virginia Intermediate
Municipal Bond Fund |
One | | 5.00% | | 3.00% |
Two | | 4.00% | | 3.00% |
Three | | 3.00%** | | 2.00% |
Four | | 3.00% | | 1.00% |
Five | | 2.00% | | None |
Six | | 1.00% | | None |
Seven | | None | | None |
Eight | | None | | None |
Nine | | Conversion to Class A Shares | | Conversion to Class A Shares |
| * | Because of rounding in the calculation, the actual CDSC you pay may be more or less than the CDSC calculated using these percentages. |
| ** | For shares purchased in a Legacy RiverSource fund (other than a Seligman fund) on or prior to June 12, 2009, the CDSC percentage for year three is 4%. |
Class B shares of Columbia Short Term Municipal Bond Fund are not subject to a CDSC.
Class B Shares — Commissions
If you are an investor who purchased Class B shares prior to their closing (except for certain limited transactions), although there was no front-end sales charge for Class B shares when you bought Class B shares, the Distributor paid an up-front commission directly to your selling and/or servicing agent when you bought the Class B shares (a portion of this commission may, in turn, have been paid to your financial advisor). This up-front commission, which varies across the Funds, was up to 4.00% of the net asset value per share of Funds with a maximum CDSC of 5.00% and of Class B shares of Columbia Short Term Municipal Bond Fund and up to 2.75% of the net asset value per share of Funds with a maximum CDSC of 3.00%. The Distributor continues to seek to recover this commission through distribution fees it receives under the Fund’s distribution plan and any applicable CDSC paid when you sell your shares. See Choosing a Share Class – Distribution and Service Fees for details.
Class B Shares — Conversion to Class A Shares
Class B shares purchased in a Legacy Columbia fund at any time, a Legacy RiverSource fund (other than a Seligman fund) at any time, or a Seligman fund on or after June 13, 2009 automatically convert to Class A shares after you’ve owned the shares for eight years, except for Class B shares of Columbia Short Term Municipal Bond Fund, which do not convert to Class A shares. Class B shares originally purchased in a Seligman fund on or prior to June 12, 2009 will convert to Class A shares in the month prior to the ninth year of ownership. The conversion feature allows you to benefit from the lower operating costs of Class A shares, which can help increase your total returns from an investment in the Fund.
Class B shares purchased in a Legacy RiverSource fund (other than a Seligman fund) prior to May 21, 2005 age on a calendar year basis. Class B shares purchased in a Legacy Columbia fund at any time, Seligman fund at any time, or a Legacy RiverSource fund on or after May 21, 2005 age on a daily basis. For example, a purchase made on
C-12
November 12, 2004 completed its first year on December 31, 2004 under calendar year aging, but completed its first year on November 11, 2005 under daily aging.
The following rules apply to the conversion of Class B shares to Class A shares:
| | • | | Class B shares are converted on or about the 15th day of the month that they become eligible for conversion. For purposes of determining the month when your Class B shares are eligible for conversion, the start of the holding period is the first day of the month in which your purchase was made. |
| | • | | Any shares you received from reinvested distributions on these shares generally will convert to Class A shares at the same time. |
| | • | | You’ll receive the same dollar value of Class A shares as the Class B shares that were converted. Class B shares that you received from an exchange of Class B shares of another Fund will convert based on the day you bought the original shares. |
| | • | | No sales charge or other charges apply, and conversions are free from U.S. federal income tax. |
Class C Shares — Sales Charges
You don’t pay a front-end sales charge when you buy Class C shares, but you may pay a CDSC when you sell Class C shares.
Class C Shares — CDSC
You’ll pay a CDSC of 1.00% if you redeem Class C shares within one year of buying them unless you qualify for a waiver of the CDSC or the shares you’re selling were bought through reinvested distributions. For details, see Choosing a Share Class — Reductions/Waivers of Sales Charges. The CDSC on Class C shares:
| | • | | is applied to the net asset value at the time of your purchase or sale, whichever is lower, |
| | • | | will not be applied to any shares you receive through reinvested distributions or on any amount that represents appreciation in the value of your shares, and |
| | • | | is reduced to 0.00% on shares redeemed a year or more after purchase. |
Class C Shares — Commissions
Although there is no front-end sales charge when you buy Class C shares, the Distributor pays an up-front commission directly to your selling and/or servicing agent of up to 1.00% of the net asset value per share when you buy Class C shares (a portion of this commission may, in turn, be paid to your financial advisor). The Distributor seeks to recover this commission through distribution fees it receives under the Fund’s distribution and/or service plan and any applicable CDSC applied when you sell your shares. See Choosing a Share Class – Distribution and Service Fees for details.
Class E Shares — Front-End Sales Charge
You’ll pay a front-end sales charge when you buy Class E shares unless you qualify for a waiver of the sales charge or you buy the shares through reinvested distributions. See Choosing a Share Class – Reductions/Waivers of Sales Charges for more information.
The front-end sales charge you’ll pay on Class E shares:
| | • | | depends on the amount you’re investing (generally, the larger the investment, the smaller the percentage sales charge), and |
| | • | | is based on the total amount of your purchase and the value of your account. |
C-13
| | | | | | | | | |
| Class E Shares – Front-End Sales Charge – Breakpoint Schedule | |
| | | |
Dollar amount of shares bought(a) | | Sales charge as a% of the
offering price(b) | | | Sales charge as a% of the
net amount invested(b) | | | Amount retained by or paid to selling
and/or servicing agents as a% of the
offering price | |
$0 – $49,999 | | 4.50 | % | | 4.71 | % | | 4.00 | % |
$50,000 – $99,999 | | 3.50 | % | | 3.63 | % | | 3.00 | % |
$100,000 – $249,999 | | 2.50 | % | | 2.56 | % | | 2.00 | % |
$250,000 – $499,999 | | 1.25 | % | | 1.27 | % | | 1.00 | % |
$500,000 – $999,999 | | 0.00 | % | | 0.00 | % | | 0.00 | % |
$1,000,000 or more | | 0.00 | % | | 0.00 | % | | 0.00 | %(c) |
| (a) | Purchase amounts and account values are aggregated among all eligible Fund accounts for the purposes of this table. |
| (b) | Because the offering price is calculated to two decimal places, the dollar amount of the sales charge as a percentage of the offering price and your net amount invested for any particular purchase of Fund shares may be higher or lower depending on whether downward or upward rounding was required during the calculation process. |
| (c) | Although there is no sales charge for purchases with a total market value of $1 million or more, and therefore no re-allowance, the Distributor may pay selling and/or servicing agents the following out of its own resources: 1.00% on purchases up to but not including $3 million, 0.50% on purchases of $3 million up to but not including $5 million and 0.25% on purchases of $5 million or more. The Distributor pays selling and/or servicing agents on investments of $1 million or more, but may be reimbursed if a CDSC is deducted when the shares are sold. |
Class E Shares – CDSC
In some cases, you’ll pay a CDSC if you sell Class E shares that you bought without an initial sales charge.
| | • | | If you bought Class E shares without an initial sales charge because your accounts aggregated between $1 million and $50 million at the time of purchase, you will incur a 1.00% CDSC if you redeem those shares within one year of buying them. |
| | • | | Subsequent Class E share purchases that bring your aggregate account value to $1 million or more (but less than $50 million) will also be subject to a CDSC if you redeem them within one year of buying them. |
The CDSC on Class E shares:
| | • | | is applied to the net asset value at the time of your purchase or sale, whichever is lower, and |
| | • | | will not be applied to any shares you receive through reinvested distributions or any amount that represents appreciation in the value of your shares. |
For purposes of calculating the CDSC, the start of the holding period is the first day of the month in which the purchase was made. When you place an order to sell your Class E shares, the Fund will first redeem any shares that aren’t subject to a CDSC followed by those you have held the longest. This means that if a CDSC is imposed, you cannot designate the individual shares being redeemed for U.S. federal income tax purposes. You should consult your tax advisor about the tax consequences of your investment in the Funds.
The Distributor may pay your selling and/or servicing agent an up-front commission of up to 4.00% of the offering price per share when you buy Class E shares. The Distributor funds the commission through the applicable sales charge paid by you.
Class E Shares – Commissions
The Distributor may also pay your selling and/or servicing agent a cumulative commission when you buy Class E shares, according to the following schedule:
| | | |
| Class E Shares – Commission Schedule (Paid by the Distributor to Selling and/or Servicing Agents) | |
| |
Purchase Amount | | Commission Level
(as a% of net
asset value per
share) | |
$0 – $2,999,999 | | 1.00 | % |
$3 million – $4,999,999 | | 0.50 | % |
$5 million or more | | 0.25 | % |
Class F Shares – Sales Charges
You don’t pay a front-end sales charge when you buy Class F shares, but you may pay a CDSC when you sell Class F shares. The CDSC on Class F shares:
| | • | | is applied to the net asset value at the time of your purchase or sale, whichever is lower, |
C-14
| | • | | will not be applied to any shares you receive through reinvested distributions or on any amount that represents appreciation in the value of your shares, and |
| | • | | generally declines each year until there is no sales charge for redeeming shares. |
For purposes of calculating the CDSC, the start of the holding period is the first day of the month in which your purchase was made. When you place an order to sell your Class F shares, the Fund will first redeem any shares that aren’t subject to a CDSC, followed by those you have held the longest. This means that if a CDSC is imposed, you cannot designate the individual shares being redeemed for U.S. federal income tax purposes. You should consult your tax advisor about the tax consequences of your investment in the Funds.
Class F Shares – CDSC
The CDSC you pay on Class F shares depends on how long you’ve held your shares:
| | |
| Class F Shares – CDSC Schedule |
| |
Number of Years Class F Shares Held | | Applicable CDSC* |
One | | 5.00% |
Two | | 4.00% |
Three | | 3.00% |
Four | | 3.00% |
Five | | 2.00% |
Six | | 1.00% |
Seven | | None |
Eight | | None |
Nine | | Conversion to Class E Shares |
| * | Because of rounding in the calculation, the actual CDSC you pay may be more or less than the CDSC calculated using these percentages. |
Class F Shares — Commissions and Conversion to Class E Shares
Although there is no front-end sales charge when you buy Class F shares, the Distributor pays an up-front commission directly to your selling and/or servicing agent of up to 4.00% of the net asset value per share when you buy Class F shares (a portion of this commission may, in turn, be paid to your financial advisor). The Distributor seeks to recover this commission through distribution fees it receives under the Fund’s distribution plan and any applicable CDSC when you sell your shares. See Choosing a Share Class – Distribution and Service Fees for details.
Class F shares automatically convert to Class E shares after you’ve owned them for eight years. This conversion feature allows you to benefit from the lower operating costs of Class E shares, which can help increase your total returns from an investment in the Fund.
The following rules apply to the conversion of Class F shares to Class E shares:
| | • | | Class F shares are converted on or about the 15th day of the month that they become eligible for conversion. |
| | • | | Any shares you received from reinvested distributions on these shares generally will convert to Class E shares at the same time. |
| | • | | You’ll receive the same dollar value of Class E shares as the Class F shares that were converted. Class F shares that you received from an exchange of Class F shares of another Fund will convert based on the day you bought the original shares. |
| | • | | No sales charge or other charges apply, and conversions are free from U.S. federal income tax. |
Class R Shares – Sales Charges and Commissions
You don’t pay a front-end sales charge when you buy Class R shares of the Fund or a CDSC when you sell Class R shares of the Fund. See Buying, Selling and Exchanging Shares – Opening an Account and Placing Orders for more information about investing in Class R shares of the Fund. The Distributor pays an up-front commission directly to your selling and/or servicing agent when you buy Class R shares (a portion of this commission may, in turn, be paid to your financial advisor), according to the following schedule:
C-15
| | |
| Class R Shares – Commission Schedule (Paid by the Distributor to Selling and/or Servicing Agents) |
Purchase Amount | | Commission Level (as a % of net asset value per share) |
$0 – $49,999,999 | | 0.50% |
$50 million or more | | 0.25% |
The Distributor seeks to recover this commission through distribution and/or service fees it receives under the Fund’s distribution and/or service plan. See Choosing a Share Class – Distribution and Service Fees for details.
Class T Shares – Front-End Sales Charge
You’ll pay a front-end sales charge when you buy Class T shares unless you qualify for a waiver of the sales charge or you buy the shares through reinvested distributions. See Choosing a Share Class – Reductions/Waivers of Sales Charges for more information.
The front-end sales charge you’ll pay on Class T shares:
| | • | | depends on the amount you’re investing (generally, the larger the investment, the smaller the percentage sales charge), and |
| | • | | is based on the total amount of your purchase and the value of your account. |
| | | | | | | | |
| Class T Shares — Front-End Sales Charge — Breakpoint Schedule |
Breakpoint Schedule For: | | Dollar amount of shares bought(a) | | Sales charge as a% of the offering price(b) | | Sales charge as a% of the net amount invested(b) | | Amount retained by or paid to selling and/or servicing agents as a% of the offering price |
| | | | | | | | |
Equity Funds | | $0 – $49,999 | | 5.75% | | 6.10% | | 5.00% |
| | $50,000 – $99,999 | | 4.50% | | 4.71% | | 3.75% |
| | $100,000 – $249,999 | | 3.50% | | 3.63% | | 2.75% |
| | $250,000 – $499,999 | | 2.50% | | 2.56% | | 2.00% |
| | $500,000 – $999,999 | | 2.00% | | 2.04% | | 1.75% |
| | $1,000,000 or more | | 0.00% | | 0.00% | | 0.00%(c)(d) |
Fixed Income Funds | | $0 – $49,999 | | 4.75% | | 4.99% | | 4.25% |
| | $50,000 – $99,999 | | 4.50% | | 4.71% | | 3.75% |
| | $100,000 – $249,999 | | 3.50% | | 3.63% | | 2.75% |
| | $250,000 – $499,999 | | 2.50% | | 2.56% | | 2.00% |
| | $500,000 – $999,999 | | 2.00% | | 2.04% | | 1.75% |
| | $1,000,000 or more | | 0.00% | | 0.00% | | 0.00%(c)(d) |
| (a) | Purchase amounts and account values are aggregated among all eligible Fund accounts for the purposes of this table. |
| (b) | Because the offering price is calculated to two decimal places, the dollar amount of the sales charge as a percentage of the offering price and your net amount invested for any particular purchase of Fund shares may be higher or lower depending on whether downward or upward rounding was required during the calculation process. |
| (c) | Although there is no sales charge for purchases with a total market value of $1 million or more, and therefore no re-allowance, the Distributor may pay selling and/or servicing agents the following amounts out of its own resources: 1.00% on purchases of $1 million up to |
C-16
| | but not including $3 million, 0.50% on purchases of $3 million up to but not including $50 million and 0.25% on purchases of $50 million or more. The Distributor pays selling and/or servicing agents on investments of $1 million or more, but may be reimbursed if a CDSC is deducted when the shares are sold. |
| (d) | For eligible employee benefit plans, selling and/or servicing agents are eligible to receive from the Distributor the following sales commissions on purchases that are coded as commission-eligible trades: 1.00% on purchases up to but not including $3 million (including those in amounts of less than $1 million), up to 0.50% on purchases of $3 million up to but not including $50 million, and up to 0.25% on purchases of $50 million or more. |
Class T Shares – CDSC
In some cases, you’ll pay a CDSC if you sell Class T shares that you bought without an initial sales charge.
| | • | | If you bought Class T shares without a front-end sales charge because your accounts aggregated between $1 million and $50 million at the time of purchase, you will incur a CDSC if you redeem those shares in accordance with the following policies: |
| | • | | Shareholders who purchased shares of a Legacy Columbia fund on or before September 3, 2010 will incur a 1.00% CDSC if those shares are redeemed within one year of purchase. |
| | • | | Shareholders who purchased shares of a Fund after September 3, 2010 will incur a CDSC if those shares are redeemed within 18 months of purchase, which is charged as follows: 1.00% CDSC if shares are redeemed within 12 months of purchase, and 0.50% CDSC if shares are redeemed more than 12, but less than 18, months of purchase. |
| | • | | Subsequent Class T share purchases that bring your aggregate account value to $1 million or more (but less than $50 million) will also be subject to a CDSC if you redeem them within one year of purchase. |
The CDSC on Class T shares:
| | • | | is applied to the net asset value at the time of your purchase or sale, whichever is lower, and |
| | • | | will not be applied to any shares you receive through reinvested distributions or any amount that represents appreciation in the value of your shares. |
For purposes of calculating the CDSC, the start of the holding period is the first day of the month in which the purchase was made. When you place an order to sell your Class T shares, the Fund will first redeem any shares that aren’t subject to a CDSC, followed by those you have held the longest. This means that if a CDSC is imposed, you cannot designate the individual shares being redeemed for U.S. federal income tax purposes. You should consult your tax advisor about the tax consequences of your investment in the Funds.
In certain circumstances, the CDSC may not apply. See Choosing a Share Class – Reductions/Waivers of Sales Charges for details.
Class T Shares – Commissions
The Distributor may pay your selling and/or servicing agent an up-front commission when you buy Class T shares (a portion of this commission may, in turn, be paid to your financial advisor). The up-front commission, which varies by Fund, may be up to 5.00% of the offering price for Funds with a maximum front-end sales charge of 5.75% and up to 4.25% of the offering price for Funds with a maximum front-end sales charge of 4.75%.
The Distributor may also pay your selling and/or servicing agent a cumulative commission when you buy $1 million or more of Class T shares, according to the following schedule:
| | |
Class T Shares – Commission Schedule (Paid by the Distributor to Selling and/or Servicing Agents) |
Purchase Amount | | Commission Level (as a% of net asset value per share) |
$1 million – $2,999,999 | | 1.00% |
$3 million – $49,999,999 | | 0.50% |
$50 million or more | | 0.25% |
Reductions/Waivers of Sales Charges
Front-End Sales Charge Reductions
There are two ways in which you may be able to reduce the front-end sales charge that you may pay when you buy Class A, Class E or Class T shares of a Fund. These types of sales charge reductions are also referred to as breakpoint discounts.
C-17
First, through the right of accumulation (ROA), you may combine the value of eligible accounts maintained by you and members of your immediate family to reach a breakpoint discount level and apply a lower sales charge to your purchase. To calculate the combined value of your accounts in the particular class of shares, the Fund will use the current public offering price per share. For purposes of obtaining a Class A shares breakpoint discount through ROA, you may aggregate your or your immediate family members’ ownership of different classes of shares, except for Class I, Class R, Class R3, Class R4, Class R5 and Class Y shares of the Funds, which may not be aggregated.
Second, by making a statement of intent to purchase additional shares (commonly referred to as a letter of intent (LOI)), you may pay a lower sales charge on all purchases (including existing ROA purchases) of Class A shares, Class E shares or Class T shares made within 13 months of the date of your LOI. Your LOI must state the aggregate amount of purchases you intend to make in that 13-month period, which must be at least $50,000. The required form of LOI may vary by selling and/or servicing agent, so please contact them directly for more information. Five percent of the purchase commitment amount will be placed in escrow. At the end of the 13-month period, the shares will be released from escrow, provided that you have invested the commitment amount. If you do not invest the purchase commitment amount by the end of the 13 months, the remaining amount of the unpaid sales charge will be redeemed from the escrowed shares and the remaining balance released from escrow. To calculate the total value of the purchases you’ve made under an LOI, the Fund will use the historic cost (i.e., dollars invested) of the shares held in each eligible account. For purposes of making an LOI to purchase additional shares, you may aggregate your ownership of different classes of shares, except for Class I, Class R, Class R3, Class R4, Class R5 and Class Y shares of the Funds, which may not be aggregated.
You must request the reduced sales charge (whether through ROA or an LOI) when you buy shares. If you do not complete and file an LOI, or do not request the reduced sales charge at the time of purchase, you will not be eligible for the reduced sales charge. To obtain a breakpoint discount, you must notify your selling and/or servicing agent in writing at the time you buy your shares of each eligible account maintained by you and members of your immediate family, including accounts maintained through different selling and/or servicing agents. You and your selling and/or servicing agent are responsible for ensuring that you receive discounts for which you are eligible. The Fund is not responsible for a selling and/or servicing agent’s failure to apply the eligible discount to your account. You may be asked by your selling and/or servicing agent for account statements or other records to verify your discount eligibility, including, when applicable, records for accounts opened with a different selling and/or servicing agent and records of accounts established by members of your immediate family.
FUNDamentalsTM
Your “Immediate Family” and Account Value Aggregation
For purposes of reaching the Class F shares investment limits described in Choosing a Share Class – Comparison of the Share Classes or obtaining a Class A shares, Class E shares or Class T shares breakpoint discount, the value of your account will be deemed to include the value of all applicable shares in eligible accounts that are held by you and your “immediate family,” which includes your spouse, domestic partner, parent, step-parent, legal guardian, child, step-child, father-in-law and mother-in-law, provided that you and your immediate family members share the same mailing address. Any Fund accounts linked together for account value aggregation purposes as of the close of business on September 3, 2010 will be permitted to remain linked together. Remember that in order to obtain a breakpoint discount, you must notify your selling and/or servicing agent in writing at the time you buy your shares of each eligible account maintained by you and members of your immediate family. Group plan accounts are valued at the plan level.
Eligible Accounts
The following accounts are eligible for account value aggregation as described above:
| | • | | Individual or joint accounts; |
| | • | | Roth and traditional Individual Retirement Accounts (IRAs), Simplified Employee Pension accounts (SEPs), Savings Investment Match Plans for Employees of Small Employers accounts (SIMPLEs) and Tax Sheltered Custodial Accounts (TSCAs); |
| | • | | Uniform Gifts to Minors Act (UGMA)/Uniform Transfers to Minors (UTMA) accounts for which you, your spouse, or your domestic partner is parent or guardian of the minor child; |
| | • | | Revocable trust accounts for which you or an immediate family member, individually, is the beneficial owner/grantor; |
C-18
| | • | | Accounts held in the name of your, your spouse’s, or your domestic partner’s sole proprietorship or single owner limited liability company or S corporation; |
| | • | | Qualified retirement plan assets, provided that you are the sole owner of the business sponsoring the plan, are the sole participant (other than a spouse) in the plan, and have no intention of adding participants to the plan; and |
| | • | | Investments in wrap accounts; |
provided that each of the accounts identified above is invested in Class A, Class B, Class C, Class E, Class F, Class T, Class W and/or Class Z shares of the Funds.
The following accounts are not eligible for account value aggregation as described above:
| | • | | Accounts of pension and retirement plans with multiple participants, such as 401(k) plans (which are combined to reduce the sales charge for the entire pension or retirement plan and therefore are not used to reduce the sales charge for your individual accounts); |
| | • | | Accounts invested in Class I, Class R, Class R3, Class R4, Class R5 and Class Y shares of the Funds; |
| | • | | Investments in 529 plans, donor advised funds, variable annuities, variable life insurance products, or managed separate accounts; |
| | • | | Charitable and irrevocable trust accounts; and |
| | • | | Accounts holding shares of money market Funds that used the Columbia brand before May 1, 2010. |
Front-End Sales Charge Waivers
The following categories of investors may buy Class A, Class E and Class T shares of the Funds at net asset value, without payment of any front-end sales charge that would otherwise apply:
| | • | | Current or retired Fund Board members, officers or employees of the Funds or Columbia Management or its affiliates(1); |
| | • | | Current or retired Ameriprise Financial Services, Inc. financial advisors and employees of such financial advisors(1); |
| | • | | Registered representatives and other employees of affiliated or unaffiliated selling and/or servicing agent having a selling agreement with the Distributor(1); |
| | • | | Registered broker/dealer firms that have entered into a dealer agreement with the Distributor may buy Class A shares without paying a front-end sales charge for their investment account only; |
| | • | | Portfolio managers employed by subadvisers of the Funds(1); |
| | • | | Partners and employees of outside legal counsel to the Funds or the Funds’ directors or trustees who regularly provide advice and services to the Funds, or to their directors or trustees; |
| | • | | Direct rollovers from qualified employee benefit plans, provided that the rollover involves a transfer to Class A shares in the same Fund; |
| | • | | With dividend or capital gain distributions from a Fund or from the same class of another Fund; |
| | • | | Through or under a wrap fee product or other investment product sponsored by a selling and/or servicing agent that charges an account management fee or other managed agency/asset allocation accounts or programs involving fee-based compensation arrangements that have or that clear trades through a selling and/or servicing agent that has a selling agreement with the Distributor; |
| | • | | Through state sponsored college savings plans established under Section 529 of the Internal Revenue Code; or |
| | • | | Through banks, trust companies and thrift institutions, acting as fiduciaries; |
| | • | | Separate accounts established and maintained by an insurance company which are exempt from registration under Section 3(c)(11); |
| | • | | Purchases made through “employee benefit plans” created under section 401(a), 401(k), 457 and 403(b), and qualified deferred compensation plans that have a plan level or omnibus account maintained with the Fund or the Transfer Agent and transacts directly with the Fund or the Transfer Agent through a third party administrator or third party recordkeeper; and |
| | • | | At the Fund’s discretion, front-end sales charges may be waived for shares issued in plans of reorganization, such as mergers, asset acquisitions and exchange offers, to which the Fund is a party. |
C-19
Restrictions may apply to certain accounts and certain transactions. The Funds may change or cancel these terms at any time. Any change or cancellation applies only to future purchases. Unless you provide your selling and/or servicing agent with information in writing about all of the factors that may count toward a waiver of the sales charge, there can be no assurance that you will receive all of the waivers for which you may be eligible. You should request that your selling and/or servicing agent provide this information to the Fund when placing your purchase order. Please see the Merger SAI for more information about the sales charge reductions and waivers.
| (1) | Including their spouses or domestic partners, children or step-children, parents, step-parents or legal guardians, and their spouse’s or domestic partner’s parents, step-parents, or legal guardians. |
CDSC Waivers
You may be able to avoid an otherwise applicable CDSC when you sell Class A, Class B, Class C, Class E, Class F or Class T shares of the Fund. This could happen because of the way in which you originally invested in the Fund, because of your relationship with the Funds or for other reasons.
CDSC — Waivers of the CDSC for Class A, Class C, Class E, Class F and Class T shares. The CDSC will be waived on redemptions of shares:
| | • | | in the event of the shareholder’s death; |
| | • | | for which no sales commission or transaction fee was paid to an authorized selling and/or servicing agent at the time of purchase; |
| | • | | purchased through reinvestment of dividend and capital gain distributions; |
| | • | | in an account that has been closed because it falls below the minimum account balance; |
| | • | | that result from required minimum distributions taken from retirement accounts upon the shareholder’s attainment of age 70 1/2; |
| | • | | that result from returns of excess contributions made to retirement plans or individual retirement accounts, so long as the selling and/or servicing agent returns the applicable portion of any commission paid by the Distributor; |
| | • | | of Class A shares of a Fund initially purchased by an employee benefit plan; |
| | • | | other than Class A shares, of a Fund initially purchased by an employee benefit plan that are not connected with a plan level termination; |
| | • | | in connection with the Fund’s Small Account Policy (which is described below in Buying, Selling and Exchanging Shares – Transaction Rules and Policies); |
| | • | | at a Fund’s discretion, issued in connection with plans of reorganization, including but not limited to mergers, asset acquisitions and exchange offers, to which the Fund is a party; and |
| | • | | by certain other investors as set forth in more detail in the Merger SAI. |
CDSC — Waivers of the CDSC for Class B shares. The CDSC will be waived on redemptions of shares:
| | • | | in the event of the shareholder’s death; |
| | • | | that result from required minimum distributions taken from retirement accounts upon the shareholder’s attainment of age 70½; |
| | • | | in connection with the Fund’s Small Account Policy (which is described below in Buying, Selling and Exchanging Shares – Transaction Rules and Policies); and |
| | • | | by certain other investors, including certain institutions as set forth in more detail in the Merger SAI. |
Restrictions may apply to certain accounts and certain transactions. The Distributor may, in its sole discretion, authorize the waiver of the CDSC for additional classes of investors. The Fund may change or cancel these terms at any time. Any change or cancellation applies only to future purchases.
Please see the Merger SAI for more information about the sales charge reductions and waivers described here.
Repurchases
Investors can also buy Class A shares without paying a sales charge if the purchase is made from the proceeds of a redemption of any Class A, B, C or T shares of the Fund within 90 days, up to the amount of the redemption proceeds. Any CDSC paid upon redemption of your Class A, B, C or T shares of the Fund will not be reimbursed. If your original purchase was in Class T shares, you will be allowed to reinvest in the same Class T shares account and Fund you originally purchased.
C-20
Legacy RiverSource fund shareholders may not invest or reinstate their investment in Class B shares of a Legacy RiverSource fund. However, shareholders who redeem Class B shares of the Fund and wish to reinvest all or a portion of the redemption proceeds within 90 days of redemption can invest in Class A shares without incurring a front-end sales charge. To qualify, shareholders must notify their selling and/or servicing agent or the Transfer Agent in writing in advance of reinvestment and must purchase shares into an account with the same account owner information.
To be eligible for these reinstatement privileges, the purchase must be made into an account for the same owner, but does not need to be into the same Fund from which the shares were sold. The Transfer Agent, Distributor or their agents must receive a written reinstatement request from you or your selling and/or servicing agent within 90 days after the shares are redeemed and the purchase of Class A shares through this reinstatement privilege will be made at the NAV of such shares next calculated after the request is received in good order. The repurchased shares will be deemed to have the original purchase date for purposes of applying the CDSC (if any) to subsequent redemptions. Systematic withdrawals and purchases are excluded from this policy.
Distribution and Service Fees
Pursuant to Rule 12b-1 under the 1940 Act, the applicable Board has approved, and the Funds have adopted, distribution and/or shareholder service plans which set the distribution and/or service fees that are periodically deducted from the Fund assets. These fees are calculated daily, may vary by share class and are intended to compensate the Distributor and/or eligible selling and/or servicing agents for selling shares of the Fund and providing services to investors. Because the fees are paid out of the Fund’s assets on an ongoing basis, they will increase the cost of your investment over time.
The table below shows the maximum annual distribution and/or service fees (as an annual % of average daily net assets) and the combined amount of such fees applicable to each share class:
| | | | | | |
| | | Distribution Fee | | Service Fee | | Combined Total |
Class A | | up to 0.25% | | up to 0.25% | | up to 0.35%(a)(b)(c) |
| | | |
Class B | | 0.75% | | 0.25% | | 1.00%(a)(b) |
| | | |
Class C | | 0.75% | | 0.25% | | 1.00%(d) |
| | | |
Class E | | 0.10% | | 0.25% | | 0.35% |
| | | |
Class F | | 0.75% | | 0.25% | | 1.00% |
| | | |
Class I | | none | | none | | None |
| | | |
Class R (Legacy Columbia funds) | | 0.50% | | —(e) | | 0.50% |
| | | |
Class R (Legacy RiverSource funds) | | up to 0.50% | | up to 0.25% | | 0.50%(e) |
| | | |
Class R3 | | 0.25% | | 0.25%(f) | | 0.50%(f) |
| | | |
Class R4 | | none | | 0.25%(f) | | 0.25%(f) |
| | | |
Class R5 | | none | | None | | none |
| | | |
Class T | | none | | 0.50%(g) | | 0.50%(g) |
| | | |
Class W | | up to 0.25% | | up to 0.25% | | 0.25%(c) |
| | | |
Class Y | | none | | none | | none |
| | | |
Class Z | | none | | none | | none |
C-21
| (a) | As shown in the table below, the maximum distribution and service fees of Class A shares varies among the Funds, as follows: |
| | | | | | |
Funds | | Maximum Class A Distribution Fee | | Maximum Class A Service Fee | | Maximum Class A Combined Total |
| Legacy RiverSource funds (other than Columbia Money Market Fund) | | Up to 0.25% | | Up to 0.25% | | 0.25% |
| | | |
| Columbia Money Market Fund | | — | | — | | 0.10% |
| | | |
| Columbia Asset Allocation Fund, Columbia Balanced Fund, Columbia Conservative High Yield Fund, Columbia Contrarian Core Fund, Columbia Disciplined Value Fund, Columbia Dividend Income Fund, Columbia Large Cap Growth Fund, Columbia Mid Cap Growth Fund, Columbia Oregon Intermediate Municipal Bond Fund, Columbia Intermediate Bond Fund, Columbia Real Estate Equity Fund, Columbia Small Cap Core Fund, Columbia Small Cap Growth Fund I, Columbia Technology Fund | | up to 0.10% | | up to 0.25% | | up to 0.35%; these Funds may pay distribution and service fees up to a maximum of 0.35% of the their average daily net assets attributable to Class A shares (comprised of up to 0.10% for distribution services and up to 0.25% for shareholder liaison services) but currently limit such fees to an aggregate fee of not more than 0.25% for Class A shares. |
| | | |
| Columbia Blended Equity Fund, Columbia Bond Fund, Columbia California Tax-Exempt Fund, Columbia Connecticut Intermediate Municipal Bond Fund, Columbia Connecticut Tax-Exempt Fund, Columbia Core Bond Fund, Columbia Corporate Income Fund, Columbia Emerging Markets Fund, Columbia Federal Securities Fund, Columbia Greater China Fund, Columbia High Yield Opportunity Fund, Columbia Liberty Fund, Columbia Energy and Natural Resources Fund, Columbia International Bond Fund, Columbia International Growth Fund, Columbia International Stock Fund, Columbia Massachusetts Intermediate Municipal Bond Fund, Columbia Mid Cap Core Fund, Columbia Small Cap Value Fund I, Columbia Strategic Investor Fund, Columbia Massachusetts Tax-Exempt Fund, Columbia New Jersey Intermediate Municipal Bond Fund, Columbia New York Intermediate Municipal Bond Fund, Columbia New York Tax-Exempt Fund, Columbia Pacific/Asia Fund, Columbia Rhode Island Intermediate Municipal Bond Fund, Columbia Select Large Cap Growth Fund, Columbia Select Opportunities Fund, Columbia Select Small Cap Fund, Columbia Short-Intermediate Bond Fund, Columbia Strategic Income Fund, Columbia U.S. Treasury Index Fund, Columbia Value and Restructuring Fund, Columbia World Equity Fund | | — | | 0.25% | | 0.25% |
| | | |
| Columbia High Yield Municipal Fund, Columbia Intermediate Municipal Bond Fund, Columbia Tax Exempt Fund | | — | | 0.20% | | 0.20% |
C-22
| | | | | | |
Funds | | Maximum Class A Distribution Fee | | Maximum Class A Service Fee | | Maximum Class A Combined Total |
| Columbia Asset Allocation Fund II, Columbia California Intermediate Municipal Bond Fund, Columbia Convertible Securities Fund, Columbia Georgia Intermediate Municipal Bond Fund, Columbia Global Value Fund, Columbia High Income Fund, Columbia International Value Fund, Columbia Large Cap Core Fund, Columbia Marsico Focused Equities Fund, Columbia Marsico Global Fund, Columbia Maryland Intermediate Municipal Bond Fund, Columbia North Carolina Intermediate Municipal Bond Fund, Columbia Short Term Bond Fund, Columbia Short Term Municipal Bond Fund, Columbia Small Cap Growth Fund II, Columbia South Carolina Intermediate Municipal Bond Fund, Columbia Total Return Bond Fund, Columbia Virginia Intermediate Municipal Bond Fund, Columbia Large Cap Value Fund, Columbia LifeGoal® Balanced Growth Portfolio, Columbia LifeGoal® Growth Portfolio, Columbia LifeGoal® Income and Growth Portfolio, Columbia LifeGoal® Income Portfolio, Columbia Marsico 21st Century Fund, Columbia Marsico Growth Fund, Columbia Marsico International Opportunities Fund, Columbia Mid Cap Value Fund, Columbia Multi-Advisor International Equity Fund, Columbia Masters International Equity Portfolio, Columbia Small Cap Value Fund II, Columbia Large Cap Enhanced Core Fund, Columbia Large Cap Index Fund, Columbia Mid Cap Index Fund, Columbia Small Cap Index Fund, Columbia Overseas Value Fund | | — | | — | | 0.25%; these Funds pay a combined distribution and service fee pursuant to their combined distribution and shareholder servicing plan for Class A shares. |
| (b) | The service fees for Class A shares, Class B shares and Class C shares of certain Funds depend on when the shares were purchased, as described below. |
Service Fee for Class A shares and Class B shares of Columbia California Tax-Exempt Fund, Columbia Connecticut Tax-Exempt Fund, Columbia Massachusetts Tax-Exempt Fund and Columbia New York Tax-Exempt Fund – The annual service fee may equal up to 0.10% on net assets attributable to shares of these Funds issued prior to December 1, 1994 and 0.25% on net assets attributable to Fund shares issued thereafter. This arrangement results in a rate of service fee for Fund shares that is a blend between the 0.10% and 0.25% rates. For the fiscal year ended October 31, 2009, the blended service fee was 0.24% of the Fund’s average net assets for each of these Funds, other than Columbia Massachusetts Tax-Exempt Fund, which had a blended service fee of 0.23%.
Service Fee for Class A shares, Class B shares and Class C shares of Columbia Liberty Fund – The annual service fee may equal up to 0.15% on net assets attributable to shares of this Fund issued prior to April 1, 1989 and 0.25% on net assets attributable to shares issued thereafter. This arrangement results in a rate of service fee for all shares that is a blend between the 0.15% and 0.25% rates. For the fiscal year ended September 30, 2009, the blended service fee was 0.24% of the Fund’s average daily net assets.
Service Fee for Class A shares, Class B shares and Class C shares of Columbia Strategic Income Fund – The annual service fee may equal up to 0.15% on net assets attributable to shares of this Fund issued prior to January 1, 1993 and 0.25% on net assets attributable to shares issued thereafter. This arrangement results in a rate of service fee for all Fund shares that is a blend between the 0.15% and 0.25% rates. For the fiscal year ended May 31, 2010, the blended service fee was 0.25% of the Fund’s average net assets.
Service Fee for Class A shares, Class B shares and Class C shares of Columbia High Yield Municipal Fund, Columbia Intermediate Municipal Bond Fund and Columbia Tax-Exempt Fund – The annual service fee may equal up to 0.20% of the average daily net asset value of all shares of such Fund class.
Distribution Fee for Class B shares and Class C shares for Columbia Intermediate Municipal Bond Fund – The annual distribution fee shall be 0.65% of the average daily net assets of the Fund’s Class B shares and Class C shares. Fee amounts noted apply to Class B shares of the Funds other than Class B shares of Columbia Money Market Fund, which pay distribution fees of up to 0.75% and service fees of up to 0.10%, for a combined total of 0.85%.
| (c) | Fee amounts noted apply to all Funds other than Columbia Money Market Fund (formerly RiverSource Cash Management Fund), which, for each of Class A and Class W shares, pays distribution and service fees of 0.10%, and for Class C shares pays distribution fees of 0.75%. The Distributor has voluntarily agreed, effective April 15, 2010, to waive the 12b-1 fees it receives from Class A, Class C, Class R (formerly Class R2) and Class W shares of Columbia Money Market Fund and from Class A, Class C and Class R (formerly Class R2) shares of Columbia Government Money Market Fund. Compensation paid to broker-dealers and other financial intermediaries may be suspended to the extent of the Distributor’s waiver of the 12b-1 fees on these specific share classes of these Funds. |
| (d) | The Distributor has voluntarily agreed to waive a portion of the distribution fee for Class C shares of the following Funds so that the combined distribution and service fee (or the distribution fee for Columbia California Tax-Exempt Fund, Columbia Connecticut Tax-Exempt Fund, Columbia Massachusetts Tax-Exempt Fund and Columbia New York Tax-Exempt Fund) does not exceed the specified percentage annually: 0.40% for Columbia Intermediate Municipal Bond Fund; 0.45% for Columbia California Tax-Exempt Fund, Columbia Connecticut Tax-Exempt Fund, Columbia Massachusetts Tax-Exempt Fund and Columbia New York Tax-Exempt Fund; 0.56% for Columbia Short Term Bond Fund; 0.65% for Columbia Connecticut Intermediate Municipal Bond Fund, Columbia Massachusetts Intermediate Municipal Bond Fund, Columbia New Jersey Intermediate Municipal Bond Fund, Columbia New York Intermediate Municipal Bond Fund, Columbia Oregon Intermediate Municipal Bond Fund and Columbia Rhode Island Intermediate Municipal Bond Fund; 0.80% for Columbia High Yield Municipal Fund and Columbia Tax-Exempt Fund; 0.85% for Columbia Conservative High Yield |
C-23
| | Fund, Columbia Core Bond Fund, Columbia Corporate Income Fund, Columbia Federal Securities Fund, Columbia High Yield Opportunity Fund, Columbia Intermediate Bond Fund, Columbia Strategic Income Fund and Columbia U.S. Treasury Index Fund. These arrangements may be modified or terminated by the Distributor at any time. |
| (e) | Class R shares of Legacy Columbia funds pay a distribution fee pursuant to a distribution (Rule 12b-1) plan for Class R shares. The Legacy Columbia funds do not have a shareholder service plan for Class R shares. The Legacy RiverSource funds have a distribution and shareholder service plan for Class R shares, which, prior to the close of business on September 3, 2010, were known as Class R2 shares. For Legacy RiverSource fund Class R shares, the maximum fee under the plan reimbursed for distribution expenses is equal on an annual basis to 0.50% of the average daily net assets of the Fund attributable to Class R shares. Of that amount, up to 0.25% may be reimbursed for shareholder service expenses. |
| (f) | The shareholder service fees for Class R3 and Class R4 shares are not paid pursuant to a 12b-1 plan. Under a plan administration services agreement, the Funds’ Class R3 and Class R4 shares pay for plan administration services, including services such as implementation and conversion services, account set-up and maintenance, reconciliation and account recordkeeping, education services and administration to various plan types, including 529 plans, retirement plans and health savings accounts. |
| (g) | The shareholder servicing fees for Class T shares are up to 0.50% of average daily net assets attributable to Class T shares for equity Funds (including Columbia Asset Allocation Fund) and 0.40% for fixed income Funds. The Funds currently limit such fees to a maximum of 0.30% for equity Funds and 0.15% for fixed-income Funds other than Columbia Rhode Island Intermediate Municipal Bond Fund, for which the limit currently is 0.00%. See Class T Shareholder Service Fees below for more information. |
The distribution and/or shareholder service fees for Class A, Class B, Class C, Class E, Class F, Class R and Class W shares, as applicable, are subject to the requirements of Rule 12b-1 under the 1940 Act, and are used by the Distributor to make payments, or to reimburse the Distributor for certain expenses it incurs, in connection with distributing the Fund’s shares and directly or indirectly providing services to Fund shareholders. These payments or expenses include providing distribution and/or shareholder service fees to selling and/or servicing agents that sell shares of the Fund or provide services to Fund shareholders. The Distributor may retain these fees otherwise payable to selling and/or servicing agents if the amounts due are below an amount determined by the Distributor in its discretion.
For Legacy RiverSource fund Class A, Class B and Class W shares, the Distributor begins to pay these fees immediately after purchase. For Legacy RiverSource fund Class C shares, the Distributor pays these fees in advance for the first 12 months. Selling and/or servicing agents also receive distribution fees up to 0.75% of the average daily net assets of Legacy RiverSource fund Class C shares sold and held through them, which the Distributor begins to pay 12 months after purchase. For Legacy RiverSource fund Class B shares, and, for the first 12 months following the sale of Legacy RiverSource fund Class C shares, the Distributor retains the distribution fee of up to 0.75% in order to finance the payment of sales commissions to selling and/or servicing agents, and to pay for other distribution related expenses. Selling and/or servicing agents may compensate their financial advisors with the shareholder service and distribution fees paid to them by the Distributor.
For Legacy Columbia fund Class E, Class R shares and, with the exception noted in the next sentence, Class A shares, the Distributor begins to pay these fees immediately after purchase. For Legacy Columbia fund Class B, Class F, Class A (if purchased as part of a purchase of shares of $1 million or more) and, with the exception noted in the next sentence, Class C shares, the Distributor begins to pay these fees 12 months after purchase (for Columbia fund Class B and Class F shares, and, for the first 12 months following the sale of Columbia Class C shares, the Distributor retains the distribution fee of up to 0.75% in order to finance the payment of sales commissions to selling and/or servicing agents, and to pay for other distribution related expenses). For Legacy Columbia fund Class C shares, selling and/or servicing agents may opt to decline payment of sales commission and, instead, may receive these fees immediately after purchase. Selling and/or servicing agents may compensate their financial advisors with the shareholder service and distribution fees paid to them by the Distributor.
If you maintain shares of the Fund directly with the Fund, without working directly with a financial advisor or selling and/or servicing agent, distribution and service fees may be retained by the Distributor as payment or reimbursement for incurring certain distribution and shareholder service related expenses.
Over time, these distribution and/or shareholder service fees will reduce the return on your investment and may cost you more than paying other types of sales charges. The Fund will pay these fees to the Distributor and/or to eligible selling and/or servicing agents for as long as the distribution and/or shareholder servicing plans continue in effect. The Fund may reduce or discontinue payments at any time. Your selling and/or servicing agent may also charge you other additional fees for providing services to your account, which may be different from those described here.
Class T Shareholder Service Fees
The Funds that offer Class T shares have adopted a shareholder servicing plan that permits them to pay for certain services provided to Class T shareholders by their selling and/or servicing agents. Equity Funds (including
C-24
Columbia Asset Allocation Fund) may pay shareholder servicing fees up to an aggregate annual rate of 0.50% of the Fund’s average daily net assets attributable to Class T shares (comprised of up to 0.25% for shareholder liaison services and up to 0.25% for administrative support services), but such fees will not exceed the Fund’s net investment income attributable to Class T shares. These fees are currently limited to an aggregate annual rate of not more than 0.30% of the Fund’s average daily net assets attributable to Class T shares for shareholder liaison services and administrative support services. Fixed income Funds may pay shareholder service fees up to an aggregate annual rate of 0.40% of the Fund’s average daily net assets attributable to Class T shares (comprised of an annual rate of up to 0.20% for shareholder liaison services and up to 0.20% for administrative support services), but such fees will not exceed the Fund’s net investment income attributable to Class T shares. These fees are currently limited to an aggregate annual rate of not more than 0.15% of the Fund’s average daily net assets attributable to Class T shares for shareholder liaison services and administrative support services, other than Columbia Rhode Island Intermediate Municipal Bond Fund, for which the limit currently is 0.00%.
Class R3 and Class R4 Shares Plan Administration Fee
Class R3 and Class R4 shares pay an annual plan administration services fee for the provision of various administrative, recordkeeping, communication and educational services. The fee for Class R3 and Class R4 shares is equal on an annual basis to 0.25% of average daily net assets attributable to the class.
Selling and/or Servicing Agent Compensation
The Distributor and the investment manager make payments, from their own resources, to selling and/or servicing agents, including other Ameriprise Financial affiliates, for marketing/sales support services relating to the Funds. Such payments are generally based upon one or more of the following factors: average net assets of the Funds sold by the Distributor attributable to that intermediary, gross sales of the Funds distributed by the Distributor attributable to that intermediary, reimbursement of ticket charges (fees that a selling and/or servicing agent charges its representatives for effecting transactions in Fund shares) or a negotiated lump sum payment. While the financial arrangements may vary for each intermediary, the support payments to any one intermediary are generally between 0.05% and 0.50% on an annual basis for payments based on average net assets of the Fund attributable to the intermediary, and between 0.05% and 0.25% on an annual basis for firms receiving a payment based on gross sales of the Funds attributable to the intermediary.
The Distributor and the investment manager may make payments in larger amounts or on a basis other than those described above when dealing with certain selling and/or servicing agents, including certain affiliates of Bank of America Corporation (Bank of America). Such increased payments may enable such selling and/or servicing agents to offset credits that they may provide to customers.
The Distributor, the Transfer Agent and the investment manager may also make payments to financial intermediaries, including other Ameriprise Financial affiliates, that provide shareholder services to retirement plans and other investment programs to compensate those selling and/or servicing agents for services they provide to such programs, including, but not limited to, sub-accounting, sub-transfer agency, similar shareholder or participant recordkeeping, shareholder or participant reporting, or shareholder or participant transaction processing.
These payments for shareholder servicing support vary by selling and/or servicing agent but generally are not expected, with certain limited exceptions, to exceed 0.40% of the average aggregate value of the Fund’s shares in any intermediary’s program on an annual basis for those classes of shares that pay a service fee pursuant to a plan under Rule 12b-1 under the 1940 Act, and 0.45% of the average aggregate value of the Fund’s shares in any intermediary’s program on an annual basis for those classes of shares that do not pay a service fee pursuant to a plan under Rule 12b-1 under the 1940 Act.
For all classes other than Class Y shares, the Funds may reimburse the Transfer Agent for amounts paid to selling and/or servicing agents that maintain assets in omnibus accounts, subject to an annual cap that varies among Funds. Generally, the annual cap for each Fund (other than the Columbia Acorn funds) is 0.20% of the average aggregate value of the Fund’s shares maintained in each such account for selling and/or servicing agents that seek payment by the Transfer Agent based on a percentage of net assets. Please see the Merger SAI for additional information. The annual cap for Columbia Acorn funds is 0.05% of the average aggregate value of the Fund’s shares maintained in such accounts. The amounts in excess of that reimbursed by the Fund are borne by the Distributor or the investment manager. The Distributor and the investment manager may make other payments or allow promotional incentives to broker/dealers to the extent permitted by SEC and Financial Industry Regulatory Authority (FINRA) rules and by other applicable laws and regulations.
C-25
Amounts paid by the Distributor and the investment manager and their affiliates are paid out of the Distributor’s and the investment manager’s own resources and do not increase the amount paid by you or the Fund. You can find further details in the Merger SAI about the payments made by the Distributor and the investment manager and their affiliates, as well as a list of the selling and/or servicing agents, including Ameriprise Financial affiliates, to which the Distributor and the investment manager have agreed to make marketing support payments. Your selling and/or servicing agent may charge you fees and commissions in addition to those described herein. You should consult with your selling and/or servicing agent and review carefully any disclosure your selling and/or servicing agent provides regarding its services and compensation. Depending on the financial arrangement in place at any particular time, a selling and/or servicing agent and its financial advisors may have a financial incentive for recommending the Fund or a particular share class over others.
Buying, Selling and Exchanging Shares
Share Price Determination
The price you pay or receive when you buy, sell or exchange shares is the Fund’s next determined net asset value (or NAV) per share for a given share class. The Fund calculates the net asset value per share for each class of the Fund at the end of each business day.
|
| |
FUNDamentalsTM |
NAV Calculation Each of the Fund’s share classes calculates its NAV per share as follows: (Value of assets of the share class) NAV – (Liabilities of the share class) = Number of outstanding shares of the class |
|
FUNDamentalsTM Business Days A business day is any day that the New York Stock Exchange (NYSE) is open. A business day ends at the close of regular trading on the NYSE, usually at 4:00 p.m. Eastern time. If the NYSE closes early, the business day ends as of the time the NYSE closes. On holidays and other days when the NYSE is closed, the Fund’s net asset value is not calculated and the Fund does not accept buy or sell orders. However, the value of the Fund’s assets may still change on days that the NYSE is closed, including to the extent that the Fund holds foreign securities that trade on days that foreign securities markets are open. |
The value of the Fund’s shares is based on the total market value of all of the securities and other assets that it holds as of a specified time. The prices reported on stock exchanges and other securities markets around the world are usually used to value securities in the Fund. The Fund uses the amortized cost method, which approximates market value, to value short-term investments maturing in 60 days or less. For a Fund organized as a fund-of-funds, the assets will consist primarily of shares of the underlying funds, which are valued at their NAVs.
If a market price isn’t readily available, the Fund will determine the price of the security held by the Fund based on the investment manager’s determination of the security’s fair value. A market price is considered not readily available if, among other circumstances, the most recent reported price is deemed unreliable. In addition, the Fund may use fair valuation to price securities that trade on a foreign exchange when a significant event has occurred after the foreign exchange closes but before the time at which the Fund’s share price is calculated. Foreign exchanges typically close before the time at which Fund share prices are calculated, and may be closed altogether on some days when the Fund is open. Such significant events affecting a foreign security may include, but are not limited to: (1) those impacting a single issuer; (2) governmental action that affects securities in one sector or country; (3) natural disasters or armed conflicts affecting a country or region; or (4) significant domestic or foreign market fluctuations. The Fund uses various criteria, including an evaluation of U.S. market moves after the close of foreign markets, in determining whether a security’s market price is readily available and, if not, the fair value of the security.
C-26
Fair valuation may have the effect of reducing stale pricing arbitrage opportunities presented by the pricing of Fund shares. However, when the Fund uses fair valuation to price securities, it may value those securities higher or lower than another fund would have priced the security. Also, the use of fair valuation may cause the Fund’s performance to diverge to a greater degree from the performance of various benchmarks used to compare the Fund’s performance because benchmarks generally do not use fair valuation techniques. Because of the judgment involved in fair valuation decisions, there can be no assurance that the value ascribed to a particular security is accurate. The Fund has retained one or more independent fair valuation pricing services to assist in the fair valuation process for foreign securities. International markets are sometimes open on days when U.S. markets are closed, which means that the value of foreign securities owned by the Fund could change on days when Fund shares cannot be bought or sold.
For money market Funds, the Fund’s investments are valued at amortized cost, which approximates market value.
Transaction Rules and Policies
Remember that sales charges may apply to your transactions. You should also ask your selling and/or servicing agent about its rules, fees and policies for buying, selling and exchanging shares, which may be different from those described here, and about its related programs or services.
Also remember that the Fund may refuse any order to buy or exchange shares. If this happens, the Fund will return any money it received, but no interest will be paid on that money.
Order Processing
Orders to buy, sell or exchange Fund shares are processed on business days. Depending upon the class of shares, orders can be delivered by mail, by telephone or online. Orders received in “good form” by the Transfer Agent or your selling and/or servicing agent before the end of a business day are priced at the Fund’s net asset value per share on that day. Orders received after the end of a business day will receive the next business day’s net asset value per share. The market value of the Fund’s investments may change between the time you submit your order and the time the Fund next calculates its net asset value per share. The business day that applies to your order is also called the trade date.
“Good Form”
An order is in “good form” if the Transfer Agent or your selling and/or servicing agent has all of the information and documentation it deems necessary to effect your order. For example, when you sell shares by letter of instruction, “good form” means that your letter has (i) complete instructions and the signatures of all account owners, (ii) a Medallion Signature Guarantee (as described below) for amounts greater than $100,000 and (iii) any other required documents completed and attached. For the documents required for sales by corporations, agents, fiduciaries, surviving joint owners and other legal entities, call 800.345.6611.
Medallion Signature Guarantees
A Medallion Signature Guarantee helps assure that a signature is genuine and not a forgery. The selling and/or servicing agent providing the Medallion Signature Guarantee is financially liable for the transaction if the signature is a forgery.
Qualified customers can obtain a Medallion Signature Guarantee from any financial institution – including commercial banks, credit unions and broker/dealers – that participates in one of the three Medallion Signature Guarantee programs recognized by the Securities and Exchange Commission. These Medallion Signature Guarantee programs are the Securities Transfer Agents Medallion Program (STAMP), the Stock Exchanges Medallion Program (SEMP) and the New York Stock Exchange Medallion Signature Program (MSP). Please note that a guarantee from a notary public is not acceptable.
A Medallion Signature Guarantee is required if:
| | • | | The amount is greater than $100,000. |
| | • | | You want your check made payable to someone other than the registered account owner(s). |
| | • | | Your address of record has changed within the last 30 days. |
| | • | | You want the check mailed to an address other than the address of record. |
| | • | | You want the proceeds sent to a bank account not on file. |
| | • | | You are the beneficiary of the account and the account owner is deceased (additional documents may be required). |
C-27
Written Transactions
Once you have an account, you can communicate written buy, sell and exchange orders to the Transfer Agent at The Funds, c/o Columbia Management Investment Services Corp at the following address (regular mail) P.O. Box 8081, Boston, MA 02266-8081 and (express mail) 30 Dan Road, Canton, MA 02021-2809.
Telephone Transactions
For Class A, Class B, Class C, Class R, Class T, Class Y and Class Z shareholders, once you have an account, you may place orders to buy, sell or exchange shares by telephone. To place orders by telephone, call 800.422.3737. Have your account number and social security number (SSN) or taxpayer identification number (TIN) available when calling.
You can sell up to and including an aggregate of $100,000 of shares via the telephone per day, per Fund, if you qualify for telephone orders. Wire redemptions requested via the telephone are subject to a maximum of $3 million of shares per day, per Fund. You can buy up to and including $100,000 of shares per day, per Fund through your bank account as an Automated Clearing House (ACH) transaction via the telephone if you qualify for telephone orders.
Telephone orders may not be as secure as written orders. The Funds will take reasonable steps to confirm that telephone instructions are genuine. For example, we require proof of your identification before we will act on instructions received by telephone and may record telephone conversations. However, the Fund and its agents will not be responsible for any losses, costs or expenses resulting from an unauthorized telephone instruction when reasonable steps have been taken to confirm that telephone instructions are genuine. Telephone orders may be difficult to complete during periods of significant economic or market change or business interruption.
Online Transactions
Once Class A, Class B, Class C, Class R, Class T, Class Y and Class Z shareholders have an account, they may contact the Transfer Agent at 800.345.6611 for more information on account trading restrictions and the special sign-up procedures required for online transactions. The Transfer Agent has procedures in place to authenticate electronic orders you deliver through the internet. You will be required to accept the terms of an online agreement and to establish and utilize a password in order to access online account services.
You can sell up to and including an aggregate of $100,000 of shares per day, per Fund account through the internet if you qualify for internet orders.
Customer Identification Program
U.S. Federal law requires the Fund to obtain and record specific personal information to verify your identity when you open an account. This information may include your name, address, date of birth (for individuals) and taxpayer or other government issued identification (e.g., SSN or TIN). If you fail to provide the requested information, the Fund may need to delay the date of your purchase or may be unable to open your account, which may result in a return of your investment monies. In addition, if the Fund is unable to verify your identity after your account is open, the Fund reserves the right to close your account or take other steps as deemed reasonable. The Fund will not be liable for any loss resulting from any purchase delay, application rejection or account closure due to a failure to provide proper identifying information.
Small Account Policy – Class A, B, C, T and Z Share Accounts Below $250
The Funds generally will automatically sell your shares if the value of your Fund account (treating each account of the Fund you own separately from any other account of the Fund you may own) falls below $250. If your shares are sold, the Transfer Agent will remit the sale proceeds to you. Any otherwise applicable CDSC will not be imposed on such an automatic sale of your shares. The Transfer Agent will send you written notification in advance of any automatic sale, which will provide details on how you may avoid such an automatic sale. Generally, you may avoid such an automatic sale by raising your account balance, consolidating your accounts through an exchange of shares of another Fund in which you hold shares, or setting up a Systematic Investment Plan. For more information, contact the Transfer Agent or your selling and/or servicing agent. The Transfer Agent’s contact information (toll-free number and mailing address) as well as the Funds’ website address can be found at the beginning of the section Choosing a Share Class.
C-28
The Fund may also sell your Fund shares if your selling and/or servicing agent tells us to sell your shares pursuant to arrangements made with you, and under certain other circumstances allowed under the 1940 Act.
Small Account Policy – Class A, B, C, T and Z Share Accounts Minimum Balance Fee
If the value of your Fund account (treating each account of the Fund you own separately from any other account of the Fund you may own) falls below the minimum initial investment requirement applicable to you for any reason, including as a result of market decline, your account generally will be subject to a $20 annual fee. This fee will be assessed through the automatic sale of Fund shares in your account. Any otherwise applicable CDSC will not be imposed on such an automatic sale of your shares. The Transfer Agent will reduce the expenses paid by the Fund by any amounts it collects from the assessment of this fee. For Funds that do not have transfer agency expenses against which to offset the amount collected through assessment of this fee, the fee will be paid directly to the Fund. The Transfer Agent will send you written notification in advance of assessing any fee, which will provide details on how you can avoid the imposition of such fee. Generally, you may avoid the imposition of such fee by raising your Fund account balance, consolidating your Fund accounts through an exchange of shares of another Fund in which you hold shares, or setting up a Systematic Investment Plan. For more information, contact the Transfer Agent or your selling and/or servicing agent. The Transfer Agent’s contact information (toll-free number and mailing address) as well as the Funds’ website address can be found at the beginning of the section Choosing a Share Class.
Each Fund reserves the right to change its minimum investment requirements. The Funds also reserve the right to lower the account size trigger point for the minimum balance fee in any year or for any class of shares when we believe it is appropriate to do so in light of declines in the market value of Fund shares, sales loads applicable to a particular class of shares, or for other reasons.
Exceptions to the Small Account Policy (Accounts Below $250 and Minimum Balance Fee)
The automatic sale of Fund shares of accounts under $250 and the annual minimum balance fee described above do not apply to shareholders of Class E, Class F, Class R, Class R3, Class R4, Class R5, Class Y or Class W shares; shareholders holding their shares through broker/dealer networked accounts; wrap fee and omnibus accounts; accounts with active Systematic Investment Plans; certain qualified retirement plans; and health savings accounts. The automatic sale of Fund shares of accounts under $250 does not apply to individual retirement plans.
Small Account Policy – Broker/Dealer and Wrap Fee Accounts
The Funds may automatically redeem at any time broker/dealer networked accounts and wrap fee accounts that have account balances of $20 or less or have less than one share.
Cash Flows
The timing and magnitude of cash inflows from investors buying Fund shares could prevent the Fund from always being fully invested. Conversely, the timing and magnitude of cash outflows to investors redeeming Fund shares could require large ready reserves of uninvested cash to meet shareholder redemptions. Either situation could adversely impact the Fund’s performance.
Information Sharing Agreements
As required by Rule 22c-2 under the 1940 Act, the Funds or certain of their service providers will enter into information sharing agreements with selling and/or servicing agents, including participating life insurance companies and financial intermediaries that sponsor or offer retirement plans through which shares of the Funds are made available for purchase. Pursuant to Rule 22c-2, selling and/or servicing agents are required, upon request, to: (i) provide shareholder account and transaction information and (ii) execute instructions from the Fund to restrict or prohibit further purchases of Fund shares by shareholders who have been identified by the Fund as having engaged in transactions that violate the Fund’s excessive trading policies and procedures. See Buying, Selling and Exchanging Shares – Excessive Trading Practices for more information.
Excessive Trading Practices Policy of Non-Money Market Funds
Right to Reject or Restrict Share Transaction Orders — The Fund is intended for investors with long-term investment purposes and is not intended as a vehicle for frequent trading activity (market timing) that is excessive. Investors should transact in Fund shares primarily for investment purposes. The Board has adopted excessive trading policies and procedures that are designed to deter excessive trading by investors (the Excessive Trading Policies and Procedures). The Fund discourages and does not accommodate excessive trading.
The Fund reserves the right to reject, without any prior notice, any buy or exchange order for any reason, and will not be liable for any loss resulting from rejected orders. For example, the Fund may in its discretion restrict or reject a buy or exchange order even if the transaction is not subject to the specific exchange limitation described below if
C-29
the Fund or its agents determine that accepting the order could interfere with efficient management of the Fund’s portfolio or is otherwise contrary to the Fund’s best interests. The Excessive Trading Policies and Procedures apply equally to buy or exchange transactions communicated directly to the Transfer Agent and to those received by selling and/or servicing agents.
Specific Buying and Exchanging Limitations — If a Fund detects that an investor has made two “material round trips” in any 28-day period, it will generally reject the investor’s future buy orders, including exchange buy orders, involving any Fund.
For these purposes, a “round trip” is a purchase or exchange into the Fund followed by a sale or exchange out of the Fund, or a sale or exchange out of the Fund followed by a purchase or exchange into the Fund. A “material” round trip is one that is deemed by the Fund to be material in terms of its amount or its potential detrimental impact on the Fund. Independent of this limit, the Fund may, in its discretion, reject future buy orders by any person, group or account that appears to have engaged in any type of excessive trading activity.
These limits generally do not apply to automated transactions or transactions by registered investment companies that invest in the Fund using a “fund-of-funds” structure. These limits do not apply to payroll deduction contributions by retirement plan participants, transactions initiated by a retirement plan sponsor or certain other retirement plan transactions consisting of rollover transactions, loan repayments and disbursements, and required minimum distribution redemptions. They may be modified or rescinded for accounts held by certain retirement plans to conform to plan limits, for considerations relating to the Employee Retirement Income Security Act of 1974 or regulations of the Department of Labor, and for certain asset allocation or wrap programs. Accounts known to be under common ownership or control generally will be counted together, but accounts maintained or managed by a common intermediary generally will not be considered to be under common ownership or control. The Fund retains the right to modify these restrictions at any time without prior notice to shareholders.
Limitations on the Ability to Detect and Prevent Excessive Trading Practices — The Fund takes various steps designed to detect and prevent excessive trading, including daily review of available shareholder transaction information. However, the Fund receives buy, sell and exchange orders through selling and/or servicing agents, and cannot always know of or reasonably detect excessive trading that may be facilitated by selling and/or servicing agents or by the use of the omnibus account arrangements they offer. Omnibus account arrangements are common forms of holding shares of mutual funds, particularly among certain selling and/or servicing agents such as broker/dealers, retirement plans and variable insurance products. These arrangements often permit selling and/or servicing agents to aggregate their clients’ transactions and accounts, and in these circumstances, the identity of the shareholders is often not known to the Fund.
Some selling and/or servicing agents apply their own restrictions or policies to underlying investor accounts, which may be more or less restrictive than those described here. This may impact the Fund’s ability to curtail excessive trading, even where it is identified. For these and other reasons, it is possible that excessive trading may occur despite the Fund’s efforts to detect and prevent it.
Although these restrictions and policies involve judgments that are inherently subjective and may involve some selectivity in their application, the Fund seeks to act in a manner that it believes is consistent with the best interests of shareholders in making any such judgments.
Risks of Excessive Trading — Excessive trading creates certain risks to the Fund’s long-term shareholders and may create the following adverse effects:
| | • | | negative impact on the Fund’s performance; |
| | • | | potential dilution of the value of the Fund’s shares; |
| | • | | interference with the efficient management of the Fund’s portfolio, such as the need to maintain undesirably large cash positions, the need to use its line of credit or the need to buy or sell securities it otherwise would not have bought or sold; |
| | • | | losses on the sale of investments resulting from the need to sell securities at less favorable prices; |
| | • | | increased taxable gains to the Fund’s remaining shareholders resulting from the need to sell securities to meet sell orders; and |
| | • | | increased brokerage and administrative costs. |
To the extent that the Fund invests significantly in foreign securities traded on markets that close before the Fund’s valuation time, it may be particularly susceptible to dilution as a result of excessive trading. Because events may
C-30
occur after the close of foreign markets and before the Fund’s valuation time that influence the value of foreign securities, investors may seek to trade Fund shares in an effort to benefit from their understanding of the value of foreign securities as of the Fund’s valuation time. This is often referred to as price arbitrage. The Fund has adopted procedures designed to adjust closing market prices of foreign securities under certain circumstances to reflect what the Fund believes to be the fair value of those securities as of its valuation time. To the extent the adjustments don’t work fully, investors engaging in price arbitrage may cause dilution in the value of the Fund’s shares held by other shareholders.
Similarly, to the extent that the Fund invests significantly in thinly traded high-yield bonds (junk bonds) or equity securities of small-capitalization companies, because these securities are often traded infrequently, investors may seek to trade their shares in an effort to benefit from their understanding of the value of these securities. This is also a type of price arbitrage. Any such frequent trading strategies may interfere with efficient management of the Fund’s portfolio to a greater degree than would be the case for mutual funds that invest in highly liquid securities, in part because the Fund may have difficulty selling those portfolio securities at advantageous times or prices to satisfy large and/or frequent sell orders. Any successful price arbitrage may also cause dilution in the value of Fund shares held by other shareholders.
Excessive Trading Practices Policy of Money Market Funds
The money market Funds are designed to offer investors a liquid cash option that they may buy and sell as often as they wish. Accordingly, the Board has not adopted policies and procedures designed to discourage excessive or short-term trading of money market Fund shares. However, since frequent purchases and sales of money market Fund shares could in certain instances harm shareholders in various ways, including reducing the returns to long-term shareholders by increasing costs (such as spreads paid to dealers who trade money market instruments with the money market Funds) and disrupting portfolio management strategies, each of the money market Funds reserves the right, but has no obligation, to reject any purchase or exchange transaction at any time. Except as expressly described herein (such as minimum purchase amounts), the money market Funds have no limits on buy or exchange transactions. In addition, each of the money market Funds reserve the right to impose or modify restrictions on purchases, exchanges or trading of the Fund shares at any time.
Opening an Account and Placing Orders
We encourage you to consult with a financial advisor who can help you with your investment decisions and who can help you open an account. Once you have an account, you can buy, sell and exchange shares by contacting your financial advisor who will send your order to the Transfer Agent or your selling and/or servicing agent. As described in Buying, Selling and Exchanging Shares – Transaction Rules and Policies, once you have an account you can also communicate your orders directly to the Transfer Agent by mail, by telephone or online.
The Funds are available directly and through broker-dealers, banks and other selling and/or servicing agents or institutions, and through certain qualified and non-qualified plans, wrap fee products or other investment products sponsored by selling and/or servicing agents.
Not all selling and/or servicing agents offer the Funds and certain selling and/or servicing agents that offer the Funds may not offer all Funds on all investment platforms. Please consult with your financial advisor to determine the availability of the Funds. If you set up an account at a selling and/or servicing agent that does not have, and is unable to obtain, a selling agreement with the Distributor, you will not be able to transfer Fund holdings to that account. In that event, you must either maintain your Fund holdings with your current selling and/or servicing agent, find another selling and/or servicing agent with a selling agreement, or sell your Fund shares, paying any applicable CDSC. Please be aware that transactions in taxable accounts are taxable events and may result in income tax liability.
Selling and/or servicing agents that offer the Funds may charge you additional fees for the services they provide and they may have different policies not described herein. Some policy differences may include different minimum investment amounts, exchange privileges, Fund choices and cutoff times for investments. Additionally, recordkeeping, transaction processing and payments of distributions relating to your account may be performed by the selling and/or servicing agents through which your shares of the Fund are held. Since the Fund (and its service providers) may not have a record of your account transactions, you should always contact the financial advisor employed by the selling and/or servicing agent through which you purchased or at which you maintain your shares of the Fund to make changes to your account or to give instructions concerning your account, or to obtain information about your account. The Fund and its service providers, including the Distributor and the Transfer Agent, are not responsible for the failure of one of these financial intermediaries and/or its selling and/or servicing agents to carry out its obligations to its customers.
C-31
As stated above, you may establish and maintain your account with a selling and/or servicing agent authorized by the Distributor to sell fund shares or directly with the Fund. The Fund may engage selling and/or servicing agents to receive purchase orders and exchange (and sale) orders on its behalf. Accounts established directly with the Fund will be serviced by the Transfer Agent. The Funds, the Transfer Agent and the Distributor do not provide investment advice. The Funds encourage you to consult with a financial advisor who can help you with your investment decisions and who can help you open an account. Once you have an account, you can buy, sell and exchange shares by contacting your financial advisor who will send your order to the Transfer Agent or your selling and/or servicing agent. As described in Buying, Selling and Exchanging Shares – Transaction Rules and Policies, once you have an account you can also communicate your orders directly to the Transfer Agent.
Accounts established directly with the Fund
You or the financial advisor through which you buy shares may establish an account with the Fund. To do so, complete a Fund account application with your financial advisor or investment professional, and mail the account application to the address below. Account applications may be obtained at columbiamanagement.com or may be requested by calling 800.345.6611. Make your check payable to the Fund. You will be assessed a $15 fee for any checks rejected by your financial institution due to insufficient funds or other reasons. The Funds do not accept cash, credit card convenience checks, money orders, traveler’s checks, starter checks, third or fourth party checks, or other cash equivalents.
Mail your check and completed application to The Funds, c/o Columbia Management Investment Services Corp. (regular mail) P.O. Box 8081, Boston, MA 02266-8081 or (express mail) 30 Dan Road, Canton, MA 02021-2809. You may also use these addresses to request an exchange or redemption of Fund shares.
You will be sent a statement confirming your purchase and any subsequent transactions in your account. You will also be sent quarterly and annual statements detailing your transactions in the Fund and the other Funds you own under the same account number. Duplicate quarterly account statements for the current year and duplicate annual statements for the most recent prior calendar year will be sent to you free of charge. Copies of year-end statements for prior years are available for a fee. Please contact the Transfer Agent for more information.
Buying Shares
Eligible Investors
Class A and Class C Shares
Class A and Class C shares are available to the general public for investment. Once you have opened an account, you can buy Class A and Class C shares in a lump sum, through our Systematic Investment Plan, by dividend diversification, by wire or by electronic funds transfer. For money market Funds, new investments must be made in Class A, Class I (available as a new investment only to the Funds (i.e., Fund-of-Fund investment)), Class T, Class W or Class Z shares of the Fund, subject to eligibility. Class C and Class R of the money market Funds are available as a new investment only to investors in the Distributor’s proprietary 401(k) products, provided that such investor is eligible to invest in the Class and transacts directly with the Fund or the Transfer Agent through a third party administrator or third party recordkeeper. The money market Funds offer other classes of shares only to facilitate exchanges with other Funds offering these classes of shares.
Class B Shares Closed
The Funds no longer accept investments from new or existing investors in Class B shares, except for certain limited transactions involving existing investors in Class B shares as described in more detail below.
Additional Class B shares will be issued only to existing investors in Class B shares and only through the following two types of transactions (Qualifying Transactions):
| | • | | Dividends and/or capital gain distributions may continue to be reinvested in Class B shares of a Fund. |
| | • | | Shareholders invested in Class B shares of a Fund may exchange those shares for Class B shares of other Funds offering such shares. Certain exceptions apply, including that not all Funds may permit exchanges. |
Any initial purchase orders for the Fund’s Class B shares will be rejected (other than through a Qualifying Transaction that is an exchange transaction).
C-32
Unless contrary instructions are received in advance by the Fund, any purchase orders (except those submitted by a selling and/or servicing agent through the National Securities Clearing Corporation (NSCC) as described in more detail below) that are initial investments in Class B shares or that are orders for additional Class B shares of the Fund received from existing investors in Class B shares, including orders made through an active systematic investment plan, will automatically be invested in Class A shares of the Fund, without regard to the normal minimum initial investment requirement for Class A shares, but subject to the front-end sales charge that generally applies to Class A shares. For additional information about Class A shares, see Choosing a Share Class – Class A Shares – Front-end Sales Charges. Your selling and/or servicing agent may have different policies not described here, including a policy to reject purchase orders for a Fund’s Class B shares or to automatically invest the purchase amount in a money market fund. Please consult your selling and/or servicing agent to understand their policy.
Additional purchase orders for a Fund’s Class B shares by an existing Class B shareholder, submitted by such shareholder’s selling and/or servicing agent through the NSCC, will be rejected due to operational limitations of the NSCC. Investors should consult their selling and/or servicing agent if they wish to invest in the Fund by purchasing a share class of the Fund other than Class B shares.
Dividend and/or capital gain distributions from Class B shares of a Fund will not be automatically invested in Class B shares of another Fund. Unless contrary instructions are received in advance of the date of declaration, such dividend and/or capital gain distributions from Class B shares of a Fund will be reinvested in Class B shares of the same Fund that is making the distribution.
Class E and Class F Shares Closed
Class E and Class F shares are closed to new investors and new accounts. Shareholders who opened and funded an account with the Fund as of September 22, 2006 (including accounts once funded that subsequently reached a zero balance) (i) may continue to make additional purchases of Class E and Class F shares and (ii) will continue to have their dividend and capital gains distributions reinvested. These share classes are designed for investors who wish to make an irrevocable gift to a child, grandchild or other individual. Shares are held in an irrevocable trust until a specified date, at which time they pass to a beneficiary.
Class I Shares
Class I shares are currently only available to the Funds (i.e., Fund of Fund investments). Class I shares may be purchased, sold or exchanged only through the Distributor or an authorized selling and/or servicing agent. The Distributor, in its sole discretion, may accept investments in Class I shares from other institutional investors.
Class R Shares
Class R shares can only be bought through eligible health savings accounts sponsored by third party platforms, including those sponsored by Ameriprise Financial affiliates, and the following eligible retirement plans: 401(k) plans; 457 plans; employer-sponsored 403(b) plans; profit sharing and money purchase pension plans; defined benefit plans; and non-qualified deferred compensation plans. Class R shares are not available for investment through retail nonretirement accounts, traditional and Roth IRAs, Coverdell Education Savings Accounts, SEPs, SAR-SEPs, Simple IRAs, individual 403(b) plans or 529 tuition programs. Contact the Transfer Agent or your retirement plan or health savings account administrator for more information about investing in Class R shares. The Distributor, in its sole discretion, may accept investments in Class R shares from other institutional investors.
Class R3, Class R4 and Class R5 Shares
Class R3, Class R4 and Class R5 shares are closed to new investors and new accounts effective as of the close of business on December 31, 2010, subject to certain limited exceptions described below.
Shareholders who opened and funded a Class R3, Class R4 or Class R5 account with the Fund as of the close of business on December 31, 2010 (including accounts once funded that subsequently reached a zero balance) may continue to make additional purchases of these share classes. Plans may continue to make additional purchases of Fund shares and add new participants, and new plans sponsored by the same or an affiliated sponsor may invest in the Fund (and add new participants) if an initial plan so sponsored invested in the Fund as of December 31, 2010 (or has approved the Fund as an investment option as of December 31, 2010 and funds its initial account with the Fund prior to March 31, 2011) and holds Fund shares at the plan level.
In the event that an order to purchase Class R3, Class R4 or Class R5 shares is received by the Fund or the Transfer Agent after the close of business on December 31, 2010 (other than as described above) from a new investor or a new account that is not eligible to purchase shares, that order will be refused by the Fund and the Transfer Agent and any money that the Fund or the Transfer Agent received with the order will be returned to the investor or the selling and/or servicing agent, as appropriate, without interest.
C-33
Class R3, Class R4 and Class R5 shares are designed for qualified employee benefit plans, trust companies or similar institutions, charitable organizations that meet the definition in Section 501(c)(3) of the Internal Revenue Code, non-qualified deferred compensation plans whose participants are included in a qualified employee benefit plan described above, state sponsored college savings plans established under Section 529 of the Internal Revenue Code, and health savings accounts created pursuant to public law 108-173. Additionally, if approved by the Distributor, Class R5 shares are available to institutional or corporate accounts above a threshold established by the Distributor (currently $1 million per Fund or $10 million in all Funds) and bank trust departments. Class R3, Class R4 and R5 shares may be purchased, sold or exchanged only through the Distributor or an authorized selling and/or servicing agent. Class R3, Class R4 shares and Class R5 shares of the Fund may be exchanged for Class R3 shares, Class R4 shares and Class R5 shares, respectively, of another Fund.
Class T Shares Closed
Class T shares are available for purchase only to investors who received (and who have continuously held) Class T shares in connection with the merger of certain Galaxy funds into various Columbia funds (formerly named Liberty funds).
Class W Shares
Class W shares are available to investors purchasing through authorized investment programs managed by investment professionals, including discretionary managed account programs. Class W shares may be purchased, sold or exchanged only through the Distributor or an authorized selling and/or servicing agent. Shares originally purchased in a discretionary managed account may continue to be held in Class W outside of a discretionary managed account, but no additional Class W purchases may be made and no exchanges to Class W shares of another Fund may be made outside of a discretionary managed account. The Distributor, in its sole discretion, may accept investments in Class W shares from other institutional investors.
Class Y Shares
Class Y shares are available only to the following categories of eligible investors:
| | • | | Individual investors and institutional clients (endowments, foundations, defined benefit plans, etc.) who invest at least $1 million in Class Y shares of a single Fund; and |
| | • | | Group retirement plans (including 401(k) plans, 457 plans, employer-sponsored 403(b) plans, profit sharing and money purchase plans) with plan assets of at least $10 million. |
Currently, Class Y shares are offered only to certain former shareholders of the series of the former Columbia Funds Institutional Trust and to institutional and high net worth individuals and clients invested in certain pooled investment vehicles and separate accounts managed by the investment manager.
Class Z Shares
Class Z shares are available only to the categories of eligible investors described below under “Minimum Investment and Account Balance — Class Z Shares Minimum Investments”
In addition, for Class I, Class R, Class W, Class Y and Class Z shares, the Distributor, in its sole discretion, may accept investments from other institutional investors not listed above.
Minimum Initial Investments, Additional Investments and Account Balances
The table below shows the Fund’s minimum initial investment, additional investment and minimum account balance requirements, which may vary by Fund, class and type of account.
Minimum Investment and Account Balance
| | | | | | | | | | | |
| | | Minimum Initial
investment | | | Minimum
Additional
investments | | Minimum
Account balance | |
For all Funds, classes and accounts except those listed below (non-qualified) | | $ | 2,000 | (a) | | $ | 100 | | $ | 250 | (d) |
| | | |
Individual Retirement Accounts | | $ | 1,000 | | | $ | 100 | | | none | |
C-34
Minimum Investment and Account Balance
| | | | | | | | | | | |
| | | Minimum Initial
investment | | | Minimum
Additional
investments | | Minimum
Account balance | |
Columbia 120/20 Contrarian Equity Fund, Columbia Global Extended Alpha Fund, Columbia Absolute Return Currency and Income Fund | | $ | 10,000 | | | $ | 100 | | $ | 5,000 | |
| | | |
RiverSource Disciplined Small Cap Value Fund, Columbia Floating Rate Fund, Columbia Inflation Protected Securities Fund | | $ | 5,000 | | | $ | 100 | | $ | 2,500 | |
| | | |
Class I, Class R | | | none | | | | none | | | none | |
| | | |
Class W | | $ | 500 | | | | none | | $ | 500 | |
| | | |
Class Y | | | variable | (b) | | $ | 100 | | $ | 250 | |
| | | |
Class Z | | | variable | (a)(c) | | $ | 100 | | $ | 250 | (d) |
| (a) | If your Class A, B, C, T or Z shares account balance falls below the minimum initial investment amount for any reason, including a market decline, you may be asked to increase it to the minimum initial investment amount or establish a systematic investment plan. If you do not do so, it will be subject to a $20 annual low balance fee and/or shares may be automatically redeemed and the proceeds mailed to you if the account falls below the minimum account balance requirement. |
| (b) | The minimum initial investment amount for Class Y shares varies depending on eligibility. For eligibility details, see Buying, Selling and Exchanging Shares – Buying Shares – Eligible Investors – Class Y Shares. |
| (c) | The minimum initial investment requirement for Class Z shares is $0, $1,000 or $2,000 depending upon the category of eligible investor. For details, see Class Z Shares Minimum Investments below. |
| (d) | If the value of your account falls below $250, your Fund account is subject to automatic redemption of Fund shares. For details, see Small Account Policy above. |
Systematic Investment Plan
The Systematic Investment Plan allows you to make regular purchases via automatic transfers from your bank account to the Fund on a monthly, quarterly or semi-annual basis. Contact the Transfer Agent or your financial advisor to set up the plan. The table below shows the minimum initial investments, minimum additional investments and minimum account balance for investment through a Systematic Investment Plan:
C-35
Minimum Investment and Account Balance — Systematic Investment Plans
| | | | | | | | | | | |
| | | Minimum Initial
investment | | | Minimum
Additional
investments | | Minimum
Account
balance* | |
For all Funds, classes and accounts except those listed below (non-qualified) | | $ | 100 | *(a) | | $ | 100 | | | none | *(b) |
Individual Retirement Accounts | | $ | 100 | *(b) | | $ | 50 | | | none | |
| | | |
Columbia 120/20 Contrarian Equity Fund, Columbia Global Extended Alpha Fund, Columbia Absolute Return Currency and Income Fund | | $ | 10,000 | | | $ | 100 | | $ | 5,000 | |
| | | |
RiverSource Disciplined Small Cap Value Fund, Columbia Floating Rate Fund, Columbia Inflation Protected Securities Fund | | $ | 5,000 | | | $ | 100 | | $ | 2,500 | |
| | | |
Class I, Class R | | | none | | | | none | | | none | |
| | | |
Class W | | $ | 500 | | | | none | | $ | 500 | |
| | | |
Class Y | | | variable | (c) | | $ | 100 | | | none | |
| | | |
Class Z | | | variable | (d) | | $ | 100 | | | none | |
| * | If your Fund account balance is below the minimum initial investment requirement described in this table, you must make investments at least monthly, as follows: |
(a) money market Funds — $2,000; and
(b) money market Funds — $1,000.
| (c) | The minimum initial investment amount for Class Y shares varies depending on eligibility. For eligibility details, see Buying, Selling and Exchanging Shares – Buying Shares – Eligible Investors – Class Y Shares. |
| (d) | The minimum initial investment requirement for Class Z shares is $0, $1,000 or $2,000 depending upon the category of eligible investor. For details, see Class Z Shares Minimum Investments below. |
Class Z Shares Minimum Investments
There is no minimum initial investment in Class Z shares for the following categories of eligible investors:
| | • | | Any person investing all or part of the proceeds of a distribution, rollover or transfer of assets into a Columbia Management Individual Retirement Account, from any deferred compensation plan which was a shareholder of any of the Funds of Columbia Acorn Trust (formerly named Liberty Acorn Trust) on September 29, 2000, in which the investor was a participant and through which the investor invested in one or more of the Funds of Columbia Acorn Trust immediately prior to the distribution, transfer or rollover. |
| | • | | Any health savings account sponsored by a third party platform and any omnibus group retirement plan for which a selling and/or servicing agent or other entity provides services and is not compensated by the Fund for those services, other than in the form of payments for shareholder servicing or sub-accounting performed in place of the Transfer Agent. |
| | • | | Any investor participating in a wrap program sponsored by a selling and/or servicing agent or other entity that is paid an asset-based fee by the investor and that is not compensated by the Fund for those services, other than payments for shareholder servicing or sub-accounting performed in place of the Transfer Agent. |
The minimum initial investment in Class Z shares for the following eligible investors is $1,000:
| | • | | Any individual retirement plan (assuming the eligibility criteria below are met) or group retirement plan that is not held in an omnibus manner for which a selling and/or servicing agent or other entity provides services and is not compensated by the Fund for those services, other than in the form of payments for shareholder servicing or sub-accounting performed in place of the Transfer Agent. |
| | • | | Any person employed as of April 30, 2010 by the former investment manager, distributor or transfer agent of the Legacy Columbia funds is eligible to make new and subsequent purchases in the Class Z shares through an individual retirement account. |
C-36
The minimum initial investment in Class Z shares for the following categories of eligible investors is $2,000:
| | • | | Any investor buying shares through a Columbia Management state tuition plan organized under Section 529 of the Internal Revenue Code. |
| | • | | Any shareholder (as well as any family member of a shareholder or person listed on an account registration for any account of the shareholder) of another fund distributed by the Distributor (i) who holds Class Z shares; (ii) who held Primary A shares prior to the share class redesignation of Primary A shares as Class Z shares that occurred on August 22, 2005; (iii) who holds Class A shares that were obtained by an exchange of Class Z shares; or (iv) who bought shares of certain mutual funds that were not subject to sales charges and that merged with a Legacy Columbia fund distributed by the Distributor. |
| | • | | Any trustee or director (or family member of a trustee or director) of a fund distributed by the Distributor. |
| | • | | Any investor participating in an account offered by a selling and/or servicing agent or other entity that provides services to such an account, is paid an asset-based fee by the investor and is not compensated by the Fund for those services, other than payments for shareholder servicing or sub-accounting performed in place of the Transfer Agent (each investor buying shares through a selling and/or servicing agent must independently satisfy the minimum investment requirement noted above). |
| | • | | Any institutional investor who is a corporation, partnership, trust, foundation, endowment, institution, government entity, or similar organization, which meets the respective qualifications for an accredited investor, as defined under the Securities Act of 1933. |
| | • | | Certain financial institutions and intermediaries, such as insurance companies, trust companies, banks, endowments, investment companies or foundations, buying shares for their own account, including Ameriprise Financial and its affiliates and/or subsidiaries. |
| | • | | Any person employed as of April 30, 2010 by the former investment manager, distributor or transfer agent of the Legacy Columbia funds is eligible to make new and subsequent purchases in the Class Z shares through a non-retirement account. |
| | • | | Certain other investors as set forth in more detail in the Merger SAI. |
The minimum initial investment requirements may be waived for accounts that are managed by an investment professional, for accounts held in approved discretionary or non-discretionary wrap programs, for accounts that are a part of an employer-sponsored retirement plan, or for other account types if approved by the Distributor.
The Fund reserves the right to modify its minimum investment and related requirements at any time, with or without prior notice.
Dividend Diversification
Generally, you may automatically invest distributions made by another Fund into the same class of shares (and in some cases certain other classes of shares) of the Fund at no additional sales charge. A sales charge may apply when you invest distributions made with respect to shares that were not subject to a sales charge at the time of your initial purchase. Call the Funds at 800.345.6611 for details. See Buying, Selling and Exchanging Shares – Opening an Account and Placing Orders – Buying Shares – Class B Shares Closed for restrictions applicable to Class B shares.
Wire Purchases
You may buy Class A, Class C, Class E, Class F, Class T, Class Y and Class Z shares of the Fund by wiring money from your bank account to your Fund account by calling the Transfer Agent at 800.345.6611.
Electronic Funds Transfer
You may buy Class A, Class C, Class E, Class F, Class T, Class Y and Class Z shares of the Fund by electronically transferring money from your bank account to your Fund account by calling the Transfer Agent at 800.422.3737. An electronic funds transfer may take up to three business days to settle and be considered in “good form.” You must set up this feature by contacting the Transfer Agent prior to your request to obtain any necessary forms. The minimum investment amount for additional purchases via electronic funds transfer is $100.
Important: Payments sent by electronic fund transfers, a bank authorization, or check that are not guaranteed may take up to 10 or more days to clear. If you request a redemption before the purchase funds clear, this may cause your redemption request to fail to process if the requested amount includes unguaranteed funds. If you purchased your shares by check or from your bank account as an Automated Clearing House (ACH) transaction, the Fund holds the redemption proceeds when you sell those shares for a period of time after the trade date of the purchase.
C-37
Other Purchase Rules You Should Know
| | • | | Once the Transfer Agent or your selling and/or servicing agent receives your buy order in “good form,” your purchase will be made at the next calculated public offering price per share, which is the net asset value per share plus any sales charge that applies. |
| | • | | You generally buy Class A, Class E and Class T shares at the public offering price per share because purchases of these share classes are generally subject to a front-end sales charge. |
| | • | | You buy Class B, Class C, Class F, Class I, Class R, Class R3, Class R4, Class R5, Class W, Class Y and Class Z shares at net asset value per share because no front-end sales charge applies to purchases of these share classes. |
| | • | | The Fund reserves the right to cancel your order if it doesn’t receive payment within three business days of receiving your buy order. The Fund will return any payment received for orders that have been cancelled, but no interest will be paid on that money. |
| | • | | Selling and/or servicing agents are responsible for sending your buy orders to the Transfer Agent and ensuring that we receive your money on time. |
| | • | | Shares bought are recorded on the books of the Fund. The Fund doesn’t issue certificates. |
Selling Shares
When you sell your shares, the Fund is effectively buying them back from you. This is called a redemption. You may sell your shares at any time. The payment will be sent within seven days after your request is received in good order. When you sell shares, the amount you receive may be more or less than the amount you invested. Your sale price will be the next NAV calculated after your request is received in good order, minus any applicable CDSC.
Remember that Class R, R3, R4 and R5 shares are sold through your eligible retirement plan or health savings account. For detailed rules regarding the sale of these classes of shares, contact the Transfer Agent, your retirement plan or health savings account administrator.
Wire Redemptions
You may request that your Class A, Class B, Class C, Class E, Class F, Class I, Class T, Class W, Class Y and Class Z share sale proceeds be wired to your bank account by calling the Transfer Agent at 800.422.3737. You must set up this feature prior to your request. The Transfer Agent charges a fee for shares sold by Fedwire. The Transfer Agent may waive the fee for certain accounts. The receiving bank may charge an additional fee. The minimum amount that can be redeemed by wire is $500.
Electronic Funds Transfer
You may sell Class A, Class B, Class C, Class E, Class F, Class T, Class Y and Class Z shares of the Fund and request that the proceeds be electronically transferred to your bank account by calling the Transfer Agent at 800.422.3737. It may take up to three business days for the sale proceeds to be received by your bank. You must set up this feature by contacting the Transfer Agent prior to your request to obtain any necessary forms.
Systematic Withdrawal Plan
The Systematic Withdrawal Plan lets you withdraw funds from your Class A, Class B, Class C, Class I, Class T, Class W, Class Y and/or Class Z shares account any day of the month on a monthly, quarterly or semi-annual basis. Contact the Transfer Agent or your financial advisor to set up the plan. To set up the plan, your account balance must meet the Fund Class’ minimum initial investment amount. All dividend and capital gain distributions must be reinvested to set up the plan. A Systematic Withdrawal Plan cannot be set up on an account that already has a Systematic Investment Plan established. If you set up the plan after you’ve opened your account, we may require your signature to be Medallion Signature Guaranteed.
You can choose to receive your withdrawals via check or direct deposit into your bank account. Otherwise, the Fund will deduct any applicable CDSC from the withdrawals before sending the balance to you. You can cancel the plan by giving the Fund 30 days notice in writing or by calling the Transfer Agent at 800.422.3737. It’s important to remember that if you withdraw more than your investment in the Fund is earning, you’ll eventually use up your original investment.
Check Redemption Service
Class A shares of the money market Funds offer check writing privileges. If you have $2,000 in a money market Fund, you may request checks which may be drawn against your account. The amount of any check drawn against your money market Fund must be at least $100. You can elect this service on your initial application or thereafter.
C-38
Call 800.345.6611 for the appropriate forms to establish this service. If you own Class A shares that were both in another Fund at NAV because of the size of the purchase, and then exchanged into a money market Fund, check redemptions may be subject to a CDSC. A $15 charge will be assessed for any stop payment order requested by you or any overdraft in connection with checks written against your money market Fund account.
In-Kind Distributions
The Fund reserves the right to honor sell orders with in-kind distributions of portfolio securities instead of cash. In the event the Fund makes such an in-kind distribution, you may incur the brokerage and transaction costs associated with converting the portfolio securities you receive into cash. Also, the portfolio securities you receive may increase or decrease in value before you convert them into cash.
Other Redemption Rules You Should Know
| | • | | Once the Transfer Agent or your selling and/or servicing agent receives your sell order in “good form,” your shares will be sold at the next calculated net asset value per share. Any applicable CDSC will be deducted from the amount you’re selling and the balance will be remitted to you. |
| | • | | If you sell your shares directly through the Funds, we will normally send the sale proceeds by mail or electronically transfer them to your bank account within three business days after the Transfer Agent or your selling and/or servicing agent receives your order in “good form.” |
| | • | | If you sell your shares through a selling and/or servicing agent, the Funds will normally send the sale proceeds by Fedwire within three business days after the Transfer Agent or your selling and/or servicing agent receives your order in “good form.” |
| | • | | If you paid for your shares by check or from your bank account as an Automated Clearing House (ACH) transaction, the Funds will hold the sale proceeds when you sell those shares for a period of time after the trade date of the purchase. |
| | • | | No interest will be paid on uncashed redemption checks. |
| | • | | The Funds can delay payment of the redemption proceeds for up to seven days and may suspend redemptions and/or further postpone payment of redemption proceeds when the NYSE is closed or during emergency circumstances as determined by the SEC. |
| | • | | Other restrictions may apply to retirement accounts. For information about these restrictions, contact your retirement plan administrator. |
| | • | | Also keep in mind the Funds’ Small Account Policy, which is described above in Buying, Selling and Exchanging Shares – Transaction Rules and Policies. |
| | • | | For Class E shareholders, if, at the time of the trust’s termination, the beneficiary does not elect to redeem Class E shares held by the trust, the shares automatically will convert to Class A shares of the Fund and be registered in the beneficiary’s name. For Class F shareholders, if, at the time of the trust’s termination, the beneficiary does not elect to redeem Class F shares held by the trust, the shares automatically will convert to Class B shares of the Fund and be registered in the beneficiary’s name. After such conversion, the beneficiary’s shares no longer will convert to Class E shares, but will convert to Class A shares in accordance with the applicable conversion schedule for Class B shares. Automatic conversion of Class B shares to Class A shares occurs eight years after purchase for these shares. For purposes of calculating the conversion period, the beneficiary ownership period for the Class B shares will begin at the time the Class F shares were purchased. |
| | • | | For Class E and Class F shareholders, if the beneficiary under a Columbia Advantage Plan trust exercises his or her withdrawal rights, the financial advisor may be required to refund to the Distributor any sales charge or initial commission previously retained or paid on the withdrawn Class E and/or Class F shares or amount redeemed. |
Exchanging Shares
You can generally sell shares of a Fund to buy shares of another Fund, in what is called an exchange. You should read the prospectus of, and make sure you understand the investment objective, principal investment strategies, risks, fees and expenses of, the Fund into which you are exchanging. You may be subject to a sales charge if you exchange from a money market Fund or any other Fund that does not charge a front-end sales charge into a non–money market Fund. If you hold your Fund shares through certain selling and/or servicing agents, including Ameriprise Financial Services, Inc., you may have limited exchangeability among the Funds. Please contact your financial advisor for more information.
C-39
Systematic Exchanges
You may buy Class A, Class C, Class T, Class W, Class Y and/or Class Z shares of a Fund by exchanging each month from another Fund for shares of the same class of the Fund at no additional cost, subject to the following exchange amount minimums: $50 each month for individual retirement accounts (i.e. tax qualified accounts); and $100 each month for non-retirement accounts. Contact the Transfer Agent or your selling and/or servicing agent to set up the plan. If you set up your plan to exchange more than $100,000 each month, you must obtain a Medallion Signature Guarantee.
Exchanges will continue as long as your balance is sufficient to complete the systematic monthly transfers, subject to the Funds’ Small Account Policy described above in Buying, Selling and Exchanging Shares – Transaction Rules and Policies. You may terminate the program or change the amount you would like to exchange (subject to the $50 and $100 minimum requirements noted immediately above) by calling the Funds at 800.345.6611. A sales charge may apply when you exchange shares of a Fund that were not assessed a sales charge at the time of your initial purchase.
The rules described below for making exchanges apply to systematic exchanges.
Other Exchange Rules You Should Know
| | • | | Exchanges are made at net asset value next calculated after your exchange order is received in good form. |
| | • | | Once the Fund receives your exchange request, you cannot cancel it after the market closes. |
| | • | | The rules for buying shares of a Fund generally apply to exchanges into that Fund, including, if your exchange creates a new Fund account, it must satisfy the minimum investment amount, unless a waiver applies. |
| | • | | Shares of the purchased Fund may not be used on the same day for another exchange or sale. |
| | • | | You can generally make exchanges between like share classes of any Fund. Some exceptions apply. |
| | • | | If you exchange shares from Class A shares of a money market Fund to a non-money market Fund, any further exchanges must be between shares of the same class. For example, if you exchange from Class A shares of a money market Fund into Class C shares of a non-money market Fund, you may not exchange from Class C shares of that non-money market Fund back to Class A shares of a money market Fund. |
| | • | | A sales charge may apply when you exchange shares of a Fund that were not assessed a sales charge at the time of your initial purchase. If your initial investment was in a money market Fund and you exchange into a non-money market Fund, your transaction is subject to a front-end sales charge if you exchange into Class A shares and to a CDSC if you exchange into Class C, Class E, Class F and Class T shares of the Funds. |
| | • | | If your initial investment was in Class A shares of a non-money market Fund and you exchange shares into a money market Fund, you may exchange that amount to another Fund, including dividends earned on that amount, without paying a sales charge. |
| | • | | If your shares are subject to a CDSC, you will not be charged a CDSC upon the exchange of those shares. Any CDSC will be deducted when you sell the shares you received from the exchange. The CDSC imposed at that time will be based on the period that begins when you bought shares of the original Fund and ends when you sell the shares of the Fund you received from the exchange. The applicable CDSC will be the CDSC of the original Fund. |
| | • | | Class T shares may be exchanged for Class T or Class A shares. Class T shares exchanged into Class A shares cannot be exchanged back into Class T shares. |
| | • | | Class Z shares of a Fund may be exchanged for Class A or Class Z shares of another Fund. |
| | • | | You may make exchanges only into a Fund that is legally offered and sold in your state of residence. Contact the Transfer Agent or your selling and/or servicing agent for more information. |
| | • | | You generally may make an exchange only into a Fund that is accepting investments. |
| | • | | The Fund may change or cancel your right to make an exchange by giving the amount of notice required by regulatory authorities (generally 60 days for a material change or cancellation). |
| | • | | Unless your account is part of a tax-advantaged arrangement, an exchange for shares of another Fund is a taxable event, and you may recognize a gain or loss for tax purposes. |
| | • | | Shares of Class W originally purchased, but no longer held in a discretionary managed account, may not be exchanged for Class W shares of another Fund. You may continue to hold these shares in the original Fund. Changing your investment to a different Fund will be treated as a sale and purchase, and you will be subject to applicable taxes on the sale and sales charges on the purchase of the new Fund. |
C-40
You may exchange or sell shares by having your selling and/or servicing agent process your transaction. If you maintain your account directly with your selling and/or servicing agent, you must contact that agent to exchange or sell shares of the Fund. If your account was established directly with the Fund, there are a variety of methods you may use to exchange or sell shares of the Fund.
Same-Fund Exchange Privilege for Class Z Shares
Certain shareholders invested in a class of shares other than Class Z may become eligible to invest in Class Z shares. Upon a determination of such eligibility, any such shareholders will be eligible to exchange their shares for Class Z shares of the same Fund, if offered. No sales charges or other charges will apply to any such exchange, except that when Class B shares are exchanged for Class Z shares, any CDSC charges applicable to Class B shares will be applied. Ordinarily, shareholders will not recognize a gain or loss for U.S. federal income tax purposes upon such an exchange. Investors should contact their selling and/or servicing agents to learn more about the details of the Class Z shares exchange privilege.
Ways to Request a Sale or Exchange of Shares
Account established with your selling and/or servicing agent
You can exchange or sell Fund shares by having your financial advisor or selling and/or servicing agent process your transaction. They may have different policies not described herein, including different transaction limits, exchange policies and sale procedures.
Mail your sale or exchange request to The Funds, c/o Columbia Management Investment Services Corp. (regular mail) P.O. Box 8081, Boston, MA 02266-8081 or (express mail) 30 Dan Road, Canton, MA 02021-2809.
Include in your letter: your name; the name of the Fund(s); your account number; the class of shares to be exchanged or sold; your social security number (SSN) or taxpayer identification number (TIN); the dollar amount or number of shares you want to exchange or sell; specific instructions regarding delivery or exchange destination; signature(s) of registered account owner(s); and any special documents the Transfer Agent may require in order to process your order.
Corporate, trust or partnership accounts may need to send additional documents. Payment will be mailed to the address of record and made payable to the names listed on the account, unless your request specifies differently and is signed by all owners.
Distributions and Taxes
Distributions to Shareholders
A mutual fund can make money two ways:
| | • | | It can earn income on its investments. Examples of fund income are interest paid on money market instruments and bonds, and dividends paid on common stocks. |
| | • | | A mutual fund can also have capital gains if the value of its investments increases. While a fund continues to hold an investment, any gain is unrealized. If the fund sells an investment, it generally will realize a capital gain if it sells that investment for a higher price than it originally paid. Capital gains are either short-term or long-term, depending on whether the fund holds the securities for one year or less (short-term gains) or more than one year (long-term gains). |
|
FUNDamentalsTM Distributions Mutual funds make payments of fund earnings to shareholders, distributing them among all shareholders of the fund. As a shareholder, you are entitled to your portion of a fund’s distributed income, including capital gains. Reinvesting your distributions buys you more shares of a fund – which lets you take advantage of the potential for compound growth. Putting the money you earn back into your investment means it, in turn, may earn even more money. Over time, the power of compounding has the potential to significantly increase the value of your investment. There is no assurance, however, that you’ll earn more money if you reinvest your distributions rather than receive them in cash. |
The Fund intends to pay out, in the form of distributions to shareholders, a sufficient amount of its income and gains so that the Fund will qualify for treatment as a regulated investment company and generally will not have to pay any federal excise tax. The Fund generally intends to distribute any net realized capital gain (whether long-term or short-term gain) at least once a year.
C-41
Different share classes of the Fund usually pay different net investment income distribution amounts, because each class has different expenses. Each time a distribution is made, the net asset value per share of the share class is reduced by the amount of the distribution.
The Fund generally pays cash distributions within five business days after the distribution was declared (or, if the Fund declares distributions daily, within five business days after the end of the month in which the distribution was declared). If you sell all of your shares after the record date, but before the payment date, for a distribution, you’ll normally receive that distribution in cash within five business days after the sale was made.
The Fund will automatically reinvest distributions in additional shares of the same share class of the Fund unless you inform us you want to receive your distributions in cash (the financial selling and/or servicing agent through which you purchased shares may have different policies). You can do this by writing the Funds at the addresses and telephone numbers listed at the beginning of the section entitled Choosing a Share Class. No sales charges apply to the purchase or sale of such shares.
For accounts held directly with the Fund, distributions of $10 or less will automatically be reinvested in additional Fund shares only. If you elect to receive distributions by check and the check is returned as undeliverable, all subsequent distributions will be reinvested in additional shares of the Fund.
Unless you are a tax-exempt investor or holding Fund shares through a tax-advantaged account (such as a 401(k) plan or IRA), you should consider avoiding buying Fund shares shortly before the Fund makes a distribution (other than distributions of net investment income that are declared daily) of net investment income or net realized capital gain, because doing so can cost you money in taxes. This is because you will, in effect, receive part of your purchase price back in the distribution. This is known as “buying a dividend.” To avoid “buying a dividend,” before you invest, check the Fund’s distribution schedule, which is available at the Funds’ websites and/or by calling the Funds’ telephone numbers listed at the beginning of the section entitled Choosing a Share Class.
If you buy shares of the Fund when it holds securities with unrealized capital gain, you may, in effect, receive part of your purchase price back if and when the Fund sells those securities and distributes any net realized gain. Any such distribution is generally subject to tax. The Fund may have, or may build up over time, high levels of unrealized capital gain. If you buy shares of the Fund when it has capital loss carryforwards, the Fund may have the ability to offset capital gains realized by the Fund that otherwise would have been distributed to shareholders with such carryforwards, although capital loss carryforwards generally expire after eight taxable years and may be subject to substantial limitations.
Taxes and Your Investment
The Fund will send you a statement each year showing how much you’ve received in distributions in the prior year and the distributions’ character for U.S. federal income tax purposes. In addition, you should be aware of the following considerations applicable to all Funds (unless otherwise noted):
| | • | | The Fund intends to qualify each year as a regulated investment company. A regulated investment company generally is not subject to tax at the fund level on income and gains from investments that are distributed to shareholders. However, the Fund’s failure to qualify as a regulated investment company would result in Fund level taxation, and consequently, a reduction in income available for distribution to you. In addition, any dividends of net tax-exempt income would no longer be exempt from U.S. federal income tax and, instead, in general, would be taxable to you as ordinary income. |
| | • | | Distributions generally are taxable to you when paid, whether they are paid in cash or automatically reinvested in additional shares of the Fund. |
| | • | | Certain derivative instruments when held in a Fund’s portfolio subject the Fund to special tax rules, the effect of which may be to accelerate income to the Fund, defer fund losses, cause adjustments in the holding periods of Fund portfolio securities, convert capital gains into ordinary income and convert short-term capital losses into long-term capital losses. These rules could therefore affect the amount, timing and/or character of distributions to shareholders. For tax-exempt Funds: Derivative instruments held by a Fund may also generate taxable income to the Fund. |
| | • | | Certain Funds may purchase or sell (write) options, as described further in the Merger SAI. In general, option premiums which may be received by the Fund are not immediately included in the income of the Fund. Instead, |
C-42
| | such premiums are taken into account when the option contract expires, the option is exercised by the holder, or the Fund transfers or otherwise terminates the option. If an option written by a Fund is exercised and such Fund sells or delivers the underlying security, the Fund generally will recognize capital gain or loss equal to (a) the sum of the exercise price and the option premium received by the Fund minus (b) the Fund’s basis in the security. Such gain or loss generally will be short-term or long-term depending upon the holding period of the underlying security. Gain or loss with respect to any termination of a Fund’s obligation under an option other than through the exercise of the option and the related sale or delivery of the underlying security generally will be short-term gain or loss. Thus, for example, if an option written by a Fund expires unexercised, such Fund generally will recognize short-term gain equal to the premium received. |
| | • | | For tax-exempt Funds: Tax-exempt Funds expect that distributions will consist primarily of exempt-interest dividends. Distributions of the Fund’s net interest income from tax-exempt securities generally are not subject to U.S. federal income tax, but may be subject to state and local income and other taxes, as well as federal and state alternative minimum tax. Similarly, distributions of interest income that is exempt from state and local income taxes of a particular state generally will be exempt from such taxes, but may be subject to other taxes, including income taxes of other states, and federal and state alternative minimum tax. |
| | • | | For tax-exempt Funds: The Fund may invest a portion of its assets in securities that generate income that is not exempt from federal or state income tax. Distributions by the Fund of this income generally are taxable to you as ordinary income. Distributions of gains realized by the Fund, including those generated from the sale or exchange of tax-exempt securities, generally also are taxable to you. Distributions of the Fund’s net short-term capital gain, if any, generally are taxable to you as ordinary income. Distributions of the Fund’s net long-term capital gain, if any, generally are taxable to you as long-term capital gain. Whether capital gains are long-term or short-term is determined by how long the Fund has owned the investments that generated them, rather than how long you have owned your shares. |
| | • | | Distributions of the Fund’s ordinary income and net short-term capital gain, if any, generally are taxable to you as ordinary income. Distributions of the Fund’s net long-term capital gain, if any, generally are taxable to you as long-term capital gain. Whether capital gains are long-term or short-term is determined by how long the Fund has owned the investments that generated them, rather than how long you have owned your shares. |
| | • | | For taxable fixed income Funds: Taxable fixed-income Funds expect that distributions will consist primarily of ordinary income. |
| | • | | For taxable years beginning on or before December 31, 2010, if you are an individual and you meet certain holding period and other requirements for your Fund shares, a portion of your distributions may be treated as “qualified dividend income” taxable at lower net long-term capital gain rates. It is currently unclear whether Congress will extend this provision to taxable years beginning after December 31, 2010. Qualified dividend income is income attributable to the Fund’s dividends received from certain U.S. and foreign corporations, as long as the Fund meets certain holding period and other requirements for the stock producing such dividends. For taxable fixed income Funds and tax-exempt Funds: Taxable fixed income Funds and tax-exempt Funds do not expect a significant portion of Fund distributions to be derived from qualified dividend income. |
| | • | | For taxable years beginning on or before December 31, 2010, the maximum individual U.S. federal income tax rate on net long-term capital gain (and thus qualified dividend income) has been temporarily reduced to 15%. It is currently unclear whether Congress will extend this rate reduction to taxable years beginning after December 31, 2010. |
| | • | | A sale, redemption or exchange of Fund shares is a taxable event. This includes redemptions where you are paid in securities. Your sales, redemptions and exchanges of Fund shares (including those paid in securities) usually will result in a taxable capital gain or loss to you, equal to the difference between the amount you receive for your shares (or are deemed to have received in the case of exchanges) and the amount you paid (or are deemed to have paid in the case of exchanges) for them. Any such capital gain or loss generally will be long-term capital gain or loss if you have held your Fund shares for more than one year at the time of sale or exchange. In certain circumstances, capital losses may be converted from short-term to long-term or disallowed. |
| | • | | The Fund is required by federal law to withhold tax on any taxable and possibly tax-exempt distributions and redemption proceeds paid to you (including amounts paid to you in securities and amounts deemed to be paid to you upon an exchange of shares) if: you haven’t provided a correct TIN or SSN or haven’t certified to the Fund that withholding doesn’t apply; the Internal Revenue Service (IRS) has notified us that the TIN listed on your account is incorrect according to its records; or the IRS informs the Fund that you are otherwise subject to backup withholding. |
C-43
| | • | | Class E and Class F shareholders, under the Columbia Gift Plan, the trustee will file all federal and state income tax returns and pay all related income taxes for income and capital gains earned prior to the trust’s termination. Under the Columbia Advantage Plan, the beneficiary will be obligated to report any income and capital gains earned by the trust on his or her own tax returns and to pay any related income taxes. |
| | • | | Class E and Class F shareholders, you should consult with your own tax advisor about the particular tax consequences to you of making a gift and holding Fund shares through a trust, including any applicable federal or state estate or gift tax consequences. |
| | • | | If at the end of the taxable year more than 50% of the value of the Fund’s assets consists of securities of foreign corporations, and the Fund makes a special election, you will generally be required to include in income your share of the foreign taxes paid by the Fund. You may be able to either deduct this amount from your income or claim it as a foreign tax credit. There is no assurance that the Fund will make a special election for a taxable year, even if it is eligible to do so. |
For a Fund organized as a fund-of-funds. Because most of the Fund’s investments are shares of underlying Funds, the tax treatment of the Fund’s gains, losses, and distributions may differ from the tax treatment that would apply if either the Fund invested directly in the types of securities held by the underlying Funds or the Fund shareholders invested directly in the underlying funds. As a result, you may receive taxable distributions earlier and recognize higher amounts of capital gain or ordinary income than you otherwise would.
|
FUNDamentalsTM Taxes The information provided above is only a summary of how U.S. federal income taxes may affect your investment in the Fund. It is not intended as a substitute for careful tax planning. Your investment in the Fund may have other tax implications. It does not apply to certain types of investors who may be subject to special rules, including foreign or tax-exempt investors or those holding Fund shares through a tax-advantaged account, such as a 401(k) plan or IRA. You should consult with your own tax advisor about the particular tax consequences to you of an investment in the Fund, including the effect of any foreign, state and local taxes, and the effect of possible changes in applicable tax laws. |
ADDITIONAL SERVICES AND COMPENSATION
In addition to acting as the Fund’s investment manager, Columbia Management Investment Advisers, LLC (Columbia Management) and its affiliates also receive compensation for providing other services to the Funds.
Administration Services. Ameriprise Financial, Inc., 200 Ameriprise Financial Center, Minneapolis, MN 55474, provides or compensates others to provide administrative services to the Legacy RiverSource funds, which includes the Seligman and Threadneedle branded funds. These services include administrative, accounting, treasury, and other services.
Distribution and Shareholder Services. Columbia Management Investment Distributors, Inc. (formerly RiverSource Fund Distributors, Inc.), One Financial Center, Boston, MA 02111, provides underwriting and distribution services to the Funds.
Transfer Agency Services. Columbia Management Investment Services Corp. (formerly RiverSource Service Corporation), One Financial Center, Boston, MA 02111, provides or compensates others to provide transfer agency services to the Funds. The Funds pay the Transfer Agent a fee that may vary by class, as set forth in the Merger SAI, and reimburses the transfer agent for its out-of-pocket expenses incurred while providing these transfer agency services to the Funds. The Transfer Agent pays a portion of these fees to selling and servicing agents that provide sub-recordkeeping and other services to Fund shareholders. The Merger SAI provides additional information about the services provided and the fee schedules for the Transfer Agent agreements.
ADDITIONAL MANAGEMENT INFORMATION
Affiliated Products. Columbia Management serves as investment manager to the Funds, including those that are structured to provide asset-allocation services to shareholders of those Funds (funds of funds) by investing in shares of other Funds (collectively referred to as underlying funds) and to discretionary managed accounts (collectively referred to as affiliated products) that invest exclusively in underlying funds. These affiliated products, individually or collectively, may own a significant percentage of the outstanding shares of the underlying funds, and Columbia Management seeks to balance potential conflicts between the affiliated products and the underlying funds in which they invest. The affiliated products investment in the underlying funds may also have the effect of creating
C-44
economies of scale (including lower expense ratios) because the affiliated products may own substantial portions of the shares of underlying funds and, comparatively, a redemption of underlying fund shares by one or more affiliated products could cause the expense ratio of an underlying fund to increase as its fixed costs would be spread over a smaller asset base. Because of these large positions of the affiliated products, the underlying funds may experience relatively large purchases or redemptions. Although Columbia Management may seek to minimize the impact of these transactions, for example, by structuring them over a reasonable period of time or through other measures, underlying funds may experience increased expenses as they buy and sell securities to manage these transactions. When Columbia Management structures transactions over a reasonable period of time in order to manage the potential impact of the buy and sell decisions for the affiliated products, these affiliated products, including funds of funds, may pay more or less for shares of the underlying funds than if the transactions were executed in one transaction. In addition, substantial redemptions by the affiliated products within a short period of time could require the underlying fund to liquidate positions more rapidly than would otherwise be desirable, which may have the effect of reducing or eliminating potential gain or causing the underlying fund to realize a loss. Substantial redemptions may also adversely affect the ability of the investment manager to implement the underlying fund’s investment strategy. Columbia Management also has an economic conflict of interest in determining the allocation of the affiliated products’ assets among the underlying funds as it earns different fees from the underlying funds. Columbia Management monitors expense levels of the Funds and is committed to offering funds that are competitively priced. Columbia Management reports to the Board of each fund of funds on the steps it has taken to manage any potential conflicts. See the Merger SAI for information on the percent of the Fund owned by affiliated products.
Cash Reserves. A Fund may invest its daily cash balance in a money market fund selected by Columbia Management, including but not limited to RiverSource Short-Term Cash Fund (Short-Term Cash Fund), a money market Fund established for the exclusive use of the Funds and other institutional clients of Columbia Management. While Short-Term Cash Fund does not pay an advisory fee to Columbia Management, it does incur other expenses. A Fund will invest in Short-Term Cash Fund or any other money market fund selected by Columbia Management only to the extent it is consistent with the Fund’s investment objectives and policies. Short-Term Cash Fund is not insured or guaranteed by the FDIC or any other government agency.
Fund Holdings Disclosure. The Board has adopted policies and procedures that govern the timing and circumstances of disclosure to shareholders and third parties of information regarding the securities owned by a Fund. A description of these policies and procedures is included in the Merger SAI.
The website references herein are intended to be inactive textual references and information contained in or otherwise accessible through the referenced websites does not form a part of this combined proxy statement/prospectus.
C-45
Exhibit D
Comparison of Organizational Documents
This chart highlights material differences between the terms of the Declarations of Trust/Articles of Incorporation and By-Laws of the Buying Funds and Selling Funds.
| | |
Group A: | | Selling Fund: Columbia Global Value Fund |
| |
Group B: | | Selling Fund: Columbia World Equity Fund. |
| |
Group C: | | Selling Fund: Threadneedle Global Equity Income Fund; Buying Fund: Columbia Global Equity Fund.2 |
| | | | | | |
Policy | | Group A | | Group B | | Group C |
| Shareholder Liability | | Shareholders of the Trust are protected from liability under Delaware statutory law, which provides that shareholders of a Delaware statutory trust have the same limitation of personal liability as is extended to shareholders of a private corporation for profit incorporated in the State of Delaware. In addition, any shareholder or former shareholder exposed to liability by reason of a claim or demand relating solely to his or her being or having been a shareholder of the Trust, and not because of his acts or omissions, the shareholder or former shareholder (or his or her heirs, executors, administrators, or other legal representatives or in the case of a corporation or other entity, its corporate or other general successor) will be entitled to be held harmless from and indemnified out of the assets of the Trust against all loss and expense arising from such claim or demand. | | The shareholders of a Massachusetts business trust could, under certain circumstances, be held personally liable as partners for its obligations. However, the Declaration of Trust contains express disclaimers of shareholder liability for acts, obligations or affairs of the Trust. The Declaration of Trust also provides for indemnification and reimbursement of expenses out of the assets of a series for any shareholder held personally liable for obligations of such series. Therefore, the possibility that a shareholder could be held liable would be limited to a situation in which the assets of the applicable series had been exhausted. | | Under Minnesota law, a shareholder’s liability to the corporation or its creditors is limited to paying the amount agreed to be paid for the shares which the shareholder holds or has agreed to purchase. |
| 2 | The Board of RiverSource Global Series, Inc., has approved the Redomiciling of Columbia Global Equity Fund, a series of RiverSource Global Series, Inc., into a newly created series of RiverSource Series Trust that has also been named Columbia Global Equity Fund (the “Redomiciling”). The Redomiciling is subject to approval by the shareholders of Columbia Global Equity Fund. If the Redomiciling is approved by shareholders of Columbia Global Equity Fund, the Buying Fund will be governed by charter documents in Group B. If the Redomiciling has not been completed prior to the Closing of the Reorganization, the Buying Fund will be governed by charter documents in Group C. |
D-1
| | | | | | |
Policy | | Group A | | Group B | | Group C |
| Shareholder Voting Rights | | Shareholders have only the powers to vote on matters as the Trustees may consider desirable and so authorize, and those voting powers expressly granted under the 1940 Act or under the law of Delaware applicable to statutory trusts. Shares may be voted in person or by proxy or in any manner authorized by the Trustees. On any matter that requires shareholder approval under the 1940 Act, whether shareholders are required to vote by series or class is determined by reference to the 1940 Act. On all other matters, all shares are voted in the aggregate and not by series or class unless the Trustees determine otherwise. Each whole share is entitled to one vote as to any matter on which it is entitled to vote, and each fractional share is entitle to a proportionate fractional vote. There is no cumulative voting in the election of Trustees. | | At all meetings of shareholders, each shareholder of record is entitled to one vote for each dollar of net asset value (number of shares owned times net asset value per share) and each fractional dollar amount is entitled to a proportionate fractional vote. The shareholders have the power to vote (i) for the election of Trustees, (ii) to the same extent as shareholders of a Massachusetts business corporation as to whether or not a court action, proceeding or claim should or should not be brought or maintained derivatively or as a class action on behalf of the Trust or shareholder, (iii) with respect to termination of the Trust or any class or series of the trust, (iv) with respect to the approval or termination in accordance with the 1940 Act of any contract with any one or more corporations, trusts, associations, partnerships, limited partnerships or other types of organizations, or individuals as to which shareholder approval is required by the 1940 Act, and (v) with respect to additional matters relating to the Trust as may be required by the 1940 Act, the Declaration of Trust, the By-Laws or any registration of the Trust with the SEC (or any successor agency) or any State, or as the Trustees may consider necessary or desirable. On any matter submitted to a vote of shareholders, all shares entitled to vote will be voted in the aggregate as a single class without regard to series or class of shares, except that shares may be voted by individual series or classes (1) when required by the 1940 Act, (2) when the Trustees have determined that the matter affects one or more series or classes of shares materially differently, or (3) when the matter affects only the interests of one or more series or classes. There is no cumulative voting in the election of Trustees. | | At all meetings of the shareholders, each shareholder of record entitled to vote is entitled to one vote for each dollar of net asset value (number of shares owned times net asset value per share) and each fractional dollar amount is entitled to a proportionate fractional vote. Shareholders have the power to vote (i) for the election of Directors; (ii) on most amendments to the corporation’s Articles of Incorporation and on certain amendments to the corporation’s By-Laws; (iii) on certain proposed mergers and exchanges to which the corporation is a party; (iv) on the proposed sale of all or substantially all of the corporation’s property and assets not in the usual and regular course of its business; and (v) on the proposed dissolution of the corporation. At all elections of Directors, each shareholder is entitled to as many votes equal to the number of dollars of net asset value of shares owned multiplied by the number of Directors to be elected and may cast all of such votes for a single Director or may distribute them among the number to be voted for, or any two or more of them. The standard form of certifying resolution creating rights and preferences for series of capital stock provides that each share may be voted by series (i) as required by the provisions of the 1940 Act and all rules and regulations promulgated thereunder; (ii) when the Board of Directors determines that a matter affects series in a materially different way; or (iii) when the Board of Directors determines a matter affects only one or some of the series. In addition, under Minnesota law, shareholders are entitled to vote as separate series or classes with respect to certain amendments to the corporation’s Articles of Incorporation and on certain mergers and exchanges to which the corporation is a party. |
D-2
| | | | | | |
Policy | | Group A | | Group B | | Group C |
| Shareholder Meetings | | The Trust is not required to hold annual meetings of shareholders. Shareholders have the right to call special meetings and vote to remove Trustees but only if and to the extent the SEC staff takes the position by rule, interpretive letter or public release that Section 16(c) of the 1940 Act gives them such right. Otherwise, only the Trustees, the chairman of the Trustees or the president of the Trust may call shareholder meetings. | | The Declaration of Trust and By-Laws do not address annual shareholder meetings. Regular shareholder meetings are not required for business trusts under the General Laws of Massachusetts. Shareholder meetings will be held when called by the Trustees for the purpose of taking action on any matter requiring the vote or authority of the shareholders, or for any other matter the Trustees deem necessary or desirable. | | Regular shareholder meetings are not required; however, a majority of Directors present at a duly held meeting may call a regular meeting of shareholders by fixing the date, time and place for a meeting. If a regular meeting of shareholders has not been held during the immediately preceding 15 months, a shareholder or shareholders holding three percent or more of the voting power of all shares entitled to vote may demand a regular meeting of shareholders by written notice of demand given to the chief executive officer or chief financial officer. Within 30 days after receipt of the demand by one of those officers, the Board of Directors must cause a regular meeting of shareholders to be called and held on notice no later than 90 days after receipt of the demand, all at the expense of the Fund. Special meetings of the shareholders may be called at any time as provided for by the laws of the State of Minnesota. In addition, a special meeting of shareholders may be called at any time by a shareholder or shareholders holding 10% or more of the voting power of all shares entitled to vote, except that a special meeting for the purpose of considering any action to directly or indirectly facilitate or effect a business combination must be called by 25% or more of the voting power of all shares entitled to vote. |
| | | |
| Shareholder Quorum | | Except when a larger quorum is required by applicable law, thirty-three and one-third percent (33 1/3%) of the shares entitled to vote constitutes a quorum at a shareholders’ meeting. When any one or more series or classes of the Trust is to vote as a single class separate from any other shares, thirty-three and one-third percent (33 1/3%) of the shares of each | | The presence in person or by proxy of 30% of the votes entitled to be cast at a meeting constitutes a quorum. When any one or more series or classes votes as a single class separate from any other shares which are to vote on the same matters as a separate class or classes, 30% of the votes entitled to | | The holders of at least 10% of the shares outstanding and entitled to vote, present in person or by proxy, constitute a quorum, but the holders of a smaller amount may adjourn without further notice, other than by notice at the time, until a quorum is secured at any such adjourned meeting. In case a quorum is not present, the meeting may be adjourned without notice |
D-3
| | | | | | |
Policy | | Group A | | Group B | | Group C |
| | such series or classes entitled to vote constitutes a quorum at a shareholder’s meeting of that series. A meeting may be adjourned, whether or not a quorum is present, by the vote of a majority of the shares represented at the meeting, either in person or by proxy. If a meeting is adjourned, notice does not need to be given of the adjourned meeting date unless a new record date for the adjourned meeting is set or unless the adjourned meeting is to take place more than sixty (60) days from the date set for the original meeting, in which case the Board of Trustees would be required to set a new record date. | | be cast by each such class entitled to vote constitutes a quorum at a shareholders’ meeting of that class. A meeting may be adjourned by a majority of the votes properly cast upon the question, whether or not a quorum is present, and the meeting may be held as adjourned within a reasonable time after the date set for the original meeting without further notice. | | other than by notice at the meeting. At any adjourned meeting at which a quorum may be present, any business may be transacted which might have been transacted at the meeting as originally called. |
| | | |
| Shareholder Consent | | Any action taken by shareholders may be taken without a meeting if shareholders holding a majority of the shares entitled to vote on the matter and holding a majority of the shares of any series or class entitled to vote separately on the matter consent to the action in writing and such written consents are filed with the records of the meetings of shareholders. Such consent is treated for all purposes as a vote taken at a meeting of shareholders. | | Except as otherwise provided by law, the Declaration of Trust or the By-Laws, any action required or permitted to be taken at any meeting of shareholders may be taken without a meeting if a majority of the shareholders entitled to vote consent to the action in writing and the consents are filed with the records of the Trust. The consent will be treated for all purposes as a vote taken at a meeting of shareholders. | | An action required or permitted to be taken at a shareholder meeting may be taken by written action signed, or consented to by authorized electronic communication, by all of the shareholders entitled to vote on that action. Such a written action is not effective if it is signed or consented to by fewer than all the shareholders entitled to vote on the action. |
| | | |
| Notice to Shareholders of Record Date | | Notice of any meeting of shareholders must be given by the Trustees, chairman of the Trustees or president not less than 7 days nor more than 120 days before the date of the meeting. The Trustees may set a record date for the purpose of determining the shareholders entitled to vote or act at a shareholders’ meeting. The record date cannot be more than 120 days before the date of the meeting. | | Written notice of any meeting of shareholders must be given by the Trustees at least 7 days before the meeting. The Trustees may set a record date for the purpose of determining the shareholders entitled to notice of or to vote at a shareholder meeting. The record date cannot be more than 90 days or less than 7 days before the date of the meeting. | | In general, shareholders who are entitled to vote at a shareholder meeting must be given notice of the meeting at least ten and not more than 60 days before the meeting. In certain cases, the notice of meeting must include specified information required by Minnesota law. The Board of Directors can establish a record date for determining the shareholders who are entitled to vote at a shareholder meeting. The record date cannot be more than 60 days before the date of the meeting. |
| | | |
| Shareholder Proxies | | Shareholders my vote in person or by proxy. Unless the Trustees declare otherwise, proxies may be given by | | Shareholders may vote in person or by proxy. A proxy with respect to shares held in the name of two or more persons | | At each shareholder meeting, the polls may be opened and closed, the proxies and ballots may be received and taken in charge, and all questions touching the |
D-4
| | | | | | |
Policy | | Group A | | Group B | | Group C |
| | any electronic or telecommunications device, including telefacsimile, telephone or through the Internet, but if a proposal by anyone other than the officers or Trustees is submitted to a vote of the shareholders of any series or class, or if there is a proxy contest or proxy solicitation or proposal in opposition to any proposal by the officers or Trustees, shares may be voted only in person or by written proxy unless the Trustees specifically authorize other permissible methods of transmission. The Trustees may appoint inspectors for any meeting of shareholders, and these inspectors are charged with, among other things, determining the authenticity, validity and effect of proxies | | will be valid if executed by any one of them unless at or prior to exercise of the proxy the Trust receives a specific written notice to the contrary from any one of them. A proxy purporting to be executed by or on behalf of a shareholder will be deemed valid unless challenged at or prior to its exercise and the burden of proving invalidity rests on the challenger. | | qualification of voters, the validity of proxies, and acceptances or rejections of votes may be decided by two (2) inspectors of election. Minnesota law provides that shareholders can submit proxies in writing or by telephonic transmission or authenticated electronic communication. It also provides that the Board of Directors can establish procedures whereby a record holder can certify in writing that another person is the beneficial owner of shares, and the beneficial owner then can vote the shares or appoint a proxy. |
| | | |
| Director/Trustee Power to Amend Organizational Document | | The Trustees may, without shareholder vote, amend or otherwise supplement the Declaration of Trust; provided that shareholders have the right to vote on any amendment if expressly required under Delaware law or the 1940 Act, or submitted to shareholders by the Trustees at their discretion. | | The Trustees may amend the Declaration of Trust at any time by an instrument in writing signed by a majority of the then Trustees provided that notice of such amendment is transmitted promptly to shareholders of record. The Trustees need not, however, provide notice of an amendment if the amendment is for the purpose of supplying an omission, curing any ambiguity or curing, correcting or supplementing any defective or inconsistent provision contained in the Declaration of Trust, or having any other purpose which is ministerial or clerical in nature. | | The Articles of Incorporation may be amended, altered, changed or repealed in a manner prescribed by the laws of the State of Minnesota. |
| | | |
| Termination of Corporation/Trust | | The Trust and any series thereof may be terminated at any time by the Board of Trustees with written notice to shareholders. To the extent the 1940 Act expressly allows shareholders the power to vote on such terminations, the Trust or any series thereof may be terminated by a vote of a majority of shares entitled to vote. | | The Trust may be terminated by the Trustees with written notice to shareholders, or by the affirmative vote of at least two-thirds of the shares of each series entitled to vote. Any series of or class may be terminated by the affirmative vote of at least two-thirds of the shares of that series or class, or by the Trustees by written notice to the shareholders of that series or class. | | In order to dissolve a Minnesota corporation, the affirmative vote of a majority of the voting power of all shares entitled to vote is required. In order to discontinue an individual class or series of shares without dissolving the corporation, an amendment to the corporation’s Articles of Incorporation is required. In order to adopt such an amendment, shareholders must approve the amendment by the affirmative vote of the greater of (i) |
D-5
| | | | | | |
Policy | | Group A | | Group B | | Group C |
| | | | | | a majority of the voting power of the shares of that class or series present and entitled to vote or (ii) a majority of the voting power of the minimum number of shares of such class or series entitled to vote that would constitute a quorum for the transaction of business at the meeting (a “Minnesota Statutory Vote”). The Board of Directors, acting without a shareholder vote, does not have the power to dissolve the corporation or to discontinue an individual class or series of shares. |
| | | |
| Merger or Consolidation | | The Trustees have the power to cause the Trust or any series to be merged or consolidated with another trust or company. The Trustees may accomplish such merger or consolidation with written notice to shareholders but without the vote of shareholders, unless such shareholder vote is required by law. | | Subject to applicable laws, the Trustees may, without shareholder consent, cause the Trust or any series to be merged or consolidated with another trust or company. The Trustees may also transfer all or a substantial portion of the Trust’s assets to another fund or company. | | In most cases, any merger or exchange in which a Minnesota corporation is not the continuing entity, and any sale of all or substantially all of the corporation’s property and assets not in the usual and regular course of its business, requires the affirmative vote of a majority of the voting power of all shares entitled to vote. Any sale of the assets belonging to an individual series of shares of a Minnesota corporation in exchange for shares of another corporation or trust or shares of another series of the corporation, while leaving other series of the corporation outstanding, would require an amendment to the corporation’s Articles of Incorporation. In order to adopt such an amendment, shareholders of that series would have to approve the amendment by a Minnesota Statutory Vote. |
| | | |
| Removal of Directors/Trustees | | A Trustee may be removed with or without cause at any time by a written instrument signed by at least two-thirds of the other Trustees. In addition, if required by Section 16(c) of the 1940 Act, any Trustee may be removed at any meeting of the shareholders by a vote of at least two-thirds of the outstanding shares. | | Trustees may be removed with or without cause by majority vote of the Trustees. | | Under Minnesota law, the Board of Directors can remove a Director by a majority vote of the remaining Directors, but only if the Director was appointed by the Board of Directors to fill a vacancy and has not subsequently been elected by shareholders. In all other cases, a Director can only be removed by shareholder vote. In general, such removal requires the affirmative vote of the holders of a majority of the voting |
D-6
| | | | | | |
Policy | | Group A | | Group B | | Group C |
| | | | | | power of all shares entitled to vote at an election of Directors. However, where a corporation has cumulative voting (as do the Funds), unless the entire Board of Directors is removed simultaneously, a Director is not removed from the Board of Directors if there are cast against removal of the Director the votes of a proportion of the voting power sufficient to elect the Director at an election of the entire Board of Directors under cumulative voting. |
| | | |
| Director/Trustee Committees | | The Trust has two standing committees that may not be abolished: the Audit Committee and the Nominating Committee. Otherwise, the Trustees may, with a majority vote of the Trustees, appoint from their number other committees consisting of two or more Trustees which may be delegated such authority as the Trustees consider desirable. The Trustees may also abolish the non-standing committees with a majority vote of the Trustees. Each committee may elect a chair and each committee must maintain records of its meetings and report its actions to the full Board of Trustees. A majority of the authorized number of committee members shall constitute a quorum for the transaction of business of such committee, unless the Board of Trustees designates a lower percentage. | | The Trustees may appoint from their own number and terminate committees consisting of one or more Trustees, which may exercise the powers and authority of the Trustees to the extent that the Trustees determine. | | The corporation’s By-Laws provide that the Board of Directors may, by resolution passed by a majority of the whole Board of Directors, designate an Executive Committee of two or more Directors, which may meet at stated times or on notice to all by any of their number during intervals between meetings of the Board of Directors. The Executive Committee will advise with and aid the officers of the Fund in all matters concerning its interests and the management of its business, and generally perform such duties and exercise such powers as may be delegated to it from time to time by the Board of Directors. The Board of Directors also may, by resolution passed by a majority of the whole Board of Directors, appoint any other committee or committees for any purpose or purposes, which committee or committees will have such powers as specified in the resolution of appointment. For RiverSource Disciplined |
D-7
| | | | | | |
Policy | | Group A | | Group B | | Group C |
| | | | | | International Equity Fund, Threadneedle International Opportunity Fund, Threadneedle Global Equity Income Fund, and Columbia Global Equity Fund, the quorum for such committee established by the Board of Directors is two members regardless of the number of members serving on the committee. |
| | | |
| Director/Trustee Liability | | Trustees will be liable to the Trust by reason of willful misfeasance, bad faith, negligence or reckless disregard of the duties involved in the conduct of the Trustee’s office. | | Trustees are not subject to personal liability, except by reason of willful misfeasance, bad faith, gross negligence or reckless disregard of the duties involved in the conduct of the office of Trustee. Additionally, Trustees are not personally liable for any neglect or wrong-doing of any officer, agent, or employee of the Trust or for any act or omission of any other Trustee. Trustees that are singled out as experts on particular issues, such as a chair of a committee, are not held to any higher standard than their non-expert counterparts. | | To the full extent permitted by the laws of the State of Minnesota, no Director of the Fund will be liable to the Fund or to its shareholders for monetary damages for breach of fiduciary duty as a Director but such limit on liability will be permitted only to the extent allowable under the provisions of the 1940 Act. Under Minnesota law, the foregoing provision is not effective to eliminate a Director’s personal liability to the Funds or its shareholders for, among other things, (i) any breach of the Director’s duty of loyalty to the corporation or its shareholders; (ii) acts or omissions not in good faith or that involve intentional misconduct or knowing violation of law; or (iii) any transaction from which the Director derived an improper personal benefit. |
| | | |
| Director/Trustee Indemnification | | The Trust indemnifies the Trustees against expenses, judgments, fines and settlements and other amounts actually and reasonably incurred in connection with any civil or criminal proceeding or investigations, if it is determined that the Trustee acted in good faith and reasonably believed 1) that his or her conduct was in the Trust’s best interests, and 2) that his or her conduct was at least not opposed to the Trust’s best interests, and 3) in the case of a criminal proceeding, that he or she had no reasonable cause to believe that the conduct was unlawful. A Trustee will not, however, be | | The Trust indemnifies each of its Trustees against all liabilities and expenses, including amounts paid in satisfaction of judgments, in compromise or as fines and penalties, and attorneys’ fees incurred in connection with the defense of any civil or criminal suit or action, except with respect to any matter (i) as to which a Trustee is finally adjudicated in any such action or proceeding not to have acted in good faith in reasonable belief that such Trustee’s action was in the best interests of the Trust; or (ii) where the Trustee acted in willful misfeasance, bad faith, gross negligence or reckless disregard of the duties involved in | | Each person made or threatened to be made a party to or is involved (including, without limitation, as a witness) in any actual or threatened action, suit or proceeding whether civil, criminal, administrative, arbitration, or investigative, including a proceeding by or in the right of the Fund by reason of the former or present capacity as a Director of the Fund or who, while a Director of the Fund, is or was serving at the request of the Fund or whose duties as a Director involve or involved service as a director, officer, partner, trustee or agent of another organization or employee benefit plan, whether the basis of any proceeding is alleged action in |
D-8
| | | | | | |
Policy | | Group A | | Group B | | Group C |
| | indemnified 1) with respect to any matters where the Trustee is judged to be liable on the basis that a personal benefit was improperly received, whether or not the benefit resulted from action taken in that Trustee’s official capacity, 2) with respect to any matter where the Trustee is judged to be liable in the performance of his or her duty to the Trust unless the adjudicator determines that the Trustee was not liable as the result of conduct in (1) above and that the Trustee is fairly entitled to indemnification, and 3) with respect to amounts paid to settle or dispose of an action with or without court approval unless a) approved by a majority vote of a quorum of Trustees who are not parties and are disinterested persons, or b) a written opinion of counsel is obtained. Expenses incurred in defending any proceeding may be advanced by the Trust before the final disposition of a proceeding upon a written undertaking by the Trustee to repay the amount advanced if it is ultimately determined that he or she is not entitled to indemnification, together with at least on of the following conditions to the advance: 1) security for the undertaking, 2) the existence of insurance protecting the Trust against losses arising by reason of any lawful advances, or 3) a determination by a majority of a quorum of the Trustees who are not parties to the proceeding and are not interested persons of the Trust, or by an independent legal counsel, based on a review of the readily available facts that there is reason to believe that the Trustee ultimately will be found entitled to indemnification. | | the conduct of such Trustee’s office. Expenses, including counsel fees, so incurred by any such Trustee (but excluding amounts paid in satisfaction of judgments, in compromise or as fines or penalties) will be paid from time to time by the Trust in advance of the final disposition of any such action, suit or proceeding upon receipt of an undertaking by or on behalf of such Trustee to repay amounts so paid to the Trust if it is ultimately determined that indemnification of such expenses is not authorized under the By-Laws, provided, however, that either (a) such Trustee shall have provided appropriate security for such undertaking, (b) the Trust shall be insured against losses arising from any such advance payments, or (c) either a majority of the disinterested Trustees acting on the matter (provided that a majority of the disinterested Trustees then in office act on the matter), or independent legal counsel in a written opinion, will have determined, based upon a review of readily available facts, that there is reason to believe that such Trustee will be found entitled to indemnification under the By-Laws. | | an official capacity or in any capacity while serving as a director, officer, partner, trustee or agent, will be indemnified and held harmless by the Fund to the full extent authorized by the Minnesota Business Corporation Act, as the same or may hereafter be amended (but, in the case of any such amendment, only to the extent that such amendment permits the Fund to provide broader indemnification rights than the law permitted the Fund to provide prior to such amendment, or by any other applicable law as then in effect, against judgments, penalties, fines including, without limitation, excise taxes assessed against the person with respect to an employee benefit plan, settlements and reasonable expenses, including attorneys’ fees and disbursements, incurred in connection therewith and such indemnification will continue as to any person who has ceased to be a Director or officer and will inure to the benefit of the person’s heirs, executors and administrators provided, however, in an action brought against the Fund to enforce rights to indemnification, the Director will be indemnified only if the action was authorized by the Board of Directors of the Fund. The right to indemnification conferred by the Articles of Incorporation and By-Laws is a contract right and includes the right to be paid by the Fund in advance of the final disposition of a proceeding for expenses incurred in connection therewith provided, however, such payment of expenses will be made only upon receipt of a written undertaking by the Director to repay all amounts so paid if it is ultimately determined that the Director is not entitled to indemnification. Any indemnification under the Articles of Incorporation or the By-Laws is not exclusive of any other rights of indemnification to which the Directors might |
D-9
| | | | | | |
Policy | | Group A | | Group B | | Group C |
| | | | | | otherwise be entitled. No indemnification will be made in violation of the Investment Company Act of 1940. |
| | | |
| Dividends | | The Trustees may declare and pay dividends and distributions to shareholders of each series from the assets of such series. | | Dividends and distributions may be paid to shareholders from the Trust’s net income with the frequency as the Trustees may determine. | | The corporation’s Articles of Incorporation provide that the Directors may declare and pay dividends in their discretion at any time and from time to time to the extent and from such sources as permitted by the laws of the State of Minnesota. Under Minnesota law, the Board of Directors can authorize a dividend if it determines that the corporation will be able to pay its debts in the ordinary course of business after paying the dividend. |
| | | |
| Capitalization | | The beneficial interest in the Trust shall at all times be divided into an unlimited number of shares, without par value. | | The beneficial interest in the Trust shall at all times be divided into an unlimited number of shares without par value. | | The Corporation’s articles of incorporation authorize the issuance of up to 10,000,000,000 shares of stock with a par value of $.01 per share. The Board of Directors can authorize the issuance of shares in such classes or series |
D-10
| | | | | | |
Policy | | Group A | | Group B | | Group C |
| | | | | | with such designations, preferences and relative, participating, optional or other special rights, or qualifications, limitations or restrictions thereof, as are stated in the Board resolution establishing the class or series. The Board of Directors can, without shareholder approval, increase or decrease the total number of authorized shares, or the authorized shares of a class or series, in the manner and to the extent set forth under “Directors’ Power to Amend Articles of Incorporation/Trustees’ Power to Amend Declaration of Trust” above. |
| | | |
| Number of Directors/Trustees and Vacancies | | The number of Trustees may be fixed by the Trustees from time to time by a written instrument signed, or a resolution approved at a duly constituted meeting, by a majority of the Trustees. Provided, however, that the number of Trustees cannot be fewer than 1 or more than 16. Vacancies in the Board of Trustees may be filled by a majority of the remaining Trustees, even if less than a quorum, or by a sole remaining Trustee, unless the Trustees call a meeting of shareholders for the purpose of electing Trustees. In the event that at any time less than a majority of the Trustees holding office at that time were so elected by shareholders, the Board of Trustees will hold a shareholders’ meeting within 60 days for the election of Trustees to fill such vacancies on the board. | | The Trustees may fix the number of Trustees, fill vacancies in the Trustees, including vacancies arising from an increase in the number of Trustees, or remove Trustees with or without cause. Shareholders may fix the number of Trustees and elect Trustees at any meeting of Shareholders called by the Trustees for that purpose and to the extent required by applicable law, including paragraphs (a) and (b) of Section 16 of the 1940 Act. Each Trustee serves during the continued lifetime of the Trust until he or she dies, resigns or is removed, or, if sooner, until the next meeting of Shareholders called for the purpose of electing Trustees and until the election and qualification of his or her successor. | | There may be no fewer than two or more than 15 Directors. If a vacancy occurs in the Board of Directors by reason of death, resignation or otherwise, such vacancy may be filled for the unexpired term by a majority vote of the remaining Directors, even if the remaining number of Directors is less than a quorum. |
| | | |
| Independent Chair of the Board | | The Declaration of Trust does not require an independent chair of the Board of Trustees. | | The Declaration of Trust and By-Laws do not require an independent chair of the board of Trustees. | | The Corporation’s By-Laws require the Board of Directors to elect one independent member to serve as Chair of the Board of Directors whose duties include serving as the lead independent Director. |
| | | |
| Inspection of Books and Records | | The original or a copy of the Declaration of Trust, and of each amendment thereto, is kept at the office of the Trust where it may be inspected by any shareholder. | | The original or a copy of the Declaration of Trust, and of each amendment thereto, is kept at the office of the Trust where it may be inspected by any shareholder. | | Minnesota law requires the corporation (each Fund) to keep (i) a share register containing the names and addresses of its shareholders and the number and classes of shares held by each; (ii) |
D-11
| | | | | | |
Policy | | Group A | | Group B | | Group C |
| | | | | | records of all proceedings of shareholders for the last three years; (iii) records of all proceedings of the Board of Directors for the last three years; (iv) its Articles of Incorporation and Bylaws, as amended; (v) certain financial statements which Minnesota law requires the corporation (each Fund) to prepare; (vi) all reports to shareholders generally within the last three years; and (vii) a statement of the names and usual business addresses of its Directors and principal officers. The Fund’s shareholders and beneficial owners have the right, upon written demand stating the purpose, at any reasonable time to examine and copy those records which are reasonably related to the stated purpose, provided that the stated purpose is reasonably related to the person’s interest as a shareholder or beneficial owner. |
| | | |
| Involuntary Redemption of Accounts | | The Trustees may redeem, repurchase and transfer shares pursuant to applicable law. | | The Trust has the right at its option and at any time to redeem shares of any shareholder at the net asset value thereof: (i) if at such time such shareholder owns shares of any series or class having an aggregate net asset value of less than an amount determined from time to time by the Trustees; or (ii) to the extent that such shareholder owns shares equal to or in excess of a percentage determined from time to time by the Trustees of the outstanding shares of the Trust or of any series or class. | | The Fund may redeem the shares of a shareholder if the amount invested is less than an amount determined by the Board of Directors and set forth in the current Fund prospectus. |
D-12
STATEMENT OF ADDITIONAL INFORMATION
[—], 2010
This Statement of Additional Information (the “SAI”) relates to the following proposed reorganizations (the “Reorganizations”):
| (1) | Threadneedle Global Equity Income Fund, a series of RiverSource Global Series, Inc.; Columbia Global Value Fund, a series of Columbia Funds Series Trust; Columbia World Equity Fund, a series of Columbia Funds Series Trust I (each a “Selling Fund”), into Columbia Global Equity Fund (formerly, Threadneedle Global Equity Fund), a series of RiverSource Series Trust1 (a “Buying Fund”) |
This SAI contains information which may be of interest to shareholders of the Selling Funds but which is not included in the combined Prospectus/Proxy Statement dated [—] (the “Proxy Statement/Prospectus”) which relates to the Reorganizations. As described in the Proxy Statement/Prospectus, the Reorganizations would involve the transfer of all the assets of each Selling Fund in exchange for shares of the Buying Fund and the assumption of all the liabilities of each Selling Fund by the Buying Fund. Each Selling Fund would distribute the Buying Fund shares it receives to its shareholders in complete liquidation of each Selling Fund.
This SAI is not a prospectus and should be read in conjunction with the Proxy Statement/Prospectus. The Proxy Statement/Prospectus has been filed with the Securities and Exchange Commission and is available upon request and without charge by writing to the Buying Fund at the following:
(1) Columbia Global Equity Fund at c/o Columbia Management Services Corp., P.O. Box 8081, Boston, MA 02266-8081, or by calling 800.345.6611.
| 1 | The Board of RiverSource Global Series, Inc. has approved the redomiciling of Columbia Global Equity Fund, a series of RiverSource Global Series, Inc., into a newly created series of RiverSource Series Trust that has also been named Columbia Global Equity Fund (the “Redomiciling”). The Redomiciling is subject to approval by shareholders of Columbia Global Equity Fund. If the Redomiciling is approved by shareholders of Columbia Global Equity Fund, it is expected that the Redomiciling will occur prior to the Reorganizations, in which case the Buying Fund will be the newly created series of RiverSource Series Trust. If the Redomiciling has not been completed prior to the closing of the Reorganization, the Buying Fund will be the existing series of RiverSource Global Series, Inc. Except as otherwise noted, information contained herein relating to the Buying Fund applies to both the existing series of RiverSource Global Series, Inc. and the newly-created series of RiverSource Series Trust. |
1
TABLE OF CONTENTS
2
ADDITIONAL INFORMATION ABOUT EACH BUYING FUND
Attached hereto as Appendix A is the Statement of Additional Information of Columbia Global Equity Fund dated September 27, 2010, as supplemented.
INDEPENDENT REGISTERED PUBLIC ACCOUNTING FIRMS
Ernst & Young LLP, located at 220 South 6th Street, Suite 1400, Minneapolis, MN 55402, is the independent registered public accounting firm for the Buying Fund providing audit and other accounting and tax-related services as requested by the Buying Fund. The Report of Independent Registered Public Accounting Firm, Financial Highlights and Financial Statements included in the Buying Fund’s Annual Report to Shareholders for the fiscal year ended October 31, 2009 and the Financial Highlights and Financial Statements included in the Semiannual Report to Shareholders for the period ended April 30, 2010 are incorporated by reference into this SAI. The audited financial statements for the Buying Fund incorporated by reference into this SAI and the audited financial statements for Threadneedle Global Equity Income Fund incorporated by reference into the Proxy Statement/Prospectus have been so included and incorporated in reliance upon the report of Ernst & Young LLP given on their authority as experts in auditing and accounting. The audited financial statements for Columbia World Equity Fund and Columbia Global Value Fund incorporated by reference to the Proxy Statement/Prospectus have been so included and incorporated in reliance upon the reports of PricewaterhouseCoopers LLP given on their authority as experts in auditing and accounting.
FINANCIAL STATEMENTS
Pro forma financial statements of the Buying Fund for the Reorganizations are attached hereto as Appendix B.
3
Appendix A - Statement of Additional Information of Columbia Global Equity Fund
4
STATEMENT OF ADDITIONAL INFORMATION
Sept. 27, 2010
| | | | |
Columbia Frontier Fund, Inc. | | | | |
Class A: SLFRX | | Class B: SLFBX | | Class C: SLFCX |
Class I: — | | Class R: SFFRX | | Class R4: SFFTX |
Class R5: SFFIX | | Class Z: CFOZX | | |
Columbia Government Money Market Fund, Inc. | | | | |
Class A: SCMXX | | Class B: SCBXX | | Class C: SCCXX |
Class R: SMRXX | | Class R5: SMIXX | | Class Z: CGZXX |
Columbia Seligman Communications and Information Fund, Inc. |
Class A: SLMCX | | Class B: SLMBX | | Class C: SCICX |
Class I: — | | Class R: SCIRX | | Class R3: SCIOX |
Class R4: SCIFX | | Class R5: SCMIX | | Class Z: CCIZX |
RiverSource Bond Series, Inc. |
Columbia Floating Rate Fund |
Class A: RFRAX | | Class B: RSFBX | | Class C: RFRCX |
Class I: RFRIX | | Class R: CFRRX | | Class R4: — |
Class R5: RFRFX | | Class W: RFRWX | | Class Z: CFRZX |
Columbia Income Opportunities Fund |
Class A: AIOAX | | Class B: AIOBX | | Class C: RIOCX |
Class I: AOPIX | | Class R: CIORX | | Class R4: — |
Class W: CIOWX | | Class Z: CIOZX | | |
Columbia Inflation Protected Securities Fund |
Class A: APSAX | | Class B: APSBX | | Class C: RIPCX |
Class I: AIPIX | | Class R: RIPRX | | Class R4: — |
Class W: RIPWX | | Class Z: CIPZX | | |
Columbia Limited Duration Credit Fund |
Class A: ALDAX | | Class B: ALDBX | | Class C: RDCLX |
Class I: ALDIX | | Class R4: — | | Class W: RLDWX |
Class Z: CLDZX | | | | |
RiverSource California Tax-Exempt Trust |
RiverSource California Tax-Exempt Fund |
Class A: ICALX | | Class B: ACABX | | Class C: RCTCX |
RiverSource Dimensions Series, Inc. | | | | |
RiverSource Disciplined Small and Mid Cap Equity Fund |
Class A: RDSAX | | Class B: — | | Class C: RDSCX |
Class I: RDSIX | | Class R4: — | | Class W: RSDVX |
RiverSource Disciplined Small Cap Value Fund |
Class A: RDVAX | | Class B: — | | Class C: RDVCX |
Class I: RCVIX | | Class R: — | | Class R3: — |
RiverSource Diversified Income Series, Inc. |
Columbia Diversified Bond Fund | | | | |
Class A: INBNX | | Class B: ININX | | Class C: AXBCX |
Class I: RDBIX | | Class R: — | | Class R3: RSDBX |
Class R4: IDBYX | | Class R5: RSVBX | | Class W: RVBWX |
Class Z: CDBZX | | | | |
RiverSource Equity Series, Inc. | | | | |
Columbia Mid Cap Growth Opportunity Fund |
Class A: INVPX | | Class B: IDQBX | | Class C: AESCX |
Class I: AQUIX | | Class R: — | | Class R3: — |
Class R4: IESYX | | Class Z: CVOZX | | |
RiverSource Global Series, Inc. | | | | |
Columbia Absolute Return Currency and Income Fund |
Class A: RARAX | | Class B: — | | Class C: RARCX |
Class I: RVAIX | | Class W: RACWX | | Class Z: CACZX |
Columbia Emerging Markets Bond Fund | | | | |
Class A: REBAX | | Class B: — | | Class C: REBCX |
Class I: RSMIX | | Class R4: — | | Class W: REMWX |
Class Z: CMBZX | | | | |
1
| | | | |
Columbia Global Bond Fund | | | | |
Class A: IGBFX | | Class B: IGLOX | | Class C: AGBCX |
Class I: AGBIX | | Class R: — | | Class R4: RGBRX |
Class W: RGBWX | | Class Z: CGBZX | | |
Columbia Emerging Markets Opportunity Fund | | | | |
Class A: IDEAX | | Class B: IEMBX | | Class C: RMCEX |
Class I: RSRIX | | Class R: REMRX | | Class R4: — |
Class R5: REMFX | | Class W: CMOWX | | Class Z: CEOZX |
Columbia Global Equity Fund | | | | |
Class A: IGIGX | | Class B: IDGBX | | Class C: RGCEX |
Class I: — | | Class R: — | | Class R4: IDGYX |
Class R5: RGERX | | Class W: — | | Class Z: CGEZX |
Columbia Global Extended Alpha Fund | | | | |
Class A: RTAAX | | Class B: — | | Class C: RTACX |
Class I: — | | Class R: REAOX | | Class R4: REYRX |
Class Z: CEAZX | | | | |
Threadneedle Global Equity Income Fund | | | | |
Class A: RTNAX | | Class B: — | | Class C: RTNEX |
Class I: — | | Class R: RGEOX | | Class R4: RGEYX |
RiverSource Government Income Series, Inc. | | | | |
Columbia U.S. Government Mortgage Fund | | | | |
Class A: AUGAX | | Class B: AUGBX | | Class C: AUGCX |
Class I: RVGIX | | Class R4: RSGYX | | Class Z: CUGZX |
RiverSource Short Duration U.S. Government Fund | | | | |
Class A: IFINX | | Class B: ISHOX | | Class C: AXFCX |
Class I: AGMIX | | Class R: RSDRX | | Class R4: IDFYX |
Class W: RSDWX | | | | |
RiverSource High Yield Income Series, Inc. | | | | |
Columbia High Yield Bond Fund | | | | |
Class A: INEAX | | Class B: IEIBX | | Class C: APECX |
Class I: RSHIX | | Class R: — | | Class R3: — |
Class R4: RSHYX | | Class R5: RSHRX | | Class W: RHYWX |
Class Z: CHYZX | | | | |
RiverSource Income Series, Inc. | | | | |
Columbia Income Builder Fund | | | | |
Class A: RBBAX | | Class B: RBBBX | | Class C: RBBCX |
Class R4: — | | Class R: CBURX | | Class Z: CBUZX |
Columbia Income Builder Fund II | | | | |
Class A: RSMAX | | Class B: RSMBX | | Class C: RSMCX |
Class R4: — | | | | |
Columbia Income Builder Fund III | | | | |
Class A: RSBAX | | Class B: REIVX | | Class C: RIECX |
Class R4: — | | | | |
RiverSource International Managers Series, Inc. | | | | |
Columbia Multi-Advisor International Value Fund | | | | |
Class A: APIAX | | Class B: AXIBX | | Class C: APICX |
Class I: APRIX | | Class R4: — | | Class Z: CMVZX |
RiverSource Partners International Select Growth Fund | | | | |
Class A: AXGAX | | Class B: APIBX | | Class C: RIACX |
Class I: AIGGX | | Class R: RISRX | | Class R4: — |
Class R5: RISSX | | | | |
RiverSource Partners International Small Cap Fund | | | | |
Class A: AISCX | | Class B: APNBX | | Class C: RISLX |
Class I: RPSCX | | Class R: — | | Class R4: — |
Class R5: — | | | | |
| | |
| Statement of Additional Information — Sept. 27, 2010 | | | | |
2
| | | | |
RiverSource International Series, Inc. | | | | |
Columbia Asia Pacific ex-Japan Fund | | | | |
Class A: CAJAX | | Class C: CAJCX | | Class R: CAJRX |
Class R5: TAPRX | | Class Z: CAJZX | | |
Columbia European Equity Fund | | | | |
Class A: AXEAX | | Class B: AEEBX | | Class C: REECX |
Class I: — | | Class R4: — | | Class Z: CEEZX |
RiverSource Disciplined International Equity Fund | | | | |
Class A: RDIAX | | Class B: RDIBX | | Class C: RDICX |
Class I: RSDIX | | Class R: RDIOX | | Class R4: RDIRX |
Class W: RDIWX | | | | |
Threadneedle International Opportunity Fund | | | | |
Class A: INIFX | | Class B: IWWGX | | Class C: ROPCX |
Class I: ATNIX | | Class R: — | | Class R4: IDIYX |
RiverSource Investment Series, Inc. | | | | |
Columbia Diversified Equity Income Fund | | | | |
Class A: INDZX | | Class B: IDEBX | | Class C: ADECX |
Class I: ADIIX | | Class R: RDEIX | | Class R3: RDERX |
Class R4: IDQYX | | Class R5: RSEDX | | Class W: — |
Class Z: CDVZX | | | | |
Columbia Large Growth Quantitative Fund | | | | |
Class A: RDLAX | | Class B: — | | Class C: RDLCX |
Class I: RDLIX | | Class R: — | | Class R4: RDLFX |
Class W: RDLWX | | Class Z: CLQZX | | |
Columbia Large Value Quantitative Fund | | | | |
Class A: RLCAX | | Class B: — | | Class C: RDCCX |
Class I: — | | Class R: RLCOX | | Class R4: RLCYX |
Class W: RLCWX | | Class Z: CVQZX | | |
Columbia Mid Cap Value Opportunity Fund | | | | |
Class A: AMVAX | | Class B: AMVBX | | Class C: AMVCX |
Class I: RMCIX | | Class R: RMVTX | | Class R3: RMCRX |
Class R4: RMCVX | | Class R5: RSCMX | | Class W: — |
Class Z: CMOZX | | | | |
RiverSource Balanced Fund | | | | |
Class A: INMUX | | Class B: IDMBX | | Class C: RVBCX |
Class R: RVBRX | | Class R4: IDMYX | | Class R5: RVBSX |
RiverSource Large Cap Series, Inc. | | | | |
Columbia Large Core Quantitative Fund | | | | |
Class A: AQEAX | | Class B: AQEBX | | Class C: RDCEX |
Class I: ALEIX | | Class R: — | | Class R4: RQEYX |
Class R5: RSIPX | | Class W: RDEWX | | Class Z: CCRZX |
RiverSource Managers Series, Inc. | | | | |
Columbia Multi-Advisor Small Cap Value Fund | | | | |
Class A: ASVAX | | Class B: ASVBX | | Class C: APVCX |
Class I: — | | Class R: RSVTX | | Class R3: RSVRX |
Class R4: RSGLX | | Class R5: RSCVX | | Class Z: CMAZX |
RiverSource Partners Fundamental Value Fund | | | | |
Class A: AFVAX | | Class B: AFVBX | | Class C: AFVCX |
Class I: AFVIX | | Class R4: — | | |
RiverSource Market Advantage Series, Inc. | | | | |
Columbia Portfolio Builder Aggressive Fund | | | | |
Class A: AXBAX | | Class B: AXPBX | | Class C: RBGCX |
Class R: CPARX | | Class R4: — | | Class Z: CPAZX |
Columbia Portfolio Builder Conservative Fund | | | | |
Class A: ABDAX | | Class B: ABBDX | | Class C: RPCCX |
Class R: CBURX | | Class R4: — | | Class Z: CBVZX |
3
| | | | |
Columbia Portfolio Builder Moderate Aggressive Fund | | | | |
Class A: AXMAX | | Class B: ABMBX | | Class C: AGECX |
Class R: CBARX | | Class R4: — | | Class Z: CBAZX |
Columbia Portfolio Builder Moderate Conservative Fund | | | | |
Class A: AUCAX | | Class B: AMDBX | | Class C: RBMCX |
Class R: CPMRX | | Class R4: — | | Class Z: CPMZX |
Columbia Portfolio Builder Moderate Fund | | | | |
Class A: ABUAX | | Class B: AURBX | | Class C: AMTCX |
Class R: CBMRX | | Class R4: — | | Class Z: CBMZX |
Columbia Portfolio Builder Total Equity Fund | | | | |
Class A: AXTAX | | Class B: AXTBX | | Class C: RBTCX |
Class R4: — | | | | |
RiverSource S&P 500 Index Fund | | | | |
Class A: ADIDX | | Class Z: ADIEX | | |
RiverSource Small Company Index Fund | | | | |
Class A: ISIAX | | Class B: ISIBX | | Class R4: ISCYX |
RiverSource Money Market Series, Inc. | | | | |
Columbia Money Market Fund | | | | |
Class A: IDSXX | | Class B: ACBXX | | Class C: RCCXX |
Class I: RCIXX | | Class R: RVRXX | | Class R5: — |
Class W: RCWXX | | Class Z: IDYXX | | |
RiverSource Sector Series, Inc. | | | | |
Columbia Dividend Opportunity Fund | | | | |
Class A: INUTX | | Class B: IUTBX | | Class C: ACUIX |
Class I: RSOIX | | Class R: RSOOX | | Class R4: RSORX |
Class R5: RSDFX | | Class W: — | | Class Z: CDOZX |
RiverSource Real Estate Fund | | | | |
Class A: ARLAX | | Class B: AESBX | | Class C: RRECX |
Class I: AESIX | | Class R4: — | | Class W: RREWX |
RiverSource Selected Series, Inc. | | | | |
RiverSource Precious Metals and Mining Fund | | | | |
Class A: INPMX | | Class B: INPBX | | Class C: RPMCX |
Class I: — | | Class R4: AEVYX | | |
RiverSource Series Trust | | | | |
Columbia 120/20 Contrarian Equity Fund | | | | |
Class A: RCEAX | | Class B: RZZBX | | Class C: RECCX |
Class I: — | | Class Z: CCEZX | | |
Columbia Recovery and Infrastructure Fund | | | | |
Class A: RRIAX | | Class B: RRIBX | | Class C: RRICX |
Class I: RRIIX | | Class R: RRIRX | | Class R4: RRIYX |
Class R5: RRIZX | | Class Z: CRIZX | | |
Columbia Retirement Plus 2010 Fund | | | | |
Class A: — | | Class C: CRTCX | | Class R: — |
Class Y: RSSPX | | | | |
Columbia Retirement Plus 2015 Fund | | | | |
Class A: — | | Class C: CRPCX | | Class R: — |
Class Y: RSFNX | | | | |
Columbia Retirement Plus 2020 Fund | | | | |
Class A: — | | Class C: CRUCX | | Class R: — |
Class Y: RSNFX | | | | |
Columbia Retirement Plus 2025 Fund | | | | |
Class A: — | | Class C: CRLCX | | Class R: — |
Class Y: RSMEX | | | | |
Columbia Retirement Plus 2030 Fund | | | | |
Class A: — | | Class C: CRRCX | | Class R: — |
Class Y: RPTYX | | | | |
4
| | | | |
Columbia Retirement Plus 2035 Fund | | | | |
Class A: — | | Class C: CRPZX | | Class R: — |
Class Y: RPOYX | | | | |
Columbia Retirement Plus 2040 Fund | | | | |
Class A: — | | Class C: CRWCX | | Class R: — |
Class Y: RPFYX | | | | |
Columbia Retirement Plus 2045 Fund | | | | |
Class A: — | | Class C: CFRCX | | Class R: — |
Class R4: RSNNX | | Class Y: RRPYX | | |
RiverSource Special Tax-Exempt Series Trust | | | | |
Columbia Minnesota Tax-Exempt Fund | | | | |
Class A: IMNTX | | Class B: IDSMX | | Class C: RMTCX |
Class Z: CMNZX | | | | |
RiverSource New York Tax-Exempt Fund | | | | |
Class A: INYKX | | Class B: — | | Class C: RNTCX |
RiverSource Strategic Allocation Series, Inc. | | | | |
Columbia Strategic Allocation Fund | | | | |
Class A: IMRFX | | Class B: IMRBX | | Class C: RSSCX |
Class I: — | | Class R: — | | Class R4: IDRYX |
Class Z: CSAZX | | | | |
RiverSource Strategic Income Allocation Fund | | | | |
Class A: RSGAX | | Class B: RIABX | | Class C: RAICX |
Class R: RSDOX | | Class R4: RSTRX | | Class R5: RSFRX |
RiverSource Strategy Series, Inc. | | | | |
Columbia Equity Value Fund | | | | |
Class A: IEVAX | | Class B: INEGX | | Class C: REVCX |
Class I: — | | Class R: REVRX | | Class R3: RSEVX |
Class R4: AEVYX | | Class R5: RSEYX | | Class W: — |
Class Z: CEVZX | | | | |
RiverSource Tax-Exempt Income Series, Inc. | | | | |
RiverSource Tax-Exempt High Income Fund | | | | |
Class A: INHYX | | Class B: IHYBX | | Class C: AHECX |
RiverSource Tax-Exempt Series, Inc. | | | | |
Columbia AMT-Free Tax-Exempt Bond Fund | | | | |
Class A: INTAX | | Class B: ITEBX | | Class C: RTCEX |
Class Z: CATZX | | | | |
RiverSource Intermediate Tax-Exempt Fund | | | | |
Class A: INFAX | | Class B: INFBX | | Class C: RTICX |
Seligman Capital Fund, Inc. | | | | |
Class A: SCFIX | | Class B: SLCBX | | Class C: SCLCX |
Class I: — | | Class R: SCFRX | | Class R5: SCLIX |
Seligman Global Fund Series, Inc. | | | | |
Columbia Seligman Global Technology Fund | | | | |
Class A: SHGTX | | Class B: SHTBX | | Class C: SHTCX |
Class I: — | | Class R: SGTRX | | Class R4: SGTSX |
Class R5: SGTTX | | Class Z: CSGZX | | |
Seligman Growth Fund, Inc. | | | | |
Class A: SGRFX | | Class B: SGBTX | | Class C: SGRCX |
Class I: — | | Class R: SGRFX | | Class R4: SGRSX |
Class R5: SGFIX | | | | |
Seligman LaSalle Real Estate Fund Series, Inc. | | | | |
RiverSource LaSalle Global Real Estate Fund | | | | |
Class A: SLDAX | | Class C: SLDCX | | Class I: — |
Class R: SLDRX | | Class R4: SLDTX | | Class R5: SLDIX |
RiverSource LaSalle Monthly Dividend Real Estate Fund | | | | |
Class A: SREAX | | Class B: SREBX | | Class C: SRECX |
Class I: — | | Class R: SRERX | | Class R4: SLRCX |
Class R5: SREIX | | | | |
5
| | | | |
Seligman Municipal Fund Series, Inc. | | | | |
Seligman Minnesota Municipal Class | | | | |
Class A: SMNNX | | Class C: SMNCX | | |
Seligman National Municipal Class | | | | |
Class A: SNXEX | | Class C: SNACX | | |
Seligman New York Municipal Class | | | | |
Class A: SNYTX | | Class C: SNYCX | | |
Seligman Municipal Series Trust | | | | |
Seligman California Municipal High Yield Series | | | | |
Class A: SCHYX | | Class C: SCHCX | | |
Seligman California Municipal Quality Series | | | | |
Class A: SCTQX | | Class C: SCQCX | | |
Seligman TargetHorizon ETF Portfolios, Inc. | | | | |
Seligman TargETFund 2015* | | | | |
Class A: STJAX | | Class B: — | | Class C: STJCX |
Class R: STJRX | | Class R5: STJIX | | |
Seligman TargETFund 2025* | | | | |
Class A: STKAX | | Class B: — | | Class C: STKCX |
Class R: STKRX | | Class R5: STKIX | | |
Seligman TargETFund 2035* | | | | |
Class A: STZAX | | Class B: — | | Class C: STZCX |
Class R: STZRX | | Class R5: STZIX | | |
Seligman TargETFund 2045* | | | | |
Class A: STQAX | | Class B: — | | Class C: STQCX |
Class R: STQRX | | Class R5: STQIX | | |
Seligman TargETFund Core* | | | | |
Class A: SHVAX | | Class B: — | | Class C: SHVCX |
Class R: SHVRX | | Class R5: SHVIX | | |
Seligman Value Fund Series, Inc. | | | | |
Columbia Select Large-Cap Value Fund | | | | |
Class A: SLVAX | | Class B: SLVBX | | Class C: SLVCX |
Class I: — | | Class R: SLVRX | | Class R4: SLVTX |
Class R5: SLVIX | | Class W: CSVWX | | Class Z: CSVZX |
Columbia Select Smaller-Cap Value Fund | | | | |
Class A: SSCVX | | Class B: SSCBX | | Class C: SVMCX |
Class I: — | | Class R: SSVRX | | Class R4: SSLRX |
Class R5: SSVIX | | Class Z: CSSZX | | |
| * | Effective May 28, 2010 the funds are no longer open to new investors. All outstanding shares of each fund are anticipated to be redeemed on or about Nov. 30, 2010. |
This is the Statement of Additional Information (“SAI”) for each of the funds listed on the previous pages. This SAI is not a prospectus. It should be read together with the appropriate current fund prospectus, the date of which can be found in Table 1 of this SAI.
Each fund’s financial statements for its most recent fiscal period are contained in the fund’s annual or semiannual report to shareholders. The Independent Registered Public Accounting Firm’s Report and the Financial Statements, including Notes to the Financial Statements and the Schedule of Investments in Securities and any applicable Schedule of Affiliated Funds, contained in the Annual Report, are incorporated in this SAI by reference. No other portion of the Annual Report is incorporated by reference. For a free copy of a fund prospectus, annual or semiannual report, contact your financial intermediary (or selling/servicing agent) or write to the family of funds, which includes Columbia, RiverSource, Seligman and Threadneedle branded funds (collectively, the “Fund Family”), at c/o Columbia Management Investment Services Corp., P.O. Box 8081, Boston, MA 02266-8081, call 800.345.6611 or visit columbiamanagement.com.
Each fund is governed by a Board of Directors/Trustees (the “Board”) that meets regularly to review a wide variety of matters affecting the funds. Detailed information about fund governance, the funds’ investment manager, Columbia Management Investment Advisers, LLC (the “investment manager” or “Columbia Management”), a wholly-owned subsidiary of Ameriprise Financial, Inc. (“Ameriprise Financial”), and other aspects of fund management can be found by referencing the Table of Contents or the List of Tables on the following pages.
6
Table of Contents
7
List of Tables
8
Table 1. Fund Fiscal Year Ends, Prospectus Date and Investment Categories
| | | | | | |
Fund | | Fiscal Year End | | Prospectus Date | | Fund Investment Category |
| Columbia 120/20 Contrarian Equity | | April 30 | | June 29, 2010 | | Equity |
| Columbia Absolute Return Currency and Income | | October 31 | | Dec. 30, 2009 | | Taxable fixed income* |
| Columbia AMT-Free Tax-Exempt Bond | | November 30 | | Jan. 29, 2010 | | Tax-exempt fixed income |
| Columbia Asia Pacific ex-Japan | | October 31 | | Dec. 30, 2009 | | Equity |
| Columbia Diversified Bond | | August 31 | | Oct. 30, 2009 | | Taxable fixed income |
| Columbia Diversified Equity Income | | September 30 | | Nov. 27, 2009 | | Equity |
| Columbia Dividend Opportunity | | June 30 | | Aug. 27, 2010 | | Equity |
| Columbia Emerging Markets Bond | | October 31 | | Dec. 30, 2009 | | Taxable fixed income |
| Columbia Emerging Markets Opportunity | | October 31 | | Dec. 30, 2009 | | Equity |
| Columbia Equity Value | | March 31 | | May 28, 2010 | | Equity |
| Columbia European Equity | | October 31 | | Dec. 30, 2009 | | Equity |
| Columbia Floating Rate | | July 31 | | Sept. 27, 2010 | | Taxable fixed income |
| Columbia Frontier | | October 31 | | Dec. 30, 2009 | | Equity |
| Columbia Global Bond | | October 31 | | Dec. 30, 2009 | | Taxable fixed income |
| Columbia Global Equity | | October 31 | | Dec. 30, 2009 | | Equity |
| Columbia Global Extended Alpha Fund | | October 31 | | Dec. 30, 2009 | | Equity |
| Columbia Government Money Market | | December 31 | | March 1, 2010 | | Taxable Money Market |
| Columbia High Yield Bond | | May 31 | | July 30, 2010 | | Taxable fixed income |
| Columbia Income Builder Fund | | January 31** | | April 1, 2010 | | Fund-of-funds – fixed income |
| Columbia Income Builder Fund II | | January 31** | | April 1, 2010 | | Fund-of-funds – fixed income |
| Columbia Income Builder Fund III | | January 31** | | April 1, 2010 | | Fund-of-funds – fixed income |
| Columbia Income Opportunities | | July 31 | | Sept. 27, 2010 | | Taxable fixed income |
| Columbia Inflation Protected Securities | | July 31 | | Sept. 27, 2010 | | Taxable fixed income |
| Columbia Large Core Quantitative Equity | | July 31 | | Sept. 27, 2010 | | Equity |
| Columbia Large Growth Quantitative | | September 30 | | Nov. 27, 2009 | | Equity |
| Columbia Large Value Quantitative | | September 30 | | Nov. 27, 2009 | | Equity |
| Columbia Limited Duration Credit | | July 31 | | Sept. 27, 2010 | | Taxable fixed income |
| Columbia Mid Cap Growth Opportunity | | November 30 | | Jan. 22, 2010 | | Equity |
| Columbia Mid Cap Value Opportunity | | September 30 | | Nov. 27, 2009 | | Equity |
| Columbia Minnesota Tax-Exempt | | August 31 | | Oct. 30, 2009 | | State tax-exempt fixed income |
| Columbia Money Market | | July 31 | | Sept. 27, 2010 | | Taxable money market |
| Columbia Multi-Advisor International Value | | October 31 | | Dec. 30, 2009 | | Equity |
| Columbia Multi-Advisor Small Cap Value | | May 31 | | July 30, 2010 | | Equity |
| Columbia Portfolio Builder Aggressive | | January 31 | | April 1, 2010 | | Fund-of-funds – equity |
| Columbia Portfolio Builder Conservative | | January 31 | | April 1, 2010 | | Fund-of-funds – fixed income |
| Columbia Portfolio Builder Moderate | | January 31 | | April 1, 2010 | | Fund-of-funds – equity |
| Columbia Portfolio Builder Moderate Aggressive | | January 31 | | April 1, 2010 | | Fund-of-funds – equity |
| Columbia Portfolio Builder Moderate Conservative | | January 31 | | April 1, 2010 | | Fund-of-funds – fixed income |
| Columbia Portfolio Builder Total Equity | | January 31 | | April 1, 2010 | | Fund-of-funds – equity |
| Columbia Recovery and Infrastructure | | April 30 | | June 29, 2010 | | Equity |
| Columbia Retirement Plus 2010 | | April 30 | | June 29, 2010 | | Fund-of-funds – equity |
| Columbia Retirement Plus 2015 | | April 30 | | June 29, 2010 | | Fund-of-funds – equity |
| Columbia Retirement Plus 2020 | | April 30 | | June 29, 2010 | | Fund-of-funds – equity |
| Columbia Retirement Plus 2025 | | April 30 | | June 29, 2010 | | Fund-of-funds – equity |
| Columbia Retirement Plus 2030 | | April 30 | | June 29, 2010 | | Fund-of-funds – equity |
| Columbia Retirement Plus 2035 | | April 30 | | June 29, 2010 | | Fund-of-funds – equity |
| Columbia Retirement Plus 2040 | | April 30 | | June 29, 2010 | | Fund-of-funds – equity |
| Columbia Retirement Plus 2045 | | April 30 | | June 29, 2010 | | Fund-of-funds – equity |
| Columbia Select Large-Cap Value | | December 31 | | March 1, 2010 | | Equity |
| Columbia Select Smaller-Cap Value | | December 31 | | March 1, 2010 | | Equity |
| Columbia Seligman Communications and Information | | December 31 | | March 1, 2010 | | Equity |
| Columbia Seligman Global Technology | | October 31 | | Dec. 30, 2009 | | Equity |
| Columbia Strategic Allocation | | September 30 | | Nov. 27, 2009 | | Balanced |
| Columbia U.S. Government Mortgage | | May 31 | | July 30, 2010 | | Taxable fixed income |
| RiverSource Balanced | | September 30 | | Nov. 27, 2009 | | Balanced |
| RiverSource California Tax-Exempt | | August 31 | | Oct. 30, 2009 | | State tax-exempt fixed income |
| RiverSource Disciplined International Equity | | October 31 | | Dec. 30, 2008 | | Equity |
| RiverSource Disciplined Small and Mid Cap Equity | | July 31 | | Sept. 27, 2010 | | Equity |
| RiverSource Disciplined Small Cap Value | | July 31 | | Sept. 27, 2010 | | Equity |
| RiverSource Intermediate Tax-Exempt | | November 30 | | Jan. 29, 2010 | | Tax-exempt fixed income |
| RiverSource LaSalle Global Real Estate | | December 31 | | March 1, 2010 | | Equity |
| RiverSource LaSalle Monthly Dividend Real Estate | | December 31 | | March 1, 2010 | | Equity |
| RiverSource New York Tax-Exempt | | August 31 | | Oct. 30, 2009 | | State tax-exempt fixed income |
9
| | | | | | |
| RiverSource Partners Fundamental Value | | May 31 | | July 30, 2010 | | Equity |
| RiverSource Partners International Select Growth | | October 31 | | Dec. 30, 2009 | | Equity |
| RiverSource Partners International Small Cap | | October 31 | | Dec. 30, 2009 | | Equity |
| RiverSource Precious Metals and Mining | | March 31 | | May 28, 2010 | | Equity |
| RiverSource Real Estate | | June 30 | | Aug. 27, 2010 | | Equity |
| RiverSource S&P 500 Index | | January 31 | | April 1, 2010 | | Equity |
| RiverSource Short Duration U.S. Government | | May 31 | | July 30, 2010 | | Taxable fixed income |
| RiverSource Small Company Index | | January 31 | | April 1, 2010 | | Equity |
| RiverSource Strategic Income Allocation | | September 30 | | Nov. 27, 2009 | | Taxable fixed income* |
| RiverSource Tax-Exempt High Income | | November 30 | | Jan. 29, 2010 | | Tax-exempt fixed income |
| Seligman California Municipal High-Yield | | September 30 | | Nov. 27, 2009 | | State tax-exempt fixed income |
| Seligman California Municipal Quality | | September 30 | | Nov. 27, 2009 | | State tax-exempt fixed income |
| Seligman Capital | | December 31 | | March 1, 2010 | | Equity |
| Seligman Growth | | December 31 | | March 1, 2010 | | Equity |
| Seligman Minnesota Municipal | | September 30 | | Nov. 27, 2009 | | State tax-exempt fixed income |
| Seligman National Municipal | | September 30 | | Nov. 27, 2009 | | Tax-exempt fixed income |
| Seligman New York Municipal | | September 30 | | Nov. 27, 2009 | | State tax-exempt fixed income |
| Seligman TargETFund 2015 | | September 30 | | Nov. 27, 2009 | | Fund-of-funds – equity |
| Seligman TargETFund 2025 | | September 30 | | Nov. 27, 2009 | | Fund-of-funds – equity |
| Seligman TargETFund 2035 | | September 30 | | Nov. 27, 2009 | | Fund-of-funds – equity |
| Seligman TargETFund 2045 | | September 30 | | Nov. 27, 2009 | | Fund-of-funds – equity |
| Seligman TargETFund Core | | September 30 | | Nov. 27, 2009 | | Fund-of-funds – equity |
| Threadneedle Global Equity Income Fund | | October 31 | | Dec. 30, 2009 | | Equity |
| Threadneedle International Opportunity | | October 31 | | Dec. 30, 2009 | | Equity |
| * | The taxable fixed income fund investment category includes Columbia Absolute Return Currency and Income Fund, which is an alternative investment strategy. Although RiverSource Strategic Income Allocation Fund is a taxable fixed income fund, it may invest up to 10% of its portfolio in equity securities. |
| ** | The fund changed its fiscal year end effective Jan. 31, 2008 from May 31 to Jan. 31. For 2008, the information shown is for the period from June 1, 2007 to Jan. 31, 2008. For years prior to 2008, the fiscal period ended May 31. |
10
Fundamental and Nonfundamental Investment Policies
Fundamental investment policies adopted by a fund cannot be changed without the approval of a majority of the outstanding voting securities of the fund (i.e., shareholders) as defined in the Investment Company Act of 1940, as amended (the “1940 Act”). Nonfundamental investment policies may be changed by the Board at any time.
Notwithstanding any of a fund’s other investment policies, each fund, subject to certain limitations, may invest its assets in an open-end management investment company having substantially the same investment objectives, policies, and restrictions as the fund for the purpose of having those assets managed as part of a combined pool.
FUNDAMENTAL POLICIES
Fundamental policies are policies that can be changed only with shareholder approval. The chart below shows fund-specific policies that may be changed only with shareholder approval. The chart indicates whether or not the fund has a policy on a particular topic. A dash indicates that the fund does not have a policy on a particular topic. Please see “Investment Strategies and Types of Investments” for more information regarding your fund’s investment strategies. The specific policy is stated in the paragraphs that follow the table.
Table 2. Fundamental Policies
| | | | | | | | | | | | | | | | | | | | | | | |
Fund | | A
Buy or
sell real
estate | | B
Buy or sell
commodities | | C
Buy more
than 10% of
an issuer | | D
Invest
more than
5% in an
issuer | | E
Concentrate
in any one
industry | | F
Invest less
than 80% | | | G
Act as an
underwriter | | H
Lending | | I
Borrow
money | | J
Issue
senior
securities | | K
Buy on
margin/
sell
short |
Columbia 120/20 Contrarian Equity | | A1 | | B4 | | C1 | | D1 | | E8 | | — | | | G1 | | H1 | | I1 | | J1 | | — |
Columbia Absolute Return Currency and Income | | A1 | | B1 | | — | | — | | E7 | | — | | | G1 | | H1 | | I1 | | J1 | | — |
Columbia AMT-Free Tax-Exempt Bond | | A1 | | B1 | | C1 | | D1 | | — | | F3 | (a) | | G1 | | H1 | | I1 | | J1 | | — |
Columbia Asia Pacific ex-Japan | | A1 | | B2 | | C2 | | C2 | | E1 | | — | | | G1 | | H1 | | I1 | | J1 | | — |
Columbia Diversified Bond | | A1 | | B1 | | C1 | | D1 | | E1 | | — | | | G1 | | H1 | | I1 | | J1 | | — |
Columbia Diversified Equity Income | | A1 | | B1 | | C1 | | D1 | | E1 | | — | | | G1 | | H1 | | I1 | | J1 | | — |
Columbia Dividend Opportunity | | A1 | | B1 | | C1 | | D1 | | — | | — | | | G1 | | H1 | | I1 | | J1 | | — |
Columbia Emerging Markets Bond | | A1 | | B3 | | — | | — | | E5 | | — | | | G1 | | H1 | | I1 | | J1 | | — |
Columbia Emerging Markets Opportunity | | A1 | | B1 | | C1 | | D1 | | E1 | | — | | | G1 | | H1 | | I1 | | J1 | | — |
Columbia Equity Value | | A1 | | B1 | | C1 | | D1 | | E1 | | — | | | G1 | | H1 | | I1 | | J1 | | — |
Columbia European Equity | | A1 | | B1 | | — | | — | | E1 | | — | | | G1 | | H1 | | I1 | | J1 | | — |
Columbia Floating Rate | | A1 | | B3 | | C1 | | D1 | | E6 | | — | | | G1 | | H1 | | I1 | | J1 | | — |
Columbia Global Bond | | A1 | | B1 | | C1 | | — | | E1 | | — | | | G1 | | H1 | | I1 | | J1 | | — |
Columbia Global Equity | | A1 | | B1 | | C1 | | D1 | | E1 | | — | | | G1 | | H1 | | I1 | | J1 | | — |
Columbia Global Extended Alpha | | A1 | | B2 | | C2 | | C2 | | E1 | | — | | | G1 | | H1 | | I1 | | J1 | | — |
Columbia Government Money Market | | A6 | | — | | C4 | | C4 | | E11 | | — | | | G3 | | H5 | | J3 | | J3 | | G3 |
Columbia High Yield Bond | | A1 | | B1 | | C1 | | D1 | | E1 | | — | | | G1 | | H1 | | I1 | | J1 | | — |
Columbia Income Builder Fund* | | A1 | | B3 | | C2 | | C2 | | E2 | | — | | | G1 | | H1 | | I1 | | J1 | | — |
Columbia Income Builder Fund II* | | A1 | | B3 | | C2 | | C2 | | E2 | | — | | | G1 | | H1 | | I1 | | J1 | | — |
Columbia Income Builder Fund III* | | A1 | | B3 | | C2 | | C2 | | E2 | | — | | | G1 | | H1 | | I1 | | J1 | | — |
Columbia Income Opportunities | | A1 | | B1 | | C1 | | D1 | | E1 | | — | | | G1 | | H1 | | I1 | | J1 | | — |
Columbia Inflation Protected Securities | | A1 | | B1 | | — | | — | | E1 | | — | | | G1 | | H1 | | I1 | | J1 | | — |
Columbia Large Core Quantitative | | A1 | | B1 | | C1 | | D1 | | E1 | | — | | | G1 | | H1 | | I1 | | J1 | | — |
Columbia Large Growth Quantitative | | A1 | | B2 | | C1 | | D1 | | E1 | | — | | | G1 | | H1 | | I1 | | J1 | | — |
Columbia Large Value Quantitative | | A1 | | B2 | | C2 | | C2 | | E1 | | — | | | G1 | | H1 | | I1 | | J1 | | — |
Columbia Limited Duration Credit | | A1 | | B1 | | C1 | | D1 | | E1 | | — | | | G1 | | H1 | | I1 | | J1 | | — |
Columbia Mid Cap Growth Opportunity | | A1 | | B1 | | C1 | | D1 | | E1 | | — | | | G1 | | H1 | | I1 | | J1 | | — |
Columbia Mid Cap Value Opportunity | | A1 | | B1 | | C1 | | D1 | | E1 | | — | | | G1 | | H1 | | I1 | | J1 | | — |
Columbia Minnesota Tax-Exempt | | A1 | | B1 | | — | | — | | — | | F1 | | | G1 | | H1 | | I1 | | J1 | | — |
Columbia Money Market | | A2 | | A2 | | C1 | | D1 | | — | | — | | | G1 | | H1 | | I1 | | J1 | | K1 |
Columbia Multi-Advisor International Value | | A1 | | B2 | | C1 | | D1 | | E1 | | — | | | G1 | | H1 | | I1 | | J1 | | — |
Columbia Multi-Advisor Small Cap Value | | A1 | | B2 | | — | | — | | E1 | | — | | | G1 | | H1 | | I1 | | J1 | | — |
Columbia Portfolio Builder Aggressive* | | A1 | | B1 | | C2 | | C2 | | E2 | | — | | | G1 | | H1 | | I1 | | J1 | | — |
Columbia Portfolio Builder Conservative* | | A1 | | B1 | | C2 | | C2 | | E2 | | — | | | G1 | | H1 | | I1 | | J1 | | — |
Columbia Portfolio Builder Moderate* | | A1 | | B1 | | C2 | | C2 | | E2 | | — | | | G1 | | H1 | | I1 | | J1 | | — |
Columbia Portfolio Builder Moderate Aggressive* | | A1 | | B1 | | C2 | | C2 | | E2 | | — | | | G1 | | H1 | | I1 | | J1 | | — |
Columbia Portfolio Builder Moderate Conservative* | | A1 | | B1 | | C2 | | C2 | | E2 | | — | | | G1 | | H1 | | I1 | | J1 | | — |
Columbia Portfolio Builder Total Equity* | | A1 | | B1 | | C2 | | C2 | | E2 | | — | | | G1 | | H1 | | I1 | | J1 | | — |
Columbia Recovery and Infrastructure | | A1 | | B3 | | — | | — | | E1 | | — | | | G1 | | H1 | | I1 | | J1 | | — |
Columbia Retirement Plus 2010* | | A1 | | B3 | | C2 | | C2 | | E2 | | — | | | G1 | | H1 | | I1 | | J1 | | — |
Columbia Retirement Plus 2015* | | A1 | | B3 | | C2 | | C2 | | E2 | | — | | | G1 | | H1 | | I1 | | J1 | | — |
Columbia Retirement Plus 2020* | | A1 | | B3 | | C2 | | C2 | | E2 | | — | | | G1 | | H1 | | I1 | | J1 | | — |
Columbia Retirement Plus 2025* | | A1 | | B3 | | C2 | | C2 | | E2 | | — | | | G1 | | H1 | | I1 | | J1 | | — |
Columbia Retirement Plus 2030* | | A1 | | B3 | | C2 | | C2 | | E2 | | — | | | G1 | | H1 | | I1 | | J1 | | — |
Columbia Retirement Plus 2035* | | A1 | | B3 | | C2 | | C2 | | E2 | | — | | | G1 | | H1 | | I1 | | J1 | | — |
Columbia Retirement Plus 2040* | | A1 | | B3 | | C2 | | C2 | | E2 | | — | | | G1 | | H1 | | I1 | | J1 | | — |
Columbia Retirement Plus 2045* | | A1 | | B3 | | C2 | | C2 | | E2 | | — | | | G1 | | H1 | | I1 | | J1 | | — |
Columbia Select Large-Cap Value | | A3 | | B6 | | C3 | | C3 | | E10 | | — | | | G2 | | H4 | | J2 | | J2 | | K3 |
Columbia Select Smaller-Cap Value | | A3 | | B6 | | C3 | | C3 | | E10 | | — | | | G2 | | H4 | | J2 | | J2 | | K3 |
Columbia Seligman Communications and Information | | A3 | | B6 | | C3 | | C3 | | E13 | | — | | | G2 | | H4 | | J2 | | J2 | | K3 |
Columbia Seligman Global Technology | | A3 | | B6 | | C3 | | C3 | | E10 | | — | | | G2 | | H4 | | J2 | | J2 | | K3 |
Columbia Strategic Allocation | | A1 | | B1 | | C1 | | D1 | | E1 | | — | | | G1 | | H1 | | I1 | | J1 | | — |
11
| | | | | | | | | | | | | | | | | | | | | | | | | |
Fund | | A
Buy or
sell real
estate | | B
Buy or sell
commodities | | | C
Buy more
than 10% of
an issuer | | D
Invest
more than
5% in an
issuer | | E
Concentrate
in any one
industry | | F
Invest less
than 80% | | | G
Act as an
underwriter | | H
Lending | | I
Borrow
money | | J
Issue
senior
securities | | K
Buy on
margin/
sell
short | |
Columbia U.S. Government Mortgage | | A1 | | B1 | | | C1 | | D1 | | E1 | | — | | | G1 | | H1 | | I1 | | J1 | | — | |
RiverSource Balanced | | A1 | | B1 | | | C1 | | D1 | | E1 | | — | | | G1 | | H1 | | I1 | | J1 | | — | |
RiverSource California Tax-Exempt | | A1 | | B1 | | | — | | — | | — | | F1 | | | G1 | | H1 | | I1 | | J1 | | — | |
RiverSource Disciplined International Equity | | A1 | | B3 | | | C1 | | D1 | | E1 | | — | | | G1 | | H1 | | I1 | | J1 | | — | |
RiverSource Disciplined Small and Mid Cap Equity | | A1 | | B3 | | | C1 | | D1 | | E1 | | — | | | G1 | | H1 | | I1 | | J1 | | — | |
RiverSource Disciplined Small Cap Value | | A1 | | B3 | | | C1 | | D1 | | E1 | | — | | | G1 | | H1 | | I1 | | J1 | | — | |
RiverSource Intermediate Tax-Exempt | | A1 | | B1 | | | C1 | | D1 | | — | | F3 | (b) | | G1 | | H1 | | I1 | | J1 | | — | |
RiverSource LaSalle Global Real Estate | | A7 | | B6 | | | — | | — | | E12 | | — | | | G2 | | H4 | | J2 | | J2 | | K3 | |
RiverSource LaSalle Monthly Dividend Real Estate | | A7 | | B6 | | | — | | — | | E12 | | — | | | G2 | | H4 | | J2 | | J2 | | K3 | |
RiverSource New York Tax-Exempt | | A1 | | B1 | | | — | | — | | — | | F1 | | | G1 | | H1 | | I1 | | J1 | | — | |
RiverSource Partners Fundamental Value | | A1 | | B2 | | | C1 | | D1 | | E1 | | — | | | G1 | | H1 | | I1 | | J1 | | — | |
RiverSource Partners International Select Growth | | A1 | | B2 | | | C1 | | D1 | | E1 | | — | | | G1 | | H1 | | I1 | | J1 | | — | |
RiverSource Partners International Small Cap | | A1 | | B2 | | | C1 | | D1 | | E1 | | — | | | G1 | | H1 | | I1 | | J1 | | — | |
RiverSource Precious Metals and Mining | | A1 | | B1 | (c) | | — | | — | | E3 | | — | | | G1 | | H1 | | I1 | | J1 | | — | |
RiverSource Real Estate | | A1 | | B1 | | | — | | — | | — | | — | | | G1 | | H1 | | I1 | | J1 | | — | |
RiverSource S&P 500 Index | | A1 | | B1 | | | — | | — | | E4 | | — | | | G1 | | H1 | | I1 | | J1 | | — | |
RiverSource Short Duration U.S. Government | | A1 | | B1 | | | C1 | | D1 | | E1 | | — | | | G1 | | H1 | | I1 | | J1 | | — | |
RiverSource Small Company Index | | A1 | | B1 | | | C1 | | D1 | | E1 | | — | | | G1 | | H1 | | I1 | | J1 | | — | |
RiverSource Strategic Income Allocation | | A1 | | B2 | | | C1 | | D1 | | E1 | | — | | | G1 | | H1 | | I1 | | J1 | | — | |
RiverSource Tax-Exempt High Income | | A1 | | B1 | | | C1 | | D1 | | — | | F2 | | | G1 | | H1 | | I1 | | J1 | | — | |
Seligman California Municipal High-Yield | | A3 | | B5 | (d) | | D2 | | D2 | | E9 | | F4 | | | G1 | | H2 | | I2 | | — | | K2 | (e) |
Seligman California Municipal Quality | | A3 | | B5 | (d) | | D2 | | D2 | | E9 | | F4 | | | G1 | | H2 | | I2 | | — | | K2 | (e) |
Seligman Capital | | A3 | | B6 | | | C3 | | C3 | | E10 | | — | | | G2 | | H4 | | J2 | | J2 | | K3 | |
Seligman Frontier | | A3 | | B6 | | | C3 | | C3 | | E10 | | — | | | G2 | | H4 | | J2 | | J2 | | K3 | |
Seligman Growth | | A3 | | B6 | | | C3 | | C3 | | E10 | | — | | | G2 | | H4 | | J2 | | J2 | | K3 | |
Seligman Minnesota Municipal | | A4 | | B5 | | | D2 | | D2 | | E9 | | F4 | | | G1 | | H3 | | I2 | | — | | K2 | |
Seligman National Municipal | | A4 | | B5 | | | D2 | | D2 | | E9 | | F4 | | | G1 | | H3 | | I2 | | — | | K2 | |
Seligman New York Municipal | | A4 | | B5 | | | D2 | | D2 | | E9 | | F4 | | | G1 | | H3 | | I2 | | — | | K2 | |
Seligman TargETFund 2015* | | A5 | | B6 | | | C3 | | C3 | | E10 | | — | | | G2 | | H4 | | J2 | | J2 | | K3 | |
Seligman TargETFund 2025* | | A5 | | B6 | | | C3 | | C3 | | E10 | | — | | | G2 | | H4 | | J2 | | J2 | | K3 | |
Seligman TargETFund 2035* | | A5 | | B6 | | | C3 | | C3 | | E10 | | — | | | G2 | | H4 | | J2 | | J2 | | K3 | |
Seligman TargETFund 2045* | | A5 | | B6 | | | C3 | | C3 | | E10 | | — | | | G2 | | H4 | | J2 | | J2 | | K3 | |
Seligman TargETFund Core* | | A5 | | B6 | | | C3 | | C3 | | E10 | | — | | | G2 | | H4 | | J2 | | J2 | | K3 | |
Threadneedle Global Equity Income | | A1 | | B2 | | | C2 | | C2 | | E1 | | — | | | G1 | | H1 | | I1 | | J1 | | — | |
Threadneedle International Opportunity | | A1 | | B1 | | | C1 | | D1 | | E1 | | — | | | G1 | | H1 | | I1 | | J1 | | — | |
| * | The fund-of-funds invests in a combination of underlying funds. These underlying funds have adopted their own investment policies that may be more or less restrictive than those of the fund-of-funds. The policies of the underlying funds may permit a fund to engage in investment strategies indirectly that would otherwise be prohibited under the fund’s investment restrictions. |
| (a) | The fund does not intend to purchase bonds or other debt securities the interest from which is subject to the alternative minimum tax. |
| (b) | For purposes of this policy, the fund will not include any investments subject to the alternative minimum tax. |
| (c) | Additionally, the fund may purchase gold, silver, or other precious metals, strategic metals or other metals occurring naturally with such metals. |
| (d) | The policy includes futures contracts. |
| (e) | A fund may be deemed an underwriter in connection with the purchase and sale of portfolio securities. |
A. Buy or sell real estate
| | A1 – | The fund will not buy or sell real estate, unless acquired as a result of ownership of securities or other instruments, except this shall not prevent the fund from investing in securities or other instruments backed by real estate or securities of companies engaged in the real estate business or real estate investment trusts. For purposes of this policy, real estate includes real estate limited partnerships. |
| | A2 – | The fund will not buy or sell real estate, commodities or commodity contracts. For purposes of this policy, real estate includes real estate limited partnerships. |
| | A3 – | The fund will not purchase or hold any real estate, except that a fund may invest in securities secured by real estate or interests therein or issued by persons (other than real estate investment trusts) which deal in real estate or interests therein. |
| | A4 – | The fund will not purchase or hold any real estate, including limited partnership interests on real property, except that the fund may invest in securities secured by real estate or interests therein or issued by persons (other than real estate investment trusts) which deal in real estate or interests therein. |
12
| | A5 – | The fund will not purchase or hold any real estate, except a fund may invest (through investments in Underlying exchange-traded funds) in securities secured by real estate or interests therein or issued by persons (including real estate investment trusts) which deal in real estate or interests therein. |
| | A6 – | The fund will not buy or hold any real estate or securities of corporations or trusts whose principal business is investing in interests in real estate. |
| | A7 – | The fund will not purchase or hold any real estate, except that the fund may (A) invest in (i) securities directly or indirectly secured by real estate or interests therein or issued by companies which invest in real estate or interests therein or (ii) securities of issuers that deal in real estate or are engaged in the real estate business, including but not limited to real estate investment trusts (and, in the case of RiverSource LaSalle Global Real Estate, RiverSource Global Real Estate Companies, as defined in the fund’s prospectus), and (B) hold and sell real estate acquired through default, liquidation, or other distributions of an interest in real estate as a result of a fund’s ownership of such securities. |
B. Buy or sell physical commodities
| | B1 – | The fund will not buy or sell physical commodities unless acquired as a result of ownership of securities or other instruments, except this shall not prevent the fund from buying or selling options and futures contracts or from investing in securities or other instruments backed by, or whose value is derived from, physical commodities. |
| | B2 – | The fund will not buy or sell physical commodities unless acquired as a result of ownership of securities or other instruments, except this shall not prevent the fund from buying or selling options, futures contracts and foreign currency or from investing in securities or other instruments backed by, or whose value is derived from, physical commodities. |
| | B3 – | The fund will not buy or sell physical commodities unless acquired as a result of ownership of securities or other instruments, except this shall not prevent the fund from buying or selling options, futures contracts and foreign currency or from entering into forward currency contracts or from investing in securities or other instruments backed by, or whose value is derived from, physical commodities. |
| | B4 – | The fund will not buy or sell commodities, except that the fund may to the extent consistent with its investment objective(s), invest in securities of companies that purchase or sell commodities or which invest in such programs, and purchase and sell options, forward contracts, futures contracts, and options on futures contracts and enter into swap contracts and other financial transactions relating to commodities. This restriction does not apply to foreign currency transactions including without limitation forward currency contracts. |
| | B5 – | The fund will not purchase or sell commodities or commodity contracts. |
| | B6 – | The fund will not purchase or sell commodities or commodity contracts, except to the extent permissible under applicable law and interpretations, as they may be amended from time to time. |
C. Buy more than 10% of an issuer
| | C1 – | The fund will not purchase more than 10% of the outstanding voting securities of an issuer, except that up to 25% of the fund’s assets may be invested without regard to this 10% limitation. For tax-exempt funds, for purposes of this policy, the terms of a municipal security determine the issuer. |
| | C2 – | The fund will not purchase securities (except securities issued or guaranteed by the U.S. Government, its agencies or instrumentalities) of any one issuer if, as a result, more than 5% of its total assets will be invested in the securities of such issuer or it would own more than 10% of the voting securities of such issuer, except that: (a) up to 25% of its total assets may be invested without regard to these limitations; and (b) a fund’s assets may be invested in the securities of one or more management investment companies to the extent permitted by the 1940 Act, the rules and regulations thereunder, or any applicable exemptive relief. |
| | C3 – | The fund will not make any investment inconsistent with its classification as a diversified company under the 1940 Act. |
13
| | C4 – | The fund will not invest more than 5% of its gross assets (taken at market) in the securities of any one issuer, other than the US Government, its agencies or instrumentalities, or buy more than 10% of the voting securities of any one issuer, other than US Government agencies or instrumentalities. |
D. Invest more than 5% in an issuer
| | D1 – | The fund will not invest more than 5% of its total assets in securities of any company, government, or political subdivision thereof, except the limitation will not apply to investments in securities issued or guaranteed by the U.S. government, its agencies, or instrumentalities, or other investment companies, and except that up to 25% of the fund’s total assets may be invested without regard to this 5% limitation. For tax-exempt funds, for purposes of this policy, the terms of a municipal security determine the issuer. |
| | D2 – | The fund will not, as to 50% of the value of its total assets, purchase securities of any issuer if immediately thereafter more than 5% of total assets at market value would be invested in the securities of any issuer (except that this limitation does not apply to obligations issued or guaranteed as to principal and interest by the U.S. Government or its agencies or instrumentalities). |
E. Concentrate
| | E1 – | The fund will not concentrate in any one industry. According to the present interpretation by the Securities and Exchange Commission (SEC), this means that up to 25% of the fund’s total assets, based on current market value at time of purchase, can be invested in any one industry. |
| | E2 – | The fund will not concentrate in any one industry. According to the present interpretation by the SEC, this means that up to 25% of the fund’s total assets, based on current market value at time of purchase, can be invested in any one industry. The fund itself does not intend to concentrate, however, the aggregation of holdings of the underlying funds may result in the fund indirectly investing more than 25% of its assets in a particular industry. The fund does not control the investments of the underlying funds and any indirect concentration will occur only as a result of the fund following its investment objectives by investing in the underlying funds. |
| | E3 – | The fund will not invest less than 25% of its total assets in the precious metals industry, based on current market value at the time of purchase, unless market conditions temporarily require a defensive investment strategy. |
| | E4 – | The fund will not concentrate in any one industry unless that industry represents more than 25% of the index tracked by the fund. For all other industries, in accordance with the current interpretation by the SEC, this means that up to 25% of the fund’s total assets, based on current market value at time of purchase, can be invested in any one industry. |
| | E5 – | While the fund may invest 25% or more of its total assets in the securities of foreign governmental and corporate entities located in the same country, it will not invest 25% or more of its total assets in any single foreign governmental issuer. |
| | E6 – | The fund will not concentrate in any one industry. According to the present interpretation by the SEC, this means that up to 25% of the fund’s total assets, based on current market value at time of purchase, can be invested in any one industry. For purposes of this restriction, loans will be considered investments in the industry of the underlying borrower, rather than that of the seller of the loan. |
| | E7 – | The fund will not concentrate in any one industry, provided however, that this restriction shall not apply to securities or obligations issued or guaranteed by the U.S. Government, banks or bank holding companies or finance companies. For all other industries, this means that up to 25% of the fund’s total assets, based on current market value at the time of purchase, can be invested in any one industry. |
| | E8 – | The fund will not purchase any securities which would cause 25% or more of the value of its total assets at the time of purchase to be invested in the securities of one or more issuers conducting their principal business activities in the same industry, provided that: a) there is no limitation with respect to obligations issued or guaranteed by the U.S. Government, any state or territory of the United States, or any of their agencies, instrumentalities or political subdivisions; and b) notwithstanding this limitation or any other fundamental investment limitation, assets may be invested in the securities of one or more management investment companies to the extent permitted by the 1940 Act, the rules and regulations thereunder and any applicable exemptive relief. |
14
| | E9 – | The fund will not invest more than 25% of total assets, at market value, in any one industry; except that municipal securities and securities of the U.S. Government, its agencies and instrumentalities are not considered an industry for purposes of this limitation. |
| | E10 – | The fund will not invest 25% or more of its total assets, at market value, in the securities of issuers in any particular industry, provided that this limitation shall exclude securities issued or guaranteed by the U.S. Government or any of its agencies or instrumentalities (which, for Seligman TargETFunds, may include mortgage related securities). |
| | E11 – | The fund will not invest more than 25% of the market value of its total assets in securities of issuers in any one industry, provided that the fund reserves the right to concentrate investments in money market instruments issued by the U.S. Government or its agencies or instrumentalities or banks or bank holding companies. |
| | E12 – | The fund will not invest 25% or more of its total assets, at market value, in the securities of issuers in any particular industry, except that the fund will invest at least 25% of the value of its total assets in securities of issuers principally engaged in the real estate industry (in which the fund intends to concentrate) and may invest without limit in securities issued or guaranteed by the U.S. government or any of its agencies or instrumentalities. |
| | E13 – | The fund will not invest 25% or more of its total assets, at market value, in the securities of issuers in any particular industry, except that the fund will invest at least 25% of the value of its total assets in securities of companies principally engaged in the communications, information and related industries and provided that this limitation shall exclude securities issued or guaranteed by the U.S. Government or any of its agencies or instrumentalities. |
For purposes of applying the limitation set forth in the concentration policy, above, the funds will generally use the industry classifications provided by the Global Industry Classification System.
F. Invest less than 80%
| | F1 – | The fund will not under normal market conditions, invest less than 80% of its net assets in municipal obligations that are generally exempt from federal income tax as well as respective state and local income tax. |
| | F2 – | The fund will not under normal market conditions, invest less than 80% of its net assets in bonds and notes issued by or on behalf of state and local governmental units whose interest, in the opinion of counsel for the issuer, is exempt from federal income tax and is not subject to the alternative minimum tax. |
| | F3 – | The fund will not under normal market conditions, invest less than 80% of its net assets in bonds and other debt securities issued by or on behalf of state or local governmental units whose interest, in the opinion of counsel for the issuer, is exempt from federal income tax. |
| | F4 – | The fund will not, under normal market conditions, invest less than 80% of its net assets in securities the interest on which is exempt from regular federal income tax and (except for Seligman National Municipal) regular, personal income tax of its designated state, and temporary investments in taxable securities will be limited to 20% of the value of the fund’s net assets. |
G. Act as an underwriter
| | G1 – | The fund will not act as an underwriter (sell securities for others). However, under the securities laws, the fund may be deemed to be an underwriter when it purchases securities directly from the issuer and later resells them. |
| | G2 – | The fund will not underwrite the securities of other issuers, except insofar as the fund may be deemed an underwriter under the Securities Act of 1933 (the 1933 Act) in disposing of a portfolio security or in connection with investments in other investment companies. |
| | G3 – | The fund will not underwrite the securities of other issuers; make “short” sales of securities, or purchase securities on “margin”; write or purchase put or call options. |
15
H. Lending
| | H1 – | The fund will not lend securities or participate in an interfund lending program if the total of all such loans would exceed 33 1/3% of the fund’s total assets except this fundamental investment policy shall not prohibit the fund from purchasing money market securities, loans, loan participation or other debt securities, or from entering into repurchase agreements. For funds-of-funds – equity, under current Board policy, the fund has no current intention to borrow to a material extent. |
| | H2 – | The fund will not make loans, except to the extent that the purchase of notes, bonds or other evidences of indebtedness or deposits with banks may be considered loans. |
| | H3 – | The fund will not make loans except to the extent that the purchase of notes, bonds or other evidences of indebtedness or the entry into repurchase agreements or deposits with banks may be considered loans. The fund does not have a present intention of entering into repurchase agreements. |
| | H4 – | The fund will not make loans, except as permitted by the 1940 Act or any rule thereunder, any SEC or SEC staff interpretations thereof or any exemptions therefrom which may be granted by the SEC. |
| | H5 – | The fund will not make loans, except loans of portfolio securities and except to the extent that the purchase of notes, bonds or other evidences of indebtedness, the entry into repurchase agreements or deposits with banks, may be considered loans. |
I. Borrowing
| | I1 – | The fund will not borrow money, except for temporary purposes (not for leveraging or investment) in an amount not exceeding 33 1/3% of its total assets (including the amount borrowed) less liabilities (other than borrowings) immediately after the borrowings. For funds-of-funds – equity, under current Board policy, the fund has no current intention to borrow to a material extent. |
| | I2 – | The fund will not borrow money, except from banks for temporary purposes (such as meeting redemption requests or for extraordinary or emergency purposes) in an amount not to exceed 10% of the value of its total assets at the time the borrowing is made (not including the amount borrowed). The fund will not purchase additional portfolio securities if the fund has outstanding borrowings in excess of 5% of the value of its total assets. |
J. Issue senior securities
| | J1 – | The fund will not issue senior securities, except as permitted under the 1940 Act, the rules and regulations thereunder and any applicable exemptive relief. |
| | J2 – | The fund will not issue senior securities or borrow money, except as permitted by the 1940 Act or any rule thereunder, any SEC or SEC staff interpretations thereof or any exemptions therefrom which may be granted by the SEC. |
| | J3 – | The fund will not issue senior securities or borrow money, except from banks for temporary purposes in an amount not exceeding 5% of the value of its total assets. |
K. Buy on margin/sell short
| | K1 – | The fund will not buy on margin or sell short or deal in options to buy or sell securities. |
| | K2 – | The fund will not write or purchase put, call, straddle or spread options; purchase securities on margin or sell “short”; or underwrite the securities of other issuers. |
| | K3 – | The fund will not purchase securities on margin except as permitted by the 1940 Act or any rule thereunder, any SEC or SEC staff interpretations thereof or any exemptions therefrom which may be granted by the SEC. |
16
In addition to the policies described above and any fundamental policy described in the prospectus:
For Columbia Money Market, the fund will not:
| | • | | Purchase common stocks, preferred stocks, warrants, other equity securities, corporate bonds or debentures, state bonds, municipal bonds, or industrial revenue bonds. |
For Columbia Government Money Market, the fund will not:
| | • | | Mortgage or pledge any of its assets, except to the extent, up to a maximum of 5% of its total assets, necessary to secure permissible borrowings. |
| | • | | Buy securities of any company which, with their predecessors, have been in operation less than three continuous years, provided however, that securities guaranteed by a company that (including predecessors) has been in operation at least three continuous years shall be excluded. |
| | • | | Invest in securities with contractual or other restrictions on resale, except in connection with repurchase agreements. |
| | • | | Deal with its directors and officers, or firms they are associated with, in the purchase or sale of securities except as broker, or purchase or hold the securities of any issuer, if to its knowledge, directors or officers of the fund or of the fund’s investment manager individually owning beneficially more than 0.5% of the securities of that other company own in the aggregate more than 5% of such securities. |
| | • | | Invest in the securities of companies for purposes of exercising control or management of such companies or in securities issued by other investment companies, except in connection with a merger, consolidation, acquisition or reorganization or for the purpose of hedging the fund’s obligations under its deferred compensation plan for directors. |
For RiverSource LaSalle Global Real Estate and RiverSource LaSalle Monthly Dividend Real Estate, the fund will not:
| | • | | Purchase or hold the securities of any issuer, if to its knowledge, directors or officers of the fund and, only in the case of Seligman Global Technology, the directors and officers of the fund’s investment manager or subadviser, individually owning beneficially more than 0.5% of the outstanding securities of that issuer own in the aggregate more than 5% of such securities. |
For Seligman California Municipal High Yield, Seligman California Municipal Quality, Seligman Minnesota Municipal, Seligman National Municipal and Seligman New York Municipal, the fund will not:
| | • | | Invest in securities issued by other investment companies, except in connection with a merger, consolidation, acquisition or reorganization, or for the purpose of hedging a fund’s obligations under its deferred compensation plan for directors/trustees. |
| | • | | Purchase or hold the securities of any issuer, if to its knowledge, directors/trustees or officers of a fund individually owning beneficially more than 0.5% of the securities of that issuer own in the aggregate more than 5% of such securities. |
| | • | | Mortgage or pledge any of its assets, except to secure permitted borrowings noted above. |
For Seligman Capital and Seligman Growth, the fund will not:
| | • | | Deal with its directors or officers, or firms they are associated with, in the purchase or sale of securities of other issuers, except as broker. |
For Seligman Capital, Columbia Seligman Communications and Information, Columbia Frontier, Columbia Seligman Global Technology, Columbia Select Growth, Columbia Select Large-Cap Value and Columbia Select Smaller-Cap Value, the fund will not:
| | • | | Purchase or hold the securities of any issuer, if to its knowledge, directors or officers of the fund and, only in the case of Seligman Global Technology, the directors and officers of the fund’s investment manager, individually owning beneficially more than 0.5% of the outstanding securities of that issuer own in the aggregate more than 5% of such securities. |
| | • | | Enter into repurchase agreements of more than one week’s duration if more than 10% of the fund’s net assets would be so invested. |
17
NONFUNDAMENTAL POLICIES
Nonfundamental policies are policies that can be changed by the Board without shareholder approval. The following nonfundamental policies are in addition to those described in the prospectus.
For funds other than money market funds:
| | • | | No more than 15% of the fund’s net assets will be held in securities and other instruments that are illiquid. |
For money market funds:
| | • | | No more than 5% of the fund’s net assets will be held in securities and other instruments that are illiquid. |
Additionally, regarding limiting investments in foreign securities:
For Columbia 120/20 Contrarian Equity, Columbia Diversified Bond, Columbia Diversified Equity Income, Columbia Dividend Opportunity, Columbia Equity Value, Columbia Floating Rate, Columbia High Yield Bond, Columbia Income Opportunities, Columbia Inflation Protected Securities, Columbia Large Core Quantitative, Columbia Large Growth Quantitative, Columbia Large Value Quantitative, Columbia Mid Cap Growth Opportunity, Columbia Mid Cap Value Opportunity, Columbia Multi-Advisor Small Cap Value, Columbia Recovery and Infrastructure, Seligman Capital, Columbia Select Large-Cap Value, Columbia Select Smaller-Cap Value, Columbia Seligman Communications and Information, Columbia Frontier, RiverSource Balanced, RiverSource Disciplined Small and Mid Cap Equity, RiverSource Disciplined Small Cap Value, RiverSource LaSalle Monthly Dividend Real Estate, Columbia Limited Duration Credit, RiverSource Partners Fundamental Value, RiverSource Real Estate and Seligman Growth:
| | • | | Up to 25% of the fund’s net assets may be invested in foreign investments. |
For RiverSource Precious Metals and Mining:
| | • | | Under normal market conditions, the fund intends to invest at least 50% of its total assets in foreign investments. |
For RiverSource Short Duration U.S. Government and Columbia U.S. Government Mortgage:
| | • | | Up to 20% of the fund’s net assets may be invested in foreign investments. |
For Columbia Strategic Allocation:
| | • | | The fund may invest its total assets, up to 50%, in foreign investments. |
18
Investment Strategies and Types of Investments
This table shows many of the various investment strategies and investments the funds are allowed to engage in and purchase. It is intended to show the breadth of investments that the investment manager or subadviser (individually and collectively, the “investment manager”) may make on behalf of a fund. For a description of principal risks for an individual fund, please see the applicable prospectus for that fund. Notwithstanding a fund’s ability to utilize these strategies and investments, the investment manager is not obligated to use them at any particular time. For example, even though the investment manager is authorized to adopt temporary defensive positions and is authorized to attempt to hedge against certain types of risk, these practices are left to the investment manager’s sole discretion.
Fund-of-funds invest in a combination of underlying funds, although they may invest directly in stocks, bonds and other securities. These underlying funds have their own investment strategies and types of investments they are allowed to engage in and purchase. Fund-of-funds currently only invest in underlying funds, which may invest directly in securities and engage in investment strategies, indicated in the table below.
Investment strategies and types of investments: A black circle indicates that the investment strategy or type of investment generally is authorized for a category of funds. Exceptions are noted in the footnotes to the table. See Table 1 for fund categories.
Table 3. Investment Strategies and Types of Investments
| | | | | | | | | | | | | | |
Investment strategy | | Balanced | | Equity | | Funds-of-Funds –
Equity and
Fixed Income | | Taxable
Fixed
Income | | Taxable
Money
Market | | Tax-Exempt
Fixed
Income | | State
Tax-Exempt
Fixed Income |
Agency and government securities | | — | | — | | — | | — | | — | | — | | — |
Borrowing | | — | | — | | — | | — | | — | | — | | — |
Cash/money market instruments | | — | | — | | — | | — | | — | | — | | — |
Collateralized bond obligations | | — | | — A | | — | | — | | — | | — | | — |
Commercial paper | | — | | — | | — | | — | | — | | — | | — |
Common stock | | — | | — | | — | | — B | | — | | — | | — |
Convertible securities | | — | | — | | — | | — C | | — | | — | | — |
Corporate bonds | | — | | — | | — | | — | | D | | — | | — |
Debt obligations | | — | | — | | — | | — | | — | | — | | — |
Depositary receipts | | — | | — | | — | | — | | — | | — | | — |
Derivative instruments (including options and futures) | | — | | — | | — | | — | | — | | — | | — |
Exchange-traded funds | | — | | — | | — | | — | | — | | — | | — |
Floating rate loans | | — | | — | | — | | — | | — | | — | | — |
Foreign currency transactions | | — | | — | | — | | — | | — | | — | | — |
Foreign securities | | — | | — | | — | | — | | — | | — | | — |
Funding agreements | | — | | — | | — | | — | | — | | — | | — |
High yield debt securities (junk bonds) | | — | | — | | — | | — | | — | | — | | — J |
Illiquid and restricted securities | | — | | — | | — | | — | | — | | — | | — |
Indexed securities | | — | | — | | — | | — | | — | | — | | — |
Inflation protected securities | | — | | — | | — | | — | | — | | — | | — |
Initial Public Offerings (IPOs) | | — | | — | | — | | — | | — | | — | | — |
Inverse floaters | | — | | E | | — | | — | | — | | — | | — |
Investment companies | | — | | — | | — | | — | | — | | — | | — |
Lending of portfolio securities | | — | | — | | — | | — | | — | | — | | — |
Loan participations | | — | | — | | — | | — | | — | | — | | — |
Mortgage- and asset-backed securities | | — | | — F | | — | | — | | — | | — | | — |
Mortgage dollar rolls | | — | | G | | — | | — | | — | | — | | — |
Municipal obligations | | — | | — | | — | | — | | — | | — | | — |
Pay-in-kind securities | | — | | — | | — | | — | | — | | — | | — |
Preferred stock | | — | | — | | — | | — H | | — | | — H | | — |
Real estate investment trusts | | — | | — | | — | | — | | — | | — | | — |
Repurchase agreements | | — | | — | | — | | — | | — | | — | | — |
Reverse repurchase agreements | | — | | — | | — | | — | | — | | — | | — |
Short sales | | I | | I | | — | | I | | — | | I | | I |
Sovereign debt | | — | | — | | — | | — | | — | | — | | — |
Structured investments | | — | | — | | — | | — | | — | | — | | — |
Swap agreements | | — | | — | | — | | — | | — | | — | | — |
Variable- or floating-rate securities | | — | | — | | — | | — | | — | | — | | — |
Warrants | | — | | — | | — | | — | | — | | — | | — |
When-issued securities and forward commitments | | — | | — | | — | | — | | — | | — | | — |
Zero-coupon and step-coupon securities | | — | | — | | — | | — | | — | | — | | — |
19
| A. | The following funds are not authorized to invest in collateralized bond obligations: RiverSource Partners International Select Growth, Columbia Multi-Advisor International Value, RiverSource Partners International Small Cap, and Columbia Multi-Advisor Small Cap Value. |
| B. | The following funds are not authorized to invest in common stock: RiverSource Short Duration U.S. Government, Columbia U.S. Government Mortgage. |
| C. | The following funds are not authorized to invest in convertible securities: RiverSource Short Duration U.S. Government, Columbia U.S. Government Mortgage. |
| D. | While the fund is prohibited from investing in corporate bonds, it may invest in securities classified as corporate bonds if they meet the requirements of Rule 2a-7 of the 1940 Act. |
| E. | The following fund is authorized to invest in inverse floaters: RiverSource Real Estate. |
| F. | The following funds are not authorized to invest in mortgage- and asset-backed securities: RiverSource S&P 500 Index and RiverSource Small Company Index. |
| G. | The following funds are authorized to invest in mortgage dollar rolls: RiverSource Real Estate. |
| H. | The following funds are not authorized to invest in preferred stock: RiverSource Tax-Exempt High Income, RiverSource Intermediate Tax-Exempt, Columbia AMT-Free Tax-Exempt Bond, RiverSource Short Duration U.S. Government, Columbia U.S. Government Mortgage. |
| I. | Except for Seligman California Municipal High-Yield, Seligman California Municipal Quality, Seligman Minnesota Municipal and Seligman New York Municipal, which are prohibited from selling short, the funds are not prohibited from engaging in short sales, however, each fund will seek Board approval prior to utilizing short sales as an active part of its investment strategy. |
| J. | The following funds are not authorized to invest in high yield debt securities: Seligman California Municipal Quality, Seligman Minnesota, Seligman National and Seligman New York. |
20
Information Regarding Risks and Investment Strategies
RISKS
The following is a summary of risk characteristics. Following this summary is a description of certain investments and investment strategies and the risks most commonly associated with them (including certain risks not described below and, in some cases, a more comprehensive discussion of how the risks apply to a particular investment or investment strategy). A mutual fund’s risk profile is largely defined by the fund’s primary portfolio holdings and investment strategies. However, most mutual funds are allowed to use certain other strategies and investments that may have different risk characteristics. Accordingly, one or more of the following types of risk may be associated with a fund at any time (for a description of principal risks and investment strategies for an individual fund, please see that fund’s prospectus):
Active Management Risk. For a fund that is actively managed, its performance will reflect in part the ability of the portfolio managers to select securities and to make investment decisions that are suited to achieving the fund’s investment objectives. Due to its active management, a fund could underperform other mutual funds with similar investment objectives and strategies.
Affiliated Fund Risk. For funds-of-funds, the risk that the investment manager may have potential conflicts of interest in selecting underlying funds because the fees paid to it by some underlying funds are higher than the fees paid by other underlying funds. However, the investment manager is a fiduciary to the funds and is legally obligated to act in their best interests when selecting underlying funds.
Allocation Risk. For funds-of-funds, the risk that the investment manager’s evaluations regarding asset classes or underlying funds may be incorrect. There is no guarantee that the underlying funds will achieve their investment objectives. There is also a risk that the selected underlying funds’ performance may be lower than the performance of the asset class they were selected to represent or may be lower than the performance of alternative underlying funds that could have been selected to represent the asset class.
Asian Pacific Region Risk. Many of the countries in the Asian Pacific Region are developing both politically and economically, and may have relatively unstable governments and economies based on a limited number of commodities or industries. Securities markets in the Asian Pacific Region are smaller and have a lower trading volume than those in the United States, which may result in the securities of some companies in the Asian Pacific Region being less liquid than similar U.S. or other foreign securities. Some currencies in the Asian Pacific Region are more volatile than the U.S. dollar, and some countries in the Asian Pacific Region have restricted the flow of money in and out of the country. As a result, many of the risks detailed above under “Risks of Foreign Investing” may be more pronounced due to concentration of the Fund’s investments in the Asian Pacific Region.
Borrowing Risk. To the extent the fund borrows money for investment purposes, which is commonly referred to as “leveraging,” the fund’s exposure to fluctuations in the prices of its assets will be increased as compared to the fund’s exposure if the fund did not borrow. The fund’s borrowing activities will exaggerate any increase or decrease in the net asset value of the fund. In addition, the interest which the fund pays on borrowed money, together with any additional costs of maintaining a borrowing facility, are additional costs borne by the fund and could reduce or eliminate any net investment profits. Unless profits on assets acquired with borrowed funds exceed the costs of borrowing, the use of borrowing will diminish the investment performance of the fund compared with what it would have been without borrowing. When the fund borrows money it must comply with certain asset coverage requirements, which at times may require the fund to dispose of some of its holdings, even though it may be disadvantageous to do so at the time.
Common Stock Risk. An adverse event, such as an unfavorable earnings report, may depress the value of a particular common stock held by the fund. Also, the prices of common stocks are sensitive to general movements in the stock market and a drop in the stock market may depress the price of common stocks to which the fund has exposure. Common stock prices fluctuate for several reasons, including changes to investors’ perceptions of the financial condition of an issuer or the general condition of the relevant stock market, or when political or economic events affecting an issuer occurs. In addition, common stock prices may be particularly sensitive to rising interest rates, as the cost of capital rises and borrowing costs increase.
Concentration Risk. Investments that are concentrated in a particular issuer, geographic region, or sector will make the fund’s portfolio value more susceptible to the events or conditions impacting the issuer, geographic region, or sector. Because of the fund’s concentration, the fund’s overall value may decline to a greater degree than if the fund held a less concentrated portfolio.
21
Confidential Information Access Risk. For funds investing in floating rate loans, the investment manager normally will seek to avoid the receipt of material, non-public information (Confidential Information) about the issuers of floating rate loans being considered for acquisition by the fund, or held in the fund. In many instances, issuers of floating rate loans offer to furnish Confidential Information to prospective purchasers or holders of the issuer’s floating rate loans to help potential investors assess the value of the loan. The investment manager’s decision not to receive Confidential Information from these issuers may disadvantage the fund as compared to other floating rate loan investors, and may adversely affect the price the fund pays for the loans it purchases, or the price at which the fund sells the loans. Further, in situations when holders of floating rate loans are asked, for example, to grant consents, waivers or amendments, the investment manager’s ability to assess the desirability of such consents, waivers or amendments may be compromised. For these and other reasons, it is possible that the investment manager’s decision under normal circumstances not to receive Confidential Information could adversely affect the fund’s performance.
Counterparty Risk. Counterparty risk is the risk that a counterparty to a financial instrument entered into by the fund or held by a special purpose or structured vehicle becomes bankrupt or otherwise fails to perform its obligations due to financial difficulties. The fund may experience significant delays in obtaining any recovery in a bankruptcy or other reorganization proceeding. The fund may obtain only limited recovery or may obtain no recovery in such circumstances. The fund will typically enter into financial instrument transactions with counterparties whose credit rating is investment grade, or, if unrated, determined to be of comparable quality by the investment manager.
Credit Risk. Credit risk is the risk that one or more fixed income securities in the fund’s portfolio will decline in price or fail to pay interest or repay principal when due because the issuer of the security experiences a decline in its financial status and is unable or unwilling to honor its obligations, including the payment of interest or the repayment of principal. Adverse conditions in the credit markets can adversely affect the broader global economy, including the credit quality of issuers of fixed income securities in which the fund may invest. Changes by nationally recognized statistical rating organizations in its rating of securities and in the ability of an issuer to make scheduled payments may also affect the value of the fund’s investments. To the extent the fund invests in below-investment grade securities, it will be exposed to a greater amount of credit risk than a fund which invests solely in investment grade securities. The prices of lower grade securities are more sensitive to negative developments, such as a decline in the issuer’s revenues or a general economic downturn, than are the prices of higher grade securities. Fixed income securities of below investment grade quality are predominantly speculative with respect to the issuer’s capacity to pay interest and repay principal when due and therefore involve a greater risk of default. If the fund purchases unrated securities, or if the rating of a security is reduced after purchase, the fund will depend on the investment manager’s analysis of credit risk more heavily than usual.
Derivatives Risk. Derivatives are financial instruments that have a value which depends upon, or is derived from, the value of something else, such as one or more underlying securities, pools of securities, options, futures, indexes or currencies. Losses involving derivative instruments may be substantial, because a relatively small price movement in the underlying security(ies), instrument, currency or index may result in a substantial loss for the fund. In addition to the potential for increased losses, the use of derivative instruments may lead to increased volatility within a fund. Derivative instruments in which the fund invests will typically increase the fund’s exposure to its principal risks (as described in the fund’s prospectus) to which it is otherwise exposed, and may expose the fund to additional risks, including correlation risk, counterparty credit risk, hedging risk, leverage risk, and liquidity risk.
Correlation risk is related to hedging risk and is the risk that there may be an incomplete correlation between the hedge and the opposite position, which may result in increased or unanticipated losses.
Counterparty credit risk is the risk that a counterparty to the derivative instrument becomes bankrupt or otherwise fails to perform its obligations due to financial difficulties, and the fund may obtain no recovery of its investment or may only obtain a limited recovery, and any recovery may be delayed.
Hedging risk is the risk that derivative instruments used to hedge against an opposite position may offset losses, but they may also offset gains. There is no guarantee that a hedging strategy will eliminate the risk which the hedging strategy is intended to offset, which may lead to losses within a fund.
Leverage risk is the risk that losses from the derivative instrument may be greater than the amount invested in the derivative instrument. Certain derivatives have the potential for unlimited losses, regardless of the size of the initial investment.
Liquidity risk is the risk that the derivative instrument may be difficult or impossible to sell or terminate, which may cause the fund to be in a position to do something the investment manager would not otherwise choose, including accepting a lower price for the derivative instrument, selling other investments or foregoing another, more appealing investment opportunity. Derivative instruments, which are not traded on an exchange, including, but not limited to, forward contracts, swaps, and over-the-counter options may have liquidity risk.
22
Certain derivatives have the potential for unlimited losses regardless of the size of the initial investment.
Exchange-Traded Fund (ETF) Risk. An ETF’s share price may not track its specified market index and may trade below its net asset value. ETFs generally use a “passive” investment strategy and will not attempt to take defensive positions in volatile or declining markets. An active secondary market in an ETF’s shares may not develop or be maintained and may be halted or interrupted due to actions by its listing exchange, unusual market conditions or other reasons. There can be no assurance an ETF’s shares will continue to be listed on an active exchange. In addition, shareholders bear both their proportionate share of the fund’s expenses and similar expenses incurred through ownership of the ETF.
The funds generally expect to purchase shares of ETFs through broker-dealers in transactions on a securities exchange, and in such cases the funds will pay customary brokerage commissions for each purchase and sale. Shares of an ETF may also be acquired by depositing a specified portfolio of the ETF’s underlying securities, as well as a cash payment generally equal to accumulated dividends of the securities (net of expenses) up to the time of deposit, with the ETF’s custodian, in exchange for which the ETF will issue a quantity of new shares sometimes referred to as a “creation unit”. Similarly, shares of an ETF purchased on an exchange may be accumulated until they represent a creation unit, and the creation unit may redeemed in kind for a portfolio of the underlying securities (based on the ETF’s net asset value) together with a cash payment generally equal to accumulated dividends as of the date of redemption. The funds may redeem creation units for the underlying securities (and any applicable cash), and may assemble a portfolio of the underlying securities (and any required cash) to purchase creation units. The funds’ ability to redeem creation units may be limited by the 1940 Act, which provides that ETFs will not be obligated to redeem shares held by the funds in an amount exceeding one percent of their total outstanding securities during any period of less than 30 days.
There is a risk that ETFs in which a fund invests may terminate due to extraordinary events. For example, any of the service providers to ETFs, such as the trustee or sponsor, may close or otherwise fail to perform their obligations to the ETF, and the ETF may not be able to find a substitute service provider. Also, ETFs may be dependent upon licenses to use the various indices as a basis for determining their compositions and/or otherwise to use certain trade names. If these licenses are terminated, the ETFs may also terminate. In addition, an ETF may terminate if its net assets fall below a certain amount.
Focused Portfolio Risk. The fund expects to invest in a limited number of companies. Accordingly, the fund may have more volatility and is considered to have more risk than a fund that invests in a greater number of companies because changes in the value of a single security may have a more significant effect, either negative or positive, on the fund’s net asset value. To the extent the Fund invests its assets in fewer securities, the fund is subject to greater risk of loss if any of those securities declines in price.
Foreign Currency Risk. The Fund’s exposure to foreign currencies subjects the Fund to constantly changing exchange rates and the risk that those currencies will decline in value relative to the U.S. dollar, or, in the case of short positions, that the U.S. dollar will decline in value relative to the currency being sold forward. Currency rates in foreign countries may fluctuate significantly over short periods of time for a number of reasons, including changes in interest rates and economic or political developments in the U.S. or abroad. As a result, the Fund’s exposure to foreign currencies may reduce the returns of the Fund. Trading of foreign currencies also includes the risk of clearing and settling trades which, if prices are volatile, may be difficult.
Foreign/Emerging Markets Risk. Foreign securities are securities of issuers based outside the United States. An issuer is deemed to be based outside the United States if it is organized under the laws of another country. Foreign securities are primarily denominated in foreign currencies. In addition to the risks normally associated with domestic securities of the same type, foreign securities are subject to the following risks:
Country risk includes the political, economic, and other conditions of the country. These conditions include lack of publicly available information, less government oversight and regulation of business and industry practices of stock exchanges, brokers and listed companies than in the U.S. (including lack of uniform accounting, auditing, and financial reporting standards comparable to those applicable to domestic companies). In addition, with certain foreign countries, there is the possibility of nationalization, expropriation, the imposition of additional withholding or confiscatory taxes, political, social, or economic instability, diplomatic developments that could affect investments in those countries, or other unforeseen actions by regulatory bodies (such as changes to settlement or custody procedures). It may be more difficult for an investor’s agents to keep currently informed about corporate actions such as stock dividends or other matters that may affect the prices of portfolio securities. The liquidity of foreign investments may be more limited than for most U.S. investments, which means that, at times it may be difficult to sell foreign securities at desirable prices. Payment for securities without delivery may be required in certain foreign markets and, when participating in new issues, some foreign countries require payment to be made in advance of issuance (at the time of issuance, the market value of the security may be more or less than the purchase price). Fixed commissions on some foreign stock exchanges are generally higher than negotiated commissions on U.S.
23
exchanges. Further, the Fund may encounter difficulties or be unable to pursue legal remedies and obtain judgments in foreign courts. The introduction of a single currency, the euro, on Jan. 1, 1999 for participating European nations in the Economic and Monetary Union (EU) presents unique risks. The most important is the exposure to the economic, political and social development of the member countries in the EU.
Currency risk results from the constantly changing exchange rates between local currency and the U.S. dollar. Whenever the fund holds securities valued in a foreign currency or holds the currency, changes in the exchange rate add to or subtract from the value of the investment.
Custody risk refers to the process of clearing and settling trades. It also covers holding securities with local agents and depositories. Low trading volumes and volatile prices in less developed markets make trades harder to complete and settle. Local agents are held only to the standard of care of the local market. Governments or trade groups may compel local agents to hold securities in designated depositories that are not subject to independent evaluation. The less developed a country’s securities market is, the greater the likelihood of problems occurring.
Emerging markets risk includes the dramatic pace of change (economic, social, and political) in these countries as well as the other considerations listed above. These markets are in early stages of development and are extremely volatile. They can be marked by extreme inflation, devaluation of currencies, dependence on trade partners, and hostile relations with neighboring countries.
Geographic Concentration Risk. The fund may be particularly susceptible to economic, political or regulatory events affecting companies and countries within the specific geographic region in which the fund focuses its investments. Currency devaluations could occur in countries that have not yet experienced currency devaluation to date, or could continue to occur in countries that have already experienced such devaluations. As a result, the fund may be more volatile than a more geographically diversified fund.
For state-specific funds. Because state-specific tax-exempt funds invest primarily in the municipal securities issued by the state and political sub-divisions of the state, each fund will be particularly affected by political and economic changes, adverse conditions to an industry significant to the area and other developments in the state in which it invests. This vulnerability to factors affecting the state’s tax-exempt investments will be significantly greater than that of a more geographically diversified fund, which may result in greater losses and volatility. See Appendix B for details. The value of municipal securities owned by a fund also may be adversely affected by future changes in federal or state income tax laws.
In addition, because of the relatively small number of issuers of tax-exempt securities and because the state-specific funds may concentrate in a segment of the tax-exempt debt market, such as revenue bonds for health care facilities, housing or airports, the fund may invest a higher percentage of its assets in a single issuer and, therefore, be more exposed to the risk of loss by investing in a few issuers than a fund that invests more broadly. At times, the fund and other accounts managed by the investment manager may own all or most of the debt of a particular issuer. These investments may cause the value of a fund’s shares to change more than the values of other funds’ shares that invest in more diversified investments. This concentration of ownership may make it more difficult to sell, or to determine the fair value of, these investments. The yields on the securities in which the fund invests generally are dependent on a variety of factors, including the financial condition of the issuer or other obligor, the revenue source from which the debt service is payable, general economic and monetary conditions, conditions in the relevant market, the size of a particular issue, the maturity of the obligation, and the rating of the issue. Because many tax-exempt bonds may be revenue or general obligations of local governments or authorities, ratings on tax-exempt bonds may be different from the ratings given to the general obligation bonds of a particular state.
More information about state specific risks may be available from official state resources.
Highly Leveraged Transactions Risk. Certain corporate loans and corporate debt securities involve refinancings, recapitalizations, mergers and acquisitions, and other financings for general corporate purposes. These investments also may include senior obligations of a borrower issued in connection with a restructuring pursuant to Chapter 11 of the U.S. Bankruptcy Code (commonly known as “debtor-in-possession” financings), provided that such senior obligations are determined by the fund’s investment manager upon its credit analysis to be a suitable investment by the fund. In such highly leveraged transactions, the borrower assumes large amounts of debt in order to have the financial resources to attempt to achieve its business objectives. Such business objectives may include but are not limited to: management’s taking over control of a company (leveraged buy-out); reorganizing the assets and liabilities of a company (leveraged recapitalization); or acquiring another company. Loans or securities that are part of highly leveraged transactions involve a greater risk (including default and bankruptcy) than other investments.
24
Impairment of Collateral Risk. The value of collateral, if any, securing a floating rate loan can decline, and may be insufficient to meet the borrower’s obligations or difficult to liquidate. In addition, the fund’s access to collateral may be limited by bankruptcy or other insolvency laws. Further, certain floating rate loans may not be fully collateralized and may decline in value.
Indexing Risk. For funds that are managed to an index, the fund’s performance will rise and fall, subject to any tracking error, as the performance of the index rises and falls.
Inflation-Protected Securities Risk. Inflation-protected debt securities tend to react to change in real interest rates. Real interest rates can be described as nominal interest rates minus the expected impact of inflation. In general, the price of an inflation-protected debt security falls when real interest rates rise, and rises when real interest rates fall. Interest payments on inflation-protected debt securities will vary as the principal and/or interest is adjusted for inflation and may be more volatile than interest paid on ordinary bonds. In periods of deflation, the fund may have no income at all. Income earned by a shareholder depends on the amount of principal invested and that principal cannot seek to grow with inflation unless the investor reinvests the portion of fund distributions that comes from inflation adjustments.
Infrastructure-Related Companies Risk. Investments in infrastructure-related securities have greater exposure to adverse economic, regulatory, political, legal, and other changes affecting the issuers of such securities. Infrastructure-related businesses are subject to a variety of factors that may adversely affect their business or operations including high interest costs in connection with capital construction programs, costs associated with environmental and other regulations, the effects of economic slowdown and surplus capacity, increased competition from other providers of services, uncertainties concerning availability of fuel at reasonable prices, the effects of energy conservation policies and other factors. Additionally, infrastructure-related entities may be subject to regulation by various governmental authorities and may also be affected by governmental regulation of rates charged to customers, service interruption and/or legal challenges due to environmental, operational or other mishaps and the imposition of special tariffs and changes in tax laws, regulatory policies and accounting standards. There is also the risk that corruption may negatively affect publicly-funded infrastructure projects, especially in foreign markets, resulting in delays and cost overruns.
Initial Public Offering (IPO) Risk. IPOs are subject to many of the same risks as investing in companies with smaller market capitalizations. To the extent a fund determines to invest in IPOs it may not be able to invest to the extent desired, because, for example, only a small portion (if any) of the securities being offered in an IPO may be made available. The investment performance of a fund during periods when it is unable to invest significantly or at all in IPOs may be lower than during periods when the fund is able to do so. In addition, as a fund increases in size, the impact of IPOs on the fund’s performance will generally decrease. IPOs sold within 12 months of purchase will result in increased short-term capital gains, which will be taxable to shareholders as ordinary income.
Interest Rate Risk. The securities in the portfolio are subject to the risk of losses attributable to changes in interest rates. Interest rate risk is generally associated with bond prices: when interest rates rise, bond prices generally fall. In general, the longer the maturity or duration of a bond, the greater its sensitivity to changes in interest rates. Interest rate changes also may increase prepayments of debt obligations, which in turn would increase prepayment risk.
Issuer Risk. An issuer, or the value of its securities, may perform poorly. Poor performance may be caused by poor management decisions, competitive pressures, breakthroughs in technology, reliance on suppliers, labor problems or shortages, corporate restructurings, fraudulent disclosures, or other factors.
Leverage Risk. Leverage occurs when the fund increases its assets available for investment using borrowings, short sales, derivatives, or similar instruments or techniques. Due to the fact that short sales involve borrowing securities and then selling them, the fund’s short sales effectively leverage the fund’s assets. The use of leverage may make any change in the fund’s net asset value (“NAV”) even greater and thus result in increased volatility of returns. The fund’s assets that are used as collateral to secure the short sales may decrease in value while the short positions are outstanding, which may force the fund to use its other assets to increase the collateral. Leverage can also create an interest expense that may lower the fund’s overall returns. Lastly, there is no guarantee that a leveraging strategy will be successful.
Liquidity Risk. The risk associated from a lack of marketability of securities which may make it difficult or impossible to sell at desirable prices in order to minimize loss. The Fund may have to lower the selling price, sell other investments, or forego another, more appealing investment opportunity.
25
Market Risk. The market value of securities may fall or fail to rise. Market risk may affect a single issuer, sector of the economy, industry, or the market as a whole. The market value of securities may fluctuate, sometimes rapidly and unpredictably. This risk is generally greater for small and mid-sized companies, which tend to be more vulnerable to adverse developments. In addition, focus on a particular style, for example, investment in growth or value securities, may cause the Fund to underperform other mutual funds if that style falls out of favor with the market.
Master Limited Partnership Risk. Investments in securities (units) of master limited partnerships involve risks that differ from an investment in common stock. Holders of the units of master limited partnerships have more limited control and limited rights to vote on matters affecting the partnership. There are also certain tax risks associated with an investment in units of master limited partnerships. In addition, conflicts of interest may exist between common unit holders, subordinated unit holders and the general partner of a master limited partnership, including a conflict arising as a result of incentive distribution payments.
Mortgage-Related and Other Asset-Backed Securities Risk. Generally, rising interest rates tend to extend the duration of fixed rate mortgage-related securities, making them more sensitive to changes in interest rates. As a result, in a period of rising interest rates, if a fund holds mortgage-related securities, it may exhibit additional volatility. This is known as extension risk. In addition, adjustable and fixed rate mortgage-related securities are subject to prepayment risk. When interest rates decline, borrowers may pay off their mortgages sooner.
Municipal Securities Risk. The value of a municipal security may be affected by legislative or administrative actions as well as by the economics of the region where the issuer of the municipal security is located. For example, a significant restructuring of federal income tax rates could cause municipal security prices to fall. Lower income tax rates could reduce the advantage of owning municipal securities.
Non-Diversification Risk. A non-diversified fund may invest more of its assets in fewer companies than if it were a diversified fund. Because each investment has a greater effect on the fund’s performance, the fund may be more exposed to the risks of loss and volatility than a fund that invests more broadly.
Portfolio Trading and Turnover Risks. Portfolio trading may be undertaken to accomplish the investment objectives of the funds in relation to actual and anticipated movements in interest rates, securities markets and for other reasons. In addition, a security may be sold and another of comparable quality purchased at approximately the same time to take advantage of what the investment manager believes to be a temporary price disparity between the two securities. Temporary price disparities between two comparable securities may result from supply and demand imbalances where, for example, a temporary oversupply of certain securities may cause a temporarily low price for such security, as compared with other securities of like quality and characteristics. A fund may also engage in short-term trading consistent with its investment objectives. Securities may be sold in anticipation of a market decline or purchased in anticipation of a market rise and later sold, or to recognize a gain.
A change in the securities held by a fund is known as “portfolio turnover.” The use of certain derivative instruments with relatively short maturities may tend to exaggerate the portfolio turnover rate for a fund. High portfolio turnover may involve correspondingly greater expenses to the fund, including brokerage commissions or dealer mark-ups and other transaction costs on the sale of securities and reinvestments in other securities. Trading in debt obligations does not generally involve the payment of brokerage commissions, but does involve indirect transaction costs. The use of futures contracts may involve the payment of commissions to futures commission merchants. The higher the rate of portfolio turnover of the fund, the higher the transaction costs borne by the fund generally will be. Transactions in the fund’s portfolio securities may result in realization of taxable capital gains (including short-term capital gains which are generally taxed to stockholders at ordinary income tax rates). The trading costs and tax effects associated with portfolio turnover may adversely affect the fund’s performance.
Prepayment and Extension Risk. The risk that a bond or other security might be called, or otherwise converted, prepaid, or redeemed, before maturity. This risk is primarily associated with asset-backed securities, including mortgage backed securities. If a security is converted, prepaid, or redeemed, before maturity, particularly during a time of declining interest rates, the portfolio managers may not be able to reinvest in securities providing as high a level of income, resulting in a reduced yield to the fund. Conversely, as interest rates rise, the likelihood of prepayment decreases. The portfolio managers may be unable to capitalize on securities with higher interest rates because the Fund’s investments are locked in at a lower rate for a longer period of time.
Quantitative Model Risk. Securities selected using quantitative methods may perform differently from the market as a whole as a result of the factors used in the quantitative method, the weight placed on each factor, and changes in the factors’ historical trends. The quantitative methodology employed by the investment manager has been extensively tested using historical securities market data, but has only recently begun to be used to manage the funds. There can be no assurance that the methodology will enable the fund to achieve its objective.
26
Real Estate Industry Risk. Certain underlying funds concentrate their investments in securities of companies operating in the real estate industry, making the fund is more susceptible to risks associated with the ownership of real estate and with the real estate industry in general. These risks can include fluctuations in the value of the underlying properties, defaults by borrowers or tenants, market saturation, decreases in market rates for rents, and other economic, political, or regulatory occurrences affecting the real estate industry, including REITs.
REITs depend upon specialized management skills, may have limited financial resources, may have less trading volume, and may be subject to more abrupt or erratic price movements than the overall securities markets. REITs are also subject to the risk of failing to qualify for tax-free pass-through of income. Some REITs (especially mortgage REITs) are affected by risks similar to those associated with investments in debt securities including changes in interest rates and the quality of credit extended.
Reinvestment Risk. The risk that an investor will not be able to reinvest income or principal at the same rate it currently is earning.
Retirement Goal Risk. For Retirement Plus Funds, the investor may have different needs than the quantitative model anticipates.
Sector Risk. Investments that are concentrated in a particular issuer, geographic region, or sector will be more susceptible to changes in price. The more a fund diversifies, the more it spreads risk and potentially reduces the risks of loss and volatility.
Short Selling Risk. The fund may make short sales, which involves selling a security the fund does not own in anticipation that the security’s price will decline. The fund must borrow those securities to make delivery to the buyer. The fund may not always be able to borrow a security it wants to sell short. The fund will suffer a loss if it sells a security short and the value of the security rises rather than falls. It is possible that the fund’s long positions will decline in value at the same time that the value of its short positions increase, thereby increasing potential losses to the fund. Short sales expose the fund to the risk that it will be required to buy the security sold short (also known as “covering” the short position) at a time when the security has appreciated in value, thus resulting in a loss to the fund. The fund may also be required to close out a short position at a time when it might not otherwise choose, for example, if the lender of the security calls it back, which may have the effect of reducing or eliminating potential gain, or cause the fund to realize a loss. Short positions introduce more risk to the fund than long positions (purchases) because the maximum sustainable loss on a security purchased (held long) is limited to the amount paid for the security plus the transaction costs, whereas there is no maximum attainable price of the shorted security. Therefore, in theory, securities sold short have unlimited risk. Additionally, the fund’s use of short sales in effect “leverages” the fund, as the fund intends to use the cash proceeds from short sales to invest in additional long positions. This leverage effect potentially exposes the fund to greater risks due to unanticipated market movements, which may magnify losses and increase the volatility of returns. See Leverage Risk and Market Risk.
Small and Mid-Sized Company Risk. Investments in small and medium companies often involve greater risks than investments in larger, more established companies because small and medium companies may lack the management experience, financial resources, product diversification, experience, and competitive strengths of larger companies. Additionally, in many instances the securities of small and medium companies are traded only over-the-counter or on regional securities exchanges and the frequency and volume of their trading is substantially less and may be more volatile than is typical of larger companies.
Tax Risk. As a regulated investment company, a fund must derive at least 90% of its gross income for each taxable year from sources treated as “qualifying income” under the Internal Revenue Code of 1986, as amended. The fund currently intends to take positions in forward currency contracts with notional value up to the fund’s total net assets. Although foreign currency gains currently constitute “qualifying income” the Treasury Department has the authority to issue regulations excluding from the definition of “qualifying incomes” a fund’s foreign currency gains not “directly related” to its “principal business” of investing in stocks or securities (or options and futures with respect thereto). Such regulations might treat gains from some of the fund’s foreign currency-denominated positions as not “qualifying income” and there is a remote possibility that such regulations might be applied retroactively, in which case, the fund might not qualify as a regulated investment company for one or more years. In the event the Treasury Department issues such regulations, the fund’s Board of Directors may authorize a significant change in investment strategy or fund liquidation.
Technology and Technology-Related Investment Risks. The market prices of technology and technology-related stocks tend to exhibit a greater degree of market risk and price volatility than other types of investments. These stocks may fall in and out of favor with investors rapidly, which may cause sudden selling and dramatically lower market prices. These stocks also may be affected adversely by changes in technology, consumer and business purchasing patterns, government regulation and/or obsolete products or
27
services. In addition, a rising interest rate environment tends to negatively affect technology and technology-related companies. In such an environment, those companies with high market valuations may appear less attractive to investors, which may cause sharp decreases in the companies’ market prices. Further, those technology or technology-related companies seeking to finance their expansion would have increased borrowing costs, which may negatively impact their earnings. As a result, these factors may negatively affect the performance of the fund. Finally, the fund may be susceptible to factors affecting the technology and technology-related industries. Technology and technology-related companies are often smaller and less experienced companies and may be subject to greater risks than larger companies, such as limited product lines, markets and financial and managerial resources. These risks may be heightened for technology companies in foreign markets.
Tracking Error Risk. For funds that are managed to an index, the fund may not track the index perfectly because differences between the index and the fund’s portfolio can cause differences in performance. The investment manager purchases securities and other instruments in an attempt to replicate the performance of the index. However, the tools that the investment manager uses to replicate the index are not perfect and the fund’s performance is affected by factors such as the size of the fund’s portfolio, transaction costs, management fees and expenses, brokerage commissions and fees, the extent and timing of cash flows in and out of the fund and changes in the index.
In addition, the returns from a specific type of security (for example, mid-cap stocks) may trail returns from other asset classes or the overall market. Each type of security will go through cycles of doing better or worse than stocks or bonds in general. These periods may last for several years.
Underlying Fund Selection Risk. For funds-of-funds, the risk that the selected underlying funds’ performance may be lower than the performance of the asset class they were selected to represent or may be lower than the performance of alternative underlying funds that could have been selected to represent the investment category.
INVESTMENT STRATEGIES
The following information supplements the discussion of each fund’s investment objectives, policies, and strategies that are described in the prospectus and in this SAI. The following describes strategies that many mutual funds use and types of securities that they purchase. Please refer to the table titled Investment Strategies and Types of Investments to see which are applicable to various categories of funds.
Agency and Government Securities
The U.S. government, its agencies and instrumentalities, and government-sponsored enterprises issue many different types of securities. U.S. Treasury bonds, notes, and bills and securities, including mortgage pass through certificates of the Government National Mortgage Association (GNMA), are guaranteed by the U.S. government.
Other U.S. government securities are issued or guaranteed by federal agencies or instrumentalities or government-sponsored enterprises but are not guaranteed by the U.S. government. This may increase the credit risk associated with these investments. Government-sponsored entities issuing securities include privately owned, publicly chartered entities created to reduce borrowing costs for certain sectors of the economy, such as farmers, homeowners, and students. They include the Federal Farm Credit Bank System, Farm Credit Financial Assistance Corporation, Federal Home Loan Bank, Federal Home Loan Mortgage Corporation* (FHLMC), Federal National Mortgage Association* (FNMA), Student Loan Marketing Association (SLMA), and Resolution Trust Corporation (RTC). Government-sponsored entities may issue discount notes (with maturities ranging from overnight to 360 days) and bonds. Agency and government securities are subject to the same concerns as other debt obligations. (See also Debt Obligations and Mortgage- and Asset-Backed Securities.)
Although one or more of the other risks described in this SAI may apply, the largest risks associated with agency and government securities include: Inflation Risk, Interest Rate Risk, Prepayment and Extension Risk, and Reinvestment Risk.
| * | On Sept. 7, 2008, the Federal Housing Finance Agency (FHFA), an agency of the U.S. government, placed the FHLMC and FNMA into conservatorship, a statutory process with the objective of returning the entities to normal business operations. FHFA will act as the conservator to operate the enterprises until they are stabilized. |
28
Borrowing
If the fund borrows money, its share price may be subject to greater fluctuation until the borrowing is paid off. If the fund makes additional investments while borrowings are outstanding, this may be considered a form of leverage. Under the 1940 Act, the fund is required to maintain continuous asset coverage of 300% with respect to such borrowings and to sell (within three days) sufficient portfolio holdings to restore such coverage if it should decline to less than 300% due to market fluctuations or otherwise, even if such liquidations of the fund’s holdings may be disadvantageous from an investment standpoint. Leveraging by means of borrowing may exaggerate the effect of any increase or decrease in the value of portfolio securities or the fund’s NAV, and money borrowed will be subject to interest and other costs (which may include commitment fees and/or the cost of maintaining minimum average balances) which may or may not exceed the income received from the securities purchased with borrowed funds.
Although one or more of the other risks described in this SAI may apply, the largest risks associated with borrowing include: Inflation Risk.
Cash/Money Market Instruments
Cash-equivalent investments include short-term U.S. and Canadian government securities and negotiable certificates of deposit, non-negotiable fixed-time deposits, bankers’ acceptances, and letters of credit of banks or savings and loan associations having capital, surplus, and undivided profits (as of the date of its most recently published annual financial statements) in excess of $100 million (or the equivalent in the instance of a foreign branch of a U.S. bank) at the date of investment. A fund also may purchase short-term notes and obligations of U.S. and foreign banks and corporations and may use repurchase agreements with broker-dealers registered under the Securities Exchange Act of 1934 and with commercial banks. (See also Commercial Paper, Debt Obligations, Repurchase Agreements, and Variable- or Floating-Rate Securities.) These types of instruments generally offer low rates of return and subject a fund to certain costs and expenses. See Appendix A for a discussion of securities ratings.
Bankers’ acceptances are marketable short-term credit instruments used to finance the import, export, transfer or storage of goods. They are termed “accepted” when a bank guarantees their payment at maturity.
Bank certificates of deposit are certificates issued against funds deposited in a bank (including eligible foreign branches of U.S. banks), are for a definite period of time, earn a specified rate of return and are normally negotiable.
A fund may invest its daily cash balance in RiverSource Short-Term Cash Fund, a money market fund established for the exclusive use of the RiverSource, Seligman and Threadneedle funds and other institutional clients of Columbia Management.
Although one or more of the other risks described in this SAI may apply, the largest risks associated with cash/money market instruments include: Credit Risk and Inflation Risk.
Collateralized Bond Obligations
Collateralized bond obligations (CBOs) are investment grade bonds backed by a pool of bonds, which may include junk bonds. CBOs are similar in concept to collateralized mortgage obligations (CMOs), but differ in that CBOs represent different degrees of credit quality rather than different maturities. (See also Mortgage- and Asset-Backed Securities.) Underwriters of CBOs package a large and diversified pool of high-risk, high-yield junk bonds, which is then separated into “tiers.” Typically, the first tier represents the higher quality collateral and pays the lowest interest rate; the second tier is backed by riskier bonds and pays a higher rate; the third tier represents the lowest credit quality and instead of receiving a fixed interest rate receives the residual interest payments — money that is left over after the higher tiers have been paid. CBOs, like CMOs, are substantially overcollateralized and this, plus the diversification of the pool backing them, may earn certain of the tiers investment-grade bond ratings. Holders of third-tier CBOs stand to earn high yields or less money depending on the rate of defaults in the collateral pool. (See also High-Yield Debt Securities (Junk Bonds).)
Although one or more of the other risks described in this SAI may apply, the largest risks associated with CBOs include: Credit Risk, Interest Rate Risk and Prepayment and Extension Risk.
29
Commercial Paper
Commercial paper is a short-term debt obligation with a maturity ranging from 2 to 270 days issued by banks, corporations, and other borrowers. It is sold to investors with temporary idle cash as a way to increase returns on a short-term basis. These instruments are generally unsecured, which increases the credit risk associated with this type of investment. (See also Debt Obligations and Illiquid and Restricted Securities.)
Although one or more of the other risks described in this SAI may apply, the largest risks associated with commercial paper include: Credit Risk and Liquidity Risk.
Common Stock
Common stock represents units of ownership in a corporation. Owners typically are entitled to vote on the selection of directors and other important matters as well as to receive dividends on their holdings. In the event that a corporation is liquidated, the claims of secured and unsecured creditors and owners of bonds and preferred stock take precedence over the claims of those who own common stock.
The price of common stock is generally determined by corporate earnings, type of products or services offered, projected growth rates, experience of management, liquidity, and general market conditions for the markets on which the stock trades.
Although one or more of the other risks described in this SAI may apply, the largest risks associated with common stock include: Issuer Risk, Market Risk, and Small and Mid-Sized Company Risk.
Convertible Securities
Convertible securities are bonds, debentures, notes, preferred stocks, or other securities that may be converted into common, preferred or other securities of the same or a different issuer within a particular period of time at a specified price. Some convertible securities, such as preferred equity-redemption cumulative stock (PERCs), have mandatory conversion features. Others are voluntary. A convertible security entitles the holder to receive interest normally paid or accrued on debt or the dividend paid on preferred stock until the convertible security matures or is redeemed, converted, or exchanged. Convertible securities have unique investment characteristics in that they generally (i) have higher yields than common stocks but lower yields than comparable non-convertible securities, (ii) are less subject to fluctuation in value than the underlying stock since they have fixed income characteristics, and (iii) provide the potential for capital appreciation if the market price of the underlying common stock increases.
The value of a convertible security is a function of its “investment value” (determined by its yield in comparison with the yields of other securities of comparable maturity and quality that do not have a conversion privilege) and its “conversion value” (the security’s worth, at market value, if converted into the underlying common stock). The investment value of a convertible security is influenced by changes in interest rates, with investment value declining as interest rates increase and increasing as interest rates decline. The credit standing of the issuer and other factors also may have an effect on the convertible security’s investment value. The conversion value of a convertible security is determined by the market price of the underlying common stock. If the conversion value is low relative to the investment value, the price of the convertible security is governed principally by its investment value. Generally, the conversion value decreases as the convertible security approaches maturity. To the extent the market price of the underlying common stock approaches or exceeds the conversion price, the price of the convertible security will be increasingly influenced by its conversion value. A convertible security generally will sell at a premium over its conversion value by the extent to which investors place value on the right to acquire the underlying common stock while holding a fixed income security.
Although one or more of the other risks described in this SAI may apply, the largest risks associated with convertible securities include: Interest Rate Risk, Issuer Risk, Market Risk, Prepayment and Extension Risk, and Reinvestment Risk.
Corporate Bonds
Corporate bonds are debt obligations issued by private corporations, as distinct from bonds issued by a government or its agencies or a municipality. Corporate bonds typically have four distinguishing features: (1) they are taxable; (2) they have a par value of $1,000; (3) they have a term maturity, which means they come due all at once; and (4) many are traded on major exchanges. Corporate bonds are subject to the same concerns as other debt obligations. (See also Debt Obligations and High-Yield Debt Securities (Junk Bonds).) Corporate bonds may be either secured or unsecured. Unsecured corporate bonds are generally referred to as “debentures.” See Appendix A for a discussion of securities ratings.
30
Although one or more of the other risks described in this SAI may apply, the largest risks associated with corporate bonds include: Credit Risk, Interest Rate Risk, Issuer Risk, Prepayment and Extension Risk, and Reinvestment Risk.
Debt Obligations
Many different types of debt obligations exist (for example, bills, bonds, or notes). Issuers of debt obligations have a contractual obligation to pay interest at a fixed, variable or floating rate on specified dates and to repay principal on a specified maturity date. Certain debt obligations (usually intermediate- and long-term bonds) have provisions that allow the issuer to redeem or “call” a bond before its maturity. Issuers are most likely to call these securities during periods of falling interest rates. When this happens, an investor may have to replace these securities with lower yielding securities, which could result in a lower return.
The market value of debt obligations is affected primarily by changes in prevailing interest rates and the issuers perceived ability to repay the debt. The market value of a debt obligation generally reacts inversely to interest rate changes. When prevailing interest rates decline, the price usually rises, and when prevailing interest rates rise, the price usually declines.
In general, the longer the maturity of a debt obligation, the higher its yield and the greater the sensitivity to changes in interest rates. Conversely, the shorter the maturity, the lower the yield but the greater the price stability.
As noted, the values of debt obligations also may be affected by changes in the credit rating or financial condition of their issuers. Generally, the lower the quality rating of a security, the higher the degree of risk as to the payment of interest and return of principal. To compensate investors for taking on such increased risk, those issuers deemed to be less creditworthy generally must offer their investors higher interest rates than do issuers with better credit ratings. (See also Agency and Government Securities, Corporate Bonds, and High-Yield Debt Securities (Junk Bonds).)
Generally, debt obligations that are investment grade are those that have been rated in one of the top four credit quality categories by two out of the three independent rating agencies. In the event that a debt obligation has been rated by only two agencies, the most conservative, or lower, rating must be in one of the top four credit quality categories in order for the security to be considered investment grade. If only one agency has rated the debt obligation, that rating must be in one of the top four credit quality categories for the security to be considered investment grade. See Appendix A for a discussion of securities ratings.
All ratings limitations are applied at the time of purchase. Subsequent to purchase, a debt security may cease to be rated or its rating may be reduced below the minimum required for purchase by a fund. Neither event will require the sale of such a security, but it will be a factor in considering whether to continue to hold the security. To the extent that ratings change as a result of changes in a rating agency or its rating system, a fund will attempt to use comparable ratings as standards for selecting investments.
Although one or more of the other risks described in this SAI may apply, the largest risks associated with debt obligations include: Credit Risk, Interest Rate Risk, Issuer Risk, Prepayment and Extension Risk, and Reinvestment Risk.
Depositary Receipts
Some foreign securities are traded in the form of American Depositary Receipts (ADRs). ADRs are receipts typically issued by a U.S. bank or trust company evidencing ownership of the underlying securities of foreign issuers. European Depositary Receipts (EDRs) and Global Depositary Receipts (GDRs) are receipts typically issued by foreign banks or trust companies, evidencing ownership of underlying securities issued by either a foreign or U.S. issuer. Generally, depositary receipts in registered form are designed for use in the U.S. and depositary receipts in bearer form are designed for use in securities markets outside the U.S. Depositary receipts may not necessarily be denominated in the same currency as the underlying securities into which they may be converted. Depositary receipts involve the risks of other investments in foreign securities. In addition, ADR holders may not have all the legal rights of shareholders and may experience difficulty in receiving shareholder communications. (See also Common Stock and Foreign Securities.)
Although one or more of the other risks described in this SAI may apply, the largest risks associated with depositary receipts include: Foreign/Emerging Markets Risk, Issuer Risk, and Market Risk.
31
Derivative Instruments
Derivative instruments are commonly defined to include securities or contracts whose values depend, in whole or in part, on (or “derive” from) the value of one or more other assets, such as securities, currencies, or commodities.
A derivative instrument generally consists of, is based upon, or exhibits characteristics similar to options or forward contracts. Such instruments may be used to maintain cash reserves while remaining fully invested, to offset anticipated declines in values of investments, to facilitate trading, to reduce transaction costs, or to pursue higher investment returns. Derivative instruments are characterized by requiring little or no initial payment. Their value changes daily based on a security, a currency, a group of securities or currencies, or an index. A small change in the value of the underlying security, currency, or index can cause a sizable percentage gain or loss in the price of the derivative instrument.
Options and forward contracts are considered to be the basic “building blocks” of derivatives. For example, forward- based derivatives include forward contracts, swap contracts, and exchange-traded futures. Forward-based derivatives are sometimes referred to generically as “futures contracts.” Option-based derivatives include privately negotiated, over-the-counter (OTC) options (including caps, floors, collars, and options on futures) and exchange-traded options on futures. Diverse types of derivatives may be created by combining options or futures in different ways, and by applying these structures to a wide range of underlying assets.
Options. An option is a contract. A person who buys a call option for a security has the right to buy the security at a set price for the length of the contract. A person who sells a call option is called a writer. The writer of a call option agrees for the length of the contract to sell the security at the set price when the buyer wants to exercise the option, no matter what the market price of the security is at that time. A person who buys a put option has the right to sell a security at a set price for the length of the contract. A person who writes a put option agrees to buy the security at the set price if the purchaser wants to exercise the option during the length of the contract, no matter what the market price of the security is at that time. An option is covered if the writer owns the security (in the case of a call) or sets aside the cash or securities of equivalent value (in the case of a put) that would be required upon exercise.
The price paid by the buyer for an option is called a premium. In addition to the premium, the buyer generally pays a broker a commission. The writer receives a premium, less another commission, at the time the option is written. The premium received by the writer is retained whether or not the option is exercised. A writer of a call option may have to sell the security for a below-market price if the market price rises above the exercise price. A writer of a put option may have to pay an above-market price for the security if its market price decreases below the exercise price.
When an option is purchased, the buyer pays a premium and a commission. It then pays a second commission on the purchase or sale of the underlying security if the option is exercised. For record keeping and tax purposes, the price obtained on the sale of the underlying security is the combination of the exercise price, the premium, and both commissions.
One of the risks an investor assumes when it buys an option is the loss of the premium. To be beneficial to the investor, the price of the underlying security must change within the time set by the option contract. Furthermore, the change must be sufficient to cover the premium paid, the commissions paid both in the acquisition of the option and in a closing transaction or in the exercise of the option and sale (in the case of a call) or purchase (in the case of a put) of the underlying security. Even then, the price change in the underlying security does not ensure a profit since prices in the option market may not reflect such a change.
Options on many securities are listed on options exchanges. If a fund writes listed options, it will follow the rules of the options exchange. Options are valued at the close of the New York Stock Exchange. An option listed on a national exchange, Chicago Board Options Exchange, or NASDAQ will be valued at the mean of the last bid and ask prices.
Options on certain securities are not actively traded on any exchange, but may be entered into directly with a dealer. These options may be more difficult to close. If an investor is unable to effect a closing purchase transaction, it will not be able to sell the underlying security until the call written by the investor expires or is exercised.
Futures Contracts. A futures contract is a sales contract between a buyer (holding the “long” position) and a seller (holding the “short” position) for an asset with delivery deferred until a future date. The buyer agrees to pay a fixed price at the agreed future date and the seller agrees to deliver the asset. The seller hopes that the market price on the delivery date is less than the agreed upon price, while the buyer hopes for the contrary. Many futures contracts trade in a manner similar to the way a stock trades on a stock exchange and the commodity exchanges.
32
Generally, a futures contract is terminated by entering into an offsetting transaction. An offsetting transaction is effected by an investor taking an opposite position. At the time a futures contract is made, a good faith deposit called initial margin is set up. Daily thereafter, the futures contract is valued and the payment of variation margin is required so that each day a buyer would pay out cash in an amount equal to any decline in the contract’s value or receive cash equal to any increase. At the time a futures contract is closed out, a nominal commission is paid, which is generally lower than the commission on a comparable transaction in the cash market.
Futures contracts may be based on various securities, securities indexes (such as the S&P 500 Index), foreign currencies and other financial instruments and indexes.
A fund may engage in futures and related options transactions to produce incremental earnings, to hedge existing positions, and to increase flexibility. The fund intends to comply with Rule 4.5 of the Commodity Futures Trading Commission (CFTC), under which a mutual fund is exempt from the definition of a “commodity pool operator.” The fund, therefore, is not subject to registration or regulation as a commodity pool operator, meaning that the fund may invest in futures contracts without registering with the CFTC.
Options on Futures Contracts. Options on futures contracts give the holder a right to buy or sell futures contracts in the future. Unlike a futures contract, which requires the parties to the contract to buy and sell a security on a set date (some futures are settled in cash), an option on a futures contract merely entitles its holder to decide on or before a future date (within nine months of the date of issue) whether to enter into a contract. If the holder decides not to enter into the contract, all that is lost is the amount (premium) paid for the option. Further, because the value of the option is fixed at the point of sale, there are no daily payments of cash to reflect the change in the value of the underlying contract. However, since an option gives the buyer the right to enter into a contract at a set price for a fixed period of time, its value does change daily.
One of the risks in buying an option on a futures contract is the loss of the premium paid for the option. The risk involved in writing options on futures contracts an investor owns, or on securities held in its portfolio, is that there could be an increase in the market value of these contracts or securities. If that occurred, the option would be exercised and the asset sold at a lower price than the cash market price. To some extent, the risk of not realizing a gain could be reduced by entering into a closing transaction. An investor could enter into a closing transaction by purchasing an option with the same terms as the one previously sold. The cost to close the option and terminate the investor’s obligation, however, might still result in a loss. Further, the investor might not be able to close the option because of insufficient activity in the options market. Purchasing options also limits the use of monies that might otherwise be available for long-term investments.
Options on Indexes. Options on indexes are securities traded on national securities exchanges. An option on an index is similar to an option on a futures contract except all settlements are in cash. A fund exercising a put, for example, would receive the difference between the exercise price and the current index level. Options may also be traded with respect to other types of indexes, such as options on indexes of commodities futures.
Currency Options. Options on currencies are contracts that give the buyer the right, but not the obligation, to buy (call options) or sell (put options) a specified amount of a currency at a predetermined price (strike price) on or before the option matures (expiry date). Conversely, the seller has the obligation to buy or sell a currency option upon exercise of the option by the purchaser. Currency options are traded either on a national securities exchange or over-the-counter.
Tax and Accounting Treatment. As permitted under federal income tax laws and to the extent a fund is allowed to invest in futures contracts, a fund would intend to identify futures contracts as part of a mixed straddle and not mark them to market, that is, not treat them as having been sold at the end of the year at market value. If a fund is using short futures contracts for hedging purposes, the fund may be required to defer recognizing losses incurred on short futures contracts and on underlying securities. Any losses incurred on securities that are part of a straddle may be deferred to the extent there is unrealized appreciation on the offsetting position until the offsetting position is sold. Federal income tax treatment of gains or losses from transactions in options, options on futures contracts and indexes will depend on whether the option is a section 1256 contract. If the option is a non-equity option, a fund would either make a 1256(d) election and treat the option as a mixed straddle or mark to market the option at fiscal year end and treat the gain/loss as 40% short-term and 60% long-term.
The Internal Revenue Service (IRS) has ruled publicly that an exchange-traded call option is a security for purposes of the 50%-of-assets test and that its issuer is the issuer of the underlying security, not the writer of the option, for purposes of the diversification requirements.
33
Accounting for futures contracts will be according to generally accepted accounting principles. Initial margin deposits will be recognized as assets due from a broker (a fund’s agent in acquiring the futures position). During the period the futures contract is open, changes in value of the contract will be recognized as unrealized gains or losses by marking to market on a daily basis to reflect the market value of the contract at the end of each day’s trading. Variation margin payments will be made or received depending upon whether gains or losses are incurred. All contracts and options will be valued at the last-quoted sales price on their primary exchange.
Other Risks of Derivatives. The primary risk of derivatives is the same as the risk of the underlying asset, namely that the value of the underlying asset may go up or down. Adverse movements in the value of an underlying asset can expose an investor to losses. Derivative instruments may include elements of leverage and, accordingly, the fluctuation of the value of the derivative instrument in relation to the underlying asset may be magnified. The successful use of derivative instruments depends upon a variety of factors, particularly the investment manager’s ability to predict movements of the securities, currencies, and commodity markets, which requires different skills than predicting changes in the prices of individual securities. There can be no assurance that any particular strategy will succeed.
Another risk is the risk that a loss may be sustained as a result of the failure of a counterparty to comply with the terms of a derivative instrument. The counterparty risk for exchange-traded derivative instruments is generally less than for privately-negotiated or OTC derivative instruments, since generally a clearing agency, which is the issuer or counterparty to each exchange-traded instrument, provides a guarantee of performance. For privately-negotiated instruments, there is no similar clearing agency guarantee. In all transactions, an investor will bear the risk that the counterparty will default, and this could result in a loss of the expected benefit of the derivative transaction and possibly other losses.
When a derivative transaction is used to completely hedge another position, changes in the market value of the combined position (the derivative instrument plus the position being hedged) result from an imperfect correlation between the price movements of the two instruments. With a perfect hedge, the value of the combined position remains unchanged for any change in the price of the underlying asset. With an imperfect hedge, the values of the derivative instrument and its hedge are not perfectly correlated. For example, if the value of a derivative instrument used in a short hedge (such as writing a call option, buying a put option, or selling a futures contract) increased by less than the decline in value of the hedged investment, the hedge would not be perfectly correlated. Such a lack of correlation might occur due to factors unrelated to the value of the investments being hedged, such as speculative or other pressures on the markets in which these instruments are traded.
Derivatives also are subject to the risk that they cannot be sold, closed out, or replaced quickly at or very close to their fundamental value. Generally, exchange contracts are very liquid because the exchange clearinghouse is the counterparty of every contract. OTC transactions are less liquid than exchange-traded derivatives since they often can only be closed out with the other party to the transaction.
Another risk is caused by the legal unenforcibility of a party’s obligations under the derivative. A counterparty that has lost money in a derivative transaction may try to avoid payment by exploiting various legal uncertainties about certain derivative products.
(See also Foreign Currency Transactions.)
Although one or more of the other risks described in this SAI may apply, the largest risks associated with derivative instruments include: Derivatives Risk and Liquidity Risk.
Exchange-Traded Funds
Exchange-traded funds (ETFs) represent shares of ownership in funds, unit investment trusts or depositary receipts. ETFs hold portfolios of securities that are designed to replicate, as closely as possible before expenses, the price and yield of a specified market index. The performance results of ETFs will not replicate exactly the performance of the pertinent index due to transaction and other expenses, including fees to service providers, borne by ETFs. ETF shares are sold and redeemed at net asset value only in large blocks called creation units and redemption units, respectively. The funds’ ability to redeem redemption units may be limited by the 1940 Act, which provides that ETFs will not be obligated to redeem shares held by the funds in an amount exceeding one percent of their total outstanding securities during any period of less than 30 days. There is a risk that Underlying ETFs in which a fund invests may terminate due to extraordinary events. ETF shares also may be purchased and sold in secondary market trading on national securities exchanges, which allows investors to purchase and sell ETF shares at their market price throughout the day.
34
Although one or more of the other risks described in this SAI may apply, investments in ETFs involve the same risks associated with a direct investment in the types of securities included in the indices the ETFs are designed to replicate, including Market Risk. ETFs generally use a “passive” investment strategy and will not attempt to take defensive positions in volatile or declining markets. Shares of an ETF may trade at a market price that is less than their net asset value and an active trading market in such shares may not develop or continue and may be halted or interrupted due to actions by its listing exchange, unusual market conditions or other reasons. For example, any of the service providers to ETFs, such as the trustee or sponsor, may close or otherwise fail to perform their obligations to the ETF, and the ETF may not be able to find a substitute service provider. Also, ETFs may be dependent upon licenses to use the various indices as a basis for determining their compositions and/or otherwise to use certain trade names. If these licenses are terminated, the ETFs may also terminate. In addition, an ETF may terminate if its net assets fall below a certain amount. Although the funds believe that, in the event of the termination of an ETF, they will be able to invest instead in shares of an alternate ETF tracking the same market index or another index covering the same general market, there can be no assurance that shares of an alternate ETF would be available for investment at that time. There can be no assurance an ETF’s shares will continue to be listed on an active exchange. Finally, there can be no assurance that the portfolio of securities purchased by an ETF to replicate a particular index will replicate such index.
Generally, under the 1940 Act, a fund may not acquire shares of another investment company (including ETFs) if, immediately after such acquisition, (i) such fund would hold more than 3% of the other investment company’s total outstanding shares, (ii) if such fund’s investment in securities of the other investment company would be more than 5% of the value of the total assets of the Fund, or (iii) if more than 10% of such fund’s total assets would be invested in investment companies. The SEC has granted orders for exemptive relief to certain ETFs that permit investments in those ETFs by other investment companies (such as the Seligman TargETFunds) in excess of these limits. The Seligman TargETFunds’ ability to invest in ETFs will be severely constrained unless ETFs have received such an order from the SEC, and the ETF and the Seligman TargETFunds take appropriate steps to comply with the relevant terms and conditions of such orders.
The Seligman TargETFunds will invest in an ETF only if the SEC has issued an exemptive order to the ETF which permits investment companies, including the Seligman TargETFunds, to invest in ETFs beyond the limitations in the 1940 Act, subject to certain terms and conditions, including that such investment companies enter into an agreement with the ETF before investing in them in excess of the 3% limitation in the 1940 Act. To the extent other ETFs obtain similar exemptive relief from the SEC, the Seligman TargETFunds may seek to qualify to invest in such other ETFs in excess of the 1940 Act limitations. Each Seligman TargETFund may invest greater than 25% of its assets in any one ETF, although no Seligman TargETFund intends to invest greater than 40% of its assets in any one ETF.
To the extent the 1940 Act limitations apply to an ETF, such limitations may prevent Seligman TargETFund from allocating its investments in the manner that the investment manager considers optimal, or cause the investment manager to select a similar index or sector-based mutual fund or other investment company (each, an “Other Investment Company”), or a basket of stocks (a group of securities related by index or sector that are pre-selected by, and made available through, certain brokers) (“Stock Baskets”) providing similar exposure as an alternative. The Seligman TargETFunds may also invest in Other Investment Companies or Stock Baskets when the investment manager believes they represent more attractive opportunities than similar ETFs held in the portfolio.
ETFs, because they invest in other securities (e.g., common stocks of small-, mid- and large capitalization companies (U.S. and foreign, including, for example, real estate investment trusts and emerging markets securities) and fixed income securities), are subject to the risks of investment associated with these and other types of investments, as described in this SAI.
Floating Rate Loans
Most floating rate loans are acquired directly from the agent bank or from another holder of the loan by assignment. Most such loans are secured, and most impose restrictive covenants which must be met by the borrower. These loans are typically made by a syndicate of banks and institutional investors, represented by an agent bank which has negotiated and structured the loan and which is responsible generally for collecting interest, principal, and other amounts from the borrower on its own behalf and on behalf of the other lending institutions in the syndicate, and for enforcing its and their other rights against the borrower. Each of the lending institutions, including the agent bank, lends to the borrower a portion of the total amount of the loan, and retains the corresponding interest in the loan. Floating rate loans may include delayed draw term loans and prefunded or synthetic letters of credit.
A fund’s ability to receive payments of principal and interest and other amounts in connection with loans held by it will depend primarily on the financial condition of the borrower. The failure by the fund to receive scheduled interest or principal payments on a loan would adversely affect the income of the fund and would likely reduce the value of its assets, which would be reflected in a
35
reduction in the fund’s net asset value. Banks and other lending institutions generally perform a credit analysis of the borrower before originating a loan or purchasing an assignment in a loan. In selecting the loans in which the fund will invest, however, the investment manager will not rely on that credit analysis of the agent bank, but will perform its own investment analysis of the borrowers. The investment manager’s analysis may include consideration of the borrower’s financial strength and managerial experience, debt coverage, additional borrowing requirements or debt maturity schedules, changing financial conditions, and responsiveness to changes in business conditions and interest rates. The majority of loans the fund will invest in will be rated by one or more of the nationally recognized rating agencies. Investments in loans may be of any quality, including “distressed” loans, and will be subject to the fund’s credit quality policy.
Loans may be structured in different forms, including assignments and participations. In an assignment, a fund purchases an assignment of a portion of a lender’s interest in a loan. In this case, the fund may be required generally to rely upon the assigning bank to demand payment and enforce its rights against the borrower, but would otherwise be entitled to all of such bank’s rights in the loan.
The borrower of a loan may, either at its own election or pursuant to terms of the loan documentation, prepay amounts of the loan from time to time. There is no assurance that a fund will be able to reinvest the proceeds of any loan prepayment at the same interest rate or on the same terms as those of the original loan.
Corporate loans in which a fund may purchase a loan assignment are made generally to finance internal growth, mergers, acquisitions, recapitalizations, stock repurchases, leveraged buy-outs, dividend payments to sponsors and other corporate activities. The highly leveraged capital structure of certain borrowers may make such loans especially vulnerable to adverse changes in economic or market conditions. The fund may hold investments in loans for a very short period of time when opportunities to resell the investments that the investment manager believes are attractive arise.
Certain of the loans acquired by a fund may involve revolving credit facilities under which a borrower may from time to time borrow and repay amounts up to the maximum amount of the facility. In such cases, the fund would have an obligation to advance its portion of such additional borrowings upon the terms specified in the loan assignment. To the extent that the fund is committed to make additional loans under such an assignment, it will at all times designate cash or securities in an amount sufficient to meet such commitments.
Notwithstanding its intention in certain situations to not receive material, non-public information with respect to its management of investments in floating rate loans, the investment manager may from time to time come into possession of material, non-public information about the issuers of loans that may be held in a fund’s portfolio. Possession of such information may in some instances occur despite the investment manager’s efforts to avoid such possession, but in other instances the investment manager may choose to receive such information (for example, in connection with participation in a creditors’ committee with respect to a financially distressed issuer). As, and to the extent, required by applicable law, the investment manager’s ability to trade in these loans for the account of the fund could potentially be limited by its possession of such information. Such limitations on the investment manager’s ability to trade could have an adverse effect on the fund by, for example, preventing the fund from selling a loan that is experiencing a material decline in value. In some instances, these trading restrictions could continue in effect for a substantial period of time.
In some instances, other accounts managed by the investment manager may hold other securities issued by borrowers whose floating rate loans may be held in a fund’s portfolio. These other securities may include, for example, debt securities that are subordinate to the floating rate loans held in the fund’s portfolio, convertible debt or common or preferred equity securities. In certain circumstances, such as if the credit quality of the issuer deteriorates, the interests of holders of these other securities may conflict with the interests of the holders of the issuer’s floating rate loans. In such cases, the investment manager may owe conflicting fiduciary duties to the fund and other client accounts. The investment manager will endeavor to carry out its obligations to all of its clients to the fullest extent possible, recognizing that in some cases certain clients may achieve a lower economic return, as a result of these conflicting client interests, than if the investment manager’s client accounts collectively held only a single category of the issuer’s securities.
Although one or more of the other risks described in this SAI may apply, the largest risks associated with floating rate loans include: Credit Risk and Prepayment and Extension Risk.
Foreign Currency Transactions
Investments in foreign securities usually involve currencies of foreign countries. In addition, a fund may hold cash and cash equivalent investments in foreign currencies. As a result, the value of a fund’s assets as measured in U.S. dollars may be affected favorably or unfavorably by changes in currency exchange rates and exchange control regulations. Also, a fund may incur costs in connection with
36
conversions between various currencies. Currency exchange rates may fluctuate significantly over short periods of time causing a fund’s NAV (Net Asset Value) to fluctuate. Currency exchange rates are generally determined by the forces of supply and demand in the foreign exchange markets, actual or anticipated changes in interest rates, and other complex factors. Currency exchange rates also can be affected by the intervention of U.S. or foreign governments or central banks, or the failure to intervene, or by currency controls or political developments.
Spot Rates and Derivative Instruments. A fund may conduct its foreign currency exchange transactions either at the spot (cash) rate prevailing in the foreign currency exchange market or by entering into forward currency exchange contracts (forward contracts). (See also Derivative Instruments.) These contracts are traded in the interbank market conducted directly between currency traders (usually large commercial banks) and their customers. Because foreign currency transactions occurring in the interbank market might involve substantially larger amounts than those involved in the use of such derivative instruments, a fund could be disadvantaged by having to deal in the odd lot market for the underlying foreign currencies at prices that are less favorable than for round lots.
A fund may enter into forward contracts for a variety of reasons, but primarily it will enter into such contracts for risk management (hedging) or for investment purposes.
A fund may enter into forward contracts to settle a security transaction or handle dividend and interest collection. When a fund enters into a contract for the purchase or sale of a security denominated in a foreign currency or has been notified of a dividend or interest payment, it may desire to lock in the price of the security or the amount of the payment, usually in U.S. dollars, although it could desire to lock in the price of the security in another currency. By entering into a forward contract, a fund would be able to protect itself against a possible loss resulting from an adverse change in the relationship between different currencies from the date the security is purchased or sold to the date on which payment is made or received or when the dividend or interest is actually received.
A fund may enter into forward contracts when management of the fund believes the currency of a particular foreign country may decline in value relative to another currency. When selling currencies forward in this fashion, a fund may seek to hedge the value of foreign securities it holds against an adverse move in exchange rates. The precise matching of forward contract amounts and the value of securities involved generally will not be possible since the future value of securities in foreign currencies more than likely will change between the date the forward contract is entered into and the date it matures. The projection of short-term currency market movements is extremely difficult and successful execution of a short-term hedging strategy is highly uncertain. Unless specifically permitted, a fund would not enter into such forward contracts or maintain a net exposure to such contracts when consummating the contracts would obligate it to deliver an amount of foreign currency in excess of the value of its securities or other assets denominated in that currency.
This method of protecting the value of the fund’s securities against a decline in the value of a currency does not eliminate fluctuations in the underlying prices of the securities. It simply establishes a rate of exchange that can be achieved at some point in time. Although forward contracts tend to minimize the risk of loss due to a decline in value of hedged currency, they tend to limit any potential gain that might result should the value of such currency increase.
A fund may also enter into forward contracts when its management believes the currency of a particular country will increase in value relative to another currency. A fund may buy currencies forward to gain exposure to a currency without incurring the additional costs of purchasing securities denominated in that currency.
Absolute Return Currency and Income Fund is designed to invest in a combination of forward currency contracts and U.S. dollar-denominated market instruments in an attempt to obtain an investment result that is substantially the same as a direct investment in a foreign currency-denominated instrument. For example, the combination of U.S. dollar-denominated instruments with long forward currency exchange contracts creates a position economically equivalent to a position in the foreign currency, in anticipation of an increase in the value of the foreign currency against the U.S. dollar. Conversely, the combination of U.S. dollar-denominated instruments with short forward currency exchange contracts is economically equivalent to borrowing the foreign currency for delivery at a specified date in the future, in anticipation of a decrease in the value of the foreign currency against the U.S. dollar. This strategy may also be employed by other funds. Unanticipated changes in the currency exchange results could result in poorer performance for funds that enter into these types of transactions.
A fund may designate cash or securities in an amount equal to the value of the fund’s total assets committed to consummating forward contracts entered into under the circumstance set forth above. If the value of the securities declines, additional cash or securities will be designated on a daily basis so that the value of the cash or securities will equal the amount of the fund’s commitments on such contracts.
37
At maturity of a forward contract, a fund may either deliver (if a contract to sell) or take delivery of (if a contract to buy) the foreign currency or terminate its contractual obligation by entering into an offsetting contract with the same currency trader, the same maturity date, and covering the same amount of foreign currency.
If a fund engages in an offsetting transaction, it would incur a gain or loss to the extent there has been movement in forward contract prices. If a fund engages in an offsetting transaction, it may subsequently enter into a new forward contract to buy or sell the foreign currency.
Although a fund values its assets each business day in terms of U.S. dollars, it may not intend to convert its foreign currencies into U.S. dollars on a daily basis. It would do so from time to time, and shareholders should be aware of currency conversion costs. Although foreign exchange dealers do not charge a fee for conversion, they do realize a profit based on the difference (spread) between the prices at which they are buying and selling various currencies. Thus, a dealer may offer to sell a foreign currency to a fund at one rate, while offering a lesser rate of exchange should a fund desire to resell that currency to the dealer.
For Absolute Return Currency and Income Fund, it is possible, under certain circumstances, including entering into forward currency contracts for investment purposes, that the fund may have to limit or restructure its forward contract currency transactions to qualify as a “regulated investment company” under the Internal Revenue Code.
Options on Foreign Currencies. A fund may buy put and call options and write covered call and cash-secured put options on foreign currencies for hedging purposes and to gain exposure to foreign currencies. For example, a decline in the dollar value of a foreign currency in which securities are denominated will reduce the dollar value of such securities, even if their value in the foreign currency remains constant. In order to protect against the diminutions in the value of securities, a fund may buy put options on the foreign currency. If the value of the currency does decline, a fund would have the right to sell the currency for a fixed amount in dollars and would offset, in whole or in part, the adverse effect on its portfolio that otherwise would have resulted.
Conversely, where a change in the dollar value of a currency would increase the cost of securities a fund plans to buy, or where a fund would benefit from increased exposure to the currency, a fund may buy call options on the foreign currency. The purchase of the options could offset, at least partially, the changes in exchange rates.
As in the case of other types of options, however, the benefit to a fund derived from purchases of foreign currency options would be reduced by the amount of the premium and related transaction costs. In addition, where currency exchange rates do not move in the direction or to the extent anticipated, a fund could sustain losses on transactions in foreign currency options that would require it to forego a portion or all of the benefits of advantageous changes in rates.
A fund may write options on foreign currencies for the same types of purposes. For example, when a fund anticipates a decline in the dollar value of foreign-denominated securities due to adverse fluctuations in exchange rates it could, instead of purchasing a put option, write a call option on the relevant currency. If the expected decline occurs, the option would most likely not be exercised and the diminution in value of securities would be fully or partially offset by the amount of the premium received.
Similarly, instead of purchasing a call option when a foreign currency is expected to appreciate, a fund could write a put option on the relevant currency. If rates move in the manner projected, the put option would expire unexercised and allow the fund to hedge increased cost up to the amount of the premium.
As in the case of other types of options, however, the writing of a foreign currency option will constitute only a partial hedge up to the amount of the premium, and only if rates move in the expected direction. If this does not occur, the option may be exercised and the fund would be required to buy or sell the underlying currency at a loss that may not be offset by the amount of the premium. Through the writing of options on foreign currencies, the fund also may be required to forego all or a portion of the benefits that might otherwise have been obtained from favorable movements on exchange rates.
All options written on foreign currencies will be covered. An option written on foreign currencies is covered if a fund holds currency sufficient to cover the option or has an absolute and immediate right to acquire that currency without additional cash consideration upon conversion of assets denominated in that currency or exchange of other currency held in its portfolio. An option writer could lose amounts substantially in excess of its initial investments, due to the margin and collateral requirements associated with such positions.
38
Options on foreign currencies are traded through financial institutions acting as market-makers, although foreign currency options also are traded on certain national securities exchanges, such as the Philadelphia Stock Exchange and the Chicago Board Options Exchange, subject to SEC regulation. In an over-the-counter trading environment, many of the protections afforded to exchange participants will not be available. For example, there are no daily price fluctuation limits, and adverse market movements could therefore continue to an unlimited extent over a period of time. Although the purchaser of an option cannot lose more than the amount of the premium plus related transaction costs, this entire amount could be lost.
Foreign currency option positions entered into on a national securities exchange are cleared and guaranteed by the Options Clearing Corporation (OCC), thereby reducing the risk of counterparty default. Further, a liquid secondary market in options traded on a national securities exchange may be more readily available than in the over-the-counter market, potentially permitting a fund to liquidate open positions at a profit prior to exercise or expiration, or to limit losses in the event of adverse market movements.
The purchase and sale of exchange-traded foreign currency options, however, is subject to the risks of availability of a liquid secondary market described above, as well as the risks regarding adverse market movements, margining of options written, the nature of the foreign currency market, possible intervention by governmental authorities and the effects of other political and economic events. In addition, exchange-traded options on foreign currencies involve certain risks not presented by the over-the-counter market. For example, exercise and settlement of such options must be made exclusively through the OCC, which has established banking relationships in certain foreign countries for that purpose. As a result, the OCC may, if it determines that foreign governmental restrictions or taxes would prevent the orderly settlement of foreign currency option exercises, or would result in undue burdens on OCC or its clearing member, impose special procedures on exercise and settlement, such as technical changes in the mechanics of delivery of currency, the fixing of dollar settlement prices or prohibitions on exercise.
Foreign Currency Futures and Related Options. A fund may enter into currency futures contracts to buy or sell currencies. It also may buy put and call options and write covered call and cash-secured put options on currency futures. Currency futures contracts are similar to currency forward contracts, except that they are traded on exchanges (and have margin requirements) and are standardized as to contract size and delivery date. Most currency futures call for payment of delivery in U.S. dollars. A fund may use currency futures for the same purposes as currency forward contracts, subject to CFTC limitations.
Currency futures and options on futures values can be expected to correlate with exchange rates, but will not reflect other factors that may affect the value of the fund’s investments. A currency hedge, for example, should protect a Yen-denominated bond against a decline in the Yen, but will not protect a fund against price decline if the issuer’s creditworthiness deteriorates. Because the value of a fund’s investments denominated in foreign currency will change in response to many factors other than exchange rates, it may not be possible to match the amount of a forward contract to the value of a fund’s investments denominated in that currency over time.
A fund will hold securities or other options or futures positions whose values are expected to offset its obligations. The fund would not enter into an option or futures position that exposes the fund to an obligation to another party unless it owns either (i) an offsetting position in securities or (ii) cash, receivables and short-term debt securities with a value sufficient to cover its potential obligations. (See also Derivative Instruments and Foreign Securities.)
Although one or more of the other risks described in this SAI may apply, the largest risks associated with foreign currency transactions include: Derivatives Risk, Interest Rate Risk, and Liquidity Risk.
Foreign Securities
Foreign securities, foreign currencies, and securities issued by U.S. entities with substantial foreign operations involve special risks, including those set forth below, which are not typically associated with investing in U.S. securities. Foreign companies are not generally subject to uniform accounting, auditing, and financial reporting standards comparable to those applicable to domestic companies. Additionally, many foreign stock markets, while growing in volume of trading activity, have substantially less volume than the New York Stock Exchange, and securities of some foreign companies are less liquid and more volatile than securities of domestic companies. Similarly, volume and liquidity in most foreign bond markets are less than the volume and liquidity in the U.S. and, at times, volatility of price can be greater than in the U.S. Further, foreign markets have different clearance, settlement, registration, and communication procedures and in certain markets there have been times when settlements have been unable to keep pace with the volume of securities transactions making it difficult to conduct such transactions. Delays in such procedures could result in temporary periods when assets are uninvested and no return is earned on them. The inability of an investor to make intended security purchases due to such problems could cause the investor to miss attractive investment opportunities.
39
Payment for securities without delivery may be required in certain foreign markets and, when participating in new issues, some foreign countries require payment to be made in advance of issuance (at the time of issuance, the market value of the security may be more or less than the purchase price). Some foreign markets also have compulsory depositories (i.e., an investor does not have a choice as to where the securities are held). Fixed commissions on some foreign stock exchanges are generally higher than negotiated commissions on U.S. exchanges. Further, an investor may encounter difficulties or be unable to pursue legal remedies and obtain judgments in foreign courts. There is generally less government supervision and regulation of business and industry practices, stock exchanges, brokers, and listed companies than in the U.S. It may be more difficult for an investor’s agents to keep currently informed about corporate actions such as stock dividends or other matters that may affect the prices of portfolio securities. Communications between the U.S. and foreign countries may be less reliable than within the U.S., thus increasing the risk of delays or loss of certificates for portfolio securities. In addition, with respect to certain foreign countries, there is the possibility of nationalization, expropriation, the imposition of additional withholding or confiscatory taxes, political, social, or economic instability, diplomatic developments that could affect investments in those countries, or other unforeseen actions by regulatory bodies (such as changes to settlement or custody procedures).
The risks of foreign investing may be magnified for investments in emerging markets, which may have relatively unstable governments, economies based on only a few industries, and securities markets that trade a small number of securities.
The introduction of a single currency, the euro, on Jan. 1, 1999 for participating European nations in the Economic and Monetary Union (EU) presents unique uncertainties, including the legal treatment of certain outstanding financial contracts after Jan. 1, 1999 that refer to existing currencies rather than the euro; the establishment and maintenance of exchange rates; the fluctuation of the euro relative to non-euro currencies; whether the interest rate, tax or labor regimes of European countries participating in the euro will converge over time; and whether the admission of other countries such as Poland, Latvia, and Lithuania as members of the EU may have an impact on the euro.
Although one or more of the other risks described in this SAI may apply, the largest risks associated with foreign securities include: Foreign/Emerging Markets Risk and Issuer Risk.
Funding Agreements
A fund may invest in funding agreements issued by domestic insurance companies. Funding agreements are short-term, privately placed, debt obligations of insurance companies that offer a fixed- or floating-rate of interest. These investments are not readily marketable and therefore are considered to be illiquid securities. (See also Illiquid and Restricted Securities.)
Although one or more of the other risks described in this SAI may apply, the largest risks associated with funding agreements include: Credit Risk and Liquidity Risk.
High-Yield Debt Securities (Junk Bonds)
High yield (high-risk) debt securities are sometimes referred to as junk bonds. They are non-investment grade (lower quality) securities that have speculative characteristics. Lower quality securities, while generally offering higher yields than investment grade securities with similar maturities, involve greater risks, including the possibility of default or bankruptcy. They are regarded as predominantly speculative with respect to the issuer’s capacity to pay interest and repay principal. The special risk considerations in connection with investments in these securities are discussed below.
See Appendix A for a discussion of securities ratings. (See also Debt Obligations.)
All fixed rate interest-bearing securities typically experience appreciation when interest rates decline and depreciation when interest rates rise. The market values of lower-quality and comparable unrated securities tend to reflect individual corporate developments to a greater extent than do higher rated securities, which react primarily to fluctuations in the general level of interest rates. Lower-quality and comparable unrated securities also tend to be more sensitive to economic conditions than are higher-rated securities. As a result, they generally involve more credit risks than securities in the higher-rated categories. During an economic downturn or a sustained period of rising interest rates, highly leveraged issuers of lower-quality securities may experience financial stress and may not have sufficient revenues to meet their payment obligations. The issuer’s ability to service its debt obligations also may be adversely affected by specific corporate developments, the issuer’s inability to meet specific projected business forecasts, or the unavailability of additional financing. The risk of loss due to default by an issuer of these securities is significantly greater than a default by issuers of higher-rated securities because such securities are generally unsecured and are often subordinated to other creditors. Further, if the issuer of a lower quality security defaulted, an investor might incur additional expenses to seek recovery.
40
Credit ratings issued by credit rating agencies are designed to evaluate the safety of principal and interest payments of rated securities. They do not, however, evaluate the market value risk of lower-quality securities and, therefore, may not fully reflect the true risks of an investment. In addition, credit rating agencies may or may not make timely changes in a rating to reflect changes in the economy or in the condition of the issuer that affect the market value of the securities. Consequently, credit ratings are used only as a preliminary indicator of investment quality.
An investor may have difficulty disposing of certain lower-quality and comparable unrated securities because there may be a thin trading market for such securities. Because not all dealers maintain markets in all lower quality and comparable unrated securities, there is no established retail secondary market for many of these securities. To the extent a secondary trading market does exist, it is generally not as liquid as the secondary market for higher-rated securities. The lack of a liquid secondary market may have an adverse impact on the market price of the security. The lack of a liquid secondary market for certain securities also may make it more difficult for an investor to obtain accurate market quotations. Market quotations are generally available on many lower-quality and comparable unrated issues only from a limited number of dealers and may not necessarily represent firm bids of such dealers or prices for actual sales.
Although one or more of the other risks described in this SAI may apply, the largest risks associated with high-yield debt securities include: Credit Risk, Interest Rate Risk, and Prepayment and Extension Risk.
Illiquid and Restricted Securities
Illiquid securities are securities that are not readily marketable. These securities may include, but are not limited to, certain securities that are subject to legal or contractual restrictions on resale, certain repurchase agreements, and derivative instruments. To the extent a fund invests in illiquid or restricted securities, it may encounter difficulty in determining a market value for the securities. Disposing of illiquid or restricted securities may involve time-consuming negotiations and legal expense, and it may be difficult or impossible for a fund to sell the investment promptly and at an acceptable price.
In determining the liquidity of all securities and derivatives, such as Rule 144A securities, which are unregistered securities offered to qualified institutional buyers, and interest-only and principal-only fixed mortgage-backed securities (IOs and POs) issued by the U.S. government or its agencies and instrumentalities the investment manager, under guidelines established by the Board, will consider any relevant factors including the frequency of trades, the number of dealers willing to purchase or sell the security and the nature of marketplace trades.
Although one or more of the other risks described in this SAI may apply, the largest risks associated with illiquid and restricted securities include: Liquidity Risk.
Indexed Securities
The value of indexed securities is linked to currencies, interest rates, commodities, indexes, or other financial indicators. Most indexed securities are short- to intermediate-term fixed income securities whose values at maturity or interest rates rise or fall according to the change in one or more specified underlying instruments. Indexed securities may be more volatile than the underlying instrument itself and they may be less liquid than the securities represented by the index. (See also Derivative Instruments.)
Although one or more of the other risks described in this SAI may apply, the largest risks associated with indexed securities include: Liquidity Risk and Market Risk.
Inflation Protected Securities
Inflation is a general rise in prices of goods and services. Inflation erodes the purchasing power of an investor’s assets. For example, if an investment provides a total return of 7% in a given year and inflation is 3% during that period, the inflation-adjusted, or real, return is 4%. Inflation-protected securities are debt securities whose principal and/or interest payments are adjusted for inflation, unlike debt securities that make fixed principal and interest payments. One type of inflation-protected debt security is issued by the U.S. Treasury. The principal of these securities is adjusted for inflation as indicated by the Consumer Price Index for Urban Consumers (CPI) and interest is paid on the adjusted amount. The CPI is a measurement of changes in the cost of living, made up of components such as housing, food, transportation and energy.
41
If the CPI falls, the principal value of inflation-protected securities will be adjusted downward, and consequently the interest payable on these securities (calculated with respect to a smaller principal amount) will be reduced. Conversely, if the CPI rises, the principal value of inflation-protected securities will be adjusted upward, and consequently the interest payable on these securities will be increased. Repayment of the original bond principal upon maturity is guaranteed in the case of U.S. Treasury inflation-protected securities, even during a period of deflation. However, the current market value of the inflation-protected securities is not guaranteed and will fluctuate. Other inflation-indexed securities include inflation-related bonds, which may or may not provide a similar guarantee. If a guarantee of principal is not provided, the adjusted principal value of the bond repaid at maturity may be less than the original principal.
Other issuers of inflation-protected debt securities include other U.S. government agencies or instrumentalities, corporations and foreign governments. There can be no assurance that the CPI or any foreign inflation index will accurately measure the real rate of inflation in the prices of goods and services. Moreover, there can be no assurance that the rate of inflation in a foreign country will be correlated to the rate of inflation in the United States.
If interest rates rise due to reasons other than inflation (for example, due to changes in currency exchange rates), investors in these securities may not be protected to the extent that the increase is not reflected in the bond’s inflation measure.
Any increase in principal for an inflation-protected security resulting from inflation adjustments is considered by IRS regulations to be taxable income in the year it occurs. For direct holders of an inflation-protected security, this means that taxes must be paid on principal adjustments even though these amounts are not received until the bond matures. By contrast, a fund holding these securities distributes both interest income and the income attributable to principal adjustments in the form of cash or reinvested shares, which are taxable to shareholders.
Although one or more of the other risks described in this SAI may apply, the largest risks associated with inflation-protected securities include: Interest Rate Risk and Market Risk.
Initial Public Offerings (IPOs)
Companies issuing IPOs generally have limited operating histories, and their prospects for future profitability are uncertain. These companies often are engaged in new and evolving businesses and are particularly vulnerable to competition and to changes in technology, markets and economic conditions. They may be dependent on certain key managers and third parties, need more personnel and other resources to manage growth and require significant additional capital. They may also be dependent on limited product lines and uncertain property rights and need regulatory approvals. Funds that invest in IPOs can be affected by sales of additional shares and by concentration of control in existing management and principal shareholders. Stock prices of IPOs can also be highly unstable, due to the absence of a prior public market, the small number of shares available for trading and limited investor information. Most IPOs involve a high degree of risk not normally associated with offerings of more seasoned companies.
Although one or more risks described in this SAI may apply, the largest risks associated with IPOs include: Small and Mid-Sized Company Risk and Initial Public Offering (IPO) Risk.
Inverse Floaters
Inverse floaters or inverse floating rate securities are a type of derivative long-term fixed income obligation with a floating or variable interest rate that moves in the opposite direction of short-term interest rates. As short-term interest rates go down, the holders of the inverse floaters receive more income and, as short-term interest rates go up, the holders of the inverse floaters receive less income. As with all long-term fixed income securities, the price of the inverse floater moves inversely with long-term interest rates; as long-term interest rates go down, the price of the inverse floater moves up and, when long-term interest rates go up, the price of the inverse floater moves down. While inverse floater securities tend to provide more income than similar term and credit quality fixed-rate bonds, they also exhibit greater volatility in price movement (both up and down).
In the municipal market an inverse floater is typically created when the owner of a municipal fixed rate bond transfers that bond to a trust in exchange for cash and a residual interest in the trust’s assets and cash flows (inverse floater certificates). The trust funds the purchase of the bond by issuing two classes of certificates: short-term floating rate notes (typically sold to third parties) and the inverse floaters (also known as residual certificates). No additional income beyond that provided by the trust’s underlying bond is created; rather, that income is merely divided-up between the two classes of certificates. The holder of the inverse floating rate securities typically has the right to (1) cause the holders of the short-term floating rate notes to tender their notes at par ($100) and (2) to return the inverse floaters and withdraw the underlying bonds, thereby collapsing the trust. (See also Derivative Instruments.)
42
Although one or more of the other risks described in this SAI may apply, the largest risks associated with transactions in inverse floaters include: Interest Rate Risk, Credit Risk, Liquidity Risk and Market Risk.
Investment Companies
Investing in securities issued by registered and unregistered investment companies may involve the duplication of advisory fees and certain other expenses.
Although one or more of the other risks described in this SAI may apply, the largest risks associated with the securities of other investment companies include: Market Risk.
Lending of Portfolio Securities
To generate additional income, a fund may lend up to one-third of the value of its total assets to broker-dealers, banks or other institutional borrowers of securities. JPMorgan Chase Bank, N.A. serves as lending agent (the Lending Agent) to the funds pursuant to a securities lending agreement (the Securities Lending Agreement) approved by the Board.
Under the Securities Lending Agreement, the Lending Agent loans securities to approved borrowers pursuant to borrower agreements in exchange for collateral equal to at least 100% of the market value of the loaned securities. Collateral may consist of cash, securities issued by the U.S. government or its agencies or instrumentalities (collectively, “U.S. government securities”) or such other collateral as may be approved by the Board. For loans secured by cash, the fund retains the interest earned on cash collateral investments, but is required to pay the borrower a rebate for the use of the cash collateral. For loans secured by U.S. government securities, the borrower pays a borrower fee to the Lending Agent on behalf of the fund. If the market value of the loaned securities goes up, the Lending Agent will request additional collateral from the borrower. If the market value of the loaned securities goes down, the borrower may request that some collateral be returned. During the existence of the loan, the lender will receive from the borrower amounts equivalent to any dividends, interest or other distributions on the loaned securities, as well as interest on such amounts.
Loans are subject to termination by a fund or a borrower at any time. A fund may choose to terminate a loan in order to vote in a proxy solicitation if the fund has knowledge of a material event to be voted on that would affect the fund’s investment in the loaned security.
Securities lending involves counterparty risk, including the risk that a borrower may not provide additional collateral when required or return the loaned securities in a timely manner. Counterparty risk also includes a potential loss of rights in the collateral if the borrower or the Lending Agent defaults or fails financially. This risk is increased if a fund’s loans are concentrated with a single or limited number of borrowers. There are no limits on the number of borrowers a fund may use and a fund may lend securities to only one or a small group of borrowers. Funds participating in securities lending also bear the risk of loss in connection with investments of cash collateral received from the borrowers. Cash collateral is invested in accordance with investment guidelines contained in the Securities Lending Agreement and approved by the Board. To the extent that the value or return of a fund’s investments of the cash collateral declines below the amount owed to a borrower, a fund may incur losses that exceed the amount it earned on lending the security. The Lending Agent will indemnify a fund from losses resulting from a borrower’s failure to return a loaned security when due, but such indemnification does not extend to losses associated with declines in the value of cash collateral investments.
Although one or more of the other risks described in this SAI may apply, the largest risks associated with the lending of portfolio securities include: Credit Risk.
Loan Participations
Loans, loan participations, and interests in securitized loan pools are interests in amounts owed by a corporate, governmental, or other borrower to a lender or consortium of lenders (typically banks, insurance companies, investment banks, government agencies, or international agencies). Loans involve a risk of loss in case of default or insolvency of the borrower and may offer less legal protection to an investor in the event of fraud or misrepresentation.
Although one or more of the other risks described in this SAI may apply, the largest risks associated with loan participations include: Credit Risk.
43
Mortgage- and Asset-Backed Securities
Mortgage-backed securities represent direct or indirect participations in, or are secured by and payable from, mortgage loans secured by real property, and include single- and multi-class pass-through securities and Collateralized Mortgage Obligations (CMOs). These securities may be issued or guaranteed by U.S. government agencies or instrumentalities (see also Agency and Government Securities), or by private issuers, generally originators and investors in mortgage loans, including savings associations, mortgage bankers, commercial banks, investment bankers, and special purpose entities. Mortgage-backed securities issued by private lenders may be supported by pools of mortgage loans or other mortgage-backed securities that are guaranteed, directly or indirectly, by the U.S. government or one of its agencies or instrumentalities, or they may be issued without any governmental guarantee of the underlying mortgage assets but with some form of non-governmental credit enhancement. Commercial mortgage-backed securities (CMBS) are a specific type of mortgage-backed security collateralized by a pool of mortgages on commercial real estate.
Stripped mortgage-backed securities are a type of mortgage-backed security that receive differing proportions of the interest and principal payments from the underlying assets. Generally, there are two classes of stripped mortgage-backed securities: Interest Only (IO) and Principal Only (PO). IOs entitle the holder to receive distributions consisting of all or a portion of the interest on the underlying pool of mortgage loans or mortgage-backed securities. POs entitle the holder to receive distributions consisting of all or a portion of the principal of the underlying pool of mortgage loans or mortgage-backed securities. The cash flows and yields on IOs and POs are extremely sensitive to the rate of principal payments (including prepayments) on the underlying mortgage loans or mortgage-backed securities. A rapid rate of principal payments may adversely affect the yield to maturity of IOs. A slow rate of principal payments may adversely affect the yield to maturity of POs. If prepayments of principal are greater than anticipated, an investor in IOs may incur substantial losses. If prepayments of principal are slower than anticipated, the yield on a PO will be affected more severely than would be the case with a traditional mortgage-backed security.
CMOs are hybrid mortgage-related instruments secured by pools of mortgage loans or other mortgage-related securities, such as mortgage pass through securities or stripped mortgage-backed securities. CMOs may be structured into multiple classes, often referred to as “tranches,” with each class bearing a different stated maturity and entitled to a different schedule for payments of principal and interest, including prepayments. Principal prepayments on collateral underlying a CMO may cause it to be retired substantially earlier than its stated maturity. The yield characteristics of mortgage-backed securities differ from those of other debt securities. Among the differences are that interest and principal payments are made more frequently on mortgage-backed securities, usually monthly, and principal may be repaid at any time. These factors may reduce the expected yield.
Asset-backed securities have structural characteristics similar to mortgage-backed securities. Asset-backed debt obligations represent direct or indirect participation in, or secured by and payable from, assets such as motor vehicle installment sales contracts, other installment loan contracts, home equity loans, leases of various types of property, and receivables from credit card or other revolving credit arrangements. The credit quality of most asset-backed securities depends primarily on the credit quality of the assets underlying such securities, how well the entity issuing the security is insulated from the credit risk of the originator or any other affiliated entities, and the amount and quality of any credit enhancement of the securities. Payments or distributions of principal and interest on asset- backed debt obligations may be supported by non-governmental credit enhancements including letters of credit, reserve funds, overcollateralization, and guarantees by third parties. The market for privately issued asset-backed debt obligations is smaller and less liquid than the market for government sponsored mortgage-backed securities. (See also Derivative Instruments.)
Although one or more of the other risks described in this SAI may apply, the largest risks associated with mortgage and asset-backed securities include: Credit Risk, Interest Rate Risk, Liquidity Risk, and Prepayment and Extension Risk.
Mortgage Dollar Rolls
Mortgage dollar rolls are investments in which an investor sells mortgage-backed securities for delivery in the current month and simultaneously contracts to purchase substantially similar securities on a specified future date. While an investor foregoes principal and interest paid on the mortgage-backed securities during the roll period, the investor is compensated by the difference between the current sales price and the lower price for the future purchase as well as by any interest earned on the proceeds of the initial sale. The investor also could be compensated through the receipt of fee income equivalent to a lower forward price.
Although one or more of the other risks described in this SAI may apply, the largest risks associated with mortgage dollar rolls include: Credit Risk and Interest Rate Risk.
44
Municipal Obligations
Municipal obligations include debt obligations issued by or on behalf of states, territories, possessions, or sovereign nations within the territorial boundaries of the United States (including the District of Columbia, Guam and Puerto Rico). The interest on these obligations is generally exempt from federal income tax. Municipal obligations are generally classified as either “general obligations” or “revenue obligations.”
General obligation bonds are secured by the issuer’s pledge of its full faith, credit, and taxing power for the payment of interest and principal. Revenue bonds are payable only from the revenues derived from a project or facility or from the proceeds of a specified revenue source. Industrial development bonds are generally revenue bonds secured by payments from and the credit of private users. Municipal notes are issued to meet the short-term funding requirements of state, regional, and local governments. Municipal notes include tax anticipation notes, bond anticipation notes, revenue anticipation notes, tax and revenue anticipation notes, construction loan notes, short-term discount notes, tax-exempt commercial paper, demand notes, and similar instruments.
Municipal lease obligations may take the form of a lease, an installment purchase, or a conditional sales contract. They are issued by state and local governments and authorities to acquire land, equipment, and facilities. An investor may purchase these obligations directly, or it may purchase participation interests in such obligations. Municipal leases may be subject to greater risks than general obligation or revenue bonds. State constitutions and statutes set forth requirements that states or municipalities must meet in order to issue municipal obligations. Municipal leases may contain a covenant by the state or municipality to budget for and make payments due under the obligation. Certain municipal leases may, however, provide that the issuer is not obligated to make payments on the obligation in future years unless funds have been appropriated for this purpose each year.
Yields on municipal bonds and notes depend on a variety of factors, including money market conditions, municipal bond market conditions, the size of a particular offering, the maturity of the obligation, and the rating of the issue. The municipal bond market has a large number of different issuers, many having smaller sized bond issues, and a wide choice of different maturities within each issue. For these reasons, most municipal bonds do not trade on a daily basis and many trade only rarely. Because many of these bonds trade infrequently, the spread between the bid and offer may be wider and the time needed to develop a bid or an offer may be longer than other security markets. See Appendix A for a discussion of securities ratings. (See also Debt Obligations.)
Taxable Municipal Obligations. There is another type of municipal obligation that is subject to federal income tax for a variety of reasons. These municipal obligations do not qualify for the federal income exemption because (a) they did not receive necessary authorization for tax-exempt treatment from state or local government authorities, (b) they exceed certain regulatory limitations on the cost of issuance for tax-exempt financing or (c) they finance public or private activities that do not qualify for the federal income tax exemption. These non-qualifying activities might include, for example, certain types of multi-family housing, certain professional and local sports facilities, refinancing of certain municipal debt, and borrowing to replenish a municipality’s underfunded pension plan.
Although one or more of the other risks described in this SAI may apply, the largest risks associated with municipal obligations include: Credit Risk, Inflation Risk, Interest Rate Risk, and Market Risk.
Preferred Stock
Preferred stock is a type of stock that pays dividends at a specified rate and that has preference over common stock in the payment of dividends and the liquidation of assets. Preferred stock does not ordinarily carry voting rights.
The price of a preferred stock is generally determined by earnings, type of products or services, projected growth rates, experience of management, liquidity, and general market conditions of the markets on which the stock trades.
Although one or more of the other risks described in this SAI may apply, the largest risks associated with preferred stock include: Issuer Risk and Market Risk.
Real Estate Investment Trusts
Real estate investment trusts (REITs) are pooled investment vehicles that manage a portfolio of real estate or real estate related loans to earn profits for their shareholders. REITs are generally classified as equity REITs, mortgage REITs or a combination of equity and mortgage REITs. Equity REITs invest the majority of their assets directly in real property, such as shopping centers, nursing homes, office buildings, apartment complexes, and hotels, and derive income primarily from the collection of rents. Equity REITs can also
45
realize capital gains by selling properties that have appreciated in value. Mortgage REITs invest the majority of their assets in real estate mortgages and derive income from the collection of interest payments. REITs can be subject to extreme volatility due to fluctuations in the demand for real estate, changes in interest rates, and adverse economic conditions. Similar to investment companies, REITs are not taxed on income distributed to shareholders provided they comply with certain requirements under the tax law. The failure of a REIT to continue to qualify as a REIT for tax purposes can materially affect its value. A fund will indirectly bear its proportionate share of any expenses paid by a REIT in which it invests.
REITs often do not provide complete tax information until after the calendar year-end. Consequently, because of the delay, it may be necessary for a fund investing in REITs to request permission to extend the deadline for issuance of Forms 1099-DIV beyond January 31. In the alternative, amended Forms 1099-DIV may be sent.
Although one or more of the other risks described in this SAI may apply, the largest risks associated with REITs include: Interest Rate Risk, Issuer Risk and Market Risk.
Repurchase Agreements
Repurchase agreements may be entered into with certain banks or non-bank dealers. In a repurchase agreement, the purchaser buys a security at one price, and at the time of sale, the seller agrees to repurchase the obligation at a mutually agreed upon time and price (usually within seven days). The repurchase agreement determines the yield during the purchaser’s holding period, while the seller’s obligation to repurchase is secured by the value of the underlying security. Repurchase agreements could involve certain risks in the event of a default or insolvency of the other party to the agreement, including possible delays or restrictions upon the purchaser’s ability to dispose of the underlying securities.
Although one or more of the other risks described in this SAI may apply, the largest risks associated with repurchase agreements include: Credit Risk.
Reverse Repurchase Agreements
In a reverse repurchase agreement, an investor sells a security and enters into an agreement to repurchase the security at a specified future date and price. The investor generally retains the right to interest and principal payments on the security. Since the investor receives cash upon entering into a reverse repurchase agreement, it may be considered a borrowing. (See also Derivative Instruments.)
Although one or more of the other risks described in this SAI may apply, the largest risks associated with reverse repurchase agreements include: Credit Risk and Interest Rate Risk.
Short Sales
In short-selling transactions, a fund sells a security it does not own in anticipation of a decline in the market value of the security. To complete the transaction, a fund must borrow the security to make delivery to the buyer. A fund is obligated to replace the security borrowed by purchasing it at the market price at the time of replacement. The price at such time may be more or less than the price at which the security was sold by a fund, which may result in a loss or gain, respectively. Unlike taking a long position in a security by purchasing the security, where potential losses are limited to the purchase price, short sales have no cap on maximum losses, and gains are limited to the price of the security at the time of the short sale.
Short sales of forward commitments and derivatives do not involve borrowing a security. These types of short sales may include futures, options, contracts for differences, forward contracts on financial instruments and options such as contracts, credit-linked instruments, and swap contracts.
A fund may not always be able to borrow a security it wants to sell short. A fund also may be unable to close out an established short position at an acceptable price and may have to sell long positions at disadvantageous times to cover its short positions. The value of your investment in a fund will fluctuate in response to the movements in the market. Fund performance also will depend on the effectiveness of the investment manager’s research and the management team’s investment decisions.
Short sales also involve other costs. A fund must repay to the lender an amount equal to any dividends or interest that accrues while the loan is outstanding. To borrow the security, a fund may be required to pay a premium. A fund also will incur truncation costs in effecting short sales. The amount of any ultimate gain for a fund resulting from a short sale will be decreased and the amount of any
46
ultimate loss will be increased, by the amount of premiums, interest or expenses a fund may be required to pay in connection with the short sale. Until a fund closes the short position, it will earmark and reserve fund assets, in cash or liquid securities to offset a portion of the leverage risk. Realized gains from short sales are typically treated as short-term gains/losses.
Although one or more of the other risks described in this SAI may apply, the largest risks associated with short sales include: Market Risk and Short Sales Risk.
Sovereign Debt
A sovereign debtor’s willingness or ability to repay principal and pay interest in a timely manner may be affected by a variety of factors, including its cash flow situation, the extent of its reserves, the availability of sufficient foreign exchange on the date a payment is due, the relative size of the debt service burden to the economy as a whole, the sovereign debtor’s policy toward international lenders, and the political constraints to which a sovereign debtor may be subject. (See also Foreign Securities.)
With respect to sovereign debt of emerging market issuers, investors should be aware that certain emerging market countries are among the largest debtors to commercial banks and foreign governments. At times, certain emerging market countries have declared moratoria on the payment of principal and interest on external debt.
Certain emerging market countries have experienced difficulty in servicing their sovereign debt on a timely basis that led to defaults and the restructuring of certain indebtedness.
Sovereign debt includes Brady Bonds, which are securities issued under the framework of the Brady Plan, an initiative announced by former U.S. Treasury Secretary Nicholas F. Brady in 1989 as a mechanism for debtor nations to restructure their outstanding external commercial bank indebtedness.
Although one or more of the other risks described in this SAI may apply, the largest risks associated with sovereign debt include: Credit Risk and Foreign/Emerging Markets Risk.
Structured Investments
A structured investment is a security whose return is tied to an underlying index or to some other security or pool of assets. Structured investments generally are individually negotiated agreements and may be traded over-the-counter. Structured investments are created and operated to restructure the investment characteristics of the underlying security. This restructuring involves the deposit with or purchase by an entity, such as a corporation or trust, of specified instruments, such as commercial bank loans, and the issuance by that entity of one or more classes of debt obligations (“structured securities”) backed by, or representing interests in, the underlying instruments. The cash flow on the underlying instruments may be apportioned among the newly issued structured securities to create securities with different investment characteristics, such as varying maturities, payment priorities, and interest rate provisions. The extent of the payments made with respect to structured securities is dependent on the extent of the cash flow on the underlying instruments. Because structured securities typically involve no credit enhancement, their credit risk generally will be equivalent to that of the underlying instruments. Structured securities are often offered in different classes. As a result a given class of a structured security may be either subordinated or unsubordinated to the right of payment of another class. Subordinated structured securities typically have higher yields and present greater risks than unsubordinated structured securities. Structured securities are typically sold in private placement transactions, and at any given time there may be no active trading market for a particular structured security.
Although one or more of the other risks described in this SAI may apply, the largest risks associated with structured investments include: Credit Risk and Liquidity Risk.
Swap Agreements
Swap agreements are typically individually negotiated agreements that obligate two parties to exchange payments based on a reference to a specified asset, reference rate or index. Swap agreements will tend to shift a party’s investment exposure from one type of investment to another. A swap agreement can increase or decrease the volatility of a fund’s investments and its net asset value.
Swap agreements are traded in the over-the-counter market and may be considered to be illiquid. Swap agreements entail the risk that a party will default on its payment obligations. A fund will enter into a swap agreement only if the claims-paying ability of the other party or its guarantor is considered to be investment grade by the investment manager. Generally, the unsecured senior debt or the
47
claims-paying ability of the other party or its guarantor must be rated in one of the three highest rating categories of at least one Nationally Recognized Statistical Rating Organization (NRSRO) at the time of entering into the transaction. If there is a default by the other party to such a transaction, a fund will have to rely on its contractual remedies (which may be limited by bankruptcy, insolvency or similar laws) pursuant to the agreements related to the transaction. In certain circumstances, a fund may seek to minimize counterparty risk by requiring the counterparty to post collateral.
Swap agreements are usually entered into without an upfront payment because the value of each party’s position is the same. The market values of the underlying commitments will change over time resulting in one of the commitments being worth more than the other and the net market value creating a risk exposure for one counterparty or the other.
Interest Rate Swaps. Interest rate swap agreements are often used to obtain or preserve a desired return or spread at a lower cost than through a direct investment in an instrument that yields the desired return or spread. They are financial instruments that involve the exchange of one type of interest rate cash flow for another type of interest rate cash flow on specified dates in the future. In a standard interest rate swap transaction, two parties agree to exchange their respective commitments to pay fixed or floating rates on a predetermined specified (notional) amount. The swap agreement notional amount is the predetermined basis for calculating the obligations that the swap counterparties have agreed to exchange. Under most swap agreements, the obligations of the parties are exchanged on a net basis. The two payment streams are netted out, with each party receiving or paying, as the case may be, only the net amount of the two payments. Interest rate swaps can be based on various measures of interest rates, including LIBOR, swap rates, treasury rates and other foreign interest rates.
Cross Currency Swaps. Cross currency swaps are similar to interest rate swaps, except that they involve multiple currencies. A fund may enter into a currency swap when it has exposure to one currency and desires exposure to a different currency. Typically the interest rates that determine the currency swap payments are fixed, although occasionally one or both parties may pay a floating rate of interest. Unlike an interest rate swap, however, the principal amounts are exchanged at the beginning of the contract and returned at the end of the contract. In addition to paying and receiving amounts at the beginning and termination of the agreements, both sides will also have to pay in full periodically based upon the currency they have borrowed. Change in foreign exchange rates and changes in interest rates, as described above, may negatively affect currency swaps.
Total Return Swaps. Total return swaps are contracts in which one party agrees to make periodic payments based on the change in market value of the underlying assets, which may include a specified security, basket of securities or security indexes during the specified period, in return for periodic payments based on a fixed or variable interest rate of the total return from other underlying assets. Total return swap agreements may be used to obtain exposure to a security or market without owning or taking physical custody of such security or market. For example, CMBS total return swaps are bilateral financial contracts designed to replicate synthetically the total returns of commercial mortgage-backed securities. In a typical total return equity swap, payments made by the fund or the counterparty are based on the total return of a particular reference asset or assets (such as an equity security, a combination of such securities, or an index). That is, one party agrees to pay another party the return on a stock, basket of stocks, or stock index in return for a specified interest rate. By entering into an equity index swap, for example, the index receiver can gain exposure to stocks making up the index of securities without actually purchasing those stocks. Total return swaps involve not only the risk associated with the investment in the underlying securities, but also the risk of the counterparty not fulfilling its obligations under the agreement.
Swaption Transaction. A swaption is an option on a swap agreement and a contract that gives a counterparty the right (but not the obligation) to enter into a new swap agreement or to shorten, extend, cancel or otherwise modify an existing swap agreement, at some designated future time on specified terms, in return for payment of the purchase price (the “premium”) of the option. The fund may write (sell) and purchase put and call swaptions to the same extent it may make use of standard options on securities or other instruments. The writer of the contract receives the premium and bears the risk of unfavorable changes in the market value on the underlying swap agreement.
Swaptions can be bundled and sold as a package. These are commonly called interest rate caps, floors and collars. In interest rate cap transactions, in return for a premium, one party agrees to make payments to the other to the extent that interest rates exceed a specified rate, or cap. Interest rate floor transactions require one party, in exchange for a premium to agree to make payments to the other to the extent that interest rates fall below a specified level, or floor. In interest rate collar transactions, one party sells a cap and purchases a floor, or vice versa, in an attempt to protect itself against interest rate movements exceeding given minimum or maximum levels or collar amounts.
48
Credit Default Swaps. Credit default swaps are contracts in which third party credit risk is transferred from one party to another party by one party, the protection buyer, making payments to the other party, the protection seller, in return for the ability of the protection buyer to deliver a reference obligation, or portfolio of reference obligations, to the protection seller upon the occurrence of certain credit events relating to the issuer of the reference obligation and receive the notional amount of the reference obligation from the protection seller. A fund may use credit default swaps for various purposes including to increase or decrease its credit exposure to various issuers. For example, as a seller in a transaction, a fund could use credit default swaps as a way of increasing investment exposure to a particular issuer’s bonds in lieu of purchasing such bonds directly. Similarly, as a buyer in a transaction, a fund may use credit default swaps to hedge its exposure on bonds that it owns or in lieu of selling such bonds. A credit default swap agreement may have as reference obligations one or more securities that are not currently held by the fund. The fund may be either the buyer or seller in the transaction. Credit default swaps may also be structured based on the debt of a basket of issuers, rather than a single issuer, and may be customized with respect to the default event that triggers purchase or other factors. As a seller, the fund generally receives an up front payment or a fixed rate of income throughout the term of the swap, which typically is between six months and three years, provided that there is no credit event. If a credit event occurs, generally the seller must pay the buyer the full face amount of deliverable obligations of the reference obligations that may have little or no value. If the fund is a buyer and no credit event occurs, the fund recovers nothing if the swap is held through its termination date. However, if a credit event occurs, the buyer may elect to receive the full notional value of the swap in exchange for an equal face amount of deliverable obligations of the reference obligation that may have little or no value.
Credit default swap agreements can involve greater risks than if a fund had invested in the reference obligation directly since, in addition to general market risks, credit default swaps are subject to counterparty credit risk, leverage risk, hedging risk, correlation risk and liquidity risk. A fund will enter into credit default swap agreements only with counterparties that meet certain standards of creditworthiness. A buyer generally also will lose its investment and recover nothing should no credit event occur and the swap is held to its termination date. If a credit event were to occur, the value of any deliverable obligation received by the seller, coupled with the upfront or periodic payments previously received, may be less than the full notional value it pays to the buyer, resulting in a loss of value to the seller. A fund’s obligations under a credit default swap agreement will be accrued daily (offset against any amounts owing to the fund). In connection with credit default swaps in which a fund is the buyer, the fund will segregate or “earmark” cash or other liquid assets, or enter into certain offsetting positions, with a value at least equal to the fund’s exposure (any accrued but unpaid net amounts owed by the fund to any counterparty), on a marked-to-market basis. In connection with credit default swaps in which a fund is the seller, the fund will segregate or “earmark” cash or other liquid assets, or enter into offsetting positions, with a value at least equal to the full notional amount of the swap (minus any amounts owed to the fund). Such segregation or “earmarking” will ensure that the fund has assets available to satisfy its obligations with respect to the transaction. Such segregation or “earmarking” will not limit the fund’s exposure to loss.
The use of swap agreements by a fund entails certain risks, which may be different from, or possibly greater than, the risks associated with investing directly in the securities and other investments that are the referenced asset for the swap agreement. Swaps are highly specialized instruments that require investment techniques, risk analyses, and tax planning different from those associated with stocks, bonds, and other traditional investments. The use of a swap requires an understanding not only of the referenced asset, reference rate, or index, but also of the swap itself, without the benefit of observing the performance of the swap under all the possible market conditions. Because some swap agreements have a leverage component, adverse changes in the value or level of the underlying asset, reference rate, or index can result in a loss substantially greater than the amount invested in the swap itself. Certain swaps have the potential for unlimited loss, regardless of the size of the initial investment.
Although one or more of the other risks described in this SAI may apply, the largest risks associated with swaps include: Credit Risk, Liquidity Risk and Market Risk.
Variable- or Floating-Rate Securities
Variable-rate securities provide for automatic establishment of a new interest rate at fixed intervals (daily, monthly, semiannually, etc.). Floating-rate securities generally provide for automatic adjustment of the interest rate whenever some specified interest rate index changes. Variable- or floating-rate securities frequently include a demand feature enabling the holder to sell the securities to the issuer at par. In many cases, the demand feature can be exercised at any time. Some securities that do not have variable or floating interest rates may be accompanied by puts producing similar results and price characteristics. Variable-rate demand notes include master demand notes that are obligations that permit the investor to invest fluctuating amounts, which may change daily without penalty, pursuant to direct arrangements between the investor as lender, and the borrower. The interest rates on these notes fluctuate from time to time. The issuer of such obligations normally has a corresponding right, after a given period, to prepay in its discretion the outstanding principal amount of the obligations plus accrued interest upon a specified number of days’ notice to the holders of
49
such obligations. Because these obligations are direct lending arrangements between the lender and borrower, it is not contemplated that such instruments generally will be traded. There generally is not an established secondary market for these obligations. Accordingly, where these obligations are not secured by letters of credit or other credit support arrangements, the lender’s right to redeem is dependent on the ability of the borrower to pay principal and interest on demand. Such obligations frequently are not rated by credit rating agencies and may involve heightened risk of default by the issuer.
Although one or more of the other risks described in this SAI may apply, the largest risks associated with variable- or floating-rate securities include: Credit Risk.
Warrants
Warrants are securities giving the holder the right, but not the obligation, to buy the stock of an issuer at a given price (generally higher than the value of the stock at the time of issuance) during a specified period or perpetually. Warrants may be acquired separately or in connection with the acquisition of securities. Warrants do not carry with them the right to dividends or voting rights and they do not represent any rights in the assets of the issuer. Warrants may be considered to have more speculative characteristics than certain other types of investments. In addition, the value of a warrant does not necessarily change with the value of the underlying securities, and a warrant ceases to have value if it is not exercised prior to its expiration date.
Although one or more of the other risks described in this SAI may apply, the largest risks associated with warrants include: Market Risk.
When-Issued Securities and Forward Commitments
When-issued securities and forward commitments involve a commitment to purchase or sell specific securities at a predetermined price or yield in which payment and delivery take place after the customary settlement period for that type of security. Normally, the settlement date occurs within 45 days of the purchase although in some cases settlement may take longer. The investor does not pay for the securities or receive dividends or interest on them until the contractual settlement date. Such instruments involve the risk of loss if the value of the security to be purchased declines prior to the settlement date and the risk that the security will not be issued as anticipated. If the security is not issued as anticipated, a fund may lose the opportunity to obtain a price and yield considered to be advantageous.
Although one or more of the other risks described in this SAI may apply, the largest risks associated with when-issued securities and forward commitments include: Credit Risk.
Zero-Coupon, Step-Coupon, and Pay-in-Kind Securities
These securities are debt obligations that do not make regular cash interest payments (see also Debt Obligations). Zero-coupon and step-coupon securities are sold at a deep discount to their face value because they do not pay interest until maturity. Pay-in-kind securities pay interest through the issuance of additional securities. Because these securities do not pay current cash income, the price of these securities can be extremely volatile when interest rates fluctuate. See Appendix A for a discussion of securities ratings.
Although one or more of the other risks described in this SAI may apply, the largest risks associated with zero- coupon, step-coupon, and pay-in-kind securities include: Credit Risk and Interest Rate Risk.
A fund cannot issue senior securities but this does not prohibit certain investment activities for which assets of the fund are set aside, or margin, collateral or escrow arrangements are established, to cover the related obligations. Examples of those activities include borrowing money, delayed-delivery and when-issued securities transactions, and contracts to buy or sell options, derivatives, and hedging instruments.
Securities Transactions
Except as otherwise noted, the description of policies and procedures in this section also applies to any fund subadviser. Subject to policies set by the Board, as well as the terms of the investment management services agreements, and subadviser agreements, as applicable, the investment manager or subadviser is authorized to determine, consistent with a fund’s investment objective and policies, which securities will be purchased, held, or sold. In determining where the buy and sell orders are to be placed, the investment manager has been directed to use its best efforts to obtain the best available price and the most favorable execution except where otherwise authorized by the Board.
50
Each fund, the investment manager, any subadviser and Columbia Management Investment Distributors, Inc. (principal underwriter and distributor of the funds) (formerly RiverSource Fund Distributors, Inc.) has a strict Code of Ethics that prohibits affiliated personnel from engaging in personal investment activities that compete with or attempt to take advantage of planned portfolio transactions for the fund.
A fund’s securities may be traded on an agency basis with brokers or dealers or on a principal basis with dealers. In an agency trade, the broker-dealer generally is paid a commission. In a principal trade, the investment manager will trade directly with the issuer or with a dealer who buys or sells for its own account, rather than acting on behalf of another client. The investment manager may pay the dealer a commission or instead, the dealer’s profit, if any, is the difference, or spread, between the dealer’s purchase and sale price for the security.
Broker-Dealer Selection
In selecting broker-dealers to execute transactions, the investment manager and each subadviser will consider from among such factors as the ability to minimize trading costs, trading expertise, infrastructure, ability to provide information or services, financial condition, confidentiality, competitiveness of commission rates, evaluations of execution quality, promptness of execution, past history, ability to prospect for and find liquidity, difficulty of trade, security’s trading characteristics, size of order, liquidity of market, block trading capabilities, quality of settlement, specialized expertise, overall responsiveness, willingness to commit capital and research services provided.
The Board has adopted a policy prohibiting the investment manager, or any subadviser, from considering sales of shares of the funds as a factor in the selection of broker-dealers through which to execute securities transactions.
On a periodic basis, the investment manager makes a comprehensive review of the broker-dealers and the overall reasonableness of their commissions, including review by an independent third-party evaluator. The review evaluates execution, operational efficiency, and research services.
Commission Dollars
Broker-dealers typically provide a bundle of services including research and execution of transactions. The research provided can be either proprietary (created and provided by the broker-dealer) or third party (created by a third party but provided by the broker-dealer). Consistent with the interests of the fund, the investment manager and each subadviser may use broker-dealers who provide both types of research products and services in exchange for commissions, known as “soft dollars,” generated by transactions in fund accounts.
The receipt of research and brokerage products and services is used by the investment manager, and by each subadviser, to the extent it engages in such transactions, to supplement its own research and analysis activities, by receiving the views and information of individuals and research staffs of other securities firms, and by gaining access to specialized expertise on individual companies, industries, areas of the economy and market factors. Research and brokerage products and services may include reports on the economy, industries, sectors and individual companies or issuers; statistical information; accounting and tax law interpretations; political analyses; reports on legal developments affecting portfolio securities; information on technical market actions; credit analyses; on-line quotation systems; risk measurement; analyses of corporate responsibility issues; on-line news services; and financial and market database services. Research services may be used by the investment manager in providing advice to multiple accounts, including the funds (or by any subadviser to any other client of the subadviser) even though it is not possible to relate the benefits to any particular account or fund.
On occasion, it may be desirable to compensate a broker for research services or for brokerage services by paying a commission that might not otherwise be charged or a commission in excess of the amount another broker might charge. The Board has adopted a policy authorizing the investment manager to do so, to the extent authorized by law, if the investment manager or subadviser determines, in good faith, that such commission is reasonable in relation to the value of the brokerage or research services provided by a broker or dealer, viewed either in the light of that transaction or the investment manager’s or subadviser’s overall responsibilities with respect to a fund and the other funds or accounts for which it acts as investment manager (or by any subadviser to any other client of that subadviser).
As a result of these arrangements, some portfolio transactions may not be effected at the lowest commission, but overall execution may be better. The investment manager and each subadviser have represented that under its procedures the amount of commission paid will be reasonable and competitive in relation to the value of the brokerage services and research products and services provided.
51
The investment manager or a subadviser may use step-out transactions. A “step-out” is an arrangement in which the investment manager or subadviser executes a trade through one broker-dealer but instructs that broker-dealer to step-out all or a part of the trade to another broker-dealer. The second broker-dealer will clear and settle, and receive commissions for, the stepped-out portion. The investment manager or subadviser may receive research products and services in connection with step-out transactions.
Use of fund commissions may create potential conflicts of interest between the investment manager or subadviser and a fund. However, the investment manager and each subadviser has policies and procedures in place intended to mitigate these conflicts and ensure that the use of fund commissions falls within the “safe harbor” of Section 28(e) of the Securities Exchange Act of 1934. Some products and services may be used for both investment decision-making and non-investment decision-making purposes (“mixed use” items). The investment manager and each subadviser, to the extent it has mixed use items, has procedures in place to assure that fund commissions pay only for the investment decision-making portion of a mixed-use item.
Affiliate Transactions
Subject to applicable legal and regulatory requirements, the fund may enter into transactions in which Ameriprise Financial and/or its affiliates, or companies that are deemed to be affiliates of the fund (e.g., due to, among other factors, their or their affiliates’ ownership or control of shares of the fund) may have an interest that potentially conflicts with the interests of the fund. For example, an affiliate of Ameriprise Financial may sell securities to the fund from an offering in which it is an underwriter or from securities that it owns as a dealer, subject to applicable legal and regulatory requirements. Applicable legal and regulatory requirements also may prevent the fund from engaging in transactions with an affiliate of the fund, which may include Ameriprise Financial and its affiliates, or from participating in an investment opportunity in which an affiliate of the fund participates.
Trade Aggregation and Allocation
Generally, orders are processed and executed in the order received. When a fund buys or sells the same security as another portfolio, fund, or account, the investment manager or subadviser carries out the purchase or sale pursuant to policies and procedures designed in such a way believed to be fair to the fund. Purchase and sale orders may be combined or aggregated for more than one account if it is believed it would be consistent with best execution. Aggregation may reduce commission costs or market impact on a per-share and per-dollar basis, although aggregation may have the opposite effect. There may be times when not enough securities are received to fill an aggregated order, including in an initial public offering, involving multiple accounts. In that event, the investment manager and each subadviser has policies and procedures designed in such a way believed to result in a fair allocation among accounts, including the fund.
From time to time, different portfolio managers with the investment manager may make differing investment decisions related to the same security. However, with certain exceptions for funds managed using strictly quantitative methods, a portfolio manager or portfolio management team may not sell a security short if the security is owned in another portfolio managed by that portfolio manager or portfolio management team. On occasion, a fund may purchase and sell a security simultaneously in order to profit from short-term price disparities.
Certain Investment Limitations
From time to time, the investment manager or subadviser for a fund and their respective affiliates (“adviser group”) will be trading in the same securities or be deemed to beneficially hold the same securities. Due to regulatory and other restrictions or limits in various countries or industry- or issuer-specific restrictions or limitations (e.g., poison pills) that restrict the amount of securities or other investments of an issuer that may be held on an aggregate basis by an adviser group, a fund may be limited or prevented from acquiring securities of an issuer that the fund’s adviser may otherwise prefer to purchase. For example, many countries limit the amount of outstanding shares that may be held in a local bank by an adviser group. In these circumstances, a fund may be limited or prevented from purchasing additional shares of a bank if the purchase would put the adviser group over the regulatory limit when the adviser group’s holdings are combined together or with the holdings of the funds’ affiliates, even if the purchases alone on behalf of a specific fund would not be in excess of such limit. Additionally, regulatory and other applicable limits are complex and vary significantly, including, among others, from country to country, industry to industry and issuer to issuer. However, given the complexity of these limits, a fund’s adviser may inadvertently breach these limits, and a fund may be required to sell securities of an issuer in order to be in compliance with such limits even if the fund’s adviser may otherwise prefer to continue to hold such securities. At certain times, the funds may be restricted in their investment activities because of relationships an affiliate of the fund’s, which may include Ameriprise Financial and its affiliates, may have with the issuers of securities.
52
The investment manager has portfolio management teams in its multiple geographic locations that may share research information regarding leveraged loans. The investment manager operates separate and independent trading desks in these locations for the purpose of purchasing and selling leveraged loans. As a result, the investment manager does not aggregate orders in leveraged loans across portfolio management teams. For example, funds and other client accounts being managed by these portfolio management teams may purchase and sell the same leveraged loan in the secondary market on the same day at different times and at different prices. There is also the potential for a particular account or group of accounts, including a fund, to forego an opportunity or to receive a different allocation (either larger or smaller) than might otherwise be obtained if the investment manager were to aggregate trades in leveraged loans across the portfolio management teams. Although the investment manager does not aggregate orders in leveraged loans across its portfolio management teams in the multiple geographic locations, it operates in this structure subject to its duty to seek best execution.
The following table shows total brokerage commissions paid in the last three fiscal periods. Substantially all firms through whom transactions were executed provide research services. The table is organized by fiscal year end. You can find your fund’s fiscal year end in Table 1.
Table 4. Total Brokerage Commissions
Total Brokerage Commissions
| | | | | | | | | | | |
Fund | | 2010 | | 2009 | | | 2008 | |
For funds with fiscal period ending January 31 | | | | | | | | | | | |
Columbia Income Builder Fund | | $ | 0 | | $ | 0 | | | $ | 0 | (a) |
Columbia Income Builder Fund II | | | 0 | | | 0 | | | | 0 | (a) |
Columbia Income Builder Fund III | | | 0 | | | 0 | | | | 0 | (a) |
Columbia Portfolio Builder Aggressive | | | 0 | | | 0 | | | | 0 | |
Columbia Portfolio Builder Conservative | | | 0 | | | 0 | | | | 0 | |
Columbia Portfolio Builder Moderate | | | 0 | | | 0 | | | | 0 | |
Columbia Portfolio Builder Moderate Aggressive | | | 0 | | | 0 | | | | 0 | |
Columbia Portfolio Builder Moderate Conservative | | | 0 | | | 0 | | | | 0 | |
Columbia Portfolio Builder Total Equity | | | 0 | | | 0 | | | | 0 | |
RiverSource S&P 500 Index | | | 97,970 | | | 16,486 | | | | 40,706 | |
RiverSource Small Company Index | | | 517,354 | | | 123,243 | | | | 108,360 | |
For funds with fiscal period ending March 31 | | | | | | | | | | | |
Columbia Equity Value | | | 357,285 | | | 525,309 | | | | 591,525 | |
RiverSource Precious Metals and Mining | | | 288,177 | | | 1,067,960 | | | | 960,159 | |
For funds with fiscal period ending April 30 | | | | | | | | | | | |
Columbia 120/20 Contrarian Equity | | | 26,985 | | | 38,789 | | | | 38,557 | (b) |
Columbia Recovery and Infrastructure | | | 527,728 | | | 128,097 | (c) | | | N/A | |
Columbia Retirement Plus 2010 | | | 0 | | | 0 | | | | 0 | |
Columbia Retirement Plus 2015 | | | 0 | | | 0 | | | | 0 | |
Columbia Retirement Plus 2020 | | | 0 | | | 0 | | | | 0 | |
Columbia Retirement Plus 2025 | | | 0 | | | 0 | | | | 0 | |
Columbia Retirement Plus 2030 | | | 0 | | | 0 | | | | 0 | |
Columbia Retirement Plus 2035 | | | 0 | | | 0 | | | | 0 | |
Columbia Retirement Plus 2040 | | | 0 | | | 0 | | | | 0 | |
Columbia Retirement Plus 2045 | | | 0 | | | 0 | | | | 0 | |
For funds with fiscal period ending May 31 | | | | | | | | | | | |
Columbia High Yield Bond | | | 0 | | | 0 | | | | 0 | |
Columbia Multi-Advisor Small Cap Value | | | 749,980 | | | 1,484,768 | | | | 1,179,158 | |
Columbia U.S. Government Mortgage | | | 9,489 | | | 14,329 | | | | 17,640 | |
RiverSource Partners Fundamental Value | | | 146,283 | | | 298,507 | | | | 292,900 | |
RiverSource Short Duration U.S. Government | | | 21,796 | | | 35,642 | | | | 43,210 | |
53
| | | | | | | | | |
For funds with fiscal period ending June 30 | | | | | | | | | |
Columbia Dividend Opportunity | | 402,958 | | | 673,569 | | | 412,022 | |
RiverSource Real Estate | | 164,335 | | | 205,118 | | | 173,705 | |
For funds with fiscal period ending July 31 | | | | | | | | | |
Columbia Floating Rate | | 0 | | | 12,760 | | | 861 | |
Columbia Income Opportunities | | 0 | | | 0 | | | 0 | |
Columbia Inflation Protected Securities | | 43,426 | | | 17,762 | | | 11,586 | |
Columbia Large Core Quantitative | | 2,806,058 | | | 2,084,675 | | | 1,951,255 | |
Columbia Limited Duration Credit | | 8,523 | | | 4,188 | | | 4,138 | |
Columbia Money Market | | 0 | | | 0 | | | 0 | |
RiverSource Disciplined Small and Mid Cap Equity | | 306,343 | | | 541,939 | | | 124,754 | |
RiverSource Disciplined Small Cap Value | | 139,213 | | | 178,570 | | | 75,041 | |
| | | |
| | | 2009 | | | 2008 | | | 2007 | |
For funds with fiscal period ending August 31 | | | | | | | | | |
Columbia Diversified Bond | | 95,997 | | | 111,876 | | | 91,815 | |
Columbia Minnesota Tax-Exempt | | 0 | | | 3,418 | | | 7,293 | |
RiverSource California Tax-Exempt | | 0 | | | 1,938 | | | 4,143 | |
RiverSource New York Tax-Exempt | | 0 | | | 724 | | | 1,524 | |
For funds with fiscal period ending September 30 | | | | | | | | | |
Columbia Large Growth Quantitative | | 649,261 | | | 150,374 | | | 45,978 | (d) |
Columbia Large Value Quantitative | | 378,324 | | | 6,631 | (e) | | N/A | |
Columbia Diversified Equity Income | | 4,728,940 | | | 4,085,552 | | | 3,790,954 | |
Columbia Mid Cap Value Opportunity | | 2,601,029 | | | 1,672,775 | | | 1,219,474 | |
Columbia Strategic Allocation | | 1,248,108 | | | 1,049,954 | | | 1,425,483 | |
RiverSource Balanced | | 688,814 | | | 493,156 | | | 567,773 | |
RiverSource Strategic Income Allocation | | 22,351 | | | 17,707 | | | 6,639 | (d) |
Seligman California Municipal High-Yield | | 0 | | | 0 | | | 0 | |
Seligman California Municipal Quality | | 0 | | | 0 | | | 0 | |
Seligman Minnesota Municipal | | 0 | | | 0 | | | 0 | |
Seligman National Municipal | | 0 | | | 0 | | | 0 | |
Seligman New York Municipal | | 0 | | | 0 | | | 0 | |
Seligman TargETFund 2015 | | 12,772 | | | 7,434 | | | 3,559 | |
Seligman TargETFund 2025 | | 1,327 | | | 7,302 | | | 2,743 | |
Seligman TargETFund 2035 | | 1,215 | | | 1,206 | | | 461 | |
Seligman TargETFund 2045 | | 1,173 | | | 948 | | | 308 | |
Seligman TargETFund Core | | 26,992 | | | 10,913 | | | 10,770 | |
For funds with fiscal period ending October 31 | | | | | | | | | |
Columbia Absolute Return Currency and Income | | 0 | | | 0 | | | 0 | |
Columbia Asia Pacific ex-Japan | | 41,731 | (f) | | N/A | | | N/A | |
Columbia Emerging Markets Bond | | 0 | | | 0 | | | 0 | |
Columbia Emerging Markets Opportunity | | 2,108,103 | | | 3,346,690 | | | 3,361,865 | |
Columbia European Equity | | 189,286 | | | 396,474 | | | 282,104 | |
Columbia Frontier | | 157,476 | | | 250,561 | | | 388,531 | |
Columbia Global Bond | | 7,292 | | | 18,925 | | | 17,268 | |
Columbia Global Equity | | 581,962 | | | 1,185,084 | | | 1,474,583 | |
Columbia Global Extended Alpha | | 11,397 | | | 6,647 | (g) | | N/A | |
Columbia Multi-Advisor International Value | | 959,077 | | | 1,558,333 | | | 1,426,926 | |
Columbia Seligman Global Technology | | 1,319,806 | | | 1,747,855 | | | 2,082,502 | |
RiverSource Disciplined International Equity | | 500,331 | | | 514,960 | | | 547,910 | |
RiverSource Partners International Select Growth | | 901,265 | | | 1,690,066 | | | 1,932,330 | |
RiverSource Partners International Small Cap | | 265,317 | | | 270,663 | | | 353,096 | |
Threadneedle Global Equity Income | | 18,370 | | | 5,030 | (g) | | N/A | |
Threadneedle International Opportunity | | 793,899 | | | 1,020,584 | | | 1,150,182 | |
For funds with fiscal period ending November 30 | | | | | | | | | |
Columbia AMT-Free Tax-Exempt Bond | | 315 | | | 6,431 | | | 19,450 | |
Columbia Mid Cap Growth Opportunity | | 2,752,727 | | | 2,165,273 | | | 2,813,784 | |
RiverSource Intermediate Tax-Exempt | | 42 | | | 684 | | | 2,175 | |
RiverSource Tax-Exempt High Income | | 1,080 | | | 24,531 | | | 74,062 | |
For funds with fiscal period ending December 31 | | | | | | | | | |
Columbia Government Money Market | | 0 | | | 0 | | | 0 | |
Columbia Seligman Communications and Information | | 12,482,079 | | | 11,241,475 | | | 17,228,966 | |
Columbia Select Large-Cap Value | | 206,322 | | | 236,168 | | | 167,912 | |
Columbia Select Smaller-Cap Value | | 123,904 | | | 240,154 | | | 217,466 | |
RiverSource LaSalle Global Real Estate | | 20,434 | | | 32,671 | | | 63,034 | |
RiverSource LaSalle Monthly Dividend Real Estate | | 40,941 | | | 82,218 | | | 227,752 | |
Seligman Capital | | 927,607 | | | 1,815,753 | | | 2,088,716 | |
Seligman Growth | | 2,228,705 | | | 1,627,919 | | | 1,428,056 | |
54
| (a) | The fund changed its fiscal year end effective Jan. 31, 2008 from May 31 to Jan. 31. For 2008, the information shown is for the period from June 1, 2007 through Jan. 31, 2008. For years prior to 2008, the fiscal period ended on May 31. |
| (b) | For the period from Oct. 18, 2007 (when shares became publicly available) to April 30, 2008. |
| (c) | For the period from Feb. 19, 2009 (when shares become publicly available) to April 30, 2009. |
| (d) | For the period from May 17, 2007 (when shares became publicly available) to Sept. 30, 2007. |
| (e) | For the period from Aug. 1, 2008 (when shares became publicly available) to Sept. 30, 2008. |
| (f) | For the period from July 15, 2009 (when shares became publicly available) to Oct. 31, 2009. |
| (g) | For the period from Aug. 1, 2008 (when shares became publicly available) to Oct. 31, 2008. |
For the last fiscal period, transactions were specifically directed to firms in exchange for research services as shown in the following table. The table also shows portfolio turnover rates for the last two fiscal periods. Higher turnover rates may result in higher brokerage expenses and taxes. The table is organized by fiscal year end. You can find your fund’s fiscal year end in Table 1.
Table 5. Brokerage Directed for Research and Turnover Rates
| | | | | | | | | | | | | | |
| | | Brokerage directed for research* | | | | | | | |
Fund | | Amount of | | | Amount of
commissions | | | Turnover rates | |
| | transactions | | | imputed or paid | | | 2010 | | | 2009 | |
For funds with fiscal period ending January 31 | | | | | | | | | | | | | | |
Columbia Income Builder Fund | | $ | 0 | (a) | | $ | 0 | (a) | | 41 | % | | 39 | % |
Columbia Income Builder Fund II | | | 0 | (a) | | | 0 | (a) | | 39 | | | 40 | |
Columbia Income Builder Fund III | | | 0 | (a) | | | 0 | (a) | | 46 | | | 36 | |
Columbia Portfolio Builder Aggressive | | | 0 | (a) | | | 0 | (a) | | 28 | | | 35 | |
Columbia Portfolio Builder Conservative | | | 0 | (a) | | | 0 | (a) | | 26 | | | 27 | |
Columbia Portfolio Builder Moderate | | | 0 | (a) | | | 0 | (a) | | 26 | | | 34 | |
Columbia Portfolio Builder Moderate Aggressive | | | 0 | (a) | | | 0 | (a) | | 28 | | | 33 | |
Columbia Portfolio Builder Moderate Conservative | | | 0 | (a) | | | 0 | (a) | | 30 | | | 29 | |
Columbia Portfolio Builder Total Equity | | | 0 | (a) | | | 0 | (a) | | 25 | | | 28 | |
RiverSource S&P 500 Index | | | 0 | | | | 0 | | | 41 | | | 5 | |
RiverSource Small Company Index | | | 0 | | | | 0 | | | 41 | | | 23 | |
For funds with fiscal period ending March 31 | | | | | | | | | | | | | | |
Columbia Equity Value | | | 95,868,655 | | | | 111,080 | | | 30 | | | 21 | |
RiverSource Precious Metals and Mining | | | 42,266,048 | | | | 35,270 | | | 72 | | | 340 | (b) |
For funds with fiscal period ending April 30 | | | | | | | | | | | | | | |
Columbia 120/20 Contrarian Equity | | | 10,891,991 | | | | 10,904 | | | 31 | | | 36 | |
Columbia Recovery and Infrastructure | | | 243,972,941 | | | | 295,680 | | | 11 | | | 4 | (c) |
Columbia Retirement Plus 2010 | | | 0 | (a) | | | 0 | (a) | | 53 | | | 55 | |
Columbia Retirement Plus 2015 | | | 0 | (a) | | | 0 | (a) | | 126 | | | 53 | |
Columbia Retirement Plus 2020 | | | 0 | (a) | | | 0 | (a) | | 53 | | | 52 | |
Columbia Retirement Plus 2025 | | | 0 | (a) | | | 0 | (a) | | 52 | | | 47 | |
Columbia Retirement Plus 2030 | | | 0 | (a) | | | 0 | (a) | | 57 | | | 47 | |
Columbia Retirement Plus 2035 | | | 0 | (a) | | | 0 | (a) | | 54 | | | 48 | |
Columbia Retirement Plus 2040 | | | 0 | (a) | | | 0 | (a) | | 55 | | | 50 | |
Columbia Retirement Plus 2045 | | | 0 | (a) | | | 0 | (a) | | 64 | | | 51 | |
For funds with fiscal period ending May 31 | | | | | | | | | | | | | | |
Columbia High Yield Bond | | | 0 | | | | 0 | | | 94 | | | 83 | |
Columbia Multi-Advisor Small Cap Value | | | 25,296,772 | | | | 30,410 | | | 80 | | | 120 | |
Columbia U.S. Government Mortgage | | | 0 | | | | 0 | | | 519 | (d) | | 431 | (d) |
RiverSource Partners Fundamental Value | | | 0 | | | | 0 | | | 9 | | | 19 | |
RiverSource Short Duration U.S. Government | | | 0 | | | | 0 | | | 329 | (d) | | 217 | (d) |
55
| | | | | | | | | | | | |
For funds with fiscal period ending June 30 | | | | | | | | | | | | |
Columbia Dividend Opportunity | | 66,349,011 | | | 55,087 | | | 23 | | | 21 | |
RiverSource Real Estate | | 6,919,253 | | | 9,212 | | | 93 | | | 51 | |
For funds with fiscal period ending July 31 | | | | | | | | | | | | |
Columbia Floating Rate | | 0 | | | 0 | | | 68 | % | | 84 | % |
Columbia Income Opportunities | | 0 | | | 0 | | | 86 | | | 81 | |
Columbia Inflation Protected Securities | | 0 | | | 0 | | | 177 | (f) | | 160 | (f) |
Columbia Large Core Quantitative | | 302,209,602 | | | 175,221 | | | 75 | | | 61 | |
Columbia Limited Duration Credit | | 0 | | | 0 | | | 101 | | | 335 | (d),(g) |
Columbia Money Market | | 0 | | | 0 | | | N/A | | | N/A | |
RiverSource Disciplined Small and Mid Cap Equity | | 21,380,485 | | | 24,466 | | | 107 | | | 104 | |
RiverSource Disciplined Small Cap Value | | 6,706,217 | | | 7,860 | | | 114 | | | 98 | |
| | | | |
| | | | | | | | | 2009 | | | 2008 | |
For funds with fiscal period ending August 31 | | | | | | | | | | | | |
Columbia Diversified Bond | | 0 | | | 0 | | | 371 | (d) | | 226 | (d) |
Columbia Minnesota Tax-Exempt | | 0 | | | 0 | | | 33 | | | 23 | |
RiverSource California Tax-Exempt | | 0 | | | 0 | | | 49 | | | 49 | |
RiverSource New York Tax-Exempt | | 0 | | | 0 | | | 34 | | | 31 | |
For funds with fiscal period ending September 30 | | | | | | | | | | | | |
Columbia Disciplined Large Growth Quantitative | | 115,848,221 | | | 85,590 | | | 58 | | | 70 | |
Columbia Disciplined Large Value Quantitative | | 38,146,821 | | | 31,490 | | | 63 | | | 6 | (h) |
Columbia Diversified Equity Income | | 1,100,570,862 | | | 1,494,280 | | | 38 | | | 31 | |
Columbia Mid Cap Value Opportunity | | 85,198,971 | | | 545,756 | | | 42 | | | 34 | |
Columbia Strategic Allocation | | 92,052,055 | | | 81,422 | | | 136 | (d) | | 123 | (d) |
RiverSource Balanced | | 134,013,627 | | | 160,642 | | | 189 | (d) | | 105 | (d) |
RiverSource Strategic Income Allocation | | 0 | | | 0 | | | 143 | | | 137 | |
Seligman California Municipal High-Yield | | 0 | | | 0 | | | 63 | (i) | | 4 | |
Seligman California Municipal Quality | | 0 | | | 0 | | | 46 | (i) | | 13 | |
Seligman Minnesota Municipal | | 0 | | | 0 | | | 29 | (i) | | 16 | |
Seligman National Municipal | | 0 | | | 0 | | | 107 | (i) | | 16 | |
Seligman New York Municipal | | 0 | | | 0 | | | 53 | (i) | | 0 | |
Seligman TargETFund 2015 | | 0 | | | 0 | | | 58 | | | 70 | |
Seligman TargETFund 2025 | | 0 | | | 0 | | | 13 | | | 61 | |
Seligman TargETFund 2035 | | 0 | | | 0 | | | 16 | | | 38 | |
Seligman TargETFund 2045 | | 0 | | | 0 | | | 36 | | | 48 | |
Seligman TargETFund Core | | 0 | | | 0 | | | 45 | | | 46 | |
For funds with fiscal period ending October 31 | | | | | | | | | | | | |
Columbia Absolute Return Currency and Income | | 0 | | | 0 | | | 16 | | | 39 | |
Columbia Asia Pacific ex-Japan | | 8,232,647 | (j) | | 23,202 | (j) | | 4 | (j) | | N/A | |
Columbia Emerging Markets Bond | | 0 | | | 0 | | | 62 | | | 82 | |
Columbia Emerging Markets Opportunity | | 794,301,729 | | | 1,895,074 | | | 149 | | | 133 | |
Columbia European Equity | | 113,984,459 | | | 144,742 | | | 154 | | | 180 | |
Columbia Frontier | | 142,448,732 | | | 47,004 | | | 162 | | | 156 | |
Columbia Global Bond | | 0 | | | 0 | | | 69 | | | 75 | |
Columbia Global Equity | | 300,110,709 | | | 477,223 | | | 81 | | | 97 | |
Columbia Global Extended Alpha | | 4,801,721 | | | 7,937 | | | 133 | | | 36 | (k) |
Columbia Multi-Advisor International Value | | 33,502,807 | | | 17,102 | | | 63 | % | | 40 | % |
Columbia Seligman Global Technology | | 2,739,223,355 | | | 460,483 | | | 150 | | | 171 | |
RiverSource Disciplined International Equity | | 8,041,109 | | | 2,162 | | | 85 | | | 61 | |
RiverSource Partners International Select Growth | | 83,531,533 | | | 99,348 | | | 90 | | | 85 | |
RiverSource Partners International Small Cap | | 95,857 | | | 63 | | | 174 | | | 87 | |
Threadneedle Global Equity Income | | 6,599,033 | | | 11,416 | | | 45 | | | 10 | (k) |
Threadneedle International Opportunity | | 536,939,110 | | | 737,307 | | | 97 | | | 78 | |
56
| | | | | | | | |
For funds with fiscal period ending November 30 | | | | | | | | |
Columbia Mid Cap Growth Opportunity | | 454,152,183 | | 799,318 | | 126 | | 76 |
RiverSource AMT-Free Tax-Exempt Bond | | 0 | | 0 | | 29 | | 37 |
RiverSource Intermediate Tax-Exempt | | 0 | | 0 | | 26 | | 36 |
RiverSource Tax-Exempt High Income | | 0 | | 0 | | 30 | | 37 |
For funds with fiscal period ending December 31 | | | | | | | | |
Columbia Government Money Market | | N/A | | N/A | | N/A | | N/A |
Columbia Select Large-Cap Value | | 69,507,890 | | 68,240 | | 24 | | 28 |
Columbia Select Smaller-Cap Value | | 1,444,931 | | 5,200 | | 7 | | 16 |
Columbia Seligman Communications and Information | | 1,115,825,859 | | 2,102,493 | | 150 | | 133 |
RiverSource LaSalle Global Real Estate | | 0 | | 0 | | 83 | | 62 |
RiverSource LaSalle Monthly Dividend Real Estate | | 0 | | 0 | | 87 | | 77 |
Seligman Capital | | 20,147,615 | | 37,667 | | 139 | | 229 |
Seligman Growth | | 843,145,024 | | 1,192,083 | | 142 | | 241 |
| * | Reported numbers include third party soft dollar commissions and portfolio manager directed commissions directed for research. Columbia Management also receives proprietary research from brokers, but these amounts have not been included in the table. |
| (a) | The underlying funds may have directed transactions to firms in exchange for research services. |
| (b) | Higher turnover rates may result in higher brokerage expenses and taxes. The higher turnover rate can be primarily attributed to repositioning the fund to a smaller number of holdings as it worked through risk management and secondarily, market volatility made up the balance of the turnover rate. |
| (c) | For the period from Feb. 19, 2009 (when shares became publicly available) to April 30, 2009. |
| (d) | Includes mortgage dollar rolls. If mortgage dollar roll transactions were excluded, the portfolio turnover would have been: 184% and 122% for Columbia Diversified Bond for the fiscal periods ended Aug. 31, 2009 and 2008, respectively; 220% and 124% for Columbia Limited Duration Credit Fund for the fiscal periods ended July 31, 2009 and 2008, respectively; 110% and 86% for RiverSource Balanced Fund and 116% and 89% for Columbia Strategic Allocation Fund for the fiscal periods ended Sept. 30, 2009 and 2008, respectively; 286% and 199% for RiverSource Short Duration U.S. Government Fund and 246% and 162% for Columbia U.S. Government Mortgage Fund for the fiscal periods ended May 31, 2010 and 2009, respectively. |
| (e) | A significant portion of the turnover was the result of “roll” transactions in liquid derivatives and Treasury securities. In the derivative transactions, positions in expiring contracts are liquidated and simultaneously replaced with positions in new contracts with equivalent characteristics. In the Treasury transactions, existing holdings are sold to purchase newly issued securities with slightly longer maturity dates. Although these transactions affect the turnover rate of the portfolio, they do not change the risk exposure or result in material transaction costs. The remaining turnover resulted from strategic reallocations and relative value trading. After transaction costs, this activity is expected to enhance the returns on the fund. |
| (f) | The fund’s turnover rate has historically been low. The increase in turnover rate is primarily a result of repositioning holdings after management changes in the first quarter of 2009 and following a more active management style. |
| (g) | The turnover was a result of a combination of a change in the investment strategy and the growth of the fund. The fund experienced high net inflows in the second quarter of 2009, increasing the NAV. |
| (h) | For the period from Aug. 1, 2008 (when shares became publicly available) to Sept. 30, 2008. |
| (i) | The fund’s turnover rate has historically been low. The increase in turnover rate is primarily a result of repositioning holdings after management changes in the second quarter of 2009, and additionally for Seligman National Municipal, mergers of 14 state-specific Seligman Municipal Funds during the period into the Fund. |
| (j) | For the period from July 15, 2009 (when the Fund became publicly available) to Oct. 31, 2009. |
| (k) | For the period from Aug. 1, 2008 (when the Fund became available) to Oct. 31, 2008. |
As of the end of the most recent fiscal period, the fund held securities of its regular brokers or dealers or of the parent of those brokers or dealers that derived more than 15% of gross revenue from securities-related activities as presented below. The table is organized by fiscal year end. You can find your fund’s fiscal year end in Table 1.
57
Table 6. Securities of Regular Brokers or Dealers
| | | | | |
Fund | | Issuer | | Value of securities owned at
end of fiscal period |
For funds with fiscal period ending January 31 | | | | | |
Columbia Income Builder Fund | | None | | | N/A |
Columbia Income Builder Fund II | | None | | | N/A |
Columbia Income Builder Fund III | | None | | | N/A |
Columbia Portfolio Builder Aggressive | | None | | | N/A |
Columbia Portfolio Builder Conservative | | None | | | N/A |
Columbia Portfolio Builder Moderate | | None | | | N/A |
Columbia Portfolio Builder Moderate Aggressive | | None | | | N/A |
Columbia Portfolio Builder Moderate Conservative | | None | | | N/A |
Columbia Portfolio Builder Total Equity | | None | | | N/A |
RiverSource S&P 500 Index | | Ameriprise Financial | | $ | 147,339 |
| | Charles Schwab | | | 199,837 |
| | Citigroup | | | 825,442 |
| | E*Trade Financial | | | 48,192 |
| | Franklin Resources | | | 216,282 |
| | Goldman Sachs Group | | | 983,038 |
| | JPMorgan Chase & Co. | | | 1,947,078 |
| | Legg Mason | | | 41,068 |
| | Morgan Stanley | | | 489,323 |
| | PNC Financial Services Group | | | 347,103 |
RiverSource Small Company Index | | Investment Technology Group | | | 932,730 |
| | LaBranche & Co. | | | 159,627 |
| | optionsXpress | | | 645,578 |
| | Piper Jaffray Companies | | | 677,351 |
| | Stifel Financial | | | 1,463,301 |
For funds with fiscal period ending March 31 | | | | | |
Columbia Equity Value | | Goldman Sachs Group | | | 11,067,062 |
| | JPMorgan Chase & Co. | | | 13,784,298 |
| | Morgan Stanley | | | 7,911,083 |
RiverSource Precious Metals and Mining | | None | | | N/A |
For funds with fiscal period ending April 30 | | | | | |
Columbia 120/20 Contrarian Equity | | None | | | N/A |
Columbia Recovery and Infrastructure | | None | | | N/A |
Columbia Retirement Plus 2010 | | None | | | N/A |
Columbia Retirement Plus 2015 | | None | | | N/A |
Columbia Retirement Plus 2020 | | None | | | N/A |
Columbia Retirement Plus 2025 | | None | | | N/A |
Columbia Retirement Plus 2030 | | None | | | N/A |
Columbia Retirement Plus 2035 | | None | | | N/A |
Columbia Retirement Plus 2040 | | None | | | N/A |
Columbia Retirement Plus 2045 | | None | | | N/A |
For funds with fiscal period ending May 31 | | | | | |
Columbia High Yield Bond | | Lehman Brothers Holdings* | | | 1,322,250 |
Columbia Multi-Advisor Small Cap Value | | Raymond James Financial | | | 1,696,199 |
Columbia U.S. Government Mortgage | | Bear Stearns Asset Backed Securities Trust | | | 339,729 |
| | Bear Stearns Commercial Mtge Securities | | | 3,164,927 |
| | ChaseFlex Trust | | | 398,308 |
| | Citigroup Mortgage Loan Trust, Inc. | | | 1,106,996 |
| | Credit Suisse Mortgage Capital Ctfs | | | 7,823,287 |
| | GS Mortgage Securities Corp. | | | 6,427,923 |
| | Jefferies & Co. | | | 2,284,896 |
| | JPMorgan Chase Commercial Mtge Securities | | | 990,893 |
| | JPMorgan Mtge Trust | | | 667,343 |
| | JPMorgan Reremic | | | 534,987 |
58
| | | | |
RiverSource Partners Fundamental Value | | Goldman Sachs Group, Inc. | | 3,039,588 |
| | JPMorgan Chase & Co. | | 2,342,740 |
RiverSource Short Duration U.S. Government | | Bear Stearns Asset Backed Securities Trust | | 782,912 |
| | Bear Stearns Commercial Mtge Securities | | 1,607,987 |
| | Citigroup Funding | | 18,414,224 |
| | Citigroup Mortgage Loan Trust, Inc. | | 3,441,463 |
| | Credit Suisse Mortgage Capital Ctfs | | 7,919,291 |
| | CS First Boston Mtge Securities | | 968,402 |
| | Goldman Sachs Group | | 7,829,724 |
| | Jefferies & Co. | | 1,062,793 |
| | JPMorgan Chase Commercial Mtge Securities | | 3,998,961 |
| | JPMorgan Chase & Co. | | 2,966,688 |
| | JPMorgan Mtge Trust | | 2,196,977 |
| | Morgan Stanley | | 8,350,389 |
| | Morgan Stanley Capital 1 | | 4,934,943 |
For funds with fiscal period ending June 30 | | | | |
Columbia Dividend Opportunity | | Goldman Sachs Group | | 8,911,501 |
| | JPMorgan Chase & Co. | | 5,407,407 |
| | Morgan Stanley | | 10,581,853 |
RiverSource Real Estate | | None | | N/A |
For funds with fiscal period ending July 31 | | | | |
Columbia Floating Rate | | Nuveen Investments | | 887,000 |
Columbia Income Opportunities | | E*TRADE Financial | | 4,180,938 |
Columbia Inflation Protected Securities | | Jefferies & Co. | | 925,026 |
| | LB-UBS Commercial Mortgage Trust | | 2,711,440 |
Columbia Large Core Quantitative | | Citigroup | | 89,448,117 |
| | Franklin Resources | | 10,199,918 |
| | Goldman Sachs Group | | 18,407,431 |
| | PNC Financial Services Group | | 55,870,310 |
Columbia Limited Duration Credit | | Citigroup | | 4,988,135 |
| | Goldman Sachs Group | | 5,629,686 |
| | JPMorgan Chase & Co. | | 4,363,771 |
| | Lehman Brothers Holdings* | | 95,700 |
| | Merrill Lynch & Co. | | 856,523 |
| | Morgan Stanley | | 5,284,355 |
Columbia Money Market | | Citigroup Funding | | 100,983,942 |
| | JPMorgan Chase & Co. | | 87,793,771 |
RiverSource Disciplined Small and Mid Cap Equity | | Investment Technology Group | | 93,176 |
| | Jefferies Group, Inc. | | 76,613 |
| | Knight Capital Group Cl A | | 342,359 |
| | optionsXpress Holdings | | 113,864 |
| | Raymond James Financial | | 1,524,868 |
RiverSource Disciplined Small Cap Value | | Knight Capital Group Cl A | | 251,175 |
| | Westwood Holdings Group | | 104,596 |
For funds with fiscal period ending August 31 | | | | |
Columbia Diversified Bond | | Bear Stearns Adjustable Rate Mortgage Trust | | 5,130,924 |
| | Bear Stearns Alternative Trust | | 14,970 |
| | Bear Stearns Commercial Mortgage Securities | | 3,546,017 |
| | ChaseFlex Trust | | 1,409,767 |
| | Citigroup | | 25,350,618 |
| | Citigroup Commercial Mortgage Trust | | 2,837,338 |
| | Citigroup/Deutsche Bank Commercial Mortgage Trust | | 9,615,239 |
| | Citigroup Funding | | 11,998,570 |
| | CS First Boston Mortgage Securities | | 12,910,140 |
| | Goldman Sachs Group | | 14,411,592 |
| | GS Mortgage Securities II | | 20,476,757 |
| | Jefferies & Co. | | 15,527,394 |
| | JPMorgan Chase Commercial Mortgage Securities | | 53,453,994 |
| | JPMorgan Chase & Co. | | 14,640,885 |
| | LB-UBS Commercial Mortgage Trust | | 16,071,271 |
| | Lehman Brothers Holdings* | | 1,862,306 |
| | Merrill Lynch Mortgage Trust | | 2,665,078 |
| | Morgan Stanley | | 13,240,853 |
| | Morgan Stanley Capital I | | 10,028,848 |
59
| | | | |
Columbia Minnesota Tax-Exempt | | None | | N/A |
RiverSource California Tax-Exempt | | None | | N/A |
RiverSource New York Tax-Exempt | | None | | N/A |
For funds with fiscal period ending September 30 | | | | |
Columbia Diversified Equity Income | | Goldman Sachs Group | | 178,337,738 |
| | JPMorgan Chase & Co. | | 85,834,923 |
| | Morgan Stanley | | 52,518,110 |
Columbia Large Growth Quantitative | | Franklin Resources | | 1,934,035 |
| | Goldman Sachs Group | | 20,863,258 |
| | Morgan Stanley | | 9,177,567 |
Columbia Large Value Quantitative | | Citigroup | | 6,796,957 |
| | Goldman Sachs Group | | 6,574,659 |
| | JPMorgan Chase & Co. | | 1,293,917 |
| | Morgan Stanley | | 6,536,678 |
| | PNC Financial Services Group | | 1,943,649 |
Columbia Mid Cap Value Opportunity | | Goldman Sachs & Co. | | 47,226,353 |
Columbia Strategic Allocation | | Bear Stearns Commercial Mortgage Securities | | 699,898 |
| | Citigroup | | 6,504,737 |
| | Citigroup Commercial Mortgage Trust | | 316,302 |
| | Citigroup/Deutsche Bank Commercial Mortgage Trust | | 183,715 |
| | Credit Suisse Group | | 457,330 |
| | CS First Boston Mortgage Securities | | 155,406 |
| | Goldman Sachs Group | | 9,642,282 |
| | GS Mortgage Securities II | | 788,719 |
| | JPMorgan Chase & Co. | | 10,872,093 |
| | JPMorgan Chase Commercial Mortgage Securities | | 2,234,879 |
| | Knight Capital Group Cl A | | 96,200 |
| | LB-UBS Commercial Mortgage Trust | | 559,502 |
| | Morgan Stanley | | 9,436,155 |
| | Morgan Stanley Capital 1 | | 709,666 |
| | optionsXpress Holdings | | 82,339 |
| | PNC Financial Services Group | | 6,225,544 |
RiverSource Balanced | | Bear Stearns Adjustable Rate Mortgage Trust | | 713,060 |
| | Bear Stearns Commercial Mortgage Securities | | 899,869 |
| | ChaseFlex Trust | | 849,320 |
| | Citigroup | | 1,082,219 |
| | Citigroup Commercial Mortgage Trust | | 316,302 |
| | Citigroup/Deutsche Bank Commercial Mortgage Trust | | 393,676 |
| | Goldman Sachs Group | | 18,865,931 |
| | GS Mortgage Securities II | | 1,030,324 |
| | JPMorgan Chase & Co. | | 8,998,091 |
| | JPMorgan Chase Commercial Mortgage Securities | | 2,697,566 |
| | LB-UBS Commercial Mortgage Trust | | 1,354,451 |
| | Lehman Brothers Holdings* | | 236,004 |
| | Merrill Lynch Mortgage Trust | | 188,000 |
| | Morgan Stanley | | 3,258,404 |
| | Morgan Stanley Capital 1 | | 1,291,191 |
RiverSource Strategic Income Allocation | | Ameritrade Holding Corp. — subsidiary | | 624,828 |
| | Bear Stearns Commercial Mortgage Securities | | 868,876 |
| | Citigroup | | 118,157 |
| | Citigroup/Deutsche Bank Commercial Mortgage Trust | | 985,508 |
| | CS First Boston Mortgage Securities | | 1,069,849 |
| | Goldman Sachs Group | | 171,602 |
| | JPMorgan Chase & Co. | | 268,331 |
| | JPMorgan Chase Commercial Mortgage Securities | | 889,173 |
| | Lehman Brothers Holdings* | | 15,975 |
| | Merrill Lynch Mortgage Trust | | 178,336 |
| | Morgan Stanley | | 801,038 |
| | Morgan Stanley Capital 1 | | 69,125 |
| | Nuveen Investments | | 97,091 |
Seligman California Municipal High-Yield | | None | | N/A |
Seligman California Municipal Quality | | None | | N/A |
Seligman Minnesota Municipal | | None | | N/A |
Seligman National Municipal | | None | | N/A |
60
| | | | |
Seligman New York Municipal | | None | | N/A |
Seligman TargETFund 2015 | | None | | N/A |
Seligman TargETFund 2025 | | None | | N/A |
Seligman TargETFund 2035 | | None | | N/A |
Seligman TargETFund 2045 | | None | | N/A |
Seligman TargETFund Core | | None | | N/A |
For funds with fiscal period ending October 31 | | | | |
Columbia Absolute Return Currency and Income | | GS Mortgage Securities II | | 2,719,948 |
| | Lehman Brothers Holdings* | | 100,800 |
| | Morgan Stanley, Dean Witter Capital 1 | | 428,016 |
Columbia Asia Pacific ex-Japan | | None | | N/A |
Columbia Emerging Markets Bond | | Morgan Stanley | | 2,351,866 |
Columbia Emerging Markets Opportunity | | None | | N/A |
Columbia European Equity | | Credit Suisse Group | | 2,058,583 |
Columbia Frontier | | Affiliated Managers Group | | 380,940 |
| | Piper Jaffray Companies | | 171,643 |
| | Stifel Financial | | 244,212 |
Columbia Global Bond | | Bear Stearns Commercial Mortgage Securities | | 237,337 |
| | Citigroup | | 1,003,392 |
| | Citigroup Commercial Mortgage Trust | | 1,581,548 |
| | CS First Boston Mortgage Securities | | 595,440 |
| | Goldman Sachs Group | | 1,188,323 |
| | GS Mortgage Securities II | | 1,102,326 |
| | JPMorgan Chase Commercial Mortgage Securities | | 1,702,095 |
| | JPMorgan Chase & Co. | | 770,873 |
| | LB-UBS Commercial Mortgage Trust | | 1,501,910 |
| | Lehman Brothers Holdings* | | 212,850 |
| | Merrill Lynch & Co. | | 366,682 |
| | Morgan Stanley | | 11,964,651 |
| | Morgan Stanley Capital 1 | | 1,334,954 |
Columbia Global Equity | | Citigroup Commercial Mortgage Trust | | 6,721,641 |
| | Credit Suisse Mortgage Capital Ctfs | | 2,352,116 |
| | Goldman Sachs Group | | 5,039,414 |
| | JPMorgan Chase & Co. | | 9,925,220 |
Columbia Global Extended Alpha | | Citigroup | | 64,732 |
| | Goldman Sachs Group | | 119,119 |
Columbia Multi-Advisor International Value | | Citigroup Funding | | 6,997,755 |
| | Morgan Stanley | | 20,000,000 |
Columbia Seligman Global Technology | | None | | N/A |
RiverSource Disciplined International Equity | | Credit Suisse Mortgage Capital Ctfs | | 3,138,369 |
RiverSource Partners International Select Growth | | Credit Suisse Group | | 4,008,753 |
RiverSource Partners International Small Cap | | None | | N/A |
Threadneedle Global Equity Income | | None | | N/A |
Threadneedle International Opportunity | | Credit Suisse Group | | 7,751,291 |
For funds with fiscal period ending November 30 | | | | |
Columbia AMT-Free Tax-Exempt Bond | | None | | N/A |
Columbia Mid Cap Growth Opportunity | | E*TRADE Financial | | 3,797,720 |
| | Legg Mason | | 2,696,490 |
RiverSource Intermediate Tax-Exempt | | None | | N/A |
RiverSource Tax-Exempt High Income | | None | | N/A |
For funds with fiscal period ending December 31 | | | | |
Columbia Government Money Market | | None | | N/A |
Columbia Seligman Communications and Information | | None | | N/A |
Columbia Select Large-Cap Value | | JPMorgan Chase & Co. | | 8,334,000 |
| | Morgan Stanley | | 7,340,800 |
Columbia Select Smaller-Cap Value | | None | | N/A |
RiverSource LaSalle Global Real Estate | | None | | N/A |
RiverSource LaSalle Monthly Dividend Real Estate | | None | | N/A |
Seligman Capital | | None | | N/A |
Seligman Growth | | Goldman Sachs Group | | 9,455,040 |
| * | Subsequent to Aug. 31, 2008. Lehman Brothers Holdings filed a Chapter 11 bankruptcy petition. |
61
Brokerage Commissions Paid to Brokers Affiliated with the Investment Manager
Affiliates of the investment manager may engage in brokerage and other securities transactions on behalf of a fund according to procedures adopted by the Board and to the extent consistent with applicable provisions of the federal securities laws. Subject to approval by the Board, the same conditions apply to transactions with broker-dealer affiliates of any subadviser. The investment manager will use an affiliate only if (i) the investment manager determines that the fund will receive prices and executions at least as favorable as those offered by qualified independent brokers performing similar brokerage and other services for the fund and (ii) the affiliate charges the fund commission rates consistent with those the affiliate charges comparable unaffiliated customers in similar transactions and if such use is consistent with terms of the Investment Management Services Agreement.
Information about any brokerage commissions paid by a fund in the last three fiscal periods to brokers affiliated with the fund’s investment manager is contained in the following table. The table is organized by fiscal year end. You can find your fund’s fiscal year end in Table 1.
Table 7. Brokerage Commissions Paid to Investment Manager or Affiliates
| | | | | | | | | | | | | | | | | | |
| | | Broker | | Nature of
affiliation | | Aggregate
dollar
amount of
commissions
paid to
broker | | Percent of
aggregate
brokerage
commissions | | Percent of
aggregate
dollar
amount of
transactions
involving
payment of
commissions | | Aggregate
dollar
amount of
commissions
paid to
broker | | | Aggregate
dollar
amount of
commissions
paid to
broker | |
Fund | | 2010 | | 2009 | | | 2008 | |
For funds with fiscal period ending January 31 | | | | | | | | | | | | | | | | | | |
Columbia Income Builder Fund | | None | | — | | — | | — | | — | | $ | 0 | | | $ | 0 | (a) |
Columbia Income Builder Fund II | | None | | — | | — | | — | | — | | | 0 | | | | 0 | (a) |
Columbia Income Builder Fund III | | None | | — | | — | | — | | — | | | 0 | | | | 0 | (a) |
Columbia Portfolio Builder Aggressive | | None | | — | | — | | — | | — | | | 0 | | | | 0 | |
Columbia Portfolio Builder Conservative | | None | | — | | — | | — | | — | | | 0 | | | | 0 | |
Columbia Portfolio Builder Moderate | | None | | — | | — | | — | | — | | | 0 | | | | 0 | |
Columbia Portfolio Builder Moderate Aggressive | | None | | — | | — | | — | | — | | | 0 | | | | 0 | |
Columbia Portfolio Builder Moderate Conservative | | None | | — | | — | | — | | — | | | 0 | | | | 0 | |
Columbia Portfolio Builder Total Equity | | None | | — | | — | | — | | — | | | 0 | | | | 0 | |
RiverSource S&P 500 Index | | None | | — | | — | | — | | — | | | 0 | | | | 0 | |
RiverSource Small Company Index | | None | | — | | — | | — | | — | | | 0 | | | | 0 | |
For funds with fiscal period ending March 31 | | | | | | | | | | | | | | | | | | |
Columbia Equity Value | | None | | — | | — | | — | | — | | | 0 | | | | 0 | |
RiverSource Precious Metals and Mining | | None | | — | | — | | — | | — | | | 0 | | | | 0 | |
For funds with fiscal period ending April 30 | | | | | | | | | | | | | | | | | | |
Columbia 120/20 Contrarian Equity | | None | | — | | — | | — | | — | | | 0 | | | | 0 | (b) |
Columbia Recovery and Infrastructure | | None | | — | | — | | — | | — | | | 0 | (c) | | | N/A | |
Columbia Retirement Plus 2010 | | None | | — | | — | | — | | — | | | 0 | | | | 0 | |
Columbia Retirement Plus 2015 | | None | | — | | — | | — | | — | | | 0 | | | | 0 | |
Columbia Retirement Plus 2020 | | None | | — | | — | | — | | — | | | 0 | | | | 0 | |
Columbia Retirement Plus 2025 | | None | | — | | — | | — | | — | | | 0 | | | | 0 | |
Columbia Retirement Plus 2030 | | None | | — | | — | | — | | — | | | 0 | | | | 0 | |
Columbia Retirement Plus 2035 | | None | | — | | — | | — | | — | | | 0 | | | | 0 | |
Columbia Retirement Plus 2040 | | None | | — | | — | | — | | — | | | 0 | | | | 0 | |
Columbia Retirement Plus 2045 | | None | | — | | — | | — | | — | | | 0 | | | | 0 | |
For funds with fiscal period ending May 31 | | | | | | | | | | | | | | | | | | |
Columbia High Yield Bond | | None | | — | | — | | — | | — | | | 0 | | | | 0 | |
Columbia Multi-Advisor Small Cap Value | | None | | — | | — | | — | | — | | | 0 | | | | 0 | |
Columbia U.S. Government Mortgage | | None | | — | | — | | — | | — | | | 0 | | | | 0 | |
RiverSource Partners Fundamental Value | | None | | — | | — | | — | | — | | | 0 | | | | 0 | |
RiverSource Short Duration U.S. Government | | None | | — | | — | | — | | — | | | 0 | | | | 0 | |
For funds with fiscal period ending June 30 | | | | | | | | | | | | | | | | | | |
Columbia Dividend Opportunity | | None | | — | | — | | — | | — | | | 0 | | | | 0 | |
RiverSource Real Estate | | None | | — | | — | | — | | — | | | 0 | | | | 0 | |
For funds with fiscal period ending July 31 | | | | | | | | | | | | | | | | | | |
Columbia Floating Rate | | None | | — | | — | | — | | — | | | 0 | | | | 0 | |
Columbia Income Opportunities | | None | | — | | — | | — | | — | | | 0 | | | | 0 | |
Columbia Inflation Protected Securities | | None | | — | | — | | — | | — | | | 0 | | | | 0 | |
Columbia Large Core Quantitative | | None | | | | | | | | | | | 0 | | | | 0 | |
Columbia Limited Duration Credit | | None | | — | | — | | — | | — | | | 0 | | | | 0 | |
Columbia Money Market | | None | | — | | — | | — | | — | | | 0 | | | | 0 | |
RiverSource Disciplined Small and Mid Cap Equity | | None | | — | | — | | — | | — | | | 0 | | | | 0 | |
RiverSource Disciplined Small Cap Value | | None | | — | | — | | — | | — | | | 0 | | | | 0 | |
62
| | | | | | | | | | | | | | | | | | | | |
| | | 2009 | | | 2008 | | | 2007 | |
For funds with fiscal period ending August 31 | | | | | | | | | | | | | | | | | | | | |
Columbia Diversified Bond | | None | | — | | | | — | | — | | | — | | | 0 | | | 0 | |
Columbia Minnesota Tax-Exempt | | None | | — | | | | — | | — | | | — | | | 0 | | | 0 | |
RiverSource California Tax-Exempt | | None | | — | | | | — | | — | | | — | | | 0 | | | 0 | |
RiverSource New York Tax-Exempt | | None | | — | | | | — | | — | | | — | | | 0 | | | 0 | |
For funds with fiscal period ending September 30 | | | | | | | | | | | | | | | | | | | | |
Columbia Diversified Equity Income | | None | | — | | | | — | | — | | | — | | | 0 | | | 0 | |
Columbia Large Growth Quantitative | | None | | — | | | | — | | — | | | — | | | 0 | | | 0 | (d) |
Columbia Large Value Quantitative | | None | | — | | | | — | | — | | | — | | | 0 | (e) | | N/A | |
Columbia Mid Cap Value Opportunity | | None | | — | | | | — | | — | | | — | | | 0 | | | 0 | |
Columbia Strategic Allocation | | None | | — | | | | — | | — | | | — | | | 0 | | | 0 | |
RiverSource Balanced | | None | | — | | | | — | | — | | | — | | | 0 | | | 0 | |
RiverSource Strategic Income Allocation | | None | | — | | | | — | | — | | | — | | | 0 | | | 0 | (d) |
Seligman California Municipal High-Yield | | None | | — | | | | — | | — | | | — | | | 0 | | | 0 | |
Seligman California Municipal Quality | | None | | — | | | | — | | — | | | — | | | 0 | | | 0 | |
Seligman Minnesota Municipal | | None | | — | | | | — | | — | | | — | | | 0 | | | 0 | |
Seligman National Municipal | | None | | — | | | | — | | — | | | — | | | 0 | | | 0 | |
Seligman New York Municipal | | None | | — | | | | — | | — | | | — | | | 0 | | | 0 | |
Seligman TargETFund 2015 | | None | | — | | | | — | | — | | | — | | | 0 | | | 0 | |
Seligman TargETFund 2025 | | None | | — | | | | — | | — | | | — | | | 0 | | | 0 | |
Seligman TargETFund 2035 | | None | | — | | | | — | | — | | | — | | | 0 | | | 0 | |
Seligman TargETFund 2045 | | None | | — | | | | — | | — | | | — | | | 0 | | | 0 | |
Seligman TargETFund Core | | None | | — | | | | — | | — | | | — | | | 0 | | | 0 | |
For funds with fiscal period ending October 31 | | | | | | | | | | | | | | | | | | | | |
Columbia Absolute Return Currency and Income | | None | | — | | | | — | | — | | | — | | | 0 | | | 0 | |
Columbia Asia Pacific ex-Japan | | None(f) | | — | | | | — | | — | | | — | | | N/A | | | N/A | |
Columbia Emerging Markets Bond | | None | | — | | | | — | | — | | | — | | | 0 | | | 0 | |
Columbia Emerging Markets Opportunity | | None | | — | | | | — | | — | | | — | | | 0 | | | 0 | |
Columbia European Equity | | None | | — | | | | — | | — | | | — | | | 0 | | | 0 | |
Columbia Frontier | | None | | — | | | | — | | — | | | — | | | 0 | | | 0 | |
Columbia Global Bond | | None | | — | | | | — | | — | | | — | | | 0 | | | 0 | |
Columbia Global Equity | | None | | — | | | | — | | — | | | — | | | 0 | | | 0 | |
Columbia Global Extended Alpha | | None | | — | | | | — | | — | | | — | | | 0 | (g) | | N/A | |
Columbia Multi-Advisor International Value | | Sanford Bernstein | | (1 | ) | | $ | 0 | | — | | | — | | | 1,677 | | | 0 | |
Columbia Seligman Global Technology | | None | | — | | | | — | | — | | | — | | | 0 | | | 0 | |
RiverSource Disciplined International Equity | | None | | — | | | | — | | — | | | — | | | 0 | | | 0 | |
RiverSource Partners International Select Growth | | Merrill Lynch | | (2 | ) | | | 585 | | 0.27 | % | | 0.42 | % | | 0 | | | 0 | |
| | Capital Markets | | | | | | | | | | | | | | | | | | |
RiverSource Partners International Small Cap | | None | | — | | | | — | | — | | | — | | | 0 | | | 0 | |
Threadneedle Global Equity Income | | None | | — | | | | — | | — | | | — | | | 0 | (g) | | N/A | |
Threadneedle International Opportunity | | None | | — | | | | — | | — | | | — | | | 0 | | | 0 | |
For funds with fiscal period ending November 30 | | | | | | | | | | | | | | | | | | | | |
Columbia AMT-Free Tax-Exempt Bond | | None | | — | | | | — | | — | | | — | | | 0 | | | 0 | |
Columbia Mid Cap Growth Opportunity | | None | | — | | | | — | | — | | | — | | | 0 | | | 0 | |
RiverSource Intermediate Tax-Exempt | | None | | — | | | | — | | — | | | — | | | 0 | | | 0 | |
RiverSource Tax-Exempt High Income | | None | | — | | | | — | | — | | | — | | | 0 | | | 0 | |
For funds with fiscal period ending December 31 | | | | | | | | | | | | | | | | | | | | |
Columbia Government Money Market | | None | | — | | | | — | | — | | | — | | | 0 | | | 0 | |
Columbia Select Large-Cap Value | | None | | — | | | | — | | — | | | — | | | 0 | | | 0 | |
Columbia Select Smaller-Cap Value | | None | | — | | | | — | | — | | | — | | | 0 | | | 0 | |
Columbia Seligman Communications and Information | | None | | — | | | | — | | — | | | — | | | 0 | | | 0 | |
RiverSource LaSalle Global Real Estate | | None | | — | | | | — | | — | | | — | | | 0 | | | 0 | |
RiverSource LaSalle Monthly Dividend Real Estate | | None | | — | | | | — | | — | | | — | | | 0 | | | 0 | |
Seligman Capital | | None | | — | | | | — | | — | | | — | | | 0 | | | 0 | |
Seligman Growth | | None | | — | | | | — | | — | | | — | | | 0 | | | 0 | |
| (1) | Affiliate of AllianceBernstein L.P., a subadviser. |
| (2) | Affiliate of Columbia Wanger Asset Management, L.P., a subadviser. |
| (a) | The fund changed its fiscal year end effective Jan. 31, 2008 from May 31 to Jan. 31. For 2008, the information shown is for the period from June 1, 2007 through Jan. 31, 2008. For years prior to 2008, the fiscal period ended on May 31. |
| (b) | For the period from Oct. 18, 2007 (when shares became publicly available) to April 30, 2008. |
| (c) | For the period from Feb. 19, 2009 (when shares became publicly available) to April 30, 2009. |
| (d) | For the period from May 17, 2007 (when shares became publicly available) to Sept. 30, 2007. |
| (e) | For the period from Aug. 1, 2008 (when shares became publicly available) to Sept. 30, 2008. |
| (f) | For the period from July 15, 2009 (when shares became publicly available) to Oct. 31, 2009. |
| (g) | For the period from Aug. 1, 2008 (when shares became publicly available) to Oct. 31, 2008. |
63
Valuing Fund Shares
As of the end of the most recent fiscal period, the computation of net asset value per share of a class of a fund was based on net assets of that class divided by the number of class shares outstanding as shown in the following table. The table is organized by fiscal year end. You can find your fund’s fiscal year end in Table 1. All expenses of a fund, including the management fee and administrative services fee and, as applicable, distribution and plan administration fees, are accrued daily and taken into account for the purpose of determining NAV.
Table 8. Valuing Fund Shares
| | | | | | | | |
Fund | | Net assets | | Shares outstanding | | Net asset value of one Share |
For funds with fiscal period ending January 31 | | | | | | | | |
Columbia Income Builder Fund | | | | | | | | |
Class A | | $ | 191,609,144 | | 19,630,870 | | $ | 9.76 |
Class B | | | 24,940,436 | | 2,547,850 | | | 9.79 |
Class C | | | 12,407,352 | | 1,267,551 | | | 9.79 |
Class R4 | | | 9,771 | | 1,000 | | | 9.77 |
Columbia Income Builder Fund II | | | | | | | | |
Class A | | | 336,673,414 | | 35,567,971 | | | 9.47 |
Class B | | | 35,116,660 | | 3,701,134 | | | 9.49 |
Class C | | | 15,534,369 | | 1,636,863 | | | 9.49 |
Class R4 | | | 18,248 | | 1,926 | | | 9.47 |
Columbia Income Builder Fund III | | | | | | | | |
Class A | | | 169,340,312 | | 17,933,995 | | | 9.44 |
Class B | | | 17,093,815 | | 1,803,903 | | | 9.48 |
Class C | | | 8,762,187 | | 925,152 | | | 9.47 |
Class R4 | | | 36,268 | | 3,844 | | | 9.43 |
Columbia Portfolio Builder Aggressive | | | | | | | | |
Class A | | | 411,905,718 | | 47,812,554 | | | 8.62 |
Class B | | | 69,631,727 | | 8,121,597 | | | 8.57 |
Class C | | | 26,852,423 | | 3,157,443 | | | 8.50 |
Class R4 | | | 391,084 | | 45,318 | | | 8.63 |
Columbia Portfolio Builder Conservative | | | | | | | | |
Class A | | | 188,324,159 | | 19,284,494 | | | 9.77 |
Class B | | | 38,996,195 | | 4,007,171 | | | 9.73 |
Class C | | | 18,361,827 | | 1,886,873 | | | 9.73 |
Class R4 | | | 68,268 | | 7,043 | | | 9.69 |
Columbia Portfolio Builder Moderate | | | | | | | | |
Class A | | | 936,670,111 | | 99,022,922 | | | 9.46 |
Class B | | | 163,374,895 | | 17,355,229 | | | 9.41 |
Class C | | | 60,532,854 | | 6,431,212 | | | 9.41 |
Class R4 | | | 221,015 | | 23,381 | | | 9.45 |
Columbia Portfolio Builder Moderate Aggressive | | | | | | | | |
Class A | | | 848,711,038 | | 93,990,508 | | | 9.03 |
Class B | | | 143,830,084 | | 16,003,632 | | | 8.99 |
Class C | | | 44,907,699 | | 5,004,198 | | | 8.97 |
Class R4 | | | 842,067 | | 93,149 | | | 9.04 |
Columbia Portfolio Builder Moderate Conservative | | | | | | | | |
Class A | | | 335,708,725 | | 34,921,226 | | | 9.61 |
Class B | | | 60,124,214 | | 6,274,529 | | | 9.58 |
Class C | | | 26,207,827 | | 2,735,790 | | | 9.58 |
Class R4 | | | 28,861 | | 3,017 | | | 9.57 |
Columbia Portfolio Builder Total Equity | | | | | | | | |
Class A | | | 348,269,405 | | 42,472,580 | | | 8.20 |
Class B | | | 56,041,391 | | 6,869,051 | | | 8.16 |
Class C | | | 25,712,743 | | 3,180,656 | | | 8.08 |
Class R4 | | | 227,529 | | 27,657 | | | 8.23 |
64
| | | | | | |
RiverSource S&P 500 Index | | | | | | |
Class A* | | 21,534,109 | | 6,062,565 | | 3.55 |
Class Z* | | 100,496,276 | | 28,199,115 | | 3.56 |
RiverSource Small Company Index | | | | | | |
Class A | | 328,913,706 | | 84,403,946 | | 3.90 |
Class B | | 43,947,939 | | 14,032,865 | | 3.13 |
Class R4 | | 6,632,993 | | 1,640,892 | | 4.04 |
For funds with fiscal period ending March 31 | | | | | | |
Columbia Equity Value | | | | | | |
Class A | | 681,073,286 | | 70,741,844 | | 9.63 |
Class B | | 50,132,060 | | 5,184,913 | | 9.67 |
Class C | | 4,895,038 | | 512,462 | | 9.55 |
Class I | | 18,363,036 | | 1,905,271 | | 9.64 |
Class R | | 30,124 | | 3,129 | | 9.63 |
Class R3 | | 183,254 | | 19,014 | | 9.64 |
Class R4 | | 10,092,743 | | 1,046,026 | | 9.65 |
Class R5 | | 6,508 | | 676 | | 9.63 |
Class W | | 3,658 | | 380 | | 9.63 |
RiverSource Precious Metals and Mining | | | | | | |
Class A | | 133,459,266 | | 10,925,790 | | 12.22 |
Class B | | 13,809,631 | | 1,240,361 | | 11.13 |
Class C | | 4,233,101 | | 389,141 | | 10.88 |
Class I | | 12,268 | | 989 | | 12.40 |
Class R4 | | 177,328 | | 14,319 | | 12.38 |
For funds with fiscal period ending April 30 | | | | | | |
Columbia 120/20 Contrarian Equity | | | | | | |
Class A | | 33,365,848 | | 2,185,314 | | 15.27 |
Class B | | 1,401,883 | | 92,764 | | 15.11 |
Class C | | 2,405,895 | | 159,728 | | 15.06 |
Class I | | 4,324,899 | | 281,691 | | 15.35 |
Class R5 | | 7,670 | | 500 | | 15.34 |
Columbia Recovery and Infrastructure | | | | | | |
Class A | | 438,673,229 | | 22,317,277 | | 19.66 |
Class B | | 21,596,850 | | 1,108,701 | | 19.48 |
Class C | | 27,986,758 | | 1,436,501 | | 19.48 |
Class I | | 117,332,774 | | 5,939,737 | | 19.75 |
Class R | | 80,728 | | 4,127 | | 19.56 |
Class R3 | | 19,621 | | 1,000 | | 19.62 |
Class R4 | | 623,844 | | 31,702 | | 19.68 |
Class R5 | | 59,600 | | 3,020 | | 19.74 |
Columbia Retirement Plus 2010 | | | | | | |
Class A | | 3,004,756 | | 352,192 | | 8.53 |
Class R | | 3,994 | | 468 | | 8.53 |
Class R3 | | 3,994 | | 468 | | 8.53 |
Class R4 | | 3,996 | | 468 | | 8.54 |
Class R5 | | 3,998 | | 468 | | 8.54 |
Class Y | | 5,248,330 | | 614,374 | | 8.54 |
Columbia Retirement Plus 2015 | | | | | | |
Class A | | 5,097,950 | | 597,650 | | 8.53 |
Class R | | 3,973 | | 465 | | 8.54 |
Class R3 | | 3,973 | | 465 | | 8.54 |
Class R4 | | 3,975 | | 465 | | 8.55 |
Class R5 | | 3,981 | | 465 | | 8.56 |
Class Y | | 16,572,401 | | 1,937,035 | | 8.56 |
Columbia Retirement Plus 2020 | | | | | | |
Class A | | 5,667,643 | | 702,748 | | 8.06 |
Class R | | 78,158 | | 9,696 | | 8.06 |
Class R3 | | 3,759 | | 464 | | 8.10 |
Class R4 | | 3,760 | | 464 | | 8.10 |
Class R5 | | 3,765 | | 464 | | 8.11 |
Class Y | | 17,797,248 | | 2,195,426 | | 8.11 |
65
| | | | | | |
Columbia Retirement Plus 2025 | | | | | | |
Class A | | 3,282,520 | | 407,390 | | 8.06 |
Class R | | 22,706 | | 2,823 | | 8.04 |
Class R3 | | 3,768 | | 466 | | 8.09 |
Class R4 | | 3,778 | | 465 | | 8.12 |
Class R5 | | 3,778 | | 465 | | 8.12 |
Class Y | | 23,159,563 | | 2,856,811 | | 8.11 |
Columbia Retirement Plus 2030 | | | | | | |
Class A | | 3,128,008 | | 387,287 | | 8.08 |
Class R | | 11,770 | | 1,457 | | 8.08 |
Class R3 | | 3,744 | | 464 | | 8.07 |
Class R4 | | 3,752 | | 464 | | 8.09 |
Class R5 | | 3,757 | | 464 | | 8.10 |
Class Y | | 22,379,892 | | 2,763,842 | | 8.10 |
Columbia Retirement Plus 2035 | | | | | | |
Class A | | 1,956,294 | | 244,856 | | 7.99 |
Class R | | 3,735 | | 467 | | 8.00 |
Class R3 | | 3,739 | | 467 | | 8.01 |
Class R4 | | 3,740 | | 467 | | 8.01 |
Class R5 | | 3,746 | | 467 | | 8.02 |
Class Y | | 17,305,186 | | 2,157,431 | | 8.02 |
Columbia Retirement Plus 2040 | | | | | | |
Class A | | 1,741,154 | | 224,227 | | 7.77 |
Class R | | 11,120 | | 1,430 | | 7.78 |
Class R3 | | 35,194 | | 4,525 | | 7.78 |
Class R4 | | 3,616 | | 464 | | 7.79 |
Class R5 | | 3,621 | | 464 | | 7.80 |
Class Y | | 12,213,457 | | 1,565,039 | | 7.80 |
Columbia Retirement Plus 2045 | | | | | | |
Class A | | 1,471,608 | | 185,478 | | 7.93 |
Class R | | 4,460 | | 562 | | 7.94 |
Class R3 | | 3,702 | | 466 | | 7.94 |
Class R4 | | 13,137 | | 1,653 | | 7.95 |
Class R5 | | 3,708 | | 466 | | 7.96 |
Class Y | | 11,614,891 | | 1,459,211 | | 7.96 |
For funds with fiscal period ending May 31 | | | | | | |
Columbia High Yield Bond | | | | | | |
Class A | | 1,192,635,686 | | 457,046,893 | | 2.61 |
Class B | | 91,104,344 | | 34,942,309 | | 2.61 |
Class C | | 70,488,596 | | 27,193,543 | | 2.59 |
Class I | | 144,202,631 | | 55,371,206 | | 2.60 |
Class R | | 5,689,581 | | 2,174,204 | | 2.62 |
Class R3 | | 4,003,157 | | 1,526,132 | | 2.62 |
Class R4 | | 43,405,874 | | 16,621,906 | | 2.61 |
Class R5 | | 7,957,720 | | 3,054,300 | | 2.61 |
Class W | | 100,226,537 | | 38,706,595 | | 2.59 |
Columbia Multi-Advisor Small Cap Value | | | | | | |
Class A | | 277,383,581 | | 56,445,589 | | 4.91 |
Class B | | 62,403,783 | | 13,736,068 | | 4.54 |
Class C | | 7,765,256 | | 1,704,900 | | 4.55 |
Class I | | 43,814,661 | | 8,585,111 | | 5.10 |
Class R | | 679,273 | | 138,536 | | 4.90 |
Class R3 | | 439,854 | | 88,320 | | 4.98 |
Class R4 | | 370,250 | | 73,789 | | 5.02 |
Class R5 | | 11,078,515 | | 2,197,207 | | 5.04 |
Columbia U.S. Government Mortgage | | | | | | |
Class A | | 80,371,258 | | 15,588,925 | | 5.16 |
Class B | | 17,619,412 | | 3,416,007 | | 5.16 |
Class C | | 5,217,051 | | 1,011,314 | | 5.16 |
Class I | | 132,494,594 | | 25,723,583 | | 5.15 |
Class R4 | | 85,125 | | 16,536 | | 5.15 |
66
| | | | | | |
RiverSource Partners Fundamental Value | | | | | | |
Class A | | 307,057,850 | | 70,426,307 | | 4.36 |
Class B | | 51,870,545 | | 12,425,795 | | 4.17 |
Class C | | 8,227,996 | | 1,965,058 | | 4.19 |
Class I | | 174,554,927 | | 39,571,435 | | 4.41 |
Class R4 | | 153,322 | | 34,916 | | 4.39 |
RiverSource Short Duration U.S. Government | | | | | | |
Class A | | 488,090,547 | | 102,802,359 | | 4.75 |
Class B | | 66,777,148 | | 14,065,529 | | 4.75 |
Class C | | 27,832,188 | | 5,862,287 | | 4.75 |
Class I | | 67,563,272 | | 14,218,020 | | 4.75 |
Class R | | 2,999,953 | | 631,892 | | 4.75 |
Class R4 | | 4,709,513 | | 991,519 | | 4.75 |
Class W | | 4,996 | | 1,053 | | 4.74 |
For funds with fiscal period ending June 30 | | | | | | |
Columbia Dividend Opportunity | | | | | | |
Class A | | 883,208,464 | | 139,966,191 | | 6.31 |
Class B | | 68,144,709 | | 10,871,463 | | 6.27 |
Class C | | 21,354,419 | | 3,418,234 | | 6.25 |
Class I | | 165,701,325 | | 26,198,041 | | 6.32 |
Class R | | 196,428 | | 31,069 | | 6.32 |
Class R3 | | 4,127 | | 653 | | 6.32 |
Class R4 | | 1,455,755 | | 230,050 | | 6.33 |
Class R5 | | 968,152 | | 152,954 | | 6.33 |
Class W | | 3,592 | | 568 | | 6.32 |
RiverSource Real Estate | | | | | | |
Class A | | 52,648,116 | | 5,701,458 | | 9.23 |
Class B | | 6,533,282 | | 713,272 | | 9.16 |
Class C | | 1,396,367 | | 152,727 | | 9.14 |
Class I | | 131,165,236 | | 14,173,209 | | 9.25 |
Class R4 | | 60,555 | | 6,587 | | 9.19 |
Class W | | 2,528 | | 275 | | 9.19 |
For funds with fiscal period ending July 31 | | | | | | |
Columbia Floating Rate | | | | | | |
Class A | | 226,172,173 | | 26,483,112 | | 8.54 |
Class B | | 9,928,119 | | 1,161,939 | | 8.54 |
Class C | | 21,210,203 | | 2,483,252 | | 8.54 |
Class I | | 101,982,065 | | 11,945,601 | | 8.54 |
Class R4 | | 178,181 | | 20,812 | | 8.56 |
Class R5 | | 4,760 | | 556 | | 8.56 |
Class W | | 4,246 | | 497 | | 8.54 |
Columbia Income Opportunities | | | | | | |
Class A | | 498,802,615 | | 51,300,169 | | 9.72 |
Class B | | 29,050,926 | | 2,989,075 | | 9.72 |
Class C | | 60,481,511 | | 6,224,222 | | 9.72 |
Class I | | 182,941,408 | | 18,794,063 | | 9.73 |
Class R4 | | 403,599 | | 41,375 | | 9.75 |
Class R5 | | 5,068 | | 521 | | 9.73 |
Columbia Inflation Protected Securities | | | | | | |
Class A | | 297,826,817 | | 28,749,837 | | 10.36 |
Class B | | 14,961,461 | | 1,445,877 | | 10.35 |
Class C | | 17,160,807 | | 1,658,844 | | 10.35 |
Class I | | 184,100,334 | | 17,768,869 | | 10.36 |
Class R | | 1,474,003 | | 142,411 | | 10.35 |
Class R4 | | 79,085 | | 7,639 | | 10.35 |
Class R5 | | 5,139 | | 496 | | 10.36 |
Class W | | 100,345,459 | | 9,690,622 | | 10.35 |
67
| | | | | | |
Columbia Large Core Quantitative | | | | | | |
Class A | | 2,688,843,397 | | 567,423,999 | | 4.74 |
Class B | | 153,325,657 | | 32,554,969 | | 4.71 |
Class C | | 21,982,264 | | 4,714,140 | | 4.66 |
Class I | | 314,250,741 | | 65,856,337 | | 4.77 |
Class R | | 2,193,578 | | 463,276 | | 4.73 |
Class R3 | | 6,033 | | 1,273 | | 4.74 |
Class R4 | | 162,518,882 | | 34,154,804 | | 4.76 |
Class R5 | | 24,848,139 | | 5,229,982 | | 4.75 |
Class W | | 373,927,157 | | 79,042,111 | | 4.73 |
Columbia Limited Duration Credit | | | | | | |
Class A | | 392,689,453 | | 39,500,738 | | 9.94 |
Class B | | 11,562,307 | | 1,163,439 | | 9.94 |
Class C | | 49,324,257 | | 4,964,675 | | 9.94 |
Class I | | 126,851,810 | | 12,755,538 | | 9.94 |
Class R4 | | 540,555 | | 54,240 | | 9.97 |
Class W | | 5,096 | | 512 | | 9.95 |
Columbia Money Market | | | | | | |
Class A | | 2,528,588,079 | | 2,528,587,497 | | 1.00 |
Class B | | 33,926,741 | | 33,926,744 | | 1.00 |
Class C | | 7,909,529 | | 7,909,540 | | 1.00 |
Class I | | 27,174,833 | | 27,174,915 | | 1.00 |
Class R | | 2,500 | | 2,500 | | 1.00 |
Class R5 | | 725,626 | | 725,628 | | 1.00 |
Class W | | 34,576,967 | | 34,577,375 | | 1.00 |
Class Y | | 26,190,282 | | 26,190,329 | | 1.00 |
Class Z | | 19,816,215 | | 19,816,218 | | 1.00 |
RiverSource Disciplined Small and Mid Cap Equity | | | | | | |
Class A | | 9,570,996 | | 1,291,322 | | 7.41 |
Class B | | 586,284 | | 81,313 | | 7.21 |
Class C | | 205,141 | | 28,435 | | 7.21 |
Class I | | 27,121,153 | | 3,643,387 | | 7.44 |
Class R4 | | 8,952 | | 1,206 | | 7.42 |
Class W | | 104,872,014 | | 14,205,922 | | 7.38 |
RiverSource Disciplined Small Cap Value | | | | | | |
Class A | | 3,483,311 | | 441,264 | | 7.89 |
Class B | | 141,730 | | 18,276 | | 7.75 |
Class C | | 120,243 | | 15,510 | | 7.75 |
Class I | | 47,679,790 | | 6,023,250 | | 7.92 |
Class R | | 3,587 | | 455 | | 7.88 |
Class R3 | | 5,300 | | 672 | | 7.89 |
Class R4 | | 7,899 | | 1,000 | | 7.90 |
Class R5 | | 3,599 | | 455 | | 7.91 |
For funds with fiscal period ending August 31 | | | | | | |
Columbia Diversified Bond | | | | | | |
Class A | | 2,402,834,582 | | 505,515,125 | | 4.75 |
Class B | | 191,468,923 | | 40,286,990 | | 4.75 |
Class C | | 52,650,113 | | 11,074,642 | | 4.75 |
Class I | | 787,166,241 | | 165,384,786 | | 4.76 |
Class R | | 287,638 | | 60,428 | | 4.76 |
Class R3 | | 9,829 | | 2,067 | | 4.76 |
Class R4 | | 72,569,590 | | 15,286,568 | | 4.75 |
Class R5 | | 296,257 | | 62,408 | | 4.75 |
Class W | | 578,424,162 | | 121,658,362 | | 4.75 |
Columbia Minnesota Tax-Exempt | | | | | | |
Class A | | 301,420,555 | | 58,435,558 | | 5.16 |
Class B | | 9,061,802 | | 1,755,984 | | 5.16 |
Class C | | 12,604,907 | | 2,443,475 | | 5.16 |
68
| | | | | | |
RiverSource California Tax-Exempt | | | | | | |
Class A | | 156,529,091 | | 32,281,411 | | 4.85 |
Class B | | 2,746,317 | | 566,512 | | 4.85 |
Class C | | 2,638,601 | | 543,497 | | 4.85 |
RiverSource New York Tax-Exempt | | | | | | |
Class A | | 52,995,844 | | 10,905,515 | | 4.86 |
Class B | | 2,051,875 | | 422,258 | | 4.86 |
Class C | | 931,186 | | 191,649 | | 4.86 |
For funds with fiscal period ending September 30 | | | | | | |
Columbia Diversified Equity Income | | | | | | |
Class A | | 3,516,947,647 | | 423,238,665 | | 8.31 |
Class B | | 377,652,270 | | 45,345,973 | | 8.33 |
Class C | | 72,371,930 | | 8,719,127 | | 8.30 |
Class I | | 212,064,386 | | 25,537,767 | | 8.30 |
Class R | | 8,271,071 | | 998,943 | | 8.28 |
Class R3 | | 110,247,680 | | 13,285,646 | | 8.30 |
Class R4 | | 197,976,509 | | 23,806,751 | | 8.32 |
Class R5 | | 53,334,196 | | 6,415,412 | | 8.31 |
Class W | | 3,002 | | 361 | | 8.32 |
Columbia Large Growth Quantitative | | | | | | |
Class A | | 274,023,730 | | 36,524,683 | | 7.50 |
Class B | | 3,579,138 | | 481,472 | | 7.43 |
Class C | | 1,561,360 | | 210,004 | | 7.43 |
Class I | | 206,056,085 | | 27,238,022 | | 7.57 |
Class R | | 7,533 | | 1,000 | | 7.53 |
Class R3 | | 7,539 | | 1,000 | | 7.54 |
Class R4 | | 7,730 | | 1,025 | | 7.54 |
Class R5 | | 7,561 | | 1,000 | | 7.56 |
Class W | | 188,126,122 | | 25,003,227 | | 7.52 |
Columbia Large Value Quantitative | | | | | | |
Class A | | 1,434,098 | | 184,422 | | 7.78 |
Class B | | 57,553 | | 7,464 | | 7.71 |
Class C | | 27,275 | | 3,524 | | 7.74 |
Class I | | 60,019,450 | | 7,688,355 | | 7.81 |
Class R | | 7,766 | | 1,000 | | 7.77 |
Class R3 | | 7,779 | | 1,000 | | 7.78 |
Class R4 | | 13,843 | | 1,776 | | 7.79 |
Class R5 | | 7,804 | | 1,000 | | 7.80 |
Class W | | 237,104,669 | | 30,469,778 | | 7.78 |
Columbia Mid Cap Value Opportunity | | | | | | |
Class A | | 1,351,336,081 | | 219,846,167 | | 6.15 |
Class B | | 104,322,229 | | 17,668,539 | | 5.90 |
Class C | | 41,952,034 | | 7,101,337 | | 5.91 |
Class I | | 44,213,966 | | 7,069,592 | | 6.25 |
Class R | | 15,826,707 | | 2,592,379 | | 6.11 |
Class R3 | | 46,598,913 | | 7,595,392 | | 6.14 |
Class R4 | | 337,592,770 | | 54,533,230 | | 6.19 |
Class R5 | | 133,143,010 | | 21,466,665 | | 6.20 |
Class W | | 3,138 | | 506 | | 6.20 |
Columbia Strategic Allocation | | | | | | |
Class A | | 1,122,673,319 | | 133,009,047 | | 8.44 |
Class B | | 115,318,212 | | 13,795,868 | | 8.36 |
Class C | | 46,514,897 | | 5,592,862 | | 8.32 |
Class I | | 3,660 | | 434 | | 8.43 |
Class R | | 3,660 | | 434 | | 8.43 |
Class R3 | | 3,660 | | 434 | | 8.43 |
Class R4 | | 1,219,103 | | 144,213 | | 8.45 |
Class R5 | | 3,660 | | 434 | | 8.43 |
69
| | | | | | |
RiverSource Balanced | | | | | | |
Class A | | 567,386,530 | | 64,566,373 | | 8.79 |
Class B | | 17,661,853 | | 2,021,254 | | 8.74 |
Class C | | 9,454,482 | | 1,084,116 | | 8.72 |
Class R | | 119,765 | | 13,638 | | 8.78 |
Class R4 | | 45,391,810 | | 5,164,844 | | 8.79 |
Class R5 | | 10,692 | | 1,217 | | 8.79 |
RiverSource Strategic Income Allocation | | | | | | |
Class A | | 255,190,331 | | 26,582,876 | | 9.60 |
Class B | | 25,702,531 | | 2,676,844 | | 9.60 |
Class C | | 13,328,854 | | 1,389,310 | | 9.59 |
Class R | | 5,157 | | 537 | | 9.60 |
Class R3 | | 5,157 | | 537 | | 9.60 |
Class R4 | | 68,365 | | 7,124 | | 9.60 |
Class R5 | | 5,157 | | 537 | | 9.60 |
Seligman California Municipal High-Yield | | | | | | |
Class A | | 31,142,713 | | 4,653,633 | | 6.69 |
Class C | | 6,162,106 | | 919,720 | | 6.70 |
Seligman California Municipal Quality | | | | | | |
Class A | | 40,319,393 | | 6,023,523 | | 6.69 |
Class C | | 3,514,624 | | 527,353 | | 6.66 |
Seligman Minnesota Municipal | | | | | | |
Class A | | 71,247,393 | | 9,145,572 | | 7.79 |
Class C | | 1,407,064 | | 180,200 | | 7.81 |
Seligman National Municipal | | | | | | |
Class A | | 665,767,573 | | 82,031,969 | | 8.12 |
Class C | | 36,644,916 | | 4,493,860 | | 8.15 |
Seligman New York Municipal | | | | | | |
Class A | | 76,943,770 | | 9,243,243 | | 8.32 |
Class C | | 8,196,244 | | 982,659 | | 8.34 |
Seligman TargETFund 2015 | | | | | | |
Class A | | 12,869,269 | | 1,940,646 | | 6.63 |
Class C | | 12,264,632 | | 1,882,061 | | 6.52 |
Class R | | 1,495,666 | | 226,740 | | 6.60 |
Class R5 | | 25,221 | | 3,765 | | 6.70 |
Seligman TargETFund 2025 | | | | | | |
Class A | | 17,518,203 | | 2,562,329 | | 6.84 |
Class C | | 13,402,662 | | 2,002,910 | | 6.69 |
Class R | | 3,182,793 | | 469,091 | | 6.79 |
Class R5 | | 245,363 | | 35,571 | | 6.90 |
Seligman TargETFund 2035 | | | | | | |
Class A | | 5,955,957 | | 840,606 | | 7.09 |
Class C | | 2,414,707 | | 346,244 | | 6.97 |
Class R | | 1,481,321 | | 209,743 | | 7.06 |
Class R5 | | 7,946 | | 1,115 | | 7.13 |
Seligman TargETFund 2045 | | | | | | |
Class A | | 3,216,301 | | 455,251 | | 7.06 |
Class C | | 882,294 | | 126,804 | | 6.96 |
Class R | | 523,492 | | 74,309 | | 7.04 |
Class R5 | | 17,878 | | 2,516 | | 7.11 |
Seligman TargETFund Core | | | | | | |
Class A | | 20,084,624 | | 3,119,620 | | 6.44 |
Class C | | 28,956,029 | | 4,495,509 | | 6.44 |
Class R | | 9,547,700 | | 1,483,888 | | 6.43 |
Class R5 | | 105,101 | | 16,332 | | 6.44 |
70
| | | | | | |
For funds with fiscal period ending October 31 | | | | | | |
Columbia Absolute Return Currency and Income | | | | | | |
Class A | | 114,237,775 | | 11,504,415 | | 9.93 |
Class B | | 2,026,053 | | 205,708 | | 9.85 |
Class C | | 7,609,307 | | 773,530 | | 9.84 |
Class I | | 28,925,560 | | 2,899,043 | | 9.98 |
Class R4 | | 9,944 | | 1,000 | | 9.94 |
Class R5 | | 9,397 | | 942 | | 9.98 |
Class W | | 86,999,758 | | 8,768,011 | | 9.92 |
Columbia Asia Pacific ex-Japan | | | | | | |
Class R5 | | 53,643,171 | | 4,698,479 | | 11.42 |
Columbia Emerging Markets Bond | | | | | | |
Class A | | 32,726,471 | | 3,161,305 | | 10.35 |
Class B | | 2,419,853 | | 234,037 | | 10.34 |
Class C | | 722,068 | | 69,939 | | 10.32 |
Class I | | 106,358,547 | | 10,273,954 | | 10.35 |
Class R4 | | 23,156 | | 2,238 | | 10.35 |
Class W | | 117,037,431 | | 11,319,382 | | 10.34 |
Columbia Emerging Markets Opportunity | | | | | | |
Class A | | 416,296,725 | | 53,776,169 | | 7.74 |
Class B | | 38,489,191 | | 5,601,155 | | 6.87 |
Class C | | 32,757,231 | | 4,756,330 | | 6.89 |
Class I | | 68,977,761 | | 8,575,621 | | 8.04 |
Class R | | 12,235,711 | | 1,580,451 | | 7.74 |
Class R4 | | 1,186,515 | | 147,397 | | 8.05 |
Class R5 | | 538,197 | | 66,743 | | 8.06 |
Columbia European Equity | | | | | | |
Class A | | 64,717,075 | | 13,311,370 | | 4.86 |
Class B | | 6,123,682 | | 1,268,930 | | 4.83 |
Class C | | 1,156,669 | | 240,707 | | 4.81 |
Class I | | 6,487 | | 1,336 | | 4.86 |
Class R4 | | 18,019 | | 3,711 | | 4.86 |
Columbia Frontier | | | | | | |
Class A | | 23,379,805 | | 2,848,890 | | 8.21 |
Class B | | 1,118,495 | | 169,585 | | 6.60 |
Class C | | 8,899,070 | | 1,342,806 | | 6.63 |
Class I | | 999,800 | | 114,806 | | 8.71 |
Class R | | 81,518 | | 10,109 | | 8.06 |
Class R3 | | 5,027 | | 623 | | 8.07 |
Class R4 | | 9,819 | | 1,128 | | 8.70 |
Class R5 | | 625,564 | | 71,840 | | 8.71 |
Columbia Global Bond | | | | | | |
Class A | | 252,772,959 | | 35,605,039 | | 7.10 |
Class B | | 29,976,819 | | 4,198,213 | | 7.14 |
Class C | | 5,556,941 | | 784,634 | | 7.08 |
Class I | | 169,716,515 | | 23,886,385 | | 7.11 |
Class R4 | | 168,713 | | 23,740 | | 7.11 |
Class W | | 60,278,436 | | 8,500,017 | | 7.09 |
Columbia Global Equity | | | | | | |
Class A | | 394,510,625 | | 64,353,725 | | 6.13 |
Class B | | 33,008,877 | | 5,717,899 | | 5.77 |
Class C | | 10,570,042 | | 1,851,492 | | 5.71 |
Class I | | 32,596,470 | | 5,289,556 | | 6.16 |
Class R | | 46,070 | | 7,498 | | 6.14 |
Class R3 | | 3,897 | | 634 | | 6.15 |
Class R4 | | 6,058,555 | | 980,165 | | 6.18 |
Class R5 | | 17,622 | | 2,861 | | 6.16 |
Class W | | 3,934 | | 639 | | 6.16 |
71
| | | | | | |
Columbia Global Extended Alpha | | | | | | |
Class A | | 2,647,582 | | 150,018 | | 17.65 |
Class B | | 258,403 | | 14,788 | | 17.47 |
Class C | | 125,035 | | 7,154 | | 17.48 |
Class I | | 4,366,888 | | 246,500 | | 17.72 |
Class R | | 8,780 | | 500 | | 17.56 |
Class R3 | | 8,808 | | 500 | | 17.62 |
Class R4 | | 59,122 | | 3,345 | | 17.67 |
Class R5 | | 8,852 | | 500 | | 17.70 |
Columbia Multi-Advisor International Value | | | | | | |
Class A | | 710,323,385 | | 125,309,364 | | 5.67 |
Class B | | 80,458,495 | | 15,117,302 | | 5.32 |
Class C | | 10,917,260 | | 2,057,531 | | 5.31 |
Class I | | 182,888,529 | | 31,357,443 | | 5.83 |
Class R4 | | 493,430 | | 85,118 | | 5.80 |
Columbia Seligman Global Technology | | | | | | |
Class A | | 325,789,863 | | 19,750,519 | | 16.50 |
Class B | | 21,966,464 | | 1,541,875 | | 14.25 |
Class C | | 69,848,512 | | 4,900,053 | | 14.25 |
Class I | | 23,827,145 | | 1,442,107 | | 16.52 |
Class R | | 5,131,007 | | 315,762 | | 16.25 |
Class R3 | | 5,301 | | 326 | | 16.26 |
Class R4 | | 289,226 | | 17,518 | | 16.51 |
Class R5 | | 5,304 | | 321 | | 16.52 |
RiverSource Disciplined International Equity | | | | | | |
Class A | | 49,044,997 | | 7,030,588 | | 6.98 |
Class B | | 7,031,214 | | 1,021,394 | | 6.88 |
Class C | | 1,094,910 | | 159,170 | | 6.88 |
Class I | | 126,948,273 | | 18,085,070 | | 7.02 |
Class R | | 3,525 | | 509 | | 6.93 |
Class R3 | | 3,530 | | 509 | | 6.94 |
Class R4 | | 69,728 | | 9,972 | | 6.99 |
Class R5 | | 3,546 | | 509 | | 6.97 |
Class W | | 282,912,809 | | 40,530,503 | | 6.98 |
RiverSource Partners International Select Growth | | | | | | |
Class A | | 181,148,068 | | 31,216,716 | | 5.80 |
Class B | | 24,733,743 | | 4,433,114 | | 5.58 |
Class C | | 9,527,501 | | 1,710,456 | | 5.57 |
Class I | | 191,323,369 | | 32,651,792 | | 5.86 |
Class R | | 122,389 | | 21,139 | | 5.79 |
Class R4 | | 489,252 | | 84,049 | | 5.82 |
Class R5 | | 938,080 | | 159,892 | | 5.87 |
RiverSource Partners International Small Cap | | | | | | |
Class A | | 25,159,619 | | 4,951,093 | | 5.08 |
Class B | | 4,125,636 | | 846,784 | | 4.87 |
Class C | | 486,947 | | 100,059 | | 4.87 |
Class I | | 31,466,684 | | 6,079,010 | | 5.18 |
Class R4 | | 401,664 | | 78,176 | | 5.14 |
Threadneedle Global Equity Income | | | | | | |
Class A | | 21,078,520 | | 2,483,415 | | 8.49 |
Class B | | 2,067,434 | | 244,105 | | 8.47 |
Class C | | 449,282 | | 53,062 | | 8.47 |
Class I | | 4,190,596 | | 493,000 | | 8.50 |
Class R | | 8,493 | | 1,000 | | 8.49 |
Class R3 | | 8,495 | | 1,000 | | 8.50 |
Class R4 | | 10,456 | | 1,230 | | 8.50 |
Class R5 | | 8,499 | | 1,000 | | 8.50 |
72
| | | | | | |
Threadneedle International Opportunity | | | | | | |
Class A | | 257,909,909 | | 33,503,026 | | 7.70 |
Class B | | 20,431,810 | | 2,710,581 | | 7.54 |
Class C | | 6,942,369 | | 936,735 | | 7.41 |
Class I | | 116,826,749 | | 15,026,177 | | 7.77 |
Class R | | 1,110,150 | | 142,157 | | 7.81 |
Class R3 | | 3,876 | | 496 | | 7.81 |
Class R4 | | 226,706 | | 28,868 | | 7.85 |
Class R5 | | 3,890 | | 496 | | 7.84 |
For funds with fiscal period ending November 30 | | | | | | |
Columbia AMT-Free Tax-Exempt Bond | | | | | | |
Class A | | 645,167,080 | | 173,557,831 | | 3.72 |
Class B | | 14,670,642 | | 3,944,081 | | 3.72 |
Class C | | 8,445,704 | | 2,271,237 | | 3.72 |
Columbia Mid Cap Growth Opportunity | | | | | | |
Class A | | 553,923,464 | | 64,580,896 | | 8.58 |
Class B | | 50,253,513 | | 7,048,364 | | 7.13 |
Class C | | 7,874,750 | | 1,103,661 | | 7.14 |
Class I | | 71,139,006 | | 7,877,330 | | 9.03 |
Class R4 | | 4,055,434 | | 458,745 | | 8.84 |
RiverSource Intermediate Tax-Exempt | | | | | | |
Class A | | 84,077,384 | | 15,978,559 | | 5.26 |
Class B | | 3,518,592 | | 669,458 | | 5.26 |
Class C | | 4,753,140 | | 904,158 | | 5.26 |
RiverSource Tax-Exempt High Income | | | | | | |
Class A | | 2,233,824,301 | | 533,202,685 | | 4.19 |
Class B | | 37,295,962 | | 8,910,422 | | 4.19 |
Class C | | 15,135,314 | | 3,611,273 | | 4.19 |
For funds with fiscal period ending December 31 | | | | | | |
Columbia Government Money Market | | | | | | |
Class A | | 89,878,036 | | 89,888,902 | | 1.00 |
Class B | | 4,745,466 | | 4,744,006 | | 1.00 |
Class C | | 13,538,936 | | 13,518,927 | | 1.00 |
Class R | | 3,134,050 | | 3,134,336 | | 1.00 |
Class R5 | | 128,883 | | 128,873 | | 1.00 |
Columbia Select Large-Cap Value | | | | | | |
Class A | | 202,826,281 | | 16,478,708 | | 12.31 |
Class B | | 5,889,617 | | 506,900 | | 11.62 |
Class C | | 40,629,661 | | 3,493,324 | | 11.63 |
Class I | | 23,869,523 | | 1,894,164 | | 12.60 |
Class R | | 8,288,348 | | 679,748 | | 12.19 |
Class R3 | | 5,402 | | 443 | | 12.19 |
Class R4 | | 5,412 | | 430 | | 12.59 |
Class R5 | | 718,316 | | 56,928 | | 12.62 |
Columbia Select Smaller-Cap Value | | | | | | |
Class A | | 221,181,372 | | 17,565,526 | | 12.59 |
Class B | | 26,499,678 | | 2,376,033 | | 11.15 |
Class C | | 46,625,791 | | 4,175,990 | | 11.17 |
Class I | | 6,299,696 | | 471,820 | | 13.35 |
Class R | | 10,777,562 | | 872,458 | | 12.35 |
Class R3 | | 5,568 | | 450 | | 12.37 |
Class R4 | | 41,632 | | 3,122 | | 13.34 |
Class R5 | | 1,807,541 | | 135,374 | | 13.35 |
Columbia Seligman Communications and Information | | | | | | |
Class A | | 2,788,834,356 | | 71,908,305 | | 38.78 |
Class B | | 106,645,895 | | 3,289,023 | | 32.42 |
Class C | | 694,889,021 | | 21,418,226 | | 32.44 |
Class I | | 39,507,415 | | 980,688 | | 40.29 |
Class R | | 37,012,489 | | 971,801 | | 38.09 |
Class R3 | | 16,436 | | 431 | | 38.13 |
73
| | | | | | |
Class R4 | | 7,565 | | 188 | | 40.24 |
Class R5 | | 14,853,268 | | 368,766 | | 40.28 |
RiverSource LaSalle Global Real Estate | | | | | | |
Class A | | 3,954,525 | | 1,131,585 | | 3.49 |
Class C | | 3,230,557 | | 928,401 | | 3.48 |
Class I | | 5,868,744 | | 1,675,386 | | 3.50 |
Class R | | 65,688 | | 18,792 | | 3.50 |
Class R3 | | 5,971 | | 1,706 | | 3.50 |
Class R4 | | 7,004 | | 2,001 | | 3.50 |
Class R5 | | 1,356,462 | | 387,086 | | 3.50 |
RiverSource LaSalle Monthly Dividend Real Estate | | | | | | |
Class A | | 6,537,789 | | 1,804,866 | | 3.62 |
Class B | | 2,419,442 | | 668,153 | | 3.62 |
Class C | | 10,283,911 | | 2,841,350 | | 3.62 |
Class I | | 1,709,431 | | 471,537 | | 3.63 |
Class R | | 3,927,576 | | 1,088,654 | | 3.61 |
Class R3 | | 6,521 | | 1,805 | | 3.61 |
Class R4 | | 16,991 | | 4,682 | | 3.63 |
Class R5 | | 1,357,398 | | 375,009 | | 3.62 |
Seligman Capital | | | | | | |
Class A | | 157,108,911 | | 7,820,630 | | 20.09 |
Class B | | 5,955,476 | | 365,780 | | 16.28 |
Class C | | 45,861,279 | | 2,809,562 | | 16.32 |
Class I | | 12,192,369 | | 581,385 | | 20.97 |
Class R | | 10,324,166 | | 520,475 | | 19.84 |
Class R3 | | 5,618 | | 283 | | 19.85 |
Class R4 | | 5,632 | | 269 | | 20.94 |
Class R5 | | 1,754,570 | | 83,689 | | 20.97 |
Seligman Growth | | | | | | |
Class A | | 1,243,927,994 | | 305,941,924 | | 4.07 |
Class B | | 97,446,493 | | 30,519,910 | | 3.19 |
Class C | | 32,821,061 | | 10,276,754 | | 3.19 |
Class I | | 238,196,380 | | 56,595,677 | | 4.21 |
Class R | | 1,088,235 | | 272,087 | | 4.00 |
Class R3 | | 6,400 | | 1,597 | | 4.01 |
Class R4 | | 31,688,383 | | 7,529,168 | | 4.21 |
Class R5 | | 420,125 | | 99,877 | | 4.21 |
| * | Effective Sept. 7, 2010, Class D was renamed as Class A and Class E was renamed as Class Z. |
For Funds other than Money Market Funds. A fund’s securities are valued as follows as of the close of business of the New York Stock Exchange (the Exchange):
| | • | | Securities traded on a securities exchange for which a last-quoted sales price is readily available are valued at the last-quoted sales price on the exchange where such security is primarily traded. |
| | • | | Securities traded on a securities exchange for which a last-quoted sales price is not readily available are valued at the mean of the closing bid and asked prices, looking first to the bid and asked prices on the exchange where the security is primarily traded and, if none exist, to the over-the-counter market. |
| | • | | Securities included in the NASDAQ National Market System are valued at the last-quoted sales price in this market. |
| | • | | Securities included in the NASDAQ National Market System for which a last-quoted sales price is not readily available, and other securities traded over-the-counter but not included in the NASDAQ National Market System are valued at the mean of the closing bid and asked prices. |
| | • | | Futures and options traded on major exchanges are valued at the last-quoted sales price on their primary exchange. |
| | • | | Foreign securities traded outside the United States are generally valued as of the time their trading is complete, which is usually different from the close of the Exchange. Foreign securities quoted in foreign currencies are translated into U.S. dollars utilizing spot exchange rates at the close of regular trading on the Exchange. |
74
| | • | | Occasionally, events affecting the value of securities occur between the time the primary market on which the securities are traded closes and the close of the Exchange. If events materially affect the value of securities, the securities will be valued at their fair value according to procedures decided upon in good faith by the Board. This occurs most commonly with foreign securities, but may occur in other cases. The fair value of a security is likely to be different from the quoted or published price. |
| | • | | Short-term securities maturing more than 60 days from the valuation date are valued at the readily available market price or approximate market value based on current interest rates. Typically, short-term securities maturing in 60 days or less that originally had maturities of more than 60 days at acquisition date are valued at amortized cost using the market value on the 61st day before maturity. Short-term securities maturing in 60 days or less at acquisition date are valued at amortized cost. Amortized cost is an approximation of market value determined by systematically increasing the carrying value of a security if acquired at a discount, or reducing the carrying value if acquired at a premium, so that the carrying value is equal to maturity value on the maturity date. |
| | • | | Securities without a readily available market price and securities for which the price quotations or valuations received from other sources are deemed unreliable or not reflective of market value are valued at fair value as determined in good faith by the Board. The Board is responsible for selecting methods it believes provide fair value. |
| | • | | When possible, bonds are valued at an evaluated bid by a pricing service independent from the funds. If a valuation of a bond is not available from a pricing service, the bond will be valued by a dealer knowledgeable about the bond if such a dealer is available. |
The assets of funds-of-funds consist primarily of shares of the underlying funds, which are valued at their NAVs. Other securities held by funds-of-funds are valued as described above.
For Money Market Funds. In accordance with Rule 2a-7 of the 1940 Act, all of the securities in the fund’s portfolio are valued at amortized cost. The amortized cost method of valuation is an approximation of market value determined by systematically increasing the carrying value of a security if acquired at a discount, or reducing the carrying value if acquired at a premium, so that the carrying value is equal to maturity value on the maturity date. Amortized cost does not take into consideration unrealized capital gains or losses.
The Board has established procedures designed to stabilize the fund’s price per share for purposes of sales and redemptions at $1, to the extent that it is reasonably possible to do so. These procedures include review of the fund’s securities by the Board, at intervals deemed appropriate by it, to determine whether the fund’s net asset value per share computed by using available market quotations deviates from a share value of $1 as computed using the amortized cost method. The Board must consider any deviation that appears and, if it exceeds 0.5%, it must determine what action, if any, needs to be taken. If the Board determines a deviation exists that may result in a material dilution of the holdings of current shareholders or investors, or in any other unfair consequences for shareholders, it must undertake remedial action that it deems necessary and appropriate. Such action may include withholding dividends, calculating net asset value per share for purposes of sales and redemptions using available market quotations, making redemptions in kind, and selling securities before maturity in order to realize capital gains or losses or to shorten average portfolio maturity.
While the amortized cost method provides certainty and consistency in portfolio valuation, it may result in valuations of securities that are either somewhat higher or lower than the prices at which the securities could be sold. This means that during times of declining interest rates the yield on the fund’s shares may be higher than if valuations of securities were made based on actual market prices and estimates of market prices. Accordingly, if using the amortized cost method were to result in a lower portfolio value, a prospective investor in the fund would be able to obtain a somewhat higher yield than the investor would get if portfolio valuations were based on actual market values. Existing shareholders, on the other hand, would receive a somewhat lower yield than they would otherwise receive. The opposite would happen during a period of rising interest rates.
Portfolio Holdings Disclosure
Each fund’s Board and the investment manager believe that the investment ideas of the investment manager and any subadviser with respect to portfolio management of a fund should benefit the fund and its shareholders, and do not want to afford speculators an opportunity to profit by anticipating fund trading strategies or by using fund portfolio holdings information for stock picking. However, each fund’s Board also believes that knowledge of the fund’s portfolio holdings can assist shareholders in monitoring their investments, making asset allocation decisions, and evaluating portfolio management techniques.
Each fund’s Board has therefore adopted policies and procedures relating to disclosure of the fund’s portfolio securities. These policies and procedures are intended to protect the confidentiality of fund portfolio holdings information and generally prohibit the release of such information until such information is made public, unless such persons have been authorized to receive such information on a selective basis, as described below. It is the policy of the fund not to provide or permit others to provide portfolio holdings on a selective basis, and the investment manager does not intend to selectively disclose portfolio holdings or expect that such holdings information will be selectively disclosed, except where necessary for the fund’s operation or where there are legitimate business purposes for doing so and, in any case, where conditions are met that are designed to protect the interests of the fund and its shareholders.
75
Although the investment manager seeks to limit the selective disclosure of portfolio holdings information and such selective disclosure is monitored under the fund’s compliance program for conformity with the policies and procedures, there can be no assurance that these policies will protect the fund from the potential misuse of holdings information by individuals or firms in possession of that information. Under no circumstances may the investment manager, its affiliates or any employee thereof receive any consideration or compensation for disclosing such holdings information.
Public Disclosures
The funds’ portfolio holdings are currently disclosed to the public through filings with the SEC and postings on the funds’ website. The information is available on the funds’ website as described below.
| | • | | For Equity and Balanced funds, a complete list of fund portfolio holdings as of month-end are posted on the website on a monthly basis approximately, but no earlier than, 15 calendar days after each month-end. The four most recent consecutive monthly disclosures remain posted for each fund. Such portfolio holdings information posted on the website includes the name of each portfolio security, number of shares held by the fund, value of the security and the security’s percentage of the market value of the fund’s portfolio as of month-end. |
| | • | | For Fixed Income funds, a complete list of fund portfolio holdings as of calendar quarter-end are posted on the website on a quarterly basis approximately, but no earlier than, 30 calendar days after such quarter-end, and remain posted at least until the date on which the fund files its Form N-CSR or Form N-Q with the SEC for the subsequent fiscal period. Fixed income fund portfolio holdings information posted on the website shall include the name of each portfolio security, maturity/rate, par value and the security’s percentage of the market value of the fund’s portfolio as of calendar quarter-end. |
| | • | | For Money Market funds, a complete list of fund portfolio holdings as of month-end are posted on the website on a monthly basis, approximately five business days after such month-end. Commencing with the month-end holdings as of September 2010 and thereafter, such month-end holdings will be continuously available on the website for at least six months, together with a link to an SEC webpage where a user of the website may obtain access to the fund’s most recent 12 months of publicly available filings on Form N-MFP. Additionally, as of September 2010 and thereafter, Money Market fund portfolio holdings information posted on the website will, at minimum, include with respect to each holding, the name of the issuer, the category of investment (e.g., Treasury debt, government agency debt, asset backed commercial paper, structured investment vehicle note), the CUSIP number (if any), the principal amount, the maturity date (as determined under Rule 2a-7 for purposes of calculating weighted average maturity), the final maturity date (if different from the maturity date previously described), coupon or yield and the amortized cost value. The Money Market funds will also disclose on the website the overall weighted average maturity and weighted average life maturity of a holding and any other information that may be required by the SEC. |
Portfolio holdings of funds owned solely by affiliates of the investment manager may not be disclosed on the website. A complete schedule of each fund’s portfolio holdings is available semi-annually and annually in shareholder reports filed on Form N-CSR and, after the first and third fiscal quarters, in regulatory filings on Form N-Q. These shareholder reports and regulatory filings are filed with the SEC in accordance with federal securities laws and are generally available on the SEC’s website within sixty (60) days of the end of a fund’s fiscal quarter.
In addition, the investment manager makes publicly available information regarding certain fund’s largest five to fifteen holdings, as a percent of the market value of the funds’ portfolios as of a month-end. This holdings information is made publicly available through the websites (riversource.com/funds for RiverSource and Threadneedle funds and seligman.com for Seligman funds), approximately fifteen (15) days following the month-end. The scope of the information that is made available on the funds’ websites pursuant to the funds’ policies may change from time to time without prior notice.
Other Disclosures
The funds’ policies and procedures provide that no disclosures of the funds’ portfolio holdings may be made prior to the portfolio holdings information being made public unless (i) the funds have a legitimate business purpose for making such disclosure, (ii) the funds or their authorized agents authorize such non-public disclosure of information, and (iii) the party receiving the non-public information enters into an appropriate confidentiality agreement or is otherwise subject to a confidentiality obligation.
76
In determining the existence of a legitimate business purpose for making portfolio disclosures, the following factors, among others, are considered: (i) any prior disclosure must be consistent with the anti-fraud provisions of the federal securities laws and the fiduciary duties of the investment manager; (ii) any conflicts of interest between the interests of fund shareholders, on the one hand, and those of the investment manager, the funds’ distributor or any affiliated person of a fund, the investment manager or distributor on the other; and (iii) any prior disclosure to a third party, although subject to a confidentiality agreement, would not make conduct lawful that is otherwise unlawful.
In addition, the funds periodically disclose their portfolio information on a confidential basis to various service providers that require such information to assist the funds with their day-to-day business affairs. These service providers include each fund’s sub-advisor(s) (if any), affiliates of the investment manager, the funds’ custodian, sub-custodians, the funds’ independent registered public accounting firm, legal counsel, financial printers, proxy solicitor and proxy voting service provider, as well as ratings agencies that maintain ratings on certain funds. These service providers are required to keep such information confidential, and are prohibited from trading based on the information or otherwise using the information except as necessary in providing services to the funds. The funds also may disclose portfolio holdings information to broker/dealers and certain other entities in connection with potential transactions and management of the funds, provided that reasonable precautions, including limitations on the scope of the portfolio holdings information disclosed, are taken to avoid any potential misuse of the disclosed information.
The fund also discloses holdings information as required by federal, state or international securities laws, and may disclose holdings information in response to requests by governmental authorities, or in connection with litigation or potential litigation, a restructuring of a holding, where such disclosure is necessary to participate or explore participation in a restructuring of the holding (e.g., as part of a bondholder group), or to the issuer of a holding, pursuant to a request of the issuer or any other party who is duly authorized by the issuer.
Each fund’s Board has adopted policies to ensure that the fund’s holdings information is only disclosed in accordance with these policies. Before any selective disclosure of holdings information is permitted, the person seeking to disclose such holdings information must submit a written request to the Portfolio Holdings Committee (“PHC”). The PHC is comprised of members from the investment manager’s legal department, Compliance, and the funds’ President. The PHC has been authorized by each fund’s Board to perform an initial review of requests for disclosure of holdings information to evaluate whether there is a legitimate business purpose for selective disclosure, whether selective disclosure is in the best interests of a fund and its shareholders, to consider any potential conflicts of interest between the fund, the investment manager, and its affiliates, and to safeguard against improper use of holdings information. Factors considered in this analysis are whether the recipient has agreed to or has a duty to keep the holdings information confidential and whether risks have been mitigated such that the recipient has agreed or has a duty to use the holdings information only as necessary to effectuate the purpose for which selective disclosure was authorized, including a duty not to trade on such information. Before portfolio holdings may be selectively disclosed, requests approved by the PHC must also be authorized by either the fund’s President, Chief Compliance Officer or General Counsel or their respective designees. On at least an annual basis, the PHC reviews the approved recipients of selective disclosure and may require a resubmission of the request, in order to re-authorize certain ongoing arrangements. These procedures are intended to be reasonably designed to protect the confidentiality of fund holdings information and to prohibit their release to individual investors, institutional investors, intermediaries that distribute the fund’s shares, and other parties, until such holdings information is made public or unless such persons have been authorized to receive such holdings information on a selective basis, as set forth above.
Although the investment manager has set up these procedures to monitor and control selective disclosure of holdings information, there can be no assurance that these procedures will protect a fund from the potential misuse of holdings information by individuals or firms in possession of that information.
The funds currently have ongoing arrangements with certain approved recipients with respect to the disclosure of portfolio holdings information prior to such information being made public. Portfolio holdings information disclosed to such recipients is current as of the time of its disclosure, is disclosed to each recipient solely for purposes consistent with the services described below and has been authorized in accordance with the policy. These special arrangements are described in the table below.
77
Ongoing Portfolio Holdings Disclosure Arrangements:
In addition to the daily information provided to the fund’s custodians, subcustodians, administrator and investment advisers, the following disclosure arrangements are in place:
| | | | |
Identity of recipient | | Conditions/Restrictions on use of information | | Frequency of disclosure |
Bitlathe | | Website support for fund performance disclosure | | Monthly |
BlackRock, Inc. | | For providing trading operations and portfolio management support. | | Daily |
Bloomberg, L.P. | | For independent research of funds. Sent monthly, approximately 30 days after month end. | | Monthly |
Bowne & Co. | | For printing of proxies and annual updates to prospectuses and SAIs. | | As needed |
Cenveo, Inc. | | For printing of prospectuses, supplements, SAIs and shareholder reports. | | As needed |
Factset Research Systems | | For provision of quantitative analytics, charting and fundamental data to the investment manager. | | Daily |
Investment Technology Group, Inc. (ITG, formerly known as Plexus Group) | | For evaluation and assessment of trading activity, execution and practices by the investment manager. | | Daily |
InvestorTools, Inc. | | Provide descriptive data for municipal securities | | Daily |
Morningstar, Inc. | | For independent research and ranking of funds. Sent monthly, approximately 25 days after month end. | | Monthly |
RiskMetrics Group (formerly Institutional Shareholder Services) | | Proxy voting administration and research on proxy matters. | | Daily |
Thomson Reuters Corp. (Lipper) | | Information provided monthly with a 30 day lag to assure accuracy of Lipper Fact Sheets. | | Monthly |
78
Proxy Voting
GENERAL GUIDELINES, POLICIES AND PROCEDURES
The funds uphold a long tradition of supporting sound and principled corporate governance. For over 30 years, the Board, which consists of a majority of independent Board members, has determined policies and voted proxies. The funds’ investment manager and the funds’ administrator, Ameriprise Financial, provide support to the Board in connection with the proxy voting process.
GENERAL GUIDELINES
Corporate Governance Matters — The Board supports proxy proposals that it believes are tied to the interests of shareholders and votes against proxy proposals that appear to entrench management. For example:
| | • | | The Board generally votes in favor of proposals for an independent chairman or, if the chairman is not independent, in favor of a lead independent director. |
| | • | | The Board supports annual election of all directors and proposals to eliminate classes of directors. |
| | • | | In a routine election of directors, the Board will generally vote with management’s recommendations because the Board believes that management and nominating committees of independent directors are in the best position to know what qualifications are required of directors to form an effective board. However, the Board will generally vote against a nominee who has been assigned to the audit, compensation, or nominating committee if the nominee is not independent of management based on established criteria. The Board will also withhold support for any director who fails to attend 75% of meetings or has other activities that appear to interfere with his or her ability to commit sufficient attention to the company and, in general, will vote against nominees who are determined to have been involved in options backdating. |
| | • | | The Board generally supports proposals requiring director nominees to receive a majority of affirmative votes cast in order to be elected to the board, and opposes cumulative voting based on the view that each director elected should represent the interests of all shareholders. |
| | • | | Votes in a contested election of directors are evaluated on a case-by-case basis. In general, the Board believes that incumbent management and nominating committees, with access to more and better information, are in the best position to make strategic business decisions. However, the Board will consider an opposing slate if it makes a compelling business case for leading the company in a new direction. |
Shareholder Rights Plans — The Board generally supports shareholder rights plans based on a belief that such plans force uninvited bidders to negotiate with a company’s board. The Board believes these negotiations allow time for the company to maximize value for shareholders by forcing a higher premium from a bidder, attracting a better bid from a competing bidder or allowing the company to pursue its own strategy for enhancing shareholder value. The Board supports proposals to submit shareholder rights plans to shareholders and supports limiting the vote required for approval of such plans to a majority of the votes cast.
Auditors — The Board values the independence of auditors based on established criteria. The Board supports a reasonable review of matters that may raise concerns regarding an auditor’s service that may cause the Board to vote against a management recommendation, including, for example, auditor involvement in significant financial restatements, options backdating, material weaknesses in control, attempts to limit auditor liability or situations where independence has been compromised.
Stock Option Plans and Other Management Compensation Issues — The Board expects company management to give thoughtful consideration to providing competitive long-term employee incentives directly tied to the interest of shareholders. The Board votes against proxy proposals that it believes dilute shareholder value excessively.
The Board believes that equity compensation awards can be a useful tool, when not abused, for retaining employees and giving them incentives to engage in conduct that will improve the performance of the company. In this regard, the Board generally favors minimum holding periods of stock obtained by senior management pursuant to an option plan and will vote against compensation plans for executives that it deems excessive.
79
Social and Corporate Policy Issues — The Board believes proxy proposals should address the business interests of the corporation. Shareholder proposals sometime seek to have the company disclose or amend certain business practices based purely on social or environmental issues rather than compelling business arguments. In general, the Board recognizes our fund shareholders are likely to have differing views of social and environmental issues and believes that these matters are primarily the responsibility of a company’s management and its board of directors.
POLICIES AND PROCEDURES
The policy of the Board is to vote all proxies of the companies in which a fund holds investments. Because of the volume and complexity of the proxy voting process, including inherent inefficiencies in the process that are outside the control of the Board or the Proxy Team (as defined below), not all proxies may be voted. The Board has implemented policies and procedures that have been reasonably designed to vote proxies and to ensure that there are no conflicts between interests of a fund’s shareholders and those of the funds’ principal underwriters, Columbia Management, or other affiliated persons. In exercising its proxy voting responsibilities, the Board may rely upon the research or recommendations of one or more third party service providers.
The administration of the proxy voting process is handled by the Columbia Management Proxy Administration Team (“Proxy Team”). In exercising its responsibilities, the Proxy Team may rely upon one or more third party service providers. The Proxy Team assists the Board in identifying situations where its guidelines do not clearly require a vote in a particular manner and assists in researching matters and making voting recommendations. Columbia Management may recommend that a proxy be voted in a manner contrary to the Board’s guidelines. In making recommendations to the Board about voting on a proposal, the investment manager relies on its own investment personnel (or the investment personnel of a fund’s subadviser(s)) and information obtained from an independent research firm. The investment manager makes the recommendation in writing. The process requires that Board members who are independent from the investment manager consider the recommendation and decide how to vote the proxy proposal or establish a protocol for voting the proposal.
On an annual basis, or more frequently as determined necessary, the Board reviews recommendations to revise the existing guidelines or add new guidelines. Recommendations are based on, among other things, industry trends and the frequency that similar proposals appear on company ballots.
The Board considers management’s recommendations as set out in the company’s proxy statement. In each instance in which a fund votes against management’s recommendation (except when withholding votes from a nominated director), the Board sends a letter to senior management of the company explaining the basis for its vote. This permits both the company’s management and the Board to have an opportunity to gain better insight into issues presented by the proxy proposal(s).
Voting in Countries Outside the United States (Non-U.S. Countries) — Voting proxies for companies not domiciled in the United States may involve greater effort and cost due to the variety of regulatory schemes and corporate practices. For example, certain non-U.S. countries require securities to be blocked prior to a vote, which means that the securities to be voted may not be traded within a specified number of days before the shareholder meeting. The Board typically will not vote securities in non-U.S. countries that require securities to be blocked as the need for liquidity of the securities in the funds will typically outweigh the benefit of voting. There may be additional costs associated with voting in non-U.S. countries such that the Board may determine that the cost of voting outweighs the potential benefit.
Securities on Loan — The Board will generally refrain from recalling securities on loan based upon its determination that the costs and lost revenue to the funds, combined with the administrative effects of recalling the securities, generally outweigh the benefit of voting the proxy. While neither the Board nor the funds’ administrator assesses the economic impact and benefits of voting loaned securities on a case-by-case basis, situations may arise where the Board requests that loaned securities be recalled in order to vote a proxy. In this regard, if a proxy relates to matters that may impact the nature of a company, such as a proposed merger or acquisition, and the funds’ ownership position is more significant, the Board has established a guideline to direct the funds’ administrator to use its best efforts to recall such securities based upon its determination that, in these situations, the benefits of voting such proxies generally outweigh the costs or lost revenue to the funds, or any potential adverse administrative effects to the funds, of not recalling such securities.
Investment in Affiliated Funds — Certain funds may invest in shares of other funds in the Fund Family (referred to in this context as “underlying funds”) and may own substantial portions of these underlying funds. The proxy policy of the funds is to ensure that direct public shareholders of underlying funds control the outcome of any shareholder vote. To help manage this potential conflict of interest, recognizing that the direct public shareholders of these underlying funds may represent only a minority interest, the policy of the funds is to vote proxies of the underlying funds in the same proportion as the vote of the direct public shareholders. If there are no direct public shareholders of an underlying fund, the policy is to cast votes in accordance with instructions from the independent members of the Board.
80
OBTAIN A PROXY VOTING RECORD
Each year the funds file their proxy voting records with the SEC and make them available by August 31 for the 12-month period ending June 30 of that year. The records can be obtained without charge through riversource.com/funds or searching the website of the SEC at www.sec.gov.
Investing in a Fund
The Columbia funds and Columbia Acorn funds and portfolios are collectively referred to as the Legacy Columbia funds (see Appendix E). The RiverSource funds (including the Seligman and Threadneedle branded funds) are collectively referred to as the Legacy RiverSource funds (see Appendix F).
SALES CHARGE
Investors should understand that the purpose and function of the initial sales charge and distribution fee for Class A shares is the same as the purpose and function of the contingent deferred sales charge (“CDSC”) and distribution fee for Class B and Class C shares. The sales charges and distribution fees applicable to each class pay for the distribution of shares of a fund.
Shares of a fund are sold at the class’ public offering price. For funds other than money market funds and, as noted below in Table 9, certain other funds, the public offering price for Class A shares is the NAV of one share adjusted for the sales charge applicable to the class. For money market funds and, as noted below in Table 9, certain other funds, the public offering price is the NAV. For all funds, for Class B, Class C, Class I, Class R, Class R3, Class R4, Class R5, Class W and Class Z there is no initial sales charge so the public offering price is the same as the NAV.
Class A – Calculation of the Sales Charge
Sales charges are determined as shown in the following tables. The table is organized by investment category. You can find your fund’s investment category in Table 1.
Table 9. Class A Initial Sales Charge
| | | | | | | | | | |
| | | Class A Shares – Front-End Sales Charge – Breakpoint Schedule | |
| | | | | | Sales charge(a) as a percentage of: | |
Fund category | | Total market value | | | Public offering
price(b) | | | Net amount
invested | |
| | $ | 0 –$49,999 | | | 5.75 | % | | 6.10 | % |
| | $ | 50,000 –$99,999 | | | 4.50 | % | | 4.71 | % |
| | $ | 100,000 –$249,999 | | | 3.50 | % | | 3.63 | % |
Balanced, Equity, Fund-of-funds – equity* | | $ | 250,000 –$499,999 | | | 2.50 | % | | 2.56 | % |
| | $ | 500,000 –$999,999 | | | 2.00 | % | | 2.04 | % |
| | $ | 1,000,000 or more | (c),(d) | | 0.00 | % | | 0.00 | % |
| | $ | 0 – $49,999 | | | 4.75 | % | | 4.99 | % |
| | $ | 50,000 – $99,999 | | | 4.25 | % | | 4.44 | % |
Fund-of-funds – fixed income, State tax- | | $ | 100,000 –$249,999 | | | 3.50 | % | | 3.63 | % |
exempt fixed income, Taxable fixed | | $ | 250,000 –$499,999 | | | 2.50 | % | | 2.56 | % |
income, Tax-exempt fixed income | | $ | 500,000 –$999,999 | | | 2.00 | % | | 2.04 | % |
| | $ | 1,000,000 or more | (c),(d) | | 0.00 | % | | 0.00 | % |
For Columbia Absolute Return Currency | | $ | 0 – $99,999 | | | 3.00 | % | | 3.09 | % |
and Income Fund, Columbia Floating Rate | | $ | 100,000 –$249,999 | | | 2.50 | % | | 2.56 | % |
Fund, Columbia Inflation Protected | | $ | 250,000 –$499,999 | | | 2.00 | % | | 2.04 | % |
Securities Fund, Columbia Limited | | $ | 500,000 –$999,999 | | | 1.50 | % | | 1.52 | % |
Duration Credit Fund, RiverSource | | | | | | | | | | |
Intermediate Tax-Exempt Fund and | | | | | | | | | | |
RiverSource Short Duration U.S. | | $ | 1,000,000 or more | (c),(d) | | 0.00 | % | | 0.00 | % |
Government Fund | | | | | | | | | | |
| * | RiverSource S&P 500 Index Fund is not subject to a front-end sales change on Class A shares. |
81
| (a) | Because the offering price is calculated to two decimal places, the dollar amount of the sales charge as a percentage of the offering price and your net amount invested for any particular purchase of fund shares may be higher or lower depending on whether downward or upward rounding was required during the calculation process. |
| (b) | Purchase price includes the sales charge. |
| (c) | Although there is no sales charge for purchases with a total market value of $1 million or more, and therefore no re-allowance, the distributor may pay a selling and/or servicing agent the following out of its own resources: 1.00% on purchases from $1 million up to but not including $3 million; 0.50% on purchases of $3 million up to but not including $50 million; and 0.25% on amounts of $50 million or more. The distributor may be reimbursed if a CDSC is deducted when the shares are redeemed. |
| (d) | For eligible employee benefit plans, selling and/or servicing agents are eligible to receive from the distributor the following sales commissions on purchases that are coded as commission eligible trades: 1.00% on all purchases up to but not including $3 million, including those in amounts of less than $1 million; up to 0.50% on all purchases of $3 million up to but not including $50 million; and up to 0.25% on all purchases of $50 million or more. |
Using the sales charge schedule in the table above, for Class A, the public offering price for an investment of less than $50,000, made on the last day of the most recent fiscal period, was determined as shown in the following table. The sales charge is paid to the distributor by the person buying the shares. The table is organized by fiscal year end. You can find your fund’s fiscal year end in Table 1.
Table 10. Public Offering Price
| | | | | | | | |
Fund | | Net asset
value | | 1.0 minus maximum
sales charge | | Public offering price |
For funds with fiscal period ending January 31 | | | | | | | | |
Columbia Income Builder Fund | | $ | 9.76 | | 0.9525 | | $ | 10.25 |
Columbia Income Builder Fund II | | | 9.47 | | 0.9525 | | | 9.94 |
Columbia Income Builder Fund III | | | 9.44 | | 0.9525 | | | 9.91 |
Columbia Portfolio Builder Aggressive | | | 8.62 | | 0.9425 | | | 9.15 |
Columbia Portfolio Builder Conservative | | | 9.77 | | 0.9525 | | | 10.26 |
Columbia Portfolio Builder Moderate | | | 9.46 | | 0.9425 | | | 10.04 |
Columbia Portfolio Builder Moderate Aggressive | | | 9.03 | | 0.9425 | | | 9.58 |
Columbia Portfolio Builder Moderate Conservative | | | 9.61 | | 0.9525 | | | 10.09 |
Columbia Portfolio Builder Total Equity | | | 8.20 | | 0.9425 | | | 8.70 |
RiverSource S&P 500 Index (for Class D, now known as Class A) | | | 3.55 | | No sales charge | | | 3.55 |
RiverSource Small Company Index | | | 3.90 | | 0.9425 | | | 4.14 |
For funds with fiscal period ending March 31 | | | | | | | | |
Columbia Equity Value | | | 9.63 | | 0.9425 | | | 10.22 |
RiverSource Precious Metals and Mining | | | 12.22 | | 0.9425 | | | 12.97 |
For funds with fiscal period ending April 30 | | | | | | | | |
Columbia 120/20 Contrarian Equity | | | 15.27 | | 0.9425 | | | 16.20 |
Columbia Recovery and Infrastructure | | | 19.66 | | 0.9425 | | | 20.86 |
Columbia Retirement Plus 2010 | | | 8.53 | | 0.9425 | | | 9.05 |
Columbia Retirement Plus 2015 | | | 8.53 | | 0.9425 | | | 9.05 |
Columbia Retirement Plus 2020 | | | 8.06 | | 0.9425 | | | 8.55 |
Columbia Retirement Plus 2025 | | | 8.06 | | 0.9425 | | | 8.55 |
Columbia Retirement Plus 2030 | | | 8.08 | | 0.9425 | | | 8.57 |
Columbia Retirement Plus 2035 | | | 7.99 | | 0.9425 | | | 8.48 |
Columbia Retirement Plus 2040 | | | 7.77 | | 0.9425 | | | 8.24 |
Columbia Retirement Plus 2045 | | | 7.93 | | 0.9425 | | | 8.41 |
For funds with fiscal period ending May 31 | | | | | | | | |
Columbia High Yield Bond | | | 2.61 | | 0.9525 | | | 2.74 |
Columbia Multi-Advisor Small Cap Value | | | 4.91 | | 0.9425 | | | 5.21 |
Columbia U.S. Government Mortgage | | | 5.16 | | 0.9525 | | | 5.42 |
RiverSource Partners Fundamental Value | | | 4.36 | | 0.9425 | | | 4.63 |
RiverSource Short Duration U.S. Government | | | 4.75 | | 0.9700 | | | 4.90 |
82
| | | | | | |
For funds with fiscal period ending June 30 | | | | | | |
Columbia Dividend Opportunity | | 6.31 | | 0.9425 | | 6.69 |
RiverSource Real Estate | | 9.23 | | 0.9425 | | 9.79 |
For funds with fiscal period ending July 31 | | | | | | |
Columbia Floating Rate | | 8.54 | | 0.9700 | | 8.80 |
Columbia Income Opportunities | | 9.72 | | 0.9525 | | 10.20 |
Columbia Inflation Protected Securities | | 10.36 | | 0.9700 | | 10.68 |
Columbia Large Core Quantitative | | 4.74 | | 0.9425 | | 5.03 |
Columbia Limited Duration Credit | | 9.94 | | 0.9700 | | 10.25 |
Columbia Money Market | | 1.00 | | No sales charge | | 1.00 |
RiverSource Disciplined Small and Mid Cap Equity | | 7.41 | | 0.9425 | | 7.86 |
RiverSource Disciplined Small Cap Value | | 7.89 | | 0.9425 | | 8.37 |
For funds with fiscal period ending August 31 | | | | | | |
Columbia Diversified Bond | | 4.75 | | 0.9525 | | 4.99 |
Columbia Minnesota Tax-Exempt | | 5.16 | | 0.9525 | | 5.42 |
RiverSource California Tax-Exempt | | 4.85 | | 0.9525 | | 5.09 |
RiverSource New York Tax-Exempt | | 4.86 | | 0.9525 | | 5.10 |
For funds with fiscal period ending September 30 | | | | | | |
Columbia Diversified Equity Income | | 8.31 | | 0.9425 | | 8.82 |
Columbia Large Growth Quantitative | | 7.50 | | 0.9425 | | 7.96 |
Columbia Large Value Quantitative | | 7.78 | | 0.9425 | | 8.25 |
Columbia Mid Cap Value Opportunity | | 6.15 | | 0.9425 | | 6.53 |
Columbia Strategic Allocation | | 8.44 | | 0.9425 | | 8.95 |
RiverSource Balanced | | 8.79 | | 0.9425 | | 9.33 |
RiverSource Strategic Income Allocation | | 9.60 | | 0.9525 | | 10.08 |
Seligman California Municipal High-Yield | | 6.69 | | 0.9525 | | 7.02 |
Seligman California Municipal Quality | | 6.69 | | 0.9525 | | 7.02 |
Seligman Minnesota Municipal | | 7.79 | | 0.9525 | | 8.18 |
Seligman National Municipal | | 8.12 | | 0.9525 | | 8.52 |
Seligman New York Municipal | | 8.32 | | 0.9525 | | 8.73 |
Seligman TargETFund 2015 | | 6.63 | | 0.9425 | | 7.03 |
Seligman TargETFund 2025 | | 6.84 | | 0.9425 | | 7.26 |
Seligman TargETFund 2035 | | 7.09 | | 0.9425 | | 7.52 |
Seligman TargETFund 2045 | | 7.06 | | 0.9425 | | 7.49 |
Seligman TargETFund Core | | 6.44 | | 0.9425 | | 6.83 |
For funds with fiscal period ending October 31 | | | | | | |
Columbia Absolute Return Currency and Income | | 9.93 | | 0.9700 | | 10.24 |
Columbia Asia Pacific ex-Japan (for Class R5) | | 11.42 | | N/A | | N/A |
Columbia Emerging Markets Bond | | 10.35 | | 0.9525 | | 10.87 |
Columbia Emerging Markets Opportunity | | 7.74 | | 0.9425 | | 8.21 |
Columbia European Equity | | 4.86 | | 0.9425 | | 5.16 |
Columbia Frontier | | 8.21 | | 0.9425 | | 8.71 |
Columbia Global Bond | | 7.10 | | 0.9525 | | 7.45 |
Columbia Global Equity | | 6.13 | | 0.9425 | | 6.50 |
Columbia Global Extended Alpha | | 17.65 | | 0.9425 | | 18.73 |
Columbia Multi-Advisor International Value | | 5.67 | | 0.9425 | | 6.02 |
Columbia Seligman Global Technology | | 16.50 | | 0.9425 | | 17.51 |
RiverSource Disciplined International Equity | | 6.98 | | 0.9425 | | 7.41 |
RiverSource Partners International Select Growth | | 5.80 | | 0.9425 | | 6.15 |
RiverSource Partners International Small Cap | | 5.08 | | 0.9425 | | 5.39 |
Threadneedle Global Equity Income | | 8.49 | | 0.9425 | | 9.01 |
Threadneedle International Opportunity | | 7.70 | | 0.9425 | | 8.17 |
For funds with fiscal period ending November 30 | | | | | | |
Columbia AMT-Free Tax-Exempt Bond | | 3.72 | | 0.9525 | | 3.91 |
Columbia Mid Cap Growth Opportunity | | 8.58 | | 0.9425 | | 9.10 |
RiverSource Intermediate Tax-Exempt | | 5.26 | | 0.9700 | | 5.42 |
RiverSource Tax-Exempt High Income | | 4.19 | | 0.9525 | | 4.40 |
For funds with fiscal period ending December 31 | | | | | | |
Columbia Government Money Market | | 1.00 | | No sales charge | | 1.00 |
Columbia Select Large-Cap Value | | 12.31 | | 0.9425 | | 13.06 |
83
| | | | | | |
Columbia Select Smaller-Cap Value | | 12.59 | | 0.9425 | | 13.36 |
Columbia Seligman Communications and Information | | 38.78 | | 0.9425 | | 41.15 |
RiverSource LaSalle Global Real Estate | | 3.49 | | 0.9425 | | 3.70 |
RiverSource LaSalle Monthly Dividend Real Estate | | 3.62 | | 0.9425 | | 3.84 |
Seligman Capital | | 20.09 | | 0.9425 | | 21.32 |
Seligman Growth | | 4.07 | | 0.9425 | | 4.32 |
Class A — Statement or Letter of Intent (LOI)
If you intend to invest $50,000 or more over a period of time, you may be able to reduce the sales charge you pay on investments in Class A, Class E or Class T shares by completing a LOI form and committing to invest a certain amount. The LOI must be filed with and accepted in good order by the distributor of the funds. You will have up to 13 months from the date of your LOI to fulfill your commitment. Existing Rights of Accumulation (ROA) can be included for purposes of meeting your commitment under the LOI. For example, a shareholder currently has $60,000 ROA in the funds. Shareholder completes an LOI to invest $100,000 in the funds (ROA eligible accounts). Shareholder only needs to invest an additional $40,000 in the funds’ Class A shares over the next 13 months in order to fulfill the LOI commitment, during which time the shareholder receives reduced front-end sales charge(s) on investments. Your investments during this 13-month period will be charged the sales charge that applies to the amount you have committed to invest under the LOI. A portion of your commitment will be invested in Class A, Class E or Class T shares, as the case may be, and placed in escrow. At the end of the 13-month period, the LOI will end and the shares will be released from escrow (less any amount necessary to pay sales charges to the extent the LOI commitment was not met, as described below). Once the LOI has ended or your investments entitle you to a lower sale charge than would otherwise be available to you under the LOI, future sales charges will be determined by Rights of Accumulation (ROA) as described in the prospectus. If you do not invest the commitment amount by the end of the 13-month period, the remaining unpaid sales charge will be redeemed from the escrowed shares and the remaining balance released from escrow. For purposes of making an LOI to purchase additional shares, you may aggregate your ownership of different classes of shares, except Class I, Class R, Class R3, Class R4, Class R5 and Class Y shares. For example, if your LOI commits you to purchases Class A shares, the commitment amount does not include purchases in these classes of shares; does not include any new reinvested dividends and directed dividends earned in any funds during the 13-month period; and purchases of money market funds unless they are subsequently exchanged for shares of a non-money market fund (other than Class I, Class R, Class R3, Class R4, Class R5 and Class Y shares of such non-money market fund) within the 13-month period. A LOI is not an option (absolute right) to buy shares. If you purchase shares through different channels, for example, in a brokerage account or through a third party, you must inform your financial intermediary in writing about the LOI when placing any purchase orders during the period of the LOI. If you do not complete and file the LOI form, or do not request the reduced sales charge at the time of purchase, you will not be eligible for the reduced sales charge.
Class A Shares
Class A shares may be sold at net asset value to certain persons since such sales require less sales effort and lower sales-related expenses as compared with sales to the general public. If you are eligible to purchase Class A shares without a sales charge, you should inform your financial advisor, selling and/or servicing agent or the fund’s transfer agent of such eligibility and be prepared to provide proof thereof. For Class A shares purchased without a sales charge where a commission was separately paid by the distributor to a selling and/or servicing agent effecting the purchase, a CDSC may be charged if you sell your shares within, except as provided below, 18 months after purchase, charged as follows: a 1.00% CDSC if redeemed within 12 months of purchase, and 0.50% CDSC if redeemed more than 12, but less than 18, months after purchase. A CDSC is based on the original purchase cost or the current market value of the shares being sold, whichever is less.
Initial Sales Charge — Waivers of the sales charge for Class A shares. Sales charges do not apply to:
| | • | | shareholders whose original purchase was in a Strategist fund merged into a RiverSource fund in 2000. |
| | • | | participants of “eligible employee benefit plans” including 403(b) plans for which Ameriprise Financial Services, Inc. (Ameriprise Financial Services) serves as broker-dealer, and the school district or group received a written proposal from Ameriprise Financial Services between November 1, 2007 and Dec. 31, 2008 (each a Qualifying 403(b) Plan). In order for participants in one of these 403(b) plans to receive this waiver, at least one participant account of the 403(b) plan must have been funded at Ameriprise Financial Services prior to Dec. 31, 2009. This waiver may be discontinued for any Qualifying 403(b) Plan, in the sole discretion of the distributor, after Dec. 31, 2009. |
84
| | • | | to separate accounts established and maintained by an insurance company which are exempt from registration under Section 3(c)(11) of the 1940 Act. |
| | • | | plans that (i) own Class B shares of any Seligman fund and (ii) participate in Seligman Growth 401(k) through Ascensus’s (formerly BISYS) third party administration platform may, with new contributions, purchase Class A shares at net asset value. Class A shares purchased at net asset value on or prior to Sept. 3, 2010 are subject to a CDSC on shares purchased within 18 months prior to plan termination, charged as follows: 1.00% CDSC if redeemed within 12 months of purchase, and 0.50% CDSC if redeemed more than 12, but less than 18, months after purchase. |
| | • | | to participants in retirement and deferred compensation plans and trusts used to fund those plans, including but not limited to, those defined in Sections 401(a), 401(k), 403(b) or 457 of the Internal Revenue Code and “rabbi trusts” for which Charles Schwab & Co., Inc. acts as broker dealer. |
| | • | | to participants in plans established at the transfer agent (Seligman funds only) prior to January 7, 2008, the plan had $500,000 or 50 participants when the shares were initially purchased. |
| | • | | to participants in retirement and benefit plans made through financial intermediaries that perform participant recordkeeping or other administrative services for the plans and that have entered into special arrangements as alliance program partners with the funds and/or the distributor specifically for such purchases. |
| | • | | to other funds pursuant to a “fund-of-funds” arrangement provided that the fund is distributed by the distributor. |
| | • | | any shareholder who owned shares of any fund of Columbia Acorn Trust (formerly named Liberty Acorn Trust) on September 29, 2000 (when all of the then outstanding shares of Columbia Acorn Trust were re-designated Class Z shares) and who since that time remained a shareholder of any Fund, may buy Class A shares of any Fund without paying a front-end sales charge in those cases when Class Z shares is not available. |
| | • | | Galaxy Fund shareholders prior to December 1, 1995; and shareholders who (i) bought Galaxy Fund Prime A shares without paying a front-end sales charge and received Class A shares in exchange for those shares during the Galaxy/Liberty Fund reorganization; and (ii) continue to maintain the account in which the Prime A shares were originally bought. |
Initial Sales Charge — Waivers of the sales charge for Class T shares.
| | • | | (For Class T shares only) Shareholders who (i) bought Galaxy Fund Retail A shares at net asset value and received Class T shares in exchanges for those shares during the Galaxy/Liberty Fund reorganization; and (ii) continue to maintain the account in which the Retail A shares were originally bought; and Boston 1784 Fund shareholders on the date those funds were reorganized into Galaxy Funds. |
CDSC — Waivers of the CDSC for Class A, Class C, Class E, and Class T shares. The CDSC will be waived on sales of Class A, Class C, Class E, and Class T shares:
| | • | | in connection with participation in the Merrill Lynch Small Market 401(k) Program, retirement programs administered or serviced by the Princeton Retirement Group, Paychex, ADP Retirement Services, Hartford Securities Distribution Company, Inc. or NYLIM Service Company LLC, retirement programs or accounts administered or serviced by Mercer HR Services, LLC or its affiliates, or retirement programs or accounts administered or serviced by firms that have a written agreement with the distributor that contemplates a waiver of CDSCs, provided that no sales commission or transaction fee was paid to such authorized financial institution at the time of purchase. |
The CDSC will be waived on sales of Class A, Class B and Class C shares of a Legacy Columbia fund purchased prior to September 7, 2010:
| | • | | after the sole shareholder on an individual account or a joint tenant on a joint tenant account becomes disabled (as defined by Section 72(m)(7) of the Internal Revenue Code). To be eligible for such a waiver: (i) the disability must arise after the account is opened and (ii) a letter from a physician must be signed under penalty of perjury stating the nature of the disability. If the account is transferred to a new registration and then shares are sold, the applicable CDSC will be charged.* |
85
| | • | | by health savings accounts sponsored by third party platforms, including those sponsored by affiliates of Bank of America.* |
| | • | | for the following purposes (i) to make medical payments that exceed 7.5% of income and (ii) to pay for insurance by an individual who has separated from employment and who has received unemployment compensation under a federal or state program for at least twelve weeks.* |
| | • | | pursuant to the Fund’s Systematic Withdrawal Plan established with the Transfer Agent, to the extent that the sales do not exceed, on an annual basis, 12% of the account’s value as long as distributions are reinvested. Otherwise, a CDSC will be charged on sales through the Fund’s Systematic Withdrawal Plan until this requirement is met. |
| | • | | in connection with distributions from qualified retirement plans, government (Section 457) plans, individual retirement accounts or custodial accounts under Section 403(b)(7) of the Internal Revenue Code following normal retirement or the attainment of age 591/2.** |
| | • | | in connection with loans from qualified retirement plans to shareholders.* |
| * | Fund investors and selling and/or servicing agents must inform the fund or the transfer agent in writing that the fund investor qualifies for the particular sales charge waiver and provide proof thereof. |
| ** | For direct trades on non-prototype retirement accounts where the date of birth of the fund shareholder is not maintained, the shareholder or selling and/or servicing agent must inform the fund or the transfer agent in writing that the Fund investor qualifies for the particular sales charge waiver and provide proof thereof. |
Class B Shares — Closed
The funds no longer accept investments from new or existing investors in Class B shares, except for certain limited transactions involving existing investors in Class B shares as described in more detail in the fund’s prospectus.
Class B shares have a CDSC. For purposes of calculating the CDSC on shares of a fund purchased after the close of business on Sept. 3, 2010, the start of the holding period is the first day of the month in which your purchase was made. For purposes of calculating the CDSC on shares of a Legacy RiverSource fund purchased on or before the close of business on Sept. 3, 2010, the start of the holding period is the date your purchase was made. When you place an order to sell your Class B shares, the fund will first redeem any shares that aren’t subject to a CDSC, followed by those you have held the longest. This means that if a CDSC is imposed, you cannot designate the individual shares being redeemed for federal income tax purposes. You should consult your tax advisor about the tax consequences of investing in the funds.
CDSC — Waivers of the CDSC for Class B shares. The CDSC will be waived on sales of shares:
| | • | | in connection with participation in the Merrill Lynch Small Market 401(k) Program, retirement programs administered or serviced by the Princeton Retirement Group, Paychex, ADP Retirement Services, Hartford Securities Distribution Company, Inc. or NYLIM Service Company LLC, retirement programs or accounts administered or serviced by Mercer HR Services, LLC or its affiliates, or retirement programs or accounts administered or serviced by firms that have a written agreement with the distributor that contemplates a waiver of CDSCs, provided that no sales commission or transaction fee was paid to such authorized financial institution at the time of purchase. |
| | • | | of Legacy RiverSource funds held in investment-only accounts (i.e. accounts where Ameriprise Trust Company does not act as the custodian) at Ameriprise Financial Services on behalf of a trust for an employee benefit plan. |
| | • | | of Legacy RiverSource funds held in IRAs or certain qualified plans, on or prior to June 12, 2009, such as Keogh plans, tax-sheltered custodial accounts or corporate pension plans where Ameriprise Trust Company is acting as custodian, provided that the shareholder is: |
| | • | | at least 59 1/2 years old and taking a retirement distribution (if the sale is part of a transfer to an IRA or qualified plan, or a custodian-to-custodian transfer, the CDSC will not be waived)*, or |
| | • | | selling under an approved substantially equal periodic payment arrangement. |
86
| | • | | of sales of Class B shares of Legacy RiverSource funds purchased prior to Sept. 7, 2010 sold under an approved substantially equal periodic payment arrangement (applies to retirement accounts when a shareholder sets up an arrangement with the Internal Revenue Service).** |
| * | You must notify the fund or the transfer agent prior to redeeming shares of the applicability of the CDSC waiver, but final decision of the applicability of the CDSC waiver is contingent on approval of the fund or the transfer agent. |
| ** | Fund investors and selling and/or servicing agents must inform the fund or the transfer agent in writing that the fund investor qualifies for the particular sales charge waiver and provide proof thereof. |
Class C Shares
Class C shares are available to all investors. Class C shares are sold without a front-end sales charge. For Class C shares, a 1% CDSC may apply if shares are sold within one year after purchase. Class C shares are subject to a distribution fee.
Class I Shares
Class I shares are only available to the funds. Class I shares are sold without a front-end sales charge or CDSC.
Class R, Class R3, Class R4 and Class R5 Shares
Class R, Class R3, Class R4 and Class R5 shares are offered to certain institutional investors identified in the fund’s prospectus. Class R, Class R3, Class R4 and Class R5 shares are sold without a front-end sales charge or a CDSC. Class R and Class R3 shares are subject to a distribution fee (for Class R shares of a Legacy RiverSource fund, a portion of such fee may be paid for shareholder services). Class R3 and R4 shares are subject to a plan administration fee (which is not a 12b-1 related free). The following investors are eligible to purchase Class R, Class R3, Class R4 and Class R5 shares:
Class R Shares (formerly Class R2 shares)
Class R shares are available to eligible health savings accounts sponsored by third party platforms, including those sponsored by affiliates of Ameriprise Financial, and the following eligible retirement plans:
| | • | | 401(k) plans; 457 plans; |
| | • | | employer-sponsored 403(b) plans; |
| | • | | profit sharing and money purchase pension plans; |
| | • | | defined benefit plans; and |
| | • | | non-qualified deferred compensation plans. |
Class R shares are not available for investment through retail nonretirement accounts, traditional and Roth IRAs, Coverdell Education Savings Accounts, SEPs, SAR-SEPs, Simple IRAs, individual 403(b) plans or 529 tuition programs. Contact the funds or your retirement plan or health savings account administrator for more information about investing in Class R shares.
Class R3, Class R4 and Class R5 Shares
Class R3, Class R4 and Class R5 shares will be closed to new investors as of the close of business on Dec. 31, 2010.
Class R3, Class R4 and Class R5 are available to:
| | • | | Qualified employee benefit plans; |
87
| | • | | Trust companies or similar institutions, and charitable organizations that meet the definition in Section 501(c)(3) of the Internal Revenue Code; |
| | • | | Nonqualified deferred compensation plans; |
| | • | | State sponsored college savings plans established under Section 529 of the Internal Revenue Code; and |
| | • | | Health Savings Accounts (HSAs) created pursuant to public law 108-173. |
Additionally, the following eligible investors may purchase Class R5 shares:
| | • | | Institutional or corporate accounts above a threshold established by the distributor (currently $1 million per fund or $10 million in all funds); and |
Class W Shares
Class W shares are offered to qualifying discretionary accounts. Class W shares are sold without a front-end sales charge or CDSC. Class W shares are subject to a distribution fee.
Class Z Shares
Class Z shares are sold without a front-end sales charge or a CDSC.
Class Z shares are available only to certain eligible investors, which are subject to different minimum initial investment requirements described in the prospectus and the SAI. In addition to the categories of Class Z investors described in the prospectus, the minimum initial investment in Class Z shares is as follows:
There is no minimum initial investment in Class Z shares for the following categories of eligible investors:
| | • | | Any health savings account sponsored by a third party platform, including those sponsored by affiliates of Bank of America |
The minimum initial investment in Class Z shares for the following categories of eligible investors is $2,000:
| | • | | Any client of Bank of America or one of its subsidiaries buying shares through an asset management company, trust, fiduciary, retirement plan administration or similar arrangement with Bank of America or the subsidiary. |
| | • | | Any employee (or family member of an employee) of Bank of America or one of its subsidiaries. |
In addition, for Class I, Class R, Class W and Class Z shares, the distributor, in its sole discretion, may accept investments from other purchasers not listed above.
FUND REORGANIZATIONS
Class A shares may be issued without an initial sales charge in connection with the acquisition of cash and securities owned by other investment companies. Any CDSC will be waived in connection with the redemption of shares of the fund if the fund is combined with another fund or in connection with a similar reorganization transaction.
REJECTION OF BUSINESS
Each fund and the distributor of the funds reserve the right to reject any business, in their sole discretion.
Selling Shares
You have a right to sell your shares at any time. For an explanation of sales procedures, please see the applicable prospectus.
88
During an emergency, the Board can suspend the computation of NAV, stop accepting payments for purchase of shares, or suspend the duty of a fund to redeem shares for more than seven days. Such emergency situations would occur if:
| | • | | The Exchange closes for reasons other than the usual weekend and holiday closings or trading on the Exchange is restricted, or |
| | • | | Disposal of a fund’s securities is not reasonably practicable or it is not reasonably practicable for the fund to determine the fair value of its net assets, or, |
| | • | | The SEC, under the provisions of the 1940 Act, declares a period of emergency to exist. |
Should a fund stop selling shares, the Board may make a deduction from the value of the assets held by the fund to cover the cost of future liquidations of the assets so as to distribute these costs fairly among all shareholders.
Each fund has elected to be governed by Rule 18f-1 under the 1940 Act, which obligates the fund to redeem shares in cash, with respect to any one shareholder during any 90-day period, up to the lesser of $250,000 or 1% of the net assets of the fund at the beginning of the period. Although redemptions in excess of this limitation would normally be paid in cash, the fund reserves the right to make these payments in whole or in part in securities or other assets in case of an emergency, or if the payment of a redemption in cash would be detrimental to the existing shareholders of the fund as determined by the Board. In these circumstances, the securities distributed would be valued as set forth in this SAI. Should a fund distribute securities, a shareholder may incur brokerage fees or other transaction costs in converting the securities to cash.
Pay-out Plans
You can use any of several pay-out plans to redeem your investment in regular installments. If you redeem shares, you may be subject to a contingent deferred sales charge as discussed in the prospectus. While the plans differ on how the pay-out is figured, they all are based on the redemption of your investment. Net investment income dividends and any capital gain distributions will automatically be reinvested, unless you elect to receive them in cash. If you redeem an IRA or a qualified retirement account, certain restrictions, federal tax penalties, and special federal income tax reporting requirements may apply. You should consult your tax advisor about this complex area of the tax law.
Applications for a systematic investment in a class of a fund subject to a sales charge normally will not be accepted while a pay-out plan for any of those funds is in effect. Occasional investments, however, may be accepted.
To start any of these plans, please consult your financial intermediary. Your authorization must be received at least five days before the date you want your payments to begin. Payments will be made on a monthly, bimonthly, quarterly, semiannual, or annual basis. Your choice is effective until you change or cancel it.
89
Capital Loss Carryover
For federal income tax purposes, certain funds had total capital loss carryovers at the end of the most recent fiscal period that, if not offset by subsequent capital gains, will expire as provided in the table below. Because the measurement periods for a regulated investment company’s income are different for excise tax purposes verses income tax purposes, special rules are in place to protect the amount of earnings and profits needed to support excise tax distributions. As a result, the funds are permitted to treat net capital losses realized between November 1 and its fiscal year end (“post-October loss”) as occurring on the first day of the following tax year. The total capital loss carryovers below include post-October losses, if applicable. It is unlikely that the Board will authorize a distribution of any net realized capital gains until the available capital loss carryover has been offset or has expired except as required by Internal Revenue Service rules. The table is organized by fiscal year end. You can find your fund’s fiscal year end in Table 1.
Table 11. Capital Loss Carryover
| | | | | | | | | | | | | | | | | | | | | | | | | | | | | | |
Fund | | Total
Capital Loss
Carryovers | | | | | | | | | | | | | | | | | | |
| | | Amount Expiring in |
| | | 2011 | | 2012 | | 2013 | | 2014 | | 2015 | | 2016 | | 2017 | | 2018 | | 2019 |
For funds with fiscal period ending January 31 | | | | | | | | | | | | | | | | | | | | | | | | | | | | | | |
Columbia Income Builder Fund | | $ | 19,447,298 | | $ | 0 | | $ | 0 | | $ | 0 | | $ | 0 | | $ | 0 | | $ | 0 | | $ | 2,942,103 | | $ | 15,861,057 | | $ | 644,138 |
Columbia Income Builder Fund II | | $ | 59,928,714 | | $ | 0 | | $ | 0 | | $ | 0 | | $ | 0 | | $ | 0 | | $ | 0 | | $ | 7,376,558 | | $ | 51,037,474 | | $ | 1,514,682 |
Columbia Income Builder Fund III | | $ | 37,439,030 | | $ | 0 | | $ | 0 | | $ | 0 | | $ | 0 | | $ | 0 | | $ | 0 | | $ | 5,920,892 | | $ | 31,518,138 | | $ | 0 |
Columbia Portfolio Builder Aggressive | | $ | 37,879,654 | | $ | 0 | | $ | 0 | | $ | 0 | | $ | 0 | | $ | 0 | | $ | 0 | | $ | 6,629,032 | | $ | 28,221,611 | | $ | 3,029,011 |
Columbia Portfolio Builder Conservative | | $ | 4,428,658 | | $ | 0 | | $ | 0 | | $ | 0 | | $ | 0 | | $ | 0 | | $ | 0 | | $ | 0 | | $ | 4,265,389 | | $ | 163,269 |
Columbia Portfolio Builder Moderate | | $ | 48,604,696 | | $ | 0 | | $ | 0 | | $ | 0 | | $ | 0 | | $ | 0 | | $ | 0 | | $ | 7,597,638 | | $ | 37,758,600 | | $ | 3,248,458 |
Columbia Portfolio Builder Moderate Aggressive | | $ | 68,142,574 | | $ | 0 | | $ | 0 | | $ | 0 | | $ | 0 | | $ | 0 | | $ | 0 | | $ | 4,898,399 | | $ | 57,879,727 | | $ | 5,364,448 |
Columbia Portfolio Builder Moderate Conservative | | $ | 17,455,318 | | $ | 0 | | $ | 0 | | $ | 0 | | $ | 0 | | $ | 0 | | $ | 0 | | $ | 1,062,939 | | $ | 15,811,121 | | $ | 581,258 |
Columbia Portfolio Builder Total Equity | | $ | 42,147,214 | | $ | 0 | | $ | 0 | | $ | 0 | | $ | 0 | | $ | 0 | | $ | 0 | | $ | 7,784,164 | | $ | 30,165,767 | | $ | 4,197,283 |
RiverSource S&P 500 Index | | $ | 4,733,437 | | $ | 0 | | $ | 0 | | $ | 1,980,165 | | $ | 235,890 | | $ | 66,065 | | $ | 0 | | $ | 0 | | $ | 2,105,466 | | $ | 345,851 |
RiverSource Small Company Index | | $ | 43,209,451 | | $ | 0 | | $ | 0 | | $ | 0 | | $ | 0 | | $ | 0 | | $ | 0 | | $ | 0 | | $ | 41,195,692 | | $ | 2,013,759 |
For funds with fiscal period ending March 31 | | | | | | | | | | | | | | | | | | | | | | | | | | | | | | |
Columbia Equity Value | | $ | 133,819,916 | | $ | 0 | | $ | 0 | | $ | 0 | | $ | 0 | | $ | 0 | | $ | 96,368 | | $ | 40,190,239 | | $ | 93,533,309 | | $ | 0 |
RiverSource Precious Metals and Mining | | $ | 14,911,599 | | $ | 0 | | $ | 0 | | $ | 0 | | $ | 0 | | $ | 0 | | $ | 0 | | $ | 14,911,599 | | $ | 0 | | $ | 0 |
For funds with fiscal period ending April 30 | | | | | | | | | | | | | | | | | | | | | | | | | | | | | | |
Columbia 120/20 Contrarian Equity | | $ | 11,229,719 | | $ | 0 | | $ | 0 | | $ | 0 | | $ | 0 | | $ | 0 | | $ | 0 | | $ | 3,090,734 | | $ | 8,138,985 | | $ | 0 |
Columbia Recovery and Infrastructure | | $ | 0 | | | — | | | — | | | — | | | — | | | — | | | — | | | — | | | — | | | — |
Columbia Retirement Plus 2010 | | $ | 3,454,336 | | $ | 0 | | $ | 0 | | $ | 0 | | $ | 0 | | $ | 0 | | $ | 0 | | $ | 428,181 | | $ | 2,827,856 | | $ | 198,299 |
Columbia Retirement Plus 2015 | | $ | 4,269,531 | | $ | 0 | | $ | 0 | | $ | 0 | | $ | 0 | | $ | 0 | | $ | 0 | | $ | 704,342 | | $ | 3,055,770 | | $ | 509,419 |
Columbia Retirement Plus 2020 | | $ | 5,656,636 | | $ | 0 | | $ | 0 | | $ | 0 | | $ | 0 | | $ | 0 | | $ | 0 | | $ | 502,050 | | $ | 4,705,880 | | $ | 448,706 |
Columbia Retirement Plus 2025 | | $ | 4,543,260 | | $ | 0 | | $ | 0 | | $ | 0 | | $ | 0 | | $ | 0 | | $ | 0 | | $ | 662,473 | | $ | 3,488,786 | | $ | 392,001 |
Columbia Retirement Plus 2030 | | $ | 4,050,556 | | $ | 0 | | $ | 0 | | $ | 0 | | $ | 0 | | $ | 0 | | $ | 0 | | $ | 623,603 | | $ | 2,895,797 | | $ | 531,156 |
Columbia Retirement Plus 2035 | | $ | 1,679,848 | | $ | 0 | | $ | 0 | | $ | 0 | | $ | 0 | | $ | 0 | | $ | 0 | | $ | 312,553 | | $ | 1,217,126 | | $ | 150,169 |
Columbia Retirement Plus 2040 | | $ | 955,784 | | $ | 0 | | $ | 0 | | $ | 0 | | $ | 0 | | $ | 0 | | $ | 0 | | $ | 370,260 | | $ | 565,348 | | $ | 20,176 |
Columbia Retirement Plus 2045 | | $ | 468,723 | | $ | 0 | | $ | 0 | | $ | 0 | | $ | 0 | | $ | 0 | | $ | 0 | | $ | 84,212 | | $ | 248,395 | | $ | 136,116 |
90
| | | | | | | | | | | | | | | | | | | | | | | | | | | | | | |
For funds with fiscal period ending May 31 |
Columbia High Yield Bond | | $ | 815,795,304 | | $ | 552,664,309 | | $ | 0 | | $ | 0 | | $ | 19,078,058 | | $ | 0 | | $ | 9,388,877 | | $ | 179,604,128 | | $ | 55,059,932 | | $ | 0 |
Columbia Multi-Advisor Small Cap Value | | $ | 66,320,839 | | $ | 0 | | $ | 0 | | $ | 0 | | $ | 0 | | $ | 0 | | $ | 0 | | $ | 20,926,946 | | $ | 45,393,893 | | $ | 0 |
Columbia U.S. Government Mortgage | | $ | 12,077,144 | | $ | 0 | | $ | 0 | | $ | 0 | | $ | 0 | | $ | 0 | | $ | 0 | | $ | 410,120 | | $ | 11,667,024 | | $ | 0 |
RiverSource Partners Fundamental Value | | $ | 113,804,431 | | $ | 0 | | $ | 0 | | $ | 0 | | $ | 0 | | $ | 0 | | $ | 0 | | $ | 26,053,833 | | $ | 82,755,092 | | $ | 4,995,506 |
RiverSource Short Duration U.S. Government | | $ | 93,995,687 | | $ | 0 | | $ | 1,261,719 | | $ | 38,180,597 | | $ | 22,499,962 | | $ | 9,579,187 | | $ | 0 | | $ | 3,846,817 | | $ | 18,627,405 | | $ | 0 |
For funds with fiscal period ending June 30 |
Columbia Dividend Opportunity | | $ | 573,711,900 | | $ | 343,927,468 | | $ | 0 | | $ | 0 | | $ | 0 | | $ | 0 | | $ | 0 | | $ | 36,972,874 | | $ | 165,774,622 | | $ | 27,036,936 |
RiverSource Real Estate | | $ | 45,007,629 | | $ | 0 | | $ | 0 | | $ | 0 | | $ | 0 | | $ | 0 | | $ | 0 | | $ | 1,114,883 | | $ | 43,892,746 | | $ | 0 |
For funds with fiscal period ending July 31 |
Columbia Floating Rate | | $ | 69,735,278 | | $ | 0 | | $ | 0 | | $ | 0 | | $ | 0 | | $ | 33,562 | | $ | 3,488,601 | | $ | 29,093,899 | | $ | 35,393,394 | | $ | 1,725,822 |
Columbia Income Opportunities | | $ | 0 | | $ | 0 | | $ | 0 | | $ | 0 | | $ | 0 | | $ | 0 | | $ | 0 | | $ | 0 | | $ | 0 | | $ | 0 |
Columbia Inflation Protected Securities | | $ | 17,202,378 | | $ | 0 | | $ | 0 | | $ | 0 | | $ | 0 | | $ | 0 | | $ | 0 | | $ | 8,424,851 | | $ | 8,777,527 | | $ | 0 |
Columbia Large Core Quantitative | | $ | 2,641,007,182 | | $ | 0 | | $ | 0 | | $ | 0 | | $ | 0 | | $ | 0 | | $ | 420,044,596 | | $ | 1,377,208,066 | | $ | 628,476,902 | | $ | 215,277,618 |
Columbia Limited Duration Credit | | $ | 9,271,761 | | $ | 0 | | $ | 0 | | $ | 0 | | $ | 0 | | $ | 2,206,552 | | $ | 0 | | $ | 825,807 | | $ | 4,896,866 | | $ | 1,342,536 |
Columbia Money Market | | $ | 0 | | $ | 0 | | $ | 0 | | $ | 0 | | $ | 0 | | $ | 0 | | $ | 0 | | $ | 0 | | $ | 0 | | $ | 0 |
RiverSource Disciplined Small and Mid Cap Equity | | $ | 7,615,730 | | $ | 0 | | $ | 0 | | $ | 0 | | $ | 0 | | $ | 0 | | $ | 0 | | $ | 7,615,730 | | $ | 0 | | $ | 0 |
RiverSource Disciplined Small Cap Value | | $ | 6,228,634 | | $ | 0 | | $ | 0 | | $ | 0 | | $ | 0 | | $ | 0 | | $ | 0 | | $ | 6,228,634 | | $ | 0 | | $ | 0 |
| | | | | | | | | | |
| | | | | 2010 | | 2011 | | 2012 | | 2013 | | 2014 | | 2015 | | 2016 | | 2017 | | 2018 |
For funds with fiscal period ending August 31 |
RiverSource California Tax-Exempt | | $ | 2,622,059 | | $ | 0 | | $ | 0 | | $ | 0 | | $ | 0 | | $ | 0 | | $ | 0 | | $ | 359,905 | | $ | 1,247,347 | | $ | 1,014,807 |
RiverSource Diversified Bond | | $ | 248,546,506 | | $ | 49,658,521 | | $ | 0 | | $ | 5,227,159 | | $ | 3,354,885 | | $ | 10,357,129 | | $ | 0 | | $ | 0 | | $ | 3,705,819 | | $ | 176,242,993 |
RiverSource Minnesota Tax-Exempt | | $ | 2,322,451 | | $ | 0 | | $ | 0 | | $ | 0 | | $ | 1,199,755 | | $ | 913,006 | | $ | 3,601 | | $ | 0 | | $ | 206,089 | | $ | 0 |
RiverSource New York Tax-Exempt | | $ | 897,923 | | $ | 0 | | $ | 0 | | $ | 0 | | $ | 0 | | $ | 0 | | $ | 0 | | $ | 3,664 | | $ | 341,015 | | $ | 553,244 |
For funds with fiscal period ending September 30 |
Columbia Diversified Equity Income | | $ | 1,110,095,393 | | $ | 0 | | $ | 0 | | $ | 0 | | $ | 0 | | $ | 0 | | $ | 0 | | $ | 0 | | $ | 46,346,713 | | $ | 1,063,748,680 |
Columbia Large Growth Quantitative | | $ | 41,243,744 | | $ | 0 | | $ | 0 | | $ | 0 | | $ | 0 | | $ | 0 | | $ | 0 | | $ | 0 | | $ | 14,271,533 | | $ | 26,972,211 |
Columbia Large Value Quantitative | | $ | 0 | | | — | | | — | | | — | | | — | | | — | | | — | | | — | | | — | | | — |
Columbia Mid Cap Value Opportunity | | $ | 566,727,070 | | $ | 0 | | $ | 0 | | $ | 0 | | $ | 0 | | $ | 0 | | $ | 0 | | $ | 0 | | $ | 47,902,744 | | $ | 518,824,326 |
Columbia Strategic Allocation | | $ | 346,850,712 | | $ | 0 | | $ | 0 | | $ | 0 | | $ | 0 | | $ | 0 | | $ | 0 | | $ | 0 | | $ | 21,514,298 | | $ | 325,336,414 |
RiverSource Balanced | | $ | 888,451,981 | | $ | 294,910,142 | | $ | 368,676,980 | | $ | 24,886,878 | | $ | 0 | | $ | 0 | | $ | 8,027,521 | | $ | 22,923,709 | | $ | 38,698,637 | | $ | 130,328,114 |
RiverSource Strategic Income Allocation | | $ | 11,336,901 | | $ | 0 | | $ | 0 | | $ | 0 | | $ | 0 | | $ | 0 | | $ | 0 | | $ | 0 | | $ | 631,381 | | $ | 10,705,520 |
Seligman California Municipal High-Yield | | $ | 0 | | | — | | | — | | | — | | | — | | | — | | | — | | | — | | | — | | | — |
Seligman California Municipal Quality | | $ | 0 | | | — | | | — | | | — | | | — | | | — | | | — | | | — | | | — | | | — |
Seligman Minnesota Municipal | | $ | 0 | | | — | | | — | | | — | | | — | | | — | | | — | | | — | | | — | | | — |
Seligman National Municipal | | $ | 2,099,958 | | $ | 996,330 | | $ | 0 | | $ | 505,484 | | $ | 0 | | $ | 0 | | $ | 0 | | $ | 598,144 | | $ | 0 | | $ | 0 |
Seligman New York Municipal | | $ | 0 | | | — | | | — | | | — | | | — | | | — | | | — | | | — | | | — | | | — |
Seligman TargETFund 2015 | | $ | 7,102,014 | | $ | 0 | | $ | 0 | | $ | 0 | | $ | 0 | | $ | 0 | | $ | 0 | | $ | 0 | | $ | 1,531,175 | | $ | 5,570,839 |
Seligman TargETFund 2025 | | $ | 1,803,909 | | $ | 0 | | $ | 0 | | $ | 0 | | $ | 0 | | $ | 0 | | $ | 0 | | $ | 0 | | $ | 158,889 | | $ | 1,645,020 |
Seligman TargETFund 2035 | | $ | 256,357 | | $ | 0 | | $ | 0 | | $ | 0 | | $ | 0 | | $ | 0 | | $ | 0 | | $ | 0 | | $ | 40,056 | | $ | 216,301 |
Seligman TargETFund 2045 | | $ | 541,844 | | $ | 0 | | $ | 0 | | $ | 0 | | $ | 0 | | $ | 0 | | $ | 0 | | $ | 0 | | $ | 25,322 | | $ | 516,522 |
Seligman TargETFund Core | | $ | 12,588,348 | | $ | 0 | | $ | 0 | | $ | 0 | | $ | 0 | | $ | 0 | | $ | 0 | | $ | 0 | | $ | 901,259 | | $ | 11,687,089 |
91
| | | | | | | | | | | | | | | | | | | | | | | | | | | | | | |
For funds with fiscal period ending October 31 |
Columbia Absolute Return Currency and Income | | $ | 5,945,153 | | $ | 0 | | $ | 0 | | $ | 0 | | $ | 0 | | $ | 0 | | $ | 0 | | $ | 0 | | $ | 5,945,153 | | $ | 0 |
Columbia Asia Pacific ex-Japan | | $ | 0 | | | — | | | — | | | — | | | — | | | — | | | — | | | — | | | — | | | — |
Columbia Emerging Markets Bond | | $ | 17,157,025 | | $ | 0 | | $ | 0 | | $ | 0 | | $ | 0 | | $ | 0 | | $ | 0 | | $ | 2,399,388 | | $ | 14,757,637 | | $ | 0 |
Columbia Emerging Markets Opportunity | | $ | 98,672,638 | | $ | 0 | | $ | 0 | | $ | 0 | | $ | 0 | | $ | 0 | | $ | 0 | | $ | 28,498,591 | | $ | 70,174,047 | | $ | 0 |
Columbia European Equity | | $ | 44,533,168 | | $ | 16,514,517 | | $ | 5,021,215 | | $ | 0 | | $ | 0 | | $ | 0 | | $ | 0 | | $ | 4,272,956 | | $ | 18,724,480 | | $ | 0 |
Columbia Frontier | | $ | 8,888,714 | | $ | 0 | | $ | 0 | | $ | 0 | | $ | 0 | | $ | 0 | | $ | 0 | | $ | 1,048,243 | | $ | 7,840,471 | | $ | 0 |
Columbia Global Bond | | $ | 15,099,745 | | $ | 3,665,049 | | $ | 0 | | $ | 0 | | $ | 0 | | $ | 498,771 | | $ | 0 | | $ | 2,328,738 | | $ | 8,607,187 | | $ | 0 |
Columbia Global Equity | | $ | 339,519,748 | | $ | 143,688,441 | | $ | 30,509,951 | | $ | 0 | | $ | 0 | | $ | 0 | | $ | 2,715,902 | | $ | 62,625,028 | | $ | 99,980,426 | | $ | 0 |
Columbia Global Extended Alpha | | $ | 1,407,944 | | $ | 0 | | $ | 0 | | $ | 0 | | $ | 0 | | $ | 0 | | $ | 0 | | $ | 577,229 | | $ | 830,715 | | $ | 0 |
Columbia Multi-Advisor International Value | | $ | 340,858,587 | | $ | 0 | | $ | 0 | | $ | 0 | | $ | 0 | | $ | 0 | | $ | 0 | | $ | 0 | | $ | 340,858,587 | | $ | 0 |
Columbia Seligman Global Technology | | $ | 294,571,144 | | $ | 193,291,798 | | $ | 17,073,210 | | $ | 0 | | $ | 0 | | $ | 0 | | $ | 17,310,562 | | $ | 37,526,708 | | $ | 29,368,866 | | $ | 0 |
RiverSource Disciplined International Equity | | $ | 285,672,442 | | $ | 0 | | $ | 0 | | $ | 0 | | $ | 0 | | $ | 0 | | $ | 0 | | $ | 23,521,188 | | $ | 262,151,254 | | $ | 0 |
RiverSource Partners International Select Growth | | $ | 185,090,340 | | $ | 0 | | $ | 0 | | $ | 0 | | $ | 0 | | $ | 0 | | $ | 823,328 | | $ | 67,466,960 | | $ | 116,800,052 | | $ | 0 |
RiverSource Partners International Small Cap | | $ | 36,130,012 | | $ | 0 | | $ | 0 | | $ | 0 | | $ | 0 | | $ | 0 | | $ | 0 | | $ | 16,740,416 | | $ | 19,389,596 | | $ | 0 |
Threadneedle Global Equity Income | | $ | 1,477,274 | | $ | 0 | | $ | 0 | | $ | 0 | | $ | 0 | | $ | 0 | | $ | 0 | | $ | 182,867 | | $ | 1,294,407 | | $ | 0 |
Threadneedle International Opportunity | | $ | 204,715,335 | | $ | 59,231,998 | | $ | 38,262,972 | | $ | 0 | | $ | 0 | | $ | 0 | | $ | 0 | | $ | 12,069,463 | | $ | 95,150,902 | | $ | 0 |
For funds with fiscal period ending November 30 |
Columbia Mid Cap Growth Opportunity | | $ | 66,514,603 | | $ | 0 | | $ | 0 | | $ | 0 | | $ | 0 | | $ | 0 | | $ | 0 | | $ | 20,714,703 | | $ | 45,799,900 | | $ | 0 |
Columbia AMT-Free Tax-Exempt Bond | | $ | 18,155,779 | | $ | 0 | | $ | 0 | | $ | 0 | | $ | 0 | | $ | 729,269 | | $ | 0 | | $ | 9,046,561 | | $ | 8,379,949 | | $ | 0 |
RiverSource Tax-Exempt High Income | | $ | 88,820,109 | | $ | 0 | | $ | 0 | | $ | 0 | | $ | 0 | | $ | 0 | | $ | 0 | | $ | 30,950,938 | | $ | 57,869,171 | | $ | 0 |
RiverSource Intermediate Tax-Exempt | | $ | 704,163 | | $ | 0 | | $ | 0 | | $ | 0 | | $ | 0 | | $ | 177,579 | | $ | 0 | | $ | 361,418 | | $ | 165,166 | | $ | 0 |
For funds with fiscal period ending December 31 |
Columbia Government Money Market | | $ | 0 | | $ | 0 | | $ | 0 | | $ | 0 | | $ | 0 | | $ | 0 | | $ | 0 | | $ | 0 | | $ | 0 | | $ | 0 |
Columbia Select Large-Cap Value | | $ | 3,224,311 | | $ | 0 | | $ | 0 | | $ | 0 | | $ | 0 | | $ | 0 | | $ | 0 | | $ | 0 | | $ | 0 | | $ | 3,224,311 |
Columbia Select Smaller-Cap Value | | $ | 153,343,213 | | $ | 0 | | $ | 0 | | $ | 0 | | $ | 0 | | $ | 0 | | $ | 22,627,649 | | $ | 115,478,130 | | $ | 15,237,434 | | $ | 0 |
Columbia Seligman Communications and Information | | $ | 207,486,080 | | $ | 0 | | $ | 12,308,398 | | $ | 0 | | $ | 0 | | $ | 0 | | $ | 0 | | $ | 97,889,818 | | $ | 97,287,864 | | $ | 0 |
RiverSource LaSalle Global Real Estate | | $ | 16,375,351 | | $ | 0 | | $ | 0 | | $ | 0 | | $ | 0 | | $ | 0 | | $ | 585,168 | | $ | 5,289,122 | | $ | 9,426,119 | | $ | 1,074,942 |
RiverSource LaSalle Monthly Dividend Real Estate | | $ | 40,689,222 | | $ | 0 | | $ | 0 | | $ | 0 | | $ | 0 | | $ | 0 | | $ | 0 | | $ | 14,370,083 | | $ | 26,294,548 | | $ | 24,591 |
Seligman Capital | | $ | 176,270,293 | | $ | 50,722,077 | | $ | 0 | | $ | 0 | | $ | 0 | | $ | 0 | | $ | 0 | | $ | 63,824,881 | | $ | 60,299,879 | | $ | 1,423,456 |
Seligman Growth | | $ | 1,416,163,210 | | $ | 234,134,706 | | $ | 0 | | $ | 0 | | $ | 0 | | $ | 0 | | $ | 107,614,532 | | $ | 1,048,921,057 | | $ | 25,492,915 | | $ | 0 |
92
Taxes
Subchapter M Compliance
Each fund has elected to be taxed under Subchapter M of the Internal Revenue Code as a regulated investment company. Each fund intends to maintain its qualification as a regulated investment company by meeting certain requirements relating to distributions, source of income, and asset diversification. Distribution requirements include distributing at least 90% of the fund’s investment company taxable income (which includes net short-term capital gains) and tax-exempt ordinary income to fund shareholders each taxable year. The source of income rules require that at least 90% of the fund’s gross income be derived from dividends, interest, certain payments with respect to securities loans, gain from the sale or other disposition of stock, securities or foreign currencies (subject to certain limitations), and certain other income derived with respect to its business of investing in stock, securities or currencies, and net income from certain interests in qualified publicly traded partnerships. Asset diversification requirements are met when the fund owns, at the end of each quarter of its taxable year, a portfolio, 50% of which includes cash and cash items, U.S. government securities, securities of other regulated investment companies and, securities of other issuers in which the fund has not invested more than 5% of the value of the fund’s assets (or 10% of the value of the outstanding voting securities of any one issuer). Also, no more than 25% of the fund’s assets may be invested in the securities of any one issuer or two or more issuers which the fund controls and which are engaged in the same or similar trades or businesses (excepting U.S. government securities and securities of other regulated investment companies) or the securities of one or more qualified publicly traded partnerships. This is a simplified description of the relevant laws.
If the fund fails to qualify as a regulated investment company under Subchapter M, the fund would be taxed as a corporation on the entire amount of its taxable income (including its capital gain) without a dividends paid deduction. Also, “all of” a shareholder’s distributions would generally be taxable to shareholders as qualified dividend income (QDI) (or could be treated as a return of capital, if there weren’t sufficient earnings and profits) and generally would be eligible for the dividends received deduction in the case of corporate shareholders.
Under federal tax law, by the end of a calendar year a fund must declare and pay dividends representing 98% of ordinary income for that calendar year and 98% of net capital gains (both long-term and short-term) for the 12-month period ending Oct. 31 of that calendar year. The fund is subject to an excise tax equal to 4% of the excess, if any, of the amount required to be distributed over the amount actually distributed. Each fund intends to comply with federal tax law and avoid any excise tax. For purposes of the excise tax distributions, section 988 ordinary gains and losses are distributable based on an Oct. 31 year end. This is an exception to the general rule that ordinary income is paid based on a calendar year end.
The fund intends to distribute sufficient dividends within each calendar year, as well as on a fiscal year basis, to avoid income and excise taxes.
A fund may be subject to U.S. taxes resulting from holdings in passive foreign investment companies (PFIC). To avoid unfavorable tax consequences, a fund may make an election to mark to market its PFIC investments. A foreign corporation is a PFIC when 75% or more of its gross income for the taxable year is passive income or 50% or more of the average value of its assets consists of assets that produce or could produce passive income.
Income earned by a fund may have had foreign taxes imposed and withheld on it in foreign countries. Tax conventions between certain countries and the U.S. may reduce or eliminate such taxes. If more than 50% of a fund’s total assets at the close of its fiscal year consists of securities of foreign corporations, the fund will be eligible to file an election with the Internal Revenue Service (IRS) under which shareholders of the fund would be required to include their pro rata portions of foreign taxes withheld by foreign countries as gross income in their federal income tax returns. These pro rata portions of foreign taxes withheld may be taken as a credit or deduction in computing the shareholders’ federal income taxes. If the election is filed, the fund will report to its shareholders the per share amount of such foreign taxes withheld and the amount of foreign tax credit or deduction available for federal income tax purposes.
A fund may use equalization payments to satisfy its requirement to make distributions of net investment income and capital gain net income. Equalization payments occur when a fund allocates a portion of its net investment income and realized capital gain net income to redemptions of fund shares. These payments reduce the amount of taxable distributions paid to shareholders. The IRS has not issued any guidance concerning the methods used to allocate investment income and capital gain to redemptions of shares. If the IRS determines that a fund is using an improper method of allocation for these purposes, the fund may be liable for additional federal income tax.
93
This is a brief summary that relates to federal income taxation only. Shareholders should consult their tax advisor as to the application of federal, state, and local income tax laws to fund distributions.
See Appendix B for more information regarding state tax-exempt funds.
Exchanges, Purchases and Sales
For tax purposes, an exchange is considered a sale and purchase, and may result in a gain or loss. A sale is a taxable transaction. If you sell shares for less than their cost, the difference is a capital loss. If you sell shares for more than their cost, the difference is a capital gain. Your gain may be short term (for shares held for one year or less) or long term (for shares held more than one year).
Capital gain of a non-corporate U.S. shareholder that is recognized in a taxable year beginning before January 1, 2011 is generally taxed at a maximum rate of 15% in respect of shares held for more than one year. Net capital gain of a corporate shareholder is taxed at the same rate as ordinary income. However, if shares on which a long-term capital gain distribution has been received are subsequently sold or redeemed and such shares have been held for six months or less (after taking into account certain hedging transactions), any loss realized will be treated as long-term capital loss to the extent that it does not exceed the long-term capital gain distribution.
A capital loss on a sale or redemption of a security in a nonqualified account may be disallowed for tax purposes if the same or a substantially identical security is purchased or acquired (including shares acquired through dividend reinvestment) within 30 days before or after the date of the loss transaction. This is called a wash sale. When a wash sale occurs, the loss is disallowed to the extent of shares repurchased, and the cost basis on the security acquired is increased by the amount of the loss that is disallowed. The loss is disallowed in a nonqualified account whether the purchase is in a nonqualified account or in an IRA or Roth IRA, however, an individual’s cost basis in an IRA or Roth IRA is not increased due to the wash sale rules. The wash sale rules apply only to capital losses. Sales of securities that result in capital gains are generally recognized when incurred.
If you buy Class A shares and within 91 days exchange into another fund, you may not include the sales charge in your calculation of tax gain or loss on the sale of the first fund you purchased. The sales charge may be included in the calculation of your tax gain or loss on a subsequent sale of the second fund you purchased.
For example
You purchase 100 shares of an equity fund having a public offering price of $10.00 per share. With a sales load of 5.75%, you pay $57.50 in sales load. With a NAV of $9.425 per share, the value of your investment is $942.50. Within 91 days of purchasing that fund, you decide to exchange out of that fund, now at a NAV of $11.00 per share, up from the original NAV of $9.425, and purchase a second fund, at a NAV of $15.00 per share. The value of your investment is now $1,100.00 ($11.00 x 100 shares). You cannot use the $57.50 paid as a sales load when calculating your tax gain or loss in the sale of the first fund shares. So instead of having a $100.00 gain ($1,100.00 – $1,000.00), you have a $157.50 gain ($1,100.00 – $942.50). You can include the $57.50 sales load in the calculation of your tax gain or loss when you sell shares in the second fund.
The following paragraphs provide information based on a fund’s investment category. You can find your fund’s investment category in Table 1.
For State Tax-Exempt Fixed Income and Tax-Exempt Fixed Income Funds, all distributions of net investment income during the fund’s fiscal year will have the same percentage designated as tax-exempt. This percentage is expected to be substantially the same as the percentage of tax-exempt income actually earned during any particular distribution period.
For Balanced, Equity, Funds-of-Funds, Taxable Money Market and Taxable Fixed Income Funds, if you have a nonqualified investment in a fund and you wish to move part or all of those shares to an IRA or qualified retirement account in the fund, you can do so without paying a sales charge. However, this type of exchange is considered a redemption of shares and may result in a gain or loss for tax purposes. See wash sale discussion above. In addition, this type of exchange may result in an excess contribution under IRA or qualified plan regulations if the amount exchanged exceeds annual contribution limitations. You should consult your tax advisor for further details about this complex subject.
94
Distributions
Dividends
Net investment income dividends (other than qualified dividend income) received and distributions from the excess of net short-term capital gains over net long-term capital losses should be treated as ordinary income for federal income tax purposes. Corporate shareholders are generally entitled to a deduction equal to 70% of that portion of a fund’s dividend that is attributable to dividends the fund received from domestic (U.S.) securities. If there is debt-financed portfolio stock, that is, bank financing is used to purchase long securities, the 70% dividends received deduction would be reduced by the average amount of portfolio indebtedness divided by the average adjusted basis in the stock. This does not impact the qualified dividend income available to individual shareholders. For the most recent fiscal period, net investment income dividends qualified for the corporate deduction are shown in the following table.
Only certain QDI will be subject to the 15% and 0% (for lower-bracket taxpayers) tax rates for 2008-2010. QDI is dividends earned from domestic corporations and qualified foreign corporations. Qualified foreign corporations are corporations incorporated in a U.S. possession, corporations whose stock is readily tradable on an established U.S. securities market (ADRs), and certain other corporations eligible for relief under an income tax treaty with the U.S. that includes an exchange of information agreement. PFICs are excluded from this treatment. Holding periods for shares must also be met to be eligible for QDI treatment (more than 60 days for common stock and more than 90 days for certain preferred’s dividends).
Dividends declared in October, November or December, payable to shareholders of record on a specified date in such a month and paid in the following January will be treated as having been paid by a fund and received by each shareholder in December. Under this rule, therefore, shareholders may be taxed in one year on dividends or distributions actually received in January of the following year.
The QDI for individuals for the most recent fiscal period is shown in the table below. The table is organized by fiscal year end. You can find your fund’s fiscal year end in Table 1.
Table 12. Corporate Deduction and Qualified Dividend Income
| | | | | | |
Fund | | Percent of dividends qualifying
for corporate deduction | | | Qualified dividend income
for individuals | |
For funds with fiscal period ending January 31 | | | | | | |
Columbia Income Builder Fund | | 20.79 | % | | 23.21 | % |
Columbia Income Builder Fund II | | 19.04 | | | 22.16 | |
Columbia Income Builder Fund III | | 13.81 | | | 17.15 | |
Columbia Portfolio Builder Aggressive | | 60.55 | | | 90.45 | |
Columbia Portfolio Builder Conservative | | 100.00 | | | 100.00 | |
Columbia Portfolio Builder Moderate | | 27.70 | | | 41.29 | |
Columbia Portfolio Builder Moderate Aggressive | | 43.07 | | | 64.31 | |
Columbia Portfolio Builder Moderate Conservative | | 18.56 | | | 27.43 | |
Columbia Portfolio Builder Total Equity | | 91.77 | | | 100.00 | |
RiverSource S&P 500 Index | | 100.00 | | | 100.00 | |
RiverSource Small Company Index | | 100.00 | | | 100.00 | |
For funds with fiscal period ending March 31 | | | | | | |
Columbia Equity Value | | 100.00 | | | 100.00 | |
RiverSource Precious Metals and Mining | | 5.22 | | | 20.29 | |
For funds with fiscal period ending April 30 | | | | | | |
Columbia 120/20 Contrarian Equity | | 100.00 | | | 100.00 | |
Columbia Recovery and Infrastructure | | 35.61 | | | 42.61 | |
Columbia Retirement Plus 2010 | | 45.41 | | | 50.54 | |
Columbia Retirement Plus 2015 | | 47.80 | | | 54.77 | |
Columbia Retirement Plus 2020 | | 53.80 | | | 62.70 | |
Columbia Retirement Plus 2025 | | 60.75 | | | 70.54 | |
Columbia Retirement Plus 2030 | | 61.11 | | | 70.71 | |
Columbia Retirement Plus 2035 | | 60.82 | | | 70.52 | |
Columbia Retirement Plus 2040 | | 61.81 | | | 71.38 | |
Columbia Retirement Plus 2045 | | 67.54 | | | 77.42 | |
95
| | | | | | |
For funds with fiscal period ending May 31 | | | | | | |
Columbia High Yield Bond | | 0 | % | | 0 | % |
Columbia Multi-Advisor Small Cap Value | | 0 | | | 0 | |
Columbia U.S. Government Mortgage | | 0 | | | 0 | |
RiverSource Partners Fundamental Value | | 100.00 | | | 100.00 | |
RiverSource Short Duration U.S. Government | | 0 | | | 0 | |
For funds with fiscal period ending June 30 | | | | | | |
Columbia Dividend Opportunity | | 91.83 | | | 100.00 | |
RiverSource Real Estate | | 0.35 | | | 7.02 | |
For funds with fiscal period ending July 31 | | | | | | |
Columbia Floating Rate | | 0.06 | | | 0.06 | |
Columbia Income Opportunities | | 0 | | | 0 | |
Columbia Inflation Protected Securities | | 0 | | | 0 | |
Columbia Limited Duration Credit | | 0 | | | 0 | |
Columbia Large Core Quantitative | | 100.00 | | | 100.00 | |
Columbia Money Market | | 0 | | | 0 | |
RiverSource Disciplined Small and Mid Cap Equity | | 100.00 | | | 100.00 | |
RiverSource Disciplined Small Cap Value | | 100.00 | | | 100.00 | |
For funds with fiscal period ending August 31 | | | | | | |
Columbia Diversified Bond | | 0 | | | 0 | |
Columbia Minnesota Tax-Exempt | | 0 | | | 0 | |
RiverSource California Tax-Exempt | | 0 | | | 0 | |
RiverSource New York Tax-Exempt | | 0 | | | 0 | |
For funds with fiscal period ending September 30 | | | | | | |
Columbia Diversified Equity Income | | 100.00 | | | 100.00 | |
Columbia Large Growth Quantitative | | 100.00 | | | 100.00 | |
Columbia Large Value Quantitative | | 46.66 | | | 47.51 | |
Columbia Mid Cap Value Opportunity | | 100.00 | | | 100.00 | |
Columbia Strategic Allocation | | 85.51 | | | 94.62 | |
RiverSource Balanced | | 58.23 | | | 67.65 | |
RiverSource Strategic Income Allocation | | 0.31 | | | 1.00 | |
Seligman California Municipal High-Yield | | 0 | | | 0 | |
Seligman California Municipal Quality | | 0 | | | 0 | |
Seligman Minnesota Municipal | | 0 | | | 0 | |
Seligman National Municipal | | 0 | | | 0 | |
Seligman New York Municipal | | 0 | | | 0 | |
Seligman TargETFund 2015 | | 53.63 | | | 87.73 | |
Seligman TargETFund 2025 | | 50.39 | | | 100.00 | |
Seligman TargETFund 2035 | | 48.74 | | | 100.00 | |
Seligman TargETFund 2045 | | 43.70 | | | 100.00 | |
Seligman TargETFund Core | | 50.44 | | | 63.90 | |
For funds with fiscal period ending October 31 | | | | | | |
Columbia Absolute Return Currency and Income | | 0 | % | | 0 | % |
Columbia Asia Pacific ex-Japan | | 0 | | | 53.84 | |
Columbia Emerging Markets Bond | | 0 | | | 0 | |
Columbia Emerging Markets Opportunity | | 0.27 | | | 81.67 | |
Columbia European Equity | | 0 | | | 100.00 | |
Columbia Frontier | | 0 | | | 0 | |
Columbia Global Bond | | 0 | | | 0 | |
Columbia Global Equity | | 77.49 | | | 100.00 | |
Columbia Global Extended Alpha | | 0 | | | 0 | |
Columbia Multi-Advisor International Value | | 2.08 | | | 100.00 | |
Columbia Seligman Global Technology | | 0 | | | 0 | |
RiverSource Disciplined International Equity | | 0.25 | | | 100.00 | |
RiverSource Partners International Select Growth | | 2.04 | | | 100.00 | |
RiverSource Partners International Small Cap | | 0 | | | 0 | |
Threadneedle Global Equity Income | | 29.74 | | | 100.00 | |
Threadneedle International Opportunity | | 0 | | | 100.00 | |
96
| | | | |
For funds with fiscal period ending November 30 | | | | |
Columbia AMT-Free Tax-Exempt Bond | | 0 | | 0 |
Columbia Mid Cap Growth Opportunity | | 0 | | 0 |
RiverSource Intermediate Tax-Exempt | | 0 | | 0 |
RiverSource Tax-Exempt High Income | | 0 | | 0 |
For funds with fiscal period ending December 31 | | | | |
Columbia Government Money Market | | 0 | | 0 |
Columbia Select Large-Cap Value | | 100.00 | | 100.00 |
Columbia Select Smaller-Cap Value | | 0 | | 100.00 |
Columbia Seligman Communications and Information | | 0 | | 0 |
RiverSource LaSalle Global Real Estate | | 0 | | 2.58 |
RiverSource LaSalle Monthly Dividend Real Estate | | 0 | | 2.09 |
Seligman Capital | | 0 | | 0 |
Seligman Growth | | 100.00 | | 100.00 |
Capital Gains Distributions
Capital gain distributions, if any, received by shareholders (in cash or invested in additional shares) should be treated as long-term capital gains regardless of how long shareholders owned their shares. Short-term capital gains earned by a fund are paid to shareholders as part of their ordinary income dividend and are taxable as ordinary income. Special rates on capital gains may apply to sales of precious metals, if any, owned directly by a fund and to investments in REITs.
Individual shareholders will be subject to federal income tax on distributions of net capital gains generally at a maximum rate of 15% if designated as derived from a fund’s capital gains from property held for more than one year and recognized in the taxable years beginning before January 1, 2011. Net capital gain of a corporate shareholder is taxed at the same rate as ordinary income. Such distributions are not eligible for the dividends received deduction allowed to corporate shareholders. Shareholders receiving distributions in the form of additional shares issued by a fund will generally be treated for federal income tax purposes as having received a distribution in an amount equal to the cash that could have been elected to be received instead of the additional shares.
Under the Internal Revenue Code of 1986 (the Code), gains or losses attributable to fluctuations in exchange rates that occur between the time a fund accrues interest or other receivables, or accrues expenses or other liabilities denominated in a foreign currency and the time the fund actually collects such receivables or pays such liabilities generally are treated as ordinary income or ordinary loss. Similarly, gains or losses on disposition of debt securities denominated in a foreign currency attributable to fluctuations in the value of the foreign currency between the date of acquisition of the security and the date of disposition may be treated as ordinary or capital gains or losses. These gains or losses, referred to under the Code as “section 988” gains or losses, may increase or decrease the amount of a fund’s investment company taxable income to be distributed to its shareholders as ordinary income.
Return of Capital
If a mutual fund is the holder of record of any share of stock on the record date for any dividend payable with respect to the stock, the dividend will be included in gross income by the fund as of the later of (1) the date the share became ex-dividend or (2) the date the fund acquired the share. Because the dividends on some foreign equity investments may be received some time after the stock goes ex-dividend, and in certain rare cases may never be received by the fund, this rule may cause a fund to pay income to its shareholders that it has not actually received. To the extent that the dividend is never received, the fund will take a loss at the time that a determination is made that the dividend will not be received.
If a fund’s distributions exceed its current and accumulated earnings and profits, that portion of the fund’s distributions will be treated as a return of capital to its shareholders. A return of capital is a return of a portion of the shareholder’s original investment. A return of capital will generally not be taxable, however, any amounts received in excess of a shareholder’s tax basis are treated as capital gain. Forms 1099 will be sent to shareholders to report any return of capital.
Withholding
Unless a shareholder provides a certified taxpayer identification number (social security number for individuals) on the account application or other document and certifies that the shareholder is not subject to backup withholding, the fund is required to withhold and remit to the IRS 28% backup withholding on taxable and exempt-interest dividends and redemptions. Shareholders should be aware that, under regulations promulgated by the IRS, a fund may be fined for each account for which a certified taxpayer identification number (social security number for individuals) is not provided.
97
Taxation of a shareholder who, as to the United States, is a nonresident alien individual, foreign trust or estate, foreign corporation, or foreign partnership (“foreign shareholder”) depends on whether the income from the fund is “effectively connected” with a U.S. trade or business carried on by such shareholder. If the income from the fund is not effectively connected with a U.S. trade or business carried on by a foreign shareholder, ordinary income and qualified dividends paid to such foreign shareholders generally will be subject to a 30% U.S. withholding tax under existing provisions of the Internal Revenue Code applicable to foreign individuals and entities unless a reduced rate of withholding or a withholding exemption is provided under applicable treaty or law. Nonresident shareholders are urged to consult their own tax advisers concerning the applicability of the U.S. withholding tax.
If the income from the fund is effectively connected with a U.S. trade or business carried on by a foreign shareholder, then ordinary income dividends, qualified dividends, capital gain dividends, undistributed capital gains credited to such shareholder and any gains realized upon the sale of shares of the fund will be subject to U.S. federal income tax at the graduated rates applicable to U.S. citizens or domestic corporations. In the case of foreign non-corporate shareholders, the fund may be required to backup withhold U.S. federal income tax on distributions that are otherwise exempt from withholding tax (or taxable at a reduced treaty rate) unless such shareholders furnish the fund with proper documentation related to their foreign status.
The tax consequences to a foreign shareholder entitled to claim the benefits of an applicable tax treaty may be different from those described herein. Foreign shareholders are urged to consult their own tax advisers with respect to the particular tax consequences to them of an investment in the fund, the procedure for claiming the benefit of a lower treaty rate and the applicability of foreign taxes.
Seligman TargETFunds. Each of Seligman TargETFund 2045, Seligman TargETFund 2035, Seligman TargETFund 2025 and Seligman TargETFund 2015 (Target Date Funds) will automatically be combined with Seligman TargETFund Core during their respective target year. The investment manager expects each of these combinations to be effected as an acquisition of the assets and liabilities of the applicable Target Date Fund in exchange for shares of TargETFund Core at net asset value, with the shares of TargETFund Core then distributed to shareholders of the applicable Target Date Fund. Based on current tax rules, the investment manager expects the combination to be effected in a non-taxable transaction. Changes in such tax rules or applicable law or other developments could negatively impact the combination of the Target Date Funds with Seligman TargETFund Core.
Due to the impossibility of predicting whether changes in law or other developments may impact the fairness or overall desirability of the combination of any two funds ten or more years in the future, the Board of the Seligman TargETFunds will evaluate each combination in the year it is scheduled to occur under the standards of Rule 17a-8 under the 1940 Act and general principles of fairness, and may approve modifications to the methodology or terminate the combination if it determines that doing so would be in the best interests of shareholders. Any modifications to the manner of combining funds will be presented to shareholders for approval if such approval is required under applicable law.
Service Providers
INVESTMENT MANAGEMENT SERVICES
Columbia Management Investment Advisers, LLC (formerly RiverSource Investments, LLC) is the investment manager for each fund. Under the Investment Management Services Agreements, the investment manager, subject to the policies set by the Board, provides investment management services to the funds.
For Seligman funds, Columbia Management serves as the investment manager effective Nov. 7, 2008, with the completion of the acquisition of J. & W. Seligman & Co. Incorporated by the investment manager and with shareholders having previously approved a new investment management services agreement between the funds and the investment manager.
For its services, the investment manager is paid a monthly fee based on the following schedule. Each class of a fund pays its proportionate share of the fee. The fee is calculated for each calendar day on the basis of net assets as of the close of the preceding day.
98
Table 13. Investment Management Services Agreement Fee Schedule
| | | | | | | |
Fund | | Assets (billions) | | Annual rate at
each asset level | | | Daily rate on last day of most recent fiscal period |
Columbia 120/20 Contrarian Equity | | First $0.25 | | 0.950 | % | | 0.950% |
| | Next $0.25 | | 0.930 | % | | |
| | Next $0.50 | | 0.910 | % | | |
| | Over $1.0 | | 0.890 | % | | |
Columbia Absolute Return Currency and Income | | First $1.0 | | 0.890 | % | | 0.890% |
| | Next $1.0 | | 0.865 | % | | |
| | Next $1.0 | | 0.840 | % | | |
| | Next $3.0 | | 0.815 | % | | |
| | Next $1.5 | | 0.790 | % | | |
| | Next $1.5 | | 0.775 | % | | |
| | Next $1.0 | | 0.770 | % | | |
| | Next $5.0 | | 0.760 | % | | |
| | Next $5.0 | | 0.750 | % | | |
| | Next $4.0 | | 0.740 | % | | |
| | Next $26.0 | | 0.720 | % | | |
| | Over $50.0 | | 0.700 | % | | |
Columbia AMT-Free Tax-Exempt Bond | | First $1.0 | | 0.410 | % | | 0.410% |
| | Next $1.0 | | 0.385 | % | | |
| | Next $1.0 | | 0.360 | % | | |
| | Next $3.0 | | 0.335 | % | | |
| | Next $1.5 | | 0.310 | % | | |
| | Next $2.5 | | 0.300 | % | | |
| | Next $5.0 | | 0.290 | % | | |
| | Next $9.0 | | 0.280 | % | | |
| | Next $26.0 | | 0.260 | % | | |
| | Over $50.0 | | 0.250 | % | | |
Columbia Asia Pacific ex-Japan | | First $0.25 | | 0.800 | % | | Columbia Asia Pacific ex-Japan – 0.800% |
Columbia European Equity | | Next $0.25 | | 0.775 | % | | Columbia European Equity – 0.800% |
Columbia Global Equity | | Next $0.25 | | 0.750 | % | | Columbia Global Equity – 0.788% |
RiverSource Disciplined International Equity | | Next $0.25 | | 0.725 | % | | RiverSource Disciplined International Equity – 0.788% |
| | Next $1.0 | | 0.700 | % | | Threadneedle Global Equity Income – 0.800% |
Threadneedle Global Equity Income | | Next $5.5 | | 0.675 | % | | Threadneedle International Opportunity – 0.790% |
Threadneedle International Opportunity | | Next $2.5 | | 0.660 | % | | |
| | Next $5.0 | | 0.645 | % | | |
| | Next $5.0 | | 0.635 | % | | |
| | Next $4.0 | | 0.610 | % | | |
| | Next $26.0 | | 0.600 | % | | |
| | Over $50.0 | | 0.570 | % | | |
Columbia Diversified Bond | | First $1.0 | | 0.480 | % | | Columbia Diversified Bond – 0.442% |
Columbia Limited Duration Credit | | Next $1.0 | | 0.455 | % | | Columbia Limited Duration Credit – 0.480% |
| | Next $1.0 | | 0.430 | % | | |
| | Next $3.0 | | 0.405 | % | | |
| | Next $1.5 | | 0.380 | % | | |
| | Next $1.5 | | 0.365 | % | | |
| | Next $1.0 | | 0.360 | % | | |
| | Next $5.0 | | 0.350 | % | | |
| | Next $5.0 | | 0.340 | % | | |
| | Next $4.0 | | 0.330 | % | | |
| | Next $26.0 | | 0.310 | % | | |
| | Over $50.0 | | 0.290 | % | | |
Columbia Diversified Equity Income | | First $1.0 | | 0.600 | % | | Columbia Diversified Equity Income – 0.558% |
Columbia Large Core Quantitative | | Next $1.0 | | 0.575 | % | | Columbia Large Core Quantitative – 0.565% |
Columbia Large Growth Quantitative | | Next $1.0 | | 0.550 | % | | Columbia Large Growth Quantitative – 0.600% |
Columbia Large Value Quantitative | | Next $3.0 | | 0.525 | % | | Columbia Large Value Quantitative – 0.600% |
| | Next $1.5 | | 0.500 | % | | |
| | Next $2.5 | | 0.485 | % | | |
| | Next $5.0 | | 0.470 | % | | |
| | Next $5.0 | | 0.450 | % | | |
| | Next $4.0 | | 0.425 | % | | |
| | Next $26.0 | | 0.400 | % | | |
| | Over $50.0 | | 0.375 | % | | |
99
| | | | | | | |
Columbia Dividend Opportunity | | First $0.50 | | 0.610 | % | | 0.593% |
| | Next $0.50 | | 0.585 | % | | |
| | Next $1.0 | | 0.560 | % | | |
| | Next $1.0 | | 0.535 | % | | |
| | Next $3.0 | | 0.510 | % | | |
| | Next $4.0 | | 0.480 | % | | |
| | Next $5.0 | | 0.470 | % | | |
| | Next $5.0 | | 0.450 | % | | |
| | Next $4.0 | | 0.425 | % | | |
| | Next $26.0 | | 0.400 | % | | |
| | Over $50.0 | | 0.375 | % | | |
Columbia Emerging Markets Bond | | First $0.25 | | 0.720 | % | | Columbia Emerging Markets Bond – 0.719% |
Columbia Global Bond | | Next $0.25 | | 0.695 | % | | Columbia Global Bond – 0.699% |
| | Next $0.25 | | 0.670 | % | |
| | Next $0.25 | | 0.645 | % | |
| | Next $6.5 | | 0.620 | % | |
| | Next $2.5 | | 0.605 | % | |
| | Next $5.0 | | 0.590 | % | |
| | Next $5.0 | | 0.580 | % | |
| | Next $4.0 | | 0.560 | % | |
| | Next $26.0 | | 0.540 | % | |
| | Over $50.0 | | 0.520 | % | |
Columbia Emerging Markets Opportunity | | First $0.25 | | 1.100 | % | | 1.086% |
| | Next $0.25 | | 1.080 | % | | |
| | Next $0.25 | | 1.060 | % | | |
| | Next $0.25 | | 1.040 | % | | |
| | Next $1.0 | | 1.020 | % | | |
| | Next $5.5 | | 1.000 | % | | |
| | Next $2.5 | | 0.985 | % | | |
| | Next $5.0 | | 0.970 | % | | |
| | Net $5.0 | | 0.960 | % | | |
| | Next $4.0 | | 0.935 | % | | |
| | Next $26.0 | | 0.920 | % | | |
| | Over $50.0 | | 0.900 | % | | |
Columbia Equity Value | | First $0.50 | | 0.530 | % | | 0.521% |
| | Next $0.50 | | 0.505 | % | | |
| | Next $1.0 | | 0.480 | % | | |
| | Next $1.0 | | 0.455 | % | | |
| | Next $3.0 | | 0.430 | % | | |
| | Over $6.0 | | 0.400 | % | | |
Columbia Floating Rate | | First $1.0 | | 0.610 | % | | 0.610% |
Columbia Income Opportunities | | Next $1.0 | | 0.585 | % | | |
| | Next $1.0 | | 0.560 | % | | |
| | Next $3.0 | | 0.535 | % | | |
| | Next $1.5 | | 0.510 | % | | |
| | Next $1.5 | | 0.495 | % | | |
| | Next $1.0 | | 0.470 | % | | |
| | Next $5.0 | | 0.455 | % | | |
| | Next $5.0 | | 0.445 | % | | |
| | Next $4.0 | | 0.420 | % | | |
| | Next $26.0 | | 0.405 | % | | |
| | Over $50.0 | | 0.380 | % | | |
Columbia Global Extended Alpha | | First $0.25 | | 1.050 | % | | 1.050% |
| | Next $0.25 | | 1.030 | % | | |
| | Next $0.50 | | 1.010 | % | | |
| | Next $1.0 | | 0.990 | % | �� | |
Columbia Government Money Market(a) | | First $1.0 | | 0.330 | % | | Columbia Government Money Market – 0.330% |
Columbia Money Market | | Next $0.5 | | 0.313 | % | | Columbia Money Market – 0.306% |
| | Next $0.5 | | 0.295 | % | | |
| | Next $0.5 | | 0.278 | % | | |
| | Next $2.5 | | 0.260 | % | | |
| | Next $1.0 | | 0.240 | % | | |
| | Next $1.5 | | 0.220 | % | | |
| | Next $1.5 | | 0.215 | % | | |
| | Next $1.0 | | 0.190 | % | | |
| | Next $5.0 | | 0.180 | % | | |
| | Next $5.0 | | 0.170 | % | | |
| | Next $4.0 | | 0.160 | % | | |
| | Over $24.0 | | 0.150 | % | | |
100
| | | | | | | |
Columbia High Yield Bond | | First $1.0 | | 0.590 | % | | 0.580% |
| | Next $1.0 | | 0.565 | % | | |
| | Next $1.0 | | 0.540 | % | | |
| | Next $3.0 | | 0.515 | % | | |
| | Next $1.5 | | 0.490 | % | | |
| | Next $1.5 | | 0.475 | % | | |
| | Next $1.0 | | 0.450 | % | | |
| | Next $5.0 | | 0.435 | % | | |
| | Next $5.0 | | 0.425 | % | | |
| | Next $4.0 | | 0.400 | % | | |
| | Next $26.0 | | 0.385 | % | | |
| | Over $50.0 | | 0.360 | % | | |
Columbia Income Builder Fund | | N/A | | N/A | | | N/A |
Columbia Income Builder Fund II | | | | | | | |
Columbia Income Builder Fund III | | | | | | | |
Columbia Portfolio Builder Aggressive | | | | | | | |
Columbia Portfolio Builder Conservative | | | | | | | |
Columbia Portfolio Builder Moderate | | | | | | | |
Columbia Portfolio Builder Moderate Aggressive | | | | | | | |
Columbia Portfolio Builder Moderate Conservative | | | | | | | |
Columbia Portfolio Builder Total Equity | | | | | | | |
Columbia Retirement Plus 2010 | | | | | | | |
Columbia Retirement Plus 2015 | | | | | | | |
Columbia Retirement Plus 2020 | | | | | | | |
Columbia Retirement Plus 2025 | | | | | | | |
Columbia Retirement Plus 2030 | | | | | | | |
Columbia Retirement Plus 2035 | | | | | | | |
Columbia Retirement Plus 2040 | | | | | | | |
Columbia Retirement Plus 2045 | | | | | | | |
Columbia Inflation Protected Securities | | First $1.0 | | 0.440 | % | | 0.440% |
| | Next $1.0 | | 0.415 | % | | |
| | Next $1.0 | | 0.390 | % | | |
| | Next $3.0 | | 0.365 | % | | |
| | Next $1.5 | | 0.340 | % | | |
| | Next $1.5 | | 0.325 | % | | |
| | Next $1.0 | | 0.320 | % | | |
| | Next $5.0 | | 0.310 | % | | |
| | Next $5.0 | | 0.300 | % | | |
| | Next $4.0 | | 0.290 | % | | |
| | Next $26.0 | | 0.270 | % | | |
| | Over $50.0 | | 0.250 | % | | |
Columbia Mid Cap Growth Opportunity | | First $1.0 | | 0.700 | % | | 0.700% |
RiverSource Disciplined Small and Mid Cap Equity | | Next $1.0 | | 0.675 | % | | |
| | Next $1.0 | | 0.650 | % | | |
| | Next $3.0 | | 0.625 | % | | |
| | Next $1.5 | | 0.600 | % | | |
| | Next $2.5 | | 0.575 | % | | |
| | Next $5.0 | | 0.550 | % | | |
| | Next $9.0 | | 0.525 | % | | |
| | Next $26.0 | | 0.500 | % | | |
| | Over $50.0 | | 0.475 | % | | |
Columbia Mid Cap Value Opportunity | | First $1.0 | | 0.700 | % | | 0.686% |
| | Next $1.0 | | 0.675 | % | | |
| | Next $1.0 | | 0.650 | % | | |
| | Next $3.0 | | 0.625 | % | | |
| | Next $1.5 | | 0.600 | % | | |
| | Next $2.5 | | 0.575 | % | | |
| | Next $5.0 | | 0.550 | % | | |
| | Next $9.0 | | 0.525 | % | | |
| | Next $26.0 | | 0.500 | % | | |
| | Over $50.0 | | 0.475 | % | | |
Columbia Minnesota Tax-Exempt | | First $0.25 | | 0.410 | % | | Columbia Minnesota – 0.404% |
RiverSource California Tax-Exempt | | Next $0.25 | | 0.385 | % | | RiverSource California – 0.410% |
101
| | | | | | | |
RiverSource New York Tax-Exempt | | Next $0.25 | | 0.360 | % | | RiverSource New York – 0.410% |
| | Next $0.25 | | 0.345 | % | | |
| | Next $6.5 | | 0.320 | % | | |
| | Next $2.5 | | 0.310 | % | | |
| | Next $5.0 | | 0.300 | % | | |
| | Next $9.0 | | 0.290 | % | | |
| | Next $26.0 | | 0.270 | % | | |
| | Over $50.0 | | 0.250 | % | | |
Columbia Multi-Advisor International Value | | First $0.25 | | 0.900 | % | | 0.863% |
| | Next $0.25 | | 0.875 | % | | |
| | Next $0.25 | | 0.850 | % | | |
| | Next $0.25 | | 0.825 | % | | |
| | Next $1.0 | | 0.800 | % | | |
| | Over $2.0 | | 0.775 | % | | |
Columbia Multi-Advisor Small Cap Value | | First $0.25 | | 0.970 | % | | 0.960% |
| | Next $0.25 | | 0.945 | % | | |
| | Next $0.25 | | 0.920 | % | | |
| | Next $0.25 | | 0.895 | % | | |
| | Over $1.0 | | 0.870 | % | | |
Columbia Recovery and Infrastructure | | First $1.0 | | 0.650 | % | | 0.650% |
| | Next $1.0 | | 0.600 | % | | |
| | Next $4.0 | | 0.550 | % | | |
| | Over $6.0 | | 0.500 | % | | |
Columbia Select Large-Cap Value(j) | | First $0.5 | | 0.755 | % | | 0.755% |
| | Next $0.5 | | 0.660 | % | | |
| | Over $1.0 | | 0.565 | % | | |
Columbia Select Smaller-Cap Value(l) | | First $0.5 | | 0.935 | % | | 0.935% |
| | Next $0.5 | | 0.840 | % | | |
| | Over $1.0 | | 0.745 | % | | |
Columbia Seligman Communications and Information(f) | | First $3.0 | | 0.855 | % | | 0.849% |
| | Next $3.0 | | 0.825 | % | | |
| | Over $6.0 | | 0.725 | % | | |
Columbia Seligman Global Technology(h) | | First $2.0 | | 0.950 | % | | 0.950% |
| | Next $2.0 | | 0.910 | % | | |
| | Over $4.0 | | 0.870 | % | | |
Columbia Strategic Allocation | | First $1.0 | | 0.570 | % | | 0.564% |
| | Next $1.0 | | 0.545 | % | | |
| | Next $1.0 | | 0.520 | % | | |
| | Next $3.0 | | 0.495 | % | | |
| | Next $1.5 | | 0.470 | % | | |
| | Next $2.5 | | 0.450 | % | | |
| | Next $5.0 | | 0.430 | % | | |
| | Next $9.0 | | 0.410 | % | | |
| | Over $24.0 | | 0.390 | % | | |
Columbia U.S. Government Mortgage | | First $1.0 | | 0.480 | % | | 0.480% |
| | Next $1.0 | | 0.455 | % | | |
| | Next $1.0 | | 0.430 | % | | |
| | Next $3.0 | | 0.405 | % | | |
| | Next $1.5 | | 0.380 | % | | |
| | Next $1.5 | | 0.365 | % | | |
| | Next $1.0 | | 0.360 | % | | |
| | Next $5.0 | | 0.350 | % | | |
| | Next $5.0 | | 0.340 | % | | |
| | Next $4.0 | | 0.330 | % | | |
| | Next $26.0 | | 0.310 | % | | |
| | Over $50.0 | | 0.290 | % | | |
RiverSource Balanced | | First $1.0 | | 0.530 | % | | 0.530% |
| | Next $1.0 | | 0.505 | % | | |
| | Next $1.0 | | 0.480 | % | | |
| | Next $3.0 | | 0.455 | % | | |
| | Next $1.5 | | 0.430 | % | | |
| | Next $2.5 | | 0.410 | % | | |
| | Next $5.0 | | 0.390 | % | | |
| | Next $9.0 | | 0.370 | % | | |
| | Over $24.0 | | 0.350 | % | | |
102
| | | | | | | |
RiverSource Disciplined Small Cap Value | | First $0.25 | | 0.850 | % | | 0.850% |
| | Next $0.25 | | 0.825 | % | | |
| | Next $0.25 | | 0.800 | % | | |
| | Next $0.25 | | 0.775 | % | | |
| | Next $1.0 | | 0.750 | % | | |
| | Over $2.0 | | 0.725 | % | | |
RiverSource Intermediate Tax-Exempt | | First $1.0 | | 0.390 | % | | 0.390% |
| | Next $1.0 | | 0.365 | % | | |
| | Next $1.0 | | 0.340 | % | | |
| | Next $3.0 | | 0.315 | % | | |
| | Next $1.5 | | 0.290 | % | | |
| | Next $2.5 | | 0.280 | % | | |
| | Next $5.0 | | 0.270 | % | | |
| | Next $35.0 | | 0.260 | % | | |
| | Over $50.0 | | 0.250 | % | | |
RiverSource LaSalle Global Real Estate(b) | | All | | 0.915 | % | | 0.915% |
RiverSource LaSalle Monthly Dividend Real
Estate(c) | | All | | 0.855 | % | | 0.855% |
RiverSource Partners Fundamental Value | | First $0.50 | | 0.730 | % | | 0.728% |
| | Next $0.50 | | 0.705 | % | | |
| | Next $1.0 | | 0.680 | % | | |
| | Next $1.0 | | 0.655 | % | | |
| | Next $3.0 | | 0.630 | % | | |
| | Over $6.0 | | 0.600 | % | | |
RiverSource Partners International Select Growth | | First $0.25 | | 1.000 | % | | 0.990% |
| | Next $0.25 | | 0.975 | % | | |
| | Next $0.25 | | 0.950 | % | | |
| | Next $0.25 | | 0.925 | % | | |
| | Next $1.0 | | 0.900 | % | | |
| | Over $2.0 | | 0.875 | % | | |
RiverSource Partners International Small Cap | | First $0.25 | | 1.120 | % | | 1.120% |
| | Next $0.25 | | 1.095 | % | | |
| | Next $0.25 | | 1.070 | % | | |
| | Next $0.25 | | 1.045 | % | | |
| | Next $1.0 | | 1.020 | % | | |
| | Over $2.0 | | 0.995 | % | | |
RiverSource Precious Metals and Mining | | First $0.25 | | 0.800 | % | | 0.800% |
| | Next $0.25 | | 0.775 | % | | |
| | Next $0.25 | | 0.750 | % | | |
| | Next $0.25 | | 0.725 | % | | |
| | Next $1.0 | | 0.700 | % | | |
| | Over $2.0 | | 0.675 | % | | |
RiverSource Real Estate | | First $1.0 | | 0.840 | % | | 0.840% |
| | Next $1.0 | | 0.815 | % | | |
| | Next $1.0 | | 0.790 | % | | |
| | Next $3.0 | | 0.765 | % | | |
| | Next $6.0 | | 0.740 | % | | |
| | Next $12.0 | | 0.730 | % | | |
| | Over $24.0 | | 0.720 | % | | |
RiverSource S&P 500 Index | | First $1.0 | | 0.220 | % | | 0.220% |
| | Next $1.0 | | 0.210 | % | | |
| | Next $1.0 | | 0.200 | % | | |
| | Next $4.5 | | 0.190 | % | | |
| | Next $2.5 | | 0.180 | % | | |
| | Next $5.0 | | 0.170 | % | | |
| | Next $9.0 | | 0.160 | % | | |
| | Next $26.0 | | 0.140 | % | | |
| | Over $50.0 | | 0.120 | % | | |
RiverSource Short Duration U.S. Government | | First $1.0 | | 0.480 | % | | 0.480% |
| | Next $1.0 | | 0.455 | % | | |
| | Next $1.0 | | 0.430 | % | | |
| | Next $3.0 | | 0.405 | % | | |
| | Next $1.5 | | 0.380 | % | | |
| | Next $1.5 | | 0.365 | % | | |
| | Next $1.0 | | 0.340 | % | | |
| | Next $5.0 | | 0.325 | % | | |
103
| | | | | | | |
| | Next $5.0 | | 0.315 | % | | |
| | Next $4.0 | | 0.290 | % | | |
| | Next $26.0 | | 0.275 | % | | |
| | Over $50.0 | | 0.250 | % | | |
RiverSource Small Company Index | | First $0.25 | | 0.360 | % | | 0.357% |
| | Next $0.25 | | 0.350 | % | | |
| | Next $0.25 | | 0.340 | % | | |
| | Next $0.25 | | 0.330 | % | | |
| | Next $6.5 | | 0.320 | % | | |
| | Next $7.5 | | 0.300 | % | | |
| | Next $9.0 | | 0.280 | % | | |
| | Next $26.0 | | 0.260 | % | | |
| | Over $50.0 | | 0.240 | % | | |
RiverSource Strategic Income Allocation | | First $0.25 | | 0.550 | % | | 0.546% |
| | Next $0.25 | | 0.525 | % | | |
| | Next $0.25 | | 0.500 | % | | |
| | Over $0.75 | | 0.475 | % | | |
RiverSource Tax-Exempt High Income | | First $1.0 | | 0.470 | % | | 0.453% |
| | Next $1.0 | | 0.445 | % | | |
| | Next $1.0 | | 0.420 | % | | |
| | Next $3.0 | | 0.395 | % | | |
| | Next $1.5 | | 0.370 | % | | |
| | Next $2.5 | | 0.360 | % | | |
| | Next $5.0 | | 0.350 | % | | |
| | Next $9.0 | | 0.340 | % | | |
| | Next $26.0 | | 0.320 | % | | |
| | Over $50.0 | | 0.300 | % | | |
Seligman California Municipal High-Yield(d) | | First $0.25 | | 0.410 | % | | 0.410% |
| | Next $0.25 | | 0.385 | % | | |
Seligman California Municipal Quality(d) | | Next $0.25 | | 0.360 | % | | |
Seligman Minnesota Municipal(d) | | Next $0.25 | | 0.345 | % | | |
Seligman New York Municipal(d) | | Next $6.5 | | 0.320 | % | | |
| | Next $2.5 | | 0.310 | % | | |
| | Next $5.0 | | 0.300 | % | | |
| | Next $9.0 | | 0.290 | % | | |
| | Next $26.0 | | 0.270 | % | | |
| | Over $50.0 | | 0.250 | % | | |
Seligman Capital(e) | | First $1.0 | | 0.805 | % | | 0.805% |
| | Next $1.0 | | 0.765 | % | | |
| | Over $2.0 | | 0.715 | % | | |
Seligman Frontier(g) | | First $0.75 | | 0.885 | % | | 0.885% |
| | Over $0.75 | | 0.790 | % | | |
Seligman Growth(i) | | First $1.0 | | 0.655 | % | | 0.639% |
| | Next $1.0 | | 0.615 | % | | |
| | Over $2.0 | | 0.565 | % | | |
Seligman National Municipal(k) | | First $1.0 | | 0.410 | % | | 0.410% |
| | Next $1.0 | | 0.385 | % | | |
| | Next $1.0 | | 0.360 | % | | |
| | Next $3.0 | | 0.335 | % | | |
| | Next $1.5 | | 0.310 | % | | |
| | Next $2.5 | | 0.300 | % | | |
| | Next $5.0 | | 0.290 | % | | |
| | Next $9.0 | | 0.280 | % | | |
| | Next $26.0 | | 0.260 | % | | |
| | Over $50.0 | | 0.250 | % | | |
Seligman TargETFund 2015 | | First $0.5 | | 0.455 | % | | 0.455% |
Seligman TargETFund 2025 | | Next $0.5 | | 0.410 | % | | |
Seligman TargETFund 2035 | | Over $1.0 | | 0.365 | % | | |
Seligman TargETFund 2045 | | | | | | | |
Seligman TargETFund Core | | | | | | | |
| (a) | Prior to June 15, 2009, the investment manager received an annual fee equal to 0.40% of the fund’s average daily net assets. |
| (b) | Prior to June 15, 2009, the investment manager received an annual fee equal to 0.98% of the fund’s average daily net assets. |
| (c) | Prior to June 15, 2009, the investment manager received an annual fee equal to 0.90% of the fund’s average daily net assets. |
104
| (d) | Prior to June 15, 2009, the investment manager received an annual fee equal to 0.50% of the fund’s average daily net assets. |
| (e) | Prior to June 29, 2009, the investment manager received an annual fee equal to 0.85% on the first $1.0 billion of the fund’s average daily net assets, 0.80% on the next $1.0 billion and 0.75% thereafter. |
| (f) | Prior to June 29, 2009, the investment manager received an annual fee equal to 0.90% on the first $3.0 billion of the fund’s average daily net assets, 0.85% on the next $3.0 billion and 0.75% thereafter. |
| (g) | Prior to June 29, 2009, the investment manager received a fee equal to 0.95% per annum of the fund’s average daily net assets on the first $750 million of net assets and 0.85% per annum of the fund’s average daily net assets in excess of $750 million. |
| (h) | Prior to June 15, 2009, the investment manager received an annual fee equal to 1.00% of average daily net assets on the first $2 billion of net assets, 0.95% of average daily net assets on the next $2 billion and 0.90% of average daily net assets in excess of $4 billion. |
| (i) | Prior to June 29, 2009, the investment manager received an annual fee equal to 0.70% on the first $1.0 billion of the fund’s average daily net assets, 0.65% on the next $1.0 billion and 0.60% thereafter. |
| (j) | Prior to June 29, 2009, the investment manager received an annual fee equal to 0.80% of the fund’s average daily net assets. |
| (k) | Prior to Aug. 31, 2009, the investment manager received an annual fee equal to 0.50% of the fund’s average daily net assets. |
| (l) | Prior to June 29, 2009, the investment manager received an annual fee equal to 1.00% of the fund’s average daily net assets. |
Under the agreement, a fund also pays taxes, brokerage commissions and nonadvisory expenses, which include custodian fees and charges; fidelity bond premiums; certain legal fees; registration fees for shares; consultants’ fees; compensation of Board members, officers and employees not employed by the investment manager or its affiliates; corporate filing fees; organizational expenses; expenses incurred in connection with lending securities; interest and fee expense related to a fund’s participation in inverse floater structures; and expenses properly payable by a fund, approved by the Board.
For Equity and Balanced Funds, except for RiverSource S&P 500 Index, RiverSource Small Company Index and the Seligman funds, before the fee based on the asset charge is paid, it is adjusted for the fund’s investment performance relative to a Performance Incentive Adjustment Index (PIA Index) as shown in the table below. The adjustment increased or decreased the fee for the last fiscal period as shown in the following table. The table is organized by fiscal year end. You can find your fund’s fiscal year end in Table 1.
Table 14. PIA Indexes
| | | | | | |
Fund | | PIA Index | | Fee Increase or
(Decrease) | |
Fiscal year ending March 31 | | | | | | |
Columbia Equity Value | | Lipper Large-Cap Value Funds Index | | $ | (84,713 | ) |
RiverSource Precious Metals and Mining | | Lipper Precious Metals Funds Index | | | 5,214 | |
Fiscal year ending April 30 | | | | | | |
Columbia 120/20 Contrarian Equity | | Russell 3000 Index | | | (16,065 | ) |
Columbia Recovery and Infrastructure | | S&P 500 Index | | | N/A | (a) |
Fiscal year ending May 31 | | | | | | |
Columbia Multi-Advisor Small Cap Value | | Lipper Small-Cap Value Funds Index | | | 353,598 | |
RiverSource Partners Fundamental Value | | Lipper Large-Cap Core Funds Index | | | 135,795 | |
Fiscal year ending June 30 | | | | | | |
Columbia Dividend Opportunity | | Lipper Equity Income Funds Index | | | 902,715 | |
RiverSource Real Estate | | Lipper Real Estate Funds Index | | | 52,237 | |
Fiscal year ending July 31 | | | | | | |
Columbia Large Core Quantitative | | Lipper Large-Cap Core Funds Index | | | (789,031 | ) |
RiverSource Disciplined Small and Mid Cap Equity | | Lipper Mid-Cap Core Funds Index | | | (126,252 | ) |
RiverSource Disciplined Small Cap Value | | Lipper Small-Cap Value Funds Index | | | (56,412 | ) |
Fiscal year ending September 30 | | | | | | |
Columbia Diversified Equity Income | | Lipper Equity Income Funds Index | | | (5,590,723 | ) |
Columbia Large Growth Quantitative | | Lipper Large-Cap Growth Funds Index | | | (9,448 | ) |
105
| | | | | |
Columbia Large Value Quantitative | | Lipper Large-Cap Value Funds Index | | (33,219 | ) |
Columbia Mid Cap Value Opportunity | | Lipper Mid-Cap Value Funds Index | | (2,112,990 | ) |
Columbia Strategic Allocation | | Lipper Flexible Portfolio Funds Index | | (556,345 | ) |
RiverSource Balanced | | Lipper Balanced Funds Index | | (474,081 | ) |
Fiscal year ending October 31 | | | | | |
Columbia Asia Pacific ex-Japan | | MSCI All Country Asia Pacific Ex-Japan Index | | N/A | (b) |
Columbia Emerging Markets Opportunity | | Lipper Emerging Markets Funds Index | | (54,050 | ) |
Columbia European Equity | | Lipper European Funds Index | | 97,462 | |
Columbia Global Equity | | Lipper Global Funds Index | | (446,000 | ) |
Columbia Global Extended Alpha | | MSCI All Country World Index | | N/A | (c) |
Columbia Multi-Advisor International Value | | Lipper International Multi-Cap Value Funds Index | | (1,510,778 | ) |
RiverSource Disciplined International Equity | | Lipper International Large-Cap Core Funds Index | | (629,082 | ) |
RiverSource Partners International Select Growth | | Lipper International Multi-Cap Growth Funds Index | | (267,871 | ) |
RiverSource Partners International Small Cap | | Lipper International Small-Cap Funds Index | | (48,195 | ) |
Threadneedle Global Equity Income | | MSCI All Country World Index | | 10,034 | |
Threadneedle International Opportunity | | Lipper International Large-Cap Core Funds Index | | 286,033 | |
Fiscal year ending November 30 | | | | | |
Columbia Mid Cap Growth Opportunity | | Lipper Mid-Cap Growth Funds Index | | 469,963 | |
| (a) | The first performance incentive adjustment will be made on March 1, 2011. See section titled “Transaction Period” below. |
| (b) | The first performance incentive adjustment will be made Feb. 1, 2010. See section titled “Transition Period” below. |
| (c) | The first performance incentive adjustment will be made on Aug. 1, 2010. See section titled “Transition Period” below. |
For all funds noted in Table 14 EXCEPT Columbia 120/20 Contrarian Equity, Columbia Recovery and Infrastructure, and Columbia Global Extended Alpha:
The adjustment will be determined monthly by measuring the percentage difference over a rolling 12-month period (subject to earlier determination based on the Transition Period, as set forth below) between the annualized performance of one Class A share of the fund and the annualized performance of the PIA Index (“performance difference”). The performance difference is then used to determine the adjustment rate. The adjustment rate, computed to five decimal places, is determined in accordance with the following table and is applied against average daily net assets for the applicable rolling 12-month period or Transition Period, and divided by 12 to obtain the fee reflecting the performance fee adjustment for that month. The table is organized by fund category. You can find your fund’s category in Table 1.
Table 15A. Performance Incentive Adjustment Calculation
| | | | | | | |
| Equity Funds | | Balanced Funds |
Performance
Difference | | Adjustment Rate | | Performance
Difference | | | Adjustment Rate |
| 0.00% – 0.50% | | 0 | | 0.00% – 0.50 | % | | 0 |
| 0.50% – 1.00% | | 6 basis points times the performance difference over 0.50%, times 100 (maximum of 3 basis points if a 1% performance difference) | | 0.50% – 1.00 | % | | 6 basis points times the performance difference over 0.50%, times 100 (maximum of 3 basis points if a 1% performance difference) |
| 1.00% – 2.00% | | 3 basis points, plus 3 basis points times the performance difference over 1.00%, times 100 (maximum 6 basis points if a 2% performance difference) | | 1.00% – 2.00 | % | | 3 basis points, plus 3 basis points times the performance difference over 1.00%, times 100 (maximum 6 basis points if a 2% performance difference) |
| 2.00% – 4.00% | | 6 basis points, plus 2 basis points times the performance difference over 2.00%, times 100 (maximum 10 basis points if a 4% performance difference) | | 2.00% – 3.00 | % | | 6 basis points, plus 2 basis points times the performance difference over 2.00%, times 100 (maximum 8 basis points if a 3% performance difference) |
| 4.00% – 6.00% | | 10 basis points, plus 1 basis point times the performance difference over 4.00%, times 100 (maximum 12 basis points if a 6% performance difference) | | 3.00% or more | | | 8 basis points |
| | | |
| 6.00% or more | | 12 basis points | | N/A | | | |
106
For example, if the performance difference for an Equity Fund is 2.38%, the adjustment rate is 0.000676 (0.0006 [6 basis points] plus 0.0038 [the 0.38% performance difference over 2.00%] x 0.0002 [2 basis points] x 100 (0.000076)). Rounded to five decimal places, the adjustment rate is 0.00068. The maximum adjustment rate for the fund is 0.0012 per year. Where the fund’s Class A performance exceeds that of the PIA Index, the fee paid to the investment manager will increase. Where the performance of the PIA Index exceeds the performance of the fund’s Class A shares, the fee paid to the investment manager will decrease. The 12-month comparison period rolls over with each succeeding month, so that it always equals 12 months, ending with the month for which the performance adjustment is being computed.
Transition Period
The performance incentive adjustment will not be calculated for the first 6 months from the inception of the fund. After 6 full calendar months, the performance fee adjustment will be determined using the average assets and performance difference over the first 6 full calendar months, and the adjustment rate will be applied in full. Each successive month an additional calendar month will be added to the performance adjustment computation. After 12 full calendar months, the full rolling 12-month period will take affect.
Change in Index
If the PIA Index ceases to be published for a period of more than 90 days, changes in any material respect, otherwise becomes impracticable or, at the discretion of the Board, is no longer appropriate to use for purposes of a performance incentive adjustment, for example, if Lipper reclassifies the fund from one peer group to another, the Board may take action it deems appropriate and in the best interests of shareholders, including: (1) discontinuance of the performance incentive adjustment until such time as it approves a substitute index; or (2) adoption of a methodology to transition to a substitute index it has approved.
In the case of a change in the PIA Index, a fund’s performance will be compared to a 12-month blended index return that reflects the performance of the current index for the portion of the 12-month performance measurement period beginning the effective date of the current index and the performance of the prior index for the remainder of the measurement period. At the conclusion of the transition period, the performance of the prior index will be eliminated from the performance incentive adjustment calculation, and the calculation will include only the performance of the current index.
For Columbia 120/20 Contrarian Equity, Columbia Recovery and Infrastructure, and Columbia Global Extended Alpha:
The adjustment will be determined monthly by measuring the percentage difference over a rolling 36-month period (subject to earlier determination based on the Transition Period, as set forth below) between the annualized performance of one Class A share of the fund and the annualized performance of the PIA Index (“performance difference”). The performance difference will then be used to determine the adjustment rate. The adjustment rate, computed to five decimal places, is determined in accordance with the following table and is applied against average daily net assets for the applicable rolling 36-month period or Transition Period, and divided by 12 to obtain the fee reflecting the performance fee adjustment for that month.
Table 15B. Performance Incentive Adjustment Calculation
| | | | | | | |
| | | | | Columbia 120/20 Contrarian Equity
Columbia Global Extended Alpha |
| Columbia Recovery and Infrastructure | |
Performance
Difference | | Adjustment Rate | | Performance
Difference | | | Adjustment Rate |
| 0.00% – 0.50% | | 0 | | 0.00% – 1.00 | % | | 0 |
| 0.50% – 1.00% | | 6 basis points times the performance difference over 0.50%, times 100 (maximum of 3 basis points if a 1% performance difference) | | 1.00% – 6.00 | % | | 10 basis points times the performance difference over 1.00%, times 100 (maximum 50 basis points if a 6% performance difference) |
| 1.00% – 2.00% | | 3 basis points, plus 3 basis points times the performance difference over 1.00%, times 100 (maximum 6 basis points if a 2% performance difference) | | 6.00% or more | | | 50 basis points |
| 2.00% – 4.00% | | 6 basis points, plus 2 basis points times the performance difference over 2.00%, times 100 (maximum 10 basis points if a 4% performance difference) | | N/A | | | |
| 4.00% – 6.00% | | 10 basis points, plus 1 basis point times the performance difference over 4.00%, times 100 (maximum 12 basis points if a 6% performance difference) | | N/A | | | |
| 6.00% or more | | 12 basis points | | N/A | | | |
107
For example, if the performance difference for Columbia 120/20 Contrarian Equity is 2.38%, the adjustment rate is 0.00138 [the 1.38% performance difference over 1.00%] x 0.0010 [10 basis points] x 100. Rounded to five decimal places, the adjustment rate is 0.00138. This adjustment rate of 0.00138 is then applied against the average daily net assets for the applicable rolling 36-month or Transition Period, and divided by 12, which provides the performance adjustment fee for that month. Where the fund’s Class A performance exceeds that of the PIA Index for the applicable rolling 36-month period or Transition Period, the fee paid to the investment manager will increase by the adjustment rate. Where the performance of the PIA Index exceeds the performance of the fund’s Class A shares for the applicable rolling 36-month period or Transition Period, the fee paid to the Investment Manager will decrease by the adjustment rate.
The 36-month comparison period rolls over with each succeeding month, so that it always equals 36 months, ending with the month for which the performance adjustment is being computed.
Transition Period
The performance incentive adjustment will not be calculated for the first 24 months from the inception of the fund. After 24 full calendar months, the performance fee adjustment will be determined using the average assets and Performance Difference over the first 24 full calendar months, and the Adjustment Rate will be applied in full. Each successive month an additional calendar month will be added to the performance adjustment computation. After 36 full calendar months, the full rolling 36-month period will take affect.
Change in Index
If the PIA Index ceases to be published for a period of more than 90 days, changes in any material respect, otherwise becomes impracticable or, at the discretion of the Board, is no longer appropriate to use for purposes of a performance incentive adjustment, the Board may take action it deems appropriate and in the best interests of shareholders, including: (1) discontinuance of the performance incentive adjustment until such time as it approves a substitute index, or (2) adoption of a methodology to transition to a substitute index it has approved.
In the case of a change the PIA Index, a fund’s performance will be compared to a 36-month blended index return that reflects the performance of the current index for the portion of the 36-month performance measurement period beginning the effective date of the current index and the performance of the prior index for the remainder of the measurement period. At the conclusion of the transition period, the performance of the prior index will be eliminated from the performance incentive adjustment calculation, and the calculation will include only the performance of the current index.
The table below shows the total management fees paid by each fund for the last three fiscal periods as well as nonadvisory expenses, net of earnings credits, waivers and expenses reimbursed by the investment manager and its affiliates. The table is organized by fiscal year end. You can find your fund’s fiscal year end in Table 1.
Table 16. Management Fees and Nonadvisory Expenses
| | | | | | | | | | | | | | | | |
| | | Management Fees | | Nonadvisory expenses | |
Fund | | 2010 | | 2009 | | 2008 | | 2010 | | 2009 | | 2008 | |
For funds with fiscal period ending January 31 | | | | | | | | | | | | | | | | |
Columbia Income Builder Fund | | N/A | | N/A | | N/A | | $ | 101,055 | | $ | 139,640 | | $ | 103,636 | (a) |
Columbia Income Builder Fund II | | N/A | | N/A | | N/A | | | 109,874 | | | 175,842 | | | 129,062 | (a) |
Columbia Income Builder Fund III | | N/A | | N/A | | N/A | | | 112,467 | | | 118,255 | | | 134,546 | (a) |
Columbia Portfolio Builder Aggressive | | N/A | | N/A | | N/A | | | 107,162 | | | 199,501 | | | 168,942 | |
Columbia Portfolio Builder Conservative | | N/A | | N/A | | N/A | | | 151,416 | | | 146,492 | | | 96,147 | |
Columbia Portfolio Builder Moderate | | N/A | | N/A | | N/A | | | 272,479 | | | 278,861 | | | 247,980 | |
Columbia Portfolio Builder Moderate Aggressive | | N/A | | N/A | | N/A | | | 290,338 | | | 299,503 | | | 247,472 | |
108
| | | | | | | | | | | | | | | | | | | | | | | |
Columbia Portfolio Builder Moderate Conservative | | | N/A | | | N/A | | | | N/A | | | | 164,289 | | | | 170,774 | | | | 117,533 | |
Columbia Portfolio Builder Total Equity | | | N/A | | | N/A | | | | N/A | | | | 28,299 | | | | 149,589 | | | | 173,675 | |
RiverSource S&P 500 Index | | $ | 255,644 | | $ | 371,178 | | | $ | 579,548 | | | | (29,594 | ) | | | (194,370 | ) | | | (254,777 | ) |
RiverSource Small Company Index | | | 1,306,919 | | | 1,990,095 | | | | 3,292,392 | | | | (1,051,278 | ) | | | (1,171,627 | ) | | | (1,007,306 | ) |
For funds with fiscal period ending March 31 | |
Columbia Equity Value | | | 3,406,527 | | | 4,340,117 | | | | 6,797,853 | | | | 309,679 | | | | 343,552 | | | | 413,170 | |
RiverSource Precious Metals and Mining | | | 1,112,166 | | | 824,176 | | | | 956,280 | | | | 144,675 | | | | 242,615 | | | | 175,405 | |
For funds with fiscal period ending April 30 | |
Columbia 120/20 Contrarian Equity | | $ | 360,835 | | | 368,969 | | | | 159,311 | (b) | | $ | 31,738 | | | | 34,475 | | | | 21,297 | (b) |
Columbia Recovery and Infrastructure | | | 2,163,593 | | | 45,652 | (c) | | | N/A | | | | 232,888 | | | | 18,717 | (c) | | | N/A | |
Columbia Retirement Plus 2010 | | | N/A | | | N/A | | | | N/A | | | | (2,671 | ) | | | (4,254 | ) | | | 41 | |
Columbia Retirement Plus 2015 | | | N/A | | | N/A | | | | N/A | | | | (7,079 | ) | | | (7,894 | ) | | | 310 | |
Columbia Retirement Plus 2020 | | | N/A | | | N/A | | | | N/A | | | $ | (7,779 | ) | | $ | (9,956 | ) | | $ | 745 | |
Columbia Retirement Plus 2025 | | | N/A | | | N/A | | | | N/A | | | | (11,346 | ) | | | (12,026 | ) | | | 332 | |
Columbia Retirement Plus 2030 | | | N/A | | | N/A | | | | N/A | | | | (9,157 | ) | | | (9,748 | ) | | | 431 | |
Columbia Retirement Plus 2035 | | | N/A | | | N/A | | | | N/A | | | | (8,136 | ) | | | (7,948 | ) | | | 487 | |
Columbia Retirement Plus 2040 | | | N/A | | | N/A | | | | N/A | | | | (7,439 | ) | | | (6,946 | ) | | | (796 | ) |
Columbia Retirement Plus 2045 | | | N/A | | | N/A | | | | N/A | | | | (7,533 | ) | | | (6,418 | ) | | | (2,131 | ) |
For funds with fiscal period ending May 31 | |
Columbia High Yield Bond | | $ | 9,691,900 | | $ | 6,353,707 | | | $ | 9,610,610 | | | | (400,525 | ) | | | (748,008 | ) | | | 665,785 | |
Columbia Multi-Advisor Small Cap Value | | | 3,968,159 | | | 3,098,591 | | | | 6,511,571 | | | | (684,318 | ) | | | (963,886 | ) | | | (972,781 | ) |
Columbia U.S. Government Mortgage | | | 1,247,010 | | | 1,731,277 | | | | 1,958,404 | | | | (256,078 | ) | | | (327,855 | ) | | | (389,262 | ) |
RiverSource Partners Fundamental Value | | | 4,305,601 | | | 4,416,792 | | | | 7,668,633 | | | | (775,463 | ) | | | (939,055 | ) | | | (213,716 | ) |
RiverSource Short Duration U.S. Government | | | 3,287,540 | | | 3,665,529 | | | | 3,816,196 | | | | (877,297 | ) | | | (610,585 | ) | | | (771,512 | ) |
For funds with fiscal period ending June 30 | |
Columbia Dividend Opportunity | | | 8,065,963 | | | 6,381,215 | | | | 12,015,660 | | | | (91,086 | ) | | | (502,682 | ) | | | 626,341 | |
RiverSource Real Estate | | | 1,498,361 | | | 1,227,857 | | | | 1,667,040 | | | | (83,163 | ) | | | (18,514 | ) | | | 138,649 | |
For funds with fiscal period ending July 31 | |
Columbia Floating Rate | | | 2,466,113 | | | 2,210,544 | | | | 3,509,190 | | | | 226,409 | | | | (61,933 | ) | | | 293,676 | |
Columbia Income Opportunities | | | 4,451,807 | | | 1,913,521 | | | | 1,767,885 | | | | 313,169 | | | | 291,601 | | | | 196,944 | |
Columbia Inflation Protected Securities | | | 2,886,405 | | | 3,322,371 | | | | 2,554,103 | | | | (354,181 | ) | | | (115,062 | ) | | | (238,396 | ) |
Columbia Large Core Quantitative | | | 21,017,705 | | | 9,909,438 | | | | 17,556,244 | | | | (4,112,307 | ) | | | 268,796 | | | | 726,080 | |
Columbia Limited Duration Credit | | | 2,186,361 | | | 844,435 | | | | 792,200 | | | | (272,368 | ) | | | (68,816 | ) | | | (78,320 | ) |
Columbia Money Market | | | 8,951,478 | | | 12,658,313 | | | | 15,026,220 | | | | (13,410,378 | ) | | | (1,868,463 | ) | | | 1,290,897 | |
RiverSource Disciplined Small and Mid Cap Equity | | | 851,036 | | | 853,191 | | | | 365,578 | | | | 162,170 | | | | 143,015 | | | | 125,645 | |
RiverSource Disciplined Small Cap Value | | | 375,114 | | | 363,926 | | | | 286,759 | | | | 55,844 | | | | 47,195 | | | | 33,868 | |
| | | | | | |
| | | 2009 | | 2008 | | | 2007 | | | 2009 | | | 2008 | | | 2007 | |
For funds with fiscal period ending August 31 | | | | | | | | | | | | | | | | | | | | |
Columbia Diversified Bond | | | 15,648,683 | | | 14,772,880 | | | | 12,770,016 | | | | (2,314,025 | ) | | | (461,298 | ) | | | (1,129,485 | ) |
Columbia Minnesota Tax-Exempt | | | 1,230,393 | | | 1,246,083 | | | | 1,351,439 | | | | 196,213 | | | | 506,328 | | | | 676,782 | |
RiverSource California Tax-Exempt | | | 663,711 | | | 715,946 | | | | 717,999 | | | | 73,054 | | | | 44,499 | | | | 20,854 | |
RiverSource New York Tax-Exempt | | | 220,172 | | | 242,807 | | | | 279,438 | | | | 9,792 | | | | 75,790 | | | | 134,099 | |
For funds with fiscal period ending September 30 | |
Columbia Diversified Equity Income | | $ | 17,053,076 | | $ | 44,177,652 | | | $ | 42,530,087 | | | $ | 1,037,819 | | | $ | 1,905,627 | | | $ | 1,561,033 | |
Columbia Large Growth Quantitative | | | 2,033,555 | | | 905,956 | | | | 114,048 | (d) | | | 214,462 | | | | 195,661 | | | | 54,709 | (d) |
Columbia Large Value Quantitative | | | 661,677 | | | 6,618 | (e) | | | N/A | | | | 168,055 | | | | 2,877 | (e) | | | N/A | |
Columbia Mid Cap Value Opportunity | | | 9,896,881 | | | 18,813,340 | | | | 15,908,732 | | | | 776,726 | | | | 992,201 | | | | 826,273 | |
Columbia Strategic Allocation | | | 6,604,411 | | | 10,108,947 | | | | 11,025,000 | | | | 585,299 | | | | 1,047,907 | | | | 921,198 | |
RiverSource Balanced | | | 2,483,462 | | | 3,977,541 | | | | 6,315,077 | | | | 346,693 | | | | 437,940 | | | | 368,447 | |
RiverSource Strategic Income Allocation | | | 1,081,850 | | | 904,660 | | | | 168,875 | (d) | | | 246,334 | | | | 294,099 | | | | 76,656 | (d) |
109
| | | | | | | | | | | | | | | | | | | | | | | |
Seligman California Municipal High-Yield | | | 164,150 | | | | 173,288 | | | | 174,700 | | | 32,933 | | | | 53,665 | | | | 32,890 | |
Seligman California Municipal Quality | | | 192,624 | | | | 196,281 | | | | 214,476 | | | 60,833 | | | | 90,615 | | | | 72,092 | |
Seligman Minnesota Municipal | | | 324,501 | | | | 351,237 | | | | 375,995 | | | 68,180 | | | | 99,131 | | | | 88,809 | |
Seligman New York Municipal | | | 352,211 | | | | 332,574 | | | | 342,695 | | | 75,556 | | | | 88,770 | | | | 71,419 | |
Seligman National Municipal | | | 1,147,080 | | | | 304,747 | | | | 327,359 | | | 62,006 | | | | 106,685 | | | | 95,664 | |
Seligman TargETFund 2015 | | | 121,554 | | | | 207,083 | | | | 184,907 | | | (54,705 | ) | | | (4,193 | ) | | | 7,243 | |
Seligman TargETFund 2025 | | | 136,473 | | | | 210,264 | | | | 157,846 | | | (68,782 | ) | | | (13,470 | ) | | | (551 | ) |
Seligman TargETFund 2035 | | | 35,438 | | | | 32,294 | | | | 6,852 | | | (18,456 | ) | | | (5,254 | ) | | | (15,347 | ) |
Seligman TargETFund 2045 | | | 19,710 | | | | 22,283 | | | | 4,354 | | | (12,505 | ) | | | (3,570 | ) | | | (4,094 | ) |
Seligman TargETFund Core | | | 272,984 | | | | 457,038 | | | | 382,979 | | | (119,771 | ) | | | (10,950 | ) | | | 17,561 | |
For funds with fiscal period ending October 31 | | | | | | | | | | | | | | | | |
Columbia Absolute Return Currency and Income | | $ | 4,698,565 | | | $ | 4,188,137 | | | $ | 887,341 | | $ | 205,127 | | | $ | 313,877 | | | $ | 103,119 | |
Columbia Asia Pacific ex-Japan | | | 78,072 | (f) | | | N/A | | | | N/A | | | 21,500 | (f) | | | N/A | | | | N/A | |
Columbia Emerging Markets Bond | | | 1,320,292 | | | | 1,182,004 | | | | 706,943 | | | 82,201 | | | | 172,124 | | | | 120,044 | |
Columbia Emerging Markets Opportunity | | | 3,791,476 | | | | 7,352,591 | | | | 7,106,815 | | | 524,327 | | | | 1,138,897 | | | | 1,190,259 | |
Columbia European Equity | | | 600,499 | | | | 980,629 | | | | 952,484 | | | (31,736 | ) | | | 223,792 | | | | 199,237 | |
Columbia Frontier | | | 321,582 | | | | 579,499 | | | | 766,116 | | | (20,898 | ) | | | 200,110 | | | | 250,909 | |
Columbia Global Bond | | | 3,551,274 | | | | 5,074,934 | | | | 3,438,893 | | | (33,836 | ) | | | 165,694 | | | | (17,529 | ) |
Columbia Global Equity | | | 2,918,784 | | | | 5,825,153 | | | | 6,075,014 | | | 350,276 | | | | 554,139 | | | | 577,463 | |
Columbia Global Extended Alpha | | | 64,424 | | | | 16,485 | (g) | | | N/A | | | 4,234 | | | | 1,122 | (g) | | | N/A | |
Columbia Multi-Advisor International Value | | | 5,749,639 | | | | 13,239,202 | | | | 20,067,871 | | | 511,602 | | | | 1,054,830 | | | | 1,286,758 | |
Columbia Seligman Global Technology | | | 2,551,543 | | | | 3,571,473 | | | | 3,876,481 | | | 386,252 | | | | 680,094 | | | | 707,762 | |
RiverSource Disciplined International Equity | | | 2,174,525 | | | | 5,209,129 | | | | 2,161,563 | | | 252,387 | | | | 512,793 | | | | 358,005 | |
RiverSource Partners International Select Growth | | | 3,240,723 | | | | 5,965,413 | | | | 6,048,963 | | | (660,493 | ) | | | 334,550 | | | | 672,542 | |
RiverSource Partners International Small Cap | | | 496,177 | | | | 1,057,146 | | | | 1,270,558 | | | (45,193 | ) | | | 63,912 | | | | 208,621 | |
Threadneedle Global Equity Income | | | 177,834 | | | | 15,723 | (g) | | | N/A | | | 25,200 | | | | 2,989 | (g) | | | N/A | |
Threadneedle International Opportunity | | | 3,074,518 | | | | 4,661,800 | | | | 4,923,040 | | | 283,182 | | | | 486,074 | | | | 545,663 | |
For funds with fiscal period ending November 30 | | | | | | | | | | | | | | | | |
Columbia AMT-Free Tax-Exempt Bond | | | 2,699,258 | | | | 2,764,541 | | | | 3,157,092 | | | 48,345 | | | | 506,736 | | | | (8,650 | ) |
Columbia Mid Cap Growth Opportunity | | | 4,488,355 | | | | 4,726,590 | | | | 6,373,531 | | | 281,069 | | | | 437,496 | | | | 241,412 | |
RiverSource Intermediate Tax-Exempt | | | 339,947 | | | | 291,762 | | | | 321,011 | | | 8,313 | | | | 2,588 | | | | (4,565 | ) |
RiverSource Tax-Exempt High Income | | | 10,226,940 | | | | 11,447,732 | | | | 13,006,578 | | | (1,338,742 | ) | | | 2,984,232 | | | | (847,490 | ) |
For funds with fiscal period ending December 31 | | | | | | | | | | | | | | | | |
Columbia Government Money Market | | $ | 518,174 | | | $ | 893,335 | | | $ | 776,197 | | $ | (1,105,030 | ) | | $ | 6,551 | | | $ | 300,969 | |
Columbia Select Large-Cap Value | | | 1,486,938 | | | | 1,732,331 | | | | 2,163,189 | | | 292,721 | | | | 282,371 | | | | 293,338 | |
Columbia Select Smaller-Cap Value | | | 1,687,329 | | | | 2,048,229 | | | | 3,132,296 | | | (186,016 | ) | | | 295,691 | | | | 337,798 | |
Columbia Seligman Communications and Information | | | 25,152,110 | | | | 28,854,808 | | | | 34,908,273 | | | 1,991,333 | | | | 2,540,656 | | | | 2,783,442 | |
RiverSource LaSalle Global Real Estate | | | 114,310 | | | | 243,213 | | | | 297,971 | | | (8,058 | ) | | | 221,303 | | | | (104,511 | ) |
RiverSource LaSalle Monthly Dividend Real Estate | | | 208,539 | | | | 460,038 | | | | 827,966 | | | (107,139 | ) | | | 177,277 | | | | (30,072 | ) |
Seligman Capital | | | 1,731,065 | | | | 2,912,130 | | | | 3,982,898 | | | 370,916 | | | | 386,885 | | | | 427,027 | |
Seligman Growth | | | 4,254,428 | | | | 2,534,267 | | | | 3,101,571 | | | 85,442 | | | | 387,623 | | | | 404,127 | |
| (a) | The fund changed its fiscal year end effective Jan. 31, 2008 from May 31 to Jan. 31. For 2008, the information shown is for the period from June 1, 2007 through Jan. 31, 2008. For years prior to 2008, the fiscal period ended on May 31. |
| (b) | For the period from Oct. 18, 2007 (when shares became publicly available) to April 30, 2008. |
110
| (c) | For the fiscal period from Feb. 19, 2009 (when shares became publicly available) to April 30, 2009. |
| (d) | For the period from May 17, 2007 (when shares became publicly available) to Sept. 30, 2007. |
| (e) | For the period from Aug. 1, 2008 (when shares became publicly available) to Sept. 30, 2008. |
| (f) | For the period from July 15, 2009 (when the Fund became available) to Oct. 31, 2009. |
| (g) | For the period from Aug. 1, 2008 (when shares became publicly available) to Oct. 31, 2008. |
Manager of Managers Exemption
The funds have received an order from the SEC that permits Columbia Management, subject to the approval of the Board, to appoint a subadviser or change the terms of a subadvisory agreement for a fund without first obtaining shareholder approval. The order permits the fund to add or change unaffiliated subadvisers or the fees paid to subadvisers from time to time without the expense and delays associated with obtaining shareholder approval of the change.
For all Seligman funds and for Columbia Frontier, Columbia Seligman Global Technology, Columbia Seligman Communications and Information, Columbia Select Large-Cap Value, Columbia Select Smaller-Cap Value, RiverSource California Tax-Exempt, RiverSource Cash Management, Columbia Diversified Bond, Columbia Global Bond, Columbia High Yield Bond, RiverSource Intermediate Tax-Exempt, Columbia Minnesota Tax-Exempt, RiverSource New York Tax-Exempt, RiverSource Short Duration U.S. Government, Columbia AMT-Free Tax-Exempt Bond, RiverSource Tax-Exempt High Income and Columbia U.S. Government Mortgage funds: if the fund was to seek to rely on the order, holders of a majority of the fund’s outstanding voting securities would need to approve operating the fund in this manner. There is no assurance shareholder approval, if sought, will be received, and no changes will be made without shareholder approval until that time.
Subadvisory Agreements
The assets of certain funds are managed by subadvisers that have been selected by the investment manager, subject to the review and approval of the Board. The investment manager has recommended the subadvisers to the Board based upon its assessment of the skills of the subadvisers in managing other assets with objectives and investment strategies substantially similar to those of the applicable fund. Short-term investment performance is not the only factor in selecting or terminating a subadviser, and the investment manager does not expect to make frequent changes of subadvisers. Certain subadvisers, affiliated with the investment manager, have been directly approved by shareholders. These subadvisers are noted in Table 17.
The investment manager allocates the assets of a fund with multiple subadvisers among the subadvisers. Each subadviser has discretion, subject to oversight by the Board and the investment manager, to purchase and sell portfolio assets, consistent with the fund’s investment objectives, policies, and restrictions. Generally, the services that a subadviser provides to the fund are limited to asset management and related recordkeeping services.
The investment manager has entered into an advisory agreement with each subadviser under which the subadviser provides investment advisory assistance and day-to-day management of some or all of the fund’s portfolio, as well as investment research and statistical information. A subadviser may also serve as a discretionary or non-discretionary investment adviser to management or advisory accounts that are unrelated in any manner to the investment manager or its affiliates.
111
The following table shows the advisory fee schedules for fees paid by the investment manager to subadvisers for funds that have subadvisers. The table is organized by fiscal year end. You can find your fund’s fiscal year end in Table 1.
Table 17. Subadvisers and Subadvisory Agreement Fee Schedules
| | | | | | |
Fund | | Subadviser | | Parent
Company | | Fee Schedule |
For funds with fiscal period ending May 31 | | | | |
Columbia Multi-Advisor Small Cap Value | | Barrow, Hanley, Mewhinney & Strauss (BHMS)(a) (effective March 12, 2004) | | A | | 1.00% on the first $10 million, reducing to 0.30% as assets increase |
| | Donald Smith & Co., Inc. (Donald Smith)(a) (effective March 12, 2004) | | N/A | | 0.60% on the first $175 million, reducing to 0.55% as assets increase |
| | Metropolitan West Capital Management, LLC (MetWest Capital) (effective April 24, 2006) | | B | | 0.50% on all assets |
| | Turner Investment Partners, Inc. (Turner) (effective Feb. 19, 2010) | | N/A | | 0.50% on the first $50 million, reducing to 0.35% as assets increase.(a) |
RiverSource Partners Fundamental Value | | Davis Selected Advisers, LP (Davis)(a), (b) (effective June 18, 2001) | | N/A | | 0.45% on the first $100 million, reducing to 0.25% as assets increase |
For funds with fiscal period ending October 31 | | | | |
Columbia Asia Pacific ex-Japan | | Threadneedle International Limited(b) (Threadneedle) (effective July 15, 2009) | | D | | 0.50% on the first $250 million, reducing to 0.40% as assets increase, and subject to a performance incentive adjustment(c) |
Columbia Emerging Markets Opportunity | | Threadneedle(b) (effective July 9, 2004) | | D | | 0.45% of the first $150 million, reducing to 0.30% as assets increase, and subject to a performance incentive adjustment(c) |
Columbia European Equity | | Threadneedle(b) (effective July 9, 2004) | | D | | 0.35% of the first $150 million, reducing to 0.20% as assets increase, and subject to a performance incentive adjustment(c) |
Columbia Global Equity | | Threadneedle(b) (effective July 9, 2004) | | D | | 0.35% of the first $150 million, reducing to 0.20% as assets increase, and subject to a performance incentive adjustment(b) |
Columbia Global Extended Alpha | | Threadneedle(b) (effective Aug. 1, 2008) | | D | | 0.70% of the first $250 million, reducing to 0.60% as assets increase, and subject to a performance incentive adjustment(c) |
Columbia Multi-Advisor International Value | | AllianceBernstein L.P. (AllianceBernstein) (effective Sept. 17, 2001) | | N/A | | 0.65% on the first $75 million, reducing to 0.30% as assets increase |
| | Mondrian Investment Partners Limited (Mondrian) (effective August 18, 2008) | | N/A | | 0.70% on all assets |
| | Tradewinds Global Investors, LLC (Tradewinds) (effective August 18, 2008) | | N/A | | 0.50% on the first $250 million, reducing to 0.40 as assets increase |
RiverSource Partners International Select Growth | | Columbia Wanger Asset Management L.P. (Columbia WAM)(a),(d) (effective Sept. 5, 2001) | | C | | 0.70% on the first $150 million, reducing to 0.50% as assets increase |
112
| | | | | | |
RiverSource Partners International Small Cap | | Columbia WAM(a),(d) (effective Aug. 10, 2009) | | C | | 0.70% on the first $150 million, reducing to 0.50% as assets increase |
Threadneedle Global Equity Income | | Threadneedle(b) (effective Aug. 1, 2008) | | D | | 0.45% of the first $250 million, reducing to 0.35% as assets increase, and subject to a performance incentive adjustment(c) |
Threadneedle International Opportunity | | Threadneedle(b) (effective July 9, 2004) | | D | | 0.35% of the first $150 million, reducing to 0.20% as assets increase, and subject to a performance incentive adjustment(c) |
For funds with fiscal period ended December 31 | | | | |
RiverSource LaSalle Global Real Estate | | LaSalle Investment Management (Securities), L.P. (LaSalle Securities U.S.) (since inception) | | E | | 0.30% on the first $37 million, 0.65% on the next $43 million, and 0.49% thereafter. |
RiverSource LaSalle Monthly Dividend Real Estate | | LaSalle Securities U.S. (since inception) | | E | | 0.30% on the first $58 million, 0.65% on the next $42 million, and 0.45% thereafter. |
| (a) | The fee is calculated based on the combined net assets subject to the subadviser’s investment management. |
| (b) | Davis is a 1940 Act affiliate of the investment manager because it owns or has owned more than 5% of the publicly issued securities of the investment manager’s parent company, Ameriprise Financial. Threadneedle is an affiliate of the investment manager as an indirect, wholly-owned subsidiary of Ameriprise Financial. |
| (c) | The adjustment for Threadneedle is based on the performance of one Class A share of the fund and the change in the PIA Index described in Table 14. The performance of the fund and the Index will be calculated using the method described above for the performance incentive adjustment paid to the investment manager under the terms of the Investment Management Services Agreement. The amount of the adjustment to Threadneedle’s fee, whether positive or negative, shall be equal to the following amount of the performance incentive adjustment made to the investment management fee payable to the investment manager under the terms of the Investment Management Services Agreement: 50% for Threadneedle Emerging Markets, Threadneedle European Equity, Threadneedle Global Equity and Threadneedle International Opportunity; 100% for Threadneedle Global Equity Income and Threadneedle Global Extended Alpha. The performance incentive adjustment was effective Dec. 1, 2004. |
| (d) | On May 1, 2010, Ameriprise Financial announced the closing of its acquisition of the long-term asset management business of Columbia Management Group, LLC, including Columbia WAM, from Bank of America (the “Columbia Transaction”). As a result of the Columbia Transaction, Columbia WAM is an indirect, wholly-owned subsidiary of Ameriprise Financial. |
| | |
| A – | | BHMS is an independent-operating subsidiary of Old Mutual Asset Management. |
| |
| B – | | Metropolitan West Capital Management, LLC (MetWest Capital) is a subsidiary of Wells Fargo & Company and operates within the Evergreen Investments unit of its asset management division. |
| |
| C – | | Columbia WAM is an indirect wholly-owned subsidiary of Columbia Management Group, Inc., which in turn is a wholly-owned subsidiary of Bank of America Corporation. |
| |
| D – | | Threadneedle is an indirect wholly-owned subsidiary of Ameriprise Financial. |
| |
| E – | | LaSalle Investment Management (Securities), L.P. is an affiliate of Jones Lang LaSalle Incorporated. |
The following table shows the subadvisory fees paid by the investment manager to subadvisers in the last three fiscal periods. The table is organized by fiscal year end. You can find your fund’s fiscal year end in Table 1.
113
Table 18. Subadvisory Fees
| | | | | | | | | | | | | | |
| | | | | Subadvisory Fees Paid | |
Fund | | Subadviser | | 2010 | | | 2009 | | | 2008 | |
For funds with fiscal period ending May 31 | | | | | | | | | | | | | | |
Columbia Multi-Advisor Small Cap Value | | BHMS | | $ | 491,375 | | | $ | 437,027 | | | $ | 865,372 | |
| | Donald Smith | | | 587,548 | | | | 497,789 | | | | 984,692 | |
| | MetWest Capital | | | 491,635 | | | | 466,432 | | | | 955,503 | |
| | Turner | | | 89,142 | (a) | | | N/A | | | | N/A | |
| | Former subadviser: Franklin Portfolio Associates (from March 2004 to June 6, 2008) | | | N/A | | | | 22,583 | | | | 964,510 | |
| | Former subadviser: Federated MDTA, LLC (from June 6, 2008 to Feb. 19, 2010) | | | 325,109 | | | | 443,715 | | | | N/A | (a) |
RiverSource Partners Fundamental Value | | Davis | | | 1,688,264 | | | | 2,020,698 | | | | 3,220,929 | |
| | | | |
| | | | | 2009 | | | 2008 | | | 2007 | |
For funds with fiscal period ending October 31 | | | | | | | | | | | | |
Columbia Asia Pacific ex-Japan | | Threadneedle | | | 42,462 | (e) | | | N/A | | | | N/A | |
Columbia Emerging Markets Opportunity | | Threadneedle | | | 1,469,749 | | | | 2,801,637 | | | | 2,728,720 | |
Columbia European Equity | | Threadneedle | | | 260,772 | | | | 443,279 | | | | 406,594 | |
Columbia Global Equity | | Threadneedle | | | 1,168,151 | | | | 2,269,177 | | | | 2,408,387 | |
Columbia Global Extended Alpha | | Threadneedle | | | 43,117 | | | | 11,750 | (f) | | | N/A | |
Columbia Multi-Advisor | | AllianceBernstein | | | 2,170,338 | | | | 6,268,208 | | | | 7,962,307 | |
International Value | | Mondrian | | | 714,196 | | | | 77,048 | (b) | | | N/A | |
| | Tradewinds | | | 1,116,798 | | | | 129,124 | (b) | | | N/A | |
RiverSource Partners International | | Columbia WAM | | | 956,567 | | | | 1,557,963 | | | | 1,568,158 | |
Select Growth | | Former subadviser: Principal Global | | | 866,239 | | | | 1,849,485 | | | | 1,760,150 | |
| | Investors, LLC (from April 24, 2006 to May 6, 2010) | | | | | | | | | | | | |
RiverSource Partners International | | Columbia WAM | | | 41,203 | (c) | | | N/A | | | | N/A | |
Small Cap | | Former subadviser: Batterymarch | | | 188,913 | | | | 386,194 | | | | 439,593 | |
| | Financial Management, Inc. (from April 24, 2006 to April 30, 2010) | | | | | | | | | | | | |
| | Former subadviser: AIG Global Investment Corp. | | | 127,498 | (d) | | | 355,245 | | | | 425,696 | |
| | (from April 24, 2006 to Aug. 7, 2009) | | | | | | | | | | | | |
Threadneedle Global Equity Income | | Threadneedle | | | 104,654 | | | | 9,057 | (f) | | | N/A | |
Threadneedle International Opportunity | | Threadneedle | | | 1,254,178 | | | | 1,907,215 | | | | 1,895,712 | |
For funds with fiscal period ended December 31 | | | | | | | | | | | | |
RiverSource LaSalle Global Real Estate | | LaSalle Securities U.S. | | $ | 36,482 | | | | 121,606 | | | | 148,985 | |
RiverSource LaSalle Monthly Dividend Real Estate | | LaSalle Securities U.S. | | | 71,093 | | | | 230,019 | | | | 413,983 | |
| (a) | The subadviser did not begin managing the fund until after the fund’s fiscal year end. |
| (b) | For the fiscal period from Aug. 18, 2008 to Oct. 31, 2008. |
| (c) | For the fiscal period from Aug. 10, 2009 to Oct. 31, 2009. |
| (d) | For the fiscal period from Nov. 1, 2008 to Aug. 7, 2009. |
| (e) | For the fiscal period from July 15, 2009 to Oct. 31, 2009. |
| (f) | For the fiscal period from Aug. 1, 2008 to Oct. 31, 2008. |
114
Portfolio Managers. For funds other than money market funds, the following table provides information about the fund’s portfolio managers as of the end of the most recent fiscal period, unless otherwise noted. The table is organized by fiscal year end. You can find your fund’s fiscal year end in Table 1.
Table 19. Portfolio Managers
| | | | | | | | | | | | | | |
| | | | | Other Accounts Managed (excluding the fund) | | Ownership
of Fund
Shares | | Potential
Conflicts
of Interest | | Structure of
Compensation |
Fund | | Portfolio Manager | | Number and Type
of Account* | | Approximate
Total Net
Assets | | Performance Based
Accounts(a) | | | |
For funds with fiscal period ending January 31 | | | | | | | | | | | | | | |
Columbia Income Builder Fund | | Colin Lundgren | | 16 RICs | | $1.34 billion | | None | | None | | (6) | | (18) |
| | | | 16 other accounts | | $271.73 million | | | | | | | | |
| | Gene R. Tannuzzo(j) | | 1 RIC | | $341.48 million | | None | | None | | | | |
| | | | 2 other accounts | | $0.08 million | | | | | | | | |
Columbia Income Builder Fund II | | Colin Lundgren | | 16 RICs | | $1.18 billion | | None | | $100,001 – | | (6) | | (18) |
| | | | 16 other accounts | | $271.73 million | | | | $500,000 | | | | |
| | Gene R. Tannuzzo(j) | | 1 RIC | | $341.48 million | | None | | None | | | | |
| | | | 2 other accounts | | $0.08 million | | | | | | | | |
Columbia Income Builder Fund III | | Colin Lundgren | | 16 RICs | | $1.38 billion | | None | | None | | (6) | | (18) |
| | | | 16 other accounts | | $271.73 million | | | | | | | | |
| | Gene R. Tannuzzo(j) | | 1 RIC | | $341.48 million | | None | | None | | | | |
| | | | 2 other accounts | | $0.08 million | | | | | | | | |
Columbia Portfolio Builder Aggressive | | Kent M. Bergene(b) | | 5 RICs | | $3.30 billion | | None | | $50,001 – | | (1) | | (19) |
| | | | 7 other accounts | | $1.36 million | | | | $100,000 | | | | |
| | David M. Joy | | 5 RICs | | $3.30 billion | | None | | None | | | | |
| | | | 6 other accounts | | $1.01 million | | | | | | | | |
| | Anwiti Bahuguna(k) | | 17 RICs | | $2.1 billion | | None | | None | | (3) | | (32) |
| | | | 26 PIVs | | $2.4 billion | | | | | | | | |
| | | | 22 other accounts | | $296.0 million | | | | | | | | |
| | Colin Moore(k) | | 19 RICs | | $3.62 billion | | None | | None | | | | |
| | | | 26 PIVs | | $2.4 billion | | | | | | | | |
| | | | 21 other accounts | | $299.0 million | | | | | | | | |
| | Kent Peterson(k) | | 17 RICs | | $2.1 billion | | None | | None | | | | |
| | | | 26 PIVs | | $2.4 billion | | | | | | | | |
| | | | 21 other accounts | | $296.0 million | | | | | | | | |
| | Marie M. Schofield(k) | | 17 RICs | | $2.1 million | | None | | None | | | | |
| | | | 26 PIVs | | $2.4 million | | | | | | | | |
| | | | 16 other accounts | | $296.0 million | | | | | | | | |
Columbia Portfolio Builder Conservative | | Kent M. Bergene(b) | | 5 RICs | | $3.30 billion | | None | | $50,001 – | | (1) | | (19) |
| | | | 7 other accounts | | $1.36 million | | | | $100,000 | | | | |
| | David M. Joy | | 5 RICs | | $3.30 billion | | None | | None | | | | |
| | | | 6 other accounts | | $1.01 million | | | | | | | | |
| | Anwiti Bahuguna(k) | | 17 RICs | | $2.1 billion | | None | | None | | (3) | | (32) |
| | | | 26 PIVs | | $2.4 billion | | | | | | | | |
| | | | 22 other accounts | | $296.0 million | | | | | | | | |
| | Colin Moore(k) | | 19 RICs | | $3.62 billion | | None | | None | | | | |
| | | | 26 PIVs | | $2.4 billion | | | | | | | | |
| | | | 21 other accounts | | $299.0 million | | | | | | | | |
| | Kent Peterson(k) | | 17 RICs | | $2.1 billion | | None | | None | | | | |
| | | | 26 PIVs | | $2.4 billion | | | | | | | | |
| | | | 21 other accounts | | $296.0 million | | | | | | | | |
| | Marie M. Schofield(k) | | 17 RICs | | $2.1 million | | None | | None | | | | |
| | | | 26 PIVs | | $2.4 million | | | | | | | | |
| | | | 16 other accounts | | $296.0 million | | | | | | | | |
Columbia Portfolio Builder Moderate | | Kent M. Bergene(b) | | 5 RICs | | $3.30 billion | | None | | $50,001 – | | (1) | | (19) |
| | | | 7 other accounts | | $1.36 million | | | | $100,000 | | | | |
| | David M. Joy | | 5 RICs | | $3.30 billion | | None | | None | | | | |
| | | | 6 other accounts | | $1.01 million | | | | | | | | |
| | Anwiti Bahuguna(k) | | 17 RICs | | $2.1 billion | | None | | None | | (3) | | (32) |
| | | | 26 PIVs | | $2.4 billion | | | | | | | | |
| | | | 22 other accounts | | $296.0 million | | | | | | | | |
| | Colin Moore(k) | | 19 RICs | | $3.62 billion | | None | | None | | | | |
| | | | 26 PIVs | | $2.4 billion | | | | | | | | |
| | | | 21 other accounts | | $299.0 million | | | | | | | | |
| | Kent Peterson(k) | | 17 RICs | | $2.1 billion | | None | | None | | | | |
| | | | 26 PIVs | | $2.4 billion | | | | | | | | |
| | | | 21 other accounts | | $296.0 million | | | | | | | | |
| | Marie M. Schofield(k) | | 17 RICs | | $2.1 million | | None | | None | | | | |
| | | | 26 PIVs | | $2.4 million | | | | | | | | |
| | | | 16 other accounts | | $296.0 million | | | | | | | | |
Columbia Portfolio Builder Moderate Aggressive | | Kent M. Bergene(b) | | 5 RICs | | $3.30 billion | | None | | $50,001 – | | (1) | | (19) |
| | | | 7 other accounts | | $1.36 million | | | | $100,000 | | | | |
| | David M. Joy | | 5 RICs | | $3.30 billion | | None | | None | | | | |
| | | | 6 other accounts | | $1.01 million | | | | | | | | |
| | Anwiti Bahuguna(k) | | 17 RICs | | $2.1 billion | | None | | None | | (3) | | (32) |
| | | | 26 PIVs | | $2.4 billion | | | | | | | | |
| | | | 22 other accounts | | $296.0 million | | | | | | | | |
| | Colin Moore(k) | | 19 RICs | | $3.62 billion | | None | | None | | | | |
| | | | 26 PIVs | | $2.4 billion | | | | | | | | |
| | | | 21 other accounts | | $299.0 million | | | | | | | | |
| | Kent Peterson(k) | | 17 RICs | | $2.1 billion | | None | | None | | | | |
| | | | 26 PIVs | | $2.4 billion | | | | | | | | |
| | | | 21 other accounts | | $296.0 million | | | | | | | | |
| | Marie M. Schofield(k) | | 17 RICs | | $2.1 million | | None | | None | | | | |
| | | | 26 PIVs | | $2.4 million | | | | | | | | |
| | | | 16 other accounts | | $296.0 million | | | | | | | | |
Columbia Portfolio Builder Moderate Conservative | | Kent M. Bergene(b) | | 5 RICs | | $3.56 billion | | None | | $10,001 – | | (1) | | (19) |
| | | | 7 other accounts | | $1.36 million | | | | $50,000 | | | | |
| | David M. Joy | | 5 RICs | | $3.56 billion | | None | | None | | | | |
| | | | 6 other accounts | | $1.01 million | | | | | | | | |
| | Anwiti Bahuguna(k) | | 17 RICs | | $2.1 billion | | None | | None | | (3) | | (32) |
| | | | 26 PIVs | | $2.4 billion | | | | | | | | |
| | | | 22 other accounts | | $296.0 million | | | | | | | | |
| | Colin Moore(k) | | 19 RICs | | $3.62 billion | | None | | None | | | | |
| | | | 26 PIVs | | $2.4 billion | | | | | | | | |
115
| | | | | | | | | | | | | | |
| | | | 21 other accounts | | $299.0 million | | | | | | | | |
| | Kent Peterson(k) | | 17 RICs | | $2.1 billion | | None | | None | | | | |
| | | | 26 PIVs | | $2.4 billion | | | | | | | | |
| | | | 21 other accounts | | $296.0 million | | | | | | | | |
| | Marie M. Schofield(k) | | 17 RICs | | $2.1 million | | None | | None | | | | |
| | | | 26 PIVs | | $2.4 million | | | | | | | | |
| | | | 16 other accounts | | $296.0 million | | | | | | | | |
Columbia Portfolio Builder Total Equity | | Kent M. Bergene(b) | | 5 RICs | | $3.30 billion | | None | | $50,001 – | | (1) | | (19) |
| | | | 7 other accounts | | $1.36 million | | | | $100,000 | | | | |
| | David M. Joy | | 5 RICs | | $3.30 billion | | None | | None | | | | |
| | | | 6 other accounts | | $1.01 million | | | | | | | | |
| | Anwiti Bahuguna(k) | | 17 RICs | | $2.1 billion | | None | | None | | (3) | | (32) |
| | | | 26 PIVs | | $2.4 billion | | | | | | | | |
| | | | 22 other accounts | | $296.0 million | | | | | | | | |
| | Colin Moore(k) | | 19 RICs | | $3.62 billion | | None | | None | | | | |
| | | | 26 PIVs | | $2.4 billion | | | | | | | | |
| | | | 21 other accounts | | $299.0 million | | | | | | | | |
| | Kent Peterson(k) | | 17 RICs | | $2.1 billion | | None | | None | | | | |
| | | | 26 PIVs | | $2.4 billion | | | | | | | | |
| | | | 21 other accounts | | $296.0 million | | | | | | | | |
| | Marie M. Schofield(k) | | 17 RICs | | $2.1 million | | None | | None | | | | |
| | | | 26 PIVs | | $2.4 million | | | | | | | | |
| | | | 16 other accounts | | $296.0 million | | | | | | | | |
RiverSource S&P 500 Index | | Alfred F. Alley III(k) | | 4 RICs | | $6.5 billion | | None | | None | | (3) | | (32) |
| | | | 3 PIVs | | $175.0 million | | | | | | | | |
| | | | 19 other accounts | | $4.0 billion | | | | | | | | |
RiverSource Small Company Index | | Alfred F. Alley III(k) | | 4 RICs | | $6.5 billion | | None | | None | | (3) | | (32) |
| | | | 3 PIVs 1 | | $175.0 million | | | | | | | | |
| | | | 9 other accounts | | $4.0 billion | | | | | | | | |
For funds with fiscal period ending March 31 | | | | | | | | | | | | | | |
Columbia Equity Value | | Steve Schroll | | 12 RICs | | $14.61 billion | | 8 RICs ($14.05 B) | | $50,001 – | | (2) | | (20) |
| | | | 2 PIVs | | $69.61 million | | | | $100,000 | | | | |
| | | | 18 other accounts(d) | | $538.36 million | | | | | | | | |
| | Laton Spahr | | 12 RICs | | $14.61 billion | | 8 RICs ($14.05 B) | | $100,001 – | | | | |
| | | | 2 PIVs | | $69.61 million | | | | $500,000 | | | | |
| | | | 17 other accounts(d) | | $538.66
million | | | | | | | | |
| | Paul Stocking | | 12 RICs | | $14.61 billion | | 8 RICs ($14.05 B) | | $50,001 – | | | | |
| | | 2 PIVs | | $69.61 million | | | | $100,000 | | | | |
| | | | 21 other accounts(d) | | $543.80
million | | | | | | | | |
RiverSource Precious Metals and Mining | | Michael E. Hoover(k) | | 1 RIC | | $689.7 million | | None | | None | | (3) | | (32) |
| | | | 3 PIVs | | $689.7 million | | | | | | | | |
| | | | 3 other accounts | | $0.74 million | | | | | | | | |
For funds with fiscal period ending April 30 | | | | | | | | | | | | | | |
Columbia 120/20 Contrarian Equity | | Steve Schroll | | 12 RICs | | $14.76 billion | | 8 RICs ($14.2 B) | | $10,001 – | | (2) | | (20) |
| | | 2 PIVs | | $70.44 million | | | | $50,000 | | | | |
| | | | 18 other accounts(d) | | $539.06
million | | | | | | | | |
| | Laton Spahr | | 12 RICs | | $14.76 billion | | 8 RICs ($14.2 B) | | $500,001 – | | (2) | | (20) |
| | | | 2 PIVs | | $70.44 million | | | | $1,000,000 | | | | |
| | | | 17 other accounts(d) | | $539.57
million | | | | | | | | |
| | Paul Stocking | | 12 RICs | | $14.76 billion | | 8 RICs ($14.2 B) | | $100,001 – | | | | |
| | | 2 PIVs | | $70.44 million | | | | $500,000 | | | | |
| | | | 21 other accounts(d) | | $544.59
million | | | | | | | | |
Columbia Recovery and Infrastructure | | Warren Spitz | | None | | None | | None | | Over $1,000,000 | | (2) | | (20) |
Columbia Retirement Plus 2010 | | Kent M. Bergene(b),(l) | | 6 RICs | | $4.13 billion | | None | | None | | (1) | | (19) |
| | | | 8 other accounts | | $1.50 million | | | | | | | | |
| | David M. Joy(l) | | 6 RICs | | $4.13 billion | | None | | None | | | | |
| | | | 7 other accounts | | $1.13 million | | | | | | | | |
| | Anwiti Bahuguna(l) | | 17 RICs | | $2.1 billion | | None | | None | | (3) | | (32) |
| | | | 26 PIVs | | $2.5 billion | | | | | | | | |
| | | | 21 other accounts | | $243 million | | | | | | | | |
| | Colin Moore(l) | | 19 RICs | | $3.56 billion | | None | | None | | | | |
| | | | 26 PIVs | | $2.5 billion | | | | | | | | |
| | | | 20 other accounts | | $246 million | | | | | | | | |
| | Kent Peterson(l) | | 17 RICs | | $2.1 billion | | None | | None | | | | |
| | | | 26 PIVs | | $2.5 billion | | | | | | | | |
| | | | 20 other accounts | | $243 million | | | | | | | | |
| | Marie M. Schofield(l) | | 17 RICs | | $2.1 billion | | None | | None | | | | |
| | | | 26 PIVs | | $2.5 billion | | | | | | | | |
| | | | 17 other accounts | | $243 million | | | | | | | | |
Columbia Retirement Plus 2015 | | Kent M. Bergene(b),(l) | | 6 RICs | | $4.13 billion | | None | | None | | (1) | | (19) |
| | | | 8 other accounts | | $1.50 million | | | | | | | | |
| | David M. Joy(l) | | 6 RICs | | $4.13 billion | | None | | $1 – $10,000 | | | | |
| | | | 7 other accounts | | $1.13 million | | | | | | | | |
| | Anwiti Bahuguna(l) | | 17 RICs | | $2.1 billion | | None | | None | | (3) | | (32) |
| | | | 26 PIVs | | $2.5 billion | | | | | | | | |
| | | | 21 other accounts | | $243 million | | | | | | | | |
| | Colin Moore(l) | | 19 RICs | | $3.56 billion | | None | | None | | | | |
| | | | 26 PIVs | | $2.5 billion | | | | | | | | |
| | | | 20 other accounts | | $246 million | | | | | | | | |
| | Kent Peterson(l) | | 17 RICs | | $2.1 billion | | None | | None | | | | |
| | | | 26 PIVs | | $2.5 billion | | | | | | | | |
| | | | 20 other accounts | | $243 million | | | | | | | | |
| | Marie M. Schofield(l) | | 17 RICs | | $2.1 billion | | None | | None | | | | |
| | | | 26 PIVs | | $2.5 billion | | | | | | | | |
| | | | 17 other accounts | | $243 million | | | | | | | | |
Columbia Retirement Plus 2020 | | Kent M. Bergene(b),(l) | | 8 other accounts | | $1.50 million | | None | | None | | (1) | | (19) |
| | David M. Joy(l) | | 6 RICs | | $4.13 billion | | None | | None | | | | |
| | | | 7 other accounts | | $1.13 million | | | | | | | | |
| | Anwiti Bahuguna(l) | | 17 RICs | | $2.1 billion | | None | | None | | (3) | | (32) |
| | | | 26 PIVs | | $2.5 billion | | | | | | | | |
| | | | 21 other accounts | | $243 million | | | | | | | | |
| | Colin Moore(l) | | 19 RICs | | $3.56 billion | | None | | None | | | | |
| | | | 26 PIVs | | $2.5 billion | | | | | | | | |
| | | | 20 other accounts | | $246 million | | | | | | | | |
| | Kent Peterson(l) | | 17 RICs | | $2.1 billion | | None | | None | | | | |
| | | | 26 PIVs | | $2.5 billion | | | | | | | | |
| | | | 20 other accounts | | $243 million | | | | | | | | |
| | Marie M. Schofield(l) | | 17 RICs | | $2.1 billion | | None | | None | | | | |
| | | | 26 PIVs | | $2.5 billion | | | | | | | | |
116
| | | | | | | | | | | | | | |
| | | | 17 other accounts | | $243 million | | | | | | | | |
Columbia Retirement Plus 2025 | | Kent M. Bergene(b),(l) | | 6 RICs | | $4.13 billion | | None | | None | | (1) | | (19) |
| | | | 8 other accounts | | $1.50 million | | | | | | | | |
| | David M. Joy(l) | | 6 RICs | | $4.13 billion | | None | | None | | | | |
| | | | 7 other accounts | | $1.13 million | | | | | | | | |
| | Anwiti Bahuguna(l) | | 17 RICs | | $2.1 billion | | None | | None | | (3) | | (32) |
| | | | 26 PIVs | | $2.5 billion | | | | | | | | |
| | | | 21 other accounts | | $243 million | | | | | | | | |
| | Colin Moore(l) | | 19 RICs | | $3.56 billion | | None | | None | | | | |
| | | | 26 PIVs | | $2.5 billion | | | | | | | | |
| | | | 20 other accounts | | $246 million | | | | | | | | |
| | Kent Peterson(l) | | 17 RICs | | $2.1 billion | | None | | None | | | | |
| | | | 26 PIVs | | $2.5 billion | | | | | | | | |
| | | | 20 other accounts | | $243 million | | | | | | | | |
| | Marie M. Schofield(l) | | 17 RICs | | $2.1 billion | | None | | None | | | | |
| | | | 26 PIVs | | $2.5 billion | | | | | | | | |
| | | | 17 other accounts | | $243 million | | | | | | | | |
Columbia Retirement Plus 2030 | | Kent M. Bergene(b),(l) | | 6 RICs | | $4.13 billion | | None | | None | | (1) | | (19) |
| | | | 8 other accounts | | $1.50 million | | | | | | | | |
| | David M. Joy(l) | | 6 RICs | | $4.13 billion | | None | | None | | | | |
| | | | 7 other accounts | | $1.13 million | | | | | | | | |
| | Anwiti Bahuguna(l) | | 17 RICs | | $2.1 billion | | None | | None | | (3) | | (32) |
| | | | 26 PIVs | | $2.5 billion | | | | | | | | |
| | | | 21 other accounts | | $243 million | | | | | | | | |
| | Colin Moore(l) | | 19 RICs | | $3.56 billion | | None | | None | | | | |
| | | | 26 PIVs | | $2.5 billion | | | | | | | | |
| | | | 20 other accounts | | $246 million | | | | | | | | |
| | Kent Peterson(l) | | 17 RICs | | $2.1 billion | | None | | None | | | | |
| | | | 26 PIVs | | $2.5 billion | | | | | | | | |
| | | | 20 other accounts | | $243 million | | | | | | | | |
| | Marie M. Schofield(l) | | 17 RICs | | $2.1 billion | | None | | None | | | | |
| | | | 26 PIVs | | $2.5 billion | | | | | | | | |
| | | | 17 other accounts | | $243 million | | | | | | | | |
Columbia Retirement Plus 2035 | | Kent M. Bergene(b),(l) | | 6 RICs | | $4.13 billion | | None | | None | | (1) | | (19) |
| | | | 8 other accounts | | $1.50 million | | | | | | | | |
| | David M. Joy(l) | | 6 RICs | | $4.13 billion | | None | | None | | | | |
| | | | 7 other accounts | | $1.13 million | | | | | | | | |
| | Anwiti Bahuguna(l) | | 17 RICs | | $2.1 billion | | None | | None | | (3) | | (32) |
| | | | 26 PIVs | | $2.5 billion | | | | | | | | |
| | | | 21 other accounts | | $243 million | | | | | | | | |
| | Colin Moore(l) | | 19 RICs | | $3.56 billion | | None | | None | | | | |
| | | | 26 PIVs | | $2.5 billion | | | | | | | | |
| | | | 20 other accounts | | $246 million | | | | | | | | |
| | Kent Peterson(l) | | 17 RICs | | $2.1 billion | | None | | None | | | | |
| | | | 26 PIVs | | $2.5 billion | | | | | | | | |
| | | | 20 other accounts | | $243 million | | | | | | | | |
| | Marie M. Schofield(l) | | 17 RICs | | $2.1 billion | | None | | None | | | | |
| | | | 26 PIVs | | $2.5 billion | | | | | | | | |
| | | | 17 other accounts | | $243 million | | | | | | | | |
Columbia Retirement Plus 2040 | | Kent M. Bergene(b),(l) | | 6 RICs | | $4.13 billion | | None | | None | | (1) | | (19) |
| | | | 8 other accounts | | $1.50 million | | | | | | | | |
| | David M. Joy(l) | | 6 RICs | | $4.13 billion | | None | | None | | | | |
| | | | 7 other accounts | | $1.13 million | | | | | | | | |
| | Anwiti Bahuguna(l) | | 17 RICs | | $2.1 billion | | None | | None | | (3) | | (32) |
| | | | 26 PIVs | | $2.5 billion | | | | | | | | |
| | | | 21 other accounts | | $243 million | | | | | | | | |
| | Colin Moore(l) | | 19 RICs | | $3.56 billion | | None | | None | | | | |
| | | | 26 PIVs | | $2.5 billion | | | | | | | | |
| | | | 20 other accounts | | $246 million | | | | | | | | |
| | Kent Peterson(l) | | 17 RICs | | $2.1 billion | | None | | None | | | | |
| | | | 26 PIVs | | $2.5 billion | | | | | | | | |
| | | | 20 other accounts | | $243 million | | | | | | | | |
| | Marie M. Schofield(l) | | 17 RICs | | $2.1 billion | | None | | None | | | | |
| | | | 26 PIVs | | $2.5 billion | | | | | | | | |
| | | | 17 other accounts | | $243 million | | | | | | | | |
Columbia Retirement Plus 2045 | | Kent M. Bergene(b),(l) | | 6 RICs | | $4.13 billion | | None | | None | | (1) | | (19) |
| | | | 8 other accounts | | $1.50 million | | | | | | | | |
| | David M. Joy(l) | | 6 RICs | | $4.13 billion | | None | | None | | | | |
| | | | 7 other accounts | | $1.13 million | | | | | | | | |
| | Anwiti Bahuguna(l) | | 17 RICs | | $2.1 billion | | None | | None | | (3) | | (32) |
| | | | 26 PIVs | | $2.5 billion | | | | | | | | |
| | | | 21 other accounts | | $243 million | | | | | | | | |
| | Colin Moore(l) | | 19 RICs | | $3.56 billion | | None | | None | | | | |
| | | | 26 PIVs | | $2.5 billion | | | | | | | | |
| | | | 20 other accounts | | $246 million | | | | | | | | |
| | Kent Peterson(l) | | 17 RICs | | $2.1 billion | | None | | None | | | | |
| | | | 26 PIVs | | $2.5 billion | | | | | | | | |
| | | | 20 other accounts | | $243 million | | | | | | | | |
| | Marie M. Schofield(l) | | 17 RICs | | $2.1 billion | | None | | None | | | | |
| | | | 26 PIVs | | $2.5 billion | | | | | | | | |
| | | | 17 other accounts | | $243 million | | | | | | | | |
For funds with fiscal period ending May 31 | | | | | | | | | | | | | | |
Columbia High Yield Bond | | Jennifer Ponce de Leon | | 6 RICs | | $4.04 billion | | 2 RICs ($527.4 M) | | None | | (2) | | (23) |
| | | | 1 PIV | | $9.33 million | | | | | | | | |
| | | | 27 other accounts | | $4.58 billion | | | | | | | | |
| | Brian Lavin | | 12 RICs | | $8.92 billion | | None | | None | | | | |
| | | | 1 PIV | | $9.33 million | | | | | | | | |
| | | | 4 other account | | $683.4
million | | | | | | | | |
Columbia Multi-Advisor Small Cap Value | | Donald Smith: | | | | | | | | | | | | |
| | Donald G. Smith | | 2 RICs | | $832.0
million | | 1 RIC ($790 M); | | | | | | |
| | Richard L. Greenberg | | 1 PIV | | $67.0 million | | 1 other account ($68 M) | | None | | (10) | | (26) |
| | | | 33 other accounts | | $2.0 billion | | | | | | | | |
| | BHMS: | | | | | | | | | | | | |
| | James S. McClure | | 4 RICs | | $824.6 million | | | | | | | | |
| | John P. Harloe | | 1 PIV | | $5.4 million | | None | | None | | (12) | | (27) |
| | | | 15 other accounts | | $572.3
million | | | | | | | | |
| | MetWest: | | | | | | | | | | | | |
| | Samir Sikka | | 5 RICs | | $472.7
million | | 1 other account | | None | | (13) | | (28) |
| | | | 3 PIVs | | $84.3 million | | ($53.9 M) | | | | | | |
| | | | 12 other accounts | | $193.8
million | | | | | | | | |
117
| | | | | | | | | | | | | | |
| | Turner: | | | | | | | | | | | | |
| | David Kovacs | | 4 RICs | | $315.0 million | | 1 PIV ($2 M) | | None | | (5) | | (21) |
| | | | 7 PIVs | | $46.0 million | | | | | | | | |
| | | | 6 other accounts | | $23930 million | | | | | | | | |
Columbia U.S. Government Mortgage | | Colin Lundgren | | 26 RICs | | $42.86 billion | | 2 RICs ($527.4 M) | | None | | (2) | | (23) |
| | | | 9 other accounts | | $274.16 million | | | | | | | | |
| | Jason J. Callan | | 4 RICs | | $1.84 billion | | None | | None | | | | |
| | | | 3 other accounts | | $0.34 million | | | | | | | | |
| | Tom Heuer | | 4 RICs | | $1.84 billion | | None | | None | | | | |
| | | | 2 other accounts | | $0.40 million | | | | | | | | |
RiverSource Partners Fundamental Value | | Davis: | | 26 RICs | | $54.0 billion | | None | | None(f) | | (9) | | (25) |
| | Christopher C. Davis | | 12 PIVs | | $1.0 billion | | | | | | | | |
| | | | 117 other accounts(e) | | $8.0 billion | | | | | | | | |
| | Kenneth C. Feinberg | | 24 RICs | | $54.0 billion | | | | | | | | |
| | | | 11 PIVs | | $1.0 billion | | | | | | | | |
| | | | 107 other accounts(e) | | $7.0 billion | | | | | | | | |
RiverSource Short Duration U.S. Government | | Colin Lundgren | | 26 RICs | | $42.44 billion | | 2 RICs ($527.4 M) | | None | | (2) | | (23) |
| | | | 9 other accounts | | $274.16 million | | | | | | | | |
| | Jason J. Callan | | 4 RICs | | $1.42 billion | | None | | $100,000 – | | | | |
| | | | 3 other accounts | | $0.34 million | | | | $500,000 | | | | |
| | Tom Heuer | | 4 RICs | | $1.42 billion | | None | | None | | | | |
| | | | 2 other accounts | | $0.40 million | | | | | | | | |
For funds with fiscal period ending June 30 | | | | | | | | | | | | | | |
Columbia Dividend Opportunity | | Steve Schroll | | 12 RICs | | $12.06 billion | | 8 RICs ($11.57 M) | | $100,001 – | | (2) | | (20) |
| | | | 2 PIVs | | $58.92 million | | | | $500,000 | | | | |
| | | | 21 other accounts(d) | | $467.85 million | | | | | | | | |
| | Laton Spahr | | 12 RICs | | $12.06 billion | | 8 RICs ($11.57 M) | | $100,001 –$500,000 | | | | |
| | | | 2 PIVs | | $58.92 million | | | | | | | | |
| | | | 17 other accounts(d) | | $468.59
million | | | | | | | | |
| | Paul Stocking | | 12 RICs | | $12.06 billion | | 8 RICs ($11.57 M) | | $10,001 – | | | | |
| | | 2 PIVs | | $58.92 million | | | | $50,000 | | | | |
| | | | 18 other accounts(d) | | $473.07
million | | | | | | | | |
RiverSource Real Estate | | Arthur J. Hurley | | 1 RIC | | $332.0 million | | None | | None | | (3) | | (32) |
| | | | 7 other accounts | | $0.40 million | | | | | | | | |
For funds with fiscal period ending July 31 | | | | | | | | | | | | | | |
Columbia Floating Rate | | Lynn Hopton | | 11 PIVs | | $4.85 billion | | None | | None | | (2) | | (29) |
| | | | 11 other accounts | | $440.11 million | | | | | | | | |
| | Yvonne Stevens | | 11 PIVs | | $4.85 billion | | None | | None | | | | |
| | | | 11 other accounts | | $436.48 million | | | | | | | | |
| | Steve Staver | | 5 other accounts | | $0.81 million | | None | | None | | | | |
Columbia Income Opportunities | | Brian Lavin | | 12 RICs | | $8.19 billion | | None | | None | | (2) | | (23) |
| | | | 1 PIV | | $10.40 million | | | | | | | | |
| | | | 3 other account | | $684.85 million | | | | | | | | |
Columbia Inflation Protected Securities | | Colin Lundgren | | 22 RICs | | $50.92 billion | | 2 RICs ($1.53 B) | | None | | (2) | | (23) |
| | | | 9 other accounts | | $275.58
million | | | | | | | | |
| | VishaI Khanduja | | 1 RIC | | $2.24 billion | | None | | None | | | | |
| | | | 3 other accounts | | $0.09 million | | | | | | | | |
Columbia Large Core Quantitative | | Brian M. Condon | | 12 RICs | | $4.92 billion | | 1 PIV ($23 M) | | None | | (3) | | (32) |
| | | | 8 PIVs | | $707 million | | | | | | | | |
| | | | 43 other accounts | | $2.63 billion | | | | | | | | |
Columbia Limited Duration Credit | | Tom Murphy | | 6 RICs | | $12.38 billion | | 2 RICs ($1.53 B); | | Over | | (2) | | (23) |
| | | | 2 PIVs | | $715.72
million | | 1 other account | | 1,000,000 | | | | |
| | | | 17 other accounts | | $12.88 billion | | ($30.68 M) | | | | | | |
| | Timothy J. Doubek | | 1 RIC | | $2.05 billion | | 1 other account | | $10,001 – | | | | |
| | | | 5 other account | | $31.88 million | | ($30.68 M) | | $50,000 | | | | |
RiverSource Disciplined Small and Mid | | Brian M. Condon | | 12 RICs | | $8.52 billion | | 1 PIV ($23 M) | | None | | (3) | | (32) |
Cap Equity | | | | 8 PIVs | | $707 million | | | | | | | | |
| | | | 43 other accounts | | $2.63 billion | | | | | | | | |
| | Alfred F. Alley III | | 6 RICs | | $6.81 billion | | None | | None | | | | |
| | | | 6 PIVs | | $846.76
million | | | | | | | | |
| | | | 17 other accounts | | $1.28 billion | | | | | | | | |
RiverSource Disciplined Small and Mid Cap Value | | Brian M. Condon | | 12 RICs | | $8.61 billion | | 1 PIV ($23 M) | | None | | (3) | | (32) |
| | | | 8 PIVs | | $707 million | | | | | | | | |
| | | | 43 other accounts | | $2.63 billion | | | | | | | | |
| | Alfred F. Alley III | | 6 RICs | | $6.90 billion | | None | | None | | | | |
| | | | 6 PIVs | | $846.76
million | | | | | | | | |
| | | | 17 other accounts | | $1.28 billion | | | | | | | | |
For funds with fiscal period ending August 31 | | | | | | | | | | | | | | |
Columbia Diversified Bond | | Tom Murphy | | 6 RICs | | $6.26 billion | | 3 RICs ($916.13 M) | | $10,001 – | | (2) | | (23) |
| | | | 2 PIVs | | $826.67
million | | | | $50,000 | | | | |
| | | | 14 other accounts | | $12.60 billion | | | | | | | | |
| | Jennifer Ponce de Leon(l) | | 4 RICs | | $5.49 billion | | None | | $10,001 – | | | | |
| | | 1 PIV | | $9.56 million | | | | $50,000 | | | | |
| | | | 28 other accounts | | $4.89 billion | | | | | | | | |
| | Colin Lundgren(j) | | 17 RICs | | $1.59 billion | | None | | $100,001 – | | | | |
| | | 15 other accounts | | $203.49
million | | | | $500,000 | | | | |
Columbia Minnesota Tax-Exempt | | | | 10 RICs | | $4.18 billion | | None | | None | | (2) | | (23) |
| | | | 8 other accounts | | $6.35 billion | | | | | | | | |
RiverSource California Tax-Exempt | | Catherine Stienstra | | 10 RICs | | $4.34 billion | | | | | | | | |
| | | | 8 other accounts | | $6.35 billion | | | | | | | | |
RiverSource New York Tax-Exempt | | | | 10 RICs | | $4.45 billion | | | | | | | | |
| | | | 8 other accounts | | $6.35 billion | | | | | | | | |
For fund with fiscal period ending September 30 | | | | | | | | | | | | | | |
Columbia Diversified Equity Income | | Laton Spahr | | 12 RICs | | $9.59 billion | | 8 RICs ($9.09 B) | | $100,001 – | | (2) | | (20) |
| | | | 2 PIVs | | $48.35 million | | | | $500,000 | | | | |
| | | | 16 other accounts(d) | | $2.96 billion | | | | | | | | |
| | Steve Schroll | | 12 RICs | | $9.59 billion | | | | $50,001 – | | | | |
| | | 2 PIVs | | $48.35 million | | | | $100,000 | | | | |
| | | | 18 other accounts(d) | | $2.42 billion | | | | | | | | |
| | Paul Stocking | | 12 RICs | | $9.59 billion | | | | $100,001 – | | | | |
| | | 2 PIVs | | $48.35 million | | | | $500,000 | | | | |
| | | | 21 other accounts(d) | | $6.91 billion | | | | | | | | |
Columbia Large Growth Quantitative | | Brian M. Condon(k) | | 3 RICs | | $594.0 million | | 1 PIV ($22 M) | | None | | (3) | | (32) |
| | | | 8 PIVs | | $864.0 million | | | | | | | | |
| | | | 40 other accounts | | $2.72 billion | | | | | | | | |
Columbia Large Value Quantitative | | Brian M. Condon(k) | | 3 RICs | | $594.0 million | | 1 PIV ($22 M) | | None | | (3) | | (32) |
| | | | 8 PIVs | | $864.0 million | | | | | | | | |
| | | | 40 other accounts | | $2.72 billion | | | | | | | | |
Columbia Mid Cap Value Opportunity | | Laton Spahr | | 12 RICs | | $12.07 billion | | 8 RICs ($11.58 B) | | $100,001 – | | (2) | | (20) |
| | | | 2 PIVs | | $48.35 million | | | | $500,000 | | | | |
118
| | | | | | | | | | | | | | |
| | | | 16 other accounts(d) | | $2.96 billion | | | | | | | | |
| | Steve Schroll | | 12 RICs | | $12.07 billion | | | | $50,001 – | | | | |
| | | | 2 PIVs | | $48.35 million | | | | $100,000 | | | | |
| | | | 18 other accounts(d) | | $2.42 billion | | | | | | | | |
| | Paul Stocking | | 12 RICs | | $12.07 billion | | | | $100,001 – | | | | |
| | | | 2 PIVs | | $48.35 million | | | | $500,000 | | | | |
| | | | 21 other accounts(d) | | $6.91 billion | | | | | | | | |
Columbia Strategic Allocation | | Anwiti Bahuguna(k) | | 17 RICs | | $2.1 billion | | None | | None | | (3) | | (32) |
| | | | 26 PIVs | | $2.4 billion | | | | | | | | |
| | | | 22 other accounts | | $296.0 million | | | | | | | | |
| | Colin Moore(k) | | 19 RICs | | $3.62 billion | | None | | None | | | | |
| | | | 26 PIVs | | $2.4 billion | | | | | | | | |
| | | | 21 other accounts | | $299.0 million | | | | | | | | |
| | Kent Peterson(k) | | 17 RICs | | $2.1 billion | | None | | None | | | | |
| | | | 26 PIVs | | $2.4 billion | | | | | | | | |
| | | | 21 other accounts | | $296.0 million | | | | | | | | |
| | Marie M. Schofield(k) | | 17 RICs | | $2.1 million | | None | | None | | | | |
| | | | 26 PIVs | | $2.4 million | | | | | | | | |
| | | | 16 other accounts | | $296.0 million | | | | | | | | |
| | David M. Joy(j) | | 6 RICs | | $4.07 billion | | None | | None | | (2) | | (19) |
| | | | 6 other accounts | | $1.12 million | | | | | | | | |
RiverSource Balanced | | Steve Schroll | | 12 RICs | | $13.73 billion | | 8 RICs ($13.23 B) | | None | | (2) | | (20) |
| | | | 2 PIVs | | $48.35 million | | | | | | | | |
| | | | 18 other accounts(d) | | $2.42 billion | | | | | | | | |
| | Laton Spahr | | 12 RICs | | $13.73 billion | | 8 RICs ($13.23 B) | | $1 – $10,000 | | | | |
| | | | 2 PIVs | | $48.35 million | | | | | | | | |
| | | | 16 other accounts(d) | | $2.42 billion | | | | | | | | |
| | Paul Stocking | | 12 RICs | | $13.73 billion | | 8 RICs ($13.23 B) | | None | | | | |
| | | | 2 PIVs | | $48.35 million | | | | | | | | |
| | | | 21 other accounts(d) | | $2.42 billion | | | | | | | | |
| | Tom Murphy | | 6 RICs | | $10.40 billion | | 2 RICs ($729.4 M) | | None | | (2) | | (23) |
| | | | 2 PIVs | | $835.61 million | | | | | | | | |
| | | | 18 other accounts | | $15.33 billion | | | | | | | | |
| | Jennifer Ponce de Leon(l) | | 4 RICs | | $5.49 billion | | None | | None | | | | |
| | | | 1 PIV | | $9.56 million | | | | | | | | |
| | | | 28 other accounts | | $4.89 billion | | | | | | | | |
| | Colin Lundgren(j) | | 17 RICs | | $1.59 billion | | None | | None | | | | |
| | | | 15 other accounts | | $203.49 million | | | | | | | | |
RiverSource Strategic Income Allocation | | Colin Lundgren | | 16 RICs | | $1.24 billion | | None | | None | | (2) | | (23) |
| | | | 14 other accounts | | $1.22 billion | | | | | | | | |
| | Gene R. Tannuzzo | | 2 other accounts | | $0.04 million | | None | | $1 – $10,000 | | | | |
| | Brian Lavin(l) | | 2 RICs | | $2.92 billion | | None | | None | | | | |
| | | | 1 PIV | | $9.56 million | | | | | | | | |
| | | | 4 other account | | $766.77 million | | | | | | | | |
Seligman California Municipal High-Yield | | Catherine Stienstra | | 10 RICs | | $4.64 billion | | None | | None | | (2) | | (23) |
| | | | 11 other accounts | | $6.76 billion | | | | | | | | |
Seligman California Municipal Quality | | Catherine Stienstra | | 10 RICs | | $4.64 billion | | None | | None | | (2) | | (23) |
| | | | 11 other accounts | | $6.76 billion | | | | | | | | |
Seligman Minnesota Municipal | | Catherine Stienstra | | 10 RICs | | $4.61 billion | | None | | None | | (2) | | (23) |
| | | | 11 other accounts | | $6.76 billion | | | | | | | | |
Seligman National Municipal | | Catherine Stienstra | | 10 RICs | | $3.98 billion | | None | | None | | (2) | | (23) |
| | | | 11 other accounts | | $6.76 billion | | | | | | | | |
Seligman New York Municipal | | Catherine Stienstra | | 10 RICs | | $4.59 billion | | None | | None | | (2) | | (23) |
| | | | 11 other accounts | | $6.76 billion | | | | | | | | |
Seligman TargETFund 2015 | | John Schonberg | | 6 RICs | | $1.23 billion | | 2 RICs ($1.12 B) | | None | | (2) | | (37) |
| | | | 2 PIVs | | $20.41 million | | | | | | | | |
| | | | 5 other accounts | | $1.13 million | | | | | | | | |
| | Gary Terpening | | 4 RICs | | $107.69
million | | None | | None | | (2) | | (26) |
| | | | 3 other accounts | | $0.40 million | | | | | | | | |
Seligman TargETFund 2025 | | John Schonberg | | 6 RICs | | $1.23 billion | | 2 RICs ($1.12 B) | | None | | (2) | | (37) |
| | | | 2 PIVs | | $20.41 million | | | | | | | | |
| | | | 5 other accounts | | $1.13 million | | | | | | | | |
| | Gary Terpening | | 4 RICs | | $99.96 million | | None | | $100,001 – | | (2) | | (26) |
| | | | 3 other accounts | | $0.40 million | | | | $500,000 | | | | |
Seligman TargETFund 2035 | | John Schonberg | | 6 RICs | | $1.23 billion | | 2 RICs ($1.12 B) | | None | | (2) | | (37) |
| | | | 2 PIVs | | $20.41 million | | | | | | | | |
| | | | 5 other accounts | | $1.13 million | | | | | | | | |
| | Gary Terpening | | 4 RICs | | $124.47
million | | None | | None | | (2) | | (26) |
| | | | 3 other accounts | | $0.40 million | | | | | | | | |
Seligman TargETFund 2045 | | John Schonberg | | 6 RICs | | $1.23 billion | | 2 RICs ($1.12 B) | | None | | (2) | | (37) |
| | | | 2 PIVs | | $20.41 million | | | | | | | | |
| | | | 5 other accounts | | $1.13 million | | | | | | | | |
| | Gary Terpening | | 4 RICs | | $129.70
million | | None | | None | | (2) | | (26) |
| | | | 3 other accounts | | $0.40 million | | | | | | | | |
Seligman TargETFund Core | | John Schonberg | | 6 RICs | | $1.23 billion | | 2 RICs ($1.12 B) | | None | | (2) | | (37) |
| | | | 2 PIVs | | $20.41 million | | | | | | | | |
| | | | 5 other accounts | | $1.13 million | | | | | | | | |
| | Gary Terpening | | 4 RICs | | $75.53 million | | None | | None | | (2) | | (26) |
| | | | 3 other accounts | | $0.40 million | | | | | | | | |
For funds with fiscal period ending October 31 |
Columbia Absolute Return Currency and Income | | Nicholas Pifer | | 5 RICs | | $4.79 billion | | None | | $50,001 – | | (2) | | (23) |
| | | | 3 PIVs | | $33.59 million | | | | $100,000 | | | | |
| | | | 17 other accounts(d) | | $6.27 billion | | | | | | | | |
Columbia Asia Pacific ex-Japan | | Threadneedle: | | | | | | | | | | | | |
| | Vanessa Donegan | | 2 PIVs | | $2.17 billion | | 1 other ($156.61 M) | | None(g) | | (14) | | (36) |
| | | | 7 other accounts | | $4.16 billion | | | | | | | | |
| | Rafael Polatinsky | | 1 PIV | | $201.29
million | | None | | | | | | |
| | | | 4 other accounts | | $20.0 billion | | | | | | | | |
Columbia Emerging Markets Bond | | Nicholas Pifer | | 5 RICs | | $4.77 billion | | None | | $10,001 – | | (2) | | (23) |
| | | | 3 PIVs | | $33.59 million | | | | $50,000 | | | | |
| | | | 17 other accounts(d) | | $6.27 billion | | | | | | | | |
| | Jim Carlene | | 4 PIVs | | $174.53 million | | | | $10,001 – | | | | |
| | | | 7 other accounts | | $966.74 million | | | | $50,000 | | | | |
Columbia Emerging Markets Opportunities | | Threadneedle: | | | | | | | | | | | | |
| | Julian A.S. Thompson | | 1 RIC | | $832.97 million | | 1 RIC ($832.97 M) | | None(g) | | (14) | | (36) |
| | Jules Mort | | 4 PIVs | | $984.10 million | | None | | | | | | |
| | | | 2 other accounts | | $29.80 million | | | | | | | | |
Columbia European Equity | | Threadneedle: | | | | | | | | | | | | |
| | Dan Ison | | 4 PIVs | | $211.49
million | | 1 PIV ($86.38 M) | | None(g) | | (14) | | (36) |
119
| | | | | | | | | | | | | | |
Columbia Frontier | | John K. Schonberg(j) | | 8 RICs | | $1.98 billion | | 2 RICs ($1.55 B) | | None | | (2) | | (37) |
| | | | 2 PIVs | | $27.61 million | | | | | | | | |
| | | | 6 other accounts | | $1.26 million | | | | | | | | |
| | Sam Murphy(j) | | 2 RICs | | $1.55 billion | | 2 RICs ($1.55 B) | | None | | | | |
| | | | 3 other accounts | | $0.15 million | | | | | | | | |
| | Mike Marzolf(j) | | 2 RICs | | $1.55 billion | | 2 RICs ($1.55 B) | | None | | | | |
| | | | 3 other accounts | | $0.081 million | | | | | | | | |
Columbia Global Bond | | Nicholas Pifer | | 5 RICs | | $4.51 billion | | None | | $50,001 – | | (2) | | (23) |
| | | | 3 PIVs | | $33.59
million | | | | $100,000 | | | | |
| | | | 17 other accounts(d) | | $6.27 billion | | | | | | | | |
Columbia Global Equity | | Threadneedle: | | | | | | | | | | | | |
| | Stephen Thornber | | 2 RICs | | $28.09
million | | None | | None(g) | | (14) | | (36) |
| | | | 3 PIVs | | $779.53
million | | | | | | | | |
| | | | 3 other accounts | | $411.64
million | | | | | | | | |
| | Andrew Holliman | | 2 RICs | | $7.50 million | | 1 RIC, 1 PIV | | | | | | |
| | | | 6 PIVs | | $1.63 billion | | ($16.2 M) | | | | | | |
Columbia Global Extended Alpha | | Threadneedle: | | | | | | | | | | | | |
| | Andrew Holliman | | 1 RICs | | $481.64
million | | 1 RIC, 1 PIV | | None(g) | | (14) | | (36) |
| | | | 6 PIVs | | $1.63 billion | | ($16.2 M) | | | | | | |
| | Jeremy Podger | | 1 RICs | | $28.09
million | | 3 PIVs, 1 other | | | | | | |
| | | | 7 PIV | | $692.70
million | | ($96.2 M) | | | | | | |
| | | | 4 other accounts | | $120.63
million | | | | | | | | |
Columbia Multi-Advisor International Value | | AllianceBernstein: | | | | | | | | | | | | |
| | Kevin F. Simms | | 112 RICs | | $38.41
billion | | 3 RICs ($6.56 B); | | None | | (16) | | (33) |
| | Henry S. D’Auria | | 195 PIVs | | $19.99
billion | | 3 PIVs ($839 M); | | | | | | |
| | Sharon E. Fay | | 33,923 other accounts | | $96.14
billion | | 86 other ($8.82 B) | | | | | | |
| | Marilyn G. Fedak | | 43 RICs | | $11.20
billion | | 1 RIC ($3.64 B); | | | | | | |
| | | | 52 PIVs | | $1.43 billion | | 8 other ($584 M) | | | | | | |
| | | | 33,271 other accounts | | $23.54
billion | | | | | | | | |
| | Giulio Martini | | 53 RICs | | $23.88
billion | | 2 RICs ($2.92 B); | | | | | | |
| | | | 94 PIVs | | $17.06
billion | | 2 PIVs ($792 M); | | | | | | |
| | | | 548 other accounts | | $58.71
billion | | 62 other ($6.79 B) | | | | | | |
| | Mondrian: | | | | | | | | | | | | |
| | Ormala Krishnan | | 1 RIC | | $363.0
million | | None | | None | | (8) | | (34) |
| | | | 1 PIV | | $406.0
million | | | | | | | | |
| | | | 11 other accounts | | $1.08 billion | | | | | | | | |
| | Tradewinds: | | | | | | | | | | | | |
| | Peter Boardman | | 4 RICs | | $1.80 billion | | None | | None | | (11) | | (35) |
| | | | 9 PIVs | | $906.79
million | | | | | | | | |
| | | | 41,851 other accounts | | $11.98
billion | | | | | | | | |
| | Alberto Jimenez Crespo | | 4 RICs | | $1.81 billion | | | | | | | | |
| | | | 9 PIVs | | $906.79
million | | | | | | | | |
| | | | 41,848 other accounts | | $11.85
billion | | | | | | | | |
Columbia Seligman Global Technology | | Richard M. Parower | | 3 RICs | | $3.40 billion | | None | | $100,001 – | | (2) | | (30) |
| | | | 5 PIVs | | $904.02
million | | | | $500,000 | | | | |
| | | | 6 other accounts | | $247.29
million | | | | | | | | |
| | Paul H. Wick | | 3 RICs | | $3.40 billion | | | | None | | | | |
| | | | 5 PIVs | | $904.02
million | | | | | | | | |
| | | | 5 other accounts | | $246.94
million | | | | | | | | |
| | Reema D. Shah | | 3 RICs | | $3.40 billion | | | | None | | | | |
| | | | 5 PIVs | | $904.02
million | | | | | | | | |
| | | | 8 other accounts | | $253.02
million | | | | | | | | |
| | Ajay Diwan | | 3 RICs | | $3.40 billion | | | | None | | | | |
| | | | 5 PIVs | | $904.02
million | | | | | | | | |
| | | | 7 other accounts | | $249.66
million | | | | | | | | |
| | Benjamin Lu | | 1 RIC | | $6.11 million | | | | $0 – | | | | |
| | | | 2 PIVs | | $41.12
million | | | | $10,000 | | | | |
| | | | 1 other account | | $0.01 million | | | | | | | | |
RiverSource Disciplined International Equity | | Fred Copper(k) | | 10 RICs | | $1.8 billion | | None | | None | | (3) | | (32) |
| | | | 4 PIVs | | $634.7
million | | | | | | | | |
| | | | 24 other accounts | | $92.4 million | | | | | | | | |
RiverSource Partners | | Columbia WAM: | | | | | | | | | | | | |
International Select Growth | | P. Zachary Egan | | 2 RICs | | $4.10 billion | | None | | None | | (15) | | (31) |
| | Louis J. Mendes | | 3 RICs | | $5.50 billion | | | | | | | | |
RiverSource Partners International Small Cap | | Columbia WAM: | | | | | | | | | | | | |
| | P. Zachary Egan | | 2 RICs | | $4.30 billion | | None | | None | | (15) | | (31) |
| | Louis Mendes III | | 3 RICs | | $5.60 billion | | | | | | | | |
Threadneedle Global Equity Income | | Threadneedle: | | | | | | | | | | | | |
| | Stephen Thornber | | 2 RICs | | $481.64
million | | 1 RIC ($481.64 M) | | None(g) | | (14) | | (36) |
| | | | 3 PIVs | | $779.53
million | | | | | | | | |
| | | | 3 other accounts | | $411.64
million | | | | | | | | |
| | Jeremy Podger | | 2 RICs | | $28.09
million | | 3 PIVs, 1 other | | | | | | |
| | | | 7 PIV | | $144.71
million | | ($96.2 M) | | | | | | |
| | | | 4 other accounts | | $120.63
million | | | | | | | | |
Threadneedle International Opportunity | | Threadneedle: | | | | | | | | | | | | |
| | Alex Lyle | | 1 RIC | | $552.78
million | | 1 RIC ($552.78 M); | | None(g) | | (14) | | (36) |
| | | | 16 PIVs | | $1.20 million | | 1 other ($221.18 M) | | | | | | |
| | | | 30 other accounts | | $2.17 billion | | | | | | | | |
| | Esther Perkins | | 1 RIC | | $552.78
million | | 1 RIC ($552.78 M) | | | | | | |
| | | | 3 other accounts | | $264.31
million | | | | | | | | |
For funds with fiscal period ending November 30 | | | | | | | | | | | | | | |
Columbia AMT-Free Tax-Exempt Bond | | Catherine Stienstra | | 10 RICs | | $3.82 billion | | None | | None | | (2) | | (23) |
| | | | 11 other accounts | | $6.50 billion | | | | | | | | |
Columbia Mid Cap Growth Opportunity | | John K. Schonberg | | 7 RICs | | $745.93
million | | 1 RIC ($364.11 M) | | None | | (2) | | (37) |
| | | | 2 PIVs | | $15.93
million | | | | | | | | |
| | | | 6 other accounts | | $1.12 million | | | | | | | | |
| | Sam Murphy | | 1 RIC | | $364.11
million | | | | | | | | |
| | | | 3 other accounts | | $0.12 million | | | | | | | | |
| | Mike Marzolf | | 1 RIC | | $364.11
million | | | | | | | | |
| | | | 2 other accounts | | $0.05 million | | | | | | | | |
RiverSource Intermediate Tax-Exempt | | Catherine Stienstra | | 10 RICs | | $4.40 billion | | None | | None | | (2) | | (23) |
| | | | 11 other accounts | | $6.50 billion | | | | | | | | |
RiverSource Tax-Exempt High Income | | Catherine Stienstra | | 10 RICs | | $2.21 billion | | None | | None | | (2) | | (23) |
| | | | 11 other accounts | | $6.50 billion | | | | | | | | |
For funds with fiscal period ending December 31 | | | | | | | | | | | | | | |
Columbia Select Large-Cap Value | | Neil Eigen | | 6 RICs | | $642.93
million | | 4 RICs ($544.83 M) | | None | | (2) | | (22) |
| | | | 2 PIVs | | $149.17
million | | | | | | | | |
| | | | 65 other accounts(d) | | $2.92 billion | | | | | | | | |
| | Richard Rosen | | 6 RICs | | $642.93
million | | 4 RICs ($544.83 M) | | None | | | | |
| | | | 2 PIVs | | $149.17
million | | | | | | | | |
| | | | 70 other accounts(d) | | $2.88 billion | | | | | | | | |
120
| | | | | | | | | | | | | | |
Columbia Select Smaller-Cap Value | | Neil Eigen | | 6 RICs | | $611.66 million | | 4 RICs ($513.56 M) | | None | | (2) | | (22) |
| | | | 2 PIVs | | $149.17 million | | | | | | | | |
| | | | 65 other accounts(d) | | $2.92 billion | | | | | | | | |
| | Richard Rosen | | 6 RICs | | $611.66 million | | 4 RICs ($513.56 M) | | $1-$10,000 | | | | |
| | | | 2 PIVs | | $149.17 million | | | | | | | | |
| | | | 70 other accounts(d) | | $2.88 billion | | | | | | | | |
Columbia Seligman Communications and Information | | Paul Wick | | 4 RICs | | $851.40 million | | None | | Over | | (2) | | (30) |
| | | | 5 PIVs | | $1.82 billion | | | | $1,000,000,000 | | | | |
| | | | 6 other accounts | | $266.43 million | | | | | | | | |
| | Ajay Diwan | | 4 RICs | | $851.40 million | | None | | None | | | | |
| | | | 5 PIVs | | $1.82 billion | | | | | | | | |
| | | | 7 other accounts | | $262.94 million | | | | | | | | |
| | Richard Parower | | 3 RICs | | $566.53 million | | None | | None | | | | |
| | | | 5 PIVs | | $1.82 billion | | | | | | | | |
| | | | 8 other accounts | | $265.53 million | | | | | | | | |
| | Reema Shah | | 3 RICs | | $566.53 million | | None | | None | | | | |
| | | | 5 PIVs | | $1.82 billion | | | | | | | | |
| | | | 8 other accounts | | $270.30 million | | | | | | | | |
| | Sangeeth Peruri | | 1 RIC | | $56.04 million | | None | | None | | | | |
| | | | 3 PIVs | | $874.60 million | | | | | | | | |
| | | | 9 other accounts | | $16.67 million | | | | | | | | |
RiverSource LaSalle Global Real Estate | | LaSalle Securities: | | | | | | | | | | | | |
| | Stan J. Kraska | | 2 RICs | | $113.0 million | | 4 other accounts | | $10,001- | | (17) | | (39) |
| | | | 14 PIVs | | $4.15 billion | | ($539 M) | | $50,000 | | | | |
| | | | 29 other accounts | | $2.83 billion | | | | | | | | |
| | George J. Noon | | 2 RICs | | $113.0 million | | | | None | | | | |
| | Keith R. Pauley | | 14 PIVs | | $4.15 billion | | | | None | | | | |
| | | | 28 other accounts | | $2.83 billion | | | | | | | | |
| | Ernst Jan de Leeuw | | 1 RIC | | $87.0 million | | 2 other accounts | | None | | | | |
| | | | 16 PIVs | | $4.20 billion | | ($426 M) | | | | | | |
| | | | 17 other accounts | | $1.31 billion | | | | | | | | |
RiverSource LaSalle Monthly Dividend Real Estate | | LaSalle Securities: | | | | | | | | | | | | |
| | Stan J. Kraska | | 2 RICs | | $101.0 million | | 4 other accounts | | $10,001- | | (17) | | (39) |
| | | | 14 PIVs | | $4.15 billion | | ($539 M) | | $50,000 | | | | |
| | | | 29 other accounts | | $2.83 billion | | | | | | | | |
| | George J. Noon | | 2 RICs | | $101.0 million | | | | None | | | | |
| | Keith R. Pauley | | 14 PIVs | | $4.15 billion | | | | | | | | |
| | | | 28 other accounts | | $2.83 billion | | | | None | | | | |
Seligman Capital | | Wayne Collette(k) | | 10 RICs | | $2.55 billion | | None | | None | | (3) | | (32) |
| | | | 1 PIV | | $125.4 million | | | | | | | | |
| | | | 114 other accounts | | $216.4 million | | | | | | | | |
| | George Myers(k) | | 7 RICs | | $2.13 billion | | None | | None | | | | |
| | | | 1 PIV | | $125.4 million | | | | | | | | |
| | | | 103 other accounts | | $138.8 million | | | | | | | | |
| | Lawrence W. Lin(k) | | 7 RICs | | $2.13 billion | | None | | None | | | | |
| | | | 1 PIV | | $125.4 million | | | | | | | | |
| | | | 108 other accounts | | $138.8 million | | | | | | | | |
| | Brian D. Neigut(k) | | 7 RICs | | $2.13 billion | | None | | None | | | | |
| | | | 1 PIV | | $125.4 million | | | | | | | | |
| | | | 105 other accounts | | $138.6 million | | | | | | | | |
Seligman Growth | | John Wilson(k) | | 5 RICs | | $1.65 billion | | None | | None | | (3) | | (32) |
| | | | 1 PIV | | $310.0 million | | | | | | | | |
| | | | 19 other accounts | | $350.0 million | | | | | | | | |
| | Peter Deininger(k) | | 1 PIV | | $315.0 million | | None | | None | | | | |
| | | | 15 other accounts | | $275.0 million | | | | | | | | |
| * | RIC refers to a Registered Investment Company; PIV refers to a Pooled Investment Vehicle. |
| (a) | Number of accounts for which the advisory fee paid is based in part or wholly on performance and the aggregate net assets in those accounts. |
| (b) | Mr. Bergene has overall accountability for the group that monitors the subadvisers for the funds and for making recommendations to the Boards of Directors on changes to those subadvisers. |
| (c) | Mr. Truscott, who serves as Chairman of the Board for Columbia Management, oversees the portfolio managers who manage other accounts for Columbia Management, including the underlying funds in which the Funds-of-Funds invest, and other accounts managed by Columbia Management and its affiliates including institutional assets, proprietary assets and hedge funds. |
| (d) | Reflects each wrap program strategy as a single client, rather than counting each participant in the program as a separate client. |
| (e) | Wrap accounts have been counted at the sponsor level. |
| (f) | Neither Christopher Davis nor Kenneth Feinberg own any shares of RiverSource Partners Fundamental Value Fund. However, both portfolio managers have over $1 million invested in the Davis Funds, which are managed in a similar style. |
| (g) | The fund is available for sale only in the U.S. The portfolio managers do not reside in the U.S. and therefore do not hold any shares of the fund. |
| (h) | The portfolio manager began managing the fund after its last fiscal year end; reporting information is as of Oct. 31, 2008. |
121
| (i) | The portfolio manager began managing the fund after its last fiscal year end; reporting information is provided as of Jan. 31, 2009. |
| (j) | The portfolio manager began managing the fund after its last fiscal year end; reporting information is provided as of Dec. 31, 2009. |
| (k) | The portfolio manager began managing the fund after its last fiscal year end; reporting information is provided as of March 31, 2010. |
| (l) | The portfolio manager began managing the fund after its last fiscal year end; reporting information is provided as of April 30, 2010. |
Potential Conflicts of Interest
| (1) | Columbia Management: Management of funds-of-funds differs from that of the other funds. The portfolio management process is set forth generally below and in more detail in the funds’ prospectus. |
Portfolio managers of the fund-of-funds may be involved in determining each funds-of-fund’s allocation among the three main asset classes (equity, fixed income and cash) and the allocation among investment categories within each asset class, as well as each funds-of-fund’s allocation among the underlying funds.
| | • | | Because of the structure of the funds-of-funds, the potential conflicts of interest for the portfolio managers may be different than the potential conflicts of interest for portfolio managers who manage other funds. |
In addition to the accounts above, portfolio managers may manage accounts in a personal capacity that may include holdings that are similar to, or the same as, those of the fund. The investment manager has in place a Code of Ethics that is designed to address conflicts and that, among other things, imposes restrictions on the ability of the portfolio managers and other “investment access persons” to invest in securities that may be recommended or traded in the fund and other client accounts.
| (2) | Columbia Management: Portfolio managers may manage one or more mutual funds as well as other types of accounts, including hedge funds, proprietary accounts, separate accounts for institutions and individuals, and other pooled investment vehicles. Portfolio managers make investment decisions for an account or portfolio based on its investment objectives and policies, and other relevant investment considerations. A portfolio manager may manage another account whose fees may be materially greater than the management fees paid by the fund and may include a performance-based fee. Management of multiple funds and accounts may create potential conflicts of interest relating to the allocation of investment opportunities, competing investment decisions made for different accounts and the aggregation and allocation of trades. In addition, the investment manager monitors a variety of areas (e.g., allocation of investment opportunities) and compliance with the firm’s Code of Ethics, and places additional investment restrictions on portfolio managers who manage hedge funds and certain other accounts. |
The investment manager has a fiduciary responsibility to all of the clients for which it manages accounts. The investment manager seeks to provide best execution of all securities transactions and to aggregate securities transactions and then allocate securities to client accounts in a fair and equitable basis over time. The investment manager has developed policies and procedures, including brokerage and trade allocation policies and procedures, designed to mitigate and manage the potential conflicts of interest that may arise from the management of multiple types of accounts for multiple clients.
In addition to the accounts above, portfolio managers may manage accounts in a personal capacity that may include holdings that are similar to, or the same as, those of the fund. The investment manager’s Code of Ethics is designed to address conflicts and, among other things, imposes restrictions on the ability of the portfolio managers and other “investment access persons” to invest in securities that may be recommended or traded in the fund and other client accounts.
For portfolio managers Marzolf and Murphy, their responsibilities also include working as a securities analyst. This dual role may give rise to conflicts with respect to making investment decisions for accounts that the portfolio manager manages versus communicating his or her analyses to other portfolio managers concerning securities that he or she follows as an analyst.
| (3) | Columbia Management: Like other investment professionals with multiple clients, a fund’s portfolio manager(s) may face certain potential conflicts of interest in connection with managing both the fund and other accounts at the same time. The investment manager and the funds have adopted compliance policies and procedures that attempt to address certain of the potential conflicts that portfolio managers face in this regard. Certain of these conflicts of interest are summarized below. |
122
The management of accounts with different advisory fee rates and/or fee structures, including accounts that pay advisory fees based on account performance (performance fee accounts), may raise potential conflicts of interest for a portfolio manager by creating an incentive to favor higher fee accounts.
Potential conflicts of interest also may arise when a portfolio manager has personal investments in other accounts that may create an incentive to favor those accounts. As a general matter and subject to the investment manager’s Code of Ethics and certain limited exceptions, the investment manager’s investment professionals do not have the opportunity to invest in client accounts, other than the funds.
A portfolio manager who is responsible for managing multiple funds and/or accounts may devote unequal time and attention to the management of those funds and/or accounts. The effects of this potential conflict may be more pronounced where funds and/or accounts managed by a particular portfolio manager have different investment strategies.
A portfolio manager may be able to select or influence the selection of the broker/dealers that are used to execute securities transactions for the funds. A portfolio manager’s decision as to the selection of broker/dealers could produce disproportionate costs and benefits among the funds and the other accounts the portfolio manager manages.
A potential conflict of interest may arise when a portfolio manager buys or sells the same securities for a fund and other accounts. On occasions when a portfolio manager considers the purchase or sale of a security to be in the best interests of a fund as well as other accounts, the investment manager’s trading desk may, to the extent consistent with applicable laws and regulations, aggregate the securities to be sold or bought in order to obtain the best execution and lower brokerage commissions, if any. Aggregation of trades may create the potential for unfairness to a fund or another account if a portfolio manager favors one account over another in allocating the securities bought or sold.
“Cross trades,” in which a portfolio manager sells a particular security held by a fund to another account (potentially saving transaction costs for both accounts), could involve a potential conflict of interest if, for example, a portfolio manager is permitted to sell a security from one account to another account at a higher price than an independent third party would pay. The investment manager and the funds have adopted compliance procedures that provide that any transactions between a fund and another account managed by the investment manager are to be made at a current market price, consistent with applicable laws and regulations.
Another potential conflict of interest may arise based on the different investment objectives and strategies of a fund and other accounts managed by its portfolio manager(s). Depending on another account’s objectives and other factors, a portfolio manager may give advice to and make decisions for a fund that may differ from advice given, or the timing or nature of decisions made, with respect to another account. A portfolio manager’s investment decisions are the product of many factors in addition to basic suitability for the particular account involved. Thus, a portfolio manager may buy or sell a particular security for certain accounts, and not for a fund, even though it could have been bought or sold for the fund at the same time. A portfolio manager also may buy a particular security for one or more accounts when one or more other accounts are selling the security (including short sales). There may be circumstances when a portfolio manager’s purchases or sales of portfolio securities for one or more accounts may have an adverse effect on other accounts, including the funds.
A fund’s portfolio manager(s) also may have other potential conflicts of interest in managing the fund, and the description above is not a complete description of every conflict that could exist in managing the fund and other accounts. Many of the potential conflicts of interest to which the investment manager’s portfolio managers are subject are essentially the same or similar to the potential conflicts of interest related to the investment management activities of the investment manager and its affiliates.
| (4) | Turner: As is typical for many money managers, potential conflicts of interest may arise related to Turner’s management of accounts including the fund where not all accounts are able to participate in a desired IPO, or other limited opportunity, relating to use of soft dollars and other brokerage practices, related to the voting of proxies, employee personal securities trading, and relating to a variety of other circumstances. In all cases, however, Turner believes it has written policies and procedures in place reasonably designed to prevent violations of the federal securities laws and to prevent material conflicts of interest from arising. Please also see Turner’s Form ADV, Part II for a description of some of its policies and procedures in this regard. |
123
| (5) | MDTA: As a general matter, certain conflicts of interest may arise in connection with a portfolio manager’s management of a fund’s investments, on the one hand, and the investments of other accounts for which the portfolio manager is responsible, on the other. For example, it is possible that the various accounts managed could have different investment strategies that, at times, might conflict with one another to the possible detriment of the Fund. Alternatively, to the extent that the same investment opportunities might be desirable for more than one account, possible conflicts could arise in determining how to allocate them. Other potential conflicts might include conflicts created by specific portfolio manager compensation arrangements, and conflicts relating to selection of brokers or dealers to execute fund portfolio trades and/or specific uses of commissions from Fund portfolio trades (for example, research, or “soft dollars”). The Adviser has structured the portfolio managers’ compensation in a manner, and the Fund has adopted policies and procedures, reasonably designed to safeguard the Fund from being negatively affected as a result of any such potential conflicts. |
| (6) | Columbia Management: Management of the Income Builder Funds-of-Funds differs from that of the other funds. The portfolio management process is set forth generally below and in more detail in the funds’ prospectus. |
The investment manager uses quantitative models combined with qualitative factors to determine the funds allocations to the underlying funds. Using these methodologies, a group of the investment manager’s investment professionals allocates each fund’s assets within and across different asset classes in an effort to achieve the fund’s objective of providing a high level of current income and growth of capital. The fund will typically be rebalanced monthly in an effort to maximize the level of income and capital growth, incorporating various measures of relative value subject to constraints that set minimum or maximum exposure within asset classes, as set forth in the prospectus. Within the equity and fixed income asset classes, the investment manager establishes allocations for the funds, seeking to achieve each fund’s objective by investing in defined investment categories. The target allocation range constraints are intended, in part, to promote diversification within the asset classes.
Because of the structure of the funds-of-funds, the potential conflicts of interest for the portfolio managers may be different than the potential conflicts of interest for portfolio managers who manage other funds. These potential conflicts of interest include:
| | • | | In certain cases, the portfolio managers of the underlying funds are the same as the portfolio managers of the Income Builder Funds-of-Funds, and could influence the allocation of funds-of-funds assets to or away from the underlying funds that they manage. |
| | • | | The investment manager and its affiliates may receive higher compensation as a result of allocations to underlying funds with higher fees. |
The investment manager monitors the performance of the underlying funds and may, from time to time, recommend to the Board of Directors of the funds a change in portfolio management or fund strategy or the closure or merger of an underlying fund. In addition, the investment manager may believe that certain funds may benefit from additional assets or could be harmed by redemptions. All of these factors may also influence decisions in connection with the allocation of funds-of-funds assets to or away from certain underlying funds.
In addition to the accounts above, portfolio managers may manage accounts in a personal capacity that may include holdings that are similar to, or the same as, those of the fund. The investment manager has in place a Code of Ethics that is designed to address conflicts and that, among other things, imposes restrictions on the ability of the portfolio managers and other “investment access persons” to invest in securities that may be recommended or traded in the fund and other client accounts.
| (7) | American Century: Certain conflicts of interest may arise in connection with the management of multiple portfolios. Potential conflicts include, for example, conflicts among investment strategies and conflicts in the allocation of investment opportunities. American Century has adopted policies and procedures that are designed to minimize the effects of these conflicts. |
Responsibility for managing American Century client portfolios is organized according to investment discipline. Investment disciplines include, for example, quantitative equity, small- and mid-cap growth, large-cap growth, value, international, fixed income, asset allocation, and sector funds. Within each discipline are one or more portfolio teams responsible for managing specific client portfolios. Generally, client portfolios with similar strategies are managed by the same team using the same objective, approach, and philosophy. Accordingly, portfolio holdings, position sizes, and industry and sector exposures tend to be similar across similar portfolios, which minimizes the potential for conflicts of interest.
124
For each investment strategy, one portfolio is generally designated as the “policy portfolio.” Other portfolios with similar investment objectives, guidelines and restrictions are referred to as “tracking portfolios.” When managing policy and tracking portfolios, a portfolio team typically purchases and sells securities across all portfolios that the team manages. American Century’s trading systems include various order entry programs that assist in the management of multiple portfolios, such as the ability to purchase or sell the same relative amount of one security across several funds. In some cases a tracking portfolio may have additional restrictions or limitations that cause it to be managed separately from the policy portfolio. Portfolio managers make purchase and sale decisions for such portfolios alongside the policy portfolio to the extent the overlap is appropriate, and separately, if the overlap is not.
American Century may aggregate orders to purchase or sell the same security for multiple portfolios when it believes such aggregation is consistent with its duty to seek best execution on behalf of its clients. Orders of certain client portfolios may, by investment restriction or otherwise, be determined not available for aggregation. American Century has adopted policies and procedures to minimize the risk that a client portfolio could be systematically advantaged or disadvantaged in connection with the aggregation of orders. To the extent equity trades are aggregated, shares purchased or sold are generally allocated to the participating portfolios pro rata based on order size. Because initial public offerings (IPOs) are usually available in limited supply and in amounts too small to permit across-the-board pro rata allocations, American Century has adopted special procedures designed to promote a fair and equitable allocation of IPO securities among clients over time. Fixed income securities transactions are not executed through a centralized trading desk. Instead, portfolio teams are responsible for executing trades with broker/dealers in a predominantly dealer marketplace. Trade allocation decisions are made by the portfolio manager at the time of trade execution and orders entered on the fixed income order management system.
Finally, investment of American Century’s corporate assets in proprietary accounts may raise additional conflicts of interest. To mitigate these potential conflicts of interest, American Century has adopted policies and procedures intended to provide that trading in proprietary accounts is performed in a manner that does not give improper advantage to American Century to the detriment of client portfolios.
| (8) | Mondrian: Mondrian does not foresee any material conflicts of interest that may arise in the management of the funds and any other accounts managed with similar investment guidelines. Mondrian acts solely as an investment manager and does not engage in any other business activities. The following is a list of some potential conflicts of interest that can arise in the course of normal investment management business activities. Mondrian maintains and operates various policies and procedures which are designed to prevent or manage any of the conflicts identified below so that the interests of its clients are always put ahead of Mondrian’s own interests or those of its employees and directors: |
Allocation of aggregated trades
Mondrian may from time to time aggregate trades for a number of its clients.
Mondrian’s policy requires that all allocations of aggregated trades must be fair between clients. Transactions involving commingled orders are allocated in a manner deemed equitable to each account. When a combined order is executed in a series of transactions, at different prices, each account participating in the order may be allocated an average price obtained from the broker/dealer. When a trade can be allocated in a cost efficient manner to our clients, it will be prorated across all participating accounts. Mondrian may randomly allocate purchases or sales among participating accounts when the amounts involved are too small to be evenly proportioned in a cost efficient manner. In performing random allocations, Mondrian will consider consistency of strategy implementation among participating accounts.
Allocation of investment opportunities
Mondrian is an investment manager of multiple client portfolios. As such, it has to ensure that investment opportunities are allocated fairly between clients. There is a potential risk that Mondrian may favor one client over another client in making allocations of investment opportunities.
Mondrian makes security selection decisions at committee level. Those securities identified as investment opportunities are added to a list of approved securities; portfolios will hold only such approved securities.
All portfolios governed by the same or a similar mandate will be structured similarly (that is, will hold the same or comparable stocks), and will exhibit similar characteristics. Sale and purchase opportunities identified at regular investment meetings will be applied to portfolios across the board, subject to the requirements of individual client mandates.
125
See also “Side-by-side management of hedge funds” below.
Allocation of IPO opportunities
Initial Public Offerings (“IPO’s”) present a potential conflict of interest when they are priced at a discount to the anticipated secondary market price and the issuer has restricted or scaled back its allocation due to market demand. In such instances, the IPO allocation could be divided among a small select group of clients with others not receiving the allocation they would otherwise be entitled to.
Mondrian clients with relevant mandates are given an equal opportunity, proportionate to the size of their portfolio, to participate in IPO trades. All IPO purchases are allocated on a strict pro-rata basis.
Dealing in investments as principal in connections with the provision of seed capital
A conflict of interest exists when a portfolio management firm manages its own money alongside client money.
Mondrian generally does not trade for its own account. However, Mondrian and its affiliates have provided the seed capital to certain investment vehicles that have been established by Mondrian group entities. Mondrian serves as the investment manager to these investment vehicles.
Mondrian operates dealing policies designed to ensure the fair and equal treatment of all clients e.g. the allocation of aggregated trades among clients. These policies ensure that any portfolios in which Mondrian has an investment interest do not receive favorable treatment relative to other client portfolios.
Directorships and external arrangements
Certain Mondrian staff may hold positions in external organizations. There is a potential risk that Mondrian personnel may place their own interests (resulting from outside employment/directorships) ahead of the interests of Mondrian clients.
Before accepting an executive or non-executive directorship or any other appointment in another company, employees, including executive directors, must obtain the prior approval of the Chief Executive Officer. The Chief Compliance Officer must also be informed of all such appointments and changes.
The CEO and CCO will only permit appointments that would not present a conflict of interest with the individual’s responsibilities to Mondrian clients.
Dual agency
Dual Agency (also known as Cross Trading) concerns those transactions where Mondrian may act as agent for both the buyer and seller. In such circumstances there is a potential conflict of interest as it may be possible to favor one client over another when establishing the execution price and/or commission rate.
Although it rarely does so, Mondrian may act as agent for both buying and selling parties with respect to transactions in investments. If Mondrian proposes to act in such capacity, the Portfolio Manager will first obtain approval from the Chief Compliance Officer. The CCO has an obligation to ensure that both parties are treated fairly in any such trade.
Employee personal account dealing
There are a number of potential conflicts when staff of an investment firm engage in buying and selling securities for their personal account.
Mondrian has arrangements in place to ensure that none of its directors, officers or employees (or persons connected to them by way of a business or domestic relationship) effects any transaction on their own account which conflicts with client interests.
Mondrian’s rules which govern personal account dealing and general ethical standards are set out in the Mondrian Investment Partners Code of Ethics.
126
Gifts and entertainment (received)
In the normal course of business Mondrian employees may receive gifts and entertainment from third parties e.g. brokers and other service providers. This results in a potential conflict of interest when selecting third parties to provide services to Mondrian and its clients.
Mondrian has a policy which requires that gifts and entertainment received are reported to the Chief Compliance Officer (any items in excess of £100 require pre-approval).
All gifts and entertainment are reviewed to ensure that they are not inappropriate and that staff have not been unduly influenced by them.
Gifts and entertainment (given)
In the normal course of business, Mondrian employees may provide gifts and entertainment to third parties. Excessively lavish gifts and entertainment would be inappropriate.
Mondrian has a policy which requires that any gifts and entertainment provided are reported to the Chief Compliance Officer (any items in excess of £200 require pre-approval).
All gifts and entertainment are reviewed to ensure that they are not inappropriate and that staff have not attempted to obtain undue influence from them.
Performance fees
Where an investment firm has clients with a performance fee arrangement there is a risk that those clients could be favored over clients without performance fees.
Mondrian charges fees as a proportion of assets under management. In a very limited number of situations, in addition to this fee basis, certain accounts also include a performance fee basis.
The potential conflict of interest arising from these fee arrangements is addressed by Mondrian’s procedures for the allocation of aggregated trades among clients. Investment opportunities are allocated totally independently of fee arrangements.
Side-by-side management of hedge funds (Mondrian Alpha Funds)
Where an investment manager has responsibility for managing long only portfolios alongside portfolios that can take short positions there is potential for a conflict of interest to arise between the two types of portfolio.
Mondrian acts as investment manager for two Fixed Income Alpha and one Equity Alpha fund. The Alpha Funds are permitted to take short positions and are also permitted to invest in some or all of the same securities that Mondrian manages for other clients.
Mondrian is satisfied that the investment styles of these different products significantly reduce the likelihood of a conflict of interest arising. However, Mondrian has a number of policies and procedures in place that are designed to ensure that any potential conflicts are correctly managed and monitored so that all clients are treated fairly.
Soft dollar arrangements
Where an investment manager has soft dollar arrangements in place with a broker/dealer there is a potential conflict of interest as trading volumes through that broker/dealer are usually important in ensuring that soft dollar targets are met.
As is typical in the investment management industry, Mondrian client funds are used to pay brokerage commissions for the execution of transactions in the client’s portfolio. As part of that execution service, brokers generally provide proprietary research to their clients as to the value of securities, the advisability of investing in, purchasing or selling securities, and the availability of securities or purchasers or sellers of securities; furnishing of analyses and reports concerning issuers, securities or industries; and providing information on economic factors and trends.
Proprietary research may be used by Mondrian in connection with its investment decision-making process with respect to one or more accounts managed by it, and it may or may not be used, or used exclusively, with respect to the account generating the brokerage.
127
With the exception of the receipt of proprietary research, Mondrian has no other soft dollar or commission sharing arrangements in place with brokers.
| (9) | Davis: Actual or apparent conflicts of interest may arise when a portfolio manager has day-to-day management responsibilities with respect to more than one portfolio or other account. More specifically, portfolio managers who manage multiple portfolios and/or other accounts are presented with the following potential conflicts: |
| | • | | The management of multiple portfolios and/or other accounts may result in a portfolio manager devoting unequal time and attention to the management of each portfolio and/or other account. Davis Advisors seeks to manage such competing interests for the time and attention of portfolio managers by having portfolio managers focus on a particular investment discipline. Most other accounts managed by a portfolio manager are managed using the same investment models that are used in connection with the management of the portfolios. |
| | • | | If a portfolio manager identifies a limited investment opportunity which may be suitable for more than one portfolio or other account, a portfolio may not be able to take full advantage of that opportunity due to an allocation of filled purchase or sale orders across all eligible portfolios and other accounts. To deal with these situations, Davis Advisors has adopted procedures for allocating portfolio transactions across multiple accounts. |
| | • | | With respect to securities transactions for the portfolios, Davis Advisors determines which broker to use to execute each order, consistent with its duty to seek best execution of the transaction. However, with respect to certain other accounts (such as mutual funds, other pooled investment vehicles that are not registered mutual funds, and other accounts managed for organizations and individuals), Davis Advisors may be limited by the client with respect to the selection of brokers or may be instructed to direct trades through a particular broker. In these cases, Davis Advisors may place separate, non-simultaneous, transactions for a portfolio and another account which may temporarily affect the market price of the security or the execution of the transaction, or both, to the detriment of the portfolio or the other account. |
| | • | | Finally, substantial investment of Davis Advisor or Davis Family assets in certain mutual funds may lead to conflicts of interest. To mitigate these potential conflicts of interest, Davis Advisors has adopted policies and procedures intended to ensure that all clients are treated fairly over time. Davis Advisors does not receive an incentive based fee on any account. |
| (10) | Donald Smith: Donald Smith & Co., Inc. is very sensitive to conflicts of interest that could possibly arise in its capacity of serving as an investment adviser. It remains committed to resolving any and all conflicts in the best interest of its clients. |
Donald Smith & Co., Inc. is an independent investment advisor with no parent or subsidiary organizations. Additionally, it has no affiliated organizations, brokerage, nor any investment banking activities.
Clients include mutual funds, public and corporate pension plans, endowments and foundations, and other separate accounts. Donald Smith & Co., Inc. has put in place systems, policies and procedures, which have been designed to maintain fairness in portfolio management across all clients. Potential conflicts between funds or with other types of accounts are managed via allocation policies and procedures, internal review processes, and direct oversight by Donald G. Smith, President.
| (11) | Tradewinds: Actual or apparent conflicts of interest may arise when a portfolio manager has day-to-day management responsibilities with respect to more than one account. More specifically, portfolio managers who manage multiple accounts are presented with several potential conflicts, which is not intended to be an exhaustive list: |
| | • | | The management of multiple accounts may result in a portfolio manager devoting unequal time and attention to the management of each account. Tradewinds seeks to manage such competing interests for the time and attention of portfolio managers by having portfolio managers focus on a particular investment discipline. Most accounts managed by a portfolio manager in a particular investment strategy are managed using the same investment models. |
| | • | | If a portfolio manager identifies a limited investment opportunity which may be suitable for more than one account, an account may not be able to take full advantage of that opportunity due to an allocation of filled purchase or sale orders across all eligible accounts. To deal with these situations, Tradewinds has adopted procedures for fairly allocating portfolio transactions across multiple accounts. |
| | • | | With respect to many of its clients’ accounts, Tradewinds determines which broker to use to execute transaction orders, consistent with its duty to seek best execution of the transaction. However, with respect to certain other accounts, Tradewinds may be limited by the client with respect to the selection of brokers or may be instructed to direct trades through a particular |
128
| | broker. In these cases, Tradewinds may place separate, non-simultaneous, transactions for a Fund and other accounts which may temporarily affect the market price of the security or the execution of the transaction, or both, to the detriment of the Fund or the other accounts. |
| | • | | Some clients are subject to different regulations. As a consequence of this difference in regulatory requirements, some clients may not be permitted to engage in all the investment techniques or transactions or to engage in these transactions to the same extent as the other accounts managed by the portfolio manager. Finally, the appearance of a conflict of interest may arise where Tradewinds has an incentive, such as a performance-based management fee, which relates to the management of some accounts, with respect to which a portfolio manager has day-to-day management responsibilities. |
Tradewinds has adopted certain compliance procedures which are designed to address these types of conflicts common among investment managers. However, there is no guarantee that such procedures will detect each and every situation in which a conflict arises.
| (12) | BHMS: Actual or potential conflicts of interest may arise when a portfolio manager has management responsibilities to more than one account (including the Fund). BHMS manages potential conflicts between funds or with other types of accounts through allocation policies and procedures, internal review processes and oversight by directors and independent third parties to ensure that no client, regardless of type or fee structure, is intentionally favored at the expense of another. Allocation policies are designed to address potential conflicts in situations where two or more funds or accounts participate in investment decisions involving the same securities. |
| (13) | MetWest: MetWest Capital’s portfolio managers generally face two types of conflicts of interest: (1) conflicts between and among the interests of the various accounts they manage, and (2) conflicts between the interests of the accounts they manage and their own personal interests. The policies of MetWest Capital require that portfolio managers treat all accounts they manage equitably and fairly in the face of such real or potential conflicts, The management of multiple funds and other accounts may require the portfolio manager to devote less than all of his or her time to a fund, particularly if the funds and accounts have different objectives, benchmarks and time horizons. The portfolio manager may also be required to allocate his or her investment ideas across multiple funds and accounts. In addition, if a portfolio manager identifies a limited investment opportunity, such as an IPO that may be suitable for more than one fund or other account, a fund may not be able to take full advantage of that opportunity due to an allocation of that investment across all eligible funds and accounts. Further, security purchase and sale orders for multiple accounts often are aggregated for purpose of execution. Although such aggregation generally benefits clients, it may cause the price or brokerage costs to be less favorable to a particular client than if similar transactions were not being executed concurrently for other accounts. It may also happen that a fund’s adviser or sub-adviser will determine that it would be in the best interest, and consistent with the investment policies, of another account to sell a security (including by means of a short sale) that a fund holds long, potentially resulting in a decrease in the market value of the security held by the fund. |
As noted above, portfolio managers may also experience certain conflicts between the interests of the accounts they manage and their own personal interests (which may include interests in advantaging MetWest Capital). The structure of a portfolio manager’s or an investment advisor’s compensation may create an incentive for the manager or advisor to favor accounts whose performance has a greater impact on such compensation. The portfolio manager may, for example, have an incentive to allocate favorable or limited opportunity investments or structure the timing of investments to favor such accounts. Similarly, if a portfolio manager holds a larger personal investment in one fund than he or she does in another, the portfolio manager may have an incentive to favor the fund in which he or she holds a larger stake. In general, MetWest Capital has policies and procedures to address the various potential conflicts of interest described above. It has policies and procedures designed to ensure that portfolio managers have sufficient time and resources to devote to the various accounts they manage. Similarly, it has policies and procedures designed to ensure that investments and investment opportunities are allocated fairly across accounts, and that the interests of client accounts are placed ahead of a portfolio manager’s personal interests. However, there is no guarantee that such procedures will detect or address each and every situation where a conflict arises.
| (14) | Threadneedle: Threadneedle Investments portfolio managers may manage one or more mutual funds as well as other types of accounts, including proprietary accounts, separate accounts for institutions, and other pooled investment vehicles. Portfolio managers make investment decisions for an account or portfolio based on its investment objectives and policies, and other relevant investment considerations. A portfolio manager may manage a separate account or other pooled investment vehicle whose fees may be materially greater than the management fees paid by the Fund and may include a performance-based fee. Management of multiple funds and accounts may create potential conflicts of interest relating to the allocation of investment opportunities, and the aggregation and allocation of trades. In addition, the portfolio manager’s responsibilities at Threadneedle |
129
| | Investments include working as a securities analyst. This dual role may give rise to conflicts with respect to making investment decisions for accounts that he/she manages versus communicating his/her analyses to other portfolio managers concerning securities that he/she follows as an analyst. |
Threadneedle Investments has a fiduciary responsibility to all of the clients for which it manages accounts. Threadneedle Investments seeks to provide best execution of all securities transactions and to aggregate securities transactions and then allocate securities to client accounts in a fair and timely manner. Threadneedle Investments has developed policies and procedures, including brokerage and trade allocation policies and procedures, designed to mitigate and manage the potential conflicts of interest that may arise from the management of multiple types of accounts for multiple clients.
| (15) | Columbia WAM: Like other investment professionals with multiple clients, a Fund’s portfolio manager(s) may face certain potential conflicts of interest in connection with managing both the Fund and other accounts at the same time. The Advisor (Columbia Wanger Asset Management) and the Funds have adopted compliance policies and procedures that attempt to address certain of the potential conflicts that portfolio managers face in this regard. Certain of these conflicts of interest are summarized below. |
The management of accounts with different advisory fee rates and/or fee structures, including accounts that pay advisory fees based on account performance (performance fee accounts), if any, may raise potential conflicts of interest for a portfolio manager by creating an incentive to favor higher fee accounts.
Potential conflicts of interest also may arise when a portfolio manager has personal investments in other accounts that may create an incentive to favor those accounts. As a general matter and subject to the Advisor’s Code of Ethics and certain limited exceptions, the Advisor’s investment professionals do not have the opportunity to invest in client accounts, other than the Funds.
A portfolio manager who is responsible for managing multiple funds and/or accounts may devote unequal time and attention to the management of those funds and/or accounts. The effects of this potential conflict may be more pronounced where funds and/or accounts managed by a particular portfolio manager have different investment strategies.
A portfolio manager may be able to select or influence the selection of the broker/dealers that are used to execute securities transactions for the Funds. A portfolio manager’s decision as to the selection of broker/dealers could produce disproportionate costs and benefits among the Funds and the other accounts the portfolio manager manages.
A potential conflict of interest may arise when a portfolio manager buys or sells the same securities for a Fund and other accounts. On occasions when a portfolio manager considers the purchase or sale of a security to be in the best interests of a Fund as well as other accounts, the Advisor’s trading desk may, to the extent consistent with applicable laws and regulations, aggregate the securities to be sold or bought in order to obtain the best execution and lower brokerage commissions, if any. Aggregation of trades may create the potential for unfairness to a Fund or another account if a portfolio manager favors one account over another in allocating the securities bought or sold.
“Cross trades,” in which a portfolio manager sells a particular security held by a Fund to another account (potentially saving transaction costs for both accounts), could involve a potential conflict of interest if, for example, a portfolio manager is permitted to sell a security from one account to another account at a higher price than an independent third party would pay. The Advisor and the Funds have adopted compliance procedures that provide that any transactions between the Fund and another account managed by the Advisor are to be made at an independent current market price, consistent with applicable laws and regulation.
Another potential conflict of interest may arise based on the different investment objectives and strategies of a Fund and other accounts managed by its portfolio manager(s). Depending on another account’s objectives and other factors, a portfolio manager may give advice to and make decisions for a Fund that may differ from advice given, or the timing or nature of decisions made, with respect to another account. A portfolio manager’s investment decisions are the product of many factors in addition to basic suitability for the particular account involved. Thus, a portfolio manager may buy or sell a particular security for certain accounts, and not for a Fund, even though it could have been bought or sold for the Fund at the same time. A portfolio manager also may buy a particular security for one or more accounts when one or more other accounts are selling the security (including short sales). There may be circumstances when a portfolio manager’s purchases or sales of portfolio securities for one or more accounts may have an adverse effect on other accounts, including the Funds.
130
A Fund’s portfolio manager(s) also may have other potential conflicts of interest in managing the Fund, and the description above is not a complete description of every conflict that could be deemed to exist in managing both the Fund and other accounts. Many of the potential conflicts of interest to which the Advisor’s portfolio managers are subject are essentially the same as or similar to the potential conflicts of interest related to the investment management activities of the Advisor and its affiliates.
| (16) | AllianceBernstein: As an investment adviser and fiduciary, AllianceBernstein owes its clients and shareholders an undivided duty of loyalty. We recognize that conflicts of interest are inherent in our business and accordingly have developed policies and procedures (including oversight monitoring) reasonably designed to detect, manage and mitigate the effects of actual or potential conflicts of interest in the area of employee personal trading, managing multiple accounts for multiple clients, including AllianceBernstein Mutual Funds, and allocating investment opportunities. Investment professionals, including portfolio managers and research analysts, are subject to the above-mentioned policies and oversight monitoring to ensure that all clients are treated equitably. We place the interests of our clients first and expect all of our employees to meet their fiduciary duties. |
Employee Personal Trading
AllianceBernstein has adopted a Code of Business Conduct and Ethics that is designed to detect and prevent conflicts of interest when investment professionals and other personnel of AllianceBernstein own, buy or sell securities which may be owned by, or bought or sold for, clients. Personal securities transactions by an employee may raise a potential conflict of interest when an employee owns or trades in a security that is owned or considered for purchase or sale by a client, or recommended for purchase or sale by an employee to a client. Subject to the reporting requirements and other limitations of its Code of Business Conduct and Ethics, AllianceBernstein permits its employees to engage in personal securities transactions, and also allows them to acquire investments in the AllianceBernstein Mutual Funds through direct purchase, 401K/profit sharing plan investment and/or notionally in connection with deferred incentive compensation awards. AllianceBernstein’s Code of Ethics and Business Conduct requires disclosure of all personal accounts and maintenance of brokerage accounts with designated broker-dealers approved by AllianceBernstein. The Code also requires preclearance of all securities transactions and imposes a 90 day holding period for securities purchased by employees to discourage short-term trading.
Managing Multiple Accounts for Multiple Clients
AllianceBernstein has compliance policies and oversight monitoring in place to address conflicts of interest relating to the management of multiple accounts for multiple clients. Conflicts of interest may arise when an investment professional has responsibilities for the investments of more than one account because the investment professional may be unable to devote equal time and attention to each account. The investment professional or investment professional teams for each client may have responsibilities for managing all or a portion of the investments of multiple accounts with a common investment strategy, including other registered investment companies, unregistered investment vehicles, such as hedge funds, pension plans, separate accounts, collective trusts and charitable foundations. Among other things, AllianceBernstein’s policies and procedures provide for the prompt dissemination to investment professionals of initial or changed investment recommendations by analysts so that investment professionals are better able to develop investment strategies for all accounts they manage. In addition, investment decisions by investment professionals are reviewed for the purpose of maintaining uniformity among similar accounts and ensuring that accounts are treated equitably. No investment professional that manages client accounts carrying performance fees is compensated directly or specifically for the performance of those accounts. Investment professional compensation reflects a broad contribution in multiple dimensions to long-term investment success for our clients and is not tied specifically to the performance of any particular client’s account, nor is it directly tied to the level or change in the level of assets under management.
Allocating Investment Opportunities
AllianceBernstein has policies and procedures intended to address conflicts of interest relating to the allocation of investment opportunities. These policies and procedures are designed to ensure that information relevant to investment decisions is disseminated promptly within its portfolio management teams and investment opportunities are allocated equitably among different clients. The investment professionals at AllianceBernstein routinely are required to select and allocate investment opportunities among accounts. Portfolio holdings, position sizes, and industry and sector exposures tend to be similar across similar accounts, which minimizes the potential for conflicts of interest relating to the allocation of investment opportunities. Nevertheless, investment opportunities may be allocated differently among accounts due to the particular characteristics of an account, such as size of the account, cash position, tax status, risk tolerance and investment restrictions or for other reasons.
131
AllianceBernstein’s procedures are also designed to prevent potential conflicts of interest that may arise when AllianceBernstein has a particular financial incentive, such as a performance-based management fee, relating to an account. An investment professional may perceive that he or she has an incentive to devote more time to developing and analyzing investment strategies and opportunities or allocating securities preferentially to accounts for which AllianceBernstein could share in investment gains.
To address these conflicts of interest, AllianceBernstein’s policies and procedures require, among other things, the prompt dissemination to investment professionals of any initial or changed investment recommendations by analysts; the aggregation of orders to facilitate best execution for all accounts; price averaging for all aggregated orders; objective allocation for limited investment opportunities (e.g., on a rotational basis) to ensure fair and equitable allocation among accounts; and limitations on short sales of securities. These procedures also require documentation and review of justifications for any decisions to make investments only for select accounts or in a manner disproportionate to the size of the account.
| (17) | LaSalle: Since the Investment Team manages other accounts in addition to the Funds, conflicts of interest may arise in connection with the Investment Team’s management of a Fund’s investments on the one hand and the investments of such other accounts on the other hand. Conflicts may arise related to: (1) aggregation and allocation of securities transactions (including initial public offerings), (2) the timing of purchases and sales of the same security for different accounts and (3) different advice for different accounts, primarily driven by the account’s investment objectives. LaSalle Securities US and LaSalle Securities B.V. believe that conflicts are largely mitigated by their respective Code of Ethics, which prohibits ownership by the Investment Team Members (except through a mutual fund) of securities of the type the Funds invest in, and various policies and procedures it has adopted, including the master trading schedule it maintains to proportionately allocate purchases and sales to each account by tracking the target weight for each holding and establishing the required shares to reach those targets. |
Structure of Compensation
| (18) | Columbia Management: Portfolio manager compensation is typically comprised of (i) a base salary, (ii) an annual cash bonus, and (iii) an equity incentive award in the form of stock options and/or restricted stock. The annual cash bonus and equity incentive awards are paid from a team bonus pool that is based on the performance of the accounts managed by the portfolio management team, which might include mutual funds, wrap accounts, institutional portfolios and hedge funds. Funding for the bonus pool is determined by a percentage of the aggregate assets under management in the accounts managed by the portfolio managers, including the fund, and by the short term (typically one-year) and long-term (typically three-year, five-year and ten-year) performance of those accounts in relation to the relevant peer group universe. Funding for the bonus pool would also include a percentage of any performance fees earned on long/short mutual funds managed by the Team. With respect to hedge funds and separately managed accounts that follow a hedge fund mandate, funding for the bonus pool is a percentage of performance fees earned on the hedge funds or accounts managed by the portfolio managers. Senior management of Columbia Management has the discretion to increase or decrease the size of the part of the bonus pool and to determine the exact amount of each portfolio manager’s bonus paid from this portion of the bonus pool based on his/her performance as an employee. In addition, where portfolio managers invest in a hedge fund managed by the investment manager, they receive a cash reimbursement for the investment management fees charged on their hedge fund investments. Portfolio managers are provided with a benefits package, including life insurance, health insurance, and participation in a company 401(k) plan, comparable to that received by other Columbia Management employees. Certain investment personnel are also eligible to defer a portion of their compensation. An individual making this type of election can allocate the deferral to the returns associated with one or more products they manage or support or to certain other products managed by their investment team. Depending upon their job level, portfolio managers may also be eligible for other benefits or perquisites that are available to all Columbia Management employees at the same job level. |
| (19) | Columbia Management: The compensation of employees of the investment manager consists of (i) a base salary, (ii) an annual cash bonus, and (iii) equity incentive awards in the form of stock options and/or restricted stock. The annual cash bonus is based on management’s assessment of the employee’s performance relative to individual and business unit goals and objectives which, for portfolio manager Joy, may be based, in part, on achieving certain investment performance goals and retaining and attracting assets under management, and for portfolio manager Bergene, on developing competitive products, managing existing products, and selecting and monitoring subadvisers for the funds. In addition, subject to certain vesting requirements, the compensation of portfolio manager Joy includes an annual award based on the performance of Ameriprise Financial over rolling three-year periods. This program has been discontinued and the final award under this plan covers the three-year period that started in January 2007 and ended in December 2009. Portfolio managers are provided with a benefit package including life insurance, health insurance and participation in the company’s 401(k) plan comparable to that received by other employees of the investment manager. Depending upon their job level, portfolio managers may also be eligible for other benefits or perquisites that are available to all employees of investment manager at the same job level. |
132
| (20) | Columbia Management: Portfolio manager compensation is typically comprised of (i) a base salary, (ii) an annual cash bonus, and (iii) an equity incentive award in the form of stock options and/or restricted stock. The annual cash bonus and equity incentive awards are paid from a team bonus pool that is based on the performance of the accounts managed by the portfolio management team, which might include mutual funds, wrap accounts, institutional portfolios and hedge funds. The bonus pool is determined by a percentage of the aggregate assets under management in the accounts managed by the portfolio managers, including the fund, plus, where applicable, a percentage of the assets of the funds they support as research analysts, and by the short term (typically one-year) and long-term (typically three-year and five-year) performance of those accounts in relation to the relevant peer group universe. Funding for the bonus pool may also include a percentage of any performance fees earned on long/short mutual funds managed by the Team. One member of the team does not participate in the pool but instead receives a bonus based on management fees on one product and asset retention efforts associated with other products managed by the team. Senior management of the investment manager has the discretion to increase or decrease the size of the part of the bonus pool and to determine the exact amount of each portfolio manager’s bonus paid from this portion of the bonus pool based on his/her performance as an employee. Portfolio managers are provided with a benefits package, including life insurance, health insurance, and participation in a company 401(k) plan, comparable to that received by other employees of the investment manager. Certain investment personnel are also eligible to defer a portion of their compensation. An individual making this type of election can allocate the deferral to the returns associated with one or more products they manage or support or to certain other products managed by their investment team. Depending upon their job level, portfolio managers may also be eligible for other benefits or perquisites that are available to all employees of the investment manager at the same job level. |
| (21) | Turner: Turner’s investment professionals receive a base salary commensurate with their level of experience. Turner’s goal is to maintain competitive base salaries through review of industry standards, market conditions, and salary surveys. Bonus compensation, which is a multiple of base salary, is based on the performance of each individual’s sector and portfolio assignments relative to appropriate market benchmarks. In addition, each employee is eligible for equity awards. Turner believes this compensation provides incentive to attract and retain highly qualified people. |
The objective performance criteria noted above accounts for 90% of the bonus calculation. The remaining 10% is based upon subjective, “good will” factors including teamwork, interpersonal relations, the individual’s contribution to overall success of the firm, media and client relations, presentation skills, and professional development. Portfolio managers/analysts are reviewed on an annual basis. The Chief Investment Officer, Robert E. Turner, CFA, is responsible for setting base salaries, bonus targets, and making all subjective judgments related to an investment professionals’ compensation.
| (22) | Columbia Management: Portfolio manager compensation is typically comprised of (i) a base salary, (ii) an annual cash bonus, and (iii) an equity incentive award in the form of stock options and/or restricted stock. The annual cash bonus and equity incentive awards are paid from a team bonus pool that is based on the performance of the accounts managed by the portfolio management team, which might include mutual funds, wrap accounts, institutional portfolios and hedge funds. The bonus pool is determined by a percentage of the aggregate assets under management in the accounts managed by the portfolio managers, including the fund, plus, where applicable, a percentage of the assets of the funds they support as research analysts, and by the short term (typically one-year) and long-term (typically three-year) performance of those accounts in relation to the relevant peer group universe. Funding for the bonus pool may also include a percentage of any performance fees earned on long/short mutual funds managed by the Team. Senior management of The investment manager has the discretion to increase or decrease the size of the part of the bonus pool and to determine the exact amount of each portfolio manager’s bonus paid from this portion of the bonus pool based on his/her performance as an employee. Portfolio managers are provided with a benefits package, including life insurance, health insurance, and participation in a company 401(k) plan, comparable to that received by other employees of the investment manager. Certain investment personnel are also eligible to defer a portion of their compensation. An individual making this type of election can allocate the deferral to the returns associated with one or more products they manage or support or to certain other products managed by their investment team. Depending upon their job level, portfolio managers may also be eligible for other benefits or perquisites that are available to all employees of the investment manager at the same job level. |
| (23) | Columbia Management: Portfolio manager compensation is typically comprised of (i) a base salary, (ii) an annual cash bonus, a portion of which may be subject to a mandatory deferral program, and may include (iii) an equity incentive award in the form of stock options and/or restricted stock. The annual cash bonus is paid from a team bonus pool that is based on the performance of the accounts managed by the portfolio management team, which might include mutual funds, wrap accounts, institutional portfolios and hedge funds. The bonus pool is determined by the aggregate market competitive bonus targets for the teams of which the portfolio manager is a member and by the short-term (typically one-year) and long-term (typically three-year) performance of those accounts in relation to applicable benchmarks or the relevant peer group universe. Senior management of |
133
| | the investment manager has the discretion to increase or decrease the size of the part of the bonus pool and to determine the exact amount of each portfolio manager’s bonus paid from this portion of the bonus pool based on his/her performance as an employee. Portfolio managers are provided with a benefits package, including life insurance, health insurance, and participation in a company 401(k) plan, comparable to that received by other employees of the investment manager. Certain investment personnel are also eligible to defer a portion of their compensation. An individual making this type of election can allocate the deferral to the returns associated with one or more products they manage or support or to certain other products managed by their investment team. Depending upon their job level, portfolio managers may also be eligible for other benefits or perquisites that are available to all employees of the investment manager at the same job level. |
| (24) | American Century: The compensation of American Century’s portfolio managers is structured to align the interests of portfolio managers with those of the shareholders whose assets they manage. For the fiscal year ended May 31, 2009, it included the components described below, each of which is determined with reference to a number of factors, such as overall performance, market competition, and internal equity. Compensation is not directly tied to the value of assets held in client portfolios. |
Base Salary
Portfolio managers receive base pay in the form of a fixed annual salary.
Bonus
A significant portion of portfolio manager compensation takes the form of an annual incentive bonus tied to performance. Bonus payments are determined by a combination of factors. One factor is fund investment performance. For most American Century mutual funds, investment performance is measured by a combination of one- and three- year pre-tax performance relative to various benchmarks and/or internally-customized peer groups. The performance comparison periods may be adjusted based on a fund’s inception date or a portfolio manager’s tenure on the fund. Custom peer groups are constructed using all the funds in appropriate Lipper or Morningstar categories as a starting point. Funds are then eliminated from the peer group that is both more stable over the long-term (i.e., has less peer turnover) and that more closely represents the fund’s true peers based on internal investment mandates. In 2008, American Century Investments began placing increased emphasis on long-term performance and is phasing in five year performance periods.
Portfolio managers may have responsibility for multiple American Century mutual funds. In such cases, the performance of each is assigned a percentage weight appropriate for the portfolio manager’s relative levels of responsibility.
Portfolio managers also may have responsibility for portfolios that are managed in a fashion similar to that of other American Century mutual funds. This is the case for the Partners Small Cap Equity and Partners Aggressive Growth Funds. If the performance of a similarly managed account is considered for purposes of compensation, it is either measured in the same way as a comparable American Century mutual fund (i.e., relative to the performance of a benchmark and/or peer group) or relative to the performance of such mutual fund. Performance of Partners Small Cap Equity Fund is measured relative to the performance of a comparable American Century mutual fund. Performance of Partners Aggressive Growth Fund is not separately considered in determining portfolio manager compensation.
A second factor in the bonus calculation relates to the performance of all American Century funds managed according to a particular investment style, such as U.S. growth, U.S. value, international, quantitative or fixed income. Performance is measured for each product individually as described above and then combined to create an overall composite for the product group. These composites may measure one-year performance (equal weighted) or a combination of one- and three-year performance (asset weighted) depending on the portfolio manager’s responsibilities and products managed. This feature is designed to encourage effective teamwork among portfolio management teams in achieving long-term investment success for similarly styled portfolios.
A portion of some portfolio managers’ bonuses may be tied to individual performance goals, such as research projects and the development of new products.
134
Restricted Stock Plans
Portfolio managers are eligible for grants of restricted stock of ACC. These grants are discretionary, and eligibility and availability can vary from year to year. The size of an individual’s grant is determined by individual and product performance as well as other product-specific considerations. Grants can appreciate/depreciate in value based on the performance of the ACC stock during the restriction period (generally three to four years).
Deferred Compensation Plans
Portfolio managers are eligible for grants of deferred compensation. These grants are used in very limited situations, primarily for retention purposes. Grants are fixed and can appreciate/depreciate in value based on the performance of the American Century mutual funds in which the portfolio manager chooses to invest them.
| (25) | Davis: Kenneth Feinberg’s compensation as a Davis Advisors employee consists of (i) a base salary, (ii) an annual bonus equal to a percentage of growth in Davis Advisors’ profits, (iii) awards of equity (“Units”) in Davis Advisors including Units, options on Units, and/or phantom Units, and (iv) an incentive plan whereby Davis Advisors purchases shares in selected funds managed by Davis Advisors. At the end of specified periods, generally five years following the date of purchase, some, all, or none of the fund shares will be registered in the employee’s name based on fund performance after expenses on a pre-tax basis versus the S&P 500 Index and versus peer groups as defined by Morningstar or Lipper. Davis Advisors’ portfolio managers are provided benefits packages including life insurance, health insurance, and participation in company 401(k) plan comparable to that received by other company employees. |
Christopher Davis’s annual compensation as an employee of Davis Advisors consists of a base salary. Davis Advisors’ portfolio managers are provided benefits packages including life insurance, health insurance, and participation in company 401(k) plan comparable to that received by other company employees.
| (26) | Donald Smith: All employees at Donald Smith & Co., Inc. are compensated on incentive plans. The compensation for portfolio managers, analysts and traders at Donald Smith consists of a base salary, a partnership interest in the firm’s profits, and possibly an additional, discretionary bonus. This discretionary bonus can exceed 100% of the base salary if performance for clients exceeds established benchmarks. The current benchmark utilized is the Russell 2000 Value Index. Additional distribution of firm ownership is a strong motivation for continued employment at Donald Smith & Co., Inc. Administrative personnel are also given a bonus as a function of their contribution and the profitability of the firm. |
| (27) | BHMS: In addition to base salary, all portfolio managers and analysts at BHMS share in a bonus pool that is distributed semi-annually. Analysts and portfolio managers are rated on their value added to the team-oriented investment process. Overall compensation applies with respect to all accounts managed and compensation does not differ with respect to distinct accounts managed by a portfolio manager. Compensation is not tied to a published or private benchmark. It is important to understand that contributions to the overall investment process may include not recommending securities in an analyst’s sector if there are no compelling opportunities in the industries covered by that analyst. |
The compensation of portfolio managers is not directly tied to fund performance or growth in assets for any fund or other account managed by a portfolio manager and portfolio managers are not compensated for bringing in new business. Of course, growth in assets from the appreciation of existing assets and/or growth in new assets will increase revenues and profit. The consistent, long-term growth in assets at any investment firm is to a great extent, dependent upon the success of the portfolio management team. The compensation of the portfolio management team at the Adviser will increase over time, if and when assets continue to grow through competitive performance.
| (28) | MetWest: MetWest Capital’s compensation system is designed not only to attract and retain experienced, highly qualified investment personnel, but also to closely align employees’ interests with clients’ interests. Compensation for investment professionals consists of a base salary, bonus, and generous benefits. Benefits include a comprehensive insurance benefits program (medical, vision and dental), 401(k) plan with an employer-matched contribution. A material portion of each such professional’s annual compensation is in the form of a bonus tied to results relative to clients’ benchmarks and overall client satisfaction. Bonuses may range from 20% to over 100% of salary. |
135
| | MetWest Capital’s compensation system is not determined on an account-specific basis. Rather, bonuses are tied to overall firm profitability and composite performance relative to the benchmark. The primary benchmark for the Small Cap Intrinsic Value strategy is the Russell 2000 Value Index. To reinforce long-term focus, performance is measured over MetWest Capital’s investment horizon (typically two to four years). Analysts are encouraged to maintain a long-term focus and are not compensated for the number of their recommendations that are purchased in the portfolio. Rather, their bonuses are tied to overall strategy performance. |
Mr. Lisenbee is an owner of MetWest Capital. As such, his compensation consists of a fixed salary and participation in the firm’s profits.
| (29) | Columbia Management: Portfolio manager compensation is typically comprised of (i) a base salary, (ii) an annual cash bonus and may include (iii) an equity incentive award in the form of stock options and/or restricted stock. The annual cash bonus is paid from a team bonus pool that is based on the performance of the accounts managed by the portfolio management team, which might include mutual funds, wrap accounts, institutional portfolios and hedge funds. Funding for the bonus pool is based upon a percentage of profits generated by the institutional portfolios they manage. Lynn Hopton and Yvonne Stevens may also be paid from a bonus pool based upon the performance of the mutual fund(s) they manage. Funding for this bonus pool is determined by a percentage of the aggregate assets under management in the mutual fund(s) they manage, and by the short term (typically one-year) and long-term (typically three-year) performance of the mutual fund(s) in relation to the relevant peer group universe. Senior management of Columbia Management has the discretion to increase or decrease the size of the bonus pool related to mutual funds and to determine the exact amount of each portfolio manager’s bonus paid from this portion of the bonus pool based on his/her performance as an employee. Senior management of Columbia Management does not have discretion over the size of the bonus pool related to institutional portfolios. Portfolio managers are provided with a benefits package, including life insurance, health insurance, and participation in a company 401(k) plan, comparable to that received by other Columbia Management employees. Certain investment personnel are also eligible to defer a portion of their compensation. An individual making this type of election can allocate the deferral to the returns associated with one or more products they manage or support or to certain other products managed by their investment team. Depending upon their job level, portfolio managers may also be eligible for other benefits or perquisites that are available to all Columbia Management employees at the same job level. |
| (30) | Columbia Management: Portfolio manager compensation is typically comprised of (i) a base salary, (ii) an annual cash bonus, and may include (iii) an equity incentive award in the form of stock options and/or restricted stock. The annual cash bonus, and in some instances the base salary, are paid from a team bonus pool that is based on the performance of the accounts managed by the portfolio management team, which might include mutual funds, wrap accounts, institutional portfolios and hedge funds. The bonus pool is determined by a percentage of the management fees on the accounts managed by the portfolio managers, including the fund. The percentage of management fees that fund the bonus pool is based on the short term (typically one-year) and long-term (typically three-year and five-year) performance of those accounts in relation to the relevant peer group universe. Funding for the bonus pool may also include a percentage of any performance fees earned on long/short mutual funds managed by the Team. With respect to hedge funds and separately managed accounts that follow a hedge fund mandate, funding for the bonus pool is a percentage of performance fees earned on the hedge funds or accounts managed by the portfolio managers. Portfolio managers are provided with a benefits package, including life insurance, health insurance, and participation in a company 401(k) plan, comparable to that received by other Columbia Management employees. Depending upon their job level, portfolio managers may also be eligible for other benefits or perquisites that are available to all Columbia Management employees at the same job level. |
| (31) | Columbia WAM: As of December 31, 2008, the portfolio managers received all of their compensation from the Advisor and its parent company, Columbia Management. P. Zachary Egan and Louis J. Mendes each received compensation in the form of salary and incentive compensation. Typically, a high proportion of an analyst’s or portfolio manager’s bonus is paid in cash with a smaller proportion going into two separate incentive plans. The first plan is a notional investment based on the performance of certain Columbia Funds, including the Columbia Acorn Funds. The second plan consists of Bank of America restricted stock and/or options. For 2008, investments in the second plan were made through a deferred cash program. Both plans vest over three years from the date of issuance. The CWAM total incentive compensation pool, including cash and the two incentive plans, is based on formulas, with investment performance of individual portfolio managers and certain analysts, plus firm-wide investment performance, as primary drivers. |
136
| | Analysts and portfolio managers are positioned in a number of compensation tiers based on cumulative performance of the portfolios they manage. Performance of each Fund for purposes of portfolio manager compensation is measured relative to its primary benchmark. One and three year performance periods primarily drive incentive levels. Excellent performance results in advancement to a higher tier until the highest tier is reached. Higher tiers have higher base compensation levels and wider incentive compensation ranges. While cumulative performance places analysts and managers in tiers, current year performance drives changes in incentive compensation levels. Incentive compensation varies by tier, and can range between a fraction of base pay to several times base pay; the objective being to provide very competitive total compensation for high performing analysts and portfolio managers. If a fund’s performance declines, the compensation incentives available to its analysts and portfolio manager(s) also declines. |
| (32) | Columbia Management: As of the funds’ most recent fiscal year end, the portfolio managers received all of their compensation in the form of salary, bonus, stock options, restricted stock, and notional investments through an incentive plan, the value of which is measured by reference to the performance of the funds in which the account is invested. A portfolio manager’s bonus is variable and generally is based on (1) an evaluation of the portfolio manager’s investment performance and (2) the results of a peer and/or management review of the portfolio manager, which takes into account skills and attributes such as team participation, investment process, communication and professionalism. In evaluating investment performance, the investment manager generally considers the one, three and five year performance of mutual funds and other accounts managed by the portfolio manager relative to the benchmarks and peer groups noted below, emphasizing the portfolio manager’s three and five year performance. The investment manager also may consider a portfolio manager’s performance in managing client assets in sectors and industries assigned to the portfolio manager as part of his/her investment team responsibilities, where applicable. For portfolio managers who also have group management responsibilities, another factor in their evaluation is an assessment of the group’s overall investment performance. |
Performance Benchmarks:
| | | | | | |
Portfolio Manager | | Fund(s) | | Benchmark(s) | | Peer Group |
| Alfred F. Alley III | | RiverSource Disciplined Small and Mid Cap Equity | | Russell 2500 Index | | Lipper Mid-Cap Core Funds Classification |
| | RiverSource Disciplined Small Cap Value | | Russell 200 Value Index | | Lipper Small Cap Value Funds Classification |
| | RiverSource S&P 500 Index | | S&P 500 Index | | Lipper S&P 500 Index Objective Funds Classification |
| | RiverSource Small Company Index | | S&P Small Cap 600 Index | | Lipper Small-Cap Core Funds Classification |
Anwiti Bahuguna, Colin Moore, Kent Peterson and Marie M. Schofield | | Columbia Portfolio Builder Aggressive, Columbia Portfolio Builder Moderate Aggressive and Columbia Portfolio Builder Total Equity | | S&P 500 Index | | Lipper Large Cap Core Funds Classification |
| | Columbia Portfolio Builder Conservative | | Barclays Capital U.S. Aggregate 1-3 Years Index and Blended: 80% Barclays Capital U.S. Aggregate 1-3 Years Index, 20% Barclays Capital U.S. Corporate High-Yield Bond Index | | Lipper Mixed-Asset Target Allocation Conservative Funds Classification |
| | Columbia Portfolio Builder Moderate Conservative | | S&P 500 Index and Barclays Capital U.S. Aggregate Bond Index | | Lipper Mixed-Asset Target Allocation Conservative Funds Classification |
| | Columbia Portfolio Builder Moderate | | S&P 500 Index and Barclays Capital U.S. Aggregate Bond Index | | Lipper Mixed-Asset Target Allocation Growth Funds Classification |
137
| | | | | | |
| | Columbia Retirement Plus Funds | | S&P 500 Index, Russell 1000 Index, Russell 1000 Value Index, Barclays Capital U.S. Aggregate Bond Index, MSCI The World Index Net, and MSCI EAFE Index Net | | N/A |
| | Columbia Strategic Allocation | | S&P 500 Index and Barclays Capital Aggregate Bond Index | | Lipper Mixed Asset Target Allocation Moderate Funds Classification |
| Brian M. Condon | | Columbia Large Core Quantitative | | S&P 500 Index | | Lipper S&P 500 Index Objective Funds Classification |
| | Columbia Large Growth Quantitative | | Russell 1000 Growth Index | | Lipper Large Cap Growth Funds Classification |
| | Columbia Disciplined Large Value Quantitative | | Russell 1000 Value Index | | Lipper Large Cap Value Funds Classification |
| | RiverSource Disciplined Small and Mid Cap Equity | | Russell 2500 Index | | Lipper Mid Cap Core Funds Classification |
| | RiverSource Disciplined Small Cap Value | | Russell 2000 Value Index | | Lipper Small Cap Value Funds Classification |
| Fred Copper | | RiverSource Disciplined International Equity | | MSCI EAFE Value Index | | Lipper International Multi-Cap Value Funds Classification |
Wayne M. Collette, Lawrence W. Lin, George Myers and Brian D. Neigut | | Seligman Capital | | Russell MidCap TR and Russell MidCap Growth TR | | Lipper Mid-Cap Growth Funds Classification |
| | Columbia Frontier | | Russell 2000 TR and Russell 2000 Growth TR | | Lipper Small Cap Growth Funds Classification |
Peter Deininger and John Wilson | | Seligman Growth | | Russell 1000 Growth Index | | Lipper Large-Cap Growth Funds Classification |
| Cheryl D’Hollander | | RiverSource S&P 500 Index | | S&P 500 Index | | Lipper S&P 500 Index Objective Funds Classification |
| | RiverSource Small Company Index | | S&P Small Cap 600 Index | | Lipper Small-Cap Core Funds Classification |
| Michael E. Hoover | | RiverSource Precious Metals and Mining | | S&P North American Natural Resources Sector Index | | Lipper Natural Resources Funds Classification |
Arthur J. Hurley | | RiverSource Real Estate | | FTSE NAREIT Equity REITs Index | | Lipper Real Estate Funds Classification |
| Laura A. Ostrander | | RiverSource Strategic Income Allocation | | Barclays Capital Government/Credit Bond Index and Blended Benchmark | | Lipper Multi-Sector Income Funds Classification |
| (1) | A custom composite, established by the Advisor, consisting of a 35% weighting of the Barclays Capital U.S. Aggregate Bond Index, a 35% weighting of the JPMorgan Global High Yield Index, a 15% weighting of the Citigroup Non-U.S. World Government Bond Index — Unhedged and a 15% weighting of the JPMorgan EMBI Global Diversified Index. |
The size of the overall bonus pool each year depends on, among other factors, the levels of compensation generally in the investment management industry (based on market compensation data) and the investment manager’s profitability for the year, which is largely determined by assets under management.
| (33) | AllianceBernstein: AllianceBernstein’s compensation program for investment professionals is designed to be competitive and effective in order to attract and retain the highest caliber employees. The compensation program for investment professionals is designed to reflect their ability to generate long-term investment success for our clients. Investment professionals do not receive any direct compensation based upon the investment returns of any individual client account, nor is compensation tied directly to the level or change in the level of assets under management. Investment professionals’ annual compensation is comprised of the following: |
138
| | (i) | Fixed base salary: This is generally the smallest portion of compensation. The base salary is a relatively low, fixed salary within a similar range for all investment professionals. The base salary does not change significantly from year-to-year, and hence, is not particularly sensitive to performance. |
| | (ii) | Discretionary incentive compensation in the form of an annual cash bonus: AllianceBernstein’s overall profitability determines the total amount of incentive compensation available to investment professionals. This portion of compensation is determined subjectively based on qualitative and quantitative factors. In evaluating this component of an investment professional’s compensation, AllianceBernstein considers the contribution to his/her team or discipline as it relates to that team’s overall contribution to the long-term investment success, business results and strategy of AllianceBernstein. Quantitative factors considered include, among other things, relative investment performance (e.g., by comparison to competitor or peer group funds or similar styles of investments, and appropriate, broad-based or specific market indices), and consistency of performance. There are no specific formulas used to determine this part of an investment professional’s compensation and the compensation is not tied to any pre-determined or specified level of performance. AllianceBernstein also considers qualitative factors such as the complexity and risk of investment strategies involved in the style or type of assets managed by the investment professional; success of marketing/business development efforts and client servicing; seniority/length of service with the firm; management and supervisory responsibilities; and fulfillment of AllianceBernstein’s leadership criteria. |
| | (iii) | Discretionary incentive compensation in the form of awards under AllianceBernstein’s Partners Compensation Plan (“deferred awards”): AllianceBernstein’s overall profitability determines the total amount of deferred awards available to investment professionals. The deferred awards are allocated among investment professionals based on criteria similar to those used to determine the annual cash bonus. Deferred awards, which are in the form of AllianceBernstein’s publicly traded securities, vest over a four-year period and are generally forfeited if the employee resigns or AllianceBernstein terminates his/her employment. |
| | (iv) | Contributions under AllianceBernstein’s Profit Sharing/401(k) Plan: The contributions are based on AllianceBernstein’s overall profitability. The amount and allocation of the contributions are determined at the sole discretion of AllianceBernstein. |
| (34) | Mondrian: Mondrian has the following programs in place to retain key investment staff: |
| | 1. | Competitive Salary — All investment professionals are remunerated with a competitive base salary. |
| | 2. | Profit Sharing Bonus Pool — All Mondrian staff, including portfolio managers and senior officers, qualify for participation in an annual profit sharing pool determined by the company’s profitability (approximately 30% of profits). |
| | 3. | Equity Ownership — Mondrian is ultimately controlled by a partnership of senior management and Hellman & Friedman LLC, an independent private equity firm. Mondrian is currently 67% owned by its senior employees, including the majority of investment professionals, senior client service officers, and senior operations personnel. |
The private equity funds sponsored by Hellman & Friedman LLC are passive, non-controlling minority investors in Mondrian and do not have day-to-day involvement in the management of Mondrian.
Incentives (Bonus and Equity Programs) focus on the key areas of research quality, long-term and short-term stock performance, teamwork, client service and marketing. As an individual’s ability to influence these factors depends on that individual’s position and seniority within the firm, so the allocation of participation in these programs will reflect this.
At Mondrian, the investment management of particular portfolios is not “star manager” based but uses a team system. This means that Mondrian’s investment professionals are primarily assessed on their contribution to the team’s effort and results, though with an important element of their assessment being focused on the quality of their individual research contribution.
139
Compensation Committee
In determining the amount of bonuses and equity awarded, Mondrian’s Board of Directors consults with the company’s Compensation Committee, who will make recommendations based on a number of factors including investment research, organization management, team work, client servicing and marketing.
Defined Contribution Pension Plan
All portfolio managers are members of the Mondrian defined contribution pension plan where Mondrian pays a regular monthly contribution and the member may pay additional voluntary contributions if they wish. The Plan is governed by Trustees who have responsibility for the trust fund and payments of benefits to members. In addition, the Plan provides death benefits for death in service and a spouse’s or dependant’s pension may also be payable.
Mondrian believes that this compensation structure, coupled with the opportunities that exist within a successful and growing business, are adequate to attract and retain high caliber employees.
| (35) | Tradewinds: Tradewinds offers a highly competitive compensation structure with the purpose of attracting and retaining the most talented investment professionals. These professionals are rewarded through a combination of cash and long-term incentive compensation as determined by the firm’s executive committee. Total cash compensation (TCC) consists of both a base salary and an annual bonus that can be a multiple of the base salary. The firm annually benchmarks TCC to prevailing industry norms with the objective of achieving competitive levels for all contributing professionals. |
Available bonus pool compensation is primarily a function of the firm’s overall annual profitability. Individual bonuses are based primarily on the following:
| | • | | Overall performance of client portfolios; |
| | • | | Objective review of stock recommendations and the quality of primary research; |
| | • | | Subjective review of the professional’s contributions to portfolio strategy, teamwork, collaboration and work ethic. |
To further strengthen our incentive compensation package and to create an even stronger alignment to the long-term success of the firm, Tradewinds has made available to most investment professionals equity participation opportunities, the values of which are determined by the increase in profitability of Tradewinds over time.
Finally, some of our investment professionals have received additional remuneration as consideration for signing employment agreements. These agreements range from retention agreements to long-term employment contracts with significant non-solicitation and, in some cases, non-compete clauses.
| (36) | Threadneedle: To align the interests of our investment staff with those of our clients the remuneration plan for senior individuals comprises basic salary, an annual profit share (linked to individual performance and the profitability of the company) and a Long Term Incentive Plan known as the Equity Incentive Plan (“EIP”) linked to measures of Threadneedle’s corporate success. Threadneedle believes this encourages longevity of service. |
The split between each component varies between investment professionals and will be dependent on performance and the type of funds they manage.
The split of the profit share focuses on three key areas of success:
| | • | | Performance of own funds and research recommendations, |
| | • | | Performance of all portfolios in the individual’s team, |
| | • | | Broader contribution to the wider thinking of the investment team, e.g. idea generation, interaction with colleagues and commitment for example to assisting the sales effort. |
Consideration of the individual’s general contribution is designed to encourage fund managers to think beyond personal portfolio performance and considers contributions made in:
| | • | | Inter-team discussions, including asset allocation, global sector themes and weekly investment meetings, |
140
| | • | | Intra-team discussion, stock research and investment insights, |
| | • | | Marketing support, including written material and presentations. |
It is important to appreciate that in order to maximize an individual’s rating and hence their profit share, they need to score well in all areas. It is not sufficient to produce good personal fund performance without contributing effectively to the team and wider investment department. This structure is closely aligned with the Threadneedle’s investment principles of sharing ideas and effective communication.
| (37) | Columbia Management: Portfolio manager compensation is typically comprised of (i) a base salary, (ii) an annual cash bonus, and (iii) an equity incentive award in the form of stock options and/or restricted stock. The annual cash bonus and equity incentive awards are paid from a team bonus pool that is based on the performance of the accounts managed by the portfolio management team, which might include mutual funds, wrap accounts, institutional portfolios and hedge funds. The bonus pool is determined by a percentage of the aggregate assets under management in the accounts managed by the portfolio managers, including the fund, plus, where applicable, a percentage of the assets of the funds they support as research analysts, and by the short term (typically one-year) and long-term (typically three-year) performance of those accounts in relation to the relevant peer group universe. Funding for the bonus pool may also include a percentage of any performance fees earned on long/short mutual funds managed by the Team. Senior management of Columbia Management has the discretion to increase or decrease the size of the part of the bonus pool and to determine the exact amount of each portfolio manager’s bonus paid from this portion of the bonus pool based on his/her performance as an employee. Portfolio managers are provided with a benefits package, including life insurance, health insurance, and participation in a company 401(k) plan, comparable to that received by other Columbia Management employees. Certain investment personnel are also eligible to defer a portion of their compensation. An individual making this type of election can allocate the deferral to the returns associated with one or more products they manage or support or to certain other products managed by their investment team. Depending upon their job level, portfolio managers may also be eligible for other benefits or perquisites that are available to all Columbia Management employees at the same job level. |
| (38) | Columbia Management: Portfolio manager compensation is typically comprised of (i) a base salary, (ii) an annual cash bonus and (iii) an equity incentive award in the form of stock options and/or restricted stock. The annual cash bonus and equity incentive awards are paid from a team bonus pool that is based on the performance of the accounts managed by the portfolio management team, which might include mutual funds, wrap accounts, institutional portfolios and hedge funds. Funding for the bonus pool is determined by the short term (typically one-year) and long-term (typically three-year and five-year) performance of the accounts managed by the portfolio managers, including the fund, in relation to the relevant peer group universe. Senior management of Columbia Management has the discretion to increase or decrease the size of the part of the bonus pool and to determine the exact amount of each portfolio manager’s bonus paid from this portion of the bonus pool based on his/her performance as an employee. Portfolio managers are provided with a benefits package, including life insurance, health insurance, and participation in a company 401(k) plan, comparable to that received by other Columbia Management employees. Certain investment personnel are also eligible to defer a portion of their compensation. An individual making this type of election can allocate the deferral to the returns associated with one or more products they manage or support or to certain other products managed by their investment team. Depending upon their job level, portfolio managers may also be eligible for other benefits or perquisites that are available to all Columbia Management employees at the same job level. |
| (39) | LaSalle: Compensation for Investment Team Members consists of a base salary and incentive compensation that is based primarily upon performance of the particular Investment Team and that of the subadviser with which an Investment Team Member is employed, and meeting financial objectives for the Investment Team. The annual performance of clients’ portfolios and/or the performance of stock recommendations against a sector index (generally the NAREIT-Equity REITs Index or the Wilshire REIT Index in respect of the Investment Team Members of LaSalle Securities US, or the EPRA Euro Zone Index and EPRA Europe Index in respect of the Investment Team Member of LaSalle Securities B.V.) is one factor included in professional employee evaluations, but compensation is not directly linked to these performance criteria. |
In addition, equity ownership in Jones Lang LaSalle, the subadvisers’ publicly-traded parent, is available to and expected of senior professionals. The major components of Jones Lang LaSalle’s comprehensive equity ownership program are: (1) Stock Ownership Program — credits employees with a portion of their incentive compensation in the form of restricted stock; (2) Employee Stock Purchase Plan — program through which employees may elect to purchase shares of Jones Land LaSalle through a payroll deduction plan (available to employees of LaSalle Securities US) and; (3) Stock Award Incentive Plan rewards key employees of the firm with stock awards, in the form of restricted stock units, based on the strength of their individual contributions.
141
ADMINISTRATIVE SERVICES
Each fund listed in the table below has an Administrative Services Agreement with Ameriprise Financial. Under this agreement, the fund pays Ameriprise Financial for providing administration and accounting services. The fee is calculated as follows:
Table 20. Administrative Services Agreement Fee Schedule
| | | | | | | | | | | | | | | |
| | | Asset Levels and Breakpoints in Applicable Fees | |
Fund | | $0 – 500,000,000 | | | $500,000,001 –
1,000,000,000 | | | $1,000,000,001 –
3,000,000,000 | | | $3,000,000,001 –
$12,000,000,000 | | | 12,000,000,001 + | |
Columbia 120/20 Contrarian Equity | | 0.080 | % | | 0.075 | % | | 0.070 | % | | 0.060 | % | | 0.050 | % |
Columbia Absolute Return Currency and Income | | | | | | | | | | | | | | | |
Columbia Asia Pacific ex-Japan | | | | | | | | | | | | | | | |
Columbia Emerging Markets Bond | | | | | | | | | | | | | | | |
Columbia Emerging Markets Opportunity | | | | | | | | | | | | | | | |
Columbia European Equity | | | | | | | | | | | | | | | |
Columbia Frontier | | | | | | | | | | | | | | | |
Columbia Global Bond | | | | | | | | | | | | | | | |
Columbia Global Equity | | | | | | | | | | | | | | | |
Columbia Global Extended Alpha | | | | | | | | | | | | | | | |
Columbia Multi-Advisor International Value | | | | | | | | | | | | | | | |
Columbia Multi-Advisor Small Cap Value | | | | | | | | | | | | | | | |
Columbia Select Smaller-Cap Value | | | | | | | | | | | | | | | |
Columbia Seligman Global Technology | | | | | | | | | | | | | | | |
Columbia Strategic Allocation | | | | | | | | | | | | | | | |
RiverSource Disciplined International Equity | | | | | | | | | | | | | | | |
RiverSource Disciplined Small Cap Value | | | | | | | | | | | | | | | |
RiverSource LaSalle Global Real Estate | | | | | | | | | | | | | | | |
RiverSource Partners International Select Growth | | | | | | | | | | | | | | | |
RiverSource Partners International Small Cap | | | | | | | | | | | | | | | |
RiverSource Small Company Index | | | | | | | | | | | | | | | |
Threadneedle Global Equity Income | | | | | | | | | | | | | | | |
Threadneedle International Opportunity | | | | | | | | | | | | | | | |
Columbia AMT-Free Tax-Exempt Bond | | 0.070 | % | | 0.065 | % | | 0.060 | % | | 0.050 | % | | 0.040 | % |
Columbia Diversified Bond | | | | | | | | | | | | | | | |
Columbia Floating Rate | | | | | | | | | | | | | | | |
Columbia High Yield Bond | | | | | | | | | | | | | | | |
Columbia Income Opportunities | | | | | | | | | | | | | | | |
Columbia Inflation Protected Securities | | | | | | | | | | | | | | | |
Columbia Limited Duration Credit | | | | | | | | | | | | | | | |
Columbia Minnesota Tax-Exempt | | | | | | | | | | | | | | | |
Columbia U.S. Government Mortgage | | | | | | | | | | | | | | | |
RiverSource California Tax-Exempt | | | | | | | | | | | | | | | |
RiverSource Intermediate Tax-Exempt | | | | | | | | | | | | | | | |
RiverSource New York Tax-Exempt | | | | | | | | | | | | | | | |
RiverSource Short Duration U.S. Government | | | | | | | | | | | | | | | |
RiverSource Strategic Income Allocation | | | | | | | | | | | | | | | |
RiverSource Tax-Exempt High Income | | | | | | | | | | | | | | | |
Seligman California Municipal High-Yield | | | | | | | | | | | | | | | |
142
| | | | | | | | | | | | | | | |
Seligman California Municipal Quality | | | | | | | | | | | | | | | |
Seligman Minnesota Municipal | | | | | | | | | | | | | | | |
Seligman National Municipal | | | | | | | | | | | | | | | |
Seligman New York Municipal | | | | | | | | | | | | | | | |
Columbia Diversified Equity Income | | 0.060 | % | | 0.055 | % | | 0.050 | % | | 0.040 | % | | 0.030 | % |
Columbia Dividend Opportunity | | | | | | | | | | | | | | | |
Columbia Equity Value | | | | | | | | | | | | | | | |
Columbia Government Money Market | | | | | | | | | | | | | | | |
Columbia Large Core Quantitative | | | | | | | | | | | | | | | |
Columbia Large Growth Quantitative | | | | | | | | | | | | | | | |
Columbia Large Value Quantitative | | | | | | | | | | | | | | | |
Columbia Mid Cap Growth Opportunity | | | | | | | | | | | | | | | |
Columbia Mid Cap Value Opportunity | | | | | | | | | | | | | | | |
Columbia Money Market | | | | | | | | | | | | | | | |
Columbia Recovery and Infrastructure | | | | | | | | | | | | | | | |
Columbia Select Large-Cap Value | | | | | | | | | | | | | | | |
Columbia Seligman Communications and Information | | | | | | | | | | | | | | | |
RiverSource Balanced | | | | | | | | | | | | | | | |
RiverSource Disciplined Small and Mid Cap Equity | | | | | | | | | | | | | | | |
RiverSource LaSalle Monthly Dividend Real Estate | | | | | | | | | | | | | | | |
RiverSource Partners Fundamental Value | | | | | | | | | | | | | | | |
RiverSource Precious Metals and Mining | | | | | | | | | | | | | | | |
RiverSource Real Estate | | | | | | | | | | | | | | | |
RiverSource S&P 500 Index | | | | | | | | | | | | | | | |
Seligman Capital | | | | | | | | | | | | | | | |
Seligman Growth | | | | | | | | | | | | | | | |
Seligman TargETFund 2015 | | | | | | | | | | | | | | | |
Seligman TargETFund 2025 | | | | | | | | | | | | | | | |
Seligman TargETFund 2035 | | | | | | | | | | | | | | | |
Seligman TargETFund 2045 | | | | | | | | | | | | | | | |
Seligman TargETFund Core | | | | | | | | | | | | | | | |
Columbia Income Builder Fund | | 0.020 | % | | 0.020 | % | | 0.020 | % | | 0.020 | % | | 0.020 | % |
Columbia Income Builder Fund II | | | | | | | | | | | | | | | |
Columbia Income Builder Fund III | | | | | | | | | | | | | | | |
Columbia Portfolio Builder Aggressive | | | | | | | | | | | | | | | |
Columbia Portfolio Builder Conservative | | | | | | | | | | | | | | | |
Columbia Portfolio Builder Moderate | | | | | | | | | | | | | | | |
Columbia Portfolio Builder Moderate Aggressive | | | | | | | | | | | | | | | |
Columbia Portfolio Builder Moderate Conservative | | | | | | | | | | | | | | | |
Columbia Portfolio Builder Total Equity | | | | | | | | | | | | | | | |
Columbia Retirement Plus 2010 | | | | | | | | | | | | | | | |
Columbia Retirement Plus 2015 | | | | | | | | | | | | | | | |
Columbia Retirement Plus 2020 | | | | | | | | | | | | | | | |
Columbia Retirement Plus 2025 | | | | | | | | | | | | | | | |
Columbia Retirement Plus 2030 | | | | | | | | | | | | | | | |
Columbia Retirement Plus 2035 | | | | | | | | | | | | | | | |
Columbia Retirement Plus 2040 | | | | | | | | | | | | | | | |
Columbia Retirement Plus 2045 | | | | | | | | | | | | | | | |
143
The fee is calculated for each calendar day on the basis of net assets as of the close of the preceding day. Fees paid in each of the last three fiscal periods are shown in the table below. The table also shows the daily rate applied to each fund’s net assets as of the last day of the most recent fiscal period. The table is organized by fiscal year end. You can find your fund’s fiscal year end in Table 1.
Table 21. Administrative Fees
| | | | | | | | | | | | | | |
| | | Administrative services fees paid in: | | | Daily rate
applied to
fund assets | |
Fund | | 2010 | | 2009 | | | 2008 | | |
For funds with fiscal period ending January 31 | | | | | | | | | | | | | | |
Columbia Income Builder Fund | | $ | 45,313 | | $ | 56,956 | | | $ | 38,041 | (a) | | 0.020 | % |
Columbia Income Builder Fund II | | | 78,128 | | | 108,149 | | | | 82,229 | (a) | | 0.020 | |
Columbia Income Builder Fund III | | | 38,950 | | | 54,275 | | | | 45,848 | (a) | | 0.020 | |
Columbia Portfolio Builder Aggressive | | | 89,504 | | | 96,644 | | | | 110,897 | | | 0.020 | |
Columbia Portfolio Builder Conservative | | | 45,451 | | | 36,929 | | | | 26,665 | | | 0.020 | |
Columbia Portfolio Builder Moderate | | | 201,685 | | | 193,553 | | | | 183,783 | | | 0.020 | |
Columbia Portfolio Builder Moderate Aggressive | | | 186,977 | | | 205,250 | | | | 223,400 | | | 0.020 | |
Columbia Portfolio Builder Moderate Conservative | | | 75,988 | | | 72,830 | | | | 62,617 | | | 0.020 | |
Columbia Portfolio Builder Total Equity | | | 75,724 | | | 84,413 | | | | 101,924 | | | 0.020 | |
RiverSource S&P 500 Index | | | 69,721 | | | 101,230 | | | | 158,059 | | | 0.060 | |
RiverSource Small Company Index | | | 293,026 | | | 446,427 | | | | 738,676 | | | 0.080 | |
For funds with fiscal period ending March 31 | | | | | | | | | | | | | | |
Columbia Equity Value | | | 391,620 | | | 448,794 | | | | 680,124 | | | 0.058 | |
RiverSource Precious Metals and Mining | | | 83,021 | | | 64,531 | | | | 77,686 | | | 0.060 | |
For funds with fiscal period ending April 30 | | | | | | | | | | | | | | |
Columbia 120/20 Contrarian Equity | | | 31,739 | | | 31,071 | | | | 13,416 | (b) | | 0.080 | |
Columbia Recovery and Infrastructure | | | 199,325 | | | 4,214 | (c) | | | N/A | | | 0.059 | |
Columbia Retirement Plus 2010 | | | 1,647 | | | 2,441 | | | | 3,623 | | | 0.020 | |
Columbia Retirement Plus 2015 | | | 4,050 | | | 4,449 | | | | 5,483 | | | 0.020 | |
Columbia Retirement Plus 2020 | | | 4,355 | | | 4,871 | | | | 7,572 | | | 0.020 | |
Columbia Retirement Plus 2025 | | | 4,903 | | | 5,145 | | | | 7,280 | | | 0.020 | |
Columbia Retirement Plus 2030 | | | 4,981 | | | 5,001 | | | | 7,160 | | | 0.020 | |
Columbia Retirement Plus 2035 | | | 3,476 | | | 3,258 | | | | 4,249 | | | 0.020 | |
Columbia Retirement Plus 2040 | | | 2,435 | | | 2,051 | | | | 4,915 | | | 0.020 | |
Columbia Retirement Plus 2045 | | | 2,262 | | | 1,726 | | | | 1,670 | | | 0.020 | |
For funds with fiscal period ending May 31 | | | | | | | | | | | | | | |
Columbia High Yield Bond | | | 1,077,547 | | | 722,190 | | | | 1,069,014 | | | 0.065 | |
Columbia Multi-Advisor Small Cap Value | | | 300,718 | | | 277,260 | | | | 565,329 | | | 0.080 | |
Columbia U.S. Government Mortgage | | | 181,856 | | | 252,478 | | | | 285,601 | | | 0.070 | |
RiverSource Partners Fundamental Value | | | 340,508 | | | 374,303 | | | | 594,407 | | | 0.060 | |
RiverSource Short Duration U.S. Government | | | 470,119 | | | 521,265 | | | | 541,748 | | | 0.069 | |
For funds with fiscal period ending June 30 | | | | | | | | | | | | | | |
Columbia Dividend Opportunity | | | 681,093 | | | 642,082 | | | | 1,033,158 | | | 0.057 | |
RiverSource Real Estate | | | 103,295 | | | 91,566 | | | | 132,646 | | | 0.060 | |
For funds with fiscal period ending July 31 | | | | | | | | | | | | | | |
Columbia Floating Rate | | | 282,996 | | | 253,669 | | | | 398,924 | | | 0.070 | % |
Columbia Income Opportunities | | | 499,304 | | | 219,083 | | | | 202,872 | | | 0.068 | |
Columbia Inflation Protected Securities | | | 451,332 | | | 515,776 | | | | 399,972 | | | 0.069 | |
Columbia Large Core Quantitative | | | 1,911,088 | | | 1,094,618 | | | | 1,701,542 | | | 0.050 | |
Columbia Limited Duration Credit | | | 317,896 | | | 123,147 | | | | 115,529 | | | 0.069 | |
Columbia Money Market | | | 1,551,462 | | | 2,132,989 | | | | 2,507,729 | | | 0.053 | |
RiverSource Disciplined Small and Mid Cap Equity | | | 83,767 | | | 77,180 | | | | 38,114 | | | 0.060 | |
RiverSource Disciplined Small Cap Value | | | 40,614 | | | 34,017 | | | | 30,592 | | | 0.080 | |
| | | | |
| | | 2009 | | 2008 | | | 2007 | | | | |
For funds with fiscal period ending August 31 | | | | | | | | | | | | | | |
Columbia Diversified Bond | | | 2,122,615 | | | 2,012,548 | | | | 1,752,212 | | | 0.059 | |
Columbia Minnesota Tax-Exempt | | | 212,293 | | | 215,249 | | | | 234,353 | | | 0.070 | |
RiverSource California Tax-Exempt | | | 113,317 | | | 122,235 | | | | 122,586 | | | 0.070 | |
RiverSource New York Tax-Exempt | | | 37,590 | | | 41,455 | | | | 47,710 | | | 0.070 | |
144
| | | | | | | | | | | | |
For funds with fiscal period ending September 30 | | | | | | | | | | | | |
Columbia Large Growth Quantitative | | 203,583 | | | 101,276 | | | 11,405 | (d) | | 0.059 | |
Columbia Large Value Quantitative | | 69,490 | | | 662 | (e) | | N/A | | | 0.060 | |
Columbia Diversified Equity Income | | 1,985,768 | | | 3,272,256 | | | 3,449,519 | | | 0.048 | |
Columbia Mid Cap Value Opportunity | | 946,227 | | | 1,335,281 | | | 1,196,773 | | | 0.054 | |
Columbia Strategic Allocation | | 962,590 | | | 1,505,894 | | | 1,340,234 | | | 0.076 | |
RiverSource Balanced | | 331,811 | | | 519,542 | | | 623,784 | | | 0.059 | |
RiverSource Strategic Income Allocation | | 137,849 | | | 115,139 | | | 21,493 | (d) | | 0.070 | |
Seligman California Municipal High-Yield* | | 7,436 | | | N/A | | | N/A | | | 0.070 | |
Seligman California Municipal Quality* | | 8,837 | | | N/A | | | N/A | | | 0.070 | |
Seligman Minnesota Municipal* | | 14,896 | | | N/A | | | N/A | | | 0.070 | |
Seligman National Municipal* | | 42,999 | | | N/A | | | N/A | | | 0.069 | |
Seligman New York Municipal* | | 17,197 | | | N/A | | | N/A | | | 0.070 | |
Seligman TargETFund 2015* | | 4,585 | | | N/A | | | N/A | | | 0.060 | |
Seligman TargETFund 2025* | | 5,686 | | | N/A | | | N/A | | | 0.060 | |
Seligman TargETFund 2035* | | 1,661 | | | N/A | | | N/A | | | 0.060 | |
Seligman TargETFund 2045* | | 835 | | | N/A | | | N/A | | | 0.060 | |
Seligman TargETFund Core* | | 10,074 | | | N/A | | | N/A | | | 0.060 | |
For funds with fiscal period ending October 31 | | | | | | | | | | | | |
Columbia Absolute Return Currency and Income | | 417,444 | | | 373,454 | | | 79,761 | | | 0.080 | % |
Columbia Asia Pacific ex-Japan | | 7,807 | (f) | | N/A | | | N/A | | | 0.080 | |
Columbia Emerging Markets Bond | | 146,703 | | | 131,334 | | | 78,549 | | | 0.080 | |
Columbia Emerging Markets Opportunity | | 280,656 | | | 498,019 | | | 503,279 | | | 0.079 | |
Columbia European Equity | | 50,304 | | | 96,107 | | | 105,886 | | | 0.080 | |
Columbia Frontier* | | 10,073 | | | N/A | | | N/A | | | 0.030 | |
Columbia Global Bond | | 401,109 | | | 572,976 | | | 388,646 | | | 0.080 | |
Columbia Global Equity | | 340,869 | | | 549,601 | | | 611,621 | | | 0.080 | |
Columbia Global Extended Alpha | | 4,908 | | | 1,256 | (g) | | N/A | | | 0.080 | |
Columbia International Multi-Advisor Value | | 651,133 | | | 1,395,090 | | | 1,759,221 | | | 0.078 | |
Columbia Seligman Global Technology* | | 102,757 | | | N/A | | | N/A | | | 0.040 | |
RiverSource Disciplined International Equity | | 282,974 | | | 549,173 | | | 209,295 | | | 0.080 | |
RiverSource Partners International Select Growth | | 282,773 | | | 511,522 | | | 490,174 | | | 0.080 | |
RiverSource Partners International Small Cap | | 38,884 | | | 79,183 | | | 92,062 | | | 0.080 | |
Threadneedle Global Equity Income | | 16,780 | | | 1,528 | (g) | | N/A | | | 0.080 | |
Threadneedle International Opportunity | | 281,413 | | | 460,205 | | | 540,718 | | | 0.080 | |
For funds with fiscal period ending November 30 | | | | | | | | | | | | |
Columbia Mid Cap Growth Opportunity | | 339,961 | | | 471,791 | | | 652,889 | | | 0.059 | |
Columbia AMT-Free Tax-Exempt Bond | | 453,062 | | | 463,150 | | | 525,515 | | | 0.069 | |
RiverSource Intermediate Tax-Exempt | | 61,016 | | | 52,367 | | | 57,618 | | | 0.070 | |
RiverSource Tax-Exempt High Income | | 1,428,680 | | | 1,603,416 | | | 1,823,812 | | | 0.063 | |
For funds with fiscal period ending December 31 | | | | | | | | | | | | |
Columbia Government Money Market* | | 41,094 | | | N/A | | | N/A | | | 0.060 | |
Columbia Select Large-Cap Value* | | 76,758 | | | N/A | | | N/A | | | 0.060 | |
Columbia Select Smaller-Cap Value* | | 96,841 | | | N/A | | | N/A | | | 0.080 | |
Columbia Seligman Communications and Information* | | 868,517 | | | N/A | | | N/A | | | 0.050 | |
RiverSource LaSalle Global Real Estate* | | 5,942 | | | N/A | | | N/A | | | 0.080 | |
RiverSource LaSalle Monthly Dividend Real Estate* | | 7,968 | | | N/A | | | N/A | | | 0.060 | |
Seligman Capital* | | 68,772 | | | N/A | | | N/A | | | 0.060 | |
Seligman Growth* | | 299,785 | | | N/A | | | N/A | | | 0.055 | |
| * | Prior to June 15, 2009 for Seligman California Municipal High-Yield, Seligman California Municipal Quality, Seligman Minnesota Municipal, Seligman New York Municipal, Seligman TargETFund 2015, Seligman TargETFund 2025, Seligman TargETFund 2035, Seligman TargETFund 2045, Seligman TargETFund Core, Columbia Seligman Global Technology, Columbia Government Money Market, RiverSource LaSalle Global Real Estate and RiverSource LaSalle Monthly Dividend Real Estate and prior to June 29, 2009 for Seligman Capital, Columbia Frontier, Columbia Seligman Communications and Information, Seligman Growth, Columbia Select Large-Cap Value and Columbia Select Smaller-Cap Value, and for Seligman National, prior to Aug. 31, 2009, the fund did not pay a separate administrative services fee. Fees for administration services were included in the fund’s management fees as charged by the fund’s pervious investment manager. |
145
| (a) | The fund changed its fiscal year end effective Jan. 31, 2008 from May 31 to Jan. 31. For 2008, the information shown is for the period from June 1, 2007 through Jan. 31, 2008. For years prior to 2008, the fiscal period ended on May 31. |
| (b) | For the period from Oct. 18, 2007 (when shares became publicly available) to April 30, 2008. |
| (c) | For the period from Feb. 19, 2009 (when shares became publicly available) to April 30, 2009. |
| (d) | For the period from May 17, 2007 (when shares became publicly available) to Sept. 30, 2007. |
| (e) | For the period from Aug. 1, 2008 (when shares became publicly available) to Sept. 30, 2008. |
| (f) | For the period from July 15, 2009 (when the Fund became available) to Oct. 31, 2009. |
| (g) | For the period from Aug. 1, 2008 (when shares became publicly available) to Oct. 31, 2008. |
146
TRANSFER AGENCY SERVICES
The funds have a Transfer Agency Agreement with Columbia Management Investment Services Corp. (the “transfer agent”) (formerly RiverSource Service Corporation) located at One Financial Center, Boston, MA 02111. This agreement governs the transfer agent’s responsibility for administering and/or performing transfer agent functions, for acting as service agent in connection with dividend and distribution functions and for performing shareholder account administration agent functions in connection with the issuance, exchange and redemption or repurchase of the fund’s shares.
For Class A, Class B, Class C, Class R, Class R3, Class R4, Class R5, Class W, Class Y and Class Z, the transfer agent will earn an open account fee determined by multiplying the number of open accounts by the annual rate of $12.08. The annual per account fee is accrued daily and payable monthly. The fund will allocate the fee daily across their share classes based on the relative percentage of net assets of each class of shares.
In addition, for Class A, Class B, Class C, Class R, Class W and Class Z, the fund reimburses the transfer agent for the fees and expenses the transfer agent pays to financial intermediaries that maintain omnibus accounts with the fund subject to an annual limitation of 0.20% of the average aggregate value of the fund’s shares maintained in each such omnibus account (other than omnibus accounts for which American Enterprise Investment Services, Inc. is the broker of record or accounts where the beneficial shareholder is a customer of Ameriprise Financial Services, Inc., which are reimbursed in an amount equal to $16.00 annually, calculated monthly based on the total number of positions in such account at the end of such month). For Class R3, Class R4 and Class R5, the fees paid to the transfer agent for expenses paid to financial intermediaries to maintain omnibus accounts are subject to an annual limitation of 0.05% of the net assets attributable to such shares. Class I does not pay transfer agency fees.
The fund also pays certain reimbursable out-of-pocket expenses to the transfer agent. The transfer agent also may retain as additional compensation for its services revenues for fees for wire, telephone and redemption orders, IRA trustee agent fees and account transcripts due the transfer agent from fund shareholders and credits (net of bank charges) earned with respect to balances in accounts the transfer agent maintains in connection with its services to the funds. The fees paid to the transfer agent may be changed by the Board without shareholder approval.
PLAN ADMINISTRATION SERVICES
The funds that offer Class R3 and Class R4 shares have a Plan Administration Services Agreement with the transfer agent. Under the agreement the fund pays for plan administration services, including services such as implementation and conversion services, account set-up and maintenance, reconciliation and account recordkeeping, education services and administration to various plan types, including 529 plans, retirement plans and Health Savings Accounts (HSAs).
The fee for services is equal on an annual basis to 0.25% of the average daily net assets of the fund attributable to each of Class R3 and R4.
The fees paid to the transfer agent may be changed by the Board without shareholder approval.
DISTRIBUTION SERVICES
Columbia Management Investment Distributors, Inc. (the “distributor”) (formerly RiverSource Fund Distributors, Inc.), an indirect wholly-owned subsidiary of Columbia Management, One Financial Center, Boston, MA 02111, serves as the funds’ principal underwriter and distributor. Prior to June 1, 2009, for RiverSource and Threadneedle funds, RiverSource Distributors, Inc. also served as principal underwriter and distributor to the funds. Prior to Oct. 1, 2007, for RiverSource and Threadneedle funds, Ameriprise Financial Services, Inc. also served as principal underwriter and distributor to the funds. Prior to Nov. 7, 2008, for Seligman funds, Seligman Advisors, Inc. also served as principal underwriter and distributor to the funds. The fund’s shares are offered on a continuous basis. Under a Distribution Agreement, sales charges deducted for distributing fund shares are paid to the distributor daily. The following table shows the sales charges paid to the distributor and the amount retained by the distributor after paying commissions and other expenses for each of the last three fiscal periods. The table is organized by fiscal year end. You can find your fund’s fiscal year end in Table 1.
147
Table 22. Sales Charges Paid to Distributor
| | | | | | | | | | | | | | | | | | | | | | | |
| | | | | | | | | | | Amount retained after paying
commissions and other expenses | |
| | | Sales charges paid to Distributor | | |
Fund | | 2010 | | 2009 | | | 2008 | | | 2010 | | | 2009 | | | 2008 | |
For funds with fiscal period ending January 31 | | | | | | | | | | | | | | | | | | | | | | | |
Columbia Income Builder Fund | | $ | 245,462 | | $ | 466,216 | | | $ | 688,587 | (a) | | $ | (86,426 | ) | | $ | (21,562 | ) | | $ | (56,086 | )(a) |
Columbia Income Builder Fund II | | | 293,969 | | | 654,937 | | | | 1,279,681 | (a) | | | (109,209 | ) | | | 77,641 | | | | 34,001 | (a) |
Columbia Income Builder Fund III | | | 189,070 | | | 296,977 | | | | 831,981 | (a) | | | (27,745 | ) | | | (533 | ) | | | 176,661 | (a) |
Columbia Portfolio Builder Aggressive | | | 1,656,276 | | | 2,081,242 | | | | 2,848,037 | | | | 417,384 | | | | 552,795 | | | | 799,417 | |
Columbia Portfolio Builder Conservative | | | 524,245 | | | 528,590 | | | | 384,348 | | | | 8,450 | | | | 16,829 | | | | 4,989 | |
Columbia Portfolio Builder Moderate | | | 2,911,626 | | | 3,277,766 | | | | 3,944,827 | | | | 507,020 | | | | 661,689 | | | | 702,939 | |
Columbia Portfolio Builder Moderate Aggressive | | | 3,171,640 | | | 4,181,445 | | | | 5,635,597 | | | | 795,856 | | | | 1,125,393 | | | | 1,613,677 | |
Columbia Portfolio Builder Moderate Conservative | | | 885,194 | | | 982,012 | | | | 1,088,559 | | | | 111,387 | | | | 153,386 | | | | 140,630 | |
Columbia Portfolio Builder Total Equity | | | 1,059,706 | | | 1,561,130 | | | | 2,257,735 | | | | 202,573 | | | | 319,114 | | | | 471,536 | |
RiverSource S&P 500 Index | | | N/A | | | N/A | | | | N/A | | | | N/A | | | | N/A | | | | N/A | |
RiverSource Small Company Index | | | 265,422 | | | 365,094 | | | | 563,878 | | | | 265,422 | | | | 317,088 | | | | 117,897 | |
For funds with fiscal period ending March 31 | | | | | | | | | | | | | | | | | | | | | | | |
Columbia Equity Value | | | 245,798 | | | 374,068 | | | | 496,313 | | | | 28,520 | | | | 65,246 | | | | 16,594 | |
RiverSource Precious Metals and Mining | | | 224,264 | | | 159,379 | | | | 192,503 | | | | 6,986 | | | | 55,468 | | | | 50,572 | |
For funds with fiscal period ending April 30 | | | | | | | | | | | | | | | | | | | | | | | |
Columbia 120/20 Contrarian Equity | | | 44,207 | | | 57,137 | | | | 149,480 | (b) | | | 2,401 | | | | 5,429 | | | | 46,196 | (b) |
Columbia Recovery and Infrastructure | | | 1,817,351 | | | 221,190 | (c) | | | N/A | | | | 337,598 | | | | (7,085 | )(c) | | | N/A | |
Columbia Retirement Plus 2010 | | | 6,098 | | | 7,536 | | | | 32,694 | | | | 2,480 | | | | 1,465 | | | | 11,266 | |
Columbia Retirement Plus 2015 | | | 12,014 | | | 17,354 | | | | 70,298 | | | | 5,364 | | | | 5,173 | | | | 50,360 | |
Columbia Retirement Plus 2020 | | | 20,614 | | | 26,015 | | | | 41,850 | | | | 8,068 | | | | 12,539 | | | | 21,519 | |
Columbia Retirement Plus 2025 | | | 15,117 | | | 21,208 | | | | 49,187 | | | | 6,222 | | | | 7,872 | | | | 25,003 | |
Columbia Retirement Plus 2030 | | | 14,540 | | | 19,999 | | | | 51,530 | | | | 5,797 | | | | 9,336 | | | | 28,063 | |
Columbia Retirement Plus 2035 | | | 11,125 | | | 14,670 | | | | 31,469 | | | | 5,669 | | | | 6,101 | | | | 19,162 | |
Columbia Retirement Plus 2040 | | | 18,304 | | | 17,700 | | | | 39,332 | | | | 8,927 | | | | 8,815 | | | | 21,208 | |
Columbia Retirement Plus 2045 | | | 15,018 | | | 16,697 | | | | 23,890 | | | | 6,063 | | | | 6,510 | | | | 12,087 | |
For funds with fiscal period ending May 31 | | | | | | | | | | | | | | | | | | | | | | | |
Columbia High Yield Bond | | | 1,321,507 | | | 974,983 | | | | 882,107 | | | | 297,716 | | | | 108,896 | | | | 41,174 | |
Columbia Multi-Advisor Small Cap Value | | | 305,205 | | | 287,969 | | | | 607,350 | | | | 56,453 | | | | 38,780 | | | | 117,005 | |
Columbia U.S. Government Mortgage | | | 109,683 | | | 101,207 | | | | 136,891 | | | | (17,796 | ) | | | (70,344 | ) | | | (116,397 | ) |
RiverSource Partners Fundamental Value | | | 340,583 | | | 494,967 | | | | 766,263 | | | | 14,174 | | | | 43,220 | | | | 58,252 | |
RiverSource Short Duration U.S. Government | | | 392,239 | | | 530,165 | | | | 660,354 | | | | 35,955 | | | | 107,433 | | | | (152,827 | ) |
For funds with fiscal period ending June 30 | | | | | | | | | | | | | | | | | | | | | | | |
Columbia Dividend Opportunity | | | 1,058,723 | | | 798,182 | | | | 1,648,530 | | | | 175,949 | | | | 39,934 | | | | 206,622 | |
RiverSource Real Estate | | | 80,410 | | | 98,301 | | | | 211,915 | | | | 15,331 | | | | 18,158 | | | | 63,306 | |
For funds with fiscal period ending July 31 | | | | | | | | | | | | | | | | | | | | | | | |
Columbia Floating Rate | | | 240,774 | | | 189,836 | | | | 380,143 | | | | (11,075 | ) | | | 11,806 | | | | (174,369 | ) |
Columbia Income Opportunities | | | 1,196,954 | | | 951,690 | | | | 135,655 | | | | 271,045 | | | | 251,745 | | | | (11,090 | ) |
Columbia Inflation Protected Securities | | | 236,120 | | | 332,292 | | | | 407,706 | | | | 15,969 | | | | 101,013 | | | | 51,044 | |
Columbia Large Core Quantitative | | | 1,610,548 | | | 261,402 | | | | 412,821 | | | | 377,765 | | | | 67,822 | | | | 85,890 | |
148
| | | | | | | | | | | | | | | | | |
Columbia Limited Duration Credit | | 1,033,053 | | 145,544 | | | 92,255 | | | 119,494 | | | 17,573 | | | 9,475 | |
Columbia Money Market | | 106,803 | | 367,743 | | | 339,219 | | | 106,058 | | | 367,712 | | | 339,111 | |
RiverSource Disciplined Small and Mid Cap Equity | | 25,721 | | 24,097 | | | 26,228 | | | 7,017 | | | 7,132 | | | 7,923 | |
RiverSource Disciplined Small Cap Value | | 5,507 | | 8,386 | | | 6,647 | | | 1,133 | | | 2,011 | | | 1,943 | |
| | | | | | |
| | | 2009 | | 2008 | | | 2007 | | | 2009 | | | 2008 | | | 2007 | |
For funds with fiscal period ending August 31 | | | | | | | | | | | | | | | | | |
Columbia Diversified Bond | | 1,922,949 | | 1,992,222 | | | 2,340,251 | | | (92,219 | ) | | 176,513 | | | 419,415 | |
Columbia Minnesota Tax-Exempt | | 406,782 | | 463,447 | | | 338,160 | | | 84,001 | | | 37,217 | | | 12,594 | |
RiverSource California Tax-Exempt | | 92,347 | | 91,928 | | | 150,760 | | | 9,806 | | | 5,945 | | | 46,117 | |
RiverSource New York Tax-Exempt | | 20,992 | | 29,401 | | | 43,518 | | | 8,033 | | | 8,217 | | | 6,984 | |
For funds with fiscal period ending September 30 | | | | | | | | | | | | | | | | | |
Columbia Diversified Equity Income | | 3,383,179 | | 6,331,545 | | | 9,553,810 | | | 496,151 | | | 1,204,186 | | | 1,407,616 | |
Columbia Large Growth Quantitative | | 69,425 | | 87,685 | | | 20,834 | (d) | | 15,099 | | | 30,621 | | | 5,197 | (d) |
Columbia Large Value Quantitative | | 2,270 | | 0 | (e) | | N/A | | | 566 | | | 0 | (e) | | N/A | |
Columbia Mid Cap Value Opportunity | | 954,172 | | 2,444,490 | | | 3,538,910 | | | 207,568 | | | 898,395 | | | 862,120 | |
Columbia Strategic Allocation | | 2,055,294 | | 5,371,458 | | | 8,570,846 | | | 347,495 | | | 1,321,113 | | | 1,738,063 | |
RiverSource Balanced | | 189,413 | | 287,586 | | | 474,702 | | | 39,038 | | | 36,359 | | | 32,524 | |
RiverSource Strategic Income Allocation | | 600,969 | | 400,285 | | | 267,319 | (d) | | 2,484 | | | 28,302 | | | 26,129 | (d) |
Seligman California Municipal High-Yield | | 37,316 | | 98,702 | | | 18,611 | | | 36,272 | | | 13,104 | | | 3,125 | |
Seligman California Municipal Quality | | 60,005 | | 37,798 | | | 15,149 | | | 56,335 | | | 5,413 | | | 2,159 | |
Seligman Minnesota Municipal | | 66,716 | | 49,497 | | | 35,607 | | | 55,756 | | | 6,427 | | | 4,740 | |
Seligman National Municipal | | 222,346 | | 57,892 | | | 18,992 | | | 199,904 | | | 7,651 | | | 3,601 | |
Seligman New York Municipal | | 166,632 | | 48,724 | | | 31,659 | | | 157,302 | | | 7,550 | | | 6,334 | |
Seligman TargETFund 2015 | | 22,260 | | 77,218 | | | 242,913 | | | 22,260 | | | 9,521 | | | 25,977 | |
Seligman TargETFund 2025 | | 26,925 | | 79,939 | | | 188,122 | | | 26,925 | | | 9,918 | | | 19,976 | |
Seligman TargETFund 2035 | | 3,094 | | 13,483 | | | 13,573 | | | 2,975 | | | 1,677 | | | 1,493 | |
Seligman TargETFund 2045 | | 7,658 | | 27,815 | | | 7,910 | | | 7,508 | | | 3,493 | | | 791 | |
Seligman TargETFund Core | | 24,251 | | 126,638 | | | 297,932 | | | 24,251 | | | 15,617 | | | 30,512 | |
For funds with fiscal period ending October 31 | | | | | | | | | | | | | | | | | |
Columbia Absolute Return Currency and Income | | 118,256 | | 288,047 | | | 10,519 | | | 40,664 | | | 52,383 | | | 3,448 | |
Columbia Asia Pacific ex-Japan(f) | | N/A | | N/A | | | N/A | | | N/A | | | N/A | | | N/A | |
Columbia Emerging Markets Bond | | 70,770 | | 41,906 | | | 25,743 | | | 28,245 | | | 10,486 | | | 1,421 | |
Columbia Emerging Markets Opportunity | | 558,505 | | 780,872 | | | 886,062 | | | 140,308 | | | (4,109,358 | ) | | (7,004,024 | ) |
Columbia European Equity | | 68,398 | | 124,828 | | | 226,464 | | | 19,191 | | | 35,391 | | | 90,745 | |
Columbia Frontier | | 1,357 | | 10,431 | | | 25,638 | | | 735 | | | 1,351 | | | 3,856 | |
Columbia Global Bond | | 218,412 | | 391,577 | | | 314,002 | | | 32,697 | | | 118,930 | | | 215,442 | |
Columbia Global Equity | | 361,007 | | 800,774 | | | 896,578 | | | 60,748 | | | 114,011 | | | 99,098 | |
Columbia Global Extended Alpha | | 8,674 | | 1,795 | (g) | | N/A | | | 3,445 | | | 307 | (g) | | N/A | |
Columbia Multi-Advisor International Value | | 580,503 | | 1,584,444 | | | 4,085,674 | | | 68,413 | | | 235,164 | | | 641,699 | |
Columbia Seligman Global Technology | | 221,563 | | 265,528 | | | 309,290 | | | 184,936 | | | 233,685 | | | 274,719 | |
RiverSource Disciplined International Equity | | 61,779 | | 168,692 | | | 130,761 | | | 8,596 | | | 36,899 | | | 14,894 | |
RiverSource Partners International Select Growth | | 213,399 | | 560,302 | | | 885,940 | | | 43,200 | | | 118,125 | | | 226,007 | |
RiverSource Partners International Small Cap | | 53,930 | | 88,479 | | | 164,026 | | | 26,245 | | | 20,053 | | | 19,649 | |
Threadneedle Global Equity Income | | 38,564 | | 18,558 | (g) | | N/A | | | 7,576 | | | 4,340 | (g) | | N/A | |
Threadneedle International Opportunity | | 168,431 | | 319,850 | | | 501,090 | | | 37,276 | | | 49,744 | | | 56,669 | |
For funds with fiscal period ending November 30 | | | | | | | | | | | | | | | | | |
Columbia AMT-Free Tax-Exempt Bond | | 477,836 | | 319,831 | | | 313,115 | | | 100,280 | | | 64,831 | | | (19,725 | ) |
Columbia Mid Cap Growth Opportunity | | 453,947 | | 360,393 | | | 608,683 | | | 131,709 | | | 59,123 | | | 115,052 | |
RiverSource Intermediate Tax-Exempt | | 75,578 | | 59,348 | | | 62,985 | | | 3,223 | | | (792 | ) | | (10,183 | ) |
RiverSource Tax-Exempt High Income | | 1,164,712 | | 1,042,555 | | | 1,182,244 | | | 192,881 | | | 151,444 | | | 181,059 | |
For funds with fiscal period ending December 31 | | | | | | | | | | | | | | | | | |
Columbia Government Money Market | | 22,845 | | N/A | | | N/A | | | 22,830 | | | N/A | | | N/A | |
Columbia Select Large-Cap Value | | 83,550 | | 112,370 | | | 67,382 | | | 72,301 | | | 14,405 | | | 8,773 | |
Columbia Select Smaller-Cap Value | | 73,571 | | 31,742 | | | 65,218 | | | 39,883 | | | 4,542 | | | 8,361 | |
Columbia Seligman Communications and Information | | 3,487,463 | | 1,478,105 | | | 2,850,171 | | | 3,197,170 | | | 187,649 | | | 320,100 | |
RiverSource LaSalle Global Real Estate | | 14,337 | | 4,931 | | | 439,574 | | | 13,946 | | | 638 | | | 50,672 | |
RiverSource LaSalle Monthly Dividend Real Estate | | 15,219 | | 19,987 | | | 95,027 | | | 14,907 | | | 2,839 | | | 10,193 | |
Seligman Capital | | 30,899 | | 34,577 | | | 66,383 | | | 27,966 | | | 6,030 | | | 11,356 | |
Seligman Growth | | 336,636 | | 43,178 | | | 48,116 | | | 115,283 | | | 11,948 | | | 10,926 | |
149
| (a) | The fund changed its fiscal year end effective Jan. 31, 2008 from May 31 to Jan. 31. For 2008, the information shown is for the period from June 1, 2007 through Jan. 31, 2008. For years prior to 2008, the fiscal period ended on May 31. |
| (b) | For the period from Oct. 18, 2007 (when shares became publicly available) to April 30, 2008. |
| (c) | For the period from Feb. 19, 2009 (when shares became publicly available) to April 30, 2009. |
| (d) | For the period from May 17, 2007 (when shares became publicly available) to Sept. 30, 2007. |
| (e) | For the period from Aug. 1, 2008 (when shares became publicly available) to Sept. 30, 2008. |
| (f) | For the period from July 15, 2009 (when the Fund became available) to Oct. 31, 2009. |
| (g) | For the period from Aug. 1, 2008 (when shares became publicly available) to Oct. 31, 2008. |
Part of the sales charge may be paid to selling dealers who have agreements with the distributor. The distributor will retain the balance of the sales charge. At times the entire sales charge may be paid to selling dealers.
PLAN AND AGREEMENT OF DISTRIBUTION
To help defray the cost of distribution and/or servicing not covered by the sales charges received under the Distribution Agreement, the Legacy RiverSource funds approved a Plan of Distribution (the “Plan”) and entered into an agreement under the Plan pursuant to Rule 12b-1 under the 1940 Act. The Plan is a reimbursement plan whereby the fund pays the distributor a fee up to actual expenses incurred.
The table below shows the maximum annual distribution and/or service fees (as an annual percent of average daily net assets) and the combined amount of such fees (as an annual percent of average daily net assets) applicable to each share class of a Legacy RiverSource fund:
| | | | | | |
Share Class | | Distribution Fee | | Service Fee | | Combined Total |
Class A | | up to 0.25% | | up to 0.25% | | 0.25%(a) |
Class B | | 0.75% | | 0.25% | | 1.00%(b) |
Class C | | 0.75% | | 0.25% | | 1.00%(a) |
Class I | | None | | None | | None |
Class R (formerly Class R2) | | up to 0.50% | | up to 0.25% | | 0.50%(a),(c) |
Class R3 | | 0.25% | | 0.25%(d) | | 0.50%(d) |
Class R4 | | None | | 0.25%(d) | | 0.25%(d) |
Class R5 | | None | | None | | None |
Class W | | up to 0.25% | | up to 0.25% | | 0.25%(a) |
Class Z | | None | | None | | None |
| (a) | Fee amounts noted apply to all funds other than Columbia Money Market Fund, which, for each of Class A and Class W shares, pays distribution and service fees of 0.10%, and for Class C shares pays distribution fees of 0.75%. The distributor has voluntarily agreed, effective April 15, 2010, to waive the 12b-1 fees it receives from Class A, Class C, Class R (formerly Class R2) and Class W shares of Columbia Money Market Fund and from Class A, Class C and Class R (formerly Class R2) shares of Columbia Government Money Market Fund. Compensation paid to broker-dealers and other financial intermediaries may be suspended to the extent of the distributor’s waiver of the 12b-1 fees on these specific share classes of these funds. |
| (b) | Fee amounts noted apply to all funds other than Columbia Money Market Fund, which pays distribution fees of up to 0.75% and service fees of up to 0.10% for a combined total of 0.85%. Effective after the close of business on Sept. 3, 2010, Class B shares will be closed to new and existing investors. |
150
| (c) | The Legacy RiverSource funds have a distribution and shareholder service plan for Class R shares, which, prior to the close of business on Sept. 3, 2010, were known as Class R2 shares. For Class R shares, the maximum fee under the plan reimbursed for distribution expenses is equal on an annual basis to 0.50% of the average daily net assets of the fund attributable to Class R shares. Of that amount, up to 0.25% may be reimbursed for shareholder service expenses. |
| (d) | The shareholder service fees for Class R3 and Class R4 shares are not paid pursuant to a 12b-1 plan. Under a Plan Administration Services Agreement, the funds’ Class R3 and Class R4 shares pay for plan administration services, including services such as implementation and conversion services, account set-up and maintenance, reconciliation and account recordkeeping, education services and administration to various plan types, including 529 plans, retirement plans and health savings accounts. |
The distribution and/or shareholder service fees for Class A, Class B, Class C, Class R (formerly Class R2), Class R3 and Class W shares, as applicable, are subject to the requirements of Rule 12b-1 under the 1940 Act, and are to reimburse the distributor for certain expenses it incurs in connection with distributing the fund’s shares and directly or indirectly providing services to fund shareholders. These payments or expenses include providing distribution and/or shareholder service fees to selling and/or servicing agents that sell shares of the fund or provide services to fund shareholders. The distributor may retain these fees otherwise payable to selling and/or servicing agents if the amounts due are below an amount determined by the distributor in its discretion.
For the Legacy RiverSource funds, for Class A, Class B and Class W shares, the distributor begins to pay these fees immediately after purchase. For Class C shares, the distributor pays these fees in advance for the first 12 months. Selling and/or servicing agents also receive distribution fees up to 0.75% of the average daily net assets of Class C shares sold and held through them, which the distributor begins to pay 12 months after purchase. For Class B shares, and, for the first 12 months following the sale of Class C shares, the distributor retains the distribution fee of up to 0.75% in order to finance the payment of sales commissions to selling and/or servicing agents, and to pay for other distribution related expenses. Selling and/or servicing agents may compensate their financial advisors with the shareholder service and distribution fees paid to them by the Distributor.
If you maintain shares of the fund directly with the fund, without working directly with a financial advisor or selling and/or servicing agent, distribution and service fees are retained by the distributor as payment or reimbursement for incurring certain distribution and shareholder service related expenses.
Over time, these distribution and/or shareholder service fees will reduce the return on your investment and may cost you more than paying other types of sales charges. The fund will pay these fees to the distributor and/or to eligible selling and/or servicing agents for as long as the distribution and/or shareholder servicing plans continue in effect. The fund may reduce or discontinue payments at any time. Your selling and/or servicing agent may also charge you other additional fees for providing services to your account, which may be different from those described here.
For its most recent fiscal period, each fund paid 12b-1 fees as shown in the following table. The table is organized by fiscal year end. You can find your fund’s fiscal year end in Table 1.
Table 23. 12b-1 Fees
| | | | | | | | | | | | | | | | | | |
Fund | | Class A | | Class B | | Class C | | Class D* | | Class R | | Class R3 | | Class W |
For funds with fiscal period ending January 31 | | | | | | | | | | | | | | | | | | |
Columbia Income Builder Fund | | $ | 471,671 | | $ | 273,352 | | $ | 105,503 | | | N/A | | N/A | | N/A | | N/A |
Columbia Income Builder Fund II | | | 843,392 | | | 386,458 | | | 146,186 | | | N/A | | N/A | | N/A | | N/A |
Columbia Income Builder Fund III | | | 420,462 | | | 181,976 | | | 83,149 | | | N/A | | N/A | | N/A | | N/A |
Columbia Portfolio Builder Aggressive | | | 906,136 | | | 651,430 | | | 196,648 | | | N/A | | N/A | | N/A | | N/A |
Columbia Portfolio Builder Conservative | | | 427,544 | | | 415,794 | | | 145,696 | | | N/A | | N/A | | N/A | | N/A |
Columbia Portfolio Builder Moderate | | | 2,010,066 | | | 1,572,878 | | | 469,838 | | | N/A | | N/A | | N/A | | N/A |
Columbia Portfolio Builder Moderate Aggressive | | | 1,896,292 | | | 1,394,436 | | | 362,267 | | | N/A | | N/A | | N/A | | N/A |
Columbia Portfolio Builder Moderate Conservative | | | 744,235 | | | 615,354 | | | 206,862 | | | N/A | | N/A | | N/A | | N/A |
Columbia Portfolio Builder Total Equity | | | 769,440 | | | 529,603 | | | 177,552 | | | N/A | | N/A | | N/A | | N/A |
RiverSource S&P 500 Index | | | N/A | | | N/A | | | N/A | | $ | 54,437 | | N/A | | N/A | | N/A |
RiverSource Small Company Index | | | 781,451 | | | 482,501 | | | N/A | | | N/A | | N/A | | N/A | | N/A |
151
| | | | | | | | | | | | | | | | | |
For funds with fiscal period ending March 31 | | | | | | | | | | | | | | | | | |
Columbia Equity Value | | 1,484,672 | | 513,603 | | 42,567 | | N/A | | $ | 52 | | $ | 369 | | $ | 8 |
RiverSource Precious Metals and Mining | | 303,284 | | 137,925 | | 31,060 | | N/A | | | N/A | | | N/A | | | N/A |
For funds with fiscal period ending April 30 | | | | | | | | | | | | | | | | | |
Columbia 120/20 Contrarian Equity | | 80,959 | | 14,686 | | 19,355 | | N/A | | | N/A | | | N/A | | | N/A |
Columbia Recovery and Infrastructure(a) | | 573,841 | | 125,316 | | 127,106 | | N/A | | | 93 | | | 39 | | | N/A |
Columbia Retirement Plus 2010 | | 7,863 | | N/A | | N/A | | N/A | | | 18 | | | 10 | | | N/A |
Columbia Retirement Plus 2015 | | 12,794 | | N/A | | N/A | | N/A | | | 18 | | | 10 | | | N/A |
Columbia Retirement Plus 2020 | | 11,607 | | N/A | | N/A | | N/A | | | 146 | | | 8 | | | N/A |
Columbia Retirement Plus 2025 | | 6,809 | | N/A | | N/A | | N/A | | | 97 | | | 8 | | | N/A |
Columbia Retirement Plus 2030 | | 10,004 | | N/A | | N/A | | N/A | | | 45 | | | 13 | | | N/A |
Columbia Retirement Plus 2035 | | 4,104 | | N/A | | N/A | | N/A | | | 17 | | | 8 | | | N/A |
Columbia Retirement Plus 2040 | | 3,831 | | N/A | | N/A | | N/A | | | 50 | | | 70 | | | N/A |
Columbia Retirement Plus 2045 | | 3,364 | | N/A | | N/A | | N/A | | | 18 | | | 8 | | | N/A |
For funds with fiscal period ending May 31 | | | | | | | | | | | | | | | | | |
Columbia High Yield Bond | | 3,126,170 | | 1,016,761 | | 599,062 | | N/A | | | 19,571 | | | 5,898 | | | 263,891 |
Columbia Multi-Advisor Small Cap Value | | 629,566 | | 635,056 | | 71,205 | | N/A | | | 2,666 | | | 433 | | | N/A |
Columbia U.S. Government Mortgage | | 195,150 | | 198,412 | | 44,904 | | N/A | | | N/A | | | N/A | | | N/A |
RiverSource Partners Fundamental Value | | 846,835 | | 604,556 | | 88,558 | | N/A | | | N/A | | | N/A | | | N/A |
RiverSource Short Duration U.S. Government | | 1,289,353 | | 810,418 | | 242,435 | | N/A | | | 11,521 | | | N/A | | | 12 |
For funds with fiscal period ending June 30 | | | | | | | | | | | | | | | | | |
Columbia Dividend Opportunity | | 2,335,959 | | 777,706 | | 197,105 | | N/A | | | 228 | | | 11 | | | 10 |
RiverSource Real Estate | | 128,018 | | 64,833 | | 11,302 | | N/A | | | N/A | | | N/A | | | 6 |
For funds with fiscal period ending July 31 | | | | | | | | | | | | | | | | | |
Columbia Floating Rate | | 661,379 | | 129,749 | | 172,291 | | N/A | | | N/A | | | N/A | | | 11 |
Columbia Income Opportunities | | 1,165,157 | | 362,360 | | 508,953 | | N/A | | | N/A | | | N/A | | | N/A |
Columbia Inflation Protected Securities | | 676,148 | | 221,294 | | 156,599 | | N/A | | | 5,707 | | | N/A | | | 401,982 |
Columbia Large Core Quantitative | | 6,447,567 | | 1,947,821 | | 209,143 | | N/A | | | 9,201 | | | 14 | | | 1,372,152 |
Columbia Limited Duration Credit | | 710,400 | | 120,305 | | 341,535 | | N/A | | | N/A | | | N/A | | | 12 |
Columbia Money Market | | 2,064,367 | | 421,815 | | 29,890 | | N/A | | | 5 | | | N/A | | | 14,212 |
RiverSource Disciplined Small and Mid Cap Equity | | 25,573 | | 9,144 | | 2,729 | | N/A | | | N/A | | | N/A | | | 265,113 |
RiverSource Disciplined Small Cap Value | | 19,337 | | 2,362 | | 1,006 | | N/A | | | 17 | | | 12 | | | N/A |
For funds with fiscal period ending August 31 | | | | | | | | | | | | | | | | | |
Columbia Diversified Bond | | 4,876,489 | | 2,344,842 | | 378,881 | | N/A | | | 135 | | | 23 | | | 1,433,055 |
Columbia Minnesota Tax-Exempt | | 703,042 | | 127,738 | | 92,844 | | N/A | | | N/A | | | N/A | | | N/A |
RiverSource California Tax-Exempt | | 388,632 | | 39,496 | | 24,784 | | N/A | | | N/A | | | N/A | | | N/A |
RiverSource New York Tax-Exempt | | 124,348 | | 32,203 | | 7,408 | | N/A | | | N/A | | | N/A | | | N/A |
For funds with fiscal period ending September 30 | | | | | | | | | | | | | | | | | |
Columbia Diversified Equity Income | | 7,673,291 | | 4,133,298 | | 654,310 | | N/A | | | 32,750 | | | 224,770 | | | 7 |
Columbia Large Growth Quantitative | | 285,822 | | 31,420 | | 14,405 | | N/A | | | 31 | | | 16 | | | 148,342 |
Columbia Large Value Quantitative | | 2,658 | | 717 | | 132 | | N/A | | | 33 | | | 16 | | | 203,257 |
Columbia Mid Cap Value Opportunity | | 2,975,723 | | 1,048,865 | | 359,404 | | N/A | | | 56,692 | | | 82,312 | | | 7 |
Columbia Strategic Allocation | | 2,727,681 | | 1,272,157 | | 456,933 | | N/A | | | 16 | | | 8 | | | N/A |
RiverSource Balanced | | 1,240,431 | | 190,901 | | 34,422 | | N/A | | | 54 | | | N/A | | | N/A |
RiverSource Strategic Income Allocation | | 421,534 | | 206,718 | | 76,158 | | N/A | | | 23 | | | 11 | | | N/A |
Seligman California Municipal High-Yield | | 42,842 | | N/A | | 54,350 | | N/A | | | N/A | | | N/A | | | N/A |
Seligman California Municipal Quality | | 54,798 | | N/A | | 34,584 | | N/A | | | N/A | | | N/A | | | N/A |
Seligman Minnesota Municipal | | 99,128 | | N/A | | 9,092 | | N/A | | | N/A | | | N/A | | | N/A |
Seligman National Municipal | | 461,232 | | N/A | | 105,746 | | N/A | | | N/A | | | N/A | | | N/A |
Seligman New York Municipal | | 99,753 | | N/A | | 67,646 | | N/A | | | N/A | | | N/A | | | N/A |
Seligman TargETFund 2015 | | 29,037 | | N/A | | 116,119 | | N/A | | | 7,361 | | | N/A | | | N/A |
Seligman TargETFund 2025 | | 34,200 | | N/A | | 114,588 | | N/A | | | 11,757 | | | N/A | | | N/A |
Seligman TargETFund 2035 | | 10,620 | | N/A | | 17,945 | | N/A | | | 6,060 | | | N/A | | | N/A |
Seligman TargETFund 2045 | | 6,401 | | N/A | | 6,705 | | N/A | | | 3,486 | | | N/A | | | N/A |
Seligman TargETFund Core | | 45,600 | | N/A | | 289,930 | | N/A | | | 41,727 | | | N/A | | | N/A |
152
| | | | | | | | | | | | | | |
For funds with fiscal period ending October 31 | | | | | | | | | | | | | | |
Columbia Absolute Return Currency and Income | | 416,349 | | 35,353 | | 98,315 | | N/A | | N/A | | N/A | | 530,074 |
Columbia Asia Pacific ex-Japan(b) | | N/A | | N/A | | N/A | | N/A | | N/A | | N/A | | N/A |
Columbia Emerging Markets Bond | | 35,486 | | 15,974 | | 3,265 | | N/A | | N/A | | N/A | | 254,174 |
Columbia Emerging Markets Opportunity | | 715,248 | | 302,533 | | 99,973 | | N/A | | 13,518 | | N/A | | N/A |
Columbia European Equity | | 134,391 | | 81,471 | | 9,558 | | N/A | | N/A | | N/A | | N/A |
Columbia Frontier | | 56,264 | | 11,282 | | 86,834 | | N/A | | 453 | | 3 | | N/A |
Columbia Global Bond | | 593,225 | | 367,588 | | 44,351 | | N/A | | N/A | | N/A | | 147,100 |
Columbia Global Equity | | 884,744 | | 362,565 | | 57,394 | | N/A | | 192 | | 8 | | 8 |
Columbia Global Extended Alpha | | 5,199 | | 2,820 | | 1,035 | | N/A | | 36 | | 18 | | N/A |
Columbia Multi-Advisor International Value | | 1,476,812 | | 892,831 | | 106,186 | | N/A | | N/A | | N/A | | N/A |
Columbia Seligman Global Technology | | 469,642 | | 85,618 | | 559,118 | | N/A | | 15,300 | | 3 | | N/A |
RiverSource Disciplined International Equity | | 115,524 | | 76,758 | | 9,922 | | N/A | | 15 | | 7 | | 530,215 |
RiverSource Partners International Select Growth | | 414,628 | | 250,377 | | 42,614 | | N/A | | 110 | | N/A | | N/A |
RiverSource Partners International Small Cap | | 57,422 | | 42,653 | | 4,096 | | N/A | | N/A | | N/A | | N/A |
Threadneedle Global Equity Income | | 38,589 | | 17,080 | | 2,551 | | N/A | | 36 | | 18 | | N/A |
Threadneedle International Opportunity | | 576,787 | | 226,132 | | 30,118 | | N/A | | 1,240 | | 8 | | N/A |
For funds with fiscal period ending November 30 | | | | | | | | | | | | | | |
Columbia AMT-Free Tax-Exempt Bond | | 1,580,370 | | 189,971 | | 72,103 | | N/A | | N/A | | N/A | | N/A |
Columbia Mid Cap Growth Opportunity | | 1,123,363 | | 500,167 | | 46,013 | | N/A | | N/A | | N/A | | N/A |
RiverSource Intermediate Tax-Exempt | | 197,660 | | 44,588 | | 36,432 | | N/A | | N/A | | N/A | | N/A |
RiverSource Tax-Exempt High Income | | 5,482,675 | | 487,040 | | 137,058 | | N/A | | N/A | | N/A | | N/A |
For funds with fiscal period ending December 31 | | | | | | | | | | | | | | |
Columbia Government Money Market(c) | | 54,819 | | 51,551 | | 133,682 | | N/A | | 6,985 | | N/A | | N/A |
Columbia Seligman Communications and Information | | 5,402,710 | | 1,008,895 | | 5,611,229 | | N/A | | 133,982 | | 11 | | N/A |
Columbia Select Large-Cap Value | | 324,397 | | 67,910 | | 372,709 | | N/A | | 34,736 | | 6 | | N/A |
Columbia Select Smaller-Cap Value | | 274,250 | | 132,950 | | 382,137 | | N/A | | 43,885 | | 5 | | N/A |
RiverSource LaSalle Global Real Estate | | 15,681 | | N/A | | 27,290 | | N/A | | 248 | | 6 | | N/A |
RiverSource LaSalle Monthly Dividend Real Estate | | 15,884 | | 20,254 | | 84,243 | | N/A | | 15,651 | | 6 | | N/A |
Seligman Capital | | 350,797 | | 65,892 | | 404,801 | | N/A | | 42,283 | | 6 | | N/A |
Seligman Growth | | 1,283,827 | | 316,419 | | 239,516 | | N/A | | 4,129 | | 5 | | N/A |
| * | Effective Sept. 7, 2010, Class D was renamed as Class A. |
| (a) | For the period from Feb. 19, 2009 (when shares became publicly available) to April 30, 2009. |
| (b) | For the period from July 15, 2009 (when shares became publicly available) to Oct. 31, 2009. |
| (c) | Effective March 27, 2009, Class C2 shares converted to Class A shares. The amount attributable to Class C2 prior to the conversion is $4,804. |
153
For funds with Class B and Class C shares:
The following table provides the amount of distribution expenses, as a dollar amount and as a percentage of net assets, incurred by the distributor and not yet reimbursed (“unreimbursed expense”) for Class B and Class C shares. These amounts are based on the most recent information available as of April 30, 2010 and may be recovered from future payments under the distribution plan or CDSC. To the extent the unreimbursed expense has been fully recovered, the distribution fee is reduced.
Table 24. Unreimbursed Distribution Expenses
| | | | | | | | | | | | |
| | | Class B | | Percentage of
Class B
net assets | | | Class C | | Percentage of
Class C
net assets | |
Columbia 120/20 Contrarian Equity Fund | | $ | 74,000 | | 5.28 | % | | $ | 18,000 | | 0.75 | % |
Columbia Absolute Return Currency and Income Fund | | | 61,000 | | 4.34 | % | | | 22,000 | | 0.38 | % |
Columbia AMT-Free Tax-Exempt Bond Fund | | | 400,000 | | 2.84 | % | | | 84,000 | | 0.18 | % |
Columbia Diversified Bond Fund | | | 7,785,000 | | 4.54 | % | | | 854,000 | | 1.45 | % |
Columbia Diversified Equity Income Fund | | | 15,676,000 | | 4.24 | % | | | 750,000 | | 1.01 | % |
Columbia Dividend Opportunity Fund | | | 3,241,000 | | 4.11 | % | | | 229,000 | | 0.97 | % |
Columbia Emerging Markets Bond Fund | | | 108,800 | | 3.22 | % | | | 52,000 | | 3.83 | % |
Columbia Emerging Markets Opportunity Fund | | | 1,134,000 | | 2.59 | % | | | 1,471,000 | | 4.09 | % |
Columbia Equity Value Fund | | | 1,559,000 | | 3.16 | % | | | 61,000 | | 1.23 | % |
Columbia European Equity Fund | | | 180,000 | | 3.07 | % | | | 23,000 | | 1.80 | % |
Columbia Floating Rate Fund | | | 749,000 | | 5.69 | % | | | 110,000 | | 0.54 | % |
Columbia Frontier Fund | | | 7,000 | | 0.06 | % | | | 1,286,000 | | 10.57 | % |
Columbia Global Bond Fund | | | 1,147,000 | | 4.18 | % | | | 97,000 | | 1.60 | % |
Columbia Global Equity Fund | | | 1,354,000 | | 4.11 | % | | | 1,521,000 | | 14.28 | % |
Columbia Global Extended Alpha Fund | | | 36,000 | | 8.22 | % | | | 1,000 | | 0.60 | % |
Columbia Government Money Market Fund | | | 118,000 | | 2.78 | % | | | 3,024,000 | | 22.05 | % |
Columbia High Yield Bond Fund | | | 3,390,000 | | 3.49 | % | | | 8,938,000 | | 11.94 | % |
Columbia Income Builder Fund | | | 1,771,000 | | 7.04 | % | | | 105,000 | | 0.75 | % |
Columbia Income Builder Fund II | | | 2,359,000 | | 6.74 | % | | | 108,000 | | 0.67 | % |
Columbia Income Builder Fund III | | | 1,194,000 | | 7.04 | % | | | 63,000 | | 0.68 | % |
Columbia Income Opportunities Fund | | | 1,590,000 | | 4.28 | % | | | 271,000 | | 0.46 | % |
Columbia Inflation Protected Securities Fund | | | 1,099,000 | | 5.19 | % | | | 198,000 | | 1.15 | % |
Columbia Large Core Quantitative Fund | | | 10,727,000 | | 4.70 | % | | | 1,330,000 | | 5.37 | % |
Columbia Large Growth Quantitative Fund | | | 158,000 | | 4.30 | % | | | 12,000 | | 0.70 | % |
Columbia Large Value Quantitative Fund | | | 8,000 | | 8.54 | % | | | — | | 0.00 | % |
Columbia Limited Duration Credit Fund | | | 533,000 | | 3.70 | % | | | 478,000 | | 1.09 | % |
Columbia Mid Cap Growth Opportunity Fund | | | 1,622,000 | | 1.94 | % | | | 82,000 | | 0.62 | % |
Columbia Mid Cap Value Opportunity Fund | | | 4,289,000 | | 3.09 | % | | | 280,000 | | 0.56 | % |
Columbia Minnesota Tax-Exempt Fund | | | 201,000 | | 2.21 | % | | | 177,000 | | 1.01 | % |
Columbia Money Market Fund | | | 6,136,000 | | 13.23 | % | | | 24,000 | | 0.62 | % |
Columbia Multi-Advisor International Value Fund | | | 3,780,000 | | 5.15 | % | | | 174,000 | | 0.75 | % |
Columbia Multi-Advisor Small Cap Value Fund | | | 1,903,000 | | 2.76 | % | | | 109,000 | | 0.37 | % |
Columbia Portfolio Builder Aggressive Fund | | | 3,112,000 | | 4.13 | % | | | 176,000 | | 0.25 | % |
Columbia Portfolio Builder Conservative Fund | | | 2,190,000 | | 5.56 | % | | | 181,000 | | 0.65 | % |
Columbia Portfolio Builder Moderate Aggressive Fund | | | 6,749,000 | | 4.37 | % | | | 1,175,000 | | 25.73 | % |
Columbia Portfolio Builder Moderate Conservative Fund | | | 3,127,000 | | 5.04 | % | | | 275,000 | | 18.50 | % |
Columbia Portfolio Builder Moderate Fund | | | 8,071,000 | | 4.61 | % | | | 1,562,000 | | 5.63 | % |
Columbia Portfolio Builder Total Equity Fund | | | 2,647,000 | | 4.39 | % | | | 1,384,000 | | 5.13 | % |
Columbia Recovery and Infrastructure Fund | | | 267,000 | | 1.24 | % | | | 122,000 | | 1.36 | % |
Columbia Select Large-Cap Value Fund | | | 105,000 | | 1.76 | % | | | 2,948,000 | | 204.54 | % |
Columbia Select Smaller-Cap Value Fund | | | 782,000 | | 2.08 | % | | | 2,754,000 | | 25.49 | % |
Columbia Seligman Global Technology Fund | | | 510,000 | | 1.99 | % | | | 4,621,000 | | 15.83 | % |
Columbia Seligman Communications and Information Fund | | | 982,000 | | 0.97 | % | | | 20,436,000 | | 2.81 | % |
Columbia Strategic Allocation Fund | | | 6,182,000 | | 5.95 | % | | | 416,000 | | 6.87 | % |
Columbia U.S. Government Mortgage Fund | | | 893,000 | | 5.05 | % | | | 51,000 | | 0.42 | % |
RiverSource Balanced Fund | | | 715,000 | | 4.14 | % | | | 1,466,000 | | 15.03 | % |
RiverSource California Tax-Exempt Fund | | | 77,000 | | 2.92 | % | | | 32,000 | | 0.99 | % |
RiverSource Disciplined International Equity Fund | | | 331,000 | | 5.32 | % | | | 13,000 | | 1.24 | % |
RiverSource Disciplined Small and Mid Cap Equity Fund | | | 53,000 | | 5.62 | % | | | — | | 0.00 | % |
RiverSource Disciplined Small Cap Value Fund | | | 17,000 | | 7.23 | % | | | 2,000 | | 1.53 | % |
154
| | | | | | | | | | |
RiverSource Intermediate Tax-Exempt Fund | | 117,000 | | 3.44 | % | | 57,000 | | 0.93 | % |
RiverSource LaSalle Global Real Estate Fund | | N/A | | N/A | | | 790,000 | | 32.81 | % |
RiverSource LaSalle Monthly Dividend Real Estate Fund | | 30,000 | | 1.16 | % | | 315,000 | | 2.72 | % |
RiverSource New York Tax-Exempt Fund | | 58,000 | | 2.98 | % | | 12,000 | | 1.19 | % |
RiverSource Partners Fundamental Value Fund | | 2,438,000 | | 4.22 | % | | 127,000 | | 1.45 | % |
RiverSource Partners International Select Growth Fund | | 977,000 | | 4.27 | % | | 1,963,000 | | 19.48 | % |
RiverSource Partners International Small Cap Fund | | 223,000 | | 3.89 | % | | 2,000 | | 0.02 | % |
RiverSource Precious Metals and Mining Fund | | 392,000 | | 2.63 | % | | 51,000 | | 0.12 | % |
RiverSource Real Estate Fund | | 402,000 | | 5.45 | % | | 12,000 | | 0.07 | % |
RiverSource Short Duration U.S. Government Fund | | 3,624,000 | | 5.38 | % | | 1,582,000 | | 9.46 | % |
RiverSource Small Company Index Fund | | 1,427,000 | | 2.93 | % | | N/A | | N/A | |
RiverSource Strategic Income Allocation Fund | | 1,189,000 | | 4.41 | % | | 131,000 | | 3.81 | % |
RiverSource Tax-Exempt High Income Fund | | 893,000 | | 2.45 | % | | 186,000 | | 0.03 | % |
Seligman California Municipal High-Yield Fund | | N/A | | N/A | | | 206,000 | | 3.40 | % |
Seligman California Municipal Quality Fund | | N/A | | N/A | | | 242,000 | | 7.04 | % |
Seligman Capital Fund | | 72,000 | | 1.42 | % | | 5,183,000 | | 11.17 | % |
Seligman Growth Fund | | 3,891,000 | | 3.94 | % | | 2,102,000 | | 4.51 | % |
Seligman Minnesota Municipal Fund | | N/A | | N/A | | | 93,000 | | 0.27 | % |
Seligman National Municipal Fund | | N/A | | N/A | | | 2,293,000 | | 27.15 | % |
Seligman New York Municipal Fund | | N/A | | N/A | | | 267,000 | | 0.52 | % |
Seligman TargETFund 2015 | | N/A | | N/A | | | 1,018,000 | | 7.12 | % |
Seligman TargETFund 2025 | | N/A | | N/A | | | 1,063,000 | | 36.36 | % |
Seligman TargETFund 2035 | | N/A | | N/A | | | 327,000 | | 28.88 | % |
Seligman TargETFund 2045 | | N/A | | N/A | | | 191,000 | | 0.68 | % |
Seligman TargETFund Core | | N/A | | N/A | | | 1,786,000 | | 4.96 | % |
Threadneedle Global Equity Income Fund | | 94,000 | | 4.13 | % | | 7,000 | | 1.18 | % |
Threadneedle International Opportunity Fund | | 735,000 | | 3.81 | % | | 59,000 | | 0.78 | % |
PAYMENTS TO FINANCIAL INTERMEDIARIES
The distributor and its affiliates make or support additional cash payments out of their own resources (including profits earned from providing services to the funds) to financial intermediaries, including payment to affiliated broker-dealers, in connection with agreements between the distributor and financial intermediaries pursuant to which these financial intermediaries sell fund shares and provide services to their clients who are shareholders of the funds. These payments do not change the price paid by investors and fund shareholders for the purchase or ownership of shares of the funds, and these payments are not reflected in the fees and expenses of the funds, as they are not paid by the funds. These payments are in addition to fees paid by the funds to the distributor under 12b-1 plans, which fees may be used to compensate financial intermediaries for the distribution of fund shares and the servicing of fund shareholders, or paid by the funds to the transfer agent under the transfer agent agreement or plan administration agreement, which fees may be used to support networking or servicing fees to compensate financial intermediaries for supporting shareholder account maintenance, sub-accounting, plan recordkeeping or other services provided directly by the financial intermediary to shareholders or plans and plan participants, including retirement plans, 529 plans, Health Savings Account plans, or other plans, where participants beneficially own shares of the funds.
These payments are typically made pursuant to an agreement between the distributor and the financial intermediary, and are typically made in support of marketing and sales support efforts or program and shareholder servicing, as further described below. These payments are usually calculated based on a percentage of fund assets owned through the financial intermediary and/or as a percentage of fund sales attributable to the financial intermediary. Certain financial intermediaries require flat fees instead of or in addition to these asset-based fees as compensation for including or maintaining funds on their platforms, and, in certain situations, may require the reimbursement of ticket or operational charges — fees that a financial intermediary charges its representatives for effecting transactions in the funds. The amount of payment varies by financial intermediary, and often is significant. In addition, the amount of payments may differ based upon the type of fund sold or maintained; for instance, the amount of payments for an equity fund may differ from payments for a money-market or fixed income fund. Asset-based payments generally will be made in a range of up to 0.25% of assets or 0.25% of sales or some combination thereof. Exceptions to these general ranges will be considered on a case-by-case basis. Flat fees or annual minimum fees required by a financial intermediary in addition to such asset-based fees, are considered on a case-by-case basis.
155
Marketing and Sales Support
Payments may be paid in support of retail, institutional, plan or other fee-based advisory program distribution efforts. These payments are typically made by the distributor in its efforts to advertise to and/or educate the financial intermediary’s personnel, including its registered representatives, about the fund. As a result of these payments, the distributor may obtain a higher profile and greater visibility for the fund within the financial intermediary’s organization, including placement of the fund on the financial intermediary’s preferred or recommended list. The distributor may also obtain greater access to sales meetings, sales representatives, and management representatives of the financial intermediary, including potentially having increased opportunity for fund representatives to participate in and/or present at conferences or seminars, sales or training programs for invited registered representatives and their clients and other events sponsored by the financial intermediary.
Program and Shareholder Servicing
Payments may be made in support of recordkeeping, reporting, transaction processing, and other plan administration services provided by a financial intermediary to or through retirement plans, 529 plans, Health Savings Account plans, or other plans or fee-based advisory programs but may also be made in support of certain retail advisory programs, including wrap programs. A financial intermediary may perform program services itself or may arrange with a third party to perform program services. These payments may also include services rendered in connection with fund selection and monitoring, employee enrollment and education, plan balance rollover or separation, or other similar services.
Below is a list of firms that the distributor and its affiliates make payments to for the above described services.
| | • | | ADP Broker-Dealer, Inc. |
| | • | | American Century Investment Management, Inc. and American Century Investment Services, Inc. |
| | • | | Ameriprise Financial Services, Inc./American Enterprise Investment Services, Inc. |
| | • | | Associated Securities Corp. |
| | • | | Benefit Plans Administrative Services, Inc. and Community Bank System, Inc. |
| | • | | Boston Financial Data Services, Inc. |
| | • | | Charles Schwab Trust Company |
| | • | | Charles Schwab and Company, Inc. |
| | • | | Citigroup Global Markets Inc. |
| | • | | Columbia Management Advisors, LLC and Columbia Management Distributors, Inc. |
| | • | | Digital Retirement Solutions, Inc. |
| | • | | Fidelity Brokerage Services/National Financial Services |
| | • | | Fidelity Investments Institutional Operations Company/Fidelity Investments Institutional Service Company |
156
| | • | | Hartford Life Insurance Company |
| | • | | Hartford Securities Distribution Company, Inc. |
| | • | | ING Institutional Plan Services, LLC |
| | • | | ING Life Insurance and Annuity Company |
| | • | | J.P. Morgan Chase Bank, N.A. |
| | • | | J.P. Morgan Retirement Plan Services, LLC |
| | • | | John Hancock Life Insurance Company |
| | • | | John Hancock Life Insurance Company New York |
| | • | | Lincoln Retirement Services Company LLC |
| | • | | LPL Financial Corporation |
| | • | | Massachusetts Mutual Life Insurance Company (Mass Mutual/MML) |
| | • | | Mercer HR Services, LLC |
| | • | | Merrill Lynch Life Insurance Company |
| | • | | Merrill Lynch, Pierce, Fenner & Smith, Inc. |
| | • | | Mid Atlantic Capital Corporation |
| | • | | Minnesota Life Insurance Company |
| | • | | ML Life Insurance Company of New York |
| | • | | Morgan Stanley & Co., Inc. |
| | • | | MSCS Financial Services, LLC |
| | • | | Mutual Service Corporation |
| | • | | Nationwide Financial Services, Inc. |
| | • | | Newport Retirement Services, Inc. |
| | • | | NYLife Distributors LLC |
| | • | | Principal Life Insurance Company |
| | • | | Prudential Insurance Company of America/Prudential Investments Retirement Services |
| | • | | Prudential Investment Management Services LLC/Prudential Investments LLC |
157
| | • | | Raymond James & Associates, Inc. and Raymond James Financial Services, Inc. |
| | • | | RBC Capital Markets Corporation |
| | • | | The Retirement Plan Company, LLC |
| | • | | Securities America, Inc. |
| | • | | Standard Retirement Services, Inc. |
| | • | | TD Ameritrade Trust Company |
| | • | | The Princeton Retirement Group, Inc. and GPC Securities, Inc. |
| | • | | UBS Financial Services, Inc. |
| | • | | UVest Financial Services Group, Inc. |
| | • | | The Vanguard Group, Inc. |
| | • | | Vertical Management Systems, Inc. |
| | • | | Waterstone Financial Group, Inc. |
| | • | | Wells Fargo Advisors Financial Network, LLC |
| | • | | Wilmington Trust Company |
| | • | | Wilmington Trust Retirement and Institutional Services Company |
Other Payments
The distributor and its affiliates may separately pay financial intermediaries in order to participate in and/or present at conferences or seminars, sales or training programs for invited registered representatives and other financial intermediary employees, client and investor events and other financial intermediary-sponsored events, and for travel expenses, including lodging incurred by registered representatives and other employees in connection with prospecting, asset retention and due diligence trips. The amount of these payments varies depending upon the nature of the event. The distributor and its affiliates make payments for such events as they deem appropriate, subject to internal guidelines and applicable law.
From time to time, to the extent permitted by SEC and NASD rules and by other applicable laws and regulations, the distributor and its affiliates may make other reimbursements or payment to financial intermediaries or their registered representatives, including non-cash compensation, in the form of gifts of nominal value, occasional meals, tickets, or other entertainment, support for due diligence trips, training and educational meetings or conference sponsorships, support for recognition programs, and other forms of non-cash compensation permissible under regulations to which these financial intermediaries and their representatives are subject. To the extent these are made as payments instead of reimbursement, they may provide profit to the financial intermediary to the extent the cost of such services was less than the actual expense of the service.
158
The financial intermediary through which you are purchasing or own shares of funds has been authorized directly or indirectly by the distributor to sell funds and/or to provide services to you as a shareholder of funds. Investors and current shareholders may wish to take such payment arrangements into account when considering and evaluating any recommendations they receive relating to fund shares.
If you have questions regarding the specific details regarding the payments your financial intermediary may receive from the distributor or its affiliates related to your purchase or ownership of funds, please contact your financial intermediary.
CUSTODIAN SERVICES
The funds’ securities and cash are held pursuant to a custodian agreement with JPMorgan Chase Bank, N.A. (JPMorgan), 1 Chase Manhattan Plaza, 19th Floor, New York, NY 10005. The custodian is permitted to deposit some or all of their securities in central depository systems as allowed by federal law. For its services, each fund pays its custodian a maintenance charge and a charge per transaction in addition to reimbursing the custodian’s out-of-pocket expenses.
As part of this arrangement, securities purchased outside the United States are maintained in the custody of various foreign branches of JPMorgan or in other financial institutions as permitted by law and by the fund’s custodian agreement.
BOARD SERVICES CORPORATION
The funds have an agreement with Board Services Corporation (Board Services) located at 901 Marquette Avenue South, Suite 2810, Minneapolis, MN 55402. This agreement sets forth the terms of Board Services’ responsibility to serve as an agent of the funds for purposes of administering the payment of compensation to each Independent Director, to provide office space for use by the funds and their boards, and to provide any other services to the boards or the independent members, as may be reasonably requested.
Organizational Information
Each fund is an open-end management investment company. The funds’ headquarters are at 901 S. Marquette Ave., Suite 2810, Minneapolis, MN 55402-3268.
SHARES
The shares of a fund represent an interest in that fund’s net assets only (and profits or losses), and, in the event of liquidation, each share of a fund would have the same rights to dividends and assets as every other share of that fund.
VOTING RIGHTS
As a shareholder in a fund, you have voting rights over the fund’s management and fundamental policies. You are entitled to vote based on your total dollar interest in the fund. Each class, if applicable, has exclusive voting rights with respect to matters for which separate class voting is appropriate under applicable law. Shares of the RiverSource and Threadneedle funds have cumulative voting rights with respect to the election of Board members. This means that you have as many votes as the dollar amount you own, including the fractional amount, multiplied by the number of members to be elected, all of which may, in the shareholder’s discretion, be voted for a single director. The Seligman funds do not provide for cumulative voting rights.
DIVIDEND RIGHTS
Dividends paid by a fund, if any, with respect to each applicable class of shares will be calculated in the same manner, at the same time, on the same day, and will be in the same amount, except for differences resulting from differences in fee structures.
SHAREHOLDER LIABILITY
For funds organized as Massachusetts business trusts, under Massachusetts law, shareholders of a Massachusetts business trust may, under certain circumstances, be held personally liable as partners for its obligation. However, the Declaration of Trust that establishes a trust, a copy of which, together with all amendments thereto (the “Declaration of Trust”), is on file with the office of the Secretary of the Commonwealth of Massachusetts for each applicable fund, contains an express disclaimer of shareholder liability for acts or obligations of the Trust, or of any fund in the Trust. The Declaration of Trust provides that, if any shareholder (or former shareholder) of a fund in the Trust is charged or held to be personally liable for any obligation or liability of the Trust, or of any fund in the Trust, solely by reason of being or having been a shareholder and not because of such shareholder’s acts or omissions or for some other reason, the Trust (upon request of the shareholder) shall assume the defense against such charge and satisfy any judgment thereon, and the shareholder or former shareholder (or the heirs, executors, administrators or other legal representatives thereof, or in the case of a corporation or other entity, its corporate or other general successor) shall be entitled (but solely out of the assets of the fund of which such shareholder or former shareholder is or was the holder of shares) to be held harmless from and indemnified against all loss and expense arising from such liability.
159
The Declaration of Trust also provides that the Trust may maintain appropriate insurance (for example, fidelity bond and errors and omissions insurance) for the protection of the Trust, its shareholders, Trustees, officers, employees and agents covering possible tort and other liabilities. Thus, the risk of a shareholder incurring financial loss on account of shareholder liability is limited to circumstances in which both inadequate insurance existed and the Trust itself was unable to meet its obligations.
The Declaration of Trust further provides that obligations of the Trust are not binding upon the Trustees individually, but only upon the assets and property of the Trust, and that the Trustees will not be liable for any action or failure to act, errors of judgment, or mistakes of fact or law, but nothing in the Declaration of Trust or other agreement with a Trustee protects a Trustee against any liability to which he or she would otherwise be subject by reason of his or her willful bad faith, gross negligence, or reckless disregard of the duties involved in the conduct of his or her office. By becoming a shareholder of the fund, each shareholder shall be expressly held to have assented to and agreed to be bound by the provisions of the Declaration of Trust.
Table 25. Fund History Table
| | | | | | | | | | | | |
Fund* | | Date of Organization | | Date Began
Operations | | Form of
Organization | | State of
Organization | | Fiscal
Year
End | | Diversified** |
Columbia Frontier Fund, Inc. | | 7/9/84 | | 12/10/84 | | Corporation | | MD | | 10/31 | | Yes |
Columbia Seligman Communications and Information Fund, Inc.(19) | | 10/8/82 | | 6/23/83 | | Corporation | | MD | | 12/31 | | Yes |
RiverSource Bond Series, Inc.(2) | | 4/29/81, 4/8/86(1) | | | | Corporation | | NV/MN | | 7/31 | | |
Columbia Floating Rate Fund | | | | 2/16/06 | | | | | | | | Yes |
Columbia Income Opportunities Fund | | | | 6/19/03 | | | | | | | | Yes |
Columbia Inflation Protected Securities Fund | | | | 3/4/04 | | | | | | | | No |
Columbia Limited Duration Credit
Fund(19) | | | | 6/19/03 | | | | | | | | Yes |
RiverSource California Tax-Exempt Trust | | 4/7/86 | | | | Business Trust | | MA | | 8/31(10) | | |
RiverSource California Tax-Exempt Fund | | | | 8/18/86 | | | | | | | | No |
RiverSource Dimensions Series, Inc. | | 2/20/68, 4/8/86(1) | | | | Corporation | | NV/MN | | 7/31 | | |
RiverSource Disciplined Small and Mid Cap Equity Fund | | | | 5/18/06 | | | | | | | | Yes |
RiverSource Disciplined Small Cap Value Fund | | | | 2/16/06 | | | | | | | | Yes |
RiverSource Diversified Income Series,
Inc.(2) | | 6/27/74, 4/8/86(1) | | | | Corporation | | NV/MN | | 8/31 | | |
Columbia Diversified Bond Fund(3) | | | | 10/3/74 | | | | | | | | Yes |
RiverSource Equity Series, Inc. | | 3/18/57, 4/8/86(1) | | | | Corporation | | NV/MN | | 11/30 | | |
Columbia Mid Cap Growth Opportunity Fund(4),(19) | | | | 6/4/57 | | | | | | | | Yes |
RiverSource Global Series, Inc. | | 10/28/88 | | | | Corporation | | MN | | 10/31 | | |
Columbia Absolute Return Currency and Income Fund | | | | 6/15/06 | | | | | | | | Yes |
Columbia Emerging Markets Bond Fund | | | | 2/16/06 | | | | | | | | No |
Columbia Global Bond Fund | | | | 3/20/89 | | | | | | | | No |
Columbia Emerging Markets Opportunity Fund(4),(5),(11),(19) | | | | 11/13/96 | | | | | | | | Yes |
Columbia Global Equity
Fund(5),(6),(11) | | | | 5/29/90 | | | | | | | | Yes |
Columbia Global Extended Alpha Fund | | | | 8/1/08 | | | | | | | | Yes |
Threadneedle Global Equity Income Fund | | | | 8/1/08 | | | | | | | | Yes |
RiverSource Government Income Series, Inc. | | 3/12/85 | | | | Corporation | | MN | | 5/31 | | |
Columbia U.S. Government Mortgage Fund | | | | 2/14/02 | | | | | | | | Yes |
RiverSource Short Duration U.S. Government Fund(3) | | | | 8/19/85 | | | | | | | | Yes |
Columbia Government Money Market Fund, Inc.(17) | | 6/29/76 | | 1/31/77 | | Corporation | | MD | | 12/31 | | Yes |
RiverSource High Yield Income Series, Inc. | | 8/17/83 | | | | Corporation | | MN | | 5/31 | | |
Columbia High Yield Bond Fund(3) | | | | 12/8/83 | | | | | | | | Yes |
RiverSource Income Series, Inc. | | 2/10/45; 4/8/86(1) | | | | Corporation | | NV/MN | | 1/31(7) | | |
Columbia Income Builder Fund(19) | | | | 2/16/06 | | | | | | | | Yes |
Columbia Income Builder Fund II(19) | | | | 2/16/06 | | | | | | | | Yes |
Columbia Income Builder Fund III(19) | | | | 2/16/06 | | | | | | | | Yes |
RiverSource International Managers Series, Inc.(2) | | 5/9/01 | | | | Corporation | | MN | | 10/31 | | |
Columbia Multi-Advisor International Value Fund(11),(19) | | | | 9/28/01 | | | | | | | | Yes |
RiverSource Partners International Select Growth Fund(11) | | | | 9/28/01 | | | | | | | | Yes |
RiverSource Partners International Small Cap Fund(11) | | | | 10/3/02 | | | | | | | | Yes |
RiverSource International Series, Inc.(2) | | 7/18/84 | | | | Corporation | | MN | | 10/31 | | |
Columbia Asia Pacific ex-Japan
Fund(19) | | | | 7/15/09 | | | | | | | | Yes |
Columbia European Equity Fund(5),(11) | | | | 6/26/00 | | | | | | | | Yes |
RiverSource Disciplined International Equity Fund | | | | 5/18/06 | | | | | | | | Yes |
Threadneedle International Opportunity Fund(4),(5),(11) | | | | 11/15/84 | | | | | | | | Yes |
RiverSource Investment Series, Inc. | | 1/18/40; 4/8/86(1) | | | | Corporation | | NV/MN | | 9/30 | | |
Columbia Diversified Equity Income Fund | | | | 10/15/90 | | | | | | | | Yes |
Columbia Large Quantitative Growth Fund(19) | | | | 5/17/07 | | | | | | | | Yes |
Columbia Large Quantitative Value Fund(19) | | | | 8/1/08 | | | | | | | | Yes |
Columbia Mid Cap Value Opportunity Fund(19) | | | | 2/14/02 | | | | | | | | Yes |
RiverSource Balanced Fund(4) | | | | 4/16/40 | | | | | | | | Yes |
160
| | | | | | | | | | | | |
RiverSource Large Cap Series, Inc.(2) | | 5/21/70, 4/8/86(1) | | | | Corporation | | NV/MN | | 7/31 | | |
Columbia Large Core Quantitative
Fund(4),(19) | | | | 4/24/03 | | | | | | | | Yes |
RiverSource Managers Series, Inc.(2) | | 3/20/01 | | | | Corporation | | MN | | 5/31 | | |
Columbia Multi-Advisor Small Cap Value Fund(11),(19) | | | | 6/18/01 | | | | | | | | Yes |
RiverSource Partners Fundamental Value Fund(11) | | | | 6/18/01 | | | | | | | | Yes |
RiverSource Market Advantage Series, Inc. | | 8/25/89 | | | | Corporation | | MN | | 1/31 | | |
Columbia Portfolio Builder Conservative Fund | | | | 3/4/04 | | | | | | | | Yes |
Columbia Portfolio Builder Moderate Conservative Fund | | | | 3/4/04 | | | | | | | | Yes |
Columbia Portfolio Builder Moderate Fund | | | | 3/4/04 | | | | | | | | Yes |
Columbia Portfolio Builder Moderate Aggressive Fund | | | | 3/4/04 | | | | | | | | Yes |
Columbia Portfolio Builder Aggressive Fund | | | | 3/4/04 | | | | | | | | Yes |
Columbia Portfolio Builder Total Equity Fund | | | | 3/4/04 | | | | | | | | Yes |
RiverSource S&P 500 Index Fund | | | | 10/25/99 | | | | | | | | Yes |
RiverSource Small Company Index Fund | | | | 8/19/96 | | | | | | | | Yes |
RiverSource Money Market Series, Inc. | | 8/22/75; 4/8/86(1) | | | | Corporation | | NV/MN | | 7/31 | | |
Columbia Money Market Fund(19) | | | | 10/6/75 | | | | | | | | Yes |
RiverSource Sector Series, Inc. | | 3/25/88 | | | | Corporation | | MN | | 6/30 | | |
Columbia Dividend Opportunity
Fund(8) | | | | 8/1/88 | | | | | | | | Yes |
RiverSource Real Estate Fund | | | | 3/4/04 | | | | | | | | No |
RiverSource Selected Series, Inc. | | 10/5/84 | | | | Corporation | | MN | | 3/31 | | |
RiverSource Precious Metals and Mining Fund(9) | | | | 4/22/85 | | | | | | | | No |
RiverSource Series Trust(14) | | 1/27/06 | | | | Business Trust | | MA | | 4/30 | | |
Columbia 120/20 Contrarian Equity Fund | | | | 10/18/07 | | | | | | | | Yes |
Columbia Marsico Flexible Capital Fund | | | | 9/28/10 | | | | | | | | No |
Columbia Recovery and Infrastructure Fund | | | | 2/19/09 | | | | | | | | No |
Columbia Retirement Plus 2010 Fund | | | | 5/18/06 | | | | | | | | Yes |
Columbia Retirement Plus 2015 Fund | | | | 5/18/06 | | | | | | | | Yes |
Columbia Retirement Plus 2020 Fund | | | | 5/18/06 | | | | | | | | Yes |
Columbia Retirement Plus 2025 Fund | | | | 5/18/06 | | | | | | | | Yes |
Columbia Retirement Plus 2030 Fund | | | | 5/18/06 | | | | | | | | Yes |
Columbia Retirement Plus 2035 Fund | | | | 5/18/06 | | | | | | | | Yes |
Columbia Retirement Plus 2040 Fund | | | | 5/18/06 | | | | | | | | Yes |
Columbia Retirement Plus 2045 Fund | | | | 5/18/06 | | | | | | | | Yes |
RiverSource Short Term Investments Series, Inc.(15) | | 4/23/68, 4/8/86(1) | | | | Corporation | | NV/MN | | 7/31 | | |
Columbia Short-Term Cash Fund | | | | 9/26/06 | | | | | | | | Yes |
RiverSource Special Tax-Exempt Series Trust | | 4/7/86 | | | | Business Trust | | MA | | 8/31(10) | | |
Columbia Minnesota Tax-Exempt Fund | | | | 8/18/86 | | | | | | | | No |
RiverSource New York Tax-Exempt Fund | | | | 8/18/86 | | | | | | | | No |
RiverSource Strategic Allocation Series, Inc.(2) | | 10/9/84 | | | | Corporation | | MN | | 9/30 | | |
Columbia Strategic Allocation Fund(4) | | | | 1/23/85 | | | | | | | | Yes |
RiverSource Strategic Income Allocation Fund | | | | 5/17/07 | | | | | | | | Yes |
RiverSource Strategy Series, Inc. | | 1/24/84 | | | | Corporation | | MN | | 3/31 | | |
Columbia Equity Value Fund | | | | 5/14/84 | | | | | | | | Yes |
RiverSource Tax-Exempt Income Series, Inc.(2) | | 12/21/78; 4/8/86(1) | | | | Corporation | | NV/MN | | 11/30 | | |
RiverSource Tax-Exempt High Income Fund(4) | | | | 5/7/79 | | | | | | | | Yes |
RiverSource Tax-Exempt Series, Inc. | | 9/30/76, 4/8/86(1) | | | | Corporation | | NV/MN | | 11/30 | | |
Columbia AMT-Free Tax-Exempt Bond Fund(19) | | | | 11/24/76 | | | | | | | | Yes |
RiverSource Intermediate Tax-Exempt Fund | | | | 11/13/96 | | | | | | | | Yes |
RiverSource Variable Series Trust(12) | | 9/11/07 | | | | Business Trust | | MA | | 12/31 | | |
Disciplined Asset Allocation Portfolios – Aggressive | | | | 5/1/08 | | | | | | | | Yes |
Disciplined Asset Allocation Portfolios – Conservative | | | | 5/1/08 | | | | | | | | Yes |
Disciplined Asset Allocation Portfolios – Moderate | | | | 5/1/08 | | | | | | | | Yes |
Disciplined Asset Allocation Portfolios – Moderately Aggressive | | | | 5/1/08 | | | | | | | | Yes |
Disciplined Asset Allocation Portfolios – Moderately Conservative | | | | 5/1/08 | | | | | | | | Yes |
RiverSource Variable Portfolio – Balanced Fund(4) | | | | 4/30/86 | | | | | | | | Yes |
RiverSource Variable Portfolio – Cash Management Fund | | | | 10/31/81 | | | | | | | | Yes |
RiverSource Variable Portfolio – Core Equity Fund | | | | 9/10/04 | | | | | | | | Yes |
RiverSource Variable Portfolio – Diversified Bond Fund(3) | | | | 10/13/81 | | | | | | | | Yes |
RiverSource Variable Portfolio – Diversified Equity Income Fund | | | | 9/15/99 | | | | | | | | Yes |
RiverSource Variable Portfolio – Dynamic Equity Fund(5),(16) | | | | 10/13/81 | | | | | | | | Yes |
RiverSource Variable Portfolio – Global Bond Fund | | | | 5/1/96 | | | | | | | | No |
RiverSource Variable Portfolio – Global Inflation Protected Securities
Fund(13) | | | | 9/13/04 | | | | | | | | No |
RiverSource Variable Portfolio – High Yield Bond Fund(3) | | | | 5/1/96 | | | | | | | | Yes |
RiverSource Variable Portfolio – Income Opportunities Fund | | | | 6/1/04 | | | | | | | | Yes |
RiverSource Variable Portfolio – Mid Cap Growth Fund(4) | | | | 5/1/01 | | | | | | | | Yes |
RiverSource Variable Portfolio – Mid Cap Value Fund | | | | 5/2/05 | | | | | | | | Yes |
RiverSource Variable Portfolio – S&P 500 Index Fund | | | | 5/1/00 | | | | | | | | Yes |
RiverSource Variable Portfolio – Short Duration U.S. Government Fund(3) | | | | 9/15/99 | | | | | | | | Yes |
161
| | | | | | | | | | | | |
Seligman Variable Portfolio – Growth Fund(16) | | | | 9/15/99 | | | | | | | | Yes |
Seligman Variable Portfolio – Larger-Cap Value Fund(16) | | | | 02/4/04 | | | | | | | | Yes |
Seligman Variable Portfolio – Smaller-Cap Value Fund(16) | | | | 9/15/99 | | | | | | | | Yes |
Threadneedle Variable Portfolio –Emerging Markets Fund(4),(5),(11) | | | | 5/1/00 | | | | | | | | Yes |
Threadneedle Variable Portfolio –International Opportunity
Fund(4),(5),(11) | | | | 1/13/92 | | | | | | | | Yes |
Variable Portfolio – Davis New York Venture Fund(11),(18) | | | | 5/1/06 | | | | | | | | Yes |
Variable Portfolio – Goldman Sachs Mid Cap Value Fund(11),(18) | | | | 2/4/04 | | | | | | | | Yes |
Variable Portfolio – Partners Small Cap Value Fund(11),(18) | | | | 8/14/01 | | | | | | | | Yes |
Seligman Capital Fund, Inc. | | 10/21/68 | | 10/9/69 | | Corporation | | MD | | 12/31 | | Yes |
Seligman Global Fund Series, Inc. | | 11/22/91 | | | | Corporation | | MD | | 10/31 | | |
Columbia Seligman Global Technology Fund(19) | | | | 5/23/94 | | | | | | | | Yes |
Seligman Growth Fund, Inc. | | 1/26/37 | | 4/1/37 | | Corporation | | MD | | 12/31 | | Yes |
Seligman LaSalle Real Estate Fund Series, Inc. | | 5/30/03 | | | | Corporation | | MD | | 12/31 | | |
RiverSource LaSalle Global Real Estate Fund(17) | | | | 12/29/06 | | | | | | | | No |
RiverSource LaSalle Monthly Dividend Real Estate Fund(17) | | | | 7/16/03 | | | | | | | | Yes |
Seligman Municipal Fund Series, Inc. | | 8/8/83 | | | | Corporation | | MD | | 9/30 | | |
Seligman National Municipal Class | | | | 12/31/83 | | | | | | | | Yes |
Seligman Minnesota Municipal Class | | | | 12/30/83 | | | | | | | | No |
Seligman New York Municipal Class | | | | 1/3/84 | | | | | | | | No |
Seligman Municipal Series Trust | | 7/25/84 | | | | Business Trust | | MA | | 9/30 | | |
Seligman California Municipal High-Yield Series | | | | 11/20/84 | | | | | | | | No |
Seligman California Municipal Quality Series | | | | 11/20/84 | | | | | | | | No |
Seligman Portfolios, Inc. | | 7/1/87 | | | | Corporation | | MD | | 12/31 | | |
Seligman Capital Portfolio | | | | 6/21/88 | | | | | | | | Yes |
Seligman Common Stock Portfolio | | | | 6/21/88 | | | | | | | | Yes |
Seligman Communications and Information Portfolio | | | | 10/11/94 | | | | | | | | Yes |
Seligman Global Technology Portfolio | | | | 5/1/96 | | | | | | | | Yes |
Seligman International Growth Portfolio | | | | 5/3/93 | | | | | | | | Yes |
Seligman Investment Grade Fixed Income Portfolio | | | | 6/21/88 | | | | | | | | Yes |
Seligman Large-Cap Value Portfolio | | | | 5/1/98 | | | | | | | | Yes |
Seligman Smaller-Cap Value Portfolio | | | | 5/1/98 | | | | | | | | Yes |
Seligman TargetHorizon ETF Portfolios, Inc. | | 7/6/05 | | | | Corporation | | MD | | 9/30 | | |
Seligman TargETFund 2015 | | | | 10/3/05 | | | | | | | | Yes |
Seligman TargETFund 2025 | | | | 10/3/05 | | | | | | | | Yes |
Seligman TargETFund 2035 | | | | 10/2/06 | | | | | | | | Yes |
Seligman TargETFund 2045 | | | | 10/2/06 | | | | | | | | Yes |
Seligman TargETFund Core | | | | 10/3/05 | | | | | | | | Yes |
Seligman Value Fund Series, Inc. | | 1/27/97 | | | | Corporation | | MD | | 12/31 | | |
Columbia Select Large-Cap Value
Fund(19) | | | | 4/25/97 | | | | | | | | Yes |
Columbia Select Smaller-Cap Value Fund(19) | | | | 4/25/97 | | | | | | | | Yes |
| * | Effective Oct. 1, 2005 American Express Funds changed its name to RiverSource funds and the names Threadneedle and Partners were removed from fund names. Effective Sept. 27, 2010, several of the funds were renamed from RiverSource, Seligman and Threadneedle to Columbia. |
| ** | If a Non-diversified fund is managed as if it were a diversified fund for a period of three years, its status under the 1940 Act will convert automatically from Non-diversified to diversified. A diversified fund may convert to Non-diversified status only with shareholder approval. |
| (1) | Date merged into a Minnesota corporation incorporated on April 8, 1986. |
| (2) | Effective April 21, 2006, AXP Discovery Series, Inc. changed its name to RiverSource Bond Series, Inc.; AXP Fixed Income Series, Inc. changed its name to RiverSource Diversified Income Series, Inc.; AXP Growth Series, Inc. changed its name to RiverSource Large Cap Series, Inc.; AXP High Yield Tax-Exempt Series, Inc. changed its name to RiverSource Tax-Exempt Income Series, Inc.; AXP Managed Series, Inc. changed its name to RiverSource Strategic Allocation Series, Inc.; AXP Partners International Series, Inc. changed its name to RiverSource International Managers Series, Inc.; AXP Partners Series, Inc. changed its name to RiverSource Managers Series, Inc.; and for all other corporations and business trusts, AXP was replaced with RiverSource in the registrant name. |
| (3) | Effective June 27, 2003, Bond Fund changed its name to Diversified Bond Fund, Federal Income Fund changed its name to Short Duration U.S. Government Fund and Extra Income Fund changed its name to High Yield Bond Fund, Variable Portfolio – Bond Fund changed its name to Variable Portfolio – Diversified Bond Fund, Variable Portfolio – Extra Income Fund changed its name to Variable Portfolio – High Yield Bond Fund and Variable Portfolio – Federal Income Fund changed its name to Variable Portfolio – Short Duration U.S. Government Fund. |
162
| (4) | Effective Oct. 1, 2005, Equity Select Fund changed its name to Mid Cap Growth Fund, High Yield Tax-Exempt Fund changed its name to Tax-Exempt High Income Fund, Managed Allocation Fund changed its name to Strategic Allocation Fund, Mutual changed its name to Balanced Fund, Quantitative Large Cap Equity Fund changed its name to Disciplined Equity Fund, and Threadneedle International Fund changed its name to International Opportunity Fund. Variable Portfolio – Equity Select Fund changed its name to Variable Portfolio – Mid Cap Growth Fund, Variable Portfolio – Threadneedle Emerging Markets Fund changed its name to Variable Portfolio – Emerging Markets Fund, Variable Portfolio – Threadneedle International Fund changed its name to Variable Portfolio –International Opportunity Fund, and Variable Portfolio – Managed Fund changed its name to Variable Portfolio – Balanced Fund. |
| (5) | Effective July 9, 2004, Emerging Markets Fund changed its name to Threadneedle Emerging Markets Fund, European Equity Fund changed its name to Threadneedle European Equity Fund, Global Equity Fund changed its name to Threadneedle Global Equity Fund, and International Fund changed its name to Threadneedle International Fund, Variable Portfolio – Capital Resource Fund changed its name to Variable Portfolio – Large Cap Equity Fund, Variable Portfolio – Emerging Markets Fund changed its name to Variable Portfolio – Threadneedle Emerging Markets Fund and Variable Portfolio – International Fund changed its name to Variable Portfolio – Threadneedle International Fund. |
| (6) | Effective Oct. 20, 2003, Global Growth Fund changed its name to Global Equity Fund. |
| (7) | Effective Jan. 31, 2008, the fiscal year end was changed from May 31 to Jan. 31. |
| (8) | Effective Feb. 18, 2004, Utilities Fund changed its name to Dividend Opportunity Fund. |
| (9) | Effective Nov. 1, 2006, Precious Metals Fund changed its name to Precious Metals and Mining Fund. |
| (10) | Effective April 13, 2006, the fiscal year end was changed from June 30 to Aug. 31. |
| (11) | Effective March 31, 2008, RiverSource Emerging Markets Fund changed its name to Threadneedle Emerging Markets Fund; RiverSource Global Equity Fund changed its name to Threadneedle Global Equity Fund; RiverSource European Equity Fund changed its name to Threadneedle European Equity Fund; RiverSource International Opportunity Fund changed its name to Threadneedle International Opportunity Fund; RiverSource International Aggressive Growth Fund changed its name to RiverSource Partners International Select Growth Fund; RiverSource International Select Value Fund changed its name to RiverSource Partners International Select Value Fund; RiverSource International Small Cap Fund changed its name to RiverSource Partners International Small Cap Fund; RiverSource Fundamental Value Fund changed its name to RiverSource Partners Fundamental Value Fund; RiverSource Small Cap Value Fund changed its name to RiverSource Partners Small Cap Value Fund; RiverSource Variable Portfolio – Fundamental Value Fund changed its name to RiverSource Partners Variable Portfolio – Fundamental Value Fund; RiverSource Variable Portfolio – Select Value Fund changed its name to RiverSource Partners Variable Portfolio – Select Value Fund; and RiverSource Variable Portfolio – Small Cap Value Fund changed its name to RiverSource Partners Variable Portfolio – Small Cap Value Fund. |
| (12) | Prior to January 2008, the assets of the funds in RiverSource Variable Series Trust were held by funds organized under six separate Minnesota Corporations. |
| (13) | Effective June 8, 2005, Variable Portfolio – Inflation Protected Securities Fund changed its name to Variable Portfolio – Global Inflation Protected Securities Fund. |
| (14) | Prior to September 11, 2007, RiverSource Series Trust was known as RiverSource Retirement Series Trust. |
| (15) | Prior to April 21, 2006, RiverSource Short Term Investments Series, Inc. was known as AXP Stock Series, Inc. |
| (16) | Effective May 1, 2009, RiverSource Variable Portfolio – Growth Fund changed its name to Seligman Variable Portfolio – Growth Fund, RiverSource Variable Portfolio – Large Cap Equity Fund changed its name to RiverSource Variable Portfolio – Dynamic Equity Fund, RiverSource Variable Portfolio – Large Cap Value Fund changed its name to Seligman Variable Portfolio – Larger-Cap Value Fund, and RiverSource Variable Portfolio – Small Cap Advantage Fund changed its name to Seligman Variable Portfolio – Smaller-Cap Value Fund. |
| (17) | Effective Sept. 25, 2009, Seligman Cash Management Fund, Inc. changed its name to RiverSource Government Money Market Fund, Inc.; Seligman LaSalle Global Real Estate Fund changed its name to RiverSource LaSalle Global Real Estate Fund; and Seligman LaSalle Monthly Dividend Real Estate Fund changed its name to RiverSource LaSalle Monthly Dividend Real Estate Fund. |
163
| (18) | Effective May 1, 2010, RiverSource Partners Variable Portfolio – Fundamental Value Fund changed its name to Variable Portfolio – Davis New York Venture Fund; RiverSource Partners Variable Portfolio – Select Value Fund changed its name to Variable Portfolio – Goldman Sachs Mid Cap Value Fund; and RiverSource Partners Variable Portfolio – Small Cap Value Fund changed its name to Variable Portfolio – Partners Small Cap Value Fund. |
| (19) | Effective Sept. 27, 2010, RiverSource Limited Duration Bond Fund changed its name to Columbia Limited Duration Credit Fund; RiverSource Mid Cap Growth Fund changed its name to Columbia Mid Cap Growth Opportunity Fund; Threadneedle Emerging Markets Fund changed its name to Columbia Emerging Markets Opportunity Fund; RiverSource Income Builder Basic Income Fund changed its name to Columbia Income Builder Fund; RiverSource Income Builder Moderate Income Builder Fund changed its name to Columbia Income Builder Fund II; RiverSource Income Builder Enhanced Fund changed its name to Columbia Income Builder Fund III; RiverSource Partners International Select Value Fund changed its name to Columbia Multi-Advisor International Value Fund; Threadneedle Asia Pacific Fund changed its name to Columbia Asia Pacific ex-Japan Fund; RiverSource Disciplined Large Cap Growth Fund changed its name to Columbia Large Growth Quantitative Fund; RiverSource Disciplined Large Cap Value Fund changed its name to Columbia Large Value Quantitative Fund; RiverSource Mid Cap Value Fund changed its name to Columbia Mid Cap Value Opportunity Fund; RiverSource Disciplined Equity Fund changed its name to Columbia Large Core Quantitative Fund; RiverSource Partners Small Cap Value Fund changed its name to Columbia Multi-Advisor Small Cap Value Fund; RiverSource Cash Management Fund changed its name to Columbia Money Market Fund; RiverSource Tax-Exempt Bond Fund changed its name to Columbia AMT-Free Tax-Exempt Bond Fund; Seligman Communications and Information Fund, Inc. changed its name to Columbia Seligman Communications and Information Fund, Inc.; Seligman Global Technology Fund changed its name to Columbia Seligman Global Technology Fund; Seligman Large-Cap Value Fund changed its name to Columbia Select Large-Cap Value Fund; and Seligman Smaller-Cap Value Fund changed its name to Columbia Select Smaller-Cap Value Fund. |
Board Members and Officers
Shareholders elect a Board that oversees a fund’s operations. The Board appoints officers who are responsible for day-to-day business decisions based on policies set by the Board. The following is a list of each fund’s Board members. Each Board member oversees 150 Columbia, RiverSource, Seligman and Threadneedle funds. Under current Board policy, members generally serve until the next regular shareholders’ meeting, until he or she reaches the mandatory retirement age established by the Board, or the fifteenth anniversary of the first Board meeting they attended as members of the Board.
On Nov. 7, 2008, Columbia Management announced the closing of its acquisition of J. & W. Seligman & Co. Incorporated (the “Seligman Acquisition”). In connection with the Seligman Acquisition, Messrs. Leroy C. Richie and John F. Maher, who were members of the Seligman funds’ Board prior to Nov. 7, 2008, began service on the Board after the Seligman Acquisition, which resulted in an overall increase from ten directors to twelve for all funds.
164
Table 26. Board Members
Independent Board Members*
| | | | | | | | |
Name, address, age | | Position held with funds and length of service | | Principal occupation during past five years | | Other present or past directorships (within past 5 years) | | Committee memberships |
Kathleen Blatz 901 S. Marquette Ave. Minneapolis, MN 55402 Age 56 | | Board member since 1/11/06 | | Chief Justice, Minnesota Supreme Court, 1998-2006; Attorney | | None | | Board Governance, Compliance, Investment Review, Audit |
| | | | |
Arne H. Carlson 901 S. Marquette Ave. Minneapolis, MN 55402 Age 76 | | Board member since 1/5/99 | | Chair, RiverSource and Threadneedle funds, 1999-2006; former Governor of Minnesota | | None | | Board Governance, Compliance, Contracts, Executive, Investment Review |
| | | | |
Pamela G. Carlton 901 S. Marquette Ave. Minneapolis, MN 55402 Age 55 | | Board member since 7/11/07 | | President, Springboard-Partners in Cross Cultural Leadership (consulting company) | | None | | Distribution, Investment Review, Audit |
| | | | |
Patricia M. Flynn 901 S. Marquette Ave. Minneapolis, MN 55402 Age 59 | | Board member since 11/1/04 | | Trustee Professor of Economics and Management, Bentley University; former Dean, McCallum Graduate School of Business, Bentley University | | None | | Board Governance, Contracts, Investment Review |
| | | | |
Anne P. Jones 901 S. Marquette Ave. Minneapolis, MN 55402 Age 75 | | Board member since 3/1/85 | | Attorney and Consultant | | None | | Board Governance, Compliance, Executive, Investment Review, Audit |
| | | | |
Jeffrey Laikind, CFA 901 S. Marquette Ave. Minneapolis, MN 55402 Age 74 | | Board member since 11/1/05 | | Former Managing Director, Shikiar Asset Management | | American Progressive Insurance; Hapoalim Securities USA, Inc. | | Distribution, Executive, Investment Review, Audit |
| | | | |
Stephen R. Lewis, Jr. 901 S. Marquette Ave. Minneapolis, MN 55402 Age 71 | | Chair of the Board since 1/1/07, Board member since 1/1/02 | | President Emeritus and Professor of Economics, Carleton College | | Valmont Industries, Inc. (manufactures irrigation systems) | | Board Governance, Compliance, Contracts, Executive, Investment Review |
| | | | |
John F. Maher 901 S. Marquette Ave. Minneapolis, MN 55402 Age 67 | | Board member since 12/10/08 | | Retired President and Chief Executive Officer and former Director, Great Western Financial Corporation (financial services), 1986-1997 | | None | | Distribution, Investment Review, Audit |
| | | | |
Catherine James Paglia 901 S. Marquette Ave. Minneapolis, MN 55402 Age 58 | | Board member since 11/1/04 | | Director, Enterprise Asset Management, Inc. (private real estate and asset management company) | | None | | Board Governance, Compliance, Contracts, Executive, Investment Review |
| | | | |
Leroy C. Richie 901 S. Marquette Ave. Minneapolis, MN 55402 Age 69 | | Board member since 11/11/08 | | Counsel, Lewis & Munday, P.C. since 2004; former Vice President and General Counsel, Automotive Legal Affairs, Chrysler Corporation | | Digital Ally, Inc. (digital imaging); Infinity, Inc. (oil and gas exploration and production); OGE Energy Corp. (energy and energy services) | | Contracts, Distribution, Investment Review |
| | | | |
| Alison Taunton-Rigby 901 S. Marquette Ave. Minneapolis, MN 55402 Age 66 | | Board member since 11/13/02 | | Chief Executive Officer and Director, RiboNovix, Inc. since 2003 (biotechnology); former President, Aquila Biopharmaceuticals | | Idera Pharmaceuticals, Inc. (biotechnology); Healthways, Inc. (health management programs) | | Contracts, Distribution, Executive, Investment Review |
| * | Mr. Laikind may be deemed, as a technical matter, an interested person of RiverSource International Managers Series, Inc. because he serves as an independent director of a broker-dealer that has executed transactions for a subadviser to this fund. |
165
Board Member Affiliated with the Investment Manager*
| | | | | | | | |
Name, address, age | | Position held with funds and length of service | | Principal occupation during past five years | | Other present or past
directorships (within past 5 years) | | Committee memberships |
William F. Truscott 53600 Ameriprise Financial Center Minneapolis, MN 55474 Age 50 | | Board member since 11/7/01, Vice President since 2002 | | Chairman of the Board, Columbia Management Investment Advisers, LLC (formerly RiverSource Investments, LLC) since May 2010 (previously President, Chairman of the Board and Chief Investment Officer, 2001-April 2010); Senior Vice president, Atlantic Funds, Columbia Funds and Nations Funds since May 2010; Chief Executive Officer, U.S. Asset Management & President – Annuities, Ameriprise Financial, Inc. since May 2010 (previously President – U.S. Asset Management and Chief Investment Officer, 2005-April 2010 and Senior Vice President – Chief Investment Officer, 2001-2005); Director, President and Chief Executive Officer, Ameriprise Certificate Company since 2006; Director, Columbia Management Investment Distributors, Inc. (formerly RiverSource Fund Distributors, Inc.) since May 2010 (previously Chairman of the Board and Chief Executive Officer, 2008-April 2010); Chairman of the Board and Chief Executive Officer, RiverSource Distributors, Inc. since 2006 | | None | | None |
| * | Interested person (as defined under the 1940 Act) by reason of being an officer, director, security holder and/or employee of the investment manager or Ameriprise Financial. |
The Board has appointed officers who are responsible for day-to-day business decisions based on policies it has established. The officers serve at the pleasure of the Board. In addition to Mr. Truscott, who is Vice President, the funds’ other officers are:
166
Table 27. Fund Officers
| | | | |
Name, address, age | | Position held with funds and length of service | | Principal occupation during past five years |
J. Kevin Connaughton One Financial Center Boston, MA 02111 Age 46 | | President since 5/1/10 | | Senior Vice President and General Manager – Mutual Fund Products, Columbia Management Investment Advisers, LLC since May 2010; President, Columbia Funds since 2009 (previously Senior Vice President and Chief Financial Officer, June 2008 - January 2009); President, Atlantic Funds and Nations Funds since 2009; Managing Director of Columbia Management Advisors, LLC, December 2004 - April 2010; Treasurer, Columbia Funds, October 2003 - May 2008; Treasurer, the Liberty Funds, Stein Roe Funds and Liberty All-Star Funds, December 2000 - December 2006; Senior Vice President – Columbia Management Advisors, LLC, April 2003 - December 2004; President, Columbia Funds, Liberty Funds and Stein Roe Funds, February 2004 - October 2004 |
| | |
Amy K. Johnson 5228 Ameriprise Financial Center Minneapolis, MN 55474 Age 45 | | Vice President since 12/5/06 | | Senior Vice President and Chief Operating Officer, Columbia Management Investment Advisers, LLC (formerly RiverSource Investments, LLC) since May 2010 (previously Chief Administrative Officer, 2009 – April 2010 and Vice President – Asset Management and Trust Company Services, 2006–2009 and Vice President – Operations and Compliance, 2004-2006); Senior Vice President, Columbia Funds, Atlantic Funds and Nations Funds since May 2010; Director of Product Development – Mutual Funds, Ameriprise Financial, Inc., 2001-2004 |
| | |
Jeffrey P. Fox 105 Ameriprise Financial Center Minneapolis, MN 55474 Age 55 | | Treasurer since 7/10/02 | | Chief Financial Officer, Columbia Management Investment Distributors, Inc. (formerly RiverSource Fund Distributors, Inc.) and of Seligman Data Corp. since 2008; Vice President – Investment Accounting, Ameriprise Financial, Inc. since 2002; Chief Financial Officer, RiverSource Distributors, Inc. since 2006 |
| | |
Scott R. Plummer 5228 Ameriprise Financial Center Minneapolis, MN 55474 Age 51 | | Vice President, General Counsel and Secretary since 12/5/06 | | Chief Legal Officer and Assistant Secretary, Columbia Management Investment Advisers, LLC (formerly RiverSource Investments, LLC) since June 2005; Vice President and Lead Chief Counsel – Asset Management, Ameriprise Financial, Inc. since May 2010 (previously Vice President and Chief Counsel – Asset Management, 2005-April 2010 and Vice President – Asset Management Compliance, 2004-2005); Senior Vice President, Secretary and Chief Legal Officer, Atlantic Funds, Columbia Funds and Nations Funds since May 2010; Vice President, Chief Counsel and Assistant Secretary, Columbia Management Investment Distributors, Inc. (formerly RiverSource Fund Distributors, Inc.) |
167
| | | | |
| | | | | since 2008; Vice President, General
Counsel and Secretary, Ameriprise
Certificate Company since 2005; Chief
Counsel, RiverSource Distributors, Inc.
since 2006; Senior Vice President and
Chief Compliance Officer, USBancorp
Asset Management, 2002-2004 |
| | |
Michael A. Jones 100 Federal Street Boston, MA 02110 Age 51 | | Vice President since 5/1/10 | | Director and President, Columbia Management Investment Advisers, LLC since May 2010; President and Director, Columbia Management Investment Distributors, Inc. since May 2010; Senior Vice President, Atlantic Funds, Columbia Funds and Nations Funds since May 2010; Manager, Chairman, Chief Executive Officer and President, Columbia Management Advisors, LLC, 2007 – April 2010; Chief Executive Officer, President and Director, Columbia Management Distributors, Inc., 2006 – April 2010; former Co-President and Senior Managing Director, Robeco Investment Management |
| | |
Colin Moore One Financial Center Boston, MA 02111 Age 52 | | Vice President since 5/1/10 | | Chief Investment Officer, Columbia Management Investment Advisers, LLC since May 2010; Senior Vice President, Atlantic Funds, Columbia Funds and Nations Funds since May 2010; Manager, Managing Director and Chief Investment Officer, Columbia Management Advisors, LLC, 2007 - April 2010; Head of Equities, Columbia Management Advisors, LLC, 2002-Sept. 2007 |
| | |
Linda Wondrack One Financial Center Boston, MA 02111 Age 46 | | Chief Compliance Officer since 5/1/10 | | Vice President and Chief Compliance Officer, Columbia Management Investment Advisers, LLC since May 2010; Chief Compliance Officer, Columbia Funds since 2007; Senior Vice President and Chief Compliance Officer, Atlantic Funds and Nations Funds since 2007; Director (Columbia Management Group, LLC and Investment Product Group Compliance), Bank of America, June 2005 - April 2010; Director of Corporate Compliance and Conflicts Officer, MFS Investment Management (investment management), August 2004 - May 2005 |
| | |
Neysa M. Alecu 2934 Ameriprise Financial Center Minneapolis, MN 55474 Age 46 | | Money Laundering Prevention Officer since 11/9/05 and Identity Theft Prevention Officer since 2008 | | Vice President – Compliance, Ameriprise Financial, Inc. since 2008; Anti-Money Laundering Officer and Identity Theft Prevention Officer, Columbia Management Investment Distributors, Inc. (formerly RiverSource Fund Distributors, Inc.) since 2008; Anti-Money Laundering Officer, Ameriprise Financial, Inc. since 2005; Compliance Director, Ameriprise Financial, Inc., 2004-2008; |
168
Responsibilities of Board with respect to fund management
The Board is chaired by an Independent Director who has significant additional responsibilities compared to the other Board members, including, among other things: setting the agenda for Board meetings, communicating and meeting regularly with Board members between Board and committee meetings on fund-related matters with the funds’ Chief Compliance Officer, counsel to the Independent Directors, and representatives of the funds’ service providers and overseeing Board Services. The Board initially approves an Investment Management Services Agreement and other contracts with the investment manager and its affiliates, and other service providers. Once the contracts are approved, the Board monitors the level and quality of services including commitments of service providers to achieve expected levels of investment performance and shareholder services. In addition, the Board oversees that processes are in place to assure compliance with applicable rules, regulations and investment policies and addresses possible conflicts of interest. Annually, the Board evaluates the services received under the contracts by receiving reports covering investment performance, shareholder services, marketing, and the investment manager’s profitability in order to determine whether to continue existing contracts or negotiate new contracts. The Board also oversees fund risks, primarily through the functions (described below) performed by the Investment Review Committee, the Audit Committee and the Compliance Committee.
Committees of the Board
The Board has organized the following standing committees to facilitate its work: Board Governance Committee, Compliance Committee, Contracts Committee, Distribution Committee, Executive Committee, Investment Review Committee and Audit Committee. These Committees are comprised solely of Independent Directors (persons who are not “interested persons” of the fund as that term is defined in the 1940 Act. The table above describing each Director also includes their respective committee memberships. The duties of these committees are described below.
Mr. Lewis, as Chair of the Board, acts as a point of contact between the Independent Directors and the investment manager between Board meetings in respect of general matters.
Board Governance Committee — Recommends to the Board the size, structure and composition of the Board and its committees; the compensation to be paid to members of the Board; and a process for evaluating the Board’s performance. The committee also reviews candidates for Board membership including candidates recommended by shareholders. The committee also makes recommendations to the Board regarding responsibilities and duties of the Board, oversees proxy voting and supports the work of the Board Chair in relation to furthering the interests of the Funds and their shareholders on external matters. The committee also reviews candidates for Board membership, including candidates recommended by shareholders.
To be considered as a candidate for director, recommendations must include a curriculum vitae and be mailed to the Chair of the Board, 901 Marquette Avenue South, Suite 2810, Minneapolis, MN 55402-3268. To be timely for consideration by the committee, the submission, including all required information, must be submitted in writing not less than 120 days before the date of the proxy statement for the previous year’s annual meeting of shareholders, if such a meeting is held. The committee will consider only one candidate submitted by such a shareholder or group for nomination for election at a meeting of shareholders. The committee will not consider self-nominated candidates or candidates nominated by members of a candidate’s family, including such candidate’s spouse, children, parents, uncles, aunts, grandparents, nieces and nephews.
The committee will consider and evaluate candidates submitted by the nominating shareholder or group on the basis of the same criteria as those used to consider and evaluate candidates submitted from other sources. The committee may take into account a wide variety of factors in considering director candidates, including (but not limited to): (i) the candidate’s knowledge in matters relating to the investment company industry; (ii) any experience possessed by the candidate as a director or senior officer of other public or private companies; (iii) the candidate’s educational background; (iv) the candidate’s reputation for high ethical standards and personal and professional integrity; (v) any specific financial, technical or other expertise possessed by the candidate, and the extent to which such expertise would complement the Board’s existing mix of skills and qualifications; (vi) the candidate’s perceived ability to contribute to the ongoing functions of the Board, including the candidate’s ability and commitment to attend meetings regularly, work collaboratively with other members of the Board and carry out his or her duties in the best interests of the fund; (vii) the candidate’s ability to qualify as an independent director; and (viii) such other criteria as the committee determines to be relevant in light of the existing composition of the Board and any anticipated vacancies or other factors.
Members of the committee (and/or the Board) also meet personally with each nominee to evaluate the candidate’s ability to work effectively with other members of the Board, while also exercising independent judgment. Although the Board does not have a formal diversity policy, the Board endeavors to comprise itself of members with a broad mix of professional and personal backgrounds. Thus, the committee and the Board accorded particular weight to the individual professional background of each Independent Director, as encapsulated in their bios included above in Table 26.
169
The Board believes that the funds are well-served by a Board, the membership of which consists of persons that represent a broad mix of professional and personal backgrounds. In considering nominations, the Committee takes the following matrix into account in assessing how a candidate’s professional background would fit into the mix of experiences represented by the then-current Board.
| | | | | | | | | | | | | | | | | | |
| | | Geographic | | PROFESSIONAL BACKGROUND — 2010 |
Name | | | For Profit;
CIO/CFO;
CEO/COO | | Non-Profit;
Government;
CEO | | Investment | | Legal;
Regulatory | | Political | | Academic | | Distribution;
Marketing | | Audit
Committee;
Financial
Expert |
Blatz | | MN | | | | X | | | | X | | X | | | | | | |
Carlson | | MN | | | | X | | | | | | X | | | | | | |
Carlton | | NY | | | | | | X | | X | | | | | | | | X |
Flynn | | MA | | | | | | | | | | | | X | | | | |
Jones | | MD | | | | | | | | X | | | | | | | | X |
Laikind | | NY | | X | | | | X | | | | | | | | X | | X |
Lewis | | MN | | | | X | | | | | | | | X | | | | |
Maher | | CT | | X | | | | X | | | | | | | | | | X |
Paglia | | NY | | X | | | | X | | | | | | | | | | X |
Richie | | MI | | X | | | | | | X | | | | | | | | |
Taunton-Rigby | | MA | | X | | | | X | | | | | | | | | | X |
With respect to the directorship of Mr. Truscott, who is not an Independent Director, the committee and the Board have concluded that having a senior member of the investment manager serve on the Board can facilitate the Independent Directors’ increased access to information regarding the funds’ investment manager, which is the funds’ most significant service provider.
Compliance Committee — Supports the funds’ maintenance of a strong compliance program by providing a forum for Independent Directors to consider compliance matters impacting the Funds or their key service providers; developing and implementing, in coordination with the funds’ Chief Compliance Officer (CCO), a process for the review and consideration of compliance reports that are provided to the Boards; and providing a designated forum for the funds’ CCO to meet with Independent Directors on a regular basis to discuss compliance matters.
Contracts Committee — Reviews and oversees the contractual relationships with service providers. Receives and analyzes reports covering the level and quality of services provided under contracts with the fund and advises the Board regarding actions taken on these contracts during the annual review process.
Distribution Committee — Reviews and supports product development, marketing, sales activity and practices related to the funds and will report to the Board as appropriate.
Executive Committee — Acts for the Board between meetings of the Board.
Investment Review Committee — Reviews and oversees the management of the funds’ assets. Considers investment management policies and strategies; investment performance; risk management techniques; and securities trading practices and reports areas of concern to the Board.
Audit Committee — Oversees the accounting and financial reporting processes of the funds and internal controls over financial reporting. Oversees the quality and integrity of the funds’ financial statements and independent audits as well as the funds’ compliance with legal and regulatory requirements relating to the funds’ accounting and financial reporting, internal controls over financial reporting and independent audits. The committee also makes recommendations regarding the selection of the funds’ independent auditor and reviews and evaluates the qualifications, independence and performance of the auditor. The committee oversees the funds’ risks by, among other things, meeting with the funds’ internal auditors, establishing procedures for the confidential, anonymous submission by employees of concerns about accounting or audit matters, and overseeing the funds’ Disclosure Controls and Procedures.
This table shows the number of times the committees met during each fund’s most recent fiscal period. The table is organized by fiscal year end. You can find your fund’s fiscal year end in Table 1.
170
Table 28. Committee Meetings
| | | | | | | | | | | | | | |
Fiscal Period | | Board
Governance
Committee | | Compliance
Committee | | Contracts
Committee | | Distribution
Committee | | Executive
Committee | | Investment
Review
Committee | | Audit
Committee |
For funds with fiscal period ending January 31 | | 5 | | 5 | | 6 | | 4 | | 2 | | 6 | | 6 |
For funds with fiscal period ending March 31 | | 5 | | 5 | | 6 | | 4 | | 1 | | 5 | | 6 |
For funds with fiscal period ending April 30 | | 5 | | 5 | | 6 | | 3 | | 0 | | 5 | | 6 |
For funds with fiscal period ending May 31 | | 5 | | 5 | | 6 | | 3 | | 0 | | 5 | | 6 |
For funds with fiscal period ending June 30 | | 5 | | 5 | | 6 | | 2 | | 0 | | 5 | | 6 |
For funds with fiscal period ending July 31 | | 5 | | 5 | | 6 | | 2 | | 0 | | 5 | | 6 |
For funds with fiscal period ending August 31 | | 5 | | 5 | | 6 | | 4 | | 4 | | 6 | | 6 |
For funds with fiscal period ending September 30 | | 5 | | 5 | | 6 | | 4 | | 4 | | 6 | | 6 |
For funds with fiscal period ending October 31 | | 5 | | 5 | | 6 | | 4 | | 3 | | 6 | | 6 |
For funds with fiscal period ending November 30 | | 5 | | 5 | | 6 | | 4 | | 3 | | 6 | | 6 |
For funds with fiscal period ending December 31 | | 5 | | 5 | | 6 | | 4 | | 2 | | 6 | | 6 |
171
BOARD MEMBER HOLDINGS
The following table shows the Board members’ dollar range of equity securities beneficially owned on Dec. 31, 2009 of each individual fund owned by a Board member, and the aggregate dollar range of equity securities of all funds overseen by the Board members.
Table 29. Board Member Holdings
Based on net asset values as of Dec. 31, 2009:
| | | | | | |
Board Member | | Fund | | Dollar range of equity securities in the fund | | Aggregate dollar range of equity securities of all Funds overseen by Board Member |
| Kathleen Blatz | | Columbia Absolute Return Currency and Income | | $50,001-$100,000 | | Over $100,000 |
| | Columbia Dividend Opportunity | | Over $100,000 | | |
| | Columbia Income Opportunities Fund | | $10,001-$50,000 | | |
| | RiverSource LaSalle International Real Estate | | $1-$10,000 | | |
| | RiverSource Partners Small Cap Growth | | $10,001-$50,000 | | |
| | Columbia Multi-Advisor Small Cap Value | | $10,001-$50,000 | | |
| | RiverSource Precious Metals and Mining | | $10,001-$50,000 | | |
| | RiverSource Real Estate | | $50,001-$100,000 | | |
| | Columbia Strategic Allocation | | Over $100,000 | | |
| | Columbia Seligman Communication and Information Fund | | $10,001-$50,000 | | |
| | Seligman National Municipal Fund | | $1-$10,000 | | |
| | Columbia Emerging Markets Opportunity | | $10,001-$50,000 | | |
| | Threadneedle International Opportunity | | Over $100,000 | | |
| | Tri-Continental Corporation | | $1-$10,000 | | |
| Arne Carlson | | Columbia Money Market | | Over $100,000 | | Over $100,000 |
| | Columbia Dividend Opportunity | | $10,001-$50,000 | | |
| | RiverSource LaSalle International Real Estate | | $1-$10,000 | | |
| | Columbia Portfolio Builder Moderate | | $10,001-$50,000 | | |
| | Columbia Recovery and Infrastructure | | $1-$10,000 | | |
| | RiverSource Short Duration U.S. Government | | $1-$10,000 | | |
| | Columbia Seligman Communications and Information | | $10,001-$50,000 | | |
| | Seligman National Municipal Class | | $1-$10,000 | | |
| | Columbia Emerging Markets Opportunity | | $10,001-$50,000 | | |
| | Tri-Continental Corporation | | $1-$10,000 | | |
| Pamela Carlton | | Columbia Absolute Return Currency and Income | | $1-$10,000 | | Over $100,000** |
| | Columbia Money Market | | $1-$10,000 | | |
| | Columbia Diversified Equity Income | | $10,001-$50,000 | | |
| | Columbia Floating Rate* | | $50,001-$100,000 | | |
| | RiverSource Short Duration U.S. Government | | $50,001-$100,000 | | |
| | RiverSource LaSalle International Real Estate | | $1-$10,000 | | |
| | Seligman National Municipal Class | | $1-$10,000 | | |
| | Columbia Emerging Markets Opportunity | | $1-$10,000 | | |
| | Columbia Global Equity | | $1-$10,000 | | |
| | Tri-Continental Corporation | | $1-$10,000 | | |
| Patricia M. Flynn | | Columbia Money Market | | $1-$10,000 | | $50,001-$100,000** |
| | RiverSource LaSalle International Real Estate | | $1-$10,000 | | |
| | Columbia Strategic Allocation | | $10,001-$50,000 | | |
| | Threadneedle International Opportunity* | | $50,001-$100,000 | | |
| | Tri-Continental Corporation | | $10,001-$50,000 | | |
| Anne P. Jones | | Columbia Large Core Quantitative | | $10,001-$50,000 | | Over $100,000 |
| | Columbia Diversified Bond | | $10,001-$50,000 | | |
| | Columbia Diversified Equity Income | | $10,001-$50,000 | | |
| | Columbia Global Bond | | Over $100,000 | | |
| | Columbia High Yield Bond | | Over $100,000 | | |
172
| | | | | | |
| | RiverSource LaSalle International Real Estate | | $1-$10,000 | | |
| | RiverSource Short Duration U.S. Government | | Over $100,000 | | |
| | RiverSource Small Company Index | | Over $100,000 | | |
| | Columbia Strategic Allocation | | $50,001-$100,000 | | |
| | Seligman Growth | | $10,001-$50,000 | | |
| | Seligman National Municipal Class | | $1-$10,000 | | |
| | Columbia Global Equity | | $10,001-$50,000 | | |
| | Tri-Continental Corporation | | $1-$10,000 | | |
| Jeffrey Laikind | | Columbia 120/20 Contrarian Equity | | $50,001-$100,000 | | Over $100,000 |
| | Columbia Money Market | | Over $100,000 | | |
| | Columbia Dividend Opportunity | | $50,001-$100,000 | | |
| | RiverSource LaSalle International Real Estate | | $1-$10,000 | | |
| | Seligman National Municipal Class | | $1-$10,000 | | |
| | Tri-Continental Corporation | | $1-$10,000 | | |
| Stephen R. Lewis, Jr. | | Columbia 120/20 Contrarian Equity | | $10,001-$50,000 | | Over $100,000** |
| | Columbia Absolute Return Currency and Income | | $10,001-$50,000 | | |
| | Columbia Money Market* | | $1-$10,000 | | |
| | Columbia Diversified Bond* | | $10,001-$50,000 | | |
| | Columbia Diversified Equity Income | | $10,001-$50,000 | | |
| | Columbia Dividend Opportunity | | $10,001-$50,000 | | |
| | Columbia Emerging Markets Bond | | $10,001-$50,000 | | |
| | Columbia Global Bond | | $10,001-$50,000 | | |
| | Columbia Mid Cap Growth Opportunity | | $10,001-$50,000 | | |
| | Columbia Strategic Allocation | | $10,001-$50,000 | | |
| | Columbia Seligman Communications and Information* | | Over $100,000 | | |
| | RiverSource LaSalle International Real Estate | | $1-$10,000 | | |
| | Seligman National Municipal Class | | $1-$10,000 | | |
| | Columbia Emerging Markets Opportunity | | $10,001-$50,000 | | |
| | Threadneedle Global Equity Income | | $10,001-$50,000 | | |
| | Tri-Continental Corporation | | $1-$10,000 | | |
| John F. Maher | | Columbia Money Market | | $10,001-$50,000 | | Over $100,000** |
| | RiverSource LaSalle International Real Estate | | $1-$10,000 | | |
| | Columbia Seligman Communications and Information* | | Over $100,000 | | |
| | Seligman National Municipal Class | | $10,001-$50,000 | | |
| | Tri-Continental Corporation | | $50,001-$100,000 | | |
| Catherine James Paglia | | Columbia Money Market | | $10,001-$50,000 | | Over $100,000** |
| | Columbia Floating Rate* | | Over $100,000 | | |
| | RiverSource LaSalle International Real Estate | | $1-$10,000 | | |
| | Tri-Continental Corporation | | $1-$10,000 | | |
| Leroy C. Richie | | RiverSource Balanced | | $1-$10,000 | | Over $100,000 |
| | Columbia Large Core Quantitative | | $1-$10,000 | | |
| | Columbia Diversified Bond | | $1-$10,000 | | |
| | Columbia High Yield Bond | | $1-$10,000 | | |
| | RiverSource LaSalle International Real Estate | | $1-$10,000 | | |
| | RiverSource Partners International Select Growth | | $1-$10,000 | | |
| | RiverSource Short Duration U.S. Government | | $1-$10,000 | | |
| | Seligman Capital | | $1-$10,000 | | |
| | Columbia Seligman Communications and Information | | $1-$10,000 | | |
| | Columbia Frontier | | $1-$10,000 | | |
| | Columbia Seligman Global Technology | | $1-$10,000 | | |
| | Seligman Growth | | $1-$10,000 | | |
| | Columbia Select Large-Cap Value | | $1-$10,000 | | |
| | Seligman National Municipal Class | | $1-$10,000 | | |
| | Columbia Select Smaller-Cap Value | | $1-$10,000 | | |
| | Columbia Emerging Markets Opportunity | | $1-$10,000 | | |
| | Columbia Global Equity | | $1-$10,000 | | |
| | Tri-Continental Corporation | | Over $100,000 | | |
173
| | | | | | |
| Alison Taunton Rigby | | Columbia 120/20 Contrarian Equity | | $10,001-$50,000 | | Over $100,000 |
| | Columbia Absolute Return Currency and Income | | $50,001-$100,000 | | |
| | Columbia Diversified Equity Income | | $10,001-$50,000 | | |
| | Columbia Income Builder Fund III | | Over 100,000 | | |
| | Columbia Mid Cap Value Opportunity | | $50,001-$100,000 | | |
| | RiverSource Partners International Select Growth | | $50,001-$100,000 | | |
| | Columbia Multi-Advisor Small Cap Value | | $50,001-$100,000 | | |
| | Columbia Strategic Allocation | | $50,001-$100,000 | | |
| | Columbia Seligman Communications and Information | | $50,001-$100,000 | | |
| | Seligman Growth | | $50,001-$100,000 | | |
| | Seligman LaSalle International Real Estate | | $1-$10,000 | | |
| | Seligman National Municipal Class | | $1-$10,000 | | |
| | Columbia Emerging Markets Opportunity | | $50,001-$100,000 | | |
| | Tri-Continental Corporation | | $1-$10,000 | | |
| Ted Truscott | | Columbia 120/20 Contrarian Equity | | $50,001-$100,000 | | Over $100,000 |
| | Columbia Absolute Return Currency and Income | | $50,001-$100,000 | | |
| | Columbia Large Core Quantitative | | Over $100,000 | | |
| | RiverSource Disciplined International Equity | | Over $100,000 | | |
| | Columbia Large Growth Quantitative | | $50,001-$100,000 | | |
| | Columbia Large Value Quantitative | | $50,001-$100,000 | | |
| | RiverSource Disciplined Small and Mid Cap Equity | | $10,001-$50,000 | | |
| | Columbia Diversified Bond | | Over $100,000 | | |
| | Columbia Diversified Equity Income | | $1-$10,000 | | |
| | Columbia Dividend Opportunity | | $10,001-$50,000 | | |
| | Columbia Emerging Markets Bond | | $10,001-$50,000 | | |
| | Columbia Global Bond | | Over $100,000 | | |
| | Columbia High Yield Bond | | Over $100,000 | | |
| | Columbia Income Opportunities | | $50,001- $100,000 | | |
| | Columbia Inflation Protected Securities | | $10,001-$50,000 | | |
| | Columbia Limited Duration Credit | | Over $100,000 | | |
| | Columbia Mid Cap Value Opportunity | | $50,001-$100,000 | | |
| | RiverSource Partners International Select Growth | | Over $100,000 | | |
| | Columbia Multi-Advisor International Value | | $10,001-$50,000 | | |
| | Columbia Portfolio Builder Moderate Aggressive | | $50,001-$100,000 | | |
| | Columbia Retirement Plus 2035 | | $10,001-$50,000 | | |
| | Columbia Strategic Allocation | | Over $100,000 | | |
| | RiverSource Strategic Income Allocation | | Over $100,000 | | |
| | Columbia Seligman Communications and Information | | $10,001-$50,000 | | |
| | Columbia Seligman Global Technology | | $10,001-$50,000 | | |
| | Seligman Growth | | Over $100,000 | | |
| | Seligman LaSalle International Real Estate | | $1-$10,000 | | |
| | Seligman National Municipal Class | | $1-$10,000 | | |
| | Columbia Seligman Premium Technology Growth | | $10,001-$50,000 | | |
| | Columbia Emerging Markets Opportunity | | $10,001-$50,000 | | |
| | Columbia Global Equity | | Over $100,000 | | |
| | Tri-Continental Corporation | | $1-$10,000 | | |
| * | Deferred compensation invested in share equivalents: |
| | | | |
| A. Carlton | | Columbia Money Market | | $1-$10,000 |
| | Columbia Floating Rate | | $50,001-$100,000 |
| B. Flynn | | Columbia Money Market | | $1-$10,000 |
| | Threadneedle International Opportunity | | $50,001-$100,000 |
| C. Lewis | | Columbia Money Market | | $1-$10,000 |
| | Columbia Diversified Bond | | $1-$10,000 |
| | Columbia Diversified Equity Income | | $50,001-$100,000 |
| | Columbia Seligman Communications and Information | | $50,001-$100,000 |
| D. Maher | | Columbia Money Market | | $10,001-$50,000 |
| | Columbia Seligman Communications and Information | | Over $100,000 |
| E. Paglia | | Columbia Money Market | | $10,001-$50,000 |
| | Columbia Floating Rate | | Over $100,000 |
| ** | Total includes deferred compensation invested in share equivalents. |
174
As of 30 days prior to the date of this SAI, the Board members and officers as a group owned 1.31% of Columbia Retirement Plus 2035 Fund Class A. The Board members and officers as a group owned less than 1% of the outstanding shares of any class of any other fund in the Fund Family.
COMPENSATION OF BOARD MEMBERS
Total compensation. The following table shows the total compensation paid to independent Board members from all the funds in the last fiscal period.
Table 30. Board Member Compensation – All Funds
| | | | |
Board member(a) | | Total Cash Compensation from
Funds Paid to Board member | |
Kathleen Blatz | | $ | 192,801 | |
Arne H. Carlson | | | 205,231 | |
Pamela G. Carlton | | | 185,301 | (b) |
Patricia M. Flynn | | | 196,262 | (b) |
Anne P. Jones | | | 195,301 | |
Jeffrey Laikind | | | 194,451 | (b) |
Stephen R. Lewis, Jr. | | | 399,753 | (b) |
John F. Maher | | | 192,500 | (b) |
Catherine James Paglia | | | 195,301 | |
Leroy Richie | | | 187,801 | |
Alison Taunton-Rigby | | | 187,801 | |
| (a) | Board member compensation is paid by the funds and is comprised of a combination of a base fee and meeting fees, with the exception of the Chair of the Board, who receives a base annual compensation. Payment of compensation is administered by a company providing limited administrative services to the funds and to the Board. Compensation noted in the table does not include amounts paid by Ameriprise Financial to Board members for attendance at Board and committee meetings relating to Ameriprise Financial’s acquisition of the long-term asset management business of Columbia Management Group, LLC, including certain of its affiliates. The Chair of the Board did not receive any such compensation from Ameriprise Financial. |
| (b) | Ms. Carlton, Ms. Flynn, Mr. Laikind, Mr. Lewis and Mr. Maher elected to defer a portion of the total cash compensation payable during the period in the amount of $27,833, $87,333, $95,938, $75,167, and $192,500, respectively. Amount deferred by fund is set forth in Table 31. Additional information regarding the deferred compensation plan is described below. |
The Independent Directors determine the amount of compensation that they receive, including the amount paid to the Chair of the Board. In determining compensation for the Independent Directors, the Independent Directors take into account a variety of factors including, among other things, their collective significant work experience (e.g., in business and finance, government or academia). The Independent Directors also recognize that these individuals’ advice and counsel are in demand by other organizations, that these individuals may reject other opportunities because the time demands of their duties as Independent Directors, and that they undertake significant legal responsibilities. The Independent Directors also consider the compensation paid to independent board members of
175
other mutual fund complexes of comparable size. In determining the compensation paid to the Chair, the Independent Directors take into account, among other things, the Chair’s significant additional responsibilities (e.g., setting the agenda for Board meetings, communicating or meeting regularly with the Funds’ Chief Compliance Officer, Counsel to the Independent Directors, and the Funds’ service providers) which result in a significantly greater time commitment required of the Board Chair. The Chair’s compensation, therefore, has generally been set at a level between 2.5 and 3 times the level of compensation paid to other independent Board members.
Effective Jan. 1, 2010, independent Board members will be paid an annual retainer of $125,000. Committee and sub- committee Chairs each receive an additional annual retainer of $5,000. In addition, Independent Board Directors are paid the following fees for attending Board and committee meetings: $5,000 per day of in-person Board meetings and $2,500 per day of in-person committee or sub-committee meetings (if such meetings are not held on the same day as a Board meeting). Independent Directors are not paid for special meetings conducted by telephone. In 2010, the Board’s Chair will receive total annual cash compensation of $430,000.
The Independent Directors may elect to defer payment of up to 100% of the compensation they receive in accordance with a Deferred Compensation Plan (the Deferred Plan). Under the Deferred Plan, a Board member may elect to have his or her deferred compensation treated as if they had been invested in shares of one or more RiverSource, Seligman or Threadneedle funds in the Fund Family and the amount paid to the Board member under the Deferred Plan will be determined based on the performance of such investments. Distributions may be taken in a lump sum or over a period of years. The Deferred Plan will remain unfunded for federal income tax purposes under the Internal Revenue Code of 1986, as amended. It is anticipated that deferral of Board member compensation in accordance with the Deferred Plan will have, at most, a negligible impact on fund assets and liabilities.
Compensation from each fund. The following table shows the compensation paid to independent Board members from each fund during its last fiscal period.
Table 31. Board Member Compensation — Individual Funds
| | | | | | | | | | | | | | | | | | | | | | | | | | | | | | | | | |
| | | Aggregate Compensation from Fund |
Fund | | Blatz | | Carlson | | Carlton | | Flynn | | Jones | | Laikind | | Lewis | | Maher | | Paglia | | Richie | | Taunton-
Rigby |
| For funds with fiscal period ending January 31 |
Columbia Income Builder Fund | | | * | | | * | | | * | | | * | | | * | | | * | | | * | | | * | | | * | | | * | | | * |
Columbia Income Builder Fund II | | | * | | | * | | | * | | | * | | | * | | | * | | | * | | | * | | | * | | | * | | | * |
Columbia Income Builder Fund III | | | * | | | * | | | * | | | * | | | * | | | * | | | * | | | * | | | * | | | * | | | * |
Columbia Portfolio Builder Aggressive | | | * | | | * | | | * | | | * | | | * | | | * | | | * | | | * | | | * | | | * | | | * |
Columbia Portfolio Builder Conservative | | | * | | | * | | | * | | | * | | | * | | | * | | | * | | | * | | | * | | | * | | | * |
Columbia Portfolio Builder Moderate | | | * | | | * | | | * | | | * | | | * | | | * | | | * | | | * | | | * | | | * | | | * |
Columbia Portfolio Builder Moderate Aggressive | | | * | | | * | | | * | | | * | | | * | | | * | | | * | | | * | | | * | | | * | | | * |
Columbia Portfolio Builder Moderate Conservative | | | * | | | * | | | * | | | * | | | * | | | * | | | * | | | * | | | * | | | * | | | * |
Columbia Portfolio Builder Total Equity | | | * | | | * | | | * | | | * | | | * | | | * | | | * | | | * | | | * | | | * | | | * |
RiverSource S&P 500 Index — total | | $ | 294 | | $ | 303 | | $ | 273 | | $ | 282 | | $ | 295 | | $ | 273 | | $ | 677 | | $ | 265 | | $ | 303 | | $ | 282 | | $ | 282 |
Amount deferred | | | 0 | | | 0 | | | 96 | | | 91 | | | 0 | | | 25 | | | 105 | | | 265 | | | 0 | | | 0 | | | 0 |
RiverSource Small Company Index — total | | | 928 | | | 954 | | | 862 | | | 887 | | | 928 | | | 862 | | | 2,129 | | | 834 | | | 954 | | | 887 | | | 887 |
Amount deferred | | | 0 | | | 0 | | | 302 | | | 287 | | | 0 | | | 80 | | | 329 | | | 834 | | | 0 | | | 0 | | | 0 |
For funds with fiscal period ending March 31 |
Columbia Equity Value — total | | | 1,720 | | | 1,744 | | | 1,604 | | | 1,653 | | | 1,744 | | | 1,604 | | | 3,776 | | | 1,561 | | | 1,744 | | | 1,629 | | | 1,629 |
Amount deferred | | | 0 | | | 0 | | | 463 | | | 595 | | | 0 | | | 336 | | | 618 | | | 1,561 | | | 0 | | | 0 | | | 0 |
RiverSource Precious Metals and Mining — total | | | 354 | | | 359 | | | 330 | | | 339 | | | 359 | | | 330 | | | 776 | | | 321 | | | 358 | | | 335 | | | 335 |
Amount deferred | | | 0 | | | 0 | | | 96 | | | 122 | | | 0 | | | 68 | | | 127 | | | 321 | | | 0 | | | 0 | | | 0 |
For funds with fiscal period ending April 30 |
Columbia 120/20 Contrarian Equity — total | | $ | 103 | | $ | 104 | | $ | 97 | | $ | 100 | | $ | 104 | | $ | 97 | | $ | 221 | | $ | 95 | | $ | 104 | | $ | 99 | | $ | 99 |
Amount deferred | | | 0 | | | 0 | | | 24 | | | 38 | | | 0 | | | 29 | | | 37 | | | 95 | | | 0 | | | 0 | | | 0 |
Columbia Recovery and Infrastructure — total | | | 912 | | | 929 | | | 869 | | | 903 | | | 929 | | | 869 | | | 1,880 | | | 853 | | | 929 | | | 886 | | | 886 |
Amount deferred | | | 0 | | | 0 | | | 170 | | | 366 | | | 0 | | | 333 | | | 326 | | | 853 | | | 0 | | | 0 | | | 0 |
Columbia Retirement Plus 2010 | | | * | | | * | | | * | | | * | | | * | | | * | | | * | | | * | | | * | | | * | | | * |
Columbia Retirement Plus 2015 | | | * | | | * | | | * | | | * | | | * | | | * | | | * | | | * | | | * | | | * | | | * |
Columbia Retirement Plus 2020 | | | * | | | * | | | * | | | * | | | * | | | * | | | * | | | * | | | * | | | * | | | * |
Columbia Retirement Plus 2025 | | | * | | | * | | | * | | | * | | | * | | | * | | | * | | | * | | | * | | | * | | | * |
Columbia Retirement Plus 2030 | | | * | | | * | | | * | | | * | | | * | | | * | | | * | | | * | | | * | | | * | | | * |
176
| | | | | | | | | | | | | | | | | | | | | | |
Columbia Retirement Plus 2035 | | * | | * | | * | | * | | * | | * | | * | | * | | * | | * | | * |
Columbia Retirement Plus 2040 | | * | | * | | * | | * | | * | | * | | * | | * | | * | | * | | * |
Columbia Retirement Plus 2045 | | * | | * | | * | | * | | * | | * | | * | | * | | * | | * | | * |
For funds with fiscal period ending May 31 |
Columbia High Yield Bond — total | | 4,436 | | 4,626 | | 4,212 | | 4,374 | | 4,495 | | 4,212 | | 9,268 | | 4,114 | | 4,495 | | 4,271 | | 4,271 |
Amount deferred | | 0 | | 0 | | 890 | | 1,720 | | 0 | | 1,490 | | 1,594 | | 4,114 | | 0 | | 0 | | 0 |
Columbia Multi-Advisor Small Cap Value — total | | 980 | | 1,025 | | 931 | | 968 | | 993 | | 931 | | 2,038 | | 907 | | 993 | | 944 | | 945 |
Amount deferred | | 0 | | 0 | | 196 | | 381 | | 0 | | 330 | | 350 | | 907 | | 0 | | 0 | | 0 |
Columbia U.S. Government Mortgage — total | | 664 | | 687 | | 625 | | 643 | | 671 | | 625 | | 1,398 | | 604 | | 671 | | 632 | | 631 |
Amount deferred | | 0 | | 0 | | 160 | | 239 | | 0 | | 170 | | 233 | | 604 | | 0 | | 0 | | 0 |
RiverSource Partners Fundamental Value — total | | 1,495 | | 1,556 | | 1,417 | | 1,469 | | 1,514 | | 1,417 | | 3,115 | | 1,378 | | 1,514 | | 1,436 | | 1,436 |
Amount deferred | | 0 | | 0 | | 314 | | 570 | | 0 | | 474 | | 532 | | 1,378 | | 0 | | 0 | | 0 |
RiverSource Short Duration U.S. Government — total | | 1,779 | | 1,847 | | 1,684 | | 1,742 | | 1,801 | | 1,684 | | 3,725 | | 1,636 | | 1,801 | | 1,705 | | 1,705 |
Amount deferred | | 0 | | 0 | | 384 | | 672 | | 0 | | 544 | | 633 | | 1,636 | | 0 | | 0 | | 0 |
For funds with fiscal period ending June 30 |
Columbia Dividend Opportunity — total | | 3,054 | | 3,178 | | 2,932 | | 3,104 | | 3,095 | | 3,062 | | 6,388 | | 3,025 | | 3,095 | | 2,974 | | 2,974 |
Amount deferred | | 0 | | 0 | | 534 | | 1,327 | | 0 | | 1,329 | | 1,167 | | 3,025 | | 0 | | 0 | | 0 |
RiverSource Real Estate — total | | 424 | | 444 | | 408 | | 435 | | 430 | | 430 | | 884 | | 427 | | 430 | | 414 | | 414 |
Amount deferred | | 0 | | 0 | | 69 | | 190 | | 0 | | 199 | | 164 | | 427 | | 0 | | 0 | | 0 |
For funds with fiscal period ending July 31 |
Columbia Floating Rate — total | | 1,013 | | 1,076 | | 972 | | 1,032 | | 1,027 | | 1,017 | | 2,116 | | 1,011 | | 1,027 | | 986 | | 986 |
Amount deferred | | 0 | | 0 | | 151 | | 454 | | 0 | | 490 | | 395 | | 1,011 | | 0 | | 0 | | 0 |
Columbia Income Opportunities — total | | 1,838 | | 1,952 | | 1,764 | | 1,869 | | 1,862 | | 1,847 | | 3,812 | | 1,832 | | 1,862 | | 1,789 | | 1,789 |
Amount deferred | | 0 | | 0 | | 271 | | 826 | | 0 | | 898 | | 714 | | 1,832 | | 0 | | 0 | | 0 |
Columbia Inflation Protected Securities — total | | 1,632 | | 1,733 | | 1,566 | | 1,658 | | 1,653 | | 1,639 | | 3,404 | | 1,625 | | 1,653 | | 1,588 | | 1,588 |
Amount deferred | | 0 | | 0 | | 244 | | 731 | | 0 | | 790 | | 636 | | 1,625 | | 0 | | 0 | | 0 |
Columbia Large Core Quantitative — total | | 10,069 | | 10,674 | | 9,637 | | 10,207 | | 10,203 | | 10,076 | | 20,381 | | 10,019 | | 10,203 | | 9,771 | | 9,771 |
Amount deferred | | 0 | | 0 | | 1,502 | | 4,494 | | 0 | | 4,851 | | 3,824 | | 10,019 | | 0 | | 0 | | 0 |
Columbia Limited Duration Credit — total | | 1,151 | | 1,233 | | 1,111 | | 1,184 | | 1,168 | | 1,170 | | 2,359 | | 1,158 | | 1,168 | | 1,128 | | 1,128 |
Amount deferred | | 0 | | 0 | | 145 | | 539 | | 0 | | 620 | | 453 | | 1,158 | | 0 | | 0 | | 0 |
Columbia Money Market — total | | 7,280 | | 7,694 | | 6,974 | | 7,354 | | 7,370 | | 7,272 | | 15,303 | | 7,219 | | 7,370 | | 7,063 | | 7,063 |
Amount deferred | | 0 | | 0 | | 1,162 | | 3,195 | | 0 | | 3,350 | | 2,824 | | 7,219 | | 0 | | 0 | | 0 |
RiverSource Disciplined Small and Mid Cap Equity — total | | 340 | | 363 | | 327 | | 348 | | 345 | | 344 | | 706 | | 342 | | 345 | | 331 | | 331 |
Amount deferred | | 0 | | 0 | | 50 | | 154 | | 0 | | 169 | | 133 | | 342 | | 0 | | 0 | | 0 |
RiverSource Disciplined Small Cap Value — total | | 123 | | 131 | | 119 | | 126 | | 125 | | 125 | | 254 | | 124 | | 125 | | 120 | | 120 |
Amount deferred | | 0 | | 0 | | 17 | | 56 | | 0 | | 62 | | 48 | | 124 | | 0 | | 0 | | 0 |
For funds with fiscal period ending August 31 |
Columbia Diversified Bond — total | | 9,578 | | 9,858 | | 8,910 | | 9,270 | | 9,578 | | 8,910 | | 21,784 | | 5,758 | | 10,028 | | 7,302 | | 9,191 |
Amount deferred | | 0 | | 0 | | 2,180 | | 3,449 | | 0 | | 0 | | 3,315 | | 5,171 | | 3,715 | | 0 | | 0 |
Columbia Minnesota Tax-Exempt — total | | 830 | | 855 | | 772 | | 804 | | 830 | | 772 | | 1,887 | | 502 | | 870 | | 636 | | 797 |
Amount deferred | | 0 | | 0 | | 189 | | 299 | | 0 | | 0 | | 287 | | 450 | | 321 | | 0 | | 0 |
RiverSource California Tax-Exempt — total | | 444 | | 457 | | 412 | | 429 | | 444 | | 412 | | 1,003 | | 263 | | 465 | | 335 | | 426 |
Amount deferred | | 0 | | 0 | | 98 | | 161 | | 0 | | 0 | | 153 | | 234 | | 179 | | 0 | | 0 |
RiverSource New York Tax-Exempt — total | | 147 | | 151 | | 137 | | 142 | | 147 | | 137 | | 334 | | 88 | | 154 | | 112 | | 141 |
Amount deferred | | 0 | | 0 | | 33 | | 53 | | 0 | | 0 | | 51 | | 79 | | 57 | | 0 | | 0 |
For funds with fiscal period ending September 30 |
Columbia Diversified Equity Income — total | | 11,145 | | 11,437 | | 10,376 | | 10,768 | | 11,145 | | 10,376 | | 24,962 | | 7,460 | | 11,656 | | 9,314 | | 10,667 |
Amount deferred | | 0 | | 0 | | 2,800 | | 3,875 | | 0 | | 0 | | 3,806 | | 6,697 | | 3,540 | | 0 | | 0 |
Columbia Large Growth Quantitative — total | | 952 | | 977 | | 883 | | 913 | | 952 | | 882 | | 2,194 | | 730 | | 988 | | 850 | | 908 |
Amount deferred | | 0 | | 0 | | 291 | | 304 | | 0 | | 0 | | 332 | | 691 | | 163 | | 0 | | 0 |
Columbia Large Value Quantitative — total | | 330 | | 339 | | 305 | | 315 | | 330 | | 305 | | 770 | | 277 | | 341 | | 308 | | 314 |
Amount deferred | | 0 | | 0 | | 116 | | 97 | | 0 | | 0 | | 116 | | 273 | | 18 | | 0 | | 0 |
Columbia Mid Cap Value Opportunity — total | | 4,836 | | 4,960 | | 4,498 | | 4,664 | | 4,836 | | 4,498 | | 10,838 | | 3,287 | | 5,051 | | 4,070 | | 4,622 |
Amount deferred | | 0 | | 0 | | 1,242 | | 1,665 | | 0 | | 0 | | 1,651 | | 2,970 | | 1,461 | | 0 | | 0 |
Columbia Strategic Allocation — total | | 3,493 | | 3,591 | | 3,253 | | 3,382 | | 3,493 | | 3,253 | | 7,846 | | 2,335 | | 3,661 | | 2,928 | | 3,350 |
Amount deferred | | 0 | | 0 | | 873 | | 1,219 | | 0 | | 0 | | 1,197 | | 2,091 | | 1,124 | | 0 | | 0 |
177
| | | | | | | | | | | | | | | | | | | | | | |
RiverSource Balanced — total | | 1,543 | | 1,585 | | 1,436 | | 1,491 | | 1,543 | | 1,436 | | 3,469 | | 1,042 | | 1,614 | | 1,297 | | 1,477 |
Amount deferred | | 0 | | 0 | | 392 | | 534 | | 0 | | 0 | | 529 | | 940 | | 477 | | 0 | | 0 |
RiverSource Strategic Income Allocation — total | | 544 | | 559 | | 505 | | 523 | | 544 | | 506 | | 1,238 | | 397 | | 567 | | 475 | | 520 |
Amount deferred | | 0 | | 0 | | 155 | | 179 | | 0 | | 0 | | 188 | | 369 | | 123 | | 0 | | 0 |
Seligman California Municipal High-Yield — total | | 86 | | 89 | | 79 | | 75 | | 86 | | 80 | | 194 | | 74 | | 73 | | 82 | | 82 |
Amount deferred | | 0 | | 0 | | 25 | | 20 | | 0 | | 0 | | 25 | | 68 | | 0 | | 0 | | 0 |
Seligman California Municipal Quality — total | | 101 | | 105 | | 93 | | 88 | | 101 | | 94 | | 228 | | 87 | | 86 | | 97 | | 97 |
Amount deferred | | 0 | | 0 | | 30 | | 23 | | 0 | | 0 | | 29 | | 20 | | 0 | | 0 | | 0 |
Seligman Minnesota Municipal — total | | 170 | | 176 | | 156 | | 148 | | 170 | | 157 | | 382 | | 146 | | 145 | | 162 | | 162 |
Amount deferred | | 0 | | 0 | | 50 | | 39 | | 0 | | 0 | | 0 | | 134 | | 0 | | 0 | | 0 |
Seligman National Municipal — total | | 625 | | 643 | | 582 | | 587 | | 624 | | 582 | | 1,494 | | 528 | | 615 | | 600 | | 600 |
Amount deferred | | 0 | | 0 | | 221 | | 171 | | 0 | | 0 | | 216 | | 517 | | 0 | | 0 | | 0 |
Seligman New York Municipal — total | | 187 | | 194 | | 173 | | 165 | | 187 | | 173 | | 425 | | 162 | | 164 | | 179 | | 179 |
Amount deferred | | 0 | | 0 | | 57 | | 44 | | 0 | | 0 | | 55 | | 150 | | 0 | | 0 | | 0 |
Seligman TargETFund 2015 — total | | 61 | | 62 | | 56 | | 52 | | 61 | | 56 | | 134 | | 52 | | 50 | | 58 | | 58 |
Amount deferred | | 0 | | 0 | | 17 | | 14 | | 0 | | 0 | | 16 | | 47 | | 0 | | 0 | | 0 |
Seligman TargETFund 2025 — total | | 69 | | 71 | | 64 | | 60 | | 69 | | 64 | | 154 | | 59 | | 58 | | 66 | | 66 |
Amount deferred | | 0 | | 0 | | 20 | | 16 | | 0 | | 0 | | 19 | | 54 | | 0 | | 0 | | 0 |
Seligman TargETFund 2035 — total | | 18 | | 19 | | 17 | | 16 | | 19 | | 17 | | 42 | | 16 | | 16 | | 18 | | 18 |
Amount deferred | | 0 | | 0 | | 0 | | 0 | | 0 | | 0 | | 5 | | 15 | | 0 | | 0 | | 0 |
Seligman TargETFund 2045 — total | | 10 | | 10 | | 9 | | 8 | | 10 | | 9 | | 23 | | 9 | | 9 | | 10 | | 10 |
Amount deferred | | 0 | | 0 | | 3 | | 2 | | 0 | | 0 | | 0 | | 8 | | 0 | | 0 | | 0 |
Seligman TargETFund Core — total | | 136 | | 140 | | 125 | | 116 | | 136 | | 125 | | 301 | | 116 | | 112 | | 129 | | 129 |
Amount deferred | | 0 | | 0 | | 39 | | 30 | | 0 | | 0 | | 37 | | 105 | | 0 | | 0 | | 0 |
For funds with fiscal period ending October 31 |
Columbia Absolute Return Currency and Income — total | | 1,356 | | 1,410 | | 1,252 | | 1,322 | | 1,356 | | 1,252 | | 3,201 | | 1,017 | | 1,446 | | 1,306 | | 1,306 |
Amount deferred | | 0 | | 0 | | 366 | | 459 | | 0 | | 0 | | 490 | | 891 | | 364 | | 0 | | 0 |
Columbia Asia Pacific ex-Japan(a) — total | | 22 | | 22 | | 20 | | 21 | | 22 | | 20 | | 60 | | 20 | | 22 | | 20 | | 20 |
Amount deferred | | 0 | | 0 | | 8 | | 6 | | 0 | | 0 | | 9 | | 20 | | 0 | | 0 | | 0 |
Columbia Emerging Markets Bond — total | | 465 | | 477 | | 430 | | 447 | | 465 | | 430 | | 1,118 | | 363 | | 486 | | 443 | | 442 |
Amount deferred | | 0 | | 0 | | 137 | | 150 | | 0 | | 0 | | 170 | | 330 | | 94 | | 0 | | 0 |
Columbia Emerging Markets Opportunity — total | | 878 | | 898 | | 814 | | 841 | | 878 | | 814 | | 2,144 | | 703 | | 912 | | 835 | | 835 |
Amount deferred | | 0 | | 0 | | 275 | | 276 | | 0 | | 0 | | 325 | | 656 | | 137 | | 0 | | 0 |
Columbia European Equity — total | | 161 | | 166 | | 149 | | 155 | | 161 | | 149 | | 385 | | 125 | | 169 | | 153 | | 153 |
Amount deferred | | 0 | | 0 | | 47 | | 52 | | 0 | | 0 | | 59 | | 113 | | 34 | | 0 | | 0 |
Columbia Frontier — total | | 89 | | 92 | | 83 | | 77 | | 89 | | 82 | | 205 | | 76 | | 75 | | 85 | | 85 |
Amount deferred | | 0 | | 0 | | 26 | | 20 | | 0 | | 0 | | 26 | | 70 | | 0 | | 0 | | 0 |
Columbia Global Bond — total | | 1,293 | | 1,329 | | 1,196 | | 1,246 | | 1,293 | | 1,196 | | 3,068 | | 970 | | 1,361 | | 1,232 | | 1,232 |
Amount deferred | | 0 | | 0 | | 361 | | 428 | | 0 | | 0 | | 469 | | 866 | | 318 | | 0 | | 0 |
Columbia Global Equity — total | | 1,092 | | 1,124 | | 1,010 | | 1,052 | | 1,092 | | 1,010 | | 2,613 | | 855 | | 1,145 | | 1,043 | | 1,043 |
Amount deferred | | 0 | | 0 | | 325 | | 352 | | 0 | | 0 | | 398 | | 780 | | 213 | | 0 | | 0 |
Columbia Global Extended Alpha — total | | 16 | | 16 | | 14 | | 15 | | 16 | | 15 | | 38 | | 12 | | 16 | | 15 | | 15 |
Amount deferred | | 0 | | 0 | | 5 | | 5 | | 0 | | 0 | | 6 | | 11 | | 3 | | 0 | | 0 |
Columbia Multi-Advisor International Value — total | | 2,143 | | 2,201 | | 1,983 | | 2,062 | | 2,143 | | 1,983 | | 5,121 | | 1,674 | | 2,245 | | 2,042 | | 2,042 |
Amount deferred | | 0 | | 0 | | 633 | | 693 | | 0 | | 0 | | 780 | | 1,518 | | 432 | | 0 | | 0 |
Columbia Seligman Global Technology — total | | 673 | | 691 | | 622 | | 595 | | 672 | | 622 | | 1,581 | | 583 | | 594 | | 640 | | 640 |
Amount deferred | | 0 | | 0 | | 209 | | 162 | | 0 | | 0 | | 210 | | 545 | | 0 | | 0 | | 0 |
RiverSource Disciplined International Equity — total | | 908 | | 931 | | 840 | | 873 | | 908 | | 840 | | 2,166 | | 699 | | 951 | | 863 | | 863 |
Amount deferred | | 0 | | 0 | | 260 | | 297 | | 0 | | 0 | | 331 | | 625 | | 206 | | 0 | | 0 |
RiverSource Partners International Select Growth — total | | 903 | | 929 | | 836 | | 870 | | 903 | | 836 | | 2,159 | | 703 | | 947 | | 861 | | 861 |
Amount deferred | | 0 | | 0 | | 266 | | 293 | | 0 | | 0 | | 329 | | 637 | | 186 | | 0 | | 0 |
RiverSource Partners International Small Cap — total | | 124 | | 128 | | 115 | | 120 | | 124 | | 115 | | 299 | | 98 | | 130 | | 119 | | 119 |
Amount deferred | | 0 | | 0 | | 37 | | 40 | | 0 | | 0 | | 46 | | 89 | | 24 | | 0 | | 0 |
Threadneedle Global Equity Income — total | | 54 | | 55 | | 50 | | 52 | | 54 | | 50 | | 131 | | 44 | | 56 | | 52 | | 52 |
Amount deferred | | 0 | | 0 | | 17 | | 17 | | 0 | | 0 | | 20 | | 41 | | 7 | | 0 | | 0 |
Threadneedle International Opportunity — total | | 902 | | 927 | | 835 | | 869 | | 902 | | 835 | | 2,163 | | 709 | | 945 | | 861 | | 861 |
Amount deferred | | 0 | | 0 | | 268 | | 291 | | 0 | | 0 | | 329 | | 642 | | 178 | | 0 | | 0 |
178
| | | | | | | | | | | | | | | | | | | | | | |
For funds with fiscal period ending November 30 | | | | | | | | | | | | | | | | | | | | | | |
Columbia AMT-Free Tax-Exempt Bond — total | | 1,649 | | 1,703 | | 1,526 | | 1,586 | | 1,649 | | 1,526 | | 3,963 | | 1,467 | | 1,715 | | 1,580 | | 1,580 |
Amount deferred | | 0 | | 0 | | 560 | | 499 | | 0 | | 0 | | 599 | | 1,353 | | 126 | | 0 | | 0 |
Columbia Mid Cap Growth Opportunity — total | | 1,441 | | 1,479 | | 1,332 | | 1,375 | | 1,441 | | 1,332 | | 3,423 | | 1,277 | | 1,489 | | 1,370 | | 1,370 |
Amount deferred | | 0 | | 0 | | 495 | | 430 | | 0 | | 0 | | 517 | | 1,193 | | 94 | | 0 | | 0 |
RiverSource Intermediate Tax-Exempt — total | | 220 | | 227 | | 203 | | 211 | | 219 | | 203 | | 527 | | 195 | | 228 | | 210 | | 210 |
Amount deferred | | 0 | | 0 | | 75 | | 66 | | 0 | | 0 | | 80 | | 181 | | 16 | | 0 | | 0 |
RiverSource Tax-Exempt High Income — total | | 5,635 | | 5,818 | | 5,215 | | 5,420 | | 5,635 | | 5,215 | | 13,540 | | 5,012 | | 5,860 | | 5,399 | | 5,399 |
Amount deferred | | 0 | | 0 | | 1,915 | | 1,705 | | 0 | | 0 | | 2,046 | | 4,627 | | 427 | | 0 | | 0 |
For funds with fiscal period ending December 31 |
Columbia Government Money Market — total | | 348 | | 363 | | 323 | | 338 | | 349 | | 323 | | 828 | | 313 | | 363 | | 338 | | 338 |
Amount deferred | | 0 | | 0 | | 129 | | 101 | | 0 | | 0 | | 124 | | 313 | | 0 | | 0 | | 0 |
Columbia Select Large-Cap Value — total | | 497 | | 507 | | 463 | | 473 | | 497 | | 463 | | 1,143 | | 445 | | 507 | | 473 | | 473 |
Amount deferred | | 0 | | 0 | | 185 | | 142 | | 0 | | 0 | | 172 | | 445 | | 0 | | 0 | | 0 |
Columbia Select Smaller-Cap Value — total | | 463 | | 472 | | 429 | | 437 | | 463 | | 429 | | 1,019 | | 420 | | 472 | | 437 | | 437 |
Amount deferred | | 0 | | 0 | | 172 | | 131 | | 0 | | 0 | | 153 | | 420 | | 0 | | 0 | | 0 |
Columbia Seligman Communications and Information — total | | 7,421 | | 7,621 | | 6,888 | | 7,087 | | 7,421 | | 6,888 | | 17,086 | | 6,672 | | 7,621 | | 7,087 | | 7,087 |
Amount deferred | | 0 | | 0 | | 2,755 | | 2,126 | | 0 | | 0 | | 2,563 | | 6,672 | | 0 | | 0 | | 0 |
RiverSource LaSalle Global Real Estate — total | | 31 | | 32 | | 29 | | 30 | | 31 | | 29 | | 71 | | 28 | | 32 | | 29 | | 29 |
Amount deferred | | 0 | | 0 | | 12 | | 9 | | 0 | | 0 | | 11 | | 28 | | 0 | | 0 | | 0 |
RiverSource LaSalle Monthly Dividend Real Estate — total | | 60 | | 62 | | 56 | | 57 | | 60 | | 56 | | 139 | | 54 | | 62 | | 58 | | 58 |
Amount deferred | | 0 | | 0 | | 22 | | 17 | | 0 | | 0 | | 21 | | 54 | | 0 | | 0 | | 0 |
Seligman Capital — total | | 530 | | 545 | | 491 | | 507 | | 530 | | 491 | | 1,228 | | 476 | | 545 | | 507 | | 507 |
Amount deferred | | 0 | | 0 | | 197 | | 152 | | 0 | | 0 | | 184 | | 476 | | 0 | | 0 | | 0 |
Seligman Growth — total | | 1,806 | | 1,825 | | 1,672 | | 1,690 | | 1,806 | | 1,672 | | 3,803 | | 1,654 | | 1,825 | | 1,690 | | 1,690 |
Amount deferred | | 0 | | 0 | | 669 | | 507 | | 0 | | 0 | | 570 | | 1,654 | | 0 | | 0 | | 0 |
| * | The Funds-of-Funds do not pay additional compensation to the Board members for attending meetings. Compensation is paid directly from the affiliated underlying funds in which each Fund-of-Funds invests. |
| (a) | For the period from July 15, 2009 (when shares became publicly available) to Oct. 31, 2009. |
The funds, Columbia Management, unaffiliated and affiliated subadvisers, and Columbia Management Investment Distributors, Inc. have each adopted a Code of Ethics (collectively, the “Codes”) and related procedures reasonably designed to prevent violations of Rule 204A-1 under the Investment Advisers Act of 1940 and Rule 17j-1 under the 1940 Act. The Codes contain provisions reasonably necessary to prevent a fund’s access persons from engaging in any conduct prohibited by paragraph (b) of Rule 17j-1, which indicates that it is unlawful for any affiliated person of or principal underwriter for a fund, or any affiliated persons of an investment adviser of or principal underwriter for a fund, in connection with the purchase or sale, directly or indirectly, by the person of a security held or to be acquired by a fund (i) to employ any device, scheme or artifice to defraud a fund; (ii) to make any untrue statement of a material fact to a fund or omit to state a material fact necessary in order to make the statements made to a fund, in light of the circumstance under which they are made, not misleading; (iii) to engage in any act, practice or course of business that operates or would operate as a fraud or deceit on a fund; or (iv) to engage in any manipulative practice with respect to a fund. The Codes prohibit personnel from engaging in personal investment activities that compete with or attempt to take advantage of planned portfolio transactions for the funds.
Copies of the Codes are on public file with the SEC and can be reviewed and copied at the SEC’s Public Reference Room in Washington, DC. The information on the operation of the SEC’s Public Reference Room may be obtained by calling the SEC at 1-202-942-8090. Copies of the Codes are also available on the EDGAR Database on the SEC’s Internet site at www.sec.gov. Copies of the Codes may also be obtained, after paying a duplicating fee, by electronic request at the following e-mail address: publicinfo@sec.gov, or by writing the SEC’s Public Reference Section, Washington, DC 20549-0102.
179
Control Persons and Principal Holders of Securities
The following table identifies those investors who, as of 30 days after the end of the fund’s fiscal period, owned 5% or more of any class of a fund’s shares and those investors who owned 25% or more of a fund’s shares (all share classes taken together). Investors who own more than 25% of a fund’s shares are presumed under securities laws to control the fund and would be able to determine the outcome of most issues that are submitted to shareholders for vote. The table is organized by fiscal year end. You can find your fund’s fiscal year end in Table 1.
Table 32. Control Persons and Principal Holders of Securities
As of 30 days after the end of the fund’s fiscal period:
| | | | | | | | | | |
| | | | | Fund Shares | | | Percent of Fund
(if greater than 25%) | |
Fund | | Shareholder name, city and state | | Share Class | | Percentage | | |
| | | | |
Funds with fiscal period ending January 31 | |
Columbia Income Builder Fund | | Charles Schwab & Co., Inc. (Charles Schwab) | | Class A | | 24.34 | % | | — | |
| | a brokerage firm in San Francisco, CA | | | | | | | | |
| | Columbia Management Investment Advisers, LLC (Columbia Management), Minneapolis, MN | | Class R4 | | 100.00 | % | | — | |
Columbia Income Builder Fund II | | Charles Schwab | | Class A | | 30.24 | % | | 26.31 | %(a) |
| | | | Class R4 | | 48.17 | % | | | |
| | Columbia Management | | Class R4 | | 51.83 | % | | — | |
Columbia Income Builder Fund III | | Charles Schwab | | Class A | | 30.62 | % | | 26.58 | %(a) |
| | | | Class R4 | | 74.05 | % | | | |
| | Columbia Management | | Class R4 | | 25.95 | % | | — | |
Columbia Portfolio Builder Aggressive | | Wells Fargo Bank NA (Wells Fargo Bank), Minneapolis, MN | | Class R4 | | 52.43 | % | | — | |
| | Charles Schwab | | Class R4 | | 30.18 | % | | — | |
| | GWFS Equities Inc. (GWFS Equities), Greenwood Village, CO | | Class R4 | | 12.50 | % | | — | |
Columbia Portfolio Builder Conservative | | Charles Schwab | | Class A | | 5.32 | % | | — | |
| | | | Class R4 | | 20.85 | % | | | |
| | Wells Fargo Bank | | Class R4 | | 59.72 | % | | — | |
| | Columbia Management | | Class R4 | | 13.92 | % | | — | |
| | GWFS Equities | | Class R4 | | 5.24 | % | | — | |
Columbia Portfolio Builder Moderate | | Charles Schwab | | Class R4 | | 54.79 | % | | — | |
| | Wells Fargo Bank | | Class R4 | | 32.25 | % | | — | |
| | MG Trust Company Cust. FBO Becker Tire & Treading, Inc., Denver, CO | | Class R4 | | 9.17 | % | | — | |
Columbia Portfolio Builder Moderate Aggressive | | Charles Schwab | | Class R4 | | 73.17 | % | | — | |
| | Fifth Third Bank TTEE, Cincinnati, OH | | Class R4 | | 11.66 | % | | — | |
| | MG Trust Company Cust. FBO Becker Tire & Treading, Inc., Denver, CO | | Class R4 | | 7.96 | % | | — | |
| | Wells Fargo Bank | | Class R4 | | 5.64 | % | | — | |
Columbia Portfolio Builder Moderate Conservative | | Charles Schwab | | Class R4 | | 57.77 | % | | — | |
| | Columbia Management | | Class R4 | | 30.33 | % | | — | |
| | Wells Fargo Bank | | Class R4 | | 11.90 | % | | — | |
180
| | | | | | | | | | |
Columbia Portfolio Builder Total Equity | | Wells Fargo Bank | | Class R4 | | 52.82 | % | | — | |
| | Charles Schwab | | Class R4 | | 43.75 | % | | — | |
RiverSource S&P 500 Index | | Charles Schwab | | Class A | | 100.00 | % | | 35.16 | %(a) |
| | | | Class Z | | 21.47 | % | | | |
| | Wachovia Bank NA (Wachovia Bank), Charlotte, NC | | Class Z | | 78.44 | % | | 64.76 | %(a) |
RiverSource Small Company Index | | Charles Schwab | | Class A | | 6.24 | % | | — | |
| | | | Class R4 | | 5.65 | % | | | |
| | Wachovia Bank | | Class R4 | | 80.56 | % | | — | |
Funds with fiscal period ending March 31 | | | | | | | | |
Columbia Equity Value | | Charles Schwab | | Class A | | 5.37 | % | | — | |
| | Columbia Management | | Class R | | 21.35 | % | | — | |
| | | | Class R5 | | 100.00 | % | | — | |
| | | | Class W | | 100.00 | % | | — | |
| | Columbia Portfolio Builder Aggressive Fund | | Class I | | 17.81 | % | | — | |
| | Columbia Portfolio Builder Moderate Fund | | Class I | | 25.96 | % | | — | |
| | Columbia Portfolio Builder Moderate Aggressive Fund | | Class I | | 29.71 | % | | — | |
| | Columbia Portfolio Builder Moderate Conservative Fund | | Class I | | 6.55 | % | | — | |
| | Columbia Portfolio Builder Total Equity Fund | | Class I | | 17.70 | % | | — | |
| | MG Trust Company, FBO Alumaline Corp. of America, Denver, CO | | Class R | | 71.11 | % | | — | |
| | Frontier Trust Company, FBO Aurora Packing Company 401K, Fargo, ND | | Class R | | 7.54 | % | | — | |
| | John Hancock Life Insurance Company, Buffalo, NY | | Class R4 | | 74.65 | % | | — | |
| | Wachovia Bank | | Class R3 | | 96.49 | % | | — | |
| | | | Class R4 | | 19.20 | % | | — | |
RiverSource Precious Metals and Mining | | Charles Schwab | | Class A | | 12.26 | % | | — | |
| | | | Class R4 | | 57.96 | % | | — | |
| | Columbia Management | | Class I | | 100.00 | % | | — | |
| | Merrill Lynch Pierce Fenner & Smith (MLP Fenner & Smith), Jacksonville, FL | | Class C | | 13.50 | % | | — | |
| | Frontier Trust Company, FBO Jacinto Medical Group PA 401K, Fargo, ND | | Class R4 | | 32.22 | % | | — | |
| | MG Trust Company, FBO Saddle Butte Operating, Denver, CO | | Class R4 | | 7.99 | % | | — | |
Funds with fiscal period ending April 30 | | | | | | | | |
Columbia 120/20 Contrarian Equity Columbia Recovery and Infrastructure | | Columbia Management | | Class I | | 100.00 | % | | — | |
| | | | Class R5 | | 100.00 | % | | | |
| | Columbia Management | | Class R | | 24.00 | % | | — | |
| | | | Class R3 | | 100.00 | % | | | |
| | | | Class R5 | | 33.12 | % | | | |
| | Columbia Portfolio Builder Aggressive | | Class I | | 17.50 | % | | — | |
| | Columbia Portfolio Builder Moderate | | Class I | | 26.33 | % | | — | |
| | Columbia Portfolio Builder Moderate Aggressive | | Class I | | 29.60 | % | | — | |
| | Columbia Portfolio Builder Moderate Conservative | | Class I | | 6.80 | % | | — | |
| | Columbia Portfolio Builder Total Equity | | Class I | | 17.31 | % | | — | |
| | Charles Schwab | | Class R5 | | 66.86 | % | | — | |
| | Frontier Trust Company FBO Brian P. Sommer | | Class R | | 75.00 | % | | — | |
181
| | | | | | | | | | |
| | American Enterprise Investment Services Inc. (American Enterprise Investment Services), Minneapolis, MN | | Class R4 | | 29.19 | % | | — | |
| | NFS LLC FEBO Cisco Systems Inc., Acton, MA | | Class R4 | | 5.96 | % | | — | |
Columbia Retirement Plus 2010 | | Columbia Management | | Class R | | 100.00 | % | | — | |
| | | | Class R3 | | 100.00 | % | | | |
| | | | Class R4 | | 100.00 | % | | | |
| | | | Class R5 | | 100.00 | % | | | |
| | Wachovia Bank | | Class Z | | 100.00 | % | | 63.98 | %(a) |
Columbia Retirement Plus 2015 | | Columbia Management | | Class R | | 100.00 | % | | — | |
| | | | Class R3 | | 100.00 | % | | | |
| | | | Class R4 | | 100.00 | % | | | |
| | | | Class R5 | | 100.00 | % | | | |
| | Wachovia Bank | | Class Z | | 100.00 | % | | 76.23 | %(a) |
Columbia Retirement Plus 2020 | | Columbia Management | | Class R3 | | 100.00 | % | | — | |
| | | | Class R4 | | 100.00 | % | | | |
| | | | Class R5 | | 100.00 | % | | | |
| | David T. Matthiesen, Littleton, CO | | Class A | | 8.38 | % | | — | |
| | MG Trust Company FBO Applied Reliability Engineering, Denver, CO | | Class R | | 80.49 | % | | — | |
| | Matrix Capital Bank MSCS (Matrix Capital), Denver, CO | | Class R | | 14.86 | % | | — | |
| | Wachovia Bank | | Class Z | | 100.00 | % | | 75.54 | %(a) |
Columbia Retirement Plus 2025 | | Columbia Management | | Class R | | 16.35 | % | | — | |
| | | | Class R3 | | 100.00 | % | | | |
| | | | Class R4 | | 100.00 | % | | | |
| | | | Class R5 | | 100.00 | % | | | |
| | Eric Taketa, Wailuku, Hi | | Class A | | 8.10 | % | | — | |
| | Anthony D. and Rebecca H. Marken, Lexington, MA | | Class A | | 5.78 | % | | — | |
| | Matrix Capital | | Class R | | 83.64 | % | | — | |
| | Wachovia Bank | | Class Z | | 100.00 | % | | 87.25 | %(a) |
Columbia Retirement Plus 2030 | | Columbia Management | | Class R | | 31.82 | % | | — | |
| | | | Class R3 | | 100.00 | % | | | |
| | | | Class R4 | | 100.00 | % | | | |
| | | | Class R5 | | 100.00 | % | | | |
| | John C. Bukowski, Suffern, NY | | Class A | | 10.12 | % | | — | |
| | Steven and Teresa Bockian, Orlando, FL | | Class A | | 5.89 | % | | — | |
| | MG Trust Company FBO Applied Reliability Engineering, Denver, CO | | Class R | | 68.18 | % | | — | |
| | Wachovia Bank | | Class Z | | 100.00 | % | | 87.56 | %(a) |
Columbia Retirement Plus 2035 | | Columbia Management | | Class R | | 100.00 | % | | — | |
| | | | Class R3 | | 100.00 | % | | | |
| | | | Class R4 | | 100.00 | % | | | |
| | | | Class R5 | | 100.00 | % | | | |
| | Gary L. and Karen L. Fournier, Vicksburg, MS | | Class A | | 7.30 | % | | — | |
| | Richard and Stefanie A. Nelson, Hot Springs, SD | | Class A | | 5.23 | % | | — | |
| | Wachovia Bank | | Class Z | | 99.87 | % | | 89.55 | %(a) |
182
| | | | | | | | | | |
Columbia Retirement Plus 2040 | | Columbia Management | | Class R | | 32.46 | % | | — | |
| | | | Class R3 | | 100.00 | % | | | |
| | | | Class R4 | | 100.00 | % | | | |
| | | | Class R5 | | 100.00 | % | | | |
| | Matrix Capital | | Class R | | 67.53 | % | | — | |
| | Wachovia Bank | | Class Z | | 98.82 | % | | 86.36 | %(a) |
Columbia Retirement Plus 2045 | | Columbia Management | | Class R | | 82.98 | % | | — | |
| | | | Class R3 | | 100.00 | % | | | |
| | | | Class R4 | | 28.19 | % | | | |
| | | | Class R5 | | 100.00 | % | | | |
| | MG Trust Company FBO Applied Reliability Engineering, Denver, CO | | Class R | | 17.02 | % | | — | |
| | Scottrade Inc. FBO Michael C. Davis, St. Louis, MO | | Class R4 | | 71.81 | % | | — | |
| | Wachovia Bank | | Class Z | | 100.00 | % | | 88.66 | %(a) |
Funds with fiscal period ending May 31 | | | | | | | | |
Columbia High Yield Bond | | MLP Fenner & Smith | | Class C | | 14.76 | % | | — | |
| | | | Class R | | 69.10 | % | | | |
| | Columbia Income Builder Fund | | Class I | | 21.74 | % | | — | |
| | Columbia Income Builder Fund II | | Class I | | 37.23 | % | | — | |
| | Columbia Income Builder Fund III | | Class I | | 23.77 | % | | — | |
| | American Enterprise Investment Services | | Class W | | 99.99 | % | | — | |
| | ING Life Insurance and Annuity (ING), Hartford, CT | | Class R3 | | 89.20 | % | | — | |
| | | | Class R4 | | 93.78 | % | | | |
| | Massachusetts Mutual | | Class R3 | | 6.29 | % | | — | |
| | US Bank National Association, Milwaukee, WI | | Class R5 | | 99.52 | % | | — | |
Columbia Multi-Advisor Small Cap Value | | Columbia Portfolio Builder Aggressive Fund | | Class I | | 16.51 | % | | — | |
| | Columbia Portfolio Builder Moderate Fund | | Class I | | 30.26 | % | | — | |
| | Columbia Portfolio Builder Moderate Aggressive Fund | | Class I | | 33.96 | % | | — | |
| | Columbia Portfolio Builder Moderate Conservative Fund | | Class I | | 7.68 | % | | — | |
| | Columbia Portfolio Builder Total Equity Fund | | Class I | | 8.91 | % | | — | |
| | Christa Fischer FBO Photo Systems Inc. 401K, Dexter, MI | | Class R | | 5.94 | % | | — | |
| | Robert Guglielmo FBO Grid Electric Inc. | | Class R | | 5.16 | % | | — | |
| | 401K. Chester Springs, PA | | | | | | | | |
| | Hartford Life Insurance Company (Hartford Life), Weatogue, CT | | Class R | | 84.79 | % | | — | |
| | | | Class R3 | | 21.70 | % | | | |
| | PIMS/Prudential Retirement, Boston, MA | | Class R3 | | 66.20 | % | | — | |
| | Reliance Trust Co. FBO VHFA, Atlanta, GA | | Class R3 | | 7.83 | % | | — | |
| | VRSCO FBO Pullman Regional Hospital, Houston, TX | | Class R4 | | 41.18 | % | | — | |
| | American Enterprise Investment Services | | Class R4 | | 30.00 | % | | — | |
| | Edward Dopkin FBO Classic Catering People Inc., Owings Mills, MD | | Class R4 | | 5.74 | % | | — | |
| | JP Morgan Chase Bank, Kansas City, MO | | Class R5 | | 99.94 | % | | — | |
Columbia U.S. Government Mortgage | | Columbia Income Builder Fund | | Class I | | 25.69 | % | | 55.94 | %(a) |
| | Columbia Income Builder Fund II | | Class I | | 31.90 | % | | — | |
| | Columbia Income Builder Fund III | | Class I | | 11.28 | % | | — | |
| | Columbia Portfolio Builder Moderate Fund | | Class I | | 12.20 | % | | — | |
| | Columbia Portfolio Builder Moderate Aggressive Fund | | Class I | | 7.16 | % | | — | |
183
| | | | | | | | | | |
| | Columbia Portfolio Builder Moderate Conservative Fund | | Class I | | 5.80 | % | | — | |
| | RiverSource Life Insurance Company, Minneapolis, MN | | Class R4 | | 12.12 | % | | — | |
| | MLP Fenner & Smith | | Class C | | 5.25 | % | | — | |
| | Counsel Trust FBO Harvard Mgmt Solutions, Pittsburgh, PA | | Class R4 | | 30.76 | % | | — | |
| | American Enterprise Investment Services | | Class R4 | | 30.75 | % | | — | |
| | Frontier Trust Co. FBO URY & Moskow LLC, Fargo, ND | �� | Class R4 | | 17.70 | % | | — | |
RiverSource Partners Fundamental Value | | Columbia Portfolio Builder Aggressive Fund | | Class I | | 17.66 | % | | 32.17 | %(a) |
| | Columbia Portfolio Builder Moderate Fund | | Class I | | 26.20 | % | | — | |
| | Columbia Portfolio Builder Moderate Aggressive Fund | | Class I | | 29.64 | % | | — | |
| | Columbia Portfolio Builder Moderate Conservative Fund | | Class I | | 6.66 | % | | — | |
| | Columbia Portfolio Builder Total Equity Fund | | Class I | | 17.53 | % | | — | |
| | American Enterprise Investment Services | | Class R4 | | 83.80 | % | | — | |
| | Columbia Management | | Class R4 | | 5.73 | % | | — | |
RiverSource Short Duration U.S. Government | | Columbia Management | | Class W | | 100.00 | % | | — | |
| | Columbia Portfolio Builder Conservative Fund | | Class I | | 43.31 | % | | — | |
| | Columbia Portfolio Builder Moderate Conservative Fund | | Class I | | 39.88 | % | | — | |
| | Columbia Portfolio Builder Moderate Fund | | Class I | | 16.80 | % | | — | |
| | MLP Fenner & Smith | | Class R | | 79.26 | % | | — | |
| | Frontier Trust Co. FBO North Alabama Insurance, Fargo, ND | | Class R | | 7.93 | % | | — | |
| | Wachovia Bank | | Class R4 | | 98.92 | % | | — | |
Funds with fiscal period ending June 30 | | | | | | | | |
Columbia Dividend Opportunity | | Columbia Management | | Class R3 | | 100.00 | % | | — | |
| | | | Class W | | 100.00 | % | | — | |
| | Columbia Income Builder Fund | | Class I | | 10.12 | % | | — | |
| | Columbia Income Builder Fund II | | Class I | | 19.29 | % | | — | |
| | Columbia Income Builder Fund III | | Class I | | 8.56 | % | | — | |
| | Columbia Portfolio Builder Aggressive Fund | | Class I | | 10.93 | % | | — | |
| | Columbia Portfolio Builder Moderate Fund | | Class I | | 16.35 | % | | — | |
| | Columbia Portfolio Builder Moderate Aggressive Fund | | Class I | | 18.32 | % | | — | |
| | Columbia Portfolio Builder Total Equity Fund | | Class I | | 10.80 | % | | — | |
| | MLP Fenner & Smith | | Class R | | 97.90 | % | | — | |
| | VRSCO FBO Hamilton Healthcare, Houston, TX | | Class R4 | | 64.38 | % | | — | |
| | American Enterprise Investment Services | | Class R4 | | 6.76 | % | | — | |
| | Securian Financial Services, St. Paul, MN | | Class R5 | | 38.12 | % | | — | |
| | Counsel Trust FBO Bennett Tueller Johnson & Deere, Pittsburgh, PA | | Class R5 | | 15.11 | % | | — | |
| | TD Ameritrade Trust Co., Denver CO | | Class R5 | | 13.55 | % | | — | |
| | Counsel Trust FBO Western Gynecological Clinic, Pittsburgh, PA | | Class R5 | | 12.04 | % | | — | |
184
| | | | | | | | | | |
| | Counsel Trust FBO Utah Woolen Mills Profit Sharing Plan, Pittsburgh, PA | | Class R5 | | 12.01 | % | | — | |
| | NFS LLC FEBO Sylvia C San Martin TTEE, St. Augustine, FL | | Class R5 | | 7.89 | % | | — | |
RiverSource Real Estate | | Columbia Management | | Class R4 | | 12.42 | % | | 68.41 | %(a) |
| | | | Class W | | 100.00 | % | | | |
| | Columbia Income Builder Fund II | | Class I | | 13.28 | % | | — | |
| | Columbia Income Builder Fund III | | Class I | | 10.48 | % | | — | |
| | Columbia Portfolio Builder Aggressive Fund | | Class I | | 9.81 | % | | — | |
| | Columbia Portfolio Builder Moderate Fund | | Class I | | 23.04 | % | | — | |
| | Columbia Portfolio Builder Moderate Aggressive Fund | | Class I | | 18.72 | % | | — | |
| | Columbia Portfolio Builder Moderate Conservative Fund | | Class I | | 8.24 | % | | — | |
| | Columbia Portfolio Builder Total Equity Fund | | Class I | | 8.21 | % | | — | |
| | American Enterprise Investment Services | | Class R4 | | 87.58 | % | | — | |
For funds with fiscal period ending July 31 | | | | | | | | |
Columbia Floating Rate | | Columbia Management | | Class R5 | | 100.00 | % | | 27.75 | %(a) |
| | | | Class W | | 100.00 | % | | — | |
| | Columbia Income Builder Fund | | Class I | | 12.28 | % | | — | |
| | Columbia Income Builder Fund II | | Class I | | 35.22 | % | | — | |
| | Columbia Income Builder Fund III | | Class I | | 21.95 | % | | — | |
| | Columbia Portfolio Builder Moderate Fund | | Class I | | 12.95 | % | | — | |
| | Columbia Portfolio Builder Moderate Aggressive Fund | | Class I | | 9.21 | % | | — | |
| | Columbia Portfolio Builder Moderate Conservative Fund | | Class I | | 6.17 | % | | — | |
| | Charles Schwab | | Class A | | 6.52 | % | | — | |
| | MLP Fenner & Smith | | Class C | | 9.19 | % | | — | |
| | American Enterprise Investment Services | | Class R4 | | 64.03 | | | — | |
| | NFS LLC FEBO American Trust & Svgs, Dubuque, IA | | Class R4 | | 7.31 | % | | — | |
Columbia Income Opportunities | | Columbia Portfolio Builder Aggressive Fund | | Class I | | 5.58 | % | | — | |
| | Columbia Portfolio Builder Moderate Fund | | Class I | | 39.73 | % | | — | |
| | Columbia Portfolio Builder Moderate Aggressive Fund | | Class I | | 22.91 | % | | — | |
| | Columbia Portfolio Builder Moderate Conservative Fund | | Class I | | 18.80 | % | | — | |
| | Columbia Income Builder Fund II | | Class I | | 6.41 | % | | — | |
| | MLP Fenner & Smith | | Class B | | 6.32 | % | | — | |
| | | | Class C | | 8.83 | % | | — | |
| | Morgan Stanley Smith Barney, Jersey City, NJ | | Class C | | 7.78 | % | | — | |
| | American Enterprise Investment Services | | Class R4 | | 12.78 | % | | — | |
| | GWFS Equities | | Class R4 | | 84.82 | % | | — | |
Columbia Inflation Protected Securities | | RiverSource Life Insurance Company, Minneapolis, MN | | Class R4 | | 13.62 | % | | 31.95 | %(a) |
| | Columbia Income Builder Fund | | Class I | | 9.81 | % | | — | |
| | Columbia Income Builder Fund II | | Class I | | 9.74 | % | | — | |
| | Columbia Portfolio Builder Conservative Fund | | Class I | | 10.06 | % | | — | |
| | Columbia Portfolio Builder Moderate Fund | | Class I | | 28.92 | % | | — | |
| | Columbia Portfolio Builder Moderate Aggressive Fund | | Class I | | 16.65 | % | | — | |
| | Columbia Portfolio Builder Moderate Conservative Fund | | Class I | | 13.74 | % | | — | |
| | Citigroup Global Markets, Owings Mills, MD | | Class C | | 15.08 | % | | — | |
| | MLP Fenner & Smith | | Class C | | 9.31 | % | | — | |
| | | | Class R | | 64.40 | % | | — | |
| | Frontier Trust Co. FBO Moen 401K, Fargo, ND | | Class R | | 5.97 | % | | — | |
185
| | | | | | | | | |
| | Frontier Trust Co. FBO B & L Corp. 401K, Fargo, ND | | Class R | | 5.91 | % | | — |
| | Frontier Trust Co. FBO C. Anthony Phillips Accountancy, Fargo, ND | | Class R | | 5.91 | % | | — |
| | Matrix Capital Bank MSCS, Denver, Co | | Class R4 | | 68.92 | % | | — |
| | RiverSource Life Insurance Co. | | Class R4 | | 7.21 | % | | — |
| | American Enterprise Investment Services Inc. | | Class W | | 99.96 | % | | — |
Columbia Large Core Quantitative | | Columbia Management | | Class R | | 100.00 | % | | — |
| | Disciplined Asset Allocation Moderate Fund | | Class I | | 6.94 | % | | — |
| | Columbia Portfolio Builder Aggressive Fund | | Class I | | 10.92 | % | | — |
| | Columbia Portfolio Builder Moderate Fund | | Class I | | 16.57 | % | | — |
| | Columbia Portfolio Builder Moderate Aggressive Fund | | Class I | | 18.58 | % | | — |
| | Columbia Portfolio Builder Total Equity Fund | | Class I | | 10.77 | % | | — |
| | American Enterprise Investment Services | | Class W | | 99.99 | % | | — |
| | MLP Fenner & Smith | | Class C | | 9.73 | % | | — |
| | | | Class R | | 78.57 | % | | — |
| | Wachovia Bank | | Class R4 | | 95.66 | % | | — |
| | | | Class R5 | | 99.91 | % | | — |
Columbia Limited Duration Credit | | Columbia Management | | Class W | | 100.00 | % | | — |
| | Columbia Portfolio Builder Conservative Fund | | Class I | | 38.30 | % | | — |
| | Columbia Portfolio Builder Moderate Fund | | Class I | | 13.20 | % | | — |
| | Columbia Portfolio Builder Moderate Aggressive Fund | | Class I | | 7.60 | % | | — |
| | Columbia Portfolio Builder Moderate Conservative Fund | | Class I | | 35.57 | % | | — |
| | MLP Fenner & Smith | | Class C | | 9.58 | % | | — |
| | American Enterprise Investment Services Inc. | | Class R4 | | 85.91 | % | | — |
Columbia Money Market | | Columbia Management | | Class R | | 100.00 | % | | — |
| | Columbia Income Builder Fund | | Class I | | 35.70 | % | | — |
| | Columbia Portfolio Builder Conservative Fund | | Class I | | 52.27 | % | | — |
| | Columbia Management | | Class B | | 6.67 | % | | — |
| | Columbia Management | | Class C | | 28.62 | % | | — |
| | Frontier Trust Co. FBO Mythics, Inc. 401K, Fargo, ND | | Class R5 | | 54.23 | % | | — |
| | Frontier Trust Co. FBO Greatmats.com Corp., Fargo, ND | | Class R5 | | 30.29 | % | | — |
| | Counsel Trust DBA MATC FBO Harvard Management Solutions 401K, Pittsburgh, PA | | Class R5 | | 5.67 | % | | — |
| | American Enterprise Investment Services | | Class W | | 99.99 | % | | — |
| | Wachovia Bank | | Class Y | | 99.67 | % | | — |
| | Columbia Management | | Class Z | | 99.97 | % | | — |
186
| | | | | | | | | | |
RiverSource Disciplined Small and Mid Cap Equity | | Columbia Management | | Class R4 | | 82.91 | % | | — | |
| | Disciplined Asset Allocation Aggressive Fund | | Class I | | 7.82 | % | | — | |
| | Disciplined Asset Allocation Moderate Fund | | Class I | | 22.13 | % | | — | |
| | Disciplined Asset Allocation Moderately Aggressive Fund | | Class I | | 16.28 | % | | — | |
| | Disciplined Asset Allocation Moderately Conservative Fund | | Class I | | 8.42 | % | | — | |
| | Columbia Retirement Plus Fund 2020 | | Class I | | 5.77 | % | | — | |
| | Columbia Retirement Plus Fund 2025 | | Class I | | 7.60 | % | | — | |
| | Columbia Retirement Plus Fund 2030 | | Class I | | 7.31 | % | | — | |
| | Columbia Retirement Plus Fund 2035 | | Class I | | 5.60 | % | | — | |
| | Brian C. Burghardt, Glendale, WI | | Class B | | 6.39 | % | | — | |
| | Louiselle A. Pilegi, Agawam,MA | | Class B | | 6.21 | % | | — | |
| | Jennifer Woolbright, Reston, VA | | Class C | | 14.29 | % | | — | |
| | Carl L. and Vicki L. Ulepich, Frontenac, KS | | Class C | | 10.98 | % | | — | |
| | Patrick J. and Edilia I. Powers, Forest Park, IL | | Class C | | 9.95 | % | | — | |
| | Mary Caroline Walsh Murguia, San Antonio, TX | | Class C | | 7.45 | % | | — | |
| | American Enterprise Investment Services | | Class R4 | | 17.09 | % | | — | |
| | | | Class W | | 99.99 | % | | — | |
RiverSource Disciplined Small Cap Value | | Columbia Management | | Class B | | 6.09 | % | | 91.93 | %(a) |
| | | | Class C | | 6.42 | % | | | |
| | | | Class R | | 100.00 | % | | | |
| | | | Class R3 | | 67.31 | % | | | |
| | Columbia Income Builder Fund | | Class I | | 29.39 | % | | — | |
| | Columbia Income Builder Fund II | | Class I | | 46.90 | % | | — | |
| | Columbia Income Builder Fund III | | Class I | | 23.69 | % | | — | |
| | Eric B. and Lucilla Henderson, Lake Jackson, TX | | Class B | | 9.49 | % | | — | |
| | Doris M. Tole, Pittsburgh, PA | | Class B | | 9.21 | % | | — | |
| | Kenneth E. Farnen, Homer, AK | | Class B | | 9.01 | % | | — | |
| | Marilyn A. and Gary F. Consorto, Vonore, TN | | Class B | | 6.13 | % | | — | |
| | Donald R. Chmielewski, Isle, MN | | Class B | | 5.65 | % | | — | |
| | Morgan Stanley Smith Barney, Jersey City, NJ | | Class C | | 20.08 | % | | — | |
| | Sanford A. Greentree, Westlake Vlg, CA | | Class C | | 19.83 | % | | — | |
| | Jill Thompson, Moundsview, MN | | Class C | | 9.29 | % | | — | |
| | Bea Vande Merwe, Salt Lake City, UT | | Class C | | 9.07 | % | | — | |
| | Timothy E. Releford, New York, NY | | Class C | | 8.66 | % | | — | |
| | Richard T. Castiano, Fort Myers, FL | | Class C | | 7.81 | % | | — | |
| | MG Trust Company, Denver, CO | | Class R3 | | 32.69 | % | | — | |
Funds with fiscal period ending August 31 | | | | | | | | |
Columbia Diversified Bond | | Columbia Management | | Class R | | 12.90 | % | | — | |
| | | | Class R3 | | 100.00 | % | | | |
| | American Enterprise Investment Services | | Class W | | 99.96 | % | | — | |
| | Charles Schwab | | Class A | | 7.77 | % | | — | |
| | Citigroup Global Markets | | Class C | | 18.12 | % | | — | |
| | MLP Fenner & Smith | | Class C | | 8.71 | % | | — | |
| | | | Class R | | 10.60 | % | | | |
| | Columbia Portfolio Builder Conservative Fund | | Class I | | 6.60 | % | | — | |
| | Columbia Portfolio Builder Moderate Fund | | Class I | | 36.40 | % | | — | |
| | Columbia Portfolio Builder Moderate Aggressive Fund | | Class I | | 21.02 | % | | — | |
| | Columbia Portfolio Builder Moderate Conservative Fund | | Class I | | 13.84 | % | | — | |
| | Frontier Trust Company (Frontier Trust Company) FBO Thomas J. King, Fargo, ND | | Class R | | 41.37 | % | | — | |
| | MG Trust Company FBO Cardinal Buses Inc., Denver, CO | | Class R | | 11.67 | % | | — | |
187
| | | | | | | | | | |
| | MG Trust Company FBO Andreini Bros. Inc., Denver, CO | | Class R | | 6.59 | % | | — | |
| | Wachovia Bank | | Class R4 | | 98.54 | % | | — | |
| | Patricks Plain LLC (Patricks Plain LLC), Easton, MD | | Class R5 | | 67.87 | % | | — | |
| | American Enterprise Investment Services | | Class R5 | | 28.83 | % | | — | |
Columbia Minnesota Tax-Exempt | | None | | None | | N/A | | | — | |
RiverSource California Tax-Exempt | | Charles Schwab | | Class A | | 5.50 | % | | — | |
| | Anna M. Hunt Woods, Playa Vista, CA | | Class B | | 5.52 | % | | — | |
| | Wells Fargo Investments LLC, Minneapolis, MN | | Class C | | 13.62 | % | | — | |
| | Robert W. Baird & Co. Inc., Milwaukee, WI | | Class C | | 6.60 | % | | — | |
| | First Clearing, LLC, Buza Family Trust, Cardiff, CA | | Class C | | 5.22 | % | | — | |
RiverSource New York Tax-Exempt | | Charles Schwab | | Class A | | 11.22 | % | | — | |
| | Emmanuel and Nina Santos, Johnstown, NY | | Class B | | 6.98 | % | | — | |
| | Leroy and Janice M. Clark, Newburgh, NY | | Class B | | 5.64 | % | | — | |
| | Thomas W. and Susan M. Noonan, Clifton Park, NY | | Class C | | 13.91 | % | | — | |
| | Ena S. Ryan, Brooklyn, NY | | Class C | | 6.85 | % | | — | |
Funds with fiscal period ending September 30 | | | | | | | | |
Columbia Large Growth Quantitative | | Columbia Management | | Class R | | 100.00 | % | | 29.22 | %(a) |
| | | | Class R3 | | 100.00 | % | | | |
| | | | Class R4 | | 73.56 | % | | | |
| | | | Class R5 | | 100.00 | % | | | |
| | Columbia Portfolio Builder Aggressive Fund | | Class I | | 14.51 | % | | — | |
| | Columbia Portfolio Builder Moderate Fund | | Class I | | 19.98 | % | | — | |
| | Columbia Portfolio Builder Moderate Aggressive Fund | | Class I | | 23.99 | % | | — | |
| | Columbia Portfolio Builder Moderate Conservative Fund | | Class I | | 5.01 | % | | — | |
| | Columbia Portfolio Builder Total Equity Fund | | Class I | | 14.91 | % | | — | |
| | Matrix Capital | | Class R4 | | 26.44 | % | | — | |
| | MLP Fenner & Smith | | Class C | | 47.00 | % | | — | |
| | American Enterprise Investment Services Inc. | | Class W | | 99.99 | % | | — | |
Columbia Large Value Quantitative | | Columbia Management | | Class B | | 13.40 | % | | — | |
| | | | Class C | | 28.20 | % | | | |
| | | | Class R | | 100.00 | % | | | |
| | | | Class R3 | | 100.00 | % | | | |
| | | | Class R4 | | 56.29 | % | | | |
| | | | Class R5 | | 100.00 | % | | | |
| | Columbia Income Builder Fund | | Class I | | 18.55 | % | | — | |
| | Columbia Income Builder Fund II | | Class I | | 11.47 | % | | — | |
| | Disciplined Asset Allocation Portfolio Moderate | | Class I | | 17.40 | % | | — | |
| | Disciplined Asset Allocation Portfolio Moderately Aggressive | | Class I | | 13.26 | % | | — | |
| | Disciplined Asset Allocation Portfolio Moderately Conservative | | Class I | | 7.55 | % | | — | |
| | Disciplined Asset Allocation Portfolio Aggressive | | Class I | | 6.44 | % | | — | |
188
| | | | | | | | | |
| | American Enterprise Investment Services Inc. | | Class W | | 99.99 | % | | — |
| | Charles Schwab | | Class A | | 5.22 | % | | — |
| | | | Class R4 | | 43.71 | % | | |
| | Paul W. Eastman, Dublin, OH | | Class A | | 7.20 | % | | — |
| | Michael G. and Kristine M. Boland, Inver Grove, MN | | Class A | | 6.73 | % | | — |
| | Richard L. and Ann Gail Monnett, Mc Lean, VA | | Class A | | 6.44 | % | | — |
| | Paul D. Mattingly, Brandenburg, KY | | Class B | | 25.36 | % | | — |
| | Tseng-Yen Yen, Fullerton, CA | | Class B | | 20.47 | % | | — |
| | Alan R. and Michael S. Vinacke, Chuluota, FL | | Class B | | 19.00 | % | | — |
| | Jane J. Haash, Milwaukee, WI | | Class B | | 6.33 | % | | — |
| | Joseph M. Aquilar, Denver, CO | | Class C | | 19.21 | % | | — |
| | Charles P. and Judith G. Price, Aurora, CO | | Class C | | 15.16 | % | | — |
| | Gregory L. Norgaard, Aurora, CO | | Class C | | 14.00 | % | | — |
| | Anthony and Jeanne M. Vernell, Athens, OH | | Class C | | 13.16 | % | | — |
| | Dean Gabbert, Dorchester, MA | | Class C | | 5.50 | % | | — |
Columbia Diversified Equity Income | | Columbia Management | | Class W | | 100.00 | % | | — |
| | Columbia Portfolio Builder Aggressive Fund | | Class I | | 18.11 | % | | — |
| | Columbia Portfolio Builder Moderate Fund | | Class I | | 24.95 | % | | — |
| | Columbia Portfolio Builder Moderate Aggressive Fund | | Class I | | 29.91 | % | | — |
| | Columbia Portfolio Builder Moderate Conservative Fund | | Class I | | 6.26 | % | | — |
| | Columbia Portfolio Builder Total Equity Fund | | Class I | | 18.60 | % | | — |
| | Charles Schwab | | Class A | | 21.38 | % | | — |
| | Hartford Life | | Class R | | 61.20 | % | | — |
| | Hartford Securities Distribution Company Inc., Hartford, CT | | Class R | | 12.22 | % | | — |
| | GWFS Equities | | Class R3 | | 80.99 | % | | — |
| | | | Class R4 | | 9.55 | % | | |
| | Wachovia Bank | | Class R | | 17.75 | % | | — |
| | | | Class R3 | | 8.52 | % | | |
| | | | Class R4 | | 30.99 | % | | |
| | | | Class R5 | | 29.75 | % | | |
| | Wells Fargo Bank | | Class R4 | | 25.70 | % | | — |
| | American Century Investments, Kansas City, MO | | Class R4 | | 6.24 | % | | — |
| | ING | | Class R4 | | 12.55 | % | | — |
| | | | Class R5 | | 32.31 | % | | |
| | Ameriprise Trust Company | | Class R5 | | 7.85 | % | | — |
| | Taynik & Co., Boston, MA | | Class R5 | | 7.73 | % | | — |
| | Mercer Trust Company FBO Johnson Outdoors Inc., Norwood, MA | | Class R5 | | 7.45 | % | | — |
Columbia Mid Cap Value Opportunity | | Columbia Management | | Class W | | 100.00 | % | | — |
| | Columbia Portfolio Builder Aggressive Fund | | Class I | | 18.14 | % | | — |
| | Columbia Portfolio Builder Moderate Fund | | Class I | | 25.01 | % | | — |
| | Columbia Portfolio Builder Moderate Aggressive Fund | | Class I | | 29.79 | % | | — |
| | Columbia Portfolio Builder Moderate Conservative Fund | | Class I | | 6.26 | % | | — |
| | Columbia Portfolio Builder Total Equity Fund | | Class I | | 18.62 | % | | — |
| | Charles Schwab | | Class A | | 31.64 | % | | — |
| | | | Class R5 | | 6.65 | % | | |
| | Prudential Investment Management Services LLC, Newark, NJ | | Class A | | 15.08 | % | | — |
| | MLP Fenner & Smith | | Class C | | 17.57 | % | | — |
| | | | Class R5 | | 5.28 | % | | |
| | Citigroup Global Markets | | Class C | | 5.60 | % | | — |
| | Hartford Life | | Class R | | 75.44 | % | | — |
189
| | | | | | | | | |
| | | | Class R3 | | 14.09 | % | | |
| | Hartford Securities Distribution Company Inc., Hartford, CT | | Class R | | 5.41 | % | | — |
| | JPMorgan Chase Bank, New York, NY | | Class R3 | | 12.25 | % | | — |
| | GWFS Equities | | Class R3 | | 44.59 | % | | — |
| | Wachovia Bank | | Class R3 | | 6.31 | % | | — |
| | | | Class R4 | | 16.63 | % | | |
| | ING | | Class R4 | | 28.31 | % | | — |
| | | | Class R5 | | 12.08 | % | | |
| | John Hancock Life Insurance Company, Buffalo, NY | | Class R4 | | 22.85 | % | | — |
| | NFS LLC FEBO, Chicago, IL | | Class R5 | | 12.73 | % | | — |
| | PIMS/Prudential Retirement, Greenville, SC | | Class R5 | | 9.64 | % | | — |
| | Standard Insurance Company, Portland, OR | | Class R5 | | 17.20 | % | | — |
Columbia Strategic Allocation | | Columbia Management | | Class I | | 100.00 | % | | — |
| | | | Class R | | 100.00 | % | | |
| | | | Class R3 | | 100.00 | % | | |
| | | | Class R5 | | 100.00 | % | | |
| | Charles Schwab | | Class A | | 7.60 | % | | — |
| | | | Class R4 | | 91.62 | % | | |
| | Fifth Third Bank TTEE FBO Speng Nath SE PS, Cincinnati, OH | | Class R4 | | 8.21 | % | | — |
RiverSource Balanced | | Columbia Management | | Class R5 | | 38.56 | % | | — |
| | MLP Fenner & Smith | | Class C | | 7.66 | % | | — |
| | | | Class R | | 80.66 | % | | |
| | Citigroup Global Markets | | Class C | | 5.88 | % | | — |
| | Frontier Trust Company FBO B&L Corporation | | Class R | | 14.39 | % | | — |
| | Wachovia Bank | | Class R4 | | 99.98 | % | | — |
| | American Enterprise Investment Services Inc. | | Class R5 | | 57.76 | % | | — |
| | | | |
RiverSource Strategic Income Allocation | | Columbia Management | | Class R | | 100.00 | % | | — |
| | | | Class R3 | | 100.00 | % | | |
| | | | Class R4 | | 6.90 | % | | |
| | | | Class R5 | | 100.00 | % | | |
| | Charles Schwab | | Class A | | 41.85 | % | | — |
| | | | Class R4 | | 93.10 | % | | |
Seligman California Municipal High-Yield | | Citigroup Global Markets | | Class A | | 5.60 | % | | — |
| | | | Class C | | 11.36 | % | | |
| | MLP Fenner & Smith | | Class A | | 6.44 | % | | — |
| | | | Class C | | 16.88 | % | | |
| | Morgan Stanley & Co. (Morgan Stanley), | | Class A | | 5.86 | % | | — |
| | Jersey City, NJ | | Class C | | 14.95 | % | | |
| | Christopher Ranch LLC, Gilroy, CA | | Class C | | 10.00 | % | | — |
Seligman California Municipal Quality | | MLP Fenner & Smith | | Class A | | 5.64 | % | | — |
| | | | Class C | | 74.10 | % | | |
| | Morgan Stanley | | Class A | | 10.89 | % | | — |
| | Charles Schwab | | Class A | | 8.05 | % | | — |
Seligman Minnesota Municipal | | MLP Fenner & Smith | | Class C | | 12.78 | % | | — |
| | American Enterprise Investment Services Inc. | | Class C | | 7.46 | % | | — |
| | UBS Financial Services Inc. FBO Ethelyn C. Engel, Cold Spring, MN | | Class C | | 6.14 | % | | — |
Seligman National Municipal | | Citigroup Global Markets | | Class A | | 6.91 | % | | — |
| | | | Class C | | 11.91 | % | | |
| | MLP Fenner & Smith | | Class A | | 8.50 | % | | — |
| | | | Class C | | 17.89 | % | | |
| | Morgan Stanley | | Class C | | 6.73 | % | | — |
Seligman New York Municipal | | Citigroup Global Markets | | Class A | | 5.16 | % | | — |
| | | | Class C | | 16.99 | % | | |
190
| | | | | | | | | |
| | MLP Fenner & Smith | | Class C | | 8.03 | % | | — |
| | Charles Schwab | | Class A | | 14.31 | % | | — |
Seligman TargETFund 2015 | | MLP Fenner & Smith | | Class A | | 20.65 | % | | — |
| | | | Class C | | 20.29 | % | | |
| | | | Class R | | 41.53 | % | | |
| | AST Trust Company FBO Jamaica Anesthesia Assocs., Phoenix, AZ | | Class A | | 11.05 | % | | — |
| | Wilmington Trust FBO Medisys Health Network Inc., Phoenix, AZ | | Class A | | 7.41 | % | | — |
| | AST Trust Company FBO Medisys Health Network Inc., Phoenix, AZ | | Class A | | 5.72 | % | | — |
| | Frontier Trust Company FBO Andreini Bros Inc. Empl. PS Plan | | Class R | | 17.52 | % | | — |
| | Frontier Trust Company FBO SGCGJ Retirement Plan | | Class R | | 13.90 | % | | — |
| | Frontier Trust Company FBO Dearborn Mid West Co. 401K | | Class R | | 11.61 | % | | — |
| | MG Trust Company FBO Plastic Coating Corporation, Denver, CO | | Class R | | 10.46 | % | | — |
| | NFS LLC FEBO FMT CO Cust FBO Mark Stuart Shulman, Sudbury, MA | | Class R5 | | 79.44 | % | | — |
| | Columbia Management | | Class R5 | | 19.68 | % | | — |
Seligman TargETFund 2025 | | MLP Fenner & Smith | | Class A | | 23.76 | % | | — |
| | | | Class C | | 28.53 | % | | |
| | | | Class R | | 85.82 | % | | |
| | AST Trust Company FBO Medisys Health Network Inc., Phoenix, AZ | | Class A | | 10.22 | % | | — |
| | Frontier Trust Company FBO S.W.E.A. PC 401K | | Class A | | 8.68 | % | | — |
| | Frontier Trust Company FBO SGCGJ Retirement Plan | | Class R | | 8.93 | % | | — |
| | American Enterprise Investment Services Inc. | | Class R5 | | 89.81 | % | | — |
Seligman TargETFund 2035 | | Columbia Management | | Class R5 | | 94.33 | % | | — |
| | MLP Fenner & Smith | | Class A | | 23.94 | % | | — |
| | | | Class C | | 44.56 | % | | |
| | | | Class R | | 42.36 | % | | |
| | Reliance Trust Co. FBO Time Acquisition Holding 401K, Atlanta, GA | | Class A | | 27.12 | % | | — |
| | Reliance Trust Co. FBO Finn Dixon & Herling 401K Plan, Atlanta, GA | | Class A | | 19.02 | % | | — |
| | New York Life Trust Company, Parsippany, NJ | | Class A | | 5.57 | % | | — |
| | First Clearing, LLC A/C James Drake, Westville, IN | | Class C | | 5.92 | % | | — |
| | Frontier Trust Company FBO Dearborn Mid West Co. 401K | | Class R | | 25.67 | % | | — |
| | Frontier Trust Company FBO SGCGJ Retirement Plan | | Class R | | 19.90 | % | | — |
Seligman TargETFund 2045 | | Columbia Management | | Class R5 | | 44.80 | % | | — |
| | MLP Fenner & Smith | | Class A | | 33.51 | % | | — |
| | | | Class C | | 62.30 | % | | |
| | | | Class R | | 78.86 | % | | |
| | Reliance Trust Co. FBO Time Acquisition Holding 401K, Atlanta, GA | | Class A | | 20.62 | % | | — |
| | New York Life Trust Company, Parsippany, NJ | | Class A | | 9.87 | % | | — |
| | Frontier Trust Company FBO Wamore, Inc. 401K | | Class R | | 9.01 | % | | — |
| | American Enterprise Investment Services Inc. | | Class R5 | | 52.51 | % | | — |
191
| | | | | | | | | | |
Seligman TargETFund Core | | Columbia Management | | Class R5 | | 11.58 | % | | — | |
| | MLP Fenner & Smith | | Class A | | 21.61 | % | | — | |
| | | | Class C | | 40.42 | % | | | |
| | | | Class R | | 77.82 | % | | | |
| | Fifth Third Bank TTEE FBO Bankwest Inc., Cincinnati, OH | | Class A | | 7.27 | % | | — | |
| | Frontier Trust Company FBO Dearborn Mid West Co. 401K | | Class R | | 11.10 | % | | — | |
| | American Enterprise Investment Services Inc. | | Class R5 | | 87.88 | % | | — | |
Funds with fiscal period ending October 31 | | | | | | | | |
Columbia Absolute Return Currency and Income | | Columbia Management | | Class R4 | | 100.00 | % | | — | |
| | | | Class R5 | | 100.00 | % | | | |
| | Disciplined Asset Allocation Conservative Fund | | Class I | | 7.69 | % | | — | |
| | Disciplined Asset Allocation Moderate Fund | | Class I | | 7.28 | % | | — | |
| | Disciplined Asset Allocation Moderately Conservative Fund | | Class I | | 7.76 | % | | — | |
| | Columbia Income Builder Fund | | Class I | | 16.00 | % | | — | |
| | Columbia Income Builder Fund II | | Class I | | 43.91 | % | | — | |
| | Columbia Income Builder Fund III | | Class I | | 11.65 | % | | — | |
| | American Enterprise | | Class W | | 99.91 | % | | — | |
| | Charles Schwab | | Class A | | 60.74 | % | | — | |
| | MLP Fenner & Smith | | Class C | | 9.32 | % | | — | |
Columbia Emerging Markets Bond | | Disciplined Asset Allocation Moderate Fund | | Class I | | 5.28 | % | | 40.87 | %(a) |
| | Columbia Income Builder Fund | | Class I | | 11.78 | % | | — | |
| | Columbia Income Builder Fund II | | Class I | | 42.49 | % | | — | |
| | Columbia Income Builder Fund III | | Class I | | 23.71 | % | | | |
| | Columbia Management | | Class R4 | | 44.59 | % | | — | |
| | American Enterprise Investment Services, Inc. | | Class W | | 99.97 | % | | — | |
| | Charles Schwab | | Class A | | 38.45 | % | | — | |
| | | | Class R4 | | 27.29 | % | | | |
| | Matrix Capital | | Class R4 | | 28.12 | % | | — | |
| | Morgan Stanley | | Class A | | 12.85 | % | | — | |
| | First Clearing, LLC, Rochester, NY | | Class C | | 7.58 | % | | — | |
| | Morgan Stanley | | Class C | | 7.30 | % | | — | |
| | American Enterprise Investment Services, Inc. | | Class C | | 6.12 | % | | — | |
Columbia Emerging Markets Opportunity | | Columbia Portfolio Builder Aggressive Fund | | Class I | | 18.43 | % | | — | |
| | Columbia Portfolio Builder Moderate Fund | | Class I | | 25.71 | % | | — | |
| | Columbia Portfolio Builder Moderate Aggressive Fund | | Class I | | 30.55 | % | | — | |
| | Columbia Portfolio Builder Moderate Conservative Fund | | Class I | | 6.51 | % | | — | |
| | Columbia Portfolio Builder Total Equity Fund | | Class I | | 18.78 | % | | — | |
| | Charles Schwab | | Class A | | 13.50 | % | | — | |
| | | | Class R4 | | 100.00 | % | | | |
| | MLP Fenner & Smith | | Class C | | 39.64 | % | | — | |
| | | | Class R | | 88.30 | % | | | |
| | Columbia Management | | Class R4 | | 100.00 | % | | — | |
| | Patricks Plain LLC | | Class R5 | | 87.00 | % | | — | |
Columbia European Equity | | Columbia Management | | Class I | | 100.00 | % | | — | |
| | | | Class R4 | | 16.14 | % | | — | |
| | Charles Schwab | | Class A | | 9.89 | % | | — | |
| | Marilyn O. Matthews, Pasadena, CA | | Class C | | 5.48 | % | | — | |
| | MG Trust Company Cust. FBO Urologic Surgery, P.C. 401K, Denver, CO | | Class R4 | | 79.53 | % | | — | |
192
| | | | | | | | | | |
Columbia Frontier | | Columbia Management | | Class R | | 9.37 | % | | — | |
| | | | Class R3 | | 100.00 | % | | — | |
| | | | Class R4 | | 51.23 | % | | — | |
| | Portfolio Builder Total Equity Fund | | Class I | | 99.50 | % | | — | |
| | Charles Schwab | | Class R4 | | 48.77 | % | | — | |
| | MLP Fenner & Smith | | Class A | | 9.02 | % | | — | |
| | | | Class C | | 21.88 | % | | | |
| | | | Class R | | 63.03 | % | | | |
| | Citigroup Global Markets | | Class B | | 7.06 | % | | — | |
| | State Street Bank and Trust as Custodian, Miami, FL | | Class B | | 5.48 | % | | — | |
| | Frontier Trust Company FBO | | Class R | | 14.43 | % | | — | |
| | Frontier Trust Company FBO Financial Network Audit, LLC | | Class R | | 6.59 | % | | — | |
| | Frontier Trust Company FBO C. Anthony Phillps Accountancy 401 | | Class R | | 6.18 | % | | — | |
| | Gramma Fisher Foundation (Gramma Fisher Foundation), Easton, MD | | Class R5 | | 67.75 | % | | — | |
| | Patricks Plain LLC | | Class R5 | | 29.23 | % | | — | |
Columbia Global Equity | | Columbia Management | | Class R | | 45.30 | % | | — | |
| | | | Class R3 | | 100.00 | % | | | |
| | | | Class R5 | | 27.38 | % | | | |
| | | | Class W | | 100.00 | % | | | |
| | Columbia Portfolio Builder Aggressive Fund | | Class I | | 13.68 | % | | — | |
| | Columbia Portfolio Builder Moderate Fund | | Class I | | 29.50 | % | | — | |
| | Columbia Portfolio Builder Moderate Aggressive Fund | | Class I | | 35.14 | % | | — | |
| | Columbia Portfolio Builder Moderate Conservative Fund | | Class I | | 7.43 | % | | — | |
| | Columbia Portfolio Builder Total Equity Fund | | Class I | | 11.65 | % | | — | |
| | Charles Schwab | | Class A | | 10.22 | % | | — | |
| | MLP Fenner & Smith | | Class C | | 7.39 | % | | — | |
| | Frontier Trust Company FBO C. Anthony Phillps Accountancy 401 | | Class R | | 18.43 | % | | — | |
| | Frontier Trust Company FBO EFK Moen 401K | | | | 11.56 | % | | — | |
| | Frontier Trust Company FBO Financial Network Audit, LLC | | | | 11.09 | % | | — | |
| | MG Trust Company Cust. FBO Applied Reliability Engineering, Denver, CO | | | | 10.24 | % | | — | |
| | Wachovia Bank | | Class R4 | | 95.89 | % | | — | |
| | American Enterprise Investment Services, Inc. | | Class R5 | | 72.62 | % | | — | |
Columbia Global Bond | | Columbia Portfolio Builder Aggressive Fund | | Class I | | 7.10 | % | | 32.99 | %(a) |
| | Columbia Portfolio Builder Conservative Fund | | Class I | | 7.65 | % | | — | |
| | Columbia Portfolio Builder Moderate Fund | | Class I | | 30.72 | % | | — | |
| | Columbia Portfolio Builder Moderate Aggressive Fund | | Class I | | 26.31 | % | | — | |
| | Columbia Portfolio Builder Moderate Conservative Fund | | Class I | | 13.68 | % | | — | |
| | American Enterprise Investment Services, Inc. | | Class W | | 99.95 | % | | — | |
| | Charles Schwab | | Class A | | 12.28 | % | | — | |
| | | | Class R4 | | 100.00 | % | | | |
Columbia Global Extended Alpha | | Columbia Management | | Class C | | 6.99 | % | | 58.96 | %(a) |
| | | | Class I | | 100.00 | % | | | |
| | | | Class R | | 100.00 | % | | | |
| | | | Class R3 | | 100.00 | % | | | |
| | | | Class R4 | | 12.01 | % | | | |
| | | | Class R5 | | 100.00 | % | | | |
| | Charles Schwab | | Class A | | 45.04 | % | | — | |
| | | | Class R4 | | 87.99 | % | | | |
| | American Enterprise Investment Services, Inc. | | Class B | | 61.97 | % | | — | |
193
| | | | | | | | | | |
| | William F. and Naorma M. Paden, Yuba City, CA | | Class C | | 21.81 | % | | — | |
| | Ronald J. Oberdick, Morristown, NJ | | Class C | | 18.56 | % | | — | |
| | Pershing LLC, Jersey City, NJ | | Class C | | 15.60 | % | | — | |
| | Michael Selig, Arlington, VA | | Class C | | 10.77 | % | | — | |
| | Poonam and Pradeep Singh, McLean, VA | | Class C | | 10.15 | % | | — | |
| | Jennifer S. Carter, Washington, D.C. | | Class C | | 8.29 | % | | — | |
| | Jon Paul and Rachel Colquitt, Clifton, VA | | Class C | | 7.83 | % | | — | |
Columbia Multi-Advisor International Value | | Charles Schwab | | Class A | | 12.19 | % | | — | |
| | | | Class R4 | | 98.90 | % | | | |
| | Columbia Portfolio Builder Aggressive Fund | | Class I | | 17.99 | % | | — | |
| | Columbia Portfolio Builder Moderate Fund | | Class I | | 25.11 | % | | — | |
| | Columbia Portfolio Builder Moderate Aggressive Fund | | Class I | | 29.76 | % | | — | |
| | Columbia Portfolio Builder Moderate Conservative Fund | | Class I | | 6.30 | % | | — | |
| | Columbia Portfolio Builder Total Equity Fund | | Class I | | 18.41 | % | | — | |
Columbia Seligman Global Technology | | Columbia Management | | Class R3 | | 100.00 | % | | — | |
| | | | Class R5 | | 100.00 | % | | | |
| | Columbia Portfolio Builder Aggressive Fund | | Class I | | 18.03 | % | | — | |
| | Columbia Portfolio Builder Moderate Fund | | Class I | | 25.13 | % | | — | |
| | Columbia Portfolio Builder Moderate Aggressive Fund | | Class I | | 29.99 | % | | — | |
| | Columbia Portfolio Builder Moderate Conservative Fund | | Class I | | 6.24 | % | | — | |
| | Columbia Portfolio Builder Total Equity Fund | | Class I | | 18.44 | % | | — | |
| | Charles Schwab | | Class R4 | | 93.18 | % | | — | |
| | MLP Fenner & Smith | | Class A | | 8.81 | % | | — | |
| | | | Class B | | 10.15 | % | | | |
| | | | Class C | | 20.21 | % | | | |
| | | | Class R | | 12.22 | % | | | |
| | Citigroup Global Markets | | Class C | | 5.27 | % | | — | |
| | Hartford Life Insurance Co., Hartford, CT | | Class R | | 73.45 | % | | — | |
| | Frontier Trust Company FBO Dearborn Mid West Conveyor | | Class R | | 7.17 | % | | — | |
RiverSource Disciplined International Equity | | Columbia Management | | Class R | | 100.00 | % | | 28.08 | %(a) |
| | | | Class R3 | | 100.00 | % | | | |
| | | | Class R4 | | 8.28 | % | | | |
| | | | Class R5 | | 100.00 | % | | | |
| | Disciplined Asset Allocation Moderate Fund | | Class I | | 11.85 | % | | — | |
| | Disciplined Asset Allocation Moderately Aggressive Fund | | Class I | | 7.92 | % | | — | |
| | Columbia Portfolio Builder Aggressive Fund | | Class I | | 8.11 | % | | — | |
| | Columbia Portfolio Builder Moderate Fund | | Class I | | 11.33 | % | | — | |
| | Columbia Portfolio Builder Moderate Aggressive Fund | | Class I | | 13.48 | % | | — | |
| | Columbia Portfolio Builder Total Equity Fund | | Class I | | 8.31 | % | | — | |
| | American Enterprise Investment Services, Inc. | | Class W | | 99.98 | % | | — | |
| | Charles Schwab | | Class A | | 10.66 | % | | — | |
| | | | Class R4 | | 91.72 | % | | | |
| | Daniel and Linda Miklovic, St. Louis, MO | | Class C | | 6.39 | % | | — | |
RiverSource Partners International Select Growth | | Charles Schwab | | Class A | | 10.95 | % | | 47.03 | %(a) |
| | | | Class R4 | | 82.52 | % | | | |
| | New York Life Trust Company | | Class R4 | | 16.27 | % | | — | |
| | Columbia Portfolio Builder Aggressive Fund | | Class I | | 17.97 | % | | — | |
| | Columbia Portfolio Builder Moderate Fund | | Class I | | 25.12 | % | | — | |
| | Columbia Portfolio Builder Moderate Aggressive Fund | | Class I | | 29.80 | % | | — | |
194
| | | | | | | | | | |
| | Columbia Portfolio Builder Moderate Conservative Fund | | Class I | | 6.29 | % | | — | |
| | Columbia Portfolio Builder Total Equity Fund | | Class I | | 18.39 | % | | — | |
| | MLP Fenner & Smith | | Class C | | 9.08 | % | | — | |
| | Frontier Trust Company FBO U.S. Tank Alliance, Inc. | | Class R | | 38.15 | % | | — | |
| | Frontier Trust Company FBO B&L Corporation 401K | | Class R | | 18.63 | % | | — | |
| | Frontier Trust Company FBO Financial Audit, LLC 401K | | Class R | | 13.69 | % | | — | |
| | Frontier Trust Company FBO C. Anthony Phillips Accountants | | Class R | | 8.86 | % | | — | |
| | MG Trust Company FBO Claudina | | Class R | | 5.90 | % | | — | |
| | A. Bonilla MD FCCP PA, Denver, CO Patricks Plain LLC | | Class R5 | | 97.22 | % | | — | |
RiverSource Partners International Small Cap | | Columbia Portfolio Builder Aggressive Fund | | Class I | | 17.83 | % | | 50.85 | %(a) |
| | | | | | | | | | |
| | Columbia Portfolio Builder Moderate Fund | | Class I | | 25.47 | % | | — | |
| | Columbia Portfolio Builder Moderate Aggressive Fund | | Class I | | 30.16 | % | | — | |
| | Columbia Portfolio Builder Moderate Conservative Fund | | Class I | | 6.33 | % | | — | |
| | Columbia Portfolio Builder Total Equity Fund | | Class I | | 17.77 | % | | — | |
| | Charles Schwab | | Class A | | 9.01 | % | | — | |
| | | | Class R4 | | 11.78 | % | | | |
| | Morgan Stanley | | Class C | | 14.62 | % | | — | |
| | Taynik & Co., Boston, MA | | Class R4 | | 48.66 | % | | — | |
| | Massachusetts Mutual Life Insurance Co., Springfield, MA | | Class R4 | | 36.89 | % | | — | |
Threadneedle Global Equity Income | | Columbia Management | | Class I | | 100.00 | % | | — | |
| | | | Class R | | 100.00 | % | | | |
| | | | Class R3 | | 100.00 | % | | | |
| | | | Class R4 | | 81.26 | % | | | |
| | | | Class R5 | | 100.00 | % | | | |
| | Charles Schwab | | Class A | | 16.66 | % | | — | |
| | | | Class R4 | | 18.74 | % | | | |
| | Michael A. And Mary N. Brockman, Fort Madison, IA | | Class C | | 10.63 | % | | — | |
| | David L. and Diane M Cooper, Prescott, AZ | | Class C | | 9.56 | % | | — | |
| | Janet K. Zimmer, Warsaw, IN | | Class C | | 7.05 | % | | — | |
Threadneedle International Opportunity | | Columbia Management | | Class R | | 100.00 | % | | 28.96 | %(a) |
| | | | Class R3 | | 100.00 | % | | | |
| | | | Class R5 | | 100.00 | % | | | |
| | Charles Schwab | | Class A | | 7.77 | % | | — | |
| | | | Class R4 | | 80.39 | % | | | |
| | Matrix Capital | | Class R4 | | 19.61 | % | | — | |
| | Columbia Portfolio Builder Aggressive Fund | | Class I | | 18.02 | % | | — | |
| | Columbia Portfolio Builder Moderate Fund | | Class I | | 25.06 | % | | — | |
| | Columbia Portfolio Builder Moderate Aggressive Fund | | Class I | | 29.80 | % | | — | |
| | Columbia Portfolio Builder Moderate Conservative Fund | | Class I | | 6.27 | % | | — | |
| | Columbia Portfolio Builder Total Equity Fund | | Class I | | 18.42 | % | | — | |
| | Frontier Trust Company FBO Ed’s Supply Co. | | Class R | | 20.34 | % | | — | |
| | Frontier Trust Company FBO Sales West Partners Inc. 401K | | Class R | | 12.03 | % | | — | |
| | Frontier Trust Company FBO Horne Bros. Construction 401K | | Class R | | 11.09 | % | | — | |
195
| | | | | | | | | |
| | Frontier Trust Company FBO Kingchem, Inc. 401K | | Class R | | 10.59 | % | | — |
| | Frontier Trust Company FBO Natural Habitat Adventures | | Class R | | 9.91 | % | | — |
| | Frontier Trust Company FBO Tofel Employee 401K | | Class R | | 9.72 | % | | — |
| | Frontier Trust Company FBO Woburn Daily Times, Inc. 401K | | Class R | | 9.04 | % | | — |
| | Frontier Trust Company FBO Tremont Electric 401K | | Class R | | 8.06 | % | | — |
Funds with fiscal period ending November 30 | | | | | | | |
Columbia AMT-Free Tax-Exempt Bond | | None | | N/A | | N/A | | | — |
Columbia Mid Cap Growth Opportunity | | Charles Schwab | | Class A | | 7.03 | % | | — |
| | | | Class R4 | | 9.07 | % | | |
| | Columbia Portfolio Builder Aggressive Fund | | Class I | | 16.45 | % | | — |
| | Columbia Portfolio Builder Moderate Fund | | Class I | | 27.43 | % | | — |
| | Columbia Portfolio Builder Moderate Aggressive Fund | | Class I | | 31.54 | % | | — |
| | Columbia Portfolio Builder Moderate Conservative Fund | | Class I | | 6.84 | % | | — |
| | Columbia Portfolio Builder Total Equity Fund | | Class I | | 15.38 | % | | — |
| | MLP Fenner & Smith | | Class C | | 6.87 | % | | — |
| | Morgan Stanley | | Class C | | 5.20 | % | | — |
| | Wachovia Bank | | Class R4 | | 82.55 | % | | — |
| | US Bank NA, Milwaukee, WI | | Class R4 | | 8.20 | % | | — |
RiverSource Intermediate Tax Exempt | | Charles Schwab | | Class A | | 8.06 | % | | — |
| | First Clearing LLC, A/C T. J. Househmandzadeh, Cerritos, CA | | Class C | | 5.36 | % | | — |
RiverSource Tax-Exempt High Income | | None | | N/A | | N/A | | | — |
Funds with fiscal period ending December 31 | | | | | | | |
Columbia Government Money Market | | Patricks Plain LLC | | Class R5 | | 96.68 | % | | — |
Columbia Select Large-Cap Value | | Columbia Management | | Class R3 | | 100.00 | % | | — |
| | | | Class R4 | | 100.00 | % | | |
| | Columbia Portfolio Builder Aggressive | | Class I | | 18.01 | % | | — |
| | Columbia Portfolio Builder Moderate | | Class I | | 25.60 | % | | — |
| | Columbia Portfolio Builder Moderate Aggressive | | Class I | | 29.73 | % | | — |
| | Columbia Portfolio Builder Moderate Conservative | | Class I | | 6.32 | % | | — |
| | Columbia Portfolio Builder Total Equity | | Class I | | 18.21 | % | | — |
| | Morgan Stanley | | Class A | | 52.66 | % | | — |
| | New York Life Trust Company, Parsippany, NJ | | Class A | | 7.89 | % | | — |
| | MLP Fenner & Smith | | Class B | | 9.78 | % | | — |
| | | | Class C | | 30.39 | % | | |
| | | | Class R | | 79.31 | % | | |
| | Citigroup Global Markets | | Class B | | 5.54 | % | | — |
| | | | Class C | | 5.05 | % | | — |
| | Gramma Fisher Foundation | | Class R5 | | 48.68 | % | | — |
| | American Enterprise Investment Services | | Class R5 | | 41.42 | % | | — |
Columbia Select Smaller-Cap Value | | Columbia Management | | Class R3 | | 100.00 | % | | — |
196
| | | | | | | | | | |
| | | | Class R4 | | 10.70 | % | | | |
| | Columbia Portfolio Builder Aggressive | | Class I | | 25.11 | % | | — | |
| | Columbia Portfolio Builder Total Equity | | Class I | | 74.75 | % | | — | |
| | MLP Fenner & Smith | | Class C | | 32.91 | % | | — | |
| | | | Class R | | 76.90 | % | | | |
| | Charles Schwab | | Class R4 | | 89.30 | % | | — | |
| | Gramma Fisher Foundation | | Class R5 | | 51.12 | % | | — | |
| | Patricks Plain LLC | | Class R5 | | 35.29 | % | | — | |
Columbia Seligman Communications and Information | | Columbia Management | | Class R3 | | 35.45 | % | | — | |
| | | | Class R4 | | 43.28 | % | | | |
| | Columbia Portfolio Builder Aggressive | | Class I | | 17.94 | % | | — | |
| | Columbia Portfolio Builder Moderate | | Class I | | 25.55 | % | | — | |
| | Columbia Portfolio Builder Moderate Aggressive | | Class I | | 29.87 | % | | — | |
| | Columbia Portfolio Builder Moderate Conservative | | Class I | | 6.28 | % | | — | |
| | Columbia Portfolio Builder Total Equity | | Class I | | 18.24 | % | | — | |
| | MLP Fenner & Smith | | Class A | | 11.16 | % | | — | |
| | | | Class B | | 18.43 | % | | | |
| | | | Class C | | 21.58 | % | | | |
| | | | Class R | | 39.63 | % | | | |
| | Citigroup Global Markets | | Class A | | 5.15 | % | | — | |
| | | | Class B | | 7.46 | % | | | |
| | | | Class C | | 6.95 | % | | | |
| | Charles Schwab | | Class A | | 6.57 | % | | — | |
| | | | Class R4 | | 56.72 | % | | | |
| | Morgan Stanley | | Class B | | 5.30 | % | | — | |
| | Hartford Life Insurance Co., Hartford, CT | | Class R | | 30.01 | % | | — | |
| | JPMorgan Chase Bank , New York, NY | | Class R | | 7.48 | % | | — | |
| | Pershing LLC, Jersey City, NJ | | Class R3 | | 64.41 | % | | — | |
RiverSource LaSalle Global Real Estate | | Columbia Management | | Class A | | 18.00 | % | | 46.18 | %(a) |
| | | | Class R | | 5.78 | % | | | |
| | | | Class R3 | | 100.00 | % | | | |
| | | | Class R4 | | 85.27 | % | | | |
| | Morgan Stanley | | Class A | | 17.26 | % | | — | |
| | MLP Fenner & Smith | | Class A | | 15.79 | % | | — | |
| | | | Class C | | 51.01 | % | | | |
| | | | Class R | | 85.35 | % | | | |
| | Columbia Portfolio Builder Aggressive | | Class I | | 42.79 | % | | — | |
| | Columbia Portfolio Builder Total Equity | | Class I | | 57.11 | % | | — | |
| | Frontier Trust Company FBO Valley Ford 401K, Fargo, ND | | Class R | | 8.87 | % | | — | |
| | Scottrade Inc. FBO Jeffrey Powers IRA, Saint Louis, MO | | Class R4 | | 14.73 | % | | — | |
| | Gramma Fisher Foundation | | Class R5 | | 61.69 | % | | — | |
| | Patricks Plain LLC | | Class R5 | | 37.91 | % | | — | |
RiverSource LaSalle Monthly Dividend Real Estate | | Columbia Management | | Class R3 | | 100.00 | % | | — | |
| | | | Class R4 | | 38.39 | % | | | |
| | Columbia Portfolio Builder Moderate Aggressive | | Class I | | 99.62 | % | | — | |
| | MLP Fenner & Smith | | Class A | | 13.25 | % | | — | |
| | | | Class B | | 22.58 | % | | | |
| | | | Class C | | 50.85 | % | | | |
| | | | Class R | | 87.25 | % | | | |
| | Citigroup Global Markets | | Class B | | 6.12 | % | | — | |
| | | | Class C | | 7.74 | % | | | |
197
| | | | | | | | | |
| | Scottrade Inc. FBO Kenny K. Fong, Saint Louis, MO | | Class R4 | | 61.61 | % | | — |
| | Gramma Fisher Foundation | | Class R5 | | 61.08 | % | | — |
| | Patricks Plain LLC | | Class R5 | | 36.74 | % | | — |
Seligman Capital | | Columbia Management | | Class R3 | | 100.00 | % | | — |
| | | | Class R4 | | 100.00 | % | | |
| | Columbia Portfolio Builder Aggressive | | Class I | | 36.94 | % | | — |
| | Columbia Portfolio Builder Moderate Aggressive | | Class I | | 7.86 | % | | — |
| | Columbia Portfolio Builder Total Equity | | Class I | | 55.15 | % | | — |
| | MLP Fenner & Smith | | Class B | | 10.68 | % | | — |
| | | | Class C | | 26.29 | % | | |
| | | | Class R | | 71.60 | % | | |
| | Gramma Fisher Foundation | | Class R5 | | 56.11 | % | | — |
| | Patricks Plain LLC | | Class R5 | | 40.66 | % | | — |
Seligman Growth | | Columbia Management | | Class R3 | | 100.00 | % | | — |
| | Columbia Portfolio Builder Aggressive | | Class I | | 17.97 | % | | — |
| | Columbia Portfolio Builder Moderate | | Class I | | 25.53 | % | | — |
| | Columbia Portfolio Builder Moderate Aggressive | | Class I | | 29.84 | % | | — |
| | Columbia Portfolio Builder Moderate Conservative | | Class I | | 6.31 | % | | — |
| | Columbia Portfolio Builder Total Equity | | Class I | | 18.21 | % | | — |
| | Ameriprise Trust Company | | Class R4 | | 91.71 | % | | — |
| | Wacovia Bank | | Class R4 | | 7.61 | % | | — |
| | MLP Fenner & Smith | | Class C | | 9.80 | % | | — |
| | Frontier Trust Company, Fargo, ND | | Class R | | 70.27 | % | | — |
| | MG Trust Company FBO Global Surveillance Associates, Denver, CO | | Class R | | 6.60 | % | | — |
| | Gramma Fisher Foundation | | Class R5 | | 85.93 | % | | — |
| | American Enterprise Investment Services | | Class R5 | | 8.30 | % | | — |
| (a) | Combination of all share classes of Columbia Management initial capital and affiliated funds-of-funds’ investments in Class I shares. |
A fund may serve as an underlying investment of funds-of-funds that principally invest in shares of affiliated funds in the Fund Family (the underlying funds). The underlying funds and the funds-of-funds share the same officers, Board members, and investment manager. The funds-of-funds do not invest in an underlying fund for the purpose of exercising management or control; however, from time to time, investments by the funds-of-funds in a fund may represent a significant portion of a fund. Because the funds-of-funds may own a substantial portion of the shares of a fund, procedures have been put into place to assure that public shareholders will determine the outcome of all actions taken at underlying fund shareholder meetings. In proxy voting, the funds-of-funds will vote on each proposal in the same proportion that other shareholders vote on the proposal.
In addition, Columbia Management or an affiliate may own shares of a fund as a result of an initial capital investment at the inception of the fund or class. To the extent Columbia Management, as manager of the funds-of-funds, may be deemed a beneficial owner of the shares of an underlying fund held by the funds-of-funds, and such shares, together with any initial capital investment by Columbia Management or an affiliate, represent more than 25% of a fund, Columbia Management and its affiliated companies may be deemed to control the fund.
198
Information Regarding Pending and Settled Legal Proceedings
In June 2004, an action captioned John E. Gallus et al. v. American Express Financial Corp. and American Express Financial Advisors Inc., was filed in the United States District Court for the District of Arizona. The plaintiffs allege that they are investors in several American Express Company (now known as legacy RiverSource) mutual funds and they purport to bring the action derivatively on behalf of those funds under the 1940 Act. The plaintiffs allege that fees allegedly paid to the defendants by the funds for investment advisory and administrative services are excessive. The plaintiffs seek remedies including restitution and rescission of investment advisory and distribution agreements. The plaintiffs voluntarily agreed to transfer this case to the United States District Court for the District of Minnesota (the “District Court”). In response to defendants’ motion to dismiss the complaint, the District Court dismissed one of plaintiffs’ four claims and granted plaintiffs limited discovery. Defendants moved for summary judgment in April 2007. Summary judgment was granted in the defendants’ favor on July 9, 2007. The plaintiffs filed a notice of appeal with the Eighth Circuit Court of Appeals (the “Eighth Circuit”) on Aug. 8, 2007. On April 8, 2009, the Eighth Circuit reversed summary judgment and remanded to the District Court for further proceedings. On August 6, 2009, defendants filed a writ of certiorari with the U.S. Supreme Court (the “Supreme Court”), asking the Supreme Court to stay the District Court proceedings while the Supreme Court considers and rules in a case captioned Jones v. Harris Associates, which involves issues of law similar to those presented in the Gallus case. On March 30, 2010, the Supreme Court issued its ruling in Jones v. Harris Associates, and on April 5, 2010, the Supreme Court vacated the Eighth Circuit’s decision in the Gallus case and remanded the case to the Eighth Circuit for further consideration in light of the Supreme Court’s decision in Jones v. Harris Associates. On June 4, 2010, the Eighth Circuit remanded the Gallus case to the District Court for further consideration in light of the Supreme Court’s decision in Jones v. Harris Associates.
In December 2005, without admitting or denying the allegations, American Express Financial Corporation (AEFC, which is now known as Ameriprise Financial, Inc. (Ameriprise Financial)), entered into settlement agreements with the Securities and Exchange Commission (SEC) and Minnesota Department of Commerce (MDOC) related to market timing activities. As a result, AEFC was censured and ordered to cease and desist from committing or causing any violations of certain provisions of the Investment Advisers Act of 1940, the Investment Company Act of 1940, and various Minnesota laws. AEFC agreed to pay disgorgement of $10 million and civil money penalties of $7 million. AEFC also agreed to retain an independent distribution consultant to assist in developing a plan for distribution of all disgorgement and civil penalties ordered by the SEC in accordance with various undertakings detailed at http://www.sec.gov/litigation/admin/ia-2451.pdf. Ameriprise Financial and its affiliates have cooperated with the SEC and the MDOC in these legal proceedings, and have made regular reports to the funds’ Boards of Directors/Trustees.
Ameriprise Financial and certain of its affiliates have historically been involved in a number of legal, arbitration and regulatory proceedings, including routine litigation, class actions, and governmental actions, concerning matters arising in connection with the conduct of their business activities. Ameriprise Financial believes that the Funds are not currently the subject of, and that neither Ameriprise Financial nor any of its affiliates are the subject of, any pending legal, arbitration or regulatory proceedings that are likely to have a material adverse effect on the Funds or the ability of Ameriprise Financial or its affiliates to perform under their contracts with the Funds. Ameriprise Financial is required to make 10-Q, 10-K and, as necessary, 8-K filings with the Securities and Exchange Commission on legal and regulatory matters that relate to Ameriprise Financial and its affiliates. Copies of these filings may be obtained by accessing the SEC website at www.sec.gov.
There can be no assurance that these matters, or the adverse publicity associated with them, will not result in increased fund redemptions, reduced sale of fund shares or other adverse consequences to the Funds. Further, although we believe proceedings are not likely to have a material adverse effect on the Funds or the ability of Ameriprise Financial or its affiliates to perform under their contracts with the Funds, these proceedings are subject to uncertainties and, as such, we are unable to estimate the possible loss or range of loss that may result. An adverse outcome in one or more of these proceedings could result in adverse judgments, settlements, fines, penalties or other relief that could have a material adverse effect on the consolidated financial condition or results of operations of Ameriprise Financial.
Independent Registered Public Accounting Firm
For RiverSource and Threadneedle funds, the financial statements for the fiscal years ended on or after July 31, 2007, and for Seligman funds, the financial statements for the fiscal years ended on or after Sept. 30, 2009 contained in a fund’s Annual Report were audited by the independent registered public accounting firm, Ernst & Young LLP, 220 South 6th Street, Suite 1400, Minneapolis, MN 55402. The independent registered public accounting firm also provides other accounting and tax-related services as requested by the funds. For RiverSource funds, the financial statements for periods ended on or before June 30, 2007 were audited by other auditors. For Seligman funds, the financial statements for periods ended on or before Dec. 31, 2008 were audited by Deloitte & Touche LLP.
199
Appendix A
DESCRIPTION OF RATINGS
Standard & Poor’s Long-Term Debt Ratings.
A Standard & Poor’s corporate or municipal debt rating is a current assessment of the creditworthiness of an obligor with respect to a specific obligation. This assessment may take into consideration obligors such as guarantors, insurers, or lessees.
The debt rating is not a recommendation to purchase, sell, or hold a security, inasmuch as it does not comment as to market price or suitability for a particular investor.
The ratings are based on current information furnished by the issuer or obtained by S&P from other sources it considers reliable. S&P does not perform an audit in connection with any rating and may, on occasion, rely on unaudited financial information. The ratings may be changed, suspended, or withdrawn as a result of changes in, or unavailability of such information or based on other circumstances.
The ratings are based, in varying degrees, on the following considerations:
| | • | | Likelihood of default capacity and willingness of the obligor as to the timely payment of interest and repayment of principal in accordance with the terms of the obligation. |
| | • | | Nature of and provisions of the obligation. |
| | • | | Protection afforded by, and relative position of, the obligation in the event of bankruptcy, reorganization, or other arrangement under the laws of bankruptcy and other laws affecting creditors’ rights. |
Investment Grade
Debt rated AAA has the highest rating assigned by Standard & Poor’s. Capacity to pay interest and repay principal is extremely strong.
Debt rated AA has a very strong capacity to pay interest and repay principal and differs from the highest rated issues only in a small degree.
Debt rated A has a strong capacity to pay interest and repay principal, although it is somewhat more susceptible to the adverse effects of changes in circumstances and economic conditions than debt in higher-rated categories.
Debt rated BBB is regarded as having an adequate capacity to pay interest and repay principal. Whereas it normally exhibits adequate protection parameters, adverse economic conditions or changing circumstances are more likely to lead to a weakened capacity to pay interest and repay principal for debt in this category than in higher-rated categories.
Speculative Grade
Debt rated BB, B, CCC, CC, and C is regarded as having predominantly speculative characteristics with respect to capacity to pay interest and repay principal. BB indicates the least degree of speculation and C the highest. While such debt will likely have some quality and protective characteristics, these are outweighed by large uncertainties or major exposures to adverse conditions.
Debt rated BB has less near-term vulnerability to default than other speculative issues. However, it faces major ongoing uncertainties or exposure to adverse business, financial, or economic conditions that could lead to inadequate capacity to meet timely interest and principal payments. The BB rating category also is used for debt subordinated to senior debt that is assigned an actual or implied BBB- rating.
A-1
Debt rated B has a greater vulnerability to default but currently has the capacity to meet interest payments and principal repayments. Adverse business, financial, or economic conditions will likely impair capacity or willingness to pay interest and repay principal. The B rating category also is used for debt subordinated to senior debt that is assigned an actual or implied BB or BB- rating.
Debt rated CCC has a currently identifiable vulnerability to default and is dependent upon favorable business, financial, and economic conditions to meet timely payment of interest and repayment of principal. In the event of adverse business, financial, or economic conditions, it is not likely to have the capacity to pay interest and repay principal. The CCC rating category also is used for debt subordinated to senior debt that is assigned an actual or implied B or B- rating.
Debt rated CC typically is applied to debt subordinated to senior debt that is assigned an actual or implied CCC rating.
Debt rated C typically is applied to debt subordinated to senior debt that is assigned an actual or implied CCC rating. The C rating may be used to cover a situation where a bankruptcy petition has been filed, but debt service payments are continued.
The rating CI is reserved for income bonds on which no interest is being paid.
Debt rated D is in payment default. The D rating category is used when interest payments or principal payments are not made on the date due, even if the applicable grace period has not expired, unless S&P believes that such payments will be made during such grace period. The D rating also will be used upon the filing of a bankruptcy petition if debt service payments are jeopardized.
Moody’s Long-Term Debt Ratings
Aaa – Bonds that are rated Aaa are judged to be of the best quality. They carry the smallest degree of investment risk. Interest payments are protected by a large or by an exceptionally stable margin and principal is secure. While the various protective elements are likely to change, such changes as can be visualized are most unlikely to impair the fundamentally strong position of such issues.
Aa – Bonds that are rated Aa are judged to be of high quality by all standards. Together with the Aaa group they comprise what are generally known as high grade bonds. They are rated lower than the best bonds because margins of protection may not be as large as in Aaa securities or fluctuation of protective elements may be of greater amplitude or there may be other elements present that make the long-term risk appear somewhat larger than in Aaa securities.
A – Bonds that are rated A possess many favorable investment attributes and are to be considered as upper-medium grade obligations. Factors giving security to principal and interest are considered adequate, but elements may be present that suggest a susceptibility to impairment some time in the future.
Baa – Bonds that are rated Baa are considered as medium-grade obligations (i.e., they are neither highly protected nor poorly secured). Interest payments and principal security appear adequate for the present but certain protective elements may be lacking or may be characteristically unreliable over any great length of time. Such bonds lack outstanding investment characteristics and in fact have speculative characteristics as well.
Ba – Bonds that are rated Ba are judged to have speculative elements – their future cannot be considered as well- assured. Often the protection of interest and principal payments may be very moderate, and thereby not well safeguarded during both good and bad times over the future. Uncertainty of position characterizes bonds in this class.
B – Bonds that are rated B generally lack characteristics of a desirable investment. Assurance of interest and principal payments or maintenance of other terms of the contract over any long period of time may be small.
Caa – Bonds that are rated Caa are of poor standing. Such issues may be in default or there may be present elements of danger with respect to principal or interest.
Ca – Bonds that are rated Ca represent obligations that are speculative in a high degree. Such issues are often in default or have other marked shortcomings.
C – Bonds that are rated C are the lowest rated class of bonds, and issues so rated can be regarded as having extremely poor prospects of ever attaining any real investment standing.
A-2
Fitch’s Long-Term Debt Ratings
Fitch’s bond ratings provide a guide to investors in determining the credit risk associated with a particular security. The ratings represent Fitch’s assessment of the issuer’s ability to meet the obligations of a specific debt issue in a timely manner.
The rating takes into consideration special features of the issue, its relationship to other obligations of the issuer, the current and prospective financial condition and operating performance of the issuer and any guarantor, as well as the economic and political environment that might affect the issuer’s future financial strength and credit quality.
Fitch ratings do not reflect any credit enhancement that may be provided by insurance policies or financial guaranties unless otherwise indicated.
Fitch ratings are not recommendations to buy, sell or hold any security. Ratings do not comment on the adequacy of market price, the suitability of any security for a particular investor, or the tax-exempt nature of taxability of payments made in respect of any security.
Fitch ratings are based on information obtained from issuers, other obligors, underwriters, their experts, and other sources Fitch believes to be reliable. Fitch does not audit or verify the truth or accuracy of such information. Ratings may be changed, suspended, or withdrawn as a result of changes in, or the unavailability of, information or for other reasons.
Investment Grade
AAA: Bonds considered to be investment grade and of the highest credit quality. The obligor has an exceptionally strong ability to pay interest and repay principal, which is unlikely to be affected by reasonably foreseeable events.
AA: Bonds considered to be investment grade and of very high credit quality. The obligor’s ability to pay interest and repay principal is very strong, although not quite as strong as bonds rated AAA. Because bonds rated in the AAA and AA categories are not significantly vulnerable to foreseeable future developments, short-term debt of these issuers is generally rated F-1+.
A: Bonds considered to be investment grade and of high credit quality. The obligor’s ability to pay interest and repay principal is considered to be strong, but may be more vulnerable to adverse changes in economic conditions and circumstances than bonds with higher ratings.
BBB: Bonds considered to be investment grade and of satisfactory credit quality. The obligor’s ability to pay interest and repay principal is considered to be adequate. Adverse changes in economic conditions and circumstances, however, are more likely to have adverse impact on these bonds and, therefore, impair timely payment. The likelihood that the ratings of these bonds will fall below investment grade is higher than for bonds with higher ratings.
Speculative Grade
BB: Bonds are considered speculative. The obligor’s ability to pay interest and repay principal may be affected over time by adverse economic changes. However, business and financial alternatives can be identified, which could assist the obligor in satisfying its debt service requirements.
B: Bonds are considered highly speculative. While bonds in this class are currently meeting debt service requirements, the probability of continued timely payment of principal and interest reflects the obligor’s limited margin of safety and the need for reasonable business and economic activity throughout the life of the issue.
CCC: Bonds have certain identifiable characteristics that, if not remedied, may lead to default. The ability to meet obligations requires an advantageous business and economic environment.
CC: Bonds are minimally protected. Default in payment of interest and/or principal seems probable over time.
C: Bonds are in imminent default in payment of interest or principal.
A-3
DDD, DD, and D: Bonds are in default on interest and/or principal payments. Such bonds are extremely speculative and should be valued on the basis of their ultimate recovery value in liquidation or reorganization of the obligor. DDD represents the highest potential for recovery on these bonds, and D represents the lowest potential for recovery.
SHORT-TERM RATINGS
Standard & Poor’s Commercial Paper Ratings
A Standard & Poor’s commercial paper rating is a current assessment of the likelihood of timely payment of debt considered short-term in the relevant market.
Ratings are graded into several categories, ranging from A-1 for the highest quality obligations to D for the lowest. These categories are as follows:
| A-1 | This highest category indicates that the degree of safety regarding timely payment is strong. Those issues determined to possess extremely strong safety characteristics are denoted with a plus sign (+) designation. |
| A-2 | Capacity for timely payment on issues with this designation is satisfactory. However, the relative degree of safety is not as high as for issues designated A-1. |
| A-3 | Issues carrying this designation have adequate capacity for timely payment. They are, however, more vulnerable to the adverse effects of changes in circumstances than obligations carrying the higher designations. |
| B | Issues are regarded as having only speculative capacity for timely payment. |
| C | This rating is assigned to short-term debt obligations with doubtful capacity for payment. |
| D | Debt rated D is in payment default. The D rating category is used when interest payments or principal payments are not made on the date due, even if the applicable grace period has not expired, unless S&P believes that such payments will be made during such grace period. |
Standard & Poor’s Muni Bond and Note Ratings
An S&P municipal bond or note rating reflects the liquidity factors and market-access risks unique to these instruments. Notes maturing in three years or less will likely receive a note rating. Notes maturing beyond three years will most likely receive a long-term debt rating.
Note rating symbols and definitions are as follows:
| SP-1 | Strong capacity to pay principal and interest. Issues determined to possess very strong characteristics are given a plus (+) designation. |
| SP-2 | Satisfactory capacity to pay principal and interest, with some vulnerability to adverse financial and economic changes over the term of the notes. |
| SP-3 | Speculative capacity to pay principal and interest. |
Municipal bond rating symbols and definitions are as follows:
Standard & Poor’s rating SP-1 indicates very strong or strong capacity to pay principal and interest. Those issues determined to possess overwhelming safety characteristics will be given a plus (+) designation.
Standard & Poor’s rating SP-2 indicates satisfactory capacity to pay principal and interest.
Standard & Poor’s rating SP-3 indicates speculative capacity to pay principal and interest.
A-4
Moody’s Short-Term Ratings
Moody’s short-term debt ratings are opinions of the ability of issuers to repay punctually senior debt obligations. These obligations have an original maturity not exceeding one year, unless explicitly noted.
Moody’s employs the following three designations, all judged to be investment grade, to indicate the relative repayment ability of rated issuers:
Issuers rated Prime-1 (or supporting institutions) have a superior ability for repayment of senior short-term debt obligations. Prime-1 repayment ability will often be evidenced by many of the following characteristics: (i) leading market positions in well-established industries, (ii) high rates of return on funds employed, (iii) conservative capitalization structure with moderate reliance on debt and ample asset protection, (iv) broad margins in earnings coverage of fixed financial charges and high internal cash generation, and (v) well established access to a range of financial markets and assured sources of alternate liquidity.
Issuers rated Prime-2 (or supporting institutions) have a strong ability for repayment of senior short-term debt obligations. This will normally be evidenced by many of the characteristics cited above, but to a lesser degree. Earnings trends and coverage ratios, while sound, may be more subject to variation. Capitalization characteristics, while still appropriate, may be more affected by external conditions. Ample alternate liquidity is maintained.
Issuers rated Prime-3 (or supporting institutions) have an acceptable ability for repayment of senior short-term obligations. The effect of industry characteristics and market compositions may be more pronounced. Variability in earnings and profitability may result in changes in the level of debt protection measurements and may require relatively high financial leverage. Adequate alternate liquidity is maintained.
Issuers rated Not Prime do not fall within any of the Prime rating categories.
Moody’s Short-Term Muni Bonds and Notes
Short-term municipal bonds and notes are rated by Moody’s. The ratings reflect the liquidity concerns and market access risks unique to notes.
Moody’s MIG 1/VMIG 1 indicates the best quality. There is present strong protection by established cash flows, superior liquidity support or demonstrated broad-based access to the market for refinancing.
Moody’s MIG 2/VMIG 2 indicates high quality. Margins of protection are ample although not so large as in the preceding group.
Moody’s MIG 3/VMIG 3 indicates favorable quality. All security elements are accounted for but there is lacking the undeniable strength of the preceding grades. Liquidity and cash flow protection may be narrow and market access for refinancing is likely to be less well established.
Moody’s MIG 4/VMIG 4 indicates adequate quality. Protection commonly regarded as required of an investment security is present and although not distinctly or predominantly speculative, there is specific risk.
Fitch’s Short-Term Ratings
Fitch’s short-term ratings apply to debt obligations that are payable on demand or have original maturities of generally up to three years, including commercial paper, certificates of deposit, medium-term notes, and municipal and investment notes. The short-term rating places greater emphasis than a long-term rating on the existence of liquidity necessary to meet the issuer’s obligations in a timely manner.
Fitch short-term ratings are as follows:
F-1+: Exceptionally Strong Credit Quality. Issues assigned this rating are regarded as having the strongest degree of assurance for timely payment.
A-5
F-1: Very Strong Credit Quality. Issues assigned this rating reflect an assurance of timely payment only slightly less in degree than issues rated F-1+.
F-2: Good Credit Quality. Issues assigned this rating have a satisfactory degree of assurance for timely payment, but the margin of safety is not as great as for issues assigned F-1+ and F-1 ratings.
F-3: Fair Credit Quality. Issues assigned this rating have characteristics suggesting that the degree of assurance for timely payment is adequate, however, near-term adverse changes could cause these securities to be rated below investment grade.
F-S: Weak Credit Quality. Issues assigned this rating have characteristics suggesting a minimal degree of assurance for timely payment and are vulnerable to near-term adverse changes in financial and economic conditions.
D: Default. Issues assigned this rating are in actual or imminent payment default.
A-6
Appendix B
STATE TAX-EXEMPT FUNDS
STATE RISK FACTORS
The State Tax-Exempt Funds invest primarily in the municipal securities issued by a single state and political sub-divisions that state. Each Fund will be particularly affected by political and economic conditions and developments in the state in which it invests. This vulnerability to factors affecting the state’s tax- exempt investments will be significantly greater than that of more geographically diversified funds, which may result in greater losses and volatility. Because of the relatively small number of issuers of tax-exempt securities, the Fund may invest a higher percentage of assets in a single issuer and, therefore, be more exposed to the risk of loss by investing in a few issuers than a fund that invests more broadly. At times, the Fund and other accounts managed by the investment manager may own all or most of the debt of a particular issuer. This concentration of ownership may make it more difficult to sell, or to determine the fair value of, these investments. In addition, a Fund may concentrate in a segment of the tax-exempt debt market, such as revenue bonds for health care facilities, housing or airports. These investments may cause the value of a fund’s shares to change more than the values of funds’ shares that invest in more diversified investments. The yields on the securities in which the Fund invests generally are dependent on a variety of factors, including the financial condition of the issuer or other obligor, the revenue source from which the debt service is payable, general economic and monetary conditions, conditions in the relevant market, the size of a particular issue, the maturity of the obligation, and the rating of the issue. In addition to such factors, geographically concentrated securities will experience particular sensitivity to local conditions, including political and economic changes, adverse conditions to an industry significant to the area, and other developments within a particular locality. Because many tax-exempt bonds may be revenue or general obligations of local governments or authorities, ratings on tax-exempt bonds may be different from the ratings given to the general obligation bonds of a particular state.
Certain events may adversely affect all investments within a particular market segment of the market. Examples include litigation, legislation or court decisions, concerns about pending or contemplated litigation, legislation or court decisions, or lower demand for the services or products provided by a particular market segment. Investing mostly in state-specific tax-exempt investments makes the Fund more vulnerable to that state’s economy and to factors affecting tax-exempt issuers in that state than would be true for more geographically diversified funds. These risks include, among others:
| | • | | the inability or perceived inability of a government authority to collect sufficient tax or other revenues to meet its payment obligations; |
| | • | | natural disasters and ecological or environmental concerns; |
| | • | | the introduction of constitutional or statutory limits on a tax-exempt issuer’s ability to raise revenues or increase taxes; |
| | • | | the inability of an issuer to pay interest on or repay principal or securities in which the funds invest during recessionary periods; and |
| | • | | economic or demographic factors that may cause a decrease in tax or other revenues for a government authority or for private operators of publicly financed facilities. |
More information about state specific risks may be available from official state resources.
B-1
Appendix C
RiverSource S&P 500 Index Fund
ADDITIONAL INFORMATION ABOUT THE S&P 500 INDEX
The fund is not sponsored, endorsed, sold or promoted by S&P. S&P makes no representation or warranty, express or implied, to the shareholders of the Fund or any member of the public regarding the advisability of investing in securities generally or in the Fund particularly or the ability of the S&P 500 Index to track general stock market performance. S&P’s only relationship to the Fund is the licensing of certain trademarks and trade names of S&P and of the S&P 500 Index, which are determined, composed and calculated by S&P without regard to the Fund. S&P has no obligation to take the needs of the Fund or its shareholders into consideration in determining, composing or calculating the S&P 500 Index. S&P is not responsible for and has not participated in the determination of the prices and amount of the Fund or the timing of the issuance or sale of the Fund or in the determination or calculation of the equation by which the Fund’s shares are to be converted into cash. S&P has no obligation or liability in connection with the administration, marketing or trading of Fund shares.
S&P DOES NOT GUARANTEE THE ACCURACY AND/OR THE COMPLETENESS OF THE S&P 500 INDEX OR ANY DATA INCLUDED THEREIN (THE S&P INDEX) AND S&P SHALL HAVE NO LIABILITY FOR ANY ERRORS, OMISSIONS OR INTERRUPTIONS THEREIN. S&P MAKES NO WARRANTY, EXPRESS OR IMPLIED, AS TO RESULTS TO BE OBTAINED BY THE FUND, ITS SHAREHOLDERS OR ANY OTHER PERSON OR ENTITY FROM THE USE OF THE S&P INDEX OR ANY DATA INCLUDED THEREIN. S&P MAKES NO EXPRESS OR IMPLIED WARRANTIES, AND EXPRESSLY DISCLAIMS ALL WARRANTIES OF MERCHANTABILITY OR FITNESS FOR A PARTICULAR PURPOSE OR USE WITH RESPECT TO THE S&P INDEX OR ANY DATA INCLUDED THEREIN. WITHOUT LIMITING ANY OF THE FOREGOING, IN NO EVENT SHALL S&P HAVE ANY LIABILITY FOR ANY SPECIAL, PUNITIVE, INDIRECT OR CONSEQUENTIAL DAMAGES (INCLUDING LOST PROFITS), EVEN IF NOTIFIED OF THE POSSIBILITY OF SUCH DAMAGES.
C-1
Appendix D
Class A – Calculation of the Sales Charge
Sales charges are determined as shown in the following table. The table is organized by investment category. You can find your fund’s investment category in Table 1.
Table 9. Class A Initial Sales Charge
| | | | | | | | | | |
| | | Class A Shares – Front-End Sales Charge – Breakpoint Schedule | |
| | | Total market value | | | Sales charge(a) as a percentage of: | |
Fund category | | | Public offering
price(b) | | | Net amount
invested | |
| | $ | 0 – $49,999 | | | 5.75 | % | | 6.10 | % |
| | $ | 50,000 – $99,999 | | | 4.50 | % | | 4.71 | % |
| | $ | 100,000 – $249,999 | | | 3.50 | % | | 3.63 | % |
Balanced, Equity, Fund-of-funds – equity* | | $ | 250,000 – $499,999 | | | 2.50 | % | | 2.56 | % |
| | $ | 500,000 – $999,999 | | | 2.00 | % | | 2.04 | % |
| | $ | 1,000,000 or more | (c),(d) | | 0.00 | % | | 0.00 | % |
| | $ | 0 – $49,999 | | | 4.75 | % | | 4.99 | % |
| | $ | 50,000 – $99,999 | | | 4.25 | % | | 4.44 | % |
Fund-of-funds – fixed income, State tax- | | $ | 100,000 – $249,999 | | | 3.50 | % | | 3.63 | % |
exempt fixed income, Taxable fixed | | $ | 250,000 – $499,999 | | | 2.50 | % | | 2.56 | % |
income, Tax-exempt fixed income | | $ | 500,000 – $999,999 | | | 2.00 | % | | 2.04 | % |
| | $ | 1,000,000 or more | (c),(d) | | 0.00 | % | | 0.00 | % |
For Columbia Absolute Return Currency | | $ | 0 – $99,999 | | | 3.00 | % | | 3.09 | % |
and Income Fund, Columbia Floating Rate | | $ | 100,000 – $249,999 | | | 2.50 | % | | 2.56 | % |
Fund, Columbia Inflation Protected | | $ | 250,000 – $499,999 | | | 2.00 | % | | 2.04 | % |
Securities Fund, Columbia Limited | | $ | 500,000 – $999,999 | | | 1.50 | % | | 1.52 | % |
Duration Credit Fund, RiverSource | | | | | | | | | | |
Intermediate Tax-Exempt Fund and | | | | | | | | | | |
RiverSource Short Duration U.S. | | $ | 1,000,000 or more | (c),(d) | | 0.00 | % | | 0.00 | % |
Government Fund | | | | | | | | | | |
| * | RiverSource S&P 500 Index Fund is not subject to a front-end sales change on Class A shares. |
| (a) | Because the offering price is calculated to two decimal places, the dollar amount of the sales charge as a percentage of the offering price and your net amount invested for any particular purchase of fund shares may be higher or lower depending on whether downward or upward rounding was required during the calculation process. |
| (b) | Purchase price includes the sales charge. |
| (c) | Although there is no sales charge for purchases with a total market value of $1 million or more, and therefore no re-allowance, the distributor may pay a selling and/or servicing agent the following out of its own resources: 1.00% on purchases from $1 million up to but not including $3 million; 0.50% on purchases of $3 million up to but not including $50 million; and 0.25% on amounts of $50 million or more. The distributor may be reimbursed if a CDSC is deducted when the shares are redeemed. |
| (d) | For eligible employee benefit plans, selling and/or servicing agents are eligible to receive from the distributor the following sales commissions on purchases that are coded as commission eligible trades: 1.00% on all purchases up to but not including $3 million, including those in amounts of less than $1 million; up to 0.50% on all purchases of $3 million up to but not including $50 million; and up to 0.25% on all purchases of $50 million or more. |
D-1
Appendix E
Legacy Columbia Funds
Legacy Columbia funds are funds that were branded Columbia or Columbia Acorn prior to Sept. 27, 2010.
ColumbiaSM Acorn® Fund
ColumbiaSM Acorn International®
ColumbiaSM Acorn International Select®
ColumbiaSM Acorn Select®
ColumbiaSM Acorn USA®
Columbia Asset Allocation Fund
Columbia Asset Allocation Fund II
Columbia Balanced Fund
Columbia Blended Equity Fund
Columbia Bond Fund
Columbia California Intermediate Municipal Bond Fund
Columbia California Tax-Exempt Fund
Columbia Connecticut Intermediate Municipal Bond Fund
Columbia Connecticut Tax-Exempt Fund
Columbia Conservative High Yield Fund
Columbia Contrarian Core Fund
Columbia Convertible Securities Fund
Columbia Core Bond Fund
Columbia Corporate Income Fund (formerly known as Columbia Income Fund)
Columbia Disciplined Value Fund
Columbia Dividend Income Fund
Columbia Emerging Markets Fund
Columbia Energy and Natural Resources Fund
Columbia Federal Securities Fund
Columbia Georgia Intermediate Municipal Bond Fund
E-1
Columbia Global Value Fund
Columbia Greater China Fund
Columbia High Income Fund
Columbia High Yield Municipal Fund
Columbia High Yield Opportunity Fund
Columbia Intermediate Bond Fund
Columbia Intermediate Municipal Bond Fund
Columbia International Bond Fund
Columbia International Growth Fund
Columbia International Stock Fund
Columbia International Value Fund
Columbia Large Cap Core Fund
Columbia Large Cap Enhanced Core Fund
Columbia Large Cap Growth Fund
Columbia Large Cap Index Fund
Columbia Large Cap Value Fund
Columbia Liberty Fund
Columbia LifeGoal® Balanced Growth Portfolio
Columbia LifeGoal® Growth Portfolio
Columbia LifeGoal® Income and Growth Portfolio
Columbia LifeGoal® Income Portfolio
Columbia Marsico 21st Century Fund
Columbia Marsico Focused Equities Fund
Columbia Marsico Global Fund
Columbia Marsico Growth Fund
Columbia Marsico International Opportunities Fund
Columbia Maryland Intermediate Municipal Bond Fund
Columbia Massachusetts Intermediate Municipal Bond Fund
E-2
Columbia Massachusetts Tax-Exempt Fund
Columbia Masters International Equity Portfolio
Columbia Mid Cap Core Fund
Columbia Mid Cap Growth Fund
Columbia Mid Cap Index Fund
Columbia Mid Cap Value Fund
Columbia Multi-Advisor International Equity Fund
Columbia New Jersey Intermediate Municipal Bond Fund
Columbia New York Intermediate Municipal Bond Fund
Columbia New York Tax-Exempt Fund
Columbia North Carolina Intermediate Municipal Bond Fund
Columbia Oregon Intermediate Municipal Bond Fund
Columbia Overseas Value Fund
Columbia Pacific/Asia Fund
Columbia Real Estate Equity Fund
Columbia Rhode Island Intermediate Municipal Bond Fund
Columbia Select Large Cap Growth Fund
Columbia Select Opportunities Fund
Columbia Select Small Cap Fund
Columbia Short Term Bond Fund
Columbia Short Term Municipal Bond Fund
Columbia Short-Intermediate Bond Fund
Columbia Small Cap Core Fund
Columbia Small Cap Growth Fund I
Columbia Small Cap Growth Fund II
Columbia Small Cap Index Fund
Columbia Small Cap Value Fund I
Columbia Small Cap Value Fund II
E-3
Columbia South Carolina Intermediate Municipal Bond Fund
Columbia Strategic Income Fund
Columbia Strategic Investor Fund
Columbia Tax-Exempt Fund
Columbia Technology Fund
ColumbiaSM Thermostat Fund®
Columbia Total Return Bond Fund
Columbia U.S. Treasury Index Fund
Columbia Value and Restructuring Fund
Columbia Virginia Intermediate Municipal Bond Fund
Columbia World Equity Fund
E-4
Appendix F
Legacy RiverSource Funds
Legacy RiverSource funds include RiverSource, Seligman and Threadneedle funds, funds renamed effective Sept. 27, 2010 to
bear the Columbia brand, and certain other funds. Prior fund names are noted in parenthesis.
Columbia 120/20 Contrarian Equity Fund (formerly known as RiverSource 120/20 Contrarian Equity Fund)
Columbia Absolute Return Currency and Income Fund (formerly known as RiverSource Absolute Return Currency and Income Fund)
Columbia AMT-Free Tax-Exempt Bond Fund (formerly known as RiverSource Tax-Exempt Bond Fund)
Columbia Asia Pacific ex-Japan Fund (formerly known as Threadneedle Asia Pacific Fund)
Columbia Diversified Bond Fund (formerly known as RiverSource Diversified Bond Fund)
Columbia Diversified Equity Income Fund (formerly known as RiverSource Diversified Equity Income Fund)
Columbia Dividend Opportunity Fund (formerly known as RiverSource Dividend Opportunity Fund)
Columbia Emerging Markets Bond Fund (formerly known as RiverSource Emerging Markets Bond Fund)
Columbia Emerging Markets Opportunity Fund (formerly known as Threadneedle Emerging Markets Fund)
Columbia Equity Value Fund (formerly known as RiverSource Equity Value Fund)
Columbia European Equity Fund (formerly known as Threadneedle European Equity Fund)
Columbia Floating Rate Fund (formerly known as RiverSource Floating Rate Fund)
Columbia Frontier Fund, Inc. (formerly known as Seligman Frontier Fund, Inc.)
Columbia Global Bond Fund (formerly known as RiverSource Global Bond Fund)
Columbia Global Equity Fund (formerly known as Threadneedle Global Equity Fund)
Columbia Global Extended Alpha Fund (RiverSource Global Extended Alpha Fund)
Columbia Government Money Market Fund, Inc. (formerly known as RiverSource Government Money Market Fund, Inc.)
Columbia High Yield Bond Fund (formerly known as RiverSource High Yield Bond Fund)
Columbia Income Builder Fund (formerly known as RiverSource Income Builder Basic Income Fund)
Columbia Income Builder Fund II (formerly known as RiverSource Income Builder Moderate Income Fund)
Columbia Income Builder Fund III (formerly known as RiverSource Income Builder Enhanced Income Fund)
Columbia Income Opportunities Fund (formerly known as RiverSource Income Opportunities Fund)
Columbia Inflation Protected Securities Fund (formerly known as RiverSource Inflation Protected Securities Fund)
Columbia Large Core Quantitative Fund (formerly known as RiverSource Disciplined Equity Fund)
F-1
Columbia Large Growth Quantitative Fund (formerly known as RiverSource Disciplined Large Cap Growth Fund)
Columbia Large Value Quantitative Fund (formerly known as RiverSource Disciplined Large Cap Value Fund)
Columbia Limited Duration Credit Fund (formerly known as RiverSource Limited Duration Bond Fund)
Columbia Marsico Flexible Capital Fund
Columbia Mid Cap Growth Opportunity Fund (formerly known as RiverSource Mid Cap Growth Fund)
Columbia Mid Cap Value Opportunity Fund (formerly known as RiverSource Mid Cap Value Fund)
Columbia Minnesota Tax-Exempt Fund (formerly known as RiverSource Minnesota Tax-Exempt Fund)
Columbia Money Market Fund (formerly known as RiverSource Cash Management Fund)
Columbia Multi-Advisor International Value Fund (formerly known as RiverSource Partners International Select Value Fund)
Columbia Multi-Advisor Small Cap Value Fund (formerly known as RiverSource Partners Small Cap Value Fund)
Columbia Portfolio Builder Aggressive Fund (formerly known as RiverSource Portfolio Builder Aggressive Fund)
Columbia Portfolio Builder Conservative Fund (formerly known as RiverSource Portfolio Builder Conservative Fund)
Columbia Portfolio Builder Moderate Aggressive Fund (formerly known as RiverSource Portfolio Builder Moderate Aggressive Fund)
Columbia Portfolio Builder Moderate Conservative Fund (formerly known as RiverSource Portfolio Builder Moderate Conservative Fund)
Columbia Portfolio Builder Moderate Fund (formerly known as RiverSource Portfolio Builder Moderate Fund)
Columbia Portfolio Builder Total Equity Fund (formerly known as RiverSource Portfolio Builder Total Equity Fund)
Columbia Recovery and Infrastructure Fund (formerly known as RiverSource Recovery and Infrastructure Fund)
Columbia Retirement Plus 2010 Fund (formerly known as RiverSource Retirement Plus 2010 Fund)
Columbia Retirement Plus 2015 Fund (formerly known as RiverSource Retirement Plus 2015 Fund)
Columbia Retirement Plus 2020 Fund (formerly known as RiverSource Retirement Plus 2020 Fund)
Columbia Retirement Plus 2025 Fund (formerly known as RiverSource Retirement Plus 2025 Fund)
Columbia Retirement Plus 2030 Fund (formerly known as RiverSource Retirement Plus 2030 Fund)
Columbia Retirement Plus 2035 Fund (formerly known as RiverSource Retirement Plus 2035 Fund)
Columbia Retirement Plus 2040 Fund (formerly known as RiverSource Retirement Plus 2040 Fund)
Columbia Retirement Plus 2045 Fund (formerly known as RiverSource Retirement Plus 2045 Fund)
Columbia Select Large-Cap Value Fund (formerly known as Seligman Large-Cap Value Fund)
Columbia Select Smaller-Cap Value Fund (formerly known as Seligman Smaller-Cap Value Fund)
F-2
Columbia Seligman Communications and Information Fund, Inc. (formerly known as Seligman Communications and Information Fund, Inc.)
Columbia Seligman Global Technology Fund (formerly known as Seligman Global Technology Fund)
Columbia Short-Term Cash Fund (formerly known as RiverSource Short-Term Cash Fund)
Columbia Strategic Allocation Fund (formerly known as RiverSource Strategic Allocation Fund)
Columbia U.S. Government Mortgage Fund (formerly known as RiverSource U.S. Government Mortgage Fund)
RiverSource Balanced Fund
RiverSource California Tax-Exempt Fund
RiverSource Disciplined International Equity Fund
RiverSource Disciplined Small and Mid Cap Equity Fund
RiverSource Disciplined Small Cap Value Fund
RiverSource Intermediate Tax-Exempt Fund
RiverSource LaSalle Global Real Estate Fund
RiverSource LaSalle Monthly Dividend Real Estate Fund
RiverSource New York Tax-Exempt Fund
RiverSource Partners Fundamental Value Fund
RiverSource Partners International Select Growth Fund
RiverSource Partners International Small Cap Fund
RiverSource Precious Metals and Mining Fund
RiverSource Real Estate Fund
RiverSource S&P 500 Index Fund
RiverSource Short Duration U.S. Government Fund
RiverSource Small Company Index Fund
RiverSource Strategic Income Allocation Fund
RiverSource Tax-Exempt High Income Fund
Seligman California Municipal High Yield Series
Seligman California Municipal Quality Series
Seligman Capital Fund, Inc.
Seligman Growth Fund, Inc.
F-3
Seligman Minnesota Municipal Class
Seligman National Municipal Class
Seligman New York Municipal Class
Seligman TargETFund 2015
Seligman TargETFund 2025
Seligman TargETFund 2035
Seligman TargETFund 2045
Seligman TargETFund Core
Threadneedle Global Equity Income Fund
Threadneedle International Opportunity Fund
S-6500 CP (9/10)
F-4
Appendix B - Pro forma financial statements of Columbia Global Equity Fund
NARRATIVE DESCRIPTION OF THE PRO FORMA EFFECTS OF THE REORGANIZATIONS
The unaudited pro forma information set forth below for the twelve month periods ended on the dates indicated is intended to present supplemental data as if the reorganizations of one or more funds (each a “Selling Fund” and together, the “Selling Funds”) into other corresponding funds (each a “Buying Fund” and together, the “Buying Funds”), as noted in Table 1 below (the “Reorganizations”), had occurred as of the beginning of the period (unless otherwise noted). No Reorganization is contingent upon any other Reorganization. Information has not been presented for any Reorganizations involving a Selling Fund the net assets of which were less than 10% of the net assets of the Buying Fund as of August 31, 2010.
Table 1 – Reorganizations
| | | | |
Selling Fund | | Buying Fund | | Period Ended |
Columbia Global Value Fund | | Threadneedle Global Equity Fund | | April 30, 2010 |
Columbia World Equity Fund | | Threadneedle Global Equity Fund | | April 30, 2010 |
Basis of Combination
In August 2010, the Boards of Trustees of the Selling Funds approved an Agreement and Plan of Reorganization (the “Plan of Reorganization”) pursuant to which, subject to shareholder approval, each Selling Fund will transfer all of its assets to the Buying Fund in exchange for shares of the Buying Fund (“Reorganization Shares”) and the Buying Fund will assume all of the liabilities of the corresponding Selling Fund. Selling Fund shareholders will receive the class of Reorganization Shares indicated in Table 2 below. The Buying Fund will issue Reorganization Shares with an aggregate net asset value equal to the aggregate value of the assets that it receives from the corresponding Selling Fund, less the liabilities it assumes from the corresponding Selling Fund. All Reorganization Shares delivered to the Selling Funds will be delivered at net asset value without a sales load, commission or other similar fee being imposed. Immediately following the transfer, the Reorganization Shares received by each Selling Fund will be distributed pro rata, on what is expected to be a tax-free basis for U.S. federal income tax purposes, to the shareholders of the Selling Fund in proportion to their holdings of shares of the Selling Fund.
Table 2 – Reorganization Shares
| | | | | |
Selling Fund Share Class | | | | Reorganization Share Class |
Class A | | g | | | Class A |
Class B | | g | | | Class B |
Class C | | g | | | Class C |
Class Z | | g | | | Class Z |
Under the terms of the Plan of Reorganization, each Reorganization will be accounted for by the method of accounting for tax-free mergers of investment companies. Following the Reorganizations, the Buying Fund will be the accounting survivor. In accordance with accounting principles generally accepted in the United States, the historical cost of investment securities will be carried forward to the surviving fund and the results of operations for pre-Reorganization periods will not be restated. The costs of the Reorganizations, current estimates of which are set forth in Table 5 below, will be borne by the Selling Funds and the Buying Fund (each a “Fund” and collectively, the “Funds”) up to the amount of the anticipated reduction in expenses borne by that Fund over the first year following the Reorganization. Any Reorganization expenses otherwise allocable to a Fund that are in excess of that limitation will be borne by Columbia Management Investment Advisers, LLC (“Columbia Management”) or its affiliates and not by any other Fund. If a Reorganization is not consummated, Columbia Management or its affiliates will bear the costs associated with that Reorganization. The pro forma information provided herein should be read in conjunction with the audited financial statements of the Funds included in their most recent annual reports and, as applicable, the unaudited financial statements of the Funds included in their most recent semiannual reports, in each case dated as indicated in Table 3 below.
Table 3 – Shareholder Reports and Statements of Additional Information Dates
| | | | |
Fund | | Annual Report | | Semi-
Annual
Report |
Threadneedle Global Equity Fund (Buying Fund) | | 10/31/2009 | | 4/30/2010 |
Columbia Global Value Fund (Selling Fund) | | 2/28/2010 | | N/A |
Columbia World Equity Fund (Selling Fund) | | 3/31/2010 | | N/A |
5
Table 4 below presents, as of the date indicated, the net assets of each Fund.
Table 4 – Selling Funds and Buying Funds Net Assets
| | | | | |
Fund | | Net Assets | | As-Of Date |
Columbia Global Value Fund (Selling Fund) | | $ | 52,860,078 | | April 30, 2010 |
Columbia World Equity Fund (Selling Fund) | | $ | 54,814,282 | | April 30, 2010 |
Threadneedle Global Equity Fund (Buying Fund) | | $ | 474,178,372 | | April 30, 2010 |
The number of Reorganizations into the Buying Fund that occur will affect the net assets and total annual operating expenses of the Buying Fund and the costs of each Reorganization. Table 5 presents the estimated Reorganization costs (exclusive of any transaction costs associated with any portfolio realignment); the net assets as of the date indicated in Table 4 above of the Buying Fund assuming the indicated Reorganizations occurred on that date, after accounting for the estimated Reorganization costs to be borne by the Buying Fund and the corresponding Selling Funds; and, on a pro forma basis, the estimated relative increases or decreases in combined operating expenses that would have been incurred during the one-year period ended on the date indicated in Table 4 above, assuming in each case that (1) certain, but not all, of the Reorganizations into each Buying Fund are consummated or (2) that all of the Reorganizations into the Buying Fund are consummated. Specifically, the table presents information assuming (a) the combination of Reorganizations into the Buying Fund that results in the highest possible total annual operating expense ratio are consummated, and (b) all of the Reorganizations into the Buying Fund, which results in the lowest possible total annual operating expense ratio. The pro forma increases (decreases) represent the differences between (i) the combined expenses actually charged to the Buying Fund and the Selling Fund during the period and (ii) the expenses that would have been charged to the combined assets of the Buying and Selling Funds if the reorganizations and other contractual changes had occurred at the beginning of the year.
The unaudited pro forma information set forth in Table 5 below reflects adjustments made to expenses for differences in contractual rates, duplicate services and other services that would not have occurred if the Reorganizations had taken place on the first day of the period described in Table 1 above. The pro forma information has been derived from the books and records of the Funds utilized in calculating daily net asset value for the Funds and has been prepared in accordance with accounting principles generally accepted in the United States, which require the use of management estimates. Actual results could differ from those estimates.
Table 5 – Estimated Reorganization Costs, Combined Fund Net Assets and Pro Forma Increases or Decreases in Expenses (1)
| | | | | | | | |
Proposal 1 | | Highest Expenses
(the Reorganization of only
Columbia World Equity
Fund) | | | Lowest Expenses
(the Reorganization of all
of the Selling Funds) | |
Estimated Reorganization Costs | | $ | 21,194 | | | $ | 60,950 | |
Combined Fund Net Assets as of the Date Indicated in Table 4 | | $ | 528,971,460 | | | $ | 581,791,782 | |
Management fees (2) | | $ | 350,769 | | | $ | 238,807 | |
Custodian fees (3) | | $ | (25,619 | ) | | $ | (31,773 | ) |
Pricing and bookkeeping (4) | | $ | (57,770 | ) | | $ | (117,454 | ) |
Professional fees (5) | | $ | (48,742 | ) | | $ | (153,577 | ) |
Registration fees (5) | | $ | (32,013 | ) | | $ | (81,265 | ) |
Reports to shareholders (5) | | $ | (14,745 | ) | | $ | (19,498 | ) |
Transfer agency fees (3) | | $ | (182,735 | ) | | $ | (202,445 | ) |
Other (5) | | $ | (36,529 | ) | | $ | (82,843 | ) |
Waiver and/or reimbursement of fund expenses (6) | | $ | (278,243 | ) | | $ | (40,436 | ) |
| (1) | See “Fees and Expenses” in the Proxy Statement/Prospectus for more information. |
| (2) | Management fees are composed of an advisory fee and an administration fee and have been adjusted to reflect (i) the contractual rates charged to the Buying Fund and (ii) the elimination of the performance incentive adjustment for the Buying Fund, proposed to be effective in the second quarter of 2011, subject to shareholder approval. |
| (3) | Adjustment reflects changes in contractual rates. |
| (4) | Adjustment reflects changes in contractual rates. This service will not be separately charged and will be provided as a component of administration services. |
| (5) | Adjustment reflects the elimination of duplicate services. |
| (6) | Adjustment reflects the aggregate (increase)/decrease in expense reimbursements and/or waivers by Columbia Management and its affiliates. |
6
Pursuant to an Investment Management Services Agreement with Columbia Management, each Fund pays a monthly management fee to Columbia Management based on the average daily net assets of the Fund, at the annual rates shown in Table 6 below. The Board of Directors of the Buying Fund has approved a new Investment Management Services Agreement (“New Agreement”) for the Buying Fund, under which management fees would be paid to Columbia Management based on the average daily net assets of the Fund, at the annual rates shown below.
For the Buying Fund, the New Agreement also reflects the elimination of a performance incentive adjustment (“PIA”). The PIA adjusts the investment management fee upward or downward monthly by measuring the percentage difference over a rolling 12-month period between the annualized performance of one Class A share of the Fund and the annualized performance of the MSCI All Country World Index. The maximum adjustment is 0.12% per year. If the performance difference is less than 0.50%, the adjustment will be zero.
The New Agreement is subject to approval by shareholders of the Buying Fund.
Table 6 – Investment Management Fees
| | | | | | | | |
Fund | | Assets (billions) | | Annual Rate at
Each Asset Level
(Current) | | | Annual Rate at
Each Asset Level
(Buying Fund -
Proposed) | |
Threadneedle Global Equity Fund (Buying Fund) | | First $0.25
Next $0.25 Next $0.25 Next $0.25 Next $0.5 Next $0.5 Next $1.0 Next $3.0 Next $1.5 Next $1.5 Next $1.0 Next $5.0 Next $5.0 Next $4.0 Next $26.0 Over $50.0 | | 0.800
0.775 0.750 0.725 0.700 0.700 0.675 0.675 0.675 0.660 0.660 0.645 0.635 0.610 0.600 0.570 | %
% % % % % % % % % % % % % % % | | 0.800
0.775 0.750 0.725 0.700 0.650 0.650 0.640 0.620 0.620 0.620 0.620 0.620 0.610 0.600 0.570 | %
% % % % % % % % % % % % % % % |
Columbia Global Value Fund (Selling Fund) | | First $0.5
Next $0.5 Next $0.5 Next $1.5 Next $3.0 Over $6.0 | | 0.90
0.85 0.80 0.75 0.73 0.71 | %
% % % % % | | N/A | |
Columbia World Equity Fund (Selling Fund) | | First $1.0
Over $1.0 | | 0.40
0.35 | %
% | | N/A | |
Pursuant to an Administrative Services Agreement with Columbia Management or Ameriprise Financial, Inc. (“Ameriprise Financial”), as indicated in Table 7 below, each Fund’s administrator (“Administrator”) provides most administrative services to the Fund. For all services provided under the Administrative Services Agreement or Administration Agreement, as applicable, each Fund pays its Administrator a monthly administration fee as a percentage of the Fund’s average daily net assets, at the annual rates shown in Table 7 below.
Table 7 – Administration Fees
7
| | | | | | | |
Fund | | Administrator | | Assets (billions) | | Annual Rate at
Each Asset Level | |
Threadneedle Global Equity Fund (Buying Fund) | | Ameriprise
Financial | | First $0.5
Next $0.5 Next $2.0 Next $9.0 Over $12.0 | | 0.080
0.075 0.070 0.060 0.050 | %
% % % % |
Columbia Global Value Fund (Selling Fund) | | Columbia
Management | | First $0.5
Next $0.5 Next $2.0 Next $9.0 Over $12.0 | | 0.17
0.17 0.17 0.17 0.17 | %
% % % % |
Columbia World Equity Fund (Selling Fund) | | Columbia
Management | | All | | 0.25 | % |
Ameriprise Financial provides accounting services as part of its Administrative Services Agreement. State Street Bank and Trust Company provides accounting services to the Funds administered by Columbia Management.
Columbia Management Investment Services Corp., an affiliate of Columbia Management, is the transfer agent for each Fund. Columbia Management Investment Distributors, Inc., an affiliate of Columbia Management, is the distributor for each Fund.
No significant accounting policies will change as the result of the proposed Reorganizations.
The estimated costs of the Reorganizations shown in Table 5 above do not reflect any brokerage commissions incurred by a Fund in connection with any portfolio realignment. Columbia Management expects that, subsequent to the Reorganizations, there may be some portfolio realignment in the Buying Fund (of securities acquired from the Selling Funds). However, Columbia Management expects that any such portfolio realignment will not result in any significant increase in the Buying Fund’s portfolio turnover rate, relative to its historical portfolio turnover rates. Columbia Management also does not expect any incremental trading costs to be significant.
Federal Income Taxes
Please see “Tax Status of the Reorganizations” in the Prospectus/Proxy Statement for a discussion of the tax effects of each Reorganization.
It is each Fund’s policy to comply with the requirements of the Internal Revenue Code applicable to regulated investment companies, and to distribute all of its investment company taxable income to shareholders. After the Reorganizations, the Buying Funds intend to continue to qualify as regulated investment companies.
8
RIVERSOURCE GLOBAL SERIES, INC.
PART C
OTHER INFORMATION
PART C. OTHER INFORMATION
Item 15. Indemnification
The Articles of Incorporation of the registrant provide that the Fund shall indemnify any person who was or is a party or is threatened to be made a party, by reason of the fact that she or he is or was a director, officer, employee or agent of the Fund, or is or was serving at the request of the Fund as a director, officer, employee or agent of another company, partnership, joint venture, trust or other enterprise, to any threatened, pending or completed action, suit or proceeding, wherever brought, and the Fund may purchase liability insurance and advance legal expenses, all to the fullest extent permitted by the laws of the State of Minnesota, as now existing or hereafter amended. The By-laws of the registrant provide that present or former directors or officers of the Fund made or threatened to be made a party to or involved (including as a witness) in an actual or threatened action, suit or proceeding shall be indemnified by the Fund to the full extent authorized by the Minnesota Business Corporation Act, all as more fully set forth in the By-laws.
Insofar as indemnification for liability arising under the Securities Act of 1933 may be permitted to directors, officers and controlling persons of the registrant pursuant to the foregoing provisions, or otherwise, the registrant has been advised that in the opinion of the Securities and Exchange Commission such indemnification is against public policy as expressed in the Act and is, therefore, unenforceable. In the event that a claim for indemnification against such liabilities (other than the payment by the registrant of expenses incurred or paid by a director, officer or controlling person of the registrant in the successful defense of any action, suit or proceeding) is asserted by such director, officer or controlling person in connection with the securities being registered, the registrant will, unless in the opinion of its counsel the matter has been settled by controlling precedent, submit to a court of appropriate jurisdiction the question whether such indemnification by it is against public policy as expressed in the Act and will be governed by the final adjudication of such issue.
Any indemnification hereunder shall not be exclusive of any other rights of indemnification to which the directors, officers, employees or agents might otherwise be entitled. No indemnification shall be made in violation of the Investment Company Act of 1940.
Item 16. Exhibits
| (1) | (a) Articles of Incorporation, dated October 28, 1988, filed as Exhibit 1 to Registration Statement No. 33-25824, are incorporated by reference. |
| (1) | (b) Articles of Amendment, dated October 10, 1990, filed as Exhibit 1 to Registrant’s Post Effective Amendment No. 9 to Registration Statement No. 33-25824, are incorporated by reference. |
| (1) | (c) Articles of Amendment, dated June 16, 1999, filed electronically as Exhibit (a)(3) to Registrant’s Post-Effective Amendment No. 35 to Registration Statement No. 33-25824 filed on or about Dec. 21, 2000, are incorporated by reference. |
| (1) | (d) Articles of Amendment of AXP Global Series, Inc., dated November 14, 2002, filed electronically as Exhibit (a)(4) to Registration Statement No. 33-25824 on or about Dec. 20, 2002, are incorporated by reference. |
| (1) | (e) Articles of Amendment, dated April 21, 2006, filed electronically on or about June 2, 2006 as Exhibit (a)(5) to Registrant’s Post-Effective Amendment No. 49 to Registration Statement No. 33-25824 are incorporated by reference. |
| (1) | (f) Certificate of Designation, dated April 8, 2008 filed electronically on or about April 17, 2008 as Exhibit (a)(6) to Registrant’s Post-Effective Amendment No. 54 to Registration Statement No. 33-25824 is incorporated by reference. |
| (1) | (g) Certificate of Designation, dated April 10, 2008 filed electronically on or about April 17, 2008 as Exhibit (a)(7) to Registrant’s Post-Effective Amendment No. 54 to Registration Statement No. 33-25824 is incorporated by reference. |
| (1) | (h) Certificate of Designation reflecting the addition of Class R2 shares to Threadneedle Emerging Markets Fund, dated Feb. 23, 2009, filed electronically on or about Dec. 29, 2009 as Exhibit (a)(8) to Registrant’s Post-Effective Amendment No. 60 to Registration Statement No. 33-25824 is incorporated by reference. |
| (1) | (i) Certificate of Designation reflecting the addition of Class R2, Class 3 and Class R5 shares to RiverSource Global Bond Fund, dated Feb. 1, 2010, is filed electronically herewith as Exhibit (a)(9) to Registrant’s Post-Effective Amendment No. 61 to Registration Statement No. 33-25824. |
| (2) | By-laws, as amended April 13, 2006, filed electronically on or about April 17, 2008 as Exhibit (b) to Registrant’s Post-Effective Amendment No. 54 to Registration Statement No. 33-25824 are incorporated by reference. |
| (4) | Form of Agreement and Plan of Reorganization is filed electronically herewith. |
| (6) | (a) Investment Management Services Agreement, dated May 1, 2006, amended and restated Sept. 14, 2009, between Registrant and RiverSource Investments, LLC filed electronically on or about Dec. 29, 2009 as Exhibit (d)(1) to Registrant’s Post-Effective Amendment No. 60 to Registration Statement No. 33-25824 is incorporated by reference. |
| (6) | (b) Subadvisory Agreement, dated June 11, 2008 between RiverSource Investments, LLC and Threadneedle International Limited, filed electronically on or about Oct. 29, 2008 as Exhibit (d)(2) to Registrant’s Post-Effective Amendment No. 57 to Registration Statement No. 33-25824 is incorporated by reference. |
| (6) | (c) Amendment One to Amended and Restated Subadvisory Agreement, dated July 13, 2009, between RiverSource Investments, LLC and Threadneedle International Limited filed electronically on or about Dec. 29. 2009 as Exhibit (d)(3) to RiverSource International Series, Inc. Post-Effective Amendment No. 52 to Registration Statement No. 2-92309 is incorporated by reference. |
| (7) | (a) Distribution Agreement, effective Nov. 7, 2008, amended and restated Sept. 14, 2009, between Registrant and RiverSource Fund Distributors, Inc. filed electronically on or about Sept. 25, 2009 as Exhibit (e)(1) to RiverSource Large Cap Series, Inc. Post-Effective Amendment No. 86 to Registration Statement No. 2-38355 is incorporated by reference. |
| (7) | (b) Form of Service Agreement filed electronically on or about Aug. 27, 2007 as Exhibit (e)(3) to RiverSource Sector Series, Inc. Post-Effective Amendment No. 39 to Registration Statement No. 33-20872 is incorporated by reference. |
| (7) | (c) Form of RiverSource Funds Dealer Agreement filed electronically on or about Aug. 27, 2007 as Exhibit (e)(4) to RiverSource Sector Series, Inc. Post-Effective Amendment No. 39 to Registration Statement No. 33-20872 is incorporated by reference. |
| (8) | Deferred Compensation Plan, amended and restated Jan. 1, 2009, filed electronically on or about Jan. 27, 2009 as Exhibit (f) to RiverSource Equity Series, Inc. Post-Effective Amendment No. 105 to Registration Statement No. 2-13188 is incorporated by reference. |
| (9) | Form of Master Global Custody Agreement with JPMorgan Chase Bank, N.A. filed electronically on or about Dec. 23, 2008 as Exhibit (g) to RiverSource International Managers Series, Inc. Post-Effective Amendment No. 18 to Registration Statement No. 333-64010 is incorporated by reference. |
| (10) | (a) Plan of Distribution and Agreement of Distribution, effective Nov. 7, 2008, amended and restated Sept. 14, 2009, between Registrant and RiverSource Fund Distributors, Inc. filed electronically on or about Sept. 25, 2009 as Exhibit (m) to RiverSource Large Cap Series, Inc. Post-Effective Amendment No. 86 to Registration Statement No. 2-38355 is incorporated by reference. |
| (10) | (b) Rule 18f—3(d) Plan, amended and restated as of Sept. 14, 2009, filed electronically on or about Sept. 25, 2009 as Exhibit (n) to RiverSource Large Cap Series, Inc. Post-Effective Amendment No. 86 to Registration Statement No. 2-38355 is incorporated by reference. |
| (11) | Opinion and consent of counsel as to the legality of the securities being registered is filed electronically herewith. |
| (12) | Opinion of Counsel – to be filed by amendment. |
| (13) | (a) Administrative Services Agreement, dated Oct. 1, 2005, amended and restated Sept. 14, 2009, between Registrant and Ameriprise Financial, Inc. filed electronically on or about Sept. 25, 2009 as Exhibit (h)(1) to RiverSource Large Cap Series, Inc. Post-Effective Amendment No. 86 to Registration Statement No. 2-38355 is incorporated by reference. |
| (13) | (b) Transfer Agency Agreement, dated Oct. 1, 2005, amended and restated Sept. 14, 2009, between Registrant and RiverSource Service Corporation filed electronically on or about Sept. 25, 2009 as Exhibit (h)(2) to RiverSource Large Cap Series, Inc. Post-Effective Amendment No. 86 to Registration Statement No. 2-38355 is incorporated by reference. |
| (13) | (c) Plan Administration Services Agreement, dated Dec. 1, 2006, amended and restated Sept. 14, 2009, between Registrant and RiverSource Service Corporation filed electronically on or about Sept. 25, 2009 as Exhibit (h)(3) to RiverSource Large Cap Series, Inc. Post-Effective Amendment No. 86 to Registration Statement No. 2-38355 is incorporated by reference. |
| (13) | (d) Master Fee Cap/Fee Waiver Agreement, dated Oct. 1, 2005, amended and restated Sept. 14, 2009 between RiverSource Investments, LLC, Ameriprise Financial, Inc., RiverSource Service Corporation, RiverSource Fund Distributors, Inc. and the Registrant filed electronically on or about Sept. 25, 2009 as Exhibit (h)(11) to RiverSource Large Cap Series, Inc. Post-Effective Amendment No. 86 to Registration Statement No. 2-38355 is incorporated by reference. |
| (13) | (e) License Agreement, effective May 1, 2006, amended and restated as of Nov. 12, 2008, between Ameriprise Financial, Inc. and RiverSource Family of Funds filed electronically on or about Feb. 27, 2009 as Exhibit (h)(4) to RiverSource Variable Series Trust Post-Effective Amendment No. 4 to Registration Statement No. 333-146374 is incorporated by reference. |
| (13) | (f) Form of License Agreement, dated July 10, 2004, between Threadneedle Asset Management Holdings Limited and the Registrant filed electronically on or about Dec. 24, 2008 as Exhibit (h)(10) to Registrant’s Post-Effective Amendment No. 58 to Registration Statement No. 33-25824 is incorporated by reference. |
| (13) | (g) Form of License Agreement Amendment, dated May 15, 2008, between Threadneedle Asset Management Holdings Limited and RiverSource Global Series, Inc., RiverSource International Series, Inc. and RiverSource Variable Series Trust filed electronically on or about June 30, 2008 as Exhibit (h)(10) to Registrant’s Post-Effective Amendment No. 56 to Registration Statement No. 33-25824 is incorporated by reference. |
| (13) | (h) Form of License Agreement Amendment between Threadneedle Asset Management Holdings Limited and RiverSource Global Series, Inc., RiverSource International Series, Inc. and RiverSource Variable Series Trust filed electronically on or about July 8, 2009 as Exhibit (h)(10) to RiverSource International Series, Inc. Post-Effective Amendment No. 51 to Registration Statement No. 2-92309 is incorporated by reference. |
| (13) | (i) Agreement and Plan of Reorganization between AXP Global Series, Inc., on behalf of AXP Emerging Markets Fund, and Strategist World Fund, Inc., on behalf of Strategist Emerging Markets Fund, dated March 10, 2000, filed electronically as Exhibit (h)(7) to Registrant’s Post-Effective Amendment No. 35 to Registration Statement No. 33-25824 filed on or about Dec. 21, 2000, is incorporated by reference. |
| (13) | (j) Agreement and Plan of Reorganization between AXP Global Series, Inc., on behalf of AXP Global Bond Fund, and Strategist World Fund, Inc., on behalf of Strategist World Income Fund, dated March 10, 2000, filed electronically as Exhibit (h)(8) to Registrant’s Post-Effective Amendment No. 35 to Registration Statement No. 33-25824 filed on or about Dec. 21, 2000, is incorporated by reference. |
| (13) | (k) Agreement and Plan of Reorganization between AXP Global Series, Inc., on behalf of AXP Global Growth Fund, and Strategist World Fund, Inc., on behalf of Strategist World Growth Fund, dated March 10, 2000, filed electronically as Exhibit (h)(9) to Registrant’s Post-Effective Amendment No. 35 to Registration Statement No. 33-25824 filed on or about Dec. 21, 2000, is incorporated by reference. |
| (13) | (l) Agreement and Plan of Reorganization, dated Jan. 10, 2009, between Seligman Global Fund Series, Inc., on behalf of Seligman Emerging Markets Fund, and RiverSource Global Series, Inc., on behalf of Threadneedle Emerging Markets Fund, and Seligman Global Fund Series, Inc., on behalf of Seligman Global Growth Fund and RiverSource Global Series, Inc., on behalf of Threadneedle Global Equity Fund, filed electronically on or about Dec. 29, 2009 as Exhibit (h)(12) to Registrant’s Post-Effective Amendment No. 60 to Registration Statement No. 33-25824 is incorporated by reference. |
| (13) | (m) Code of Ethics adopted under Rule 17j-1 for Registrant filed electronically on or about Feb. 27, 2009 as Exhibit (p)(1) to RiverSource Variable Series Trust Post-Effective Amendment No. 4 to Registration Statement No. 333-146374 is incorporated by reference. |
| (13) | (n) Code of Ethics adopted under Rule 17j-1 for Registrant’s principal underwriter, dated April 2008, filed electronically on or about April 25, 2008 as Exhibit (p)(2) to RiverSource Variable Series Trust Post-Effective Amendment No. 3 to Registration Statement No. 333-146374 is incorporated by reference. |
| (13) | (o) Code of Ethics adopted under Rule 17j-1 for Registrant’s investment adviser, dated Nov. 15, 2009, filed electronically on or about Nov. 30, 2009 as Exhibit (p)(3) to RiverSource Tax-Exempt Income Series, Inc. Post-Effective Amendment No. 51 to Registration Statement No. 2-63552 is incorporated by reference. |
| (13) | (p) Code of Ethics, dated March 2006, adopted under Rule 17j-1, for Threadneedle Asia Pacific Fund’s, Threadneedle European Equity Fund’s and Threadneedle International Opportunity Fund’s Subadviser, Threadneedle International Ltd., filed electronically on or about June 30, 2008, as Exhibit (p)(3) to Registrant’s Post-Effective Amendment No. 56 to Registration Statement No. 33-25824 is incorporated by reference. |
| (14) | (a) Consent of Independent Registered Public Accounting Firm (Ernst & Young LLP) is filed electronically herewith. |
| (14) | (b) Consent of Independent Registered Public Accounting Firm (PricewaterhouseCoopers LLP) is filed electronically herewith. |
| (16) | Directors Power of Attorney to sign Amendments to this Registration Statement, dated September 7, 2010, filed electronically herewith. |
Item 17. Undertakings
| (1) | The undersigned Registrant agrees that prior to any public reoffering of the securities registered through the use of a prospectus which is a part of this registration statement by any person or party who is deemed to be an underwriter within the meaning of Rule 145(c) of the Securities Act, the reoffering prospectus will contain the information called for by the applicable registration form for the reofferings by persons who may be deemed underwriters, in addition to the information called for by the other items of the applicable form. |
| (2) | The undersigned Registrant agrees that every prospectus that is filed under paragraph above will be filed as a part of an amendment to the registration statement and will not be used until the amendment is effective, and that, in determining any liability under the 1933 Act, each post-effective amendment shall be deemed to be a new registration statement for the securities offered therein, and the offering of the securities at that time shall be deemed to be the initial bona fide offering of them. |
| (3) | The Registrant undertakes to file the opinion of counsel supporting the tax consequences of the proposed reorganization required by Item 16(12) through an amendment to this Registration Statement no later than a reasonable time after the closing of the transaction. |
SIGNATURES
As required by the Securities Act of 1933, this Registration Statement has been signed on behalf of the Registrant by the undersigned, duly authorized, in the City of Minneapolis, and State of Minnesota on the 27th day of September, 2010.
| | |
| RIVERSOURCE GLOBAL SERIES, INC. |
| |
| By: | | /S/ J. KEVIN CONNAUGHTON |
| Name: | | J. Kevin Connaughton |
| Title: | | President |
| |
| By: | | /S/ JEFFREY P. FOX |
| Name: | | Jeffrey P. Fox |
| Title: | | Treasurer |
Pursuant to the requirements of the Securities Act of 1933, this Registration Statement has been signed by the following persons in the capacities and on the date indicated:
| | | | |
SIGNATURES | | TITLE | | DATE |
| | |
/S/ STEPHEN R. LEWIS, JR.* | | Chair of the Board | | September 27, 2010 |
| Stephen R. Lewis, Jr. | | | | |
| | |
/S/ KATHLEEN A. BLATZ* | | Director | | September 27, 2010 |
| Kathleen A. Blatz | | | | |
| | |
/S/ ARNE H. CARLSON* | | Director | | September 27, 2010 |
| Arne H. Carlson | | | | |
| | |
/S/ PAMELA G. CARLTON* | | Director | | September 27, 2010 |
| Pamela G. Carlton | | | | |
| | |
/S/ PATRICIA M. FLYNN* | | Director | | September 27, 2010 |
| Patricia M. Flynn | | | | |
| | |
/S/ ANNE P. JONES* | | Director | | September 27, 2010 |
| Anne P. Jones | | | | |
| | |
/S/ JEFFREY LAIKIND* | | Director | | September 27, 2010 |
| Jeffrey Laikind | | | | |
| | |
/S/ JOHN F. MAHER* | | Director | | September 27, 2010 |
| John F. Maher | | | | |
| | |
/S/ CATHERINE JAMES PAGLIA* | | Director | | September 27, 2010 |
| Catherine James Paglia | | | | |
| | |
/S/ LEROY C. RICHIE* | | Director | | September 27, 2010 |
| Leroy C. Richie | | | | |
| | | | |
/S/ ALISON TAUNTON-RIGBY* | | Director | | September 27, 2010 |
| Alison Taunton-Rigby | | | | |
| | |
/S/ WILLIAM F. TRUSCOTT* | | Director | | September 27, 2010 |
| William F. Truscott | | | | |
| | |
| *By: | | /S/ SCOTT R. PLUMMER |
| | Scott R. Plummer** September 27, 2010 |
| ** | Executed by Scott R. Plummer on behalf of each of the Directors pursuant to a Power of Attorney dated September 7, 2010 and filed herewith. |
Exhibit Index
| | |
Exhibit No. | | Description |
| |
| (4) | | Form of Agreement and Plan of Reorganization |
| |
| (11) | | Opinion and consent of counsel as to the legality of the securities being registered |
| |
| (14)(a) | | Consent of Independent Registered Public Accounting Firm (Ernst & Young LLP) |
| |
| (14)(b) | | Consent of Independent Registered Public Accounting Firm (PricewaterhouseCoopers LLP) |
| |
| (16) | | Directors Power of Attorney to sign Amendments to this Registration Statement, dated September 7, 2010 |