EXHIBIT 99.4

9 March 2010
Company Announcements Office
Australian Securities Exchange Ltd
“This press release is not for dissemination in the United States and
shall not be disseminated to United States news services.”
2 MILLION OUNCES IN MEASURED AND INDICATED
RESOURCES AT PIGIPUT AND PIGIBO DEPOSITS
INCREASED BY 170%
HIGHLIGHTS
| · | New resource estimates for Pigiput and Pigibo deposits give total Measured and Indicated Resources of 48.1 million tonnes at 1.35 g/t gold, at 0.5g/t gold block cut-off, equivalent to 2.08 million ounces of gold |
| · | 170% increase in estimated contained gold in Measured and Indicated resources compared to previous estimates |
| · | Pigiput total Measured and Indicated resources estimated as 41.0 million tonnes at 1.38 g/t gold for 1.82 million ounces of gold |
| · | Pigibo total Measured and Indicated resources estimated as 7.1 million tonnes at 1.18 g/t gold for 0.27 million ounces of gold |
| · | Total group combined Measured, Indicated and Inferred Resources of 194.4 million tonnes at 1.25 g/t gold for 7.80 million ounces of gold (Simberi, 156.6 million tonnes at 1.13 g/t for 5.69 million ounces of gold and Gold Ridge, 37.8 million tonnes at 1.74 g/t for 2.11 million ounces of gold) |
| · | Reserve estimation to be undertaken on completion of Phase III drilling at Pigibo, Pigiput and north-east towards SE Sorowar |
Allied Gold (ASX:ALD) has received new resource estimates for Pigiput and Pigibo deposits from consultants, Golder and Associates, totalling 48.1Mt @ 1.38g/t Au in Measured and Indicated categories for 2.08 million ounces of gold, using a 0.5g/t Au block cut-off. Mineral Resources classified as Inferred are estimated to be 38.5Mt @ 1.00 g/t Au for 1.24 Moz of gold and 86.6Mt @ 3.70g/t Ag for 10.3 Moz of silver. Compared to the previous estimates, this represents a significant consolidation, with the equivalent of net 30.4 Mt @ 1.34 g/t Au (1.31 Moz gold) converted to Measured and Indicated, and net expansion of total resources, by 29.4Mt @ 1.04g/t Au (0.98 Moz gold).
1 | A L D
Phase III drilling is on-going with efforts focussed on testing down dip at Pigipbo and the open north eastern side of Pigiput. A further seventeen (17) diamond core holes for 4,360 metres, have been completed since the resource database close-off and two (2) are in progress. The holes are part of a phased in-fill and step-out program, commenced in May 2009, designed to support the A$10 million Sulphide and Oxide Expansion Studies based around the Pigiput Deposit. These studies target increasing total oxide and sulphide production to in excess of 200,000oz p.a. by 2012.
A particular focus of the Phase III programme is to test the presently open north-eastern limit of Pigiput, with the aim of establishing a link with known mineralisation already immediately north at southeast Sorowar.
The new estimates for Pigiput and Pigibo bring Allied Gold’s total Measured and Indicated Resources at the flagship Simberi Gold Mine (PNG) and the Gold Ridge Project (Solomon Islands) to 4.81 million ounces being:
Simberi(1) 78.4Mt @ 1.27 g/t Au for 3.20 Moz of gold
Gold Ridge(2) 29.5Mt @ 1.72 g/t Au for 1.63 Moz of gold
In addition, estimated Inferred Resources increase to 2.97 million ounces being:
Simberi(1) 78.2Mt @ 0.99 g/t Au for 2.49 Moz of gold
Gold Ridge(2) 8.3Mt @ 1.80 g/t Au for 0.48 Moz of gold
This equates to a total Measured, Indicated and Inferred Resource for Simberi and Gold Ridge of 194.4 Mt @ 1.25 g/t Au for 7.8 Moz of gold.
NOTES
| (1) | Simberi Total Gold Resources May 2009 – Above 0.5g/t Au Cut-off Grade as quoted in ALD Annual Report 08 | 09 with Pigiput and Pigibo resources updated by this February 2010 estimate |
| (2) | Gold Ridge Total Resources as quoted in ALD Preliminary Short Form Prospectus November 13, 2009 |
OVERVIEW
Allied Gold is actively undertaking in-fill and step-out diamond core drilling of the Pigiput Prospect, in the central part of its 100% owned mining lease ML136 (Figure 1). The Phase II program was completed at end January 2010 and Phase III will continue through the March ’10 Quarter.
The Pigiput Deposit is currently the subject of a Sulphide Development pre-feasibility study (as outlined in ALD Press Release dated 17th June 2009). ML136, the mining lease on Simberi Island, is owned 100% by Allied Gold Limited. The new mineral resource estimate, along with the results of the Phase III drilling, is to be used to determine mining reserves to be included in the study.
2 | A L D
In this new estimate, Measured and Indicated resources in sulphides for the two deposits now total 33.8Mt @ 1.49 g/t Au for 1.62 Moz gold at a 0.5g/t Au block assay cut-off.
Table 1 Pigiput and Pigibo Minerals Resources - February 2010
| Measured | Indicated | Total MEAS + IND | Inferred | |||||||||||||||||||||||||||||||||||||||||||||
Deposit / Prospect | Mt | g/t Au | koz | Mt | g/t Au | koz | Mt | g/t Au | koz | Mt | g/t Au | koz | ||||||||||||||||||||||||||||||||||||
| Pigiput | ||||||||||||||||||||||||||||||||||||||||||||||||
| oxide | 3.4 | 0.96 | 106 | 5.0 | 0.97 | 154 | 8.4 | 0.96 | 260 | 1.6 | 0.79 | 40 | ||||||||||||||||||||||||||||||||||||
| transitional | 1.9 | 0.90 | 54 | 1.9 | 0.90 | 54 | 0.6 | 0.85 | 17 | |||||||||||||||||||||||||||||||||||||||
| sulphide | 30.7 | 1.52 | 1501 | 30.7 | 1.52 | 1501 | 27.3 | 0.98 | 861 | |||||||||||||||||||||||||||||||||||||||
| PIG-Total | 3.4 | 0.96 | 106 | 37.5 | 1.42 | 1709 | 41.0 | 1.38 | 1815 | 29.5 | 0.97 | 920 | ||||||||||||||||||||||||||||||||||||
| Pigibo | ||||||||||||||||||||||||||||||||||||||||||||||||
| oxide | 2.6 | 1.14 | 97 | 2.6 | 1.14 | 97 | 1.6 | 1.03 | 53 | |||||||||||||||||||||||||||||||||||||||
| transitional | 1.4 | 1.19 | 52 | 1.4 | 1.19 | 52 | 0.3 | 1.08 | 11 | |||||||||||||||||||||||||||||||||||||||
| sulphide | 3.1 | 1.20 | 120 | 3.1 | 1.20 | 120 | 7.1 | 1.12 | 256 | |||||||||||||||||||||||||||||||||||||||
| PBO-Total | 7.1 | 1.18 | 269 | 7.1 | 1.18 | 269 | 9.0 | 1.10 | 320 | |||||||||||||||||||||||||||||||||||||||
| TOTAL | 3.4 | 0.96 | 106 | 44.6 | 1.38 | 1,978 | 48.1 | 1.35 | 2,084 | 38.5 | 1.00 | 1,239 | ||||||||||||||||||||||||||||||||||||
Note: Total pre-mine Mineral Resources. Table shows rounded estimates. This rounding may cause some apparent computational discrepancies.
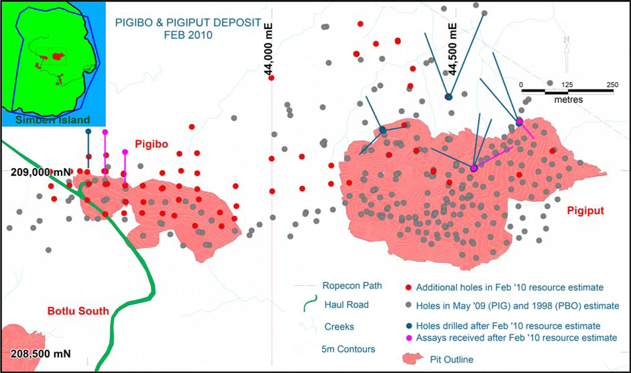
Figure 1 Pigibo - Pigiput Prospects - Collar locations of holes drilled pre-May ‘09, additional holes included in new Feb ’10 resource estimate and holes yet to be included (see legend for explanation of colour codes)
3 | A L D
PIGIPUT RESOURCE ESTIMATE
Using additional geological and assay information gained from the intensive 2009 drilling campaign, a new resource estimate was undertaken by consultants, Golder Associates. At Pigiput, estimated Measured and Indicated resources now total 41.0Mt @ 1.38 g/t gold for 1.82 million ounces, with a further 29.5Mt @ 0.97 g/t (0.92 Moz) classified as Inferred. Inferred silver resources at Pigiput total 70.4 Mt @ 4.09 g/t silver for 9.3 million ounces. The bulk of these Measured and Indicated resources, 30.7 Mt @ 1.52g/t for 1.50 Moz, are in sulphides. Previously, estimated Measured and Indicated resources totalled 17.7 Mt @ 1.36 g/t for 0.77 Moz, with a further 36.0 Mt @ 1.24 g/t gold for 1.43 Moz gold classified as Inferred, (ALD Media Release 20th May 2009).
Table 2 Pigiput Mineral Resources - Current (this release, Feb ‘10) compared to Previous (May ‘09)
| PREVIOUS | Measured | Indicated | Total MEAS + IND | Inferred | ||||||||||||||||||||||||||||||||||||||||||||
| MAY '09 Estimate | Mt | g/t Au | koz | Mt | g/t Au | koz | Mt | g/t Au | koz | Mt | g/t Au | koz | ||||||||||||||||||||||||||||||||||||
| oxide | 4.1 | 0.97 | 128 | 3.3 | 0.92 | 98 | 7.4 | 0.95 | 226 | 0.9 | 0.94 | 27 | ||||||||||||||||||||||||||||||||||||
| transition | 0.3 | 1.13 | 11 | 0.3 | 1.14 | 11 | 1.4 | 0.83 | 37 | |||||||||||||||||||||||||||||||||||||||
| sulphide | 10.0 | 1.67 | 537 | 10.0 | 1.67 | 537 | 33.7 | 1.26 | 1,365 | |||||||||||||||||||||||||||||||||||||||
| Total | 4.1 | 0.97 | 128 | 13.6 | 1.48 | 645 | 17.7 | 1.36 | 773 | 36.0 | 1.24 | 1,430 | ||||||||||||||||||||||||||||||||||||
CURRENT FEB '10 Estimate | Measured | Indicated | Total MEAS + IND | Inferred | ||||||||||||||||||||||||||||||||||||||||||||
| Mt | g/t Au | koz | Mt | g/t Au | koz | Mt | g/t Au | koz | Mt | g/t Au | koz | |||||||||||||||||||||||||||||||||||||
| oxide | 3.4 | 0.96 | 106 | 5.0 | 0.97 | 154 | 8.4 | 0.96 | 260 | 1.6 | 0.79 | 40 | ||||||||||||||||||||||||||||||||||||
| transition | 1.9 | 0.90 | 54 | 1.9 | 0.90 | 54 | 0.6 | 0.85 | 17 | |||||||||||||||||||||||||||||||||||||||
| sulphide | 30.7 | 1.52 | 1,501 | 30.7 | 1.52 | 1,501 | 27.3 | 0.98 | 861 | |||||||||||||||||||||||||||||||||||||||
| Total | 3.4 | 0.96 | 106 | 37.5 | 1.42 | 1,709 | 41.0 | 1.38 | 1,815 | 29.5 | 0.97 | 920 | ||||||||||||||||||||||||||||||||||||
Note: Total pre-mine Mineral Resources. Table shows rounded estimates. This rounding may cause some apparent computational discrepancies.
Phases I and II Pigiput Sulphide Project core drilling programmes completed in 2009 were designed as sets of multiple radiating holes, drilled from 4 principal drill sites, Figure 2. The holes were designed to increase the drill hole density in areas already known to be mineralised and include drilling directions that pierce the mineralised envelopes at oblique angles to the dip and strike of the mineralised formations. The true width of a down hole intercept varies significantly, depending on the angle the hole intersects the mineralised structures.
These results from the two drilling programs have now been consolidated into an expanded drill hole database allowing an improved 3D model to be developed for the February 2010 resource estimate. The new resource estimate used 336 holes totalling 51,856 m compared to 290 holes for 37,445 m that comprised the database for the May ’09 estimate.
4 | A L D
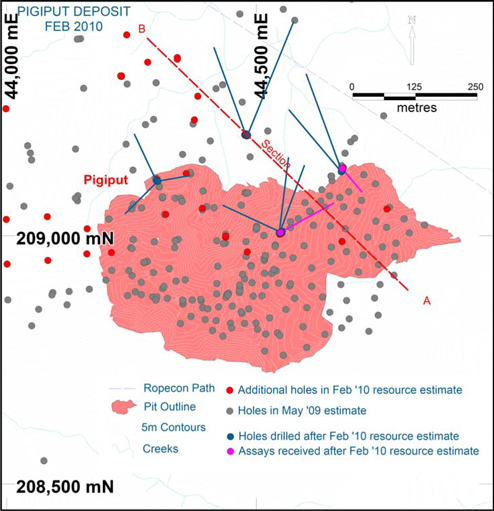
Figure 2 Pigiput Prospect - Collar locations of holes drilled pre-May ‘09 (grey), additional holes included in new Feb ’10 resource estimate and holes yet to be included (magenta = drilled – assays received; blue = drilled / assays awaited). NOTE: Multiple holes drilled in radiating patterns from several sites
Figure 3, below, a SW-looking oblique section (location shown as line A-B on Figure 2), illustrates the relationship of intercepts in drill holes to blocks in the new Feb 2010 resource estimate with grades >= 0.5g/t. Blocks are colour coded by estimated gold grade. Limits of blocks categorised as Measured, Indicated and Inferred are also shown.
5 | A L D
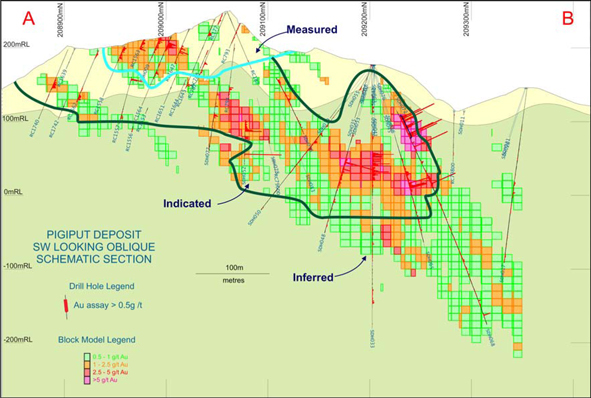
Figure 3 Pigiput Prospect – Oblique section (looking south west) illustrating gold intersections in core holes drilled in 2009 and >=0.5g/t blocks (Feb ‘10 resource) coloured by gold grade.
The February 2010 Mineral Resource for Pigiput is illustrated in Figure 4, a plan view at 0mRL, approximately 120m below surface in the central part of the drawing,. Only blocks with gold grades greater than or equal to 0.5g/t Au are sown. Assay results are awaited for holes SDH076 and SHH079 drilled in the area where the new resource is open to the north east.
6 | A L D
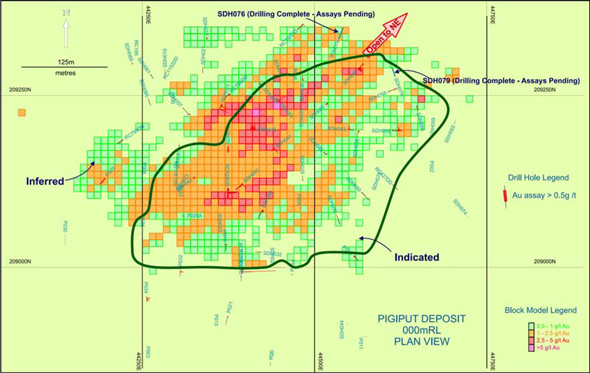
Figure 4 Pigiput Level Plan at 0mRL, illustrating holes used in Feb 2010 resource estimate and >=0.5g/t blocks (Feb ‘10 resource) coloured by gold grade.
At Pigiput, gold mineralisation is generally associated with a moderately north dipping, east-west striking structural surface that can be interpreted across the entire extent of the deposit. The surface is recognised in core holes as a discrete structurally deformed zone. Steep dipping structures, particularly those striking NNW can also be mineralised. Gold grades are generally highest at the main surface and significant mineralisation may occur in subsidiary structures above and, to a lesser extent, below it. The main surface, interpreted as a fault zone, also marks a change from clay-pyrite and silica-carbonate-pyrite alteration zones in the brecciated tuff and porphyry host rocks at and above it to chlorite dominated alteration below.
The planned Phase III drilling will test for a north eastern extension of the Pigiput deposit into SE Sorowar, an area already known to be mineralised. The drilling will seek to better define and link the two mineralised bodies. The planned Phase II drilling is illustrated below on plan, Figure 5, and in section, Figure 6.
7 | A L D
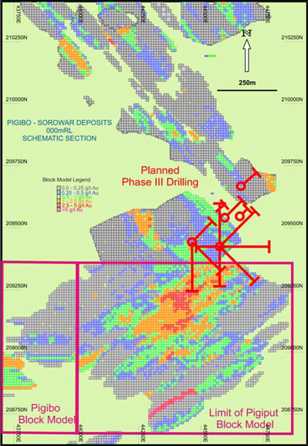
Figure 5 Pigibo - Sorowar Prospects plan, at 0mRL, showing block models colour coded by gold. Blocks outside Limit of Pigiput and Pigibo Block Model boundaries are from May ’09 Sorowar resource estimate.

Figure 6 Pigibo - Sorowar Prospects section, at 44650mE, with block models colour coded by gold. Traces of planned Phase III holes shown at NE intersection of the two models.
8 | A L D
PIGIBO RESOURCE ESTIMATE
At Pigibo, newly estimated Indicated mineral resources total 7.1Mt @ 1.18 g/t gold for 0.27 million ounces, with a further 9.0Mt @ 1.10 g/t (0.32 Moz) classified as Inferred resources. No resources are classified as Measured. Previously, all resource were classified as Inferred and totalled 3.5 Mt @ 1.26 g/t gold for 0.14 Moz gold (summarised in ALD Annual Report 08 | 09). This represents a net expansion of total resources at Pigibo of 12.7 Mt @ 1.10 g/t, equivalent to 0.45 Moz of gold. Indicated resources in sulphides at Pigibo are estimated to total 3.1 Mt @ 1.20 g/t Au, 0.12 Moz of gold.
Table 3 Pigibo Mineral Resources - Current (this release, Feb ‘10) compared to Previous (1998)
PREVIOUS | Measured | Indicated | Total MEAS + IND | Inferred | ||||||||||||||||||||||||||
| 1998 Estimate | Mt | g/t Au | koz | Mt | g/t Au | koz | Mt | g/t Au | koz | Mt | g/t Au | koz | ||||||||||||||||||
| oxide | 2.1 | 1.10 | 74 | |||||||||||||||||||||||||||
| transitional | ||||||||||||||||||||||||||||||
| sulphide | 1.4 | 1.50 | 68 | |||||||||||||||||||||||||||
| Total | 3.5 | 1.26 | 142 | |||||||||||||||||||||||||||
| CURRENT | Measured | Indicated | Total MEAS + IND | Inferred | ||||||||||||||||||||||||||||||||||||||
| FEB '10 Estimate | Mt | g/t Au | koz | Mt | g/t Au | koz | Mt | g/t Au | koz | Mt | g/t Au | koz | ||||||||||||||||||||||||||||||
| oxide | 2.6 | 1.14 | 97 | 2.6 | 1.14 | 97 | 1.6 | 1.03 | 53 | |||||||||||||||||||||||||||||||||
| transitional | 1.4 | 1.19 | 52 | 1.4 | 1.19 | 52 | 0.3 | 1.08 | 11 | |||||||||||||||||||||||||||||||||
| sulphide | 3.1 | 1.20 | 120 | 3.1 | 1.20 | 120 | 7.1 | 1.12 | 256 | |||||||||||||||||||||||||||||||||
| Total | 7.1 | 1.18 | 269 | 7.1 | 1.18 | 269 | 9.0 | 1.10 | 320 | |||||||||||||||||||||||||||||||||
| Note: Total pre-mine Mineral Resources .Table shows rounded estimates. This rounding may cause some apparent computational discrepancies. | ||||||||||||||||||||||||||||||||||||||||||
The current resource estimate used 97 holes totalling 11,208 m compared to 40 holes for 3,745 m that comprised the database for the previous (1998) estimate, Figure 7.
At Pigibo, gold mineralisation largely occurs in a crackle-brecciated porphytic andesite that intrudes a sequence of volcanic tuffs. Gold mineralization at Pigibo is associated with arsenian pyrite, slightly elevated copper values (average 170ppm) and otherwise low base metals levels, similar to the upper parts of the Pigiput Deposit.
9 | A L D
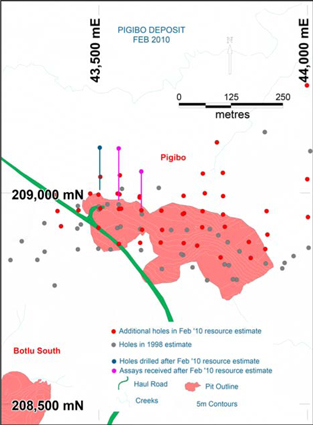
Figure 7 Pigibo Prospect - Collar locations of holes drilled pre-2009 (grey), additional holes in Feb ’10 estimate (red) and holes not included (magenta = assays received Feb ‘10; blue = drilled / assays awaited).

Figure 8 Pigibo Prospect – Section 43550mE illustrating drill hole traces, annotated with gold values >0.5g/t Au and blocks from the new Pigibo mineral resource estimate colour coded by block gold grade.
10 | A L D
PIGIPUT and PIGIBO 2010 MINERAL RESOURCE STATEMENT - Comments
Allied Gold Limited (Allied) commissioned Golder Associates Pty Ltd (Golder) to combine and update the Pigiput and Pigibo deposit resource models on Simberi Island in February 2010. The combined model is based on the geological database as at 28 January 2010. The database includes RC and Diamond drill holes and some Diamond Core ‘tails’.
Geological modelling of the deposit was undertaken by Carmel Grant (Resource Geologist) and Phil Davies (Chief Geologist) from Allied. Construction of the block model and grade estimation was undertaken by Stephen Godfrey (Associate, Senior Resource Geologist) and reviewed by Richard Gaze (Principal). For this update, the oxide, transition and sulphide resource was modelled and estimated for gold (Au), silver (Ag) and sulphur (S).
Drill sample data was composited to five metres and flagged using oxide, transition and sulphide wireframes. The composites were also flagged as being in Tuff or Andesite. The flagged composites were used to estimate their corresponding geological/weathering domains in the block model.
Grade estimations were done using Ordinary Kriging. High grade restraining was applied to restrict the influence of high grade composites.
Dry Bulk Density values were applied to the model based on depth below surface. Independent regression equations were developed for the Oxide, Transition and Sulphide zones in Pigibo and Pigiput.
The Au estimation has been classified as Measured, Indicated and Inferred based on data quality and density. The Measured Resource is confined to the oxide material at Pigiput. The Indicated Resource has a nominal data density of 50m by 50m and the Inferred Resource100m by 100m. All resource west of 43400mE is Inferred. Material south of the interpreted mineralisation footwall and outside the Inferred Resource boundary is not classified due to insufficient data density. Due to the under sampling of the historical drilling, Ag and S are classified as Inferred.
The model has been reported as Pigibo from 43210mE to 44000mE and as Pigiput from 44000mE to 44900mE. Both areas extended from 208600mN to 209350mN.
This Mineral Resource statement has been compiled in accordance with the guidelines defined in the Australasian Code for Reporting of Exploration Results, Mineral Resources and Ore Reserves (The JORC Code - 2004 Edition).
Stephen Godfrey is a member of the Australasian Institute of Mining and Metallurgy and has sufficient experience which is relevant to the style of mineralisation and type of deposit under consideration and to the activity which he is undertaking to qualify as a Competent Person as defined in the 2004 Edition of the Australasian Code for Reporting of Exploration Results, Mineral Resources and Ore Reserves (The JORC Code - 2004 Edition).
11 | A L D
Yours faithfully
ALLIED GOLD LIMITED

Mark V. Caruso
Executive Chairman
For enquiries in connection with this release please contact:
Allied Gold Limited
Office of the Executive Chairman
+61 8 9353 3638 phone
+61 8 9353 4894 fax
Corporate Office
Frank Terranova – Chief Financial Officer
+61 7 3252 5911 phone
+61 7 3252 3552 fax
Media Enquiries:
Simon Jemison
Collins St Media
simon@collinsstreetmedia.com.au
+61 3 9224 5319
12 | A L D
Board of Directors: Mark Caruso Executive Chairman & CEO Monty House Non Executive Director Tony Lowrie Non Executive Director Greg Steemson Non Executive Director Frank Terranova Executive Director & CFO Peter Torre Company Secretary ASX Code: ALD AIM Code: AGLD | Competent Persons The information in this Stock Exchange Announcement that relates to Mineral Exploration results and Mineral Resources, together with any related assessments and interpretations, have been verified by and approved for release by Mr P R Davies, MSc, BSc, M.Aus.I.M.M., a qualified geologist and full-time employee of the Company. Mr Davies has sufficient experience which is relevant to the style of mineralisation and type of deposit under consideration and to the activity which he is undertaking to qualify as a Competent Person as defined in the 2004 Edition of the “Australasian Code for Reporting of Exploration Results, Mineral Resources and Ore Reserves”. Mr Davies consents to the inclusion of the information contained in this ASX release in the form and context in which it appears. The information in this Stock Exchange Announcement that relates to Mineral Resources has been compiled by Mr S Godfrey of Golder Associates who is a Member of the Australasian Institute of Mining and Metallurgy. Mr Godfrey has had sufficient experience in Ore Resource estimation relevant to the style of mineralisation and type of deposit under consideration to qualify as a Competent Person as defined in the 2004 Edition of the “Australasian Code for Reporting of Exploration Results, Mineral Resources and Ore Reserves”. Mr Godfrey consents to the inclusion of the information contained in this ASX release in the form and context in which it appears. | ||
Principal Office 34 Douglas Street Milton, Queensland 4064 Telephone +61 7 3252 5911 Facsimile +61 7 3252 3552 Email info@alliedgold.com.au Website: www.alliedgold.com.au Postal Address PO Box 2019, Milton 4064 Registered Office Unit B9, 431 Roberts Road Subiaco, WA 6008 Share Registry | Forward-Looking Statements This press release contains forward-looking statements concerning the projects owned by Allied Gold. Statements concerning mineral reserves and resources may also be deemed to be forward-looking statements in that they involve estimates, based on certain assumptions, of the mineralisation that will be found if and when a deposit is developed and mined. Forward-looking statements are not statements of historical fact, and actual events or results may differ materially from those described in the forward-looking statements, as the result of a variety of risks, uncertainties and other factors, involved in the mining industry generally and the particular properties in which Allied has an interest, such as fluctuation in gold prices; uncertainties involved in interpreting drilling results and other tests; the uncertainty of financial projections and cost estimates; the possibility of cost overruns, accidents, strikes, delays and other problems in development projects, the uncertain availability of financing and uncertainties as to terms of any financings completed; uncertainties relating to environmental risks and government approvals, and possible political instability or changes in government policy in jurisdictions in which properties are located. Forward-looking statements are based on management’s beliefs, opinions and estimates as of the date they are made, and no obligation is assumed to update forward-looking statements if these beliefs, opinions or estimates should change or to reflect other future developments. | ||
| Computershare Investor Services | |||
Level 2, Reserve Bank Building 45 St Georges Terrace Perth, Western Australia WA 6000 | Not an offer of securities or solicitation of a proxy This communication is not a solicitation of a proxy from any security holder of Allied Gold, nor is this communication an offer to purchase or a solicitation to sell securities. Any offer will be made only through an information circular or proxy statement or similar document. Investors and security holders are strongly advised to read such document regarding the proposed business combination referred to in this communication, if and when such document is filed and becomes available, because it will contain important information. Any such document would be filed by Allied Gold with the Australian Securities and Investments Commission, the Australian Stock Exchange and with the U.S. Securities and Exchange Commission (SEC). |
13 | A L D
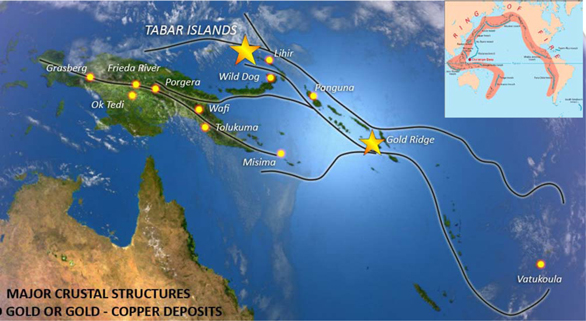
BACKGROUND
Allied Gold Limited’s gold production and exploration development portfolio is centred on the Tabar Islands of Papua New Guinea approximately 60 kilometres from Lihir Island which hosts a plus 40 million ounce gold resource and the Gold Ridge Project located on the Island of Guadalcanal in the Solomon Islands.(see diagram below).
In 2008-2009, Allied produced 72,609 ounces of gold. Studies have been completed on an expansion of the oxide plant from 2 Mtpa to 3 Mtpa to increase production to 100,000 oz pa. A study focused on the sulphide resources is looking at the optional configuration for 100,000 oz pa sulphide operation In addition the Company proposes to redevelop the Gold Ridge Project in the Solomon Islands by 2011 which will which will produce on average 120,000ozpa over the expected life of mine of 7 years. Total group production is projected to be in excess of 300,000oz by 2012.
Total group combined Measured, Indicated and Inferred resources stand at 7.8Moz. Simberi currently hosts Measured, Indicated and Inferred mineral resources of approximately 5.7 million ounces of gold. Gold Ridge hosts approximately 2.11Moz of Measured, Indicated and Inferred resources. Allied Gold currently owns 100% of Simberi and 100% of the EL on the nearby Tatau and Big Tabar Islands covering a total area of 170km² and 130km² of exploration tenure in the Solomon Islands.
14 | A L D