[Missing Graphic Reference]
ALLIED GOLD LIMITED
MANAGEMENT’S DISCUSSION AND ANALYSIS
OF FINANCIAL CONDITION AND RESULTS OF OPERATIONS
FOR THE QUARTER ENDED SEPTEMBER 30, 2010
SUMMARY – THREE MONTHS ENDED SEPTEMBER 30, 2010
OPERATIONS
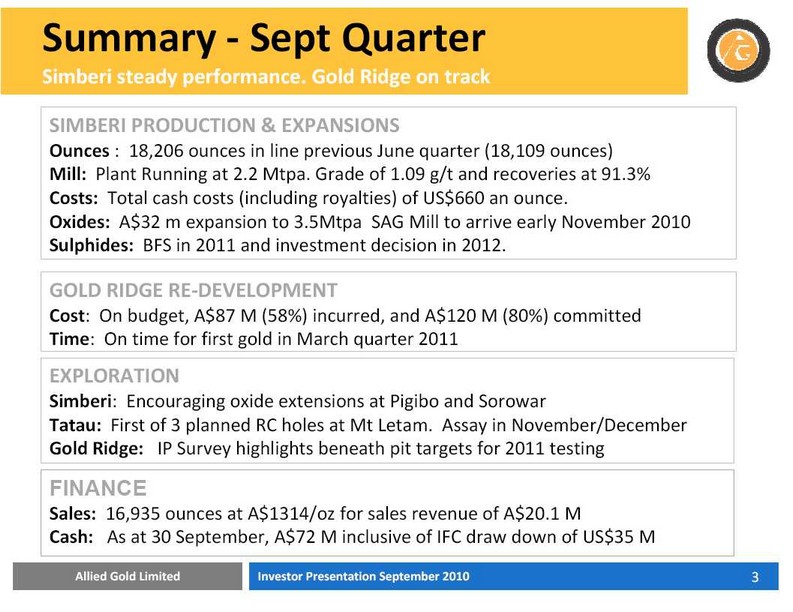
| · | Gold Production: At Simberi, PNG 18,206 ounces produced in September quarter, in line with guidance and previous June quarter (18,109 ounces) and up 29% on September 2009 quarter. |
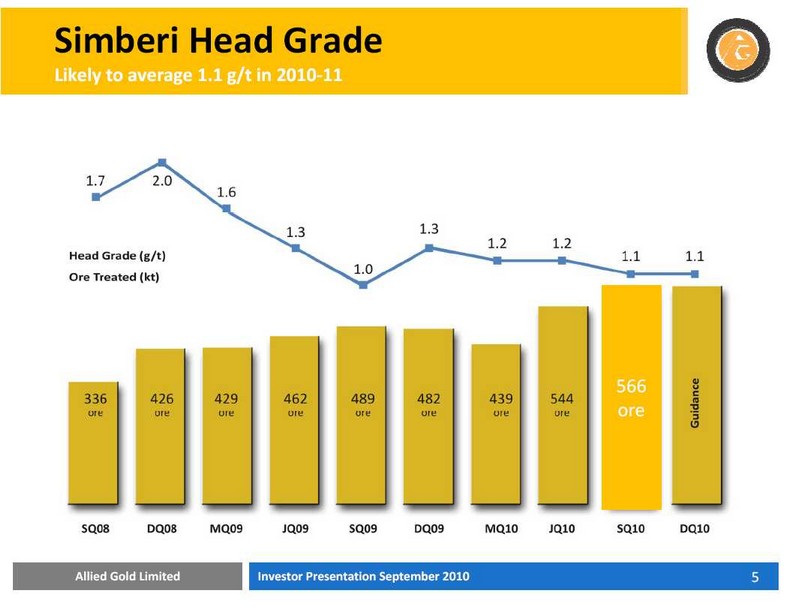
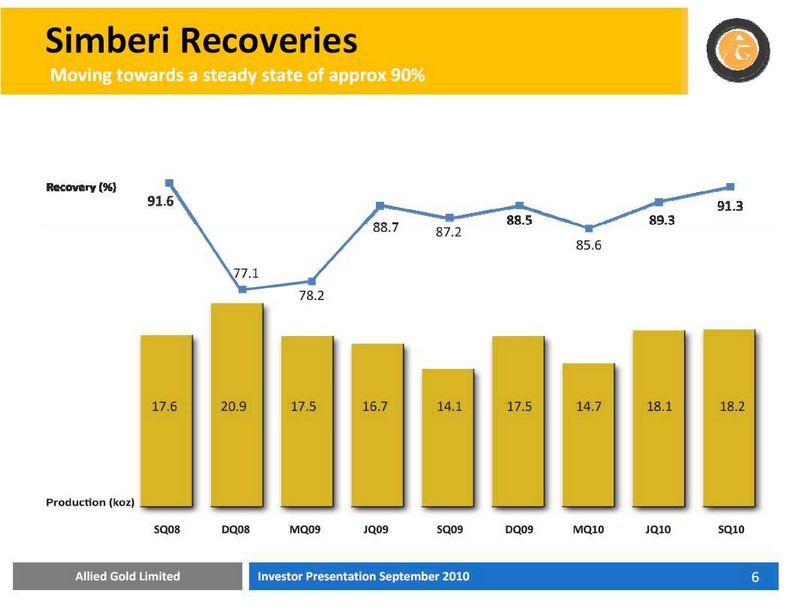
| · | Mill Performance: 570,473 tonnes processed for an annualized rate of 2.2 Million tonnes. Grade of 1.09 g/t and recoveries at 91.3 percent. |
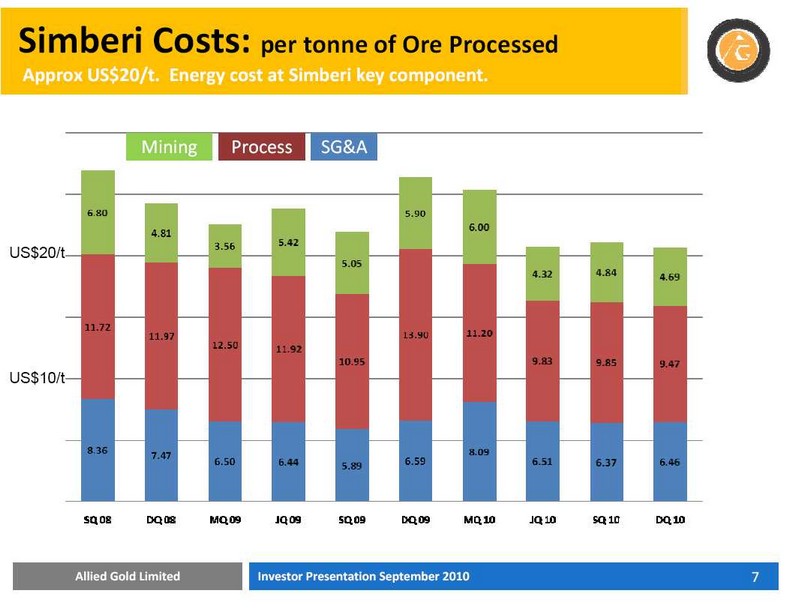
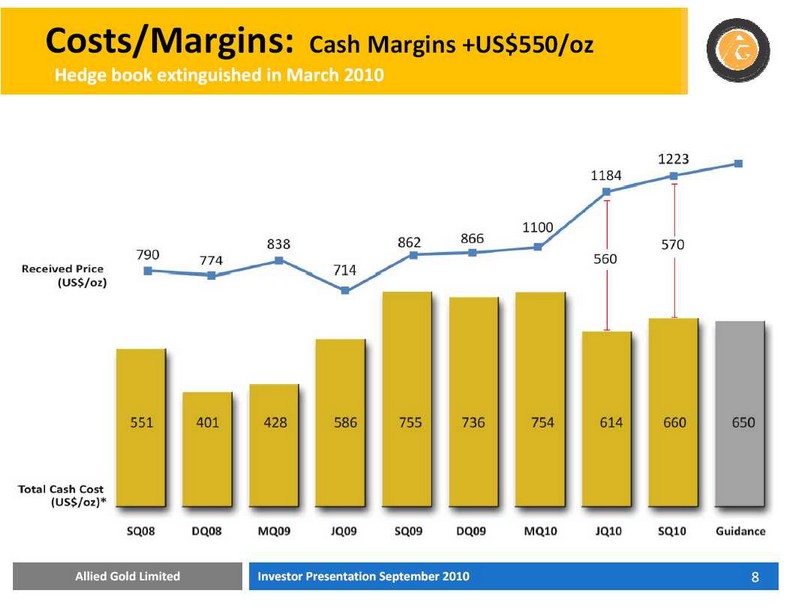
| · | Costs: Total cash costs (including royalties) of US$660 an ounce. Significant appreciation of $A in past six months has increased costs in US$ terms. |
PROJECTS
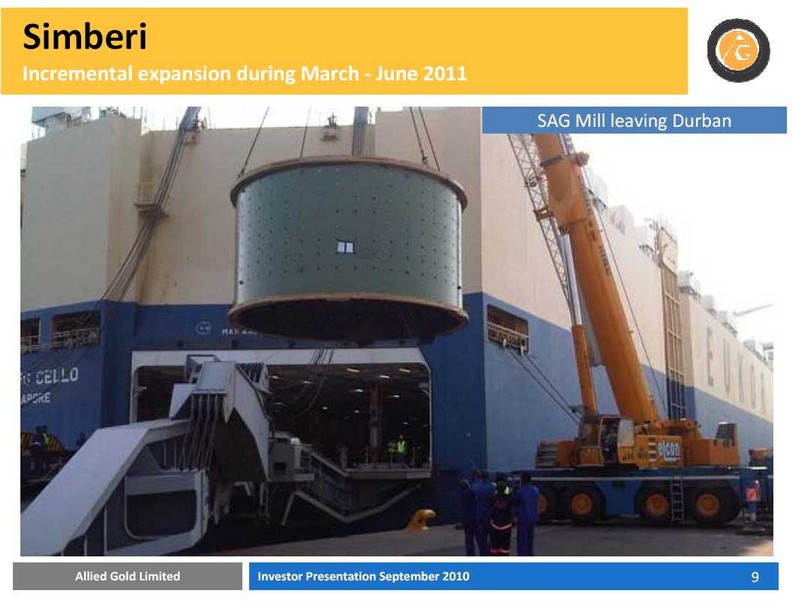
| · | Simberi - Oxide Expansion: Board approved $32 million expansion of oxide plant from 2.0Mtpa to 3.5Mtpa to lift production to 100,000 ozpa during 2011. Key items including 2.5MW SAG Mill to arrive on site this December quarter. |
| · | Simberi - Sulphide PFS: A pre-feasibility study on development of sulphide resources highlights potential for an additional 100,000 ounces in mid-decade. A bankable feasibility study to be completed in late 2011 and investment decision in 2012. |
| · | Gold Ridge - Mine redevelopment: On time and on budget for first gold in March quarter 2011. Of the A$150 million budget, A$87 million (58%) incurred, and A$120 million (80%) committed. Critical path items such as power and cabling expected in December. Village relocation continuing. |
EXLORATION
| · | Simberi - Inventory: Gold reserves (proven and probable) at Simberi increased to 2.15 million ounces of contained gold, a 155% increase on September 2009. |
| · | Simberi - Resource Drilling: Drilling of 36 core holes for 5,501 metres undertaken during quarter. |
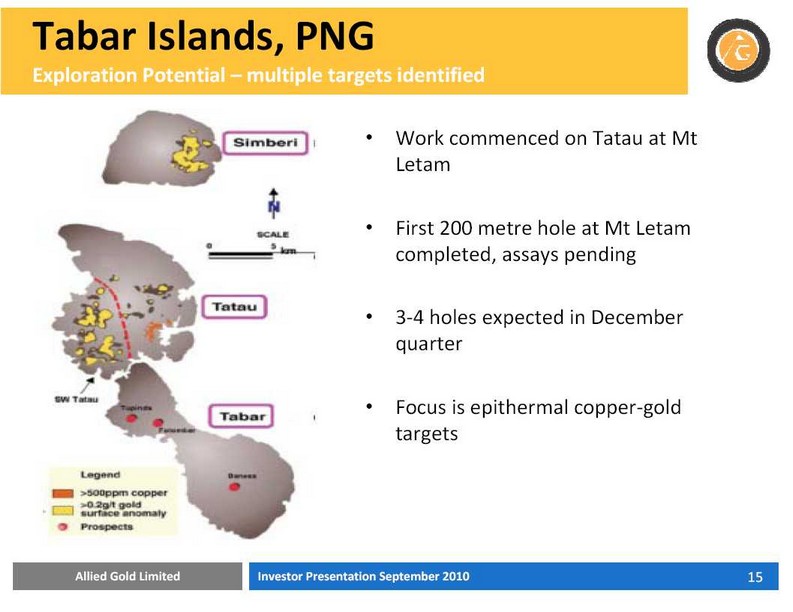
| · | Tatau: Drilling commenced at Mt Letam on Tatau with first 200 metre core. Assays expected in November. During the December quarter further two core holes to be undertaken at Mt Letam before moving to Mt Tiro prospect. |
| · | Gold Ridge: Drilling on Namachamata pit with 2,034m of RC drilling undertaken on a 50m line spacing as part of grade and metallurgical confirmation sampling. Hole GRC007 returned 20 metres @ 5.61 g/t Au, from surface occurs in a previously untested area on the south east side of pit. An IP survey has identified geophysical anomalies below the Valehaichichi and Namachamata pits for testing in 2011. |
2
CORPORATE
| · | Gold Sales: 16,935 ounces at an average realised price of A$1,314/oz for sales revenue of A$20.1 million. |
| · | Cash Flow: A$5.4 million from operations, and A$55 million invested (predominantly Gold Ridge) |
| · | Profit: Unaudited A$1.1 million operating profit after tax for the September quarter. |
| · | Loans: Draw down in September of US$35 million IFC loan. |
| · | Cash/Liquids: As at 30 September A$72 million, inclusive of IFC drawn down. |
3
MANAGEMENT’S DISCUSSION AND ANALYSIS OF
FINANCIAL CONDITION AND RESULTS OF OPERATIONS
This management’s discussion and analysis (“MD&A”) of Allied Gold Limited (“Allied Gold” or the “Company”) is dated October 19, 2010 and provides an analysis of the Company’s performance and financial condition for the three months ended September 30, 2010 (the “Quarter”). This MD&A should be read in conjunction with the Company’s unaudited interim consolidated financial statements for the three months ended September 30, 2010 and the notes thereto. These documents, along with others published by the Company are available under the Company’s profile on the Canadian System for Electronic Document Analysis and Retrieval (“SEDAR”) at www. sedar.com
The consolidated financial statements of Allied Gold and the financial information contained in this MD&A were prepared in accordance with Australian equivalents to International Financial Reporting Standards as defined by the Australian Accounting Standards Board (“Australian IFRS”) and are fully compliant with International Financial Reporting Standards as issued by the International Accounting Standards Board. All amounts in this MD&A are expressed in Australian dollars unless otherwise identified, and references to “$” are to Australian dollars.
This MD&A may contain forward-looking statements that are based on the Company’s expectations, estimates and projections regarding its business and the economic environment in which it operates. These statements speak only as of the date on which they are made, are not guarantees of future performance and involve risks and uncertainties that are difficult to control or predict. Examples of some of the specific risks associated with the operations of the Company are set out in the company’s most recent Annual Information Form (“AIF”) under the section entitled “Risk Factors”. Actual outcomes and results may differ materially from those expressed in these forward-looking statements and readers should not place undue reliance on such statements. Readers are also referred to the “Cautionary Note Regarding Forward-Looking Statements” in this MD&A.
Overview
Allied Gold is a gold production company whose shares are listed on the Toronto Stock Exchange (“TSX”) under the symbol “ALG”, on the Australian Securities Exchange under the symbol “ALD” and on AIM, a market operated by the London Stock Exchange plc under the symbol “AGLD”. Allied Gold’s major assets are its 100% owned Simberi gold project (the “Simberi Project”), which is located on Simberi Island, the northernmost island of the Tabar Islands Group, in the New Ireland Province of eastern PNG and its 100% interest in Australian Solomons Gold Limited (“ASG”) which owns the Gold Ridge Gold Project (“Gold Ridge”) which is located on Guadalcanal Island in the Solomon Islands.
The Simberi Project
The Simberi Project is located in the Pacific Rim of Fire, one of the world’s proven and most prospective gold jurisdictions. The Simberi Project is comprised of: (i) an open-pit mining operation with an associated gold processing plant, located within PNG mining lease 136 (“ML 136”), which comprises 2,560 ha on the eastern side of Simberi Island; and (ii) a larger 69 sub-block/233 km2 area under PNG exploration license 609 (“EL 609”) covering the remainder of Simberi Island and most of the adjacent Tatau and Big Tabar Islands to the south. The Simberi Project is based on seven separate deposits on the eastern portion of Simberi Island (Sorowar, Samat North, Samat South, Samat East, Pigiput, Pigibo and Botlu South). Sorowar in the north is by far the largest resource. Samat North, South and East lie to the south and while relatively small are also relatively high grade. Pigiput, Pigibo and Botlu South lie between the Sorowar and Samat areas and are of intermediate tonnage but at a grade similar to Sorowar. All prospects lie within 2-3 km of each other. The project area also includes other less well defined prospects and anomalies.
The Simberi Project is the subject of a technical report (the “Technical Report”) entitled “Simberi Gold Project, Simberi Island, Papua New Guinea” dated September 25, 2009 prepared for Allied Gold by Stephen Godfrey and John Battista of Golder Associates Pty Ltd. and Phil Hearse of Battery Limits Pty Ltd., all of whom are independent qualified persons as defined in National Instrument 43-101 – Standards of Disclosure for Mineral Projects (“NI 43-101”). The Technical Report has been filed with certain Canadian securities regulatory authorities pursuant to NI 43-101 and is available for review under Allied Gold’s SEDAR profile at www. sedar.com
4
The Gold Ridge Project
In November 2009, the Company acquired control of Australian Solomons Gold Limited (“ASG”).
ASG is an Australian-based mineral resource exploration company that was incorporated under the Australian Corporations Act on September 10, 2004. ASG converted its Australian legal status to a “public” company on April 4, 2006, which was confirmed by the ASIC on September 6, 2006. The general development of the business of ASG has focused entirely on the Gold Ridge project on the island of Guadalcanal in the Solomon Islands (the “Gold Ridge Project”). ASG holds the Gold Ridge Project through certain wholly-owned Australian and Solomon Islands subsidiaries.
ASG acquired the Gold Ridge Project in May 2005. The Gold Ridge Project consists of a mining lease that covers an area of 30 km2 and a prospecting license in the area surrounding the mining lease that covers an area of 130 km2. The mining lease is administered under a mining agreement between ASG and the Solomon Islands Government.
Prior to ASG acquiring the Gold Ridge Project, previous owners of the Gold Ridge Project had constructed a 2Mtpa open cut mine starting in 1997 and mined the Valehaichichi deposit commencing in August 1998. The Gold Ridge Project was eventually shut down in September 2000 by a subsequent owner as a result of escalating civil unrest in the Solomon Islands. The Regional Assistance Mission to Solomon Islands (“RAMSI’) was created in 2003 in response to a request for international aid by the Governor-General of the Solomon Islands. RAMSI is a partnership between the people and Government of Solomon Islands and fifteen contributing countries of the Pacific region. RAMSI is helping the Solomon Islands to lay the foundations for long-term stability, security and prosperity – through support for improved law, justice and security; for more effective, accountable and democratic government; for stronger, broad-based economic growth; and for enhanced service delivery. The Australian government continues to support RAMSI, contributing in excess of $200 million per annum for various development and support initiatives.
During the 22 months that the Gold Ridge mine was actively operating, the total gold production amounted to approximately 210,000 ounces. The Gold Ridge Project has considerable infrastructure remaining from the previous operations, although major refurbishment is required to most of the plant and equipment at site. Mine site infrastructure includes workshops and warehouse, water supply, power generators and building, road access, tailings storage facility, and an on-site camp for 150 people which have recently been refurbished.
The Gold Ridge Project is the subject of the “Technical Report”) entitled “Estimation of Recoverable Gold Resources Gold Ridge Project” dated November 27, 2008 prepared for Australian Solomons Gold Limited by W J A Yeo, MAusIMM PhD of Hellman & Schofield Pty Ltd who is an independent qualified person as defined in National Instrument 43-101 – Standards of Disclosure for Mineral Projects (“NI 43-101”). The Technical Report has been filed with certain Canadian securities regulatory authorities pursuant to NI 43-101 and is available for review under Australian Solomons Gold’s SEDAR profile at www. sedar.com
5
PROJECTS – SIMBERI
Simberi Plant at 2.2 Mtpa
Most of the debottlenecking activities associated with increasing throughput to in excess of 2 Mtpa and maintaining consistent performance at Simberi have been undertaken. Annualized throughput for the quarter was 2.3Mtpa and process recovery exceeded 91 per cent.
During the quarter plant refurbishment has been ongoing including:-
| • | Restoration of the inside of existing leach and CIL tanks. |
| • | Upgrade motor, gearboxes and wet ends for tank 1 to 3. |
| • | Replacement of steel mesh floor grating, stairs and handrail. |
| • | Painting of existing plant steel. |
| • | Design modifications of the Sorowar dump pocket to improve availability in progress. |
Oxide Expansion to 3.5 Mtpa
A review of the oxide plant size options including up to 5mtpa were considered. The company determined a previously planned and incremental expansion to 3.5 Mtpa plant at a total capital cost of approximately A$32M was most appropriate to lift production at Simberi to 100,000 oz pa by late 2011.
Perth engineering company GR Engineering Services has been engaged to undertake design and construction management with work completed in this quarter consisting of;
| · | Detailed engineering for expansion including crushing and grinding, leach and absorption, thickening and tailings disposal 75% completed. |
| · | Construction Management mobilised to site. |
| · | 2.5MW SAG Mill procured and being shipped to site to arrive end early November 2010. |
| · | Geotechnical foundation drilling for SAG mill and new reclaimer in progress. |
| · | Civil and earthworks commenced for new CIL tanks and lime slaking plant. |
| · | Existing services, HV power, water and communications rerouted. |
| · | Contract for supply of plate and structural steel for tankage awarded, and erection of CIL tanks, lime slaker tank and additional diesel storage tank will commence December quarter. |
| · | Leach tank motors, gearboxes and wet ends purchased. |
| · | Tenders for thickener received, purchase order for supply of materials to be placed December quarter. |
Sulphide Pre-feasibility Study (PFS)
The Simberi Sulphide PFS technical work was finalized during the quarter. Roaster off-gas testwork that showed the concentrate tails other than the tails generated by the porphyry ore were amenable to capturing the SO2. The porphyry tail is very low calcium content and this could be corrected with the addition of coronus into ore feed before grinding.
The study was based on the treatment of 1.5Mtpa refractory sulphide ore via a roasted concentrate treatment route. Overall process recovery is 82%. Current ore reserves are 15.1t at 2.31g/t to recover 940k ounces of gold over with an approximate 10 year mine life.
Management is in the process of assessing the final PFS results. The final scale of the processing circuit is yet to be determined with studies to date suggesting a processing capacity in the range of 1.5Mtpa – 2.5Mtpa is likely to be progressed in a full Bankable Feasibility Study.
6
Further details on the PFS results are likely to be released during the December 2010 quarter.
Development of the Simberi sulphides are intrinsically related to the current oxide mine operations, in that access to the sulphide ore will require removal of overlying oxide ores and associated waste. The table below summarises overlying oxide and waste material quantities by deposit; the underlying sulphide ore and associated waste are also shown.
| Simberi Ore and Waste |
| OXIDE | SULPHIDE | |||
| Deposit | Waste Mt | Ore Mt | Waste Mt | Ore Mt |
| Pigiput | 12.1 | 13.7 | 28.3 | 13.3 |
| Pigibo | 6.7 | 5.7 | 0.7 | 0.4 |
| Samat | 0 | 0.5 | 1.0 | 1.0 |
| TOTAL | 18.8 | 19.9 | 30.0 | 14.7 |
7
PROJECTS - - GOLD RIDGE
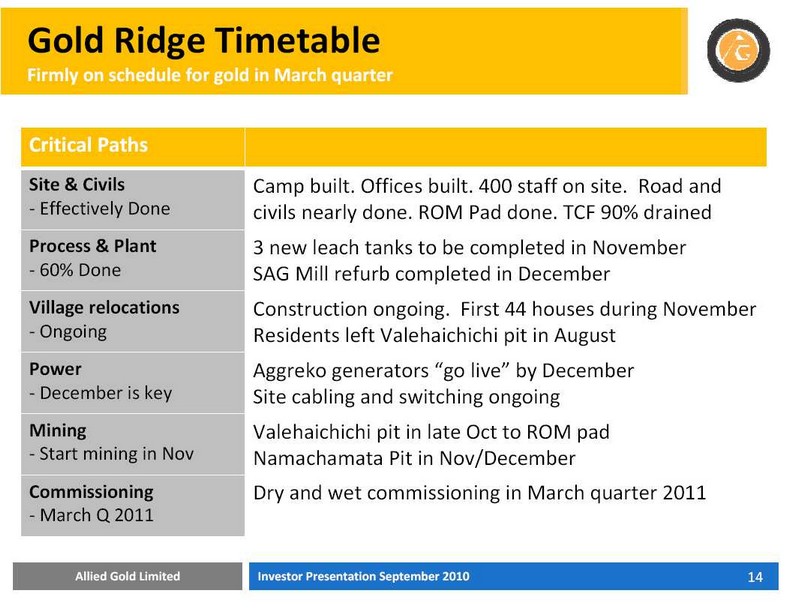
Redevelopment of the Gold Ridge Mine located in the Solomon Islands is progressing on schedule for completion and commencement of gold production in March quarter 2011.
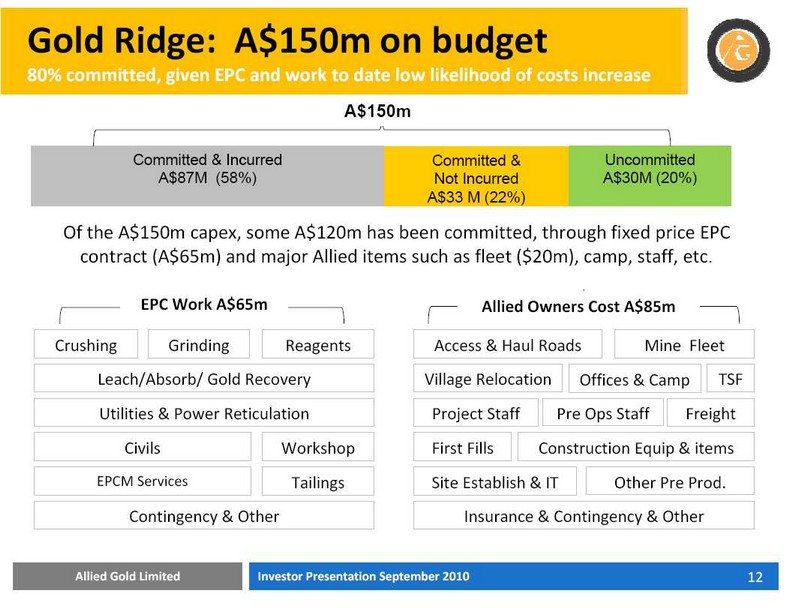
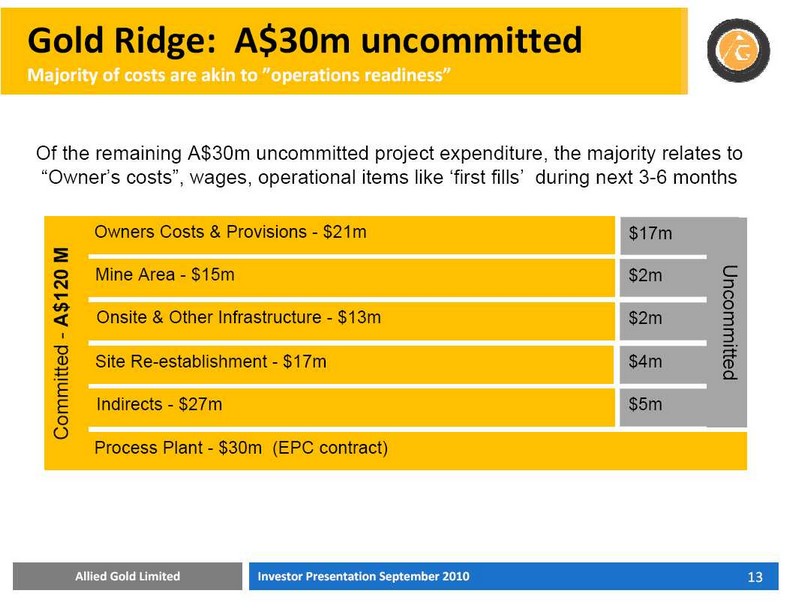
As at end of September approximately 80% of the project’s A$150m had been committed through either a fixed price EPC contract or through Allied-managed activities, providing the company with confidence the project is on time and on budget.
The redevelopment of the process plant comprises refurbishment of the existing plant and expansion of the plant from 2.0Mtpa to 2.5Mtpa throughput.
The expansion comprises additional leach tanks, tailings thickener and tailings detoxification circuit. Status of the work to date includes:
| o | Refurbishment of the SAG mill is due to be completed in early November and refurbishment of the grinding crusher is due for completion in December. |
| o | Classification and leaching, existing agitator gearboxes and motors renewed/refurbished. Three additional leach tanks to be completed in early November, cyclone tower and new cyclones to be completed December. |
| o | Gold recovery new equipment delivered to site, to include a new leach reactor in place of the old gravity tables. |
| o | Tailings disposal thickener civils completed, tailings detoxification circuit to be completed December. |
| o | Dewatering tailings dam on schedule for completion by November and the tailings pipeline choke station and tailings distribution piping in progress for completion before end of year. |
| o | Power supply BOO (buy own operate) contract awarded to Aggreko, manual power supply on schedule for early December. Restringing of power line completed. The SI Mines Department are looking at hydro power generation options from the Tina River, one catchment west of Gold Ridge. Staff from GRML and Allied Gold attended a workshop on this hydro study to investigate the possibility of Gold Ridge obtaining cheaper power within the current mine life. |
| o | Process raw water supply with refurbishment of the river pump station, plant process water dam restored and tailings return water pumping station refurbishment well progressed for completion before end of the year. |
| o | Construction earthworks associated with process plant. HV workshop and ROM pad completed, Mine haul road to Valehaichichi completed and haul road access to the Namachamata pit to be completed October 2010, first ore to ROM ahead of schedule with delivery in early October. |
| o | Heavy equipment local operators training progressing well ready to undertake mining. |
| o | Contracts for drill and blasting negotiated, mobilisation of equipment and personnel to be completed October. |
| o | Phase 2 of mining fleet requirements finalised to purchase and delivery of equipment (55t rigid frame haul trucks and additional 85t excavator) by November 2010. |
| o | Grade control drilling at Namachamata pit undertaken by company owned drill equipment completed. Short term mine planning and grade control protocols well progressed. |
8
| o | Sterilization drilling around the Valehaichichi deposit in progress as well as drilling IP geophysical targets. Ground IP surveys in the mine area continuing with numerous chargeable zones being indentified. |
| o | Operations accommodation village upsizing (200 beds) and messing facilities upgrade complete. |
| o | Local community resettlement housing on schedule to complete first 87 houses (of a total of 287 houses) by 1st week of December. |
| o | Relocation of 137 people from the Valehaichichi pit area completed and further development of the relocation plan completed. |
| o | Pre-mine operations well progressed including; warehousing, spares, first fills and reagents, site administration and plant operations. |
MINERAL RESERVES – SIMBERI
A mineral reserve update was completed in September 2010 that resulted in an additional 1.31Mozs of gold or an increase of 155% over reserves as at September last year. A breakdown of reserves by ore type is shown in the table below.
Simberi Proven and Probable Reserves
| Ore type | Mt | Au g/t | Cont. koz |
| Oxide | 26.3 | 1.03 | 871 |
| Transitional | 4.5 | 1.11 | 161 |
| Sulphide (fresh) | 15.1 | 2.31 | 1,121 |
| Total | 45.9 | 1.46 | 2,153 |
EXPLORATION
Simberi, PNG
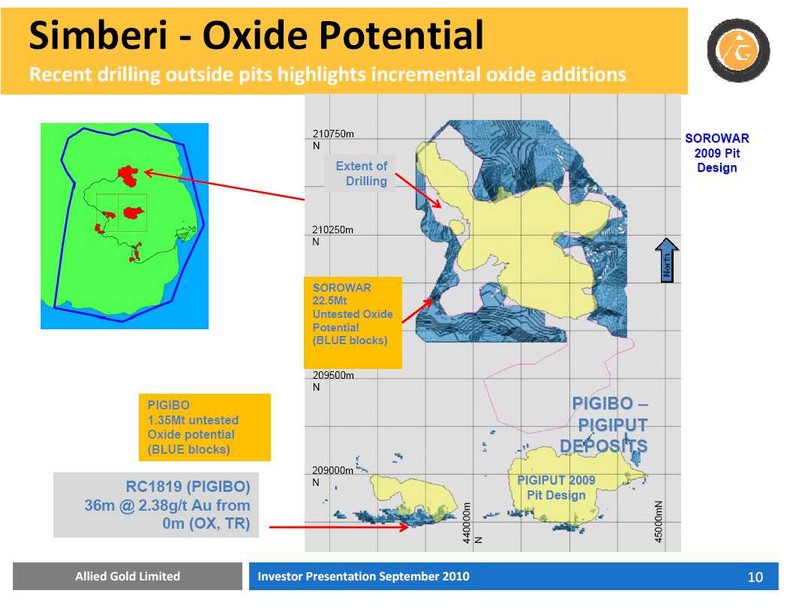
On Simberi 36 core holes for 5,501m were completed. Work was focused on testing new 3D models of sulphide resources at Samat and Botlu and for extension for mineralisation in sulphide below the Sorowar pit. Work was also undertaken on the margins of the Pigibo shell to test for oxide additions. Assays received for 8,217 samples (including QC) with further 3,105 samples awaiting analysis.
The highlights include:
| o | At Pigibo, RC hole RC1819 (36m @ 2.38g/t from 0m in OX, TR) highlights potential for additional oxide resource potential and along strike drilling is planned. |
| o | At Botlu, two notable downhole intercepts at SDH131: 20m @ 2.10 g/t Au from 92m in SU and SDH138, returning 31m @ 2.46g/t from 85m in SU. SDH138 should add some sulphide resources and has opened up possibilities on the N side of Botlu. More N to S drilling at Botlu will be planned before a sulphide resource estimate is commissioned. |
| o | At SE Sorowar, best intercept was 50m @ 1.74 g/t Au from 163m in SU (SDH130 SE Sorowar). |
| o | At Sorowar, core drilling is in progress, with 8 of the 18 planned holes completed The drilling is targeting sulphide mineralisation below the Sorowar deposit. |
9
A complete listing of weighted average grades of mineralized intercepts in holes recently drilled at Simberi, defined by a range of sample gold grade cut-offs, is presented in Table 1 below. The method of sampling and calculation of the average grades is described in the table’s accompanying notes.
Table 1 Simberi Deposits - >0.5 g/t Mineralised Intercepts - Reported September 2010
| Prospect | Hole | TIG North | TIG East | RL (m) | Dip/Azi | From (m) | To (m) | Intercept (m) | Au Grade (g/t) | Oxidation |
| Pigiput | SDH081 | 209005.9 | 44551.4 | 260.7 | -55 / 295 | 0.0 | 170.0 | 0.53 | EXLAB | |
| loss 0.5m | 41.0 | 99.0 | 58.0 | 0.94 | OX | |||||
| 164.0 | 168.0 | 4.0 | 2.76 | SU | ||||||
| incl | 165.0 | 166.0 | 1.0 | 5.68 | SU | |||||
| Total core loss = 10.8m | ||||||||||
| Pigiput | SDH117 | 209280.9 | 44316.0 | 119.1 | -55 / 160 | 0.0 | 237.9 | 0.69 | ALS | |
| loss 0.9m | 88.0 | 99.0 | 11.0 | 2.23 | SU | |||||
| loss 0.6m | incl | 92.0 | 97.0 | 5.0 | 3.45 | SU | ||||
| loss 2.2m | 131.0 | 174.0 | 43.0 | 1.23 | SU | |||||
| loss 0.1m | incl | 144.0 | 146.0 | 2.0 | 2.56 | SU | ||||
| and | 166.0 | 169.0 | 3.0 | 5.84 | SU | |||||
| loss 3.0m | 207.0 | 233.0 | 26.0 | 1.84 | SU | |||||
| loss 0.1m | incl | 208.0 | 209.0 | 1.0 | 11.3 | SU | ||||
| loss 0.4m | and | 211.0 | 214.0 | 3.0 | 5.87 | SU | ||||
| loss 0.2m | incl | 213.0 | 214.0 | 1.0 | 11.0 | SU | ||||
| Total core loss = 24.4 m | ||||||||||
| Pigiput | RC1818 | 209049.8 | 44220.8 | 200.3 | -90 / 360 | 0.0 | 181.0 | 0.65 | EXLAB | |
| 37.0 | 51.0 | 14.0 | 3.59 | OX, TR, SU | ||||||
| incl | 43.0 | 50.0 | 7.0 | 6.49 | OX, TR, SU | |||||
| incl | 44.0 | 48.0 | 4.0 | 9.53 | OX | |||||
| incl | 46.0 | 48.0 | 2.0 | 13.5 | OX | |||||
| 99.0 | 130.0 | 31.0 | 1.07 | SU | ||||||
| 136.0 | 154.0 | 18.0 | 0.78 | SU | ||||||
| Avg Estimated Recovery 80.5% | ||||||||||
| Pigibo | RC1819 | 208760.4 | 43700.9 | 246.5 | -60 / 180 | 0.0 | 119.0 | 0.75 | EXLAB | |
| 0.0 | 36.0 | 36.0 | 2.38 | OX, TR | ||||||
| incl | 2.0 | 6.0 | 4.0 | 5.63 | OX | |||||
| and | 17.0 | 32.0 | 15.0 | 2.82 | OX | |||||
| incl | 20.0 | 26.0 | 6.0 | 4.53 | OX | |||||
| incl | 23.0 | 25.0 | 2.0 | 6.95 | OX | |||||
| Avg Estimated Recovery 107.8% | ||||||||||
| SE Sorowar | SDH116 | 209429.4 | 44574.3 | 119.9 | -55 / 180 | 60.0 | 291.5 | 0.39 | EXLAB | |
| 0.0 | 60.0 | unsampled | ||||||||
| loss 0.8m | 97.0 | 118.0 | 21.0 | 1.65 | SU | |||||
| incl | 107.0 | 109.0 | 2.0 | 5.50 | SU | |||||
| Total core loss = 0.8 m | ||||||||||
| SE Sorowar | SDH118 | 209432.1 | 44572.5 | 119.2 | -55 / 135 | 0.0 | 350.0 | 0.21 | ALS | |
| 106.0 | 125.0 | 19.0 | 1.26 | SU | ||||||
| incl | 114.0 | 119.0 | 5.0 | 2.77 | SU | |||||
| incl | 117.0 | 118.0 | 1.0 | 5.86 | SU | |||||
| Total core loss =0.85m | ||||||||||
| SE Sorowar | SDH119 | 209431.4 | 44570.6 | 119.2 | -55 / 090 | 0.0 | 251.0 | 0.12 | ALS | |
| No significant intercepts | ||||||||||
| Total core loss =1.75m | ||||||||||
| SE Sorowar | SDH121 | 209448.0 | 44461.9 | 124.3 | -60 / 135 | 0.0 | 250.6 | 0.78 | ALS | |
| loss 0.9m | 77.0 | 91.0 | 14.0 | 7.53 | SU | |||||
| incl | 78.0 | 79.0 | 1.0 | 95.5 | SU | |||||
| loss 1.3m | 139.0 | 158.0 | 19.0 | 1.24 | SU | |||||
| loss 0.7m | 213.0 | 225.0 | 12.0 | 1.10 | SU | |||||
| Total core loss = 15.9 m | ||||||||||
10
Table 1 (con’t) Simberi Deposits - >0.5 g/t Mineralised Intercepts - Reported September 2010
| SE Sorowar | SDH122 | 209430.1 | 44571.0 | 119.2 | -60 / 063 | 0.0 | 250.6 | 0.22 | ALS | |
| loss 0.4m | 127.0 | 157.0 | 30.0 | 0.69 | SU | |||||
| Total core loss = 15.9 m | ||||||||||
| SE Sorowar | SDH123 | 209448.0 | 44461.9 | 124.3 | -55 / 045 | 0.0 | 250.0 | 0.44 | ALS | |
| 94.0 | 118.0 | 24.0 | 1.04 | SU | ||||||
| Total core loss = 6.0 m | ||||||||||
| SE Sorowar | SDH124 | 209429.9 | 44571.0 | 120.0 | -55 / 360 | 0.0 | 245.1 | 0.62 | ALS | |
| loss 0.6m | 74.0 | 149.0 | 75.0 | 1.37 | SU | |||||
| incl | 84.0 | 86.0 | 2.0 | 16.4 | SU | |||||
| incl | 84.0 | 85.0 | 1.0 | 27.7 | SU | |||||
| loss 0.1m | and | 108.0 | 114.0 | 6.0 | 2.51 | SU | ||||
| loss 0.1m | incl | 110.0 | 111.0 | 1.0 | 5.32 | SU | ||||
| and | 121.0 | 122.0 | 1.0 | 7.02 | SU | |||||
| 160.0 | 170.0 | 10.0 | 1.01 | SU | ||||||
| 218.0 | 234.0 | 16.0 | 1.12 | SU | ||||||
| Total core loss = 2.6 m | ||||||||||
| SE Sorowar | SDH126 | 209448.8 | 44461.5 | 125.4 | -90 / 360 | 0.0 | 250.2 | 0.38 | EXLAB | |
| loss 0.7m | 125.0 | 147.0 | 22.0 | 1.59 | SU | |||||
| loss 0.6m | incl | 126.0 | 135.0 | 9.0 | 2.73 | SU | ||||
| loss 0.2m | incl | 127.0 | 131.0 | 4.0 | 3.24 | SU | ||||
| 173.0 | 176.0 | 3.0 | 4.39 | SU | ||||||
| Total core loss = -3.3m | ||||||||||
| SE Sorowar | SDH127 | 209429.6 | 44574.6 | 120.4 | -60 / 270 | 0.0 | 261.5 | 0.41 | ALS | |
| 124.0 | 157.0 | 33.0 | 1.15 | SU | ||||||
| loss 0.75m | 171.0 | 195.0 | 24.0 | 0.63 | SU | |||||
| loss 0.3m | 249.0 | 261.5 | 12.5 | 1.12 | SU | |||||
| Total core loss = -3.6m | ||||||||||
| SE Sorowar | SDH130 | 209491.6 | 44382.9 | 122.1 | -60 / 090 | 0.0 | 250.0 | 0.77 | EXLAB | |
| loss 1.3m | 4.0 | 15.0 | 11.0 | 1.97 | OX, SU | |||||
| loss 0.5m | incl | 8.0 | 11.0 | 3.0 | 3.91 | SU | ||||
| loss 0.2m | 102.0 | 114.0 | 12.0 | 1.29 | SU | |||||
| loss 3.9m | 163.0 | 213.0 | 50.0 | 1.74 | SU | |||||
| loss 0.9m | incl | 167.0 | 183.0 | 16.0 | 3.68 | SU | ||||
| loss 0.5m | incl | 168.0 | 173.0 | 5.0 | 5.52 | SU | ||||
| incl | 169.0 | 170.0 | 1.0 | 11.1 | SU | |||||
| and | 172.0 | 173.0 | 1.0 | 7.59 | SU | |||||
| loss 0.2m | and | 177.0 | 180.0 | 3.0 | 5.73 | SU | ||||
| Total core loss = 25.8 m | ||||||||||
| SE Sorowar | SDH133 | 209487.1 | 44382.5 | 121.9 | -60 / 360 | 70.0 | 255.0 | 0.30 | EXLAB | |
| 0.0 | 70.0 | unsampled | ||||||||
| 235.0 | 254.0 | 19.0 | 1.46 | SU | ||||||
| incl | 241.0 | 242.0 | 1.0 | 6.97 | SU | |||||
| 255.0 | 295.7 | unsampled | ||||||||
| Total core loss = 9.0 m | ||||||||||
| SE Sorowar | SDH136 | 209485.5 | 44648.1 | 150.3 | -60 / 90 | 0.0 | 210.1 | 0.28 | EXLAB | |
| loss 1.8m | 13.0 | 35.0 | 22.0 | 0.92 | OX | |||||
| Total core loss = 6.5 m | ||||||||||
| SE Sorowar | SDH139 | 209484.8 | 44650.5 | 150.6 | -55 / 315 | 0.0 | 168.3 | 0.67 | EXLAB | |
| loss 4.6m | 2.0 | 35.0 | 33.0 | 0.65 | OX | |||||
| loss 0.4m | 48.0 | 55.0 | 7.0 | 2.22 | OX, TR | |||||
| loss 1.3m | 108.0 | 161.0 | 53.0 | 0.89 | SU | |||||
| loss 0.5m | incl | 141.0 | 153.0 | 12.0 | 1.29 | SU | ||||
| Total core loss = 9.6 m | ||||||||||
| Samat | RC1822 | 207497.8 | 44440.3 | 109.8 | -60 / 180 | 0.0 | 124.0 | 0.05 | EXLAB | |
| No significant intercepts | ||||||||||
| Avg Estimated Recovery 80.3% | ||||||||||
| Samat | RC1823 | 207506.7 | 44610.6 | 96.0 | -60 / 360 | 0.0 | 150.0 | 0.35 | EXLAB | |
| 0.0 | 12.0 | 12.0 | 1.02 | OX, SU | ||||||
| 19.0 | 37.0 | 18.0 | 1.61 | SU | ||||||
| incl | 26.0 | 29.0 | 3.0 | 3.38 | SU | |||||
| Avg Estimated Recovery 91.7% | ||||||||||
11
Table 1 (con’t) Simberi Deposits - >0.5 g/t Mineralised Intercepts - Reported September 2010
| Samat | RC1824 | 207812.7 | 44752.4 | 105.9 | -60 / 360 | 0.0 | 150.0 | 0.29 | EXLAB | |
| 34.0 | 55.0 | 21.0 | 1.29 | SU | ||||||
| Avg Estimated Recovery 104.9% | ||||||||||
| Samat | RC1825 | 207802.9 | 44702.5 | 112.5 | -60 / 360 | 0.0 | 140.0 | 1.68 | EXLAB | |
| 25.0 | 46.0 | 21.0 | 1.13 | TR, SU | ||||||
| 67.0 | 140.0 | 73.0 | 2.71 | SU | ||||||
| and | 79.0 | 121.0 | 42.0 | 4.14 | SU | |||||
| incl | 82.0 | 92.0 | 10.0 | 4.24 | SU | |||||
| incl | 86.0 | 88.0 | 2.0 | 6.46 | SU | |||||
| and incl | 91.0 | 92.0 | 1.0 | 10.1 | SU | |||||
| incl | 97.0 | 102.0 | 5.0 | 12.5 | SU | |||||
| incl | 97.0 | 100.0 | 3.0 | 18.4 | SU | |||||
| incl | 98.0 | 99.0 | 1.0 | 35.7 | SU | |||||
| and | 106.0 | 114.0 | 8.0 | 4.90 | SU | |||||
| incl | 106.0 | 108.0 | 2.0 | 10.9 | SU | |||||
| Avg Estimated Recovery 83.0% | ||||||||||
| Samat | RC1826 | 207699.3 | 44663.5 | 119.4 | -60 / 360 | 0.0 | 96.0 | 0.33 | ALS | |
| No significant intercepts | OX | |||||||||
| Avg Estimated Recovery 79.5% | ||||||||||
| Samat | RC1827 | 207546.9 | 44572.8 | 97.6 | -60 / 360 | 0.0 | 120.0 | 0.48 | ALS | |
| 0.0 | 35.0 | 35.0 | 0.91 | OX, SU | ||||||
| Avg Estimated Recovery 82.5% | ||||||||||
| Samat | RC1828 | 207334.1 | 44701.8 | 75.2 | -90 / 360 | 0.0 | 130.0 | 1.44 | ALS | |
| 0.0 | 21.0 | 21.0 | 2.06 | OX, SU | ||||||
| incl | 0.0 | 1.0 | 1.0 | 7.73 | OX, SU | |||||
| 35.0 | 72.0 | 37.0 | 2.98 | SU | ||||||
| incl | 63.0 | 70.0 | 7.0 | 6.60 | SU | |||||
| 99.0 | 130.0 | 31.0 | 0.92 | SU | ||||||
| Avg Estimated Recovery 72.2% | ||||||||||
| Samat | RC1830 | 207372.4 | 44656.4 | 75.7 | -60 / 360 | 0.0 | 120.0 | 0.21 | EXLAB | |
| No significant intercepts | ||||||||||
| Avg Estimated Recovery 70.9% | ||||||||||
| Samat | RC1831 | 207683.4 | 44587.8 | 146.9 | -80 / 360 | 0.0 | 90.0 | 0.49 | EXLAB | |
| 9.0 | 51.0 | 42.0 | 0.76 | OX, TR, SU | ||||||
| Avg Estimated Recovery 76.6% | ||||||||||
| Samat | SDH120 | 207593.6 | 44496.6 | 107.5 | -60 / 180 | 1.0 | 241.0 | 0.26 | ALS | |
| loss 1.45m | 46.0 | 61.0 | 15.0 | 1.37 | SU | |||||
| loss 5.85m | 92.0 | 111.0 | 19.0 | 0.61 | SU | |||||
| Total core loss = 17.15 m | ||||||||||
| Samat | SDH137 | 207504.5 | 44553.0 | 88.6 | -60 / 180 | 0.0 | 123.6 | 0.40 | EXLAB | |
| loss 0.6m | 52.0 | 65.0 | 13.0 | 1.20 | SU | |||||
| Total core loss = 4.0 m | ||||||||||
| Botlu | RC1820 | 208166.3 | 43403.1 | 228.7 | -60 / 292 | 0.0 | 120.0 | 0.01 | EXLAB | |
| No significant intercepts | ||||||||||
| Avg Estimated Recovery 87.3% | ||||||||||
| Botlu | RC1821 | 208169.5 | 43407.2 | 228.5 | -60 / 360 | 0.0 | 120.0 | 0.11 | EXLAB | |
| No significant intercepts | ||||||||||
| Avg Estimated Recovery 89.6% | ||||||||||
| Botlu | SDH125 | 208076.6 | 43543.3 | 194.7 | -60 / 360 | 0.0 | 251.1 | 0.27 | ALS | |
| loss 2.5m | 0.0 | 24.0 | 24.0 | 0.94 | OX, SU | |||||
| loss 0.7m | incl | 0.0 | 4.0 | 4.0 | 2.68 | OX, SU | ||||
| loss 0.7m | 42.0 | 52.0 | 10.0 | 1.48 | SU | |||||
| Total core loss = 9.7 m | ||||||||||
| Botlu | SDH128 | 208335.9 | 43252.8 | 192.4 | -60 / 360 | 0.0 | 250.0 | 0.21 | ALS | |
| loss 3.1m | 11.0 | 36.0 | 25.0 | 0.84 | OX | |||||
| loss 1.55m | 60.0 | 69.0 | 9.0 | 1.57 | OX, TR, SU | |||||
| incl | 66.0 | 68.0 | 2.0 | 3.51 | OX | |||||
| Total core loss = 28.6 m | ||||||||||
| Botlu | SDH129 | 208131.3 | 43438.0 | 220.8 | -60 / 360 | 88.0 | 251.0 | 0.44 | ALS | |
| 0.0 | 88.0 | unsampled | ||||||||
| loss 4.2m | 114.0 | 142.0 | 28.0 | 1.61 | SU | |||||
| loss 0.2m | incl | 116.0 | 118.0 | 2.0 | 3.45 | SU | ||||
| loss 0.6m | and | 129.0 | 133.0 | 4.0 | 3.35 | SU | ||||
| Total core loss = 9.2 m | ||||||||||
12
Table 1 (con’t) Simberi Deposits - >0.5 g/t Mineralised Intercepts - Reported September 2010
| Botlu | SDH131 | 208077.1 | 43654.6 | 221.3 | -60 / 360 | 50.0 | 291.0 | 0.31 | EXLAB | |
| 0.0 | 50.0 | unsampled | ||||||||
| loss 3.0m | 92.0 | 112.0 | 20.0 | 2.10 | SU | |||||
| loss 0.2m | incl | 98.0 | 105.0 | 7.0 | 5.08 | SU | ||||
| loss 0.2m | incl | 100.0 | 104.0 | 4.0 | 7.54 | SU | ||||
Total core loss = 18.7 m | ||||||||||
| Botlu | SDH132 | 208381.7 | 43400.4 | 205.3 | -60 / 360 | 0.0 | 200.0 | 0.15 | EXLAB | |
| No significant intercepts | ||||||||||
| Total core loss = 17.4 m | ||||||||||
| Botlu | SDH134 | 207854.6 | 43754.9 | 145.5 | -60 / 360 | 50.0 | 271.1 | 0.12 | EXLAB | |
| 0.0 | 50.0 | unsampled | ||||||||
| No significant intercepts | ||||||||||
| Total core loss = 17.4 m | ||||||||||
| Botlu | SDH135 | 208116.7 | 43494.6 | 198.4 | -60 / 360 | 30.0 | 265.5 | 0.07 | EXLAB | |
| 0.0 | 30.0 | unsampled | ||||||||
| loss 0.3m | 116.0 | 127.0 | 11.0 | 0.83 | SU | |||||
| 156.0 | 163.0 | 7.0 | 1.78 | SU | ||||||
| incl | 159.0 | 160.0 | 1.0 | 5.20 | SU | |||||
| Total core loss = 5.6 m | ||||||||||
| Botlu | SDH138 | 208383.4 | 43453.7 | 226.9 | -70 / 180 | 60.0 | 167.7 | 1.48 | EXLAB | |
| 0.0 | 60.0 | unsampled | ||||||||
| loss 3.4m | 85.0 | 116.0 | 31.0 | 2.46 | SU | |||||
| loss 3.4m | incl | 86.0 | 104.0 | 18.0 | 3.05 | SU | ||||
| incl | 97.0 | 98.0 | 1.0 | 5.13 | SU | |||||
| incl | 100.0 | 101.0 | 1.0 | 5.37 | SU | |||||
| loss 1.3m | 124.0 | 148.0 | 24.0 | 2.25 | SU | |||||
| loss 0.2m | incl | 126.0 | 130.0 | 4.0 | 3.08 | SU | ||||
| and | 132.0 | 136.0 | 4.0 | 1.83 | SU | |||||
| loss 0.7m | and | 138.0 | 144.0 | 6.0 | 4.34 | SU | ||||
| loss 0.2m | incl | 142.0 | 143.0 | 1.0 | 16.3 | SU | ||||
| 154.0 | 158.0 | 4.0 | 2.01 | SU | ||||||
| 164.0 | 167.0 | 3.0 | 4.42 | SU | ||||||
| incl | 165.0 | 166.0 | 1.0 | 9.21 | SU | |||||
| Total core loss = 7.6 m | ||||||||||
Broad down hole intercepts are determined using a cut-off of 0.5 g/t Au and a minimum grade*length of 10gmpt. Such intercepts may include material below cut-off but no more than 5 sequential meters of such material and except where the average drops below the cut-off. Selvage is only included where its average grade exceeds 0.5/t. Using the same criteria for included sub-grade, supplementary cut-offs of 2.5g/t , 5.0g/t and 10g/t are used to highlight higher grade zones and spikes. Single assays intervals are reported only where >5.0g/t and >=1m down hole. No high grade cut is applied. Drill core was cut with a diamond saw and half-core samples were taken for assaying, generally over one metre intervals. The samples were bagged and delivered to the Company's on-site sample preparation facility in the same secured compound at Simberi. The core samples were then crushed to minus 2 mm and riffle split with half the sample pulverised to 90% passing 75 microns. Approximately 150 g of pulverised sample was bagged for shipment to the selected analytical laboratory. The remaining half core and coarse crushed material and a 200 g reference pulp sample were all archived in an adjacent locked storage area. RC samples, collected below a cyclone over 1 metre intervals, were split to 1kg, using a single tier riffle splitter. The 1kg samples were bagged and delivered to the Company's on-site sample preparation facilities at the site where the drilling was done, either Simberi or Gold Ridge. The RC cutting samples were then crushed to minus 2 mm and riffle split with half the sample pulverised to 90% passing 75 microns. Approximately 150 g of pulverised sample was bagged for shipment to the selected analytical laboratory. The remaining cuttings material and, at Simberi, a 200 g reference pulp sample were archived in an adjacent locked storage area. The pulversised samples were analysed either by an ALS laboratory (independent of the Company) in Townsville, Australia (ALS_TSV) or, for Simberi samples only, an on-site Company laboratory at Simberi dedicated to exploration samples (EXLAB). The Company's QA/QC procedures include the insertion of approximately 15% commercially produced analytical standards, crushed and pulverized duplicates and blanks in each sample batch. The gold assay method is either Fire Assay with a 0.01g/t Au detection limit (ALS_TSV) or Aqua Regia digest of a 25g charge with a 0.02g/t Au detection limit (EXLAB). Samples, with a reported below detection grade, are assigned a grade of half the detection limit. Duplicates, inserted for QC purposes, are not averaged. Where reported, Ag grade is its weighted average over the same interval as that defined by the Au intercept. Ag is determined by ALS_TSV using an Aqua Regia digest of a 0.5g charge followed by ICP OES analysis, with a detection limit of 0.2g/t Ag. In core holes, intercept grades are calculated using sample grades weighted by sampled length divided by interval length. This results in any included core loss being assigned zero grade. The average grade over the length of hole sampled is shown as a ranking guide and is calculated without any cut-off applied. The information provided in this report/statement/release constitutes Mineral Exploration Results as defined in JORC code, Clause 16. It is inappropriate to use such information for deriving estimates of tonnage and grade without fully taking into account its complete relational context. | ||||||||||
Mt Letam, Tatau, PNG
13
First hole of a 3-hole programme to test for copper-gold target commenced in the first week of September. The first hole TTD001 was completed at 200m and TTD002 was in progress, at 58.6m at end September. Disseminated sulphides were observed in the final 50m of TTD001, drilled entirely in granitic rocks. Assays are pending.
Gold Ridge, Solomon Islands
Forty six RC holes were drilled at Namachamata pit for an aggregate total of 2034 metres and assay results were received for 648 drill hole samples.
The RC drilling on 50m line spacing is focused on grade and metallurgy confirmation, with Namachamata to be a production starter pit in 2011.
Of the assays received, the most interesting, GRC007 with its 20 m @ 5.61 g/t Au from surface, occurs in a previously untested area on the SE side of the pit.
An IP Survey surveyed 10 line kilometres of Pole-Dipole IP. The survey picked up both the Valehaichichi and Namachamata deposits and other large anomalies within the area.
The geophysics has identified flat dipping chargeable bodies suggesting further follow up drilling in 2011 when access is easier. Targets to 150m can be tested with RC, the deep targets would require core drilling.
A complete listing of weighted average grades of mineralized intercepts in holes recently drilled at Gold Ridge, defined by a range of sample gold grade cut-offs, is presented below.
The method of sampling and calculation of the average grades is the same as described in the accompanying notes for the table of down hole intercepts from Simberi above.
14
Table 2 Namachamata Deposit - >0.5 g/t Mineralised Intercepts - Reported September 2010
| Hole | GR m North | GR m East | RL (m) | Dip/Azi | From (m) | To (m) | Intercept (m) | Au Grade (g/t) | Oxidation |
| GRC0001 | 40556.0 | 23540.0 | 474.1 | -90 / 360 | 0.0 | 31.0 | 0.65 | ALS_TSV | |
| 11.0 | 21.0 | 10.0 | 1.85 | TR, SU | |||||
| incl | 16.0 | 21.0 | 5.0 | 3.01 | SU | ||||
| incl | 19.0 | 20.0 | 1.0 | 9.81 | SU | ||||
| GRC0002 | 40547.4 | 23565.9 | 466.5 | -90 / 360 | 0.0 | 30.0 | 2.07 | ALS_TSV | |
| 0.0 | 15.0 | 15.0 | 2.08 | OX, TR, SU | |||||
| incl | 0.0 | 4.0 | 4.0 | 3.01 | OX | ||||
| incl | 1.0 | 2.0 | 1.0 | 5.79 | OX | ||||
| and | 6.0 | 15.0 | 9.0 | 2.00 | OX, SU | ||||
| incl | 10.0 | 12.0 | 2.0 | 3.59 | SU | ||||
| 25.0 | 30.0 | 5.0 | 5.76 | SU | |||||
| incl | 29.0 | 30.0 | 1.0 | 26.6 | SU | ||||
| GRC0003 | 40596.7 | 23567.3 | 462.8 | -60 / 270 | 0.0 | 30.0 | 2.38 | ALS_TSV | |
| 10.0 | 22.0 | 12.0 | 5.31 | OX, SU | |||||
| incl | 11.0 | 15.0 | 4.0 | 11.6 | SU | ||||
| incl | 12.0 | 15.0 | 3.0 | 13.9 | SU | ||||
| incl | 13.0 | 14.0 | 1.0 | 21.2 | SU | ||||
| 18.0 | 21.0 | 3.0 | 2.92 | OX, SU | |||||
| 27.0 | 30.0 | 3.0 | 1.35 | SU | |||||
| GRC0004 | 40594.6 | 23580.5 | 463.0 | -60 / 270 | 0.0 | 30.0 | 2.59 | ALS_TSV | |
| 1.0 | 17.0 | 16.0 | 2.86 | OX, TR, SU | |||||
| incl | 4.0 | 6.0 | 2.0 | 5.66 | OX | ||||
| incl | 4.0 | 5.0 | 1.0 | 7.52 | OX | ||||
| and | 8.0 | 16.0 | 8.0 | 3.12 | OX, TR,SU | ||||
| 23.0 | 30.0 | 7.0 | 4.32 | TR, SU | |||||
| incl | 25.0 | 27.0 | 2.0 | 11.7 | TR, SU | ||||
| incl | 25.0 | 26.0 | 1.0 | 21.6 | TR | ||||
| GRC0005 | 40599.7 | 23542.8 | 467.0 | -60 / 270 | 0.0 | 30.0 | 0.69 | ALS_TSV | |
| 17.0 | 23.0 | 6.0 | 3.03 | TR | |||||
| incl | 17.0 | 22.0 | 5.0 | 3.45 | TR | ||||
| incl | 21.0 | 22.0 | 1.0 | 5.89 | TR | ||||
| GRC0006 | 40651.1 | 23550.1 | 459.6 | -60 / 270 | 0.0 | 30.0 | 0.11 | ALS_TSV | |
| No significant results | |||||||||
| GRC0007 | 40650.8 | 23522.9 | 463.8 | -60 / 270 | 0.0 | 30.0 | 3.80 | ALS_TSV | |
| 0.0 | 20.0 | 20.0 | 5.61 | OX, TR | |||||
| incl | 5.0 | 7.0 | 2.0 | 3.21 | OX | ||||
| and | 9.0 | 10.0 | 1.0 | 5.11 | OX | ||||
| and | 12.0 | 16.0 | 4.0 | 17.7 | OX | ||||
| incl | 13.0 | 16.0 | 3.0 | 22.2 | OX | ||||
| incl | 13.0 | 14.0 | 1.0 | 47.1 | OX | ||||
| GRC0008 | 40598.9 | 23604.6 | 451.1 | -60 / 270 | 0.0 | 30.0 | 0.73 | ALS_TSV | |
| 0.0 | 3.0 | 3.0 | 0.92 | OX | |||||
| incl | 0.0 | 2.0 | 2.0 | 1.11 | OX | ||||
| 14.0 | 19.0 | 5.0 | 1.45 | TR | |||||
| 22.0 | 28.0 | 6.0 | 1.35 | TR | |||||
15
Table 2 (con’t) Namachamata Deposit - >0.5 g/t Mineralised Intercepts - Reported September 2010
| Hole | GR m North | GR m East | RL (m) | Dip/Azi | From (m) | To (m) | Intercept (m) | Au Grade (g/t) | Oxidation |
| GRC0009 | 40648.9 | 23596.7 | 443.5 | -60 / 270 | 0.0 | 30.0 | 1.75 | ALS_TSV | |
| 0.0 | 6.0 | 6.0 | 0.99 | OX | |||||
| incl | 2.0 | 6.0 | 4.0 | 1.14 | OX | ||||
| 9.0 | 30.0 | 21.0 | 2.19 | TR, SU | |||||
| incl | 12.0 | 14.0 | 2.0 | 1.40 | TR | ||||
| and | 16.0 | 18.0 | 2.0 | 2.26 | TR | ||||
| and | 20.0 | 25.0 | 5.0 | 3.19 | TR | ||||
| incl | 21.0 | 23.0 | 2.0 | 5.99 | TR | ||||
| incl | 22.0 | 23.0 | 1.0 | 7.26 | TR | ||||
| and | 27.0 | 28.0 | 1.0 | 15.2 | TR | ||||
| GRC0010 | 40600.5 | 23618.1 | 448.3 | -60 / 270 | 0.0 | 30.0 | 1.00 | ALS_TSV | |
| 0.0 | 3.0 | 3.0 | 1.79 | OX | |||||
| incl | 1.0 | 3.0 | 2.0 | 2.22 | OX | ||||
| 8.0 | 9.0 | 1.0 | 6.50 | TR | |||||
| 21.0 | 26.0 | 5.0 | 2.58 | SU | |||||
| incl | 22.0 | 25.0 | 3.0 | 3.85 | SU | ||||
| incl | 24.0 | 25.0 | 1.0 | 7.91 | SU | ||||
| GRC0011 | 40591.8 | 23642.4 | 445.4 | -60 / 270 | 0.0 | 30.0 | 0.11 | ALS_TSV | |
| No significant results | |||||||||
| GRC0012 | 40499.2 | 23599.5 | 440.5 | -60 / 270 | 0.0 | 30.0 | 0.48 | ALS_TSV | |
| 7 | 11 | 4.0 | 1.59 | TR | |||||
| GRC0013 | 40647.0 | 23623.3 | 435.5 | -60 / 270 | 0.0 | 30.0 | 0.44 | ALS_TSV | |
| 6 | 8 | 2.0 | 0.65 | SU | |||||
| 10 | 12 | 2.0 | 0.70 | SU | |||||
| 22 | 30 | 8.0 | 0.82 | SU | |||||
| GRC0014 | 40647.6 | 23639.7 | 433.2 | -60 / 270 | 0.0 | 51.0 | 0.46 | ALS_TSV | |
| 0 | 4 | 4.0 | 0.99 | OX | |||||
| 9 | 17 | 8.0 | 1.01 | SU | |||||
| 29 | 32 | 3.0 | 0.74 | SU | |||||
| GRC0015 | 40651.0 | 23680.1 | 424.8 | -60 / 270 | 0.0 | 30.0 | 0.02 | ALS_TSV | |
| No significant results | |||||||||
| GRC0016 | 40649.0 | 23663.7 | 428.4 | -60 / 270 | 0.0 | 42.0 | 0.08 | ALS_TSV | |
| No significant results | |||||||||
| GRC0017 | 40510.1 | 23626.5 | 428.0 | -60 / 270 | 0.0 | 20.0 | 0.43 | ALS_TSV | |
| 0 | 5 | 5.0 | 0.94 | OX | |||||
| GRC0018 | 40550.5 | 23589.0 | 460.8 | -60 / 270 | 0.0 | 30.0 | 0.49 | ALS_TSV | |
| 2 | 10 | 8.0 | 1.40 | OX | |||||
| GRC0019 | 40516.4 | 23558.3 | 469.4 | -60 / 270 | 0.0 | 35.0 | 0.62 | ALS_TSV | |
| 1 | 5 | 4.0 | 0.92 | OX | |||||
| 16 | 21 | 5.0 | 2.01 | TR, SU | |||||
| incl | 19 | 21 | 2.0 | 4.20 | SU | ||||
| 30 | 32 | 2.0 | 0.78 | SU | |||||
| GRC0020 | 40514.3 | 23536.0 | 474.3 | -60 / 270 | 0.0 | 50.0 | 0.27 | ALS_TSV | |
| 9 | 14 | 5.0 | 1.07 | TR, SU |
16
RESULTS OF OPERATIONS
Cash position as at September 30, 2010
Allied Gold’s cash position as at September 30, 2010 was $72,047,976 in available cash and cash equivalents, compared with $85,525,391 as at June 30, 2010. The decrease was as a result of the capital expenditure of approximately $54 million, primarily on the redevelopment of the Gold Ridge Project, offset by funds received pursuant to the draw down on September 1, 2010 of the USD35 million loan facility from International Finance Corporation. These loans funds are to be applied to capital expenditure on the Gold Ridge Project.
Quarter ended September 30, 2010 as compared to Quarter ended September 30, 2009
The tables below summarise the key financial and operating statistics for Allied Gold’s mining and processing activities for the Quarter and the Previous Quarter:
Key financial statistic | 3 months ended September 30, 2010 $ | 3 months ended September 30, 2010 (restated)1 $ |
| Sales revenue | 20,139,103 | 15,989,561 |
| Gross margin | 3,892,761 | (3,585,327 |
| Corporate expenses | (2,501,306) | (2,523,106) |
| Financial expenses | (353,892) | (766,556) |
| Other expenses /(income) | 35,215 | (175,312) |
| Profit / (loss) for the period | 1,072,778 | (7,050,301) |
1 The profit for the Quarter ended September 30, 2009 was restated for a change in accounting policy in relation to the Group’s accounting for cash flow hedges. Further information is presented in Allied’s financial statements for the Quarter ended September 30, 2010.
Key financial statistic | 3 months ended September 30, 2010 $ | 3 months ended September 30, 2009 $ |
| Cashflow from operations | 5,424,979 | (1,325,439) |
| Cashflow from investing activities | (55,564,955) | (5,897,865) |
| Cashflow from financing activities | 37,165,596 | 2,458,656 |
| Net cashflow | (12,974,380) | (4,764,458) |
Key operating statistic | Unit of measure | 3 months ended September 30, 2010 | 3 months ended September 30, 2009 | 12 months ended June 30, 2010 | |
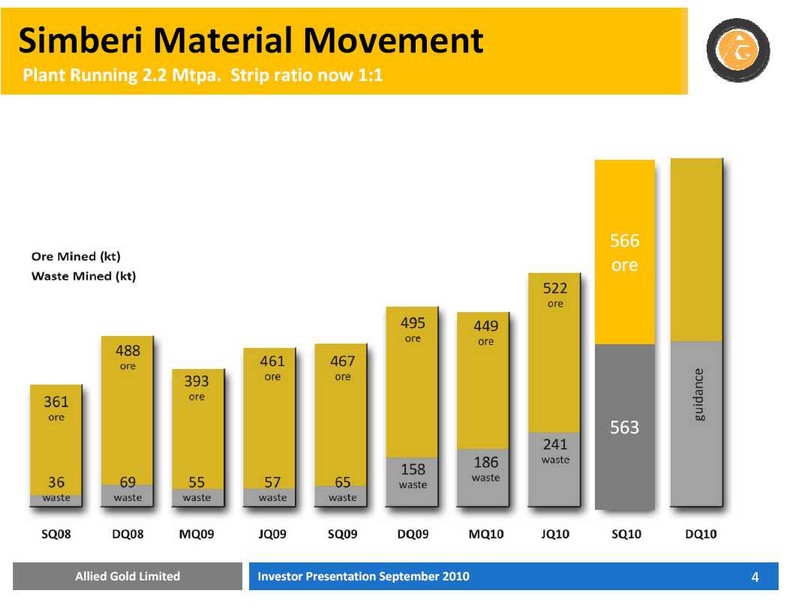
| Waste mined | tonnes | 563,672 | 65,011 | 634,296 | |
| Ore mined | tones | 566,018 | 467,368 | 1,981,500 | |
| Ore processed | tones | 570,473 | 489,256 | 1,949,650 | |
| Grade | grams of gold/tonne | 1.09 | 1.03 | 1.18 | |
| Recovery | % | 91.3 | 87.2 | 87.9 | |
| Gold produced | ounces | 18,206 | 14,072 | 64,327 | |
| Gold sold | ounces | 16,935 | 15,420 | 63,960 | |
Profit for the Quarter compared to the Previous Quarter
Allied Gold reported revenue of $20,139,103 and a net profit of $1,191,456 or 0.10 cents per share for the Quarter, compared with revenue of $15,989,561 and a net loss of ($7,050,301) or (1.33) cents per share for the prior corresponding Quarter ended September 30, 2009 (the “Previous Quarter”).
17
The results for the Quarter (September 2010) as compared to the Previous Quarter (September 2009) reflect the following:
| · | Gold production of 18,206 oz in the Quarter represented an increase of approximately 29% over gold production of 14,072 oz in the Previous Quarter. The increase in gold produced was primarily attributable to increased mining and processing volumes, higher mill head grades and higher recoveries. The increased gold production reflects the positive impact of the ongoing debottlenecking initiatives on the Simberi project. |
| · | Gold revenue for the Quarter of $20,139,103 was 26% higher than gold revenue of $15,989,561 in the Previous Quarter for the following reasons: |
| - | Sales of 16,935 ounce in 2010 compared to 15,420 ounces in 2009 (a favourable volume variance of AUD 1.7 million) |
| - | Average spot price of AUD1,314 per ounce in 2010 compared to AUD1,178 in 2009 (a favourable price variance of AUD2.3 million). |
Whilst the hedge book was paid out in February 2010, for accounting purposes the hedging losses crystallised at that time are amortised in accordance with the original maturity schedule of the hedge book. Accordingly the pay out of the hedge book has not had a significant impact on reported revenue as contractual hedge book deliveries in the Quarter was 11,250 ounces compared to 10,926 ounces in the Previous Quarter.
| · | Cost of sales of $16,246,342 for the Quarter equates to AUD959 per ounce compared to the Previous Quarter costs of sales of $19,574,888 or AUD1,269 per ounce. The 24.4% reduction in cost per ounce produced is attributable to: |
| - | Quarter production of 18,206 ounces was 29.3% higher than Previous Quarter production of 14,072 ounces. |
| - | The 29.3% increase in gold produced was achieved on the basis of a 16.6% increase in ore processed from 489,256 tonnes to 570,473 tonnes. The higher rate of increase in gold produced compared to tonnes milled was due to a combination of higher mill head grade (1.09 g/t in 2010 compared to 1.03 g/t in 2009) and higher recoveries (91.3% in the Quarter compared to 87.2% in the Previous Quarter). |
The reduced cost per ounce in 2010 therefore reflects the spreading of fixed costs across a greater level of production and reduced variable costs per ounce due to more gold being produced per tonne of ore processed as a consequence of higher grades and improved recoveries.
The increase in the ratio of waste mined to total ore mined from 0.14:1 in the Previous Quarter to 1:1 in the Quarter reflected the need to access deeper ore bodies and was consistent with current mine planning. It is expected that a ratio of 1:1 will be maintained in future quarters.
| · | Corporate expenses in 2010 were slightly lower than in 2009 notwithstanding an expanded corporate presence as a consequence of the centralisation of a number of functions (purchasing, human resources, training) following the acquisition of Australian Solomons Gold. The reduction was attributable to the following: |
18
| - | Capitalisation in the Quarter of approximately $0.2 million of corporate costs against the Gold Ridge redevelopment project and Simberi Feasibility study. |
| - | In the Quarter approximately $1.1 million in Corporate costs were recharged to sites as part of the implementation of a user pays based transfer pricing system. No such recharges were made in the Previous Quarter. |
| - | The Previous Quarter costs included approximately $0.4 million in external consultancy costs incurred as part of the preparation for the acquisition of Australian Solomons Gold. |
Cash and cash flows for the Quarter compared to the Previous Quarter
In the Quarter, Allied Gold reported a net decrease in cash and cash equivalents of ($12,974,380) compared to a net decrease of ($4,764,458) in cash and cash equivalents in the Previous Quarter. The increased cash flow usage in the Quarter was primarily due to:
| • | Cash generated by operating activities of $5,424,979 in the Quarter compared to the Previous Quarter cash used by operating activities of ($1,325,439) due to: |
| - | Due to termination of the hedge book in February 2010 all sales in the Quarter realised cash proceeds based on the spot price whereas in the Previous Quarter, 10,926 ounces of gold sold realised cash proceeds at the hedge price of USD700 per ounce being the hedge price. This resulted in approximately AUD$6.9 million of additional cash proceeds in the Quarter (11,250 hedged ounces by differential of approximately AUD615 per ounce between hedge price and spot price). |
| • | Cash used by investing activities increased from ($5,897,865) in the Previous Quarter to ($55,564,955) in the Quarter due primarily to: |
| - | Increased expenditure totaling $54,117,063 on property, plant and equipment in the Quarter in relation to (i) debottlenecking and optimization initiatives on Simberi Island of $2.4 million (ii) expenditure of $0.5 million on the ongoing Sulphide Feasibility Study being undertaken on Simberi Island (iii) capital expenditure on the Gold Ridge redevelopment project of $48.3 million relating primarily to the purchase of mobile equipment (iv) capitalised borrowing costs of approximately $2.3 million |
| - | Simberi Development and exploration and evaluation expenditure totaling $1,447,892 in relation to ML136. |
Finance Activities, Liquidity and Capital Resources
Allied Gold’s cash position as at September 30, 2010 consists of $72,047,976 in available cash and cash equivalents.
During the three month periods ended September 30, 2007 through September 30 2010, the Company has principally funded its activities through equity raisings. The Company did not undertake any equity raising during the Quarter or in the Previous Quarter.
The above mentioned equity raisings have been augmented by debt from external financiers. In the three months ended September 30, 2010 the Group drew down USD35 million under a facility provided to the Group by the International Finance Corporation Limited. The facility is secured by a fixed and floating charge over the assets of Gold Ridge Mining Limited and by a guarantee provided by Allied Gold Limited. No payments of principal or interest are due under the facility until November 2011. The funds drawn down are to be utilised to meet capital expenditure incurred as part of the redevelopment of the Gold Ridge Project.
19
The Company’s financial commitments and contingent liabilities are generally limited to controllable expenditures at the Simberi Project and the Gold Ridge Redevelopment Project. The Company’s material financial commitments and contingent liabilities as of September 30, 2010 are as follows:
| • | Leases for office premises, operating leases for various plant and machinery and payments for the charter of aircraft under non-cancellable operating leases expiring within 1 to 5 years, in the amount of $2,129,368. |
| • | Commitments in relation to finance leases for the hire of mining equipment expiring within 1 to 5 years, in the amount of $3,452,157. |
| • | A required expenditure of $900,900 during the next year in order to maintain current rights of tenure to EL 609. Financial commitments for subsequent periods are contingent upon future exploration results and cannot be estimated. These obligations are subject to renegotiation upon expiry of EL 609 or when application for a mining licence is made and have not been provided for in the accounts. |
| • | Capital expenditure commitments of $35,283,622 for the Gold Ridge Project, $695,286 for Simberi expansion and debottlenecking projects and $231,367 for the Simberi Sulphide pre-feasibility study. |
The above commitments are to be funded through existing cash resources as at September 30, 2010and operating cash flows generated from the Simberi Project.
Summary of Quarterly Results
30 Sep 10 $ | 30 Jun 10 $ | 31 Mar 10 $ | 31 Dec 09 $ | 30 Sep 09 $ | |
| Financial metrics | |||||
| Revenue | 20,139,103 | 19,557,066 | 14,857,132 | 17,151,610 | 15,989,561 |
| Income / (loss) for the Quarter | 1,072,778 | 36,082,387 | (3,437,893) | (16,443,427) | (7,050,301) |
| Income / (loss) per share – basic | 0.10 | 34.68 | (0.33) | (2.78) | (1.33) |
| Income / (loss) per share – diluted | 0.10 | 34.68 | (0.33) | (2.78) | (1.33) |
| Operational metrics | |||||
| Ore mined | 566,018 | 552,420 | 449,904 | 495,121 | 467,368 |
| Ore processed | 570,473 | 544,317 | 439,318 | 653,205 | 489,256 |
| Gold produced | 18,206 | 18,109 | 14,739 | 17,456 | 14,072 |
| Gold sold | 16,935 | 16,526 | 14,064 | 17,971 | 15,420 |
The three months ended September 30, 2009 was the first Quarter in respect of which Allied was required to file a Quarterly report as a reporting issuer.
The following are the key factors that have impacted the Quarterly performance for the periods presented in the above table:
| · | The three months ended June 30, 2010 included a $36,666,786 gain on the acquisition of Australian Solomons Gold Limited. If this gain is excluded, the loss for the three months was $584,399. |
| · | The three months ended December 31, 2009 included share based remuneration expense of $6,819,755 and expenses totaling $1,717,915 that were incurred in relation to the acquisition of Australian Solomons Gold Limited. If these amounts are excluded the loss for the three months was $7,905,757. |
20
| · | The three months ended March 31, 2010 shoed significantly lower productions than the preceding and succeeding Quarters due to approximately four direct lost days of production and a further period of sub capacity as a result of an illegal cease work order which directly impacted gold production for the Quarter and the loss of a further eight days production during the Quarter resulting from a structural mechanical failure of its Scrubber Trommel processing equipment at the Simberi operations. |
| · | If the non recurring amounts and events described above are excluded the Quarterly results demonstrate a continuing improvement in both operational and financial metrics over the Quarters. This improvement reflects the impact of the various efficiency and optimization initiatives implemented to improve plant availability and to reduce cash cost per ounce. Enhancements to plant design have improved plant reliability and availability and have allowed the plant to reach and maintain nameplate capacity consistently in the June 2010 and September 2010 Quarters. |
| · | It is expected that underlying profitability will be enhanced commencing the Match 2011 Quarter once the residual impact of the Group’s hedge book has dissipated. Whilst the hedge book was terminated in February 2010, for accounting purposes the loss realised on termination will be amortised against profit until the December 31, 2010 maturity of the hedge book. |
Financial and Other Instruments
In the normal course of its operations, Allied Gold is exposed to gold price, foreign exchange, interest rate, liquidity, equity price and counterparty risks. In order to manage these risks, the Company may enter into transactions which make use of both on and off balance sheet derivatives. Allied Gold does not acquire, hold or issue derivatives for trading purposes. The Company’s management of financial risks is aimed at ensuring that net cash flows are sufficient to meet all its financial commitments as and when they fall due and to maintain the capacity to fund its forecast project development and exploration strategy by: (i) safeguarding the Company’s core earnings stream from its major asset through the effective control and management of financial risk; (ii) effective and efficient usage of credit facilities through the adoption of reliable liquidity management planning and procedures; and (iii) ensuring that investment and hedging transactions are undertaken with creditworthy counterparts.
The Company may use derivative financial instruments to hedge some of its exposure to fluctuations in gold prices and foreign exchange rates.
In order to protect against the impact of falling gold prices, the Company enters into hedging transactions which provide a minimum price to cover non-discretionary operating expenses, repayments due under the Company’s financing facilities and sustaining capital.
Pursuant to a US$25 million financing facility the Company utilized for the construction of the Simberi Project, Allied Gold was required by its lenders to enter into a hedging program to provide comfort to its lenders of the cash flows going forward. Subsequently in March 2009, Allied Gold repaid the entire project financing facility. In February 2010 the Company settled its remaining hedge obligations totaling 37,512 ounces of gold through the pre delivery of gold into those hedging contracts.
For accounting purposes the “Effective Hedge” component of the mark to market amounting to USD9.5 million is recorded in the Hedge Reserve in equity and will remain in equity and be recognised when the forecast transactions that they were hedging are recognised in the income statement. The “Ineffective Hedge” component of the mark to market per the above table had been recognised directly in the income statement progressively up to, and including, 26 February 2010.
21
The Effective Hedge component of the mark to market will be amortised to the income statement over the following timeframe:
Quarter ending | Hedging loss to be amortised to income statement USD |
| 30 September 2010 | 2,738,137 |
| 31 December 2010 | 2,167,794 |
| 4,905,931 |
As at the date of this analysis, the Company’s forecast production is unhedged, allowing it to take advantage of increases in gold prices.
The Company operates internationally and is exposed to foreign exchange risk arising from various currency exposures primarily with respect to the Papua New Guinea Kina, Solomon Islands dollar and the United States Dollar. During the Quarter, the Company entered into some intra Quarter forward exchange contracts to hedge known commitments in Papua New Guinea Kina. There were no outstanding forward exchange contracts as at September 30, 2010.
The Company’s main interest rate risk arises from interest earning cash deposits that expose the Company to interest rate risk. No hedging programs were implemented by the Company to manage interest rate risk during the Quarter.
The Company is exposed to equity securities price risk arising from investments classified on the balance sheet as available for sale. Investments in equity securities are approved by the Board on a case-by-case basis. The majority of the Company’s available for sale equity investments are in junior resource companies listed on the ASX.
The Company is exposed to counterparty risk that a counterparty will not complete its obligations under a financial instrument resulting in a financial loss for the Company. The Company does not generally obtain collateral or other security to support financial instruments subject to credit risk, but adopts a policy of only dealing with credit worthy counterparties. Trade and other receivables mainly comprise banking institutions purchasing gold under normal settlement terms of two working days. Counterparty risk under derivative financial instruments is to reputable banking institutions. All significant cash balances are on deposit with banking institutions that are members of highly rated major Australian banking groups. The carrying amount of financial assets recorded in the financial statements represents the Company’s maximum exposure to credit risk without taking account of the value of any collateral or other security obtained.
The Company’s liquidity position is managed to ensure sufficient liquid funds are available to meet its financial obligations in a timely manner. The Company manages liquidity risk by continuously monitoring forecast and actual cash flows and ensuring that the Company has the ability to access required funding.
Off-Balance Sheet Arrangements
The Company had no off-balance sheet arrangements as at September 30, 2010.
Related Party Transactions
Remuneration (including fees and the issue of share options) was paid or is payable to the directors of the Company in the normal course of business. In addition, the Company had the following related party transactions during the Quarter:
| • | Mr. Caruso is a director and shareholder of MineSite Construction Services Pty Ltd., which provides Allied Gold with various services, including secretarial services, the supply or procurement on behalf of Allied Gold of goods and services and the provision of operating personnel. Amounts paid or payable to MineSite Construction Services Pty Ltd. were $62,278 in the Quarter and $2,480,994 in the Previous Quarter. |
22
Director options and shareholdings
The table below provides summary movements in Directors’ holding of shares and options in the three months ended September 30, 2010
Options
| Balance at start of period | Granted as remuneration | Exercised | Lapsed | Balance at end of year | Vested and exercisable | |
| M Caruso | 37,375,000 | - | - | - | 37,375,000 | 18,375,000 |
| M House | 1,500,000 | - | - | - | 1,500,000 | 1,000,000 |
| A Lowrie | 1,750,000 | - | - | - | ,750,000 | 1,250,000 |
| G Steemson | 1,750,000 | - | - | - | 1,750,000 | 1,250,000 |
| F Terranova | 18,000,000 | - | - | - | 18,000,000 | 9,250,000 |
| 67,950,000 | - | - | - | 67,950,000 | 36,600,000 |
Shares
| Name | Balance at start of year | Received as remuneration | Options exercised | Net change other | Balance at end of year |
| M Caruso | 7,585,193 | - | - | 100,000 | 7,685,193 |
| S Harvey | 49,045 | 150,955 | 200,000 | ||
| M House | 10,000 | - | - | - | 10,000 |
| A Lowrie | 1,635,460 | - | - | - | 1,635,460 |
| G Steemson | 1,100,000 | - | - | - | 1,100,000 |
| F Terranova | 1,000 | - | - | - | 1,000 |
| 10,700,698 | - | - | 250,955 | 10,951,653 |
Significant Accounting Policies and Estimates
All costs associated with exploration, evaluation and development of ML 136 and EL 609 have been capitalized as these costs are expected to be recognized through the successful development and exploitation of the Simberi Project. The carrying value of non-current assets is reviewed regularly to ensure the expected net Simberi Project cash flows exceed the carrying value. Exploration costs on all projects are capitalized provided the conditions and tests for capitalization, contained within Australian IFRS accounting standards, are met.
The consolidated financial statements of the Company have been prepared in accordance with Australian IFRS. A description of Allied Gold’s significant accounting policies is included in Note 1 to the audited consolidated financial statements of Allied Gold for the year ended September 30, 2010. Management is required to make various estimates and judgments in determining the reported amounts of assets and liabilities, revenues and expenses for each period represented and in the disclosure of commitments and contingencies. Management considers the following are the accounting policies which reflect its more significant estimates and judgments used in the preparation of the consolidated financial statements.
23
Exploration and Evaluation Expenditure
Exploration and evaluation expenditure comprises costs that are directly attributable to researching and analysing existing exploration data; conducting geological studies, exploratory drilling and sampling; examining and testing extraction and treatment methods; and/or compiling prefeasibility and feasibility studies. Exploration expenditure relates to the initial search for deposits with economic potential. Evaluation expenditure arises from a detailed assessment of deposits that have been identified as having economic potential.
Exploration and evaluation expenditure (including amortisation of capitalised licence costs) is charged to the income statement as incurred except in the following circumstances, in which case the expenditure may be capitalised:
| • | The exploration and evaluation activity is within an area of interest for which it is expected that the expenditure will be recouped by future exploitation or sale; or |
| • | At the balance sheet date, exploration and evaluation activity has not reached a stage which permits a reasonable assessment of the existence of commercially recoverable reserves. |
| • | Capitalized exploration and evaluation expenditure considered to be tangible is recorded as a component of property, plant and equipment at cost less impairment charges. Otherwise, it is recorded as an intangible asset. As the asset is not available for use, it is not depreciated. All capitalized exploration and evaluation expenditure is monitored for indications of impairment. Where a potential impairment is indicated, assessment is performed for each area of interest in conjunction with the group of operating assets (representing a cash generating unit) to which the exploration is attributed. Exploration areas at which reserves have been discovered that require major capital expenditure before production can begin are continually evaluated to ensure that commercial quantities of reserves exist or to ensure that additional exploration work is under way or planned. To the extent that capitalised expenditure is not expected to be recovered it is charged to the income statement |
| • | Cash flows associated with exploration and evaluation expenditure (comprising both amounts expensed and amounts capitalised) are classified as investing activities in the cash flow statement. |
Development Expenditure
When proved reserves are determined and development is justified, capitalised exploration and evaluation expenditure is reclassified as “Other Mineral Assets”, and is disclosed as a component of property, plant and equipment. Development expenditure is capitalised and classified as “Other Mineral Assets”. The asset is not depreciated until construction is completed and the asset is available for use.
Foreign Currency
Foreign currency transactions are translated into Australian dollars at exchange rates prevailing at the dates of such transactions. Monetary assets and liabilities denominated in foreign currencies at the balance sheet date are translated to Australian dollars at the rate of exchange prevailing on that date. Foreign exchange differences arising on translation are recognised in the income statement. Non-monetary assets and liabilities that are measured in terms of historical cost in a foreign currency are translated using the exchange rate at the date of the transaction. Non-monetary assets and liabilities denominated in foreign currencies that are stated at fair value are translated to Australian dollars at foreign exchange rates prevailing at the dates the fair value was determined.
The assets and liabilities of foreign operations are translated to Australian dollars at foreign exchange rates prevailing at the balance sheet date. The revenue and expenses of foreign operations are translated to Australian dollars at rates approximating the foreign exchange rates ruling at the dates of the transaction. Exchange differences arising on translation are recognised directly in a separate component of equity.
24
Change in accounting policy
In its consolidated financial report for the year ended June 30, 2010 the Group changed its accounting policies for cash flow hedges to comply with the requirements of AASB 2008-8 Amendment to IAS 39 Financial Instruments: Recognition and Measurement. This required the Group to amend its accounting policy for cash flow hedges to exclude time value from the one sided hedge risk when designating options as hedges. This has had the effect of requiring the time value component of the mark to market value of options forming part of a cash flow hedge to be recorded directly in the statement of comprehensive income. AASB2008-8 required the restatement of comparative information. Note 3(j) to the consolidated financial statements for the year ended June 30, 2010 provided an analysis of the retrospective impact of the change in the accounting policy. The impact of the change in accounting policy on previously reported amounts for the three months ended September 30, 2009 is summarised below:
The Statement of Changes in Equity for the three months ended September 30, 2009 changed as follows:
Notes | July 1 2009 $ | Increase / (Decrease) $ | July 1 2009 (restated) $ | |
| Accumulated losses | (24,257,420) | (1,530,849) | (25,788,269) | |
| Reserves – cash flow hedging reserve | (8,068,638) | (1,634,441) | (9,703,079) |
Profit for the three months ended September 30, 2009 changed as follows:
September 30, 2009 $ | Increase / (Decrease) $ | September 30, 2009 (restated) $ | ||
| Income statement (extract) | ||||
| Unrealised losses on derivatives | 1,131,728 | (1,077,959) | 53,769 | |
| Loss after tax attributable to members of Allied Gold Limited | (5,972,342) | (1,077,959) | (7,050,301) | |
| Changes in the fair value of cash flow hedges - gross | (2,324,920) | 2,318,455 | (6,465) | |
| Total comprehensive loss for the year attributable to the owners of Allied Gold Limited | (8,413,566) | 1,240,496 | (7,173,070) | |
| Basic earnings per share | (1.26) | (0.07) | (1.33) | |
Diluted earnings per share | (1.26) | (0.07) | (1.33) |
Outstanding Securities Data
25
At the date of this MD&A, the Company has issued and outstanding an aggregate of 1,040,032,142 ordinary shares and 74,799,427 options to acquire ordinary shares. No other securities of Allied Gold are issued or outstanding. Details of movements in Company’s outstanding options during the three months ended September 30, 2010 are as follows:
Exercise Price(iv) | Maturity(v) | Options outstanding at July 1 2009 | Options issued | Options expired or cancelled | Options exercised | Options outstanding September 30 2010 |
| $0.80 options | 31/12/2010 | 1,000,000 | - | - | - | 1,000,000 |
| $1 options | 31/12/2010 | 1,000,000 | - | - | - | 1,000,000 |
| $1.25 options | 31/12/2010 | 1,000,000 | - | - | - | 1,000,000 |
| $1.50 options | 31/12/2010 | 1,000,000 | - | - | - | 1,000,000 |
| $2 options | 31/12/2010 | 1,000,000 | - | - | - | 1,000,000 |
$0.35 options(i) | 31/10/2011 | 30,012,500 | - | - | - | 30,012,500 |
| $0.31 Options | 31/12/2010 | 1,699,427 | - | - | - | 1,699,427 |
$0.35 Options(ii) | 31/12/2011 | 1,500,000 | - | - | - | 1,500,000 |
$0.50 Options(iii) | 31/12/2013 | 37,500,000 | - | - | - | 37,500,000 |
| $0.50 options | 31/12/2013 | 1,175,000 | - | - | - | 1,175,000 |
| 76,886,927 | - | - | - | 76,886,927 | ||
Notes: |
| (i) | Of the 30,012,500 options expiring 31 October 2011, 9,375,000 vest upon the share price reaching $A0.70. |
| (ii) | Of the 1,500,000 options expiring 31 December 2011, 500,000 vest upon the share price reaching $A0.70. |
| (iii) | Of the 37,500,000 options expiring 31 December 2013, 15,000,000 vest on 7 December 2010; 15,000,000 vest upon the share price reaching $A0.70 and 7,500,000 vest upon Allied Gold producing 100,000 ounces of gold in the period 1 October 2009 t0 31 December 2010. |
| (iv) | The weighted average exercise price of all options outstanding at the end of the period was $A0.49. |
| (v) | The weighted average time to expiry of all options outstanding at the end of the period was 2.37 years. |
Each option is convertible into one ordinary share in the company when exercised. Options do not participate in dividends and do not give holders voting rights.
Disclosure Controls and Procedures and Internal Controls over Financial Reporting
The Company maintains appropriate information systems, procedures and controls to ensure that information used internally and disclosed externally is complete and reliable. The Company is continuing to review and develop appropriate disclosure controls and procedures and internal controls over financial reporting for the nature and size of the Company’s business.
Disclosure Controls and Procedures
The Company’s disclosure controls and procedures (“DCP”) are designed to provide reasonable assurance that all relevant information is communicated to the Company’s senior management to allow timely decisions regarding disclosure. Access to material information regarding the Company is facilitated by the small size of the Company’s senior management team and workforce. The Company is continuing to develop appropriate DCP for the nature and size of the Company’s business.
26
Internal Controls over Financial Reporting
Internal controls over financial reporting (“ICFR”) are designed to provide reasonable assurance regarding the reliability of the Company’s financial reporting and the preparation of financial statements in compliance with Australian IFRS. The Board is responsible for ensuring that management fulfills its responsibilities in this regard. The Audit Committee fulfills its role of ensuring the integrity of the reported information through its review of the interim and annual financial statements. The Chief Executive Officer and Chief Financial Officer, with participation of the Company’s management, have concluded that there were no material weaknesses at the end of the Quarter or changes to the Company’s internal controls during the Quarter which have materially affected, or are considered to be reasonably likely to materially affect, the Company’s ICFR.
Limitations of Controls and Procedures
The Company’s management, including the Chief Executive Officer and Chief Financial Officer, believe that any DCP or ICFR, no matter how well conceived and operated, can provide only reasonable, not absolute, assurance that the objectives of the control system are met. Because of the inherent limitations in all control systems, they cannot provide absolute assurance that all control issues and instances of fraud, if any, within the Company have been prevented or detected. These inherent limitations include the realities that judgments in decision-making can be faulty, and that breakdowns can occur because of simple error or mistake. Additionally, controls can be circumvented by the individual acts of some persons, by collusion of two or more people, or by unauthorized override of the control. The design of any systems of controls also is based in part upon certain assumptions about the likelihood of future events, and there can be no assurance that any design will succeed in achieving its stated goals under all potential future conditions. Accordingly, because of the inherent limitations in a cost effective control system, misstatements due to error or fraud may occur and not be detected.
Risk factors
The Company is subject to a number of risk factors could adversely affect the Company’s future business, operations and financial condition. For a discussion of risk factors which could affect the Company, see the Company’s Annual Information Form available at www. sedar.com
Cautionary Note Regarding Forward-Looking Statements
This MD&A contains Òforward-looking statementsÓ which may include, but are not limited to, statements with respect to the future financial or operating performance of Allied Gold, its subsidiaries and their projects, the future price of gold, the estimation of mineral reserves and resources, the realization of mineral reserve estimates, the timing and amount of estimated future production, costs of production, capital, operating and exploration expenditures, costs and timing of the development of new deposits, costs and timing of future exploration, requirements for additional capital, government regulation of mining operations, environmental risks, reclamation and rehabilitation expenses, title disputes or claims, limitations of insurance coverage and the timing and possible outcome of pending litigation and regulatory matters. Often, but not always, forward-looking statements can be identified by the use of words such as ÒplansÓ, ÒexpectsÓ, Òis expectedÓ, ÒbudgetÓ, ÒscheduledÓ, ÒestimatesÓ, ÒforecastsÓ, ÒintendsÓ, ÒanticipatesÓ, or ÒbelievesÓ, or variations (including negative variations) of such words and phrases, or state that certain actions, events or results ÒmayÓ, ÒcouldÓ, ÒwouldÓ, ÒmightÓ, or ÒwillÓ be taken, occur or be achieved. Forward-looking statements involve known and unknown risks, uncertainties and other factors which may cause the actual results, performance or achievements of Allied Gold and/or its subsidiaries to be materially different from any future results, performance or achievements expressed or implied by the forward-looking statements. Such factors include, among others, those factors discussed in the section entitled ÒRisk FactorsÓ in this short form prospectus and the documents incorporated by reference herein. Although Allied Gold has attempted to identify important factors that could cause actual actions, events or results to differ materially from those described in forward-looking statements, there may be other factors that cause actions, events or results to differ from those anticipated, estimated or intended. Forward-looking statements contained herein are made based on the opinions and estimates of management as at the date the statements are made, and Allied Gold disclaims any obligation to update any forward-looking statements except as required by law, whether as a result of new information, estimates or opinions, future events or results or otherwise. There can be no assurance that forward-looking statements will prove to be accurate, as actual results and future events could differ materially from those anticipated in such statements. Accordingly, readers should not place undue reliance on forward-looking statements.
27
Qualified Person
The Technical and Scientific information contained in this news release was reviewed by Mr Colin Ross Hastings, MSc, BSc Geology, M.Aus.I.M.M., Allied’s General Manager Resource Development and the Qualified Person as defined by National Instrument 43-101 of the Canadian Securities Administrators responsible for the development programs. Additionally Mr Hastings has sufficient experience which is relevant to the style of mineralisation and type of deposit under consideration and to the activity which he is undertaking to qualify as a Competent Person as defined in the 2004 Edition of the ÒAustralasian Code for Reporting of Exploration Results, Mineral Resources and Ore ReservesÓ Mr Hastings consents to the inclusion of the information contained in this ASX release in the form and context in which it appears.
The information in this Stock Exchange Announcement that relates to Mineral Exploration results, together with any related assessments and interpretations, have been verified by and approved for release by Mr P R Davies, MSc, BSc, M.Aus.I.M.M., a qualified geologist and full-time employee of the Company. Mr Davies has sufficient experience which is relevant to the style of mineralisation and type of deposit under consideration and to the activity which he is undertaking to qualify as a Competent Person as defined in the 2004 Edition of the ÒAustralasian Code for Reporting of Exploration Results, Mineral Resources and Ore ReservesÓ. Mr Davies consents to the inclusion of the information contained in this ASX release in the form and context in which it appears.
Glossary of Terms used in the Announcement:
A ‘Mineral Resource’ is a concentration or occurrence of material of intrinsic economic interest in or on the Earth’s crust in such form, quality and quantity that there are reasonable prospects for eventual economic extraction. The location, quantity, grade, geological characteristics and continuity of a Mineral Resource are known, estimated or interpreted from specific geological evidence and knowledge. Mineral Resources are sub-divided, in order of increasing geological confidence, into Inferred, Indicated and Measured categories.
An ‘Inferred Mineral Resource’ is that part of a Mineral Resource for which tonnage, grade and mineral content can be estimated with a low level of confidence. It is inferred from geological evidence and assumed but not verified geological and/or grade continuity. It is based on information gathered through appropriate techniques from locations such as outcrops, trenches, pits, workings and drill holes which may be limited or of uncertain quality and reliability.
An ‘Indicated Mineral Resource’ is that part of a Mineral Resource for which tonnage, densities, shape, physical characteristics, grade and mineral content can be estimated with a reasonable level of confidence. It is based on exploration, sampling and testing information gathered through appropriate techniques from locations such as outcrops, trenches, pits, workings and drill holes. The locations are too widely or inappropriately spaced to confirm geological and/or grade continuity but are spaced closely enough for continuity to be assumed.
A ‘Measured Mineral Resource’ is that part of a Mineral Resource for which tonnage, densities, shape, physical characteristics, grade and mineral content can be estimated with a high level of confidence. It is based on detailed and reliable exploration, sampling and testing information gathered through appropriate techniques from locations such as outcrops, trenches, pits, workings and drill holes. The locations are spaced closely enough to confirm geological and grade continuity.
Tonnage - An expression of the amount of material of interest irrespective of the units of measurement (which should be stated when figures are reported)
Grade - Any physical or chemical measurement of the characteristics of the Analysis (Value) material of interest in samples or product
28
Cut off grade - The lowest grade, or quality, of mineralised material that qualifies as economically mineable and available in a given deposit. May be defined on the basis of economic evaluation, or on physical or chemical attributes that define an acceptable product specification.
Mineralisation - Any single mineral or combination of minerals occurring in a mass, or deposit, of economic interest.
Assay – The proportion of a particular metal (eg Au and Ag) in a sample derived by laboratory analytical techniques. Analysis limits of detection for Au is <0.01 g/t. Au assays are determined by a 50gm fire assay and an AAS (Atomic Adsorption Spectrometry) finish. Any interval recorded as being below detection has been recorded in the database as having a grade of half the detection limit, which in this case is 0.005 g/t. The Ag detection limit is 0.2g/t, and is derived from a 0.5g charge Aquaregia digest, with assay via ICP (Induced Coupled Plasma) AES.
Mineralisation types are:
| o | Oxide - extremely weathered material (cyanide leach recoveries > 90%), 0.5 g/t Au cutoff |
| o | Transitional – distinctly weathered material (cyanide leach recoveries 50-90%), 0.5 g/t Au cutoff |
| o | Sulphide - Slightly weathered to fresh material (cyanide leach recoveries generally <50%), 0.5 or 1.0 g/t Au cutoff |
Ounce – 1 troy ounce = 31.10348 grams
Tonnes - Are estimated on a dry basis and defined as a measurement of mass equal to 1000kg which is equivalent to 2204.622 pounds.
Tuff - A rock composed of pyroclastic materials that have been ejected from a volcano. In many instances these fragments are still hot when they land, producing a "welded" rock mass.
Mineral Resource estimate – An estimate of tonnage and grade (mineral content) of a deposit by a variety of techniques including geometrical classical methods and or geostatistical methods.
Mt – Million Tonnes
Moz – Million Ounces
Andesite - A fine-grained, extrusive igneous rock composed mainly of plagioclase with other minerals such as hornblende, pyroxene and biotite.
Ordinary kriging (OK) - is a geostatistical approach to modeling. Instead of weighting nearby data points by some power of their inverted distance, OK relies on the spatial correlation structure of the data to determine the weighting values. This is a more rigorous approach to modeling, as correlation between data points determines the estimated value at an unsampled point.
29
Form 52-109F2
Certification of interim filings - full certificate
I, Mark Caruso, Executive Chairman and Chief Executive Officer of Allied Gold Limited, certify the following:
| 1. | Review: I have reviewed the interim financial statements and interim MD&A (together, the “interim filings”) of Allied Gold Limited (the “issuer”) for the interim period ended September 30, 2010. |
| 2. | No misrepresentations: Based on my knowledge, having exercised reasonable diligence, the interim filings do not contain any untrue statement of a material fact or omit to state a material fact required to be stated or that is necessary to make a statement not misleading in light of the circumstances under which it was made, with respect to the period covered by the interim filings. |
| 3. | Fair presentation: Based on my knowledge, having exercised reasonable diligence, the interim financial statements together with the other financial information included in the interim filings fairly present in all material respects the financial condition, results of operations and cash flows of the issuer, as of the date of and for the periods presented in the interim filings. |
| 4. | Responsibility: The issuer’s other certifying officer and I are responsible for establishing and maintaining disclosure controls and procedures (DC&P) and internal control over financial reporting (ICFR), as those terms are defined in National Instrument 52-109 Certification of Disclosure in Issuers’ Annual and Interim Filings, for the issuer. |
| 5. | Design: Subject to the limitations, if any, described in paragraphs 5.2 and 5.3, the issuer’s other certifying officer and I have, as at the end of the period covered by the interim filings |
| (a) | designed DC&P, or caused it to be designed under our supervision, to provide reasonable assurance that |
| (i) | material information relating to the issuer is made known to us by others, particularly during the period in which the interim filings are being prepared; and |
| (ii) | information required to be disclosed by the issuer in its annual filings, interim filings or other reports filed or submitted by it under securities legislation is recorded, processed, summarized and reported within the time periods specified in securities legislation; and |
| (b) | designed ICFR, or caused it to be designed under our supervision, to provide reasonable assurance regarding the reliability of financial reporting and the preparation of financial statements for external purposes in accordance with the issuer’s GAAP. |
| 5.1 | Control framework: The control framework the issuer’s other certifying officer and I used to design the issuer’s ICFR is the Internal Control -- Integrated Framework (COSO Framework) published by The Committee of Sponsoring Organizations of the Treadway Commission (COSO); |
| 5.2 | ICFR – material weakness relating to design: N/A |
| 5.3 | Limitation on scope of design: N/A |
| 6. | Reporting changes in ICFR: The issuer has disclosed in its interim MD&A any change in the issuer’s ICFR that occurred during the period beginning on July 1, 2010 and ended on September 30, 2010 that has materially affected, or is reasonably likely to materially affect, the issuer’s ICFR. |
Date: October 18 , 2010
[Missing Graphic Reference]
_______________________
Mark Caruso
Executive Chairman and Chief Executive Officer
| [logo] | [Missing Graphic Reference] |
INTERIM CONSOLIDATED FINANCIAL REPORT
FOR THE THREE MONTHS ENDED
September 30, 2010
All amounts are presented in Australian dollars unless otherwise stated
Notice required under National Instrument 51-102, “Continuous Disclosure Obligations” Part 3.3(3)(a).
The unaudited interim consolidated financial statements contained herein have been prepared by the Management of Allied Gold Limited and approved by the Audit Committee of Allied Gold Limited. The unaudited consolidated interim financial statements have not been reviewed by the Company’s auditors.
[logo] | ALLIED GOLD LIMITED INTERIM CONSOLIDATED FINANCIAL REPORT STATEMENT OF COMPREHENSIVE INCOME FOR THE THREE MONTHS ENDED SEPTEMBER 30, 2010 |
Note | 3 months September 30, 2010 $ | 3 months September 30, 2009 $ | |||||||
| Revenue | 20,139,103 | 15,989,561 | |||||||
| Cost of sales | (16,246,342 | ) | (19,574,888 | ) | |||||
| Gross profit | 3,892,761 | (3,585,327 | ) | ||||||
| Unrealised gains on derivatives | - | 53,769 | |||||||
| Corporate expenses | (2,501,306 | ) | (2,523,106 | ) | |||||
| Foreign exchange losses | (486,456 | ) | (294,042 | ) | |||||
| Financial income | 521,671 | 64,961 | |||||||
| Financial costs | (353,892 | ) | (766,556 | ) | |||||
Profit / (loss) from continuing operations | 1,072,778 | (7,050,301 | ) | ||||||
Income tax benefit/(expense) | - | - | |||||||
Loss after tax attributable to members of the parent entity | 1,072,778 | (7,050,301 | ) | ||||||
Other comprehensive income | |||||||||
Foreign currency translation differences | - | (114,135 | ) | ||||||
Effective portion of changes in fair value of cash flow hedges, net of tax (restated) | - | (6,465 | ) | ||||||
Net change in fair value of cash flow hedges transferred to profit or loss, net of tax | 3,017,204 | - | |||||||
Net change in fair value for available for sale financial assets, net of tax | 207,800 | (2,169 | ) | ||||||
Total other comprehensive income | 3,225,004 | (122,769 | ) | ||||||
Total comprehensive income for the year attributable to the owners of Allied Gold Limited | 4,297,782 | (7,173,070 | ) | ||||||
| Basic loss per share (cents) | 0.10 | (1.33) | |||||||
| Diluted loss per share (cents) | 0.10 | (1.33) | |||||||
The accompanying notes are an integral part of these interim consolidated financial statements.
All amounts are presented in Australian dollars unless otherwise stated
[logo] | ALLIED GOLD LIMITED INTERIM CONSOLIDATED FINANCIAL REPORT STATEMENT OF FINANCIAL POSITION AS AT SEPTEMBER 30, 2010 |
Note | September 30, 2010 $ | June 30, 2010 $ | ||||||||||
| CURRENT ASSETS | ||||||||||||
| Cash and cash equivalents | 72,047,976 | 85,525,391 | ||||||||||
| Trade and other receivables | 3,040,779 | 4,160,718 | ||||||||||
| Inventories | 14,049,769 | 11,795,370 | ||||||||||
| Other assets | 2,813,201 | 3,066,675 | ||||||||||
| Total Current Assets | 91,951,725 | 104,548,154 | ||||||||||
| NON-CURRENT ASSETS | ||||||||||||
| Available for sale financial assets | 732,930 | 524,230 | ||||||||||
| Property, plant and equipment | 6 | 348,886,035 | 302,874,641 | |||||||||
| Exploration and evaluation expenditure | 24,335,854 | 23,711,261 | ||||||||||
| Total Non-Current Assets | 373,954,819 | 327,110,132 | ||||||||||
| Total Assets | 465,906,544 | 431,658,286 | ||||||||||
| CURRENT LIABILITIES | ||||||||||||
| Trade and other payables | 38,788,505 | 44,032,012 | ||||||||||
| Borrowings | 9 | 3,931,852 | 4,481,970 | |||||||||
| Provisions | 1,393,700 | 1,008,116 | ||||||||||
| Total Current Liabilities | 44,114,057 | 49,522,098 | ||||||||||
| NON CURRENT LIABILITIES | ||||||||||||
| Borrowings | 9 | 37,343,936 | 1,755,820 | |||||||||
| Provisions | 9,085,618 | 9,315,217 | ||||||||||
| Total Non-Current Liabilities | 46,429,554 | 11,071,037 | ||||||||||
| Total Liabilities | 90,543,611 | 60,593,135 | ||||||||||
| NET ASSETS | 375,362,933 | 371,065,151 | ||||||||||
| EQUITY | ||||||||||||
| Issued capital | 7 | 369,525,183 | 369,525,183 | |||||||||
| Reserves | 20,324,426 | 17,099,422 | ||||||||||
| Accumulated losses | (14,486,676 | ) | (15,559,454 | ) | ||||||||
| TOTAL EQUITY | 375,362,933 | 371,065,151 | ||||||||||
The accompanying notes are an integral part of these interim consolidated financial statements.
All amounts are presented in Australian dollars unless otherwise stated
[logo] | ALLIED GOLD LIMITED INTERIM CONSOLIDATED FINANCIAL REPORT STATEMENT OF CHANGES IN EQUITY FOR THE THREE MONTHS ENDED SEPTEMBER 30, 2010 |
| Group | Note | Issued Capital | Accumulated Losses (restated) | Share- based payments reserve | Foreign exchange translation reserve | Available for sale investments revaluation reserve | Cash Flow Hedging Reserve (Restated) | Total |
| $ | $ | $ | $ | $ | $ | $ | ||
Balance at July 1 2009 as reported in the 2009 financial statements | 173,098,363 | (24,257,420) | 9,776,417 | (644,628) | 136,389 | (8,068,638) | 150,040,483 | |
| Adjustment on change in accounting policy | - | (1,530,849) | - | - | - | (1,634,441) | (3,165,290) | |
| Restated | 173,098,363 | (25,788,269) | 9,776,417 | (644,628) | 136,389 | (9,703,079) | 146,875,193 | |
Total comprehensive income for the period as reported in the 2009 financial statements | ||||||||
Loss for the period | - | (5,972,342) | - | - | - | - | (5,972,342) | |
| Adjustment on change in accounting policy | - | (1,077,959) | - | - | - | - | (1,077,959) | |
Restated loss for period | - | (7,050,301) | - | - | - | - | (7,050,301) | |
Other comprehensive income | ||||||||
Foreign currency translation differences | - | - | - | (114,135) | - | - | (114,135) | |
Changes in fair value of cash flow hedges | - | - | - | - | (2,324,920) | (2,324,920) | ||
Net change in fair value for available for sale financial assets, net of tax | - | - | - | - | (2,169) | - | (2,169) | |
| Total other comprehensive income | - | - | - | (114,135) | (2,169) | (2,324,920) | (2,441,224) | |
| Adjustment on change in accounting policy | - | - | - | - | - | 2,318,455 | 2,318,455 | |
| Restated total other comprehensive income | - | - | - | (114,135) | (2,169) | (6,465) | (122,769) | |
Total comprehensive income for the period | - | (7,050,301) | - | (114,135) | (2,169) | (6,465) | (7,173,070) | |
| Transactions with owners, recorded directly in equity | ||||||||
| Contributions by and distributions to owners | - | - | - | - | - | - | - | |
Balance at September 30, 2009 | 173,098,363 | (32,838,570) | 9,776,417 | (758,763) | 134,220 | (9,709,544) | 139,702,123 |
The accompanying notes are an integral part of these interim consolidated financial statements.
All amounts are presented in Australian dollars unless otherwise stated
[logo] | ALLIED GOLD LIMITED INTERIM CONSOLIDATED FINANCIAL REPORT STATEMENT OF CHANGES IN EQUITY FOR THE THREE MONTHS ENDED SEPTEMBER 30, 2010 |
| Group | Note | Issued Capital | Accumulated Losses | Share based payments reserve | Foreign exchange translation reserve | Available for sale investments revaluation reserve | Cash Flow Hedging Reserve (restated) | Total |
| $ | $ | $ | $ | $ | $ | $ | ||
Balance at July 1 2010 | 369,525,183 | (15,559,454) | 16,604,976 | 5,427,787 | 503,997 | (5,437,338) | 371,065,151 | |
| Total comprehensive income for the period as reported in the 2009 financial statements | ||||||||
| Profit for the period | - | 1,072,778 | - | - | - | - | 1,072,778 | |
| Other comprehensive income | ||||||||
| Foreign currency translation differences | - | - | - | - | - | - | - | |
| Effective portion of changes in fair value of cash flow hedges, net of tax | - | - | - | - | - | - | - | |
| Net change in fair value of cash flow hedges transferred to profit or loss, net of tax | - | - | - | - | - | 3,017,204 | 3,017,204 | |
| Net change in fair value for available for sale financial assets, net of tax | - | - | - | - | 207,800 | - | 207,800 | |
| Total other comprehensive income | - | - | - | - | 207,800 | 3,017,204 | 3,225,004 | |
| Total comprehensive income for the period | - | 1,072,778 | - | - | 207,800 | 3,017,204 | 4,297,782 | |
| Transactions with owners, recorded directly in equity | ||||||||
| Contributions by and distributions to owners | ||||||||
| Total transactions with owners | - | - | - | - | - | - | - | |
| Balance at September 30, 2010 | 369,525,183 | (14,486,676) | 16,604,976 | 5,427,787 | 711,797 | (2,420,134) | 375,362,933 |
The accompanying notes are an integral part of these interim consolidated financial statements.
All amounts are presented in Australian dollars unless otherwise stated
[logo] | ALLIED GOLD LIMITED INTERIM CONSOLIDATED FINANCIAL REPORT CONSOLIDATED CASHFLOW STATEMENT FOR THE THREE MONTHS ENDED SEPTEMBER 30, 2010 |
Note | 3 months September 30, 2010 $ | 3 months September 30, 2009 $ | |||||||
| CASH FLOWS FROM OPERATING ACTIVITIES | |||||||||
| Receipts from customers | 24,275,346 | 13,627,270 | |||||||
| Payments to suppliers & employees | (19,318,155 | ) | (14,667,866 | ) | |||||
| Interest received | 521,671 | - | |||||||
| Interest paid | (53,883 | ) | (284,843 | ) | |||||
| Net cash generated from / (used in) operating activities | 5,424,979 | (1,325,439 | ) | ||||||
| CASH FLOWS FROM INVESTING ACTIVITIES | |||||||||
| Purchase of plant & equipment | (54,117,063 | ) | (4,365,913 | ) | |||||
| Exploration and evaluation expenditure | (1,447,892 | ) | (1,531,952 | ) | |||||
Net cash used in investing activities | (55,564,955 | ) | (5,897,865 | ) | |||||
| CASH FLOWS FROM FINANCING ACTIVTIES | |||||||||
| Finance lease payments | (485,090 | ) | (1,101,747 | ) | |||||
| Proceeds from borrowings | 38,410,887 | 3,560,403 | |||||||
| Repayments of borrowings | (760,201 | ) | - | ||||||
Net cash generated from / (used in ) financing activities | 37,165,596 | 2,458,656 | |||||||
Net increase / (decrease) in cash held | (12,974,380 | ) | (4,764,648 | ) | |||||
Cash at beginning of the period | 85,525,391 | 20,529,979 | |||||||
Effects of exchange rate changes on the balance of cash and cash equivalents | (503,035 | ) | (64,971 | ) | |||||
Cash and cash equivalents at end of the period | 72,047,976 | 15,700,360 | |||||||
The accompanying notes are an integral part of these interim consolidated financial statements.
All amounts are presented in Australian dollars unless otherwise stated
[logo] | ALLIED GOLD LIMITED INTERIM CONSOLIDATED FINANCIAL REPORT FOR THE THREE MONTHS ENDED SEPTEMBER 30, 2010 |
NOTES TO THE INTERIM CONSOLIDATED FINANCIAL REPORT
1. Reporting entity
Allied Gold Limited (“the Company”) is a company incorporated in Australia and limited by shares, which are publicly traded on the Australian Stock Exchange, the Toronto Stock Exchange and the AIM, a market operated by the London Stock Exchange. The interim consolidated financial report for the three months ended September 30, 2010 comprise the Company and its controlled entities (together referred to as “the Group”).
The consolidated annual report of the Group as at and for the year ended June 30, 2010 is available upon request from the Company’s registered office at Unit B9, 431 Roberts Road, Subiaco WA 6008.
2. Statement of compliance
The interim consolidated financial report is a general-purpose financial report, which has been prepared in accordance with the requirements of the Corporations Act 2001 and AASB 134 Interim Financial Reporting. The interim consolidated financial report complies with Australian Accounting Standards, which include Australian equivalents to International Financial Reporting Standards (‘AIFRS’) as they pertain to interim financial reports. The group financial statements of Allied Gold Limited also comply with International Financial Reporting Standards (“IFRS”) as issued by the International Accounting Standards Board (“IASB”).
The interim consolidated financial report does not include all of the information required for a full annual financial report and should be read in conjunction with the annual financial report of the Group as at and for the year ended June 30, 2010 and should be considered together with any public announcements made by the Company during the three months ended September 30, 2010 in accordance with the continuous disclosure requirements applicable in the jurisdictions in which the Company’s shares are traded.
3. Significant accounting policies
The significant accounting policies applied by the Group in this interim consolidated financial report are the same as those applied by the Group in its consolidated financial report as at and for the year ended June 30, 2011 with the exception of the changes in accounting policies noted below that arose as a consequence of the application of changes in AIFRS.
| · | AASB 2009-8 Amendments to Australian Accounting Standards – Group Cash-Settled Share Based Payment Transactions [AASB 2] The amendments made by the AASB to AASB 2 confirm that an entity receiving goods or services in a group share based payment arrangement must recognise an expense for those goods or services regardless of which entity in the group settles the transaction or whether the transaction is settled in shares or cash. They also clarify how the group share-based payment arrangement should be measured, that is, whether it is measured as an equity- or a cash-settled transaction. The group has applied these amendments retrospectively for the financial reporting period commencing on 1 July 2010. There was no impact on this interim consolidated financial report. |
| · | AASB Interpretation 19 Extinguishing financial liabilities with equity instruments and AASB 2009-13 Amendments to Australian Accounting Standards arising from Interpretation19 (effective from 1 July 2010) AASB Interpretation 19 clarifies the accounting when an entity renegotiates the terms of its debt with the result that the liability is extinguished by the debtor issuing its own equity instruments to the creditor (debt for equity swap). It requires a gain or loss to be recognised in profit or loss which is measured as the difference between the carrying amount of the financial liability and the fair value of the equity instruments issued. The group has applied these amendments retrospectively for the financial reporting period commencing on 1 July 2010. There was no impact on this interim consolidated financial report. |
[logo] | ALLIED GOLD LIMITED INTERIM CONSOLIDATED FINANCIAL REPORT FOR THE THREE MONTHS ENDED SEPTEMBER 30, 2010 |
NOTES TO THE INTERIM CONSOLIDATED FINANCIAL REPORT
3. Significant accounting policies (continued)
| · | Accounting for cash flow hedges. In its consolidated financial report for the year ended June 30, 2010 the Group changed its accounting policies for cash flow hedges to comply with the requirements of AASB 2008-8 Amendment to IAS 39 Financial Instruments: Recognition and Measurement. This required the Group to amend its accounting policy for cash flow hedges to exclude time value from the one sided hedge risk when designating options as hedges. This has had the effect of requiring the time value component of the mark to market value of options forming part of a cash flow hedge to be recorded directly in the statement of comprehensive income. AASB2008-8 required the restatement of comparative information. Note 3(j) to the consolidated financial statements for the year ended June 30, 2010 provided an analysis of the retrospective impact of the change in the accounting policy. The impact of the change in accounting policy on previously reported amounts for the three months ended September 30, 2009 is summarised below: |
The Statement of Changes in Equity for the three months ended September 30, 2009 changed as follows:
Notes | July 1 2009 $ | Increase / (Decrease) $ | July 1 2009 (restated) $ | ||||||||||
Accumulated losses | (24,257,420\0 | (1,530,849) | (25,788,269) | ||||||||||
Reserves – cash flow hedging reserve | (8,068,638\0 | (1,634,441) | (9,703,079) | ||||||||||
Profit for the three months ended September 30, 2009 changed as follows:
September 30, 2009 $ | Increase / (Decrease) $ | September 30, 2009 (restated) $ | ||||||||||
| Income statement (extract) | ||||||||||||
| Unrealised losses on derivatives | 1,131,728 | (1,077,959) | 53,769 | |||||||||
| Loss after tax attributable to members of Allied Gold Limited | (5,972,342) | (1,077,959) | (7,050,301) | |||||||||
| Changes in the fair value of cash flow hedges - gross | (2,324,920) | 2,318,455) | (6,465) | |||||||||
| Total comprehensive loss for the year attributable to the owners of Allied Gold Limited | (8,413,566) | 1,240,496) | (7,173,070) | |||||||||
| Basic earnings per share | (1.26) | (0.07) | (1.33) | |||||||||
| Diluted earnings per share | (1.26) | (0.07) | (1.33) | |||||||||
[logo] | ALLIED GOLD LIMITED INTERIM CONSOLIDATED FINANCIAL REPORT FOR THE THREE MONTHS ENDED SEPTEMBER 30, 2010 |
NOTES TO THE INTERIM CONSOLIDATED FINANCIAL REPORT (continued)
4. Estimates
The preparation of the interim consolidated financial report in accordance with Australian Accounting Standards requires management to make judgements, estimates and assumptions that affect the application of policies and reported amounts of assets, liabilities, income and expenses.
These estimates and associated assumptions are based on historical experience and various other factors that are believed to be reasonable under the circumstances, the results of which form the basis of making the judgements about the carrying values of assets and liabilities that are not readily apparent from other sources. Actual results may differ from these estimates.
In preparing this interim consolidated financial report, the significant judgements made by management in applying the Group’s accounting policies and the key sources of estimation uncertainty were the same as those that applied to the consolidated annual financial report as at and for the year ended June 30, 2010.
5. Segment reporting
(a) Description of Segments
Management has determined the operating segments based on reports reviewed by the Executive Chairman and the Chief Financial Officer that are used to monitor performance and make strategic decisions. The business is considered from both a geographic and functional perspective and has identified four reportable segments.
Papua New Guinea consists of mining and processing and mineral exploration activities undertaken at the Simberi project. Solomon Islands consists of mineral exploration activities only as the project is not currently in production. The performance of the two geographic sectors is monitored separately.
The segment information presented to the Executive Chairman and the Chief Financial Officer does not include reporting of assets and liabilities or cash flows by segment.
Comparative segment information has been recognised in conformity with the requirements of AASB 8 Operating Segments. In the prior period the segments related to the Solomon Islands were not reported on as these segments were acquired as part of the acquisition of Australian Solomons Gold Limited that was effective from November 24, 2010.
[logo] | ALLIED GOLD LIMITED INTERIM CONSOLIDATED FINANCIAL REPORT FOR THE THREE MONTHS ENDED SEPTEMBER 30, 2010 |
NOTES TO THE INTERIM CONSOLIDATED FINANCIAL REPORT (continued)
5. Segment reporting (continued)
(b) Segment Information provided to the Executive Chairman and the Chief Financial Officer and the Board of Directors
| 2010 | Papua New Guinea | Solomon Islands | Group | ||||||
| Mining and Processing | Mineral Exploration | Total | Mining and Processing | Mineral Exploration | Total | Mining and Processing | Mineral Exploration | Total | |
| $ | $ | $ | $ | $ | $ | $ | $ | $ | |
| Revenue | |||||||||
| Sales to external customers | 20,139,103 | - | 20,139,103 | - | - | - | 20,139,103 | - | 20,139,103 |
| Result | |||||||||
| Segment contribution | 3,892,761 | (2,297,541) | 1,595,220 | (6,030,271) | - | (6,030,271) | (2,137,510) | (2,297,541) | (4,435,051) |
| 2009 | Papua New Guinea | ||
| Mining and Processing | Mineral Exploration | Total | |
| $ | $ | $ | |
| Revenue | |||
| Sales to external customers | 15,989,561 | - | 15,989,561 |
| Result | |||
| Segment contribution | (3,585,327) | (1,531,952) | (5,117,279) |
The Solomon Islands segments are not presented in the 2009 segment information as those segments were acquired pursuant to the acquisition of Australian Solomons Gold Limited during the current period (refer note 30).
[logo] | ALLIED GOLD LIMITED INTERIM CONSOLIDATED FINANCIAL REPORT FOR THE THREE MONTHS ENDED SEPTEMBER 30, 2010 |
NOTES TO THE CONDENSED INTERIM CONSOLIDATED FINANCIAL REPORT (continued)
5. Segment reporting (continued)
Management assesses the performance of the operating segments based on a measure of contribution. This measure excludes items such as the effects of equity settled share based payments, and unrealised gains / (losses) on financial instruments. Interest income and expenditure are not allocated to segments, nor are corporate expenses as these activities are centralised.
Three months ended September 30 | ||||
| 2010 | 2009 | |||
| Segment contribution | (4,435,051) | (5,117,279) | ||
| Capitalised expenditure | 8,327,812 | 1,531,952 | ||
| Unrealised loss on derivatives | - | 53,769 | ||
| Corporate expenses | (2,501,306) | (2,523,106) | ||
| Foreign exchange gain /(loss) | (486,456) | (294,042) | ||
| Financial income | 521,671 | 64,961 | ||
| Financial costs | (353,892) | (766,556) | ||
| Profit / (Loss) from continuing operations | 1,072,778 | (7,050,301) | ||
6. Property plant and equipment
During the three months ended September 30, 2010, the Group acquired assets with a cost of $49,940,362 (three months ended September 30, 2009 : $4,365,913).
The acquired assets included assets capitalised under finance leases of $nil (three months ended September 30, 2009:$ 3,560,403).
7. Contributed equity
| (a) | Ordinary shares |
| 2010 | 2009 | 2010 | 2009 | ||||
Number of shares | Number of shares | $ | $ | ||||
| Ordinary shares | 1,040,132,142 | 472,643,276 | 369,525,183 | 173,098,363 | |||
| Balance at July 1 | 1,040,132,142 | 472,643,276 | 369,525,183 | 173,098,363 | |||
| Shares issued through capital raising | - | - | - | - | |||
| 369,525,183 | 173,098,363 | ||||||
| Costs of capital raising | - | - | |||||
| Balance at September 30 | 1,040,132,142 | 472,643,276 | 369,525,183 | 173,098,363 |
Ordinary shares entitle the holder to one vote per share and to participate in dividends and proceeds on winding up of the company in proportion to the number of and amounts paid on the shares held.
NOTES TO THE CONDENSED INTERIM CONSOLIDATED FINANCIAL REPORT (continued)
7. Contributed equity (continued)
(b) Options
There were no options granted or exercised during the period. As at September 30, 2010 the following options were outstanding:
| Exercise Price | Maturity | Outstanding at July 1, 2010 | Options issued | Options expired or cancelled | Options exercised | Outstanding at September 30, 2010 |
| $0.80 options | 31/12/2010 | 1,000,000 | - | - | - | 1,000,000 |
| $1 options | 31/12/2010 | 1,000,000 | - | - | - | 1,000,000 |
| $1.25 options | 31/12/2010 | 1,000,000 | - | - | - | 1,000,000 |
| $1.50 options | 31/12/2010 | 1,000,000 | - | - | - | 1,000,000 |
| $2 options | 31/12/2010 | 1,000,000 | - | - | - | 1,000,000 |
$0.35 options(i) | 31/10/2011 | 30,012,500 | - | - | - | 30,012,500 |
| $0.31 Options | 31/12/2010 | 1,699,427 | - | - | - | 1,699,427 |
$0.35 Options(ii) | 31/12/2011 | 1,500,000 | - | - | - | 1,500,000 |
$0.50 Options(iii) | 31/12/2013 | 37,500,000 | - | - | - | 37,500,000 |
$0.50 options(iv) | 31/12/2013 | 1,175,000 | - | - | - | 1,175,000 |
| 76,886,927 | - | - | - | 76,886,927 | ||
| (i) | Of the 30,012,500 options expiring 31 October 2011, 9,375,000 vest upon the share price reaching $A0.70. |
| (ii) | Of the 1,500,000 options issued on 11 November 2009 and expiring 31 December 2011, 500,000 vest upon the share price reaching $A0.70. |
| (iii) | Of the 37,500,000 options issued on 11 November 2009 expiring 31 December 2013, 15,000,000 vest on 7 December 2010; 15,000,000 vest upon the share price reaching $A0.70 and 7,500,000 vest upon Allied Gold producing 100,000 ounces of gold in the period 1 October 2009 to 31 December 2010. |
Each option is convertible into one ordinary share in the company when exercised. Options do not participate in dividends and do not give holders voting rights.
8. Share based payments
In 2006, the group established a share option program that entitles key management personnel and senior employees to purchase shares in the entity. The terms and conditions of the share option programme are disclosed in the consolidated financial report as at and for the year ended June 30, 2010. The Group uses the binomial option pricing methodology.
The Group did not enter into any share based payments in the three months ended September 30, 2010.
NOTES TO THE CONDENSED INTERIM CONSOLIDATED FINANCIAL REPORT (continued)
9. Loans and borrowings
The following loans and borrowings were drawn down and repaid during the three months ended September 30, 2010:
Three months to September 30 | ||||||||
| 2010 | 2009 | |||||||
| $ | $ | |||||||
| Balance at July 1 | 6,237,790 | 5,940,368 | ||||||
New Issues | ||||||||
| Secured bank loan (USD) | 38,410,886 | - | ||||||
| Finance lease liabilities (PGK and AUD) | - | 3,560,403 | ||||||
| Effects of foreign exchange | (2,205,236 | ) | 13,927 | |||||
| Accrued interest – secured bank loan | 279,688 | - | ||||||
Repayments | ||||||||
| Secured bank loan (USD) | - | - | ||||||
| Finance lease liabilities (PGK and AUD) | (1,167,652 | ) | (1,101,747 | ) | ||||
Balance at September 30 | 41,455,476 | 8,412,951 | ||||||
The increase in secured bank loans during the three months ended September 30, 2010 represents the draw down of USD35 million under a facility provided to the Group by the International Finance Corporation Limited. The facility is secured by a fixed and floating charge over the assets of Gold Ridge Mining Limited and by a guarantee provided by Allied Gold Limited. No payments of principal or interest are due under the facility until November 2011.
10. Related party transactions
Arrangements with related parties continue to be in place. The nature and terms of transactions with related parties are consistent with those described in the consolidated financial report for the year ended June 30, 2008. Related party transactions in the three months ended September, 2010 that had not been previously disclosed by the Company amounted to payments of $62,278 to Mine Site Constructions Pty Ltd ( three months ended September 30, 2009 : lease payments totalling $2,480,994 paid to Mine Site Constructions Pty Ltd).
11. Commitments and contingent liabilities
(a) Capital commitments
Capital expenditure contracted for at the reporting date but not recognised in liabilities is as follows:
2010 $ | 2009 $ | ||
| Capital expenditure for redevelopment of Gold Ridge Project | 35,283,622 | - |
NOTES TO THE CONDENSED INTERIM CONSOLIDATED FINANCIAL REPORT (continued)
11. Commitments and contingent liabilities (continued)
(b) Legal action
In December 2009, Simberi Gold Company initiated legal proceedings against Intermet Engineers (Pty) Ltd (“Intermet”) and a director of Intermet in respect of breaches of contract entered into between the controlled entity and Intermet whereby Intermet were contracted to design, procure and manage the construction of gold processing and related facilities for the Simberi Oxide Gold Project. Under the legal action, the controlled entity is claiming damages of not less than $40 million.
Intermet have advised that they will defend the claim and have indicated that they will make a counter claim for an amount of $1.2 million for outstanding monies due from the controlled entity under the contract. This amount has been fully accrued as a liability by the controlled entity pending the outcome of the litigation.
12. Subsequent events
No matter or circumstance has arisen since September 30, 2010 that has significantly affected, or may significantly affect:
| a. | the Group’s operations in future financial periods or |
| b. | the results of those operations in future financial periods, or |
c. | the Group’s state of affairs in future financial periods. |
Form 52-109F2
Certification of interim filings - full certificate
I, Frank Terranova, Chief Financial Officer of Allied Gold Limited, certify the following:
| 1. | Review: I have reviewed the interim financial statements and interim MD&A (together, the “interim filings”) of Allied Gold Limited (the “issuer”) for the interim period ended September 30, 2010. |
| 2. | No misrepresentations: Based on my knowledge, having exercised reasonable diligence, the interim filings do not contain any untrue statement of a material fact or omit to state a material fact required to be stated or that is necessary to make a statement not misleading in light of the circumstances under which it was made, with respect to the period covered by the interim filings. |
| 3. | Fair presentation: Based on my knowledge, having exercised reasonable diligence, the interim financial statements together with the other financial information included in the interim filings fairly present in all material respects the financial condition, results of operations and cash flows of the issuer, as of the date of and for the periods presented in the interim filings. |
| 4. | Responsibility: The issuer’s other certifying officer and I are responsible for establishing and maintaining disclosure controls and procedures (DC&P) and internal control over financial reporting (ICFR), as those terms are defined in National Instrument 52-109 Certification of Disclosure in Issuers’ Annual and Interim Filings, for the issuer. |
| 5. | Design: Subject to the limitations, if any, described in paragraphs 5.2 and 5.3, the issuer’s other certifying officer and I have, as at the end of the period covered by the interim filings |
| (a) | designed DC&P, or caused it to be designed under our supervision, to provide reasonable assurance that |
| (i) | material information relating to the issuer is made known to us by others, particularly during the period in which the interim filings are being prepared; and |
| (ii) | information required to be disclosed by the issuer in its annual filings, interim filings or other reports filed or submitted by it under securities legislation is recorded, processed, summarized and reported within the time periods specified in securities legislation; and |
| (b) | designed ICFR, or caused it to be designed under our supervision, to provide reasonable assurance regarding the reliability of financial reporting and the preparation of financial statements for external purposes in accordance with the issuer’s GAAP. |
| 5.1 | Control framework: The control framework the issuer’s other certifying officer and I used to design the issuer’s ICFR is the Internal Control -- Integrated Framework (COSO Framework) published by The Committee of Sponsoring Organizations of the Treadway Commission (COSO); |
| 5.2 | ICFR – material weakness relating to design: N/A |
| 5.3 | Limitation on scope of design: N/A |
| 6. | Reporting changes in ICFR: The issuer has disclosed in its interim MD&A any change in the issuer’s ICFR that occurred during the period beginning on July 1, 2010 and ended on September 30, 2010 that has materially affected, or is reasonably likely to materially affect, the issuer’s ICFR. |
Date: October 18 , 2010
[signature]
_______________________
Frank Terranova
Chief Financial Officer