UNITED STATES
SECURITIES AND EXCHANGE COMMISSION
Washington, D.C. 20549
_______________________________________________
FORM 20-F
(Mark One)
| o | REGISTRATION STATEMENT PURSUANT TO SECTION 12(b) OR (g) OF THE SECURITIES EXCHANGE ACT OF 1934 | |
| | OR | |
| x | ANNUAL REPORT PURSUANT TO SECTION 13 OR 15(d) OF THE SECURITIES EXCHANGE ACT OF 1934 | |
| | For the fiscal year ended December 31, 2014 | |
| | OR | |
| o | TRANSITION REPORT PURSUANT TO SECTION 13 OR 15(d) OF THE SECURITIES EXCHANGE ACT OF 1934 | |
| | OR | |
| o | SHELL COMPANY REPORT PURSUANT TO SECTION 13 OR 15(d) OF THE SECURITIES EXCHANGE ACT OF 1934 | |
Commission file number: 001-10306
THE ROYAL BANK OF SCOTLAND GROUP plc
(Exact name of Registrant as specified in its charter)
United Kingdom
(Jurisdiction of incorporation)
RBS Gogarburn, PO Box 1000, Edinburgh EH12 1HQ, United Kingdom
(Address of principal executive offices)
Aileen Taylor, Chief Governance Officer and Board Counsel, Tel: +44 (0) 131 626 4099, Fax: +44 (0) 131 626 3081
PO Box 1000, Gogarburn, Edinburgh EH12 1HQ
(Name, Telephone, E-mail and/or Facsimile number and Address of Company Contact Person)
Securities registered or to be registered pursuant to Section 12(b) of the Act:
| Title of each class | | Name of each exchange on which registered |
| | | |
| American Depositary Shares, each representing 2 ordinary shares, nominal value £1 per share | | New York Stock Exchange |
| Ordinary shares, nominal value £1 per share | | |
| American Depositary Shares Series F, H, L, M, N, P, Q, R, S, T and U each representing one Non-Cumulative Dollar Preference Share, Series F, H, L, M, N, P, Q, R, S, T and U respectively | | New York Stock Exchange* |
| Dollar Perpetual Regulatory Tier 1 Securities | | New York Stock Exchange |
| 3.950% Senior Notes due 2015 | | New York Stock Exchange |
| 2.550% Senior Notes due 2015 | | New York Stock Exchange |
| 4.375% Senior Notes due 2016 | | New York Stock Exchange |
| Floating Rate Senior Notes due 2017 | | New York Stock Exchange |
| 1.875% Senior Notes due 2017 | | New York Stock Exchange |
| 4.70% Subordinated Notes due 2018 | | New York Stock Exchange |
| 5.625% Senior Notes due 2020 | | New York Stock Exchange |
| 6.125% Senior Notes due 2021 | | New York Stock Exchange |
| 6.125% Subordinated Tier 2 Notes due 2022 | | New York Stock Exchange |
| 6.000% Subordinated Tier 2 Notes due 2023 | | New York Stock Exchange |
| 6.100% Subordinated Tier 2 Notes due 2023 | | New York Stock Exchange |
| 5.125% Subordinated Tier 2 Notes due 2024 | | New York Stock Exchange |
| Structured HybrId Equity Linked Securities (SHIELDS) due January 16 2014 linked to the S&P 500 Index | | NYSE MKT |
| Leveraged CPI Linked Securities due January 13, 2020 | | NYSE MKT |
| RBS US Large Cap TrendpilotTM Exchange Traded Notes due December 7, 2040 | | NYSE Arca |
| RBS US Mid Cap TrendpilotTM Exchange Traded Notes due January 25, 2041 | | NYSE Arca |
| RBS Gold TrendpilotTM Exchange Traded Notes due February 15, 2041 | | NYSE Arca |
| RBS Oil TrendpilotTM Exchange Traded Notes due September 13, 2041 | | NYSE Arca |
| RBS Global Big Pharma Exchange Traded Notes due October 25, 2041 | | NYSE Arca |
| RBS NASDAQ-100® TrendpilotTM Exchange Traded Notes due December 13, 2041 | | NYSE Arca |
| RBS China TrendpilotTM Exchange Traded Notes due April 18, 2042 | | NYSE Arca |
| RBS US Large Cap Alternator Exchange Traded NotesTM due September 5, 2042 | | NYSE Arca |
| RBS Rogers Enhanced Commodity Index Exchange Traded Notes due October 29, 2042 | | NYSE Arca |
| RBS Rogers Enhanced Agriculture Exchange Traded Notes due October 29, 2042 | | NYSE Arca |
| RBS Rogers Enhanced Energy Exchange Traded Notes due October 29, 2042 | | NYSE Arca |
| RBS Rogers Enhanced Precious Metals Exchange Traded Notes due October 29, 2042 | | NYSE Arca |
| RBS Rogers Enhanced Industrial Metals Exchange Traded Notes due October 29, 2042 | | NYSE Arca |
* Not for trading, but only in connection with the registration of American Depositary Shares representing such ordinary shares pursuant to the requirements of the Securities and Exchange Commission.
Securities registered or to be registered pursuant to Section 12(g) of the Act:
None
_______________
Securities for which there is a reporting obligation pursuant to Section 15(d) of the Act:
None
_______________
Indicate the number of outstanding shares of each of the issuer’s classes of capital or common stock as of December 31, 2014, the close of the period covered by the annual report:
| (Title of each class) | | (Number of outstanding shares) |
| Ordinary shares of £1 each | | 6,365,895,896 |
| B Shares | | 51,000,000,000 |
| Dividend Access Share | | 1 |
| 11% cumulative preference shares | | 500,000 |
| 5½% cumulative preference shares | | 400,000 |
| Non-cumulative dollar preference shares, Series F, H and L to U | | 209,609,154 |
| Non-cumulative convertible dollar preference shares, Series 1 | | 64,772 |
| Non-cumulative euro preference shares, Series 1 to 3 | | 2,044,418 |
| Non-cumulative convertible sterling preference shares, Series 1 | | 14,866 |
| Non-cumulative sterling preference shares, Series 1 | | 54,442 |
Indicate by check mark if the registrant is a well-known seasoned issuer, as defined in Rule 405 of the Securities Act.
If this report is an annual or transition report, indicate by check mark if the registrant is not required to file reports pursuant to Section 13 or 15(d) of the Securities Exchange Act of 1934.
Note – Checking the box above will not relieve any registrant required to file reports pursuant to Section 13 or 15(d) of the Securities Exchange Act of 1934 from their obligations under those Sections.
Indicate by check mark whether the registrant (1) has filed all reports required to be filed by Section 13 or 15(d) of the Securities Exchange Act of 1934 during the preceding 12 months (or for such shorter period that the registrant was required to file such reports), and (2) has been subject to such filing requirements for the past 90 days.
Indicate by check mark whether the registrant has submitted electronically and posted on its corporate Web site, if any, every Interactive Data File required to be submitted and posted pursuant to Rule 405 of Regulation S-T (§232.405 of this chapter) during the preceding 12 months (or for such shorter period that the registrant was required to submit and post such files).
Indicate by check mark whether the registrant is a large accelerated filer, an accelerated filer, or a non-accelerated filer. See definition of “accelerated filer and large accelerated filer” in Rule 12b-2 of the Exchange Act. (Check one):
Large accelerated filer x | Accelerated filer o | Non-Accelerated filer o |
Indicate by check mark which basis of accounting the registrant has used to prepare the financial statements included in this filing:
oU.S. GAAP
x International Financial Reporting Standards as issued by the International Accounting Standards Board
oOther
If “Other” has been checked in response to the previous question, indicate by check mark which financial statement item the registrant has elected to follow.
If this is an annual report, indicate by check mark whether the registrant is a shell company (as defined in Rule 12b-2 of the Exchange Act).
SEC Form 20-F cross reference guide
| Item | Item Caption | Pages |
| | | |
| PART I | |
| 1 | Identity of Directors, Senior Management, | Not applicable |
| | Advisers | |
| | | |
| 2 | Offer Statistics and Expected Timetable | Not applicable |
| | | |
| 3 | Key Information | |
| | Selected financial data | 113-114, 409-412, 450-451, 460, 490-492 |
| | Capitalisation and indebtedness | Not applicable |
| | Reasons for the offer and use of proceeds | Not applicable |
| | Risk factors | 110-112, 466-484 |
| | | |
| 4 | Information on the Company | 117-121, 161, 212-330, 384-387, 391-392, 397-398, 450-460, 518 |
| | History and development of the Company | 3, 99-104, 107, 399-401, 421,462, 504 |
| | Business overview | 13, 21, 99-100, 107-112, 127-160, 184-186, 188, 434-439, 461 |
| -464 | | |
| | Organisational structure | 99, 107-108, 434, 461, Exhibit 8.1 |
| | Property, plant and equipment | 397-398, 461 |
| | | |
4A | Unresolved Staff Comments | Not applicable |
| | | |
| 5 | Operating and Financial Review and Prospects | |
| | Operating results | 15-33, 109, 113-161,184-186,188, 389-390, 434-439, 460 |
| | Liquidity and capital resources | 160-161, 164-179, 191-226, 270-293, 339, 366-370, 389-392, 399-401, 406-408, 410-412, 418-421, 432-433, 450-451,460 |
| | Research and development, patents, licences etc | Not applicable |
| | Trend information | 9-24, 107-108, 466-485 |
| | Off balance sheet arrangements | 415-416, 420-421 |
| | Contractual obligations | 212-226, 231, 384-386, 413-414, 417, 420-421 |
| | | |
| | | |
| 6 | Directors, Senior Management and Employees | |
| | Directors and senior management | 47-52 |
| | Compensation | 74-95, 354-363, 440 |
| | Board practices | 46-50, 51-55, 58-62, 74-75, 102-103 |
| | Employees | 100, 123-124, 129, 355-357 |
| | Share ownership | 82-84, 87-89, 103, 355-357 |
| | | |
| 7 | Major Shareholders and Related Party Transactions | |
| | Major shareholders | 104, 462 |
| | Related party transactions | 440, 441 |
| | Interests of experts and counsel | Not applicable |
| | | |
| 8 | Financial Information | |
| | Consolidated statements and other financial information | 99, 331-449, 491 |
| | Significant changes | |
| | | |
| 9 | The Offer and Listing | |
| | Offer and listing details | 490 |
| | Plan of distribution | Not applicable |
| | Markets | 98, 489 |
| | Selling shareholders | Not applicable |
| | Dilution | Not applicable |
| | Expenses of the issue | Not applicable |
| | | |
| 10 | Additional Information | |
| | Share capital | Not applicable |
| | Memorandum and articles of association | 495-504 |
| | Material contracts | 462-464 |
| | Exchange controls | 495 |
| | Taxation | 492-495 |
| | Dividends and paying agents | Not applicable |
| | Statement of experts | Not applicable |
| | Documents on display | 504 |
| | Subsidiary information | Not applicable |
| | | |
| 11 | Quantitative and Qualitative Disclosure | 165-330, 297-298, 300-318, 366-387, 389-390 |
| | about Market Risk | |
| | | |
| 12 | Description of Securities other than Equity Securities | 465 |
| Item | Item Caption | Pages |
| | | |
| PART II | |
| 13 | Defaults, Dividend Arrearages and Delinquencies | Not applicable |
| | | |
| 14 | Material Modifications to the Rights of Security | |
| | Holders and Use of Proceeds | Not applicable |
| | | |
| 15 | Controls and Procedures | 60-62, 96-98, 332 |
| | | |
| 16 | [Reserved] | |
| 16 | A Audit Committee financial expert | 58-62, 98 |
| 16 | B Code of ethics | 101 |
| 16 | C Principal Accountant Fees and services | 58-62, 363 |
| 16 | D Exemptions from the Listing Standards | Not applicable |
| | for Audit Committees | |
| 16 | E Purchases of Equity Securities by the | Not applicable |
| | Issuer and Affiliated Purchasers | |
| 16 | F Change in Registrant’s Certifying Accountant | Not applicable |
| 16 | G Corporate Governance | 51-55 |
| 16 | H Mine Safety Disclosure | Not applicable |
| | | |
| | | |
| PART III | | |
| 17 | Financial Statements | Not applicable |
| | | |
| 18 | Financial Statements | 331-448 |
| | | |
| 19 | Exhibits (including certifications) | |
| | | |
| | Signature | |
| 1 | Strategic Report |
| 2 | Forward-looking statements |
| 2 | Presentation of information |
| 3 | Recent Developments |
| 4 | 2014 Performance |
| 7 | Our progress in 2014 |
| 8 | Chairman’s statement |
| 9 | Chief Executive’s review |
| 13 | Our business model and strategy |
| 13 | - Our Structure |
| 14 | - Our Strategy |
| 14 | - Our Plan |
| 18 | - Our Operating Model |
| 18 | - Our Values |
| 19 | - Our Customers |
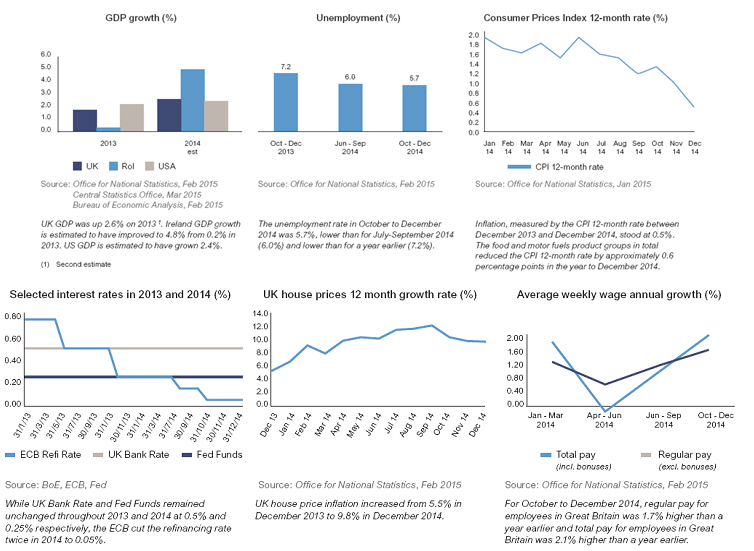
| 21 | Key economic indicators |
| 24 | Business review |
| 25 | - Personal & Business Banking |
| 27 | - Commercial & Private Banking |
| 29 | - Corporate & Institutional Banking |
| 31 | - Citizens Financial Group |
| 32 | - RBS Capital Resolution |
| 33 | - Services |
| 35 | Governance at a glance |
| 37 | Risk overview |
| 39 | Sustainability |
| | Detailed information |
| 43 | Governance report |
| 106 | Business review |
| 164 | Capital and risk management |
| 331 | Financial statements |
| 449 | Additional information |
| 486 | Shareholder information |
| 506 | Abbreviations and acronyms |
| 507 | Glossary of terms |
| 515 | Index |
| 518 | Important addresses |
Forward-looking statements
Certain sections in this document contain ‘forward-looking statements’ as that term is defined in the United States Private Securities Litigation Reform Act of 1995, such as statements that include the words ‘expect’, ‘estimate’, ‘project’, ‘anticipate’, ‘believe’, ‘should’, ‘intend’, ‘plan’, ‘could’, ‘probability’, ‘risk’, ‘Value-at-Risk (VaR)’, ‘target’, ‘goal’, ‘objective’, ‘may’, ‘endeavour’, ‘outlook’, ‘optimistic’, ‘prospects’ and similar expressions or variations on these expressions.
In particular, this document includes forward-looking statements relating, but not limited to: The Royal Bank of Scotland Group’s (RBS) Transformation Plan (which includes RBS’s 2013/2014 strategic plan relating to the implementation of its new divisional and functional structure and the continuation of its balance sheet reduction programme including its proposed divestments of Williams & Glyn and CFG, RBS’s information technology and operational investment plan, the proposed restructuring of RBS’s CIB business and the restructuring of the Group as a result of the implementation of the regulatory ring-fencing regime), as well as restructuring, capital and strategic plans, divestments, capitalisation, portfolios, net interest margin, capital and leverage ratios, liquidity, risk-weighted assets (RWAs), RWA equivalents (RWAe), Pillar 2A, Maximum Distributable Amount (MDA), total loss absorbing capital (TLAC), minimum requirements for eligible liabilities (MREL) return on equity (ROE), profitability, cost:income ratios, loan:deposit ratios, funding and risk profile; litigation, government and regulatory investigations including investigations relating to the setting of interest rates and foreign exchange trading and rate setting activities; costs or exposures borne by RBS arising out of the origination or sale of mortgages or mortgage-backed securities in the US; RBS’s future financial performance; the level and extent of future impairments and write-downs; and RBS’s exposure to political risks, credit rating risk and to various types of market risks, such as interest rate risk, foreign exchange rate risk and commodity and equity price risk. These statements are based on current plans, estimates, targets and projections, and are subject to inherent risks, uncertainties and other factors which could cause actual results to differ materially from the future results expressed or implied by such forward-looking statements. For example, certain market risk disclosures are dependent on choices relying on key model characteristics and assumptions and are subject to various limitations. By their nature, certain of the market risk disclosures are only estimates and, as a result, actual future gains and losses could differ materially from those that have been estimated.
Other factors that could adversely affect our results and the accuracy of forward looking statements in this document include the risk factors and other uncertainties discussed in the risk factors on pages 110 to 112 and 466 to 484. These include the significant risks for the Group presented by the execution of the Transformation Plan; RBS’s ability to successfully implement the various initiatives that are comprised in the Transformation Plan, particularly the balance sheet reduction programme including the divestment of Williams & Glyn and its remaining stake in CFG, the proposed restructuring of its CIB business and the significant restructuring undertaken by the Group as a result of the implementation of the ring fence; whether RBS will emerge from implementing the Transformation Plan as a viable, competitive, customer focussed and profitable bank; RBS’ ability to achieve its capital targets which depend on RBS’ success in reducing the size of its business; the cost and complexity of the implementation of the ring-fence and the extent to which it will have a material adverse effect on RBS; the risk of failure to realise the benefit of RBS’s substantial investments in its information technology and operational infrastructure and systems, the significant changes, complexity and costs relating to the implementation of the Transformation Plan, the risks of lower revenues resulting from lower customer retention and revenue generation as the Group refocuses on the UK as well as increasing competition. In addition, there are other risks and uncertainties. These include RBS’s ability to attract and retain qualified personnel; uncertainties regarding the outcomes of legal, regulatory and governmental actions and investigations that the Group is subject to and any resulting material adverse effect on the Group of unfavourable outcomes;; heightened regulatory and governmental scrutiny and the increasingly regulated environment in which the Group operates; uncertainty relating to how policies of the new government elected in the May 2015 UK election may impact RBS including a possible referendum on the UK’s membership of the EU; operational risks that are inherent in RBS’s business and that could increase as RBS implements its Transformation Plan; the potential negative impact on RBS’s business of actual or perceived global economic and financial market conditions and other global risks; how RBS will be increasingly impacted by UK developments as its operations become gradually more focussed on the UK; uncertainties regarding RBS exposure to any weakening of economies within the EU and renewed threat of default by certain counties in the Eurozone; the risks resulting from RBS implementing the State Aid restructuring plan including with respect to the disposal of certain assets and businesses as announced or required as part of the State Aid restructuring plan; the achievement of capital and costs reduction targets; ineffective management of capital or changes to regulatory requirements relating to capital adequacy and liquidity; the ability to access sufficient sources of capital, liquidity and funding when required; deteriorations in borrower and counterparty credit quality; the extent of future write-downs and impairment charges caused by depressed asset valuations; the value and effectiveness of any credit protection purchased by RBS; the impact of unanticipated turbulence in interest rates, yield curves, foreign currency exchange rates, credit spreads, bond prices, commodity prices, equity prices; basis, volatility and correlation risks; changes in the credit ratings of RBS; changes to the valuation of financial instruments recorded at fair value; competition and consolidation in the banking sector; regulatory or legal changes (including those requiring any restructuring of RBS’s operations); changes to the monetary and interest rate policies of central banks and other governmental and regulatory bodies; changes in UK and foreign laws, regulations, accounting standards and taxes; impairments of goodwill; the high dependence of RBS’ operations on its information technology systems and its increasing exposure to cyber security threats; the reputational risks inherent in RBS’ operations; the risk that RBS may suffer losses due to employee misconduct; pension fund shortfalls; the recoverability of deferred tax assets by the Group; HM Treasury exercising influence over the operations of RBS; limitations on, or additional requirements imposed on, RBS’s activities as a result of HM Treasury’s investment in RBS; and the success of RBS in managing the risks involved in the foregoing.
The forward-looking statements contained in this document speak only as of the date of this announcement, and RBS does not undertake to update any forward-looking statement to reflect events or circumstances after the date hereof or to reflect the occurrence of unanticipated events.
The information, statements and opinions contained in this document do not constitute a public offer under any applicable legislation or an offer to sell or solicitation of any offer to buy any securities or financial instruments or any advice or recommendation with respect to such securities or other financial instruments.
Presentation of information
In this document, and unless specified otherwise, the term ‘company’ or ‘RBSG’ means The Royal Bank of Scotland Group plc, ‘RBS’, ‘RBS Group’ or the ‘Group’ means the company and its subsidiaries, ‘the Royal Bank’ or ‘RBS plc’ means The Royal Bank of Scotland plc and ‘NatWest’ means National Westminster Bank Plc.
The company publishes its financial statements in pounds sterling (‘£’ or ‘sterling’). The abbreviations ‘£m’ and ‘£bn’ represent millions and thousands of millions of pounds sterling, respectively, and references to ‘pence’ represent pence in the United Kingdom (‘UK’). Reference to ‘dollars’ or ‘$’ are to United States of America (‘US’) dollars. The abbreviations ‘$m’ and ‘$bn’ represent millions and thousands of millions of dollars, respectively, and references to ‘cents’ represent cents in the US. The abbreviation ‘€’ represents the ‘euro’, the European single currency, and the abbreviations ‘€m’ and ‘€bn’ represent millions and thousands of millions of euros, respectively.
The geographic analysis in the Business Review, including the average balance sheet and interest rates, changes in net interest income and average interest rates, yields, spreads and margins in this report have generally been compiled on the basis of location of office - UK and overseas – unless indicated otherwise. ‘UK’ in this context includes transactions conducted through the offices in the UK which service international banking transactions.
The results, assets and liabilities of individual business units are classified as trading or non-trading based on their predominant activity. Although this method may result in some non-trading activity being classified as trading, and vice versa, any resulting misclassification is not expected to be material.
Non-GAAP financial information
The directors manage RBS’s performance by class of business, before certain reconciling items, as is presented in the segmental analysis in Note 38 (the “non-statutory basis”). In 2014, RBS made changes to the reconciling items and only the following will now be reported as reconciling items: own credit adjustments, gain/(loss) on redemption of own debt, write-down of goodwill, strategic disposals and RFS Holdings minority interest.
Further the results of Citizens are included in the appropriate caption in the financial results presented on a non-statutory basis and included in discontinued operations in the financial results presented on a statutory basis. Discussion of RBS’s performance in this report presents RBS's results on a non-statutory basis as management believes that such measures allow a more meaningful analysis of RBS’s financial condition and the results of its operations. These measures are non-GAAP financial measures. A body of generally accepted accounting principles such as IFRS is commonly referred to as ‘GAAP’. A non-GAAP financial measure is defined as one that measures historical or future financial performance, financial position or cash flows but which excludes or includes amounts that would not be so adjusted in the most comparable GAAP measure. Reconciliations of these non-GAAP measures to the closest equivalent GAAP measure are presented throughout this document and in the segmental analysis in Note 38. These non-GAAP financial measures are not a substitute for GAAP measures.
Furthermore, RBS has divided its operations into “RBS excluding RBS Capital Resolution (RCR)” for all periods in 2014 and for prior periods “RBS excluding Non-Core”. Certain measures disclosed in this document for RBS excluding RCR/Non-Core operations are non-GAAP financial measures used by management as they represent a combination of all reportable segments with the exception of RCR/Non-Core.
The presentation of the financial perforance of Personal & Business Banking (“PBB”) which combines the reportable segments of UK Personal & Business Banking and Ulster Bank and the presentation of the financial performance of Commercial & Private Banking (“CPB”) which combines the reportable segments of Commercial Banking and Private Banking are non GAAP financial measures. In addition the presentation of operating profit, operating expenses and other performance measures excluding the impact of restructuring costs and litigation and conduct costs is a non-GAAP financial measure and is not a substitute for the equivalent GAAP measure.
Lastly, the liquidity coverage ratio, stressed outflow coverage, net stable funding ratio and other capital and liquidity metrics included in the Capital and risk management section are non-GAAP financial measures and are being presented for informational purposes given they are metrics that are not yet required to be disclosed by a government, governmental authority or self-regulatory organisation.
International Financial Reporting Standards
As required by the Companies Act 2006 and Article 4 of the European Union IAS Regulation, the consolidated financial statements of RBS are prepared in accordance with International Financial Reporting Standards issued by the International Accounting Standards Board (IASB) and interpretations issued by the IFRS Interpretations Committee of the IASB as adopted by the European Union (together ‘IFRS’). They also comply with IFRS as issued by the IASB.
Recent developments
Sale of a North American loan portfolio to Mizuho
On 26 February 2015, RBS announced that it has entered into a definitive agreement with Mizuho Bank, Ltd. ("Mizuho"), a wholly-owned subsidiary of the Mizuho Financial Group, for the sale of a portfolio of US and Canadian loan commitments. As part of the transaction, the parties also continue to explore the transfer of certain associated derivatives, and the transition from RBS to Mizuho of certain coverage banking, debt capital markets, syndicate, and associated capabilities related to these commitments.
The transaction is aligned with the strategic direction RBS has announced for its Corporate & Institutional Banking business, which will focus mainly on UK and Western European customers, built on existing product and service strengths. RBS will remain engaged in the US, serving a select group of North American clients with strong links into the UK.
The portfolio sold to Mizuho comprises $36.5 billion of loan commitments, including $3.2 billion of drawn assets, as of 31 December 2014. The risk-weighted assets associated with the portfolio business were approximately $8 billion as of 31 December 2014, and it generated profit after tax of $0.1 billion in the year ended on that date. The cash consideration on that basis would be approximately $3.0 billion, generating a loss on disposal of $0.2 billion. Actual cash consideration and loss will depend upon settlement date portfolio balances. Sale proceeds will be used for general corporate purposes.
The transaction is expected to complete before the end of Q2 2015. RBS will work closely with Mizuho and our existing clients associated with these loan commitments to ensure an orderly and seamless transition at completion.
Moody’s
On 17 March 2015, Moody’s announced multiple rating reviews following the publication of its new bank rating methodology on 16 March 2015. The new methodology affects banking entities globally and reflects, among other things, Moody’s lowered expectations about the likelihood of government support for European banks in light of the introduction of the EU Bank Recovery and Resolution Directive ("BRRD"). Moody’s provided a preliminary indication of the outcome of its review which is to be completed later in 2015. Moody’s preliminary indication contemplates that RBS’s long-term senior unsecured and issuer credit ratings would be downgraded by two notches to Ba1 and that the credit ratings of certain of the Group subsidiaries may also be downgraded. If these downgrades occur, the credit ratings of RBSG and of certain of its subsidiaries would, therefore, be considered to be below-investment grade by that credit rating agency.
Partial sale of Citizens Financial Group, Inc. stake
On 23 March 2015, RBS announced that it intended to sell part of its shareholding in Citizens Financial Group, Inc. (Citizens), and on 26 March 2015 announced the pricing of the offer.
The offer comprised 155.25 million shares, or 28.4%, of Citizens common stock at a public offering price per share of $23.75.
Gross proceeds realised by RBS will be $3.7 billion with the cash proceeds being used for general business purposes.
Following the offering, RBS will continue to hold up to 41.9% of Citizens shares of common stock which are subject to a 90-day lock-up. During this period, the lock-up agreement is subject to modification, waiver or cancellation. RBS will continue to consolidate Citizens in its financial statements.
The partial sale is part of RBS's strategy to fully exit its holding in Citizens by the end of 2016 as part of its European Commission state aid commitments.
Disposal internationally managed Private Banking and Wealth Management business
On 27 March 2015, RBS announced it had reached an agreement to sell its internationally managed Private Banking and Wealth Management business to Union Bancaire Privée UBP SA (UBP). The sale comprises client relationships outside the British Isles and associated staff. RBS will continue to service UK Private Banking and Wealth Management client needs, together with those of international clients with a strong connection to the UK, from the British Isles through its Coutts and Adam & Company brands. The transaction is subject to regulatory approvals.
The sale includes relationships managed from Switzerland, Monaco, UAE, Qatar, Singapore and Hong Kong. As at 31 December 2014 assets under management were approximately CHF32bn and total risk-weighted assets were CHF2bn. The price paid will be determined in part by assets under management on closing. RBS anticipates receiving a premium. The resulting capital benefit to RBS is expected to be modest after writing off goodwill related to the business and taking into account anticipated exit and restructuring costs. Initial closing of the transaction is envisaged in Q4 2015, when a majority of the business is expected to transfer, with the remainder during the first part of 2016.
The transaction is subject to regulatory approvals.
Executive change
On 30 March 2015 RBS announced that Rory Cullinan, Executive Chairman of Corporate & Institutional Banking will be leaving the company. To ensure an effective transfer of responsibilities he will remain with the Bank until 30 April 2015.
Chris Marks, Chief Executive Officer of CIB, and Mark Bailie, Chief Executive Officer of Capital Resolution, will join the Bank’s Executive Committee as Co-CEOs of Corporate & Institutional Banking.
The above appointments are subject to regulatory approval.
Loss attributable to ordinary and B shareholders | (£3,470m) | | Operating profit on a non-statutory basis | £3,503m |
| Profit before tax | £2,643m | | Common Equity Tier 1 ratio (1) | 11.2% |
| RWAs | £356bn | | Loan:deposit ratio (2) | 95% |
Short-term wholesale funding (3) | £28bn | | Liquidity portfolio | £151bn |
Leverage ratio (4) | 4.2% | | Return on tangible equity (5) | (8.0%) |
| Cost:income ratio | 91% | | Net interest margin | 2.14% |
Cost:income ratio adjusted - on a non-statutory basis (6) | 68% | | Net interest margin on a non-statutory basis (7) | 2.23% |
| (2) | Includes disposal groups and excludes repos see page 162 |
| (3) | Excludes derivative collateral |
| (4) | Based on end-point CRR Tier 1 capital and revised 2014 Basel III leverage ratio framework |
| (5) | Tangible equity is equity attributable to ordinary and B shareholders less intangible assets |
| (6) | Excludes restructuring costs of £1,257 million and litigation and conduct costs of £2,194 million |
| (7) | Includes results of Citizens Financial Group, Inc. |
Financial results
RBS reported a loss attributable to ordinary and B shareholders of £3.5 billion, following a £4.0 billion write-down on Citizens.
Operating profit on a non-statutory basis was £3.5 billion. Significant progress was made towards building a bank that is stronger, simpler and better for both customers and shareholders.
RBS reported a loss attributable to ordinary and B shareholders of £3,470 million in 2014, compared with a loss of £8,995 million in 2013. The result included a loss from discontinued operations of £3,445 million, which reflected a £3,994 million fair value write-down in relation to the reclassification of Citizens to disposal groups, and a tax charge of £1.9 billion which included a £1.5 billion write-off of deferred tax assets.
Operating profit before tax, which excludes results from discontinued operations, was £2,643 million compared with an operating loss of £8,849 million in 2013.
Operating profit on a non-statutory basis totalled £3,503 million for 2014, compared with an operating loss of £7,500 million in 2013. This reflected improved operating results from the core domestic businesses together with significant impairment releases in Ulster Bank and RBS Capital Resolution (RCR). These results include £1,257 million of restructuring costs compared with £656 million in 2013, and £2,194 million of litigation and conduct costs compared with £3,844 million in the prior year.
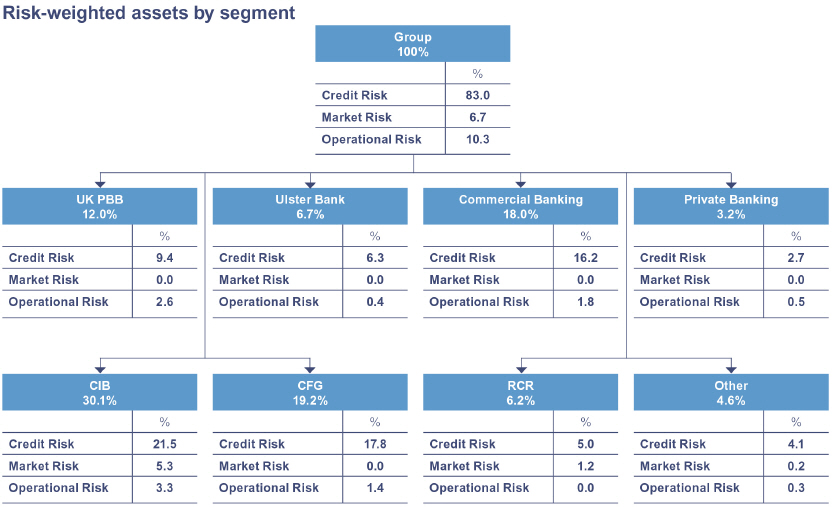
UK Personal & Business Banking (UK PBB) delivered a good performance built on strong growth from a reinvigorated mortgage business. Commercial Banking’s efforts to stimulate demand resulted in a resumption of loan book growth; together with active management of cost and capital, this supported a significant improvement in profitability. Corporate & Institutional Banking (CIB) made good progress towards a lower risk model with a further £40 billion reduction in risk-weighted assets (RWAs) on an end- point CRR basis.
Personal & Business Banking - Share of non-statutory operating profit, 59%
| | 2014 | | 2013 |
| Performance highlights | UK PBB | Ulster Bank | PBB | | UK PBB | Ulster Bank | PBB |
| Return on equity (%) | 19.4 | 16.1 | 17.5 | | 9.8 | (33.2) | (5.7) |
| Net interest margin (%) | 3.68 | 2.27 | 3.42 | | 3.56 | 1.88 | 3.21 |
| Cost:income ratio (%) | 72 | 71 | 71 | | 77 | 81 | 78 |
| Loan:deposit ratio (%) | 86 | 107 | 88 | | 86 | 120 | 91 |
| Risk-weighted assets (£bn) | 42.8 | 23.8 | 66.6 | | 51.2 | 30.7 | 81.9 |
Commercial & Private Banking - Share of non-statutory operating profit, 41%
| | 2014 | | 2013 |
| Performance highlights | Commercial Banking | Private Banking | CPB | | Commercial Banking | Private Banking | CPB |
| Return on equity (%) | 12.6 | 7.8 | 11.9 | | 4.9 | (3.1) | 3.7 |
| Net interest margin (%) | 2.74 | 3.71 | 2.93 | | 2.64 | 3.74 | 2.81 |
| Cost:income ratio (%) | 57 | 87 | 65 | | 63 | 122 | 73 |
| Loan:deposit ratio (%) | 98 | 46 | 83 | | 92 | 45 | 78 |
| Risk-weighted assets (£bn) | 64 | 11.5 | 75.5 | | 65.8 | 12 | 77.8 |
Corporate & Institutional Banking - Share of non-statutory operating profit, (25%)
| Performance highlights | | | 2014 | | | | 2013 |
| Return on equity (%) | | | (4.2) | | | | (12.9) |
| Cost:income ratio (%) | | | 123 | | | | 144 |
| Risk-weighted assets (£bn) | | | 107.1 | | | | 120.4 |
Note: RWAs at 31 December 2013 are on Basel 2.5 basis and on an end-point CRR basis at 31 December 2014.
2014 was a year of significant progress for the bank, in which we delivered against all our commitments. In line with the new strategy it set out in 2014, RBS has:
| · | Implemented a new organisational design for a more UK-centred bank with focused international capabilities, built around its strongest customer franchises. |
| · | Exceeded its 2014 cost reduction targets with savings of £1.1 billion. |
| · | Strengthened its Common Equity Tier 1 (CET1) ratio by 2.6 percentage points to 11.2% at the end of 2014, assisted by £4.8 billion of net capital release from RCR disposals and run-off. |
| · | Successfully listed Citizens as a step towards full divestment by the end of 2016. |
| · | Reached agreement with HM Treasury on the restructuring of the Dividend Access Share (DAS) and paid an initial dividend of £320 million. |
| · | Completed much of the orderly run-down and closure of the US asset-backed product business, removing £15 billion of RWAs from the balance sheet. |
| · | Completed a strategic review of Ulster Bank and the wealth businesses, launching a sales process for the international private banking activities(1). |
| · | Continued to rationalise, simplify and strengthen operating systems and processes, with a more secure mobile banking platform, faster overnight batch processing and key services available to customers 99.96% of the time. |
| · | Made our products simpler and fairer for customers, ending zero per cent balance transfers, halting teaser rates on savings accounts that penalise existing customers and explaining all charges for personal and business customers on one side of A4 paper. |
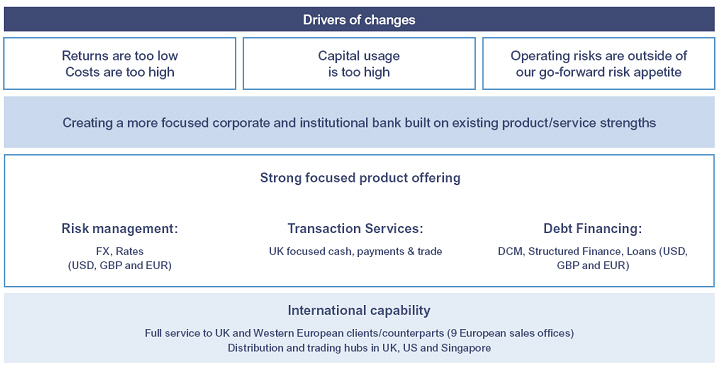
Within the overall strategic shape outlined for CIB in 2014, RBS is making further changes to improve its medium-term returns, building a stronger, safer and more sustainable business, focused mainly on UK and Western European customers, both corporates and financial institutions, supported by trading and distribution platforms in the UK, US and Singapore.
These changes will create a more focused corporate and institutional bank built on existing product and service strengths.
RBS will have a strong, client-focused product offering in sterling, US dollar and euro, including:
| · | Debt financing, with debt capital markets, structured finance and loans. |
| · | Risk management in currency, rates and inflation. |
| · | Transaction services, with UK-focused cash, payments and trade. |
| (1) | Private banking and wealth management activities where the primary relationship management is conducted outside the British Isles. |
CIB will reduce its geographical footprint to approximately 13 countries, compared with 38 at the end of 2014, though RBS will also retain its back office operations in Poland and India. In addition to its main distribution and trading hubs in the UK, US and Singapore, RBS will remain present in a number of Western European countries with coverage teams. A small sales team will be retained in Japan. US operations will shrink, while retaining the presence required to support the US dollar needs of RBS’s UK and Western European customers. Priority client sectors will be targeted in infrastructure, transportation, financial institutions, energy and resources.
CIB will continue to reduce its balance sheet and risk profile. RWAs will be reduced by 60% from £107 billion at 31 December 2014 to £35-£40 billion in 2019, with a reduction of more than £25 billion targeted in 2015. Third party assets will be reduced from £241 billion at the end of 2014 to £75- £80 billion in 2019.
This CIB strategy leaves RBS well-placed to meet the ring-fencing requirements of the Banking Reform Act 2013. As previously indicated, RBS intends to place most banking services inside the ring fence. CIB’s remaining “Markets” activities, the operations of RBS International and some corporate banking activity are expected to remain outside the ring-fenced bank in separate legal entities.
For 2015 RBS intends to:
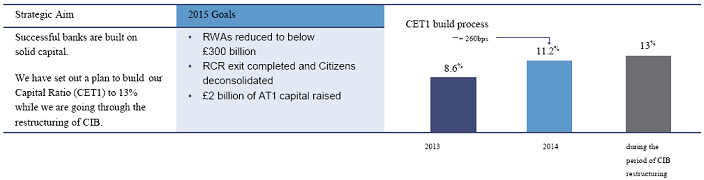
| · | Move towards a capital target of 13% CET1(1), with risk-weighted assets below £300 billion and £2 billion Additional Tier 1 capital raised. |
| · | Deconsolidate Citizens and substantially complete RCR exit. |
| · | Improve customer net promoter scores in all UK franchises, in line with the long-term goal of becoming the number 1 bank for trust, service and advocacy. |
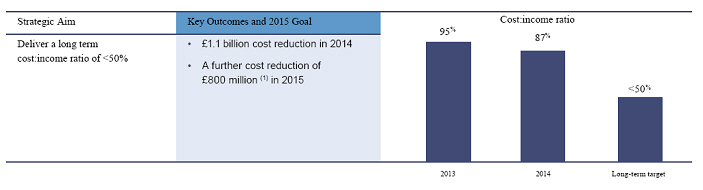
| · | Reduce costs by a further £800 million(2), taking RBS towards a long term cost:income ratio of under 50%. |
| · | Deliver lending growth in strategic segments equal to or higher than UK nominal GDP growth. |
| · | Raise employee engagement index to within 8% of the global benchmark so that staff are fully motivated to contribute to RBS’s long-term success. |
2014 performance
| · | Loss attributable to ordinary and B shareholders was £3,470 million, compared with a loss of £8,995 million in 2013. The result included a loss from discontinued operations net of tax of £3,445 million, which reflected an accounting write-down of £3,994 million taken in relation to Citizens, which has been written down to fair value less costs to sell as a consequence of it being reclassified as ‘held-for-sale’ in the statutory results. This write-down does not affect RBS’s capital position. |
| · | The tax charge included a net write-off of deferred tax assets of £1.5 billion relating to the UK (£850 million) and the US (£775 million), reflecting the impact of the decision to scale back the CIB operations. This was partially offset by write-backs relating to Ulster Bank. |
| · | Operating profit before tax was £2,643 million compared with an operating loss before tax of £8,849 million in 2013. Operating profit on a non-statutory basis improved to £3,503 million for 2014 compared with an operating loss of £7,500 million in 2013. Operating profit before tax benefitted from improved operating results in core businesses together with significant impairment releases in Ulster Bank and RCR. |
| · | Restructuring costs of £1,257 million (2013 - £656 million) were up 92% but conduct and litigation costs were 43% lower at £2,194 million (2013 - £3,844 million) and included charges relating to foreign exchange trading, Payment Protection Insurance (PPI), customer redress associated with interest rate hedging products, IT incident in 2012 and other costs including packaged accounts and investment products. Excluding restructuring, conduct and litigation costs, operating profit on a non-statutory basis was 6,954 million, compared with a loss of £3,000 million in 2013. |
| · | Total income was £15,150 million compared with £16,737 million in 2013. On a non-statutory basis total income totalled £18,197 million, down 6% from 2013. Improvements in net interest income in PBB and CPB were offset by lower income from trading activities in CIB, in line with its smaller balance sheet and reduced risk profile. Net interest margin on a statutory basis was 2.14%, up from 1.90% in 2013, with improved liability margins partially offset by pressure on mortgage and corporate lending margins and by the continuing shift in mix towards lower margin secured lending. |
| · | Operating expenses were £13,859 million compared with £17,466 million. On a non-statutory basis operating expenses of £15,849 million compared with £18,510 million, excluding restructuring, of £1,257 million (2013 - £656 million), conduct and litigation costs of £2,194 million (2013 - £3,844 million) , were down £1,612 million or 12%. Adjusting for currency movements of £0.3 billion and intangible assets write-offs of £0.2 billion, cost savings totalled £1.1 billion, in excess of the bank’s £1 billion target for the year. |
| · | Impairment releases of £1,352 million were recorded in 2014 compared with impairment losses of £8,120 million in 2013. On a non-statutory basis net impairment releases of £1,155 million were recorded in 2014 compared with impairment losses of £8,432 million in 2013, which included £4,490 million of charges recognised in connection with the creation of RCR. Provision releases arose principally in Ulster Bank and in the Irish portfolios managed by RCR, which benefited from improving Irish economic and property market conditions nd proactive debt management. |
Balance sheet and capital
| · | Funded assets which exclude derivatives of £354 billion (Q3 2014 - £314 billion, 2013 - £288 billion) totalled £697 billion at 31 December 2014, down £35 billion in the last quarter and £43 billion over the course of the year, principally reflecting continued risk and balance sheet reduction in CIB and disposals and run-off in RCR. |
| · | Net loans and advances to customers totalled £334 billion, down £57 billions from the end of 2013 which included balances relating to Citizens of £60 billion transferred to assets of disposal groups. Underlying net loans and advances to customers were up £3.0 billion from the end of 2013, despite a significant reduction in RCR. |
| | ° | UK PBB lending rose by £2 billion, with net new mortgage lending of £3.9 billion partially offset by reduced unsecured balances. |
| | ° | Commercial Banking balances rose by £1 billion, with a planned reduction in real estate finance offset by good growth in lending to other sectors. |
| | ° | Gross new lending to SMEs totalled £10.3 billion, exceeding RBS’s £9.3 billion target by 10%. |
| | ° | Total net lending flows reported within the scope of the Funding for Lending Scheme were minus £2.28 billion in Q4 2014, of which net lending to SMEs was minus £567 million. |
| · | Customer deposits totalled £354 billion at the end of 2014. Customer deposits including Citizens of £61 billion,, which has been reclassified to disposal groups, totalled £415 billion at the end of 2014, up £0.4 billion from the end of 2013. |
| · | RWAs declined to £356 billion from £429 billion at the end of 2013, primarily driven by risk and balance sheet reduction in CIB coupled with disposals and run-off in RCR. This contributed to the strengthening of the bank’s capital ratios, with the CET1 ratio strengthening by 260 basis points to 11.2% at the end of 2014 compared with 8.6% at the end of 2013. |
Our progress in 2014
We have a clear ambition to become No.1 for customer service, trust and advocacy. In 2014, our focus has been on Cost, Capital, Restructuring and Resilience. We have also begun the process of making RBS a simpler place to work and an easier bank to do business with.
Fairer banking
We’ve ended Credit Card teaser rates.
Account opening
We’ve reduced our current account opening times
for RBS and NatWest customers from
five days to one.
Launch of Citizens IPO
The biggest bank initial public offering in US history successfully delivered.
GPL system redesign
We simplified our Group Policy Learning system (GPL). As
a result we’ve seen a 62% reduction in the total hours required to complete modules, letting us spend more time
on customers.
SME funding
Gross new lending to SMEs totalled £10.3 billion, exceeding our 2014 target by 10%.
Simplified product range
Personal & Business Banking reduced the number of on sale products by 50%.
Project reduction
So far, we have reduced the number of change projects we are running
from 550 to 182.
Transparency
RBS scored top for corporate transparency in a study conducted by
Transparency International.
Small Business Fund
RBS and NatWest launch £1billion fund for both new and existing small business customers across the UK.
Online loans
We launched a new online loan application process for small businesses.
Faster processing
Our overnight batch processing is now twice as fast, processing 20 million transactions every day.
Resilience
We’ve created a mirror bank so customers still have access to our services during a system outage. Already we can process 90% of debit and credit card transactions if there is a system outage.
Mobile record
Our mobile app regularly supports around 4 million logins a day, with a record being set on ‘Black Friday’ 2014 of 4.86 million.
Living Our Values
We launched a recognition programme – Living Our Values, reducing over 200 local schemes into one and creating a bank-wide way of recognising a colleague.
Our 2015 targets
Capital target
Move towards a capital target of 13% CET1 ratio (1).
Improve NPS
Improve net promoter score in every UK franchise.
Reduce costs
Reduce costs by a further £800 million (2), taking RBS towards a long term cost:income ratio of under 50%.
Lending growth
Deliver lending growth in strategic segments equal to or higher than UK nominal GDP growth.
Our people
Raise employee engagement index to within 8% of GFS norm (3)
| (1) | During the period of CIB restructuring. |
| (2) | Excludes restructuring, conduct, litigation and intangible write-off charges as well as the operating costs of Citizens Financial Group and Williams & Glyn. |
| (3) | Global Financial Services (GFS) norm currently stands at 83%. |
2014 was a year of significant progress for RBS, with a much improved operating profit and major achievements in terms of business reorganisation, cost reduction, capital build and improved IT capability. As Ross McEwan has set out in his letter, the business continues to simplify and improve, focusing on putting its customers at the heart of its activities
The bank has delivered a good operating profit of £3.5 billion (1) for 2014, but the costs associated with completing the restructuring of RBS mean we are still reporting a bottom line attributable loss. Although the huge changes to the size, shape and risk profile of the business since the financial crisis are largely complete or in hand, the further substantial restructuring of our markets operations and international spread will require careful management in 2015.
Of course your Board is pleased to see the improved operating performance, which in our view reflects the underlying strength of the business. Looking back, however, we must acknowledge that we did not fully recognise the scale of the challenge that awaited us in 2009. At the time, we assumed that a Core Tier 1 capital ratio of more than 8% by 2013 would be sufficient to constitute undoubted financial strength in the minds of markets and regulators; today we have increased our capital target to 13%. We must also acknowledge that we did not anticipate the more than £9 billion of regulatory fines and customer redress we have borne so far as we paid, and will continue to pay, the price for our past conduct failings. These conduct issues have delayed the re-build of our capital and directly reduced shareholder value. They have also caused continuing reputational damage. I hope as we move beyond these issues we can fully rebuild the trust of our customers, and by doing so win more of their business.
The need to continue to rebuild capital strength means it has taken longer than we had expected to reach a point at which the Government could be in a position to start selling down its stake in RBS. The decision on timing rests with the Government, through UK Financial Investments, which manages its shareholding, but our task is to create the conditions in which it can do so. In working towards that end we are also furthering the interests of RBS’s other shareholders, as we believe that the beginning of the sell-down will be welcomed by investors.
As announced previously I will be leaving RBS in 2015. The Board is pleased to announce that Howard Davies will succeed me as Chairman, and we welcome him to RBS. He will join the Board at the end of June and take over from me on 1 September. On the day I joined the Board in January 2009, the shares traded at 9p, equivalent to 90p today, and the implications of the bank’s financial distress were unknowable. RBS has transformed itself over the last several years and continues to do so. The renewed focus on customer and customer service will make this a better organisation for all stakeholders, most especially customers, staff and shareholders.
I would like to thank my colleagues on the RBS Board for their support and dedication in dealing with the unusual challenges of being a majority government-owned listed company.
In particular, I would like to thank Nathan Bostock, Tony Di Iorio and Philip Scott, who all stepped down from the Board in 2014 after providing valuable service, and to welcome Morten Friis and Ewen Stevenson, who have joined the Board.
It has been a privilege to serve as Chairman of RBS and I am confident that the Board and the many outstanding people in the bank will continue to work with dedication to restore the bank’s standing.
Philip Hampton
Chairman
| (1) | On a non-statutory basis |
This is my first letter to you since we launched a new strategy for RBS last year. It is a strategy that sets out to deliver one very simple aim. To make this a great bank for our customers; a bank that will earn back their trust, and in turn win more of their business.
It’s a strategy that provides the fundamental building blocks to make RBS an attractive investment, a great place to work for our people, and a UK focused bank that the country can be proud of.
Last year we identified the areas we needed to improve in order to deliver our strategy - cost, complexity, capital, and trust from our customers. The energy and resolve of our people has resulted in significant progress on these, and we have delivered on the goals we set for 2014.
| · | We said we would reduce waste and inefficiency and reorganise ourselves around the needs of our customers, moving from seven operating divisions to three customer businesses. This reorganisation is complete and we have removed £1.1 billion of cost from the business. |
| · | We outlined a programme to rationalise, simplify and bolster our operating systems and processes to make them less complex, more resilient and easier to use. Significant progress has been made in this area with our key services available to customers 99.96% of the time during 2014. |
| · | We set out a plan to place the bank on a sure capital footing targeting a CET1 ratio of 11% by the end of 2015, and 12% or greater by the end of 2016, so as to remove any doubts about our fundamental strength and stability. This capital plan is on track and we have reached our 2015 target one year ahead of schedule. This improvement was driven by a 52% reduction in risk- weighted assets in RCR. |
| · | We said we would undertake the biggest bank initial public offering in US history. Citizens Financial Group was successfully floated on the New York Stock Exchange. At the same time we substantially completed the orderly run-down and closure of our US asset-backed product business, removing £15 billion of risk- weighted assets from our balance sheet. |
| · | We made a commitment to fairness with our customers. We said that RBS would no longer compete with other banks in a number of areas and we would use less technical language that our customers find easier to understand. We stopped offering zero per cent balance transfers on credit cards that trap customers in spirals of ever increasing debt, we ended teaser rates that penalise existing customers, and we now explain all of our fees and charges on one side of A4 paper for both our personal and business customer |
As well as being a stronger, simpler and fairer bank, I said that we would also be a very different bank. No longer chasing global market share, but instead focusing squarely on our core strength, namely our home market places in the UK and the Republic of Ireland (RoI).
Our 2014 performance shows a strategy that is working. It demonstrates the forensic approach we have taken to evaluate our businesses against the returns they provide to shareholders. The strong execution against the targets we set now gives us a platform to go further, faster.
As well as a review of our current performance I will set out exactly what this bank will become, what we will do and what we will not do as we seek to improve shareholder value and secure our market leading positions. It involves an acceleration of our strategy to build on our domestic strengths and a further reshaping of our CIB business as we seek to address its unacceptable returns.
We have five ambitious new goals for the second year of our plan and new financial targets so that you, our shareholders, can hold us to account for our performance.
2014 financial performance
The earning power of our key customer businesses lies at the heart of the strong financial progress RBS made during 2014. What you can see from these results is that underneath all the noise of conduct, litigation and restructuring charges, we have strong performing customer businesses that are geared towards delivering sustainable returns for investors.
We made an operating profit of £3.5 billion(1) in 2014, the highest since 2010 and a vast improvement on 2013. Great progress on cost reduction countered a fall in total income - which primarily reflected a smaller risk profile and lower income from trading activities in CIB - and led to an overall improvement in operating efficiency.
Our attributable loss of £3.5 billion(2), includes £1.3 billion of restructuring charges, £2.2 billion in litigation and conduct provisions, a £1.5 billion net deferred tax asset write-off, the initial £320 million dividend for the Dividend Access Share and a write-down of £4 billion anticipating the disposal of Citizens.
| (1) | On a non-statutory basis |
| (2) | Loss attributable to ordinary and B shareholders |
It is increasingly clear what is driving underlying performance at RBS - PBB and CPB. PBB and CPB are now more important to RBS’s performance than at any time in the past decade. This year they generated 61% of our income, compared with c.37% for equivalent businesses in 2009. And they have been at the forefront of progress towards our goal of increased operating efficiency, reducing adjusted operating expense(3) by 2.6% over the year whilst income was up 2.3%. ROEs of 17.5% and 11.9% respectively demonstrate their value to RBS today.
These franchises are also the custodians of our core strengths - serving the everyday banking needs of over 18 million personal and business customers in the UK and RoI, and helping these customers meet their ambitions. We’re investing in these franchises with a view to exceeding customers’ expectations and generating sustainable returns.
The performance of CIB reflects the big changes this business is going through, and the tough macro-economic conditions and increasingly high costs of regulation it faces. Income decreased alongside lower adjusted operating expenses as we reduced CIB’s risk profile in accordance with our strategy, with restructuring, litigation and conduct costs pushing the business to an operating loss. But CIB has a strong customer franchise serving our leading UK and Western European clients; increasingly it is these clients we intend to focus on. I will set out later in this letter the steps we will take to do this.
An overarching part of delivering sustainable returns is controlling operating costs. When I announced our cost target last year it was described by some as the most ambitious cost target in Europe. Well, through our drive across the bank for greater simplicity we have over-delivered, and surpassed our target of £1 billion of operating cost savings for the bank. With a cost:income ratio for the year of 68% on an adjusted basis(3) , we are still behind our peers on cost efficiency; and there is work to do to fulfil our desire to take it below 50%. But we have a strong track record on delivery, and there is resolve across this bank to get this done.
I am very pleased with the progress we have made in 2014 against our stated objectives. While that progress is evident in the operating profit line of the results announced we are still posting an attributable loss to our shareholders. This is an accounting consequence of one of our 2014 achievements - the successful flotation of Citizens on the New York Stock Exchange.
Now the deconsolidation of Citizens is finally within sight, accounting rules require us to write it down to its estimated disposal value. This write-down substantially represents the goodwill previously attached to Citizens. While I realise that the headlines this generates are disappointing it is important to emphasise that this particular accounting loss does not change our regulatory capital or tangible net asset value.
Safety remains a cornerstone of our strategy
A core question for any bank seeking the trust of its customers is whether it’s safe and strong and focused and able to support customers and the economy. The progress we have made should mean that it is no longer in any doubt. The CET1 ratio has improved by 260 basis points to 11.2% over the course of the year, up from 8.6% as at 31 December 2013. We reached our full year 2015 CET1 target of 11% one year ahead of schedule, and we are on track to achieve a revised CET1 target of 13%, which we have set in place for the period of the CIB restructuring.
We now have considerably more high quality capital than we had when the financial crisis hit and this bank was bailed out by the taxpayer. But we need to meet and exceed the expectations of the Prudential Regulation Authority (PRA) and of our shareholders and bondholders. Stress test results show it’s not just how much capital you have, but how your balance sheet behaves under extreme economic scenarios.
This year our team in RBS Capital Resolution has managed to accelerate the removal of some of our most capital intensive assets, and we are on track to complete our 2014- 2016 RCR run-down targets by the end of 2015, one year ahead of the original target we set for ourselves. Our capital strength will be bolstered further when Citizens Financial Group in the USA is deconsolidated from our balance sheet. This is also expected in 2015.
In 2015, we also plan to start a programme of issuing Basel III compliant Additional Tier 1 capital instruments.
Conduct
It has taken far longer than anyone realised to root out all the past problems, practices and related fines, and we still have challenges on the horizon. We are changing the culture of this bank; our aim is that shareholders are not exposed to this scale of conduct risk again.
What you will have seen from me over the last year is the way I will be open and honest with you and our customers when dealing with these issues; the way we continue to approach FX is a good example of this. I will not hide. I will talk openly about the hurt this wrongdoing causes me and the many thousands of people within this bank. I will detail the things we are doing to put things right for our customers, and the challenge and change we are driving through the culture and conduct of our staff.
We are determined to learn the lessons from the wrongdoings of the past and ensure that those responsible are held to account.
Notes:
| (3) | Excluding restructuring costs and litigation and conduct costs, see segmental analysis in Note 38 |
Building on our strengths
I said this time last year that the days when global domination mattered more to RBS than great customer service are well and truly over. Well, we are not just talking about being a UK-centred bank; we are a UK-centred bank. 80% of our revenues are generated in the UK. At the time of the 2008 financial crisis this number was 48%. Seven years after the crisis we still have top 3 market positions in the following UK segments:
| · | large corporates and financial institutions (FIs); |
| · | Sterling provider in wholesale banking; |
| · | Financing for UK infrastructure projects; and |
We are building on this strength to manage value for shareholders and deliver the most resilient future returns.
In last year’s letter, I told you that where a business can’t deliver value to our shareholders in a reasonable time period we will take decisive action. We have put international private banking activities(1) up for sale and we are now going further, faster in reshaping parts of our CIB business.
The investment bank was over-stretched both in range of product and geography. There was too much risk for too little return. Given the increasing regulatory requirements on this business, it was a strategy that now has little hope of delivering acceptable returns to shareholders.
To be a number 1 bank means providing a full service offering to UK and Western European corporate and financial institution clients. It means providing a first class platform to process payments in the UK and Europe. And it means having the expertise to help customers raise finance on the debt capital markets and manage the high level risks they face. Serving customers in these areas is an undisputed area of strength for us - they are our core capabilities, and are essential to us providing a first class service. In addition, trading and distribution hubs in Singapore and the US will ensure the corridors of commerce remain open to allow our customers access to investors in those regions.
We plan to fully exit our Markets businesses in Central and Eastern Europe, the Middle East and Africa, and substantially reduce our presence in Asia Pacific and the US. We will exit our cash management services outside the UK and RoI. These businesses are not essential to our go-forward client franchise, and their standalone returns are not sufficient to justify an exception.
In doing so we will be free to grow and improve the services our customers value most. And by serving customers better this franchise can reinforce its competitive position and deliver sustainable returns above the cost of equity for our shareholders.
This is a plan for a smaller, more focused, but ultimately more valuable bank with the vast majority of its assets in the UK, and for RBS marks the end of the standalone global investment bank model.
What I have just outlined will require an enormous amount of effort from our people. And I do not for one second take that for granted. We have a proven track record of delivering change in our business.
A better bank for customers
Much has been written and discussed about the root causes of the financial crisis. For me it came down to one big problem - a failure to put the customers’ interest at the heart of our business and its culture. For too long market share mattered more than customer care.
It is why over the last year our people have worked hard to embed this ‘customer first’ mentality into everything we do as a bank.
There are some concrete achievements we can call out for 2014 including: faster account opening times, a simplified product range and a clearer pricing structure. And we went against the rest of the industry and took a calculated risk by ending teaser rates, and we now offer our best rates to new and existing customers across our product range. We may have lost customers and income as a result, but we still believe that this was the right thing to do and will deliver long term value for shareholders.
I want to assure our customers that the positive changes we made in 2014 are not one-off. We strive to do better for our customers every day, and when we spot an opportunity to serve customers better, we will act. For example, customers shouldn’t be penalised because they lose track of the date and are hit with an unexpected overdraft charge for the first time. And if we can do more to help customers through both the ups and downs in their finances, it is absolutely our responsibility to do so.
But we recognise that these are chipping away at the edges, and more radical change is needed if we are to establish real upward momentum and achieve our targets. We have to be constantly asking ourselves what a really good bank for customers would look like, and to be constantly improving what we do to take us towards that goal. In our financial reporting we will include full details of the progress we have made as well as providing clear, independent measures of the bank’s customer trust and advocacy scores.
We may have started from further back than some, but we are determined to reach our aspiration of being number 1 for customer service, trust and advocacy. It won’t be easy, but I firmly believe it is doable.
A better bank for shareholders
Critical though it is that we build a bank that is safe, in capital strength, in structure and on behaviour, it must also be profitable.
There are good businesses within RBS that are capable of delivering real value to their customers. If we do that, our customers will be happy for us to make a fair and sustainable profit.
Without sustainable profitability we cannot ensure our future safety; profit is the best form of self-replenishing capital.
We remain acutely conscious of how much was invested to ensure our continued survival by our private shareholders and, critically, by the Government. As we reduce the tail risks our bank is exposed to, repair our overall profitability and reshape CIB we are creating the potential to build up excess capital, paving the way for distributions to the Government and other shareholders.
| (1) | Private banking and wealth management activities where the primary relationship management is conducted outside the British Isles. |
Our strategy envisages a capital benefit net of restructuring costs from 2016. We intend to return all capital to shareholders above a CET1 ratio of 13%. This capital return, which remains subject to regulatory approval at the time, will only be made once the significant legacy conduct hurdles are behind us. We see this as another important step towards repaying the support of our shareholders, including the UK tax payer.
2015 Goals and revised targets
I have set out in the table below five new ambitious business goals for the second year of our strategic plan to simplify and restructure this bank, achieving them will stand us in good stead to reach our goals. We have also published a revised set of financial and business targets. These are consistent with the other changes set out in this letter, and will enable you, our shareholders, to continue to track our progress and hold us to account.
By 2019 RBS intends to be a low cost business focused on effective, efficient delivery for our customers. It will be a bank based in the UK and RoI, with a presence in Western Europe, the US and Singapore. It intends to be a bank with leading market positions in each of our chosen business areas, and a bank that can generate attractive returns for shareholders on a sustainable basis.
Conclusion
I would like to take this opportunity to thank our Chairman, Sir Philip Hampton, as he takes part in his final Annual Results with the bank. Philip joined in 2009 amid the global financial crisis and immediately brought a clear sense of purpose and direction for the bank at a time of incredible uncertainty, both for the UK and RBS. His dedication to making this a great bank for the country served him well through the tremendous, but positive, change that RBS has undergone during his tenure. I want to express my personal gratitude to Philip for guiding me during my first year as CEO, and playing a key role in implementing the strategy that will take us forward. There is still work to do, but Philip will leave on a positive note, with RBS firmly focussed on serving its customers, and shareholders.
What you see today is a bank on track and delivering on its plan. A bank that is determined to earn the trust of its customers every day. A bank that helps the smallest enterprises through to the largest companies grow and prosper. A bank that is determined to reward its shareholders for their support. And a bank that is able to deliver on our ambition to be number one for customer service and advocacy in the UK and RoI.
Ross McEwan
Chief Executive
| | Our long-term targets | Our 2015 goals |
| Strength and sustainability | CET1 ratio = 13% during the period of CIB restructuring | Reduce RWAs to <£300bn |
| Customer experience | No.1 for service, trust and advocacy | Improve NPS in every UK franchise |
| Simplifying the bank | Cost:income ratio <50% | Reduce costs by £800m(1) |
| Supporting growth | Leading market positions in every franchise | Lending growth in strategic segments ³ nominal UK GDP growth |
| Employee engagement | Employee engagement index ³ GFS norm(2) | Raise employee engagement index to within 8% of GFS norm(2) |
| (1) | Excludes restructuring, conduct and litigation costs, intangible write-off charges as well as the operating costs of Citizens Financial Group and Williams & Glyn. |
| (2) | Global Financial Services (GFS) norm currently stands at 83%. |
Business model and strategy
Business model and strategy
Our major source of income in our retail and commercial banking businesses is net interest income. This is the difference between the income we earn from the loans and advances we have made to our personal, corporate and institutional customers and on our surplus funds and the interest we pay on deposits placed with us by our customers and our debt securities we have issued. We also earn fees from financial services and other products we provide to our customers as well as rental income from assets we lease to our customers.
Our Corporate & Institutional Banking business earns income from client driven trading activities particularly Rates, Currencies and Credit.
We do business in competitive markets but we have strong franchises and good growth opportunities, and we aim to target our investment to maximise these opportunities.
Our Personal & Business Banking and Commercial & Private Banking franchises provide services to over 17 million personal and business customers in the UK and to over 1 million personal and business customers in the Republic of Ireland. Our Corporate & Institutional Banking business serves our corporate and institutional clients primarily in the UK and Western Europe, as well as those US and Asian multinationals with substantial trade and investment links in the region. This business’s strategy has been further refined in 2015 (see page 15 for Reshaping our CIB business).
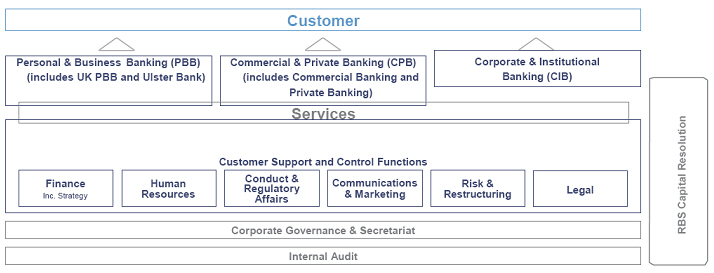
Our Structure
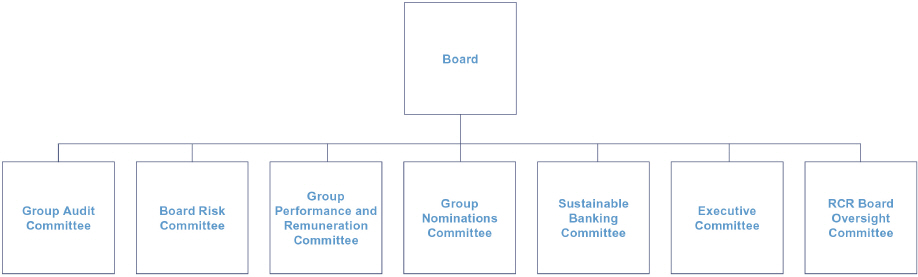
We are organised to provide products and services to personal, commercial and large corporate and institutional customers. Our principal customer-facing businesses are supported by a central Services function and other Support and Control Functions.
Customer Businesses
Our three customer-facing businesses are primarily responsible for defining the strategy and financial plan of their business and ensuring it is aligned with the wider RBS strategy. Teams define and deliver the customer proposition and are accountable for end-to-end customer processes and products. The teams partner with functions to specify functional requirements that deliver on customer needs.
Services
Services, led by the Chief Administrative Officer, provides business aligned technology, operations and property services across the bank. It is also accountable for technology risk, payments, data, change and the bank’s fraud and security functions.
Functions
These teams define functional strategy and the financial plan to support the Customer Businesses and other functions.
Most functions are a mix of control, expertise, advisory and transaction services. All common activities across the organisation are included and nothing else.
Business model and strategy
Our Strategy
After five years spent restoring fundamental soundness to the bank, we have created a strategy and a structure that provides us with an exciting opportunity. Over the next few years, we are going to focus all of our energy on earning back the trust we lost in 2008. And in doing so, RBS is going to change the UK banking sector for the better.
Our Priorities
We have a long way to go to be the bank that our customers deserve. But we are in a period of very significant, positive change. We have millions of great customers, tens of thousands of outstanding employees, and a home economy that is getting stronger. By building on this foundation, we can achieve our ambition to be number one for customer service, trust and advocacy in all our chosen markets.
Our Plan
Our overarching ambition is to become the number one bank for customer service, trust and advocacy. We have set out how we track our progress towards this goal on page 16.
We also track a number of other performance measures and have set long-term targets for these to keep us on track.
Business model and strategy
Reshaping our CIB business
We have announced our plans to go further and faster in reshaping parts of our CIB business. The investment bank was overstretched both in range of product and geography. We are building a stronger, safer and more sustainable business, focused mainly on UK and Western European customers, both corporates and financial institutions, supported by trading and distribution platforms in the UK, US and Singapore.
Our go-forward business is focused predominantly on UK and EMEA. Based on 2014 numbers, around 74% of CIB’s RWAs and 81% of income(4) is generated in these regions.
The following table illustrates the impact of the announced restructuring of the CIB business on certain key performance metrics by region based on the non-statutory 31 December 2014 results. The information presented below assumes that the product offering for the CIB business will reduce by over a half as will the number of products and desks in the Markets business and is based on certain assumptions relating to the implementation of this strategy within each region and the businesses and operations which we expect to maintain. This information is presented to illustrate the strategy and its impact on the CIB segment. The information presented in this table is non-GAAP, has not been prepared in accordance with Regulation S-X and should be read in conjunction with the notes below as well as the information included in the main announcement, including the section titled “Forward Looking Statements” on page 2 and “Summary Risk Factors” on pages 110 to 112 and “Risk Factors” on pages 466 to 484.
| | 2014 |
| Region | Current CIB | Go-forward | Non-strategic |
| RWAs (£bn) | Income (£m) (4) | RWAs (£bn) | Income (£m) (4) | RWAs (£bn) | Income (£m) (4) |
UK / Europe (1) | 71 | 2,488 | 34 | 1,630 | 37 | 858 |
US (2) | 24 | 974 | 11 | 274 | 14 | 700 |
| APAC | 12 | 487 | 2 | 111 | 10 | 376 |
| Total | 107 | 3,949 | 46 | 2,015 | 61 | 1,934 |
| Countries | 38 | 13 | 25 |
Our product offering will reduce by over a half as will the number of products and desks in our Markets business.
| (3) | Based on 2014 financials rounded. |
| (4) | On a non-statutory basis |
Business model and strategy
Building the number one bank for customer service, trust and advocacy in the UK
We use independent surveys to measure our customers’ experience and track our progress against our goal in each of our markets.
Net Promoter Score (NPS)
Customers are asked how likely they would be to recommend their bank to a friend or colleague, and respond based on a 0-10 scale with 10 indicating ‘extremely likely’ and 0 indicating ‘not at all likely’. Customers scoring 0 to 6 are termed detractors and customers scoring 9 to 10 are termed promoters. The Net Promoter Score (NPS) is established by subtracting the proportion detractors from the proportion of promoters.
In 2014, we have seen some positive NPS movements in some of our franchises and our plans for 2015 will help to gather momentum across the bank.
| | Year end 2013 | Year end 2014 | Year end 2015 target |
| Personal Banking | NatWest (England & Wales)(1) | 5 | 6 | 9 |
| | RBS (Scotland)(1) | -16 | -13 | -10 |
| | Ulster Bank (Northern Ireland)(2) | -31 | -24 | -21 |
| | Ulster Bank (Republic of Ireland)(2) | -20 | -18 | -15 |
| Business Banking | NatWest (England & Wales)(3) | -11 | -11 | -7 |
| | RBS (Scotland)(3) | -38 | -23 | -21 |
| | Ulster Bank (Northern Ireland)(4) | -47 | -44 | -34 |
| | Ulster Bank (Republic of Ireland)(4) | -21 | -17 | -15 |
| | -1 | 12 | 15 |
Suitable measures for Private Banking and Corporate & Institutional Banking are in development.
The only NPS improvements in 2014 that are statistically significant are for Business Banking (RBS Scotland) and Commercial Banking.
| (1) | Source: GfK FRS 6 month rolling data. Latest base sizes: NatWest England & Wales (3,511) RBS Scotland (547). Based on the question: “How likely is it that you would recommend (brand) to a relative, friend or colleague in the next 12 months for current account banking? “ |
| (2) | Source: Coyne Research 12 month rolling data. Question: “Please indicate to what extent you would be likely to recommend (brand) to your friends or family using a scale of 0 to 10 where 0 is not at all likely and 10 is extremely likely”. |
| (3) | Source: Charterhouse Research Business Banking Survey, based on interviews with businesses with an annual turnover up to £2 million. 12 month rolling data. Latest base sizes: NatWest England & Wales (529), RBS Scotland (399). Weighted by region and turnover to be representative of businesses in England & Wales/ Scotland. |
| (4) | Source: PwC Business Banking Tracker. Question: “I would like you to continue thinking about your main business bank and the service they provide. Can you tell me how likely or unlikely would you be to do the following? Again please use a scale of 1 to 10, where 1 is very unlikely and 10 is very likely. How likely are you to recommend them to another business? ”. |
| (5) | Source: Charterhouse Research Business Banking Survey, based on interviews with businesses with annual turnover between £2 million and £1 billion. Latest base size: RBSG Great Britain (972). Weighted by region and turnover to be representative of businesses in Great Britain. |
Customer Trust
We also use independent experts to measure our customers’ trust in the bank. Each quarter we ask customers to what extent they trust or distrust their bank to do the right thing. The score is a net measure of those customers that trust their bank (a lot or somewhat) minus those that distrust their bank (a lot or somewhat).
| | | Year end 2013 | Year end 2014 | Year end 2015 target |
Customer Trust(6) | NatWest (England & Wales) | 35% | 41% | 46% |
| | RBS (Scotland) | -16% | 2% | 11% |
| (6) | Source: Populus (2014) and PSB (2013). Latest quarter’s data. Measured as a net of those that trust RBS/NatWest to do the right thing, less those that do not. Latest base sizes: NatWest England & Wales (927), RBS Scotland (206). |
The year-on-year improvement in RBS customer trust is largely a reversion to its longer-term trend: there were issues in late 2013 that impacted the bank’s reputation and customer trust. There are early signs that customer trust in RBS is stabilising and starting to improve. NatWest has consistently performed competitively, and has shown early signs of improvement.
We will continue to aim for improvement through a secure, consistent and reliable service, and an unrelenting focus on our customers.
Business model and strategy
Our transformation priorities
Cost
Note: (1) Excludes restructuring, conduct and litigation costs, intangible write-off charges as well as the operating costs of Citizens Financial Group and Williams & Glyn.
Capital
Reshaping the bank
Business model and strategy
Our Operating Model
We have a clear set of Organisation Design principles that underpin our operating model, structures and accountabilities.
| | The organisation will... | Meaning |
| Customer orientation | ...be easy and effective for customers. | • Primarily organised around customer segments • Delivers the whole bank, seamlessly, to our customers • Decision rights as close as possible to the customer • End-to-end approach to delivering great customer experience |
| One bank | ...be easy and effective for staff. | • No customer units vs functions • Unified culture and leadership • Short simple chains of command • Clear individual accountabilities • Minimum committees to support individual accountabilities |
| Efficiency | ...share all things that can be shared. | • No duplication • Centres of excellence located in primary business or function • Cross-bank sharing of platforms |
| Disciplined and rigorous | ...manage activities end-to-end in one best way. | • Effective process design, ownership and management • Standardisation • Consistent customer experience • Sticking to a long term investment plan to address complex technology environment |
| Safety and soundness | ...help ourselves to do the right thing. | • Strong control functions • Effective three lines of defence • Straightforward policies |
Our Values
Our Values are universal and guide our actions every day, in every part of our business. The values are the foundation of how we work at RBS.
Serving customers
| · | We exist to serve customers. |
| · | We earn their trust by focusing on their needs and delivering excellent service. |
Working together
| · | We care for each other and work best as one team. |
| · | We bring the best of ourselves to work and support one another to realise our potential. |
Doing the right thing
| · | We take risk seriously and manage it prudently. |
| · | We prize fairness and diversity and exercise judgement with thought and integrity. |
Thinking long term
| · | We know we succeed only when our customers and communities succeed. |
| · | We do business in an open, direct and sustainable way. |
Business model and strategy
Our Customers
Our purpose is to serve customers well and we have moved from seven divisions to three customer businesses, so we can better deliver on this. Each of our businesses share the RBS ambition: to be number one for customer service, trust and advocacy.
We have made a number of customer commitments marking our intent to deliver better service to our customers. RBS is making steady progress towards building a simpler, smaller and fairer bank, and remains focused on delivering the commitments for personal and business customers that we announced on 27 February 2014.
We will stop offering deals to new customers that we are not prepared to offer to our existing customers.
Progress:
We now offer our best rates to new and existing customers across our product range. There is now no Personal Banking or Business Banking deal that is not available to existing customers.
We will also ban teaser rates, including zero per cent balance transfers in our credit card business.
Progress:
We have banned teaser rates. We run a fair and transparent credit card business for our customers.
We will stop offering different rates to customers who apply online, in branch or by phoning our call centres.
Progress:
Across our RBS and NatWest brands, pricing is consistent.
We will use simple language in our customer letters, on our websites and in our branches.
Progress:
Customer letters and emails have been simplified for our personal and business customers so they are straightforward and transparent. We have reduced the number of pages on our personal banking website by over 60%. In branches we have fewer, shorter brochures making it easier for customers to find information.
By the end of 2014 we will cut in half the number of personal and SME products on offer.
Progress:
We have reduced the number of Personal and SME products on offer by 50%. We are becoming a smaller, simpler bank to do business with.
We will improve the clarity of our language to customers. By the end of 2014 we will be able to explain all of our personal and SME charges on one side of A4.
Progress:
Fees and charges are explained on one side of A4 for both our personal and business customers and will be communicated via our
internet sites by the end of February 2015.
We have a duty to our customers to provide a straightforward breakdown of all charges.
We will speed up our account opening process for personal customers. We will cut how long it takes to open a personal current account from five days to next day.
Progress:
All customers applying for a personal current account who have the required ID and pass our fraud and credit checks can now open their account the next working day.
We will also improve the process to open a personal current account online so customers can upload their identification, such as their passport, and open their entire account from home.
Progress:
All customers applying for a personal current account who have the required ID and pass our fraud and credit checks can complete their application online and where required, are able to upload key ID documents from home.
By the end of 2014, customers will have access to Mobile Banking and Online Banking within one day.
Progress:
All Personal and Business Banking customers now have access to online banking by the next working day. Existing customers with a debit card now have access to mobile banking the next working day.
We will put Business Bankers back on the high street. We will have hundreds of Business Bankers help small business people open accounts, apply for loans and get the help they need.
Progress:
82% of Business Banking frontline staff are immediately above/next to our branches. This equates to 1,335 Business Banking specialists in branch today. We are simplifying processes so that Business Bankers can spend more time with customers, providing help and advice in branch or via telephone.
We will start making small business lending decisions in five days.
Progress:
We are processing lending decisions quicker. In almost all cases, lending decisions are made and communicated to the customer in five days or less with two-thirds of business lending decisions made locally and/or by sector specialists.
Business model and strategy
Independent Lending Review actions
In 2013, RBS and NatWest launched an Independent Lending Review, led by Sir Andrew Large and management consultants Oliver Wyman. The aim of the review was to identify steps we could take to enhance our support for SMEs. We committed to act and report on the recommendations.
The bank will write to thousands more SMEs setting out clearly how much it is willing to lend to their business.
Progress:
By the end of December 2014, more than 350,000 pro-active ‘Statements of Appetite’ had been issued to SME customers, offering in excess of £12.4 billion of new or additional funding.
A dedicated website will be developed to show clearly what information RBS use to make a lending decision and set out simple, clear steps in its lending process.
Progress:
The website has been developed and can be found at www.businesslending.natwest. com. Guidance is provided to support you in making a successful application and the types of information used to make a decision.
The bank will begin work to enable bankers to make all but the most complex lending decisions in just five days of receipt of all necessary information.
Progress:
In almost all cases, lending decisions are made and communicated to the customer in five days or less.
RBS will ensure two thirds of its lending decisions are made locally and by sector specialists.
Progress:
Over two thirds of lending decisions are now made locally and by sector specialists.
RBS will continue to invest in building the capability of its people with at least 90% of Relationship Managers and Credit Managers professionally qualified.
Progress:
RBS has a milestone plan to achieve this by the end of 2016. We met our 2014 target with 20% of Relationship Managers and Credit Managers now professionally qualified.
RBS will start a programme to make all customers whose loan applications are declined aware of the appeals process, and will continue to work with the Independent Appeals Chair to improve the support it provides to customers going though this process.
Progress:
A website has been developed and can be found at www.businesslending.natwest.com. The section titled ‘Decision’ explains how to appeal and alternative financing options.
The bank will commit to pointing businesses to alternative sources of finance where it cannot support a loan application.
Progress:
In January 2015 RBS announced it is set to give SMEs greater access to finance by formally referring customers to both Funding Circle and Assetz Capital, two alternative finance providers.
RBS aims to become the number one bank for SME customer service in the UK.
Progress:
Our ambition is to be #1 for service, trust and advocacy. We made commitments to our customers in 2014 to help us on this products or services. road, resulting in faster lending decisions, declining complaints volumes and reshaping the objectives of our people.
Customer experience targets will be set for all staff.
Progress:
Staff objectives are focussed on providing a market leading customer experience. Objectives for 2015 have been shared with all staff and include measures to ensure we are providing good customer outcomes.
SME complaints are to be reduced by 50%
Progress:
We have a milestone plan to achieve these reductions by December 2016. We have achieved our reduction target in 2014 with final quarter complaint volumes 22% lower than average quarterly volumes in 2013 by starting to simplify our processes and empowering our staff to make more decisions at first point of contact with our customers.
None of the bank’s services will be conditional on customers buying another product or service with the bank.
Progress:
As at February 2015, none of our SME products or services are conditional on customers buying another of the Bank’s customers in 2014 to help us on this products or services.
The bank will publicly report on progress against these commitments annually.
Progress:
We have reported our progress on www.rbs. com. We will continue to report progress on actions which are on-going through 2015.
Business model and strategy
Key economic indicators
The key market in which RBS operates is the UK. Lending in the UK is closely linked to GDP and growth in the housing market is highly dependent on the level of interest rates. Falling unemployment may have a positive impact on lending as more people are able to afford loans. The profitability of the banking sector is adversely impacted by low interest rates as they squeeze the margin between borrowing and lending. The level of impairments is affected among other things by GDP growth, movements of unemployment rates and interest rates.
The other key economies in which RBS operates are the US and the Republic of Ireland (RoI).
Summary
The UK economy performed relatively well in 2014 with GDP expanding by 2.6% compared with the previous year. By contrast the eurozone’s modest recovery struggled to gain traction as growth of just 0.9% was realised. In Q4 2014 UK GDP was estimated to be 3.4% higher than the pre-crisis peak of Q1 2008. Inflation fell over the course of 2014 on the back of falling food and oil prices. The Consumer Price Index rose just 0.5% in December 2014 compared with December 2013.
The UK labour market performed strongly. In October to December 2014, the number of unemployed people was 486,000 lower than a year earlier. The unemployment rate was 5.7% - the lowest level since the summer of 2008. Real wage growth turned positive in late 2014 after falling almost consistently for over six years. However, this was more a reflection of lower inflation rather than a significant uplift in wage settlements.
Nominal earnings in the three months to December 2014 were 2.1% higher than in the three months to December 2013, approximately twice the pace of a year earlier but still very low on a historical basis.
UK house prices continued to increase through most of 2014 and in December 2014 they were 11.5% higher than at the pre-crisis peak in January 2008. The strength of the UK recovery in 2014 prompted talk of when interest rates will begin to rise. Earlier in the year markets anticipated an increase as soon as in 2014, but at the end of 2014 market expectations were for the first increase to take place in early 2016, given below target UK inflation, exceptionally weak wage growth, a high household debt burden, daunting economic challenges in the eurozone and sluggish global growth.In addition to renewed concerns over the eurozone, other risks to the global economic and financial system continued to build over the course of 2014.
Customer Case Study
Perfect public sector payments
Public sector spending contributes a significant amount to the UK economy. So it’s important that the Government and wider Public Sector have access to a simple, secure and straightforward way of paying for services.
This year we were awarded a place on the ePurchasing Card Solution Framework Agreement for the supply of Commercial card and Management Information solutions that can be used by organisations across the UK public sector including central government, local government, health, education, devolved administrations, emergency services, defence and not-for-profit organisations.
Being awarded a place on the ePurchasing Card Solution Framework Agreement was a true team effort and we’re proud to play our part in helping the UK Government and wider Public Sector to deliver efficient, transparent payment services for making quick payments to a wide range of their suppliers, often including UK SMEs.
Mobile banking on the move
Investing in Technology our customers can rely on
In today’s smartphone, tablet enabled, app driven world, customers are looking for even more choice and flexibility about how, when and where they do their banking.
But we know customers still want to speak to a person for those important life decisions, like buying a home or starting a new business.
We’re responding to the changing needs of our customers by investing £1 billion over the next three years to improve our banking services. As part of this investment we’re refurbishing our entire branch network to create open, bright spaces for customers to talk to us face to face about the things that matter most to them.
For customers who like to do their banking on the move we’re continuing to develop our market-leading mobile banking app, which is used regularly by more than three million customers and supports around 3.5 million logons and half a million payments and transfers every day. We’ve also just become the first bank in the UK to introduce Touch ID fingerprint logons, offering even better security for our customers.
However, this is just one of the ways we’re taking our service to where our customers want us to be. With the UK’s second largest branch network, a 24/7 telephone banking service, the second largest free to use ATM network in the UK and an extended relationship with the Post Office which means customers can now access our basic services in 11,500 branches, customers have never had more choice about how they do their banking.
And for those customers in more remote communities we’ve invested in a further five mobile banking vans, taking our fleet of vans to 23. They join a long, proud tradition of mobile banking services – our first van was introduced in 1946.
Business review
RBS is now structured to deliver its ambition by organising itself around the needs of its customers, so as to combine customer groups with similar needs into franchises able to deliver co-ordinated services.
The reorganised bank will be a UK-focused retail and corporate bank with an international footprint to drive its corporate business. The previously reported operating divisions are now realigned into three franchises and seven operating segments.:
| · | Personal & Business Banking which includes UK Personal and Business Banking and Ulster Bank |
| · | Commercial & Private Banking which includes Commercial Banking and Private Banking |
| · | Corporate & Institutional Banking |
In addition, RBS will continue to manage and report Citizens Financial Group and RBS Capital Resolution as separate operating segments until disposal or wind down.
Total revenue by region 2014(1) | Total income by franchise 2014(1) |
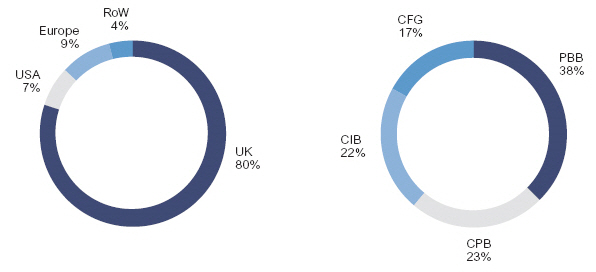 |
(1) Non-statutory
Personal & Business Banking (includes UKPBB and Ulster Bank
Les Matheson
Chief Executive,
Personal & Business Banking
Personal & Business Banking (PBB) serves individual and mass affluent customers together with small businesses (generally up to £2 million turnover), with more business bankers moving back into branches. PBB comprises two segments, UK Personal & Business Banking, including Williams & Glyn, (UK PBB) and Ulster Bank.
Performance overview
| · | PBB recorded an operating profit of £2,056 million (UK PBB - £1,450 million, Ulster £606 million), up £2,846 million (UK PBB – up £631 million, Ulster up £2,215 million). |
| · | Net interest income increased by £210 million or 4% (UK PBB - £193 million, 4%, Ulster £17 million, 3%) with strong improvements in deposit margins and volume growth. This was partly offset by lower asset margins linked to the continued change in the mix of loan book towards secured lending and lower mortgage margins. |
| · | Operating expenses decreased by £279 million or 5% (UK PBB - £174million reduction, 4%, Ulster £105 million reduction, 15%), reflecting lower restructuring and litigation and conduct costs. |
| · | Mortgage balances increased by £2.4 billion or 2% (UK PBB increase £3.9 billion, 4%, Ulster £1.5 billion decrease, 8%), to £121 billion driven by strong performance as advisor capacity increased. |
Building a better bank that serves customers well
The strategic goal of PBB is to become the number one personal and business bank for customer service, trust and advocacy in the UK. Following completion of a strategic review, Ulster Bank was confirmed as a core part of RBS, offering a good strategic fit with RBS’s retail and commercial strategy.
Throughout 2014, the business has made steady progress in making banking fairer and simpler for its customers through a number
of fair banking initiatives and technology investments.
These Included:
| · | extending services to the Post Office network. |
| · | removing 0% teaser deals from its offering and introducing the new Clear Rate and cash-back credit cards in 2014. RBS became the first of the main high street banks to ensure all of its savers get the same or better deals as new customers. |
| · | further developing online and mobile banking services to support the upward trend in digital transaction volumes. |
At the end of December 2014 we had c.3 million active users of our Personal Mobile App in the UK
Simple transactions can be done in 11,500 Post Offices across the UK
| | | 2014 | Total | | | 2013 | Total |
| Performance highlights | UK PBB | Ulster Bank | PBB | | UK PBB | Ulster Bank | PBB |
| Return on equity (%) | 19.4 | 16.1 | 17.5 | | 9.8 | (33.2) | (5.7) |
| Net interest margin (%) | 3.68 | 2.27 | 3.42 | | 3.56 | 1.88 | 3.21 |
| Cost:income ratio (%) | 72 | 71 | 71 | | 77 | 81 | 78 |
| Net loans and advances to customers (£bn) | 127.2 | 22 | 149.2 | | 124.8 | 26 | 150.8 |
| Customer deposits (£bn) | 148.7 | 20.6 | 169.3 | | 144.9 | 21.7 | 166.6 |
| Loan:deposit ratio (%) | 86 | 107 | 88 | | 86 | 120 | 91 |
| Risk-weighted assets (£bn) | 42.8 | 23.8 | 66.6 | | 51.2 | 30.7 | 81.9 |
| (1) | RWAs at 31 December 2013 are on Basel 2.5 basis and on the end-point CRR basis at 31 December 2014. |
Customer Case Study
Fairer Banking
We’ve made a conscious decision to be different from other banks. In 2014, we made a series of customer commitments which aimed to make banking simpler, fairer and clearer for our customers.
In an industry leading move we stopped offering teaser rates to attract new customers and guaranteed customers the same rates, whether they chose to bank online, through a branch or over the phone. As part of this we became the first bank on the high street to commit to giving all our savers the same rates, no matter how they chose to bank with us. We’ve also simplified our products, so it’s easy for our customers to find the right one for their needs – and with all our charges explained on just one page, it’s easy to understand the terms and conditions too.
In March we stopped offering 0% balance transfer credit cards. This type of card was designed to make it easier for customers to repay existing credit card debt, but our research showed that debt tended to increase, rather than reduce over the term. Stopping these cards meant around 100,000 customers transferred to a low, ongoing rate with no chance of being caught out by a big jump in their interest rate down the line.
We’re making changes for business customers too 95% of business lending decisions are now made within five days and gross business lending is up 30% from 2013. Plus, we’ve committed an extra £1 billion to support small businesses with fee-free, fixed rate loans.
Commercial & Private Banking (includes Commercial Banking and Private Banking)
Alison Rose
Chief Executive,
Commercial & Private Banking
Commercial & Private Banking (CPB) serves commercial and mid-corporate customers and high net worth individuals, deepening relationships with commercial clients, operating overseas through its market-leading trade and foreign exchange services, while connecting our private banking brands more effectively to successful business owners and entrepreneurs. CPB comprises two reportable segments, Commercial Banking and Private Banking.
Performance overview
| · | CPB recorded an operating profit of £1,440 million, (Commercial Banking - £1290 million, Private Banking - £150 million) compared with £469 million in the prior year (Commercial Banking - £530 million profit, Private Banking £150 million loss). |
| · | Net interest income increased by £112 million or 4%, (Commercial Banking £79 million, 4%, Private Banking £33 million, 5%) largely reflecting re-pricing activity on deposits partly offset by the impact of reduced asset margins, a result of the net transfer in of lower margin legacy loans (after the cessation of Non-Core). |
| · | Total expenses were down £304 million or 10%, (Commercial Banking - £131 million, 7%, Private Banking - £173 million, 16%) reflecting lower litigation and conduct costs, primarily relating to interest rate swap redress, and lower underlying direct costs. |
| · | RWAs were £2.3 billion lower, (Commercial Banking - £1.8 billion lower, 3%, Private Banking - £0.5 billion lower, 4%) at £75.5 billion (Commercial Banking - £64 billion, Private Banking -£11.5 billion), primarily reflecting net transfers to RCR, effective 1 January 2014, and improving credit quality on the back of UK economic recovery, offset by loan growth. |
Building a better bank that serves customers well
| · | Within Commercial Banking over 120 products were removed from sale and over 400 process improvements implemented. |
| · | There has been an improvement in the Net Promoter Score and rating of overall service quality across the business, together with a continuing fall in complaints. |
| · | The first out of eight accelerator hubs opened in February 2015, offering free space, support and advice to high growth business owners. |
| · | Within Private Banking the business has progressed well against key priorities in 2014. Improvements are evidenced by several industry awards including: ‘Best private bank in the UK’ (PWM/ The Banker) and ’Most innovative digital offering’ (Private Banker International).Coutts continues to be recognised as a leader in philanthropy, with its ’$1 million donors’ report receiving significant media coverage, and its expertise as an adviser for family businesses and existing entrepreneurs remains a strong point of differentiation. |
Within Commercial Banking over 120 products were removed from sale and over 400 process improvements implemented.
The first of eight accelerator hubs offering free space, support and advice to high growth business owners opened to as part of our plan to support UK entrepreneurs.
| | | 2014 | Total | | | 2013 | Total |
| Performance highlights | Commercial Banking | Private Banking | CPB | | Commercial Banking | Private Banking | CPB |
| Return on equity (%) | 12.6 | 7.8 | 11.9 | | 49 | (3.1) | 3.7 |
| Net interest margin (%) | 2.74 | 3.71 | 2.93 | | 2.64 | 3.74 | 2.81 |
| Cost:income ratio (%) | 57 | 87 | 65 | | 63 | 122 | 73 |
| Net loans and advances to customers (£bn) | 85.1 | 16.5 | 101.6 | | 83.5 | 16.7 | 100.2 |
| Customer deposits (£bn) | 86.8 | 36.1 | 122.9 | | 90.7 | 37.2 | 127.9 |
| Loan:deposit ratio (%) | 98 | 46 | 83 | | 92 | 45 | 78 |
| Risk-weighted assets (£bn) | 64 | 11.5 | 75.5 | | 65.8 | 12 | 77.8 |
RWAs at 31 December 2013 are on Basel 2.5 basis and on the end-point CRR basis at 31 December 2014.
Customer Case Study
A helping Hertz
The summer season sees a surge in tourists visiting the UK, many of whom want to hire a car.
For leading car rental company Hertz this poses a unique challenge - how to efficiently fund the required increase in its fleet size to meet the demand of the summer months? A Lombard customer for 30 years, Hertz turned to us to help them find an answer.
Working with teams across the bank, we were able to provide a short-term seasonal increase to Hertz UK’s core fleet financing facility giving them the flexibility they needed to manage their peak requirements in line with demand.
Chris Cooper, Director of Lombard Strategic Fleet Finance said, “This is an excellent example of us working together and thinking long term for the benefit of both the client and the bank. This deal cements our position as a strategic partner to Hertz and provides a platform for further seasonal support.”
Corporate & Institutional Banking
Rory Cullinan
Executive Chairman,
Corporate & Institutional Banking and Capital Resolution
Corporate & Institutional Banking (CIB) serves our corporate and institutional clients primarily in the UK and Western Europe, as well as those US and Asian multinationals with substantial trade and investment links in the region, with debt financing, risk management and trade services, focusing on core product capabilities that are of most relevance to our clients. This business’s strategy has been revised in 2015 (see page 15 for Reshaping our CIB business).
Performance overview
| · | CIB recorded an operating loss of £892 million compared with a loss of £2,882 million in 2013. |
| · | Total income declined by 21%, reflecting reduced deployment of resources and difficult trading conditions, characterised by subdued levels of client activity and limited market volatility. |
| · | Operating expenses fell by £2,360 million driven primarily by lower litigation and conduct costs. Operating expenses excluding litigation and conduct costs of £994 million (2013 - £2,441 million) and restructuring costs of £295 million (2013 - £202 million), decreased by £1,006 million, or 22%, reflecting the continued focus on cost savings across both business and support areas. |
| · | Net impairment releases totalled £9 million compared with a net impairment charge of £680 million in 2013, reflecting a reduction in latent loss provisions and a low level of new impairments. |
| · | Funded assets fell by 10% reflecting the focus on core product areas including the wind-down of Credit Trading and the US ABP businesses. |
| · | RWAs were managed down by £40.0 billion from £147.1 billion on 1 January 2014 to £107.1 billion on 31 December 2014. |
Building a better bank that serves customers well
CIB focused on its strengths in core product areas during 2014, reducing the scale of the business and simplifying the operating model. This allowed CIB to better serve customers while deploying fewer resources.
The commitment to customers was demonstrated by the award of The Banker’s Most Innovative Bank in Risk Management in Q3 2014 and by winning IFR magazine’s Sterling Bond House of the year award in Q4 2014.
The drive to concentrate on core products is evidenced by the 27% fall in RWAs (compared with 1 January 2014 on an end-point CRR basis) and the 22% year on year fall in expenses (excluding litigation and conduct costs of £994 million (2013 - £2,441 million) and restructuring costs of £295 million (2013 - £202 million).
| Performance highlights | 2014 | 2013 |
| Return on equity (%) | (4.2) | (12.9) |
| Cost:income ratio (%) | 123 | 144 |
| Net loans and advances to customers excluding reverse repos (£bn) | 72.8 | 68.2 |
| Customer deposits excluding repos (£bn) | 59.4 | 64.8 |
| Risk-weighted assets (£bn) | 107.1 | 120.4 |
Note: RWAs at 31 December 2013 are on Basel 2.5 basis and on the end-point CRR basis at 31 December 2014.
Customer Case Study
Manchester takes off
Manchester Airports Group (MAG) owns and operates four UK airports including Manchester, the UK’s third largest airport, and London Stansted, the fastest growing airport in London. They serve over 45 million passengers and handle more than 600,000 tonnes of freight every year, contributing over £4 billion to the UK economy and directly supporting around 45,000 full-time jobs.
Our long-standing relationship with MAG has seen us support both their £1.5 billion acquisition of London Stansted in 2013, and two bond issuances which raised a total of £810 million. Those funds allowed MAG to refinance the acquisition debt used to buy London Stansted, and gave them a platform to invest in services and facilities at their airports.
A good example of their investment is the multi-million pound upgrade of the terminal at London Stansted. The expansion will double the size of the security space, expand the departure lounge and help create a new lounge area in the terminal building.
Citizens Financial Group
Bruce Van Saun
Chairman and Chief Executive Officer, Citizens Financial Group, Inc.
Citizens Financial Group, Inc. (CFG) provides financial services primarily through the Citizens and Charter One brands. CFG is engaged in retail and corporate banking activities through its branch network in 11 states in the United States and through non-branch offices in other states.
RBS disposed of 29.5% of its interest in Citizens Financial Group, Inc. during the second half of 2014 primarily through an initial public offering in the USA.
Performance overview (1)
| · | Operating profit increased by £156 million ($306 million), or 26%, to £761 million ($1,253 million), reflecting the Q2 2014 gain on the sale of the Illinois franchise. The former Non-Core portfolio is now included and indirect expenses are no longer allocated on a prospective basis from 1 January 2014. |
| · | Net interest income was up £121 million ($357 million), or 6%, to £2,013 million ($3,317 million) driven by a larger investment portfolio, loan growth including the transfer of assets from Non-Core, the benefit of interest rate swaps and deposit pricing discipline. |
| · | Excluding restructuring costs of £103 million ($169 million) (2013 £16 million ( $24 million)), total expenses were down £168 million ($96 million), or 3%, to £2,020 million ($3,328 million) driven by the removal of indirect costs in 2014 and the impact of the Illinois franchise sale partially offset by lower mortgage servicing rights impairment release and higher consumer regulatory compliance costs. |
| · | Average loans and advances were up 10% driven by the $3.4 billion transfer of assets from Non-Core, commercial loan growth, auto loan organic growth and purchases of residential mortgages and auto loans, which were partially offset by a reduction in home equity loans. |
| · | Average customer deposits were up 4%. On a US dollar basis average customer deposits were down 2% with planned run-off of high priced deposits. |
Building a better bank that serves customers well
The initial public offering of CFG was successfully completed in September 2014 and RBS’s interest in CFG stood at 70.5% of shares outstanding at 31 December 2014.
Further share sales are planned in 2015 and RBS intends to fully divest the business by the end of 2016.
| (1) | 2014 results are not directly comparable with prior year periods; prior year results exclude Non-Core operations and include indirect expenses. In the context of the planned disposal of Citizens Financial Group, indirect expenses are no longer allocated to the segment. |
| Performance highlights | 2014 £ | 2014 $ | 2013 £ | 2013 $ |
| Return on equity (%) | 6.6 | 6.6 | 5.7 | 5.7 |
| Cost:income ratio (%) | 69 | 69 | 74 | 74 |
| Net loan and advances to customers (bn) | 59.6 | 93.1 | 50.3 | 83.2 |
| Customer deposits excluding repos (bn) | 60.6 | 94.6 | 55.1 | 91.1 |
| Loan:deposit ratio (%) | 98 | 98 | 91 | 91 |
| Risk-weighted assets (bn) | 68.4 | 106.8 | 56.1 | 92.8 |
Note: RWAs at 31 December 2013 are on Basel 2.5 basis and on the end-point CRR basis at 31 December 2014.
RBS Capital Resolution
Rory Cullinan
Executive Chairman,
Corporate & Institutional Banking and Capital Resolution
RBS Capital Resolution (RCR) became fully operational on 1 January 2014 with a pool of c.£29 billion of funded assets with particularly high long-term capital intensity, credit risk and/or potentially volatile outcomes in stressed environments. RCR brings assets under common management and increases focus on the run down so as to release capital.
Performance overview
| · | RCR funded assets were reduced by £14 billion, or 48%, during 2014, driven by disposals and repayments. |
| · | RWA equivalent decreased by £38 billion, or 58%, during 2014. This primarily reflects disposals and repayments, supplemented by methodology changes and lower market risk RWAs. |
| · | Operating profit of £988 million reflects impairment provision releases and higher than anticipated sale prices for assets driven by a combination of strong execution and favourable market conditions particularly in Ireland. |
| · | The net effect of the £988 million operating profit and RWA equivalent reduction of £38 billion (1) was CET1 accretion of £4.8 billion. |
Building a better bank that serves customers well
RCR is managed and analysed in four asset management groups - Ulster Bank (RCR Ireland), Real Estate Finance, Corporate and Markets. Real Estate Finance excludes commercial real estate lending in Ulster Bank.
Note:
| (1) | Capital equivalent: £3.8 billion at an internal CET1 ratio of 10%. |
2014 saw many of RCR’s larger deals completed - around 360 of them.
| Performance highlights | 31 December 2014 | 1 January 2014 |
| Risk-weighted asset equivalent (£bn) | 27.3 | 65.0 |
| Risk-weighted assets (£bn) | 22.0 | 46.7 |
| Funded assets (£bn) | 14.9 | 28.9 |
Services
Simon McNamara
Chief Administrative Officer
Services plays a vital part in building loyalty with every customer interaction we have; from putting money in the ATMs, to keeping our customers safe from fraud, processing trillions of pounds in payments across the world, and making sure the bank’s technology systems are there for our customers when they need them. We keep RBS running, driving efficiency and resilience in everything we do to support our customers 24 hours a day, 365 days a year. For reporting purposes, Services are allocated to the operating segments. It is not deemed as a reportable segment.
Here are just some of the ways we’ve worked to build customer trust in 2014:
We’re more resilient
| · | The performance of our systems has improved with each one of our 130 services available to customers over 99.96% of the time. Through this work, in the second half of the year we have reduced system downtime by 79%. |
| · | Our mirror bank capability now lets our customers access critical services in the event of a system outage. We can now process 90% of debit and credit card transactions for customers during an outage and they can view mini-statements and balances on mobile and online banking systems. |
| · | We upgraded our service to improve stability and reduce the risk of outages associated with our core international payments infrastructure. This has resulted in a significant reduction in the number of outages we experience. |
| · | We upgraded the infrastructure that supports our mobile banking service improving the stability, capacity and availability of this service for customers. |
| · | On ‘Black Friday’ our systems supported high volumes and values across a number of our customer channels in the UK, including record-breaking figures for our mobile banking app. |
We’re simpler
| · | We implemented a new operating model for Services, fully aligned to the customer franchises in Personal & Business Banking, Commercial & Private Banking and Corporate & Institutional Banking, and RBS Capital Resolution. We reduced the number of properties we use by 200 to 2,500 today, including some major properties in London. |
| · | Through our Simplifying Customer Life programme, we implemented over 4,000 ideas, generating improvements covering more than 2.6 million customer interactions. |
| · | We used data and analytics to simplify pricing for our Instant Access Savings product (reducing from 70 to 2 different price points) - improving the savings rate for 4.5 million customers in the process. |
We’re more efficient
| · | We contributed around £500 million to the bank’s cost reduction target. |
| · | We refocused and prioritised our investment and transformation plans, reducing the number of projects we run from 550 to 182. |
| · | We reduced the amount of cash spend on third parties by £800 million, a 17% reduction from 2013. |
| · | We have invested in our data and customer technology, allowing us to personalise content presented to customers in over 1.2 billion interactions (across digital, telephony and face to face). |
We’re more innovative
| · | We initiated 23 proof of concepts, and generated a pipeline of over 450 ideas, through our innovation scouting network around the world. |
| · | We teamed up with Silicon Valley-based start-up TokBox, to trial cutting edge video conferencing technology, which increases choice and convenience for customers and entrepreneurs. |
| · | We increased the number of active mobile banking users by around 600,000 customers to 2.9 million, with over 1 billion logins. |
| · | We transformed 127 branches through our Points of Presence programme and installed Wi-Fi in almost 2000 sites for customers and colleagues. |
Customer Case Study
Malted magic
Muntons supplies malt – an important ingredient in products like beer, whisky and confectionery – to a range of blue-chip customers.
UK owned and based in Suffolk, the firm uses only British barley to make their malt. To successfully build their business and compete on a bigger stage, they knew they would have to increase their global footprint. A recent joint venture in Thailand has added to their sales presence in the USA and Asia, supported by us.
Earlier this year Muntons invested £5.4 million in an anaerobic digestion plant at their Stowmarket headquarters, partly funded by RBS Invoice Finance with an asset-based lending package. This facility will help them manage the major capital spend they’ll need to meet their ambitious growth targets both at home and abroad.
Governance at a glance
Board and committee activity remained busy during 2014 with a number of key strategic issues taking centre stage including the delivery of the strategic plan agreed in February 2014. Board committees continued to play a crucial role in our governance framework, undertaking their complex work comprehensively and effectively supporting the work of the Board.
Conduct and regulatory investigations have been key areas of focus and our 2014 results reflect the impact that conduct related matters continue to have on financial and operating performance. The Board will continue to drive cultural change and it is essential that our governance framework continues to evolve to support this.
During 2015, the Board will continue to focus on our key priorities, including customers, conduct, capital and funding, risk and delivery of the strategic plan.
Philip Hampton
Chairman of the Board of directors
Our Board
The Board has ten directors comprising the Chairman, two executive directors and seven independent non-executive directors, one of whom is the Senior Independent Director. Biographies for each director and details of which Board Committees they are members of can be found on pages 47 to 50.
There were a number of changes to the Board’s composition during 2014, details of which can be found in the Chairman’s Statement on page 8.
The Board is collectively responsible for the long-term success of RBS and delivery of sustainable shareholder value. Its role is to provide leadership of RBS within a framework of prudent and effective controls which enables risks to be assessed and managed.
We conducted an internal evaluation of the effectiveness of the Board and its committees in 2014, led by the Chief Governance Officer and Board Counsel. The evaluation has concluded that the Board is operating effectively but has identified some areas for improvement which we will focus on during 2015.
Our Board committees
In order to provide effective oversight and leadership, the Board has established a number of Board committees with particular responsibilities. The work of the Board committees is discussed in their individual reports.
The terms of reference for each of these committees is available on rbs.com and copies are also available on request from RBS Corporate Governance and Secretariat.
Group Nominations Committee
Assists the Board in the selection and appointment of directors. It reviews the structure, size and composition of the Board, and membership and chairmanship of Board committees.
The Group Nominations Committee report is set out on pages 56 and 57.
Group Audit Committee
Assists the Board in discharging its responsibilities for monitoring the quality of the financial statements of RBS. It reviews the accounting policies, financial reporting and regulatory compliance practices of RBS. It also exercises oversight over systems and standards of internal controls, and monitors RBS’s processes for internal audit and external audit.
The Group Audit Committee report is set out on pages 58 to 62.
Board Risk Committee
Provides oversight and advice to the Board on current and potential future risk exposures of RBS and future risk strategy. It reviews RBS’s compliance with approved risk appetite and oversees the operation of the RBS Policy Framework and submissions to regulators.
The Board Risk Committee report is set out on pages 63 to 69.
Board of directors and Executive Committee
Board
Chairman
Philip Hampton
Executive directors
Ross McEwan
Ewen Stevenson
Non-executive directors
Sandy Crombie (Senior Independent Director)
Alison Davis
Morten Friis
Robert Gillespie
Penny Hughes
Brendan Nelson
Baroness Noakes
Chief Governance Officer and Board Counsel
Aileen Taylor (Company Secretary)
Executive Committee
The Board is supported by the Executive Committee comprising the executive directors and other senior executives. Details of the composition of the Executive Committee and biographies of its members can be found at www.rbs.com>about us>corporate governance>ceo and board >executive committee
RBS Capital Resolution (RCR) Board Oversight Committee
Provides oversight of RCR’s progress against, and compliance with, its primary objective and asset management principles.
The RCR Board Oversight Committee report is set out on pages 70 and 71.
Sustainable Banking Committee
Responsible for overseeing and challenging how management is addressing sustainable banking and reputation issues, considering the long term interests of all stakeholder groups.
The Sustainable Banking Committee report is set out on pages 72 and 73.
Group Performance and Remuneration Committee
Responsible for approving remuneration policy and reviewing the effectiveness of its implementation. It also considers
senior executive remuneration and makes recommendations to the Board on the remuneration of executive directors.
The Director’s Remuneration report is set out on pages 74 to 95.
Executive Committee
Supports the Chief Executive in managing RBS’s businesses. It reviews and debates relevant items before consideration by the Board. It is responsible for determining and delivering RBS’s strategy and it monitors and manages financial performance, capital allocations, risk strategy and policy, risk management, operational issues and customer issues.
UK Corporate Governance Code
Throughout the year ended 31 December 2014, RBS has complied with all of the provisions of the UK Corporate Governance Code issued by the Financial Reporting Council dated September 2012 except in relation to provision (D.2.2) that the Group Performance and Remuneration Committee should have delegated responsibility for setting remuneration for the Chairman and executive directors. RBS considers that this is a matter which should rightly be reserved for the Board.
Risk overview
Capital developments
RBS continued to make good progress in reducing risk and strengthening its capital position. The Common Equity Tier 1 (CET1) ratio improved by 260 basis points to 11.2% and the leverage ratio by 80 basis points to 4.2%.
The key factors were:
| · | RCR disposals and run-off in 2014 which led to a reduction in funded assets of £14 billion and in risk-weighted asset equivalent of £38 billion (58% of the RCR start point). |
| · | RCR was established with effect from 1 January 2014 to remove risk from the balance sheet, reduce volatile outcomes in stressed environments and to accelerate the release of capital over a three year period. |
| · | A £40 billion reduction in CIB’s risk- weighted assets (RWAs), including an orderly run-down of US asset-backed product business. |
| · | Disposal of €9 billion of legacy available- for-sale securities, thereby reducing stressed capital and RWAs. |
Despite these and other risk reduction measures, RBS’s capital position was close to thresholds under adverse stress scenarios, as evidenced by the European Banking Authority.
(EBA) and Bank of England (BoE) stress test results published in the second half of 2014:
| · | EBA: 2016 CET1 ratio (based on 2013 accounts) under the modelled EBA adverse scenario was 5.7%, marginally above the minimum requirement of 5.5%. |
| · | BoE: CET1 ratio under the hypothetical BoE adverse scenario was 4.6% at the end of 2016, slightly above the 4.5% post- stress minimum ratio threshold set by the BoE. After taking account of management actions, the adjusted ratio was 5.2%. |
Other risk developments
| · | Conduct, regulatory, litigation and reputational risk: RBS continued to be affected by conduct issues. Litigation and conduct costs, including those relating to Payment Protection Insurance, Interest Rate Hedging Products, London Interbank Offered Rate (LIBOR), US mortgage securitisations and foreign exchange trading, have exceeded £9 billion since 2011 and continued to demand significant amount of management attention. |
| · | Operational risk: RBS’s ongoing transformation is complex and wide- ranging, affecting all business areas and functions. In 2014, a new functional operating model was implemented to embed standardisation and consistency of approach to the management of operational risk. Significant investments were made to improve technology resilience for core banking services. In addition, enhancements were made to cyber security programmes. |
| · | Liquidity: A strong liquidity position was maintained, with a liquidity portfolio of £151 billion at the end of 2014 covering short-term and total wholesale funding by factors of over five and 1.5 respectively. Liquidity coverage ratio was 112% and the net stable funding ratio was 121% at the end of 2014. |
| · | Credit risk: 2014 saw a net release of £1.2 billion of impairment provisions, principally in RCR and Ulster Bank reflecting sustained improvements in economic and asset market conditions in the UK and Ireland. RBS continued to reduce its risk concentrations, notably in commercial real estate and eurozone periphery countries. RBS still has substantial credit risk exposures with credit risk RWAs of £295 billion compared with £357 billion at the end of 2013, a 17% reduction. |
| · | Market risk: RBS’s traded market risk profile decreased significantly, with market risk limits being reduced across all businesses. Average trading VaR decreasing to £27.8 million, 35% of the 2013 average. Market risk RWAs also decreased by £6.3 billion to £24 billion. |
| · | Country risk: RBS maintained a cautious stance as many clients continued to reduce debt levels. Total eurozone periphery net balance sheet exposure decreased by £10 billion or 25% to £31 billion. Total exposure to Greece was £0.4 billion but only £120 million after taking into account collateral and guarantees. |
| · | Pension risk: The triennial actuarial funding valuation of the main scheme, agreed in May 2014, showed the value of liabilities exceeded the value of assets by £5.6 billion at 31 March 2013, a ratio of assets to liabilities of 82%. To eliminate this deficit, RBS has agreed to pay additional contributions: £650 million from 2014 to 2016 and £450 million (indexed for inflation) from 2017 to 2023. These contributions are in addition to regular annual contributions of around £270 million. |
Top and emerging risk scenarios
A number of top and emerging risk scenarios attracted particular attention.
Macro-economic and other external risks
| · | Risks related to the macro-economy: A number of scenarios could have a significant negative impact on RBS’s revenues and impairments, including a recession in the UK or any of the other major markets in which RBS operates, large falls in UK or Irish property prices, oil prices, a resumption of the eurozone crisis, global deflation or major geopolitical instability. To mitigate these risks, capital, liquidity and leverage ratios have been strengthened, and some higher risk and capital intensive portfolios have been exited. |
| · | An increase in obligations to support pension schemes: If economic growth stagnates, and interest rates remain low, the value of pension scheme assets may not be adequate to fund the pension schemes’ liabilities. The deficit in RBS pension schemes as determined by the most recent triennial valuations has increased, requiring RBS to increase its current and future cash contributions to the schemes as noted above. Depending on the economic and monetary conditions and longevity of scheme members prevailing at that time, the deficit may rise further at the next valuation in 2016. To limit pension risk, defined benefit pension schemes have been closed to new members since 2006 and terms for existing members have been altered in recent years. |
| · | The impact of the 2015 UK general election on performance and strategy: Ahead of the upcoming UK election in May 2015, there is uncertainty around how the policies of a newly elected government may affect RBS. The implementation of new policies could significantly affect the operating employment environment and the fiscal, monetary, legal and regulatory landscape. |
Conduct, litigation and reputational risk
| · | Risks to income, costs and business models arising from regulatory requirements: RBS is exposed to the risk of further increases in regulatory capital requirements as well as risks related to new regulations that could affect its business models. Regulatory intervention may result from a competition review of the personal current account and small business banking markets; the ring-fencing proposals from the Independent Commission on Banking or failure to implement the Basel Committee on Banking Supervision’s Risk Data Aggregation and Reporting principles. RBS considers the implications of proposed or potential regulatory requirements in its strategic and financial plans. |
| · | The impacts of past business conduct: Future conduct and litigation charges could be substantial. RBS is involved in ongoing class action litigation, securitisation and mortgage-backed securities related litigation, investigations into foreign exchange trading and rate- setting activities, continuing LIBOR related litigation and investigations, anti-money laundering, sanctions, mis-selling and compliance related investigations as well as a number of other matters. Settlements in relation to foreign exchange may result in additional financial, non-monetary penalties and collateral consequences, which may be material. RBS is embarking on a programme to embed a strong and comprehensive risk and compliance culture. |
Risk related to RBS’s operations
| · | Impact of Cyber attacks: Cyber attacks are increasing in frequency and severity across the industry. RBS has participated in industry-wide cyber attack simulations in order to help test and develop defence planning. To mitigate the risks, a large- scale programme to improve user access controls is in place. Action has also been taken to reduce the number of external websites and tighten management of them, to strengthen anti-virus protections, and to continue the staff education programme on information protection. |
| · | Failure of information technology systems: RBS’s information technology systems may be subject to failure. As such systems are complex, recovering from failure is challenging. To mitigate these risks, a major investment programme has significantly improved the resilience of the systems and more benefits are expected. Back-up system sustainability has improved, and a ‘shadow bank’ system, to provide basic services, if needed, has been created. |
| · | Increased losses arising from a failure to execute major projects successfully: The successful execution of major projects, including the transformation plan, the recently announced restructuring of CIB and the divestment of Williams & Glyn, is essential to meet RBS’s strategic objectives. These projects cover organisational structure, business strategy, information technology systems, operational processes and product offerings. RBS is working to implement change in line with its project plans while assessing the risks to implementation and taking steps to mitigate those risks where possible. |
| · | Inability to recruit or retain suitable staff: RBS is going through a period of strategic and organisational change, leading to the need to implement new business strategies to respond to a changing external environment. Strong competition for staff from peers, the impact of remuneration regulations, and the implications of the new Bank of England Senior Managers Regime may contribute to this risk. |
A description of summary rick factors is included on pages 110 to 112 and a full description of the principal risks facing RBS is set out on pages 466 to 484.
“Our ambition is to shape the communities we serve in a positive way. We recognise that we still have a long way to go to achieve this position across our business.
Sustainability is therefore not just about the many responsibilities and obligations that RBS has, but about taking leadership on a broad range of issues that are important to our stakeholders.”
Andrew Cave, Chief Sustainability Officer
Sustainability
Sustainability at RBS means building trust through long term thinking that focuses on our customers and supporting the communities in which they live. We are committed to being open and transparent regarding the challenges faced by our business, so all our stakeholders can see what we are doing to become a more sustainable bank. You can read more about the issues raised here, as well as about our wider sustainability agenda, at rbs.com/sustainable.
Governance
The sustainability programme at RBS is built on a robust governance framework that provides direction to our sustainability priorities. The Sustainable Banking Committee is a Group Board Committee and membership comprises three independent non-executive directors. The Committee is chaired by independent non-executive director Penny Hughes and attended by senior representatives from the customer-facing businesses as well as Human Resources, Sustainability, Risk, Conduct and Regulatory Affairs, Communications and Marketing, Corporate Services and Strategy. The Chairman of the Board also regularly attends meetings. The work of the Committee is essential to ensuring that our approach to issues is managed effectively and debated at the appropriate level.
The Sustainable Banking Committee has overseen a number of important developments within RBS since it was established in 2010. In 2014 the strategic direction of the Committee was refocused under the themes of bank-wide reputation and trust, Serving Customers and Sustainability/Emerging Issues. For more information see the report of the Committee Chairman on pages 72 and 73.
Stakeholder engagement
Operating in a sustainable manner is about managing our business in a way that takes account of the impact of our activities on our stakeholders. As such, we work with a number of stakeholder groups to understand their views of our organisation, and this helps shape the way we do business. As a large company we have many stakeholders and we engage with them in a variety of ways, from focus groups to meetings to online forums. These interactions inform decision making and ultimately improve RBS.
As part of our wider stakeholder engagement programme, the Sustainable Banking Committee runs its own programme of structured stakeholder engagement sessions. In 2014, the Committee took part in six of these stakeholder sessions which act as open forums where advocacy groups and experts can discuss key areas of concern with the most senior decision-makers in RBS.
We will continue to host these sessions to ensure that we understand our stakeholders’ priorities. For more information see the report of the Committee Chairman on pages 72 and 73.
External commitments
RBS is a signatory to a number of voluntary sustainability commitments and standards. We understand that implementing commitments is an ongoing process, and we are continuously working to integrate these into how we run our business.
Sustainability
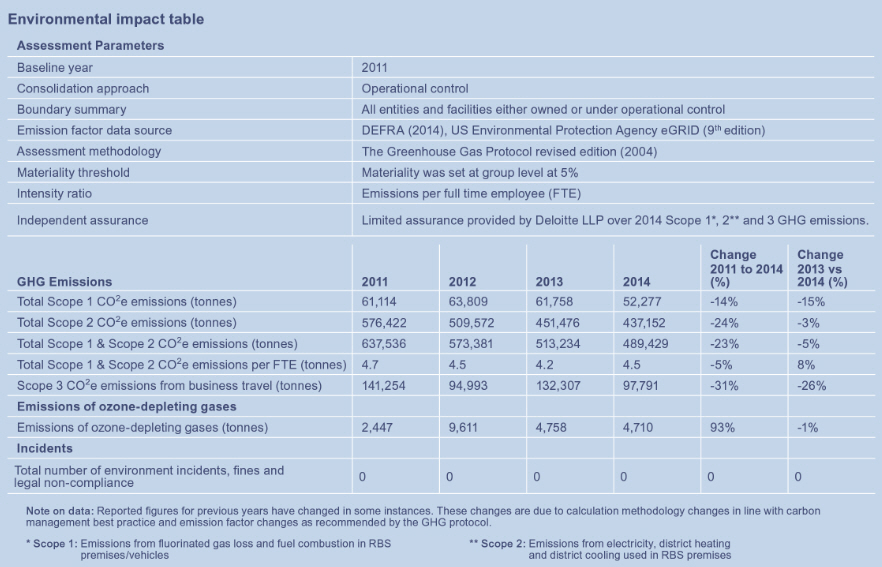
We are a member of the Equator Principle (EP) Association Steering Committee. The EPs are a voluntary set of standards adopted by banks for determining, assessing and managing social and environmental responsibilities in project financing and project related corporate loans. We will not provide project finance where the borrower will not, or cannot, comply with these principles of socially responsible investment.
We are also on the Steering Committee of the UK United Nations Global Compact (UNGC) network. The UNGC is the leading platform for the development, implementation and disclosure of responsible policies and practices in the areas of: human rights, labour, environment and anti-corruption.
Each year RBS receives ratings for its environmental and social performance by external indices. RBS has been included in the Dow Jones Sustainability World Index (DJSI) every year since its launch in 1999, maintaining our best ever score of 82 for a second year in 2014. The DJSI ranks companies’ corporate sustainability performance, based on analysis of economic, environmental and social issues like corporate governance, risk management, branding and climate change.
The CDP is an independent, investor-driven organisation which facilitates the measurement and disclosure of greenhouse gas emissions for 2,500 organisations in over 60 countries. In 2014 RBS received a disclosure score of 98% and a performance score B.
The FTSE4Good Index Series measures the performance of companies that meet globally recognised corporate responsibility standards. RBS has been included in the FTSE4Good since it was launched 11
years ago.
Transparency and disclosure
At RBS, we have a long way to go to rebuild trust after everything that the company has been through. We are taking a very deliberate approach to be as open as possible about our business, including on-going challenges as well as progress. We were therefore particularly pleased in 2014 to have been ranked as the leading UK company in Transparency International’s report on transparency in corporate reporting. In this Strategic Report we present data on our GHG emissions, diversity and our approach to human rights. More sustainability data is contained in our latest Sustainability Report and online at rbs.com/ sustainable.
Managing our impact on the environment
We aim to be recognised as a leader among large global financial institutions in managing our own environmental impacts and developing financial services that support sustainable development.
The activities of RBS and those of our clients can present a number of Environmental, Social and Ethical (ESE) risks and it is our responsibility to manage these risks. We have a robust ESE policy framework, with sector specific policies relating to high risk sectors including oil and gas, mining and metals and forestry. Data on client assessments against these policies is included in the main RBS Sustainability Report.
Progress also continues on reducing the environmental impacts of our operations. Data to the end of 2014 showed we had achieved our 2011-2014 targets for energy (15% reduction), water (12% reduction) and waste (10% reduction). However we had not yet met our objective of diverting 70% of our waste away from landfill. New 2020 targets are to be announced in the forthcoming 2014 RBS Sustainability Report.
RBS in the Community
We run a number of targeted programmes focussed on providing support to the communities where we operate. In addition to this, we have a well established employee volunteering and giving programme in RBS. As well as supporting local causes in our areas of operation and topping up employee fundraising, we also support volunteering during work time.
Diversity at RBS
The bank’s ambition is to be number one for customer service, trust and advocacy in every one of our chosen business areas, supported by a people commitment to make RBS a great place to work. Valuing difference is therefore essential for our customers and colleagues. Our inclusion policy standard applies to all our people globally; and our strategy for diversity and inclusion sits with the RBS Board and Executive Committee.
Our approach during 2014/15 focuses on building inclusion into all stages of the employee lifecycle. In 2014 we started rolling out bank-wide unconscious bias learning for all employees, which will continue across 2015. We’ve introduced a gender target to increase the number of women in senior roles across the bank. And we continue to support our employee-led networks, with membership across the bank at over 15,000 people.
This year RBS has been recognised for its work on Equality, Diversity and Inclusion by retaining our Platinum ranking from Opportunity Now (gender) for the second year; increasing our ranking from Silver to Gold for Race for Opportunity (race); retaining a position in the Times Top 50 Employers for Women for the eighth consecutive year; and improving upon our ranking in the Stonewall Workplace Equality Index (LGBT).
As at 31 December 2014, of our global population of 110,027 employees, 50,816 (46%) were male and 59,211 (54%) female. There were 762 ‘senior managers’, which comprises our executive employee population and individuals who are directors of our subsidiaries, of whom 637 (84%) were male and 125 (16%) female. The RBS Board of directors has ten members, consisting of seven male and three female directors.
Our approach to Human Rights
RBS recognises our corporate responsibility to respect and uphold human rights. We regularly review our policies and procedures to ensure that we avoid infringing on the human rights of others throughout our sphere of influence. We also participated in projects with our peers through the Thun Group and UNEP FI to better understand and implement the human rights responsibilities of banks as defined by the UN Guiding Principles on Business and Human Rights.
We have adopted and contributed to a number of internationally accepted codes, notably the Equator Principles and the UN Global Compact, which specifically address the management of human rights issues.
The RBS Code of Conduct ‘Our Code’ sets out the standards we expect our people to work to, including a clear commitment to respecting human rights. We conduct regular consultations with employees on key aspects of their working environment, and operate a confidential helpline facility that allows employees to discuss any matter of concern with regards to their wellbeing.
Our Sustainable Procurement Code sets out our expectations of the companies that we work with. It clearly states that our suppliers should not engage in breaches of human rights or labour rights, or in discrimination. We are also committed to equal opportunities for suppliers, and we recognise that diversity strengthens our supply chain.
Our ESE Risk policies include sector-specific human rights risk screenings and are regularly reviewed and updated to ensure best practice. We conduct due diligence on clients relating to human rights standards, and expect our clients to share our commitment to respecting human rights within their operations. In all sectors, we will not provide financial services to companies involved in harmful child labour or forced labour. In 2014, we continued to strengthen human rights due diligence in our ESE policies as well as public disclosure on the details of these policies.They can be seen at rbs.com/sustainable.
Accelerate for growth
Over the next two years we’ll be building on our successful partnership with Entrepreneurial Spark and increasing our support for entrepreneurs. We’re backing eight new business accelerator hubs in locations like Birmingham, Bristol, Cardiff, Leeds, Manchester and Belfast. Each hub will offer workspace, hands-on mentoring, start-up ‘boot camps’ and a free 18 month programme including advice, support and funding clinics.
The hubs will have physical work spaces for up to 80 entrepreneurs and host two intakes each year, with a graduation event bringing together entrepreneurs, investors and business advisors at the end of each programme. Entrepreneurs from any sector will be able to join the hub, creating valuable network building opportunities. Each business will also have the opportunity to pitch to potential investors and apply for growth awards of up to £50,000.
The aim is to help ambitious entrepreneurs take their businesses to the next level, supporting them to create jobs and growth, boosting the UK economy.
Governance report
| 44 | Letter from the Chairman |
| 46 | Our governance structure |
| 47 | Our Board |
| 51 | Corporate governance |
| 56 | Report of the Group Nominations Committee |
| 58 | Report of the Group Audit Committee |
| 63 | Report of the Board Risk Committee |
| 70 | Report of the RBS Capital Resolution (RCR) Board Oversight Committee |
| 72 | Report of the Sustainable Banking Committee |
| 74 | Directors’ remuneration report |
| 92 | Other remuneration disclosures |
| 96 | Compliance report |
| 99 | Report of the directors |
| 105 | Statement of directors’ responsibilities |
Letter from the Chairman
Dear Shareholder,
I am pleased to introduce our Corporate Governance report for the 2014 financial year which outlines the role our Board and Committees have had in shaping and refining the strategic ambition for the business, and providing oversight and challenge.
Board and Committee activity during 2014 continued to be extremely busy, focused on the delivery of the strategic plan announced in February 2014.
In April 2014, we entered into an agreement with Her Majesty’s Treasury to provide for the future retirement of the Dividend Access Share (DAS). Among other benefits, the retirement of the DAS will in future allow the Board to state more clearly a dividend policy to investors.
In September, we launched the initial public offering (IPO) of our US subsidiary Citizens Financial Group, Inc. (CFG) which represents a significant step towards improving our capital position and helping us create a strong and secure bank that can continue to support the needs of our customers.
Conduct and regulatory investigations have also been a key area of focus and our 2014 results reflect the huge cost of dealing with these issues. The announcements made in November 2014 in relation to settlements with certain regulators regarding misconduct in foreign exchange trading were a stark reminder of the importance of culture and integrity in banking. The Board will continue to drive cultural change and it is essential that our governance and risk frameworks continue to evolve to support this.
Systems, controls and resilience were also considered regularly by the Board, particularly in light of the regulatory investigations in relation to the 2012 IT incident which were settled in November 2014. By the end of 2015 we will have invested an additional £750 million in enhancing the security and resilience of our IT systems and many improvements have already been implemented.
Board Committees
Board Committees continued to play a crucial role in our governance framework during 2014, undertaking their complex work comprehensively and effectively supporting the work of the Board.
The Group Audit Committee has monitored the quality of RBS’s financial statements and has supported the Board in making its assessment that the Annual Report and Accounts, taken as a whole, are fair, balanced and understandable, in accordance with the UK Corporate Governance Code. The Committee has also exercised close oversight of the effectiveness of the RBS’s control environment, placing particular focus on the remediation of culture and controls in the former Markets division. Together with the Board Risk Committee, the Group Audit Committee will examine management’s plans to embed an effective three lines of defence model within the new organisational construct. During 2014, the Group Audit Committee also spent additional time overseeing the tender process for selection of the external auditor for the year commencing 1 January 2016.
The Board Risk Committee welcomed Baroness Noakes as its new Chairman in April 2014. During the year, it has played a key role in the oversight of execution risk arising from RBS’s strategic agenda, most notably the Transformation Programme, and will continue to do so in 2015. The Committee has monitored developments in the internal and regulatory investigations of our activities in foreign exchange markets, including the resulting disciplinary and accountability process. It has also overseen the remediation activity following the IT incident in 2012. The Board Risk Committee has considered the capital and liquidity position of RBS and related regulatory submissions and dedicated significant additional time to the consideration of internal and external stress testing exercises.
As announced previously, Penny Hughes stood down as Chairman of the Group Performance and Remuneration Committee and Sandy Crombie stood down as Chairman of the Sustainable Banking Committee. I would like to thank Penny and Sandy for their outstanding commitment and dedication whilst chairing these Committees.
The Group Performance and Remuneration Committee welcomed Sandy as its new Chairman. The Committee has played a vital role in ensuring that our remuneration policy is fair and transparent and supports the work to rebuild a successful and trusted RBS. During 2014 the Committee had oversight of the implementation of a limit of variable pay to no more than 100% of fixed pay and the use of deferral and malus, to deliver fair remuneration outcomes.
Penny became the new Chairman of the Sustainable Banking Committee and refocused its strategic direction on three core themes - Bank-wide Reputation and Trust, Serving Customers and Sustainability/Emerging issues. The Sustainable Banking Committee has overseen the values and conduct work in relation to behavioural and cultural issues and the development of Environmental, Social and Ethical policies, while continuing its commitment to stakeholder engagement.
The RBS Capital Resolution (RCR) Board Oversight Committee chaired by Baroness Noakes since 1 April 2014 was established to oversee the separation and wind-down of RBS’s high capital intensive assets and has implemented a governance structure and delegated authorities for RCR. The RCR Board Oversight Committee has considered RCR’s financial performance, risk reporting, delivery against targets and asset management principles and certain remuneration matters.
Letter from the Chairman
Board changes
There were a number of changes to the Board’s composition during 2014.
Ewen Stevenson took over as Chief Financial Officer in May 2014 when Nathan Bostock left RBS. Ewen has extensive experience of working with both governments and boards on the steps needed to restore confidence in financial institutions following the crisis; and his skills and experience have already been of great benefit to the Board.
Two of our non-executive directors also retired from the Board in 2014. Tony Di Iorio stood down in March 2014, having served on the Board since September 2011. Tony made an excellent contribution to the Board and, in particular, the Board Risk Committee and Group Audit Committee, and he left with our best wishes for the future. Tony remains a director of CFG in the US.
Philip Scott stood down in October 2014 having served on the Board since 2009. I would like to record my thanks to Philip for his outstanding commitment to the Board having served four years as Chairman of the Board Risk Committee during a period of enormous change.
In April 2014, we welcomed Morten Friis as a new non-executive director and a member of the Board Risk Committee and Group Audit Committee. Morten brings a wealth of experience of the financial services industry and has an especially strong background in risk. This is already evident in the contributions he is making to the Board and the committees he sits on.
On 25 February 2015 the Board approved the appointment of Howard Davies as a non-executive director with effect from the end of June 2015 and as Chairman from 1 September 2015.
Board effectiveness
This year, we conducted an internal evaluation of the effectiveness of the Board and its committees, led by the Chief Governance Officer and Board Counsel. The evaluation has concluded that the Board is operating effectively but has identified some areas of improvement that we will focus on during 2015.
The Board also received support from the Chief Governance Officer and Board Counsel in a number of other areas related to board effectiveness such as the Prudential Regulation Authority’s review of Board effectiveness, Board process, information flows and operating rhythm between the Board and committees, professional development and induction for new directors.
Corporate governance
Our statement of compliance with the UK Corporate Governance Code (the “Code”) is set out on page 96.
Finally, as we reflect on another challenging year, I would like to conclude this letter by recording my sincere thanks towards my fellow Board members. Being a director of RBS requires extensive time and commitment, and the readiness to deal with the unusual challenges of a government controlled listed company. I remain extremely grateful for their continued support and dedication in working towards the recovery of RBS.
As announced previously I will be leaving RBS on 31 August 2015. Howard Davies will join the Board at the end of June and will assume the role of Chairman with effect from 1 September 2015. It has been a privilege to serve as Chairman of RBS since 2009 and it is with sadness that I will leave the Board, but I am confident that the Board will continue to work with dedication to implement our strategy under the new Chairman.
Philip Hampton
Chairman of the Board of directors
25 February 2015
Our governance structure
Board and Board committee structure
The Board
The Board is collectively responsible for the long-term success of RBS and delivery of sustainable shareholder value. Its role is to provide leadership of RBS within a framework of prudent and effective controls which enables risks to be assessed and managed.
Group Audit Committee
Assists the Board in discharging its responsibilities for monitoring the quality of the financial statements of RBS. It reviews the accounting policies, financial reporting and regulatory compliance practices of RBS and RBS’s system and standards of internal controls, and monitors RBS’s processes for internal audit and external audit.
Board Risk Committee
Provides oversight and advice to the Board on current and potential future risk exposures of RBS and future risk strategy. It reviews RBS’s compliance with approved risk appetite and oversees the operation of RBS Policy Framework and submissions to regulators.
Group Performance and Remuneration Committee
Responsible for approving remuneration policy and reviewing the effectiveness of its implementation. It also considers senior executive remuneration and makes recommendations to the Board on the remuneration of executive directors.
Group Nominations Committee
Assists the Board in the selection and appointment of directors. It reviews the structure, size and composition of the Board, and membership and chairmanship of Board committees.
Sustainable Banking Committee
Responsible for overseeing and challenging how management is addressing sustainable banking and reputation issues, considering the long term interests of all stakeholder groups.
Executive Committee
Supports the Chief Executive in managing RBS’s businesses. It reviews and debates relevant items before consideration by the Board. It is responsible for determining and delivering RBS’s strategy, and it monitors and manages financial performance, capital allocations, risk strategy and policy, risk management, operational issues and customer issues.
RCR Board Oversight Committee
Provides oversight of RCR’s progress against, and compliance with, its primary objective and asset management principles.
Our Board
| Chairman | | |
| Philip Hampton (age 61) Date of appointment: 19 January 2009 (Board) 3 February 2009 (Chairman) Experience: Previously chairman of J Sainsbury plc and group finance director at Lloyds TSB Group, BT Group plc, BG Group plc, British Gas and British Steel plc, an executive director of Lazards and a non-executive director of RMC Group plc and Belgacom SA. He is also a former chairman of UK Financial Investments Limited, which manages the UK Government’s shareholdings in banks. | External appointment(s): · Senior Independent director of Anglo American plc, chairman of its Remuneration Committee and member of the Audit Committee · Non-executive director, chairman of the Nominations Committee and chairman designate of GlaxoSmithKline plc Committee membership(s) · Group Nominations Committee (Chairman) · RCR Board Oversight Committee |
| Executive directors | | |
Chief Executive | Ross McEwan (age 57) Date of appointment: 1 October 2013 Experience: He became Chief Executive of The Royal Bank of Scotland Group in October 2013. Between August 2012 and September 2013, he was Chief Executive Officer for UK Retail, joining from Commonwealth Bank of Australia where he was Group Executive for Retail Banking Services for five years. Prior to this he was Executive General Manager with responsibility for the branch network, contact centres and third party mortgage brokers. Ross has more than 25 years experience in the finance, insurance and investment industries, and prior to Commonwealth Bank of Australia, was Managing Director of First NZ Capital Securities. He was also Chief Executive of National Mutual Life Association of Australasia Ltd / AXA New Zealand Ltd. He has an MBA from Harvard. | External appointment(s): None Committee membership(s) · Executive Committee (Chairman) |
Chief Financial Officer | Ewen Stevenson (age 48) Date of appointment: 19 May 2014. Experience: Previously at Credit Suisse for 25 years where he was latterly co-Head of the EMEA Investment Banking Division and co-Head of the Global Financial Institutions Group. Ewen has over 20 years of experience advising the banking sector while at Credit Suisse. He has a Bachelor of Commerce and Administration majoring in Accountancy and a Bachelor of Law from Victoria University of Wellington, New Zealand. | External appointment(s): None Committee membership(s) · Executive Committee |
Our Board
| Independent non-executive directors | | |
| Sandy Crombie (age 66) Date of appointment: 1 June 2009 (Senior Independent Director) Experience: Previously group chief executive of Standard Life plc and Chairman of Creative Scotland. He was also previously a director of the Association of British Insurers and Chairman of the Edinburgh World City of Literature Trust. In 2007 he was the Prince of Wales’ Ambassador for Corporate Social Responsibility in Scotland. | External appointment(s): · Member and vice-chairman of the Board of Governors of The Royal Conservatoire of Scotland · President of the Cockburn Association Committee membership(s): · Group Performance and Remuneration Committee (Chairman) · Group Audit Committee · Group Nominations Committee · RCR Board Oversight Committee |
| Alison Davis (age 53) Date of appointment: 1 August 2011 Experience: Previously, she served as a director of City National Bank and First Data Corporation and as chair of the board of LECG Corporation. She has also worked at McKinsey & Company, AT Kearney, as Chief Financial Officer at Barclays Global Investors (now BlackRock) and as managing partner of Belvedere Capital, a private equity firm focused on buy-outs in the financial services sector. | External appointment(s): · Non-executive director and member of the audit and compensation committees of Unisys Corporation · Non-executive director, chair of the compensation committee and member of the audit committee of Diamond Foods Inc. · Non-executive director, and member of the audit committee of Fiserv Inc · Non-executive director, Ooma Inc Committee membership(s): · Group Nominations Committee · Group Performance and Remuneration Committee · Sustainable Banking Committee |
| Morten Friis (age 62) Date of appointment: 10 April 2014 Experience: He has 34 years financial services experience and has previously held various roles at Royal Bank of Canada and its subsidiaries including Associate Director at Orion Royal Bank, Vice President, Business Banking and Vice President, Financial Institutions. In 1997, he was appointed as Senior Vice President, Group Risk Management and served as the Chief Credit Officer then Chief Risk Officer from 2004 to 2014. He was also previously a Director of RBC Bank (USA), Westbury Life Insurance Company, RBC Life Insurance Company and of RBC Dexia Investor Services Trust Company. | External appointment(s): · Member of the Board of Directors of The Canadian Institute for Advanced Research · Member of the Board of Directors of the Harvard Business School Club of Toronto Committee membership(s): · Group Audit Committee · Group Nominations Committee · Board Risk Committee |
Our Board
| Independent non-executive directors | | |
| Robert Gillespie (age 59) Date of appointment: 2 December 2013 Experience: Began his career with Price Waterhouse (now PricewaterhouseCoopers) where he qualified as a chartered accountant. He then moved into banking joining SG Warburg, specialising in corporate finance, and was appointed as Co-Head and Managing Director of its US investment banking business in 1989. Following the acquisition in 1995 of Warburg by Swiss Bank Corporation (which subsequently merged with UBS), he then held the roles of Head of UK Corporate Finance, Head of European Corporate Finance and Co-Head of its global business and CEO of the EMEA region. He relinquished his management roles at the end of 2005, and was appointed Vice Chairman of UBS Investment Bank. Robert left UBS to join Evercore Partners, from where he was seconded to the UK Panel on Takeovers and Mergers, as Director General, from 2010 to 2013. He is a non-executive director of Citizens Financial Group, Inc. | External appointment(s): · Independent Board Director at Ashurst LLP · Chairman of Council at the University of Durham · Chairman of the Somerset House Trust · Chairman of the Boat Race Company Limited · Director of Social Finance Limited Committee membership(s): · Group Nominations Committee · Group Performance and Remuneration Committee · Board Risk Committee · Sustainable Banking Committee |
| Penny Hughes, CBE (age 55) Date of appointment: 1 January 2010 Experience: Previously a director and chairman of the Remuneration Committee of Skandinaviska Enskilda Banken AB and a non-executive director of Home Retail Group plc and chairman of its Remuneration Committee. She spent the majority of her executive career at Coca-Cola where she held a number of leadership positions, latterly as President, Coca-Cola Great Britain and Ireland. Former non-executive directorships include Vodafone Group plc, Reuters Group PLC, Cable & Wireless Worldwide plc and The Gap Inc. | External appointment(s): · Non-executive director, chair of the corporate compliance and responsibility committee and member of the audit, nomination and remuneration committees of Wm Morrison Supermarkets plc · Trustee of the British Museum Committee membership(s): · Sustainable Banking Committee (Chairman) · Group Nominations Committee · Board Risk Committee |
| Brendan Nelson (age 65) Date of appointment: 1 April 2010 Experience: Former global chairman, financial services for KPMG. Previously held senior leadership roles within KPMG including as a member of the KPMG UK board from 1999 to 2006 and as vice-chairman from 2006. Chairman of the Audit Committee of the Institute of Chartered Accountants of Scotland from 2005 to 2008. President of the Institute of Chartered Accountants of Scotland 2013/14. | External appointment(s): · Non-executive director and chairman of the audit committee of BP plc · Member of the Financial Reporting Review Panel Committee membership(s): · Group Audit Committee (Chairman) · Group Nominations Committee · RCR Board Oversight Committee · Board Risk Committee |
Our Board
| Independent non-executive directors | | |
| Baroness Noakes, DBE (age 65) Date of appointment: 1 August 2011 Experience: An experienced director on UK listed company boards with extensive and varied political and public sector experience. A qualified chartered accountant, she previously headed KPMG’s European and International Government practices and has been President of the Institute of Chartered Accountants in England and Wales. She was appointed to the House of Lords in 2000 and has served on the Conservative front bench in various roles including as shadow treasury minister between 2003 and May 2010. Previously held non-executive roles on the Court of the Bank of England, Hanson, ICI, Severn Trent, Carpetright, John Laing and SThree. | External appointment(s): · Deputy chairman, Ofcom Committee membership(s): · Board Risk Committee (Chairman) · RCR Board Oversight Committee (Chairman) · Group Audit Committee · Group Nominations Committee |
| Chief Governance Officer and Board Counsel | |
| Aileen Taylor (age 42) Date of appointment: 1 May 2010 (Company Secretary) Experience: A qualified solicitor, joined RBS in 2000. She was appointed Deputy Group Secretary and Head of Group Secretariat in 2007, and prior to that held various legal, secretariat and risk roles including Head of External Risk, Retail, Head of Regulatory Risk, Retail Direct and Head of Legal and Compliance at Direct Line Financial Services. | She is a fellow of the Chartered Institute of Bankers in Scotland and a member of the European Corporate Governance Council. |
Executive Committee
The Board is supported by the Executive Committee comprising the executive directors and other senior executives. Details of the composition of the Executive Committee and biographies of its members can be found at www.rbs.com>about us>corporate governance>ceo and board>executive committee
Corporate governance
The Board
The Board has ten directors comprising the Chairman, two executive directors and seven independent non-executive directors, one of whom is the Senior Independent Director.
| Name | Position | Nationality |
| Philip Hampton | Chairman | British |
| Ross McEwan | Chief Executive | New Zealand |
Ewen Stevenson | Chief Financial Officer | British/ New Zealand |
| Sandy Crombie | Senior Independent Director | British |
| Alison Davis | Independent non-executive director | British/USA |
| Morten Friis | Independent non-executive director | Norwegian |
| Robert Gillespie | Independent non-executive director | British |
| Penny Hughes | Independent non-executive director | British |
| Brendan Nelson | Independent non-executive director | British |
| Baroness Noakes | Independent non-executive director | British |
Biographies for each director and details of which Board committees they are members of can be found on pages 47 to 50. The Board considers that the Chairman was independent on appointment and that all non-executive directors are independent for the purposes of the Code.
Board Changes
Non-executive directors Tony Di Iorio and Philip Scott stepped down from the Board on 26 March 2014 and 31 October 2014 respectively. Nathan Bostock stepped down from the Board on 28 May 2014. RBS has announced that Philip Hampton will step down from the Board during 2015.
Morten Friis was appointed as a non-executive director on 10 April 2014. Ewen Stevenson was appointed as an executive director and Chief Financial Officer on 19 May 2014.
On 25 February 2015 the Board approved the appointment of Howard Davies as non-executive director with effect from the end of June 2015 and as Chairman from 1 September 2015.
Roles and responsibilities
The Board
The Board is collectively responsible for the long-term success of RBS and delivery of sustainable shareholder value. The Board’s terms of reference include key aspects of RBS’s affairs reserved for the Board’s decision and are reviewed at least annually. The terms of reference are available on rbs.com>about us.
Chairman
The role of Chairman is distinct and separate from that of the Chief Executive and there is a clear division of responsibilities with the Chairman leading the Board and the Chief Executive managing RBS’s business day to day.
The Chairman’s key responsibilities are to: · provide strong and effective leadership to the Board; · ensure the Board is structured effectively and observes the highest standards of integrity and corporate governance; · manage the business of the Board and set the agenda, style and tone of Board discussions to promote effective decision-making and constructive debate; · facilitate the effective contribution and encourage active engagement by all members of the Board; · in conjunction with the Chief Executive and Chief Governance Officer and Board Counsel, ensure that members of the Board receive accurate, timely and clear information, to enable the Board to lead RBS, take sound decisions and monitor effectively the performance of executive management; · ensure that the performance of individual directors and of the Board as a whole and its committees is evaluated regularly; and · ensure RBS maintains effective communication with shareholders and other stakeholders. |
Chief Executive
The Chief Executive has responsibility for all of RBS’s business and acts in accordance with the authority delegated by the Board.
The Chief Executive’s key responsibilities are to: · exercise executive responsibility for RBS’s franchises and functions; · define, drive and deliver the overall strategic direction approved by the Board; · drive and deliver performance against the RBS’s financial plans and budget acting in accordance with authority delegated by the Board; · consult regularly with the Chairman and Board on matters which may have a material impact on RBS; · act as a guardian and champion of the culture and values of RBS, creating an environment where employees are engaged and committed to good customer outcomes; · lead the senior executive team and ensure there are clear accountabilities for managing RBS’s business and managing risk; and · in conjunction with the Chairman and Chief Governance Officer and Board Counsel, ensure the Board receives accurate, timely and clear information. |
Corporate governance
Senior Independent Director
Sandy Crombie, as Senior Independent Director, acts as a sounding board for the Chairman and as an intermediary for other directors when necessary. He is also available to shareholders to discuss any concerns they may have, as appropriate.
Non-executive directors
Along with the Chairman and executive directors, the non-executive directors are responsible for ensuring the Board fulfils its responsibilities under its terms of reference. The non-executive directors combine broad business and commercial experience with independent and objective judgement and they provide independent challenge to the executive directors and the leadership team. The balance between non-executive and executive directors enables the Board to provide clear and effective leadership across RBS’s business activities.
The standard terms and conditions of appointment of non-executive directors are available on rbs.com or from RBS Corporate Governance and Secretariat.
Board Committees
In order to provide effective oversight and leadership, the Board has established a number of Board committees with particular responsibilities. Please see the corporate governance structure on page 46 for more details. The work of the Board committees are also discussed in their individual reports as follows:
Group Nominations Committee - pages 56 and 57.
Group Audit Committee - pages 58 to 62.
Board Risk Committee - pages 63 to 69.
RCR Board Oversight Committee pages 70 and 71.
Sustainable Banking Committee - pages 72 and 73.
Group Performance and Remuneration Committee - pages 74 to 95.
The terms of reference for each of these committees is available on rbs.com and copies are also available on request from RBS Corporate Governance and Secretariat.
Chief Governance Officer and Board Counsel
Aileen Taylor is the Chief Governance Officer and Board Counsel and is also the Company Secretary. Reporting directly to both the Chairman and the Chief Executive, she is responsible for delivering commercial corporate governance advice and support to the Board. She acts as a trusted advisor in the effective functioning of the Board, ensuring appropriate alignment and information flows between the Board and its committees, including the Executive Committee. As Board Counsel, she is responsible for the provision of legal advice to the Board. Her responsibilities include: -
| · | advising on Board skills and composition including induction, ongoing training and professional development; |
| · | executive responsibility for Chairman/non-executive Director search and appointment process; |
| · | leading on all aspects of corporate governance across RBS; |
| · | facilitating good information flows between Board members and the Board and its committees; and |
| · | leading on implementation of recommendations from the annual Board evaluation. |
Conflicts of interests
The company has procedures in place to ensure that the Board’s powers for authorising actual or potential conflicts of interest are operating effectively. On appointment, each director is provided with RBS’s guidelines for referring conflicts of interest to the Board. Each director is required to notify any actual or potential conflicts of interest to the Board for consideration and to update the Board on an ongoing basis when he or she becomes aware of any changes.
The Board considers each director’s notification separately on the facts and can impose conditions or limitations as part of the authorisation process. Actual and potential conflicts of interest can be authorised by the Board in accordance with the company’s Articles of Association. Details of all conflicts of interest are recorded in a register which is maintained by the Chief Governance Officer and Board Counsel and reviewed annually by the Board.
Board meetings
In 2014, nine Board meetings were scheduled and individual attendance by directors at these meetings is shown in the table below. One of the Board meetings took place overseas during the Board’s visit to RBS’s US businesses.
In addition to the nine scheduled meetings, 34 additional meetings of the Board and committees of the Board were held, including meetings to consider and approve financial statements. The Chairman and the non-executive directors meet at least once per year without executive directors present.
| | Attended/ scheduled |
| Philip Hampton | 9/9 |
| Ross McEwan | 9/9 |
Ewen Stevenson (1) | 6/6 |
| Sandy Crombie | 9/9 |
| Alison Davis | 9/9 |
Morten Friis (2) | 6/6 |
| Robert Gillespie | 9/9 |
| Penny Hughes | 9/9 |
| Brendan Nelson | 9/9 |
Baroness Noakes (3) | 8/9 |
| | |
| Former directors | |
Nathan Bostock (4) | 4/4 |
Tony Di lorio (5) | 3/3 |
Philip Scott (6) | 6/7 |
| (1) | Appointed to the Board on 19 May 2014. |
| (2) | Appointed to the Board on 10 April 2014. |
| (3) | Missed one meeting due to family bereavement. |
| (4) | Stepped down from the Board on 28 May 2014. |
| (5) | Stepped down from the Board on 26 March 2014. |
| (6) | Stepped down from the Board 31 October 2014. |
Corporate governance
Principal activities of the Board during 2014
In advance of each Board meeting, the directors are provided with comprehensive papers. During 2014 there has been an enhanced focus on implementation of the new organisational design, building of capital and developing resilient systems. These have been recurring themes underpinning Board discussions during the year. An overview of the principal activities of the Board during 2014 is shown below.
| Each meeting |
· Chairman’s report · Chief Executive’s report · Monthly results · Capital, funding & liquidity · Franchise updates · RCR update | · Risk report (including updates on conduct matters) · Reports from Committee Chairmen · Secretary’s report (routine matters for approval/noting) · Transformation programme |
| 1st Quarter | 2nd Quarter |
· Budget · Remuneration proposals · Annual results and AGM notice · Board & Committee evaluations · Internal Audit evaluation · External Auditor evaluation · Dividend Access Share Retirement agreement · Board session with Andrew Tyrie, Treasury Select Committee · RBS contingency funding plan · Global Restructuring Group deep dive · Capital plan · Scottish independence considerations | · Q1 results · Resolution planning · Board strategy offsite · AGM preparations · Dividend Access Share Retirement Agreement · Citizens IPO · Stress testing · Internal Capital Adequacy Assessment Process · Scottish independence considerations |
| 3rd Quarter | 4th Quarter |
· Interim results · High net worth review · Scottish independence contingency planning · Individual Liquidity Adequacy Assessment · 2014 recovery plan · PRA Board effectiveness review · Board session with PRA · Board session with FCA · Board session with UKFI · ICB updates · CIB strategy review · RBS entrepreneurial programme · Citizens IPO · Board evaluation update | · Q3 results · ICB update · CIB strategy review · High net worth review · Succession planning session · IT resilience exercise · Ulster Bank strategic review · Political risk 2015 · Technology update |
Franchise Chief Executives attend each Board meeting to provide an update on the performance of their businesses. Other relevant senior executives including the Chief Risk Officer, the Chief Regulatory Affairs Officer and the Chief Administration Officer attend Board meetings to present reports to the Board as appropriate. This provides the Board with an opportunity to engage directly with management on key issues and supports the Board’s succession planning activity.
Board effectiveness
Skills and experience on the Board
The Board is structured to ensure that the directors provide RBS with the appropriate balance of skills, experience and knowledge as well as independence. Given the nature of the RBS’s businesses, experience of banking and financial services is clearly of benefit, and we have a number of directors with substantial experience in that area, but the Board also benefits from directors with experience in other fields.
The table below illustrates the breadth of skills and experience on the Board.
· Retail Banking · Other Financial Services · Markets/Investment Banking · Utilities · Government & Public Sector · Mergers & Acquisitions · Corporate Restructuring · Stakeholder Management | · Chief Executive · Finance & Accountancy · Risk · Technology/Digital · Operations · Change Management · Consumer Facing |
Board committees also comprise directors with a variety of skills and experience so that no undue reliance is placed on any individual.
Induction and professional development
Each new director receives a formal induction on joining the Board, which is co-ordinated by the Chief Governance Officer and Board Counsel. This includes visits to RBS’s major businesses and function and meetings with directors and senior management. Meetings with the external auditors and external counsel are also arranged. Each induction programme has a core element that the director is required to complete with the remainder of the programme tailored to the new director’s specific requirements. An example of an induction programme for a new non-executive director is set out below:
Chairman Chief Executive Chief Financial Officer Senior Independent Director Board committee Chairs Chief Governance Officer and Board Counsel Chief Risk Officer Chief Conduct & Regulatory Affairs Officer RBS Treasurer RBS Chief Legal Officer and General Counsel External Auditor External Counsel | Franchise Chief Executives Business visits (UK and overseas) Finance Risk Internal Audit Tax Human Resources Investor Relations Strategy & Corporate Development Communications and Marketing Institutional Investors |
Corporate governance
The Chief Governance Officer and Board Counsel advises directors of appropriate external training and professional development opportunities and internal training is also provided which is relevant to the business of RBS. Business visits are also arranged as part of the Group Audit Committee and Board Risk Committee schedule (details of which can be found on pages 59 and 65) and all non-executive directors are invited to attend. Directors undertake the training they consider necessary to assist them in carrying out their duties and responsibilities as directors.
During 2014, the directors received updates on a range of subjects to enhance their knowledge, including:
| · | The Senior Persons Regime |
| · | The revised UK Corporate Governance Code |
| · | CRD IV Directorship Limits and Subsidiary Compliance |
| · | Shareholder Rights Directive |
| · | Banking Standards Review Council |
| · | PRA Consultation on proposed changes to the Remuneration Code |
| · | EU Market Abuse Regulations and impact on RBS |
| · | Department of Business, Innovation and Skills Proposals on Transparency and Trust |
The Chief Governance Officer and Board Counsel maintains continuing professional development logs. These are reviewed regularly with directors to assist in identifying future training and development opportunities that are specific to the individual director’s requirements.
Information
All directors receive accurate, timely and clear information on all relevant matters and have access to the advice and services of the Chief Governance Officer and Board Counsel. In addition, all directors are able, if necessary, to obtain independent professional advice at the company’s expense.
Time commitment
There is an anticipated time commitment in line with the recommendations of the Walker Review in respect of general Board duties and additional time as necessary in respect of committee duties. However, as stated in the Chairman’s introductory letter to his Corporate governance report, the time commitment currently required of our non-executive directors is significant. Each director is required to seek the agreement of the Chairman before accepting additional commitments that might affect the time the director is able to devote to his or her role as a non-executive director of RBS. Directors have also been briefed on the limits on the number of other directorships that they can hold under the requirements of fourth Capital Requirements Directive (CRD IV). The Board monitors the other commitments of the Chairman and directors and is satisfied that they are able to allocate sufficient time to enable them to discharge their duties and responsibilities effectively.
Election and re-election of directors
In accordance with the provisions of the Code, all directors of the company are required to stand for election or re-election annually by shareholders at the company’s Annual General Meeting and in accordance with the UK Listing Rules, the election or re-election of independent directors requires approval by all shareholders and also by independent shareholders.
Performance evaluation
In accordance with the Code, an external evaluation of the Board takes place every three years. An internal evaluation takes place in the intervening years.
The 2012 evaluation was conducted externally by a specialist board evaluation consultancy. The 2013 evaluation was conducted internally by the Chief Governance Officer and Board Counsel and a number of initiatives were implemented aimed at improving the overall performance and effectiveness of the Board. These included keeping Board and committee composition under review; ensuring sufficient time on Board agendas for Board oversight of key strategic areas; a review of risk reporting and a focus on regular contact with external stakeholders. These topics have been appropriately addressed and will be kept under regular review as a matter of good practice.
In 2014, the Board and committee evaluation process was conducted internally by the Chief Governance Officer and Board Counsel. A comprehensive review of the Board’s effectiveness was also carried out by the Prudential Regulatory Authority during 2014.
Performance evaluation process
The Chief Governance Officer and Board Counsel undertook a formal evaluation by:
| · | preparing surveys that were completed by each director and holding interviews with each director; |
| · | discussing the outcomes and recommendations with the Chairman; and |
| · | recommending the outcomes and areas for improvement to the Board. |
Amongst the areas reviewed were Board composition, Board meetings and processes, information quality and flows, external relationships and priorities for 2015.
Corporate governance
Outcomes of the 2014 performance evaluation
The 2014 performance evaluation concluded that the Board was strong and operated effectively and within its terms of reference throughout 2014. Key strengths identified included:
| · | the Board performed strongly during a challenging 2014, demonstrating alignment with RBS values; |
| · | the dynamic between Board members was good and on the whole members worked well together, creating effective challenge, debate and oversight; and |
| · | the Board’s committees operated effectively within their terms of reference throughout the year providing strong support to the Board. |
A summary of the key themes arising from the 2014 performance evaluation is set out below, together with an overview of the proposed actions:
| Key themes included | Proposed action |
| Board and Board committee composition | Keep Board and Board committee composition under review during 2015, to ensure balance of skills, experience, independence, knowledge and diversity remains appropriate. |
| Succession planning | Ensure that an effective succession planning process is in place at Board and Executive level. |
| Board and Committee agendas | Ensure that Board and Committee agendas for 2015 minimise duplication and allow effective oversight of key areas of strategic focus, sufficient time for debate and focus on the RBS priorities, particularly the customer. |
| Information | Continue to improve and enhance the information presented to the Board and Committees. |
| Professional development | Enhance the professional development programme provided to Board members. |
Individual director and Chairman effectiveness reviews
The Chairman met with each director individually to discuss their own performance and ongoing professional development and also shared peer feedback that had been provided as part of the evaluation process. Separately, the Senior Independent Director sought feedback on the Chairman’s performance and canvassed views on the Chairman’s performance from the non-executive directors collectively. The results of the Chairman’s effectiveness review were then discussed by the Chairman and the Senior Independent Director.
Relations with investors
The Chairman is responsible for ensuring effective communication with shareholders. The company communicates with shareholders through the Annual Report and Accounts and by providing information in advance of the Annual General Meeting. Individual shareholders can raise matters relating to their shareholdings and the business of RBS at any time throughout the year by letter, telephone or email via rbs.com/ir.
Shareholders are given the opportunity to ask questions at the Annual General Meeting and any General Meetings held or can submit written questions in advance. The Senior Independent Director and the chairmen of the Board committees are available to answer questions at the Annual General Meeting.
Communication with the company's largest institutional shareholders is undertaken as part of the Investor Relations programme:
| · | the Chief Executive and Chief Financial Officer meet regularly with UKFI, the organisation set up to manage the Government’s investments in financial institutions, to discuss the strategy and financial performance of the business. The Chief Executive and Chief Financial Officer also undertake an extensive annual programme of meetings with the company’s largest institutional shareholders. |
| · | the Chairman independently meets with RBS’s largest institutional shareholders annually to hear their feedback on management, strategy, business performance and corporate governance. Additionally, the Chairman, Senior Independent Director and chairmen of the Board committees met with the governance representatives of a number of institutional shareholders during the year. |
| · | the Senior Independent Director is available if any shareholder has concerns that they feel are not being addressed through the normal channels. |
| · | the Chairman of the Group Performance and Remuneration Committee consults extensively with major shareholders in respect of the Group’s remuneration policy. |
In 2014, RBS continued its programme of UK-based events aimed at individual shareholders. These events provided an opportunity for shareholders to meet with directors and senior management to learn more about the business.
Throughout the year, the Chairman, Chief Executive, Chief Financial Officer and Chairman of the Group Performance and Remuneration Committee communicate shareholder feedback to the Board. The directors also receive independent analyst notes and reports reviewing share price movements and performance against the sector. Detailed market and shareholder feedback is provided to the Board after major public announcements such as a results release. The arrangements in place are to ensure that directors develop an understanding of the views of major shareholders and that these are considered as part of the annual Board evaluation.
The Investor Relations programme also includes communications aimed specifically at its fixed income (debt) investors. The Chief Financial Officer and/or the RBS Treasurer give regular presentations to fixed income investors to discuss strategy and financial performance. There is also a separate section on the RBS website for fixed income investors which includes information on credit ratings, securitisation programmes and securities documentation. Further information is available at rbs.com/ir.
Report of the Group Nominations Committee
Dear Shareholder,
As Chairman of the Board and Chairman of the Group Nominations Committee I am pleased to present our report on the committee's activity during 2014.
Role and responsibilities
The Group Nominations Committee engages with external consultants, considers potential candidates and recommends appointments of new directors to the Board. The terms of reference of the Group Nominations Committee are reviewed annually and approved by the Board and are available at rbs.com.
Principal activity during 2014
The Committee continues to monitor succession planning on an ongoing basis taking into account business requirements and industry developments. In 2014, discussions principally focussed on the Chairman search and the search for new non-executive directors. The Board held a separate session on succession planning in September 2014, covering the Executive Committee and an update on RBS’s People Strategy.
Membership and meetings
All non-executive directors are members of the Group Nominations Committee which is chaired by the Chairman of the Board. The RBS Chief Executive and the Chief Financial Officer are invited to attend meetings.
The Group Nominations Committee holds at least two scheduled meetings per year, and also meets on an ad hoc basis as required. In 2014, there were four scheduled Group Nominations Committee meetings, which I chaired, and individual attendance by directors at these meetings is shown in the table below. In addition a number of ad hoc meetings were held to discuss Chairman succession.
| | Attended/ scheduled |
| Philip Hampton (Chairman) | 4/4 |
| Sandy Crombie | 4/4 |
| Alison Davis | 4/4 |
Morten Friis (1) | 4/4 |
| Robert Gillespie | 4/4 |
| Penny Hughes | 4/4 |
| Brendan Nelson | 4/4 |
| Baroness Noakes | 4/4 |
| | |
| Former members | |
Tony Di lorio (2) | — |
Philip Scott (3) | 3/4 |
| (1) | Appointed to the Committee on 10 April 2014. |
| (2) | Stepped down from the Board on 26 March 2014. |
| (3) | Stepped down from the Board on 31 October 2014. |
Chairman search
In September 2014, it was announced that I would step down as Chairman in 2015. The search for my successor commenced immediately. In line with the Code, I did not chair the Nominations Committee meetings in relation to these discussions.
Egon Zehnder International (EZ) has been engaged to support the search process for the new Chairman. EZ does not provide services to any other part of the RBS. A job specification has been prepared, which includes an assessment of the time commitment expected. The Committee has held a number of discussions on potential candidates (internal and external) and engaged with RBS’s key stakeholders to seek their views on candidates. On 25 February the Board approved the appointment of Howard Davies as a non-executive director with effect from the end of June and as Chairman from 1 September 2015.
Consideration of new non-executive directors
EZ has continued to support the search for new non-executive directors during 2014 following the departure of Art Ryan, Tony Di Iorio and Philip Scott and to support the future Board succession planning. The search for potential candidates is continuing.
Report of the Group Nominations Committee
Tenure of non-executive directors
The chart below sets out the tenure of non-executive directors.
Board and Committee membership
Board and Committee membership was reviewed in 2014 and the following Committee membership changes were made:
| · | Robert Gillespie was appointed a member of the Board Risk Committee, Group Performance and Remuneration Committee and Sustainable Banking Committee with effect from 1 April 2014; |
| · | Baroness Noakes was appointed Chairman of the Board Risk Committee and RCR Board Oversight Committee with effect from 1 April 2014; |
| · | Morten Friis was appointed a member of the Board Risk Committee and Group Audit Committee with effect from 10 April 2014; |
| · | Sandy Crombie was appointed Chairman of the Group Performance and Remuneration Committee with effect from 25 June 2014; and |
| · | Penny Hughes was appointed Chairman of the Sustainable Banking Committee with effect from 25 June 2014. |
Boardroom diversity
The Board remains supportive of Lord Davies’ recommendations and currently exceeds the target of 25 per cent female board representation as set out in Lord Davies’ report.
The chart below details the gender diversity of the Board.
In accordance with the recommendations contained within Lord Davies’ report, the Board operates a boardroom diversity policy and a copy of the Board’s diversity statement is available on rbs.com>about us.
RBS understands the importance of diversity and, with regard to gender diversity, recognises the importance of women having greater representation at key decision making points in organisations. The search for Board candidates will continue to be conducted, and nominations/appointments made, with due regard to the benefits of diversity on the Board, however, all appointments to the Board are ultimately based on merit, measured against objective criteria, and the skills and experience the individual can bring to the Board.
The balance of skills, experience, independence, knowledge and diversity on the Board, and how the Board operates together as a unit is reviewed annually as part of the Board evaluation. Where appropriate, findings from the evaluation will be considered in the search, nomination and appointment process. If appropriate, additional targets on diversity will be developed in due course.
Further details on RBS’s approach to diversity can be found on page 101.
Philip Hampton
Chairman of the Group Nominations Committee
25 February 2015
Report of the Group Audit Committee
Letter from Brendan Nelson,
Chairman of the Group Audit Committee
Dear Shareholder,
There have been a number of changes to the membership of the Audit Committee during 2014. I would like to begin by welcoming Sandy Crombie and Morten Friis, who joined the Committee in April 2014. Both bring a wealth of experience across finance, risk and control matters and have already made valuable contributions to the work of the Committee. I would also like to extend my gratitude to Tony Di Iorio and Philip Scott who stood down as members of the Board and Committee in March and October 2014, respectively. The Committee also welcomed Ewen Stevenson to RBS, who succeeded Nathan Bostock as Chief Financial Officer.
The key priority of the Audit Committee during 2014 has been to monitor the integrity of RBS’s financial statements, focusing in particular on the quality and transparency of disclosure, and to support the ongoing strengthening of the internal control environment.
Owing to favourable credit conditions and the delivery of the early cost saving benefits from RBS’s Transformation Programme, RBS experienced better than anticipated operating performance during the year. The Audit Committee supported the Board in its decision to release trading statements ahead of the half year and Q3 reporting periods.
Throughout the reporting period, through discussion and deliberation with Management, the Committee satisfied itself that the key accounting decisions, risks and significant management judgements that underlie the financial statements were appropriate. The Committee reviewed the conclusions of the External Auditor and, where applicable, other experts and concluded that disclosures in the financial statements about these judgements and estimates were transparent and appropriate. A more detailed account of the most material issues considered by the Committee is set out in the report below.
The Audit Committee also focused on the effectiveness of internal controls. In 2014, RBS embarked on its journey of transformation to a simpler and more efficient organisation. While the Transformation Programme will ultimately bring long term benefits, the scale of change is not to be underestimated and the Audit Committee has monitored the short term impact on RBS’s control environment.
The Committee continued to oversee the Markets Control Remediation Programme (MCRP) during the year. It is anticipated that all aspects of this programme will have been successfully delivered within 2015. However, there remains further work to be done within the business to improve controls and to drive cultural change. A wider programme of cultural and control remediation across the former Markets division has commenced in 2015.
An effective three lines of defence model is critical to the success of cultural change and strengthening internal controls across the organisation. The model has been developed further during 2014; it is now more clearly articulated and principles based. However, while the process of embedding the three lines of defence within the new organisational construct has begun, more work is required and this needs to remain a priority for RBS in 2015. In conjunction with the Board Risk Committee, the Audit Committee will exercise oversight of progress.
One of the most significant pieces of work for the Audit Committee during 2014 was the tender process to select an external auditor from the year commencing 1 January 2016. Following a competitive tender process, the Committee recommended to the Board that Ernst & Young LLP (EY) be appointed. A transition period will commence during 2015 to ensure EY are familiar with RBS’s internal processes. Deloitte will continue as RBS’s external auditor throughout 2015, and I would like to take this opportunity to formally thank the firm and its partners for its work as auditor of RBS and its subsidiaries over the last 14 years. While the tender process and the transitional period inevitably have involved and will continue to involve considerable work, I firmly believe that the appointment of EY will ensure that RBS continues to receive the highest quality advice and external audit services.
EY also carried out an external review of the effectiveness of Internal Audit. The review compared Internal Audit’s current audit policies, procedures and practices to the applicable regulatory and industry standards. The Committee were pleased to note that notwithstanding the level of change within the organisation, Internal Audit has made progress in key areas identified within its strategic plan, including enhancing its role, people and audit processes. The review also highlighted future areas of focus for the function, including a continued focus on retention and recruitment of skilled personnel and identification of opportunities to increase further the efficiency and effectiveness of audit processes. Action plans are in place to address all detailed findings and will be tracked to closure.
The oversight role and specific business of the Committee in these and other related areas are explained in more detail in the Committee’s full report.
As Chairman of the Audit Committee, I reported after each meeting to the Board on the principal matters discussed to ensure all directors were informed of the Committee’s work. 2014 has been another challenging year for the Committee. However, I believe that the balance of skills and experience amongst the members has enabled the Committee to strike the correct balance between independent oversight and challenge and support to management. I would like to thank my fellow members for their contribution to the effective Committee performance in 2014.
Brendan Nelson
Chairman of the Group Audit Committee
25 February 2015
Report of the Group Audit Committee
Report of the Group Audit Committee
Meetings and visits
A total of seven scheduled meetings of the Audit Committee were held in 2014, including meetings held immediately before the annual and interim financial statements and the quarterly interim management statements were considered by the Board. The Committee also held six ad hoc meetings. Meetings are attended by relevant executive directors, the Internal and External Auditors and Finance, Legal and Risk Management executives. Other executives, subject matter experts and external advisers are also invited to attend, as required, to present and advise on reports commissioned by the Committee. At least twice a year the Audit Committee meets privately with the External Auditors and separately with Internal Audit management.
During 2014 members of the Group Audit Committee, in conjunction with members of the Board Risk Committee, took part in an annual programme of visits to businesses and control functions in order to gain a closer understanding of the risks and control issues they face. This value adding programme included visits to Commercial and Private Banking; Corporate and Institutional Banking; Technology Services; Finance; Risk Management and Conduct & Regulatory Affairs (twice); Internal Audit (twice).
Membership of the Group Audit Committee
The Group Audit Committee comprises four independent non-executive directors. The Chairman and members of the Committee, together with their attendance at scheduled meetings, are shown below.
| | | Attended/ scheduled |
| Brendan Nelson (Chairman) | | 7/7 |
Sandy Crombie (1) | | 4/4 |
Morten Friis (2) | | 4/4 |
| Baroness Noakes | | 7/7 |
| | | |
| Former members | | |
Tony Di Iorio (3) | | 3/3 |
Philip Scott (4) | | 5/6 |
| (1) | Became a member of the Committee on 1 April 2014. |
| (2) | Became a member of the Committee on 10 April 2014. |
| (3) | Stepped down from the Board on 26 March 2014. |
| (4) | Stepped down from the Board on 31 October 2014. |
Brendan Nelson, Morten Friis and Baroness Noakes are also members of the Board Risk Committee. Philip Scott was also a member of the Board Risk Committee until he stood down from the Board. Sandy Crombie is Chairman of the Group Performance and Remuneration Committee. This common membership helps facilitate effective governance across all finance and risk issues; ensures that compensation decisions reflect relevant finance and risk considerations; and that agendas are aligned and overlap of responsibilities is avoided where possible.
The members of the Audit Committee are selected with a view to the expertise and experience of the Committee as a whole and with proper regard for the key issues and challenges facing RBS.
The Board is satisfied that all Audit Committee members have recent and relevant financial experience and that each member of the Group Audit Committee is independent as defined in the SEC rules under the US Securities Exchange Act of 1934 (the “Exchange Act”) and related guidance. The Board has further determined that Brendan Nelson, Committee Chairman, and Baroness Noakes are both ‘financial experts’ for the purposes of compliance with the Exchange Act Rules and the requirements of the New York Stock Exchange. Philip Scott was also deemed to be a ‘financial expert’ for the same purposes, throughout his tenure as a Committee member. Full biographical details of the Committee members are set out on pages 47 to 50.
Performance evaluation
An evaluation of the Group Audit Committee’s operation was conducted internally in 2014. Overall the review concluded that the Audit Committee continued to operate effectively. The Committee has considered and discussed the outcomes of the evaluation and is satisfied with the way in which they have been conducted, the conclusions and the recommendations to be taken forward. The evaluation praised the well-run manner of the Committee and the positive dynamic between members. The allocation of business to the Committee was considered to be appropriate, although it was acknowledged it was a heavy agenda. Recommendations for improvements focused on quality and volume of papers provided to the Committee. This will be addressed via a bank-wide programme to refresh the paper format and guidelines for submission to senior Committees and Boards.
The outcomes of the evaluation have been reported to the Board and the Committee will track progress during 2015.
In addition, the PRA undertook a review of the effectiveness of the Board and its senior committees throughout 2014, including the Group Audit Committee. The outcomes of this evaluation will be reported to the Board in due course and recommendations will be progressed as appropriate.
The role and responsibilities of the Group Audit Committee
The Group Audit Committee’s primary responsibilities are set out in its terms of reference which are reviewed annually by the Committee and approved by the Board. These terms of reference are available on the RBS website www.rbs.com.
Allocation of Group Audit Committee agenda time
Report of the Group Audit Committee
| Financial reporting and policy |
The Audit Committee focused on a number of salient judgements and reporting issues in the preparation of the 2014 accounts. In particular, the Committee considered: · The evidence (including in relation to RBS’s capital, liquidity and funding position) to support the directors’ going concern conclusion. Further information is set out on page 102; · The adequacy of loan impairment provisions, focusing particularly on the judgements and methodology applied to provisions in RCR, given the exit strategy for the business and sensitivity to market conditions. The Committee was satisfied that the overall loan impairment provisions and underlying assumptions and methodologies were reasonable and applied consistently; · Valuation methodologies and assumptions for financial instruments carried at fair value including RBS’s credit market exposures and own liabilities assessed at fair value; · The appropriateness of the carrying value of goodwill and other intangible assets. Particular consideration was given to the classification of Citizens Financial Group (CFG) in light of the Initial Public Offering (IPO) and planned disposal. Following discussion it was agreed that CFG should be re-classified as a disposal group and as a discontinued operation; · The judgements that had been made by management in assessing the recoverability of deferred tax assets, bearing in mind RBS’s simplification agenda and the potential impact of ICB and ring-fencing; · Valuation of the Group’s main defined benefit pension scheme. The Committee considered the assumptions that had been set in valuing the fund and the sensitivities of those assumptions. · The methodology and assumptions underlying the level of provision held and/or the appropriateness of required disclosure in relation to: ° redress, specifically in relation to Payment Protection Insurance and Interest Rate Hedging Products; ° ongoing regulatory and litigation actions: including foreign exchange trading; retail mortgage backed securities litigation in the US; and UK shareholder actions. Following review, the Committee was satisfied that overall the level of provision held is appropriate and that disclosure is balanced and transparent; · the assessment by management of the adequacy and effectiveness of internal controls over financial reporting which had identified deficiencies in the bank’s privileged user access controls within Technology Services. The Committee monitored remediation progress and received regular reports on actions undertaken by the business to address the weaknesses. The Committee has received assurances that the majority of significant items have been closed and that the issue did not lead to the identification of any errors in the financial statements; |
· the quality and transparency of disclosures contained within the external financial statements. As part of its overall assessment of the Annual Report and Accounts, the Committee assisted the Board in determining that the Annual Report and Accounts taken as a whole was fair, balanced and understandable, providing the information necessary for shareholders to assess the company’s performance, business model and strategy. A comprehensive review process supports both the Audit Committee and ultimately the Board in reaching their conclusion: · The production of the Annual Report and Accounts is co-ordinated centrally by the Financial Controller with guidance on requirements being provided to individual contributors; · The Annual Report and Accounts is reviewed by the Executive Disclosure Committee prior to consideration by the Audit Committee; and · A management certification process requires members of the Executive Committee and other senior executives to provide confirmation following their review of the Annual Report and Accounts that they consider them to be fair, balanced and understandable. This process is also undertaken in respect of the half year and quarterly results announcements. In addition, the External Auditor considers the Board’s statement as part of its audit requirements. |
| Systems of internal control |
Remediation of known control issues has remained a focus of the Committee during 2014. As noted in the letter from the Committee Chairman, on behalf of the Board the Committee has continued to oversee the Control Remediation Programmes within the Markets division (MCRP) and has challenged management on the prioritisation of issues, delivery of remediation, quality assurance and contingency plans. The Committee received reports from Risk Management and Internal Audit and commissioned independent assurance that: the remediation programmes were progressing in accordance with plan; issues were being remediated to industry standard; and internal reporting accurately reflected progress. It is anticipated that MCRP will conclude, with delivery of all necessary actions completed, during the first part of 2015. Notwithstanding the progress achieved in MCRP, the Committee remained concerned about the lack of improvement to the Markets control environment rating, regarding regulatory concerns around the lack of cultural shift and in light of the foreign exchange trading issues. The Committee invited management to report on improvements to the business and to provide assurances that the business was addressing the risks in an appropriate and sound manner. A larger project will begin in 2015 which will encompass specific remediation issues and wider cultural change. This will be closely monitored by the Board Risk Committee and Group Audit Committee in 2015. |
Report of the Group Audit Committee
Key to the success of the remediation programme will be an effective three lines of defence model. In conjunction with the Board Risk Committee, this has been a primary area of focus for the Audit Committee during 2014. The Committee supported management’s proposals to transition the policy to be more principles-based. The governance of the model has been simplified and streamlined. However, further work is required to ensure the revised model is fully embedded and operating effectively in practice. As such, the Committee has requested a clear articulation of end-state and a plan to reach that goal which will be closely monitored during 2015. In addition, the Committee has agreed that each business will report on progress at Committee visits in 2015. Regular updates on RBS’s credit quality assurance testing were received by the Committee. These reports highlighted certain weaknesses within the wealth credit business and the Committee requested that management report on action being taken to address these issues. Root causes of the weaknesses have been identified and remediation programmes have been established to address the underlying issues. The Committee will review closely plans and progress during 2015. Bi-annual reports were also noted in relation to RBS notifiable event process and alerts on each major event are received by the Chairman of the Committee and the Chairman of the Board Risk Committee. The Finance and Risk System Transformation (FiRST) was kept under the review of the Committee in 2014. A strategic review of the programme’s aims, progress and deliverables was undertaken by management in light of the new RBS model. A proposal was presented to the Committee under which the programme scope will now be more streamlined with a narrower set of priorities, which should enable delivery. External independent assurances on the suitability of the revised plan were provided. Progress will be monitored closely by the Committee in 2015. During 2014 the Committee has received reports on the ongoing work of the Sensitive Investigations Unit. It was also updated on the whistleblowing arrangements RBS has in place for employees to raise concerns and received reports on incidents reported and investigated. This is an important tool for employees to raise issues and to identify improper behaviours. The Committee considered the enhancements made to the process during the year and also discussed the output of an Internal Audit review. In line with the Committee’s terms of reference, consideration was given to management’s processes for identifying and responding to the risk of fraud. |
As discussed in the report of the Board Risk Committee (set out on page 63 to 69), the effectiveness of the Divisional Risk and Audit Committees was considered in 2013. In response to management feedback, consideration was given to alternative mechanisms that could more effectively provide a line of sight into business risk and audit issues. A revised construct of standardised Business Risk Committees, chaired by business Chief Executives, was created and implemented in 2014, with responsibility for the consideration of all risk issues. These Committees also consider finance and audit issues on a quarterly basis and provide reports to the Board Risk Committee and Audit Committee. A review of effectiveness of the Committees will be undertaken in 2015. The Committee has considered RBS’s compliance with the requirements of the Sarbanes-Oxley Act of 2002, and is satisfied in this respect. |
| Internal audit |
The Committee received regular reports and opinions from Internal Audit throughout 2014. The audit universe was refreshed during the year to remain aligned with the evolving shape of the bank as the Transformation Programme progressed. This will continue in 2015. Audit officers are working closely with the businesses to ensure the work undertaken is appropriate in both the short and longer term. The Committee received regular updates on the progress of implementation of Internal Audit’s strategic plan. It also considered and approved Internal Audit’s annual plan for 2014 and monitored progress against it during the year. Consideration was also given to resourcing levels and the impact of the Transformation Programme and other changes taking place across RBS. During two visits to Internal Audit in 2014, the Committee reviewed external co-sourcing arrangements and recruitment strategies aimed at ensuring any capability gaps were appropriately addressed. Significant progress has been made and the benefits are being observed across the function. Overall the Committee is satisfied that the function is appropriately resourced. The reporting arrangements for the Chief Audit Executive have remained unchanged in 2014: the role continues to report to the Chairman of the Audit Committee, with a secondary reporting line to the Chief Executive for administrative purposes. The Chief Audit Executive exercises his right of attendance at Executive Committee meetings, and Internal Audit officers regularly attend relevant business-level meetings as appropriate. The annual review of the effectiveness of Internal Audit was undertaken externally in 2014. Following a competitive tender process, EY was appointed to perform this. Their report concluded that Internal Audit had operated effectively during the year. Certain recommendations were made to enhance particular practices within the function. These will be implemented during 2015, with progress tracked by the Committee. |
Report of the Group Audit Committee
| Oversight of the Bank’s relationship with its regulators |
As set out in the terms of reference, the Committee has a responsibility to monitor the relationship with the Financial Conduct Authority (FCA) and the Prudential Regulation Authority (PRA) and other relevant regulatory bodies. Regular reports were received by the Committee on the status of ongoing regulatory investigations. Any significant developments in the relationship with the regulators were noted by the Committee. The Committee members met, individually and together with other Board members, with the PRA and the FCA during the year as part of their regular interaction with the regulator. The Committee also tracked progress in relation to mandatory and remedial projects and challenged the management of individual business areas and functions on the ability to meet regulatory expectations, responsibilities and the level of resource required to do so. |
| External audit |
During 2014, the External Auditor provided the Group Audit Committee with reports summarising its main observations and conclusions arising from the year end audit, half year review and work in connection with the first and third quarter financial results and any recommendations for enhancements to RBS’s reporting and controls. The External Auditor also presented for approval to the Committee its audit plan and audit fee proposal and engagement letter, as well as confirmation of its independence and a comprehensive report of all non-audit fees. The Audit Committee undertakes an annual evaluation to assess the independence and objectivity of the External Auditor and the effectiveness of the audit process, taking into consideration relevant professional and regulatory requirements. The evaluation sought the views of Committee members and attendees and other key members of management. In assessing the effectiveness of the External Auditor, the Audit Committee had regard to the experience of the audit engagement team; the scope of the audit work planned and executed; standards of communication and reporting; quality of insights on the internal control environment; and independence. The Audit Committee is responsible for making recommendations to the Board in relation to the appointment, re-appointment and removal of the External Auditors. In order to make a recommendation to the Board, the Audit Committee considers and discusses the performance of the External Auditor, taking account of the outcomes of the annual evaluation carried out. The Board submits the Audit Committee's recommendations to shareholders for their approval at the Annual General Meeting. The Audit Committee approves the terms of engagement of the External Auditor and also fixes their remuneration as authorised by shareholders at the Annual General Meeting. |
| A competitive tender was undertaken in 2014 to select an auditor for the audit of RBS and its subsidiaries in 2016 (and future periods). Following this, and due consideration by the Audit Committee and the Board, EY was chosen. A transition period will take place in 2015, during which EY will reach a point of independence from RBS and will begin to shadow the audit process to ensure it is well informed to commence as the External Auditor in 2016. |
| Audit and non-audit services |
The Audit Committee has adopted a policy on the engagement of the External Auditor to supply audit and non-audit services, which takes into account relevant legislation regarding the provision of such services by an external audit firm. The Committee reviews the policy annually and prospectively approves the provision of audit services and certain non-audit services by the External Auditor. For all other permitted non-audit services, Group Audit Committee approval must be sought in advance, on a case-by-case basis. A competitive tender process is required for all proposed non-audit services engagements where the fees are expected to exceed £100,000. Engagements below £100,000 may be approved by the Chairman of the Group Audit Committee; as an additional governance control all engagements have to be approved by the Financial Controller and Supply Chain Services. Where the engagement is tax related, approval must also be obtained from the Director of RBS Tax. Ad hoc approvals of non-audit services are ratified by the Group Audit Committee each quarter. During 2014, the External Auditor was approved to undertake certain significant engagements which are explained more fully below: · Assurance testing in relation to RBS’s 2013 Sustainability Report. The External Auditor was selected given its significant experience in specialist sustainability reporting. An improved fee was also negotiated. · Provision of a compliance report required to comply with an amendment by the SEC to certain broker-dealer annual reporting requirements. Standard industry practice is for the External Auditor to be appointed to perform this work. · Provision of advice and assistance to RBS Capital Resolution in formulating deleveraging strategies and transaction preparation. Data gathering, due diligence and information assessment was also undertaken. Following a review of all advisors in this area, Deloitte was selected in recognition of the team’s position as one of the leaders in the European loan portfolio sale market, particularly in the relevant geographies. Further details of the non-audit services that are prohibited and permitted under the policy can be found on the website www.rbs.com. Information on fees paid in respect of audit and non-audit services carried out by the External Auditor can be found in Note 5 to the consolidated accounts on page 363. |
Brendan Nelson
Chairman of the Group Audit Committee
25 February 2015
Report of the Board Risk Committee
Letter from Baroness Noakes,
Chairman of the Board Risk Committee
Dear Shareholder,
This is my first letter to you as Chairman of the Board Risk Committee, having succeeded Philip Scott on 1 April 2014. I have been a member of the Committee since 1 March 2012. On behalf of the Committee, I would like to thank Philip for his leadership as Chairman over the previous four years. I would also like to thank Sandy Crombie and Tony Di Iorio for their work as members of the Committee: both stood down at the end of March. In April we welcomed three new members to the Committee: Morten Friis, Robert Gillespie and Penny Hughes who have already made significant contributions.
The purpose of this report is to describe how the Committee discharged its responsibilities during 2014 and to provide details of the material and significant issues which it considered and debated during the course of the year. It should provide a sense of the breadth of the Committee’s work, which included focus on conduct risk, credit risk, market risk, operational risk, people risk, regulatory risk and reputational risk. As a reflection of the increased demands on the Committee, the number of scheduled meetings during 2014 was increased from seven to nine. This will be maintained in 2015.
The backdrop throughout 2014 for RBS has been one of significant change. In February, the bank announced its new strategy to be a
smaller, simpler UK focused bank. It mobilised a transformation programme with the objective of implementing the future bank-wide operating model and required process and technology changes. The Board Risk Committee assumed responsibility for monitoring execution risk. It received regular reports on progress, including independent opinions from Risk Management, Internal Audit and HR. Monitoring the risks associated with the transformation programme will continue throughout 2015 and beyond.
The objective underpinning RBS’s revised strategy is gaining customers’ trust and putting customers’ needs at its core. Unfortunately, in 2014 RBS continued to deal with certain significant conduct issues that have hindered the speed of RBS’s recovery and damaged its reputation. Of particular concern were the issues associated with manipulation of foreign exchange markets. The Committee oversaw the internal and regulatory investigations which ultimately led to the imposition of a substantial fine in November 2014, by the FCA and US Commodity Futures Trading Commission (CFTC).
The outcome was a stark reminder of the importance of culture and integrity in banking. On behalf of the Board, the Committee monitored the resulting disciplinary and accountability processes and made recommendations to the Group Performance and Remuneration Committee on action to be taken. The Committee will continue to oversee interactions on this matter with RBS’s other regulators in 2015. Details of other conduct and litigation matters under review of the Committee are set out in the Committee report.
It is always disappointing to have to consider behaviour which falls below expected standards. While the Committee plays a key role in ensuring appropriate action is taken when things go wrong, it is important to instil values that will eliminate this conduct at the outset. Driving a strong and healthy risk culture is fundamental to this. During 2014, RBS has commenced a programme of work to benchmark its risk culture both against peers and heightened regulatory expectations. The Committee has supported this programme wholeheartedly and will review a plan in early 2015 which will articulate how the bank can define and embed a stronger risk culture and evidence that this is effective.
Equally important is ensuring that the accountabilities of our staff are clear and transparent. In conjunction with the Group Audit Committee, the members have reviewed progress in embedding the three lines of defence model across RBS. While progress has been made to develop definition and design principles, significant work is still required to articulate and embed the operating model within businesses. This will be a priority in 2015.
RBS was fined in November 2014 for failing to put in place resilient IT systems. During the year, the Board Risk Committee has continued to oversee the remediation activity following the IT incident, which occurred in 2012. It has also considered accountability. Independent assurance has been provided by PwC that the work undertaken by the business has been appropriate and addresses the key areas requiring remediation. However, more remains to be done and the Committee will continue to ensure in 2015 that changes are sustained and risks are appropriately identified and escalated.
The Committee has dedicated considerable effort in 2014 to reviewing external and internal stress testing exercises. The Committee reviewed and recommended to the Board the submissions to the European Banking Authority (EBA) and the Bank of England (BoE) and approved the reverse stress test trigger framework. Unfortunately, in November 2014 an error was identified in the calculation of the modelled Common Equity Tier 1 (CET1) ratio in the EBA stress test results which led to RBS’s published CET1 stress test ratios being overstated. Independent assurance was sought and the error was corrected. The Committee will continue to closely monitor the actions being taken to avoid a repeat of this error until it is clear that we can deliver against our own and regulatory expectations for stress testing.
Report of the Board Risk Committee
Other material areas of Committee focus during the year have included:
| · | consideration of the risk appetite framework of RBS to ensure it remains fit for purpose in light of internal restructuring, market positioning and regulatory changes; |
| · | planned improvements to the Operational Risk Management Framework; |
| · | the capital and liquidity position of RBS and related regulatory submissions; |
| · | improvements to risk reporting; and |
| · | assessment of the risk performance of both businesses and individuals and consideration of the accountability and behaviour of individuals in relation to specific matters. |
More detailed information on each of these areas is set out in the Board Risk Committee report that follows.
Key Priorities for 2015
The report demonstrates the substantial efforts being taken to reduce the level of risk at RBS, under the oversight of the Committee. However, it is important to note that risk reduction remains a work in progress. Management is continually striving to enhance the safety and soundness of the bank, and will continue to pursue actions to bring RBS within risk appetite. The Board Risk Committee will monitor progress closely and will oversee the quality and quantity of available resources to ensure they are sufficient to achieve real improvement. Other priorities will include risk culture, risk appetite, operational risk management, cyber risk and information security; and the execution risks associated with strategic initiatives.
2014 was another challenging year for the Board Risk Committee and I would like to extend my thanks to my fellow members and to RBS’s senior leadership team for the additional time they have dedicated to the business of the Committee.
Baroness Noakes
Chairman of the Board Risk Committee
25 February 2015
Report of the Board Risk Committee
Meetings and visits
The Board Risk Committee held nine scheduled meetings and four ad hoc meetings in 2014. The ad hoc meetings were required to consider: the Clifford Chance report into the allegations set out in the Tomlinson Report; the EBA stress test results; risk performance of businesses and individuals; and accountability matters relating to the manipulation of the foreign exchange market.
In addition to the members, Board Risk Committee meetings are also attended by relevant executive directors, including representatives from Risk Management, Conduct and Regulatory Affairs (C&RA), Finance and Internal Audit. External advice is also sought by the Board Risk Committee, where appropriate. A standing invite has been issued to the lead partner of the External Auditor to attend all meetings from January 2015 onwards.
During 2014, in conjunction with members of the Group Audit Committee, members of the Board Risk Committee took part in an annual programme of visits to businesses and control functions in order to gain a deeper understanding of the risks and issues they face. This value adding programme included visits to Commercial and Private Banking; Corporate and Institutional Banking; Technology Services; and Finance. In addition, the Committee made two visits to Risk and C&RA; and Internal Audit. In addition, an in-depth session on risk reporting was undertaken by the Committee in 2014.
Membership
The Board Risk Committee comprises at least three independent non-executive directors. The Chairman and members of the Committee, together with their attendance at scheduled meetings, are shown below.
| | Attended/ scheduled |
Baroness Noakes (Chairman)(1) | 9/9 |
Morten Friis(2) | 6/6 |
Robert Gillespie (3) | 5/6 |
Penny Hughes (3) | 6/6 |
| Brendan Nelson | 9/9 |
| | |
| Former members | |
Sandy Crombie (4) | 3/3 |
Tony Di Iorio (5) | 3/3 |
Philip Scott (6) | 8/8 |
| (1) | Became Chairman of the Committee with effect from 1 April 2014. |
| (2) | Became a member of the Committee with effect from 10 April 2014. |
| (3) | Became a member of the Committee with effect from 1 April 2014. |
| (4) | Stepped down from the Committee on 31 March 2014. |
| (5) | Stepped down from the Board on 26 March 2014. |
| (6) | Stepped down from the Board on 31 October 2014. |
Baroness Noakes, Morten Friis and Brendan Nelson are also members of the Group Audit Committee. Philip Scott was a member of the Group Audit Committee until he stood down from the Group Board on 31 October 2014. Robert Gillespie is also a member of the Group Performance and Remuneration Committee and the Sustainable Banking Committee, and Penny Hughes chairs the Sustainable Banking Committee. This common membership across Committees ensures effective governance across all risk, finance, reputational and remuneration issues and that agendas are aligned and overlap of responsibilities is avoided where possible.
Role of the Board Risk Committee
The Board Risk Committee’s primary responsibilities are set out in its terms of reference which are reviewed annually by the Committee and approved by the Board. These are available on the bank’s website: www.rbs.com.
Allocation of Board Risk Committee agenda time
Performance Evaluation
The annual review of the effectiveness of the Board and its senior Committees, including the Board Risk Committee, was conducted internally in 2014. The Committee has considered and discussed the outcomes of this evaluation and accepts the findings. Overall the review concluded that the Board Risk Committee continued to operate effectively. The composition of the Committee was considered to be well-balanced, with the skills and perspectives required to respond to the challenges faced. The quality of debate at Committee meetings was also noted to be of a high standard. Some areas where further enhancements to Committee performance could be made were identified, these included: the development of a specific technical training programme to complement the members’ knowledge; review of the thresholds for reporting and escalation of issues to ensure Committee focuses on the key issues; and continued improvements to reporting to the Committee so that there are more focussed and higher quality papers which clearly articulate the key issues for debate.
The outcomes of the evaluation have been reported to the Board. The conclusions and the recommendations to help improve the Committee’s effectiveness will be taken forward and progress will be tracked during 2015.
Report of the Board Risk Committee
| Risk strategy and policy |
In February 2014, RBS announced its refreshed strategic direction to become a smaller UK centric bank with a focus on placing customers at the fore. A transformation programme was established to implement the required changes, with both short term and longer term objectives. During 2014, the Board Risk Committee, on behalf of the Board, dedicated significant time to regularly reviewing the execution risks and issues arising from the implementation of such fundamental change across the organisation. The Committee has received regular progress updates from the project team. Risk Management has been fully involved in the transformation programme and has provided an independent opinion to the Committee at each meeting on the risks in the programme. In addition, the Committee receives independent opinions from HR and Internal Audit. On a rolling basis, the Committee has held focus sessions on the key workstreams under the programme which are aligned to the priority areas of Reshaping the Bank, Cost, Customer, Control & IT execution. In 2014, the Committee received reports on the customer workstream, the control transformation programme and technology. The Committee also commissioned a detailed review of the people risks facing the organisation. Detailed 2015-17 plans were presented to the Board in December 2014 and the Committee will continue to rigorously monitor the risks and issues arising as plans progress. The Committee also considered the risks in specific strategic objectives of the bank, in particular it: · reviewed the progress on the strategic initiative to dispose of the Williams & Glyn business. It considered the technical complexities inherent in the programme; risks associated with the disposal; regulatory requirements; scope; viability; and threats to delivery. Risk is engaged in the programme and has provided the Committee with opinion on key risks and execution. The Committee will continue to oversee delivery throughout 2015, being particularly mindful of the challenging timescales; · considered the potential impacts on RBS’s mortgage book in the event of a sharp fall in property prices in the short to medium term, should concerns over rising London house prices crystallise; · received regular reports on the threats to RBS and its customers’ businesses posed by economic or political events across a number of countries including Thailand, Russia and Ukraine; and · reviewed the RBS Resolution Plan and recommended it to the Board for approval prior to submission to the PRA. The Committee considered operation of RBS’s Policy Framework and considered management’s plans to improve the accessibility, clarity and ease of implementation of RBS’s policies. |
| Risk profile |
Reporting A key priority for the Committee in 2014 was the need to improve and streamline the quality of risk reporting. Following a focus session on Risk Reporting, good progress has been made in this respect and a revised format risk report, including a ‘top risks’ section, was launched in October. Risk reporting is now more strategic and forward looking and current and future risk positions are reported relative to risk appetite and limits. Throughout 2014 the Committee received reports on key risk issues and risk metrics at each meeting and the Chief Risk Officer provided a verbal update on the key risks to RBS. The Chief Conduct and Regulatory Affairs Officer also provided a verbal update on current matters pertinent to the Committee at each meeting. This has been a useful means of ensuring the Committee receives the latest information on current and emerging risk and conduct matters. Reports are made to the Committee at each meeting on the most recent discussions at the Executive Risk Forum – the management-level risk committee which reports to the Board Risk Committee. Conduct and Remediation The Committee carefully considered various conduct issues and remediation programmes in 2014. A primary concern was the investigation of misconduct within the foreign exchange trading business. The Committee received regular reports as the investigation evolved and was kept abreast of interactions with regulators. In November 2014, RBS reached a settlement with the FCA and the US Commodity Futures Trading Commission (CFTC) in relation to failings in the foreign exchange business. RBS fully cooperated with the regulatory investigations and accepted the findings. The Committee has exercised close oversight of the internal investigation into the conduct of current and former employees who had involvement in the foreign exchange area. RBS has announced action taken to date and will provide a further update when the accountability review is complete, which is expected to be in the first quarter. RBS remains in discussion with other governmental and regulatory authorities on these issues, including the US Department of Justice, and the Committee will continue to give this appropriate focus in 2015. The allegations of misconduct within RBS’s Restructuring business, which were set out in the Tomlinson Report, were also given detailed consideration at the Committee. In response to the report, RBS commissioned Clifford Chance to undertake an independent review into the most serious allegations. The Committee played a key role in monitoring developments and overseeing the publication of the report, in April 2014. It welcomed the finding that there was no evidence of the serious and damaging allegation that RBS had set out to deliberately defraud its business customers. The Committee will continue to monitor the separate, external investigation into Restructuring, which was commissioned by the FCA under section 166 of the Financial Services and Markets Act. The results of this are anticipated during the first part of 2015, and will be reviewed in detail by the Committee. |
Report of the Board Risk Committee
Following the IT incident in June 2012, a significant amount of work has been undertaken to strengthen the resilience of RBS’s technology systems and this continued to be an area of focus for the Committee in 2014. It received quarterly reports on the work being undertaken to enhance resilience and to address the findings of the section 166 regulatory review. Reports have included independent assurance from PwC that the work undertaken by the business has been appropriate, sustainable and addresses the key areas requiring remediation. In order to further inform the Committee’s considerations around technology resilience a ‘deep dive’ session was held for all Board members in May 2014. As well as considering the immediate concerns around improving resilience, this session also offered an opportunity to review longer term priorities for the function. The Committee is satisfied with the progress of the IT resilience remediation programme and it is anticipated that the work will be complete in early 2015. At this point the Committee will determine appropriate methods of future oversight of the risks associated with IT resilience. A key part of ensuring the correct behaviours are instilled across RBS is articulating and embedding an appropriate risk culture within RBS that is set and cascaded from the top. This needs to be clearly aligned to the RBS’s existing culture programme. The Risk and Conduct & Regulatory Affairs functions have started the process of researching and developing an appropriate risk culture programme for RBS, and have kept the Committee appraised of progress. Lessons have been gained from liaison with peers and benchmarking. The Committee will review management’s plan to embed risk culture across RBS and the proposed measures to assess and validate its effectiveness during 2015. This topic is of keen regulatory interest will remain a priority for the Committee in 2015 and beyond. In 2014, the Committee also received reports on other conduct and regulatory issues, including: · quarterly updates from the oversight committee established to monitor the status of current open investigations in the former Markets Division. This work has been complemented by that of the Markets Controls Remediation Programme (MCRP) which has been monitored by the Group Audit Committee. In 2015, MCRP will be succeeded by the Markets Standards Programme. The Markets Standards Programme will be similar in scale to MCRP, with a greater focus on conduct and culture in addition to controls. It will incorporate remediation of the foreign exchange trading issues; · RBS’s progress in improving its end to end customer complaints management process, in particular its strategic aims to reduce complaint volumes and to resolve issues at the first point of contact or within forty eight hours of receipt. The Committee will receive further updates on progress next year; · reports on Anti-Money Laundering remediation at each of its meetings in the first half of 2014, ahead of the regulatory attestation in June 2014. Reporting has now returned to exception based reporting pending further regulatory review; |
· initial reports on trade and transaction reporting compliance and collateral management issues within the Corporate and Institutional Banking business. The Committee will receive more detailed reports on required action and remediation in early 2015; · the status of key litigation cases, in particular the US residential mortgage-backed securities litigation claims; and · the remediation of known regulatory issues in the RBS Americas region. Capital Management The Committee reviewed the capital and liquidity position of the bank regularly. It reviewed and recommended that the Board approve the Individual Liquidity Adequacy Assessment (ILAA) and the Internal Capital Adequacy Assessment Process (ICAAP). An assurance opinion was provided by Internal Audit on the adequacy of the processes supporting the preparation of the submissions. In response to increased regulatory expectations, the Committee has dedicated considerable effort in 2014 to the oversight of stress testing. It has been actively engaged in discussions on underlying assumptions and scenario selection for the European Banking Authority and Bank of England ‘UK Variant’ stress-test exercises and recommended the stress test results submissions to the Board. The Committee reviewed the output of stress testing exercises and has been involved in consideration of their announcement to the market. The Committee also made appropriate recommendations to the Board on reverse stress testing thresholds. Focus on stress testing and reliance upon the outputs is set to increase in 2015 and beyond. It is therefore essential that the business is resourced to meet expectations and that individuals possess the correct skills and are supported by the correct processes and tools. The Committee will carefully review stress testing capability enhancement plans to ensure that these are fit for purpose and meet regulatory expectations for 2015. Market, Credit and Operational Risk The Committee conducted its regular review of the market risks managed by RBS. The appetite for market risk and related limits were also reviewed in the context of the reduction in the size of the Corporate and Institutional Banking business, in line with the bank’s strategy. The Committee reviewed key market risk issues and hot topics including remediation and compliance with CRD IV requirements. Plans to enhance the management of exposures across Credit and Market Risk were considered. A detailed overview of the Credit Risk portfolio was also provided to the Committee, including a report on activities to address current and emerging risks, and an update on the credit risk appetite frameworks. Steps taken to de-risk certain portfolios, including commercial real estate, and to improve overall asset quality were considered. |
Report of the Board Risk Committee
Working closely with the Group Audit Committee, the Committee reviewed the updated three lines of defence design principles (across front line management, risk and internal audit). In the second half of 2014, implementation has been focussed on publication and dissemination of the principles, and application in both organisational structures and individual role profiles. During 2015, the focus will be on driving these principles deeper into the organisation, supported by the planned activity on risk culture outlined above. Effective operation of the three lines of defence model is critical to the success of the bank’s transformation and the Committee will carefully consider plans in early next year and monitor delivery against agreed objectives. An effective first line of defence with a clear understanding and ownership, is fundamental to the success of the Operational Risk Management Framework (ORMF). The way in which RBS currently manages Operational Risk is inconsistent across the bank and a programme of work has been established to address identified weaknesses in capabilities. During 2014, RBS Risk has defined an enterprise wide approach to risk management covering all risk disciplines and has aligned its end state vision of what a good ORMF should look like to this approach. The Board Risk Committee has received reports on progress and will consider detailed plans in the first quarter of 2015. Thereafter, the Committee will monitor progress as the programme is delivered over the following two years. The Committee also received reports on: · RBS’s long dated derivatives business and noted the risk and control framework (including limits and collateral requirements) which supported it; · the New Product Risk Assessment process including enhancements made to the end to end product life cycle; · the status of RBS’s compliance with the Single European Payments Area (SEPA) Directive; · regular reports on improvements in information security, corporate security, records management and cyber risk; · enhancements to data quality across the organisation. The opinion of Internal Audit was considered in this respect also. Further status updates will be provided during 2015. In December 2014, the Committee supervised the responses provided by RBS to the PRA and FCA as part of their Dear Chairman II Exercise on IT resilience. In particular, it reviewed the detailed responses to the FCA questionnaires, and for the more technical PRA questionnaires, the Committee reviewed the processes used to prepare the responses. In each case the Committee received assurance reports from Risk and from Internal Audit and on this basis recommended to the Board that it approve the submissions to the regulators. |
The Committee received bi-annual reports on cyber threats and responses, covering the threat landscape together with key issues and progress on the bank’s improvements plans in this area. The bank is re-baselining its appetite and approach to cyber risk and is moving to a model of strong detection and response in addition to mitigation. The banking sector will continue to be a prime target for attackers and the Committee will keep cyber risk under close review during 2015. The Committee reviewed RBS’s 2014 Annual Risk and Control Report and was satisfied that RBS had operated its risk management framework in accordance with the requirements of the UK Corporate Governance Code. |
| Risk appetite, framework and limits |
| The Board Risk Committee reviewed the risk appetite framework of RBS during 2014, particularly in light of internal restructuring, market positioning and changes to regulations. This included a review of capital adequacy, earnings volatility and stakeholder confidence. This review is being finalised and a formal risk appetite which reflects the new organisational structure will be approved in the first quarter of 2015. This review will also focus on how the detailed risk appetite processes within the individual businesses fit within the enterprise wide appetite set by the Board. |
| Risk and C&RA operating model |
During the course of two separate visits, the Board Risk Committee reviewed the Risk Management and C&RA operating model to ensure that both functions had the appropriate structures and resources in place to deliver their strategic plans. The bench-strength of the functions was reviewed and consideration was given to succession planning, resource and budget. The Committee considered in detail the impact of RBS’s transformation programme on the holistic risk management operating model. This included: resourcing levels and quality; changes to risk management’s technology support infrastructure; the impact on RBS’s overall control environment; and alignment with other major change and investment programmes. Last year, the Committee reviewed the operation of the Divisional Risk and Audit Committees. In response to management feedback, consideration was given to alternative mechanisms that could more effectively provide a line of sight into business risk and audit issues. In early 2014, the Committee agreed that standardised Business Risk Committees, chaired by business Chief Executives, should be responsible for the consideration of all risk issues and escalation to the business ExCo and ERF. These Committees also consider finance and audit issues on a quarterly basis and provide reports to the Board Risk Committee and Group Audit Committee. While the Committees are in their infancy, it is anticipated that these changes will improve the risk governance at a business level and facilitate the escalation of issues as appropriate. A review of effectiveness will be undertaken in 2015. |
Report of the Board Risk Committee
| Risk architecture |
The Board Risk Committee considered model risk management across the organisation and this will remain a key area of focus of the Committee into 2015 and beyond. The Committee reviewed the preparations underway to ensure compliance with the new Basel Principles on Effective Risk Data Aggregation and Reporting, which were due to come into effect from January 2016. Detailed plans will be reviewed and the Committee will receive reports on delivery through 2015. |
| Accountability and Remuneration |
The Board Risk Committee recognises clear link between conduct, culture and performance management. As part of its work the Committee has continued to work closely with the Group Performance and Remuneration Committee to consider the risk aspects of Executive Committee members’ objectives, performance and remuneration arrangements. The committee makes recommendations as appropriate to the Group Performance and Remuneration Committee. The Committee also considered the risk performance of businesses in light of known risk and control issues and under advice from Risk, C&RA and internal audit functions. It has also reviewed specific accountability cases and made recommendations regarding appropriate adjustments to performance related reward to the Group Performance and Remuneration Committee. The Group Performance and Remuneration Committee’s report on pages 75 to 95 includes more detail on how risk is taken into account in remuneration decisions. |
Baroness Noakes
Chairman of the Board Risk Committee
25 February 2015
Report of the RBS Capital Resolution (RCR) Board Oversight Committee
Letter from Baroness Noakes,
Chairman of the RCR Board Oversight Committee
Dear Shareholder,
The RBS Capital Resolution Board Oversight Committee was established following the creation of RBS Capital Resolution (RCR) on 1 January 2014.
RCR was established to separate and wind down RBS’s high capital intensive assets. Targets were set to remove 55-75% of these assets from the balance sheet by the end of 2015 and 85% by the end of 2016.
Key principles are:
| · | removing risk from the balance sheet in an efficient, expedient and economic manner; |
| · | reducing the volatile outcomes in stressed environments; and |
| · | accelerating the release of capital through management and exit of the portfolio. |
Given the importance of delivery of the RCR objectives for RBS's future plans, the Committee’s role is an important one. I was appointed Chairman of the Committee on 1 April 2014 and am pleased to present the report on the Committee’s activity during 2014.
The role and responsibilities of the RCR Board Oversight Committee
The Committee’s responsibilities are set out in its terms of reference which are reviewed annually by the Committee and approved by the Board. These are available on rbs.com.
The Committee’s role is to:
| · | oversee the actions of RCR’s management, including implementation of RCR’s strategy; |
| · | review and report to the Board on RCR’s progress against and compliance with the primary objective (to eliminate the bank’s exposure to RCR assets) and the asset management principles (criteria for taking decisions on the reduction of capital and assets); |
| · | agree in consultation with the Group Performance and Remuneration Committee specific incentives for RCR management, aligned to the objectives of RCR; |
| · | consider financial disclosures in respect of RCR; and |
| · | report to the Board on the Committee’s activities and recommend changes to RCR strategy. |
Membership and meetings
The Chairman of the Committee is the Chairman of the Board Risk Committee. The Senior Independent Director, the Chairman of RBS and the Chairman of the Group Audit Committee are members. Attendance at meetings is shown below.
| | Attended/ scheduled |
Baroness Noakes (Chairman) (1) | | 3/3 |
| Sandy Crombie | | 3/4 |
| Philip Hampton | | 4/4 |
| Brendan Nelson | | 3/4 |
| | | |
| Former member | | |
Philip Scott (2) | | 1/1 |
| (1) | Baroness Noakes took over from Philip Scott as Chairman of the Committee on 1 April 2014. The Committee held four scheduled meetings and two ad hoc meetings in 2014. Meetings are attended by relevant executives, and representatives from the risk, finance and human resources functions. |
| (2) | Stepped down from the Committee on 1 April 2014. |
Principal activities during 2014
As a newly established Board Committee, the focus at the first meeting was reviewing the Committee’s terms of reference and schedule of business for the year. The Committee also reviewed the governance structure and delegated authorities for RCR. The format of reporting on progress against the primary objective and asset management principles, and the pro-forma for financial reporting were also considered.
At each scheduled meeting during the remainder of the year, the Committee has considered financial performance and delivery against targets and asset management principles, and received updates on emerging issues and material transactions. The outlook in relation to capital release and the residual asset pool is also reviewed.
Risk reporting developed and evolved through the year and the Committee now receives information on a quarterly basis on operational, conduct and people risk.
The Committee recognised that the objective of accelerating disposal of assets carried additional customer and conduct risks. It paid particular attention to the leadership and culture within RCR and reviewed the RCR framework and operating principles to satisfy itself that management were managing these risks appropriately.
The Committee also reviewed and considered certain remuneration matters for RCR and, in conjunction with the Group Performance and Remuneration Committee, has approved RCR remuneration principles, and RCR related annual objectives for the CEO of Capital Resolution Group.
Committee meetings are attended by senior RCR managers and also representatives from the control functions, in particular from the risk function.
As explained on page 153, RCR now expects substantially to complete its work by the end of 2015. The Committee will continue to oversee the activities of RCR throughout this period.
Report of the RBS Capital Resolution (RCR) Board Oversight Committee
Performance evaluation
An internal review of the effectiveness of the Board and senior committees was conducted during 2014. The Committee has considered and discussed the report on the outcomes of the evaluation and is satisfied with the way in which the evaluation has been conducted.
Overall, the review concluded that the Committee operated effectively and exercised appropriate oversight and challenge of management.
Baroness Noakes,
Chairman of the RCR Board Oversight Committee
25 February 2015
Report of the Sustainable Banking Committee
Letter from Penny Hughes
Chairman of the Sustainable Banking Committee
Dear Shareholder,
RBS has a clear ambition to be number one for customer service, trust and advocacy in each of our chosen business areas by 2020. Delivery of this ambition depends in large part on our ability to demonstrate beyond question that we are a responsible company doing business in a sustainable way.
Our strategy is clear – our success as a company is dependent on the success and fortune of our customers and the communities we live and work in. When they succeed, so do we.
We know that RBS exists in a sector that faces huge challenges and needs to change, and we’re committed to play a leadership role. I’m encouraged that we’ve changed our business practices this year on a range of issues to make banking fairer for our customers and our communities.
Inside the bank we are on a long journey to create a culture that stands apart from the misconduct of the past. We have strong, clear values that guide our decision making, but these are yet to be truly ingrained in our approach to running the bank.
The Sustainable Banking Committee is primarily concerned with overseeing how well management is running the bank sustainably for its stakeholders and dealing with matters of reputation and trust, including cultural change. In fulfilling this responsibility, we try to consider the long term interests of all stakeholder groups which include customers, employees, shareholders, government, regulators, society and advocacy groups.
Although we still have a long way to go, some good progress was made in 2014 and the key areas of work during the year included:
| · | Oversight of the values and conduct work intended to address behavioural and cultural issues |
| · | Assessing performance on delivery of customer commitments on trust, advocacy and service including simple, transparent and fair banking |
| · | Ongoing commitment to stakeholder engagement through face to face sessions with advocacy groups on key issues of concern (more details on the next page) |
| · | Oversight of progress on sustainability activities across RBS including serving society, serving customers and supporting communities |
| · | Oversight of the development of Environmental, Social and Ethical (ESE) policies designed to ensure responsible and sustainable management of risks in sensitive and controversial lending sectors. ESE polices have now been developed for Defence, Forestry, Fisheries & Agribusiness, Mining & Metals, Oil & Gas, Gambling, Power Generation and Animal Testing. As a result of these policy decisions, the Committee has played an instrumental role in not providing finance to a number of controversial areas of industry. |
| · | Oversight of progress on people issues including safety and health, wellbeing, diversity and inclusion and employee engagement |
| · | Considering sustainability positioning on environmental targets, climate change, human rights and sustainable energy opportunities |
| · | Transparent reporting through the annual Sustainability Review which describes our performance and approach to making RBS a more sustainable business, one which will support the long-term future of the economy and society. |
Also during 2014, the opportunity was taken to refocus the strategic direction of the Committee to ensure greater alignment with the customer ambition of the bank. Our work will concentrate on three core themes: Bank-wide Reputation and Trust, Serving Customers and Sustainability/Emerging issues. More detail on these themes is provided on pages 39 to 40. Previously known as the Group Sustainability Committee, we felt the new name of Sustainable Banking Committee better reflected our purpose and underlined the importance of sustainable banking being a core part of our strategy.
Although there is still much to be done to rebuild trust, it is pleasing that the efforts to build a responsible and sustainable business are being recognised through independent and external measures. These include having recently been ranked as the top scoring UK company in Transparency International’s latest report on transparency in corporate reporting. We have also successfully retained our place in the Dow Jones World Sustainability Index and scored well in the Carbon Disclosure Project disclosure results which assess management of climate risks and opportunities. RBS has also been reselected for inclusion in the FTSE4Good index which measures the performance of companies against globally recognised responsibility criteria. Turning to people commitments, progress on diversity and inclusion has also been recognised with various gender, race and equality awards. More information on these and our sustainability performance and external commitments can be found on pages 39 to 40.
With an increasing focus on ethics and sustainability, the priority of the Committee will be to assess and encourage the work of the executive team in building a bank that puts customers’ interests first and embeds sustainable banking into everything that we do. I took over as Chairman of the Committee after the 2014 AGM having served as a member since 2013. My thanks go to the Committee members and attendees for their support and, in particular my predecessor Sandy Crombie for his commitment in steering the work of the Committee. There are significant challenges ahead, but I am confident that we will continue to build on the work that has already been done to embed sustainability into the strategic priorities of RBS.
Penny Hughes
Chairman of the Sustainable Banking Committee
25 February 2015
Report of the Sustainable Banking Committee
Report of the Sustainable Banking Committee
Meetings
The Sustainable Banking Committee held six scheduled Committee meetings in 2014 in addition to six stakeholder engagements sessions. Both were attended by senior representatives from the customer-facing divisions as well as Human Resources, Sustainability, Risk, Conduct and Regulatory Affairs, Communications and Marketing, Strategy and Corporate Services. The Chairman of the Board regularly attends the meetings as well as internal and external specialists who are invited to join for specific items.
Stakeholder engagement sessions
In addition to ongoing engagement which takes place across our business each day, the Sustainable Banking Committee runs a proactive engagement programme to which we invite external stakeholders to meet with, and challenge, the most senior decision makers in RBS. These discussions help shape future policies, influence strategic priorities and inform decision making across RBS and will continue to play a key role. To date we have met with over 40 different groups of NGOs, civil society groups, government bodies, consumer groups and investors in this way. In particular, in 2014 we held six such stakeholder engagement sessions covering the following topics:
| · | Fair Banking with particular emphasis on how well RBS serves low income customers |
| · | Privacy and the need to balance security against the employee right to privacy |
| · | Climate Change including the latest science on the predicted physical and humanitarian impacts |
| · | Supporting Enterprise and in particular how well RBS supports international trade |
| · | Sustainability priorities of the investment community |
| · | Employee Engagement with focus on people strategy, employee sentiment and balanced leadership |
In addition, the programme of UK-based events aimed at individual shareholders continued in 2014 and provided an opportunity for shareholders to meet directors and senior management to learn more about the business.
Membership
The Sustainable Banking Committee comprises three independent non-executive directors. During the year, new member Robert Gillespie joined existing member Alison Davis, and Penny Hughes took over from Sandy Crombie as Chairman after the AGM. The Chairman and members of the Committee, together with their attendance at meetings, are shown below.
| | Attended/ scheduled |
Penny Hughes (Chairman) (1) | 5/6 |
| Alison Davis | 6/6 |
Robert Gillespie (2) | 5/5 |
| | |
| Former member | |
Sandy Crombie (3) | 3/3 |
| (1) | Appointed Chairman of the Committee on 25 June 2014. |
| (2) | Appointed to the Committee with effect from 1 April 2014. |
| (3) | Stepped down from the Committee on 25 June 2014. |
Performance evaluation
An internal review of the effectiveness of the Sustainable Banking Committee took place in 2014 and overall the review concluded that the Committee continued to operate effectively. In particular, the stakeholder engagement sessions were regarded as a valuable opportunity to learn how well RBS is aligned to external sustainability priorities and these will continue in 2015. Another key focus will be to embed the changes made in 2014 to the strategic direction of the Committee.
Role and responsibilities of the Sustainable Banking Committee
The Sustainable Banking Committee is responsible for overseeing and challenging how management is addressing sustainable banking and reputation issues, considering the long term interests of all stakeholder groups.
Authority is delegated to the Sustainable Banking Committee by the Board and the Committee reports and makes recommendations to the Board as required. The terms of reference of the Committee are available on the RBS website rbs.com and these are reviewed annually and approved by the Board. A report on the activities of the Committee in fulfilling its responsibilities is provided to the Board following each meeting. The principal responsibilities of the Committee are shown below grouped under its three core themes of work: Bank-wide Reputation and Trust; Serving Customers; and Sustainability/Emerging Issues.
Bank-wide Reputation and Trust led by the Chief Executive
Oversight of:
| · | Management of reputation and delivery of commitments on trust, advocacy and customer service |
| · | Reputational challenges relating to people agenda including embedding of values and cultural change activity |
| · | Development of brand strategy in line with, RBS’s purpose, vision and values |
| · | Sustainable growth of business and measures taken to support economic development and how banks can better serve society |
| · | Community programmes and employee engagement in charitable partnerships |
Serving Customers led by business leaders
| · | Provide challenge on how well RBS is integrating sustainable banking into its business strategy and what is being done to foster a sustainable business for customers |
| · | Receive reports on key reputational risks relating to customer priorities and performance against customer commitments |
| · | Consider product sustainability, transparency and fairness |
| · | Receive reports on how RBS is supporting SMEs and oversee the approach to responsible lending and financial inclusion |
Sustainability/Emerging Issues led by the Chief Sustainability Officer
| · | Oversight of Environmental, Social and Ethical risk policies |
| · | Engage with key internal and external stakeholder groups on emerging sustainability issues |
| · | Approve the annual Sustainability Report and receive the external auditors assurance report |
| · | Oversee priorities, targets and reputational challenges on key emerging sustainable banking issues and consider best practice benchmarking |
Directors’ Remuneration Report
Annual Statement from Sandy Crombie
Chairman of the Group Performance and Remuneration Committee
Dear Shareholder,
I became Chairman of the Group Performance and Remuneration Committee with effect from the 2014 AGM having served as a member since 2009. I would like to thank my predecessor, Penny Hughes, for her leadership of the Committee over the past four years.
The Committee must balance the views of our stakeholders with our duty to reward our people fairly, and our responsibility to ensure that we are running a commercial business with the best available talent. We will do our utmost to make balanced decisions and to explain our approach to our many stakeholders.
I believe we are making genuine progress. RBS has been at the leading edge of reform in bringing down how much we pay and changing the structure of how pay is delivered. Over the last five years bonus pools have fallen by around two thirds across RBS and by nearly 90% within the investment bank. Last year we introduced a simplified pay structure for our executive directors with annual bonuses being discontinued. This means that their variable pay will be delivered entirely in long-term incentive awards, aligning executive directors’ pay more than ever to shareholder value over the long term.
Our current Directors’ Remuneration Policy was approved at the 2014 AGM with over 99% of shareholders voting in favour. No changes are being made to the policy at this time. This letter and the accompanying report aim to demonstrate the context in which decisions have been made, the decisions reached for the 2014 performance year and how the Committee intends to approach the year ahead.
Context for our decisions
Last year we set out a new strategy that stated our ambition to become the best bank in the UK for customer service, trust and advocacy by 2020. A remuneration policy that supports our business strategy is an essential part of rebuilding a successful and trusted RBS. We made good progress in 2014. Total pay costs and pay per employee have been reduced, while we have been establishing a platform to deliver good customer outcomes and sustainable returns to shareholders. There is a clear need for management to keep the franchise intact while moving the business towards a more normal and stable position. The Committee’s decisions aim to support this process.
One of the main changes during 2014 is that RBS is now operating in a framework that limits variable pay to no more than the level of fixed pay. This change is in line with the views of our majority shareholder, UK Financial Investments (UKFI). Often referred to as the ‘bonus cap’, this limit applies to all employees who are considered to be Material Risk Takers (MRTs) under regulatory requirements, a population that has increased significantly in line with enhanced criteria from the European Banking Authority (EBA). For the majority of these employees, no changes have been required to their remuneration arrangements.
Role-based allowances have been introduced as an additional element of fixed pay for some MRTs in line with market practice. Allowances for members of the Executive Committee are delivered entirely in shares and are subject to a retention period. Increases in fixed pay have been balanced by longer vesting periods for long term incentives and an overall reduction in the maximum compensation available.
In accordance with Prudential Regulation Authority (PRA) requirements, we have updated our clawback policy. Any variable pay awarded to MRTs from 1 January 2015 will be subject to clawback for seven years from the date of award. Clawback is the recovery of awards that have vested and been paid to employees. Malus allows the Committee to reduce awards (if appropriate to zero) prior to payment taking place. RBS has operated malus for a number of years. The new clawback requirements, together with malus, provide greater scope for the Committee to recover remuneration where new information indicates we should change the pay decisions made in previous years and it is no longer appropriate to make payments at the level originally awarded.
Malus has been applied as part of our accountability review process in light of the fines imposed on RBS by regulators relating to misconduct in foreign exchange trading (FX) and the IT incident that occurred in 2012. The Committee fully appreciates the impact such events have on shareholders and customers. It is only right that this should be reflected in remuneration outcomes for those whose conduct fell short of our standards.
In addition to direct action against specific employees under the accountability review process, significant deductions to bonus pools have been made for material conduct events. This includes deductions for LIBOR, the IT incident and for the FX events. The Committee believes this process strikes an appropriate balance with a significant adjustment being made to bonus pools as a targeted measure to change behaviour, while not disproportionately penalising employees who are not responsible for these events.
It has taken much longer than anyone anticipated to turn the corner on past problems, practices and related fines but a significant amount of remedial action has already been undertaken. A clear message has been sent to employees that there is no place for any misconduct at RBS and wrongdoers will be dealt with. There is a determination to develop and maintain a culture that reflects our commitment to the customer and ethical market practices.
Directors’ Remuneration Report
Performance considerations for 2014
2014 has been a year of achievement against a difficult agenda. We are delivering on our plan to make RBS a smaller, safer bank. Citizens Financial Group, Inc. (CFG) was successfully launched on the New York stock exchange in the biggest bank flotation in US history. Once the remaining stake in the CFG business is sold this will further strengthen our capital position. RBS Capital Resolution (RCR) has managed to accelerate the planned removal of assets from our balance sheet contributing c. 110 basis points to the improvement in the CET1 ratio.
Our financial results show that, underneath the conduct issues, litigation and restructuring charges, there are strong customer franchises that are geared towards delivering sustainable returns for investors. The signs of improvement are there in customer feedback, our capital strength and reduced costs. All of these factors have been considered by the Committee in seeking to make objective decisions. Some key messages for 2014 are as follows:
| · | Operating profit is up significantly to £3.5 billion from a £7.5 billion loss in 2013 |
| · | Attributable loss to ordinary and B shareholders of £3.5 billion which includes the loss provision of £4 billion associated with the decision to divest CFG |
| · | Cost reduction of £1.1 billion, excluding the effect of currency movements, which has exceeded the target |
| · | Staff compensation has reduced year on year at both the total and per employee levels |
| · | CET1 ratio has improved over the year from 8.6% to 11.2% |
| · | RCR run off - assets have been reduced by £14 billion and RWA equivalents have reduced by £38 billion |
| · | RBS Total Shareholder Return (TSR) performance in 2014 has been ahead of other UK banks and the FTSE100 index |
| · | In 2014, we have seen some positive Net Promoter Score movements in some of our franchises and there are early signs that customer trust in RBS is stabilising and starting to improve |
Pay decisions for our wider workforce
The pressures on people working at RBS are considerable. We need to recognise good results by those employees who serve our customers well and deliver excellent individual performance. Having engaged employees and improving RBS as a place to work is critical if we are to achieve our long-term ambitions.
The Committee has an important role in helping to create a compelling employee proposition. During 2014, RBS became a fully accredited Living Wage employer. RBS has been an accredited Living Wage employer in London since 2010 and we are pleased to be extending that commitment to our operations and suppliers in the rest of the UK. Some other key decisions are set out below:
| · | The average annual salary increase amongst our core population of employees in 2015 will be 2%, up from 2014, whereas it will be less than 1% across the most senior RBS employees. |
| · | The bonus pool has fallen from a total of £576 million last year (£536 million excluding CFG) to £421 million excluding CFG in 2014, a reduction of 21% excluding CFG or a 27% overall reduction. Over 90% of this pool will be directed to those below the most senior RBS employees. The Corporate & Institutional Banking (CIB) bonus pool is 53% lower than 2013. |
| · | The bonus pool represents 6% of operating profit (excluding CFG and before variable compensation expense, conduct, litigation and restructuring charges and other one-off items). |
| · | Where employees do receive a bonus, the average amounts remain relatively modest with 51% of employees receiving £2,000 or less and a further 22% receiving less than £5,000. |
| · | Bonus awards above £2,000 are subject to deferral requirements and the Committee approved a 2014 deferral structure for higher earners and MRTs that exceeds current regulatory requirements. |
These decisions aim to strike a difficult balance where pay is restrained in a market context but remains at sufficient levels to reward those employees who are building the future franchise. The intention is to demonstrate that good performance and a continuous focus on the right behaviours will be rewarded, while reflecting the impact on all stakeholders of conduct events in the reduction of specific bonus pools.
Pay decisions for executive directors
| · | No changes to remuneration policy. |
| · | Salary, pension and benefit funding unchanged in 2015. |
| · | Performance measures for long-term incentive awards to be granted in 2015 follow the criteria that applied to awards made in 2014 but incorporating Trust in the Customers & People measure. |
| · | Reflecting a desire from shareholders for longer timescales, the overall vesting period for future long-term incentive awards has been extended from three to five years. |
Considerations for the year ahead
The report sets out how pay arrangements will be implemented in the year ahead including the performance targets that will apply to the long-term incentive awards granted in 2015. An overview of our remuneration policy below Board level can be found in the ‘Other Remuneration Disclosures’ section that follows this report.
The regulatory environment continues to evolve. Further guidance is expected during 2015 from the EBA on the use of allowances as well as the outcome of the PRA’s consultation on extending deferral periods. The Committee also intends to undertake a review of the broader aspects of employee remuneration at RBS during the course of the year.
I would like to conclude by thanking my fellow Committee members and those who support the Committee for their guidance and commitment over the year. I have no doubt we will be responding in 2015 to further developments in remuneration principles and practices. Shareholders continue to have a vital role in developing responsible pay practices and I look forward to working closely with all our stakeholders in the year ahead.
Sandy Crombie
Chairman of the Group Performance and Remuneration Committee
25 February 2015
Directors’ Remuneration Report
Executive director outcomes for 2014 and implementation in 2015
| Remuneration in 2014 (£000s) |
| | Ross McEwan | Ewen Stevenson (1) |
| Salary | 1,000 | 497 |
Benefits (2) | 143 | 16 |
| Pension allowance | 350 | 174 |
| Fixed share allowance | — | 497 |
| Bonus | — | — |
Long-term Incentive Plan vesting (3) | 358 | — |
Other award (4) | — | 1,911 |
| Total | 1,851 | 3,095 |
Notes: (1) Joined on 19 May 2014. (2) Amount for Ross McEwan includes standard benefit funding and relocation benefits. (3) Amount relates to a share award made to replace awards forfeited on leaving Commonwealth Bank of Australia, which was granted subject to RBS performance conditions. (4) Amount relates to a share award made to replace awards forfeited on leaving Credit Suisse. |
| |
| Implementation of policy for 2015 |
· Details of remuneration arrangements for 2015 are set out in the implementation of policy section on page 83. · Variable pay will consist of a long-term incentive award (LTI) with performance conditions that are designed to be stretching and support delivery of the business strategy. · LTI performance conditions will be assessed over three years with any vesting taking place in equal tranches in years four and five. · Malus and clawback provisions will apply for an overall period of seven years from the date of grant. |
Linking remuneration to the business strategy
Full details of the LTI performance conditions are set out on page 84.
Directors’ Remuneration Policy
| Directors’ Remuneration Policy |
The full Directors’ Remuneration Policy, as approved by shareholders at the AGM on 25 June 2014, is available at rbs.tm/complianceandrem and no changes are proposed that would require shareholder approval. An extract of the policy with certain updates to ensure it is relevant for the current year is set out below for ease of reference. In the event of any conflict, the approved policy on rbs.com takes precedence over the information set out in this section. |
Fixed pay elements for executive directors (EDs) Fixed pay elements are intended to provide a level of competitive remuneration for performing the role with less reliance on variable pay in order to discourage excessive risk-taking and with partial delivery in shares to align with long-term shareholder value. |
| Element of pay | Purpose and link to strategy | Operation | Maximum potential value | Performance metrics and period |
| Base salary | To aid recruitment and retention of high performing individuals whilst paying no more than is necessary. To provide a competitive level of fixed cash remuneration, reflecting the skills and experience required, and to discourage excessive risk-taking. | Paid monthly and reviewed annually. The rates for 2015 are as follows: Chief Executive - £1,000,000 Chief Financial Officer - £800,000 Further details on remuneration arrangements for the year ahead are set out in the annual report on remuneration. | Determined annually. Any future salary increases will be considered against peer companies and will not normally be greater than the average salary increase for RBS employees over the period of the policy. | n/a |
| Fixed share allowance | To provide fixed pay that reflects the skills and experience required for the role. This will be delivered in shares which must be retained for the long term. | A fixed allowance, paid entirely in shares. Individuals will receive shares that vest immediately subject to any deductions required for tax purposes and a retention period will apply. Shares will be released from the retention period in equal tranches over a five year period. The fixed share allowance will broadly be paid in arrears, currently in two instalments per year. For 2015, the instalments will be paid in August and December.(1) | An award of shares with an annual value of up to 100% of salary at the time of award. The fixed share allowance is not pensionable. | n/a |
| Benefits | To provide a range of flexible and market competitive benefits to further aid recruitment and retention of key individuals. | A set level of funding is provided and EDs can select from a range of benefits including: ·Company car ·Private medical insurance ·Life assurance ·Ill health income protection Also entitled to use of a car and driver on company business and standard benefits such as holiday and sick pay. Further benefits including allowances when relocating from overseas may be provided to secure the most suitable candidate for the role. | Set level of funding for benefits (currently £26,250) which is subject to review. Further benefits such as relocation allowances and other benefits (e.g. tax advice, housing and flight allowances and payment of legal fees) may be offered in line with market practice. The value of benefits paid will be disclosed each year in the annual report on remuneration. | n/a |
| Pension | To encourage planning for retirement and long-term savings. | Provision of a monthly cash pension allowance based on a percentage of salary. Opportunity to participate in a defined contribution pension scheme. | Pension allowance of 35% of salary. | n/a |
| (1) | The company believes that delivery in shares is the most appropriate construct for a fixed allowance to executive directors, qualifying as fixed remuneration for the requirements imposed under CRD IV. If regulatory requirements emerge that prohibit allowances being delivered in shares, or deem that such allowances will not qualify as fixed remuneration, then the company reserves the right to provide the value of the allowance in cash instead in order to comply with the requirements. |
Directors’ Remuneration Policy
Variable pay
Variable pay is intended to incentivise superior long-term performance and promote the success of RBS, with rewards aligned with shareholders and adjusted for risk, based on the achievement of stretching performance measures.
| Element of pay | Purpose and link to strategy | Operation | Maximum potential value | Performance metrics and period |
Variable pay award (long-term incentive) | To support a culture where good performance against a full range of measures will be rewarded. To incentivise the delivery of stretching targets in line with the Strategic Plan. The selection of performance metrics will be closely aligned with Key Performance Indicators. Performance is assessed against a range of financial and non-financial measures to encourage superior long-term value creation for shareholders. Delivery in shares with the ability to apply malus adjustments and clawback further supports longer-term alignment with shareholders. | Any variable pay award made will be delivered in the form of a long-term incentive, paid in shares (or in other instruments if required by regulators) and subject to a combination of time and performance-based vesting requirements. A minimum three year performance period will apply. The award will have an overall five year vest period, vesting in equal tranches in years four and five. As a minimum, shares will be subject to retention periods as required under the PRA and Financial Conduct Authority (FCA) Remuneration Code. Provisions for malus adjustment of unvested awards and clawback of vested awards. The long-term incentive award will be delivered under the RBS 2014 Employee Share Plan, as approved by shareholders at the 2014 AGM. | The maximum level of award is subject to any limit on the ratio of variable to fixed pay as required by regulators. This currently limits variable pay to the level of fixed pay (i.e. base salary, fixed share allowance, benefits and pension). A higher ratio, up to 200% of fixed pay, is possible with shareholder approval. RBS is not seeking any such approval at the 2015 AGM. For these purposes awards will be valued in line with the EBA rules, including any available discount for long-term deferral. In addition to the regulatory ratio which currently limits variable pay to the level of fixed pay, awards for executive directors are subject to a maximum of 300% of base salary (1). The vesting level of the award could vary between 0% and 100% dependent on the achievement of performance conditions. Between 20% - 25% will vest at threshold for each performance measure. | Any award made will be subject to performance conditions measured over a minimum three year period. Typical measures may fall under the following categories (weighted 25% each): · Economic Profit · Relative TSR · Safe and Secure Bank · Customers and People An underpin gives the Committee discretion to reduce vesting amounts in light of underlying financial results, or conduct and risk management effectiveness. These or similar measures and weightings will be applied to reflect the strategy going forward. Details of the performance measures for awards to be granted in 2015 are set out as part of the implementation of remuneration policy on page 84. |
| (1) | Adjustments will be made to award levels where necessary to ensure that executive directors remain within the variable to fixed limit. |
Other pay elements
| Element of pay | Purpose and link to strategy | Operation | Maximum potential value | Performance metrics and period |
| Shareholding requirements | To ensure EDs build and continue to hold a significant shareholding to align interests with shareholders. | A period of five years is allowed in which to build up shareholdings to meet the required levels. Any unvested share awards are excluded in the calculation. | Chief Executive – 250% of salary. Chief Financial Officer - 125% of salary. Requirements may be reviewed and increased in future. | n/a |
Directors’ Remuneration Policy
Notes to policy table
| · | The Committee sets stretching performance targets taking into account the company’s business strategy, financial forecasts and wider non-financial metrics. The performance conditions for variable pay awards made to EDs have been chosen to promote the building of a safer, stronger and more sustainable business. The Committee agrees the performance conditions each year after consultation with major shareholders. |
| · | The Committee recognises the importance of alignment with shareholders through the use of shareholding requirements, a longer vesting period for long-term incentive awards and retention periods post vesting. Upon leaving, any outstanding share awards held by ‘good leavers’ will vest, normally on the original vesting dates, and shares from the fixed share allowance will continue to be released over the applicable five year retention period in order to ensure former EDs maintain an appropriate interest in RBS shares. |
| · | Remuneration for EDs broadly follows the policy for all employees but with a significant element delivered in shares and an appropriate proportion delivered through variable performance-related pay. This is to ensure that total remuneration to EDs is more aligned with the long-term interests of shareholders and dependent on specific performance measures being met. |
An accountability review process is operated that allows the Committee to respond in instances where new information would change the variable pay decisions made in previous years and/or the decisions to be made in the current year. As a result, malus can be applied to reduce (if appropriate to zero) the amount of any variable pay awards prior to payment taking place. Clawback provisions can also be applied to require repayment of any amounts already paid. Malus and clawback can be applied to current and former employees.
RBS has applied malus provisions to variable pay awards since 2009 and added clawback provisions to awards made in 2014 for a period of six months from the date of any vesting. Any variable pay awards granted to EDs and other MRTs after 1 January 2015 will be subject to clawback provisions for a period of seven years from the date of grant, in line with new requirements under the PRA/FCA Remuneration Code.
There are a number of trigger events under which malus and clawback will be considered including:
| · | the individual participating in or being responsible for conduct which results in significant losses for RBS; |
| · | the individual failing to meet appropriate standards of fitness and propriety; |
| · | reasonable evidence of an individual’s misbehaviour or material error; and |
| · | RBS or the individual’s relevant business unit suffering a material failure of risk management. |
Further details can be found on page 93.
| Consideration of employment conditions elsewhere in the company |
The Committee retains oversight of remuneration policy for all employees to ensure there is a fair and consistent approach throughout the organisation. The broader policy uses deferral, malus and clawback to promote effective risk management and alignment with shareholders. Further details of our remuneration policy for all employees are set out on page 93.
Any salary increases for EDs will not normally be greater than the average increase for RBS employees. While employees are not directly consulted on setting directors’ remuneration, consultation on remuneration generally takes place with our social partners, including representatives from UNITE. In November 2014, RBS became a fully accredited Living Wage employer. RBS has been an accredited Living Wage employer in London since 2010 and this commitment has been extended to our operations and suppliers in the rest of the UK.
An annual employee opinion survey takes place which includes a number of questions on pay and culture. This includes questions on how pay is determined and evaluated, including the need to consider both ‘what’ and ‘how’ outcomes have been achieved, and whether employees believe they are paid fairly for the work they do.
Around 30,000 of our employees are shareholders through our incentive and all-employee share plans and have the ability to express their views through voting on the Directors’ Remuneration Report.
The Committee has certain discretions that allow it, in appropriate circumstances, to vary the remuneration provided to EDs and other employees. For example, under the rules of the RBS 2014 Employee Share Plan, the Committee can: determine that awards should vest even where this treatment would not apply as standard under the rules; decide to vest earlier than the normal vesting date; and vary the pro-rating for time elapsed that would normally apply. Such discretions would only be used in exceptional circumstances to ensure a fair outcome for the relevant individual and for shareholders, taking into account the circumstances of departure, the performance of the individual and the need to ensure an orderly transition.
Further discretions include the ability to: treat awards in a range of ways in the event of a change of control; change measures, targets, and adjust awards if major events occur (for example transaction and capital raisings); and make administrative changes to the plan rules.
In addition, the Committee retains discretion to apply malus and clawback to awards and also to adjust the vesting outcome in relation to certain long-term incentive awards through the application of an underpin.
Directors’ Remuneration Policy
| Remuneration policy for the Chairman and non-executive directors |
| Element of pay | Purpose and link to strategy | Operation | Maximum potential value | Performance metrics and period |
| Fees | To provide a competitive level of fixed remuneration that reflects the skills, experience and time commitment required for the role. No variable pay is provided so that the Chairman and non-executive directors can maintain appropriate independence, focus on long-term decision making and constructively challenge performance of the executive directors. | Fees are paid monthly. The level of remuneration reflects their responsibility and time commitment and the level of fees paid to directors of comparable major UK companies. The Chairman and non-executive directors do not participate in any incentive or performance plan. Fees are reviewed regularly. | The rates for the year ahead are set out in the annual report on remuneration on page 83. Any future increases to fees will be considered against directors at comparable companies and will not normally be greater than the average inflation rate over the period under review, taking into account that any change in responsibilities, role or time commitment may merit a larger increase. Additional fees may be paid for new Board Committees provided these are not greater than fees payable for the existing Board Committees as detailed in the annual report on remuneration. | n/a |
| Benefits | Any benefits offered would be in line with market practice. | Reimbursement of reasonable out-of-pocket expenses incurred in performance of duties. The Chairman also receives private medical cover in line with the scheme rules. | The value of the private medical cover provided to the Chairman will be in line with market rates and disclosed in the annual report on remuneration. | n/a |
| Recruitment remuneration policy |
| · | The approach to recruitment of directors is to consider both internal and external candidates and to pay no more than is required to attract the most suitable candidate for the role. |
| · | The policy on the recruitment of new directors aims to structure pay in line with the framework and quantum applicable to current directors, taking into account that some variation may be necessary to secure the preferred candidate. |
| · | Consideration will be given to the skills and experience held by the individual being recruited as well as the incumbent’s position. |
| · | No sign-on awards or payments will be offered over and above the normal buy-out policy to replace awards forfeited or payments foregone. The Committee will seek to minimise buy-outs wherever possible and will seek to ensure they are no more generous than, and on substantially similar terms to, the original awards or payments they are replacing. |
| · | The maximum level of variable pay which may be granted to new executive directors is the same as that applicable to existing executive directors, excluding any buy-out arrangements. The Chairman and non-executive directors do not receive variable pay. |
Recruitment of Ewen Stevenson during 2014 Ewen Stevenson was appointed to the Board as Chief Financial Officer on 19 May 2014. His annual remuneration arrangements on appointment were as follows: |
Salary Fixed share allowance Pension allowance Benefit funding | £800,000 £800,000 £280,000 £26,250 | |
| Total fixed remuneration | £1,906,250 | |
Maximum variable pay (long-term incentive award) is calculated in line with the ratio limiting variable to fixed remuneration, including the EBA discount for long-term deferral, with the first award due to be made in March 2015. Further details are set out in the implementation of policy section on page 83. An award over 584,506 shares was made on Ewen’s appointment to replace awards he forfeited on leaving Credit Suisse. The award is eligible to vest between March 2015 and March 2017 on terms that are no more generous than the terms of the awards they have replaced. |
Directors’ Remuneration Policy
| Service contracts and policy on payments for loss of office – directors |
| Provision | Policy | Details |
| Payments for loss of office | Payment in lieu of notice only | If either party wishes to terminate an executive director’s service contract they are required to give 12 months’ notice to the other party. The service contracts do not contain any pre-determined provisions for compensation on termination. The service contracts give RBS the discretion to make a payment in lieu of notice, which is based on salary only (with no payment in respect of any other benefits, pension or fixed share allowances) and is released in monthly instalments. During the period when instalments are being paid, the executive director must take all reasonable steps to find alternative work and any remaining instalments will be reduced as appropriate to offset income from any such work. |
Treatment of annual and long-term incentives on termination | Treatment in line with the relevant plan rules as approved by shareholders | Existing annual incentive awards under the Deferral Plan will not normally lapse on termination, unless termination is for Cause (as defined in the rules of the Deferral Plan). The awards will normally continue to vest on the original vesting dates, subject to provisions regarding malus, clawback, competitive activity and detrimental activity as appropriate. Existing long-term incentive awards normally lapse on leaving unless the termination is for one of a limited number of specified ‘good leaver’ reasons or the Committee exercises its discretion to prevent lapsing. The Committee may exercise this discretion where it believes this is an appropriate outcome in light of the contribution of the participant and shareholders’ interests. Where awards do not lapse on termination, any vesting will normally take place on the original vesting dates subject to the performance conditions being met and pro-rating to reflect the proportion of the period that has elapsed at the date of termination. Malus and clawback provisions may also apply in accordance with policy. |
| Fixed share allowances | Treatment in line with the plan rules as approved by shareholders | Any shares already received under fixed share allowances will not be forfeited on termination but must continue to be held for the original retention periods. The fixed share allowance will continue to accrue for the period up to cessation of employment. |
| Other provisions | Standard contractual terms in line with market practice | Contracts include standard clauses covering remuneration arrangements and discretionary incentive plans (as set out in the main policy table above), reimbursement of reasonable out-of-pocket expenses incurred in performance of duties, redundancy terms and sickness absence, the performance review process, the disciplinary procedure and terms for dismissal in the event of personal underperformance or breaches of RBS policies. |
| Other payments | Discretionary | The Committee retains the discretion to make payments (including but not limited to professional and outplacement fees) to mitigate against legal claims, subject to any payments being made pursuant to a settlement or release agreement. |
| Provisions for non-executive directors (NEDs) and the Chairman | | NEDs do not have service contracts or notice periods although they have letters of engagement reflecting their responsibilities and time commitments. No compensation would be paid to any NED in the event of termination of appointment. Arrangements for the Chairman Philip Hampton is entitled to receive a cash payment in lieu of notice of 12 months’ fees in the event that his appointment is terminated as a result of the majority shareholder seeking to effect the termination of his appointment, or if RBS terminates his appointment without good reason, or if his re-election is not approved by shareholders at a General Meeting resulting in the termination of his appointment. |
In accordance with the provisions of the UK Corporate Governance Code, all directors of the company stand for election or re-election annually by shareholders at the company’s Annual General Meetings. Neither of the current executive directors hold a non-executive director role at another company.
Annual report on remuneration
| Annual report on remuneration |
| Total remuneration paid to directors for 2014 |
The sections audited by the company's auditors, are as indicated.
Total remuneration for executive directors (audited)
| | Current directors | | Former director |
| | Ross McEwan (1) | | Ewen Stevenson (2) | | Nathan Bostock (3) |
| | 2014 £000s | 2013 £000s | | 2014 £000s | 2013 £000s | | 2014 £000s | 2013 £000s |
| Salary | 1,000 | 250 | | 497 | — | | 313 | 191 |
| Fixed share allowance | — | — | | 497 | — | | — | — |
Benefits (4) | 143 | 40 | | 16 | — | | 11 | 7 |
| Pension | 350 | 88 | | 174 | — | | 109 | 67 |
| Annual bonus | — | — | | — | — | | — | — |
Long-term Incentive Plan (LTIP) (5) | 358 | — | | — | | | — | — |
Other awards (6) | — | — | | 1,911 | — | | — | — |
| Total remuneration | 1,851 | 378 | | 3,095 | — | | 433 | 265 |
Notes:
| (1) | Ross McEwan’s remuneration for 2013 reflected his service from appointment to the Board on 1 October to 31 December 2013. |
| (2) | Ewen Stevenson was appointed to the Board on 19 May 2014 and the table reflects his remuneration for the period since appointment. |
| (3) | Nathan Bostock joined the Board on 1 October 2013 and stepped down from the Board on 28 May 2014. See page 85for details of termination arrangements. |
| (4) | Benefits figure includes standard benefit funding of £26,250 per annum with the remainder being relocation expenses provided to Ross McEwan. |
| (5) | The value for Ross McEwan relates to an award made on appointment to his previous role as CEO UK Retail to replace awards forfeited on leaving Commonwealth Bank of Australia. This element of the award was subject to RBS performance conditions which ended on 31 December 2014 and have been assessed as set out below. |
| (6) | The amount shown for Ewen Stevenson relates to an award made on appointment to replace the value of awards forfeited on leaving Credit Suisse. The award was delivered entirely in shares and subject to deferral, on terms that are no more generous than the terms of the awards replaced. |
LTIP vesting amount included in the total remuneration table above (audited)
Ross McEwan was granted an award on joining RBS in 2012 to replace part of the awards forfeited on leaving Commonwealth Bank of Australia. This element was subject to RBS performance conditions over a three year period. Given his change in role over the period, this has resulted in a weighting of 50% being based on the performance of the Retail franchise and 50% based on RBS-wide measures. As the award does not vest until August 2015, an indicative share price has been used to estimate the vesting value.
| Number of shares under award | Vesting outcome for RBS measures (1) | Vesting outcome for Retail measures (2) | Final vesting outcome (weighted 50:50) | Number of shares to vest in August 2015 | Average share price October – December 2014 | Value for total remuneration table above |
| 130,841 | 61.5% | 84.2% | 72.85% | 95,318 | £3.76 | £358,396 |
Notes:
| (1) | This element follows the performance conditions applicable to the overall RBS-wide measures for the 2012 LTIP awards and the assessment is detailed on page 85. |
| (2) | The performance measures applicable for UK Retail were based on: Financial targets (weighted 50%) covering risk weighted assets, nominal assets, loan:deposit ratio, notional return on equity, operating profit, cost:income ratio; Customer measures (weighted 10%); People measures (weighted 10%); and Risk measures (weighted 30%). All financial targets were deemed to have been met in full with the customer, people and risk measures ranked as partially met. The Committee also considered recommendations from the Board Risk Committee in determining the final outcome. |
| Share plan interests awarded under the LTIP during 2014 (audited) |
| | | | | | |
| | Grant date | Face value of award (£000) | Number of shares awarded | % that would vest at threshold and maximum | Performance requirements |
Ross McEwan (1) | 7 March 2014 | 3,000 | 915,193 | Vesting between 0% - 100% with 20% vesting at threshold for the TSR measure and 25% vesting at threshold for the Economic Profit measure. | Conditional share awards subject to stretching performance conditions covering Economic Profit, Relative Total Shareholder Return, Safe & Secure Bank and Customers & People. Performance measured over a three year period. See page 86 for further details. |
Ewen Stevenson (2) | 19 May 2014 | 1,911 | 584,506 | Award made on appointment to replace the value of awards forfeited on leaving Credit Suisse. The shares are deferred over a similar time period as the awards replaced and subject to employment, malus and clawback provisions. No threshold vesting applies. |
| (1) | The number of shares awarded is based on a multiple of salary and an award price of £3.278 calculated based on the average share price over five business days prior to the grant date. |
| (2) | The number of shares is based on the value of awards replaced and an award price of £3.270 calculated based on the average share price over five business days prior to the grant date. |
Annual report on remuneration
Chairman and non-executive directors’ remuneration for 2014 (audited)
Remuneration of non-executive directors, excluding the Chairman, was reviewed in 2014. In light of the increased activity of the Nominations Committee, and after consideration of comparable fees paid to directors of other major UK banks, it was agreed that fees for membership of the Nominations Committee should be increased from £5,500 to £10,000 per annum with effect from 1 April 2014. An additional Board Committee was also established to oversee RBS Capital Resolution and the implementation of its strategy. The fees paid during 2014 are set out below.
| | Board and Committee fees £000s | Benefits and other fees £000s | 2014 Total £000s | 2013 Total £000s |
Philip Hampton (1) | 750 | 1 | 751 | 751 |
| Sandy Crombie | 213 | — | 213 | 186 |
| Alison Davis | 141 | — | 141 | 132 |
Morten Friis (2) | 112 | — | 112 | — |
Robert Gillespie (3) | 149 | 35 | 184 | 7 |
| Penny Hughes | 178 | — | 178 | 154 |
| Brendan Nelson | 183 | — | 183 | 164 |
| Baroness Noakes | 186 | — | 186 | 136 |
| | | | | |
| Former non-executive directors | | | | |
Tony Di Iorio (4) | 34 | 11 | 45 | 136 |
Philip Scott (5) | 125 | — | 125 | 164 |
| (1) | Philip Hampton is entitled to private medical cover and the value is shown in the benefits column. |
| (2) | Morten Friis was appointed to the Board with effect from 10 April 2014. |
| (3) | Robert Gillespie is the RBS nominated director of Citizens Financial Group, Inc. (CFG) and is entitled to fees for the period from 1 August 2014 to 31 December 2014. As part of the compensation plan for directors agreed on the IPO of the business in September 2014, Mr Gillespie is also entitled to restricted stock units in CFG which will vest on the date of the CFG AGM in 2015. The value of the fees and restricted stock is shown in the Benefits and other fees column, converted using an average exchange rate during 2014 of $1.647:£1. |
| (4) | Tony Di lorio became a non-executive director of CFG on 15 January 2014 and the value of fees received for the period to 26 March 2014, the date he retired from the RBS Board, is shown in the Benefits and other fees column, converted using an average exchange rate during 2014 of $1.647:£1. |
| (5) | Philip Scott stepped down from the Board on 31 October 2014. |
| Implementation of remuneration policy in 2015 |
The information below sets out how RBS intends to implement the policy in 2015. No changes have been made to the underlying policy.
Executive directors
| | Salary | Benefits | Pension 35% of salary | Fixed Share Allowance 100% of salary (1) | Long-term incentive award (LTI) calculated in line with regulatory cap (2) |
| Chief Executive | £1,000,000 | £26,250 (3) | £350,000 | £1,000,000 | £1,559,810 |
| Chief Financial Officer | £800,000 | £26,250 | £280,000 | £800,000 | £2,160,000 |
| (1) | Fixed Share Allowance will be payable broadly in arrears and the shares will be released in equal tranches over a five year period. |
| (2) | The LTI that can be awarded in 2015 is limited to the level of fixed remuneration, on an annualised basis where appropriate. The value at grant incorporates the discount factor for long-term deferral calculated in line with European Banking Authority rules and results in a maximum LTI value of approximately 113% of fixed remuneration. |
| (3) | Also receives relocation benefits include housing and flight allowances, the value of which is disclosed each year in the total remuneration table. |
Chairman and non-executive directors’ fees
| Chairman | £750,000 |
| Non-executive Director Group Board | £72,500 |
| Senior Independent Director (SID) | £30,000 |
Membership of: Group Audit Committee (GAC), Board Risk Committee (BRC), Group Performance and Remuneration Committee (RemCo) and Sustainable Banking Committee (SBC) | £30,000 |
Additional fee for Chairman of the GAC, BRC, RemCo or SBC | £30,000 |
| Membership of the RCR Board Oversight Committee (RCR BOC) | £15,000 |
| Additional fee for Chairman of the RCR BOC | £15,000 |
| Membership of Group Nominations Committee (NomsCo) | £10,000 |
Morten Friis is the RBS Board nominated member of the Steering Group to oversee compliance remediation activities in respect of RBS’s US businesses for which he receives fees of £15,000 per annum.
Board Committee membership as at 31 December 2014
| Sandy Crombie | Alison Davis | Morten Friis | Robert Gillespie | Penny Hughes | Brendan Nelson | Baroness Noakes |
SID RemCo Chairman GAC RCR BOC NomsCo | RemCo SBC NomsCo | GAC BRC NomsCo | BRC RemCo SBC NomsCo | SBC Chairman BRC NomsCo | GAC Chairman BRC RCR BOC NomsCo | BRC Chairman RCR BOC Chairman GAC NomsCo |
Annual report on remuneration
LTI awards to be granted to executive directors in 2015 Performance criteria |
The performance measures are designed to be stretching and to support delivery of the business strategy. The measures are discussed each year with major shareholders. A three year performance period will apply which will end, in normal circumstances, on 31 December 2017. Subject to the achievement of the performance conditions, shares will then vest in equal tranches in years four and five.
In line with previous practice, awards granted to executive directors in March 2015 will be subject to four equally weighted performance categories. For Ewen Stevenson’s award, each performance category can vest up to 100% of base salary, subject to the maximum award under the approved policy. Ross McEwan’s award will be structured in a similar manner but at a lower level in line with the regulatory cap limiting the amount of variable remuneration. Details of the performance measures and the Committee’s rationale for selecting them are set out below.
Reason: Economic Profit, being a risk-adjusted financial measure, is consistent with the PRA/FCA Remuneration Code and also provides a balance between measuring growth and the cost of capital employed in delivering that growth.
Measure: Economic Profit is defined as Operating Profit after Tax and preference share charges less Tangible Net Asset Value multiplied by the Cost of Equity. The measure will be based on the ‘go-forward’ business.
Performance target and weightings
| Weighting | Performance target | Vesting range |
| 25% | The economic profit target will be consistent with the achievement of RBS’s strategic long term return on equity target of 12%+. | 25 - 100% |
Details of the actual targets, and performance against these, will be disclosed retrospectively once the awards vest.
| Relative Total Shareholder Return (25%) |
Reason: Relative TSR provides a direct connection between executive directors’ awards and relative returns delivered to shareholders.
Measure: The measure compares performance against a group of comparator banks. The group and respective weightings were changed in 2014 to be more in line with the new strategy and the same comparator group will apply to awards made in 2015.
Relative TSR Comparator Group | Weighting |
| 1 | Barclays | 200% |
| 2 | Lloyds Banking Group |
| 3 | HSBC | 100% |
| 4 | Standard Chartered |
| 5 to 13 | BBVA, BNP Paribas, Credit Agricole, Credit Suisse Group, Deutsche Bank, Santander, Societe Generale, UBS, Unicredito | 50% |
Performance target and weightings
| Weighting | Performance target | Vesting range |
| 25% | TSR between median and upper quartile | 20 - 100% |
Reason: The Safe & Secure Bank measures have a particular focus on risk reduction and the building of a safer, sustainable franchise.
Measure: The key measures in this category are the achievement of pre-determined Common Equity Tier 1 (CET1) and Cost:income (C:I) ratios.
Reason: These measures reward management for building a customer-focussed franchise with strength in terms of reputation and the engagement of employees. In February 2014, RBS committed to targeting both trust and advocacy which is reflected in this category.
Measure: Net Promoter Scores (NPS) and Net Trust Scores (NTS) will be used, measured against a defined peer group. Employee engagement will be measured against the Global Financial Services (GFS) norm.
Performance target and weightings
| Category | Metrics | Performance target |
| Safe & Secure Bank | CET1 ratio (12.5%) | target consistent with the achievement of RBS’s target to operate at 13% for the period of international network restructuring |
C:I ratio (12.5%) | target consistent with the achievement of RBS’s strategic long term C:I target of <50% |
| Customers & People | Advocacy (6.25%) | NPS gap to #1 of 6.0 (1) |
Trust (6.25%) | NTS: NatWest 55, RBS 42 |
Engagement (12.5%) | Employee Engagement Index within 2% of GFS norm |
| (1) | The NPS metric adopted is a bank-wide measure of the gap to #1 bank, which RBS plans to close to zero by 2020. It is calculated using the gap to #1 leading competitor in each customer segment, weighted by the revenue contribution of each segment. |
The overall vesting under the above categories will be qualified by the Committee’s discretion taking into account changes in circumstances over the performance period, the margin by which individual targets have been missed or exceeded, and any other relevant factors. Details of performance against targets will be disclosed once the awards vest.
| Risk underpin and clawback |
The Committee will also review financial and operational performance against the business strategy and the risk environment prior to agreeing vesting of awards. In assessing this, the Committee will be advised independently by the BRC. If the Committee considers that the vesting outcome calibrated in line with the performance conditions outlined above does not reflect underlying financial results or if the Committee is not satisfied that conduct and risk management during the performance period has been effective, then the terms of the awards allow for an underpin to be used to reduce vesting or lapse the award.
All awards are subject to malus provisions which allow for awards to be reduced, if appropriate to zero, prior to vesting. In addition, awards granted in 2015 will be subject to clawback provisions for a period of seven years from the grant date, in line with the requirements of the PRA/FCA Remuneration Code. Any awards that vest will be subject to a minimum six month retention period.
Annual report on remuneration
| Payments for loss of office (audited) |
Nathan Bostock ceased to be Group Finance Director on 19 May 2014 and stepped down from the Board on 28 May 2014. He continued to receive payment of salary, pension and benefit funding until his employment ended on 18 August 2014 (a total of £234,952 for the period from 28 May to 18 August 2014). No payment was made for loss of office and all outstanding share awards were lapsed. There have been no payments made to departing non-executive directors for loss of office.
| Payments to past directors (audited) |
Stephen Hester and Bruce Van Saun received shares on 7 March 2014 following the assessment of performance conditions for the LTIP award granted in 2011. The award for Stephen Hester was reduced to reflect time served during the period. The underlying award structure consisted of four performance categories each of which could give rise to shares worth 100% of salary at grant but with the overall maximum capped at 375% of salary. The performance assessment is set out below. The current executive directors did not participate in this award.
Executive directors’ LTIP awards granted in 2011 – final assessment of performance outcome (audited)
| Performance Measure | Weighting | Threshold performance | Vesting at threshold | Performance for maximum vesting | Vesting at maximum | Actual performance | Vesting % of maximum |
| Economic Profit | 25% | Meet minimum economic profit targets | 25% | Performance ahead of the Strategic Plan | 100% | The minimum target was not met | 0% |
| Relative TSR | 25% | TSR at median | 20% | TSR at upper quartile | 100% | TSR was below median | 0% |
| Balance Sheet & Risk | 25% | Half objectives met | 25% | Objectives met or exceeded in all material respects | 100% | 9/10 targets met or exceeded (1) | 100% |
| Strategic Scorecard | 25% | 25% | 100% | targets not met (2) | 0% |
| Overall vesting outcome | 25% |
| (1) | Targets relating to non-core assets, cumulative non-core loss, Core Tier 1 capital, wholesale funding, liquidity, leverage ratio, loan to deposit ratio, risk appetite and funded assets were met or exceeded. While the credit rating condition was not met, given the over-achievement on other measures, the Committee determined that the Balance Sheet & Risk element should vest in full. |
| (2) | The cost:income ratio target was not achieved within the Strategic Scorecard and taking into account the extent of the shortfall, the Committee determined that this element should not vest. |
Value of payments on vesting (audited)
| | | Number of shares and value per category |
| | | Stephen Hester | Bruce Van Saun |
| Performance category | % vesting | Maximum shares (2) | Vested shares | Value (3) | Maximum shares (2) | Vested shares | Value (3) |
| Economic Profit | 0% | 257,912 | — | — | 170,677 | — | — |
| Relative TSR | 0% | 257,912 | — | — | 170,677 | — | — |
| Balance Sheet & Risk | 100% | 257,912 | 257,912 | £858,847 | 170,677 | 170,677 | £568,354 |
| Strategic Scorecard | 0% | 257,912 | — | — | 170,677 | — | — |
Overall shares vesting (1) | 25% | | 257,912 | £858,847 | | 170,677 | £568,354 |
| Check within maximum shares available to vest | 955,228 | | | 632,136 | |
| (1) | The Committee also considered recommendations from the Board Risk Committee in determining the outcome above. |
| (2) | The maximum number of shares is calculated in line with the underlying award structure where each of the four performance categories could give rise to shares worth 100% of salary at grant but with the overall maximum capped at 375% of salary. |
| (3) | Based on share price of £3.33 on date of vesting. |
| Total Pension Entitlements – Bruce Van Saun (audited) |
Bruce Van Saun's Unfunded Unapproved Retirement Benefit Scheme operates as a cash balance plan. The rate of return on the accrued fund is determined annually to reflect a long-term low risk investment return on an unsecured basis. For 2014 this rate was 4%. His accrued entitlement at the year end is shown below. There is no provision for any additional benefit on early retirement.
| | 2014 £000s | 2013 £000s |
| Balance at 1 January 2014 | 1,030 | 682 |
| Aggregate contributions that would have been made if funded | — | 306 |
| Investment return | 41 | 42 |
| Total value of fund at 31 December 2014 | 1,071 | 1,030 |
Annual report on remuneration
| Performance conditions for LTIP awards granted in 2012, 2013 and 2014 |
| Awards are due to vest in 2015 to 2017. An assessment of performance of each relevant element is provided by the control functions and PwC assesses relative TSR performance. The Committee determines overall vesting based on these assessments including consideration of the drivers of performance and the context against which it was delivered. Each of the four performance categories could give rise to shares worth 100% of salary at grant, but with the overall maximum capped at 300% of salary. The assessment is analytical and if any discretion is used in the final assessment, it will be explained. |
2012 LTIP – final assessment of RBS-wide performance measures (audited)
| Performance Measure | Weighting | Threshold performance | Vesting at threshold | Performance for maximum vesting | Vesting at maximum | Actual Performance | Vesting % of maximum |
| Economic Profit | 25% | (£3.5 billion) | 25% | £1 billion | 100% | (£1.8 billion) | 53% |
| Relative TSR | 25% | TSR at median | 20% | TSR at upper quartile | 100% | 65th percentile ranking | 68% |
| Balance Sheet & Risk | 25% | Half objectives met | 25% | Objectives met or exceeded in all material respects | 100% | 8/8 targets met (1) | 100% |
| Strategic Scorecard | 25% | 25% | 100% | 4/7 targets met (2) | 25% |
Overall vesting outcome (3) | 61.5% |
| (1) | Targets relating to non-core assets (<=£40 billion), cumulative non-core loss (<=£6.8 billion), Core Tier 1 capital (>10%), leverage ratio (<18x), wholesale funding (<10%), liquidity reserves (>1.5x short-term wholesale funding), loan to deposit ratio (<=100%) and earnings volatility (<100%) were uniformly met or exceeded resulting in 100% vesting for this element of the award. |
| (2) | Targets relating to customer franchise, cost:income ratio, lending targets, sustainability performance, employee engagement, leadership index and succession. The cost:income ratio and employee engagement index were both behind target and overall it was determined that half of the Strategic Scorecard measures had been met satisfactorily resulting in a 25% vesting outcome. |
| (3) | The Committee also considered recommendations from the Board Risk Committee in determining the outcome above. |
2013 and 2014 LTIP – current assessment
The table below shows performance assessment in respect of the 2013 and 2014 LTIP awards which are due to vest in March 2016 and March 2017 respectively. The table below represents an early indication of potential vesting outcomes only based on the position at 31 December 2014.
| Performance measure | Weighting | Vesting | 2013 Current Assessment | 2014 Current Assessment |
| Economic Profit | 25% | Threshold: 25% vesting for meeting minimum economic profit targets Maximum: 100% vesting for performance ahead of the Strategic Plan. | Performance consistent with some level of vesting based on current assessment. | A strong start has been made in 2014. The Committee notes that strategic decisions have been taken in 2014 and will monitor the impact of these in the remaining performance period. |
| Relative TSR | 25% | Threshold: 20% vesting if TSR is at median of the comparator group. Maximum: 100% vesting if TSR is at upper quartile of the comparator group. Pro-rata vesting in between. | Latest assessment shows percentile ranking of 53.7% which would result in 32% vesting for this element. | Latest assessment shows percentile ranking of 100% which would result in 100% vesting for this element. |
Balance Sheet & Risk (for 2013 award) Safe & Secure Bank (for 2014 award) | 25% | For 2013, vesting will be qualified by Committee discretion. Indicative vesting levels are: · Over half of objectives not met: 0%; · Half of objectives met: 25%; · Two-thirds of objectives met: 62.5%; and · Objectives met or exceeded in all material respects: 100%. For 2014 awards, target ranges have been set for each measure and vesting will be qualified by Committee discretion taking into account the margin by which targets have been missed or exceeded. | All measures currently expected to be on track or ahead of targets by end of 2015. | A strong start has been made in 2014. The Committee notes that strategic decisions have been taken in 2014 and will monitor the impact of these in the remaining performance period. |
Strategic Scorecard (for 2013 award) Customers & People (for 2014 award) | 25% | The cost:income ratio target remains challenging and is unlikely to be met. Engagement Index is behind target. Customer and leadership metrics would result in some level of vesting on current assessment. | Engagement Index currently behind target. Improvement in Net Promoter Score over 2014 would lead to some level of vesting if continued. |
Annual report on remuneration
| Directors’ interests in shares and shareholding requirements (audited) |
| The target shareholding level for the Chief Executive is 250% of salary and 125% of salary for other executive directors and members of the Executive Committee, in each case excluding any unvested share awards in the calculation. A period of five years is allowed in which to build up shareholdings to meet the required levels. Shareholding requirements will be considered when relevant individuals request permission to sell shares, recognising the timeframe allowed to reach the target level. The Group Performance and Remuneration Committee receive regular updates on progress towards meeting these requirements. |
| | As at 31 December 2014 (or date of cessation if earlier) |
| | Shares beneficially owned | % of issued share capital | Value (1) (£) | % of shareholding requirement met | Unvested LTIP awards | Unvested Deferral Plan awards |
| Ross McEwan | 754,987 | 0.01186 | 2,974,649 | 119% | 1,742,186 | 37,596 |
| Ewen Stevenson | 70,978 | 0.00111 | 279,653 | 28% | Buyout [584,506] | 0 |
Nathan Bostock (2) | 375,969 | 0.00591 | 1,289,574 | 135% | 0 | 0 |
| Philip Hampton | 27,630 | 0.00043 | | | | |
| Sandy Crombie | 20,000 | 0.00031 | | | | |
| Alison Davis | 20,000 | 0.00031 | | | | |
Morten Friis (3) | 20,000 | 0.00031 | | | | |
| Robert Gillespie | 25,000 | 0.00039 | | | | |
| Penny Hughes | 562 | 0.00001 | | | | |
| Brendan Nelson | 12,001 | 0.00019 | | | | |
| Baroness Noakes | 21,000 | 0.00033 | | | | |
Tony Di Iorio (4) | 30,000 | 0.00047 | | | | |
Philip Scott (5) | 50,000 | 0.00079 | | | | |
| (1) | Value is based on the share price on 31 December 2014, which was £3.94; for Nathan Bostock the value is based on the share price of £3.43 on 28 May 2014, the date he stepped down from the Board. During the year ended 31 December 2014, the share price ranged from £2.96 to £4.04. |
| (2) | Stepped down from the Board on 28 May 2014. |
| (3) | Interest is 10,000 American Depository Receipts representing 20,000 ordinary shares. |
| (4) | Interest is 15,000 American Depository Receipts representing 30,000 ordinary shares. Stepped down from the Board on 26 March 2014. |
| (5) | Stepped down from the Board on 31 October 2014. |
No other director had an interest in the company's ordinary shares during the year or held a non-beneficial interest in the shares of the company at 31 December 2014, at 1 January 2014 or date of appointment if later. The interests shown above include connected persons of the directors. As at 25 February 2015, there were no changes to the directors' interests in shares shown in the table above.
Members of the Executive Committee are also subject to shareholding requirements with a target shareholding level of 125% of salary. In line with the requirements of the PRA/FCA Remuneration Code and the RBS Staff Dealing Rules, employees must not engage in any personal hedging strategies to lessen the impact of a reduction in value of unvested share awards, for example if the RBS share price goes down.
| Directors’ interests under the Group’s share plans (audited) |
Long-Term Incentive Plan (LTIP) awards
| | Awards held at 1 January 2014 (or date of appointment if later) | | Awards granted in 2014 | Award price £ | Awards vested in 2014 | Market price on vesting £ | Value on vesting £ | Awards held at 31 December 2014 | End of period for qualifying conditions to be fulfilled |
| Ross McEwan | 562,929 | (1) | | 2.14 | 432,088 | 3.40 | 1,469,099 | 130,841 | | 07.08.15 |
| | 696,152 | | | 3.09 | | | | 696,152 | 08.03.16 |
| | | | 915,193 | 3.28 | | | | 915,193 | 07.03.17 |
| | 1,259,081 | | 915,193 | | 432,088 | | | 1,742,186 | |
Ewen Stevenson (2) | 584,506 | | | 3.27 | | | | 584,506 | 09.03.15 – 07.03.17 |
Deferred awards
| | Awards held at 1 January 2014 | Awards granted in 2014 | Award price £ | Awards vested in 2014 | Market price on vesting £ | Value on Vesting £ | Awards held at 31 December 2014 | End of period for qualifying conditions to be fulfilled |
| Ross McEwan | 56,395 | | 3.09 | 18,799 | 3.33 | 62,601 | 37,596 | 08.03.15 – 08.03.16 |
| (1) | Relates to an award made to Ross McEwan on joining RBS as CEO UK Retail in September 2012 to replace awards forfeited on leaving Commonwealth Bank of Australia. |
| (2) | Ewen Stevenson was appointed to the Board on 19 May 2014. Award granted on appointment to replace awards forfeited on leaving Credit Suisse. |
Annual report on remuneration
Nathan Bostock stepped down from the Board on 28 May 2014. Outstanding share awards under the LTIP (2,151,234 shares), Deferred awards (289,536 shares), the Executive Share Option Plan (option over 207,467 shares at £4.62) and the Medium-term Performance Plan (117,809 scheme interests) all lapsed as a result of his departure.
| Total Shareholder Return (TSR) performance |
The graph below shows the performance of RBS over the past six years in terms of TSR compared with that of the companies comprising the FTSE 100 Index. This index has been selected because it represents a cross-section of leading UK companies. The TSR for FTSE UK banks for the same period has been added for comparison. The TSR for the company and the indices have been rebased to 100 at 1 January 2009. Source: Datastream
| Historical Chief Executive pay over same period |
| | | | | | | |
| | 2009 | 2010 | 2011 | 2012 | 2013 (1) | 2014 |
| Total remuneration (£000s) | 1,647 | 3,687 | 1,646 | 1,646 | 1,235 (SH) 378 (RM) | — 1,851 |
| Annual bonus against maximum opportunity | 0% | 85% | 0% | 0% | 0% | n/a |
LTIP vesting rates against maximum opportunity (2) | 0% | 0% | 0% | 0% | 0% | 72.85% |
| (1) | 2013 remuneration includes Stephen Hester (SH) as CEO for the period to 30 September and Ross McEwan (RM) for the period from 1 October to 31 December 2013. |
| (2) | The LTIP vesting for Ross McEwan relates to an award made on appointment to his previous role as CEO UK Retail to replace awards forfeited on leaving Commonwealth Bank of Australia. |
| Change in Chief Executive pay compared to employees |
The table below shows the percentage change in remuneration for the Chief Executive between 2014 and 2013 compared with the percentage change in the average remuneration of RBS employees based in the UK. In each case, remuneration is based on salary, benefits and annual bonus.
| | Salary | Benefits | Annual Bonus |
| | 2014 to 2013 change | 2014 to 2013 change | 2014 to 2013 change |
Chief Executive (1) | 0% | 0% | n/a |
UK employees (2) | 3% | 3% | (4%) |
| (1) | Executive directors are not eligible for an annual bonus. Standard benefit funding for executive directors remained unchanged between 2013 and 2014. The benefits for the Chief Executive excludes the relocation expenses provided to Ross McEwan as part of his recruitment as CEO UK Retail in 2012. The value of relocation benefits is disclosed each year in the total remuneration table. |
| (2) | Data represents full year salary costs of the UK based employee population, which covers the majority of RBS employees and is considered to be the most representative comparator group. |
| Relative importance of spend on pay |
The table below shows a comparison of remuneration expenditure against other disbursements.
| | 2014 (1) £m | 2013 (1) £m | change |
Remuneration paid to all employees (2) | 5,225 | 5,554 | (6%) |
| Distributions to holders of ordinary shares | — | — | — |
Distributions to holders of preference shares (3) | 699 | 398 | 76% |
| Taxation and other charges recognised in the income statement: | | | |
| - Social security and other payments | 379 | 422 | (10%) |
| - Bank levy | 250 | 200 | 25% |
| - Corporation tax | 1,909 | 186 | £1,723m |
| Other payments made by RBS | | | |
- Irrecoverable VAT and other indirect taxes incurred by RBS (4) | 665 | 703 | (5%) |
| (1) | Numbers exclude discontinued operations, principally CFG. |
| (2) | Remuneration paid to all employees represents total staff expenses per Note 3 to the Financial Statements, exclusive of social security and other staff costs. |
| (3) | Includes initial payment relating to the initial dividend on the Dividend Access Share in 2014. |
| (4) | Input VAT and other indirect taxes not recoverable by RBS due to it being partially exempt. |
Annual report on remuneration
The items above have been included as they reflect the key stakeholders for RBS and the major categories of disbursements made by RBS to its key stakeholders, including its ordinary and preference shareholders and Governments in RBS’s operational territories. The amounts included above have been calculated in accordance with applicable accounting standards and reflect the amounts included in RBS’s Income statement.
Annual report on remuneration
| Consideration of matters relating to directors’ remuneration |
Membership of the Group Performance and Remuneration Committee
All members of the Committee are independent non-executive directors. The Committee held nine scheduled meetings in 2014 and a further seven ad hoc meetings.
| | Attended/ scheduled |
Penny Hughes (1) | 5/5 |
Sandy Crombie (2) | 9/9 |
| Alison Davis | 9/9 |
Robert Gillespie (3) | 6/6 |
| (1) | Chair until 25 June 2014 |
| (2) | Chairman from 25 June 2014 |
| (3) | Robert Gillespie was appointed to the Committee on 1 April 2014. |
The role and responsibilities of the Committee
The Committee is responsible for approving the remuneration policy for all employees and overseeing its implementation. It reviews performance and makes recommendations to the Board in respect of the remuneration arrangements of the executive directors. The Committee is also responsible for approving remuneration arrangements for members and formal attendees of the Executive Committee and employees with total annual compensation which exceeds £1 million. It is also responsible for setting the remuneration framework and principles for MRTs falling within the scope of the PRA/FCA Remuneration Code. A definition of employees deemed to be MRTs along with details of how risk is taken into account in the remuneration process is provided on page 94.
In mitigating potential conflicts of interest, directors are not involved in decisions regarding their own remuneration and remuneration advisers are appointed by the Committee rather than management. The terms of reference of the Committee are available on www.rbs.com and these are reviewed at least annually and approved by the Board.
| Summary of the principal activity of the Committee during 2014 |
The Committee considered issues under the accountability review process at every meeting and CRD IV implementation at the majority of meetings. Consideration was also given to various remuneration issues for CFG in the run up to its IPO. Set out below is a summary of other key activities considered by the Committee.
First quarter
| · | 2013 performance reviews and remuneration arrangements for members of the Executive Committee, Code Staff and high earners. |
| · | Approval of variable pay pools and Directors’ Remuneration Report. |
| · | Outcomes of the annual performance evaluation of the Committee. |
| · | Assessment of the performance to date of unvested LTIP awards and performance targets for 2014 awards. |
| · | Appointment and departure terms for various senior positions. |
| · | Presentation from Compliance and Risk on business and strategic priorities and people plans. |
Second quarter
| · | Executive Committee members 2014 objectives. |
| · | Proposals for specific areas including CIB and RCR. |
| · | Compensation funding model including 2014 risk adjustment process. |
| · | Response to FCA letter in relation to Malus Performance Adjustment. |
| · | Group Sales and Service Incentives Committee 2013 annual incentive report and FCA Incentives Thematic Review Report. |
Third quarter
| · | Review of the implementation of the remuneration policy. |
| · | Executive Committee members and attendees half year performance reviews and objectives update. |
| · | Organisation design and executive grading framework update. |
| · | External environment including PRA consultation on further changes to the Remuneration Code. |
| · | The Committee undertook a ‘Masterclass’ in July 2014 where in-depth consideration was given to pay construct and people proposition; the role & scope of the Committee; and stakeholder engagement. |
Fourth quarter
| · | 2014 preliminary pay elements including bonus pool, deferral, LTIP and clawback policy. |
| · | Remuneration Policy Statement for the PRA. |
| · | Update on external environment and regulatory developments. |
| · | RCR remuneration proposals. |
| · | Consideration of governance issues including delegated authorities and the Accountability Review framework. |
| Performance evaluation process |
A thorough internal review of the effectiveness of the Committee was conducted during 2014 involving questionnaires and follow-up interviews. The Committee considered the outcomes of the evaluation and is satisfied with the way in which the evaluation has been conducted.
The review concluded that the Committee continued to operate effectively and the Masterclass was viewed as a positive development in building the future agenda. Themes emerging from the evaluation included using the time of the Committee more effectively and the need to focus on higher level strategic performance and remuneration priorities. The importance of concise papers highlighting key issues was also raised and a roll out of board paper training is already underway in Q1 2015 to address some of these concerns. Other priorities that were identified for 2015 included: alignment of remuneration strategy to the business strategy; creating a compelling employee proposition; and considering performance trajectory and the pay construct for the future business.
Annual report on remuneration
| Advisers to the Group Performance and Remuneration Committee |
The Committee reviews its selection of advisers annually. PricewaterhouseCoopers LLP (PwC) were appointed as the Committee’s remuneration advisers on 14 September 2010 following a review of potential advisers, and their appointment was reconfirmed by the Committee in July 2014 after an annual review of the quality of the advice received and fees charged. PwC are signatories to the voluntary code of conduct in relation to remuneration consulting in the UK.
PwC also provide professional services in the ordinary course of business including assurance, advisory, tax and legal advice to RBS subsidiaries. The Chairman of the Committee is notified of other remuneration work that is being undertaken by PwC. In addition, there are processes in place to ensure the advice received by the Committee is independent of any support provided to management. As well as receiving advice from PwC in 2014, the Committee took account at meetings of the views of the Chairman, Chief Executive, Chief Financial Officer, Chief HR Officer, the Director, Organisation & Performance, the Chief Governance Officer and Board Counsel, the Chief Risk Officer and the Chief Conduct and Regulatory Affairs Officer. The fees paid to PwC for advising the Committee in relation to directors’ remuneration are charged on a time/cost basis and in 2014 amounted to £137,749 excluding VAT (2013 - £190,465).
| Statement of Shareholding Voting |
The table below sets out the voting by shareholders on the resolutions to approve the Directors’ Remuneration Policy and the 2013 Remuneration Report at the AGM held in June 2014.
1. Directors’ Remuneration Policy
| For | Against | Total votes cast | Withheld |
20,893,215,888 (99.66%) | 70,382,756 (0.34%) | 20,963,598,644 | 170,307,216 |
2. Annual Report on Remuneration for 2013
| For | Against | Total votes cast | Withheld |
21,034,273,904 (99.81%) | 40,636,912 (0.19%) | 21,074,910,816 | 58,993,972 |
| Shareholders views and their impact on remuneration policy |
An extensive consultation is undertaken every year with major shareholders including UKFI and other stakeholders on our remuneration approach. The consultation process, led by the Chairman of the Committee, typically involves inviting our largest shareholders to attend either one-to-one meetings or roundtable sessions with relevant shareholder bodies. The process takes place in sufficient time for shareholder views to be considered prior to the Committee making any final decisions on remuneration and variable pay awards.
In late 2014 and early 2015, meetings took place with a number of institutional shareholders and shareholder bodies representing a substantial portion of the non-UKFI shareholding. The topics discussed during the latest consultation included strategic direction and financial performance, determination of pay outcomes for the 2014 performance year, and developments that may impact pay arrangements going forward.
Shareholders asked a number of questions including how conduct issues and the FX fines would be reflected in the bonus pool. The evolving regulatory environment and EBA guidance on role-based allowances were also discussed. Some shareholders were interested to know whether operating within the 1:1 ratio of variable to fixed remuneration was causing any particular concerns for RBS. The potential impact on recruitment and the importance of employee engagement were also discussed. Another theme was explaining progress on performance measures and it was noted that additional detail on LTIP performance targets would be helpful.
The Chairman of the Committee responded to the questions by explaining how adjustments for risk and conduct events were incorporated into the bonus pool and also confirmed that operating within the 1:1 cap had proved to be manageable to date. Overall, recruitment into specialist roles had not been as difficult as had been anticipated although certain ‘hotspots’ remained. The future pay construct was also discussed and the Chairman acknowledged the need for a fair sharing ratio between rewards to employees and returns to shareholders over the long-term.
The reaction to the consultation process was positive and allowed the Committee to gain valuable insight into areas that shareholders were likely to support and those areas of concern. Shareholders continue to play a vital role in developing remuneration practices that support the long-term interests of the business and the Committee is grateful and greatly encouraged by their involvement in the process.
During the ten year period to 31 December 2014, awards made that could require new issue shares under the company's share plans represented 4.7% of the company's issued ordinary share capital (including the B share capital), leaving an available dilution headroom of 5.3%. The company meets its employee share plan obligations through a combination of new issue shares and market purchase shares.
Sandy Crombie
Chairman of the Group Performance and Remuneration Committee
25 February 2015
Other Remuneration Disclosures
Remuneration of eight highest paid senior executives below Board (1) |
| (£000s) | Executive 1 | Executive 2 | Executive 3 | Executive 4 | Executive 5 | Executive 6 | Executive 7 | Executive 8 |
| Fixed pay (cash) | 800 | 594 | 550 | 600 | 575 | 492 | 536 | 575 |
| Fixed share allowance | 800 | 600 | 550 | 600 | 600 | 500 | 288 | 300 |
| Annual bonus | — | — | — | — | — | — | — | — |
| Long term incentive awards (vested value) | 449 | 211 | 193 | — | — | 144 | 196 | — |
Total remuneration (2) | 2,049 | 1,405 | 1,293 | 1,200 | 1,175 | 1,136 | 1,020 | 875 |
| (1) | Remuneration earned in 2014 at RBS for eight members of the Executive Committee. Reported remuneration was lower in 2013 due to: |
i) pro-rated earnings and no long term incentive award vesting for new hires; and
ii) split year earnings of newly promoted Executive Committee members.
| (2) | Disclosure includes prior year long term incentive awards which vested during 2014. The amounts shown reflect the value of vested awards using the share price on the day the awards vested. |
Other Remuneration Disclosures
| Our remuneration policy for all employees |
The remuneration policy supports the business strategy and is designed to promote the long-term success of RBS. It aims to reward employees for delivering good performance against targets provided this is achieved in a manner consistent with our values and within acceptable risk parameters. The remuneration policy applies the same principles to all employees including Material Risk Takers (MRTs) subject to the PRA/FCA Remuneration Code (1). The current key elements underpinning the remuneration policy are set out below.
| Element of pay | Objective | Operation |
| Base salary | To aid recruitment and retention of high performing individuals whilst paying no more than is necessary. To provide a competitive level of fixed cash remuneration, reflecting the skills and experience required, and to discourage excessive risk taking. | Base salaries are reviewed annually and should reflect the talents, skills and competencies that the individual brings to the business. |
| Role-based allowance | To provide fixed pay that reflects the skills and experience required for the role. | Allowances are provided to certain employees in key roles in line with market practice, structured to qualify as fixed remuneration for regulatory requirements. They are delivered in cash and/or shares depending on the level of the allowance and the seniority of the recipient. Shares are subject to an appropriate retention period, not less than six months. |
Benefits (including pension) | To provide a range of flexible and market competitive benefits. To encourage planning for retirement and long-term savings. | In most jurisdictions, employee benefits or a cash equivalent are provided from a flexible benefits account. |
| Annual bonus | To support a culture where employees recognise the importance of serving customers well and are rewarded for superior performance. | The annual bonus pool is based on a balanced scorecard of measures including customer, financial, risk and people measures. Allocation from the pool depends on performance of the franchise or function and the individual. Individual performance assessment is supported by a structured performance management framework. Guaranteed awards are only used in very limited circumstances in accordance with the PRA/FCA Remuneration Code. Immediate cash awards are limited to a maximum of £2,000. Under the deferral arrangements a significant proportion of annual bonus awards for our more senior employees are deferred over a three year period. Deferred awards are subject to malus and clawback provisions. For MRTs, a minimum of 50% of any annual bonus is delivered in RBS shares and subject to a minimum six month retention period post vesting. In certain circumstances, formulaic short-term incentive arrangements are used to align the objectives of employees with the strategy of the relevant area in which they work. |
| Long-term incentive awards | To support a culture where good performance against a full range of measures will be rewarded. To encourage the creation of value over the long term and to align further the rewards of the participants with the returns to shareholders. | RBS provides certain employees in senior roles with long-term incentive awards. Awards are structured as performance-vesting shares. Performance is typically measured over a three year period. The amount of the award that vests may vary between 0-100% depending on the performance achieved. Awards are subject to malus and clawback provisions and a minimum six month retention period applies to MRTs post vesting. |
| Other share plans | To offer employees in certain jurisdictions the opportunity to acquire RBS shares. | Employees in certain countries are eligible to contribute to share plans which are not subject to performance conditions. |
| (1) | The EBA has issued criteria for identifying MRT roles i.e. staff whose professional activities have a material influence over RBS’s performance or risk profile. The criteria for identifying MRTs are both Qualitative (based on the nature of the role) and Quantitative (i.e. those who exceed the stipulated total remuneration threshold based on the previous year’s total remuneration). |
| | The Qualitative criteria can be summarised as: staff within the management body; senior management; other staff with key functional or managerial responsibilities; and staff, individually or as part of a Committee, with authority to approve new business products or to commit to credit risk exposures and market risk transactions above certain levels. |
| | The Quantitative Remuneration criteria are: individuals earning €500,000 or more in the previous year; or individuals in the top 0.3% of earners in the previous year; or individuals who earned more than the lowest paid identified staff per the Qualitative criteria, subject to specific exceptions in the criteria. |
In accordance with the PRA/FCA Remuneration Code and the RBS Staff Dealing Rules, the conditions attaching to discretionary share-based awards prohibit the use of any personal hedging strategies to lessen the impact of a reduction in value of such awards.
Other Remuneration Disclosures
| How risk is reflected in our remuneration process |
The RBS remuneration policy explicitly aligns remuneration with effective risk management. Focus on risk is achieved through clear risk input into objectives, performance reviews, the determination of variable pools and incentive plan design as well as the application of malus and clawback. The Committee is supported in this by the Board Risk Committee (BRC) and the RBS risk management function.
A robust process is used to assess risk performance. A range of measures are considered, specifically the overall Risk Profile, Credit, Regulatory Risk & Conduct Risk, Operational Risk, Enterprise Risk and Market Risk. The steps we take to ensure appropriate and thorough risk adjustment are also fully disclosed and discussed with the PRA and the FCA.
| Variable pay pool determination |
For the 2014 performance year, RBS has adopted a multi-step process which is a control function led assessment to determine performance and therefore the appropriate bonus pool by franchise and function.
The process considers a balanced scorecard of performance assessments at the level of each franchise or support function. The assessments are made across financial, customer and people measures. Risk and conduct assessments at the same franchise or functional level are then conducted to ensure that performance that is achieved without appropriate risk and conduct controls or culture is not inappropriately rewarded.
BRC will then review any material risk and conduct events and if appropriate an underpin may be applied to the individual business and function bonus pools and where appropriate to the overall RBS bonus pool. BRC may recommend reduction of a bonus pool if it considers that risk and conduct performance is unacceptable or that the impact of poor risk management has yet to be fully reflected in the respective inputs.
Following further review against overall performance and conduct, the Chief Executive will make a final recommendation to the Committee informed by all the previous steps in the process and his strategic view of the business. The Committee will then make an independent decision on the final bonus pool taking all of these earlier steps into account.
| Accountability review process and malus/clawback |
Our Accountability Review process is an important tool in how we manage remuneration and manage adjustments to remuneration. A summary of the accountability review process is as follows:
| · | Exists to enable RBS to respond in instances where current and/or new information would change variable pay decisions made in previous years and/or the decisions to be made in the current year. |
| · | The process for review assessments (which consider material risk management, control and general policy breach failures, accountability for those events and appropriate action against individuals) is operated across RBS. |
| · | Decisions must take into account not only any financial losses, but also behavioural issues and reputational or internal costs. |
| · | Collective responsibility may be considered where a committee or group of employees are deemed to have not appropriately discharged their duties. |
| · | Malus provisions apply to any unvested variable pay awards and can be applied to reduce awards (if appropriate to zero) regardless of whether or not disciplinary action has been undertaken. |
| · | In addition to malus provisions that RBS has operated for a number of years, any variable pay awarded from 1 January 2014 was subject to clawback and this policy was updated for MRTs from 1 January 2015 to extend clawback to seven years from the date of grant. Clawback allows for the recovery of awards that have vested and our policy is in line with the requirement under the PRA/FCA Remuneration Code. |
How have we applied this in practice?
The Accountability Review process is fully embedded and is operated throughout the year. There are certain trigger events under which malus and clawback will be considered including:
| · | the individual participating in or being responsible for conduct which results in significant losses for RBS; |
| · | the individual failing to meet appropriate standards of fitness and propriety; |
| · | reasonable evidence of an individual’s misbehaviour or material error; and |
| · | RBS or the individual’s relevant business unit suffering a material failure of risk management. |
During 2014 a number of issues and events were considered under the Accountability Review framework. The outcomes covered a range of actions including: forfeiture of unvested awards through malus, reduction of current year variable pay awards; dismissal with forfeiture of unvested awards; and suspension of awards pending further investigation.
As part of the annual remuneration governance process we provide details of our approach to pay and how we comply with the Remuneration Code to the PRA and FCA. As in previous years we have received the required regulatory confirmation in order to conclude our year end remuneration process.
Other Remuneration Disclosures
The quantitative disclosures below are made in accordance with Article 450 of the EU Capital Requirements Regulation in relation to employees who have been identified as MRTs. During the year, there were 904 employees identified as MRTs excluding CFG (954 employees including CFG). The tables below show remuneration details for the population excluding CFG.
1. Aggregate remuneration expenditure
Aggregate remuneration expenditure in respect of 2014 performance was as follows:
CIB £m | Rest of RBS £m |
| 202.2 | 239.9 |
2. Amounts and form of fixed and variable remuneration
Fixed remuneration for 2014
Consisted of salaries, allowances, pensions and benefits.
Senior management £m | Others £m |
| 15.6 | 279.8 |
Variable remuneration for 2014 performance
Consisted of deferred awards payable over a three year period. Cash awards were limited to a maximum of £2,000 per employee.
| Form of remuneration | Senior management £m | Others £m |
| Variable remuneration (cash) | — | 1.4 |
| Deferred remuneration (bonds) | — | 14.2 |
| Deferred remuneration (shares) | — | 99.2 |
Long-term incentives awarded for 2014 performance
Long-term incentive awards vest subject to the extent to which performance conditions are met and can result in zero payment.
Senior management £m | Others £m |
| 14.4 | 17.5 |
In accordance with Article 94(1)(g) of the fourth Capital Requirements Directive, the variable component of total remuneration for MRTs at RBS shall not exceed 100% of the fixed component. Based on the information disclosed above, the average ratio between fixed and variable remuneration for 2014 is approximately 1:0.5.
3. Outstanding deferred remuneration through 2014
The table below includes deferred remuneration awarded or paid out in 2014 in respect of prior performance years. Deferred remuneration reduced during the year relates to long-term incentives lapsed when performance conditions are not met, long-term incentives and deferred awards forfeited on leaving and malus of prior year deferred awards and long-term incentives.
| Category of deferred remuneration | Senior management £m | Others £m |
| Unvested from prior year | 34.5 | 357.3 |
| Awarded during the financial year | 16.2 | 242.4 |
| Paid out | 8.7 | 189.6 |
| Reduced from prior years | 11.3 | 48.1 |
| Unvested at year end | 32.3 | 366.2 |
4. Sign-on and severance payments
A sign-on award for guaranteed variable remuneration of £190,000 is included in the tables above. This relates to a commitment on recruitment made in respect of one new employee. No severance payments were made outside of contractual payments related to termination of employment such as pay in lieu of notice and benefits.
Notes on the presentation of remuneration
In the relevant tables above, assumptions have been made for the notional value of LTIP (verified by external advisors) and forfeitures through resignation for deferred awards. In addition, the share price relevant to the date of the event or valuation point has been used.
| All staff total remuneration |
| · | The average salary for all employees is £35,000. |
| · | 15,500 employees earn between £50,000 and £100,000. |
| · | 6,700 employees earn between £100,000 and £250,000. |
| · | 1,200 employees earn total remuneration over £250,000. |
| Total remuneration by band for all employees earning >€1 million | Number of employees 2014 | Number of employees 2013 |
| €1.0m - €1.5m | 59 | 88 |
| €1.5m - €2.0m | 29 | 22 |
| €2.0m - €2.5m | 8 | 6 |
| €2.5m - €3.0m | 5 | 4 |
| €3.0m - €3.5m | 3 | 3 |
| €3.5m - €4.0m | 0 | 1 |
| €4.0m - €4.5m | 1 | 2 |
| €4.5m - €5.0m | 2 | 2 |
| €5.0m - €6.0m | 3 | 2 |
| €6.0m - €7.0m | 0 | 0 |
| €7.0m - €8.0m | 0 | 1 |
| Total | 110 | 131 |
Notes:
| (1) | Total remuneration in the table above includes fixed pay, pension and benefit funding and variable pay (including actual value of LTIP vesting in 2014) after the application of clawback. |
| (2) | Executive directors and 16 employees of CFG are not included in the table. |
| (3) | An illustration of a comparable population from 2013 is shown for ease of reference. The table is based on an exchange rate where applicable of €1.241 to £1 |
Employees that earned total remuneration of over €1 million in 2014 represent just 0.1% of our employees. This number reduces to 98 employees if we exclude pension and benefit funding. These employees include those who manage major businesses and functions with responsibility for significant assets, earnings or areas of strategic activity and can be grouped as follows:
| · | The CEOs responsible for each area and their direct reports. |
| · | Employees managing large businesses within a franchise. |
| · | Income generators responsible for high levels of income including those involved in managing trading activity and supporting clients with more complex financial transactions, including financial restructuring. |
| · | Those responsible for managing our balance sheet and liquidity and funding positions across the business. |
| · | Employees managing the successful disposal of assets in RCR and reducing RBS’s capital requirements. |
Compliance report
Statement of compliance
RBS is committed to high standards of corporate governance, business integrity and professionalism in all its activities.
Throughout the year ended 31 December 2014, RBS has complied with all of the provisions of the UK Corporate Governance Code issued by the Financial Reporting Council dated September 2012 (the “Code”) except in relation to provision (D.2.2) that the Group Performance and Remuneration Committee should have delegated responsibility for setting remuneration for the Chairman and executive directors. RBS considers that this is a matter which should rightly be reserved for the Board and this is an approach RBS has adopted for a number of years. Remuneration for the executive directors is first considered by the Group Performance and Remuneration Committee which then makes recommendations to the Board for consideration. This approach allows all non-executive directors, and not just those who are members of the Group Performance and Remuneration Committee, to participate in decisions on the executive directors’ and the Chairman’s remuneration and also allows the executive directors to input to the decision on the Chairman’s remuneration. The Board believes this approach is very much in line with the spirit of the Code and no director is involved in decisions regarding his or her own remuneration. We do not anticipate any changes to our approach on this aspect of the Code. Information on how RBS has applied the main principles of the Code can be found in the Corporate governance report on pages 43 to 105. A copy of the Code can be found at www.frc.org.uk
RBS has also implemented the recommendations arising from the Walker Review and complied in all material respects with the Financial Reporting Council Guidance on Audit Committees issued in September 2012.
Under the US Sarbanes-Oxley Act of 2002, specific standards of corporate governance and business and financial disclosures and controls apply to companies with securities registered in the US. RBS complies with all applicable sections of the US Sarbanes-Oxley Act of 2002, subject to a number of exceptions available to foreign private issuers.
Internal control
Management of the Royal Bank of Scotland Group plc is responsible implementing a system of internal control that is designed to facilitate effective and efficient operations and to ensure the quality of internal and external reporting and compliance with applicable laws and regulations. In devising internal controls, management has regard to the nature and extent of the risk, the likelihood of it crystallising and the cost of controls. A system of internal control is designed to manage, but not eliminate, the risk of failure to achieve business objectives and can only provide reasonable, and not absolute, assurance against the risk of material misstatement, fraud or losses.
Management’s report on internal control over financial reporting
Management is responsible for establishing and maintaining adequate internal control over financial reporting for the Group.
The Group’s internal control over financial reporting is a component of an overall system of internal control and is designed to provide reasonable assurance regarding the preparation, reliability and fair presentation of financial statements for external purposes in accordance with International Financial Reporting Standards (“IFRS”) and it includes:
| · | Policies and procedures that relate to the maintenance of records that, in reasonable detail, fairly and accurately reflect the transactions and disposition of assets. |
| · | Controls providing reasonable assurance that transactions are recorded as necessary to permit the preparation of financial statements in accordance with IFRS, and that receipts and expenditures are being made only as authorised by management. |
| · | Controls providing reasonable assurance regarding prevention or timely detection of unauthorised acquisition, use or disposition of assets that could have a material effect on the financial statements. |
Because of its inherent limitations, internal control over financial reporting may not prevent or detect misstatements. In addition, projections of any evaluation of effectiveness to future periods are subject to the risk that controls may become inadequate because of changes in conditions or because the degree of compliance with policies or procedures may deteriorate.
Management assessed the effectiveness of the Group’s internal control over financial reporting as of 31 December 2014 based on the criteria set forth by the Committee of Sponsoring Organizations of the Treadway Commission in the 2013 publication of “Internal Control – Integrated Framework”.
Based on its assessment, management believes that, as of 31 December 2014, RBS Group’s internal control over financial reporting is effective.
The effectiveness of RBS Group’s internal control over financial reporting as of 31 December 2014 has been audited by Deloitte LLP, the Group’s independent registered public accounting firm. The report of the independent registered public accounting firm to the directors of the Royal Bank of Scotland Group plc expresses an unqualified opinion on the effectiveness of the Group’s internal control over financial reporting as of 31 December 2014.
Compliance report
Report of Independent Registered Public Accounting Firm to the members of The Royal Bank of Scotland Group plc
We have audited the internal control over financial reporting of The Royal Bank of Scotland Group plc and subsidiaries (‘’the Group”) as of 31 December 2014, based on criteria established in ‘’Internal Control - Integrated Framework (2013)’’ issued by the Committee of Sponsoring Organizations of the Treadway Commission. The Group’s management is responsible for maintaining effective internal control over financial reporting and for its assessment of the effectiveness of internal control over financial reporting, included in the accompanying Management’s Report on Internal Control over Financial Reporting. Our responsibility is to express an opinion on the Group's internal control over financial reporting based on our audit.
We conducted our audit in accordance with the standards of the Public Company Accounting Oversight Board (United States). Those standards require that we plan and perform the audit to obtain reasonable assurance about whether effective internal control over financial reporting was maintained in all material respects. Our audit included obtaining an understanding of internal control over financial reporting, assessing the risk of whether a material weakness exists, testing and evaluating the design and operating effectiveness of internal control based on the assessed risk, and performing such other procedures as we considered necessary in the circumstances. We believe that our audit provides a reasonable basis for our opinion.
A company’s internal control over financial reporting is a process designed by, or under the supervision of, the company’s principal executive and principal financial officers, or persons performing similar functions, and effected by the company’s board of directors, management, and other personnel to provide reasonable assurance regarding the reliability of financial reporting and the preparation of financial statements for external purposes in accordance with generally accepted accounting principles. A company’s internal control over financial reporting includes those policies and procedures that (1) pertain to the maintenance of records that, in reasonable detail, accurately and fairly reflect the transactions and dispositions of the assets of the company; (2) provide reasonable assurance that transactions are recorded as necessary to permit preparation of financial statements in accordance with generally accepted accounting principles, and that receipts and expenditures of the company are being made only in accordance with authorisations of management and directors of the company; and (3) provide reasonable assurance regarding prevention or timely detection of unauthorised acquisition, use, or disposition of the company’s assets that could have a material effect on the financial statements.
Because of the inherent limitations of internal control over financial reporting, including the possibility of collusion or improper management override of controls, material misstatements due to error or fraud may not be prevented or detected on a timely basis. Also, projections of any evaluation of the effectiveness of the internal control over financial reporting to future periods are subject to the risk that the controls may become inadequate because of changes in conditions, or that the degree of compliance with the policies or procedures may deteriorate.
In our opinion, the Group maintained, in all material respects, effective internal control over financial reporting as of 31 December 2014, based on the criteria established in ‘’Internal Control—Integrated Framework (2013)’’ issued by the Committee of Sponsoring Organizations of the Treadway Commission.
We have also audited, in accordance with the standards of the Public Company Accounting Oversight Board (United States), the consolidated financial statements as at and for the year ended 31 December 2014 of the Group and our report dated 25 February 2015 (31 March 2015 as to the consolidating financial information included in Note 43 of the financial statements) expressed an unqualified opinion on those financial statements.
/s/ Deloitte LLP
London, United Kingdom
25 February 2015
Compliance report
Disclosure controls and procedures
Management, including our Chief Executive and our Chief Financial Officer, conducted an evaluation of the effectiveness and design of our disclosure controls and procedures (as such term is defined in Exchange Act Rule 13a-15(e)). Based on this evaluation, our Chief Executive and our Chief Financial Officer concluded that our disclosure controls and procedures were effective as of the end of the period covered by this annual report.
Changes in internal control
There was no change in RBS’s internal control over financial reporting that occurred during the period covered by this report that has materially affected, or is reasonably likely to materially affect, RBS’s internal control over financial reporting.
The New York Stock Exchange
As a foreign issuer with American Depository Shares representing ordinary shares, preference shares and debt securities listed on the New York Stock Exchange (the “NYSE”), RBS is not required to comply with all of the NYSE standards applicable to US domestic companies (the “NYSE Standards”) provided that it follows home country practice in lieu of the NYSE Standards and discloses any significant ways in which its corporate governance practices differ from the NYSE Standards. RBS is also required to provide an Annual Written Affirmation to the NYSE of its compliance with the applicable NYSE Standards.
As a foreign private issuer, the company must, however, comply fully with the provisions of the NYSE Standards that relate to the composition, responsibilities and operation of audit committees. These provisions incorporate the relevant rules concerning audit committees of the Exchange Act. The Group Audit Committee complies with the provisions of the NYSE Standards that relate to the composition, responsibilities and operation of audit committees. In May 2014, the company submitted its required annual written affirmation to the NYSE confirming its full compliance with those and other applicable provisions. More detailed information about the Group Audit Committee and its work during 2014 is set out in the Group Audit Committee report on pages 58 to 62.
RBS has reviewed its corporate governance arrangements and is satisfied that these are consistent with the NYSE Standards, subject to the following departures: (i) the Chairman of the Board is also the Chairman of the Group Nominations Committee, which is permitted under the Code (since the Chairman was considered independent on appointment) (ii) although the members of the Group Performance and Remuneration Committee are deemed independent in compliance with the provisions of the Code, the Board has not assessed the independence of the members of the Group Performance and Remuneration Committee and of its compensation committee advisers in accordance with the independence tests prescribed by the NYSE Standards (iii) the NYSE Standards require that the compensation committee must have direct responsibility to review and approve the Chief Executive’s remuneration. As stated at the start of this Compliance report, in the case of RBS, the Board, rather than the Group Performance and Remuneration Committee, reserves the authority to make the final determination of the remuneration of the Chief Executive. RBS’s Group Audit, Board Risk, Sustainable Banking and Group Nominations Committees are otherwise composed solely of non-executive directors deemed by the Board to be independent.
This Compliance report forms part of the Corporate governance report and the Report of the directors.
Report of the directors
The directors present their report together with the audited accounts for the year ended 31 December 2014.
Group structure
The company is a holding company owning the entire issued ordinary share capital of The Royal Bank of Scotland plc, the principal direct operating subsidiary undertaking of the company. RBS comprises the company and all its subsidiary and associates, including the Royal Bank and NatWest.
Following placing and open offers in December 2008 and in April 2009, HM Treasury (HMT) owned approximately 70.3% of the enlarged ordinary share capital of the company. In December 2009, the company issued a further £25.5 billion of new capital to HMT. This new capital took the form of B shares, which do not generally carry voting rights at general meetings of ordinary shareholders but are convertible into ordinary shares and qualify as Core Tier 1 capital. Following the issuance of the B shares, HMT’s holding of ordinary shares of the company remained at 70.3%, although its economic interest rose to 84.4%.
At 31 December 2014, HMT’s holding in the company’s ordinary shares was 62.3% and its economic interest was 79.1%.
Strategic review
On 27 February 2014, RBS announced a refreshed strategic direction with the ambition of building a bank which earns its customers’ trust by serving them better than any other bank.
RBS is now structured to deliver this ambition by organising itself around the needs of its customers, so as to combine customer groups with similar needs into franchises able to deliver co-ordinated services.
The reorganised bank will be a UK-focused retail and corporate bank with an international footprint to drive its corporate business. The previously reported operating divisions are now realigned into three franchises:
| · | Personal & Business Banking (PBB), comprising two reportable segments, UK Personal & Business Banking, including Williams & Glyn, (UK PBB) and Ulster Bank. |
| · | Commercial & Private Banking (CPB), comprising two reportable segments, Commercial Banking and Private Banking. |
| · | Corporate & Institutional Banking (CIB). |
In addition to the segments noted above, RBS will continue to manage and report Citizens Financial Group (CFG) and RBS Capital Resolution (RCR) separately until disposal or wind-down.
RCR became fully operational on 1 January 2014 with a pool of c.£29 billion of assets with particularly high long-term capital intensity, credit risk and/or potentially volatile outcomes in stressed environments. RCR brings these assets under common management and increases focus on managing these assets down so as to release capital.
On 31 October 2014 RBS confirmed it will retain Ulster Bank following completion of the strategic review. Ulster Bank remains a core part of RBS, offering a good strategic fit with RBS’s focused retail and commercial banking strategy.
Results and dividends
The loss attributable to the ordinary and B shareholders of the company for the year ended 31 December 2014 amounted to £3,470 million compared with a loss of £8,995 million for the year ended 31 December 2013, as set out in the consolidated income statement on page 333.
The company did not pay a dividend on ordinary shares in 2013 or 2014.
RBS has now resumed payments on all discretionary non-equity capital instruments following the end of the European Commission ban in 2012 for RBS and 2013 for RBS N.V. Future coupons and dividends on hybrid capital instruments will only be paid subject to, and in accordance with, the terms of the relevant instruments.
In the context of prior macro-prudential policy discussions, the Board decided to partially neutralise any impact on Core Tier 1 capital of coupon and dividend payments in respect of 2014 Group hybrid capital instruments through equity issuances of c.£300 million. Consequently, approximately £300 million was raised during 2014 through the issue of new ordinary shares.
For 2015, the Board has decided to continue partially neutralising the Core Tier 1 impact of Group hybrid capital instruments. It is expected that £300 million of new equity will be issued during the course of 2015 to achieve this aim.
The Dividend Access Share (DAS) retirement agreement was approved at the General Meeting of shareholders held on 25 June 2014. The first dividend payment on the DAS of £320 million was made in the third quarter of 2014. The balance of £1.18 billion is to be paid by 31 December 2015, if the balance is not paid by this point then interest begins to accrue on the balance outstanding at 5% per annum until 1 January 2021 and 10% thereafter.
Report of the directors
Business review
Activities
RBS is engaged principally in providing a wide range of banking and other financial services. Further details of the organisational structure and business overview of RBS, including the products and services provided by each of its segments and the competitive markets in which they operate, are contained in the Business review on pages 107 to 109. Details of the strategy for delivering the company’s objectives can be found in the Strategic report.
Risk factors
RBS’s future performance and results could be materially different from expected results depending on the outcome of certain potential risks and uncertainties. Certain risk factors RBS faces are summarised in the Business review on page 110. Fuller details of these and other risk factors are set out on page 466.
The reported results of RBS are also sensitive to the accounting policies, assumptions and estimates that underlie the preparation of its financial statements. Details of RBS’s critical accounting policies and key sources of accounting judgments are included in Accounting policies on pages 348 to 350.
RBS’s approach to risk management, including its financial risk management objectives and policies and information on RBS’s exposure to price, credit, liquidity and cash flow risk, is discussed in the Business review: Capital and risk management.
Financial performance
A review of RBS's performance during the year ended 31 December 2014, including details of each segment, and RBS's financial position as at that date is contained in the Business review on pages 113 to 163.
RBS Holdings N.V. (formerly ABN AMRO Holding N.V.)
In 2007, RFS Holdings B.V., which was jointly owned by RBS, the Dutch State (successor to Fortis) and Santander (together, the “Consortium Members”) completed the acquisition of ABN AMRO Holding N.V.
On 1 April 2010, the businesses acquired by the Dutch State were transferred to ABN AMRO Group N.V., itself owned by the Dutch State. In connection with the transfer ABN AMRO Holding N.V. was renamed RBS Holdings N.V. and its banking subsidiary was renamed The Royal Bank of Scotland N.V. (“RBS N.V.”).
In October 2011, RBS completed the transfer of a substantial part of the UK activities of RBS N.V. to the Royal Bank. Substantially all of the Netherlands and EMEA businesses were transferred to the Royal Bank in September 2012. Russia, Korea and the North American businesses were transferred to the Royal Bank in 2013. During 2014, the Thailand business was transferred to the Royal Bank. Certain assets of RBS N.V. continue to be shared by the Consortium Members.
Business divestments
To comply with the European Commission State Aid requirements RBS agreed a series of restructuring measures. These include the divestment of Direct Line Insurance Group plc (completed in 2014) the sale of 80.01% of RBS’s Global Merchant Services business (completed in 2010) and the sale of substantially all of the RBS Sempra Commodities joint venture business (largely completed in 2010), as well as the divestment of the RBS branch-based business in England and Wales and the NatWest branches in Scotland, along with the direct SME customers across the UK (“UK branch-based businesses”).
In October 2012, Santander UK plc withdrew from its agreed purchase of the UK branch-based businesses. In September 2013, RBS reached an agreement with an investor consortium led by Corsair Capital and Centerbridge Partners for an investment in these businesses ahead of a stock market flotation. This includes 308 RBS branches in England and Wales. The new bank will be called Williams & Glyn, the brand RBS used for its branches in England and Wales before 1985. It is intended that Williams & Glyn will be launched by the end of 2016.
During 2014, RBS completed the disposal of its shareholding in Direct Line Insurance Group (DLG). This followed earlier disposals of 34.7% of DLG shares in 2012 and 36.8% of DLG shares in 2013.
In September 2014, RBS completed a partial IPO of Citizens Financial Group (CFG) resulting in 28.75% of CFG’s shares being floated. Full disposal of CFG is expected by the end of 2016.
Employees
As at 31 December 2014, RBS employed 108,700 people (full-time equivalent basis, including temporary workers) throughout the world. Details of related costs are included in Note 3 on the consolidated accounts.
Leadership
Developing great leaders with the capability to deliver our ambition to be number one for customer service, trust and advocacy is a key priority, aligned to our People and Leadership Standards. In 2014 we rolled out Team Effectiveness sessions for new executive teams to help them role model our values and lead the transition to a new RBS.
Employee engagement
For RBS, building an engaged, healthy and inclusive workforce is crucial. Every year since 1999, through the Our View survey, people in all our businesses have shared their thoughts about what it’s like to work at RBS. The survey enables our people leaders to monitor levels of engagement and work with their teams to make improvements to the working environment. It also provides a mechanism for RBS to track employee perception of our culture and the progress we’re making.
Report of the directors
Living our values
The ways that we recruit, promote, reward, and manage our people are all aligned to our values, and this coherent approach is making a difference within the organisation – with more people (year on year) believing our values are making a difference to the way we work.
How we behave forms the character of our company and dictates how others see us. RBS’s code of conduct, Our Code, reflects our values and applies to everyone who works here. It is supported by the YES Check: a simple decision-making framework to help our people translate Our Code into their day-to-day roles. The YES check has been designed to meet the Financial Conduct Authority’s standard of conduct and is underpinned by ethical principles.
Our Code lets everyone know what to expect of each other, what to do when unsure of a decision, and where to go for advice when needed. It’s available at rbs.com>about us>our values, or without charge, upon request, by contacting Corporate Governance and Secretariat at the telephone number listed on page 517.
Customer performance
Our approach to performance management allows us to provide clarity for our people about how their individual contribution links to our ambition, reward the behaviour that supports our values, and hold individuals to account for behaviour and performance that does not. In 2014 we completed alignment of our approach to performance management across RBS, so that in 2015 there is consistent bank-wide use of our balanced scorecard, People standards, Leadership standards, and online system.
Simple Organisation
RBS is making steady progress towards building a smaller, simpler organisation. In 2014, we defined clear principles and practices around how the organisation would work, and new role accountabilities for the top 150 roles across the RBS, as part of redesigning our operating model.
We’ve moved from seven divisions to three customer franchises, redesigning our supporting functions and services to remove duplication and unnecessary management layers. In addition to supporting our strategic direction, this work has strengthened accountabilities across RBS, with robust governance in place to ensure future organisation designs are in line with these principles, positioning us to respond to ongoing regulatory requirements.
Employee consultation
RBS recognises employee representatives such as trade unions and work councils in a number of businesses and countries. Our European Employee Council provides an opportunity for elected representatives and management to discuss developments in RBS’s European operations. Discussions have continued to take place with employee representatives where appropriate on the progress of our strategic plans.
Employee learning and development
RBS maintains a strong commitment to providing all our people with the opportunity to grow through learning and development, which in turn helps to achieve business objectives and drive excellent customer service.
Supporting the professionalisation of our front line staff, all of our customer-facing employees are aware of the professional standards expected of them, and as at the end of 2014, 86% have completed related professional development programmes, giving colleagues the skills they need to do their job and serve customers well. Building the capability of our people is also crucial to ensure effective compliance behaviour. RBS has mandatory training modules for all employees to improve their understanding of the processes and controls required to properly manage key risks.
Diversity and inclusion
RBS’s ambition is to be number one for customer service, trust and advocacy in every one of our chosen business areas by 2020, supported by a people commitment to make RBS a great place to work. Valuing difference is therefore essential for our customers and colleagues. Our inclusion policy standard applies to all our people globally; and our strategy for diversity and inclusion sits with the Board and Executive Committee.
Our approach during 2014/15 focuses on building inclusion into all stages of the employee lifecycle. In 2014 we started rolling out bank-wide unconscious bias learning for all employees, which will continue across 2015. We’ve introduced a gender target to increase the number of women in senior roles across RBS. And we continue to support our employee-led networks, with membership across RBS at over 15,000 people.
This year RBS has been recognised for its work on Equality, Diversity and Inclusion by retaining our Platinum ranking from Opportunity Now (gender) for the second year; increasing our ranking from Silver to Gold for Race for Opportunity (race); retaining a position in the Times Top 50 Employers for Women for the eighth consecutive year; and improving upon our ranking in the Stonewall Workplace Equality Index (LGBT).
Wellbeing
Ensuring and supporting the wellbeing of our people is an important responsibility for RBS. A wide range of health benefits and services is in place to help them maintain good physical and psychological health, and support them if they do become unwell, including Lifematters, RBS’s Employee Assistance Programme. We continue to enhance and promote these services, targeting those issues that we know affect our people’s ability to bring the best of themselves to work. In 2014, Lifematters Online activity improved significantly through promotion via road shows, wellbeing fairs, and internal communications; and the popularity of the Lifematters App, which was launched in late 2013, continued to grow. In 2014 RBS also signed up to Time to Change: the UK’s biggest programme to challenge mental health stigma.
Sustainability
Sustainability at RBS means building our business around long term thinking and support for our customers and the communities in which they live. Our core responsibility is to obey the law and to ensure that our business is built on safe and secure financial foundations, and we have worked hard in the years since the financial crisis to achieve this position. This underpins everything that RBS does and enables people to run their daily lives and businesses. Our position as a provider of credit supports economic growth and brings wider benefits to society.
Report of the directors
But our ambition is to go further, to shape the world around us in a positive way. We recognise that we still have a long way to go achieve this position across our business. Sustainability is therefore not just about the many responsibilities and obligations that RBS has, but about taking leadership on a broad range of issues that are important to our stakeholders.
The Sustainable Banking Committee is responsible for overseeing and challenging how management is addressing sustainable banking and reputation issues, considering the long term interests of all stakeholder groups.
For more information on our approach and progress read the RBS Sustainability Report, available on rbs.com/sustainable.
Greenhouse gas emissions
Disclosures relating to greenhouse gas emissions are included in the Strategic report on page 40.
Going concern
RBS’s business activities and financial position, the factors likely to affect its future development and performance and its objectives and policies in managing the financial risks to which it is exposed and its capital are discussed in the Business review. The risk factors which could materially affect RBS’s future results are set out on page 466. RBS’s regulatory capital resources and significant developments in 2014 and anticipated future developments are detailed on pages 187 and 188. The liquidity and funding section on pages 212 to 226 describes RBS’s funding and liquidity profile, including changes in key metrics, the build up of liquidity reserves and the outlook for 2015.
Having reviewed RBS’s forecasts, projections and other relevant evidence, the directors have a reasonable expectation that RBS and the company will continue in operational existence for the foreseeable future. Accordingly, the financial statements of RBS and of the company have been prepared on a going concern basis.
BBA disclosure code
RBS’s 2014 financial statements have been prepared in compliance with the principles set out in the Code for Financial Reporting Disclosure published by the British Bankers' Association in 2010.The Code sets out five disclosure principles together with supporting guidance. The principles are that RBS and other major UK banks will provide high quality, meaningful and decision-useful disclosures; review and enhance their financial instrument disclosures for key areas of interest to market participants; assess the applicability and relevance of good practice recommendations to their disclosures acknowledging the importance of such guidance; seek to enhance the comparability of financial statement disclosures across the UK banking sector; and clearly differentiate in their annual reports between information that is audited and information that is unaudited.
Corporate governance
The company is committed to high standards of corporate governance. Details are given in the Corporate governance report on pages 51 to 55. The Corporate governance report and compliance report (pages 96 to 98) form part of this Report of the directors.
Share capital
Details of the ordinary and preference share capital at 31 December 2014 and movements during the year are shown in Note 26 on the consolidated accounts.
During 2014, the company allotted and issued a total of 89 million new ordinary shares of £1 each for the purposes of ensuring 2014 coupon payments on discretionary hybrid capital securities were partly neutralised from a Core Tier 1 capital perspective. The shares were allotted to UBS AG at the subscription prices and determined by reference to the average market prices during the sale periods set out below.
| Number of shares sold | Subscription price | Sale period | Gross proceeds | Share price on allotment |
| 32.8m | 305.329p | 27/2/2014 - 2/5/2014 | £100 million | 331.7p |
15.5m | 328.910p | 2/5/2014 – 3/7/2014 | £51 million | 332.8p |
23.9m | 355.890p | 1/8/2014- 30/9/2014 | £85 million | 368.2p |
| 16.8m | 381.398p | 31/10/2014-25/11/2014 | £64 million | 387.1p |
In addition, the company issued 74 million ordinary shares of £1 each in connection with employee share schemes.
Additional information
Where not provided elsewhere in the Report of the directors, the following additional information is required to be disclosed by Part 6 of Schedule 7 to the Large and Medium-sized Companies and Groups (Accounts and Reports) Regulations 2008.
The rights and obligations attached to the company’s ordinary shares and preference shares are set out in the company’s Articles of Association, copies of which can be obtained from Companies House in the UK or can be found at rbs.com>about us.
On a show of hands at a general meeting of the company every holder of ordinary shares and cumulative preference shares present in person or by proxy and entitled to vote shall have one vote. On a poll, every holder of ordinary shares or cumulative preference shares present in person or by proxy and entitled to vote shall have four votes for every share held. The notices of Annual General Meetings and General Meetings specify the deadlines for exercising voting rights and appointing a proxy or proxies to vote in relation to resolutions to be passed at the meeting.
The cumulative preference shares represent less than 0.014% of the total voting rights of the company, the remainder being represented by the ordinary shares.
There are no restrictions on the transfer of ordinary shares in the company other than certain restrictions which may from time to time be imposed by laws and regulations (for example, insider trading laws). Pursuant to the Listing Rules of the FCA, certain employees of the company require the approval of the company to deal in the company’s shares.
Report of the directors
The rules governing the powers of directors, including in relation to issuing or buying back shares and their appointment are set out in the company’s Articles of Association. It will be proposed at the 2015 Annual General Meeting that the directors be granted authorities to allot shares under the Companies Act 2006. The company’s Articles of Association may only be amended by a special resolution at a general meeting of shareholders.
A number of the company’s share plans include restrictions on transfers of shares while shares are subject to the plans or the terms under which the shares were awarded.
The rights and obligations of holders of non-cumulative preference shares are set out in Note 26 on the consolidated accounts.
Except in relation to the Dividend Access Share, the company is not aware of any agreements between shareholders that may result in restrictions on the transfer of securities and/or voting rights. There are no persons holding securities carrying special rights with regard to control of the company.
Under the rules of certain employee share plans, eligible employees are entitled to acquire shares in the company, and shares are held in trust for participants by The Royal Bank and Ulster Bank Dublin Trust Company as Trustees. Voting rights are exercised by the Trustees on receipt of participants’ instructions. If a participant does not submit an instruction to the Trustee no vote is registered.
The Royal Bank of Scotland plc 1992 Employee Share Trust, The Royal Bank of Scotland Group plc 2001 Employee Share Trust and The Royal Bank of Scotland Group plc 2007 US Employee Share Trust hold shares on behalf of RBS’s employee share plans. The voting rights are exercisable by the Trustees, however, in accordance with investor protection guidelines, the Trustees abstain from voting. The Trustees would take independent advice before accepting any offer in respect of their shareholdings for the company in a takeover bid situation.
Awards granted under the company’s employee share plans may be met through a combination of newly issued shares and shares acquired in the market by the company’s employee benefit trusts.
A change of control of the company following a takeover bid may cause a number of agreements to which the company is party to take effect, alter or terminate. All of the company’s employee share plans contain provisions relating to a change of control. Outstanding awards and options may vest and become exercisable on change of control, subject where appropriate to the satisfaction of any performance conditions at that time and pro-rating of awards. In the context of the company as a whole, these agreements are not considered to be significant.
Directors
The names and brief biographical details of the current directors are shown on pages 47 to 50.
Sandy Crombie, Alison Davis, Robert Gillespie, Philip Hampton, Penny Hughes, Ross McEwan, Brendan Nelson and Baroness Noakes all served throughout the year and to the date of signing of the financial statements.
Tony di lorio stepped down from the Board on 26 March 2014.
Nathan Bostock stepped down from the Board on 28 May 2014.
Phillip Scott stepped down from the Board on 31 October 2014.
Morten Friis was appointed to the Board on 10 April 2014.
Ewen Stevenson was appointed to the Board on 19 May 2014.
On 25 February 2015 the Board approved the appointment of Howard Davies as a non-executive director with effect from the end of June and as Chairman from 1 September 2015.
All directors of the company are required to stand for election or re-election annually by shareholders at the Annual General Meeting and, in accordance with the UK Listing Rules, the election or re-election of independent directors requires approval by all shareholders and also by independent shareholders.
Directors’ interests
The interests of the directors in the shares of the company at 31 December 2014 are shown on page 87. None of the directors held an interest in the loan capital of the company or in the shares or loan capital of any of the subsidiary undertakings of the company, during the period from 1 January 2014 to 25 February 2015.
Directors’ indemnities
In terms of section 236 of the Companies Act 2006 (the “Companies Act”), Qualifying Third Party Indemnity Provisions have been issued by the company to its directors, members of the RBS Executive Committee, PRA/FCA Approved Persons and certain directors and/or officers of RBS subsidiaries.
In terms of section 236 of the Companies Act, Qualifying Pension Scheme Indemnity Provisions have been issued to all trustees of RBS pension schemes.
Post balance sheet events
There have been no significant events between the year end and the date of approval of these accounts which would require a change to or disclosure in the accounts.
Controlling shareholder
In accordance with the UK Listing Rules, the company has entered into an agreement with HM Treasury (the ‘Controlling Shareholder’) which is intended to ensure that the Controlling Shareholder complies with the independence provisions set out in the UK Listing Rules. The company has complied with the independence provisions in the relationship agreement and as far as the company is aware the independence and procurement provisions in the relationship agreement have been complied with in the period by the controlling shareholder.
Report of the directors
Shareholdings
The table below shows shareholders that have notified RBS that they hold more than 3% of the total voting rights of the company at 31 December 2014.
| Solicitor For The Affairs of Her Majesty’s Treasury as Nominee for Her Majesty’s Treasury | Number of shares (millions) | % of share class held | % of total voting rights held |
| Ordinary shares | 3,964 | 62.3 | 62.3 |
| B shares (non-voting) | 51,000 | 100 | - |
As at 25 February 2015, there were no changes to the shareholdings shown in the table above.
Listing Rule 9.8.4
In accordance with the UK Financial Conduct Authority’s Listing Rules the information to be included in the Annual Report and Accounts under LR 9.8.4, is set out in this Directors’ report with the exception of details of contracts of significance under LR 9.8.4. (10) and (11) given in Additional Information on pages 461 to 464.
Political donations
At the Annual General Meeting in 2014, shareholders gave authority under Part 14 of the Companies Act, for a period of one year, for the company (and its subsidiaries) to make political donations and incur political expenditure up to a maximum aggregate sum of £100,000. This authorisation was taken as a precaution only, as the company has a longstanding policy of not making political donations or incurring political expenditure within the ordinary meaning of those words. During 2014, RBS made no political donations, nor incurred any political expenditure in the UK or EU and it is not proposed that RBS’s longstanding policy of not making contributions to any political party be changed. Shareholders will be asked to renew this authorisation at the Annual General Meeting in 2015.
Directors’ disclosure to auditors
Each of the directors at the date of approval of this report confirms that:
(a) so far as the director is aware, there is no relevant audit information of which the company’s auditors are unaware; and
(b) the director has taken all the steps that he/she ought to have taken as a director to make himself/herself aware of any relevant audit information and to establish that the company’s auditors are aware of that information.
This confirmation is given and should be interpreted in accordance with the provisions of section 418 of the Companies Act.
Auditors
The auditors, Deloitte LLP, have indicated their willingness to continue in office. A resolution to re-appoint Deloitte LLP as the company’s auditors will be proposed at the forthcoming Annual General Meeting.
As discussed in more detail in the Group Audit Committee report, following a tender process, EY will be appointed as the company’s auditors for the financial year ending 31 December 2016, replacing Deloitte.
By order of the Board
Aileen Taylor
Company Secretary
25 February 2015
The Royal Bank of Scotland Group plc
is registered in Scotland No. SC45551
Statement of directors’ responsibilities
This statement should be read in conjunction with the responsibilities of the auditor set out in their report on page 332.
The directors are responsible for the preparation of the Annual Report and Accounts. The directors are required by Article 4 of the IAS Regulation (European Commission Regulation No 1606/2002) to prepare Group accounts, and as permitted by the Companies Act 2006 have elected to prepare company accounts, for each financial year in accordance with International Financial Reporting Standards as adopted by the European Union. They are responsible for preparing accounts that present fairly the financial position, financial performance and cash flows of the Group and the company. In preparing those accounts, the directors are required to:
| · | select suitable accounting policies and then apply them consistently; |
| · | make judgements and estimates that are reasonable and prudent; and |
| · | state whether applicable accounting standards have been followed, subject to any material departures disclosed and explained in the accounts. |
The directors are responsible for keeping proper accounting records which disclose with reasonable accuracy at any time the financial position of the Group and to enable them to ensure that the Annual Report and Accounts complies with the Companies Act 2006. They are also responsible for safeguarding the assets of the Group and hence for taking reasonable steps for the prevention and detection of fraud and other irregularities.
The directors confirm that to the best of their knowledge:
| · | the financial statements, prepared in accordance with International Financial Reporting Standards, give a true and fair view of the assets, liabilities, financial position and profit or loss of the company and the undertakings included in the consolidation taken as a whole; and |
| · | the Strategic Report and Directors’ report (incorporating the Business review) include a fair review of the development and performance of the business and the position of the company and the undertakings included in the consolidation taken as a whole, together with a description of the principal risks and uncertainties that they face. |
In addition, the directors are of the opinion that the Annual Report and Accounts, taken as a whole, is fair, balanced and understandable and provides the information necessary for shareholders to assess the company’s performance, business model and strategy.
By order of the Board
| Philip Hampton | Ross McEwan | Ewen Stevenson |
| Chairman | Chief Executive | Chief Financial Officer |
25 February 2015
Board of directors
| Chairman | Executive directors | Non-executive directors |
| Philip Hampton | Ross McEwan Ewen Stevenson | Sandy Crombie Alison Davis Morten Friis Robert Gillespie Penny Hughes Brendan Nelson Baroness Noakes |
Business review
| 107 | Revised Organisational Structure |
| 107 | Description of business |
| 109 | Competition |
| 110 | Risk factors |
| 113 | Key financials |
| 114 | Summary consolidated income statement |
| 115 | Results summary |
| 117 | Analysis of results |
| 127 | Segment performance |
| 157 | Consolidated balance sheet |
| 160 | Cash flow |
| 161 | Capital resources |
| 162 | Analysis of balance sheet pre and post disposal groups |
| 164 | Capital and risk management |
Revised organisational structure
During 2014, RBS announced a new organisational structure based on three franchises and seven operating segments:
| · | Personal & Business Banking, comprising two reportable segments, UK Personal & Business Banking, including Williams & Glyn, and Ulster Bank. |
| · | Commercial & Private Banking, comprising two reportable segments, Commercial Banking and Private Banking. |
| · | Corporate & Institutional Banking, a single reportable segment. |
In addition, RBS will continue to manage and report Citizens Financial Group and RBS Capital Resolution (RCR) as separate operating segments until disposal or wind-down. No business lines were moved to RCR so comparative data has not been restated. Non-Core was dissolved on 31 December 2013.
For further details see Note 38.
Discontinued operations
RBS disposed of 29.5% of its interest in Citizens in 2014. In accordance with IFRS 5 ’Non-current Assets Held for Sale and Discontinued Operations’, Citizens has been recognised as a discontinued operation with consequent changes to the presentation of comparative financial information. The assets and liabilities relating to Citizens are included in disposal groups at 31 December 2014.
Glossary
A glossary of terms is provided on pages 506 to 512.
Description of business
Introduction
The Royal Bank of Scotland Group plc is the holding company of a large banking and financial services group. Headquartered in Edinburgh, RBS operates in the United Kingdom, the United States and internationally through its principal subsidiaries, the Royal Bank and NatWest. Both the Royal Bank and NatWest are major UK clearing banks. In the United States, RBS's subsidiary Citizens Financial Group Inc is a large commercial banking organisation. Globally, RBS has a diversified customer base and provides a wide range of products and services to personal, commercial and large corporate and institutional customers.
Following the placing and open offers in December 2008 and in April 2009, HM Treasury owned approximately 70.3% of the enlarged ordinary share capital of the company. In December 2009, the company issued a further £25.5 billion of new capital to HM Treasury. This new capital took the form of B shares, which do not generally carry voting rights at general meetings of ordinary shareholders but are convertible into ordinary shares and qualify as Core Tier 1 capital. Following the issuance of the B shares, HM Treasury's holding of ordinary shares of the company remained at 70.3% although its economic interest rose to 84.4%.
At 31 December 2014, HM Treasury’s holding in the company’s ordinary shares was 62.3% and its economic interest was 79.1%.
RBS had total assets of £1,051 billion and owners' equity of £57 billion at 31 December 2014. The risk asset ratios at 31 December 2014 were a Total capital ratio of 13.7%, a Common Equity Tier 1 capital ratio of 11.2% and a Tier 1 capital ratio of 11.2%.
Organisational structure
On 27 February 2014, RBS announced a refreshed strategic direction with the ambition of building a bank which earns its customers’ trust by serving them better than any other bank.
RBS is now structured to deliver this ambition by organising itself around the needs of its customers, so as to combine customer groups with similar needs into franchises able to deliver co-ordinated services.
The reorganised bank will be a UK-focused retail and corporate bank with an international footprint to drive its corporate business. The previously reported operating divisions are now realigned into three franchises:
Personal & Business Banking (PBB) comprises two reportable segments, UK Personal & Business Banking, including Williams & Glyn, (UK PBB) and Ulster Bank:
| · | UK Personal & Business Banking (UK PBB) offers a comprehensive range of banking products and related financial services to the personal and small business market. It serves customers through a number of channels including: the Royal Bank and NatWest network of branches and ATMs in the UK, telephony, online and mobile. UK PBB is committed to serving customers well, making banking easier and convenient whilst ensuring that we do business in an open, honest and sustainable manner. |
| · | Ulster Bank is a leading retail and commercial bank in Northern Ireland and the Republic of Ireland. It provides a comprehensive range of financial services through both its Retail Banking division, which provides loan and deposit products through a network of branches and direct channels, and its Corporate Banking division, which provides services to businesses and corporate customers. |
Commercial & Private Banking (CPB) comprises two reportable segments, Commercial Banking and Private Banking:
| · | Commercial Banking is a leading provider of banking, finance and risk management services to the commercial, mid-corporate and corporate sector in the UK. It offers a full range of banking products and related financial services through a nationwide network of relationship managers, telephone and internet channels. The product range includes invoice finance through the RBSIF brand and asset finance through the Lombard brand. |
| · | Private Banking provides banking and wealth management services in the UK through Coutts & Co and Adam & Company, offshore through RBS International and Isle of Man Bank and internationally through Coutts & Co Ltd. |
Corporate & Institutional Banking (CIB) serves our corporate and institutional clients primarily in the UK and Western Europe, as well as those US and Asian multinationals with substantial trade and investment links in the region, with debt financing, risk management and trade services, focusing on core product capabilities that are of most relevance to our clients. CIB is a single reportable segment.
In addition to the segments noted above, RBS will continue to manage and report Citizens Financial Group (CFG) and RBS Capital Resolution (RCR) separately until disposal or wind-down.
Citizens Financial Group (CFG) provides financial services primarily through the Citizens and Charter One brands. CFG is engaged in retail and corporate banking activities through its branch network in 11 states in the United States and through non-branch offices in other states. RBS disposed of 29.5% of its interest in CFG in 2014 and it is intended that RBS will complete the disposal of CFG by 2016.
CFG has been reclassified as a discontinued operation, it continues to be presented as reportable segment.
RBS Capital Resolution (RCR) became fully operational on 1 January 2014 with a pool of c.£29 billion of assets with particularly high long-term capital intensity, credit risk and/or potentially volatile outcomes in stressed environments. RCR brings assets under common management and increases focus on managing these assets so as to release capital.
Services supports the customer-facing businesses and provides operational technology, customer support in telephony, account management, lending and money transmission, global purchasing, property and other services. Services drives efficiencies and supports income growth across multiple brands and channels by using a single, scalable platform and common processes wherever possible. It also leverages RBS’s purchasing power and is the centre of excellence for managing large-scale and complex change. For reporting purposes, Services costs are allocated to the operating segments above. It is not deemed a reportable segment.
Central Functions comprises corporate functions, such as treasury, finance, risk management, compliance, legal, communications and human resources. Central functions manages RBS capital resources and RBS-wide regulatory projects and provides services to the reportable segments.
Business divestments
To comply with the European Commission State Aid requirements RBS agreed a series of restructuring measures. These included the sale of 80.01% of RBS Global Merchant Services business (completed in 2010) and the sale of substantially all of the RBS Sempra Commodities joint venture business (largely completed in 2010), as well as the divestment of Direct Line Insurance Group plc (completed in 2014, following earlier disposals of 34.7% of DLG shares in 2012 and 36.8% of DLG shares in 2013).
In October 2012, Santander UK plc withdrew from its agreed purchase of the UK branch-based businesses. In September 2013, RBS reached an agreement with an investor consortium led by Corsair Capital and Centerbridge Partners for an investment in these businesses ahead of a stock market flotation. This includes 308 RBS branches in England and Wales along with the related direct SME customers across the UK (“UK branch-based businesses”). The new bank will be called Williams & Glyn, the brand RBS used for its branches in England and Wales before 1985. It is intended that Williams & Glyn will be launched by the end of 2016.
In September 2014, RBS completed an initial public offering of 28.75% of CFG common stock and currently has an interest of 70.5%. It is intended that RBS will cede control of CFG by the end of 2015, with full disposal completed by the end of 2016.
Competition
Personal & Business Banking
In the personal and small business banking business, the bank competes with a range of providers including UK banks and building societies, major retailers and life assurance companies, as well as the UK subsidiaries of major international banks. In the mortgage market, the bank competes with UK banks, building societies and specialist lenders. Increasingly, the ambitions of non-traditional players in the UK market are gaining credibility, with new entrants active and seeking to build their platforms either through organic growth or in some cases by acquiring businesses made available through restructuring of incumbents. Entrants with new business models such as peer-to-peer lending platforms, while currently small, have shown rapid growth and are emerging as significant competitors. Such competitors often target specific elements of the value chain or customer segments. RBS distributes life assurance products to banking customers in competition with independent advisors and life assurance companies.
In Ireland, Ulster Bank competes in retail and commercial banking with the major Irish banks and building societies, and with other UK and international banks and building societies active in the market.
In the UK credit card market large retailers and specialist card issuers are active in addition to the UK banks. In addition to physical distribution channels, providers compete through direct marketing activity and digital channels.
Key competitive factors in this market segment include cost management, growing digital sales focus, branch network re-shaping, and product simplification. Cost management remains a key focus in the market, as banks seek to simplify their organisational and IT architectures while at the same time investing to ensure that they can meet customers’ evolving channel preferences. Customers have increasingly focused on the use of internet and mobile as sales and service channels for certain types of products. Therefore, competitive position and performance in the sector increasingly depends on the possession of user-friendly, diverse and efficient online solutions. Although conveniently located branches are still important, RBS faces competitive pressure to adjust its branch formats to meet changing customer expectations and to manage its branch footprint as over-the-counter transaction volumes decline. In terms of product offering, the industry trend is to limit the number of products and present the product structure and costs in a clear and transparent manner.
Commercial & Private Banking
Competition for corporate and institutional customers in the UK is from UK banks, from specialised global and regional investment banks and from large foreign universal banks that offer combined investment and commercial banking capabilities as well as from new entrants and non-bank challengers. In asset finance and invoice finance, the bank competes with banks and specialist finance providers, both captive and non-captive. In the small business banking market, the bank competes with other UK banks, specialist finance providers and building societies. In all of these areas, entrants with new technology-based business model are also showing rapid growth. In Private Banking, The Royal Bank of Scotland International competes with other UK and international banks to offer offshore banking services as well as domestic banking services in the Channel Islands, Gibraltar and the Isle of Man. Coutts and Adam & Company compete as private banks with UK clearing and private banks, asset managers and with international private banks. Competition in wealth management remains strong as banks maintain their focus on competing for affluent and high net worth customers.
Corporate & Institutional Banking
In UK, European, Asian and the US corporate and institutional banking markets the bank competes with the large domestic banks active in these markets, the major international banks and a number of investment banks. Future competition in these markets, especially in Asia and the US, will be impacted by the implementation of the refined CIB strategy. With continued pressure on margins and fees, market participants stay focused on optimising core businesses, principally through reallocation of resources to areas generating economic returns where client opportunities are greater. In some cases this means closing part of overseas operations and focusing on home countries, while in others, notably among Japanese banks, competitors are searching for growth opportunities beyond home markets.
Citizens Financial Group (CFG)
In the United States, following a successful initial public offering, RBS retains a controlling interest in CFG. CFG competes in the New England, Mid-Atlantic and Mid-West retail and mid-corporate banking markets with local and regional banks and other financial institutions. CFG’s mortgage lending, auto lending, student lending and commercial banking businesses operate in select additional markets. CFG Commercial Banking offers its corporate, not-for-profit and institutional clients a broad range of wholesale banking products and services including treasury services, specialty finance, foreign exchange, capital markets and debt syndication.
Risk factors
Set out below is a summary of certain risks which could adversely affect the Group; it should be read in conjunction with the Capital and risk management section of the Business review (pages 164 to 330). This summary should not be regarded as a complete and comprehensive statement of all potential risks and uncertainties. A fuller description of these and other risk factors is included on pages 466 to 484.
| · | The Group is implementing a large number of existing and new programmes and initiatives intended to improve the Group’s capital position, meet legal and regulatory requirements and result in the Group becoming a safer and more competitive, customer focused and profitable bank. These initiatives include, among other things, the execution of the Group’s strategic plan announced in 2013 and 2014 and which includes the implementation of its new divisional and functional structure (the “2013/2014 Strategic Plan”) as well as a major investment programme to upgrade and rationalise the Group’s information technology (“IT”) and operational infrastructure (the “IT and Operational Investment Plan”), further initiatives designed to reduce the size of the Group’s balance sheet and de-risk its business, in particular through the divestments of the Group’s interest in Williams & Glyn, its remaining stake in Citizens Financial Group, Inc (“CFG”) and the “higher risk and capital intensive assets” in RCR as well as a significant restructuring of the Group’s Corporate and Institutional Banking (“CIB”) division and of the Group’s business as a result of the implementation of the regulatory ring-fencing of retail banking operations (the “ring-fence”). Together, these initiatives are referred to as the “Transformation Plan” and present significant risks for the Group, including the following: |
| | ° | The Transformation Plan, and in particular the restructuring of the Group’s CIB business and the divestment of certain of the Group’s portfolios and businesses, including its remaining stake in CFG, are designed to allow the Group to achieve its capital targets. There is no assurance that the Group will be able to successfully implement these initiatives on which its capital plan depends or that it will achieve its goals within the time frames contemplated. |
| | ° | The implementation of the ring-fence will likely result in considerable operational and legal difficulties as it will require significant restructuring of the Group and its businesses with the possible transfer of a large number of customers between new or existing legal entities. This implementation exercise will be complex, costly, will result in significant changes for the Group’s customers and there is no certainty that the Group will be able to implement the ring-fence successfully or in time to meet the regulatory deadline of 2019. |
| | ° | The changes to the Group resulting from the implementation of the Transformation Plan will result in major changes to the Group’s corporate structure, the delivery of its business activities in the UK and other jurisdictions as well as the Group’s business model. Although the goals of the Transformation Plan are for the Group to emerge as a less complex and safer bank, there can be no assurance that the final results will be successful and that the Group will be a viable, competitive, customer focused and profitable bank at the end of this long period of restructuring. |
| | ° | The level of structural change required to implement the Group’s Transformation Plan is likely to be disruptive and increase operational and people risks for the Group. In addition, the Group will incur significant costs in implementing the Transformation Plan and its revenues may also be impacted by lower levels of customer retention and revenue generation following the restructuring of its business and activities. Further, the competitive landscape in which the Group operates is constantly evolving and recent regulatory and legal changes, including ring-fencing, are likely to result in new market participants. These changes, combined with the changes to the Group’s structure and business as a result of the implementation of the Transformation Plan, may result in increased competitive pressures on the Group. |
| | ° | Substantial investments are being made in the Group’s IT and operational structure through targeted investment and rationalisation programmes as part of the IT and Operational Investment Plan. Any failure by the Group to realise the benefits of this IT and Operational Investment Plan, whether on time or at all, could have a material adverse effect on the Group’s business and its ability to retain or grow its customer business and remain competitive. |
| · | The Group’s ability to implement its Transformation Plan and its future success depends on its ability to attract and retain qualified personnel. The Group could fail to attract or retain senior management, which may include members of the Group Board, or other key employees. The Group’s changing strategy has led to the departure of many talented staff. Implementation of the Group’s Transformation Plan, and in particular of the ring-fence and restructuring of the Group’s CIB business, as well as increased legal and regulatory supervision, including the implementation of the new responsibility regime introduced under the Financial services (Banking Reform) Act 2013 in the UK, (the “Banking Reform Act 2013”) including the new Senior Persons Regime, may further hinder the Group’s ability to attract or retain senior management and other skilled personnel. Following the implementation of CRD IV and the Government’s views on variable compensation, there is now a restriction on the Group’s ability to pay individual bonuses greater than fixed remuneration, which may put the Group at a competitive disadvantage. An inability to attract and retain qualified personnel could have an adverse impact on the implementation of the Group’s strategy and regulatory commitments. |
| · | The Group has been, and continues to be, subject to litigation and regulatory and governmental investigations that may impact its business, reputation, results of operations and financial condition. Although the Group settled a number of legal proceedings and regulatory investigations during 2014, the Group is expected to continue to have material exposure to litigation and regulatory proceedings in the medium term. The Group also expects greater regulatory and governmental scrutiny for the foreseeable future particularly as it relates to compliance with historical, existing and new laws and regulations. |
| · | Ahead of the upcoming election in May 2015 in the UK, there is uncertainty around how the policies of the newly elected government may impact the Group, including a possible referendum on the UK’s membership of the EU. The implementation of these policies, including the outcome of the EU referendum, could significantly impact the environment in which the Group operates and the fiscal, monetary, legal and regulatory requirements to which it is subject. |
| · | Operational and reputational risks are inherent in the Group’s businesses, but are heightened as a result of the implementation of the Transformation Plan. Employee misconduct may also result in regulatory sanctions and serious reputational or financial harm to the Group. |
| · | Despite the improved outlook for the global and UK economy over the near to medium-term, actual or perceived difficult global economic conditions, potential volatility in the UK housing market as well as increased competition, particularly in the UK, may create challenging economic and market conditions and a difficult operating environment for the Group’s businesses, as it continues to refocus its operations on the UK. These factors, together with continuing uncertainty relating to the recovery of the Eurozone economy and volatile financial markets, in part due to the monetary and fiscal policies and measures carried out by central banks, have adversely affected and may continue to adversely affect the Group’s businesses, earnings, financial condition and prospects. |
| · | The Group’s business performance, financial condition and capital and liquidity ratios could be adversely affected if its capital is not managed effectively or as a result of increasingly stringent regulatory requirements relating to capital adequacy, including those arising out of the implementation of Basel III or future proposals and the uncertainty arising from the consistent implementation of such rules in the various jurisdictions in which the Group operates. Maintaining adequate capital resources and meeting the requisite capital adequacy requirements may prove increasingly difficult and costly and will depend on the Group’s continued access to funding sources, including following the implementation of the ring-fence, as well as the effective management of its balance sheet and capital resources. |
| · | The Group’s ability to meet its obligations including its funding commitments depends on the Group’s ability to access sources of liquidity and funding. The inability to access liquidity and funding due to market conditions or otherwise or to do so at a reasonable cost, could adversely affect the Group’s financial condition and results of operations. Furthermore, the Group’s borrowing costs and its access to the debt capital markets and other sources of liquidity depend significantly on its and, to a lesser extent the UK Government’s credit ratings. |
| · | The Group is subject to substantial regulation and oversight and although it is difficult to predict with certainty the effect that the recent regulatory changes, developments and heightened levels of public and regulatory scrutiny will have on the Group, the enactment of legislation and regulations in the UK, the EU and the US has resulted in increased capital, funding and liquidity requirements, changes in the competitive landscape, changes in other regulatory requirements and increased operating costs and has impacted, and will continue to impact, products offerings and business models as well as the risks that the Group may be unable to comply with such requirements in the manner or within the timeframes required. A number of reviews and investigations are currently ongoing in the UK and other jurisdictions in which the Group operates which may result in further legislative changes. |
| · | The Group or any of its UK bank subsidiaries may face the risk of full nationalisation or other resolution procedures, including recapitalisation of the Group or any of its UK bank subsidiaries, through the exercise of the bail-in tool which was introduced in the UK by the Banking Reform Act 2013 and implemented in line with the provisions of the Bank Recovery and Resolution Directive. In the event of the failure of the Group, various actions could be taken by or on behalf of the UK Government, including actions in relation to any securities issued, new or existing contractual arrangements and transfers of part or all of the Group’s businesses. |
| · | The Group is highly dependent on its IT systems, which are currently subject to a significant investment and rationalisation programme. The Group has been and expects to continue to be subject to cyber-attacks which expose the Group to loss of customer data or other sensitive information and which, combined with other failures of the Group’s information technology systems, may hinder its ability to service its customers which could result in long-term damage to the Group’s reputation, businesses and brands. |
| · | As a result of the UK Government’s majority shareholding in the Group it is able to exercise a significant degree of influence over the Group including on dividend policy, the election of directors or appointment of senior management, remuneration policy and/or limiting the Group’s operations. The offer or sale by the UK Government of all or a portion of its shareholding in the Company could affect the market price of the equity shares and other securities and acquisitions of ordinary shares by the UK Government (including through conversions of other securities or further purchases of shares) may result in the delisting of the Company from the Official List. |
| · | The Group is required to make planned contributions to its pension schemes and to compensation schemes in respect of certain financial institutions (such as the UK Financial Services Compensation Scheme). Pension contributions may be increased to meet pension deficits or to address additional funding requirements, including those which may arise in connection with the restructuring of the Group’s pension plan as a result of the implementation of the ring-fence. The Group may also be required to make further contributions under resolution financing arrangements applicable to banks and investment firms. Additional or increased contributions may have an adverse impact on the Group’s results of operations, cash flow and financial condition. |
| · | The deterioration of the prevailing economic and market conditions and the actual or perceived failure or worsening credit of the Group’s counterparties or borrowers and depressed asset valuations resulting from poor market conditions, have adversely affected the Group and could continue to adversely affect the Group if, due to a deterioration in economic and financial market conditions or continuing weak economic growth, it were to recognise or realise further write-downs or impairment charges. Changes in interest rates, foreign exchange rates, oil and other commodity prices also impact the value of the Group’s investment and trading portfolios and may have a material adverse effect on the Group’s financial performance and business operations. |
| · | The value of certain financial instruments recorded at fair value is determined using financial models incorporating assumptions, judgements and estimates that may change over time or may ultimately not turn out to be accurate. The Group’s valuation, capital and stress test models and the parameters and assumptions on which they are based rely on market data inputs and need to be constantly updated to ensure their accuracy. Failure of these models to accurately reflect changes in the environment in which the Group operates or the failure to properly input any such changes could have an adverse impact on the modeled results. |
| · | Developments in regulatory or tax legislation could have an effect on how the Group conducts its business and on its results of operations and financial condition, and the recoverability of certain deferred tax assets recognised by the Group is subject to uncertainty. |
| Key financials | | | | | | | |
| | | | | | 2014 | 2013 | 2012 |
| for the year ended 31 December | | | | | £m | £m | £m |
| Total income | | | | | 15,150 | 16,737 | 14,715 |
| Profit/(loss) before impairment losses | | | | | 1,291 | (729) | (1,042) |
| Impairment releases/(losses) | | | | | 1,352 | (8,120) | (5,010) |
| Operating profit/(loss) before tax | | | | | 2,643 | (8,849) | (6,052) |
| Loss attributable to ordinary and B shareholders | | | | | (3,470) | (8,995) | (6,055) |
| Cost:income ratio | | | | | 91% | 104% | 107% |
| Basic earnings/(loss) per ordinary and equivalent B share from | | | | | | | |
| continuing operations (pence) | | | | | 0.5p | (85.0p) | (58.9p) |
| | | | | | | | |
| At 31 December | | | | | 2014 | 2013 | 2012 |
| | | | | | £m | £m | £m |
Funded balance sheet (1) | | | | | 697,173 | 739,839 | 870,392 |
| Total assets | | | | | 1,050,763 | 1,027,878 | 1,312,295 |
| Loans and advances to customers | | | | | 378,238 | 440,722 | 500,135 |
Deposits (2) | | | | | 452,304 | 534,859 | 622,684 |
| Owners' equity | | | | | 57,246 | 58,742 | 68,678 |
Risk asset ratios - Common Equity Tier 1/Core Tier 1 (3) | | | | | 11.2% | 10.9% | 10.3% |
| - Tier 1 | | | | | 11.2% | 13.1% | 12.4% |
| - Total | | | | | 13.7% | 16.5% | 14.5% |
| (1) | Funded balance sheet represents total assets less derivatives. |
| (2) | Comprises deposits by banks and customer accounts. |
| (3) | Common Equity Tier 1 ratio with effect from 1 January 2014. |
Summary consolidated income statement for the year ended 31 December 2014
| | | | | | 2014 | 2013 | 2012 |
| | | | | | £m | £m | £m |
| Net interest income | | | | | 9,258 | 9,017 | 9,356 |
| Fees and commissions receivable | | | | | 4,414 | 4,678 | 4,898 |
| Fees and commissions payable | | | | | (875) | (923) | (818) |
| Other non-interest income | | | | | 2,353 | 3,965 | 1,279 |
| Non-interest income | | | | | 5,892 | 7,720 | 5,359 |
| Total income | | | | | 15,150 | 16,737 | 14,715 |
| Operating expenses | | | | | (13,859) | (17,466) | (15,757) |
| Profit/(loss) before impairment losses | | | | | 1,291 | (729) | (1,042) |
| Impairment releases/(losses) | | | | | 1,352 | (8,120) | (5,010) |
| Operating profit/(loss) before tax | | | | | 2,643 | (8,849) | (6,052) |
| Tax charge | | | | | (1,909) | (186) | (156) |
| Profit/(loss) from continuing operations | | | | | 734 | (9,035) | (6,208) |
| (Loss)/profit from discontinued operations, net of tax | | | | | | | |
| - Citizens | | | | | (3,486) | 410 | 490 |
| - Other | | | | | 41 | 148 | (172) |
| (Loss)/profit from discontinued operations, net of tax | | | | | (3,445) | 558 | 318 |
| Loss for the year | | | | | (2,711) | (8,477) | (5,890) |
| Non-controlling interests | | | | | (60) | (120) | 136 |
| Other owners’ dividends | | | | | (379) | (398) | (301) |
| Dividend Access Share dividend | | | | | (320) | — | — |
| Loss attributable to ordinary and B shareholders | | | | | (3,470) | (8,995) | (6,055) |
Results summary
2014 compared with 2013
Operating profit
Operating profit before tax was £2,643 million compared with a loss of £8,849 million in 2013, benefiting from improved operating results in core businesses together with significant impairment releases in Ulster Bank and RCR. This included a reduction of £929 million in goodwill write down. The loss from discontinued operations of £3,445 million reflected a £3,994 million fair value adjustment in relation to the reclassification of CFG to disposal groups.
Operating profit on a non-statutory basis excludes a gain in relation to own credit adjustments of £146 million (2013 - £120 million), gain on redemption of own debt of £20 million (2013 - £175 million), write down of goodwill of £130 million (2013 - £1,059 million), gain on strategic disposals of £191 million (2013 - £161 million) and RFS MI charge of £24 million (2013 gain - £100 million) and including the results of Citizens, which is classified as a discontinued operation; improved to £3,503 million for 2014, compared with an operating loss of £7,500 million in 2013.
Total income
Total income was £15,150 million, down 9% from 2013, including the impact of lower gains from the redemption of own debt of £20 million in 2014 compared with £175 million in 2013. Improvements in net interest income in PBB and CPB were offset by lower income from trading activities in CIB, in line with its smaller balance sheet and reduced risk profile.
Net interest income
Net interest income increased by 3% to £9,258 million which excluded the impact of CFG.
This mainly reflected improvements in deposit margins in PBB and CPB supported by a larger balance sheet in CFG through purchased portfolios, increased investments and organic growth.
Net interest margin was 2.14%, up from 1.90% in 2013, with improved liability margins partially offset by pressure on mortgage and corporate lending margins and by the continuing shift in mix towards lower margin secured lending.
Non-interest income
Non-interest income declined by £1,828 million or 24% to £5,892 million including lower gains from the redemption of own debt of £20 million compared with £175 million in 2013.
This principally reflects a 46% reduction in income from trading activities in line with CIB's smaller balance sheet and reduced risk profile and lower gains on the disposal of avalilable - for - sale securities in RBS Treasury which were down £575 million to £145 million for 2014.
On a non-statutory basis, non-interest income declined by 18% to £6,923 million.
Net fees and commission fell by 6% principally reflecting declines in CIB and Commercial Banking.
Operating expenses
Operating expenses decreased by £3,607 million or 21% to £13,859 million, including write down of goodwill of £130 million in 2014 compared with £1,059 million in 2013. Operating expenses excluding restructuring costs of £1,257 million (2013 - £656 million) and litigation and conduct costs of £2,194 million (2013 - £3,844 million) declined by £2,558 million, or 20%, to £10,408 million, mainly reflecting cost savings of £1.1 billion.
Litigation and conducts costs totalled £2,194 million compared with £3,844 million in 2013. This included additional provisions for PPI redress (£650 million) in PBB, provisions relating to investigations into the foreign exchange market (£720 million) in CIB, Interest Rate Hedging Product redress (£185 million), the fine relating to the 2012 IT incident (£59 million) booked in Centre and other costs (£580 million) including provisions relating to packaged accounts and investment products.
Restructuring costs increased by £601 million to £1,257 million, including £378 million in relation to Williams & Glyn and a £247 million write-off of intangible assets.
Impairment losses
Net impairment releases of £1,352 million were recorded in 2014 compared with a net impairment charge of £8,120 million which included £4,490 million provisions related to the creation of RCR.
Releases were recorded principally in RCR (£1,306 million) and in Ulster Bank (£365 million), which benefited from favourable economic and market conditions supported by rising Irish property values and proactive debt management. Excluding these releases, the underlying charge was lower at just over £500 million.
On a non-statutory basis net impairment releases were £1,155 million compared with a net impairment charge of £8,432 million in 2013.
Loan impairment releases represented 0.4% of gross loans and advances to customers (excluding repos) compared with loan impairment charges of 2.0% in 2013.
Risk elements in lending represented 7.6% of loans and advances to customers excluding reverse repos, compared with 9.5% the previous year. Provision coverage remained stable at 64%.
Tax
The tax charge of £1,909 million included a net write-off of deferred tax assets of £1.5 billion relating to the UK (£850 million) and the US (£775 million), reflecting the impact of scaling back the CIB operations, partially offset by write-backs relating to Ulster Bank.
Earnings per share
Basic earnings per ordinary and equivalent B share from continuing operations was 0.5p per share compared with a loss of 85.0p per share in 2013.
2013 compared with 2012
Operating loss
Operating loss before tax for the year was £8,849 million compared with £6,052 million in 2012. This reflected £4,529 million lower own credit adjustment partially offset by a £1,041 million higher write-off of goodwill.
Operating loss on a non-statutory basis excludes own credit adjustments a charge of £120 million (2012 - £4,649 million), gain on redemption of own debt of £175 million (2012 - £454 million), write down of goodwill of £1,059 million (2012 - £18 million), a gain on strategic disposals of £161 million (2012 - £113 million), charge from RFS MI of £100 million (2012 – gain of £20 million) and movements in the fair value in 2012 of the Asset Protection Scheme charge of £44 million, and including the results of Citizens was £7,500 million compared with £1,113 million in 2012. The decline in performance primarily related to increased impairment losses resulting from the establishment of RCR, elevated conduct and litigation costs and lower income in CIB.
Total income
Total income increased by 14% to £16,737 million in 2013 principally reflecting a lower accounting charge for own credit of £120 million in 2013 compared with £4,649 million in 2012 offset by lower income in CIB reflecting the smaller balance sheet, reduced risk levels and the uncertain market environment.
Net interest income
Net interest income decreased by 4% to £9,017 million largely reflecting lower interest-earning asset balances partially offset by re-pricing initiatives.
Net interest margin improved by 11 basis points to 1.90% driven by moves to reprice deposits in a number of segments, partially offset by a roll-off in higher yielding securities.
Non-interest income
Non-interest income increased 44% to £7,720 million from £5,359 million in 2012. This included a loss on own credit adjustments of £120 million (2012 - £4,649 million), net gain on redemption of own debt of £175 million (2012 - £454 million) and movements in the fair value of the Asset Protection Scheme resulting in a £44 million charge in 2012.
This was principally driven by lower income from trading activities in CIB as the segment managed down the scale of the balance sheet and reduced risk. This was partially offset by a £506 million improvement in Non-Core trading losses. Operating lease and rental income fell by £392 million, largely reflecting the disposal of RBS Aviation Capital in 2012.
On a non-statutory basis non-interest income decreased by 21% to £8,450 million in 2013.
Operating expenses
Operating expenses increased 11% to £17,466 million from £15,757 million in 2012, including write down of goodwill of £1,059 million (2012 - £18 million). Operating expenses excluding conduct and litigation costs of £3,844 million (2012 - £2,191 million) and integration and restructuring costs of £656 million (2012 - £1,415 million) increased 7% to £12,966 million. This was primarily due to the write-down of other intangible assets, including software, of £344 million related to CIB, partially offset by staff costs down 7% as headcount fell by 4% to 114,900, principally in UK PBB, Ulster Bank, CIB and Non-Core driven by exiting staff and lower central support requirements on run-down.
Litigation and conduct costs of £3,844 million (2012 - £2,191 million), reflected a charge for PPI of £900 million in 2013, a charge of £550 million for redress in relation to certain Interest-Rate Hedging Products sold to small and medium-sized businesses classified as retail clients under FSA rules and charges relating to regulatory and legal actions of £2,394 million, these charges primarily relate to various claims and conduct related matters affecting RBS companies, primarily those related to mortgage-backed securities and securities related litigation.
Integration and restructuring costs were £656 million compared with £1,415 million in 2012 with most of the costs relating to the Retail transformation, a reduction in the size of the CIB segment and programme costs for the EC mandated disposal of certain UK branch-based businesses
Impairment losses
Impairment losses increased by 62% to £8,120 million from £5,010 million in 2012 primarily due to increased charges resulting from the establishment of RCR. Excluding the impact of RCR (£4,490 million), impairment losses fell by 27% to £3,630 million with significant improvements in Non-Core, UK PBB and Ulster Bank partially offset by increases in CIB.
Loan impairments represented 2.0% of gross loans and advances to customers excluding reverse repos compared with 1.1% in 2012.
Risk elements in lending at 31 December 2013 represented 9.5% of loans and advances to customers excluding reverse repos, compared with 9.1% a year earlier. Provision coverage was 64% compared with 52% at 31 December 2012.
Tax
The tax charge was £186 million in 2013 compared with £156 million in 2012. The tax charge for the year reflects losses in low tax regimes (principally Ireland), losses in overseas subsidiaries for which a deferred tax asset has not been recognised (principally Ireland), a reduction in the carrying value of the deferred tax asset in respect of UK losses and the effect of the reduction of 3% in the rate of UK corporation tax enacted in July 2013.
Loss per share
Basic loss per ordinary and equivalent B share from continuing operations was 85.0p per share compared with 58.9p per share in 2012.
Analysis of results
Net interest income
| | | 2014 | 2013 | 2012 |
| | | £m | £m | £m |
Interest receivable (1) | | 13,079 | 14,488 | 16,083 |
| Interest payable | | (3,821) | (5,471) | (6,727) |
| Net interest income | | 9,258 | 9,017 | 9,356 |
| | | | | |
| Yields, spreads and margins of the banking business | | % | % | % |
Gross yield on interest-earning assets of the banking business (2) | | 3.03 | 3.05 | 3.07 |
| Cost of interest-bearing liabilities of the banking business | | (1.26) | (1.51) | (1.63) |
Interest spread of the banking business (3) | | 1.77 | 1.54 | 1.44 |
| Benefit from interest-free funds | | 0.37 | 0.36 | 0.35 |
Net interest margin of the banking business (4) | | 2.14 | 1.90 | 1.79 |
| | | | | |
Gross yield (2) | | | | |
| - Group | | 3.03 | 3.05 | 3.07 |
| - UK | | 3.57 | 3.54 | 3.49 |
| - Overseas | | 1.56 | 1.85 | 2.15 |
Interest spread (3) | | | | |
| - Group | | 1.77 | 1.54 | 1.44 |
| - UK | | 2.34 | 1.99 | 1.83 |
| - Overseas | | 0.11 | 0.47 | 0.63 |
Net interest margin (4) | | | | |
| - Group | | 2.14 | 1.90 | 1.79 |
| - UK | | 2.53 | 2.21 | 2.03 |
| - Overseas | | 1.08 | 1.14 | 1.24 |
| | | | | |
| The Royal Bank of Scotland plc base rate (average) | | 0.50 | 0.50 | 0.50 |
| London inter-bank three month offered rates (average) | | | | |
| - Sterling | | 0.54 | 0.52 | 0.52 |
| - Eurodollar | | 0.23 | 0.24 | 0.24 |
| - Euro | | 0.21 | 0.24 | 0.24 |
| (1) | Interest receivable includes £794 million (2013 - £798 million; 2012 - £565 million) in respect of loan fees forming part of the effective interest rate of loans and receivables. |
| (2) | Gross yield is the interest earned on average interest-earning assets of the banking book. |
| (3) | Interest spread is the difference between the gross yield and the interest rate paid on average interest-bearing liabilities of the banking business. |
| (4) | Net interest margin is net interest income of the banking business as a percentage of average interest-earning assets of the banking business. |
| (5) | The analysis into UK and overseas has been compiled on the basis of location of office. |
| (6) | Interest receivable and interest payable on trading assets and liabilities are included in income from trading activities. |
| (7) | Interest income includes amounts (unwind of discount) recognised on impaired loans and receivables. The average balances of such loans are included in average loans and advances to banks and loans and advances to customers. |
Average balance sheet and related interest
| | | Average | | | | Average | | |
| | | balance | Interest | Rate | | balance | Interest | Rate |
| | | £m | £m | % | | £m | £m | % |
| Assets | | | | | | | | |
| Loans and advances to banks | - UK | 34,592 | 216 | 0.62 | | 42,466 | 261 | 0.61 |
| | - Overseas | 33,383 | 151 | 0.45 | | 30,716 | 172 | 0.56 |
| Loans and advances to customers | - UK | 252,656 | 10,784 | 4.27 | | 256,692 | 11,060 | 4.31 |
| | - Overseas | 72,032 | 1,555 | 2.16 | | 87,822 | 2,105 | 2.40 |
| Debt securities | - UK | 28,626 | 264 | 0.92 | | 38,082 | 624 | 1.64 |
| | - Overseas | 11,030 | 109 | 0.99 | | 19,243 | 266 | 1.38 |
| Interest-earning assets | - UK | 315,874 | 11,264 | 3.57 | | 337,240 | 11,945 | 3.54 |
| | - Overseas | 116,445 | 1,815 | 1.56 | | 137,781 | 2,543 | 1.85 |
| Total interest-earning assets | - banking business | 432,319 | 13,079 | 3.03 | | 475,021 | 14,488 | 3.05 |
| | - trading business (6) | 166,643 | | | | 216,211 | | |
| Interest-earning assets | | 598,962 | | | | 691,232 | | |
| Non-interest-earning assets | | 442,392 | | | | 536,134 | | |
| Total assets | | 1,041,354 | | | | 1,227,366 | | |
| | | | | | | | | |
| Percentage of assets applicable to overseas operations | 27.4% | | | | 33.0% | | |
| | | | | | | | | |
| Liabilities | | | | | | | | |
| Deposits by banks | - UK | 5,860 | 49 | 0.84 | | 7,997 | 144 | 1.80 |
| | - Overseas | 4,327 | 26 | 0.60 | | 14,629 | 133 | 0.91 |
| Customer accounts: demand deposits | - UK | 118,628 | 470 | 0.40 | | 123,707 | 501 | 0.40 |
| | - Overseas | 21,622 | 128 | 0.59 | | 26,229 | 147 | 0.56 |
| Customer accounts: savings deposits | - UK | 85,649 | 710 | 0.83 | | 93,245 | 1,266 | 1.36 |
| | - Overseas | 1,595 | 21 | 1.32 | | 2,131 | 33 | 1.55 |
| Customer accounts: other time deposits | - UK | 17,008 | 278 | 1.63 | | 28,565 | 433 | 1.52 |
| | - Overseas | 9,440 | 162 | 1.72 | | 12,193 | 302 | 2.48 |
| Debt securities in issue | - UK | 33,967 | 985 | 2.90 | | 44,085 | 1,162 | 2.64 |
| | - Overseas | 2,156 | 25 | 1.16 | | 5,002 | 144 | 2.88 |
| Subordinated liabilities | - UK | 18,819 | 684 | 3.63 | | 17,387 | 649 | 3.73 |
| | - Overseas | 3,834 | 192 | 5.01 | | 5,650 | 228 | 4.03 |
| Internal funding of trading business | - UK | (15,426) | 89 | (0.58) | | (24,041) | 348 | (1.45) |
| | - Overseas | (4,635) | 2 | (0.04) | | 4,477 | (19) | (0.42) |
| Interest-bearing liabilities | - UK | 264,505 | 3,265 | 1.23 | | 290,945 | 4,503 | 1.55 |
| | - Overseas | 38,339 | 556 | 1.45 | | 70,311 | 968 | 1.38 |
| Total interest-bearing liabilities | - banking business | 302,844 | 3,821 | 1.26 | | 361,256 | 5,471 | 1.51 |
| | - trading business (6) | 177,156 | | | | 223,264 | | |
| Interest-bearing liabilities | | 480,000 | | | | 584,520 | | |
| Non-interest-bearing liabilities: | | | | | | | | |
| Demand deposits | - UK | 58,060 | | | | 55,303 | | |
| | - Overseas | 11,153 | | | | 5,052 | | |
| Other liabilities | | 430,566 | | | | 513,942 | | |
| Owners' equity | | 61,575 | | | | 68,549 | | |
| Total liabilities and owners' equity | | 1,041,354 | | | | 1,277,366 | | |
| | | | | | | | | |
| Percentage of liabilities applicable to overseas operations | 29.6% | | | | 28.7% | | |
| | | | | | | | | |
| For the notes to this table refer to page 117. | | | | | | | |
Average balance sheet and related interest continued
| | | | | | | Average | | |
| | | | | | | balance | Interest | Rate |
| | | | | | | £m | £m | % |
| Assets | | | | | | | | |
| Loans and advances to banks | - UK | | | | | 33,656 | 248 | 0.74 |
| | - Overseas | | | | | 39,307 | 248 | 0.63 |
| Loans and advances to customers | - UK | | | | | 277,631 | 11,326 | 4.08 |
| | - Overseas | | | | | 96,003 | 2,794 | 2.91 |
| Debt securities | - UK | | | | | 49,872 | 1,015 | 2.04 |
| | - Overseas | | | | | 26,832 | 452 | 1.68 |
| Interest-earning assets | - UK | | | | | 361,159 | 12,589 | 3.49 |
| | - Overseas | | | | | 162,142 | 3,494 | 2.15 |
| Total interest-earning assets | - banking business | | | | | 523,301 | 16,083 | 3.07 |
| | - trading business (5) | | | | | 240,131 | | |
| Interest-earning assets | | | | | | 763,432 | | |
| Non-interest-earning assets | | | | | | 666,940 | | |
| Total assets | | | | | | 1,430,372 | | |
| | | | | | | | | |
| Percentage of assets applicable to overseas operations | | | | | 37.8% | | |
| | | | | | | | | |
| Liabilities | | | | | | | | |
| Deposits by banks | - UK | | | | | 18,347 | 216 | 1.18 |
| | - Overseas | | | | | 16,511 | 197 | 1.19 |
| Customer accounts: demand deposits | - UK | | | | | 121,541 | 643 | 0.53 |
| | - Overseas | | | | | 25,467 | 185 | 0.73 |
| Customer accounts: savings deposits | - UK | | | | | 84,972 | 1,479 | 1.74 |
| | - Overseas | | | | | 2,058 | 44 | 2.14 |
| Customer accounts: other time deposits | - UK | | | | | 35,848 | 522 | 1.46 |
| | - Overseas | | | | | 14,082 | 412 | 2.93 |
| Debt securities in issue | - UK | | | | | 60,709 | 1,681 | 2.77 |
| | - Overseas | | | | | 22,261 | 342 | 1.54 |
| Subordinated liabilities | - UK | | | | | 15,629 | 435 | 2.78 |
| | - Overseas | | | | | 5,329 | 372 | 6.98 |
| Internal funding of trading business | - UK | | | | | (21,140) | 264 | (1.25) |
| | - Overseas | | | | | 11,992 | (65) | (0.54) |
| Interest-bearing liabilities | - UK | | | | | 315,906 | 5,240 | 1.66 |
| | - Overseas | | | | | 97,700 | 1,487 | 1.52 |
| Total interest-bearing liabilities | - banking business | | | | | 413,606 | 6,727 | 1.63 |
| | - trading business (5) | | | | | 248,647 | | |
| Interest-bearing liabilities | | | | | | 662,253 | | |
| Non-interest-bearing liabilities: | | | | | | | | |
| Demand deposits | - UK | | | | | 46,420 | | |
| | - Overseas | | | | | 12,619 | | |
| Other liabilities | | | | | | 635,272 | | |
| Owners' equity | | | | | | 73,808 | | |
| Total liabilities and owners' equity | | | | | | 1,430,372 | | |
| | | | | | | | | |
| Percentage of liabilities applicable to overseas operations | | | | | 33.9% | | |
| | | | | | | | | |
| For the notes to this table refer to page 117. | | | | | | | |
Analysis of change in net interest income - volume and rate analysis
Volume and rate variances have been calculated based on movements in average balances over the period and changes in interest rates on average interest-earning assets and average interest-bearing liabilities. Changes due to a combination of volume and rate are allocated pro rata to volume and rate movements.
| | | 2014 over 2013 |
| | | Increase/(decrease) due to changes in: |
| | | Average | Average | Net |
| | | volume | rate | change |
| | | £m | £m | £m |
| Interest-earning assets | | | | |
| Loans and advances to banks | | | | |
| UK | | (49) | 4 | (45) |
| Overseas | | 14 | (35) | (21) |
| Loans and advances to customers | | | | |
| UK | | (174) | (102) | (276) |
| Overseas | | (353) | (197) | (550) |
| Debt securities | | | | |
| UK | | (130) | (230) | (360) |
| Overseas | | (94) | (63) | (157) |
| Total interest receivable of the banking business | | | | |
| UK | | (353) | (328) | (681) |
| Overseas | | (433) | (295) | (728) |
| | | (786) | (623) | (1,409) |
| | | | | |
| Interest-bearing liabilities | | | | |
| Deposits by banks | | | | |
| UK | | 32 | 63 | 95 |
| Overseas | | 72 | 35 | 107 |
| Customer accounts: demand deposits | | | | |
| UK | | 31 | — | 31 |
| Overseas | | 27 | (8) | 19 |
| Customer accounts: savings deposits | | | | |
| UK | | 96 | 460 | 556 |
| Overseas | | 8 | 4 | 12 |
| Customer accounts: other time deposits | | | | |
| UK | | 185 | (30) | 155 |
| Overseas | | 59 | 81 | 140 |
| Debt securities in issue | | | | |
| UK | | 284 | (107) | 177 |
| Overseas | | 58 | 61 | 119 |
| Subordinated liabilities | | | | |
| UK | | (53) | 18 | (35) |
| Overseas | | 83 | (47) | 36 |
| Internal funding of trading business | | | | |
| UK | | 97 | 162 | 259 |
| Overseas | | (15) | (6) | (21) |
| Total interest payable of the banking business | | | | |
| UK | | 672 | 566 | 1,238 |
| Overseas | | 292 | 120 | 412 |
| | | 964 | 686 | 1,650 |
| | | | | |
| Movement in net interest income | | | | |
| UK | | 319 | 238 | 557 |
| Overseas | | (141) | (175) | (316) |
| | | 178 | 63 | 241 |
| | 2013 over 2012 |
| | Increase/(decrease) due to changes in: |
| | Average | Average | Net |
| | volume | rate | change |
| | £m | £m | £m |
| Interest-earning assets | | | |
| Loans and advances to banks | | | |
| UK | 60 | (47) | 13 |
| Overseas | (50) | (26) | (76) |
| Loans and advances to customers | | | |
| UK | (883) | 617 | (266) |
| Overseas | (225) | (464) | (689) |
| Debt securities | | | |
| UK | (214) | (177) | (391) |
| Overseas | (114) | (72) | (186) |
| Total interest receivable of the banking business | | | |
| UK | (1,037) | 393 | (644) |
| Overseas | (389) | (562) | (951) |
| | (1,426) | (169) | (1,595) |
| | | | |
| Interest-bearing liabilities | | | |
| Deposits by banks | | | |
| UK | 155 | (83) | 72 |
| Overseas | 21 | 43 | 64 |
| Customer accounts: demand deposits | | | |
| UK | (12) | 154 | 142 |
| Overseas | (6) | 44 | 38 |
| Customer accounts: savings deposits | | | |
| UK | (133) | 346 | 213 |
| Overseas | (2) | 13 | 11 |
| Customer accounts: other time deposits | | | |
| UK | 110 | (21) | 89 |
| Overseas | 51 | 59 | 110 |
| Debt securities in issue | | | |
| UK | 443 | 76 | 519 |
| Overseas | 375 | (177) | 198 |
| Subordinated liabilities | | | |
| UK | (53) | (161) | (214) |
| Overseas | (22) | 166 | 144 |
| Internal funding of trading business | | | |
| UK | (39) | (45) | (84) |
| Overseas | (34) | (12) | (46) |
| Total interest payable of the banking business | | | |
| UK | 471 | 266 | 737 |
| Overseas | 383 | 136 | 519 |
| | 854 | 402 | 1,256 |
| | | | |
| Movement in net interest income | | | |
| UK | (566) | 659 | 93 |
| Overseas | (6) | (426) | (432) |
| | (572) | 233 | (339) |
| | | | |
Non-interest income
The following table reconciles the non-statutory basis results (a non-GAAP financial measure) to the statutory results.
| | 2014 | 2013 | 2012 |
| Fees and commissions receivable | £m | £m | £m |
| - non-statutory basis | 5,148 | 5,460 | 5,709 |
| - Citizens | (734) | (782) | (811) |
| Statutory basis | 4,414 | 4,678 | 4,898 |
| | | | |
| Fees and commissions payable | | | |
| - non-statutory basis | (900) | (942) | (833) |
| - Citizens | 25 | 19 | 16 |
| - RFS Holdings minority interest | — | | (1) |
| Statutory basis | (875) | (923) | (818) |
| | | | |
| Income from trading activities | | | |
| - non-statutory basis | 1,422 | 2,651 | 3,533 |
| - own credit adjustments | (40) | 35 | (1,813) |
| - Asset Protection Scheme | — | — | (44) |
| - Citizens | (97) | (114) | (216) |
| - RFS Holdings minority interest | — | (1) | (1) |
| Statutory basis | 1,285 | 2,571 | 1,459 |
| | | | |
| Gain on redemption of own debt - statutory basis | 20 | 175 | 454 |
| | | | |
| Other operating income | | | |
| - non-statutory basis | 1,253 | 1,281 | 2,259 |
| - own credit adjustments | (106) | (155) | (2,836) |
| - strategic disposals | 191 | 161 | 113 |
| - Citizens | (272) | (179) | (169) |
| - RFS Holdings minority interest | (18) | 111 | (1) |
| Statutory basis | 1,048 | 1,219 | (634) |
| | | | |
| Total non-interest income - non-statutory basis | 6,923 | 8,450 | 10,668 |
| | | | |
| Total non-interest income - statutory basis | 5,892 | 7,720 | 5,359 |
2014 compared with 2013
Net fees and commissions fell by 6% principally reflecting declines in CIB and Commercial Banking.
Income from trading activities declined by £1,286 million, or 50%, in line with CIB’s smaller balance sheet and reduced risk profile, reflecting lower gains on the disposal of available-for-sale securities in RBS Treasury, down £575 million to £149 million for 2014 and included higher charges in relation to own credit adjustments of £40 million (2013 - £35 million gain).
The decrease of £171 million in other operating income reflected lower charges in relation to own credit adjustments of £106 million
(2013 - £155 million) and a loss from RFS MI of £18 million (2013 - gain of £111 million).
Liability management exercises undertaken during 2014 resulted in a net gain of £20 million (2013 - £175 million).
2013 compared with 2012
Net fees and commissions fell by 8% principally reflecting declines in CIB, Non-Core, UK PBB and Commercial Banking.
Income from trading activities increased by £1,112 million to £2,571 million principally due the lower charge in relation to own credit adjustment of £1,778 million. A reduction in CIB, where income from trading activities declined by £969 million as the segment managed down the scale of the balance sheet and reduced risk were partially offset by increases in Non-Core.
Other operating income increased to £1,219 million from a loss of £634 million in 2012 predominantly reflecting the lower accounting charges for own credit adjustments of £2,681 million as RBS’s credit profile strengthened. This was partially offset by losses on disposal and value adjustments in Non-Core. In addition, the disposal of RBS Aviation Capital in June 2012 resulted in a £392 million reduction in operating lease income.
Liability management exercises undertaken during 2013 resulted in a net gain of £175 million (2012 - £454 million).
Operating expenses
The following table reconciles the non-statutory basis results (a non-GAAP financial measure) to the statutory results.
| | 2014 | 2013 | 2012 |
| | £m | £m | £m |
| Staff costs | | | |
| - non-statutory basis | 6,406 | 6,882 | 7,377 |
| - integration and restructuring costs | 409 | 280 | 812 |
| - Citizens | (1,058) | (1,077) | (1,038) |
| - RFS Holdings minority interest | — | 1 | (1) |
| Statutory basis | 5,757 | 6,086 | 7,150 |
| | | | |
| Premises and equipment | | | |
| - non-statutory basis | 2,094 | 2,233 | 2,096 |
| - integration and restructuring costs | 280 | 115 | 136 |
| - Citizens | (293) | (310) | (281) |
| Statutory basis | 2,081 | 2,038 | 1,951 |
| | | | |
| Other administrative expenses | | | |
| - non-statutory basis | 2,635 | 3,147 | 3,074 |
| - litigation and conduct costs | 2,194 | 3,844 | 2,191 |
| - integration and restructuring costs | 318 | 255 | 325 |
| - Citizens | (582) | (552) | (664) |
| - RFS Holdings minority interest | 3 | (2) | 3 |
| - Depreciation and amortisation | — | — | — |
| Statutory basis | 4,568 | 6,692 | 4,929 |
| | | | |
| Integration and restructuring costs | | | |
| - non-statutory basis | 1,257 | 656 | 1,415 |
| - staff expenses | (409) | (280) | (812) |
| - premises and equipment | (280) | (115) | (136) |
| - other administrative expenses | (318) | (255) | (325) |
| - Citizens Financial Group discontinued operations | (247) | — | — |
| - depreciation and amortisation | (3) | (6) | (142) |
| Statutory basis | — | — | — |
| | | | |
| Litigation and conduct costs | | | |
| - non-statutory basis | 2,194 | 3,844 | 2,191 |
| - other administrative expenses | (2,194) | (3,844) | (2,191) |
| Statutory basis | — | — | — |
| | | | |
| Administrative expenses - non-statutory | 14,586 | 16,762 | 16,153 |
| Administrative expenses - statutory | 12,406 | 14,816 | 14,030 |
| | | | |
| Depreciation and amortisation | | | |
| - non-statutory basis | 1,107 | 1,404 | 1,660 |
| - Citizens | (180) | (163) | (199) |
| - integration and restructuring costs | 3 | 6 | 142 |
| - other administrative expenses | — | — | — |
| Statutory basis | 930 | 1,247 | 1,603 |
| | | | |
| | | | |
| Write-down of other intangible assets | | | |
| - non-statutory basis | 156 | 344 | 106 |
| - write-off of intangible assets | 247 | — | — |
| - Citizens | (10) | — | — |
| Write-down of goodwill | 130 | 1,059 | 18 |
| Statutory basis | 523 | 1,403 | 124 |
| | | | |
| Operating expenses - non-statutory basis | 15,849 | 18,510 | 17,919 |
| Operating expenses - statutory basis | 13,859 | 17,466 | 15,757 |
| | | | |
| Staff costs as a percentage of total income | 38% | 36% | 49% |
2014 compared with 2013
Operating expenses decreased by £3,607 million or 21% to £13,859 million, including a write down of goodwill of £130 million in 2014 compared with £1,059 million in 2013. Operating expenses excluding restructuring costs of £1,257 million (2013 - £656 million) and litigation and conduct costs of £2,194 million (2013 - £3,844 million) declined by £2,558 million, or 20%, to £10,408 million.
Staff costs declined by 5% and by 1% on a per capita basis against average full time employees.
Restructuring costs increased by £601 million to £1,257 million, including £378 million in relation to Williams & Glyn and a £247 million write-off of intangible assets.
Litigation and conducts costs totalled £2,194 million compared with £3,844 million in 2013. This included additional provisions for Payment Protection Insurance redress (£650 million) in PBB, potential costs following investigations into the foreign exchange market (£720 million) in CIB, Interest Rate Hedging Product redress (£185 million) in Commercial Banking and CIB, the IT incident fine (£59 million) booked in Centre and other costs (£580 million) primarily relating to packaged accounts and investment products.
2013 compared with 2012
Operating expenses increased by £1,709 million, or 11%, including the write down of goodwill and other intangible assets of £1,403 million (2012 - £124 million) which included £1,059 million relating to CIB following an impairment review, partly offset by lower staff numbers principally in UK PBB, Ulster Bank, CIB and Non-Core and reduced central support requirements on run-down.
Staff costs were down 15% at £6,086 million as staff numbers (FTEs) fell by 4% to 99,800 principally in Ulster Bank, UK PBB, CIB and Non-Core.
Integration and restructuring costs of £656 million were down 54% (2012 - £1,415 million).
Litigation and conduct costs totalled £3,844 million, compared with £2,191 million in 2012. This included charges of £2,394 million of regulatory and litigation provisions recorded during the year, primarily relating to mortgage-backed and other securities in the US, a charge for PPI of £900 million and charges of £550 million for redress in relation to certain interest-rate hedging products sold to small and medium sized businesses classified as retail clients under FSA rules.
Impairment losses
The following table reconciles the non-statutory basis results (a non-GAAP financial measure) to the statutory results.
| | 2014 | 2013 | 2012 |
| New impairment (releases)/losses | £m | £m | £m |
| - non-statutory basis | (950) | 8,688 | 5,620 |
| - Citizens | (197) | (442) | (417) |
| Statutory basis | (1,147) | 8,246 | 5,203 |
| Less: recoveries of amounts previously written-off | | | |
| - non-statutory basis | (205) | (256) | (341) |
| - Citizens | — | 130 | 148 |
| Statutory basis | (205) | (126) | (193) |
| (Release)/charge to income statement – non-statutory basis | (1,155) | 8,432 | 5,279 |
| (Release)/charge to income statement - statutory basis | (1,352) | 8,120 | 5,010 |
| | | | |
| Comprising: | | | |
| Loan impairment (releases)/losses | | | |
| - non-statutory basis | (1,170) | 8,412 | 5,315 |
| - Citizens | 194 | 307 | 261 |
| Statutory basis | (1,364) | 8,105 | 5,054 |
| Securities | | | |
| - non-statutory basis | 15 | 20 | (36) |
| - Citizens | (3) | (5) | (8) |
| Statutory basis | 12 | 15 | (44) |
| (Release)/charge to income statement – non-statutory basis | (1,155) | 8,432 | 5,279 |
| (Release)/charge to income statement – statutory basis | (1,352) | 8,120 | 5,010 |
2014 compared with 2013
Net impairment releases of £1,352 million were recorded in 2014 compared with a net impairment losses of £8,120 million in 2013
which included £4,490 million provision related to the creation of RCR.
Releases were recorded principally in RCR (£1,306 million), which benefited from favourable economic and market conditions, and in Ulster Bank (£365 million) supported by rising Irish property values and proactive debt management. Excluding these releases, the underlying charge was low at just over £500 million, primarily in UK PBB (£268 million) and Citizens (£194 million).
Loan impairment provision coverage of REIL remained stable at 64% and REIL now stands at £18.0 billion, a £7.2 billion reduction in the year. Provision coverage of gross loans is 4.4% compared with 6.0% at the end of 2013.
2013 compared with 2012
Net impairment losses were £8,120 million compared to £5,010 million reflecting the increased provisions recognised in connection with the creation of RCR of £4,490 million. Adjusting for this, impairment losses fell by £1,380 million (28%) to £3,630 million, driven by significant improvements in Non-Core, UK PBB and Ulster Bank, partially offset by increases in CIB.
Additional loan impairments arising from the RCR accelerated asset recovery strategy totalled £4,490 million, of which £3,118 million related to Non-Core, £892 million to Ulster Bank and £123 million to Commercial Banking and £355 million to CIB.
Excluding the impact of the creation of RCR, Ulster Bank excluding Non-Core loan impairments fell by £482 million (35%) to £882 million, mainly as a result of continued improvement in retail mortgage debt-flow and in recovery trends. UK PBB loan impairments fell by £243 million (33%), primarily from lower default levels.
Excluding the impact of the creation of RCR, Non-Core loan impairments fell by £792 million to £1,528 million, reflecting the continued reduction in the overall portfolio.
Tax
| | 2014 | 2013 | 2012 |
| | £m | £m | £m |
| Tax charge | (1,909) | (186) | (156) |
| | | | |
| UK corporation tax rate | 21.5% | 23.25% | 24.5% |
2014 compared with 2013
The tax charge for the year ended 31 December 2014 reflects a reduction in the carrying value of the deferred tax asset in respect of UK tax losses (£850 million) and US temporary differences (£775 million) reflecting the impact of the decision to restructure CIB, partially offset by an increase in the carrying value of the deferred tax asset in respect of Irish tax losses, the benefit of previously unrecognised Irish tax losses being offset against profits arising in Ireland during the year and the impact of certain conduct charges that do not qualify for tax relief.
2013 compared with 2012
The tax charge in the year ended 31 December 2013 reflects losses in low tax regimes (principally Ireland), losses in overseas subsidiaries for which a deferred tax asset has not been recognised (principally Ireland), a reduction in the carrying value of the deferred tax asset in respect of UK losses and the effect of the reduction of 3% in the rate of UK corporation tax enacted in July 2013.
Segment performance
Reporting changes
In order to present a more complete picture of funding, operational and business costs of the franchises and operating segments and to improve the transparency of the operating performance of the segments, the following reporting changes have been implemented:
A number of previously reported reconciling items (Payment Protection Insurance costs, Interest Rate Hedging Products redress and related costs, regulatory and legal actions, restructuring costs, amortisation of purchased intangible assets, write-down of other intangibles and bank levy) have now been allocated to the reportable segments. Only the following will now be reported as reconciling items:
| · | Gain on redemption of own debt; |
| · | Asset Protection Scheme; |
| · | Strategic disposals; and |
| · | RFS Holdings minority interest (RFS MI). |
Allocation of costs
As part of its internal reorganisation, RBS has centralised all services and functions. The costs relating to Services and Functions previously reported as direct expenses in the divisions are now reallocated to businesses using appropriate drivers and reported as indirect expenses in the segmental income statements.
Treasury allocations
The basis of allocation of RBS Treasury costs has been amended to align the recovery of funding and hedging costs across RBS and for the transfer of certain assets and their associated costs out of RBS Treasury.
Segmental return on equity
For the purposes of computing segmental return on equity, notional equity is calculated as a percentage of the monthly average of segmental RWAs. Previously, notional equity was allocated at 10% of RWAs after capital deductions (RWAe). This has been revised to 12% of RWAs across all businesses.
Comparatives have been restated accordingly.
| | 2014 | 2013 | 2012 |
| Operating profit/(loss) by segment | £m | £m | £m |
| UK Personal & Business Banking | 1,450 | 819 | 671 |
| Ulster Bank | 606 | (1,609) | (1,133) |
| Personal & Business Banking | 2,056 | (790) | (462) |
| | | | |
| Commercial Banking | 1,290 | 530 | 748 |
| Private Banking | 150 | (61) | 141 |
| Commercial & Private Banking | 1,440 | 469 | 889 |
| | | | |
| Corporate & Institutional Banking | (892) | (2,882) | (247) |
| Central items | (850) | 647 | 845 |
| Citizens Financial Group | 761 | 605 | 760 |
| RCR | 988 | n/a | n/a |
| Non-Core | n/a | (5,549) | (2,898) |
| Operating profit/(loss) - non-statutory basis | 3,503 | (7,500) | (1,113) |
| Own credit adjustments | (146) | (120) | (4,649) |
| Gain on redemption of own debt | 20 | 175 | 454 |
| Write down of goodwill | (130) | (1,059) | (18) |
| Asset Protection Scheme | — | — | (44) |
| Strategic disposals | 191 | 161 | 113 |
| Citizens discontinued operations | (771) | (606) | (775) |
| RFS Holdings minority interest | (24) | 100 | (20) |
| Operating profit/(loss) before tax – statutory basis | 2,643 | (8,849) | (6,052) |
| | | | |
Operating profit/(loss) on a non-statutory basis includes the results of Citizens which are included in discontinued operations in the statutory results.
Segment performance continued
| | 2014 | 2013 | 2012 |
| Impairment (releases)/losses by segment | £m | £m | £m |
| UK Personal & Business Banking | 268 | 501 | 741 |
| Ulster Bank | (365) | 1,774 | 1,364 |
| Personal & Business Banking | (97) | 2,275 | 2,105 |
| | | | |
| Commercial Banking | 76 | 652 | 545 |
| Private Banking | (4) | 29 | 46 |
| Commercial & Private Banking | 72 | 681 | 591 |
| | | | |
| Corporate & Institutional Banking | (9) | 680 | 229 |
| Central items | (12) | 64 | 40 |
| Citizens Financial Group | 197 | 156 | 91 |
| RCR | (1,306) | n/a | n/a |
| Non-Core | n/a | 4,576 | 2,223 |
| Non-statutory impairment l(releases)/losses | (1,155) | 8,432 | 5,279 |
| Reconciling items | | | |
| CFG | (197) | (312) | -269 |
| Statutory basis impairment l(releases)/losses | (1,352) | 8,120 | 5,010 |
| | 2014 | 2013 | 2012 |
| Net interest margin by segment | % | % | % |
| UK Personal & Business Banking | 3.68 | 3.56 | 3.57 |
| Ulster Bank | 2.27 | 1.88 | 1.84 |
| Personal & Business Banking | 3.42 | 3.21 | 3.20 |
| | | | |
| Commercial Banking | 2.74 | 2.64 | 2.66 |
| Private Banking | 3.71 | 3.47 | 3.50 |
| Commercial & Private Banking | 2.93 | 2.81 | 2.83 |
| | | | |
| Corporate & Institutional Banking | 0.99 | 0.80 | 0.78 |
| Citizens Financial Group | 2.88 | 2.91 | 2.98 |
| | | | |
RBS net interest margin (1) | 2.23 | 2.01 | 1.92 |
| | 2014 | 2013 | 2012 |
| Risk-weighted assets by segment | £bn | £bn | £bn |
| UK Personal & Business banking | 42.8 | 51.2 | 53.4 |
| Ulster Bank | 23.8 | 30.7 | 36.1 |
| Personal & Business Banking | 66.6 | 81.9 | 89.5 |
| | | | |
| Commercial Banking | 64.0 | 65.8 | 67.6 |
| Private Banking | 11.5 | 12.0 | 12.3 |
| Commercial & Private Banking | 75.5 | 77.8 | 79.9 |
| | | | |
| Corporate & Institutional Banking | 107.1 | 120.4 | 157.8 |
| Other | 16.3 | 20.1 | 15.5 |
| Citizens Financial Group | 68.4 | 56.1 | 56.5 |
| RCR | 22.0 | n/a | n/a |
| Non-Core | n/a | 29.2 | 60.4 |
| RBS risk-weighted assets | 355.9 | 385.5 | 459.6 |
| (1) On a non-statutory basis. For statutory net interest margin see page 117. |
Segment performance continued Employee numbers at 31 December | | | |
| (full time equivalents rounded to the nearest hundred) | | | |
| | 2014 | 2013 | 2012 |
| UK Personal & Business Banking | 24,800 | 26,600 | 28,300 |
| Ulster Bank | 4,400 | 4,700 | 4,500 |
| Personal & Business Banking | 29,200 | 31,300 | 32,800 |
| | | | |
| Commercial Banking | 6,200 | 7,300 | 6,900 |
| Private Banking | 3,400 | 3,500 | 3,600 |
| Commercial & Private Banking | 9,600 | 10,800 | 10,500 |
| | | | |
| Corporate & Institutional Banking | 3,700 | 4,600 | 5,300 |
| Centre | 10,600 | 11,600 | 11,800 |
| Citizens Financial Group | 17,400 | 18,800 | 18,900 |
| RCR | 700 | n/a | n/a |
| Non-Core | n/a | 1,300 | 2,900 |
| | 71,200 | 78,400 | 82,200 |
| Services | 37,400 | 40,000 | 40,300 |
| Integration and restructuring | 100 | 200 | 500 |
| RBS employee numbers | 108,700 | 118,600 | 123,000 |
| UK Personal & Business Banking | | | |
| | 2014 | 2013 | 2012 |
| Income statement | £m | £m | £m |
| Net interest income | 4,683 | 4,490 | 4,532 |
| Net fees and commissions | 1,287 | 1,309 | 1,349 |
| Other non-interest income | 67 | 14 | 3 |
| Non-interest income | 1,354 | 1,323 | 1,352 |
| Total income | 6,037 | 5,813 | 5,884 |
| Direct expenses | | | |
- staff costs | (892) | (928) | (998) |
- other costs | (380) | (524) | (284) |
| Indirect expenses | (2,027) | (1,954) | (1,861) |
| Restructuring costs | | | |
| - direct | (10) | (118) | (140) |
| - indirect | (92) | (109) | (104) |
| Litigation and conduct costs | (918) | (860) | (1,085) |
| Operating expenses | (4,319) | (4,493) | (4,472) |
| Profit before impairment losses | 1,718 | 1,320 | 1,412 |
| Impairment losses | (268) | (501) | (741) |
| Operating profit | 1,450 | 819 | 671 |
| | | | |
| Analysis of income by product | | | |
| Personal advances | 920 | 923 | 916 |
| Personal deposits | 706 | 468 | 662 |
| Mortgages | 2,600 | 2,605 | 2,367 |
| Cards | 730 | 838 | 864 |
| Business Banking | 1,021 | 973 | 1,075 |
| Other | 60 | 6 | — |
| Total income | 6,037 | 5,813 | 5,884 |
| | | | |
| Analysis of impairments by sector | | | |
| Personal advances | 161 | 179 | 307 |
| Mortgages | (26) | 31 | 92 |
| Business Banking | 53 | 177 | 212 |
| Cards | 80 | 114 | 130 |
Total impairment losses (1) | 268 | 501 | 741 |
| | | | |
| Loan impairment charge as a % of gross customer loans and advances | | | |
| (excluding reverse repurchase agreements) by sector |
| Personal advances | 2.2% | 2.2% | 3.4% |
| Mortgages | — | — | 0.1% |
| Business Banking | 0.4% | 1.2% | 1.4% |
| Cards | 1.6% | 2.0% | 2.3% |
| Total | 0.2% | 0.4% | 0.6% |
| | | | |
| Performance ratios | | | |
Return on equity (2) | 19.4% | 9.8% | 7.4% |
| Net interest margin | 3.68% | 3.56% | 3.57% |
| Cost:income ratio | 72% | 77% | 76% |
| (1) | Includes £2 million in 2013 pertaining to the creation of RCR and related strategy. |
| (2) | Return on equity is based on operating profit after tax divided by average notional equity (based on 12% of the monthly average of segmental RWAs); RWAs in 2013 and 2012 are on a Basel 2.5 basis. |
| (3) | From Q1 2015 business segment return on equity will be calculated based on operating profit after tax adjusted for preference share dividends divided by average notional equity (based on 13% of the monthly average RWAes). At 31 December 2014 the RWAes on this basis were £46.6 billion and the return on equity 16%. |
| | 2014 | 2013 | 2012 |
| Capital and balance sheet | £bn | £bn | £bn |
| Loans and advances to customers (gross) | | | |
- personal advances | 7.4 | 8.1 | 8.9 |
- mortgages | 103.2 | 99.3 | 99.1 |
- business | 14.3 | 14.6 | 15.6 |
- cards | 4.9 | 5.8 | 5.6 |
| Total loans and advance to customers (gross) | 129.8 | 127.8 | 129.2 |
| Loan impairment provisions | (2.6) | (3.0) | (3.4) |
| Net loans and advances to customers | 127.2 | 124.8 | 125.8 |
| | | | |
| Funded assets | 134.3 | 132.2 | 133.0 |
| Total assets | 134.3 | 132.2 | 133.0 |
| Risk elements in lending | 3.8 | 4.7 | 5.8 |
Provision coverage (1) | 69% | 63% | 60% |
| | | | |
| Customer deposits | | | |
| - personal current accounts | 35.9 | 32.5 | 29.0 |
| - personal savings | 81.0 | 82.3 | 78.6 |
| - business/commercial | 31.8 | 30.1 | 27.4 |
| Total customer deposits | 148.7 | 144.9 | 135.0 |
| | | | |
| Assets under management (excluding deposits) | 4.9 | 5.8 | 6.0 |
| Loan:deposit ratio (excluding repos) | 86% | 86% | 93% |
| | | | |
Risk-weighted assets (2) | | | |
| - credit risk (non-counterparty) | 33.4 | 41.4 | 43.2 |
| - operational risk | 9.4 | 9.8 | 10.2 |
| Total risk-weighted assets | 42.8 | 51.2 | 53.4 |
| (1) | Provision coverage represents loan impairment provisions as a percentage of risk elements in lending. |
| (2) | RWAs in for 2013 and 2012 are on a Basel 2.5 basis. RWAs on the end-point CRR basis as at 1 January 2014 were £49.7 billion. |
Key points
The strategic goal of UK PBB is to become the number one personal and business bank for customer service, trust and advocacy in the UK. Throughout 2014, the business has made steady progress in making banking fairer and simpler for its customers through a number of fair banking initiatives and technology investments. Progress made in 2014 by UK PBB included:
Helping customers with their needs:
| · | As the UK’s biggest lender for SMEs, UK PBB continued to offer support to small business customers. Following storms and floods in February 2014, the business introduced a £250 million interest free loan fund for small business to help them get themselves back on their feet. An additional £1 billion Small Business Fund was launched to support small businesses with fee free, fixed rate loans. |
| · | UK PBB has been able to help more customers in 2014. With additional mortgage advisors recruited (up 18% from 630 to 744), gross mortgage lending increased by 37% year on year. The business’s commitment to helping its customers get on and move up the property ladder has been a success and it has now helped almost 15,000 customers buy their first or next home with the government-backed Help to Buy schemes since their launch in May 2013. |
| · | There are now more ways to bank with UK PBB than ever. With services being extended to the Post Office network, customers now have over 13,000 branches and post offices across the UK where they can carry out their every day banking. |
Simpler and fairer products supported by the launch of the ‘Goodbye-Hello’ campaign:
| · | The business committed to responsible and fair lending by removing 0% teaser deals from its offering and introducing the new Clear Rate and cash-back credit cards in 2014. |
| · | Business banking arrangement fees and surprise overdraft fees have been replaced with fixed rates on new business loans and text alerts when customers are overdrawn to keep them on track. |
| · | Service charges have been reviewed and made simpler and fairer for customers. The business re-introduced access to the LINK ATM network for all basic account customers, reduced its daily overdraft fees for all customers, placed a 60 day cap on overdraft charges and improved credit card late fee terms. |
| · | RBS became the first of the main high street banks to ensure all of its savers get the same or better deals as new customers. Those deals are available regardless of how customers choose to bank (e.g. branch, telephony or digital). With just five personal savings products now on sale the range is the simplest on the high street both for customers and for front line staff. Teaser savings rates have been removed and the business is committed to helping customers save for the long term rather than luring them in for the short term. |
Investments in Technology
| · | UK PBB continued with its commitment to invest in technology to make things better for the customer. As its award winning mobile banking application celebrated 5 years, the business received another gold award for the “Pay your Contacts” service, which was named “Best new service of the year” in July at the ‘Best in Biz’ International awards. UK PBB now has over 6.9 million online and mobile banking users, with the mobile app being used more than 23 million times every week. |
| · | Further improvements have been made to the mobile banking application and personal customers are now able to use the new industry-wide Pay-m application that allows customers to receive payments from customers of other participating banks just by providing their mobile number. Customers will no longer have to divulge their sort code and account number to receive payment. Pay-m has already enrolled over 1.8 million customers in the service since its launch at the end of April 2014. WiFi in branches has also been a great success with customers already using the free service over 1 million times since it started in May. |
2014 compared with 2013
UK PBB recorded an operating profit of £1,450 million (2013 - £819 million), up £631 million. Operating profit excluding restructuring costs of £102 million (2013 - £227 million) and litigation and conduct costs of £918 million (2013 - £860 million) totalled £2,470 million compared with £1,906 million in the prior year. This reflected higher income, up 4% to £6,037 million and lower expenses after excluding restructuring of £102 million (2013 - £227 million) and litigation of £918 million (2013 - £860 million), down 3% to £3,299 million, together with substantially lower impairments, down £233 million to £268 million.
Net interest income increased by £193 million or 4% with strong improvements in deposit margins and volume growth. This was partly offset by lower asset margins linked to the continued change in the mix of the loan book towards secured lending and lower mortgage margins.
Non-interest income increased by £31 million or 2%, largely reflecting the transfer of the commercial cards business to UK PBB from CPB in August 2014.
Operating expenses decreased by £174 million or 4%, reflecting lower restructuring costs of £102 million (2013 - £227 million) and litigation and conduct costs of £918 million (2013 - £860 million). Operating expenses excluding these items, declined by £107 million or 3% supported by a 7% reduction in headcount and lower Financial Services Compensation Scheme (FSCS) accruals. Litigation and conduct costs included additional provisions for Payment Protection Insurance redress (£650 million) and other conduct provisions in respect of legacy investment products and packaged account sales.
The net impairment charge was down by 47% to £268 million driven by a further decrease in new default charges together with releases of provisions and recoveries on previously written off debt.
Mortgage balances increased by £3.9 billion or 4%, to £103.2 billion driven by strong performance as advisor capacity increased. Gross new mortgage business increased by 37% to £19.7 billion, representing a market share of 10% with our stock share of 8% continuing to grow.
RWAs to decline of 16% to £42.8 billion with improved credit quality and lower unsecured balances.
2013 compared with 2012
Operating profit increased by 22% to £819 million driven by a 32% decline in impairment losses. Net interest income was broadly stable,
though investment advice income was adversely impacted following changes introduced by the Retail Distribution Review (RDR). Within UK PBB, costs increased primarily because of a higher FSCS levy and other regulatory charges totalling £118 million in the year, conduct-related provisions of £63 million and additional technology investment of £45 million.
Mortgage balance growth in UK PBB was affected in H1 2013 by mortgage advisor training; however, balances recovered during H2 2013 assisted by early adoption of the second phase of the UK Government’s Help To Buy scheme. Gross mortgage lending increased to £8.9 billion in H2 2013. Customer deposits increased by 7%, above the UK market average of 4% due to strong growth in current accounts (12%), personal instant access savings accounts (5%) and business banking deposits (10%).
Net interest income and margin were both broadly flat.
| · | Mortgage new business margins reduced in line with market conditions, overall book margins improved. |
| · | Deposit margins declined reflecting the impact of continued lower rates on current account hedges. Savings margins, however, have increased over 2013 with improved market pricing. |
Non-interest income fell by 2% to £1,323 million due to a change in the fee charging structure in business banking and subdued personal advice income post RDR.
Direct costs increased by 13% due primarily to higher FSCS levy and other regulatory charges. This was partly offset by lower staff costs due to a reduction in headcount of 2,000 in UK PBB. Indirect costs increased by 4%, largely due to investment in technology.
Impairments declined by 32% to £501 million due to lower customer defaults across all product areas reflecting continued improvement in asset quality.
Risk-weighted assets declined by 4% to £51.2 billion largely reflecting balance reductions across the unsecured portfolios and quality improvements
| Ulster Bank | | | |
| | 2014 | 2013 | 2012 |
| Income statement | £m | £m | £m |
| Net interest income | 636 | 619 | 635 |
| Net fees and commissions | 139 | 141 | 145 |
| Other non-interest income | 55 | 99 | 51 |
| Non-interest income | 194 | 240 | 196 |
| Total income | 830 | 859 | 831 |
| Direct expenses | | | |
- staff costs | (247) | (239) | (214) |
- other costs | (74) | (63) | (49) |
| Indirect expenses | (265) | (263) | (267) |
| Restructuring costs | | | |
| - direct | 8 | (27) | (27) |
| - indirect | (30) | (12) | (10) |
| Litigation and conduct costs | 19 | (90) | (33) |
| Operating expenses | (589) | (694) | (600) |
| Profit before impairment releases/(losses) | 241 | 165 | 231 |
| Impairment releases/(losses) | 365 | (1,774) | (1,364) |
| Operating profit/(loss) | 606 | (1,609) | (1,133) |
| | | | |
| Analysis of income by business | | | |
| Corporate | 268 | 315 | 360 |
| Retail | 401 | 408 | 360 |
| Other | 161 | 136 | 111 |
| Total income | 830 | 859 | 831 |
| | | | |
| Analysis of impairments by sector | | | |
| Mortgages | (172) | 235 | 646 |
| Commercial real estate | | | |
| - investment | (16) | 593 | 221 |
| - development | (11) | 153 | 55 |
| Other corporate | (186) | 771 | 389 |
| Other lending | 20 | 22 | 53 |
| Total impairment (releases)/losses (1) | (365) | 1,774 | 1,364 |
| | | | |
Loan impairment (release)/charge as a % of gross customer loans and advances
(excluding reverse repurchase agreements) by sector
| Mortgages | (1.0%) | 1.2% | 3.4% |
| Commercial real estate | | | |
| - investment | (1.6%) | 17.4% | 6.1% |
| - development | (3.7%) | 21.9% | 7.9% |
| Other corporate | (3.8%) | 10.9% | 5.0% |
| Other lending | 2.0% | 1.8% | 4.1% |
| Total | (1.5%) | 5.6% | 4.2% |
| | | | |
| Performance ratios | | | |
Return on equity (2) | 16.1% | (33.2%) | (22.1%) |
| Net interest margin | 2.27% | 1.88% | 1.84% |
| Cost:income ratio | 71% | 81% | 72% |
| (1) | Includes £892 million in 2013 pertaining to the creation of RCR and related strategy. |
| (2) | Return on equity is based on operating profit after tax divided by average notional equity (based on 12% of the monthly average of segmental RWAs; RWAs in 2013 and 2012 are on a Basel 2.5 basis). |
| (3) | From Q1 2015 business segment return on equity will be calculated based on operating profit after tax adjusted for preference share dividends divided by average notional equity (based on 13% of the monthly average RWAes). At 31 December 2014 the RWAes on this basis were £22.3 billion and the return on equity 17.2%. |
| | 2014 | 2013 | 2012 |
| Capital and balance sheet | £bn | £bn | £bn |
| Loans and advances to customers (gross) | | | |
| Mortgages | 17.5 | 19.0 | 19.2 |
| Commercial real estate | | | |
| - investment | 1.0 | 3.4 | 3.6 |
| - development | 0.3 | 0.7 | 0.7 |
| Other corporate | 4.9 | 7.1 | 7.8 |
| Other lending | 1.0 | 1.2 | 1.3 |
| Total loans and advances to customers (gross) | 24.7 | 31.4 | 32.6 |
| Loan impairment provisions | | | |
| - mortgages | (1.4) | (1.7) | (1.5) |
| - commercial real estate | | | |
| - investment | (0.2) | (1.2) | (0.6) |
| - development | (0.2) | (0.3) | (0.2) |
| - other corporate | (0.8) | (2.0) | (1.4) |
| - other lending | (0.1) | (0.2) | (0.2) |
| Total loan impairment provisions | (2.7) | (5.4) | (3.9) |
Net loans and advances to customers (1) | 22.0 | 26.0 | 28.7 |
| | | | |
| Funded assets | 27.5 | 28.0 | 30.6 |
| Total assets | 27.6 | 28.2 | 30.7 |
| Risk elements in lending | | | |
| - mortgages | 3.4 | 3.2 | 3.1 |
| - Commercial real estate | | | |
| - investment | 0.3 | 2.3 | 1.6 |
| - development | 0.2 | 0.5 | 0.4 |
| - other corporate | 0.8 | 2.3 | 2.2 |
| - other lending | 0.1 | 0.2 | 0.2 |
| Total risk elements in lending | 4.8 | 8.5 | 7.5 |
Provision coverage (2) | 57% | 64% | 52% |
| | | | |
| Customer deposits | 20.6 | 21.7 | 22.1 |
| Loan:deposit ratio (excluding repos) | 107% | 120% | 130% |
| | | | |
Risk-weighted assets (3,4) | | | |
| - credit risk | | | |
| - non-counterparty | 22.2 | 28.2 | 33.6 |
| - counterparty | 0.1 | 0.3 | 0.6 |
| - market risk | — | 0.5 | 0.2 |
| - operational risk | 1.5 | 1.7 | 1.7 |
| Total risk-weighted assets | 23.8 | 30.7 | 36.1 |
| | | | |
| Spot exchange rate - €/£ | 1.285 | 1.201 | 1.227 |
| (1) | 31 December 2014 includes £11.4 billion in relation to legacy tracker mortgages. |
| (2) | Provision coverage represents loan impairment provisions as a percentage of risk elements in lending. |
| (3) | RWAs in for 2013 and 2012 are on a Basel 2.5 basis. RWAs on the end-point CRR basis as at 1 January 2014 were £28.2 billion. |
| (4) | 31 December 2014 includes £10.7 billion in relation to legacy tracker mortgages. |
Key points
Following completion of a strategic review, Ulster Bank was confirmed as a core part of RBS reflecting its fit with RBS’s retail and commercial strategy; 2014 saw a return to profitability with significant progress made addressing legacy issues and the strengthening of its core business for the future.
The transfer of £4.4 billion of gross assets to RCR on 1 January 2014 and subsequent deleveraging has enabled Ulster Bank to focus on the development of its core business. This has had a material impact on the comparison of 2014 financial performance with 2013.
Ulster Bank recorded an operating profit of £606 million in 2014, the first annual profit since 2008. This represented a major turnaround from 2013 largely due to impairment releases supported by enhanced collections performance and an improvement in key macroeconomic indicators. Net interest margin also improved and operating expenses were reduced.
Considerable progress was made to improve Ulster Bank’s service offering and to enhance the customer experience. The bank continued to re-shape its distribution network during 2014 while online and mobile banking services were further developed to support the upward trend in digital transactions, which now represent 57% of total transaction volumes. The bank’s ‘Web Chat’ initiative, launched in 2012, is now handling over 15,000 customer enquiries each month. Ulster Bank in Northern Ireland recently launched its ‘Bank on Wheels’ service and extended its partnership with the Post Office which provides customers with 484 new points of presence.
There has been a significant increase in new lending activity during 2014 following the launch of the ‘Big Yes’ mortgage and ‘Ahead for Business' campaigns. New mortgage lending increased by over 40% in 2014 while over £1 billion of new lending was made available to business customers, despite a challenging business environment.
The investment made to support customers in financial difficulty has resulted in a sustained reduction since Q1 2013 in the number of mortgage customers in arrears of 90 days or more and an increase in the number of business customers returning to mainstream management.
2014 compared with 2013
Ulster Bank recorded an operating profit of £606 million in 2014 compared with a loss of £1,609 million in 2013. The turnaround was driven by £365 million net impairment releases compared with impairment losses of £1,774 million in 2013. Operating profit excluding restructuring costs of £22 million (2013 - £39 million) and litigation and conduct provision releases of £19 million (2013 - £90 million) was £609 million compared with a loss of £1,480 million.
Profit before impairment losses was £241 million, £76 million higher than in 2013.
Total income decreased by £29 million to £830 million largely as a result of the non-recurrence of significant hedging gains on the mortgage portfolio in 2013. Net interest income increased by £17 million to £636 million, primarily driven by a significant reduction in the cost of deposits and a benefit from the recognition of income on certain previously non-performing assets, partly offset by the adverse impact on the tracker mortgage book of lower European Central Bank refinancing interest rates. Net interest margin increased 39 basis points to 2.27%.
The continued focus on costs resulted in a reduction in staff numbers and the bank’s property footprint. Litigation and conduct costs decreased by £109 million reflecting the outcome of reviews relating to provisions on PPI and Interest Rate Hedging Products. These benefits were partly offset by higher regulatory charges and levies including a new bank levy introduced in the Republic of Ireland, of £15 million, and the impact of a realignment of costs following the creation of RCR, £44 million.
The transfer of assets to RCR coupled with improved credit quality across key portfolios resulted in a 44% reduction in risk elements in lending. Provision coverage reduced from 64% to 57% during 2014 reflecting the further de-risking of the balance sheet coupled with the impact of an increase in asset values. RWAs decreased by 22% reflecting an improvement in credit metrics and a reduced loan book.
The loan:deposit ratio decreased from 120% to 107% during 2014 mainly due to a 15% reduction in net loan balances to £22 billion reflecting the transfer of assets to RCR and continued customer deleveraging partly offset by growth in new lending. Customer deposits declined by 5% largely driven by exchange rate movements.
2013 compared with 2012
Excluding the impact of the creation of RCR, operating result improved by £435 million or 38% primarily due to a higher income and lower impairment losses on the mortgage portfolio.
Total income increased by £28 million or 3% to £859 million primarily reflecting hedging gains on the mortgage portfolio. Net interest margin for 2013 increased by 4 basis points to 1.88% although net interest income was £16 million lower at £619 million, largely driven by lower interest earning assets and a higher cost of funding.
Total expenses increased by £94 million or 16% to £694 million driven by the costs of mandatory change programmes such as the Single Euro Payment Area, £18 million, an investment of £10 million in programmes to support customers in financial difficulty and an accelerated depreciation charge of £12 million. Litigation and conduct costs were £57m higher in 2013 due to increased provisions made for legacy issues including PPI and interest rate hedging product redress and administration.
Impairment losses, excluding the impact of RCR, were lower by £482 million or 35%. This was predominantly due to a sharp reduction in losses on the mortgage portfolio which reduced by £411 million or 64% due to a decline in arrears levels driven by an improved collections performance and the development of programmes to assist customers in financial difficulty, coupled with stabilising residential property prices.
The loan:deposit ratio reduced from 130% to 120% during 2013 reflecting continued customer deleveraging and low levels of demand for new lending. Retail and SME deposit balances increased by 2% during 2013, offset by a reduction in wholesale customer balances, resulting in a 2% decline in total deposit balances.
Risk-weighted assets decreased by 15% reflecting a smaller performing loan book and stabilising credit metrics.
| Commercial Banking | | | |
| | 2014 | 2013 | 2012 |
| Income statement | £m | £m | £m |
| Net interest income | 2,041 | 1,962 | 1,969 |
| Net fees and commissions | 885 | 944 | 981 |
| Other non-interest income | 284 | 251 | 370 |
| Non-interest income | 1,169 | 1,195 | 1,351 |
| Total income | 3,210 | 3,157 | 3,320 |
| Direct expenses | | | |
- staff costs | (508) | (513) | (533) |
- other costs | (249) | (269) | (261) |
| Indirect expenses | (882) | (891) | (780) |
| Restructuring costs | | | |
| - direct | (40) | (18) | (71) |
| - indirect | (53) | (37) | (39) |
| Litigation and conduct costs | (112) | (247) | (343) |
| Operating expenses | (1,844) | (1,975) | (2,027) |
| Profit before impairment losses | 1,366 | 1,182 | 1,293 |
| Impairment losses | (76) | (652) | (545) |
| Operating profit | 1,290 | 530 | 748 |
| | | | |
| Analysis of income by business | | | |
| Commercial lending | 1,830 | 1,911 | 1,934 |
| Deposits | 353 | 208 | 350 |
| Asset and invoice finance | 740 | 671 | 686 |
| Other | 287 | 367 | 350 |
| Total income | 3,210 | 3,157 | 3,320 |
| | | | |
| Analysis of impairments by sector | | | |
| Commercial real estate | (2) | 431 | 317 |
| Asset and invoice finance | 11 | 31 | 41 |
| Private sector education, health, social work, recreational and community services | (8) | 125 | 33 |
| Banks & financial institutions | — | 10 | 12 |
| Wholesale and retail trade repairs | 20 | 9 | 57 |
| Hotels and restaurants | 7 | 28 | 45 |
| Manufacturing | 10 | 1 | 8 |
| Construction | 9 | (2) | 14 |
| Other | 29 | 19 | 18 |
Total impairment losses (1) | 76 | 652 | 545 |
| | | | |
| | | | |
| Loan impairment charge as a % of gross customer loans and advances by sector | | | |
| Commercial real estate | — | 2.1% | 1.4% |
| Asset and invoice finance | 0.1% | 0.3% | 0.4% |
| Private sector education, health, social work, recreational and community services | (0.1%) | 1.6% | 0.4% |
| Banks & financial institutions | — | 0.1% | 0.2% |
| Wholesale and retail trade repairs | 0.3% | 0.2% | 1.0% |
| Hotels and restaurants | 0.2% | 0.8% | 1.0% |
| Manufacturing | 0.3% | — | 0.2% |
| Construction | 0.5% | (0.1%) | 0.6% |
| Other | 0.1% | 0.1% | 0.1% |
| Total | 0.1% | 0.8% | 0.6% |
| (1) | Includes £123 million in 2013 pertaining to the creation of RCR and related strategy. |
| | 2014 | 2013 | 2012 |
| Performance ratios | £bn | £bn | £bn |
Return on equity (1) | 12.6% | 4.9% | 7.5% |
| Net interest margin | 2.74% | 2.64% | 2.66% |
| Cost:income ratio | 57% | 63% | 61% |
| | | | |
| Capital and balance sheet | | | |
| Loans and advances to customers (gross) | | | |
| - commercial real estate | 18.3 | 20.2 | 23.1 |
| - asset and invoice finance | 14.2 | 11.7 | 11.2 |
| - private sector education, health, social work, recreational and community services | 6.9 | 7.9 | 7.7 |
| - banks & financial institutions | 7.0 | 6.9 | 6.3 |
| - wholesale and retail trade repairs | 6.0 | 5.8 | 6.0 |
| - hotels and restaurants | 3.4 | 3.6 | 4.4 |
| - manufacturing | 3.7 | 3.7 | 4.0 |
| - construction | 1.9 | 2.1 | 2.5 |
| - other | 24.7 | 23.1 | 20.0 |
| Total loans and advances to customers (gross) | 86.1 | 85.0 | 85.2 |
| Loan impairment provisions | (1.0) | (1.5) | (1.6) |
Net loans and advances to customers (2) | 85.1 | 83.5 | 83.6 |
| | | | |
| Funded assets | 89.4 | 87.9 | 88.3 |
| Total assets | 89.4 | 87.9 | 88.3 |
| Risk elements in lending | 2.5 | 4.3 | 4.0 |
Provision coverage (3) | 38% | 38% | 39% |
| | | | |
| Customer deposits (excluding repos) | 86.8 | 90.7 | 92.0 |
| Loan:deposit ratio (excluding repos) | 98% | 92% | 91% |
| | | | |
Risk-weighted assets (4) | | | |
| - credit risk (non-counterparty) | 57.6 | 59.7 | 61.5 |
| - operational risk | 6.4 | 6.1 | 6.1 |
| Total risk-weighted assets | 64.0 | 65.8 | 67.6 |
| (1) | Return on equity is based on operating profit after tax divided by average notional equity (based on 12% of the monthly average of segmental RWAs; RWAs in 2013 and 2012 are on a Basel 2.5 basis). |
| (2) | December 2014 includes £15 billion third party assets and £12 billion risk-weighted asset equivalents in relation to the run-down legacy book. |
| (3) | Provision coverage represents loan impairment provisions as a percentage of risk elements in lending. |
| (4) | RWAs in for 2013 and 2012 are on a Basel 2.5 basis. RWAs on the end-point CRR basis as at 1 January 2014 were £61.5 billion. |
| (5) | From Q1 2015 business segment return on equity will be calculated based on operating profit after tax adjusted for preference share dividends divided by average notional equity (based on 13% of the monthly average RWAes). At 31 December 2014 the RWAes on this basis were £69.8 billion and the return on equity 9.5%. |
Key points
Commercial Banking implemented a simplified and delayered management structure in 2014. With over 120 products removed from sale and over 400 process improvements implemented, the segment is becoming easier to do business with.
Tangible progress is being made via a bank-wide strategic lending programme which will transform the end-to-end customer lending experience, ensuring faster decisions and a smoother application process. Over the year there has been an improvement in the Net Promoter Score and rating of overall service quality across the business, together with a continuing fall in complaints.
Commercial Banking continues to back UK businesses and communities, with over 8,400 Statement of Appetite letters issued in 2014 at a total value of £4.7 billion. As part of our plan to support entrepreneurs across the UK, the first of eight accelerator hubs opened in February 2015, offering free space, support and advice to high growth business owners. A series of customer campaigns were launched, proactively engaging customers on their international and asset finance needs.
Significant progress has been made to drive connectivity across the bank, with a focus on providing employees with the skills and tools they need to serve customers better. This has included investment in professional qualifications as well as the development of a suite of banking tools to be rolled out in 2015. The alignment of Commercial & Private Banking continues to yield benefits, with a pilot resulting in over 140 referrals between the businesses.
2014 compared with 2013
Commercial Banking recorded an operating profit of £1,290 million compared with £530 million in the prior year. This was driven by lower net impairment losses, down £576 million, lower operating expenses, down £131 million and higher income, up £53 million. Operating profit excluding restructuring costs of £93 million (2013 - £55 million) and litigation and conduct costs of £112 million (2013 - £247 million) increased by £663 million to £1,495 million.
Net interest income increased by £79 million or 4%, largely reflecting re-pricing activity on deposits partly offset by the impact of reduced asset margins, a result of the net transfer in of lower margin legacy loans (after the cessation of Non-Core).
Non-interest income was down £26 million or 2% as lower Corporate & Institutional Banking revenue share income, restructuring fees and the transfer out of commercial cards income to UK Personal & Business Banking in August 2014 were only partially offset by higher fair value gains and operating lease income, along with lower close out costs of interest rate products associated with impaired loans.
Operating expenses were down £131 million or 7%, as a result of lower litigation and conduct costs of £112 million (2013 - £247 million), primarily relating to interest rate swap redress, and lower underlying direct costs reflecting the continued focus on cost saving. These reductions were partially offset by higher restructuring costs of £93 million (2013 - £55 million), as the business aligns itself to better support customers, and growth in operating lease depreciation. Operating expenses excluding restructuring costs and litigation and conduct costs declined by £34 million.
Net impairment losses declined £576 million to £76 million, as 2013 included the impact of the creation of RCR. Excluding the RCR charges, underlying impairments declined by £453 million with fewer individual cases across the portfolio, reduced collectively assessed provisions and higher latent provision releases, reflecting improved credit conditions.
The loan:deposit ratio increased to 98%, from reduced deposits, down 4%, reflecting the rebalancing of the bank’s liquidity position, and a 2% increase in net loans and advances, as reductions in the commercial real estate and restructuring portfolio were offset by growth across other businesses.
RWAs were £1.8 billion lower at £64.0 billion, primarily reflecting net transfers to RCR, effective 1 January 2014, and improving credit quality on the back of UK economic recovery, offset by loan growth.
2013 compared with 2012
Operating profit decreased by £218 million to £530 million (a return on equity of 4.9%), driven by lower income, higher impairments and indirect costs partly offset by lower restructuring, litigation and conduct costs.
Net interest income was in line with 2012 as increased income from re-pricing initiatives and higher average lending volumes offset the impact of the lower rate environment on deposit returns and the non-repeat of 2012 deferred income recognition revisions (£28 million).
Non-interest income decreased by 12% primarily from lower CIB revenue share income, a decline in operating lease income (offset by an associated reduction of operating lease depreciation in expenses), lower lending fees and higher costs arising from closing out interest rate hedging products associated with impaired loans.
Total expenses declined by 3% or £52 million, driven by lower restructuring, litigation and conduct costs partially offset by higher indirect expenses. Direct costs were down £12 million from reduced staff costs, a decline in operating lease depreciation and lower CIB revenue share related costs.
Impairments increased by £107 million primarily relating to higher commercial real estate impairment losses. Full year impairments include the additional impact of increased impairments losses related to the creation of RCR (£123 million) in Q4 2013.
The loan:deposit ratio increased by 100 basis points primarily from lower deposit volumes following re-pricing initiatives in line with the wider bank funding strategy.
Risk-weighted assets decreased by 3% as net movements into default more than offset increases resulting from the implementation of risk model changes.
| Private Banking | | | |
| | 2014 | 2013 | 2012 |
| Income statement | £m | £m | £m |
| Net interest income | 691 | 658 | 676 |
| Net fees and commissions | 335 | 355 | 366 |
| Other non-interest income | 56 | 64 | 84 |
| Non-interest income | 391 | 419 | 450 |
| Total income | 1,082 | 1,077 | 1,126 |
| Direct expenses | | | |
- staff costs | (317) | (317) | (319) |
- other costs | (72) | (84) | (110) |
| Indirect expenses | (439) | (475) | (475) |
| Restructuring costs | | | |
| - direct | (8) | (18) | (12) |
| - indirect | (10) | (9) | (16) |
| Litigation and conduct costs | (90) | (206) | (7) |
| Operating expenses | (936) | (1,109) | (939) |
| Profit/(loss) before impairment losses | 146 | (32) | 187 |
| Impairment releases/(losses) | 4 | (29) | (46) |
| Operating profit/(loss) | 150 | (61) | 141 |
| | | | |
| | | | |
Of which: international private banking activities (1) | | | |
| Total income | 274 | 318 | |
| Operating expenses | (284) | (385) | |
| Impairment losses | — | (20) | |
| Operating loss | (10) | (87) | |
| | | | |
| Analysis of income by business | | | |
| Investments | 176 | 198 | 214 |
| Banking | 906 | 879 | 912 |
| Total income | 1,082 | 1,077 | 1,126 |
| | | | |
| Performance ratios | | | |
Return on equity (2) | 7.8% | (3.1%) | 7.1% |
| Net interest margin | 3.71% | 3.47% | 3.50% |
| Cost:income ratio | 87% | 103% | 83% |
| (1) | Private banking and wealth management activities outside of the British Isles, broadly indicative of the businesses being exited. |
| (2) | Return on equity is based on operating profit after tax divided by average notional equity (based on 12% of the monthly average of segmental RWAs; RWAs in 2013 and 2012 are on a Basel 2.5 basis). |
| (3) | From Q1 2015 business segment return on equity will be calculated based on operating profit after tax adjusted for preference share dividends divided by average notional equity (based on 13% of the monthly average RWAes). At 31 December 2014 the RWAes on this basis were £11.5 billion and the return on equity 6.1%. |
| | 2014 | 2013 | 2012 |
| Capital and balance sheet | £bn | £bn | £bn |
| Loans and advances to customers (gross) | | | |
| - personal | 5.4 | 5.5 | 5.5 |
| - mortgages | 8.9 | 8.7 | 8.8 |
| - other | 2.3 | 2.6 | 2.8 |
| Total loans and advances to customers (gross) | 16.6 | 16.8 | 17.1 |
| Loan impairment provisions | (0.1) | (0.1) | (0.1) |
| Net loans and advances to customers | 16.5 | 16.7 | 17.0 |
| | | | |
| Funded assets | 20.4 | 21.0 | 21.4 |
| Total assets | 20.5 | 21.2 | 21.5 |
| Assets under management | 28.3 | 29.7 | 28.9 |
| Risk elements in lending | 0.2 | 0.3 | 0.2 |
Provision coverage (1) | 34% | 43% | 44% |
| | | | |
| Customer deposits (excluding repos) | 36.1 | 37.2 | 38.9 |
| Loan:deposit ratio | 46% | 45% | 44% |
| | | | |
Risk-weighted assets (2) | | | |
| - credit risk | | | |
| - non-counterparty | 9.5 | 10.0 | 10.3 |
| - counterparty | 0.1 | — | — |
| - market risk | — | 0.1 | 0.1 |
| - operational risk | 1.9 | 1.9 | 1.9 |
| Total risk-weighted assets | 11.5 | 12.0 | 12.3 |
| | | | |
Of which: international private banking activities (3) | | | |
| Net loans and advances to customers | 3.9 | 4.0 | |
| Assets under management | 15.6 | 16.5 | |
| Customer deposits (excluding repos) | 8.6 | 9.3 | |
Risk-weighted assets (2) | 2.7 | 2.5 | |
| (1) | Provision coverage represents loan impairment provisions as a percentage of risk elements in lending. |
| (2) | RWAs in for 2013 and 2012 are on a Basel 2.5 basis. RWAs on the end-point CRR basis at 1 January 2014 were £12.0 billion. |
| (3) | Private banking and wealth management activities outside of the British Isles, broadly indicative of the businesses being exited. |
Key points
During 2014, Private Banking has continued to provide excellent service to clients against the background of a major business review and significant organisational change.
Following the announcement of RBS’s new strategy in February 2014, Private Banking set out a new vision and strategic direction in August. Coutts and Adam & Company will focus on growing the UK based high net worth client franchise. All private banking and wealth management activities where the primary relationship management is conducted outside the British Isles will be exited to align better with RBS’s stated UK focus.
The ambition of the business is to be the leading UK based private bank and wealth manager for wealthy individuals seeking exceptional private banking and wealth management. Private Banking has gathered significant momentum behind its ambition, supported by a straightforward plan centred around five key priorities: an improved banking proposition; a refocused advice and wealth management model; an enhanced proposition for international clients managed from the UK; an integrated client approach across RBS; and increased client engagement.
Since September, good progress has been made towards the sale of the business outside the British Isles. A primary focus of the transaction is to execute the deal with minimal disruption for clients and staff.
Private Banking has made tangible steps towards working more closely with Commercial Banking, which includes an energetic approach to client cross referrals as well as functional synergies.
The business has progressed well against key priorities in 2014. Improvements are evidenced by several industry awards including: ‘Best private bank in the UK’ (PWM/The Banker) and ’Most innovative digital offering’ (Private Banker International). Coutts continues to be recognised as a leader in philanthropy, with its’ $1 million donors’ report receiving significant media coverage, and its expertise as an adviser for family businesses and entrepreneurs remains a strong point of differentiation.
2014 compared with 2013
Private Banking recorded an operating profit of £150 million compared with a loss of £61 million in the prior year. This was driven by reduced operating expenses, down £173 million, net impairment releases of £4 million compared with a net £29 million loss in 2013, and higher income, up £5 million. Operating profit excluding restructuring costs of £18 million (2013 - £27 million) and litigation and conduct costs of £90 million (2013 - £206 million) increased by £86 million to £258 million.
Net interest income increased by £33 million or 5% as improved deposit margin reflected the full year impact of the 2013 deposit re-pricing initiative.
Non-interest income was down £28 million or 7%, with lower transactional and investment activity due to subdued market volatility across the international business.
Operating expenses declined by £173 million or 16% primarily driven by lower restructuring and litigation and conduct costs. Operating expenses excluding restructuring costs of £18 million (2013 - £27 million) and litigation and conduct costs of £90 million (2013 - £206 million) declined by £48 million or 5% to £828 million, reflecting lower technology costs and one-off benefits from the exit of a number of London properties.
Net impairment releases of £4 million, compared with a net impairment loss of £29 million in the prior year reflected the non-repeat of a single £20 million provision, coupled with improved economic conditions and higher UK property prices.
Client deposits decreased by £1.1 billion or 3% reflecting the rebalancing of the bank’s liquidity position.
Assets under management decreased by £1.4 billion or 5% to £28.3 billion, driven by low margin custody outflows.
2013 compared with 2012
There was an operating loss of £61 million in 2013 compared with an operating profit of £141 million in 2012, principally driven by an increase in litigation and conduct costs, with lower income offsetting lower direct costs and lower impairments.
Total income declined by 4% to £1,077 million, with a full year reduction in net interest income reflecting the lower spread earned on deposits as a result of the lower interest rate environment.
Non-interest income fell by 7% to £419 million due to the disposal of the Latin American, Caribbean and African businesses for a profit of £15 million in the first half of 2012 together with a decline in fee income in the International business.
Total expenses increased by £170 million driven by litigation and conduct costs increase of £199 million, partly offset by lower direct costs as a result of reduced headcount, continued discretionary cost management and the non-recurrence of two regulatory fines totalling £26 million incurred during 2012. This was partially offset by a one-off UK tax treaty charge in the International business.
Impairments were £17 million lower at £29 million, largely reflecting a small number of specific impairments.
Client assets and liabilities managed by the division declined by 2%, with a £1.7 billion reduction in deposits following re-pricing initiatives in the UK in line with the wider bank funding strategy. Assets under management increased by 3% due to positive market movements. Lending was 2% lower, reflecting increased levels of repayments in the UK.
| Corporate & Institutional Banking | | | |
| | 2014 | 2013 | 2012 |
| Income statement | £m | £m | £m |
| Net interest income from banking activities | 817 | 684 | 816 |
| Net fees and commissions | 972 | 1,109 | 1,310 |
| Income from trading activities | 2,023 | 3,074 | 4,043 |
| Other operating income | 137 | 141 | 242 |
| Non-interest income | 3,132 | 4,324 | 5,595 |
| Total income | 3,949 | 5,008 | 6,411 |
| Direct expenses | | | |
- staff costs | (729) | (979) | (1,358) |
- other costs | (400) | (688) | (520) |
| Indirect expenses | (2,432) | (2,900) | (2,846) |
| Restructuring costs | | | |
| - direct | (93) | (76) | (411) |
| - indirect | (202) | (126) | (571) |
| Litigation and conduct costs | (994) | (2,441) | (723) |
| Operating expenses | (4,850) | (7,210) | (6,429) |
| Loss before impairment releases/(losses) | (901) | (2,202) | (18) |
| Impairment releases/(losses) | 9 | (680) | (229) |
| Operating loss | (892) | (2,882) | (247) |
| | | | |
| | | | |
| | | | |
| Analysis of income by product | | | |
| Rates | 975 | 1,075 | 1,843 |
| Currencies | 754 | 903 | 706 |
| Credit | 1,088 | 1,639 | 2,067 |
| Global Transaction Services | 818 | 881 | 1,021 |
| Portfolio | 653 | 623 | 724 |
| Total (excluding revenue share and run-off businesses) | 4,288 | 5,121 | 6,361 |
| Inter-segment revenue share | (236) | (261) | (322) |
| Run-off businesses | (103) | 148 | 372 |
| Total income | 3,949 | 5,008 | 6,411 |
| | | | |
| Performance ratios | | | |
Return on equity (1) | (4.2%) | (12.9%) | (1.0%) |
| Net interest margin | 0.99% | 0.80% | 0.78% |
| Cost:income ratio | 123% | 144% | 100% |
| (1) | Return on equity is based on operating profit after tax divided by average notional equity (based on 12% of the monthly average of the RWAs; RWAs in 2013 and 2012 are on a Basel 2.5 basis). |
| (2) | From Q1 2015 business segment return on equity will be calculated based on operating profit after tax adjusted for preference share dividends divided by average notional equity (based on 13% of the monthly average RWAes). At 31 December 2014 the RWAes on this basis were £108.9 billion and the return on equity (4.8%). |
| | 2014 | 2013 | 2012 |
| Capital and balance sheet | £bn | £bn | £bn |
| Loans and advances to customers (gross, excluding reverse repos) | 73.0 | 69.1 | 80.2 |
| Loan impairment provisions | (0.2) | (0.9) | (0.6) |
| Total loans and advances to customers (excluding reverse repos) | 72.8 | 68.2 | 79.6 |
Net loans and advances to banks (excluding reverse repos) (1) | 16.9 | 20.5 | 21.4 |
| Reverse repos | 61.6 | 76.2 | 103.8 |
| Securities | 57.0 | 72.1 | 95.0 |
| Cash and eligible bills | 23.2 | 20.6 | 30.6 |
| Other | 9.6 | 11.0 | 15.3 |
| | | | |
| Funded assets | 241.1 | 268.6 | 345.7 |
| Total assets | 577.2 | 551.2 | 775.5 |
Provision coverage (2) | 105% | 59% | 68% |
| | | | |
| Customer deposits (excluding repos) | 59.4 | 64.8 | 80.2 |
| Bank deposits (excluding repos) | 33.3 | 30.2 | 51.0 |
| Repos | 61.1 | 74.8 | 120.4 |
| Debt securities in issue | 14.1 | 21.5 | 32.6 |
| Loan:deposit ratio (excluding repos) | 122% | 105% | 99% |
| | | | |
Risk-weighted assets (3) | | | |
| - credit risk | | | |
| - non-counterparty | 51.3 | 61.8 | 65.1 |
| - counterparty | 25.1 | 17.5 | 34.7 |
| - market risk | 18.9 | 26.4 | 36.9 |
| - operational risk | 11.8 | 14.7 | 21.1 |
| Total risk-weighted assets | 107.1 | 120.4 | 157.8 |
| (1) | Excludes disposal groups. |
| (2) | Provision coverage represents loan impairment provisions as a percentage of risk elements in lending. |
| (3) | RWAs in 2013 and 2012 are on a Basel 2.5 basis. RWAs on the end-point CRR basis as at 1 January 2014 were £147.1 billion. |
Key points
Corporate & Institutional Banking (CIB) focused on its strengths in core product areas during 2014, reducing the scale of the business and simplifying the operating model. This allowed CIB to better serve customers while deploying fewer resources. The commitment to customers was demonstrated by the award of The Banker’s Most Innovative Bank in Risk Management in Q3 2014 and by winning IFR magazine’s Sterling Bond House of the year award in Q4 2014. The drive to concentrate on core products is evidenced by the 27% fall in RWAs (compared with 1 January 2014 on a CRR basis) and the 22% year on year fall in expenses excluding litigation and conduct costs of £994 million (2013 - £2,441 million) and restructuring costs of £295 million (2013 - £202 million).
2014 compared with 2013
CIB recorded an operating loss of £892 million compared with a loss of £2,882 million in 2013. This included litigation and conduct costs of £994 million compared with £2,441 million a year before. The operating result excluding these litigation and conduct costs and restructuring costs improved from a loss of £239 million in 2013 to a profit of £397 million in 2014. This movement was primarily driven by substantial reductions in expenses, partially offset by lower income. Net impairment releases totalled £9 million compared with a net impairment charge of £680 million in 2013.
Total income declined by 21%, reflecting reduced deployment of resources and difficult trading conditions, characterised by subdued levels of client activity and limited market volatility:
| · | Rates suffered from a weak trading performance in Q4 2014. This, combined with subdued client flow and balance sheet de-risking, reduced income. |
| · | Currencies income declined in a highly competitive market as both market volatility and client activity remained subdued for much of the year. Some volatility returned in Q4 2014, boosting income in the Options business in particular. |
| · | Credit reduced RWAs by 61% in 2014, including the wind-down of Credit Trading and the US asset- backed products (ABP) business. This impacted income, as did the year on year weakening in corporate investment grade debt capital market issuance in EMEA. |
| · | Income from Global Transaction Services dipped by 7%, primarily as a result of the disposal of the Global Travel Money Service business in Q4 2013. The underlying business was stable. |
| · | Run-off and recovery businesses incurred a loss of £103 million. |
Operating expenses fell by £2,360 million driven primarily by lower litigation and conduct costs. Operating expenses excluding litigation and conduct costs of £994 million (2013 - £2,441 million) and restructuring costs of £295 million (2013 - £202 million), decreased by £1,006 million, or 22%, reflecting the continued focus on cost savings across both business and support areas.
Net impairment releases totalled £9 million compared with a net impairment charge of £680 million in 2013, reflecting a reduction in latent loss provisions and a low level of new impairments. This contrasted with 2013 which included substantial impairments related to the establishment of RCR.
Funded assets fell by 10% reflecting the focus on core product areas including the wind-down of Credit Trading and the US ABP businesses
RWAs were managed down by £40.0 billion from £147.1 billion on 1 January 2014 to £107.1 billion on 31 December 2014. The 27% reduction was driven by a sustained programme of risk and business reductions, notably in Credit due to the wind-down of the US asset-backed products business (down £15 billion over the same period to £4 billion).
2013 compared with 2012
Operating loss increased by £2,635 million, driven by litigation and conduct costs of £2,441 million (2012 - £723 million). Income fell by 22%, reflecting the strategic reduction in trading products and challenging market conditions. De-risking resulted in a 24% reduction in risk-weighted assets.
Rates actively repositioned the business during 2013, lowering the balance sheet and reducing risk. This, combined with a weak trading performance in H1 2013, resulted in subdued returns.
Currencies income increased as the franchise remained resilient and FX Options benefited from opportunities in volatile FX and emerging markets.
Credit income reduced, reflecting the de-risking of Flow Credit Trading and lower income from Asset Backed Products which was affected by investor concerns regarding tapering of the Federal Reserve’s programme of quantitative easing and a reduction in the balance sheet and risk resources deployed by the business.
Global Transaction Services income was 14% lower driven by Cash Management, principally reflecting a decline in three-month LIBOR rates.
The reduction in Portfolio income of 14% reflected a smaller balance sheet.
Excluding restructuring costs of £202 million (2012 - £982 million) and litigation and conduct costs of £2,441 million (2012 - £723 million) operating expenses decreased by £157 million, or 3%, primarily reflecting a reduction in headcount and tightly controlled discretionary expenses. This was partially offset by a higher level of legal costs, primarily related to legacy issues in the US asset backed products business.
The increase in impairments mainly related to the creation of RCR (£355 million) in addition to a number of single name provisions.
Reducing risk and refocusing the trading business on core fixed income and currencies products drove the substantial reduction in both balance sheet and risk capital. Funded assets were £77.1 billion lower than December 2012 and risk weighted assets at £120.4 billion were down £37.4 billion.
| Central items | | | |
| | 2014 | 2013 | 2012 |
| | £m | £m | £m |
| Central items not allocated | (850) | 647 | 845 |
Funding and operating costs have been allocated to operating segments based on direct service usage, the requirement for market funding and other appropriate drivers where services span more than one segment.
Residual unallocated items relate to volatile corporate items that do not naturally reside within a segment.
2014 compared with 2013
Central items not allocated represented a charge of £850 million compared with a credit of £647 million in 2013. The change includes lower gains on the disposal of available-for-sale securities in Treasury, which were down £575 million to £149 million in 2014, along with a £309 million higher restructuring charge relating to the Williams & Glyn franchise. In addition 2014 includes a charge of £247 million write-down of previously capitalised software development expenditure and £134 million lower income from investments in associates. In addition, unallocated Treasury funding costs, including volatile items under IFRS, were £437 million in the year versus £282 million in 2013.
2013 compared with 2012
Central items not allocated, represented a credit of £647 million in 2013 compared with £845 million in 2012, a reduction of £198 million.
This has been principally driven by higher unallocated Treasury and funding costs, including volatile items under IFRS and lower gains on Treasury available-for-sale securities, down £156 million from £880 million in 2012 to £724 million in 2013.
Central items included a property-related impairment of £65 million which was offset by the non-repeat of £175 million costs incurred in 2012 in relation to the technology incident along with income recognised in relation to RBS’s share of profit from its stake in Saudi Hollandi.
| Citizens Financial Group | | | | | | | |
| | 2014 | 2013 | 2012 | | 2014 | 2013 | 2012 |
| Income statement | US$m | US$m | US$m | | £m | £m | £m |
| Net interest income | 3,317 | 2,960 | 3,071 | | 2,013 | 1,892 | 1,938 |
| Net fees and commissions | 1,168 | 1,190 | 1,253 | | 709 | 761 | 791 |
| Other non-interest income | 589 | 489 | 584 | | 359 | 312 | 368 |
| Non-interest income | 1,757 | 1,679 | 1,837 | | 1,068 | 1,073 | 1,159 |
| Total income | 5,074 | 4,639 | 4,908 | | 3,081 | 2,965 | 3,097 |
| Direct expenses | | | | | | | |
- staff costs | (1,697) | (1,707) | (1,644) | | (1,030) | (1,091) | (1,037) |
- other costs | (1,631) | (1,544) | (1,630) | | (990) | (986) | (1,027) |
| - litigation settlement | — | — | (138) | | — | — | (88) |
| Indirect expenses | — | (173) | (148) | | — | (111) | (95) |
| Restructuring costs | (169) | (24) | 2 | | (103) | (16) | 1 |
| Operating expenses | (3,497) | (3,448) | (3,558) | | (2,123) | (2,204) | (2,246) |
| Profit before impairment losses | 1,577 | 1,191 | 1,350 | | 958 | 761 | 851 |
| Impairment losses | (324) | (244) | (145) | | (197) | (156) | (91) |
| Operating profit | 1,253 | 947 | 1,205 | | 761 | 605 | 760 |
| | | | | | | | |
| | | | | | | | |
| Average exchange rate - US$/£ | | | | | 1.647 | 1.565 | 1.585 |
| | | | | | | | |
| Performance ratios | 2014 | 2013 | 2012 | | 2014 | 2013 | 2012 |
Return on equity (1) | 6.6% | 5.7% | 7.1% | | 6.6% | 5.7% | 7.1% |
| Net interest margin | 2.88% | 2.91% | 2.98% | | 2.88% | 2.91% | 2.98% |
| Cost:income ratio | 69% | 74% | 72% | | 69% | 74% | 72% |
| Loan impairment charge as % of gross customer loans and | | | | | | | |
| advances | 0.3% | 0.3% | 0.2% | | 0.3% | 0.3% | 0.2% |
| | | | | | | | |
| Capital and balance sheet | US$bn | US$bn | US$bn | | £bn | £bn | £bn |
| Loans and advances to customers (gross) | | | | | | | |
- residential mortgages | 12.1 | 9.6 | 9.4 | | 7.7 | 5.8 | 5.8 |
- home equity | 18.8 | 20.1 | 21.5 | | 12.0 | 12.1 | 13.3 |
| - SBO home equity | 1.8 | — | — | | 1.2 | — | — |
- corporate and commercial | 43.6 | 39.8 | 38.5 | | 27.9 | 24.1 | 23.8 |
- other consumer | 17.6 | 14.1 | 13.5 | | 11.3 | 8.6 | 8.4 |
| Total loans and advances to customers (gross) | 93.9 | 83.6 | 82.9 | | 60.1 | 50.6 | 51.3 |
| Loan impairment provisions | (0.8) | (0.4) | (0.5) | | (0.5) | (0.3) | (0.3) |
| Net loans and advances to customers | 93.1 | 83.2 | 82.4 | | 59.6 | 50.3 | 51.0 |
| | | | | | | | |
| Funded assets | 132.0 | 117.9 | 116.7 | | 84.5 | 71.3 | 72.2 |
| Total assets | 132.6 | 118.6 | 117.8 | | 84.9 | 71.7 | 72.9 |
| Investment securities | 24.7 | 21.3 | 19.5 | | 15.8 | 12.9 | 12.0 |
| Risk elements in lending | | | | | | | |
- retail | 1.8 | 1.5 | 1.3 | | 1.2 | 0.9 | 0.8 |
- commercial | 0.3 | 0.2 | 0.6 | | 0.1 | 0.1 | 0.3 |
| Total risk elements in lending | 2.1 | 1.7 | 1.9 | | 1.3 | 1.0 | 1.1 |
Provision coverage (2) | 40% | 26% | 25% | | 40% | 26% | 25% |
| | | | | | | | |
| Customer deposits (excluding repos) | 94.6 | 91.1 | 95.6 | | 60.6 | 55.1 | 59.2 |
| Bank deposits (excluding repos) | 8.0 | 3.3 | 2.9 | | 5.1 | 2.0 | 1.8 |
| Loan:deposit ratio (excluding repos) | 98% | 91% | 86% | | 98% | 91% | 86% |
| | | | | | | | |
Risk-weighted assets (3) | | | | | | | |
| - credit risk | | | | | | | |
| - non-counterparty | 97.4 | 83.8 | 82.0 | | 62.4 | 50.7 | 50.8 |
| - counterparty | 1.4 | 0.8 | 1.4 | | 0.9 | 0.5 | 0.8 |
| - operational risk | 8.0 | 8.2 | 7.9 | | 5.1 | 4.9 | 4.9 |
| Total risk-weighted assets | 106.8 | 92.8 | 91.3 | | 68.4 | 56.1 | 56.5 |
| | | | | | | | |
| Spot exchange rate - US$/£ | | | | | 1.562 | 1.654 | 1.616 |
| (1) | Return on equity is based on operating profit after tax divided by average notional equity (based on 12% of the monthly average of RWAs); RWA’s in 2013 and 2012 are on a Basel 2.5 basis. |
| (2) | Provision coverage represents loan impairment provisions as a percentage of risk elements in lending. |
| (3) | RWAs in at 2013 and 2012 are on a Basel 2.5 basis. RWAs on the end-point CRR basis as at 1 January were £60.6 billion ($100.2 billion). |
| (4) | From Q1 2015 business segment return on equity will be calculated based on operating profit after tax adjusted for preference share dividends divided by average notional equity (based on 13% of the monthly average RWAes). At 31 December 2014 the RWAes on this basis were £68.6 billion and the return on equity 6.1%. |
Key points
In accordance with a commitment to the EC to sell Citizens by 31 December 2016, RBS disposed of 29.5% of its interest in Citizens Financial Group, Inc. during the second half of 2014 primarily through an initial public offering in the USA. In accordance with IFRS 5 ‘Non-current Assets Held for Sale and Discontinued Operations’, Citizens is presented with effect from 31 December 2014 as a discontinued operation, with comparatives restated, and as a disposal group.
Although CFG has been reclassified as a discontinued operation it continues to be a reportable operating segment.
The results for 2014 are not directly comparable to prior periods; prior year results exclude Non-Core operations and include indirect expenses. In the context of the planned disposal of Citizens Financial Group, indirect expenses are no longer allocated to the segment.
2014 compared with 2013
Operating profit increased by £156 million ($306 million), or 26%, to £761 million ($1,253 million), reflecting the Q2 2014 gain on the sale of the Illinois franchise. The former Non-Core portfolio is now included and indirect expenses are no longer allocated on a prospective basis from 1 January 2014.
Net interest income was up £121 million ($357 million), or 6%, to £2,013 million ($3,317 million) driven by a larger investment portfolio, loan growth including the transfer of assets from Non-Core, the benefit of interest rate swaps and deposit pricing discipline. This was partially offset by a reduction in loan spreads, reflecting the impact of the relatively persistent low-rate environment on loan yields, higher borrowing costs related to subordinated debt issuances and the impact of lost revenue from the Illinois franchise sale.
Higher rates led to investment security purchases resulting in average portfolio growth of £3.3 billion ($5.4 billion) over the year
Average loans and advances were up 17% driven by the £2.1 billion ($3.4 billion) transfer of assets from Non-Core, commercial loan growth, auto loan organic growth and purchases of residential mortgages and auto loans, which were partially offset by a reduction in home equity loans.
Average customer deposits were up 4%. On a US dollar basis average customer deposits were down 2% with planned run-off of high priced deposits.
Loan:deposit ratio improved 700 basis points to 98%.
Excluding the gain on the sale of the Illinois franchise of £170 million ($283 million), non-interest income was down £175 million ($205 million), or 16%, to £898 million ($1,474 million) reflecting lower securities gains of £70 million ($116 million), lower mortgage banking fees of £32 million ($52 million), as refinancing volumes have slowed, lower deposit fees of £32 million ($52 million) due to a change in the posting order of transactions and the impact of lost revenue from the Illinois franchise sale. This was partially offset by underlying strength in commercial banking fee income. Mortgage origination activity has slowed as market rates have risen, leading to lower applications combined with lower levels of gains on sales of mortgages.
Excluding restructuring costs of £103 million ($169 million) (2013 - £16 million ($24 million)), operating expenses were down £168 million ($96 million), or 8%, to £2,020 million ($3,328 million) driven by the removal of indirect costs in 2014 and the impact of the Illinois franchise sale partially offset by lower mortgage servicing rights impairment release and higher consumer regulatory compliance costs.
Restructuring costs include costs related to the sale of the Illinois franchise, separation from RBS, as well as efforts to improve processes and enhance efficiency.
Impairment losses increased by £41 million ($80 million) to £197 million ($324 million) due to charge-offs related to assets transferred from Non-Core.
2013 compared with 2012
Operating profit of £605 million ($947 million) was down £155 million ($258 million), or 20%. The operating environment and market conditions remained challenging, with intense competition for loans. An extended period of low short-term rates limited net interest margin expansion and the rise in long-term rates dramatically slowed mortgage refinance volumes.
Net interest income was down 2% at £1,892 million ($2,960 million) due to a smaller investment portfolio, consumer loan run-off and the effect of prevailing economic conditions on asset yields partially offset by the benefit of interest rate swaps, commercial loan growth and favourable funding costs.
Average loans and advances were flat, with commercial loan growth of 5% despite competition for lending opportunities offset by run-off of long-term fixed-rate consumer products.
Average customer deposits were flat, with planned run-off of high priced time deposits and lower wholesale deposits offset by growth achieved in checking and money market balances. Consumer checking balances grew by 3% while small business checking balances grew by 7% over the year.
Excluding the £47 million ($75 million) gross gain on the sale of Visa B shares in 2012, non-interest income was down £39 million ($83 million), or 4% at £1,073 million ($1,679 million), reflecting lower mortgage banking fees as refinancing volumes have slowed, and lower deposit fees. This was partially offset by higher securities gains and commercial banking fee income.
Excluding the £88 million ($138 million) litigation settlement in 2012 relating to a class action lawsuit regarding the way overdraft fees were assessed on customer accounts prior to 2010 and the £8 million ($13 million) litigation reserve associated with the sale of Visa B shares, operating expenses of £2,204 million ($3,448 million) were broadly in line with prior year. This largely reflects a mortgage servicing rights impairment recapture driven by the increase in long-term rates offset by the cost of regulatory compliance and new technology investments and a £21 million ($33 million) pension gain in 2012.
Impairment losses increased by £65 million ($99 million) to £156 million ($244 million) for the year and represented 0.3% of loans and advances to customers.
RBS Capital Resolution
RCR is managed and analysed in four asset management groups - Ulster Bank (RCR Ireland), Real Estate Finance, Corporate and Markets. Real Estate Finance excludes commercial real estate lending in Ulster Bank.
| | 2014 |
| Income statement | £m |
| Net interest expense | (24) |
| Funding cost of rental assets | (23) |
| Net interest income | (47) |
| Net fees and commissions | 58 |
Income from trading activities (1) | (217) |
Other operating income (1) | 251 |
| Non-interest income | 92 |
| Total income | 45 |
| Direct expenses | |
| - staff | (167) |
| - other | (85) |
| Indirect expenses | (104) |
| Restructuring costs | (7) |
| Operating expenses | (363) |
| Loss before impairment losses | (318) |
Impairment releases (1) | 1,306 |
| Operating profit | 988 |
| | |
| | |
| Total income | |
| Ulster Bank | (20) |
| Real Estate Finance | 222 |
| Corporate | (17) |
| Markets | (140) |
| Total income | 45 |
| | |
| Impairment (releases)/losses | |
| Ulster Bank | (1,106) |
| Real Estate Finance | (183) |
| Corporate | (21) |
| Markets | 4 |
| Total impairment releases | (1,306) |
| | |
Loan impairment charge as a % of gross customer loans and advances (2) | |
| Ulster Bank | (10.1%) |
| Real Estate Finance | (4.5%) |
| Corporate | (0.3%) |
| Markets | (1.7%) |
| Total | (6.0%) |
| (1) | Asset disposals contributed £904 million to RCR’s operating profit: impairment provision releases of £874 million; £87 million gain in income from trading activities and £57 million loss in other operating income. |
| (2) | Includes disposal groups. |
| | 2014 |
| Capital and balance sheet | £bn |
Loans and advances to customers (gross) (1) | 21.9 |
| Loan impairment provisions | (10.9) |
| Net loans and advances to customers | 11.0 |
| | |
| Debt securities | 1.0 |
| Funded assets | 14.9 |
| Total assets | 29.0 |
| | |
Risk elements in lending (1) | 15.4 |
Provision coverage (2) | 71% |
| Risk-weighted assets | |
| - credit risk | |
| - non-counterparty | 13.6 |
| - counterparty | 4.0 |
| - market risk | 4.4 |
| Total risk-weighted assets | 22.0 |
| | |
Gross loans and advances to customers (1) | |
| Ulster Bank | 11.0 |
| Real Estate Finance | 4.1 |
| Corporate | 6.2 |
| Markets | 0.6 |
| | 21.9 |
| | |
| Funded assets - Ulster Bank | |
| Commercial real estate - investment | 1.2 |
| Commercial real estate - development | 0.7 |
| Other corporate | 0.7 |
| | 2.6 |
| | |
| Funded assets - Real Estate Finance | |
| UK | 2.5 |
| Germany | 0.4 |
| Spain | 0.5 |
| Other | 0.8 |
| | 4.2 |
| | |
| Funded assets - Corporate | |
| Structured finance | 1.7 |
| Shipping | 1.8 |
| Other | 2.3 |
| | 5.8 |
| | |
| Funded assets - Markets | |
| Securitised products | 1.8 |
| Emerging markets | 0.5 |
| | 2.3 |
| (1) | Includes disposal groups. |
| (2) | Provision coverage represents loan impairment provisions as a percentage of risk elements in lending. |
| Funded assets and RWAe | | | | | | | | | | | | | | | |
| | | | | | | | | | | | | | | | | | |
| | Non-performing (1) | | Performing (1) | | Total |
| | Funded assets | | | Capital | | Funded assets | | | Capital | | Funded assets | | | Capital |
| | Gross | Net | RWAe | RWA | deducts | | Gross | Net | RWAe | RWA | deducts | | Gross | Net | RWAe (2) | RWA | deducts (3) |
| 2014 | £bn | £bn | £bn | £bn | £m | | £bn | £bn | £bn | £bn | £m | | £bn | £bn | £bn | £bn | £m |
| Ulster Bank | 10.7 | 2.2 | 3.4 | — | 340 | | 0.5 | 0.4 | 0.5 | 1.3 | (82) | | 11.2 | 2.6 | 3.9 | 1.3 | 258 |
| Real Estate Finance | 3.2 | 2.0 | 1.0 | — | 98 | | 2.2 | 2.2 | 4.8 | 4.7 | 13 | | 5.4 | 4.2 | 5.8 | 4.7 | 111 |
| Corporate | 2.2 | 1.1 | 1.6 | — | 161 | | 4.7 | 4.7 | 6.7 | 7.2 | (49) | | 6.9 | 5.8 | 8.3 | 7.2 | 112 |
| Markets | 0.1 | 0.1 | 0.1 | — | 12 | | 2.2 | 2.2 | 9.2 | 8.8 | 41 | | 2.3 | 2.3 | 9.3 | 8.8 | 53 |
| Total RCR | 16.2 | 5.4 | 6.1 | — | 611 | | 9.6 | 9.5 | 21.2 | 22.0 | (77) | | 25.8 | 14.9 | 27.3 | 22.0 | 534 |
| (1) | Performing assets are those with an internal asset quality band of AQ1-AQ9; and non-performing assets are in AQ10 with a probability of default being 100%. |
| (2) | RWA equivalent (RWAe) is an internal metric that measures the equity capital employed in segments. RWAe converts both performing and non-performing exposures into a consistent capital measure, being the sum of the regulatory RWAs and the regulatory capital deductions, the latter converted to RWAe by applying a multiplier. RBS applies a CET1 ratio of 10% for RCR; this results in an end-point CRR RWAe conversion multiplier of 10. |
| (3) | The most significant component of capital deductions relate to expected loss less impairment provisions of £518 million. The negative capital deductions for performing exposures are a result of the latent loss provisions held in respect of the performing portfolio. |
| Funded assets | | | | | | |
| | 1 January | | | | | 31 December |
| | 2014 | Repayments | Disposals (1) | Impairments | Other | 2014 |
| | £bn | £bn | £bn | £bn | £bn | £bn |
| Ulster Bank | 4.8 | (0.2) | (2.8) | 1.1 | (0.3) | 2.6 |
| Real Estate Finance | 9.5 | (2.3) | (2.9) | 0.1 | (0.2) | 4.2 |
| Corporate | 9.8 | (2.3) | (1.9) | — | 0.2 | 5.8 |
| Markets | 4.8 | (1.1) | (1.5) | — | 0.1 | 2.3 |
| Total | 28.9 | (5.9) | (9.1) | 1.2 | (0.2) | 14.9 |
| | | | | | | | |
| Risk-weighted assets | | | | | | | |
| | 1 January | | | Risk | | | 31 December |
| | 2014 | Repayments | Disposals (1) | parameters (2) | Impairments | Other (3) | 2014 |
| | £bn | £bn | £bn | £bn | £bn | £bn | £bn |
| Ulster Bank | 3.3 | (0.5) | (0.5) | (0.9) | — | (0.1) | 1.3 |
| Real Estate Finance | 13.5 | (2.2) | (1.4) | (5.2) | — | — | 4.7 |
| Corporate | 16.4 | (2.2) | (3.0) | (4.1) | (0.4) | 0.5 | 7.2 |
| Markets | 13.5 | (2.7) | (2.7) | 0.2 | — | 0.5 | 8.8 |
| Total | 46.7 | (7.6) | (7.6) | (10.0) | (0.4) | 0.9 | 22.0 |
| | | | | | | | |
| Capital deductions | | | | | | | |
| | 1 January | | | Risk | | | 31 December |
| | 2014 | Repayments | Disposals (1) | parameters (2) | Impairments | Other (3) | 2014 |
| | £bn | £bn | £bn | £bn | £bn | £bn | £bn |
| Ulster Bank | 559 | (30) | (226) | (116) | 81 | (10) | 258 |
| Real Estate Finance | 505 | (396) | (683) | 621 | 78 | (14) | 111 |
| Corporate | 477 | (192) | (113) | 17 | (102) | 25 | 112 |
| Markets | 291 | (15) | (80) | (139) | 1 | (5) | 53 |
| Total | 1,832 | (633) | (1,102) | 383 | 58 | (4) | 534 |
| | | | | | | | |
RWA equivalent (4) | | | | | | | |
| | 1 January | | | Risk | | | 31 December |
| | 2014 | Repayment | Disposals (1) | parameters (2) | Impairments | Other (3) | 2014 |
| | £bn | £bn | £bn | £bn | £bn | £bn | £bn |
| Ulster Bank | 8.9 | (0.8) | (2.7) | (2.1) | 0.7 | (0.1) | 3.9 |
| Real Estate Finance | 18.6 | (6.2) | (8.2) | 0.9 | 0.7 | — | 5.8 |
| Corporate | 21.1 | (4.0) | (4.0) | (4.0) | (1.4) | 0.6 | 8.3 |
| Markets | 16.4 | (2.8) | (3.5) | (1.1) | — | 0.3 | 9.3 |
| Total | 65.0 | (13.8) | (18.4) | (6.3) | — | 0.8 | 27.3 |
| (1) | Includes all effects relating to disposals, including associated removal of deductions from regulatory capital. |
| (2) | Principally reflects credit migration and other technical adjustments. |
| (3) | Includes fair value adjustments and foreign exchange movements. |
| (4) | RWA equivalent (RWAe) is an internal metric that measures the equity capital employed in segments. RWAe converts both performing and non-performing exposures into a consistent capital measure, being the sum of the regulatory RWAs and the regulatory capital deductions, the latter converted to RWAe by applying a multiplier. RBS applies a CET1 ratio of 10% for RCR; this results in an end-point CRR RWAe conversion multiplier of 10. |
| Gross loans and advances, REIL and impairments | |
| | | | | | | | | |
| | | | | Credit metrics | | |
| | | | | REIL as a | Provisions | Provisions | Impairment | |
| | Gross | | | % of gross | as a % | as a % of | (releases)/ | Amounts |
| | loans | REIL | Provisions | loans | of REIL | gross loans | losses (2) | written-off |
| 2014 (1) | £bn | £bn | £bn | % | % | % | £m | £m |
| By sector | | | | | | | | |
| Commercial real estate | | | | | | | | |
| - investment | 6.2 | 4.9 | 2.8 | 79 | 57 | 45 | (553) | 1,911 |
| - development | 6.4 | 6.2 | 5.3 | 97 | 85 | 83 | (611) | 560 |
| Asset finance | 2.3 | 0.9 | 0.4 | 39 | 44 | 17 | 37 | 80 |
| Other corporate | 7.0 | 3.4 | 2.4 | 49 | 71 | 34 | (169) | 1,032 |
| | 21.9 | 15.4 | 10.9 | 70 | 71 | 50 | (1,296) | 3,583 |
| | | | | | | | | |
| By donating segment and sector | | | | | | | | |
| Ulster Bank | | | | | | | | |
| Commercial real estate | | | | | | | | |
| - investment | 3.0 | 2.9 | 2.0 | 97 | 69 | 67 | (450) | 445 |
| - development | 5.8 | 5.8 | 5.1 | 100 | 88 | 88 | (608) | 425 |
| Other corporate | 2.2 | 2.0 | 1.5 | 91 | 75 | 68 | (48) | 256 |
| Total Ulster Bank | 11.0 | 10.7 | 8.6 | 97 | 80 | 78 | (1,106) | 1,126 |
| | | | | | | | | |
| Commercial Banking | | | | | | | | |
| Commercial real estate | | | | | | | | |
| - investment | 1.2 | 0.7 | 0.2 | 58 | 29 | 17 | (5) | 228 |
| - development | 0.4 | 0.3 | 0.1 | 75 | 33 | 25 | (11) | 104 |
| Other corporate | 1.0 | 0.5 | 0.3 | 50 | 60 | 30 | — | 192 |
| Total Commercial Banking | 2.6 | 1.5 | 0.6 | 58 | 40 | 23 | (16) | 524 |
| | | | | | | | | |
| CIB | | | | | | | | |
| Commercial real estate | | | | | | | | |
| - investment | 2.0 | 1.3 | 0.6 | 65 | 46 | 30 | (98) | 1,238 |
| - development | 0.2 | 0.1 | 0.1 | 50 | 100 | 50 | 8 | 31 |
| Asset finance | 2.3 | 0.9 | 0.4 | 39 | 44 | 17 | 37 | 80 |
| Other corporate | 3.8 | 0.9 | 0.6 | 24 | 67 | 16 | (121) | 584 |
| Total CIB | 8.3 | 3.2 | 1.7 | 39 | 53 | 20 | (174) | 1,933 |
| | | | | | | | | |
| Total | 21.9 | 15.4 | 10.9 | 70 | 71 | 50 | (1,296) | 3,583 |
| | | | | | | | | |
| Of which | | | | | | | | |
| UK | 10.0 | 6.2 | 4.1 | 62 | 66 | 41 | (402) | 2,266 |
| Europe | 10.9 | 8.9 | 6.6 | 82 | 74 | 61 | (875) | 1,267 |
| US | 0.3 | 0.1 | — | 33 | — | — | (19) | 26 |
| RoW | 0.7 | 0.2 | 0.2 | 29 | 100 | 29 | — | 24 |
| Customers | 21.9 | 15.4 | 10.9 | 70 | 71 | 50 | (1,296) | 3,583 |
| Banks | 0.5 | — | — | — | — | — | (10) | 8 |
| Total | 22.4 | 15.4 | 10.9 | 69 | 71 | 49 | (1,306) | 3,591 |
| (1) | Includes disposal groups. |
| (2) | Impairment (releases)/losses include those relating to AFS securities; sector analyses above include allocation of latent impairment charges. |
2014 compared with 2013
RCR funded assets were reduced by £14 billion, or 48%, during 2014, driven by disposals and repayments.
The original target was for RCR to reduce funded assets by between 55% to 70% by the end of 2015 and by 85% over three years from 1 January 2014. Based on the strong performance in 2014, RCR is now expected to reduce funded assets by 85% by the end of 2015, a year earlier than planned.
RWA equivalent decreased by £38 billion, or 58%, during 2014. This primarily reflects disposals and repayments, supplemented by methodology changes and lower market risk RWAs.
Operating profit of £988 million reflects impairment provision releases and higher than anticipated sale prices for assets driven by a combination of strong execution and favourable market conditions particularly in Ireland.
The net effect of the £988 million operating profit and RWA equivalent reduction of £38 billion(1) was CET1 accretion of £4.8 billion.
Funding employed
RCR continues to be funded primarily by RBS Treasury and has no material third party deposits.
The funding is based on the original target of reducing third party assets by 85% over three years from the creation of RCR on 1 January 2014.
| (1) | Capital equivalent: £3.8 billion at an internal CET1 ratio of 10%. |
| Non-Core | | |
| | 2013 | 2012 |
| Income statement | £m | £m |
| Net interest income | (61) | 346 |
| Funding costs of rental assets | (35) | (115) |
| Net interest income | (96) | 231 |
| Net fees and commissions | 55 | 105 |
| Loss from trading activities | (148) | (654) |
| Other operating income | | |
- rental income | 177 | 510 |
- other (1) | (334) | 96 |
| Non-interest income | (250) | 57 |
| Total income | (346) | 288 |
| Direct expenses | | |
- staff costs | (190) | (256) |
- operating lease depreciation | (76) | (246) |
- other costs | (126) | (171) |
| Indirect expenses | (213) | (282) |
| Restructuring cost | | |
| - direct | (16) | (1) |
| - indirect | (6) | (7) |
| Operating expenses | (627) | -963 |
| Loss before impairment losses | (973) | (675) |
| Impairment losses | (4,576) | (2,223) |
| Operating loss | (5,549) | (2,898) |
| | | |
| Analysis of (loss)/income by business | | |
| Banking & portfolios | (496) | 40 |
| International businesses | 51 | 250 |
| Markets | 99 | (2) |
| Total income | (346) | 288 |
| | | |
| Loss from trading activities | | |
| Monoline exposures | (46) | (205) |
| Credit derivative product companies | (5) | (205) |
Asset-backed products (2) | 103 | 101 |
| Other credit exotics | 32 | (28) |
| Equities | 2 | (2) |
| Banking book hedges | 3 | (38) |
| Other | (237) | (277) |
| Total | (148) | (654) |
| | | |
| Impairment losses | | |
| Banking & portfolios | 4,646 | 2,346 |
| International businesses | 1 | 56 |
| Markets | (71) | (179) |
Total impairment losses (3) | 4,576 | 2,223 |
| | | |
| | | |
| Loan impairment charge as a % of gross customer loans and advances | | |
(excluding reverse repurchase agreements) (4) | | |
| Banking & portfolios | 12.9% | 4.2% |
| International businesses | 0.5% | 5.1% |
| Total | 12.8% | 4.2% |
| (1) | Includes losses on disposals of £221 million for 2013 (2012 - £14 million). |
| (2) | Asset-backed products include super asset-backed structures and other asset-backed products. |
| (3) | Includes £3,118 million pertaining to the creation of RCR and related strategy. |
| (4) | Includes disposal groups. |
| | | |
| Performance ratios | 2013 | 2012 |
| Net interest margin | (0.19%) | 0.31% |
| | | |
| | | |
| | | |
| Capital and balance sheet | £bn | £bn |
Loans and advances to customers (gross) (1) | 35.6 | 55.4 |
| Loan impairment provisions | (13.8) | (11.2) |
| Net loans and advances to customers | 21.8 | 44.2 |
| | | |
| Total third party assets (excluding derivatives) | 28.0 | 57.4 |
| Total third party assets (including derivatives) | 31.2 | 63.4 |
| | | |
Risk elements in lending (1) | 19.0 | 21.4 |
Provision coverage (2) | 73% | 52% |
Customer deposits (1) (excluding repos) | 2.2 | 2.7 |
| | | |
| Risk-weighted assets | | |
| - credit risk | | |
| - non-counterparty | 21.0 | 45.1 |
| - counterparty | 3.7 | 11.5 |
| - market risk | 3.3 | 5.4 |
| - operational risk | 1.2 | (1.6) |
| Total risk-weighted assets | 29.2 | 60.4 |
| | | |
| Gross customer loans and advances | | |
| Banking & portfolios | 35.4 | 54.5 |
| International businesses | 0.2 | 0.9 |
| | 35.6 | 55.4 |
| | | |
| Risk-weighted assets | | |
| Banking & portfolios | 26.2 | 53.3 |
| International businesses | 0.7 | 2.4 |
| Markets | 2.3 | 4.7 |
| | 29.2 | 60.4 |
| | | |
| Third party assets (excluding derivatives) | | |
| Banking & portfolios | 25.9 | 51.1 |
| International businesses | 0.3 | 1.2 |
| Markets | 1.8 | 5.1 |
| | 28.0 | 57.4 |
| (1) | Excludes disposal groups. |
| (2) | Provision coverage represents loan impairment provisions as a percentage of risk elements in lending. |
2013 was the final reporting period for the Non-Core division. Approximately £12 billion of assets which were managed by Non-Core were returned to the relevant originating segments, with the remaining assets transferring to RCR from 1 January 2014.
Non-Core had successfully achieved and surpassed its five year Strategic Plan target, reducing third party assets from the opening £258 billion position to end 2013 significantly below the original c.£40 billion target at £28 billion. Over the life of Non-Core this represented an overall reduction of £230 billion, or 89%. This was achieved through a mixture of disposals, run-off and impairments. By the end of 2013, the Non-Core funded balance sheet was c.4% of the Group’s funded balance sheet compared with 21% when the division was created. RWAs had reduced from £171 billion to £29 billion, or 83%, over the life of Non-Core.
2013 compared with 2012
Third party assets declined by £29 billion, or 51%, reflecting run-off of £15 billion, disposals of £11 billion and impairments of £5 billion, of which £3.1 billion is driven by the new RCR strategy to exit these assets over a shorter timeframe than previous plans.
Risk-weighted assets were £31 billion lower, driven by disposals and run-off.
Operating loss of £5,549 million was £2,651 million higher than 2012, principally due to a £2,353 million increase in impairments. This was predominantly due to £3,118 million of 2013 impairments related to the creation of RCR, most significantly with £2,299 million in Ulster Bank and £742 million in International Banking, driven by the new RCR strategy to exit these assets over a shorter timeframe than previous plans, which has led to increased impairment losses on the non-performing assets.
Operating loss before impairment losses was £298 million higher with a reduction in net interest income of £343 million, £207 million additional disposal losses and £104 million further fair value writedowns offset by £506 million lower losses from trading activities.
The reduction in net interest income of £343 million was driven by a 31% fall in interest earning assets driven by run-off and disposals.
Headcount declined by 1,700, or 55% to 1,400 of which 1,000 relates to operations in India and Romania, reflecting divestment activity and run-off.
| Consolidated balance sheet at 31 December 2014 | | | |
| | 2014 | 2013 | 2012 |
| | £m | £m | £m |
| Assets | | | |
| Cash and balances at central banks | 74,872 | 82,659 | 79,290 |
| Net loans and advances to banks | 23,027 | 27,555 | 29,168 |
| Reverse repurchase agreements and stock borrowing | 20,708 | 26,516 | 34,783 |
| Loans and advances to banks | 43,735 | 54,071 | 63,951 |
| Net loans and advances to customers | 334,251 | 390,825 | 430,088 |
| Reverse repurchase agreements and stock borrowing | 43,987 | 49,897 | 70,047 |
| Loans and advances to customers | 378,238 | 440,722 | 500,135 |
| Debt securities subject to repurchase agreements | 23,048 | 55,554 | 91,173 |
| Other debt securities | 63,601 | 58,045 | 66,265 |
| Debt securities | 86,649 | 113,599 | 157,438 |
| Equity shares | 5,635 | 8,811 | 15,232 |
| Settlement balances | 4,667 | 5,591 | 5,741 |
| Derivatives | 353,590 | 288,039 | 441,903 |
| Intangible assets | 7,781 | 12,368 | 13,545 |
| Property, plant and equipment | 6,167 | 7,909 | 9,784 |
| Deferred tax | 1,540 | 3,478 | 3,443 |
| Prepayments, accrued income and other assets | 5,878 | 7,614 | 7,820 |
| Assets of disposal groups | 82,011 | 3,017 | 14,013 |
| Total assets | 1,050,763 | 1,027,878 | 1,312,295 |
| | | | |
| Liabilities | | | |
| Bank deposits | 35,806 | 35,329 | 57,073 |
| Repurchase agreements and stock lending | 24,859 | 28,650 | 44,332 |
| Deposits by banks | 60,665 | 63,979 | 101,405 |
| Customers deposits | 354,288 | 414,396 | 433,239 |
| Repurchase agreements and stock lending | 37,351 | 56,484 | 88,040 |
| Customer accounts | 391,639 | 470,880 | 521,279 |
| Debt securities in issue | 50,280 | 67,819 | 94,592 |
| Settlement balances | 4,503 | 5,313 | 5,878 |
| Short positions | 23,029 | 28,022 | 27,591 |
| Derivatives | 349,805 | 285,526 | 434,333 |
| Accruals, deferred income and other liabilities | 13,346 | 16,017 | 14,801 |
| Retirement benefit liabilities | 2,579 | 3,210 | 3,884 |
| Deferred tax | 500 | 507 | 1,141 |
| Subordinated liabilities | 22,905 | 24,012 | 26,773 |
| Liabilities of disposal groups | 71,320 | 3,378 | 10,170 |
| Total liabilities | 990,571 | 968,663 | 1,241,847 |
| | | | |
| Non-controlling interests | 2,946 | 473 | 1,770 |
| Owners’ equity | 57,246 | 58,742 | 68,678 |
| Total equity | 60,192 | 59,215 | 70,448 |
| | | | |
| Total liabilities and equity | 1,050,763 | 1,027,878 | 1,312,295 |
Commentary on consolidated balance sheet
2014 compared with 2013
Total assets of £1,050.8 billion at 31 December 2014 were up £22.9 billion, 2%, compared with 31 December 2013. This was driven by mark-to-market increases in derivative assets, partly offset by a reduction in funded assets, primarily in CIB and RCR.
Loans and advances to banks decreased by £10.3 billion, 19%, to £43.7 billion. Excluding reverse repurchase agreements and stock borrowing (‘reverse repos’), down £5.8 billion, 22%, to £20.7 billion, bank placings declined £4.5 billion, 16%, to £23.0 billion.
Loans and advances to customers declined £62.5 billion, 14%, to £378.2 billion. Within this, reverse repos were down £5.9 billion, 12%, to £44.0 billion. Customer lending decreased by £56.6 billion, 14%, to £334.2 billion, or £64.3 billion to £351.7 billion before impairments. This reflected the transfer to disposal groups at 31 December 2014 of £60.1 billion (equivalent 2013 - £50.6 billion) of customer balances relating to Citizens together with run-down and disposals in RCR.
Debt securities were down £27.0 billion, 24%, to £86.6 billion, driven mainly by the transfer of £15.3 billion of Citizens’ debt securities to assets of disposal groups and reductions within CIB and Treasury in holdings of US government securities and financial institution bonds.
Equity shares decreased by £3.2 billion, 36%, to £5.6 billion primarily due to the ongoing run-down of the CIB equities business.
Movements in the value of derivative assets, up £65.6 billion, 23%, to £353.6 billion, and liabilities, up £64.3 billion, 23% to £349.8 billion, primarily reflects significant mark-to-market increases on interest rate contracts driven by significant downward shifts in major yield curves.
Property, plant and equipment decreased by £1.7 billion, 22%, to £6.2 billion driven largely by disposals of investment properties and the transfer of Citizens to assets of disposal groups.
Intangible assets decreased by £4.6 billion, 37%, to £7.8 billion primarily as a result of the transfer to disposal groups of £4.5 billion of intangible assets relating to Citizens.
The increase in assets and liabilities of disposal groups, up £79.0 billion to £82.0 billion, and £67.9 billion to £71.3 billion respectively, primarily reflects the transfer to disposal groups of Citizens at 31 December 2014. This was partly offset by decreases resulting from the disposals of the interest in associates in Direct Line Group and the Chicago area retail branches, small business operations and select middle market relationships in the Chicago area, which formed part of Citizens.
Deposits by banks decreased £3.3 billion, 5%, to £60.7 billion, with increases in inter-bank deposits, up £0.5 billion, 1%, to £35.8 billion and decreases in repurchase agreements and stock lending (‘repos’), down £3.8 billion, 13%, to £24.9 billion, as a result of the transfer of £6.8 billion of Citizens’ bank deposits to liabilities of disposal groups, partly offset by higher derivative cash collateral.
Customer accounts decreased £79.2 billion, 17%, to £391.6 billion. Within this, repos decreased £19.1 billion, 34%, to £37.4 billion. Excluding repos, customer deposits were down £60.1 billion, 15%, at £354.3 billion, primarily reflecting the transfer to disposal groups of £60.6 billion (equivalent 2013 - £55.1 billion) of customer accounts relating to Citizens and the reduction of corporate deposits in both Commercial Banking and CIB.
Debt securities in issue decreased £17.5 billion, 26%, to £50.3 billion due to the buy-back and maturity of medium term notes in issue given the lower funding requirements of a reduced balance sheet.
Retirement benefit liabilities decreased by £0.6 billion, 20%, to £2.6 billion primarily driven by additional employer contributions of £0.7 billion to the Group’s Main scheme as part of the schedule of additional contributions to eliminate the deficit in the scheme which were agreed following completion of the triennial valuation of the Main scheme.
Subordinated liabilities decreased by £1.1 billion, 5% to £22.9 billion, primarily as a result of the net decrease in dated loan capital with redemptions of £3.5 billion being partially offset by issuances of £2.2 billion and the effects of exchange rate and other movements of £0.2 billion.
Non-controlling interests increased by £2.5 billion to £2.9 billion, due to the disposal of a 29.5% interest in Citizens during the second half of 2014, primarily through an initial public offering in the USA.
Owner’s equity decreased by £1.5 billion, 3%, to £57.2 billion, driven by the £3.5 billion attributable loss for the year. Partially offsetting this reduction were movements in cash flow hedging reserves, £1.1 billion, and available-for-sale reserves, £0.6 billion, share issuances of £0.5 billion, and other reserve movements, £0.2 billion.
2013 compared with 2012
Total assets of £1,027.9 billion at 31 December 2013 were down £284.4 billion, 22%, compared with 31 December 2012. This was driven by the downsizing of the CIB business, primarily reflected in decreases in loans to banks and customers, debt securities and derivatives balances, and a further decrease in loans and advances to banks and customers due to Non-Core disposals and run off.
Loans and advances to banks decreased by £9.9 billion, 15%, to £54.1 billion. Excluding reverse repurchase agreements and stock borrowing (‘reverse repos’), down £8.3 billion, 24%, to £26.5 billion, bank placings declined £1.6 billion, 6%, to £27.6 billion.
Loans and advances to customers declined £59.4 billion, 12%, to £440.7 billion. Within this, reverse repurchase agreements were down £20.1 billion, 29%, to £49.9 billion. Customer lending decreased by £39.3 billion, 9%, to £390.8 billion, or £35.2 billion to £416.0 billion before impairments. This reflected reductions in Non-Core of £19.9 billion, along with declines in CIB, £11.1 billion, Ulster Bank, £1.9 billion, UK Personal & Business Banking, £1.3 billion, Private Banking, £0.3 billion, Citizens Financial Group, £0.2 billion and Commercial Banking, £0.1 billion, which included the impact of £0.7 billion of customer loans being transferred to assets of disposal groups at 31 December 2013, and the effect of exchange rate and other movements, £0.4 billion.
Debt securities were down £43.8 billion, 28%, to £113.6 billion, driven mainly by reductions within CIB and RBS Treasury in holdings of UK and Eurozone government securities and financial institution bonds.
Equity shares decreased by £6.4 billion, 42%, to £8.8 billion due to the targeted run-down of CIB’ equities business.
Movements in the value of derivative assets, down £153.9 billion, 35%, to £288.0 billion, and liabilities, down £148.8 billion, 34% to £285.5 billion, primarily reflects upward shifts in major yield curves which resulted in significant mark-to-market decreases on interest rate contracts.
Property, plant and equipment decreased by £1.9 billion, 19%, to £7.9 billion driven largely by the disposal of Non-Core assets.
Intangible assets decreased by £1.2 billion, 9%, to £12.4 billion primarily as a result of the write-down of goodwill relating to the former International Banking division at 31 December 2013.
The decrease in assets and liabilities of disposal groups, down £11.0 billion, 78%, to £3.0 billion, and £6.8 billion, 67%, to £3.4 billion respectively, primarily reflects the deconsolidation of Direct Line Group following the further sale of shares and ceding of control in 2013. The remaining interest, classified as an associate, is included in assets of disposal groups at 31 December 2013. In addition, disposal groups include loans and deposits in Illinois branches for sale in Citizens Financial Group.
Deposits by banks decreased £37.4 billion, 37%, to £64.0 billion, with decreases in inter-bank deposits, down £21.7 billion, 38%, to £35.3 billion and repurchase agreements and stock lending (‘repos’), down £15.7 billion, 35%, to £28.7 billion, as a result of lower funding requirements and reduced derivative cash collateral.
Customer accounts decreased £50.4 billion, 10%, to £470.9 billion. Within this, repos decreased £31.6 billion, 36%, to £56.5 billion. Excluding repos, customer deposits were down £18.8 billion, 4%, at £414.4 billion, primarily reflecting decreases in CIB, £15.6 billion, Citizens Financial Group, £5.9 billion, Private Banking £1.7 billion , Commercial Banking, £1.0 billion and Ulster Bank, £0.7 billion, which included the impact of £3.2 billion of customer deposits being transferred to liabilities of disposal groups at 31 December 2013, and the effect of exchange rate and other movements of £3.4 billion. These decreases were partially offset by increases in UK Personal & Business Banking, £9.8 billion.
Debt securities in issue decreased £26.8 billion, 28%, to £67.8 billion due to lower funding requirements as a result of the reduction in the overall size of the balance sheet, with most of the reduction in medium term notes in issue.
Retirement benefit liabilities decreased by £0.7 billion, 17%, to £3.2 billion with net actuarial gains of £0.5 billion arising from improved asset returns and higher discount rates partly offset by an increase in the assumed inflation rate. Additional employer contributions of £0.4 billion to the Group’s Main scheme also reduced retirement benefit liabilities.
Subordinated liabilities decreased by £2.8 billion, 10% to £24.0 billion, primarily as a result of the net decrease in dated loan capital with redemptions of £3.4 billion and the effects of exchange and other movements of £1.2 billion being partially offset by issuances of £1.8 billion.
Non-controlling interests decreased by £1.3 billion, 73%, to £0.5 billion, predominantly due to the deconsolidation of Direct Line Group following the further sale of shares and ceding of control in 2013.
Owner’s equity decreased by £9.9 billion, 14%, to £58.7 billion, driven by the £9.0 billion attributable loss for the year together with movements in cash flow hedging reserves, £1.7 billion and foreign exchange reserves, £0.2 billion. Partially offsetting these reductions were share issuances of £0.4 billion, the termination of the contingent capital facility, £0.3 billion, the recognition of actuarial gains in respect of the Group’s defined benefit pension schemes, net of tax, £0.2 billion and other reserve movements, £0.1 billion.
| Cash flow | | | |
| | 2014 | 2013 | 2012 |
| | £m | £m | £m |
| Net cash flows from operating activities | (20,387) | (30,631) | (45,113) |
| Net cash flows from investing activities | 6,609 | 21,183 | 27,175 |
| Net cash flows from financing activities | (404) | (2,728) | 2,017 |
| Effects of exchange rate changes on cash and cash equivalents | 909 | 512 | (3,893) |
| Net decrease in cash and cash equivalents | (13,273) | (11,664) | (19,814) |
2014
The major factors contributing to the net cash outflow from operating activities of £20,387 million were the decrease of £17,948 million in operating assets and liabilities, loans and advances written-off net of recoveries of £5,073 million, other provisions utilised of £3,528 million and the loss before tax of £564 million from continuing and discontinued operations. These were partially offset by the loss on reclassification to disposal groups of £3,994 million and other provisions charged net of releases of £2,711 million.
Net cash inflows from investing activities of £6,609 million related to the net inflows from sales and maturity of securities of £7,744 million and the sale of property, plant and equipment of £1,162 million, offset by net investments in business interests and intangible assets of £1,481 million and net cash outflows from the purchase of property, plant and equipment of £816 million.
Net cash outflows from financing activities of £404 million relate primarily to the repayment of subordinated liabilities of £3,480 million and interest paid on subordinated liabilities of £854 million partly offset by the issue of subordinated liabilities of £2,159 million and proceeds of non-controlling interests issued of £2,147 million.
2013
The major factors contributing to the net cash outflow from operating activities of £30,631 million were the decrease of £28,780 million in operating assets and liabilities, the net loss before tax of £8,066 million from continuing and discontinued operations, loans and advances written-off net of recoveries of £4,090 million and other provisions utilised of £2,066 million. These were partially offset by provisions for impairment losses of £8,432 million and other provisions charged net of releases of £4,422 million.
Net cash inflows from investing activities of £21,183 million related to the net inflows from sales of securities of £19,211 million, the sale of property, plant and equipment of £1,448 million and net divestments of business interests and intangible assets of £1,150 million offset by net cash outflows from the purchase of property, plant and equipment of £626 million.
Net cash outflows from financing activities of £2,728 million relate primarily to the repayment of subordinated liabilities of £3,500 million and interest paid on subordinated liabilities of £958 million partly offset by the issue of subordinated liabilities of £1,796 million.
2012
The major factors contributing to the net cash outflow from operating activities of £45,113 million were the decrease of £48,736 million in operating assets and liabilities, the net loss before tax of £5,388 million from continuing and discontinued operations, loans and advances written off net of recoveries of £3,925 million and other non-cash items of £1,491 million. These were partially offset by the elimination of foreign exchange differences of £7,140 million, provisions for impairment losses of £5,283 million and depreciation and amortisation of £1,854 million.
Net cash inflows from investing activities of £27,175 million related to the net inflows from sales of securities of £26,092 million, the sale of property, plant and equipment of £2,215 million and divestments in business interests and intangible assets of £352 million offset by net cash outflows from the purchase of property, plant and equipment of £1,484 million.
Net cash inflows from financing activities of £2,017 million relate primarily to the issue of subordinated liabilities of £2,093 million and proceeds of non-controlling interests issued of £889 million partly offset by interest paid on subordinated liabilities of £746 million and dividends paid of £301 million.
Capital resources
The following table analyses RBS's regulatory capital resources on a fully consolidated basis at 31 December as monitored by the Prudential Regulation Authority (PRA) for regulatory purposes.
| | 2014 | | | | | |
| | End-point | PRA | | Basel 2.5 basis |
| | CRR basis | transitional basis | | 2013 | 2012 | 2011 | 2010 |
| | £m | £m | | £m | £m | £m | £m |
| Capital | | | | | | | |
| Tier 1 | 39,919 | 47,117 | | 50,626 | 57,135 | 56,990 | 60,124 |
| Tier 2 | 8,717 | 13,626 | | 13,305 | 12,152 | 8,546 | 9,897 |
| | 48,636 | 60,743 | | 63,931 | 69,287 | 65,536 | 70,021 |
| Less supervisory deductions | — | — | | (272) | (2,487) | (4,828) | (4,732) |
| Total regulatory capital | 48,636 | 60,743 | | 63,659 | 66,800 | 60,708 | 65,289 |
| | | | | | | | |
| Risk-weighted assets | £bn | £bn | | £bn | £bn | £bn | £bn |
| Credit risk | | | | | | | |
| - non-counterparty | 264.7 | 264.7 | | 291.1 | 323.2 | 344.3 | 385.9 |
| - counterparty | 30.4 | 30.4 | | 22.3 | 48.0 | 61.9 | 68.1 |
| Market risk | 24.0 | 24.0 | | 30.3 | 42.6 | 64.0 | 80.0 |
| Operational risk | 36.8 | 36.8 | | 41.8 | 45.8 | 37.9 | 37.1 |
| | 355.9 | 355.9 | | 385.5 | 459.6 | 508.1 | 571.1 |
| Asset Protection Scheme relief | — | — | | — | — | (69.1) | (105.6) |
| | 355.9 | 355.9 | | 385.5 | 459.6 | 439.0 | 465.5 |
| | | | | | | | |
| Risk asset ratios | % | % | | % | % | % | % |
Common Equity Tier 1/Core Tier 1 (1) | 11.2 | 11.1 | | 10.9 | 10.3 | 10.6 | 10.7 |
| Tier 1 | 11.2 | 13.2 | | 13.1 | 12.4 | 13.0 | 12.9 |
| Total | 13.7 | 17.1 | | 16.5 | 14.5 | 13.8 | 14.0 |
| (1) Common Equity Tier 1 ratio with effect from 1 January 2014. |
It is RBS's policy to maintain a strong capital base, to expand it as appropriate and to utilise it efficiently throughout its activities to optimise the return to shareholders while maintaining a prudent relationship between the capital base and the underlying risks of the business. In carrying out this policy, RBS has regard to the supervisory requirements of the PRA. The PRA uses risk asset ratio (RAR) as a measure of capital adequacy in the UK banking sector, comparing a bank's capital resources with its risk-weighted assets (the assets and off-balance sheet exposures are 'weighted' to reflect the inherent credit and other risks); by international agreement, the RAR should be not less than 8% with a Tier 1 component of not less than 4%. At 31 December 2014, RBS's total RAR on an end-point CRR basis was 13.7% (2013 - 16.5% on a Basel 2.5 basis) and the Tier 1 RAR on an end-point CRR basis was 11.2% (2013 - 13.1% on a Basel 2.5 basis). For further information refer to Capital and risk management: Capital management on pages 191 to 211.
Business review
Analysis of balance sheet pre and post disposal groups
In accordance with IFRS 5, assets and liabilities of disposal groups are presented as a single line on the face of the balance sheet. As allowed by IFRS, disposal groups are included within risk measures in the Capital and risk management section.
| | 2014 | | 2013 | | 2012 |
| | | | Gross of | | | | Gross of | | | | Gross of |
| | Balance | Disposal | disposal | | Balance | Disposal | disposal | | Balance | Disposal | disposal |
| | sheet | groups (1) | groups | | sheet | groups (2) | groups | | sheet | groups (3) | groups |
| | £m | £m | £m | | £m | £m | £m | | £m | £m | £m |
| Assets | | | | | | | | | | | |
| Cash and balances at central banks | 74,872 | 622 | 75,494 | | 82,659 | 2 | 82,661 | | 79,290 | 18 | 79,308 |
| Net loans and advances to banks | 23,027 | 1,745 | 24,772 | | 27,555 | 22 | 27,577 | | 29,168 | 2,112 | 31,280 |
| Reverse repurchase agreements | | | | | | | | | | | |
and stock borrowing | 20,708 | — | 20,708 | | 26,516 | 41 | 26,557 | | 34,783 | — | 34,783 |
| Loans and advances to banks | 43,735 | 1,745 | 45,480 | | 54,071 | 63 | 54,134 | | 63,951 | 2,112 | 66,063 |
| Net loans and advances to customers | 334,251 | 60,550 | 394,801 | | 390,825 | 1,765 | 392,590 | | 430,088 | 1,863 | 431,951 |
| Reverse repurchase agreements | | | | | | | | | | | |
and stock borrowing | 43,987 | — | 43,987 | | 49,897 | — | 49,897 | | 70,047 | — | 70,047 |
| Loans and advances to customers | 378,238 | 60,550 | 438,788 | | 440,722 | 1,765 | 442,487 | | 500,135 | 1,863 | 501,998 |
| Debt securities | 86,649 | 15,293 | 101,942 | | 113,599 | 24 | 113,623 | | 157,438 | 7,186 | 164,624 |
| Equity shares | 5,635 | 572 | 6,207 | | 8,811 | — | 8,811 | | 15,232 | 5 | 15,237 |
| Settlement balances | 4,667 | — | 4,667 | | 5,591 | — | 5,591 | | 5,741 | — | 5,741 |
| Derivatives | 353,590 | 402 | 353,992 | | 288,039 | 1 | 288,040 | | 441,903 | 15 | 441,918 |
| Intangible assets | 7,781 | 583 | 8,364 | | 12,368 | 30 | 12,398 | | 13,545 | 750 | 14,295 |
| Property, plant and equipment | 6,167 | 503 | 6,670 | | 7,909 | 32 | 7,941 | | 9,784 | 223 | 10,007 |
| Deferred tax | 1,540 | — | 1,540 | | 3,478 | 1 | 3,479 | | 3,443 | — | 3,443 |
| Other financial assets | — | — | — | | — | — | — | | — | 924 | 924 |
| Prepayments, accrued income and | | | | | | | | | | | |
other assets | 5,878 | 1,741 | 7,619 | | 7,614 | 936 | 8,550 | | 7,820 | 742 | 8,562 |
| Assets of disposal groups | 82,011 | (82,011) | — | | 3,017 | (2,854) | 163 | | 14,013 | (13,838) | 175 |
| Total assets | 1,050,763 | — | 1,050,763 | | 1,027,878 | — | 1,027,878 | | 1,312,295 | — | 1,312,295 |
| | | | | | | | | | | | |
| Liabilities | | | | | | | | | | | |
| Bank deposits | 35,806 | 5,128 | 40,934 | | 35,329 | — | 35,329 | | 57,073 | 1 | 57,074 |
| Repurchase agreements and stock | | | | | | | | | | | |
lending | 24,859 | 1,666 | 26,525 | | 28,650 | — | 28,650 | | 44,332 | — | 44,332 |
| Deposits by banks | 60,665 | 6,794 | 67,459 | | 63,979 | — | 63,979 | | 101,405 | 1 | 101,406 |
| Customer deposits | 354,288 | 60,583 | 414,871 | | 414,396 | 3,273 | 417,669 | | 433,239 | 753 | 433,992 |
| Repurchase agreements and stock | | | | | | | | | | | |
lending | 37,351 | 706 | 38,057 | | 56,484 | — | 56,484 | | 88,040 | — | 88,040 |
| Customer accounts | 391,639 | 61,289 | 452,928 | | 470,880 | 3,273 | 474,153 | | 521,279 | 753 | 522,032 |
| Debt securities in issue | 50,280 | 1,625 | 51,905 | | 67,819 | — | 67,819 | | 94,592 | — | 94,592 |
| Settlement balances | 4,503 | — | 4,503 | | 5,313 | — | 5,313 | | 5,878 | — | 5,878 |
| Short positions | 23,029 | — | 23,029 | | 28,022 | — | 28,022 | | 27,591 | — | 27,591 |
| Derivatives | 349,805 | 144 | 349,949 | | 285,526 | 1 | 285,527 | | 434,333 | 7 | 434,340 |
| Accruals, deferred income and | | | | | | | | | | | |
other liabilities | 13,346 | 683 | 14,029 | | 16,017 | 101 | 16,118 | | 14,801 | 2,679 | 17,480 |
| Retirement benefit liabilities | 2,579 | 197 | 2,776 | | 3,210 | 1 | 3,211 | | 3,884 | — | 3,884 |
| Deferred tax | 500 | 362 | 862 | | 507 | — | 507 | | 1,141 | — | 1,141 |
| Insurance liabilities | — | — | — | | — | — | — | | — | 6,193 | 6,193 |
| Subordinated liabilities | 22,905 | 226 | 23,131 | | 24,012 | — | 24,012 | | 26,773 | 529 | 27,302 |
| Liabilities of disposal groups | 71,320 | (71,320) | — | | 3,378 | (3,376) | 2 | | 10,170 | (10,162) | 8 |
| Total liabilities | 990,571 | — | 990,571 | | 968,663 | — | 968,663 | | 1,241,847 | — | 1,241,847 |
| | | | | | | | | | | | |
| For the notes to this table refer to the following page. | | | | | | | | |
| | 2014 | | 2013 | | 2012 |
| | | | Gross of | | | | Gross of | | | | Gross of |
| | Balance | Disposal | disposal | | Balance | Disposal | disposal | | Balance | Disposal | disposal |
| | sheet | groups (1) | groups | | sheet | groups (2) | groups | | sheet | groups (3) | groups |
| | £m | £m | £m | | £m | £m | £m | | £m | £m | £m |
| Selected financial data | | | | | | | | | | | |
| Gross loans and advances to | | | | | | | | | | | |
| customers | 351,711 | 61,090 | 412,801 | | 415,978 | 1,774 | 417,752 | | 451,224 | 1,875 | 453,099 |
| Customer loan impairment provisions | (17,460) | (540) | (18,000) | | (25,153) | (9) | (25,162) | | (21,136) | (12) | (21,148) |
| Net loans and advances to | | | | | | | | | | | |
customers (4) | 334,251 | 60,550 | 394,801 | | 390,825 | 1,765 | 392,590 | | 430,088 | 1,863 | 431,951 |
| | | | | | | | | | | | |
| Gross loans and advances to banks | 23,067 | 1,745 | 24,812 | | 27,618 | 22 | 27,640 | | 29,282 | 2,112 | 31,394 |
| Bank loan impairment provisions | (40) | — | (40) | | (63) | — | (63) | | (114) | — | (114) |
Net loans and advances to banks (4) | 23,027 | 1,745 | 24,772 | | 27,555 | 22 | 27,577 | | 29,168 | 2,112 | 31,280 |
| | | | | | | | | | | | |
| Total loan impairment provisions | 17,500 | 540 | 18,040 | | (25,216) | (9) | (25,225) | | (21,250) | (12) | (21,262) |
| | | | | | | | | | | | |
| Customer REIL | 26,842 | 1,335 | 28,177 | | 39,322 | — | 39,322 | | 40,993 | 13 | 41,006 |
| Bank REIL | 42 | — | 42 | | 70 | — | 70 | | 134 | — | 134 |
| REIL | 26,884 | 1,335 | 28,219 | | 39,392 | — | 39,392 | | 41,127 | 13 | 41,140 |
| | | | | | | | | | | | |
| Gross unrealised gains on debt | | | | | | | | | | | |
| securities | 1,316 | 261 | 1,577 | | 1,541 | — | 1,541 | | 3,946 | 230 | 4,176 |
| Gross unrealised losses on debt | | | | | | | | | | | |
| securities | (145) | (137) | (282) | | (887) | — | (887) | | (1,832) | (15) | (1,847) |
| (2) | Primarily investment in associate (Direct Line Group) and Illinois branches of Citizens. |
| (3) | Primarily Direct Line Group. |
| (4) | Excludes reverse repos |
Business review Capital and risk management
| Capital and risk management |
| 165 | Overview |
| 172 | Risk governance |
| 176 | Risk appetite and culture |
| 180 | Conduct risk |
| 183 | Operational risk |
| 187 | Regulatory risk |
| 189 | Reputational risk |
| 191 | Capital management |
| 212 | Liquidity and funding risk |
| 227 | Credit risk |
| 270 | Balance sheet analysis |
| 294 | Market risk |
| 319 | Country risk |
| 327 | Pension Risk |
| 328 | Business risk |
| 329 | Strategic risk |
Business review Capital and risk management
| Overview |
| 166 | Presentation of information |
| 166 | Business model and associated risks |
| 167 | Risk coverage |
| 170 | Top and emerging risk scenarios |
Business review Capital and risk management
Overview*
Presentation of information
Except as otherwise indicated by an asterisk (*), information in the Capital and risk management section (pages 164 to 330) is within the scope of the Independent Registered Public Accountants report. Disclosures in this section include disposal groups in relevant exposures unless otherwise indicated. Refer to pages 162 and 163 for the Analysis of balance sheet pre and post-disposal groups.
Business model and associated risks
RBS aims to become a bank that its customers and all other stakeholders can depend on. It intends to do so by focusing on Personal & Business Banking (PBB), Commercial & Private Banking (CPB) and Corporate & Institutional Banking (CIB) customers, in its main market of the UK. By delivering only services that meet their needs, it aims to achieve an appropriate return. Accordingly, RBS plans to simplify its services as well as the processes it uses to deliver them, enabling RBS to provide customers with better value services. It aims to become the number one bank in the UK for customer service, trust and advocacy by 2020.
At present RBS serves approximately 24 million customers worldwide. UK PBB offers individuals and small businesses a variety of traditional retail banking products, including current and savings accounts, residential mortgages and credit cards, while CPB provides both businesses and high-net-worth individuals with loan products and investment services. Both are focused on the UK. CIB offers wholesale banking services, including debt financing and fixed income trading, to corporations and financial institutions across a wide range of countries. Ulster Bank, part of PBB, offers loan and investment products, as well as transactional services, to individuals and businesses in Ireland.
The products are delivered through a diverse array of channels, including extensive branch networks, in-store branches and call centres, in addition to online and mobile channels.
The main sources of earnings are interest income from lending and fee income from transactional and other services. Given the low interest rate environment in both the UK and the US, its net interest margin, that is, the difference between the interest it earns from lending and the interest it pays on deposits, has been under pressure. In order to offset this pressure, work is underway to reduce costs and increase non-interest income.
RBS is reducing costs through rationalisation, integration and simplification. For example, PBB is rationalising its service delivery channels and simplifying the operations that support them. The other franchises are taking similar steps.
RBS also owns a number of businesses which it is divesting as it seeks to refocus on its UK customers and reduce its risk profile as well as to comply with regulatory requirements. It is in the process of selling its stake in Citizens Financial Group Inc (CFG), a subsidiary offering loan and investment products, together with transactional services, to customers in the US. Similarly, it is committed to selling Williams & Glyn, which provides retail and commercial banking services in the UK, in the next few years. Other businesses identified for divestment and wind-down include the international private banking activities of CPB and RBS Securities Inc respectively. Finally, RBS continues to reduce the assets held in RCR (refer to page 149 for further details). These divestment and rationalisation projects expose it to execution and strategic risk.
Finally, the Group is also exposed to a range of other risks through its customer businesses including pension, business, regulatory, reputational and strategic risk. This is set out in the Risk coverage section and illustrated by the concentration of risk-weighted assets (RWAs) by segment below.
Risk-weighted assets by segment
*unaudited
Business review Capital and risk management
Risk coverage
The main risk types faced by RBS are presented below. For further information, refer to pages 180 to 330.
| Risk type | How the risk arises | 2014 overview |
Conduct and legal risk | Conduct risk can result in fines and reputational damage if customers are not treated in line with their and other stakeholders’ expectations. Conduct risk exists across all stages of RBS’s relationships with its customers, from sales through service delivery to post-sales processes. It also exists in the activities RBS undertakes to manage its business, from the development of business strategies, through governance and human resource management. Conduct risk also exists if RBS does not take effective action to prevent fraud, bribery and money laundering. | RBS continued to remediate historical conduct issues, while also restructuring its customer-facing businesses and support functions around the needs of its customers. Actions taken by RBS to address underlying control deficiencies included strengthening significantly the systems and controls governing RBS’s LIBOR submissions, and simplifying RBS��s retail product offering and sales processes. The conduct risk framework was also further developed, with the embedding of a new Conduct and Regulatory Affairs (C&RA) operating model, and the orientation of C&RA’s assurance coverage and testing towards customer outcomes. The impact of conduct issues resulted in litigation and conduct costs remaining high at £2.2 billion in 2014, albeit lower than the £3.8 billion recorded in 2013. |
| Regulatory risk | Regulatory risk arises from RBS’s regulatory, business or operating environments and from how RBS responds to them. | The level of regulatory risk remained high as policymakers and regulators continue to strengthen regulations and supervision in response to the events of 2007 and 2008. RBS will in future focus CIB’s business model on its leading positions in UK rates, debt capital markets and foreign exchange; this will leave RBS well-placed to implement the ring-fencing requirements, in 2019. |
| Operational risk | Operational risk may arise from a failure to manage operations, transactions and assets appropriately. It may arise from human error, an inability to deliver change on time or adequately, or the unavailability of technology services or the loss of customer data. Fraud and theft are sources of operational risk, as is the impact of natural and man-made disasters. It may also arise from a failure to take appropriate measures to protect assets or take account of changes in law. | RBS’s transformation plan is material and complex affecting all business areas and functions simultaneously and so has the potential to increase operational risk profile at least in the short term. Significant investments were made to improve technology resilience for core banking services, operating practices and risk management across the three lines of defence. In particular, enhancements were made to cyber security programmes, mitigating a number of vulnerabilities. |
| Capital adequacy risk | Capital adequacy risk arises from inefficient management of capital resources. | Key milestones achieved in 2014 included the sell down of the first tranche of CFG; run down of the RCR and CIB assets; and the sell down of the RBS N.V. AFS portfolio. A £3.1 billion improvement in CET1 capital and a £73 billion reduction in RWAs resulted in the CET1 ratio improving during the year by 260 basis points from 8.6% to 11.2%. Risk reduction strategies contributed to the RWA reduction, £40 billion in CIB and £25 billion in RCR. The improvement in CET1 capital reflected profit of £0.7 billion from continuing operations, £0.6 billion gains on available-for-sale securities, share issuance of £0.5 billion and lower regulatory deductions primarily relating to deferred tax assets (£1.0 billion) and prudential valuation adjustment (£0.4 billion). RBS’s current Pillar 2A requirement is 3.5% of RWAs at 31 December 2014. From 1 January 2015, 56% of the total Pillar 2A or 2.0% of RWAs will be met from CET1 capital. Based on capital that is required to be held to meet the overall financial adequacy rule, including holding current estimates of Pillar 2A constant, RBS estimates that its ‘fully phased’ CET1 maximum distributable amount (MDA) requirement would be 10.5% in 2019. Assuming a 13% a steady state CET1 capital ratio is achieved, RBS currently estimates that it would have a 2.5% headroom to MDA trigger in 2019. A significant reduction of £142 billion or 13% in the leverage exposure to £940 billion and a year on year increase in Tier 1 capital (100% CET1 currently) contributed to an 80 basis points improvement in leverage ratio from 3.4% to 4.2%. Full implementation of the 2014 Basel III leverage ratio framework, particularly on securities financing transactions, also contributed to the leverage exposure reduction. |
*unaudited
Business review Capital and risk management
| Risk type | How the risk arises | 2014 overview |
| Liquidity and funding risk | Liquidity and funding risk arise through the maturity transformation role that RBS performs. It is exposed to capital adequacy risk if it manages its capital resources inefficiently. Liquidity and funding risk arises from RBS’s day-to-day operations. | Liquidity metrics remained strong reflecting balance sheet and risk reduction as well as growth in UK PBB deposits: the liquidity coverage ratio improved to 112%; the net stable funding ratio was 121%; and the liquidity portfolio of £151 billion covered short-term and total wholesale funding of £28 billion and £90 billion by more than five and 1.5 times respectively. Based on its assessment of the Financial Stability Board’s proposals, RBS may issue £3 - £5 billion per annum of qualifying debt between 2015 - 2019 to meet future total loss absorbing capital requirements. |
| Reputational risk | Reputational risk can arise from the conduct of either RBS as a whole or that of the individuals it employs; from the activities of customers and the countries in which they operate; from the products RBS offers and the transactions it supports; and from its operations and infrastructure. | The most material threat to RBS’s reputation continued to originate from historical and more recent conduct deficiencies. RBS has been the subject of investigations and review by a number of regulators, some of which have resulted in fines and public censure. |
| Credit risk | The most significant source of credit risk is lending. RBS offers a number of lending products where it has an obligation to provide credit facilities to a customer. A further significant source of credit risk arises from activities in the derivatives and securities financing transaction markets, which result in counterparty credit risk (the risk of financial loss arising from the failure of a customer to meet obligations that vary in value by reference to a market factor). RBS holds some debt securities generally for liquidity management purposes, and is exposed to credit risk as a result. It is also exposed to credit risk from off-balance sheet products such as trade finance activities and guarantees. | RBS’s credit risk portfolio continued to improve with an overall reduction in exposure, an improvement in credit quality and a material provision release in 2014. These improvements were driven by supportive economic and market conditions in the UK and Ireland, better liquidity and increased collateral values, and also reflected improvements in credit risk measurement. Balance sheet credit exposure after credit mitigation decreased by 9% to £353 billion and credit RWAs fell by £62 billion or 17% to £295 billion primarily reflecting risk reduction and RCR disposal strategy. The wind-down of CIB’s US asset-backed products business contributed to a £13 billion decrease in asset-backed securities, now at £25 billion, an £86 billion reduction on the 2008 peak of £111 billion. Impairment provisions of £18.0 billion, down £7.2 billion, covered risk elements in lending of £28.2 billion, down £11.2 billion, by 64%. Commercial real estate lending fell by £9.3 billion to £43.3 billion, of which £13.3 billion was in risk elements in lending with a provision coverage of 68%. Favourable market conditions, particularly in Ireland, resulted in impairment releases of £3.6 billion more than offsetting new impairment charges of £2.4 billion. This led to a net release of £1.2 billion, of which £1.3 billion was in RCR and £0.4 billion in Ulster Bank, partly offset by net impairment charges of £0.3 billion in UK PBB and £0.2 billion in CFG. |
| Market risk | The majority of RBS’s traded market risk exposure arises in CIB and RCR through transactions in financial instruments including debt securities, loans, deposits and equities, as well as securities financing and derivatives. The majority of its non-traded market risk exposure arises from retail and commercial banking activities in all franchises from assets and liabilities that are not classified as held for trading. | RBS’s traded market risk profile decreased significantly, with market risk limits being reduced across all businesses, in some instances by 50-60%. Average trading value-at-risk (VaR) decreased significantly during the year to £27.8 million, 35% of the 2013 average, reflecting risk reductions in CIB and RCR, as well as the effect of a more comprehensive economic view of risk from the incorporation of credit and funding valuation adjustments in the VaR calculation. Market risk RWAs also decreased by £6.3 billion to £24.0 billion. |
*unaudited
Business review Capital and risk management
| Risk type | How the risk arises | 2014 overview |
| Pension risk | RBS is exposed to pension risk through its defined benefit schemes worldwide and the variations in their value. The five largest schemes represent around 96% of pension liabilities. The largest is the Royal Bank of Scotland Group Pension Fund (‘Main scheme’) and this is the principal source of pension risk. | The triennial actuarial funding valuation of the Main scheme was agreed in May 2014 and showed an excess in the value of liabilities over the value of assets of £5.6 billion at 31 March 2013; a ratio of 82%. In 2014, various pension stress-testing initiatives were undertaken, both on internally defined scenarios and those to meet integrated Prudential Regulation Authority and European Banking Authority stress testing requirements. |
| Country risk | Country risk arises from possible economic or political events in each country to which RBS has exposure, and from unfavourable conditions affecting daily operations in a country. It has the potential to affect all parts of RBS’s portfolio across wholesale and retail activities that are directly or indirectly linked to the country in question. The activities of several customer businesses, particularly CIB but also Ulster Bank and CFG, expose RBS to country risk. | RBS maintained a cautious stance as many clients continued to reduce debt levels. Total eurozone net balance sheet exposure decreased by £5 billion or 5% to £97.6 billion. Within this amount, eurozone periphery exposures decreased by £10 billion, or 25%, to £31 billion, primarily in Spain, reflecting the disposal of legacy liquidity portfolio bonds, and in Ireland and Italy. Total exposure to Greece was £0.4 billion but only £120 million after the effect of collateral and guarantees. Limits for Russia and Ukraine were adjusted, additional credit restrictions were placed on new business and exposures were reviewed against international sanctions. |
| Business risk | Business risk exists at all levels of the organisation and is generated at the transaction level. It is affected by other risks RBS faces, which could contribute to any adverse changes in the bank’s revenues or costs. | RBS reduced its business risk profile as it curtailed riskier activities in CIB, made disposals through RCR, and announced an intensified cost management programme. |
| Strategic risk | Strategic risk arises from strategic decisions that fail to reflect the operating environment, or which do not take adequate account of execution challenges. These include decisions related to RBS products and services which have implications for profitability, risk, the customer base, and for business growth. | In early 2014, RBS announced the results of a strategic review with a defined plan to shift the business mix towards the UK and the retail and commercial banking segments, with the aim of a lower risk profile. The year saw good progress, with results in general exceeding targets and run-down or sell-off of non-core assets ahead of schedule. Capital ratios increased considerably, a significant step towards targeted levels of financial strength which, when attained, will provide RBS with more strategic options. However, RBS continued to work through the impact of tougher regulatory regime on banks. |
*unaudited
Business review Capital and risk management
Top and emerging risk scenarios
As part of the risk management process, top and emerging risk scenarios are identified and monitored. These are events that, should they materialise, would lead to a significant unexpected negative outcome, thereby causing RBS as a whole, or a particular business, to fail to meet one or more strategic objectives. In assessing the potential impact of risk materialisation, both financial and reputational considerations are taken into account.
Management is concerned with a range of risk scenarios, but some have attracted particular attention from senior management during the past year. These were grouped into three broad categories:
| · | Macro-economic risks and other external risks; |
| · | Regulatory and legal risks; and |
| · | Risks related to operations. |
Further information on these and other risks facing RBS is detailed in Risk factors on page 466.
The top and emerging risks were as follows:
Macro-economic and other external risks
(i) Risks related to the macro-economy
RBS remains vulnerable to changes in the external economic environment. Among other scenarios, the following could have a material negative impact: a recession in the UK in any of our other major markets; a resumption of the eurozone crisis (including a worsening of the situation in Greece); global deflation; large house price falls in the UK; and major geopolitical instability.
Impact on RBS
The ability to hit strategic targets could be reduced owing to multiple effects, including lower-than-expected revenues, increases in impairments and a material deterioration in key prudential metrics. Exiting non-strategic businesses or portfolios could be disrupted by market volatility.
Mitigants
RBS has improved its capital, liquidity and leverage ratios and has passed regulatory stress tests. A number of higher risk portfolios have been exited or reduced. Stress testing is used to inform strategic planning.
(ii) The effect of the run-up to, and the result of, the UK general election on performance and strategy
Political party statements suggest that the election outcome will affect matters that are material to RBS’s strategy, including banking levy rates, banking sector competition and remuneration, the approach to sale of the public stake, and the UK’s position in the EU. Of note is the potential for a referendum on the UK’s membership of the EU during the next parliament, which would increase macro-economic and operational uncertainty.
*unaudited
Impact on RBS
Achievement of strategic objectives in general, more specifically its ability to generate income and retain high quality personnel, and its strategy, structure and attractiveness to investors, may all be affected to varying degrees in a range of election-related scenarios.
Mitigants
RBS actively monitors, and considers responses to, varying UK election outcomes to ensure that it is well prepared for all eventualities.
Regulatory and legal risks
(i) Risks to income, costs and business models arising from existing and future regulatory requirements or decisions
RBS faces potentially sustained increases in regulatory capital needs, but also risks related to regulatory intervention that affect its business models. These include: the results of a review of the personal current account and small business banking markets; Independent Commission on Banking ring fencing proposals and US Intermediate Holding Company requirements; and Risk Data Aggregation and Reporting.
Impact on RBS
RBS risks increased capital requirements, reduced income or raised costs due to business model changes and fines, remediation costs or legal action if it fails to comply with regulatory requirements. Its reputation may also suffer.
Mitigants
RBS considers proposed or potential regulatory requirements in strategic and financial planning rounds and plans accordingly.
(ii) Risks to income, costs and business models arising from existing and future regulatory requirements specifically related to conduct
RBS continues to manage issues related to its past business conduct. Remediation costs for some of these could remain high, while the impact of outcomes of other reviews remains uncertain. Moreover, it faces ongoing scrutiny of its business conduct, particularly towards retail customers, and of its ability to embed a strong appreciation of risk and good conduct across the bank.
Impact on RBS
RBS risks fines, remediation costs, legal action and reputational damage, but also lower income or higher expenses due to business model changes.
Mitigants
RBS continues to work to deal with past conduct breaches. Major programmes are in place to ensure that future conduct meets the expectations of external stakeholders and to ensure that a strong and pervasive risk culture is embedded throughout RBS.
Business review Capital and risk management
Risk related to operations
(i) Increased losses arising from a failure to execute successfully major projects
RBS has a number of transformational, execution and IT development projects under way, the successful conclusion of which are essential to meet new regulatory and strategic requirements. These new requirements affect its organisational structure, its business strategies, its information technology systems, its operational processes and its product offerings. Given the number, scale and complexity of these projects, there is a risk that it will not complete them successfully.
Impact on RBS
Failure to complete these projects successfully would affect RBS’s ability to achieve its strategic objectives. It may also incur regulatory fines, lose market share and suffer damage to its reputation.
Mitigants
RBS is working to implement change in line with its project plans while assessing the risks to implementation and taking steps to mitigate those risks where possible.
(ii) An increase in RBS’s obligations to support pension schemes
RBS has established various pension schemes for its employees as a result of which it has incurred certain obligations as sponsor of these schemes. If economic growth stagnates and interest rates remain low as a result, the value of pension scheme assets may not be adequate to fund the pension scheme’s liabilities. All of the businesses are exposed to this risk.
Impact on RBS
RBS’s pension schemes’ combined deficit had risen by £2.1 billion at the most recent valuation, requiring RBS to set aside additional capital in support. Additional capital required if the deficit widened further would depend on the size of the deficit, the efficacy of management actions undertaken to address it, and the regulatory view of those actions.
RBS increased its cash contributions to the schemes to address the increased deficit. Similarly, additional contributions required if the deficit widened further would depend on the size of the deficit. RBS undertakes a number of stress tests and scenario analyses on its material defined benefit pension schemes each year as part of its risk measurement framework.
Mitigants
The trustee is responsible for the investment of the Main scheme’s assets, which are held separately from RBS’s own assets. To restrict liability increases, defined benefit pension schemes are closed to new members and terms for existing members have been altered. Deficit-closing payments are spread over ten years to reduce the strain on income.
(iii) Impaired performance due to an inability to recruit or retain suitable staff
RBS is undergoing significant organisational change, the result of a need to implement new business strategies and respond to a changing external environment. The pace of change, coupled with the associated uncertainty may cause experienced staff members to leave and prospective staff members not to join. Although these risks concern all customer businesses, they particularly affect CIB and CFG.
Impact on RBS
If it cannot retain or attract the necessary staff members, the RBS may be unable to implement its business strategies or meet regulatory requirements on time, or at all. It may also experience control failures. Its reputation may suffer as a result.
Mitigants
RBS has communicated expected changes in its organisational structure to members of staff, implementing plans aimed at minimising unexpected staff losses. It is also working to develop and implement an enhanced recruitment strategy.
(iv) Increased losses arising from cyber attacks
RBS has experienced cyber attacks, which are increasing in frequency and severity across the industry. This risk affects all customer businesses.
Impact on RBS
A successful cyber attack could lead to fraudulent activity or the loss of customer data. RBS could experience significant losses as a result of the need to reimburse customers, pay fines or both. Further, a successful cyber attack could cause significant damage to its reputation.
Mitigants
RBS has participated in an industry-wide cyber attack simulation. It has also initiated a large-scale programme to improve controls over user access. It has reviewed its websites and taken steps to rationalise them, put additional anti-virus protections in place and taken steps to educate staff on information protection.
(v) Increased losses arising from the failure of information technology systems
The information technology systems are complex and at risk of disruption. Recovering from failure can be challenging.
Impact on RBS
A failure of information technology systems could lead to an inability to process transactions or provide services to its customers. Should a failure not be rectified promptly, it might lose funding, be subject to fines, incur remediation costs or face legal action. Its reputation might also suffer.
Mitigants
A major investment programme has significantly improved the resilience of the systems and more benefits are expected. It has improved back-up system sustainability and created a ‘shadow bank’ able to provide basic services if needed. It is also improving the documentation of critical business functions.
*unaudited
Business review Capital and risk management
| Risk governance |
| 173 | Governance structure |
| 174 | Three lines of defence |
| 175 | Management structure |
Business review Capital and risk management
Risk governance*
Governance structure
RBS is committed to achieving the highest standards of corporate governance in every aspect of its business, including risk management. A key aspect of the Board’s responsibility as the main decision-making body is the setting of risk appetite (refer to page 176 for more information on risk appetite) to ensure that the levels of risk RBS is willing to accept in the attainment of its strategic business and financial objectives are clearly understood. The Board delegates authority for risk management to specific committees.
The risk governance structure and the main purposes of each of the committees is illustrated below:
*unaudited
Business review Capital and risk management
Three lines of defence
The three lines of defence model is used industry-wide for the management of risk. It provides a clear set of principles by which to implement a cohesive operating model, one that defines accountabilities and responsibilities for managing risk across the organisation.
First line of defence - Management and supervision
The first line of defence includes customer franchises, Technology and Operations and support functions such as HR and Communications. Responsibilities include:
| · | Owning, managing and supervising, within a defined risk appetite, the risks which exist in the business area. |
| · | Ensuring appropriate controls are in place to mitigate risk: balancing control, cost, customer service and competitive advantage. |
| · | Ensuring that the culture of the business supports balanced risk decisions and compliance with policy, laws and regulations. |
| · | Ensuring that the business has effective mechanisms for identifying, reporting and managing risk and controls. |
Second line of defence - Oversight and control
The second line of defence includes RBS Risk Management and Conduct and Regulatory Affairs.
Responsibilities include:
| · | Owning and developing the risk and control policies, limits and tools for the business to use to discharge its responsibilities. |
| · | Overseeing and challenging the management of risks and controls. |
| · | Leading the design, development and communication of the bank's risk culture and appetite. |
| · | Analysing the aggregate risk profile and ensuring that risks are being managed to the desired level (risk appetite). |
| · | Providing expert support and advice to the business on risk management. |
| · | Providing senior executives with relevant management information and reports and escalating concerns where appropriate. |
Third line of defence - Internal Audit
Responsibilities include:
| · | Providing assurance on the key risks to the organisation by assessing the entire control framework. |
| · | Holding RBS Risk Management accountable for establishing an appropriate risk management framework. |
*unaudited
Business review Capital and risk management
Management structure
RBS’s management structure and the main elements of each role are illustrated below.
The RBS Chief Risk Officer (CRO) leads RBS Risk Management. The CRO reports directly to the Chief Executive and the Board Risk Committee, with a right of access to the Chairman of the Board Risk Committee.
RBS Risk Management is an independent function, structured by risk discipline to facilitate the effective management of risk.
In 2014, Risk Management, which had previously been spread across the different business segments, re-organised itself into five functional areas: Operational Risk, Support Functions & Divested Businesses; Credit Risk; Market Risk; Enterprise-Wide Risk Management and Risk Infrastructure. Directors of Risk were also appointed for each of the franchises and for Services. The streamlined structure consolidates risk information, allowing for more efficient decision-making.
The directors of risk functions are responsible for RBS-wide risk appetite and standards within their respective disciplines and report directly to the CRO.
CROs are in place for certain jurisdictions and legal entities to meet local regulatory and governance requirements. They lead the risk management teams locally in support of functional risk heads where teams follow a functional operating model. The key CRO roles report directly to the RBS CRO.
Risk committees in the customer businesses oversee risk exposures arising from their business activities and focus on ensuring that they are adequately monitored and controlled.
| (2) | Conduct and Regulatory Affairs |
Conduct & Regulatory Affairs (C&RA) is led by the Chief Conduct & Regulatory Affairs Officer, who reports directly to the Chief Executive. It is responsible for providing oversight of conduct risk and regulatory risk at RBS, and does so by setting bank-wide policy and standards, providing advice to each customer business, and ensuring that the mitigating controls are suitable. C&RA also provides leadership of the bank’s relationships with its regulators.
The functional heads (the directors of Remediation, Compliance Services, RBS Americas, Financial Crime, Regulatory Affairs and Advisory) report directly to the Chief Conduct & Regulatory Affairs Officer. Each is responsible, where appropriate, for the bank-wide risk appetite and standards of their respective areas:
A Chief Compliance Officer in each franchise, reporting to the Director of C&RA Advisory, provides advisory support to assist businesses in their management of conduct, regulatory affairs and financial crime.
*unaudited
Business review Capital and risk management
| Risk appetite and culture |
| 177 | Risk appetite |
| 177 | Strategic risk objectives |
| 178 | Risk appetite measures |
| 179 | Culture, values and remuneration |
Business review Capital and risk management
Risk appetite and culture*
Risk appetite
Risk appetite is both a key business tool and an integral part of risk management. It is aligned with RBS’s strategic objectives, aiming to strike an optimal balance between building a sustainable risk profile and creating long-term value for customers, investors and wider stakeholders. The risk appetite framework seeks to ensure that each business can withstand significant deteriorations in economic and market conditions.
The Board reviews and approves the risk appetite framework and targets annually, which establishes the level and types of risks RBS is able and willing to take in order to meet its:
| · | Strategic objectives - The strategic plan is built on the core foundations of serving customers well, building a sustainable risk profile and creating long-term value for its shareholders; and |
| · | Wider obligations to stakeholders - If RBS is safe and sound and puts serving customers at the heart of its thinking, it will also perform well for its owners, employees, regulators and communities. |
Risk appetite is cascaded and embedded across RBS. The risk appetite framework provides each business with a greater understanding of acceptable risk levels, aligning commercial strategies with the most effective use of financial resources, such as capital and funding. The risk appetite framework allows RBS to focus on its key business strengths and competitive advantages over the long term.
Strategic risk objectives
Risk management plays an integral role in the delivery of strategic goals. The implementation of a stronger and more effective culture of risk management and control provides the platform necessary to address vulnerabilities, rebuild on core strengths and position RBS on a sustainable and profitable path for future growth.
Financial strength and resilience are at the heart of the strategic plan. RBS has defined this level of robustness as that which is capable of achieving and sustaining a standalone credit rating (i.e. without government support) that is in line with those of its strongest international peers.
Given this central aim, the Board has set out four key strategic objectives, aligned with the strategic plan:
| · | Maintain capital adequacy. To ensure there is sufficient capital resources to meet regulatory requirements and to cover the potential for unexpected losses in its asset portfolio. |
| · | Deliver stable earnings growth. To ensure that strategic growth is based around a longer-term risk-versus reward consideration, with significantly lower volatility in underlying profitability than was seen during the financial crisis. |
| · | Ensure stable and efficient access to funding and liquidity. To ensure that there is sufficient funding to meet its obligations, taking account of the constraint that some forms of funding may not be available when they are most needed. |
| · | Maintain stakeholder confidence. To ensure that stakeholders have confidence in RBS’s ability to attain its strategic objectives and establish and maintain an appropriate business culture and operational controls. |
Each objective is essential in its own right, but also mutually supportive of the others. The strategic risk objectives are the bridge between the RBS-wide business strategy and the frameworks, limits and tolerances that are used to set risk appetite and manage risk in the business franchises on a day-to-day basis.
Business review Capital and risk management
Risk appetite measures
Risk appetite starts with the strategic goals and risk philosophy set by the Board and is cascaded through key targets, limits and risk tolerances that influence decision making at all levels.
The risk appetite framework is based on four main pillars:
| · | Business and financial targets - RBS has set long-term targets for capital ratio, leverage ratio, loan:deposit ratio, the return on tangible equity and cost:income ratio. These are the broad boundaries within which it operates. |
| · | Quantitative risk appetite targets - Risk appetite is also aligned with potential risk exposures and vulnerabilities under severe but plausible stress conditions. Quantitative targets, to be met under stress conditions, are set around the strategic risk objectives for maintaining capital adequacy, delivering stable earnings growth and ensuring stable and efficient access to funding and liquidity. |
| · | Qualitative risk appetite targets - The fourth strategic risk objective of maintaining stakeholder confidence covers qualitative aspects relating to the culture of risk management and controls and meeting stakeholder expectations. Stakeholders include customers, employees, investors, societies and communities. |
| · | Risk control frameworks and limits - Risk control frameworks set detailed tolerances and limits for material risk types (e.g. credit risk and market risk) that are used to manage risk on a day-to-day basis. These limits support and are required to be consistent with the high-level risk appetite targets. |
The framework is supported by a programme of communication, engagement and training rolled out across RBS to embed a wide understanding of the purpose and value of an effective risk appetite.
Risk appetite supports value creation in a safe, sustainable way. It is embedded within the annual planning and budgeting process. The risk implications of business strategies are assessed to ensure that those strategies will not cause RBS to exceed agreed risk appetite. A range of different but complementary tools has been developed to measure whether strategic plans are consistent with risk appetite, to test broader ‘what if’ questions and to assess the impact of changes in key assumptions:
| · | Stress testing - assesses how earnings, capital and funding positions change under an unfavourable, yet plausible, scenario. Stress scenarios can differ by theme, geographical location or severity. |
| · | Economic capital - provides complementary insights, with a breadth of understanding of risk profile changes and ‘tail risks’ across millions of different modelled scenarios. |
| · | Sensitivity analysis - provides ‘ready reckoners’ around changes in key variables. It offers a high-level view on questions such as ‘what if gross domestic product worsened by a further 1%’, identifying certain tipping points where the bank’s risk profile moves outside appetite. |
Effective processes for reporting the results have also been developed, presenting the Board and senior management with a more holistic and dynamic view of key risk exposures.
Risk appetite statements
Risk appetite is set at RBS-wide level then cascaded and embedded across all business areas. Each franchise is required to develop, own and manage a risk appetite statement aligned with the bank’s risk appetite that:
| · | Covers the limits and tolerances in place for all identified material risks; and |
| · | Enables each business to understand its acceptable levels of risk. |
By setting a clear risk appetite and embedding a strong risk culture throughout its businesses, RBS can identify, measure and control risk exposures and respond effectively to shocks. Each franchise is responsible for ensuring its strategic plans are consistent with its approved risk appetite.
Business review Capital and risk management
Risk control frameworks and limits
Risk control frameworks and their associated limits are an integral part of the risk appetite framework and a key part of embedding risk appetite targets in day-to-day risk management decisions. The risk control frameworks manage risk by expressing a clear tolerance for material risk types that is aligned to business activities.
The Group Policy Framework directly supports the qualitative aspects of risk appetite, helping to rebuild and maintain stakeholder confidence in RBS’s risk control and governance. Its integrated approach is designed to ensure that an appropriate standard of control is set for each of the material risks it faces, with an effective assurance process put in place to monitor and report on performance. Risk appetite has its own policy standard within the Group Policy Framework. This standard sets out clear roles and responsibilities to set, measure, cascade and report performance against risk appetite, and provides assurances that business is being conducted within approved risk limits and tolerances.
Culture, values and remuneration
Objectives for risk culture
The establishment of a strong risk culture is essential to the realisation of RBS’s ambition to build “a truly customer-centric bank”. A strong risk culture is a key part of ensuring risk appetite is effectively embedded across RBS. The link between risk appetite and strategic objectives encourages people at all levels of the business to think about risk, how they identify it and how they manage it. It incorporates the quantitative and qualitative aspects of risk and uses both absolute and relative risk measures.
Risk culture policies
A core principle behind the development of the risk appetite framework is that risk appetite contributes to a strong risk management culture, in which risk is clearly and meaningfully aligned with business behaviours and outcomes. RBS’s values - of “serving customers”, “working together”, “doing the right thing” and “thinking long term” - act as a clear starting point for a strong and effective risk culture. A wide range of communication and engagement activities (detailed below) has been undertaken to discuss the meaning of each value with employees and how they affect and guide day-to-day activities.
The embedding of RBS’s values into a strong risk culture is supported by a revised and more focused Code of Conduct. The Code provides guidance on expected behaviour and sets out the standards of conduct that support the values. It explains the effect of decisions that are taken and describes the principles that must be followed.
These business principles cover conduct-related issues as well as wider business activities. They focus on desired outcomes, with practical guidelines to align the values with commercial strategy and actions. The embedding of business principles facilitates sound decision making and a clear focus on good customer outcomes in ‘the moments that matter’. It is aligned with the people management and remuneration processes to support a positive and strong risk culture through appropriate incentive structures.
A simple decision-making guide (called the “YES check”) has been included in the Code of Conduct. It is a simple, intuitive set of five questions, designed to ensure the values guide day-to-day decisions:
| · | Does what I am doing keep our customers and RBS safe and secure? |
| · | Would customers and colleagues say I am acting with integrity? |
| · | Am I happy with how this would be perceived on the outside? |
| · | Is what I am doing meeting the standards of conduct required? |
| · | In five years’ time would others see this as a good way to work? |
Each question is a prompt to think about the situation and how it fits with RBS’s values. It ensures that employees can think through decisions that do not have a clear answer, guiding the judgements behind their decisions and actions.
Training
Across the risk management function, a series of events and activities have been undertaken to bring alive the bank’s values and culture for employees. This is supported by performance management processes that hold individuals to account for poor behaviour and reward the behaviour that supports the bank’s purpose, vision and values.
RBS Risk Management runs a Risk Academy which helps to train staff and to spread a common risk culture across the bank. Training plans are aligned with Risk function strategy to ensure staff have the skills and capabilities to support business and to meet changing regulatory and policy requirements.
Risk-based key performance indicators
RBS-wide remuneration policy requires remuneration to be aligned with, and to support, effective risk management. The policy ensures that the remuneration arrangements for all employees reflect the principles and standards prescribed by the UK Remuneration Code. For further information refer to page 93.
Business review Capital and risk management
| Conduct risk |
| 181 | Definition |
| 181 | Sources of risk |
| 181 | Key developments in 2014 |
| 181 | Governance |
| 182 | Controls and assurance |
| 182 | Risk appetite |
| 182 | Risk monitoring and measurement |
Business review Capital and risk management
Conduct risk*
Definition
Conduct risk is the risk that the behaviour of RBS and its staff towards customers, or in the markets in which it operates, leads to unfair or inappropriate customer outcomes and results in reputational damage, financial loss or both. The damage or loss may be the result of breaches of regulatory rules or laws, or of failing to meet customers’ or regulators’ expectations.
Sources of risk
Conduct risk exists across all stages of RBS’s relationships with its customers, from the development of its business strategies, through governance arrangements, to post-sales processes. Activities through which conduct risk may arise are diverse and include product design, marketing and sales, complaint handling, staff training, and handling of confidential and non-public price sensitive information. Conduct risk also exists if RBS does not take effective action to prevent fraud, bribery and money laundering.
Key developments in 2014
The level of conduct risk remained high throughout 2014. As set out in the Litigation, investigations and reviews section on page 422, RBS and certain members of it are party to legal proceedings and are subject to investigation and other regulatory action in the UK, the US and other jurisdictions.
RBS continued to remediate historical conduct issues, while also restructuring its customer-facing businesses and support functions around the needs of its customers. Specific actions taken by RBS to address underlying control deficiencies included:
| | · | Strengthening significantly the systems and controls governing RBS’s LIBOR submissions. An independent and ring-fenced rate setting team was created, and new preventative and detective controls were also put in place, including independent monitoring and statistical checking of submissions. A new rate-setting board was also created to oversee the submission process. |
| | · | Simplifying RBS’s retail product offering and sales processes; enhancing training for, and controls in relation to, customer advisors; and improving management information on product sales. |
| | · | Embedding a new Conduct and Regulatory Affairs (C&RA) operating model and governance structure, by integrating former divisional and functional resources to drive consistent bank-wide standards for managing conduct risks more efficiently; |
The conduct risk framework was also further developed. Key elements included:
| | · | Orientating C&RA’s assurance coverage and testing towards customer outcomes, and away from controls and policy compliance; |
| | · | Establishing a Conduct Advisory function with the expertise and skills to effectively interrogate and assess business models, strategy and products; provide oversight, challenge and technical policy advice; and make selective risk-based interventions; |
| | · | Transferring accountability for RBS-wide customer remediation to C&RA, and the establishment of a specialist remediation centre to deliver fair, consistent and timely customer outcomes; |
| | · | Developing product risk management tools to improve the customer outcomes of new products; |
| | · | Ensuring the focus of RBS’s culture is always about delivering good customer outcomes. Although a long-term project, RBS is confident that it has already resulted in material changes to the way business is conducted; and |
| | · | Strengthening the whistleblowing framework by aligning the policy with RBS values. |
Governance
Effective conduct risk management is a commercial imperative for the bank: customers, clients and counterparties demand it as a precursor to building trust. It also reflects the developing regulatory environment in the UK, as well as the increasing focus of overseas regulators on conduct risk.
C&RA is responsible for defining appropriate standards of conduct, and for designing the framework for managing conduct risk, driving adherence, and overseeing remediation activity. It also provides appropriate controls, challenge and oversight to ensure good customer outcomes. In so doing, C&RA acts as a second line of defence control function.
Key elements of the governance structure are set out below:
| | · | The C&RA Executive Committee considers emerging issues material to the C&RA strategy, and implements Board and Executive Committee risk management policy decisions; and |
| | · | The Financial Crime Accountable Executive Committee (accountable to the Executive Risk Forum) ensures that the customer businesses and the Services function fulfil strategic objectives by identifying and managing their financial crime risks effectively. |
Business review Capital and risk management
Controls and assurance
Under the RBS Policy Framework, C&RA owns 26 conduct risk policies, grouped under employee, corporate and market conduct, and; and conduct towards customers. Each policy is designed to provide both high-level direction and RBS-wide requirements. The policies and chapters are designed to ensure RBS meets its regulatory obligations; and to provide the necessary clarity for staff on their conduct obligations.
Assurance and monitoring activities are essential to help measure the extent to which RBS manages its delivery of specific customer outcomes. During 2014, in addition to the provision of risk-based assurance over key conduct, financial crime, systems and infrastructure topics, the C&RA assurance function provided RBS-wide assurance in support of Financial Conduct Authority (FCA) attestations, principally those relating to complaints and anti-money laundering (AML). Assurance activities are pre-emptive in highlighting conduct issues and influencing the business to re-consider the impact of their approach; and are flexible so as to achieve the right customer outcomes.
Risk assessments are used to identify material conduct risks and key controls across all business areas. The risk assessment process is designed to confirm that risks are effectively managed and prioritised and controls are tested to verify that they operate effectively.
Scenario analysis is used to assess the impacts of extreme but plausible conduct risks including financial crime. The scenarios assess the exposures that could significantly affect RBS’s financial performance or reputation and are an important component in the operational risk framework and capital model.
Risk appetite
RBS has articulated a customer-focused vision to be the leading UK bank for trust, customer service and advocacy by 2020. In line with this, C&RA has evolved from focusing on policy compliance towards considering the wider business implications of placing customers at the heart of the business.
A conduct risk appetite framework is being developed to ensure that RBS’s risk profile is based on its strategic risk objectives, with quantitative targets supplemented by qualitative criteria focused on attaining good customer outcomes, upholding market integrity, meeting stakeholder expectations and promoting a strong risk culture. Work to refine and embed the risk appetite framework and associated control processes continues in 2015.
Risk monitoring and measurement
C&RA works closely with the customer facing businesses to assess business models, strategy and products and influence better outcomes for customers.
RBS’s senior boards and committees receive updates on conduct risk exposures and action plans through monthly C&RA initiated reporting. The reporting has been enhanced to be more focused, forward-looking and action-oriented.
An annual Money Laundering Reporting Officer’s Report is submitted to the Board and the FCA. Covering the operation and effectiveness of the systems and controls in place to comply with Anti-Money Laundering law and regulation, it also describes RBS’s AML framework. In addition, it covers the systems and controls in place to prevent the financing of terrorism and to ensure compliance with sanctions as well as embargoes and export controls imposed by the UN, governments and other supranational bodies.
The Group Audit Committee is provided with an annual Whistleblowing Update Report. It details cases by internal reporting categories based on the Public Interest Disclosure Act (1998) category, identifies underlying causal and subject trends, and highlights the outcome of investigations and actions taken.
C&RA is working with the business franchises to define the data required to ensure appropriate customer outcomes are delivered and are compliant with the Basel Committee on Banking Supervision principles for effective risk data aggregation and risk reporting. RBS’s ability to aggregate, analyse and report conduct risk internally is being enhanced so it can assess the effectiveness of mitigating actions.
Business review Capital and risk management
| Operational risk |
| 184 | Definition |
| 184 | Sources of risk |
| 184 | Key developments in 2014 |
| 184 | Risk governance |
| 185 | Controls and assurance |
| 185 | Risk appetite |
| 185 | Risk identification and assessment |
| 185 | Risk mitigation |
| 185 | Risk monitoring |
| 185 | Risk measurement |
Business review Capital and risk management
Operational risk*
Definition
Operational risk is the risk of loss resulting from inadequate or failed internal processes, people and systems, or external events. It arises from day-to-day operations and is relevant to every aspect of the business.
Operational risks may have a direct customer or reputational impact (for example, a major IT systems failure or fraudulent activity) or both. Operational risk failures may also have a link with conduct risk as evidenced by customer complaints made in connection with Payment Protection Insurance.
Sources of risk
Operational risk may arise from a failure to manage operations, transactions and assets appropriately. It may arise from forms of human error, an inability to deliver change on time or adequately, or the unavailability of technology services or the loss of customer data. Fraud and theft are sources of operational risk, as is the impact of natural and man-made disasters. It may also arise from a failure to take appropriate measures to protect assets or take account of changes in law.
Key developments in 2014
RBS’s transformation programme is material and complex, affecting all business areas and functions simultaneously, and so it has the potential to increase the operational risk profile at least in the short term. The risks associated with transformation are being managed in accordance with the operational risk framework and the programme management infrastructure.
The transformation programme affects many of its people and their tasks. RBS is monitoring the resourcing impacts arising from this, as it recognises that employee capacity and engagement are essential to delivering change and completing day-to-day activities.
A key component of the programme was the implementation in 2014 of a new functional operating model for operational risk to ensure it is managed in a more standardised and consistent manner. The new operating model supplemented activity undertaken by the customer businesses to increase understanding of the operational risk profile and the actions required to mitigate risks outside of appetite.
Work started on enhancing the operational risk management framework (ORMF). This will continue in 2015 and beyond. The intention is to improve the ability to identify and assess operational risk by delivering an ORMF that is implemented consistently.
Following the major IT incident that occurred in 2012, a programme was created to address the weaknesses identified, with its core objective to deliver improvements to the technology processes, as well as the efficiency and resilience of those processes, through a number of key workstreams. In 2014, this programme improved technology resilience for core banking services, operating practices and risk management across the three lines of defence. Significant investments were made in upgrading infrastructure and in improving a broad range of processes and tools.
The threat to the security of RBS’s information from cyber attacks is a key focus for operational risk. During 2014 specific enhancements were made to cyber security programmes, mitigating a number of identified vulnerabilities. RBS continues to monitor this threat closely as it continues to develop rapidly.
Risk governance
A strong operational risk management function is vital to support the bank’s profitability. Better management of operational risk directly supports RBS’s strategic objective of improving stakeholder confidence and is vital for stability and reputational integrity.
The operational risk function, an independent second line of defence, plays a leadership role and seeks to achieve a robust risk management framework and culture across the bank. The Director of Operational Risk, Support Functions and Divested Businesses, who leads the function, reports to the Chief Risk Officer.
The operational risk function is responsible for the design and maintenance of the ORMF. The Operational Risk Policy and associated standards are incorporated in the Group Policy Framework and provide direction for the consistent identification, assessment, management, monitoring and reporting of operational risk.
The Operational Risk Executive Committee (OREC), which is a sub-committee of the Executive Risk Forum, acts on all operational risk matters. This includes reviewing the exposure against risk appetite; identifying and assessing material operational risks, encompassing both current and emerging material risks; reviewing and monitoring the operational risk profile; and reviewing and approving material policy changes.
Business review Capital and risk management
Controls and assurance
Control Environment Certification (CEC) is used to review and assess the internal control framework. Members of the senior management team are required to provide a bi-annual assessment of the robustness of the internal control environment including:
| · | Compliance with the requirements of the UK Corporate Governance Code; |
| · | Appropriateness of the risk frameworks and governance structures of each customer-facing business and support function to help ensure RBS operates within risk appetite; |
| · | Adequacy of reporting on the material risks for the business against appetite; and |
| · | Action plans to mitigate those risks outside of appetite. |
CEC outcomes are reported to the Board, the Group Audit Committee and the Board Risk Committee, and are shared with external auditors.
Risk appetite
The objective of operational risk management is not to remove operational risk altogether, but to manage it to an acceptable level, taking into account the customer journey and the cost of minimising the risk against the resultant reduction in exposure. Strategies to manage operational risk include avoiding undertaking a particular type of activity or operating in a particular market; transferring the risk to a third party; accepting the risk as a cost of doing business; or mitigating the risk by implementing controls.
Operational risk appetite measures and frameworks are reviewed annually by the Executive Risk Forum (ERF). The operational risk appetite statement comprises a number of specific measures of risk, including operational risk capital adequacy and earnings volatility based on the relationship between operational risk losses and the bank’s estimated gross income. It also includes metrics covering control environment performance. To confirm that RBS operates within the set risk appetite, the high-level statement is aligned with strategic risk objectives.
Operational risk appetite measures will be further refined in 2015, with particular focus on developing an integrated operational risk appetite framework which will be used to translate high-level objectives into achievable risk appetite measures across RBS.
Risk identification and assessment
Risk assessments are used to identify and assess material operational risks and key controls across all business areas. To provide a consistent categorisation of risks and controls across RBS and to support identification of risk concentrations, all risks and controls are mapped to the risk taxonomy and the control catalogue. Risk assessments are refreshed at least annually to ensure they remain relevant and capture any emerging risks.
The process is designed to confirm that risks are effectively managed and prioritised in line with the stated risk appetite. Controls are tested frequently to verify that they remain fit for purpose and operate effectively. Risk assessments are typically commenced in a workshop, bringing together subject matter experts and key stakeholders from across the bank. Financial and non-financial risk impacts are captured and a risk appetite decision is made.
In 2014 there was a continued focus on implementing and embedding risk assessments across the bank. This included the strengthening of links between risk assessments and other elements of the operational risk framework. In 2015, the risk framework will be further enhanced by the introduction of end-to-end risk assessments which will help provide a fuller understanding of the risk profile of the bank’s key services and products.
The New Product Risk Assessment (NPRA) process aims to ensure that the risks represented by new products (and material variations to existing products) are identified and assessed before launch. There is now a requirement to demonstrate that all products provide fair outcomes to customers. Further enhancements to the NPRA process are under review and are expected to be introduced in 2015.
Risk mitigation
Risks are mitigated by a suite of regularly assessed controls but, where the residual exposure is outside of risk appetite, the relevant customer business must decide how to reduce it. This is carried out in accordance with the operational risk management process, the objective of which is the adoption of a consistent approach to the management of issues and actions to mitigate risks outside appetite. The process continues to be enhanced, with analysis of common issues on an aggregated basis across the bank, to identify emerging trends and to make improvements to the quality of data.
RBS purchases insurance to provide the business with financial protection against specific losses and to comply with statutory or contractual requirements.
Risk monitoring
Monitoring and reporting are part of RBS’s operational risk management processes, which aim to ensure that risks and issues are identified, escalated and managed quickly. Emerging risks, and actions taken to mitigate them, are discussed at OREC. These are reported to the Board and the ERF. Exposures specific to each business are communicated through monthly risk and control reports that are discussed at business risk committees.
Risk measurement
Scenario analysis is used to assess the impact of extreme but plausible operational risks and is a key input to the capital model. It provides a forward-looking basis for managing risk exposures, with a structured and consistent approach to scenario scoping and measurement. Coupled with internal and external loss data, it has a major impact on the estimated capital requirements. Scenarios, along with internal and external loss data, are a key input into the capital model and influence the capital required significantly.
*unaudited
Business review Capital and risk management
Scenarios are run in their own dedicated workshops, bringing business and risk and control experts together, thereby providing management with a deeper understanding of risk exposures.
RBS further refined its approach to assessing the impact of the economic cycle on its operational risk losses by assessing the impact of the Prudential Regulation Authority’s published Anchor 6 scenario. This describes the impact of a series of country-specific shocks on levels of operational risk losses, and also capital adequacy requirements for operational risk.
The impact of the Prudential Regulation Authority’s Anchor 6 scenario on operational risk capital, as calculated under the standardised approach, was also projected based on the outputs of the bank’s stress-testing exercises. Operational risk impacts are also assessed based on additional economic stress scenarios developed internally. This is used as part of the overall stress input to capital planning and internal capital adequacy assessment process (ICAAP).
Operational risk is measured utilising an economic Capital model. This model is also included within the ICAAP assessment to ensure that capital requirements are appropriately calculated using internal loss, external loss and scenario data. As a true risk sensitive measurement, this AMA approach is being rolled out across RBS to ensure better information is available to businesses to help manage their risk profile.
At 31 December 2014, events aligned with clients, products and business practices accounted for 95% of the losses (compared to 98% in 2013). The losses in this category resulted from new conduct-related provisions, and further increased provisions relating to Payment Protection Insurance and Interest Rate Hedging Products, together with regulatory settlements.
A small number of operational risk events contribute a high percentage of the total losses. In 2014, around 1% of the events contributed 96% of the losses. This was in line with that of 2013.
Event and loss data management
The event and loss data management process aims to ensure compliance with standard requirements for the management of operational risk events and the capture of loss data. It also entails reporting operational risk events that meet defined threshold criteria to RBS senior management. RBS has continued to focus on the timely and accurate capture of operational risk losses; the use of a single RBS-wide repository of operational risk events; and the escalation of material operational risk events.
All losses and recoveries associated with an operational risk event are reported against their financial accounting date. A single event can result in multiple losses (or recoveries) that may take time to crystallise. Losses and recoveries with a financial accounting date in 2014 may relate to events that occurred, or were identified in, prior years.
Number and value of events
At 31 December 2014, four categories accounted for around 94% of all operational risk events. These were: (i) clients, products and business practices; (ii) execution, delivery and process management; (iii) fraud; and (iv) employment practices and workplace safety. This proportion was broadly in line with that of 2013.
Capital
RBS calculates the Pillar 1 capital requirement for operational risk using the standardised approach. For 2014, RBS’s minimum Pillar 1 capital requirement was £2.9 billion (2013 - £3.4 billion).
Business review Capital and risk management
| Regulatory risk |
| 188 | Definition |
| 188 | Sources of risk |
| 188 | Key developments in 2014 |
| 188 | Governance |
| 188 | Risk appetite |
| 188 | Risk monitoring and measurement |
| 188 | Risk mitigation |
Business review Capital and risk management
Regulatory risk*
Definition
Regulatory risk is the risk of material loss or liability, legal or regulatory sanctions, or reputational damage, resulting from the failure to comply with (or adequately plan for changes to) relevant official sector policy, laws, regulations, or major industry standards, in any location in which RBS operates.
Sources of risk
Regulatory risk arises from the regulatory, business or operating environment and from RBS’s response to it.
Key developments in 2014
The level of regulatory risk remained high during 2014, as policymakers and regulators continued to strengthen regulation and supervision in response to the events of 2007 and 2008. This resulted in high levels of interaction between RBS and supervisory authorities through meetings, requests for information, visits and investigations, as well as in policy developments and proposals for new rules.
Governance
C&RA maintains well-established policies and supporting processes to ensure timely identification of, and effective responses to, changes in official requirements affecting the bank. C&RA also maintains a structured and open engagement with regulators. That engagement underpins a range of other policies and processes that address on-going compliance with regulatory obligations (refer to the section on Conduct risk on page 180 for further information).
To help manage the risks, the Mandatory Change Advisory Committee (MCAC), chaired by C&RA, was established. The MCAC reports to the Bank-Wide Investment Committee, and comprises representatives of the bank’s customer businesses and functions. The MCAC acts as the ‘reception committee’ for reviewing externally mandated changes that may affect RBS and recommending appropriate responses, including the timely mobilisation of change implementation activities. In doing so, it agrees business or function owners of individual risks; and commissions and reviews impact assessments from customer businesses and functions.
Board and Executive Committee oversight of changes to regulatory requirements is supported by the MCAC.
C&RA’s Regulatory Developments team maintains and develops RBS Political, Legislative and Regulatory Environment Policy and supporting documents, together with associated processes, tools and governance. It also oversees the regulatory developments operating framework, to ensure it meets the needs of all businesses and functions, and maintains the Relationships with Regulators Policy.
Risk appetite
RBS believes that maintaining a strong regulatory risk framework is fundamental to ensuring sustainable growth, rebuilding its reputation and maintaining stakeholder confidence. Accordingly, its stated regulatory risk and compliance risk appetite is for no material or widespread breaches of rules, expectations, regulations or laws, individually or in aggregate. However, it also recognises that genuine errors occur, and so it accepts limited, non-material regulatory risk and subsequent loss.
Risk monitoring and measurement
C&RA ensures appropriate reporting of all material regulatory reviews and other regulatory developments worldwide to the appropriate bank-wide committees, including the Board, the Group Audit Committee, and the Board Risk Committee. Half-yearly reporting to the Group Audit Committee also captures all material investigations and tracks the status of, and trends in, key regulatory relationships.
The level of regulatory risk remained high during 2014, as policymakers and regulators continued to strengthen regulation and supervision in response to the events of 2007 and 2008. This resulted in high levels of interaction between RBS and supervisory authorities through meetings, requests for information, visits and investigations, as well as in policy developments and proposals for new rules.
Risk mitigation
C&RA also communicates information on regulatory developments and follow-up engagement with customer-facing businesses and functions, helping them identify and execute any required mitigating changes to strategy or business models. The key regulatory policies are reviewed annually.
Early identification and effective management of changes in legislation and regulation, as well as other requirements, is critical to the successful mitigation of regulatory risk. All regulatory and compliance changes are managed to ensure timely compliance readiness. Those changes assessed as having a ‘high’ or ‘medium-high’ impact are managed especially closely, with the aim of mitigating the impact through, for instance, changes to strategy or business activities, or external engagement.
*unaudited
Business review Capital and risk management
| Reputational risk |
| 190 | Definition |
| 190 | Sources of risk |
| 190 | Key developments in 2014 |
| 190 | Governance |
| 190 | Risk appetite |
| 190 | Risk monitoring and measurement |
| 190 | Risk mitigation |
Business review Capital and risk management
Reputational risk*
Definition
Reputational risk is the risk to RBS’s public image owing to a failure to meet stakeholders’ expectations in relation to performance, conduct and business profile. Stakeholders include customers, investors, employees, suppliers, government, regulators, special interest and consumer groups, media and the general public.
Sources of risk
Reputational risk can arise from the conduct of either RBS as a whole or that of the individuals it employs; from the activities of customers and the countries in which they operate; from the products RBS offers and the transactions it supports; and from its operations and infrastructure.
Key developments in 2014
The importance of reputational risk was reinforced with the appointment of a Head of Reputational Risk, together with improvements to governance frameworks to manage this risk in business franchises. A senior RBS-wide Reputational Risk Forum (RRF) and fora in all business franchises were established. These bodies consider customers, transactions, products or issues that present material reputational risks to the organisation, and have the power to decline business or to set conditions.
A high-level Reputational Risk Policy was also developed to help employees, businesses and functions effectively identify, assess and manage issues that present reputational risks.
The most material threats to RBS’s reputation continued to originate from historical and more recent conduct deficiencies. As a result, RBS has been the subject of investigations and reviews by a number of its regulators, some of which have resulted in fines and public censure. Refer to the Litigation, investigations and reviews section on page 422.
Governance
Managing reputational risk is taken very seriously, with Board-level oversight reinforced by a Reputational Risk Policy, and by governance frameworks across business franchises.
The Board and the Executive Committee have the ultimate responsibility for managing RBS’s reputation although all staff have some responsibility. The Board has set RBS’s Purpose, Vision and Values, which outline the objective, which is “to be trusted, respected and valued by our customers, shareholders and communities”. Refer to the Risk governance section on page 172.
The Sustainable Banking Committee is responsible for overseeing and challenging how management is addressing sustainable banking and reputation issues including risk appetite for environmental, social and ethical (ESE) issues.
The Board’s oversight of reputational issues is supported by the senior RBS-wide RRF which opines on cases that represent a material reputational risk to the whole organisation. The RRF, which has delegated authority from the Executive Risk Forum, also acts as a central forum to review thematic issues and risk appetite positions. Business franchises also have in place reputational risk approval fora to deliberate on customers, transactions, products or issues that may present a reputational risk for their businesses. An example is the Global Reputational Risk Committee in CIB.
Risk appetite
The Reputational and ESE Risk management team assists business franchises, as well as other control functions, to articulate risk appetite to manage reputational risk. Risk appetite positions for certain issues or markets, for example tax or money remitters, are developed through conducting research on legislation, regulation and potential reputational risk factors, undertaking peer analysis and engaging with internal and external stakeholders to discuss the issues. The risk appetite positions classify risks associated with a particular area into Normal, Sensitive and Prohibited. Customers or transactions designated Sensitive require enhanced due diligence and escalation to a reputational risk forum or individual while those rated Normal can be approved by the business without additional escalation. The team also helps set risk appetite to manage reputational risk related to business engagements and customer relationships in some sensitive industry sectors, such as mining and defence, through the ESE policy framework.
A Reputational Risk Policy has also been developed to help employees, businesses and functions effectively identify, assess and manage issues that potentially represent a reputational risk. In addition, other policies, such as those related to conduct, address key sources of reputational risk. These policies are implemented in accordance with the Policy Framework through business and functional policy standard owners. The effectiveness of these policies within each franchise is reported on through the Control Environment Certification process (Refer to the Operational risk section on page 183). Reputational aspects also form a core part of the RBS conduct risk framework, with a series of enhanced policies developed in line with conduct risk appetite.
Risk monitoring and measurement
Emerging reputational issues are identified by the business and relevant teams, including RBS Sustainability and Enterprise Wide Risk, which assess new and emerging business, sector and country risks. The Risk Management Monthly Report, provided to the Executive Committee and BRC, may also discuss reputational risks facing RBS, and the annual Sustainability Report covers progress on sustainability principles.
ESE ratings of customers and transactions are captured and analysed centrally by the Reputational and ESE Risk Team.
Risk mitigation
Reputational risk is mitigated through governance frameworks and training of staff to ensure early identification, assessment and escalation of customers, transactions or products with potential reputational risk, if appropriate. This includes creating appropriate fora, for example reputational risk committees or individual reputational risk approvers.
Also important is the setting of clear reputational risk appetite criteria, ensuring higher risk cases are escalated for senior level approval. Effective communication channels and incident response planning also ensure that cases that result in reputational impact are appropriately managed, for example by declining or exiting business or by ensuring incident management plans are implemented to manage the impact of negative media coverage.
*unaudited
Business review Capital and risk management
| Capital management |
| 192 | Definition |
| 192 | Capital strategy |
| 192 | Overview and key developments |
| 192 | Regulatory capital requirements |
| 193 | Capital and stress testing management framework |
| 193 | Governance |
| 194 | Assessing, monitoring and maintaining adequate capital |
| 195 | Risk identification and material integrated risk assessment (MIRA) |
| 195 | Stress testing |
| 198 | Internal capital adequacy assessment process (ICAAP) |
| 199 | Capital planning |
| 200 | Future regulatory developments |
| 201 | Other developments |
| 202 | Measurement |
| 202 | - Capital and leverage ratios |
| 203 | - Capital resources |
| 205 | - Leverage exposure |
| 206 | - Risk-weighted assets |
| 208 | EAD and RWA density |
| 210 | Accounting to regulatory consolidation bridge |
| 211 | Balance sheet to EAD bridge |
Business review Capital and risk management
Capital management*
Definition
RBS aims to maintain an appropriate level of capital to meet its business needs and regulatory requirements, and operates within an agreed risk appetite. The appropriate level of capital is determined based on the dual aims of: (i) meeting minimum regulatory capital requirements; and (ii) ensuring RBS maintains sufficient capital to uphold customer, investor and rating agency confidence in the organisation, thereby supporting its business franchises and funding capacity.
Capital strategy
RBS has set out its strategy to be truly customer-centric, built upon high levels of customer service and trust, delivering attractive and consistent returns and underpinned by unquestioned safety and soundness. It includes key risk metrics aligned to the strategic objectives (for example a target Common Equity Tier 1 (CET1) ratio).
RBS has devised a risk appetite framework aligned to the above. This framework establishes appetite targets on quantitative and qualitative measures which are set by the Board and aligned with its key strategic risk objectives including maintaining sufficient capital resources to meet regulatory requirements and cover the potential for unexpected losses
Overview and key developments
| · | RBS’s CET1 ratio was 11.2% at 31 December 2014, an improvement of 260 basis points compared with 8.6% as at 31 December 2013. |
| · | The leverage ratio under 2014 Basel III framework improved from 3.4% to 4.2% at 31 December 2014. |
| · | Key milestones achieved in 2014 include: |
| | ° | run down of RCR and CIB assets; and |
| | ° | disposal of €9 billion of higher risk legacy available-for-sale securities, thereby reducing stressed capital and RWAs. |
| · | Going forward, RBS is focused on delivering a capital plan in-line with its strategic objectives which includes the divestment of CFG by the end of 2016 and further run down of RCR and CIB assets. |
| · | From 2015 RBS will target a c.13% CET1 ratio during the period of CIB restructuring and expects to achieve this by the end of 2016. |
| · | RBS plans to issue around £2 billion of CRR-compliant Additional Tier 1 (AT1) capital instruments in 2015. |
RBS’s current Pillar 2A requirement is 3.5% of RWAs at 31 December 2014. From 1 January 2015, 56% of the total Pillar 2A or 2.0% of RWAs is required to be met from CET1 capital. Pillar 2A is a point in time assessment of the amount of capital that is required to be held to meet the overall financial adequacy rules. The Prudential Regulation Authority (PRA) assessment may change over time, including as a result of at least an annual assessment and supervisory review of RBS’s internal capital adequacy assessment process.
RBS’s capital risk appetite framework, which informs its capital targets, includes consideration of the maximum distributable amount (MDA) requirements. These requirements are expected to be phased in from 2016, with full implementation by 2019 but this is subject to ongoing review to accommodate regulatory and other changes.
Based on current capital requirements, including holding current estimates of Pillar 2A constant for illustrative purposes, RBS estimates that its ‘fully phased’ CET1 MDA requirement would be 10.5% in 2019, assuming RBS’s current risk profile. It should be noted that this estimate does not reflect the anticipated impact of RBS’s planned restructuring and balance sheet risk reduction programmes, changes in the regulatory framework or other factors that could impact target CET1 ratios. The estimated MDA requirement comprises:
| · | 4.5% Pillar 1 minimum CET1 ratio; |
| · | 2.0% Pillar 2A CET1 ratio; |
| · | 2.5% Capital conservation buffer; and |
| · | 1.5% Global-Systemically Important Institution buffer. |
Based on the assumptions above, assuming a 13% steady state CET1 capital ratio is achieved, RBS currently estimates that it would have headroom of 2.5% to fully phased MDA trigger in 2019. This headroom will be subject to ongoing review to accommodate regulatory and other changes.
Regulatory capital requirements
The European Union has implemented the Basel III proposals through the Capital Requirement Regulation (CRR) and the Capital Requirements Directive (CRD), collectively known as CRD IV. CRD IV was implemented on 1 January 2014. The European Banking Authority’s technical standards which will provide clarification of the CRD IV, are either in progress to be finalised through adoption by the European Commission and implemented within the UK, or delegated regulation now adopted.
CRD IV imposes the following minimum requirements to be met by 2019:
| · | Pillar 1 requirement of: CET1 of 4.5% of RWAs; Tier 1 of 6%; and total capital of 8%; |
| · | Capital buffers: capital conservation buffer of 2.5% of RWAs; countercyclical capital buffer of up to 2.5%; Global-Systemically Important Bank (G-SIB) surcharge of 1.5%; and |
| · | Minimum Tier 1 leverage ratio of 3%. |
Business review Capital and risk management
In December 2013 the PRA issued its policy statement (PS7/13) outlining changes to its Rulebook as a result of CRD IV, and finalising requirements for the minimum level of CET1 capital as follows:
| · | Firms must meet a 4% Pillar 1 CET1 requirement in 2014, rising to 4.5% from 1 January 2015. Similarly, the Tier 1 capital ratio will be 5.5%, rising to 6% from 1 January 2015 onwards. Total capital remains at 8%. |
| · | All Pillar 2A risks, including pension risk, must be met with at least 56% CET1 capital from 1 January 2015 onwards. This matches the proportion of CET1 capital required for Pillar 1. The remaining (44%) allocation of Pillar 2A is restricted to 19% Tier 1 and 25% Tier 2. |
| · | All regulatory deductions from capital must align CET1 with the end-point definition from January 2014, effectively making fully loaded Basel III the regulatory definition, a stricter approach than the CRR transitional arrangements. |
On 31 October 2014 the Financial Policy Committee (FPC) published its recommendation on the overall leverage ratio framework for the UK banking system as follows:
| · | Minimum Tier 1 leverage ratio of 3%. To be met 75% by CET1 and a maximum 25% AT1; |
| · | A supplementary leverage buffer applying to G-SIBS equal to 35% of the corresponding risk-weighted systemic risk buffer rates to be met with CET1; and |
| · | A countercyclical leverage ratio buffer equal to 35% of the risk-weighted countercyclical capital buffer rate to be met from CET1. The countercyclical buffer is currently set at 0%. |
Capital and stress testing management framework
This section covers a number of tools and processes which taken together contributed to an integrated view of capital management and is best presented by the diagram below.
MIRA: material integrated risk assessment
ICAAP: internal capital adequacy assessment process
Governance
The Board is the main decision making forum at RBS. It sets the strategic direction and ensures RBS manages risk effectively by approving and monitoring RBS’s strategic risk appetite, considering RBS-wide stress scenarios and agreed mitigants, as well as identifying longer-term strategic threats to the business operations. The Board approves the ICAAP.
The Board Risk Committee (BRC) is responsible for providing oversight and advice to the Board in relation to current and potential future risk exposures of RBS and future risk strategy, including determination of risk appetite and tolerance. The BRC will review the performance of RBS relative to risk appetite, provide oversight of the effectiveness of key RBS-wide policies and provide risk input to remuneration decisions. The BRC has responsibility for promoting a risk awareness within RBS. Authority is delegated to the BRC by the Board and the BRC reports and makes recommendations to the Board as required.
Business review Capital and risk management
The Executive Committee is responsible for managing strategic, financial, capital, risk and operational issues affecting RBS. It reviews and debates relevant items before they are submitted to the Board and relevant board committees. It also considers recommendations from the Executive Risk Forum (ERF) in relation to risk management matters, including recommendations on risk appetite, risk policies and risk management strategies. ERF oversees stress testing approach, processes and results.
RBS Asset and Liability Committee (ALCo) is a sub-committee of ERF. RBS ALCo is responsible for identifying, managing and controlling balance sheet risks in executing its business strategy. RBS Treasury is responsible for managing the RBS balance sheet in accordance with RBS ALCo policy and direction. RBS ALCo is the body with responsibility in determining that financial balance sheet risk limits and for ensuring the asset and liability management functions manage their balance sheets within the limits set by RBS ALCo.
Stress Testing Committee (STC) takes its delegated authority from ERF and makes recommendations to the ERF on asset quality reviews and stress testing, including the key vulnerabilities and scenario themes identified, the results from the generated scenarios and expanded metrics to be used in both internal and regulatory enterprise-wide stress tests. STC ensures these are relevant and reflect RBS business model vulnerabilities, and the results of both internal stress, reverse stress and regulatory enterprise-wide stress tests (including mitigants).
Assessing, monitoring and maintaining adequate capital
It is RBS’s policy to build and sustain a strong capital base and to use it efficiently throughout its activities to support strategic objectives and ultimately optimise shareholder returns while maintaining a prudent relationship between its capital base and the underlying risks of the business. In carrying out this policy, RBS follows the regulatory requirements of the “twin peaks” regulatory structure in the UK under the supervision of the FCA and the PRA, also having regard to other regulators, rating agencies, its peer group and market expectations.
Each business in RBS is subject to performance metrics respecting regulatory capital requirements to ensure that relevant Individual Capital Guidance or minimum CET1 levels are met. RBS has a control framework in place to guard against accidental breaches in capital ratios.
Monitoring
RBS continually reviews the potential impact on capital adequacy of emerging regulatory developments and actively assesses headroom against a range of stress scenarios. Recovery plans are dynamically maintained and contingency or remediation options are calibrated to determine scope to address potential capital shortfalls. All authorised institutions in RBS are required to ensure adequate capital is maintained at all times; they must also monitor and report regulatory capital and RWAs on a regular basis. The level and appropriateness of internal capital buffers at CET1, Tier 1, Tier 2 and total capital levels, is reviewed by RBS ALCo and reset as considered appropriate, at least annually.
Capital allocation
Capital resources are allocated to businesses based on key performance parameters agreed by the Board in the annual strategic planning process. Principal among these is a profitability metric, which assesses the effective use of the capital allocated to the business. Projected and actual return on equity is assessed against strategic objectives. The allocations also reflect strategic priorities, the intensity of regulatory capital use and the usage of other key resources such as balance sheet liquidity and funding.
Economic profit is also planned and measured for each business annually. It is calculated by deducting the cost of equity utilised in the particular business from its operating profit after tax and measures the value added over and above the cost of equity.
RBS aims to deliver sustainable returns across the portfolio of businesses with projected business returns stressed to test key vulnerabilities.
The franchises use return on capital metrics when making pricing decisions on products and transactions, to ensure customer activity is appropriately aligned with RBS and segmental targets.
Business review Capital and risk management
Risk identification and material integrated risk assessment (MIRA)
| · | MIRAs are annual ‘top down’ processes to: |
| | ° | help identify material risks; |
| | ° | understand the nature and magnitude of these risks clearly; and |
| | ° | appraise associated risk management frameworks robustly. |
| · | MIRAs provide a process to assess the size and nature of exposure to all risk types in the risk taxonomy, which is an exhaustive, structured list of the types of risk that RBS can and could face. |
| · | MIRAs consider whether capital should be set aside against each risk type and, if so, under which pillar, how much and of what type. If capital is not appropriate, MIRAs outline how risk types are otherwise managed. In so doing, MIRAs form a key input to the ICAAP. |
| · | To focus risk management on areas of greatest benefit, MIRAs consider in depth risks whose potential impact is ‘material’, that is exceeding appropriately chosen financial or non-financial thresholds. The key framework elements used to manage material risks (owners, governing committees, limit or tolerance frameworks including risk appetites, control policies and key reports) are specified clearly and assessed for appropriateness and effectiveness. |
Stress testing
Stress testing is used to evaluate the capital position under severe but plausible stress scenarios. Stress testing also refers to the broader framework under which these tests are developed, evaluated and used within the bank’s decision-making process in the context of the wider economic environment.
RBS stress testing framework is designed to embed stress testing as a key risk management technique into mainstream risk reporting, capital planning and business processes at business, legal entity and RBS-wide levels.
Stress test process and techniques
Stress testing is part of the financial and capital planning process and results are presented to senior management (and BRC/Board) at least semi-annually. It is now an integral part of enterprise risk management and used to assess the impact of business decisions on the bank's capital position. The stress testing process has four key stages:
| | ° | RBS-specific vulnerabilities are identified and linked to development of relevant stresses; |
| | ° | Scenario is defined, severity calibrated and full parameterisation completed; and |
| | ° | Governance is put in place for stress theme approval and scenario validation. |
| · | Stress test execution and governance: |
| | ° | Impacts of stress scenario is translated via relevant risk drivers such as RWAs, impairments; |
| | ° | Profit and loss impacts of stress scenario are also assessed; and |
| | ° | Review of stress output by the business as well as risk treasury and finance teams. |
| · | Consolidation and capital planning: |
| | ° | Segmental results are consolidated to provide the total view of stress impact; |
| | ° | Stressed profit and loss and RWA assessment contribute towards arriving at a stressed capital plan; |
| | ° | Additional capital impacts under stress are considered such as pension deficit, foreign exchange reserves; and |
| | ° | Final stressed CET1 ratios are produced for each year of the scenario. |
| · | Management actions and governance: |
| | ° | Internal subject matter experts determine a ‘menu’ of possible management actions under stress conditions such as capital raising, de-risking and sale of assets, cost reduction; |
| | ° | Review by senior risk management and executives; and |
| | ° | ERF and Board review and approval. |
Risk-type specific stress testing is also conducted. For example, within the market risk management framework, a comprehensive programme of stress tests covers a variety of historical and hypothetical scenarios.
Portfolio-specific stress tests assess the reaction of key portfolios to systemic shocks and identify potential vulnerabilities, including risks that have not yet matured or are not yet visible. They assess the potential for outsized losses and the impact of rebalancing portfolios.
*unaudited
Business review Capital and risk management
RBS conducts reverse stress testing within the ICCAP for the specific purpose of identifying and assessing scenarios most likely to render RBS’s business model unviable. For example, RBS’s most recent reverse stress test, which applied a pure macroeconomic stress only, indicated that an instantaneous global shock of a similar scale as the 2008 financial crisis which lasted for a full year could potentially render RBS’s business model unviable. However, the successful execution of RBS’s transformation plan, including the proposed restructuring of CIB, balance sheet reduction and the implementation of the ring-fencing requirements, would mitigate this risk.
Regulatory stress test exercises
RBS also takes part in a number of external stress tests as part of wider stress testing frameworks implemented by regulatory authorities to test industry-wide vulnerabilities under crystallising global systemic risks. In 2014, RBS participated in two regulatory scenarios designed by the European Banking Authority (EBA) and the Bank of England (BOE).
The EBA adverse scenario assumed an increase in global investor risk aversion that triggers financial market turmoil and has subsequent adverse impacts on economic activity worldwide. The scenario envisaged sharply rising long-term interest rates and yields in developed economies alongside a souring of market sentiment globally, resulting in financial markets distress and recessions in a range of countries, including the UK. The stress test was conducted on a static balance sheet basis and thus did not permit key strategic initiatives, such as, the wind down of higher risk and capital intensive assets as part of RCR.
From an 8.6% CET1 capital under full CRR rules as at 31 December 2013, RBS achieved a CET1 ratio of 5.7% after the adverse scenario, marginally above the minimum 5.5% required, an indication of the level of stressed risk in RBS’s exposures at the time. RBS strengthened its capital throughout 2014 and had a CET1 ratio of 10.8% at 30 September 2014, prior to disclosure of the EBA stress test results in October 2014.
Unfortunately, in November 2014 an error was identified in the calculation of the modelled CET1 ratio in the EBA stress test results which led to RBS’s published CET1 stress test ratios being overstated. Independent assurance was sought and the error was corrected. The BRC will continue to closely monitor the actions being taken to avoid a repeat of this error.
The second regulatory stress test, designed by the BoE in cooperation with the EBA, tested the combined impact of the global macroeconomic and market elements of the EBA adverse scenario, and UK-specific stress assumptions under the guidance of the FPC. In particular, the UK variant scenario examined the resilience of UK banks to a housing market shock and a snap-back in interest rates, triggered by sharp sterling depreciation and inflationary pressures. Under the scenario, the UK suffers a severe recession with economic uncertainty damaging confidence and causing both business investment contraction and a significant rise in unemployment.
RBS achieved a CET1 ratio of 5.2% after the impact of regulatory agreed management actions, just above the minimum 4.5% required. RBS strengthened its capital throughout 2014 and had a CET1 ratio of 10.8% at 30 September 2014 prior to the publication of the BOE concurrent stress test results in December 2014.
As the RBS risk profile improves as a result of deleveraging and rundown of higher risk and capital intensive assets, RBS is well placed to withstand extreme stress scenarios.
In March 2014, the Federal Reserve Board (FRB) completed its review of CFG’s 2014 capital plan. The Comprehensive Capital Analysis and Review (CCAR) results follow the Federal Reserve’s publication of Dodd-Frank Act Stress Test results. In that test, across every category, CFG’s projected capital ratios ranked in the top quartile of the 30 largest bank holding companies under the hypothetical supervisory severely adverse stress scenario. However the FRB objected on qualitative grounds to the capital plan submitted as part of the CCAR capital plan. FRB cited significant deficiencies in capital planning processes, including inadequate governance, weak internal controls and deficiencies in practices for estimating revenues and losses under a stress scenario and for ensuring the appropriateness of loss estimates across business lines in a specific stress scenario. Although the FRB acknowledged that bank holding companies such as CFG that are new to the CCAR process are subject to different expectations, CFG’s weaknesses were considered serious enough to warrant FRB’s objection. As a result, CFG are not permitted to increase its capital distributions above 2013 levels until a new capital plan is approved by the Federal Reserve Board.
In 2014, Ulster Bank Ireland Limited (UBIL) and RBS N.V. participated in a comprehensive assessment performed by the European Central Bank (ECB). The comprehensive assessment considered both a stress test and an asset quality review (AQR). The assessment was conducted to increase transparency in bank exposures, and to increase confidence in the European banking sector by identifying whether institutions held sufficient capital under a stress scenario. The AQR and stress test were the first assessments carried out by the ECB under the single supervisory mechanism.
The outcome of the AQR did not require an adjustment to the balance sheets of either UBIL or RBS N.V. In the stress test, both UBIL and RBS N.V. maintained capital ratios above the minimum 5.5% under the adverse scenario.
*unaudited
Business review Capital and risk management
Stress testing use
In addition to informing the ICAAP, stress testing within RBS has matured into business as usual process embedded across our risk management framework. It has become a key risk management tool and is used to support strategic financial planning, risk appetite, risk identification and risk mitigation as illustrated below.
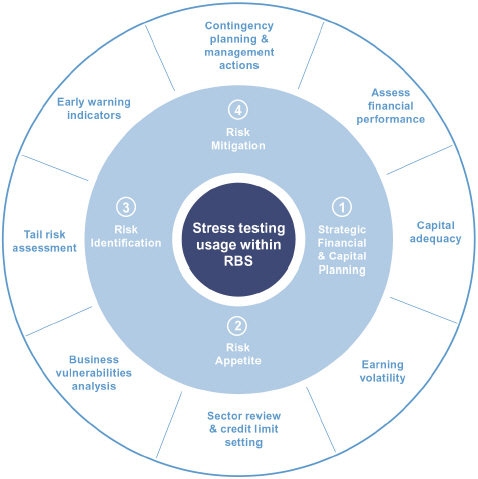
| Stress test usage across RBS |
| 1 | Strategic financial & capital planning |
| | · Assess impact of plausible downside scenarios on financial position. |
| | · Assessment of strategic plans against market concerns and headwinds. |
| 2 | Risk appetite |
| | · Better understanding of underlying risks to inform the setting of risk appetite (e.g. sector reviews, earnings volatility, reverse stress test). |
| | · Assess impact of current business strategies on risk appetite. |
| | · Identify drivers of risk appetite triggers. |
| 3 | Risk identification |
| | · Manage business through improved understanding of the underlying risk. Examples: |
| | ° Tail risk assessment: identification of risky portfolios that breach series of pre-determined triggers. |
| | ° Business vulnerabilities analysis: assessment of business model weaknesses through cross-functional discussions. |
| | · Identify high-risk portfolios to be investigated further. |
| 4 | Risk mitigation |
| | · Inform mitigating actions within RBS and segmental strategic plans. |
| | · Inform macro-hedge strategies. |
| | · Determine a schedule of potential management actions to be executed in the event of stress. |
*unaudited
Business review Capital and risk management
Internal capital adequacy assessment process (ICAAP)
The ICAAP assesses RBS’s material risks and determines how much capital is required to cover these risks.
The ICAAP consists of two types of internal capital assessment:
| · | Point-in-time capital assessment as at the financial year end: |
- Pillar 1 - CET1 4.5% of credit, market and operational RWAs at the financial year end.
- Pillar 2A - additional capital requirements for risks not captured or not adequately captured in Pillar 1. A MIRA is performed to ensure that all
material risks are identified, appropriately managed and adequately capitalised where appropriate.
| · | Forward-looking stress capital assessment: |
- Pillar 2B - Capital planning buffer is set to ensure RBS maintains adequate capital resources in stress to allow it to continue to meet
the minimum capital requirements. Current capital planning buffer will be replaced by the PRA buffer from 1 January 2016.
The final ICAAP is approved by the Board prior to submission to the PRA.
Component parts of the ICAAP are set out in the diagram below.
*unaudited
Business review Capital and risk management
Capital planning
RBS aims to maintain an appropriate level of capital to meet its business needs and regulatory requirements, and operates within an agreed risk appetite.
RBS uses the budgeting cycle to forecast the future levels of capital required at CET1, Tier 1, Tier 2 and total capital levels including bail-in or gone-concern capital at both RBS level and for each of the major operating entities. Those forecasts are then measured against minimum regulatory requirements as well as specific regulatory guidance such as the Individual Capital Guidance. Operating entities such as UBIL, RBS N.V. and CFG also go through a similar planning process to ensure that they are compliant with local regulatory rules. These plans are reviewed and challenged to ensure that they are consistent with RBS risk appetite, policies and strategic targets.
Stress testing is an integral part of capital planning. Stress testing results are produced through the same capital planning models used for the budget. Models will be adjusted to reflect the specific parameters of a particular stress test.
The capital plan outputs are subject to executive and Board review and approval. The capital plan and performance against capital metrics are reviewed each month at ALCo.
Total loss absorbing capital (TLAC) is a new requirement announced by the Financial Stability Board (FSB) at its meeting in October 2014. TLAC is intended to ensure that a bank group maintains sufficient consolidated resources not only to reduce the likelihood of insolvency but also to allow for orderly resolution and recapitalisation of insolvent operating subsidiaries in the event of a banking group’s insolvency.
Impacts for capital planning
Strategic considerations in the medium-term capital plan will be driven by key impacts such as a more restrictive approach to the capital base, higher capital ratio targets and enhanced risk coverage:
| · | Absolute capital levels will need to be higher earlier; |
| · | Higher relative risk-weighted assets will exacerbate the absolute capital required and the stress impact; and |
| · | Inclusion of PRA (and/or firm) stress buffers making stress a key driver of bank target CET1 ratios. |
Recovery and resolution planning
In line with regulatory requirements, RBS prepares regular recovery plans, which include a framework of indicators identifying the points at which appropriate actions may be taken in the event of unexpected weaknesses in its capital or liquidity resulting from either idiosyncratic or systemic stress, as well as a menu of options for addressing such weaknesses.
RBS’s 2014 Recovery Plan was prepared in line with PRA policy Statement PS8/13, requiring firms to prepare, maintain and review recovery plans. These rules were supplemented by a supervisory statement (SS18/13), (2), which sets out in more detail what the PRA expects firms to consider in their recovery planning. Previous Recovery Plans were submitted to the Financial Services Authority (the PRA’s predecessor body) in December 2011 and June 2012, and to the PRA in June 2013.
Recovery Plans are required to be updated annually; it is anticipated that RBS’s 2015 Recovery Plan will be prepared in line with revised rules taking into account the European Union Bank Recovery and Resolution Directive of 2014 and the European Banking Authority’s regulatory technical standards on recovery planning. These rules would require a bank to notify the PRA, without delay, if it decides to take action under the recovery plan or refrains from taking action.
*unaudited
Business review Capital and risk management
Economic capital
Economic capital is an internal measure of the risks to which RBS is exposed and is used as a supplement to other risk and capital management tools, such as stress testing and regulatory capital. The measure includes risk exposures for credit, market, business, operational, pension, fixed asset and interest rate risk in the banking book. These models capture risks not fully addressed within the Pillar 1 regulatory framework e.g. concentration, pension, interest rate, business and diversification.
The characteristics of the models are consistent across risks, business lines and throughout the economic cycle, but are also flexible to allow outcomes to be employed for a number of purposes e.g. severity level/confidence interval, time horizon and correlations. Models have been developed internally but are subject to rigorous governance including external benchmarking, independent validation and extensive internal review and challenge. Models are regularly reviewed and continue to be updated for new data sources and improvements in risk modelling methodology.
The ability to change severity levels supports management of earnings volatility and capital risk. Economic models are used in the ICAAP assessing risk profiles within the risk appetite framework, functional risk management e.g. credit exposures at both RBS and business levels, assessing business line profitability on a risk adjusted basis and the management and allocation of capital.
Future regulatory developments
Resolution and recovery directive
In addition to the capital requirements under CRD IV, the resolution and recovery directive (RRD) introduces requirements for banks to maintain at all times a sufficient aggregate amount of own funds and eligible liabilities (that is, liabilities that may be bailed in using the bail-in tool), known as the minimum requirements for eligible liabilities (MREL). The aim is that the minimum amount should be proportionate and adapted for each category of bank on the basis of their risk or the composition of their sources of funding.
The UK government has transposed the RRD's provisions into law with a requirement that the Bank of England adopt further secondary legislation to implement MREL requirements by 2016 which will take into account the regulatory technical standards to be developed by the EBA specifying the assessment criteria that resolution authorities should use to determine the minimum requirement for own funds and eligible liabilities for individual firms.
The EBA noted that the technical standards would be compatible with the proposed term sheet published by the FSB on TLAC requirements for G-SIBs, but there remains a degree of uncertainty as to the extent to which MREL and TLAC requirements may differ.
As the implementation of the capital requirements under RRD is the subject to the adoption of secondary legislation and implementation in the UK and overall capital requirements will be subject to the exercise of certain discretion by the PRA, RBS is currently unable to predict the impact such rules will have on the overall capital requirements or how they will affect compliance with applicable capital and loss absorbency requirements.
Pillar 2
The PRA launched a consultation paper in January 2015 on the Pillar 2 capital requirements for UK banks. Proposed changes are intended to support a more risk sensitive and consistent approach to setting Pillar 2A (P2A) capital and to provide greater transparency of the PRA capital setting process by allowing firms to manage present and future regulatory capital demands. Proposed changes are as follows:
| · | The variable element of P2A to be expressed as a percentage of RWAs plus fixed add-ons instead of the current method where P2A is a formula comprising both a variable and a fixed element; |
| · | The PRA buffer will replace the current Capital Planning Buffer (CPB). Use of the buffer will not be a breach in capital requirements and will not result in capital distribution restrictions however, failure to meet Pillar 2B (P2B) buffer may result in enhanced supervisory action; |
| · | The P2B buffer will be calculated as a percentage of RWAs rather than absolute terms and is to be met with CET1; |
| · | Firms already subject to a CPB will be required to meet P2B with CET1 in full immediately; |
| · | Firms considered to have weak risk management and governance will be required to hold additional PRA buffer applied on a scalar ranging from 10-40% of a firms CET1 Pillar 1 plus P2A capital requirements; and |
| · | Firms will have the discretion to publicly disclose their aggregate P2A charge from 1 January 2016. Component parts of P2A and the PRA buffer will remain confidential. |
The PRA estimates that the total impact of proposals will increase overall P2A requirements by 0.23% of RWAs. Implementation will be from 1 January 2016 in line with the CRD IV capital conservation and systemic buffers and the EBA’s Supervisory Review and Evaluation Process guidelines.
Domestically Systemically Important Banks
Regulatory proposals relating to domestically systemically important banks (DSIBs) continue to be progressed and could impact the level of CET1 that is required to be held by RBS and specific legal entities including NatWest and the Royal Bank. The EBA published in December 2014 a quantitative methodology as to how European regulators could quantify which firms would qualify as DSIBs. In addition the FPC intends to consult with firms in the UK on the UK framework during 2015.
Systemic risk buffer
In January 2015, HM Treasury issued an explanatory memorandum on the systemic risk buffer for banks, building societies and investment forms. The regulation implements Articles 133 and 134 of Directive 2013/36/EU and addresses the outstanding capital buffer element of the ring-fencing policy recommended by the Independent Commission on Banking (ICB) and agreed by the UK Government.
*unaudited
Business review Capital and risk management
The purpose of the systemic risk buffer is to prevent and mitigate long term non-cyclical systemic or macro prudential risks not covered by existing regulation where there is potential for serious negative consequences for the financial system and real economy.
The systemic risk buffer will apply to large banks with core (ring fenced entity) deposits of more than £25 billion and large building societies with deposits of more than £25 billion. Implementation will occur from 1 January 2019 and capital buffers will range from 0-3% of a firm’s RWAs.
The FPC will set out the framework for determining which institutions fall into scope and the size of the buffer to be held. A consultation paper will be published in 2015 and methodology by 31 May 2016. The PRA will be responsible for applying the framework and will have ultimate discretion over which firms must hold the buffer and its specific size.
Total loss absorbing capital (TLAC) and maximum distributable amounts (MDA)
The FSB has issued policy proposals for public consultation on TLAC. The new proposal is intended to replace the gone-concern loss absorbing capital concept previously expected to be the template within the G-SIB’s resolution strategies.
The proposed minimum TLAC requirements are as follows:
| · | Between 16% and 20% of RWAs and at least double the Basel III Tier 1 leverage ratio requirements - 16% represents roughly twice the minimum capital requirement (8%) under Basel III; |
| · | A certain minimum (currently undefined) amount of the TLAC requirement will need to be met with non-equity instruments - AT1, Tier 2 or even Tier 3 or bail-in able debt; |
| · | Minimum TLAC requirements will sit below the combined buffer requirements which may lead to consequences on MDA restrictions; |
| · | The loss absorption should be legally enforceable and should not give rise to systemic risk or disruption to the provision of critical functions. Therefore, to prevent a G-SIB resolution to spread contagion into the banking system, internationally active banks will be prevented from holding TLAC issued by other G-SIBs; |
| · | TLAC will be distributed by resolution entities to material subsidiaries which are themselves not resolution entities. Sufficient internal TLAC will be prepositioned on the balance sheet of material subsidiaries; and |
| · | Under the policy proposal TLAC is now defined as an additional rather than a parallel capital requirement to the Basel III framework and a breach of the minimum TLAC could trigger the same restrictions set out in the Basel III framework for MDA. However, this would technically be the consequence of a direct breach of the CRD IV buffer rather than the TLAC due to the no double counting principle. |
The FSB is currently working on draft principles with the rule expected to be in force by 1 January 2019.
Other developments
The following developments will also impact RBS’s capital:
| · | The Basel Committee on Banking Supervision: |
| | ° | Has proposed a recalibration of the credit risk standardised approach with implementation in 2017 with initial view of the new rules due in 2015. |
| | ° | Are reviewing the calibration of the operational risk calculation, with revised rules due in 2015 and applicable from 2017. |
| | ° | Has instigated a fundamental review of the trading book which will impact how the risk of trading book activity is measured. Initial consultation papers on this are due in 2015. |
| · | The PRA and FPC are looking at placing a floor on the risk-weight applied to mortgages in calculating the risk-weight. The level of the floor is currently being debated and current expectations are application in 2015. |
| · | The Financial Services (Banking Reform) Act passed into UK law in December 2013 implementing recommendations of the ICB; and |
| · | The US Federal Reserve Board’s final rule issued in February 2014, establishing enhanced prudential standards for foreign banking organisations. |
Business review Capital and risk management
Capital and leverage ratios
Capital, RWAs and risk asset ratios, on the basis of transitional rules and end-point CRR, calculated in accordance with PRA definitions, are set out below.
| | 2014 | | 2013 | | 2012 |
| | | PRA | | Estimated | PRA | | | |
| | End-point | transitional | | end-point | transitional | Base l | | Basel |
| | CRR basis (1) | basis | | CRR basis (1) | basis (2) | 2.5 basis | | 2.5 basis |
| Capital | £bn | £bn | | £bn | £bn | £bn | | £bn |
CET1 (3) | 39.9 | 39.6 | | 36.8 | 36.8 | 42.2 | | 47.3 |
| Tier 1 | 39.9 | 47.1 | | 36.8 | 44.3 | 50.6 | | 57.1 |
| Total | 48.6 | 60.7 | | 45.5 | 58.2 | 63.7 | | 66.8 |
| | | | | | | | | |
| RWAs | | | | | | | | |
| Credit risk | | | | | | | | |
- non-counterparty | 264.7 | 264.7 | | 317.9 | 317.9 | 291.1 | | 323.2 |
- counterparty | 30.4 | 30.4 | | 39.1 | 39.1 | 22.3 | | 48.0 |
| Market risk | 24.0 | 24.0 | | 30.3 | 30.3 | 30.3 | | 42.6 |
| Operational risk | 36.8 | 36.8 | | 41.8 | 41.8 | 41.8 | | 45.8 |
| | 355.9 | 355.9 | | 429.1 | 429.1 | 385.5 | | 459.6 |
| | | | | | | | | |
| Risk asset ratios | % | % | | % | % | % | | % |
CET1 (3) | 11.2 | 11.1 | | 8.6 | 8.6 | 10.9 | | 10.3 |
| Tier 1 | 11.2 | 13.2 | | 8.6 | 10.3 | 13.1 | | 12.4 |
| Total | 13.7 | 17.1 | | 10.6 | 13.6 | 16.5 | | 14.5 |
| | | | | | | | | |
| Leverage ratio | | 2014 | | | 2013 (2) | | | 2012 (2) |
| Tier 1 capital | | £39.9bn | | | £36.8bn | | | £37.9bn |
| Exposure | | £939.5bn | | | £1,082.0bn | | | £1,236.9bn |
Leverage ratio (4) | | 4.2% | | | 3.4% | | | 3.1% |
| (1) | Capital Requirements Regulation (CRR) as implemented by the Prudential Regulation Authority in the UK, with effect from 1 January 2014. |
| (3) | Common Equity Tier 1 (CET1) ratio with effect from 1 January 2014. |
| (4) | Based on end-point CRR Tier 1 capital and revised 2014 Basel III leverage ratio framework. |
In accordance with the PRA’s Policy Statement PS7/2013 issued in December 2013 on the implementation of CRD IV, all regulatory adjustments and deduction to CET1 have been applied in full (end-point CRR) with the exception of unrealised gains on AFS securities which will be included from 2015 (PRA transitional basis).
CRD IV and Basel III impose a minimum CET1 ratio of 4.5%. Further, CET1 requirements will be imposed through buffers in the CRD. There are three buffers that will affect RBS: the capital conservation buffer set at 2.5% of RWAs; the counter-cyclical capital buffer (up to 2.5% of RWAs), which will be calculated as the weighted average of the countercyclical capital buffer rates applied in the countries where RBS has relevant credit exposures; and the highest of Global-Systemically Important Institution (G-SII), Other-Systemically Important Institution or systemic risk buffers set by the supervisory authorities. RBS has been provisionally allocated a G-SII buffer of 1.5%. The regulatory target capital requirements will be phased in through CRR, and are expected to apply in full from 1 January 2019. Until then, using national discretion the PRA can apply a top-up. As set out in the PRA’s Supervisory Statement SS3/13, RBS and other major UK banks and building societies are required to maintain a CET1 ratio of 7%, after taking into account certain adjustments set by the PRA.
From 1 January 2015, RBS must meet at least 56% of its Pillar 2A capital requirement with CET1 capital and the balance with Additional Tier 1 and/or Tier 2 capital. The Pillar 2A capital requirement is the additional capital that RBS must hold, in addition to meeting its Pillar 1 requirements in order to comply with the PRA’s overall financial adequacy rule.
Measures in relation to end-point CRR basis, including RWAs, are based on the current interpretation, expectations, and understanding, of the CRR requirements, as well as further regulatory clarity and implementation guidance from the UK and EU authorities (end-point CRR basis). The actual end-point CRR impact may differ when the final technical standards are interpreted and adopted.
| (1) | Own funds are based on shareholders’ equity. |
| (2) | Includes the nominal value of B shares (£0.5 billion) on the assumption that RBS will be privatised in the future and that they will count as permanent equity in some form by the end of 2017. |
| (3) | The adjustment arising from the application of the prudent valuation requirements to all assets measured at fair value, has been included in full. The prudential valuation adjustment relating to assets under advanced internal ratings approach has been included in impairment provisions in the determination of the deduction from expected losses. |
| (4) | Where the deductions from AT1 capital exceed AT1 capital, the excess is deducted from CET1 capital. The excess of AT1 deductions over AT1 capital in year one of transition is due to the application of the current rules to the transitional amounts. |
| (5) | Insignificant investments in equities of other financial entities (net): long cash equity positions are considered to have matched maturity with synthetic short positions if the long position is held for hedging purposes and sufficient liquidity exists in the relevant market. All the trades are managed and monitored together within the equities business. |
| (6) | Based on our current interpretations of the Commission Delegated Regulation issued in December 2013 on credit risk adjustments, RBS’s standardised latent provision has been reclassified to specific provision and is not included in Tier 2 capital. |
Risk-weighted assets (RWAs):
| (1) | Current securitisation positions are shown as risk-weighted at 1,250%. |
| (2) | RWA uplifts include the impact of credit valuation adjustments and asset valuation correlation on banks and central counterparties. |
| (3) | RWAs reflect implementation of the full internal model method suite, and include methodology changes that took effect immediately on CRR implementation. |
| (4) | Non-financial counterparties and sovereigns that meet the eligibility criteria under CRR are exempt from the credit valuation adjustments volatility charges. |
| (5) | The CRR final text includes a reduction in the risk-weight relating to small and medium-sized enterprises. |
Business review Capital and risk management
Capital resources
| | | 2014 | | 2013 | | 2012 |
| | | | | | | | | | |
| Shareholders’ equity (excluding non-controlling interests) | | | | | | | | | |
| Shareholders' equity | | 57,246 | 57,246 | | 58,742 | 58,742 | 58,742 | | 68,678 |
| Preference shares - equity | | (4,313) | (4,313) | | (4,313) | (4,313) | (4,313) | | (4,313) |
| Other equity instruments | | (784) | (784) | | (979) | (979) | (979) | | (979) |
| | | 52,149 | 52,149 | | 53,450 | 53,450 | 53,450 | | 63,386 |
| | | | | | | | | | |
| Non-controlling interests | | — | — | | — | — | 473 | | 403 |
| | | | | | | | | | |
| Regulatory adjustments and deductions | | | | | | | | | |
| Own credit | | 500 | 500 | | 601 | 601 | 726 | | 691 |
| Defined benefit pension fund adjustment | | (238) | (238) | | (172) | (172) | 362 | | 913 |
Net unrealised available-for-sale (AFS) losses | | — | — | | — | — | 308 | | 346 |
Cash flow hedging reserve | | (1,029) | (1,029) | | 84 | 84 | 84 | | (1,666) |
| Deferred tax assets | | (1,222) | (1,222) | | (2,260) | (2,260) | — | | — |
| Prudential valuation adjustments | | (384) | (384) | | (781) | (781) | — | | — |
| Goodwill and other intangible assets | | (7,781) | (7,781) | | (12,368) | (12,368) | (12,368) | | (13,545) |
| Expected losses less impairments | | (1,491) | (1,491) | | (1,731) | (1,731) | (19) | | (1,904) |
50% of securitisation positions | | — | — | | — | — | (748) | | (1,107) |
| Other regulatory adjustments | | (585) | (855) | | (55) | (55) | (103) | | (197) |
| | | (12,230) | (12,500) | | (16,682) | (16,682) | (11,758) | | (16,469) |
| | | | | | | | | | |
| CET1 capital | | 39,919 | 39,649 | | 36,768 | 36,768 | 42,165 | | 47,320 |
| | | | | | | | | | |
| Additional Tier 1 (AT1) capital | | | | | | | | | |
Preference shares - equity | | — | — | | — | — | 4,313 | | 4,313 |
Preference shares - debt | | — | — | | — | — | 911 | | 1,054 |
Innovative/hybrid Tier 1 securities | | — | — | | — | — | 4,207 | | 4,125 |
| Qualifying instruments and related share premium subject to phase out | | — | 5,820 | | — | 5,831 | — | | — |
| Qualifying instruments issued by subsidiaries and held by third parties | | — | 1,648 | | — | 1,749 | — | | — |
| AT1 capital | | — | 7,468 | | — | 7,580 | 9,431 | | 9,492 |
| Tier 1 deductions | | | | | | | | | |
50% of material holdings | | — | — | | — | — | (976) | | (295) |
Tax on expected losses less impairments | | — | — | | — | — | 6 | | 618 |
| | | — | — | | — | — | (970) | | 323 |
| | | | | | | | | | |
| Tier 1 capital | | 39,919 | 47,117 | | 36,768 | 44,348 | 50,626 | | 57,135 |
Business review Capital and risk management
| | | 2014 | | 2013 | | 2012 |
| | | | | | Estimated | | | | |
| Qualifying Tier 2 capital | | | | | | | | | |
| Undated subordinated debt | | — | — | | — | — | 2,109 | | 2,194 |
| Dated subordinated debt - net of amortisation | | — | — | | — | — | 12,436 | | 13,420 |
| Qualifying instruments and related share premium | | 5,542 | 6,136 | | 3,582 | 4,431 | — | | — |
| Qualifying instruments issued by subsidiaries and held by third parties | | 3,175 | 7,490 | | 5,151 | 9,374 | — | | — |
| Unrealised gains on AFS equity shares | | — | — | | — | — | 114 | | 63 |
| Collectively assessed impairment provisions | | — | — | | — | — | 395 | | 399 |
| | | 8,717 | 13,626 | | 8,733 | 13,805 | 15,054 | | 16,076 |
| | | | | | | | | | |
| Tier 2 deductions | | | | | | | | | |
50% of securitisation positions | | — | — | | — | — | (748) | | (1,107) |
| Expected losses less impairments | | — | — | | — | — | (25) | | (2,522) |
50% of material holdings | | — | — | | — | — | (976) | | (295) |
| | | — | — | | — | — | (1,749) | | (3,924) |
| | | | | | | | | | |
| Tier 2 capital | | 8,717 | 13,626 | | 8,733 | 13,805 | 13,305 | | 12,152 |
| | | | | | | | | | |
| Supervisory deductions | | | | | | | | | |
Unconsolidated investments | | — | — | | — | — | (36) | | (2,243) |
Other deductions | | — | — | | — | — | (236) | | (244) |
| | | — | — | | — | — | (272) | | (2,487) |
| Total regulatory capital | | 48,636 | 60,743 | | 45,501 | 58,153 | 63,659 | | 66,800 |
The table below analyses the movement in end-point CRR CET1 and Tier 2 capital for the year. |
| | CET1 £m | Tier 2 £m | Total £m |
| At 1 January 2014 | 36,768 | 8,733 | 45,501 |
| Loss for the year including reclassification of CFG, net of movements in fair value of own credit | (3,571) | — | (3,571) |
| Share capital and reserve movements in respect of employee share schemes | 205 | — | 205 |
| Ordinary shares issued | 300 | — | 300 |
| Foreign exchange reserve | (208) | — | (208) |
| AFS reserves | 607 | — | 607 |
| Decrease in goodwill and intangibles deduction | 4,032 | — | 4,032 |
| Deferred tax assets (DTA) | 1,038 | — | 1,038 |
| Prudential valuation adjustments | 397 | — | 397 |
| Excess of expected loss over impairment provisions | 240 | — | 240 |
| Dated subordinated debt issues | — | 2,159 | 2,159 |
| Net dated subordinated debt/grandfathered instruments | — | (1,537) | (1,537) |
| Foreign exchange movements | — | (638) | (638) |
| Other movements | 111 | — | 111 |
| At 31 December 2014 | 39,919 | 8,717 | 48,636 |
Key points
| · | On the reclassification of CFG to disposal groups at 31 December 2014, the carrying value exceeded its fair value less costs to sell by £4 billion. The consequential write down has been ascribed to goodwill relating to CFG. |
| · | The lower regulatory capital deduction for DTA is due to the reduction in the net DTA balance reflecting the write down of deferred tax assets during the year. |
| · | Tier 2 issuances of £2.2 billion comprised €1 billion 3.625% subordinated notes and $2.25 billion 5.125% subordinated notes, both maturing in 2024. |
*unaudited
Business review Capital and risk management
Leverage exposure
The leverage exposure is based on the revised 2014 Basel III leverage ratio framework. The leverage ratio as originally included in the CRR is aligned with the internationally agreed ratio from January 2015.
| | End-point CRR basis (2) |
Leverage (1) | 2014 £bn | 2013 (3) £bn |
| Derivatives | 354.0 | 288.0 |
| Loans and advances | 419.6 | 418.4 |
| Reverse repos | 64.7 | 76.4 |
| Other assets | 212.5 | 245.1 |
| Total assets | 1,050.8 | 1,027.9 |
| Derivatives | | |
| - netting | (330.9) | (227.3) |
| - potential future exposures | 98.8 | 128.0 |
| Securities financing transactions gross up | 25.0 | 59.8 |
| Weighted undrawn commitments | 96.4 | 100.2 |
| Regulatory deductions and other adjustments | (0.6) | (6.6) |
| Leverage exposure | 939.5 | 1,082.0 |
| (1) | Based on end-point CRR Tier 1 capital and revised 2014 Basel III leverage ratio framework. |
| (2) | Capital Requirements Regulation (CRR) as implemented by the Prudential Regulation Authority in the UK, with effect from 1 January 2014. |
Additional analysis of derivative notionals and undrawn commitments, two of the major components included in the balance sheet contributing to the leverage exposure, is set out below.
Derivative notionals
Derivative potential future exposures (PFE) are calculated based on the notional value of the contracts and is dependent on the type of contract. For contracts other than credit derivatives the PFE is based on the type and maturity of the contract after the effect of netting arrangements.
The PFE on credit derivatives is based on add-on factors determined by the asset quality of the referenced instrument. Qualifying credit derivatives attract a PFE add-on of 5% and have reference securities issued by public sector entities, multilateral development banks or other investment grade issuers. Non-qualifying credit derivatives attract a PFE add-on of 10%.
The table below analyses the derivative notionals by maturity for contracts other than credit derivatives and credit derivatives by qualifying and not.
| | Derivative other than | | | | |
| | credit derivative | | Credit derivative | |
| | <1 year | 1-5 years | >5 years | | Qualifying | Non-qualifying | Total |
| 2014 | £bn | £bn | £bn | | £bn | £bn | £bn |
| Interest rate | 11,069 | 10,423 | 5,839 | | | | 27,331 |
| Exchange rate | 3,649 | 720 | 306 | | | | 4,675 |
| Equity | 42 | 33 | 2 | | | | 77 |
| Commodities | 1 | — | — | | | | 1 |
| Credit | | | | | 99 | 26 | 125 |
| Total | 14,761 | 11,176 | 6,147 | | 99 | 26 | 32,209 |
| | | | | | | | |
| 2013 | | | | | | | |
| Interest rate | 10,582 | 16,212 | 8,795 | | | | 35,589 |
| Exchange rate | 3,261 | 814 | 480 | | | | 4,555 |
| Equity | 43 | 35 | 1 | | | | 79 |
| Commodities | — | 1 | 1 | | | | 2 |
| Credit | | | | | 189 | 64 | 253 |
| Total | 13,886 | 17,062 | 9,277 | | 189 | 64 | 40,478 |
| | | | | | | | |
| 2012 | | | | | | | |
| Interest rate | 12,515 | 12,980 | 7,988 | | | | 33,483 |
| Exchange rate | 3,411 | 795 | 492 | | | | 4,698 |
| Equity | 51 | 52 | 4 | | | | 107 |
| Commodities | 2 | — | 2 | | | | 4 |
| Credit | | | | | 470 | 83 | 553 |
| Total | 15,979 | 13,827 | 8,486 | | 470 | 83 | 38,845 |
Business review Capital and risk management
Weighted undrawn commitments
| | Banking | Ulster Bank | Commercial Banking | Private Banking | Corporate & Institutional Banking | Central items | Group | RCR | Total |
| 2014 | £bn | £bn | £bn | £bn | £bn | £bn | £bn | £bn | £bn |
Unconditionally cancellable items (1) | 3.1 | 0.1 | 1.0 | 0.2 | 2.4 | — | 1.8 | — | 8.6 |
| Items with a 20% CCF | 0.4 | — | 0.7 | 0.1 | 3.2 | — | 0.4 | — | 4.8 |
| Items with a 50% CCF | 4.8 | 1.0 | 9.8 | 1.4 | 36.8 | 1.6 | 7.8 | 0.5 | 63.7 |
| Items with a 100% CCF | 0.1 | 0.3 | 2.2 | 0.8 | 10.2 | 3.9 | 1.5 | 0.3 | 19.3 |
| | 8.4 | 1.4 | 13.7 | 2.5 | 52.6 | 5.5 | 11.5 | 0.8 | 96.4 |
| | | | | | | | | | |
| 2013 | | | | | | | | Non-Core | |
Unconditionally cancellable items (1) | 3.1 | 0.2 | 0.4 | 0.1 | 0.7 | — | 1.7 | — | 6.2 |
| Items with a 20% CCF | 0.4 | — | 0.6 | 0.6 | 1.5 | — | 0.2 | — | 3.3 |
| Items with a 50% CCF | 5.8 | 1.0 | 12.5 | 1.0 | 41.9 | 2.7 | 7.1 | 0.7 | 72.7 |
| Items with a 100% CCF | 0.1 | 0.3 | 2.4 | 1.4 | 12.0 | — | 1.6 | 0.2 | 18.0 |
| | 9.4 | 1.5 | 15.9 | 3.1 | 56.1 | 2.7 | 10.6 | 0.9 | 100.2 |
| (1) | Based on a 10% credit conversion factor. |
| Risk-weighted assets |
| The table below analyses the movement in credit risk RWAs by key drivers during the year. |
| | Credit risk | |
| | Non-counterparty | Counterparty | Total |
| | £bn | £bn | £bn |
| At 1 January 2014 (Basel 2.5 basis) | 291.1 | 22.3 | 313.4 |
CRR impact (1) | 26.8 | 16.8 | 43.6 |
| At 1 January 2014 (CRR basis) | 317.9 | 39.1 | 357.0 |
| Foreign exchange movement | 1.5 | — | 1.5 |
| Business movements | (21.6) | (13.9) | (35.5) |
| Risk parameter changes | (11.7) | — | (11.7) |
| Methodology changes | (17.9) | 5.2 | (12.7) |
| Model updates | (2.7) | — | (2.7) |
| Other changes | (0.8) | — | (0.8) |
| At 31 December 2014 (CRR basis) | 264.7 | 30.4 | 295.1 |
| | | | |
Modelled (1) | 163.2 | 26.6 | 189.8 |
| Non-modelled | 101.5 | 3.8 | 105.3 |
| | 264.7 | 30.4 | 295.1 |
| (1) | Refer to RWA notes on the following page for further information. |
| The table below analyses movements in market and operational risk RWAs during the year. |
| | Market risk | | |
| | CIB | Other | Total | Operational risk | Total |
| | £bn | £bn | £bn | £bn | £bn |
| At 1 January 2014 (Basel 2.5 and CRR bases) | 22.4 | 7.9 | 30.3 | 41.8 | 72.1 |
| Business and market movements | (15.4) | (2.8) | (18.2) | (5.0) | (23.2) |
| Methodology changes | 11.9 | — | 11.9 | — | 11.9 |
| At 31 December 2014 (CRR basis) | 18.9 | 5.1 | 24.0 | 36.8 | 60.8 |
| | | | | | |
Modelled (1) | 14.9 | 3.3 | 18.2 | — | 18.2 |
| Non-modelled | 4.0 | 1.8 | 5.8 | 36.8 | 42.6 |
| | 18.9 | 5.1 | 24.0 | 36.8 | 60.8 |
| (1) | Modelled refers to advanced internal ratings basis for non-counterparty credit risk, internal model method for counterparty credit risk, and value-at-risk and related models for market risk. These principally relate to CIB (£83 billion) and Commercial Banking (£48 billion). |
*unaudited
Business review Capital and risk management
The table below analyses RWA movements by segment during the year.
| Total RWAs | UK Personal & Business Banking £bn | Ulster Bank £bn | Commercial Banking £bn | Private Banking £bn | Corporate & Institutional Banking £bn | Central items £bn | Citizens Financial Group £bn | RCR £bn | Non-Core £bn | Total £bn |
| At 31 December 2013 (Basel 2.5 basis) | 51.2 | 30.7 | 65.8 | 12.0 | 120.4 | 20.1 | 56.1 | — | 29.2 | 385.5 |
Impact of dissolution of Non-Core and creation of RCR | — | (1.9) | (2.7) | — | (10.0) | 0.1 | 2.0 | 41.7 | (29.2) | — |
| CRR impact | (1.5) | (0.6) | (1.6) | — | 36.7 | 3.1 | 2.5 | 5.0 | — | 43.6 |
| At 1 January 2014 (CRR basis) | 49.7 | 28.2 | 61.5 | 12.0 | 147.1 | 23.3 | 60.6 | 46.7 | — | 429.1 |
| Foreign exchange movement | — | (1.1) | — | — | (1.0) | — | 3.6 | — | — | 1.5 |
| Business movements | (0.3) | 0.3 | — | — | (36.8) | (6.1) | 4.2 | (20.0) | — | (58.7) |
Risk parameter changes (1) | (5.0) | (3.6) | 0.2 | — | — | — | — | (3.3) | — | (11.7) |
Methodology changes (2) | — | — | 1.7 | (0.2) | (2.0) | — | — | (0.3) | — | (0.8) |
Model updates (3) | (1.6) | — | 0.6 | — | (0.2) | (0.4) | — | (1.1) | — | (2.7) |
| Other changes | — | — | — | (0.3) | — | (0.5) | — | — | — | (0.8) |
| At 31 December 2014 (CRR basis) | 42.8 | 23.8 | 64.0 | 11.5 | 107.1 | 16.3 | 68.4 | 22.0 | — | 355.9 |
| (1) | Risk parameter changes relate to changes in credit quality metrics of customers and counterparties such as probability of default (PD) and loss given default (LGD). They comprise: |
- UK PBB and Ulster Bank: primarily reflects recalibration of PD and LGD models reflecting improvements to the UK economy.
- RCR: decrease in defaulted assets (£1.0 billion) and internal rating upgrades for certain counterparties (£0.8 billion).
| (2) | Methodology changes included: |
- Commercial Banking: revisions to both currency netting and maturity dates for securitisation liquidity facilities.
- CIB: £2.0 billion primarily represents inclusion of hedges in the credit valuation adjustments calculation. In addition there were offsetting movements of £11.4 billion reflecting transition of trading book securitisations from credit risk to market risk; and £7.5 billion reflecting reclassification of new CRR related charges, primarily asset value correlation and certain exchange traded derivatives from non-counterparty credit risk to counterparty credit risk.
| (3) | The following models were updated during the year: |
- UK PBB: revised retail LGD model.
- Commercial Banking and RCR: new large corporate PD model.
- CIB: reduction due to the impact of exposure at default model £2.6 billion was offset by the new large corporate PD model.
Key points
| · | RBS RWAs increased from £385 billion on a Basel 2.5 basis to £429 billion on a CRR basis principally reflecting: |
| | ° | 1,250% risk weighting of securitisation positions; previously capital deductions; |
| | ° | Impact of credit valuation adjustment and asset valuation correlation relating to banks and central counterparty; |
| | ° | Implementation of CRR model suite; and |
| | ° | Reduction in risk weighting for small and medium sized enterprises (SME). |
| · | UK PBB RWAs reduced due to improvements in credit quality, recovery in the UK economy and lower balances. |
| · | In Commercial Banking, credit risk RWAs increased by £5 billion due to growth in loans (£2 billion) and methodology changes (£2 billion) and model changes (£1 billion), offset by a £2 billion decrease in operational risk RWAs. |
| · | CIB managed down RWAs by £40 billion, through both balance sheet and risk reductions. The reduction included £15 billion of market risk RWAs due to the wind down of the US asset-backed products business, £6 billion credit risk RWAs in GTS and Portfolio and £10 billion in Rates reflecting counterparty reviews as well as exits, novations and mitigation. Operational risk RWAs decreased by £3 billion. |
| · | The RCR disposal strategy and run-off resulted in a £25 billion reduction in RWAs, £9 billion each in real estate finance and corporate, and a further £5 billion and £2 billion in Markets and Ulster Bank respectively. |
In relation to RWA density:
| · | The increase in RWA density of exposures reflected the impact of credit valuation adjustments and asset valuation correlation and those on structured entities related to revised RWA treatments, both relating to the implementations of CRD IV. |
| · | Non-modelled standardised credit risk RWAs principally comprised CFG (£63 billion), and Private Banking (£10 billion); repo transactions undertaken by RBSSI, the broker-dealer and certain securitisation exposures. |
| · | Total shipping portfolio exposure at default (EAD) was £10.9 billion and RWAs of £8.4 billion of which £2.3 billion and £1.7 billion were in RCR. |
| · | Oil and gas RWAs were £8.5 billion at a density of 49%. Mining and metals RWAs were £3.3 billion with a density of 74%. |
Business review Capital and risk management
EAD and RWA density
The tables below analyse exposure at default (EAD) after credit risk mitigation (CRM), RWAs and related RWA density (RWAs as a percentage of EAD) by sector cluster. RWAs at 31 December 2014 are under current rules and 31 December 2013 are on a Basel 2.5 basis. Refer to page 211 for a bridge between balance sheet and EAD.
| | EAD post CRM (1) | | RWAs | | RWA density |
| | AIRB | STD | Total | | AIRB | STD | Total | | AIRB | STD | Total |
| 2014 | £m | £m | £m | | £m | £m | £m | | % | % | % |
| Sector cluster | | | | | | | | | | | |
| Sovereign | | | | | | | | | | | |
| Central banks | 44,007 | 50,539 | 94,546 | | 1,632 | 78 | 1,710 | | 4 | — | 2 |
| Central government | 16,373 | 9,944 | 26,317 | | 1,775 | 61 | 1,836 | | 11 | 1 | 7 |
| Other sovereign | 4,936 | 6,548 | 11,484 | | 1,250 | 386 | 1,636 | | 25 | 6 | 14 |
| Total sovereign | 65,316 | 67,031 | 132,347 | | 4,657 | 525 | 5,182 | | 7 | 1 | 4 |
| | | | | | | | | | | | |
| Financial institutions (FI) | | | | | | | | | | | |
| Banks | 32,777 | 2,081 | 34,858 | | 15,089 | 488 | 15,577 | | 46 | 23 | 45 |
Other FI (2) | 41,420 | 22,535 | 63,955 | | 15,585 | 9,960 | 25,545 | | 38 | 44 | 40 |
SSPEs (3) | 17,504 | 2,634 | 20,138 | | 6,216 | 4,410 | 10,626 | | 36 | 167 | 53 |
| Total FI | 91,701 | 27,250 | 118,951 | | 36,890 | 14,858 | 51,748 | | 40 | 55 | 44 |
| | | | | | | | | | | | |
| Corporates | | | | | | | | | | | |
| Property | | | | | | | | | | | |
| - UK | 48,081 | 3,463 | 51,544 | | 23,736 | 3,390 | 27,126 | | 49 | 98 | 53 |
| - Ireland | 7,541 | 31 | 7,572 | | 1,283 | 33 | 1,316 | | 17 | 106 | 17 |
| - Other Western Europe | 4,625 | 431 | 5,056 | | 2,321 | 445 | 2,766 | | 50 | 103 | 55 |
| - US | 1,334 | 7,481 | 8,815 | | 722 | 7,551 | 8,273 | | 54 | 101 | 94 |
| - RoW | 2,048 | 284 | 2,332 | | 1,296 | 249 | 1,545 | | 63 | 88 | 66 |
| Total property | 63,629 | 11,690 | 75,319 | | 29,358 | 11,668 | 41,026 | | 46 | 100 | 54 |
| Natural resources | | | | | | | | | | | |
| - Oil and gas | 15,704 | 1,876 | 17,580 | | 6,864 | 1,665 | 8,529 | | 44 | 89 | 49 |
| - Mining and metals | 3,744 | 635 | 4,379 | | 2,602 | 660 | 3,262 | | 69 | 104 | 74 |
| - Other | 16,173 | 1,070 | 17,243 | | 6,367 | 861 | 7,228 | | 39 | 80 | 42 |
| Transport | | | | | | | | | | | |
| - Shipping | 8,332 | 2,571 | 10,903 | | 5,790 | 2,575 | 8,365 | | 69 | 100 | 77 |
| - Other | 21,268 | 3,297 | 24,565 | | 9,176 | 2,865 | 12,041 | | 43 | 87 | 49 |
| Manufacturing | 29,450 | 8,430 | 37,880 | | 12,673 | 8,257 | 20,930 | | 43 | 98 | 55 |
| Retail and leisure | 24,564 | 8,262 | 32,826 | | 14,940 | 8,027 | 22,967 | | 61 | 97 | 70 |
| Services | 23,489 | 8,426 | 31,915 | | 13,327 | 8,350 | 21,677 | | 57 | 99 | 68 |
TMT (4) | 13,555 | 2,790 | 16,345 | | 7,079 | 2,806 | 9,885 | | 52 | 101 | 60 |
| Total corporates | 219,908 | 49,047 | 268,955 | | 108,176 | 47,734 | 155,910 | | 49 | 97 | 58 |
| | | | | | | | | | | | |
| Personal | | | | | | | | | | | |
| Mortgages | | | | | | | | | | | |
| - UK | 113,884 | 7,794 | 121,678 | | 10,651 | 3,121 | 13,772 | | 9 | 40 | 11 |
| - Ireland | 15,544 | 37 | 15,581 | | 13,137 | 18 | 13,155 | | 85 | 49 | 84 |
| - Other Western Europe | 193 | 311 | 504 | | 16 | 124 | 140 | | 8 | 40 | 28 |
| - US | 131 | 21,088 | 21,219 | | 10 | 10,352 | 10,362 | | 8 | 49 | 49 |
| - RoW | 407 | 589 | 996 | | 39 | 232 | 271 | | 10 | 39 | 27 |
| Total mortgages | 130,159 | 29,819 | 159,978 | | 23,853 | 13,847 | 37,700 | | 18 | 46 | 24 |
| Other personal | 31,628 | 15,971 | 47,599 | | 13,233 | 11,805 | 25,038 | | 42 | 74 | 53 |
| Total personal | 161,787 | 45,790 | 207,577 | | 37,086 | 25,652 | 62,738 | | 23 | 56 | 30 |
| Other items | 4,465 | 18,363 | 22,828 | | 3,012 | 16,580 | 19,592 | | 67 | 90 | 86 |
| Total | 543,177 | 207,481 | 750,658 | | 189,821 | 105,349 | 295,170 | | 35 | 51 | 39 |
Business review Capital and risk management
| | EAD post CRM (1) | | RWAs | | RWA density |
| | AIRB | STD | Total | | AIRB | STD | Total | | AIRB | STD | Total |
| 2013 | £m | £m | £m | | £m | £m | £m | | % | % | % |
| Sector cluster | | | | | | | | | | | |
| Sovereign | | | | | | | | | | | |
| Central banks | 34,809 | 59,351 | 94,160 | | 1,289 | 180 | 1,469 | | 4 | — | 2 |
| Central government | 17,940 | 8,401 | 26,341 | | 2,418 | 30 | 2,448 | | 13 | — | 9 |
| Other sovereign | 5,323 | 5,525 | 10,848 | | 1,451 | 149 | 1,600 | | 27 | 3 | 15 |
| Total sovereign | 58,072 | 73,277 | 131,349 | | 5,158 | 359 | 5,517 | | 9 | — | 4 |
| | | | | | | | | | | | |
| Financial institutions (FI) | | | | | | | | | | | |
| Banks | 37,718 | 2,769 | 40,487 | | 11,922 | 689 | 12,611 | | 32 | 25 | 31 |
Other FI (2) | 43,460 | 14,033 | 57,493 | | 16,391 | 7,940 | 24,331 | | 38 | 57 | 42 |
SSPEs (3) | 21,564 | 2,523 | 24,087 | | 5,827 | 2,189 | 8,016 | | 27 | 87 | 33 |
| Total FI | 102,742 | 19,325 | 122,067 | | 34,140 | 10,818 | 44,958 | | 33 | 56 | 37 |
| | | | | | | | | | | | |
| Corporates | | | | | | | | | | | |
| Property | | | | | | | | | | | |
| - UK | 50,250 | 2,771 | 53,021 | | 27,904 | 2,461 | 30,365 | | 56 | 89 | 57 |
| - Ireland | 10,338 | 107 | 10,445 | | 3,087 | 136 | 3,223 | | 30 | 127 | 31 |
| - Other Western Europe | 8,764 | 143 | 8,907 | | 4,937 | 130 | 5,067 | | 56 | 91 | 57 |
| - US | 1,126 | 6,527 | 7,653 | | 600 | 6,272 | 6,872 | | 53 | 96 | 90 |
| - RoW | 3,579 | 317 | 3,896 | | 2,817 | 253 | 3,070 | | 79 | 80 | 79 |
| Total property | 74,057 | 9,865 | 83,922 | | 39,345 | 9,252 | 48,597 | | 53 | 94 | 58 |
| Natural resources | 29,403 | 2,826 | 32,229 | | 15,586 | 2,435 | 18,021 | | 53 | 86 | 56 |
| Transport | 31,677 | 3,024 | 34,701 | | 21,678 | 2,709 | 24,387 | | 68 | 90 | 70 |
| Manufacturing | 24,649 | 7,775 | 32,424 | | 13,607 | 7,599 | 21,206 | | 55 | 98 | 65 |
| Retail and leisure | 23,974 | 7,744 | 31,718 | | 18,302 | 7,591 | 25,893 | | 76 | 98 | 82 |
| Services | 22,716 | 8,757 | 31,473 | | 15,972 | 8,382 | 24,354 | | 70 | 96 | 77 |
TMT (4) | 13,550 | 2,222 | 15,772 | | 8,470 | 2,198 | 10,668 | | 63 | 99 | 68 |
| Total corporates | 220,026 | 42,213 | 262,239 | | 132,960 | 40,166 | 173,126 | | 60 | 95 | 66 |
| | | | | | | | | | | | |
| Personal | | | | | | | | | | | |
| Mortgages | | | | | | | | | | | |
| - UK | 110,470 | 7,841 | 118,311 | | 14,412 | 3,267 | 17,679 | | 13 | 42 | 15 |
| - Ireland | 17,148 | 33 | 17,181 | | 16,108 | 12 | 16,120 | | 94 | 36 | 94 |
| - Other Western Europe | 202 | 507 | 709 | | 25 | 202 | 227 | | 12 | 40 | 32 |
| - US | 121 | 19,717 | 19,838 | | 15 | 9,756 | 9,771 | | 12 | 49 | 49 |
| - RoW | 396 | 242 | 638 | | 50 | 107 | 157 | | 13 | 44 | 25 |
| Total mortgages | 128,337 | 28,340 | 156,677 | | 30,610 | 13,344 | 43,954 | | 24 | 47 | 28 |
| Other personal | 33,358 | 14,521 | 47,879 | | 15,286 | 10,703 | 25,989 | | 46 | 74 | 54 |
| Total personal | 161,695 | 42,861 | 204,556 | | 45,896 | 24,047 | 69,943 | | 28 | 56 | 34 |
| Other items | 4,756 | 19,189 | 23,945 | | 4,061 | 15,798 | 19,859 | | 85 | 82 | 83 |
| Total | 547,291 | 196,865 | 744,156 | | 222,215 | 91,188 | 313,403 | | 41 | 46 | 42 |
*unaudited
| (1) | Exposure at default post credit risk mitigation reflects an estimate of the extent to which a bank will be exposed under a specific facility, in the event of the default of a counterparty; AIRB: advanced internal ratings based; STD: standardised. |
| (2) | Non-bank financial institutions, such as US agencies, insurance companies, pension funds, hedge and leverage funds, broker-dealers and non-bank subsidiaries of banks. |
| (3) | Securitisation structured purpose entities primarily relate to securitisation related vehicles. |
| (4) | Telecommunications, media and technology. |
*unaudited
Business review Capital and risk management
Accounting to regulatory consolidation bridge
The table below provides a reconciliation between accounting and regulatory consolidation.
| | 2014 | | 2013 |
| | | Deconsolidation of insurance and other entities (1) £m | | | | | Deconsolidation of insurance and other entities (1) £m | | |
| Assets | | | | | | | | | |
| Cash and balances at central banks | 74,872 | (13) | 650 | 75,509 | | 82,659 | — | 430 | 83,089 |
| Loans and advances | 421,973 | 1,900 | 4,565 | 428,438 | | 494,793 | 1,191 | 3,572 | 499,556 |
| Debt securities | 86,649 | (290) | 1,258 | 87,617 | | 113,599 | (7) | 1,086 | 114,678 |
| Equity shares | 5,635 | (30) | 93 | 5,698 | | 8,811 | (3) | — | 8,808 |
| Settlement balances | 4,667 | — | — | 4,667 | | 5,591 | — | — | 5,591 |
| Derivatives | 353,590 | 355 | 24 | 353,969 | | 288,039 | — | — | 288,039 |
| Intangible assets | 7,781 | — | 4 | 7,785 | | 12,368 | — | — | 12,368 |
| Property, plant and equipment | 6,167 | (457) | 86 | 5,796 | | 7,909 | (948) | 32 | 6,993 |
| Deferred tax | 1,540 | — | — | 1,540 | | 3,478 | — | — | 3,478 |
| Prepayments, accrued income and other assets | 5,878 | (38) | (508) | 5,332 | | 7,614 | (488) | (533) | 6,593 |
| Assets of disposal groups | 82,011 | — | — | 82,011 | | 3,017 | — | — | 3,017 |
| | 1,050,763 | 1,427 | 6,172 | 1,058,362 | | 1,027,878 | (255) | 4,587 | 1,032,210 |
| | | | | | | | | | |
| Liabilities | | | | | | | | | |
| Deposits by banks and customer accounts | 452,304 | 893 | 5,452 | 458,649 | | 534,859 | (5) | 4,150 | 539,004 |
| Debt securities in issue | 50,280 | 796 | 305 | 51,381 | | 67,819 | — | — | 67,819 |
| Settlement balances | 4,503 | — | — | 4,503 | | 5,313 | — | — | 5,313 |
| Short positions | 23,029 | — | — | 23,029 | | 28,022 | — | — | 28,022 |
| Derivatives | 349,805 | — | 17 | 349,822 | | 285,526 | (208) | — | 285,318 |
| Accruals, deferred income and other liabilities | 13,346 | (241) | 398 | 13,503 | | 16,017 | (33) | 139 | 16,123 |
| Retirement benefit liabilities | 2,579 | — | — | 2,579 | | 3,210 | — | — | 3,210 |
| Deferred tax | 500 | — | — | 500 | | 507 | (9) | — | 498 |
| Subordinated liabilities | 22,905 | — | — | 22,905 | | 24,012 | — | 298 | 24,310 |
| Liabilities of disposal groups | 71,320 | — | — | 71,320 | | 3,378 | — | — | 3,378 |
| | 990,571 | 1,448 | 6,172 | 998,191 | | 968,663 | (255) | 4,587 | 972,995 |
| | | | | | | | | | |
| Non-controlling interests | 2,946 | (21) | — | 2,925 | | 473 | — | — | 473 |
| Owners’ equity | 57,246 | — | — | 57,246 | | 58,742 | — | — | 58,742 |
| Total equity | 60,192 | (21) | — | 60,171 | | 59,215 | — | — | 59,215 |
| | 1,050,763 | 1,427 | 6,172 | 1,058,362 | | 1,027,878 | (255) | 4,587 | 1,032,210 |
| (1) | RBS can only include particular types of subsidiary undertaking in the regulatory consolidation. Insurance undertakings and non-financial undertakings are excluded from the regulatory consolidation, although they are included in the consolidation for financial reporting. |
| (2) | RBS must proportionally consolidate its associates for regulatory purposes where they are classified as credit institutions or financial institutions. These will generally have been equity accounted for financial reporting purposes. |
*unaudited
Business review Capital and risk management
Balance sheet to EAD bridge
The table below provides a bridge between the balance sheet and credit EAD by balance sheet caption.
| | | | | | | | Other regulatory adjustments | | | | | | |
| | | | Consolidation differences (1) | | | | risk (2) | | | | Netting and collateral (4) | | | | | | Methodology differences and | | | | | | |
| 2014 | £bn | | £bn | | £bn | | £bn | | £bn | | £bn | | £bn | | £bn | | £bn | | £bn | | £bn | | £bn |
| Cash and balances | | | | | | | | | | | | | | | | | | | | | | | |
| at central banks | 74.9 | | 0.6 | | 75.5 | | — | | — | | — | | — | | 0.6 | | — | | 76.1 | | — | | 76.1 |
| Reverse repurchase | | | | | | | | | | | | | | | | | | | | | | | |
| agreements and stock | | | | | | | | | | | | | | | | | | | | | | | |
| borrowing | 64.7 | | — | | 64.7 | | — | | — | | (37.8) | | — | | — | | — | | 26.9 | | — | | 26.9 |
| Loans and advances | 357.3 | | 6.5 | | 363.8 | | — | | 17.5 | | (33.4) | | — | | 62.2 | | (11.2) | | 398.9 | | 100.6 | | 499.5 |
| Debt securities | 86.6 | | 1.0 | | 87.6 | | (49.3) | | 0.3 | | — | | — | | 15.3 | | (0.2) | | 53.7 | | — | | 53.7 |
| Equity shares | 5.6 | | — | | 5.6 | | (4.9) | | 0.1 | | — | | — | | 0.6 | | 0.3 | | 1.7 | | — | | 1.7 |
| Settlement balances | 4.7 | | — | | 4.7 | | (4.7) | | — | | — | | — | | — | | — | | — | | — | | — |
| Derivatives | 353.6 | | 0.4 | | 354.0 | | — | | 1.4 | | (295.3) | | — | | 0.4 | | (9.1) | | 51.4 | | — | | 51.4 |
| Intangible assets | 7.8 | | — | | 7.8 | | — | | — | | — | | (8.4) | | 0.6 | | — | | — | | — | | — |
| Property, plant and | | | | | | | | | | | | | | | | | | | | | | | |
| equipment | 6.2 | | (0.4) | | 5.8 | | — | | — | | — | | — | | 0.5 | | 0.5 | | 6.8 | | — | | 6.8 |
| Deferred tax | 1.5 | | — | | 1.5 | | — | | — | | — | | (1.2) | | — | | (0.2) | | 0.1 | | — | | 0.1 |
| Prepayments, accrued | | | | | | | | | | | | | | | | | | | | | | | |
| income and other assets | 5.9 | | (0.5) | | 5.4 | | — | | — | | — | | — | | 1.8 | | (0.1) | | 7.1 | | — | | 7.1 |
| Assets of disposal groups | 82.0 | | — | | 82.0 | | — | | — | | — | | — | | (82.0) | | — | | — | | — | | — |
| Total assets | 1,050.8 | | 7.6 | | 1,058.4 | | (58.9) | | 19.3 | | (366.5) | | (9.6) | | — | | (20.0) | | 622.7 | | 100.6 | | 723.3 |
| Contingent obligations | | | | | | | | | | | | | | | | | | | | | 27.4 | | 27.4 |
| | | | | | | | | | | | | | | | | | | | | | 128.0 | | 750.7 |
| 2013 | | | | | | | | | | | | | | | | | | | | | | | |
| Cash and balances | | | | | | | | | | | | | | | | | | | | | | | |
| at central banks | 82.7 | | 0.4 | | 83.1 | | — | | — | | — | | — | | — | | 1.7 | | 84.8 | | — | | 84.8 |
| Reverse repurchase | | | | | | | | | | | | | | | | | | | | | | | |
| agreements and stock | | | | | | | | | | | | | | | | | | | | | | | |
| borrowing | 76.4 | | — | | 76.4 | | — | | — | | (51.3) | | — | | — | | — | | 25.1 | | — | | 25.1 |
| Loans and advances | 418.4 | | 4.7 | | 423.1 | | — | | 25.2 | | (28.4) | | (0.4) | | 1.8 | | (9.7) | | 411.6 | | 75.6 | | 487.2 |
| Debt securities | 113.6 | | 1.1 | | 114.7 | | (56.7) | | 0.3 | | — | | (1.5) | | — | | 2.0 | | 58.8 | | 0.1 | | 58.9 |
| Equity shares | 8.8 | | — | | 8.8 | | (7.2) | | 0.1 | | — | | — | | — | | (0.1) | | 1.6 | | — | | 1.6 |
| Settlement balances | 5.6 | | — | | 5.6 | | (5.6) | | — | | — | | — | | — | | — | | — | | — | | — |
| Derivatives | 288.0 | | — | | 288.0 | | — | | 1.8 | | (242.8) | | — | | — | | (2.1) | | 44.9 | | — | | 44.9 |
| Intangible assets | 12.4 | | — | | 12.4 | | — | | — | | — | | (12.4) | | — | | — | | — | | — | | — |
| Property, plant and | | | | | | | | | | | | | | | | | | | | | | | |
| equipment | 7.9 | | (0.9) | | 7.0 | | — | | — | | — | | — | | — | | 0.7 | | 7.7 | | — | | 7.7 |
| Deferred tax | 3.5 | | — | | 3.5 | | — | | — | | — | | — | | — | | — | | 3.5 | | — | | 3.5 |
| Prepayments, accrued | | | | | | | | | | | | | | | | | | | | | | | |
| income and other assets | 7.6 | | (1.0) | | 6.6 | | — | | — | | — | | (1.1) | | 0.9 | | (6.4) | | — | | — | | — |
| Assets of disposal groups | 3.0 | | — | | 3.0 | | — | | — | | — | | — | | (2.7) | | (0.3) | | — | | — | | — |
| Total assets | 1,027.9 | | 4.3 | | 1,032.2 | | (69.5) | | 27.4 | | (322.5) | | (15.4) | | — | | (14.2) | | 638.0 | | 75.7 | | 713.7 |
| Contingent obligations | | | | | | | | | | | | | | | | | | | | | 30.5 | | 30.5 |
| | | | | | | | | | | | | | | | | | | | | | 106.2 | | 744.2 |
| (1) | Represents proportional consolidation of associates and deconsolidation of certain subsidiaries, as required by regulatory rules. Refer to previous page for additional details. |
| (2) | The exposures in regulatory trading book businesses are subject to market risk and are therefore excluded from EAD. Refer to the Market risk section on page 294. |
| (3) | Impairment loss provisions on loans and advances and securities, and credit valuation adjustment on derivatives. |
- Reverse repos: reflects regulatory approach for securities financing transactions including netting of collateral and cash legs.
- Loans and advances: cash collateral pledged with counterparties in relation to net derivative liability positions.
- Derivatives: impact of master netting arrangements.
| (5) | Capital deductions are excluded as EAD only captures exposures for credit RWAs. |
| (6) | Amounts reclassified to balance sheet lines for EAD. |
- Loans and advances: offset related to cash management pooling arrangements not allowed under IFRS and standardised approach credit risk mitigation.
- Derivatives: EAD valuation adjustments offset by difference between netting arrangements and netting within regulatory model sets.
- Property, plant and equipment: includes residual value of operating leases.
*unaudited
Business review Capital and risk management
| Liquidity and funding risk |
| 213 | Definition |
| 213 | Overview and key developments |
| 213 | Liquidity risk |
| 213 | - Policy, framework and governance |
| 213 | - Regulatory oversight and liquidity framework |
| 214 | - Measurement, monitoring and contingency planning |
| 214 | - Stress testing |
| 215 | - Liquidity portfolio |
| 217 | - Net stable funding ratio (NSFR) |
| 218 | Funding risk |
| 218 | - Funding markets |
| 218 | - Analysis |
| 218 | - Sources and uses of funding |
| 218 | - Key funding metrics |
| 219 | - Funding sources |
| 220 | - Notes issued |
| 220 | - Loan:deposit ratios and funding surplus/(gap) |
| 221 | - Repos |
| 221 | - Firm financing |
| 221 | - Maturity analysis |
| 221 | - Behavioural maturity |
| 222 | - Contractual maturity |
| 224 | - Encumbrance |
| 224 | - Collateral (on and off-balance sheet) |
| 225 | - Balance sheet encumbrance |
Business review Capital and risk management
Liquidity and funding risk
Definition
Liquidity and funding risk is the risk that RBS is unable to meet its financial obligations, including financing wholesale maturities or customer deposit withdrawals, as and when they fall due.
The risk arises through the maturity transformation role that banks perform. It is dependent on RBS specific factors such as maturity profile, composition of sources and uses of funding, the quality and size of the liquidity portfolio as well as broader market factors, such as wholesale market conditions alongside depositor and investor behaviour.
Overview and key developments
| · | The liquidity position strengthened with the liquidity portfolio of £150.7 billion at 31 December 2014 covering short-term wholesale funding (STWF) more than five times. STWF decreased by £4.6 billion to £27.8 billion mainly due to the buy-back and maturity of medium-term notes in CIB. |
| · | The liquidity portfolio increased by £4.6 billion in the year, primarily reflecting the proceeds from the Citizens IPO and the sale of €9 billion securities from the RBS N.V. bond portfolio. It includes £57 billion of secondary liquidity being assets eligible for discounting at central banks. The costs associated with maintaining the secondary liquidity portfolio are minimal being largely administrative and operational costs. |
| · | The liquidity coverage ratio (LCR) was 112% at 31 December 2014, based on RBS’s interpretation of the EU guidelines. The improvement in LCR from 102% at year end 2013 reflects reductions in wholesale funding due to CIB balance sheet and risk reduction and an increase in retail deposits. With effect from 1 October 2015, LCR will replace the PRA’s current regime, with an initial minimum requirement of 80% rising to 100% by 2018. |
| · | The net stable funding ratio (NSFR) based on RBS’s interpretation of the Basel framework was stable at 121% at 31 December 2014. |
| · | Liquidity risk appetite is measured by reference to the liquidity portfolio as a proportion of net stressed outflows and ratio was 186% (2013 - 145%) under the worst case stress scenario. The improvement in 2014 reflected lower stress outflows due to balance sheet reductions in CIB. |
| · | During 2014 RBS successfully issued £2.2 billion of Tier 2 subordinated debt, compared with £1.8 billion in 2013. RBSG plc had senior unsecured debt outstanding of £6.9 billion, excluding commercial paper and certificates of deposit, at 31 December 2014. Based on its assessment of the Financial Stability Board’s proposals, RBS may issue between £3 - 5 billion per annum during 2015 - 2019 to meet total loss absorbing capital requirements. |
| · | The customer loan:deposit ratio remained broadly stable at 95% compared with 94% at the end of 2013 with an increase in the funding surplus in PBB of £4.4 billion (UK PPB - £1.4 billion; Ulster Bank - £3.0 billion) being offset by a decrease in the funding surplus in CPB of £6.6 billion (Commercial Banking - £5.7 billion; Private Banking - £0.9 billion). |
Liquidity risk
Policy, framework and governance
Internal liquidity policies are designed to ensure that RBS:
| · | Has a clearly stated liquidity risk tolerance: appetite for liquidity risk is set by the Board as a percentage of the Individual Liquidity Adequacy Assessment (ILAA) stressed outflows, and is managed on a daily basis by legal entity, country, region and business. In setting risk limits the Board takes into account the nature of RBS various activities, the overall risk appetite, market best practice and regulatory compliance. |
| · | Has in place strategies, polices and practices to ensure that RBS maintains sufficient liquidity: the risk management framework determines the sources of liquidity risk and the steps that can be taken when these risks exceed certain actively monitored limits. These actions include when and how to use the liquid asset portfolio, and what other adjustments to the balance sheet should be undertaken to manage these risks within the bank’s risk appetite. RBS maintains an adequate liquid asset portfolio appropriate to the business activities of RBS and its risk profile. |
| · | Incorporates liquidity costs, benefits and risks in product pricing and performance management: RBS uses internal funds transfer pricing to ensure that these costs are reflected in the measurement of business performance, and to correctly incentivise businesses to source the most appropriate mix of funding. |
The Asset and Liability Management Committee (ALCo) sets and reviews the liquidity risk management framework and limits within the risk appetite set by the Board. ALCo, and by delegation the Liquidity Committee, oversees the implementation of liquidity management across RBS. RBS Treasury conducts the review, challenge and reporting of RBS’s liquidity performance, while the Liquidity Committee’s management of liquidity risk is overseen by ALCo, the Executive Risk Forum, Executive Committee and the Board.
Regulatory oversight and liquidity framework*
RBS operates across multiple jurisdictions and is subject to a number of regulatory regimes.
The principal regulator, the Prudential Regulation Authority (PRA), has a comprehensive set of liquidity regulations, the cornerstone of which is Prudential sourcebook for Banks, Building Societies and Investment Firms (BIPRU) 12 (until 30 September 2015). To comply with the PRA regulatory process, RBS undertakes the following:
| · | An annual exercise to complete the ILAA; and |
| · | An annual Focused Liquidity Review (FLR) process with the PRA - a comprehensive review of the RBS ILAA, liquidity policies and risk management framework. This results in the settings of the Individual Liquidity Guidance, which influences the size and overall composition of RBS liquid asset portfolio. |
Business review Capital and risk management
In addition, RBS’s US operations meet liquidity requirements set out by the Federal Reserve Board, the Office of the Comptroller of the Currency, the Federal Deposit Insurance Corporation and the Financial Industry Regulatory Authority. In Europe, Ulster Bank Ireland Limited and RBS N.V. are both subject to oversight by the European Central Bank with effect from 1 November 2014.
The Basel Committee on Banking Supervision (BCBS) has introduced a new liquidity regime for banks, Basel III, which includes two liquidity metrics, the LCR and NSFR, to be used by banks to monitor their liquidity risk.
In January 2013, the BCBS published its final guidance for calculating the LCR. This will be implemented in law across the EU by the European Commission (EC), who published a final Delegated Act for the LCR in the EU Journal in January 2015. The Delegated Act will introduce the LCR as a regulatory minimum standard from 1 October 2015 on a phased basis, such that banks are required to meet a 100% LCR ratio by 1 January 2018. In November 2014, the PRA confirmed in a consultation paper that the current BIPRU 12 regime will be revoked on 1 October 2015 in favour of the LCR, and that UK banks will be required to maintain a minimum ratio of 80% from this point. The LCR will be a Pillar 1 metric, meaning that the PRA will apply firm-specific Pillar 2 liquidity add-ons above and beyond the minimum LCR requirement. The PRA has invited feedback from UK banks on the consultation paper, but has not released any guidance on the detailed calculation of LCR. Pending PRA reporting guidelines, RBS monitors the LCR using its own internal interpretations of existing guidance.
BCBS published its final recommendations for implementation of the NSFR in October 2014, proposing an implementation date of 1 January 2018, by which time banks are expected to meet an NSFR ratio of 100%. The EC has stated that it shall, if appropriate, submit a legislative proposal to the European Parliament by the end of 2016 for implementing NSFR in the EU. In the meantime, RBS uses the definitions and proposals from the BCBS paper, and internal interpretations, to calculate NSFR.
Several regulatory regimes outside the EU where RBS operates, including the Joint Banking Supervisors of the US, have also published consultation papers with guidance for their local implementation of the LCR. RBS anticipates further guidance for LCR to be published across other jurisdictions during the course of 2015.
Measurement, monitoring and contingency planning
In implementing the liquidity risk management framework, a suite of tools are used to monitor, limit and stress test the risks within the balance sheet. The limits control the amount and composition of funding sources, asset and liability mismatches and funding concentrations, in addition to the level of liquidity risk.
Liquidity risks are reviewed at a significant legal entity level daily, and at a business level monthly, with performance reported to Asset and Liability Management Committees at least monthly. Any breach of internal metric limits will set in motion a series of actions and escalations that could lead to activation of the Contingency Funding Plan (CFP).
RBS actively monitors a range of market-wide and firm-specific early warning indicators of emerging liquidity stresses. Indicators include such areas as customer deposit outflows, market funding costs and movements in the bank’s credit default swap premiums and debt spreads. Early warning indicators and regulatory metrics are reported daily to senior management, including the Chief Financial Officer and Treasurer.
RBS maintains a CFP, which forms the basis of analysis and management actions to be undertaken in a liquidity stress. The CFP is linked to stress test results and forms the foundation for liquidity risk limits. The CFP sets out the circumstances under which the plan would be invoked; this includes material worsening of early warning indicators. It also prescribes a communications plan, roles and responsibilities, as well as potential management actions to take in response to various levels of liquidity stress. On invocation of the CFP, the Contingency Liquidity Team would be convened to identify the likely impact of the stress event and determine the appropriate management response.
Stress testing*
Under the liquidity risk management framework RBS maintains the ILAA, a component of which is an assessment of net stressed liquidity outflows. These liquidity stress tests apply scenario-based behavioural and contractual assumptions to cash inflows and outflows under the worst of three severe stress scenarios, as prescribed by the PRA. These are a market-wide stress, an idiosyncratic stress and a combination of both.
A stress event can occur when either firm-specific or market-wide factors or a combination of both lead to depositors and investors withdrawing or not renewing funding on maturity. This could be caused by many factors including fears over the viability of the firm. Additionally, liquidity stress can be brought on by customers choosing to draw down on loan agreements and facilities.
Simulated liquidity stress testing is performed at least monthly for each business as well as the major operating subsidiaries in order to evaluate the strength RBS’s liquidity risk management. The stressed outflows are measured over certain time periods which extend from two weeks to three months. RBS is expected to be able to withstand the stressed outflows through its own resources (primarily through the use of the liquidity portfolio) without having to resort to extraordinary central bank or governmental assistance.
Stress tests are designed to examine the impact of a variety of firm-specific and market-wide scenarios on the future adequacy of the liquidity reserves. Stress test scenarios are designed to take into account RBS’s experiences during the financial crisis, recent market conditions and events. These scenarios can be run at any time in response to the emergence of firm-specific or market-wide risks that could have a material impact on RBS’s liquidity position. In the past these have included credit rating changes and political and economic conditions changing in particular countries.
RBS’s liquidity risk appetite is measured by reference to the liquidity portfolio as a percentage of net stressed ILAA outflows.
Business review Capital and risk management
Liquidity risk continued
Key liquidity risk stress testing assumptions
| · | Net wholesale funding - Outflows at contractual maturity of wholesale funding, with no rollover/new issuance, prime brokerage, 100% loss of excess client derivative margin and 100% loss of excess client cash. |
| · | Secured financing and increased haircuts - Loss of secured funding capacity at contractual maturity date and incremental haircut widening, depending upon collateral type. |
| · | Retail and commercial bank deposits - Substantial outflows as RBS could be seen as a greater credit risk than competitors. |
| · | Intra-day cash flows - Liquid collateral held against intra-day requirement at clearing and payment systems is regarded as encumbered with no liquidity value assumed. Liquid collateral is held against withdrawal of unsecured intra-day lines provided by third parties. |
| · | Intra-group commitments and support - Risk of cash within subsidiaries becoming unavailable to the wider bank and contingent calls for funding on RBS Treasury from subsidiaries and affiliates. |
| · | Funding concentrations - Additional outflows recognised against concentration of providers of wholesale secured financing. |
| · | Off-balance sheet activities - Collateral outflows due to market movements, and all collateral owed by RBS to counterparties but not yet called; anticipated increase in firm’s derivative initial margin requirement in stress scenarios; collateral outflows contingent upon a multi-notch credit rating downgrade of RBS entities; drawdown on committed facilities provided to corporates, based on counterparty type, creditworthiness and facility type; and drawdown on retail commitments. |
| · | Franchise viability - Liquidity stress testing includes additional liquidity in order to meet outflows that are non-contractual in nature, but are necessary in order to support valuable franchise businesses. |
| · | Management action - Unencumbered marketable assets that are held outside of the central liquidity portfolio and are of verifiable liquidity value to the firm, are assumed to be monetised (subject to haircut/valuation adjustment). |
Liquidity portfolio
Liquidity risks are mitigated by a centrally managed liquidity portfolio. The size of the portfolio is determined under the liquidity risk management framework with reference to the RBS’s risk appetite.
The majority of the portfolio is centrally managed by RBS Treasury, ring-fenced from the CIB trading book, and is the ultimate responsibility of the RBS Treasurer. This portfolio is held in the PRA regulated UK Defined Liquidity Group (UK DLG) comprising RBS’s five UK banks: The Royal Bank of Scotland plc, National Westminster Bank Plc, Ulster Bank Limited, Coutts & Co and Adam & Company.
Certain of RBS's significant operating subsidiaries - RBS N.V., Citizens Financial Group Inc, and Ulster Bank Ireland Limited - hold locally managed portfolios of liquid assets that comply with local regulations that differ from PRA rules. These portfolios are the responsibility of the local Treasurer who reports to the RBS Treasurer.
The UK DLG liquidity portfolio accounted for 88% of the total liquidity portfolio, this portion is available to meet liquidity needs as they arise across RBS. The remaining liquidity reserves are held locally within non-UK bank subsidiaries, the majority of this portion (12%) is restricted by regulatory requirements and therefore assumed to only be available for use locally.
Separately from the liquidity portfolio, RBS holds high quality assets to meet payment systems collateral requirements, these are managed by RBS Treasury but are not freely available to other areas of RBS.
RBS categorises its liquidity portfolio, including its locally managed liquidity portfolios, into primary and secondary liquid assets.
| · | Primary liquid assets that are eligible liquid assets, such as cash and balances at central banks, treasury bills and other high quality government and US agency bonds. |
| · | Secondary liquid assets that are eligible as collateral for local central bank liquidity facilities but do not meet the core local regulatory definition. These assets include own-issued securitisations or whole loans that are retained on balance sheet and pre-positioned with a central bank so that they may be converted into additional sources of liquidity at very short notice. |
The composition of the liquidity portfolio is subject to policies and limits set by the Board, ALCo and the Liquidity Committee, it is influenced by quality of counterparty, maturity mix and currency mix. The liquidity value of the portfolio is determined with reference to current market prices and the haircuts necessary to generate cash from the asset.
RBS efficiently manages the liquidity portfolio to optimise the risk and rewards whilst not compromising its liquidity position. This optimisation can lead to changes in the composition of the portfolio.
Business review Capital and risk management
| Liquidity metrics* | | | |
| The table below sets out the key liquidity and related metrics monitored by RBS. | | |
| | 2014 | 2013 | 2012 |
| Liquidity portfolio | £151bn | £146bn | £147bn |
Stressed outflow coverage (1) | 186% | 145% | 128% |
Liquidity coverage ratio (2) | 112% | 102% | >100% |
Net stable funding ratio (3) | 121% | 120% | 115% |
| (1) | RBS's liquidity risk appetite is measured by reference to the liquidity portfolio as a percentage of stressed contractual and behavioural outflows under the worst of three severe stress scenarios of a market-wide stress, an idiosyncratic stress and a combination of both in RBS's ILAA. This assessment is performed in accordance with PRA guidance. |
| (2) | In January 2013, the BCBS issued its revised final guidance for calculating liquidity coverage ratio with a proposed implementation date of 1 January 2015. Within the EU, the LCR is currently expected to come into effect from the later date of 1 October 2015 on a phased basis, subject to the finalisation of the EU Delegated Act. Pending guidance from the PRA, RBS monitors the LCR based on the EU Delegated Act and its internal interpretations of the expected final rules. Consequently RBS’s ratio may change over time and may not be comparable with those of other financial institutions. |
| (3) | BCBS issued its final recommendations for the implementation of the net stable funding ratio in October 2014, proposing an implementation date of 1 January 2018. Pending further guidelines from the EU and the PRA, RBS uses the definitions and proposals from the BCBS paper and internal interpretations, to calculate the NSFR. Consequently RBS’s ratio may change over time and may not be comparable with those of other financial institutions. |
Liquidity portfolio
The table below shows RBS’s liquidity portfolio by product, liquidity value and by carrying value. Liquidity value is lower than carrying value as it is stated after discounts applied by the Bank of England and other central banks to instruments, within the secondary liquidity portfolio, eligible for discounting.
| | Liquidity value |
| | | | | | | | | 2013 | | 2012 |
| 2014 | | | | | | | | | | | | |
| Cash and balances at central banks | 66,409 | 1,368 | 633 | 68,410 | | 61,956 | | 74,362 | 80,933 | | 70,109 | 81,768 |
| Central and local government bonds | | | | | | | | | | | | |
AAA rated governments | 5,609 | — | 2,289 | 7,898 | | 5,935 | | 3,320 | 5,149 | | 9,885 | 18,832 |
AA- to AA+ rated governments and US agencies | 6,902 | 9,281 | 1,448 | 17,631 | | 12,792 | | 12,287 | 12,423 | | 9,621 | 9,300 |
Below rated AA governments | — | — | 100 | 100 | | — | | — | 151 | | 206 | 596 |
Local government | — | — | 82 | 82 | | 21 | | — | 148 | | 979 | 2,244 |
| | 12,511 | 9,281 | 3,919 | 25,711 | | 18,748 | | 15,607 | 17,871 | | 20,691 | 30,972 |
| Treasury bills | — | — | — | — | | — | | — | 395 | | 750 | 202 |
| Primary liquidity | 78,920 | 10,649 | 4,552 | 94,121 | | 80,704 | | 89,969 | 99,199 | | 91,550 | 112,942 |
Secondary liquidity (2) | 53,055 | 2,290 | 1,189 | 56,534 | | 56,017 | | 56,097 | 56,589 | | 55,619 | 41,978 |
| Total liquidity value | 131,975 | 12,939 | 5,741 | 150,655 | | 136,721 | | 146,066 | 155,788 | | 147,169 | 154,920 |
| | | | | | | | | | | | | |
| Total carrying value | 167,016 | 13,914 | 6,055 | 186,985 | | | | 184,233 | | | 187,942 | |
| | | | | | | | | | | | | |
The table below shows the liquidity value of the liquidity portfolio by currency.
| Total liquidity portfolio | GBP £m | USD £m | EUR £m | Other £m | Total £m |
| 2014 | 93,861 | 40,556 | 16,238 | — | 150,655 |
| 2013 | 100,849 | 33,365 | 10,364 | 1,488 | 146,066 |
| 2012 | 84,570 | 35,106 | 26,662 | 831 | 147,169 |
| (1) | The PRA regulated UK Defined Liquidity Group (UK DLG) comprises RBS’s five licensed deposit taking UK banks: The Royal Bank of Scotland plc, National Westminster Bank Plc, Ulster Bank Limited, Coutts & Co and Adam & Company. In addition, certain of RBS’s significant operating subsidiaries - RBS N.V., Citizens Financial Group Inc. and Ulster Bank Ireland Limited - hold liquidity portfolios of liquid assets that comply with local regulations that may differ from PRA rules. |
| (2) | Comprises assets eligible for discounting at the Bank of England and other central banks. |
Business review Capital and risk management
Net stable funding ratio (NSFR)*
The table below shows the composition of RBS’s NSFR, based on RBS’s interpretation of the rules published by BCBS in October 2014. RBS’s NSFR may change over time in line with regulatory developments and related interpretations.
| | 2014 | | 2013 | | 2012 | | |
| | | ASF/RSF (1) | | | ASF/RSF (1) | | | ASF/RSF (1) | | Weighting |
| | £bn | £bn | | £bn | £bn | | £bn | £bn | | % |
| Equity | | | | | | | | | | |
| - regulatory capital | 49 | 49 | | 46 | 46 | | 67 | 67 | | 100 |
| - other equity | 11 | — | | 13 | — | | 3 | — | | — |
| Wholesale funding > 1 year | 63 | 63 | | 76 | 76 | | 109 | 109 | | 100 |
| Wholesale funding < 1 year | 53 | — | | 51 | — | | 70 | — | | — |
| Derivative liabilities | 350 | — | | 286 | — | | 434 | — | | — |
| Repurchase agreements | 65 | — | | 85 | — | | 132 | — | | — |
| Deposits | | | | | | | | | | |
| - retail and SME - more stable | 206 | 196 | | 196 | 186 | | 203 | 193 | | 95 |
| - retail and SME - less stable | 62 | 56 | | 66 | 59 | | 66 | 59 | | 90 |
| - other | 147 | 74 | | 156 | 78 | | 164 | 82 | | 50 |
Other (2) | 45 | — | | 53 | — | | 64 | — | | — |
| Total liabilities and equity | 1,051 | 438 | | 1,028 | 445 | | 1,312 | 510 | | |
| | | | | | | | | | | |
| Cash | 75 | — | | 83 | — | | 79 | — | | — |
| Inter-bank lending | 25 | 4 | | 28 | 4 | | 29 | 4 | | 15 |
| Debt securities > 1 year | | | | | | | | | | |
| - governments AAA to AA- | 46 | 2 | | 47 | 2 | | 64 | 3 | | 5 |
| - other eligible bonds | 22 | 3 | | 31 | 5 | | 48 | 7 | | 15 |
| - other bonds | 9 | 9 | | 16 | 16 | | 19 | 19 | | 100 |
| Debt securities < 1 year | 25 | 13 | | 20 | 10 | | 26 | 13 | | 50 |
| Derivative assets | | | | | | | | | | |
| - assets equal to derivative liabilities | 350 | — | | 286 | — | | 434 | — | | — |
| - excess over derivative liabilities | 4 | 4 | | 2 | 2 | | 8 | 8 | | 100 |
| Reverse repurchase agreements | 65 | 7 | | 76 | 8 | | 105 | 11 | | 10 |
| Customer loans and advances > 1 year | | | | | | | | | | |
| - residential mortgages | 138 | 90 | | 135 | 88 | | 145 | 94 | | 65 |
| - other | 123 | 105 | | 114 | 97 | | 136 | 116 | | 85 |
| Customer loans and advances < 1 year | 134 | 67 | | 144 | 72 | | 149 | 75 | | 50 |
Other (3) | 35 | 35 | | 46 | 46 | | 70 | 70 | | 100 |
| Total assets | 1,051 | 339 | | 1,028 | 350 | | 1,312 | 420 | | |
| Derivative liabilities after mtm netting arrangements | 55 | 11 | | 44 | 9 | | 60 | 12 | | 20 |
| Undrawn commitments | 215 | 11 | | 213 | 11 | | 216 | 11 | | 5 |
| Total assets and undrawn commitments | 1,321 | 361 | | 1,285 | 370 | | 1,588 | 443 | | |
| | | | | | | | | | | |
| Net stable funding ratio | | 121% | | | 120% | | | 115% | | |
| (1) | Available stable funding and required stable funding. |
| (2) | Deferred tax and other liabilities. |
| (3) | Prepayments, accrued income, deferred tax, settlement balances and other assets. |
As the NSFR calculation has been refined during 2014, some of the weightings on available stable funding and required stable funding have been changed and prior periods restated (on the previously reported basis: 2013 -122%; 2012 - 117%).
*unaudited
Business review Capital and risk management
Funding risk
Funding markets
RBS’s primary funding source is its customer deposit base, primarily built through its retail and commercial franchises in the UK, Ireland and the US. These deposits form a stable base which fully funds RBS’s customer lending activities.
Complementary to its deposit funding, RBS maintains access to various wholesale markets for funding, on both a public and private basis, across a range of currencies, geographies and maturities. These include long-term secured and unsecured debt, short-term money markets and repurchase agreements. RBS has set policies for the prudent use of wholesale funding, as part of its wider liquidity policies.
RBS accesses the wholesale funding markets directly or through its main operating subsidiaries via established funding programmes. The use of different entities to access the market from time to time allows RBS to further diversify its funding mix and in certain limited circumstances demonstrate to regulators that specific operating subsidiaries enjoy market access in their own right.
RBS may access various funding facilities offered by central banks from time to time. The use of such facilities can be both part of a wider strategic objective to support initiatives to help stimulate economic growth or as part of the broader liquidity management and funding strategy. Overall usage and repayment of available central bank facilities will fit within the overall liquidity risk appetite and concentration limits.
At 31 December 2014, RBS’s participation in central bank financing operations amounted to £0.8 billion under European Central Bank’s Targeted Long Term Refinancing Operations. RBS remains committed to supporting the objectives of the Funding for Lending scheme.
Analysis
Sources and uses of funding
The composition of RBS’s balance sheet is a function of the broad array of product offerings and diverse markets served by its core businesses. The structural composition of the balance sheet is augmented as needed through active management of both asset and liability portfolios. The objective of these activities is to optimise the liquidity profile, while ensuring adequate coverage of all cash requirements under extreme stress conditions.
As set out below, RBS’s asset and liability types broadly match. Customer deposits provide more funding than customer loans utilise; repurchase agreements are largely covered by reverse repurchase agreements; interbank lending and funding largely nets off and this gap has narrowed over the past 5 years; and derivative assets are largely netted against derivative liabilities.
The table below shows the sources and uses of funding.
| | | | | | | |
| | Liabilities | | Assets | | |
| | 2014 | 2013 | | 2014 | 2013 | | |
| | £bn | £bn | | £bn | £bn | | |
Customer deposits (1) | 400 | 407 | | 372 | 373 | | Customer loans and advances (1) |
Bank deposits (short-term only) (1) | 13 | 14 | | 13 | 18 | | Loan and advances to banks (1) |
Trading liabilities (2) | 71 | 67 | | 89 | 93 | | Trading assets (2) |
Other liabilities and equity (3) | 95 | 100 | | 64 | 90 | | Other assets (3) |
| Repurchase agreements | 65 | 85 | | 65 | 76 | | Reverse repurchase agreements |
Term wholesale funding (1) | 57 | 69 | | 94 | 90 | | Primary liquidity portfolio |
| Funded balance sheet | 701 | 742 | | 697 | 740 | | Funded balance sheet |
| Derivatives | 350 | 286 | | 354 | 288 | | Derivatives |
| | 1,051 | 1,028 | | 1,051 | 1,028 | | |
| (1) | Excludes held for trading. |
| (2) | Financial instruments classified as held-for-trading (HFT) excluding security financing transactions and derivatives. |
| (3) | Includes non-HFT financial instruments and non financial assets/liabilities. |
The table below summarises the key funding metrics.
| | Short-term wholesale funding (1) | | Total wholesale funding | | Net inter-bank funding (2) |
| | | | | | | | | | |
| 2014 | 27.8 | 53.3 | | 90.5 | 116.0 | | 15.4 | (13.3) | 2.1 |
| 2013 | 32.4 | 51.5 | | 108.1 | 127.2 | | 16.2 | (17.3) | (1.1) |
| 2012 | 41.6 | 70.2 | | 150.4 | 179.0 | | 28.5 | (18.6) | 9.9 |
| (1) | Short-term wholesale funding is funding with a residual maturity of less than one year. |
| (2) | Excludes derivative cash collateral. |
| (3) | Primarily short-term balances. |
Business review Capital and risk management
The table below shows RBS's principal funding sources excluding repurchase agreements (repos).
| | 2014 | | 2013 | | 2012 |
| By product | 1 year £m | 1 year £m | Total £m | | 1 year £m | 1 year £m | Total £m | | 1 year £m | 1 year £m | Total £m |
| Deposits by banks | | | | | | | | | | | |
derivative cash collateral | 25,503 | — | 25,503 | | 19,086 | — | 19,086 | | 28,585 | — | 28,585 |
other deposits | 13,137 | 2,294 | 15,431 | | 14,553 | 1,690 | 16,243 | | 18,938 | 9,551 | 28,489 |
| | 38,640 | 2,294 | 40,934 | | 33,639 | 1,690 | 35,329 | | 47,523 | 9,551 | 57,074 |
| Debt securities in issue | | | | | | | | | | | |
commercial paper (CP) | 625 | — | 625 | | 1,583 | — | 1,583 | | 2,873 | — | 2,873 |
certificates of deposit (CDs) | 1,695 | 149 | 1,844 | | 2,212 | 65 | 2,277 | | 2,605 | 391 | 2,996 |
medium-term notes (MTNs) | 7,741 | 29,007 | 36,748 | | 10,385 | 36,779 | 47,164 | | 13,019 | 53,584 | 66,603 |
covered bonds | 1,284 | 5,830 | 7,114 | | 1,853 | 7,188 | 9,041 | | 1,038 | 9,101 | 10,139 |
securitisations | 10 | 5,564 | 5,574 | | 514 | 7,240 | 7,754 | | 761 | 11,220 | 11,981 |
| | 11,355 | 40,550 | 51,905 | | 16,547 | 51,272 | 67,819 | | 20,296 | 74,296 | 94,592 |
| Subordinated liabilities | 3,274 | 19,857 | 23,131 | | 1,350 | 22,662 | 24,012 | | 2,351 | 24,951 | 27,302 |
| Notes issued | 14,629 | 60,407 | 75,036 | | 17,897 | 73,934 | 91,831 | | 22,647 | 99,247 | 121,894 |
| Wholesale funding | 53,269 | 62,701 | 115,970 | | 51,536 | 75,624 | 127,160 | | 70,170 | 108,798 | 178,968 |
| Customer deposits | | | | | | | | | | | |
derivative cash collateral (1) | 13,003 | — | 13,003 | | 7,082 | — | 7,082 | | 7,949 | — | 7,949 |
financial institution deposits | 46,359 | 1,422 | 47,781 | | 44,621 | 2,265 | 46,886 | | 54,793 | 2,253 | 57,046 |
personal deposits | 185,781 | 6,121 | 191,902 | | 183,799 | 8,115 | 191,914 | | 165,137 | 14,335 | 179,472 |
corporate deposits | 159,782 | 2,403 | 162,185 | | 167,100 | 4,687 | 171,787 | | 180,082 | 9,443 | 189,525 |
| Total customer deposits | 404,925 | 9,946 | 414,871 | | 402,602 | 15,067 | 417,669 | | 407,961 | 26,031 | 433,992 |
| Total funding excluding repos | 458,194 | 72,647 | 530,841 | | 454,138 | 90,691 | 544,829 | | 478,131 | 134,829 | 612,960 |
| (1) | Cash collateral includes £12,036 million (2013 - £6,720 million; 2012 - £7,191 million) from financial institutions. |
| | 2014 | | 2013 |
| By currency | GBP £m | USD £m | EUR £m | Other £m | Total £m | | GBP £m | USD £m | EUR £m | Other £m | Total £m |
| Deposits by banks | 6,501 | 10,869 | 20,715 | 2,849 | 40,934 | | 7,418 | 8,337 | 17,004 | 2,570 | 35,329 |
| Debt securities in issue | | | | | | | | | | | |
| commercial paper | — | 73 | 525 | 27 | 625 | | 4 | 897 | 682 | — | 1,583 |
| certificates of deposit | 910 | 747 | 185 | 2 | 1,844 | | 336 | 1,411 | 476 | 54 | 2,277 |
| medium-term notes | 4,592 | 11,292 | 16,672 | 4,192 | 36,748 | | 6,353 | 11,068 | 23,218 | 6,525 | 47,164 |
| covered bonds | 1,090 | — | 6,024 | — | 7,114 | | 984 | — | 8,057 | — | 9,041 |
| securitisations | 1,245 | 1,895 | 2,434 | — | 5,574 | | 1,897 | 2,748 | 3,109 | — | 7,754 |
| | 7,837 | 14,007 | 25,840 | 4,221 | 51,905 | | 9,574 | 16,124 | 35,542 | 6,579 | 67,819 |
| Subordinated liabilities | 1,718 | 13,360 | 6,372 | 1,681 | 23,131 | | 1,857 | 10,502 | 8,984 | 2,669 | 24,012 |
| Wholesale funding | 16,056 | 38,236 | 52,927 | 8,751 | 115,970 | | 18,849 | 34,963 | 61,530 | 11,818 | 127,160 |
| % of wholesale funding | 14% | 33% | 46% | 7% | 100% | | 15% | 28% | 48% | 9% | 100% |
| Customer deposits | 276,039 | 89,068 | 39,526 | 10,238 | 414,871 | | 272,304 | 86,727 | 49,116 | 9,522 | 417,669 |
| Total funding excluding repos | 292,095 | 127,304 | 92,453 | 18,989 | 530,841 | | 291,153 | 121,690 | 110,646 | 21,340 | 544,829 |
| | | | | | | | | | | | |
| % of total funding | 55% | 24% | 17% | 4% | 100% | | 54% | 22% | 20% | 4% | 100% |
Business review Capital and risk management
Notes issued
The table below shows RBS's debt securities in issue and subordinated liabilities by residual maturity.
| | Debt securities in issue | | | |
| 2014 | | | | | | Subordinated liabilities £m | | |
| Less than 1 year | 2,320 | 7,741 | 1,284 | 10 | 11,355 | 3,274 | 14,629 | 20 |
| 1-3 years | 144 | 11,954 | 2,229 | — | 14,327 | 906 | 15,233 | 20 |
| 3-5 years | — | 7,103 | 812 | 3 | 7,918 | 2,663 | 10,581 | 14 |
| More than 5 years | 5 | 9,950 | 2,789 | 5,561 | 18,305 | 16,288 | 34,593 | 46 |
| | 2,469 | 36,748 | 7,114 | 5,574 | 51,905 | 23,131 | 75,036 | 100 |
| | | | | | | | | |
| 2013 | | | | | | | | |
| Less than 1 year | 3,795 | 10,385 | 1,853 | 514 | 16,547 | 1,350 | 17,897 | 19 |
| 1-3 years | 61 | 14,920 | 3,621 | — | 18,602 | 3,944 | 22,546 | 25 |
| 3-5 years | — | 6,497 | 867 | — | 7,364 | 4,209 | 11,573 | 13 |
| More than 5 years | 4 | 15,362 | 2,700 | 7,240 | 25,306 | 14,509 | 39,815 | 43 |
| | 3,860 | 47,164 | 9,041 | 7,754 | 67,819 | 24,012 | 91,831 | 100 |
| | | | | | | | | |
| 2012 | | | | | | | | |
| Less than 1 year | 5,478 | 13,019 | 1,038 | 761 | 20,296 | 2,351 | 22,647 | 18 |
| 1-3 years | 385 | 20,267 | 2,948 | 540 | 24,140 | 7,252 | 31,392 | 26 |
| 3-5 years | 1 | 13,374 | 2,380 | — | 15,755 | 756 | 16,511 | 14 |
| More than 5 years | 5 | 19,943 | 3,773 | 10,680 | 34,401 | 16,943 | 51,344 | 42 |
| | 5,869 | 66,603 | 10,139 | 11,981 | 94,592 | 27,302 | 121,894 | 100 |
Loan:deposit ratios and funding surplus/(gap)
The table below shows customer loans, deposits, loan:deposit ratios and funding surplus/(gap) by segment.
| | 2014 | | 2013 | | 2012 |
| | | | | | | | | | | |
| UK Personal & Business Banking | 127,244 | 148,658 | 86 | 21,414 | | 86 | 20,013 | | 93 | 9,261 |
| Ulster Bank | 22,008 | 20,561 | 107 | (1,447) | | 120 | (4,417) | | 130 | (6,683) |
| Personal & Business Banking | 149,252 | 169,219 | 88 | 19,967 | | 91 | 15,596 | | 98 | 2,578 |
| Commercial Banking | 85,053 | 86,830 | 98 | 1,777 | | 92 | 7,429 | | 91 | 8,232 |
| Private Banking | 16,523 | 36,105 | 46 | 19,582 | | 45 | 20,529 | | 44 | 21,945 |
| Commercial & Private Banking | 101,576 | 122,935 | 83 | 21,359 | | 78 | 27,958 | | 77 | 30,177 |
| Corporate & Institutional Banking | 72,751 | 59,402 | 122 | (13,349) | | 105 | (3,414) | | 96 | 3,058 |
Conduits (3) | — | — | — | — | | — | — | | — | (2,458) |
| Central items | 613 | 1,583 | 39 | 970 | | 27 | 792 | | 3 | 3,235 |
| Citizens Financial Group | 59,606 | 60,550 | 98 | 944 | | 91 | 4,839 | | 86 | 8,178 |
| RCR | 11,003 | 1,182 | nm | (9,821) | | n/a | n/a | | n/a | n/a |
| Non-Core | n/a | n/a | n/a | n/a | | nm | (20,692) | | nm | (41,846) |
| Direct Line Group | n/a | n/a | n/a | n/a | | n/a | n/a | | — | (881) |
| | 394,801 | 414,871 | 95 | 20,070 | | 94 | 25,079 | | 100 | 2,041 |
| | | | | | | | | | | |
| Of which: Personal | 176,621 | 191,902 | 92 | 15,281 | | 90 | 18,929 | | 94 | 10,897 |
| (1) | Excludes reverse repo agreements and net of impairment provisions. |
| (2) | Excludes repo agreements. |
| (3) | All conduits relate to CIB and have been extracted and shown separately as they were funded by commercial paper issuance until the end of the third quarter of 2012. |
Customer deposits insured through deposit guarantee schemes totalled £160 billion (2013 - £161 billion) the more material of them being Financial Services Compensation Scheme £112 billion; US Federal Deposit Insurance Corporation £37 billion and Republic of Ireland’s Deposit Guarantee Scheme £7 billion.
Business review Capital and risk management
Repos
The table below analyses RBS's repos by counterparty type.
| | 2014 | 2013 | 2012 |
| | £m | £m | £m |
| Financial institutions | | | |
| - central and other banks | 26,525 | 28,650 | 44,332 |
| - other financial institutions | 28,703 | 52,945 | 86,968 |
| Other corporate | 9,354 | 3,539 | 1,072 |
| | 64,582 | 85,134 | 132,372 |
RBS has access to the short-term money markets to supplement deposit and wholesale funding. RBS’s reverse repos mainly within CIB are generally used to fund repos or to cover short positions. In addition, repos are used to fund a small proportion of CIB’s trading assets and by RBS Treasury as part of the liquidity portfolio management.
The liquidity risk RBS is exposed to through security financing transactions is significantly lower than in relation to unsecured funding. RBS limits any exposure by setting limits and monitoring any mismatch of quality, maturity or currency. The exposure is also monitored in the context of the available liquid assets.
Firm financing*
The following table shows repos gross of IFRS offset arrangements (refer to Balance sheet analysis - Financial assets summary on page 271) by asset quality and maturity.
| 2014 | | | |
| AA- and above | 67.2 | 11.6 | 78.8 |
| Other | 12.2 | 4.4 | 16.6 |
| Total | 79.4 | 16.0 | 95.4 |
| | | | |
| 2013 | | | |
| AA- and above | 69.5 | 21.6 | 91.1 |
| Other | 27.6 | 7.1 | 34.7 |
| Total | 97.1 | 28.7 | 125.8 |
Maturity analysis
The contractual maturity of balance sheet assets and liabilities reflects the maturity transformation role banks perform, lending long-term but obtaining funding predominantly through short-term liabilities such as customer deposits. In practice, the behavioural profiles of many liabilities exhibit greater stability and longer maturity than the contractual maturity. This is particularly true of many types of retail and corporate deposits which, despite being repayable on demand or at short notice, have demonstrated very stable characteristics even in periods of acute stress. In analysis to assess and manage asset and liability maturity gaps RBS determines the expected customer behaviour through qualitative and quantitative techniques, incorporating observed customer behaviours over long periods of time. This analysis is subject to governance through Asset and Liability Management Committees down to a segment level.
Contractual maturity analysis and net behavioural funding surplus/(gap) are set out below.
| | Behavioural maturity | | Contractual maturity |
| | Net surplus/(gap) | | Net surplus/(gap) | Loans to customers | Customer accounts |
| | Less than | | | Greater than | | | Less than | | Greater than | | Less than | | | Greater than | | Less than | | | Greater than | |
| | 1 year | | 1-5 years | 5 years | Total | | 1 year | 1-5 years | 5 years | Total | 1 year | | 1-5 years | 5 years | Total | 1 year | | 1-5 years | 5 years | Total |
| 2014 | £bn | | £bn | £bn | £bn | | £bn | £bn | £bn | £bn | £bn | | £bn | £bn | £bn | £bn | | £bn | £bn | £bn |
| PBB | 14 | | 2 | 4 | 20 | | 148 | (32) | (96) | 20 | 16 | | 37 | 96 | 149 | 164 | | 5 | — | 169 |
| CPB | 11 | | 20 | (10) | 21 | | 80 | (35) | (24) | 21 | 42 | | 36 | 24 | 102 | 122 | | 1 | — | 123 |
| CIB | (7) | | (3) | (4) | (14) | | 13 | (21) | (6) | (14) | 45 | | 22 | 6 | 73 | 58 | | 1 | — | 59 |
| CFG | 7 | | (13) | 7 | 1 | | 48 | (29) | (18) | 1 | 10 | | 31 | 19 | 60 | 58 | | 2 | 1 | 61 |
| Other | (3) | | (4) | (1) | (8) | | 1 | (6) | (3) | (8) | 2 | | 6 | 3 | 11 | 3 | | — | — | 3 |
| | 22 | | 2 | (4) | 20 | | 290 | (123) | (147) | 20 | 115 | | 132 | 148 | 395 | 405 | | 9 | 1 | 415 |
*unaudited
Business review Capital and risk management
Contractual maturity
The following table shows the residual maturity of financial instruments, based on contractual date of maturity. Held-for-trading (HFT) assets and liabilities have been excluded from the maturity analysis in view of their short-term nature and are shown in total in the table below. Hedging derivatives are included within the relevant maturity bands.
| | Other than held-for-trading (HFT) | | |
| 2014 | | | | | | | | | | | |
| Cash and balances at central banks | 75,494 | — | — | — | 75,494 | — | — | — | 75,494 | — | 75,494 |
| Bank reverse repos | 1,801 | 778 | — | — | 2,579 | — | — | — | 2,579 | 18,129 | 20,708 |
| Customer reverse repos | 969 | — | — | — | 969 | — | — | — | 969 | 43,018 | 43,987 |
| Loans to banks | 10,084 | 1,146 | 576 | 913 | 12,719 | 221 | 50 | 9 | 12,999 | 11,773 | 24,772 |
| Loans to customers | 35,841 | 14,945 | 15,697 | 27,582 | 94,065 | 69,209 | 61,714 | 146,611 | 371,599 | 23,202 | 394,801 |
| Personal | 7,130 | 3,201 | 4,188 | 7,372 | 21,891 | 25,408 | 20,418 | 108,647 | 176,364 | 257 | 176,621 |
| Corporate | 23,256 | 10,649 | 9,324 | 16,191 | 59,420 | 37,782 | 39,163 | 35,351 | 171,716 | 7,087 | 178,803 |
| Financial institutions | 5,455 | 1,095 | 2,185 | 4,019 | 12,754 | 6,019 | 2,133 | 2,613 | 23,519 | 15,858 | 39,377 |
| Debt securities | 2,578 | 2,695 | 2,233 | 2,749 | 10,255 | 5,282 | 6,115 | 31,064 | 52,716 | 49,226 | 101,942 |
| Equity shares | — | — | — | — | — | — | — | 1,386 | 1,386 | 4,821 | 6,207 |
| Settlement balances | 4,667 | — | — | — | 4,667 | — | — | — | 4,667 | — | 4,667 |
| Derivatives | 622 | — | — | 1,491 | 2,113 | 2,291 | 701 | 336 | 5,441 | 348,551 | 353,992 |
| Total financial assets | 132,056 | 19,564 | 18,506 | 32,735 | 202,861 | 77,003 | 68,580 | 179,406 | 527,850 | 498,720 | 1,026,570 |
| | | | | | | | | | | | |
| Bank repos | 565 | 304 | — | — | 869 | — | — | — | 869 | 25,656 | 26,525 |
| Customer repos | 1,003 | 1,069 | — | — | 2,072 | — | — | — | 2,072 | 35,985 | 38,057 |
| Deposits by banks | 6,825 | 1,872 | 616 | 3,333 | 12,646 | 1,312 | 22 | 836 | 14,816 | 26,118 | 40,934 |
| Customer accounts | 365,679 | 9,676 | 6,736 | 8,858 | 390,949 | 6,952 | 1,450 | 212 | 399,563 | 15,308 | 414,871 |
| Personal | 169,334 | 6,210 | 3,730 | 6,507 | 185,781 | 5,555 | 544 | 22 | 191,902 | — | 191,902 |
| Corporate | 153,075 | 2,670 | 2,474 | 1,464 | 159,683 | 914 | 702 | 178 | 161,477 | 1,675 | 163,152 |
| Financial institutions | 43,270 | 796 | 532 | 887 | 45,485 | 483 | 204 | 12 | 46,184 | 13,633 | 59,817 |
| Debt securities in issue | 1,101 | 2,000 | 1,593 | 5,465 | 10,159 | 11,976 | 7,408 | 15,872 | 45,415 | 6,490 | 51,905 |
| Settlement balances | 4,503 | — | — | — | 4,503 | — | — | — | 4,503 | — | 4,503 |
| Short positions | — | — | — | — | — | — | — | — | — | 23,029 | 23,029 |
| Derivatives | — | 140 | 348 | — | 488 | 789 | 543 | 1,801 | 3,621 | 346,328 | 349,949 |
| Subordinated liabilities | 682 | 488 | 1,192 | 912 | 3,274 | 900 | 2,539 | 16,418 | 23,131 | — | 23,131 |
| Other liabilities | 1,801 | — | — | — | 1,801 | 8 | 5 | 2 | 1,816 | — | 1,816 |
| Total financial liabilities | 382,159 | 15,549 | 10,485 | 18,568 | 426,761 | 21,937 | 11,967 | 35,141 | 495,806 | 478,914 | 974,720 |
Business review Capital and risk management
| | Other than held-for-trading (HFT) | | |
| 2013 | | | | | | | | | | | |
| Cash and balances at central banks | 82,661 | — | — | — | 82,661 | — | — | — | 82,661 | — | 82,661 |
| Bank reverse repos | 652 | 110 | — | — | 762 | — | — | — | 762 | 25,795 | 26,557 |
| Customer reverse repos | — | — | — | — | — | — | — | — | — | 49,897 | 49,897 |
| Loans to banks | 11,831 | 3,171 | 1,552 | 443 | 16,997 | 69 | 13 | 546 | 17,625 | 9,952 | 27,577 |
| Loans to customers | 34,158 | 22,118 | 19,580 | 26,424 | 102,280 | 72,388 | 56,249 | 142,503 | 373,420 | 19,170 | 392,590 |
| Personal | 7,776 | 8,942 | 4,141 | 7,108 | 27,967 | 24,008 | 20,107 | 100,664 | 172,746 | 239 | 172,985 |
| Corporate | 20,310 | 11,741 | 13,175 | 16,970 | 62,196 | 43,207 | 34,227 | 38,746 | 178,376 | 5,561 | 183,937 |
| Financial Institutions | 6,072 | 1,435 | 2,264 | 2,346 | 12,117 | 5,173 | 1,915 | 3,093 | 22,298 | 13,370 | 35,668 |
| Debt securities | 1,608 | 954 | 1,787 | 2,324 | 6,673 | 7,425 | 8,782 | 34,161 | 57,041 | 56,582 | 113,623 |
| Equity shares | — | — | — | — | — | — | — | 1,612 | 1,612 | 7,199 | 8,811 |
| Settlement balances | 5,591 | — | — | — | 5,591 | — | — | — | 5,591 | — | 5,591 |
| Derivatives | 546 | — | — | 1,282 | 1,828 | 2,148 | 427 | 129 | 4,532 | 283,508 | 288,040 |
| Total financial assets | 137,047 | 26,353 | 22,919 | 30,473 | 216,792 | 82,030 | 65,471 | 178,951 | 543,244 | 452,103 | 995,347 |
| | | | | | | | | | | | |
| Bank repos | 3,045 | 1,297 | — | — | 4,342 | 1,181 | — | — | 5,523 | 23,127 | 28,650 |
| Customer repos | 3,059 | 1,125 | — | — | 4,184 | — | — | — | 4,184 | 52,300 | 56,484 |
| Deposits by banks | 10,676 | 1,882 | 1,382 | 125 | 14,065 | 82 | 109 | 1,309 | 15,565 | 19,764 | 35,329 |
| Customer accounts | 360,031 | 16,093 | 8,567 | 9,236 | 393,927 | 10,140 | 2,627 | 739 | 407,433 | 10,236 | 417,669 |
| Personal | 160,261 | 10,370 | 5,562 | 7,262 | 183,455 | 6,789 | 1,449 | 20 | 191,713 | — | 191,713 |
| Corporate | 158,138 | 4,458 | 2,369 | 1,476 | 166,441 | 2,690 | 728 | 681 | 170,540 | 1,809 | 172,349 |
| Financial Institutions | 41,632 | 1,265 | 636 | 498 | 44,031 | 661 | 450 | 38 | 45,180 | 8,427 | 53,607 |
| Debt securities in issue | 2,383 | 3,221 | 2,667 | 6,844 | 15,115 | 15,729 | 6,388 | 22,027 | 59,259 | 8,560 | 67,819 |
| Settlement balances | 5,313 | — | — | — | 5,313 | — | — | — | 5,313 | — | 5,313 |
| Short positions | — | — | — | — | — | — | — | — | — | 28,022 | 28,022 |
| Derivatives | 1 | 130 | 271 | — | 402 | 933 | 1,190 | 1,703 | 4,228 | 281,299 | 285,527 |
| Subordinated liabilities | 16 | 124 | 150 | 1,060 | 1,350 | 3,944 | 4,078 | 14,640 | 24,012 | — | 24,012 |
| Other liabilities | 1,764 | — | — | — | 1,764 | 2 | 16 | 1 | 1,783 | — | 1,783 |
| Total financial liabilities | 386,288 | 23,872 | 13,037 | 17,265 | 440,462 | 32,011 | 14,408 | 40,419 | 527,300 | 423,308 | 950,608 |
Business review Capital and risk management
Encumbrance
RBS reviews all assets against the criteria of being able to finance them in a secured form (encumbrance) but certain asset types lend themselves more readily to encumbrance. The typical characteristics that support encumbrance are an ability to pledge those assets to another counterparty or entity through operation of law without necessarily requiring prior notification, homogeneity, predictable and measurable cash flows, and a consistent and uniform underwriting and collection process. Retail assets including residential mortgages, credit card receivables and personal loans display many of these features.
From time to time RBS encumbers assets to serve as collateral to support certain wholesale funding initiatives. The three principal forms of encumbrance are own asset securitisations, covered bonds and securities repurchase agreements.
RBS categorises its assets into three broad groups; assets that are:
| · | Already encumbered and used to support funding currently in place via own asset securitisations, covered bonds and securities repurchase agreements. |
| · | Not currently encumbered but can for instance be used to access funding from market counterparties or central bank facilities as part of RBS’s contingency funding. |
| · | Not currently encumbered. In this category, RBS has in place an enablement programme which seeks to identify assets which are capable of being encumbered and to identify the actions to facilitate such encumbrance whilst not impacting customer relationships or servicing. |
RBS’s balance sheet encumbrance ratios are set out below.
| Encumbrance ratios | 2014 % | 2013 % | 2012 % |
| Total | 13 | 17 | 18 |
| Excluding balances relating to derivative transactions | 14 | 19 | 22 |
| Excluding balances relating to derivative and securities financing transactions | 11 | 11 | 13 |
Refer to the following page for further analysis.
Collateral (on and off-balance sheet)*
The table below summarises total on and off-balance sheet assets that are available to support funding and collateral requirements.
| | 2014 | 2013 |
| | £bn | £bn |
| Total on-balance sheet assets | 1,050.8 | 1,027.9 |
| Less: | | |
| - Reverse repos and derivatives | (418.7) | (364.5) |
| - Other assets not available to be pledged | (99.7) | (40.5) |
| Total on-balance sheet assets available | 532.4 | 622.9 |
| Add: | | |
| - Fair value of securities received as collateral | 100.9 | 124.2 |
| Total assets available | 633.3 | 747.1 |
| Less: | | |
| - On-balance sheet assets pledged | (136.7) | (171.5) |
| - Securities collateral received that have been rehypothicated | (96.4) | (111.5) |
| Assets available to be pledged | 400.2 | 464.1 |
Business review Capital and risk management
Balance sheet encumbrance
| | Encumbered assets relating to: | | | assets% | | Unencumbered | | |
| | Debt securities in issue | | Other secured liabilities | | | Readily realisable (3) | | | | |
| 2014 | Securitisations and conduits £bn | | | Derivatives £bn | | | | | Liquidity portfolio £bn | | | |
Cash and balances at central banks | — | — | | — | — | 2.4 | 2.4 | | 3 | | 66.7 | 6.4 | — | — | | 75.5 |
| Loans and advances to banks | 4.6 | 0.3 | | 11.5 | — | 0.5 | 16.9 | | 68 | | 1.7 | 2.1 | 4.1 | — | | 24.8 |
Loans and advances to customers | | | | | | | | | | | | | | | | |
| - UK residential mortgages | 12.0 | 13.4 | | — | — | — | 25.4 | | 22 | | 69.9 | 10.2 | 7.7 | 0.1 | | 113.3 |
| - Irish residential mortgages | 8.6 | — | | — | — | — | 8.6 | | 62 | | 0.9 | 4.3 | — | 0.1 | | 13.9 |
| - US residential mortgages | — | — | | — | — | 11.2 | 11.2 | | 53 | | 2.2 | — | 0.7 | 7.0 | | 21.1 |
| - UK credit cards | 2.7 | — | | — | — | — | 2.7 | | 52 | | — | 2.3 | 0.2 | — | | 5.2 |
| - UK personal loans | — | — | | — | — | — | — | | — | | — | 6.4 | 2.9 | — | | 9.3 |
| - other | 6.0 | — | | 21.9 | — | 1.3 | 29.2 | | 13 | | 8.0 | 17.2 | 110.3 | 67.3 | | 232.0 |
Reverse repurchase agreements and stock borrowing | — | — | | — | — | — | — | | — | | — | — | — | 64.7 | | 64.7 |
| Debt securities | — | — | | 5.9 | 25.4 | 5.7 | 37.0 | | 36 | | 24.0 | 39.7 | 1.2 | — | | 101.9 |
| Equity shares | — | — | | 0.3 | 2.6 | — | 2.9 | | 47 | | — | 2.2 | 0.2 | 0.9 | | 6.2 |
| Settlement balances | — | — | | — | — | — | — | | — | | — | — | — | 4.7 | | 4.7 |
| Derivatives | — | — | | — | — | — | — | | — | | — | — | — | 354.0 | | 354.0 |
| Intangible assets | — | — | | — | — | — | — | | — | | — | — | — | 8.4 | | 8.4 |
| Property, plant and equipment | — | — | | — | — | 0.4 | 0.4 | | 6 | | — | — | 4.2 | 2.1 | | 6.7 |
| Deferred tax | — | — | | — | — | — | — | | — | | — | — | — | 1.5 | | 1.5 |
Prepayments, accrued income and other assets | — | — | | — | — | — | — | | — | | — | — | — | 7.6 | | 7.6 |
| | 33.9 | 13.7 | | 39.6 | 28.0 | 21.5 | 136.7 | | | | 173.4 | 90.8 | 131.5 | 518.4 | | 1,050.8 |
| Securities retained | | | | | | | | | | | 13.6 | | | | | |
| Total liquidity portfolio | | | | | | | | | | | 187.0 | | | | | |
| | | | | | | | | | | | | | | | | |
| Liabilities secured | | | | | | | | | | | | | | | | |
| Intra-Group - secondary liquidity | (13.1) | — | | — | — | — | (13.1) | | | | | | | | | |
| Intra-Group - other | (11.6) | — | | — | — | — | (11.6) | | | | | | | | | |
Third-party (6) | (5.6) | (7.1) | | (39.6) | (64.6) | (10.5) | (127.4) | | | | | | | | | |
| | (30.3) | (7.1) | | (39.6) | (64.6) | (10.5) | (152.1) | | | | | | | | | |
For the notes to this table refer to the following page.
Business review Capital and risk management
Balance sheet encumbrance
| | Encumbered assets relating to: | Total encumbered assets (2) £bn | | Encumbered assets as a % of related assets % | | Unencumbered | | |
| | Debt securities in issue | | Other secured liabilities | | | Readily realisable (3) | | | | |
| 2013 | Securitisations and conduits £bn | | | Derivatives £bn | | | | | | | Other (4) realisable £bn | Cannot be encumbered (5) £bn | | |
| Cash and balances at central | | | | | | | | | | | | | | | | |
| banks | — | — | | — | — | — | — | | — | | 74.3 | 8.4 | — | — | | 82.7 |
| Loans and advances to banks | 5.8 | 0.5 | | 10.3 | — | — | 16.6 | | 60 | | 0.1 | 10.9 | — | — | | 27.6 |
| | | | | | | | | | | | | | | | | |
Loans and advances to customers | | | | | | | | | | | | | | | | |
| - UK residential mortgages | 14.6 | 16.2 | | — | — | — | 30.8 | | 28 | | 60.8 | 18.6 | — | — | | 110.2 |
| - Irish residential mortgages | 9.3 | — | | — | — | 1.2 | 10.5 | | 70 | | 0.7 | 3.8 | — | 0.1 | | 15.1 |
| - US residential mortgages | — | — | | — | — | 3.5 | 3.5 | | 18 | | 9.5 | 6.7 | — | — | | 19.7 |
| - UK credit cards | 3.4 | — | | — | — | — | 3.4 | | 52 | | — | 3.1 | — | — | | 6.5 |
| - UK personal loans | 3.4 | — | | — | — | — | 3.4 | | 38 | | — | 5.5 | — | — | | 8.9 |
| - other | 13.5 | — | | 18.1 | — | 0.8 | 32.4 | | 14 | | 4.4 | 9.6 | 175.6 | 10.2 | | 232.2 |
Reverse repurchase agreements and stock borrowing | — | — | | — | — | — | — | | — | | — | — | — | 76.5 | | 76.5 |
| Debt securities | 0.9 | — | | 5.5 | 55.6 | 2.7 | 64.7 | | 57 | | 17.0 | 31.9 | — | — | | 113.6 |
| Equity shares | — | — | | 0.5 | 5.3 | — | 5.8 | | 66 | | — | 3.0 | — | — | | 8.8 |
| Settlement balances | — | — | | — | — | — | — | | — | | — | — | — | 5.5 | | 5.5 |
| Derivatives | — | — | | — | — | — | — | | — | | — | — | — | 288.0 | | 288.0 |
| Intangible assets | — | — | | — | — | — | — | | — | | — | — | — | 12.4 | | 12.4 |
| Property, plant and equipment | — | — | | — | — | 0.4 | 0.4 | | 5 | | — | — | 7.5 | — | | 7.9 |
| Deferred tax | — | — | | — | — | — | — | | — | | — | — | — | 3.5 | | 3.5 |
Prepayments, accrued income and other assets | — | — | | — | — | — | — | | — | | — | — | — | 8.6 | | 8.6 |
| Assets of disposal groups | — | — | | — | — | — | — | | — | | — | — | — | 0.2 | | 0.2 |
| | 50.9 | 16.7 | | 34.4 | 60.9 | 8.6 | 171.5 | | | | 166.8 | 101.5 | 183.1 | 405.0 | | 1,027.9 |
| Securities retained | | | | | | | | | | | 17.4 | | | | | |
| Total liquidity portfolio | | | | | | | | | | | 184.2 | | | | | |
| | | | | | | | | | | | | | | | | |
| Liabilities secured | | | | | | | | | | | | | | | | |
| Intra-Group - secondary liquidity | (19.1) | — | | — | — | — | (19.1) | | | | | | | | | |
| Intra-Group - other | (18.4) | — | | — | — | — | (18.4) | | | | | | | | | |
Third-party (6) | (7.8) | (9.0) | | (42.7) | (85.1) | (6.0) | (150.6) | | | | | | | | | |
| | (45.3) | (9.0) | | (42.7) | (85.1) | (6.0) | (188.1) | | | | | | | | | |
| (1) | Includes cash, coin and nostro balance held with the Bank of England as collateral against deposits and notes in circulation. |
| (2) | Encumbered assets are those that have been pledged to provide security for the liability shown above and are therefore not available to secure funding or to meet other collateral needs. |
| (3) | Unencumbered readily realisable assets are those assets on the balance sheet that can be readily used to meet funding or collateral requirements and comprise: |
| | (a) | Liquidity portfolio: cash balances at central banks, high quality debt securities and loans that have been pre-positioned with central banks. In addition, the liquidity portfolio includes securitisations of own assets which has reduced over the years and has been replaced by loans. |
| | (b) | Other readily realisable assets: including assets that have been enabled for use with central banks; and unencumbered debt securities. |
| (4) | Unencumbered other realisable assets are those assets on the balance sheet that are available for funding and collateral purposes but are not readily realisable in their current form. These assets include loans that could be prepositioned with central banks but have not been subject to internal and external documentation review and diligence work. |
| (5) | Assets that cannot be encumbered include: |
| | (a) | Derivatives, reverse repurchase agreements and trading related settlement balances. |
| | (b) | Non-financial assets such as intangibles, prepayments and deferred tax. |
| | (c) | Loans that cannot be pre-positioned with central banks based on criteria set by the central banks, including those relating to date of origination and level of documentation. |
| | (d) | Non-recourse invoice financing balances and certain shipping loans whose terms and structure prohibit their use as collateral. |
| (6) | In accordance with market practice, RBS employs securities recognised on the balance sheet, and securities received under reverse repo transactions as collateral for repos. Secured derivative liabilities reflect net positions that are collateralised by balance sheet assets. |
Business review Capital and risk management
| Credit risk |
| 228 | Definition |
| 228 | Sources of credit risk |
| 228 | Key developments |
| 229 | Risk governance |
| 229 | Risk management |
| 231 | Risk measurement |
| 233 | Credit risk assets |
| 233 | - Balance sheet to CRA bridge |
| 234 | - Portfolio overview |
| 235 | - Sector and geographical regional analyses |
| 236 | - Asset quality |
| 238 | Wholesale credit risk management |
| 238 | - Risk appetite frameworks |
| 238 | - Risk assessment |
| 239 | - Risk mitigation |
| 239 | - Problem debt management |
| 240 | - Restructuring |
| 240 | - Forbearance |
| 241 | - Impairments |
| 242 | - Sector and geographical regional analyses |
| 244 | - AQ10 or non-performing |
| 245 | - Watchlist |
| 246 | - Forbearance |
| 247 | - Key credit portfolios |
| 247 | - Commercial real estate |
| 251 | - Oil and gas |
| 253 | - Counterparty credit risk |
| 254 | Personal credit risk management |
| 254 | - Risk appetite |
| 254 | - Risk assessment |
| 254 | - Risk mitigation |
| 254 | - Problem debt management |
| 254 | - Collections |
| 254 | - Forbearance |
| 255 | - Recoveries |
| 255 | - Impairments |
| 256 | - Key portfolios |
| 256 | - Overview |
| 257 | - UK PBB |
| 261 | - Ulster Bank |
| 265 | - Private Banking |
| 267 | - CFG |
Business review Capital and risk management
Credit risk
Definition
Credit risk is the risk of financial loss due to the failure of a customer or counterparty to meet its obligation to settle outstanding amounts.
Sources of credit risk
RBS is exposed to credit risk as a result of a wide range of business activities. The most significant source of credit risk is lending. RBS offers a number of lending products where it has an obligation to provide credit facilities to a customer. To mitigate the risk of loss, security may be obtained in the form of physical collateral such as commercial real estate assets and residential property, or financial collateral such as cash or bonds. Exposures arising from leasing activities are also included in lending.
The second most significant source of credit risk arises from activities in the derivatives and securities financing transaction markets. These result in counterparty credit risk, which is the risk of financial loss arising from the failure of a counterparty to meet obligations that vary in value by reference to a market factor. To mitigate the risk of loss, collateral and netting are used along with the additional legal rights provided under the terms of over-the-counter contracts.
RBS holds some debt securities generally for liquidity management purposes, and is exposed to credit risk as a result.
RBS is also exposed to credit risk from off-balance sheet products such as trade finance activities and guarantees as well as through committed but undrawn lending facilities.
Through its global activities in foreign exchange, trade finance and payments, RBS is exposed to settlement risk.
Key developments
Credit quality and impairment - RBS’s credit risk portfolio continued to improve with an overall reduction in exposure, an improvement in credit quality and a material provision release in 2014. These improvements were driven by supportive economic and market conditions in the UK and Ireland, better liquidity and increased collateral values, and also reflected improvements in credit risk measurement. Through the credit risk appetite frameworks the credit risk management function maintained a continued focus on key portfolios and concentrations.
UK personal lending - The growth in UK PBB gross mortgage lending was within credit risk appetite and against a backdrop of house price increases over most of the year. Due to the withdrawal of products with promotional rates in line with strategy, credit card exposure declined during the year. Refer to Key portfolios - UK PBB on page 257.
Ulster Bank - Following the creation of RCR, exposure to personal customers now represents 68% of the total Ulster Bank exposure. In the personal portfolio, Ulster Bank’s proactive offers of forbearance to help customers through financial difficulties saw significant uptake in the Republic of Ireland with an increasing trend towards customers opting for longer-term solutions (though mortgage recoveries stock remains high). The quality of the Ulster Bank wholesale portfolio improved following the transfer of commercial real estate (CRE) assets to RCR, with an associated material decrease in impairments. Refer to Segment performance - Ulster Bank on page 133.
CFG - 2014 was a year of growth in both the personal and wholesale CFG portfolios. This was in line with business strategy to expand personal mortgage lending and auto finance organically as well as through acquisition. The growth in wholesale exposures has been across a broad range of industry sectors and customer types, reflecting improving economic conditions in the US and specific focus on areas such as asset finance, CRE and franchise finance. Changes to strategy or the risk appetite framework are subject to review in accordance with CFG’s and RBS’s risk governance frameworks, so that risks are understood and accepted. Refer to Segment performance - Citizens Financial Group on page 146.
Oil prices - In the second half of 2014, oil prices reduced significantly, driven by the growth in supply from non-OPEC producers, the return of supply from Libya, Iran and Iraq and reduced demand expectations from Europe and China. Exposures to this sector continue to be closely managed through the sector concentration framework as well as ongoing customer and sub-sector reviews, with stress testing highlighting specific sub-sectors or customers particularly vulnerable to sustained low oil prices. Risk appetite to the overall oil and gas sector was reduced during the year, and action continues to mitigate exposure where possible. For further information, refer to the Key credit portfolios section on page 256.
Russia/Ukraine - Ongoing tensions in Russia and Ukraine as well as the imposition of sanctions, particularly in the oil and gas, defence, and financial sectors, have adversely affected the credit risk profile of customers who have exposure to or dealings with Russian or Ukrainian entities. Accordingly, RBS reduced limits to customers affected by those developments, including tightening transactional controls to mitigate credit risk while ensuring sanctions compliance. For further information regarding exposure to Russia, refer to the Country risk section on page 319.
Credit risk appetite - Credit risk appetite is continuously reviewed to ensure that it remains relevant in light of changing economic conditions and strategic objectives. Revisions were made to the sector credit risk appetite framework to reflect the altered composition of the credit portfolio following the creation of RCR. The asset and product class framework was also revised to reflect changes in the portfolio together with market developments. These included a revision of the credit risk appetite framework relating to sponsor owned corporate transactions in order to maintain portfolio credit quality following a weakening in terms and conditions within the leverage market.
Business review Capital and risk management
Risk governance
A strong credit risk management function is vital to support ongoing profitability. The potential for loss is mitigated through a robust credit risk culture and a focus on sustainable lending practices.
Operating model
The RBS credit risk management function, which is led by the Group Chief Credit Officer (GCCO), acts as the ultimate authority for the approval of credit and is responsible for ensuring that credit risk is within the risk appetite set by the Board. The function is also responsible for managing concentration risk and credit risk control frameworks as well as developing and ensuring compliance with credit risk policies. In addition, the function conducts RBS-wide assessments of provision adequacy.
The Executive Risk Forum (ERF) has delegated approval authority to the Credit Risk Committee (CRC) to act on credit risk matters. These include, but are not limited to, credit risk appetite and limits (within the overall risk appetite set by the Board and the ERF), credit risk strategy and frameworks, credit risk policy and the oversight of the credit profile across RBS. There are separate CRCs for the wholesale and personal portfolios. These are chaired by the GCCO or delegate.
The ERF has delegated approval authority to the RBS Provisions Committee to manage provisions adequacy, both individual and collective. The RBS Provisions Committee, which is chaired by either the Chief Risk Officer or the GCCO, approves recommendations from lower-level provisions committees, which in turn have delegated approval thresholds for certain provision adequacy decisions.
Key trends in the credit risk profile of RBS’s performance against limits and emerging risks are set out in the RBS Risk Management Monthly Report provided to the Executive Committee, the Board Risk Committee and the Board.
The Risk Infrastructure function provides a variety of services that enable the credit risk management function to operate. These include reporting of credit risk data, risk assurance, provision of credit risk models, systems strategy and change management.
Controls and assurance
The RBS credit control and assurance framework has three key components: credit policy; policy compliance assessment; and independent assurance. These apply to both wholesale and personal credit risk at both portfolio and individual customer level.
The first component is the RBS Credit Policy Standard, which is part of the RBS Policy Framework. It sets out the rules that must be followed to ensure that credit risks are identified and effectively managed through the credit lifecycle.
The second component is a policy compliance assessment activity that credit risk undertakes to provide the GCCO with evidence of the effectiveness of credit risk management controls in place across RBS. The results of these reviews support the self-certification that credit risk must complete every six months.
The third component of RBS credit assurance framework is the credit quality assurance activity carried out independently by Risk Assurance, which is part of the Risk Infrastructure function. Risk Assurance independently reviews lending activities to identify control breaches, assess portfolio quality and recommend process improvements. These findings are escalated to senior management and plans to address shortcomings are recorded and tracked in RBS’s operational risk system. Risk Assurance’s credit quality assurance activities are overseen by the Audit Committee and the results of its reviews are regularly shared with the regulators.
In addition, controls and processes are regularly reviewed by RBS’s Internal Audit (IA) function. IA provides assurance to the Audit Committee and senior executive that the main business risks have been identified and that effective controls are in place to manage these risks.
Risk management*
RBS credit risk management is split into wholesale and personal, reflecting the distinction between business types and the different risk management approaches, metrics and issues these involve. Wholesale focuses on activities with corporate and SME customers as well as banks and financial institutions (these customers tend to be grouped by sector and geography as well as by product/asset class). Personal covers personal customers across UK PBB, Ulster Bank and CFG as well as personal lending activities in Private Banking.
Risk appetite
Risk appetite across all risk types is set using specific quantitative targets under stress, including earnings volatility and capital adequacy. The credit risk appetite framework has been designed to reflect the factors that influence the ability to meet those targets. These include product and asset class, industry sector, single name and country concentrations. Any of these factors could generate higher earnings volatility under stress and, if not adequately controlled, they could undermine capital adequacy. Tools such as stress testing and economic capital are used to measure credit risk volatility and develop links between risk appetite targets and the credit risk appetite framework. The frameworks are supported by a suite of policies that set out the risk parameters within which franchises must operate. Impairments, and associated key metrics such as loan loss rates and provision coverage, are an integral part of standard credit risk portfolio reviews and are presented to CRC monthly. These metrics are also fully considered as part of the sector and product class appetite reviews. RBS also manages its exposures to counterparty credit risk closely, using portfolio limits and specific tools to control more volatile or capital-intensive business areas.
For further information refer to the Wholesale credit risk management and Personal credit risk management sub-sections.
*unaudited
Business review Capital and risk management
Risk monitoring and problem debt management
A key aspect of credit risk management relates to problem debt management, from early problem identification through to litigation and recovery of cash when there is no realistic potential for rehabilitation. Various tools and techniques are deployed during this part of the credit cycle including the offering of forbearance. Practices differ across the wholesale and personal portfolios. For further information refer to the Wholesale credit risk management and Personal credit risk management sub-sections.
Impairments and write-offs
Internal measures of credit risk are stated gross of impairments. However, impairments and write-offs are used as key indicators of credit quality as part of the overall assessment of credit risk incurred by RBS. These are estimated as follows:
Impaired definition
A financial asset is impaired if there is objective evidence that an event or events since initial recognition of the asset has adversely affected the amount or timing of future cash flows from it. The loss is measured as the difference between the carrying value of the asset and the present value of estimated future cash flows discounted at the original effective interest rate.
For both wholesale and personal exposures, days-past-due measures are typically used to identify evidence of impairment. In both corporate and personal portfolios, a period of 90 days past due is used. In sovereign portfolios, the period used is 180 days past due. Other factors are considered including: the borrower’s financial condition; a forbearance event; a loan restructuring; the probability of bankruptcy; or any evidence of diminished cash flows.
Provisioning
If there is objective evidence that an impairment loss has been incurred, the amount of the loss is measured as the difference between the asset carrying amount and the present value of the estimated future cash flows discounted at the financial asset’s original effective interest rate. The current net realisable value of the collateral will be taken into account in determining the need for a provision. This includes cash flows that may result from foreclosure less the costs of obtaining and selling the collateral, whether or not foreclosure is probable. No impairment provision is recognised in cases where amounts due are expected to be settled in full on realisation of the security. RBS uses one of the following three different methods to assess the amount of provision required: individual; collective; and latent.
Individually-assessed provisions
Loans and securities above a defined threshold deemed to be individually significant are assessed on a case-by-case basis. Assessments of future cash flows take into account the impact of any guarantees or collateral held. Estimating the amount and timing of future cash flows involves judgement based on the facts available at the time and assumptions related to the future financial performance of the customer or counterparty and any guarantors as well as future economic conditions and the value of collateral. Projected cash flows are reviewed on subsequent assessment dates as new information becomes available.
Collectively-assessed provisions
Provisions on impaired credits below an agreed threshold are assessed on a portfolio basis, reflecting the homogeneous nature of the assets. Such portfolios may be either wholesale or retail.
RBS segments them according to product type, such as credit cards, personal loans and mortgages. The approach taken to assess impaired assets in collections differs from the approach taken to assess those in recoveries. For further details on the collections and recoveries functions refer to the Problem debt management sub-section on page 239.
Provisions are determined based on a quantitative review of the relevant portfolio. They take account of the level of arrears, the value of any security, and historical and projected cash recovery trends over the recovery period. The provisions also incorporate any adjustments that may be deemed appropriate given current economic conditions. Such adjustments may be determined based on a review of the latest cash collections profile and operational processes used in managing exposures.
Latent loss provisions
In the performing portfolio, latent loss provisions are held against losses incurred but not identified before the balance sheet date. Latent loss provisions reflect probability of default (PD) and loss given default (LGD) as well as emergence periods. The emergence period is the period between the occurrence of the impairment event and the identification and reporting of a loan as impaired.
Emergence periods are estimated at a portfolio level and reflect the portfolio product characteristics such as coupon period and repayment terms, and the duration of the administrative process required to report and identify an impaired loan as such. Emergence periods vary across different portfolios from 120 to 270 days (365 days for forborne exposures). They are based on actual experience within the particular portfolio and are reviewed regularly.
RBS’s personal businesses segment their performing loan books into homogeneous portfolios such as mortgages, credit cards or unsecured loans, to reflect their different credit characteristics. Latent provisions are computed by applying portfolio-level LGDs, PDs and emergence periods. The wholesale calculation is based on similar principles but there is no segmentation into portfolios. PDs and LGDs are calculated individually.
Refer to pages 289 to 293 for analysis of impaired loans, related provisions and impairments and to, 350 and 351 for details of accounting policies.
*unaudited
Business review Capital and risk management
Available-for-sale portfolios
RBS reviews its portfolios of available-for-sale financial assets for evidence of impairment, which includes: default or delinquency in interest or principal payments; significant financial difficulty of the issuer or obligor; and increased likelihood that the issuer will enter bankruptcy or other financial reorganisation. However, the disappearance of an active market because an entity’s financial instruments are no longer publicly traded is not evidence of impairment. Furthermore, a downgrade of an entity’s credit rating is not, in itself, evidence of impairment, although it may be evidence of impairment when considered with other available information. A decline in the fair value of a financial asset below its cost or amortised cost is not necessarily evidence of impairment. Determining whether evidence of impairment exists requires the exercise of management judgement. Unrecognised losses on RBS’s available-for-sale debt securities are concentrated in its portfolios of asset-backed securities. Such losses reflect the widening of credit spreads as a result of the reduced market liquidity in these securities and the current uncertain macroeconomic outlook in the US and Europe. The underlying securities remain unimpaired.
Sensitivity of impairments to assumptions
Key assumptions relating to impairment levels of secured lending relate to the valuation of the security and collateral held, the timing of asset disposals based on the underlying market depth and liquidity and customer cooperation. Assumptions on timing also include an assessment of the ease and timing of the enforceability of loan agreements in varying legal jurisdictions. Assumptions are made on a case by case basis in the case of individually assessed provisions and are often based on judgement.
Key assumptions relating to impairment levels of unsecured lending relate to economic conditions and the interest rate environment, which have a direct impact on customers' debt servicing capabilities. For individual impairments greater than £1 million, oversight is provided by the Provisions Committee.
Write-offs
Impaired loans and receivables are written-off, that is, the impairment provision is applied in writing down the loan's carrying value partially or in full, when there is no longer any realistic prospect of recovery of part or all of the loan. For loans that are individually assessed for impairment, the timing of write-off is determined on a case-by-case basis. Such loans are reviewed regularly and write-offs may be prompted by bankruptcy, insolvency, forbearance and similar events.
Except for US personal portfolios, where the write-off of the irrecoverable amount takes place within 60-180 days, the typical time frames from initial impairment to write-off for collectively-assessed portfolios are:
| · | Personal mortgages: Write-off usually occurs within five years of default and is accelerated where accounts are closed earlier. |
| · | Credit cards: Write-off of the irrecoverable amount usually occurs at 12 months in arrears; the rest is expected to be recovered over a further three years following which any remaining amounts outstanding are written off. |
| · | Overdrafts and other unsecured loans: Write-off usually occurs within six years of default. |
| · | Business loans: Write-off usually occurs within five years. |
| · | Commercial loans: Write-off generally occurs within five years but is determined in the light of individual circumstances. |
Amounts recovered after a loan has been written-off are credited to the loan impairment charge for the period in which they are received.
Risk measurement*
Risk exposure measurement
RBS uses a range of measures for credit risk exposures. The internal measure used, unless otherwise stated, is credit risk assets (CRA) consisting of:
| · | Lending exposure - measured using drawn balances and includes cash balances at central banks and loans and advances to banks and customers (including overdraft facilities, instalment credit and finance leases). |
| · | Counterparty exposures - measured using the marked-to-market value of derivatives after the effect of enforceable netting agreements and regulator-approved models but before the effect of collateral. Counterparty exposures include rate risk management, which includes those arising from foreign exchange transactions, interest rate swaps, credit default swaps and options. |
| · | Contingent obligations - measured using the value of the committed amount and including primarily letters of credit and guarantees. |
CRA exclude issuer risk (primarily debt securities) and securities financing transactions. CRA take account of regulatory netting although, in practice, obligations are settled under legal netting arrangements that provide a right of legal set-off but do not meet the offset criteria under IFRS.
Risk models
RBS uses the output of credit risk models in the credit approval process, as well as for ongoing credit risk assessment, monitoring and reporting, to inform credit risk appetite decisions. These models may be divided into three categories:
Probability of default (PD)
PD models assess the probability of a customer failing its credit obligations over a one-year period.
| · | Wholesale models - A number of credit grading models consider risk characteristics relevant to different customer types. These models use a combination of quantitative inputs, such as recent financial performance, and qualitative inputs such as management performance or sector outlook. As part of the credit assessment process, RBS assigns each customer an internal credit grade based on its PD. |
| · | Personal models - Each customer account is scored and models are used to assign a PD. Inputs vary across portfolios and include both internal account and customer level data, as well as data from credit bureaus. This score is used to support automated credit decision-making through the use of a statistically-derived scorecard. |
Business review Capital and risk management
Exposure at default (EAD)
EAD models provide estimates of credit facility utilisation at the time of a customer default, recognising that customers may make further drawings on unused credit facilities prior to default or that exposures may increase due to market movements. Regulatory requirements stipulate that EAD must always be equal to, or higher, than current utilisation. Exposure can be reduced by a legally enforceable netting agreement.
Loss given default (LGD)
LGD models estimate the amount that cannot be recovered in the event of customer default. When estimating LGD, RBS’s models assess both borrower and facility characteristics, as well as any credit risk mitigants. The cost of collections and a time-discount factor for the delay in cash recovery are also incorporated.
Changes to credit models
RBS reviews and updates models on an ongoing basis, reflecting the impact of more recent data, changes to products and portfolios, and new regulatory requirements. Extensive changes were made to wholesale models in 2012 and 2013. This continued in 2014 with further changes, notably in the corporate exposure class.
New PD models are being implemented for large corporate customers. The roll-out will be completed by mid-2015. The updated calibrations associated with these new models, which reference over 20 years of rating agency default experience, may result in downwards rating migrations across internal asset quality bands. For further information regarding the impact of this change refer to the Asset quality section on page 236.
Model changes affect year-on-year comparisons of risk measures in certain disclosures. Where meaningful, in its commentary RBS has differentiated between instances where movements in risk measures reflect the impact of model changes, and those where such movements reflect changes in the size of underlying credit portfolios or their credit quality.
Economic capital
The credit economic capital model is a framework that allows for the calculation of portfolio credit loss distributions and associated metrics over a given risk horizon for a variety of business purposes.
The model takes into account migration risk (the risk that credit assets will deteriorate in credit quality across multiple years), factor correlation (the assumption that groups of obligors share a common factor) and contagion risk (for example, the risk that the weakening of the sovereign’s credit worthiness has a significant impact on the creditworthiness of a business operating in that country).
Risk mitigation
Risk mitigation techniques are used in the management of credit portfolios across RBS, typically to mitigate credit concentrations in relation to an individual customer, a borrower group or a collection of related borrowers. Where possible, customer credit balances are netted against obligations.
Mitigation tools applied can include: structuring a security interest in a physical or financial asset; use of credit derivatives, including credit default swaps, credit-linked debt instruments and securitisation structures; and use of guarantees and similar instruments (for example, credit insurance) from related and third parties.
When seeking to mitigate risk, at a minimum RBS considers the following:
| · | The suitability of the proposed risk mitigation, particularly if restrictions apply; |
| · | The means by which legal certainty is to be established, including required documentation, supportive legal opinions and the steps needed to establish legal rights; |
| · | The acceptability of the methodologies to be used for initial and subsequent valuation of collateral, the frequency of valuations and the advance rates given; |
| · | The actions which can be taken if the value of collateral or other mitigants is less than needed; |
| · | The risk that the value of mitigants and counterparty credit quality may deteriorate simultaneously; |
| · | The need to manage concentration risks arising from collateral types; and |
| · | The need to ensure that any risk mitigation remains legally effective and enforceable. |
The RBS business and credit teams are supported by specialist in-house documentation teams. RBS uses industry-standard loan and security documentation wherever possible. However, when non-standard documentation is used, external lawyers are employed to review it on a case-by-case basis. For further information refer to the Wholesale credit risk management and Personal credit risk management sub-sections.
Business review Capital and risk management
Credit risk assets*
Balance sheet to CRA bridge
The table below provides a bridge between balance sheet captions and the related components of credit risk assets (CRA).
| | | | | | | | Methodology | |
| | | Within | Not within | | Netting | | differences | |
| | Balance | the scope of | the scope | Credit | and | Disposal | and | |
| | sheet | market risk (1) | of CRA (2) | adjustments (3) | collateral (4) | groups (5) | reclassifications (6) | CRA |
| 2014 | £bn | £bn | £bn | £bn | £bn | £bn | £bn | £bn |
| Cash and balances at central banks | 74.9 | — | (3.8) | — | — | 0.6 | — | 71.7 |
| Reverse repurchase agreements and stock borrowing | 64.7 | — | (64.7) | — | — | — | — | — |
| Loans and advances | 357.3 | — | — | 18.0 | (33.4) | 62.2 | (10.3) | 393.8 |
| Debt securities | 86.6 | (49.3) | (52.6) | — | — | 15.3 | — | — |
| Equity shares | 5.6 | (4.9) | (1.3) | — | — | 0.6 | — | — |
| Settlement balances | 4.7 | (4.7) | — | — | — | — | — | — |
| Derivatives | 353.6 | — | — | 1.4 | (295.3) | 0.4 | 8.2 | 68.3 |
Other assets (7) | 103.4 | — | (18.5) | — | — | (79.1) | (3.5) | 2.3 |
| Total assets | 1,050.8 | (58.9) | (140.9) | 19.4 | (328.7) | — | (5.6) | 536.1 |
| Contingent obligations | | | | | | | | 26.0 |
| | | | | | | | | 562.1 |
| | | | | | | | | |
| 2013 | | | | | | | | |
| Cash and balances at central banks | 82.7 | — | (3.9) | — | — | — | 1.7 | 80.5 |
| Reverse repurchase agreements and stock borrowing | 76.4 | — | (76.4) | — | — | — | — | — |
| Loans and advances | 418.4 | — | (3.0) | 25.2 | (28.4) | 1.8 | (9.3) | 404.7 |
| Debt securities | 113.6 | (56.7) | (56.9) | — | — | — | — | — |
| Equity shares | 8.8 | (7.2) | (1.6) | — | — | — | — | — |
| Settlement balances | 5.6 | (5.6) | — | — | — | — | — | — |
| Derivatives | 288.0 | — | — | 1.8 | (242.8) | — | 9.9 | 56.9 |
Other assets (7) | 34.4 | — | (25.6) | — | — | (1.8) | (6.0) | 1.0 |
| Total assets | 1,027.9 | (69.5) | (167.4) | 27.0 | (271.2) | — | (3.7) | 543.1 |
| Contingent obligations | | | | | | | | 29.9 |
| | | | | | | | | 573.0 |
| (1) | The exposures in regulatory trading book businesses are subject to market risk and are hence excluded from CRA. Refer to the Market risk section on page 294. |
| (2) | Includes cash in ATMs and branches, reverse repurchase agreements, securities and other assets (refer to note below). |
| (3) | Includes impairment loss provisions related to loans and advances and credit valuation adjustment on derivatives. |
| | - Loans and advances: cash collateral pledged with counterparties in relation to net derivative liability positions. |
| | - Derivatives: impact of master netting arrangements. |
| (5) | Amounts reclassified to balance sheet lines. |
| | - Loans and advances: cash management pooling arrangements not allowed under IFRS. |
| | - Derivatives: differences between netting arrangements and regulatory model sets and balances with central counterparties after netting but before variation margin presented net on the balance sheet. |
| (7) | Includes intangible assets, property, plant and equipment, deferred tax, prepayments and accrued income and assets of disposal groups. |
*unaudited
Business review Capital and risk management
Portfolio overview
| | 2014 | | 2013 | | 2012 |
| | Personal | Wholesale | Total | Total | | Personal | Wholesale | Total | Total | | Personal | Wholesale | Total | Total |
| | £m | £m | £m | % | | £m | £m | £m | % | | £m | £m | £m | % |
| UK Personal & Business Banking | 115,570 | 13,952 | 129,522 | 23 | | 113,319 | 14,267 | 127,586 | 22 | | 114,253 | 15,082 | 129,335 | 21 |
| Ulster Bank | 18,364 | 8,501 | 26,865 | 5 | | 20,123 | 13,006 | 33,129 | 6 | | 20,455 | 13,777 | 34,232 | 5 |
| Personal & Business Banking | 133,934 | 22,453 | 156,387 | 28 | | 133,442 | 27,273 | 160,715 | 28 | | 134,708 | 28,859 | 163,567 | 26 |
| Commercial Banking | 1,420 | 81,576 | 82,996 | 15 | | 1,609 | 79,533 | 81,142 | 14 | | 1,710 | 79,283 | 80,993 | 13 |
| Private Banking | 12,921 | 5,584 | 18,505 | 3 | | 13,332 | 6,487 | 19,819 | 3 | | 13,099 | 6,814 | 19,913 | 3 |
| Commercial & Private Banking | 14,341 | 87,160 | 101,501 | 18 | | 14,941 | 86,020 | 100,961 | 17 | | 14,809 | 86,097 | 100,906 | 16 |
| Corporate & Institutional Banking | 103 | 147,368 | 147,471 | 26 | | 3 | 147,781 | 147,784 | 26 | | 7 | 177,810 | 177,817 | 29 |
| Central items | — | 62,858 | 62,858 | 11 | | — | 66,745 | 66,745 | 12 | | 883 | 62,280 | 63,163 | 10 |
| Citizens Financial Group | 32,167 | 32,031 | 64,198 | 12 | | 26,412 | 26,999 | 53,411 | 9 | | 27,473 | 27,563 | 55,036 | 9 |
| RCR | 203 | 29,447 | 29,650 | 5 | | n/a | n/a | n/a | n/a | | n/a | n/a | n/a | n/a |
| Non-Core | n/a | n/a | n/a | n/a | | 2,324 | 41,016 | 43,340 | 8 | | 3,787 | 61,433 | 65,220 | 10 |
| | 180,748 | 381,317 | 562,065 | 100 | | 177,122 | 395,834 | 572,956 | 100 | | 181,667 | 444,042 | 625,709 | 100 |
Key points
| · | Overall, CRA fell by 2% during 2014 (compared with an 8% fall in 2013). This is in line with the continued focus on reducing exposure concentrations, improving overall portfolio credit quality and running down assets in RCR. |
| · | RCR was established on 1 January 2014 and the most capital intensive, highest-risk assets from across RBS were transferred into it. As part of this process, certain assets which were previously managed as Non-Core were returned to the non-RCR businesses. Non-Core and RCR are therefore not directly comparable year on year. |
| · | Excluding RCR, CRA in PBB and CPB represented 48% of exposures while CIB represented 28% and CFG 12%. CPB exposures have remained stable with a 2% increase in Commercial Banking partially offset by a 7% reduction in Private Banking, where the largest reduction in exposure in wholesale was in the banking sector and the remainder of the reduction predominantly driven by personal lending |
| · | Personal exposure grew by 2% during 2014. This was driven predominantly by growth in UK PBB’s mortgage book as well as a rise in CFG’s mortgage and auto finance exposures. For further analysis of the personal portfolios refer to pages 257 to 269. |
| · | There has been a significant increase in CFG exposure in both the personal and wholesale portfolios, as well as across a broad range of industry sectors, in line with business strategy and risk appetite. Growth in personal CRA was driven by increases in auto finance and residential mortgages, following portfolio acquisitions during the year, partially offset by a reduction in home equity exposures, including continued run-off in the non-performing portfolio. In addition foreign exchange movements also affected the CFG exposure, with 30% of the increase in CFG exposure driven by foreign exchange movements. |
| · | The creation of RCR and run-down of assets within it has contributed significantly to the reduction in wholesale exposure during the year. In particular there has been a significant decrease in wholesale exposures in Ulster Bank. Ulster Bank’s portfolio now comprises 68% personal exposure, up from 61% at 2013, with the majority of wholesale exposure to SME customers. |
| · | Central items predominantly represent RBS Treasury’s exposures to central banks in the UK and US. Central items exposure fell 6% during the year, predominantly in the UK and Western Europe, driven by RBS’s liquidity requirements and cash positions. |
| · | At the year end, RCR accounted for 5% of total CRA (2013 Non-Core - 8%) as asset disposals and run-offs continued. 50% of RCR exposure was in the property sector as RBS continued to reduce its concentration in this sector, in particular relating to CRE. For further analysis of exposures in the wholesale portfolio refer to pages 238 to 253. |
Business review Capital and risk management
Sector and geographical regional analyses
The table below details CRA by business type and geographical region. Geographical region is based on the location of the customer’s operations (or, in the case of individuals, location of residence).
| | | Western | | | | | | | |
| | | Europe | North | Asia | Latin | | | RBS | |
| | UK | (excl. UK) | America | Pacific | America | Other (1) | Total | excluding RCR | RCR |
| 2014 | £m | £m | £m | £m | £m | £m | £m | £m | £m |
| Personal | 129,091 | 16,802 | 32,449 | 1,523 | 111 | 772 | 180,748 | 180,545 | 203 |
| Wholesale | 180,832 | 76,282 | 81,823 | 21,702 | 4,104 | 16,574 | 381,317 | 351,870 | 29,447 |
| of which: RCR | 11,531 | 12,003 | 851 | 1,178 | 140 | 3,744 | 29,447 | — | — |
| | 309,923 | 93,084 | 114,272 | 23,225 | 4,215 | 17,346 | 562,065 | 532,415 | 29,650 |
| | | | | | | | | | |
| | | | | | | | | RBS excluding | |
| 2013 | | | | | | | | Non-Core | Non-Core |
| Personal | 127,620 | 18,751 | 28,616 | 1,418 | 61 | 656 | 177,122 | 174,798 | 2,324 |
| Wholesale | 192,360 | 85,539 | 67,493 | 27,271 | 4,685 | 18,486 | 395,834 | 354,818 | 41,016 |
| of which: Non-Core | 15,895 | 18,152 | 1,832 | 1,793 | 197 | 3,147 | 41,016 | — | — |
| | 319,980 | 104,290 | 96,109 | 28,689 | 4,746 | 19,142 | 572,956 | 529,616 | 43,340 |
| | | | | | | | | | |
| | | | | | | | | RBS excluding | |
| 2012 | | | | | | | | Non-Core | Non-Core |
| Personal | 129,431 | 19,256 | 30,664 | 1,351 | 39 | 926 | 181,667 | 177,880 | 3,787 |
| Wholesale | 186,883 | 128,040 | 69,837 | 30,783 | 13,855 | 14,644 | 444,042 | 382,609 | 61,433 |
| of which: Non-Core | 24,399 | 23,247 | 3,949 | 3,806 | 3,991 | 2,041 | 61,433 | — | — |
| | 316,314 | 147,296 | 100,501 | 32,134 | 13,894 | 15,570 | 625,709 | 560,489 | 65,220 |
| (1) | Comprises Central and Eastern Europe, the Middle East, Central Asia and Africa, and supranationals such as the World Bank. |
Key points
| · | CRA fell in all geographic regions except North America. The increase in North America resulted from increased exposures to sovereigns and banks as well as increased exposure in both the wholesale and personal portfolios in CFG. Foreign exchange movements also contributed to the increased exposure in North America. |
| · | The main driver behind the wholesale reduction in the UK was reduced exposure in central bank and CRE (down 22% and 18% respectively). |
| · | There was no material change in wholesale sector distribution during the year, with proportionate reductions observed throughout the portfolio. |
| · | For the wholesale portfolio, sector analysis on a geographic basis can be found on page 242. Information on personal portfolios can be found on pages 257 to 269. |
Business review Capital and risk management
Credit risk assets* continued
Asset quality (AQ)
Credit grades play a key role in the internal reporting and oversight of CRA. Customers are assigned credit grades based on various credit grading models that reflect the key drivers of default for each customer type. All credit grades map to both a RBS level asset quality scale, used for external financial reporting, and a master grading scale for wholesale exposures, used for internal management reporting across portfolios. Accordingly, measures of risk exposure may be aggregated and reported at differing levels of detail depending on stakeholder or business requirements. Performing loans are defined as AQ1-AQ9 (where the PD is less than 100%) and non-performing loans as AQ10 (where the PD is 100%).
Exposures are allocated to asset quality bands on the basis of statistically driven models, which produce estimates of default rates. The variables included in the models vary by product and geography. For portfolios secured on residential property, these models typically include measures of delinquency and loan-to-value as well as other differentiating characteristics such as product features or account performance information.
The table below shows CRA by asset quality band.
| | | | | | | | |
| | | | Wholesale | | | Wholesale |
| | | Personal | | Of which RCR | Total | Total | excluding RCR |
| AQ band | Probability of default range | £m | £m | £m | £m | % | % |
| 2014 | | | | | | | |
| AQ1 | 0% - 0.034% | 5,369 | 115,755 | 1,415 | 121,124 | 22 | 32 |
| AQ2 | 0.034% - 0.048% | 760 | 23,337 | 345 | 24,097 | 4 | 6 |
| AQ3 | 0.048% - 0.095% | 5,502 | 35,059 | 1,344 | 40,561 | 7 | 10 |
| AQ4 | 0.095% - 0.381% | 84,613 | 67,569 | 3,200 | 152,182 | 27 | 18 |
| AQ5 | 0.381% - 1.076% | 34,644 | 49,393 | 1,123 | 84,037 | 15 | 14 |
| AQ6 | 1.076% - 2.153% | 13,607 | 27,015 | 2,089 | 40,622 | 7 | 7 |
| AQ7 | 2.153% - 6.089% | 6,174 | 18,527 | 1,822 | 24,701 | 4 | 5 |
| AQ8 | 6.089% - 17.222% | 3,799 | 4,785 | 1,397 | 8,584 | 2 | 1 |
| AQ9 | 17.222% - 100% | 3,660 | 1,729 | 566 | 5,389 | 1 | — |
| AQ10 | 100% | 8,424 | 21,636 | 15,917 | 30,060 | 5 | 2 |
Other (1) | | 14,196 | 16,512 | 229 | 30,708 | 6 | 5 |
| | | 180,748 | 381,317 | 29,447 | 562,065 | 100 | 100 |
| | | | | | | | Total |
| | | | | Of which | | | excluding |
| 2013 | | | | Non-Core | | | Non-Core |
| AQ1 | 0% - 0.034% | 5,714 | 126,802 | 3,315 | 132,516 | 23 | 24 |
| AQ2 | 0.034% - 0.048% | 2,583 | 21,844 | 1,414 | 24,427 | 4 | 4 |
| AQ3 | 0.048% - 0.095% | 3,324 | 38,701 | 627 | 42,025 | 7 | 8 |
| AQ4 | 0.095% - 0.381% | 63,197 | 56,798 | 4,481 | 119,995 | 21 | 22 |
| AQ5 | 0.381% - 1.076% | 39,409 | 40,852 | 2,306 | 80,261 | 14 | 15 |
| AQ6 | 1.076% - 2.153% | 16,417 | 31,197 | 2,972 | 47,614 | 8 | 8 |
| AQ7 | 2.153% - 6.089% | 13,687 | 19,877 | 1,937 | 33,564 | 6 | 6 |
| AQ8 | 6.089% - 17.222% | 4,440 | 5,951 | 846 | 10,391 | 2 | 2 |
| AQ9 | 17.222% - 100% | 4,001 | 3,511 | 720 | 7,512 | 1 | 1 |
| AQ10 | 100% | 8,966 | 33,591 | 20,513 | 42,557 | 8 | 4 |
Other (1) | | 15,384 | 16,710 | 1,885 | 32,094 | 6 | 6 |
| | | 177,122 | 395,834 | 41,016 | 572,956 | 100 | 100 |
| | | | | | | | |
*unaudited
Business review Capital and risk management
| | | 2012 |
| | | | Wholesale | | | Total |
| | | | | Of which | | | excluding |
| | | Personal | | Non-Core | Total | Total | Non-Core |
| AQ band | Probability of default range | £m | £m | £m | £m | % | % |
| AQ1 | 0% - 0.034% | 8,126 | 131,074 | 7,069 | 139,200 | 22 | 24 |
| AQ2 | 0.034% - 0.048% | 1,568 | 26,007 | 2,238 | 27,575 | 5 | 4 |
| AQ3 | 0.048% - 0.095% | 3,382 | 42,582 | 1,875 | 45,964 | 7 | 8 |
| AQ4 | 0.095% - 0.381% | 57,672 | 61,355 | 5,499 | 119,027 | 19 | 20 |
| AQ5 | 0.381% - 1.076% | 44,907 | 54,811 | 6,785 | 99,718 | 16 | 16 |
| AQ6 | 1.076% - 2.153% | 14,888 | 36,445 | 5,129 | 51,333 | 8 | 8 |
| AQ7 | 2.153% - 6.089% | 14,271 | 23,993 | 5,284 | 38,264 | 6 | 6 |
| AQ8 | 6.089% - 17.222% | 6,134 | 8,113 | 1,052 | 14,247 | 2 | 2 |
| AQ9 | 17.222% - 100% | 4,810 | 6,112 | 1,989 | 10,922 | 2 | 2 |
| AQ10 | 100% | 9,419 | 34,988 | 22,603 | 44,407 | 7 | 4 |
Other (1) | | 16,490 | 18,562 | 1,910 | 35,052 | 6 | 6 |
| | | 181,667 | 444,042 | 61,433 | 625,709 | 100 | 100 |
| (1) | Largely comprises assets covered by the standardised approach, for which a probability of default equivalent to those assigned to assets covered by the internal ratings based approach is not available. |
Key points
| · | The proportion of exposure in the AQ10 band fell to 5% of the total portfolio, driven by the disposal strategy in RCR and the improving economic climate which also drove lower impairments during the year. |
| · | Overall asset quality for performing assets improved year-on-year with AQ1-AQ4 increasing overall by 6%. AQ1-AQ4 represented 60% of the portfolio at the year end (2013 - 55%). |
| · | In addition to driving provision releases on individual cases, the improvement in credit quality had a positive impact on the underlying risk metrics (PD and LGD) used in collective and latent provisioning. |
| · | The reduction in the proportion of non-RCR exposures in the AQ1 band reflected the reduction in exposure to sovereigns, as well as changes to the large corporate grading models. The updated calibrations associated with these new models resulted in rating migrations from higher to lower quality AQ bands, mostly in bands AQ1-AQ5 (those associated with lower risk exposures). At 31 December 2014, 14% of RBS’s exposure was graded using these models and 64% had been re-rated using the revised models. Approximately 40% of re-rated large corporate customers retained their existing AQ band, with 40% moving down one AQ band and 15% moving down two AQ bands. |
| · | The increase in AQ4 was caused by the recalibration of models for UK personal mortgages to reflect continued improvements in observed default rates and the implementation of the large corporate grading model. |
*unaudited
Business review Capital and risk management
Wholesale credit risk management
Wholesale credit risk management focuses on the credit risks arising from activities with corporate and SME clients as well as banks, other financial institutions and sovereigns.
Risk appetite frameworks*
Four formal frameworks are used to manage wholesale credit concentration risk. RBS continually reassesses its frameworks to ensure they remain appropriate for its varied business franchises and current economic conditions as well as to reflect further refinements in RBS’s risk measurement models.
Single name concentration
A single name concentration (SNC) framework addresses the risk of outsized loss arising from a concentration of credit risk to a single borrower or borrower group. The framework includes elevated approval authority, additional reporting and monitoring, and the requirement for plans to address exposures in excess of appetite.
SNC excesses are reviewed on a gross basis as well as on a net basis after taking mitigation into account. All net excesses are managed through an approved, customer specific, exposure management plan. To reduce its SNC exposures, RBS may decide to sell excess amounts or rely on mitigation. To be considered effective under the framework, mitigation must be “eligible”. Examples of eligible credit risk mitigants include cash collateral, government or bank guarantees, credit default swaps or trade insurance. Eligible credit risk mitigants must also be structurally effective, legally certain, enforceable and characterised by an appropriate maturity profile.
Aggregate SNC exposures remain outside of RBS’s longer-term appetite. However, material reductions have been achieved since the framework was introduced. This trend continued during the year, with a 52% decrease in the number of excesses. The top ten SNC excesses comprise 95% of RBS’s total SNC excesses. Total SNC exposure was reduced by 43%.
Sector concentration
Sector concentration risk is the risk of an outsized loss arising from a concentration of credit risk to customers in the same sector or across sectors that are susceptible to similar stress events. The sector concentration framework enables RBS to manage this risk and acts as one of the primary mechanisms for cascading the board-approved risk appetite to business franchises. It also details the controls for managing and reporting credit exposure to industry sectors.
The sector concentration framework was revised in 2014. Previously, sectors were classified according to size. Under the revised sector framework, sectors are classified according to their risk (based on EC and various qualitative factors) as well as size. This classification drives the level of oversight and frequency of sector reviews. Reviews may include an assessment of business strategy, credit risk profile, key risks and mitigants, the current and expected future external environment, vulnerability to stress events, regulatory developments and economic capital usage to derive a proposed risk appetite along with transaction acceptance standards.
As a result of the reviews carried out in 2014, RBS further reduced its risk appetite in its most material corporate sector, CRE, as well as a number of other corporate sectors such as retail, leisure and oil and gas. This was in addition to the reduction of RCR exposures. For further details on sector-specific strategies, exposure reduction and key credit risks, refer to pages 247 to 269.
Product and asset class concentration framework
Product and asset class concentration risk is the risk of an outsized loss arising from a concentration in certain products or asset classes. The product and asset class framework monitors specific credit risk types such as settlement or wrong-way risk and products such as long-dated derivatives or securitisations. These product and asset classes may require specific policies and expertise as well as tailored monitoring and reporting measures. In some cases specific limits and thresholds are deployed to ensure that the credit risk inherent in these lines of business and products is adequately controlled. Exposures are reviewed regularly in accordance with the product and asset class concentration framework. The reviews consider the risks inherent in each product or asset class, the risk controls applied, monitoring and reporting of the risk, the client base, and any emerging risks to ensure risk appetite remains appropriate.
Country concentration
The country concentration framework is described in the Country risk section on pages 319 to 325.
Risk assessment
The credit risk function assesses, approves and manages the credit risk associated with a borrower or group of related borrowers.
The Group Chief Credit Officer has established a framework of individual delegated authorities, which are set out in the RBS Credit Risk Policy. The framework requires at least two individuals to approve each credit decision, one from the business and one from the credit risk function. Both must hold appropriate delegated authority, which is dependent on their experience and expertise. Only a small number of senior executives hold the highest authority provided under the framework. While both parties are accountable for the quality of each decision taken, the credit risk approver holds ultimate sanctioning authority.
Business review Capital and risk management
Assessments of credit risk must, at a minimum, specifically address the following elements:
| · | The amount, terms, tenor, structure, conditions, purpose and appropriateness of all credit facilities; |
| · | Compliance with applicable RBS-wide and/or franchise-level credit policies; |
| · | The customer’s ability to meet obligations, based on an analysis of financial information and a review of payment and covenant compliance history; |
| · | The source of repayment and the customer’s risk profile, including its sector and sensitivity to economic and market developments, and any credit risk mitigation; |
| · | Refinancing risk - the risk of loss arising from the failure of a customer to settle an obligation on expiry of a facility through the drawdown of another credit facility provided by RBS or by another lender; |
| · | Consideration of other risks such as environmental, social and ethical, regulatory and reputational risks; and |
| · | The portfolio impact of the transaction, including the impact on any credit risk concentration limits or agreed business franchise risk appetite. |
At a minimum, credit relationships are reviewed and re-approved annually. The renewal process addresses borrower performance, including reconfirmation or adjustment of risk parameter estimates; the adequacy of security; compliance with terms and conditions; and refinancing risk.
Risk mitigation
RBS mitigates credit risk through the use of netting, collateral and the use of market standard documentation.
The types of collateral RBS takes to mitigate the credit risk arising from wholesale lending varies according to the nature of the counterparty and its assets. The most common types are:
| · | Commercial real estate - Refer to CRE section on page 247. |
| · | Other physical assets - These may include stock, plant, equipment, machinery, vehicles, ships and aircraft. Such assets are suitable collateral only if RBS can identify, locate, and segregate them from other assets on which it does not have a claim. RBS values physical assets in a variety of different ways, depending on the type of asset concerned and may rely on balance sheet valuations in certain cases. |
| · | Receivables - These are amounts owed to RBS’s counterparties by their own customers. RBS values them after taking into account the quality of its counterparty’s receivable management processes and excluding any that are past due. |
| · | Financial collateral - Refer to Counterparty credit risk section on page 253. |
All collateral is assessed case-by-case to ensure that it will retain its value independently of the provider. RBS monitors the value of the collateral and, if there is a shortfall, will seek additional collateral.
Problem debt management
Early problem identification
Each segment has defined early warning indicators (EWIs) to identify customers experiencing financial difficulty, and to increase monitoring if needed. EWIs may be internal, such as a customer’s bank account activity, or external, such as a publicly-listed customer’s share price. If EWIs show a customer is experiencing potential or actual difficulty, credit officers within the business franchise may decide to place the customer on the Watchlist.
Watchlist*
For customers not managed in RCR, there are three Watch classifications - Amber, Red and Black - reflecting progressively deteriorating conditions. Watch Amber customers are performing customers who show early signs of potential financial difficulty, or have other characteristics that warrant closer monitoring. Watch Red customers are performing customers who show signs of declining creditworthiness and so require active management usually by Restructuring (formerly known as Global Restructuring Group). The Watch Black portfolio includes AQ10 exposures.
Once on the Watchlist, depending on the severity of the financial difficulty and the size of the exposure, the customer relationship strategy is reassessed by credit officers, by specialist credit risk or relationship management units in the relevant business or by Restructuring. In accordance with RBS-wide policies, a number of mandatory actions are taken, including a review of the customer’s credit grade and facility and security documentation.
In more material cases, a forum of experienced credit, portfolio management and remedial management specialists in either the relevant business or Restructuring may reassess the customer relationship strategy.
Appropriate corrective action is taken when circumstances emerge that may affect the customer’s ability to service its debt. Such circumstances include deteriorating trading performance, imminent breach of covenant, challenging macroeconomic conditions, a late payment or the expectation of a missed payment.
For all Watch Red cases, credit specialists in the relevant business are required to consult with their counterparts in Restructuring on whether the relationship should be transferred to Restructuring (for more information on Restructuring, refer to the section below). Watch Red customers that continue to be managed by the business tend to be those requiring subject matter expertise that is available in the business rather than in Restructuring.
Business review Capital and risk management
Remediation strategies available in the business include granting a customer various types of concessions. Any decision to approve a concession will be a function of specific country and sector appetite, the credit quality of the customer, the market environment and the loan structure and security. For further information, refer to the Forbearance section below.
Other potential outcomes of the relationship review are to: take the customer off the Watchlist; offer additional lending and continue monitoring; transfer the relationship to Restructuring if appropriate; or exit the relationship altogether.
Customers managed in RCR are by their nature subject to heightened scrutiny and regular review against specific disposal plans. RCR customers are separately identified in RBS’s internal Watchlist reporting, with their Watchlist classification based on asset quality.
Restructuring
Separately to the Credit Risk management function, the Restructuring team manages RBS’s wholesale problem debt portfolio in cases where its exposure to the customer exceeds £1 million. In addition, Restructuring has a specialist credit function, the Strategy Management Unit, for distressed bilateral lending where the exposure is between £250,000 and £1 million.
The factor common to all customers managed by Restructuring is that RBS’s exposure is outside risk appetite. The primary function of Restructuring is to restore customers to an acceptable credit profile, minimise losses to RBS and protect RBS’s capital.
Specialists in Restructuring work with customers experiencing financial difficulties, and showing signs of financial stress, with the aim of restoring their business to financial health whenever possible. The objective is to find a mutually acceptable solution, including repayment, refinancing or transfer to another bank if that is the customer’s preferred option.
The specialists conduct a detailed assessment of the viability of the business, as well as the ability of management to deal with the causes of financial difficulty, focusing on both financial and operational issues. Following the assessment, various options are discussed with the customer (which may involve debt restructuring or forbearance or both) and bespoke solutions are developed.
If the customer’s finances are not viable and a mutually agreed exit is not possible, insolvency may be considered as a last resort. However, helping the customer return to financial health and restoring a normal banking relationship is always the desired goal.
Forbearance
Definition
Forbearance takes place when a concession is made on the contractual terms of a loan in response to a customer’s financial difficulties.
Concessions granted where there is no evidence of financial difficulty, or where any changes to terms and conditions are within usual risk appetite (for a new customer), or reflect improving credit market conditions for the customer, are not considered forbearance.
A number of options are available. These are tailored to the customer’s individual circumstances. The aim is to restore the customer to financial health and to minimise risk to RBS. To ensure that forbearance is appropriate for the needs and financial profile of the customer, RBS applies minimum standards when assessing, recording, monitoring and reporting forbearance.
Types of wholesale forbearance
Wholesale forbearance may involve the following types of concessions:
Payment concessions and loan rescheduling, including extensions in contractual maturity, may be granted to improve the customer’s liquidity. Concessions may also be granted on the expectation that the customer’s liquidity will recover when market conditions improve. In addition, they may be granted if the customer will benefit from access to alternative sources of liquidity, such as an issue of equity capital. These options have been used in CRE transactions, particularly during periods where a shortage of market liquidity has ruled out immediate refinancing and made short-term collateral sales unattractive.
Debt may be forgiven, or exchanged for equity, where the customer’s business condition or economic environment is such that it cannot meet obligations and where other forms of forbearance are unlikely to succeed. Debt forgiveness can be used for stressed corporate transactions and are typically structured on the basis of projected cash flows from operational activities, rather than underlying tangible asset values. Provided that the underlying business model, strategy and debt level are viable, maintaining the business as a going concern is the preferred option, rather than realising the value of the underlying assets.
The contractual margin may be amended to bolster the customer’s day-to-day liquidity to help sustain its business as a going concern. This would normally be a short-term solution. As set out above, RBS would seek to obtain a return commensurate to the risk that it is required to take and this can be structured as set out above.
A temporary covenant waiver, a recalibration of covenants or a covenant amendment may be used to cure a potential or actual covenant breach. In return for this relief, RBS would seek to obtain a return commensurate with the risk that it is required to take. The increased return for the increased risk can be structured flexibly to take into account the customer’s circumstances. For example it may be structured as either increased margin on a cash or payment in kind basis, deferred return instruments or both. While RBS considers these types of concessions qualitatively different from other forms of forbearance, they constitute a significant proportion of wholesale forborne loans and are therefore included in these forbearance disclosures.
Business review Capital and risk management
Loans may be forborne more than once, generally where a temporary concession has been granted and circumstances warrant another temporary or permanent revision of the loan’s terms. All customers are assigned a PD and related facilities a LGD. These are re-assessed prior to finalising any forbearance arrangement in light of the loan’s amended terms and any revised grading is incorporated in the calculation of the impairment loss provisions for RBS’s wholesale exposures. Where forbearance is no longer viable, RBS will consider other options such as the enforcement of security, insolvency proceedings or both.
The ultimate outcome of a forbearance strategy is unknown at the time of execution. It is highly dependent on the cooperation of the borrower and the continued existence of a viable business. The following are generally considered to be options of last resort:
| · | Enforcement of security or otherwise taking control of assets - Where RBS holds collateral or other security interest and is entitled to enforce its rights, it may enforce its security or otherwise take control of the assets. The preferred strategy is to consider other possible options prior to exercising these rights. |
| · | Insolvency - Where there is no suitable forbearance option or the business is no longer sustainable, insolvency will be considered. Insolvency may be the only option that ensures that the assets of the business are properly and efficiently distributed to relevant creditors. |
Impairments for forbearance
Wholesale loans granted forbearance are individually assessed in most cases and are not therefore segregated into a separate risk pool.
Forbearance may result in the value of the outstanding debt exceeding the present value of the estimated future cash flows. This may result in the recognition of an impairment loss or a write-off.
Provisions for forborne wholesale loans are assessed in accordance with normal provisioning policies. The customer’s financial position and prospects as well as the likely effect of the forbearance, including any concessions granted, are considered in order to establish whether an impairment provision is required.
All wholesale customers are assigned a PD and related facilities a LGD. These are re-assessed prior to finalising any forbearance arrangement in light of the loan’s amended terms and any revised grading incorporated in the calculation of the impairment loss provisions for RBS’s wholesale exposures.
For performing loans, credit metrics are an integral part of the latent provision methodology and therefore the impact of covenant concessions will be reflected in the latent provision. For non-performing loans, covenant concessions will be considered in determining the overall provision for these loans.
In the case of non-performing forborne loans, the loan impairment provision assessment almost invariably takes place prior to forbearance being granted. The amount of the loan impairment provision may change once the terms of the forbearance are known, resulting in an additional provision charge or a release of the provision in the period the forbearance is granted.
The transfer of wholesale loans subject to forbearance from impaired to performing status follows assessment by relationship managers and the Credit Risk function in Restructuring. When no further losses are anticipated and the customer is expected to meet the loan’s revised terms, any provision is written-off and the balance of the loan returned to performing status. This course of action is not dependent on a specified time period and follows the credit risk manager’s assessment that it is appropriate.
Impairments
Impairments in the wholesale portfolio decreased compared with 2013. This reflected a better economic environment as well as improvements in asset values in core markets.
There was a significant amount of credit impairment release during 2014, in particular in RCR where the favourable environment and efficient deal execution supported the disposal strategy. Improved market appetite and greater liquidity was demonstrated, particularly in Ireland, where assets have been realised more quickly and at better prices, than previously anticipated.
Lower customer defaults in the business and commercial elements of PBB and CPB resulted in modest new impairments in the wholesale portfolio. The majority of provisions in the wholesale portfolio relate to CRE. For further analysis of the provisions in the CRE portfolio refer to page 247.
Business review Capital and risk management
Sector and geographical regional analyses*
The table below details CRA by sector and geographical region for the wholesale portfolio. Sectors are based on RBS’s sector concentration framework. Geographical region is based on the location of the customer’s operations (or, in the case of individuals, location of residence).
| | | Western | | | | | | | |
| | | Europe | North | Asia | Latin | | | RBS | |
| | UK | (excl. UK) | America | Pacific | America | Other (1) | Total | excluding RCR | RCR |
| 2014 | £m | £m | £m | £m | £m | £m | £m | £m | £m |
| Banks | 3,131 | 26,520 | 4,106 | 5,599 | 700 | 1,511 | 41,567 | 39,687 | 1,880 |
| Other financial institutions | 24,430 | 10,635 | 9,261 | 3,312 | 1,329 | 955 | 49,922 | 48,216 | 1,706 |
Sovereign (2) | 45,308 | 6,854 | 27,162 | 2,049 | 22 | 969 | 82,364 | 81,828 | 536 |
| Property | 44,401 | 11,858 | 6,846 | 1,035 | 254 | 587 | 64,981 | 50,160 | 14,821 |
| Natural resources | 7,825 | 4,030 | 7,070 | 3,322 | 228 | 2,135 | 24,610 | 21,700 | 2,910 |
| Manufacturing | 10,094 | 4,812 | 7,216 | 2,332 | 62 | 922 | 25,438 | 24,893 | 545 |
Transport (3) | 10,750 | 4,206 | 4,251 | 1,583 | 233 | 8,471 | 29,494 | 25,590 | 3,904 |
| Retail and leisure | 15,539 | 3,221 | 5,736 | 694 | 47 | 447 | 25,684 | 23,856 | 1,828 |
| Telecoms, media and technology | 3,099 | 1,964 | 3,923 | 1,245 | 5 | 273 | 10,509 | 10,219 | 290 |
| Business services | 16,255 | 2,182 | 6,252 | 531 | 1,224 | 304 | 26,748 | 25,721 | 1,027 |
| | 180,832 | 76,282 | 81,823 | 21,702 | 4,104 | 16,574 | 381,317 | 351,870 | 29,447 |
| | | | | | | | | | |
| | | | | | | | | RBS excluding | |
| 2013 | | | | | | | | Non-Core | Non-Core |
| Banks | 2,506 | 25,085 | 3,133 | 9,670 | 1,192 | 1,771 | 43,357 | 43,010 | 347 |
| Other financial institutions | 23,080 | 10,363 | 9,164 | 2,633 | 1,320 | 1,100 | 47,660 | 43,849 | 3,811 |
Sovereign (2) | 55,041 | 8,685 | 18,203 | 3,394 | 37 | 687 | 86,047 | 84,726 | 1,321 |
| Property | 49,639 | 18,673 | 6,206 | 929 | 286 | 795 | 76,528 | 53,569 | 22,959 |
| Natural resources | 6,698 | 4,587 | 6,189 | 3,669 | 214 | 2,087 | 23,444 | 21,412 | 2,032 |
| Manufacturing | 8,843 | 4,962 | 6,208 | 2,278 | 120 | 1,397 | 23,808 | 23,276 | 532 |
Transport (3) | 10,332 | 3,936 | 3,959 | 1,800 | 163 | 9,435 | 29,625 | 24,086 | 5,539 |
| Retail and leisure | 16,338 | 3,924 | 4,977 | 738 | 91 | 517 | 26,585 | 24,562 | 2,023 |
| Telecoms, media and technology | 3,356 | 2,591 | 3,401 | 1,403 | 29 | 491 | 11,271 | 9,810 | 1,461 |
| Business services | 16,527 | 2,733 | 6,053 | 757 | 1,233 | 206 | 27,509 | 26,518 | 991 |
| | 192,360 | 85,539 | 67,493 | 27,271 | 4,685 | 18,486 | 395,834 | 354,818 | 41,016 |
| | | | | | | | | | |
| | | | | | | | | RBS excluding | |
| 2012 | | | | | | | | Non-Core | Non-Core |
| Banks | 5,023 | 36,573 | 6,421 | 8,837 | 1,435 | 2,711 | 61,000 | 60,609 | 391 |
| Other financial institutions | 20,997 | 13,398 | 10,189 | 2,924 | 4,660 | 789 | 52,957 | 47,425 | 5,532 |
Sovereign (2) | 38,870 | 26,002 | 14,265 | 2,887 | 64 | 1,195 | 83,283 | 81,636 | 1,647 |
| Property | 54,831 | 23,220 | 7,051 | 1,149 | 2,979 | 1,280 | 90,510 | 56,566 | 33,944 |
| Natural resources | 6,103 | 5,911 | 6,758 | 4,129 | 690 | 1,500 | 25,091 | 21,877 | 3,214 |
| Manufacturing | 9,656 | 5,587 | 6,246 | 2,369 | 572 | 1,213 | 25,643 | 24,315 | 1,328 |
Transport (3) | 12,298 | 5,394 | 4,722 | 5,065 | 2,278 | 4,798 | 34,555 | 26,973 | 7,582 |
| Retail and leisure | 17,229 | 5,200 | 4,998 | 1,103 | 270 | 658 | 29,458 | 26,203 | 3,255 |
| Telecoms, media and technology | 4,787 | 3,572 | 3,188 | 1,739 | 127 | 346 | 13,759 | 10,815 | 2,944 |
| Business services | 17,089 | 3,183 | 5,999 | 581 | 780 | 154 | 27,786 | 26,190 | 1,596 |
| | 186,883 | 128,040 | 69,837 | 30,783 | 13,855 | 14,644 | 444,042 | 382,609 | 61,433 |
| (1) | Comprises Central and Eastern Europe, the Middle East, Central Asia and Africa, and supranationals such as the World Bank. |
| (2) | Includes cash held at central banks. |
| (3) | Excludes net investment in operating leases in shipping and aviation portfolios as they are accounted for as property, plant and equipment. However, operating leases are included in the monitoring and management of these portfolios. |
Business review Capital and risk management
Key points*
The revised RBS strategy and the creation of RCR as well as the general economic environment had a direct impact on the portfolios during the year, with the following key trends observed:
Financial institutions
| · | The banking sector was one of the largest in the portfolio with exposure totalling £41.6 billion. Exposures were well diversified geographically and limits are controlled through a combination of the single name concentration framework, credit policies and country limits. Overall exposure did not change materially, with the decrease in Asia Pacific (largely driven by a reduction in lending in China) partially offset by increases in North America, Western Europe and the UK. Derivatives continued to generate the largest exposure for banks (70% of credit risk assets in the banks sector). |
| · | Exposures to a range of financial companies, the largest of which were funds (26% - 25% in 2013), securitisation vehicles (19% - 22% in 2013), finance companies (17% - 14% in 2013) and financial intermediaries (16% - unchanged from 2013) including broker dealers and central counterparties (CCPs). The non-RCR other financial institutions exposure increased by 10% in 2014 driven by increased exposures to securitisation vehicles and finance companies. Product-based sub-limits were in place to ensure that exposure remained within appetite. |
| · | At the year end, the total exposure to CCPs was £5.4 billion (2013 - £4.1 billion) as regulatory initiatives encouraged the wider use of CCPs for clearing over-the-counter derivatives. |
| · | The sovereign portfolio comprised exposures to central banks, central governments and sub-sovereigns such as local authorities, primarily in the UK, US and Western Europe. Exposures to central banks were £75.3 billion at the year end, a reduction of 6% from 2013 driven by fluctuations in RBS Treasury activities. |
Property
| The majority of property exposure was CRE related in Ireland and the UK (refer to the CRE section on page 247 for further details). The remainder comprised lending to construction companies and building materials groups, which decreased by 5% (following a 15% reduction in 2013), and housing associations, which increased by 14% (2013 - 12%) and contributed to an improvement in the credit quality of the property portfolio. 23% of total property exposure was in RCR and the run-down of RCR property exposure contributed significantly to the improvement of portfolio asset quality. The CIB and CPB franchises accounted for 75% of total non-RCR property exposure. Property exposures in Ireland (including RCR) represented 12% of property CRA (down from 15% in 2013). |
Shipping
| · | RBS’s exposure to the shipping sector, which is mostly within RCR and CIB, declined 9% during the year, from £11.4 billion to £10.4 billion. The reduction was a result of scheduled loan repayments, secondary sales (RCR) and prepayments. |
| Of the total exposure to the shipping sector, £7.9 billion (2013 - £8.6 billion) related to asset-backed ocean-going vessels. £5.7 billion of the asset-backed ocean-going vessel exposures were in CIB. |
| The main concentration risks were the bulk sector which represented 38% of the portfolio; tankers at 29% and containers at 17%. The remaining exposures comprised gas, including liquid petroleum gas (10%) and others (6%). |
| Conditions remained generally subdued during 2014. There has been a recent upturn in rates for tankers due to the fall in oil prices but difficulties remained for containers due to over supply. The majority of RBS’s exposure is extended against security in vessels of recent build (average age across the portfolio of 6.4 years including RCR) with less than 3% of the CIB book being above 15 years of age. 87% of the portfolio was below 10 years. |
| A key protection for RBS is the minimum security covenant. The overall loan-to-value (LTV) on the portfolio was 77% .The LTV for the RCR portfolio was 92% and for the remaining portfolio was 73%. In the CIB portfolio, approximately 20% of the portfolio had LTVs above 100%. |
Oil and gas
| · | Within natural resources, RBS had £10.7 billion of CRA in exposure to the oil and gas sector. CRA increased by 5% (£528 million) during 2014. Further disclosures regarding exposure to this sector are detailed on page 251 |
Other corporate sectors
| · | Exposure to the manufacturing sector increased by 7% driven predominantly by increases in the industrials and agriculture sub-sectors which increased by 10% and 9% respectively during the year. |
| · | The reduction in exposure to the retail and leisure sector was in line with selective risk appetite. The reductions were predominantly in relation to Ulster Bank and CIB exposure, partially offset by modest growth in CFG in line with business strategy. The CPB retail and leisure portfolio was stable compared to last year. |
| · | Exposure in the telecoms, media and technology sector fell by 7% during the year mostly driven by a 22% reduction in telecoms. |
| · | Exposure in healthcare was £8.9 billion at the year end (2013 - £9.5 billion) with the exposure heavily biased towards the UK, which represented 69% of the exposure (70% in 2013). |
Business review Capital and risk management
AQ10 or non-performing*
| | 2014 | | 2013 | | 2012 |
| | AQ10 | | | AQ10 | | | AQ10 | |
| | RBS | | | | RBS | | | | RBS | | | |
| | excluding | | | Sector | excluding | | | Sector | excluding | | | Sector |
| | RCR | RCR | Total | assets | Non-Core | Non-Core | Total | assets | Non-Core | Non-Core | Total | assets |
| AQ10 CRA by sector | £m | £m | £m | % | £m | £m | £m | % | £m | £m | £m | % |
| Banks | 41 | 87 | 128 | 0.3 | | 76 | — | 76 | 0.2 | | 146 | — | 146 | 0.2 |
| Other financial institutions | 173 | 336 | 509 | 1.0 | | 339 | 203 | 542 | 1.1 | | 402 | 472 | 874 | 1.7 |
Sovereign (1) | 1 | — | 1 | — | | 1 | — | 1 | — | | 2 | — | 2 | — |
| Property | 2,860 | 11,885 | 14,745 | 22.7 | | 6,908 | 17,438 | 24,346 | 31.8 | | 6,424 | 19,325 | 25,749 | 28.4 |
| Natural resources | 151 | 112 | 263 | 1.1 | | 329 | 81 | 410 | 1.7 | | 115 | 134 | 249 | 1.0 |
| Manufacturing | 366 | 330 | 696 | 2.7 | | 697 | 156 | 853 | 3.6 | | 706 | 326 | 1,032 | 4.0 |
Transport (2) | 268 | 1,139 | 1,407 | 4.8 | | 1,261 | 553 | 1,814 | 6.1 | | 1,082 | 572 | 1,654 | 4.8 |
| Retail and leisure | 973 | 1,355 | 2,328 | 9.1 | | 1,820 | 1,166 | 2,986 | 11.2 | | 1,983 | 986 | 2,969 | 10.1 |
| Telecoms, media and | | | | | | | | | | | | | | |
| technology | 123 | 81 | 204 | 1.9 | | 226 | 618 | 844 | 7.5 | | 199 | 447 | 646 | 4.7 |
| Business services | 763 | 592 | 1,355 | 5.1 | | 1,421 | 298 | 1,719 | 6.2 | | 1,326 | 341 | 1,667 | 6.0 |
| | 5,719 | 15,917 | 21,636 | 5.7 | | 13,078 | 20,513 | 33,591 | 8.5 | | 12,385 | 22,603 | 34,988 | 8.0 |
| (1) | Includes cash held at central banks. |
| (2) | Excludes net investment in operating leases in shipping and aviation portfolios as they are accounted for as property, plant and equipment. However, operating leases are included in the monitoring and management of these portfolios. |
Key points
| · | The proportion of the wholesale portfolio rated AQ10 fell significantly during the year. This was driven by asset disposals as well as write-offs. |
| · | Trends in the wholesale non-performing credit risk exposures in 2014 were predominantly driven by the RCR portfolio which accounted for 74% of the AQ10 CRA. |
| · | Excluding RCR less than 2% of wholesale exposure was rated AQ10. |
| · | Property and in particular CRE continued to be the largest sector in wholesale non-performing assets - 68% of total AQ10 exposure (2013 - 73%). |
| · | Shipping represented 3.7% of wholesale non-performing assets, largely unchanged from 2013. |
| · | Wholesale non-performing assets originated in Ulster Bank (including RCR) decreased by 32%, representing 56% of total Wholesale non-performing assets (2013 - 53%). |
Business review Capital and risk management
Watchlist*
At 31 December 2014, exposures to customers reported as Watchlist Red and managed by Restructuring were £2.9 billion (2013 - £12.7 billion) and those managed in the business were £1.1 billion (2013 - £3.2 billion).
The following table shows a sector breakdown of Watchlist Red customers managed by Restructuring.
| | 2014 | 2013 | | 2012 |
| | Total | RBS | | | | RBS | | |
| | excluding | excluding | | | | excluding | | |
| | RCR | Non-Core | Non-Core | Total | | Non-Core | Non-Core | Total |
| Watchlist Red CRA by current exposure | £m | £m | £m | £m | | £m | £m | £m |
| Property | 917 | 3,178 | 1,841 | 5,019 | | 5,605 | 4,377 | 9,982 |
| Transport | 327 | 1,791 | 456 | 2,247 | | 2,238 | 478 | 2,716 |
| Retail and leisure | 386 | 1,092 | 237 | 1,329 | | 1,542 | 432 | 1,974 |
| Services | 511 | 955 | 40 | 995 | | 870 | 84 | 954 |
| Other | 758 | 2,312 | 804 | 3,116 | | 3,087 | 1,177 | 4,264 |
| Total | 2,899 | 9,328 | 3,378 | 12,706 | | 13,342 | 6,548 | 19,890 |
Key points
| · | The number of Watchlist Red customers decreased significantly in 2014 as a result of the transfer of exposures to RCR. Customers managed in RCR are subject to heightened scrutiny and regular review against specific disposal plans. A breakdown of the asset quality of the RCR portfolio is provided on page 236. |
| · | The remaining Restructuring population decreased during the year both in number and value. This reflects a reduced flow of cases into Restructuring, repayments and cases improving from Watchlist Red. |
Forbearance
The table below shows the value of loans (excluding loans where RBS has initiated recovery procedures) where forbearance was completed during the year, by sector and type.
| | 2014 | | 2013 | | 2012 |
| | | Non- | | Provision | | | Non- | | Provision | | | Non- | | Provision |
| Wholesale forbearance during | Performing | performing | Total | coverage (1) | | Performing | performing | Total | coverage (1) | Performing | performing | Total | coverage (1) |
| the year by sector | £m | £m | £m | % | | £m | £m | £m | % | £m | £m | £m | % |
| Property | 1,052 | 4,363 | 5,415 | 66 | | 1,759 | 4,802 | 6,561 | 60 | | 3,365 | 3,899 | 7,264 | 16 |
| Transport | 265 | 233 | 498 | 32 | | 1,016 | 229 | 1,245 | 34 | | 1,174 | 130 | 1,304 | 23 |
| Retail and leisure | 431 | 553 | 984 | 51 | | 455 | 390 | 845 | 37 | | 732 | 113 | 845 | 34 |
| Services | 475 | 352 | 827 | 53 | | 405 | 234 | 639 | 77 | | 324 | 51 | 375 | 30 |
| Other | 817 | 252 | 1,069 | 56 | | 670 | 510 | 1,180 | 27 | | 1,575 | 550 | 2,125 | 40 |
| | 3,040 | 5,753 | 8,793 | 62 | | 4,305 | 6,165 | 10,470 | 55 | | 7,170 | 4,743 | 11,913 | 20 |
| (1) | Provision coverage reflects impairment provision as a percentage of non-performing loans. |
Business review Capital and risk management
Forbearance arrangements
The table below shows the incidence of the main types of wholesale forbearance arrangements by loan value.
| | 2014 | 2013 | 2012 |
Wholesale forbearance during the year by arrangement type (1) | % | % | % |
| Payment concessions and loan rescheduling | 73 | 78 | 49 |
| Covenant-only concessions | 20 | 16 | 30 |
| Forgiveness of all or part of the outstanding debt | 4 | 9 | 21 |
| Variation in margin | 4 | 2 | 6 |
Other (2) | 7 | 31 | 14 |
(1) Total exceeds 100% as an individual case can involve more than one type of forbearance.
(2) The main types of ‘other’ concessions include formal ‘standstill’ agreements and release of security.
Key points
| · | Forbearance completed on loans decreased during 2014 compared with 2013. This was in line both with improving market conditions and the RCR disposal strategy. |
| · | Year-on-year analysis of forborne loans may be skewed by individual material cases during a given year. This is particularly relevant when comparing the value of forbearance completed in the property and transport sectors in 2014 with previous years. |
| · | Loans totalling £4.3 billion were granted credit approval for forbearance but had not yet reached legal completion at 31 December 2014 (2013 - £9.4 billion). These loans are referred to as “in process” and are not included in the tables above. 84% of these were non-performing loans, with associated provision coverage of 48%; and 16% were performing loans. The principal types of arrangements offered were payment concessions and loan rescheduling. |
| · | Forbearance in the transport sector was historically driven by exposure to shipping. There has been lower forbearance in the shipping portfolio in 2014 as asset values have improved, reducing the instances of minimum security covenant breaches. |
| · | The value of loans forborne during 2013 and 2014 and still outstanding at 31 December 2014 was £12.2 billion (2013 - £18.4 billion; 2012 - £17.7 billion), of which £3.4 billion related to arrangements completed during 2013 (2012 - £8.0 billion; 2011 - £9.3 billion). |
| · | Additional provisions charged in 2014 relating to loans forborne during 2013 totalled £0.6 billion, predominantly driven by RCR and Restructuring cases. Provision coverage of these loans at 31 December 2014 was 77%. |
| · | Non-RCR customers managed by Restructuring were granted forbearance on loan facilities totalling £1.3 billion during 2014. This equates to 34.1% of loans managed by Restructuring (excluding loans to customers where recovery procedures have commenced). |
| · | Of the loans granted forbearance by Restructuring (excluding those transferred to RCR) in 2013, 24% returned to performing portfolios managed by the originating businesses by 31 December 2014. Some non-forborne loans were also returned from Restructuring to performing portfolios managed by the originating businesses. |
| · | £4.8 billion of completed forbearance granted during the year was to customers managed by RCR. RCR uses forbearance as a tool to assist with the orderly realisation of assets. By value, 94% of the performing non-RCR loans granted forbearance in 2013 remained performing at 31 December 2014. |
| · | Provisions for the non-performing loans disclosed above are individually assessed and therefore not directly comparable across periods. Provision coverage increased in 2014, driven by the provision coverage level in Ulster Bank (including Ulster Bank RCR cases). |
| · | The data presented in the tables above include loans forborne during 2012 and 2013 which individually exceeded thresholds set at franchise or reportable segment level. RBS continues to refine its reporting processes for forborne loans. During 2012 the reporting threshold ranged from nil to £10 million and from 2013 until April 2014 thresholds ranged from nil to £3 million. From April 2014 no threshold were in use. |
Business review Capital and risk management
Key credit portfolios
Commercial real estate*
The commercial real estate (CRE) sector comprised exposures to entities involved in the development of, or investment in, commercial and residential properties (including house builders). The analysis of lending utilisations below is gross of impairment provisions and excludes rate risk management and contingent obligations.
During 2014, an RBS-wide centre of excellence was created to develop, implement and oversee risk management strategy for this portfolio. The centre of excellence is responsible for the management of CRE credit risk, including setting CRE-specific credit risk appetite, credit policies and portfolio controls as well as oversight of valuations, environmental and flood appraisals. This sector is reviewed regularly at the Credit Risk Committee (CRC) and Executive Risk Forum (ERF) due to its relative size and riskiness. Both CRC and ERF monitor the performance of the portfolio to ensure it remains in line with expectations relative to credit quality, capital consumption and control framework compliance.
Ongoing credit risk management is supported by dedicated credit teams covering the CPB and CIB portfolios, a team specialising in commercial and residential property developments, and senior underwriters sanctioning the most sizeable and complex CRE exposures.
| | 2014 | | 2013 | | 2012 |
| | Investment | Development | Total | | Investment | Development | Total | | Investment | Development | Total |
| By segment | £m | £m | £m | | £m | £m | £m | | £m | £m | £m |
| UK PBB | 3,757 | 501 | 4,258 | | 3,931 | 510 | 4,441 | | 4,793 | 618 | 5,411 |
| Ulster Bank | 952 | 336 | 1,288 | | 3,419 | 718 | 4,137 | | 3,575 | 729 | 4,304 |
| Personal & Business Banking | 4,709 | 837 | 5,546 | | 7,350 | 1,228 | 8,578 | | 8,368 | 1,347 | 9,715 |
| Commercial Banking | 15,145 | 2,775 | 17,920 | | 16,616 | 2,957 | 19,573 | | 17,711 | 3,473 | 21,184 |
| Private Banking | 1,051 | 244 | 1,295 | | n/a | n/a | n/a | | n/a | n/a | n/a |
| Commercial & Private Banking | 16,196 | 3,019 | 19,215 | | 16,616 | 2,957 | 19,573 | | 17,711 | 3,473 | 21,184 |
| Corporate & Institutional Banking | 721 | 255 | 976 | | 898 | 183 | 1,081 | | 1,479 | 372 | 1,851 |
| Citizens Financial Group | 5,017 | — | 5,017 | | 4,018 | — | 4,018 | | 3,857 | 3 | 3,860 |
| RCR | 6,169 | 6,394 | 12,563 | | n/a | n/a | n/a | | n/a | n/a | n/a |
| Non-Core | n/a | n/a | n/a | | 11,624 | 7,704 | 19,328 | | 17,686 | 8,744 | 26,430 |
| | 32,812 | 10,505 | 43,317 | | 40,506 | 12,072 | 52,578 | | 49,101 | 13,939 | 63,040 |
| | Investment | | Development | | | Investment | | Development | |
| | | | | | | | | RBS | | | RBS | | |
| | | | | | | | | excluding | | | excluding | | |
| | Commercial | Residential | | Commercial | Residential | Total | | RCR | RCR | | RCR | RCR | Total |
By geography (1) | £m | £m | £m | £m | £m | £m | £m | £m | £m | £m |
| 2014 | | | | | | | | | | | | | |
UK (excluding NI (2)) | 17,327 | 4,757 | | 600 | 3,446 | 26,130 | | 19,882 | 2,203 | | 3,506 | 539 | 26,130 |
Ireland (ROI and NI (2)) | 2,864 | 740 | | 1,499 | 4,469 | 9,572 | | 770 | 2,834 | | 329 | 5,639 | 9,572 |
| Western Europe (other) | 1,222 | 53 | | 189 | 24 | 1,488 | | 232 | 1,042 | | 4 | 210 | 1,488 |
| US | 4,063 | 1,358 | | — | 59 | 5,480 | | 5,376 | 45 | | 53 | 6 | 5,480 |
RoW (2) | 406 | 22 | | 34 | 185 | 647 | | 383 | 45 | | 219 | — | 647 |
| | 25,882 | 6,930 | | 2,322 | 8,183 | 43,317 | | 26,643 | 6,169 | | 4,111 | 6,394 | 43,317 |
| | | | | | | | | | | | | | |
| | | | | | | | | RBS | | | RBS | | |
| | | | | | | | | excluding | | | excluding | | |
| 2013 | | | | | | | | Non-Core | Non-Core | | Non-Core | Non-Core | |
UK (excluding NI (2)) | 20,861 | 5,008 | | 678 | 3,733 | 30,280 | | 21,297 | 4,572 | | 3,500 | 911 | 30,280 |
Ireland (ROI and NI (2)) | 4,405 | 1,028 | | 1,919 | 5,532 | 12,884 | | 2,763 | 2,670 | | 686 | 6,765 | 12,884 |
| Western Europe (other) | 4,068 | 183 | | 22 | 17 | 4,290 | | 223 | 4,028 | | 11 | 28 | 4,290 |
| US | 3,563 | 1,076 | | — | 8 | 4,647 | | 4,313 | 326 | | 8 | — | 4,647 |
RoW (2) | 314 | — | | 30 | 133 | 477 | | 286 | 28 | | 163 | — | 477 |
| | 33,211 | 7,295 | | 2,649 | 9,423 | 52,578 | | 28,882 | 11,624 | | 4,368 | 7,704 | 52,578 |
| | | | | | | | | | | | | | |
| | | | | | | | | RBS | | | RBS | | |
| | | | | | | | | excluding | | | excluding | | |
| 2012 | | | | | | | | Non-Core | Non-Core | | Non-Core | Non-Core | |
UK (excluding NI (2)) | 25,864 | 5,567 | | 839 | 4,777 | 37,047 | | 23,312 | 8,119 | | 4,184 | 1,432 | 37,047 |
Ireland (ROI and NI (2)) | 4,651 | 989 | | 2,234 | 5,712 | 13,586 | | 2,877 | 2,763 | | 665 | 7,281 | 13,586 |
| Western Europe (other) | 5,995 | 370 | | 22 | 33 | 6,420 | | 403 | 5,962 | | 24 | 31 | 6,420 |
| US | 4,230 | 981 | | — | 15 | 5,226 | | 4,629 | 582 | | 15 | — | 5,226 |
RoW (2) | 454 | — | | 65 | 242 | 761 | | 194 | 260 | | 307 | — | 761 |
| | 41,194 | 7,907 | | 3,160 | 10,779 | 63,040 | | 31,415 | 17,686 | | 5,195 | 8,744 | 63,040 |
| *unaudited | | | | | | | | | | | | | |
Business review Capital and risk management
| | UK | Ireland | Western Europe | | | |
| | (excl NI (2)) | (ROI and NI (2)) | (other) | US | RoW (2) | Total |
By sub-sector (1) | £m | £m | £m | £m | £m | £m |
| 2014 | | | | | | |
| Residential | 8,203 | 5,209 | 78 | 1,417 | 206 | 15,113 |
| Office | 3,297 | 504 | 609 | 81 | 137 | 4,628 |
| Retail | 4,909 | 809 | 173 | 157 | 91 | 6,139 |
| Industrial | 2,588 | 367 | 32 | 2 | 29 | 3,018 |
| Mixed/other | 7,133 | 2,683 | 596 | 3,823 | 184 | 14,419 |
| | 26,130 | 9,572 | 1,488 | 5,480 | 647 | 43,317 |
| | | | | | | |
| 2013 | | | | | | |
| Residential | 8,740 | 6,560 | 200 | 1,085 | 133 | 16,718 |
| Office | 4,557 | 813 | 1,439 | 32 | 121 | 6,962 |
| Retail | 6,979 | 1,501 | 967 | 84 | 73 | 9,604 |
| Industrial | 3,078 | 454 | 43 | 30 | 13 | 3,618 |
| Mixed/other | 6,926 | 3,556 | 1,641 | 3,416 | 137 | 15,676 |
| | 30,280 | 12,884 | 4,290 | 4,647 | 477 | 52,578 |
| | | | | | | |
| 2012 | | | | | | |
| Residential | 10,344 | 6,701 | 403 | 996 | 242 | 18,686 |
| Office | 6,112 | 1,132 | 1,851 | 99 | 176 | 9,370 |
| Retail | 7,529 | 1,492 | 1,450 | 117 | 129 | 10,717 |
| Industrial | 3,550 | 476 | 143 | 4 | 39 | 4,212 |
| Mixed/other | 9,512 | 3,785 | 2,573 | 4,010 | 175 | 20,055 |
| | 37,047 | 13,586 | 6,420 | 5,226 | 761 | 63,040 |
| (1) | Data at 31 December 2014 includes CRE lending from Private Banking in CPB of £1.3 billion that was excluded from 2013 and 2012 data. At 31 December 2013 CRE lending in Private Banking totalled £1.4 billion (2012 - £1.4 billion). |
| (2) | ROI: Republic of Ireland; NI: Northern Ireland; RoW: Rest of World. |
Key points
| · | The overall gross lending exposure to CRE fell by £9.3 billion (18%) to £43.3 billion. Most of the decrease occurred in RCR exposure originated by Ulster Bank, CPB and CIB and was due to repayments, asset sales and write-offs. |
| · | The RCR portfolio of £12.6 billion represented 29% of the RBS CRE portfolio. Geographically, 67% of the RCR portfolio was held in Ireland, 22% in the UK, 10% in Western Europe and 1% in the US and the rest of world. |
| · | The increase in US exposure was predominantly driven by improved economic conditions, which contributed to increased business volumes in CFG, in line with risk appetite and business strategy. |
Business review Capital and risk management
| | | | | | Corporate & | Citizens | | |
| | | Ulster | Commercial | Private | Institutional | Financial | | |
| | UK PBB | Bank | Banking | Banking | Banking | Group | RCR | Total |
| Maturity profile of portfolio | £m | £m | £m | £m | £m | £m | £m | £m |
| 2014 | | | | | | | | |
1 year (1) | 808 | 493 | 4,297 | 495 | 122 | 857 | 9,318 | 16,390 |
| 1-2 years | 299 | 63 | 2,730 | 228 | 140 | 988 | 1,629 | 6,077 |
| 2-3 years | 575 | 58 | 2,516 | 181 | 80 | 940 | 463 | 4,813 |
| > 3 years | 2,552 | 627 | 8,081 | 391 | 623 | 2,232 | 858 | 15,364 |
Not classified (2) | 24 | 47 | 296 | — | 11 | — | 295 | 673 |
| | 4,258 | 1,288 | 17,920 | 1,295 | 976 | 5,017 | 12,563 | 43,317 |
| | | | | | | | | |
| 2013 | | | | | | | Non-Core | |
1 year (1) | 821 | 2,740 | 5,995 | n/a | 469 | 602 | 14,860 | 25,487 |
| 1-2 years | 427 | 360 | 3,009 | n/a | 203 | 669 | 1,891 | 6,559 |
| 2-3 years | 490 | 177 | 4,231 | n/a | 123 | 739 | 474 | 6,234 |
| > 3 years | 2,680 | 860 | 5,941 | n/a | 286 | 2,008 | 1,968 | 13,743 |
Not classified (2) | 23 | — | 397 | n/a | — | — | 135 | 555 |
| | 4,441 | 4,137 | 19,573 | n/a | 1,081 | 4,018 | 19,328 | 52,578 |
| | | | | | | | | |
| 2012 | | | | | | | Non-Core | |
1 year (1) | 1,501 | 3,000 | 7,138 | n/a | 275 | 797 | 16,335 | 29,046 |
| 1-2 years | 449 | 284 | 3,550 | n/a | 413 | 801 | 5,225 | 10,722 |
| 2-3 years | 410 | 215 | 3,407 | n/a | 505 | 667 | 1,317 | 6,521 |
| > 3 years | 2,861 | 805 | 6,736 | n/a | 658 | 1,595 | 3,339 | 15,994 |
Not classified (2) | 190 | — | 353 | n/a | — | — | 214 | 757 |
| | 5,411 | 4,304 | 21,184 | n/a | 1,851 | 3,860 | 26,430 | 63,040 |
| (1) | Includes on-demand and past-due assets. |
| (2) | Predominantly comprises overdrafts for which there is no single maturity date. |
| (3) | The UK PBB portfolio comprises Business Banking and Williams & Glyn CRE exposure. Williams & Glyn accounts for £3.3 billion (79%). |
Key points
| The overall maturity profile has changed, with the proportion of short-term (1 year) maturities reducing in favour of more medium term (> 3 years) maturities. This reflected the reductions in RCR as well as new lending activity in Commercial Banking and CFG. |
| · | Reductions in the Ulster Bank less than one year band between 2013 and 2014 are predominantly the result of transfers to RCR. |
| | | | | | | | |
| | AQ1-AQ2 | AQ3-AQ4 | AQ5-AQ6 | AQ7-AQ8 | AQ9 | AQ10 | Total |
| By asset quality band | £m | £m | £m | £m | £m | £m | £m |
| 2014 | | | | | | | |
| RBS excluding RCR | 758 | 9,431 | 13,857 | 3,873 | 215 | 2,620 | 30,754 |
| RCR | — | 228 | 556 | 502 | 87 | 11,190 | 12,563 |
| | 758 | 9,659 | 14,413 | 4,375 | 302 | 13,810 | 43,317 |
| | | | | | | | |
| 2013 | | | | | | | |
| RBS excluding Non-Core | 441 | 7,801 | 13,396 | 5,199 | 665 | 5,748 | 33,250 |
| Non-Core | — | 376 | 1,433 | 1,341 | 176 | 16,002 | 19,328 |
| | 441 | 8,177 | 14,829 | 6,540 | 841 | 21,750 | 52,578 |
| | | | | | | | |
| 2012 | | | | | | | |
| RBS excluding Non-Core | 767 | 6,011 | 16,592 | 6,575 | 1,283 | 5,382 | 36,610 |
| Non-Core | 177 | 578 | 3,680 | 3,200 | 1,029 | 17,766 | 26,430 |
| | 944 | 6,589 | 20,272 | 9,775 | 2,312 | 23,148 | 63,040 |
Key points
| · | The overall asset quality of the portfolio has improved, including a significant reduction in the proportion rated AQ10. This was a result of reductions in RCR, improving general market conditions and the quality of new lending activity which is subject to the policies and controls put in place in recent years. |
| · | The increase in AQ3-AQ4 exposure was predominantly driven by new lending in CFG and Commercial Banking. |
Business review Capital and risk management
Credit risk mitigation for commercial real estate
The market value of the collateral typically exceeds the loan amount at origination date. The market value is defined as the estimated amount for which the asset could be sold in an arm’s length transaction by a willing seller to a willing buyer. External valuations for CRE lending are required at the inception of the loan. In addition to external valuations at inception, RBS uses a range of other types of information to value such collateral, including expert judgement and indices. External valuations may be sought should an adverse credit event occur - this requirement is assessed as part of the Watchlist process. The table below shows CRE (Non-RCR and RCR) lending split by loan-to-value ratio, which represents loan value before provisions relative to the value of the property financed.
| | RCR | | RBS excluding RCR | | Total |
| Commercial real estate | Performing | Non-performing | Total | | Performing | Non-performing | Total | | Performing | Non-performing | Total |
| loan-to-value ratio | £m | £m | £m | £m | £m | £m | £m | £m | £m |
| 2014 | | | | | | | | | | | |
| <= 50% | 300 | 45 | 345 | | 9,833 | 220 | 10,053 | | 10,133 | 265 | 10,398 |
| > 50% and <= 70% | 602 | 173 | 775 | | 8,750 | 301 | 9,051 | | 9,352 | 474 | 9,826 |
| > 70% and <= 90% | 220 | 554 | 774 | | 2,285 | 409 | 2,694 | | 2,505 | 963 | 3,468 |
| > 90% and <= 100% | 41 | 116 | 157 | | 343 | 134 | 477 | | 384 | 250 | 634 |
| > 100% and <= 110% | 56 | 211 | 267 | | 168 | 148 | 316 | | 224 | 359 | 583 |
| > 110% and <= 130% | 49 | 438 | 487 | | 326 | 201 | 527 | | 375 | 639 | 1,014 |
| > 130% and <= 150% | 6 | 404 | 410 | | 135 | 128 | 263 | | 141 | 532 | 673 |
| > 150% | 65 | 4,160 | 4,225 | | 305 | 495 | 800 | | 370 | 4,655 | 5,025 |
| Total with LTVs | 1,339 | 6,101 | 7,440 | | 22,145 | 2,036 | 24,181 | | 23,484 | 8,137 | 31,621 |
Minimal security (1) | — | 3,168 | 3,168 | | 33 | 38 | 71 | | 33 | 3,206 | 3,239 |
| Other | 34 | 1,921 | 1,955 | | 5,956 | 546 | 6,502 | | 5,990 | 2,467 | 8,457 |
| Total | 1,373 | 11,190 | 12,563 | | 28,134 | 2,620 | 30,754 | | 29,507 | 13,810 | 43,317 |
| | | | | | | | | | | | |
Total portfolio average LTV (2) | 75% | 338% | 291% | | 56% | 133% | 62% | | 57% | 287% | 116% |
| | | | | | | | | | | | |
| 2013 | Non-Core | | RBS excluding Non-Core | | Total |
| <= 50% | 419 | 142 | 561 | | 7,589 | 143 | 7,732 | | 8,008 | 285 | 8,293 |
| > 50% and <= 70% | 867 | 299 | 1,166 | | 9,366 | 338 | 9,704 | | 10,233 | 637 | 10,870 |
| > 70% and <= 90% | 1,349 | 956 | 2,305 | | 2,632 | 405 | 3,037 | | 3,981 | 1,361 | 5,342 |
| > 90% and <= 100% | 155 | 227 | 382 | | 796 | 295 | 1,091 | | 951 | 522 | 1,473 |
| > 100% and <= 110% | 168 | 512 | 680 | | 643 | 327 | 970 | | 811 | 839 | 1,650 |
| > 110% and <= 130% | 127 | 1,195 | 1,322 | | 444 | 505 | 949 | | 571 | 1,700 | 2,271 |
| > 130% and <= 150% | 13 | 703 | 716 | | 356 | 896 | 1,252 | | 369 | 1,599 | 1,968 |
| > 150% | 69 | 7,503 | 7,572 | | 400 | 1,864 | 2,264 | | 469 | 9,367 | 9,836 |
| Total with LTVs | 3,167 | 11,537 | 14,704 | | 22,226 | 4,773 | 26,999 | | 25,393 | 16,310 | 41,703 |
Minimal security (1) | 51 | 3,069 | 3,120 | | 9 | 88 | 97 | | 60 | 3,157 | 3,217 |
| Other | 108 | 1,396 | 1,504 | | 5,266 | 888 | 6,154 | | 5,374 | 2,284 | 7,658 |
| Total | 3,326 | 16,002 | 19,328 | | 27,501 | 5,749 | 33,250 | | 30,827 | 21,751 | 52,578 |
| | | | | | | | | | | | |
Total portfolio average LTV (2) | 75% | 292% | 245% | | 64% | 187% | 85% | | 65% | 261% | 142% |
| | | | | | | | | | | | |
| 2012 | | | | | | | | | | | |
| <= 50% | 727 | 142 | 869 | | 6,624 | 157 | 6,781 | | 7,351 | 299 | 7,650 |
| > 50% and <= 70% | 2,231 | 708 | 2,939 | | 10,239 | 346 | 10,585 | | 12,470 | 1,054 | 13,524 |
| > 70% and <= 90% | 3,038 | 750 | 3,788 | | 3,802 | 456 | 4,258 | | 6,840 | 1,206 | 8,046 |
| > 90% and <= 100% | 711 | 1,570 | 2,281 | | 1,235 | 712 | 1,947 | | 1,946 | 2,282 | 4,228 |
| > 100% and <= 110% | 295 | 1,635 | 1,930 | | 835 | 357 | 1,192 | | 1,130 | 1,992 | 3,122 |
| > 110% and <= 130% | 599 | 1,078 | 1,677 | | 642 | 610 | 1,252 | | 1,241 | 1,688 | 2,929 |
| > 130% and <= 150% | 263 | 1,261 | 1,524 | | 412 | 426 | 838 | | 675 | 1,687 | 2,362 |
| > 150% | 569 | 7,841 | 8,410 | | 1,026 | 1,471 | 2,497 | | 1,595 | 9,312 | 10,907 |
| Total with LTVs | 8,433 | 14,985 | 23,418 | | 24,815 | 4,535 | 29,350 | | 33,248 | 19,520 | 52,768 |
Minimal security (1) | 7 | 1,573 | 1,580 | | 4 | 55 | 59 | | 11 | 1,628 | 1,639 |
| Other | 225 | 1,207 | 1,432 | | 6,406 | 795 | 7,201 | | 6,631 | 2,002 | 8,633 |
| Total | 8,665 | 17,765 | 26,430 | | 31,225 | 5,385 | 36,610 | | 39,890 | 23,150 | 63,040 |
| | | | | | | | | | | | |
Total portfolio average LTV (2) | 84% | 223% | 173% | | 67% | 148% | 80% | | 71% | 206% | 122% |
| | | | | | | | | | | | |
| (1) | Total portfolio average LTV is quoted net of loans with minimal security given that the anticipated recovery rate is less than 10%. Provisions are marked against these loans where required to reflect the relevant asset quality and recovery profile. |
| (2) | Weighted average by exposure. |
Business review Capital and risk management
Key points
| · | The average LTV for the performing book improved from 65% to 57% over the past year. The LTV for the performing portfolio in the UK was 56%. The reductions in the higher LTV bands occurred mainly in the RCR book originated by Ulster Bank and CIB, reflecting reductions through repayments, asset sales and write-offs. |
| · | Interest on performing investment property secured loans was covered 1.6x and 2.9x within RCR and RBS excluding RCR, respectively. Performing loans include general corporate loans, typically unsecured, to CRE companies (including real estate investment trusts), and major UK house builders, in addition to facilities supported by guarantees. The credit quality of these exposures was consistent with that of the performing portfolio overall. Non-performing loans are subject to standard provisioning policies. |
Credit quality
Credit quality metrics relating to CRE lending were as follows:
| | Total | | RCR | Non-Core |
| | 2014 | 2013 | 2012 | | 2014 | 2013 | 2012 |
| Lending (gross) | £43,317m | £52,578m | £63,040m | | £12,563m | £19,328m | £26,430m |
| Of which REIL | £13,345m | £20,129m | £22,108m | | £11,112m | £14,305m | £17,052m |
| Provisions | £9,027m | £13,209m | £10,077m | | £8,067m | £10,639m | £8,349m |
| REIL as a % of gross loans to customers | 30.8% | 38.3% | 35.1% | | 88.5% | 74.0% | 64.5% |
| Provisions as a % of REIL | 68% | 66% | 46% | | 73% | 74% | 49% |
| (1) | Excludes property related lending to customers in other sectors managed by Real Estate Finance. |
| (2) | Data at 31 December 2014 includes CRE lending from Private Banking in CPB of £1.3 billion that was excluded from 2013 and 2012 data. At 31 December 2013 CRE lending in Private Banking totalled £1.4 billion (2012 - £1.4 billion). |
| Corporate risk elements in lending and potential problem loans | | | | | | |
| (excluding CRE) | | | | | | | | |
| | 2014 | | 2013 | | 2012 |
| | Loans | Provisions | | Loans | Provisions | | Loans | Provisions |
| | £m | £m | £m | £m | £m | £m |
| Secured | 5,082 | 3,109 | | 7,686 | 4,347 | | 9,936 | 4,704 |
| Unsecured | 1,953 | 1,365 | | 2,496 | 1,685 | | 1,894 | 1,170 |
Oil and gas*
RBS has £10.7 billion of credit risk assets (CRA) to the oil and gas sector. Including committed but undrawn facilities, the exposure to the sector is £24.1 billion.
The price of crude oil is subject to global demand and supply factors and therefore determined globally. It has fallen by more than 50% since June 2014. This steep decline has been driven by excess supply fears resulting from a combination of factors. These include the growth in US shale production and OPEC maintaining current production levels, as well as weaker demand in Europe and slower growth in China.
The price of natural gas is determined regionally. US natural gas prices have been relatively stable compared with the recent price of crude oil. The price of natural gas is not highly correlated to oil prices.
Exposures to this sector continue to be closely managed through the sector concentration framework and through ongoing customer and sub-sector reviews including stress testing. Risk appetite to the overall oil and gas sector was reduced during 2014. Further action is ongoing to mitigate exposure where possible.
*unaudited
Business review Capital and risk management
The table below provides a breakdown of oil and gas sector exposure on both a CRA basis and total exposure (including committed but undrawn exposure and contingent obligations) basis by business segment.
| | 2014 | | 2013 |
| | CRA | | Total | | CRA | | Total |
| | £m | % | | £m | % | | £m | % | | £m | % |
| Commercial Banking | 671 | 6 | | 1,035 | 4 | | 772 | 8 | | 1,203 | 5 |
| Corporate & Institutional Banking | 8,297 | 78 | | 20,278 | 84 | | 8,264 | 82 | | 20,924 | 88 |
| Citizens Financial Group | 1,251 | 12 | | 2,134 | 9 | | 819 | 8 | | 1,284 | 5 |
| Others | 101 | 1 | | 243 | 1 | | 144 | 1 | | 276 | 1 |
| RCR | 352 | 3 | | 457 | 2 | | 145 | 1 | | 147 | 1 |
| | 10,672 | 100 | | 24,147 | 100 | | 10,144 | 100 | | 23,834 | 100 |
| | | | | | | | | | | | |
| Of which: lending exposure | 7,744 | 73 | | 17,695 | 73 | | 6,996 | 69 | | 16,693 | 70 |
During 2014, CFG’s exposure to this sector increased, partly due to the transfer of £0.4 billion (total exposure) of oil and gas exposures from CIB.
The committed lending exposure included legal commitments to syndicated bank facilities, with tenors up to five years. These committed facilities are for general corporate purposes including funding of operating needs and capital expenditures. These facilities are available as long as counterparties remain compliant with the terms of the credit agreement. Contingent obligations relate to guarantees, letters of credit and suretyships provided to customers.
RBS had no high-yield bond underwriting positions as at 31 December 2014; it had a simple sub investment grade loan underwriting of £55 million ($86 million) in the Americas which, subsequent to year end, had been syndicated.
At the year end, RBS’s exposure to commodities financing was £1.0 billion, predominantly in relation to oil (£0.7 billion), metals (£0.2 billion) and coal (£0.1 billion).
CIB oil and gas*
Sub-sector and geography
The tables below provide a breakdown of CIB’s oil and gas sector exposure - which represents 84% of RBS’s exposure to this sector (including committed but undrawn exposure) - split by sub-sector and geography. The analysis is based on RBS’s sector concentration framework.
| | | Western | | | | | |
| | | Europe | North | Asia | Latin | | |
| | UK | (excl. UK) | America | Pacific | America | CEEMA(1) | Total |
| 2014 | £m | £m | £m | £m | £m | £m | £m |
| Producers (incl. integrated oil companies) | 833 | 1,101 | 4,822 | 263 | 115 | 848 | 7,982 |
| Oilfield service providers | 153 | 675 | 1,007 | 742 | — | 535 | 3,112 |
| Other wholesale and trading activities | 295 | 794 | 683 | 907 | — | 122 | 2,801 |
| Refineries | 1 | 177 | 2,700 | 591 | 141 | 67 | 3,677 |
| Pipelines | 96 | 48 | 2,359 | 49 | 33 | 121 | 2,706 |
| | 1,378 | 2,795 | 11,571 | 2,552 | 289 | 1,693 | 20,278 |
| | | | | | | | |
| Including committed undrawn exposures | | | | | | | |
| Of which: exploration and production | 145 | 3 | 3,118 | 115 | 150 | 37 | 3,568 |
| 2013 | | | | | | | |
| Producers (incl. integrated oil companies) | 748 | 1,065 | 5,333 | 459 | 5 | 748 | 8,358 |
| Oilfield service providers | 180 | 835 | 1,078 | 507 | 61 | 323 | 2,984 |
| Other wholesale and trading activities | 297 | 915 | 553 | 893 | — | 147 | 2,805 |
| Refineries | 1 | 135 | 2,203 | 993 | 131 | 231 | 3,694 |
| Pipelines | 188 | 95 | 2,563 | 41 | — | 196 | 3,083 |
| | 1,414 | 3,045 | 11,730 | 2,893 | 197 | 1,645 | 20,924 |
| (1) | Includes exposures to Central and Eastern Europe as well as the Middle East and Africa. |
Business review Capital and risk management
The sub-sector within which a customer operates is a primary consideration for assessing the credit risk of a customer. Current areas of focus are towards customers involved in exploration and production principally in producers (E&P) and oilfield service providers (OFS). E&P customers represent approximately 18% of CIB’s exposure to the oil and gas sector and OFS customers represent 15%.
E&P is most immediately exposed to the oil price decline and E&P companies are the primary customers for the service providers and are experiencing an adverse impact on their financial performance from a reduced level of contracts and lower contract rates as well as pressure to re-price existing services.
The other principal components of RBS’s exposure to producers are Integrated Oil Companies (IOC) and National Oil Companies (NOC). IOC and NOC are less vulnerable to the oil price decline due to scale, diversification and in the case of NOC, explicit support from governments.
Asset quality
The table below provides a breakdown of the asset quality of CIB’s oil and gas sector portfolios.
| | | 2014 |
| Asset quality - AQ band | | £m | % |
| AQ1 | 3,948 | 20 |
| AQ2 | 1,999 | 10 |
| AQ3 | 3,455 | 17 |
| AQ4 | 7,521 | 37 |
| AQ5 | 2,035 | 10 |
| AQ6 | 1,025 | 5 |
| AQ7 | 293 | 1 |
| Other | 2 | — |
| | 20,278 | 100 |
At the year end 83%, of the portfolio exposure was investment grade (AQ1-AQ4).
The impact of continuing low oil prices on the credit quality of the portfolio is subject to ongoing review, including stress testing. RBS is in regular contact with customers to understand the impacts on them of a sustained low oil price. This activity is backed up by a suite of early warning indicators used to identify customers who may be experiencing financial difficulty.
At the year end, the proportion of RBS’s total oil and gas portfolio, excluding RCR, designated as Watchlist Red (performing customers who show signs of declining creditworthiness and so require active management) was 0.4%, of which 0.02% was managed by Restructuring.
Counterparty credit risk
RBS mitigates counterparty credit risk arising from both derivatives and repurchase agreements through the use of netting, collateral and market standard documentation.
Amounts owed by RBS to a counterparty are netted against amounts the same counterparty owes it, in accordance with relevant regulatory and internal policies. However, generally, this is only done if a netting and collateral agreement is in place as well as a legal opinion to the effect that the agreement is enforceable in the relevant jurisdictions.
Collateral may consist of either cash or securities. In the case of derivatives, collateral generally takes the form of cash. In the case of securities financing transactions, collateral usually takes the form of debt and, to a much lesser extent, equity securities at the outset. However, if the value of collateral falls relative to that of the obligation, RBS may require additional collateral in the form of cash (variation margin). The vast majority of agreements are subject to daily collateral calls with collateral valued using RBS’s internal valuation methodologies.
Industry standard documentation, such as master repurchase agreements and credit support annexes accompanied by legal opinion, is used for financial collateral taken as part of trading activities.
RBS limits counterparty credit exposures by setting limits which take into account the potential adverse movement of an exposure after adjusting for the impact of netting and collateral where applicable.
| | | | |
| | 2014 | 2013 | 2012 |
| Mitigation of counterparty credit risk | £bn | £bn | £bn |
| Reverse repurchase agreements | 64.7 | 76.5 | 104.8 |
Securities received as collateral (1,2) | (64.7) | (76.4) | (104.7) |
| | | | |
| Derivative assets gross exposure | 354.0 | 288.0 | 441.9 |
| Counterparty netting | (295.3) | (241.3) | (374.9) |
Cash collateral held (2) | (33.3) | (24.4) | (34.3) |
Securities received as collateral (2) | (7.0) | (6.0) | (5.6) |
| (1) | In accordance with normal market practice, at 31 December 2014 £60.2 billion (2013 - £63.7 billion; 2012 - £100.7 billion) had been resold or re-pledged as collateral for RBS's own transactions. |
*unaudited
Business review Capital and risk management
Personal credit risk management
Personal credit risk management focuses on RBS’s personal customers in UK PBB, Ulster Bank and CFG as well as personal lending activities in Private Banking.
Risk appetite
RBS uses a product and asset class framework to control credit risk for its personal businesses. The framework sets limits that measure and control, for each relevant franchise or reportable segment, the quality of both existing and new business. The actual performance of each portfolio is tracked relative to these limits and action taken where necessary. These limits apply to a range of credit risk related measures including expected loss of the portfolio, the expected loss in a given stress scenario, projected credit default rates and the LTV of personal mortgage portfolios.
Risk assessment
Personal lending entails making a large number of small-value loans. To ensure that these lending decisions are made consistently, RBS analyses credit information, including the historical debt servicing behaviour of customers with respect to both RBS and their other lenders. RBS then sets its lending rules accordingly, developing different rules for different products. The process is then largely automated, with customers receiving a credit score that reflects a comparison of their credit profile with the rule set. However, for relatively high-value, complex personal loans, including some residential mortgage lending, specialist credit managers make the final lending decisions.
Risk mitigation
RBS takes collateral in the form of residential property to mitigate the credit risk arising from mortgages and home equity lending. RBS values residential property during the loan underwriting process by either appraising properties individually or valuing them collectively using statistically valid models. RBS updates residential property values quarterly using the relevant residential property index, namely the Halifax Quarterly Regional House Price Index in the UK, the Case-Shiller Home Price Index in the US, the Central Statistics Office Residential Property Price Index in the ROI, and the Nationwide House Price Index in Northern Ireland. For automobile lending in the US, new vehicles are valued at cost and used vehicles at the average trade-in value.
Problem debt management
Collections
Collections functions in each of RBS’s personal businesses provide support to customers who cannot meet their obligations to RBS. Such customers may miss a payment on their loan, borrow more than their agreed limit, or ask for help. Dedicated support teams are also in place to identify and help customers who have not yet missed a payment but may be facing financial difficulty. The collections function may use a range of tools to initiate contact with such customers, establish the cause of their financial difficulty and support them where possible. In the process, they may consider granting the customer forbearance.
Additionally, in the UK and Ireland support is provided to customers with unsecured loans who establish a repayment plan with RBS through a debt advice agency or a self-help tool. Such “breathing space” suspends collections activity for a 30-day period to allow time for the repayment plan to be put in place. Arrears continue to accrue for customer loans granted breathing space.
If collections strategies are unsuccessful the relationship is transferred to the recoveries team. For further details on recoveries, refer to the following pages.
Forbearance
Definition
Forbearance takes place when a concession is made on the contractual terms of a loan in response to a customer's financial difficulties. It is granted either permanently or temporarily, following an assessment of the customer's circumstances.
Identification
Customers who contact RBS directly because of financial difficulties, or who are already in payment arrears, may be granted forbearance. In the course of assisting customers, more than one forbearance treatment may be granted.
Types of personal forbearance
Forbearance is granted principally to customers with mortgages and less frequently to customers with unsecured loans.
Mortgage portfolios
Forbearance options include, but are not limited:
| · | Payment concessions - A temporary reduction in, or elimination of, the periodic (usually monthly) loan repayment is agreed with the customer. At the end of the concessionary period, forborne principal and accrued interest outstanding is scheduled for repayment over an agreed period. Ulster Bank and CFG also offer payment concessions in the form of discounted interest rates that involve the forgiveness of some interest. |
| · | Capitalisation of arrears - The customer repays the arrears over the remaining term of the mortgage and returns to an up-to-date position. |
| · | Term extensions - The maturity date of the loan is extended. |
| · | Interest only conversions - The loan converts from principal and interest repayment to interest only repayment on a permanent or, in Ulster Bank only, temporary basis. |
Business review Capital and risk management
Unsecured portfolios
Types of forbearance offered in the unsecured portfolios vary by reportable segment.
Monitoring of forbearance
Forborne loans may be either performing or impaired and are subject to the same impairment triggers as the rest of the portfolio (refer to impairment section). A loan is deemed impaired if the borrower has failed to make repayments of principal, payments of interest or both for 90 days or more, or in the case of forborne loans, the borrower has been granted a payment concession such as interest forgiveness.
The granting of forbearance does not generally change the delinquency status of the loan affected. An exception is a loan for which RBS has agreed to capitalise arrears. Capitalisation of principal and interest in arrears brings the loan up to date. If it remains up to date for six months and is deemed likely to continue to do so, it is transferred to the performing book. In Ulster Bank, if a customer makes payments that reduce loan arrears below 90 days, the loan is transferred to the performing book. In addition, a small portfolio of loans past due 90 days is managed by PBB’s collections function. Loans in this portfolio may also be transferred to the performing book if the customer makes payments that reduce arrears below 90 days. In CFG, all forborne loans are included in the non-performing book regardless of whether or not RBS has agreed to capitalise interest past due for 90 days or more.
Mortgages granted forbearance are reviewed regularly to ensure that customers are meeting the agreed terms. Key metrics have been developed to record the proportion of loans that fail to meet the agreed terms over time, as well as the proportion of loans that return to performing with no arrears. Personal forbearance loans can be modified more than once.
Impairments for forbearance
Performing loans in UK PBB and Ulster Bank are subject to a latent loss provision but form a separate risk pool (for 24 months in UK PBB and for the period of forbearance in Ulster Bank). The higher of the observed default rates, or PD, is used in UK PBB in the latent provisioning calculations for these loans to ensure that appropriate provision is held. In Ulster Bank, the PD model used in latent provision calculations is calibrated separately for forborne loans, using information on the historic performance of loans subject to similar arrangements. Furthermore, for these portfolios the latent provision incorporates extended emergence periods. Once such loans are no longer separately identified, the use of account level PDs, refreshed monthly in the latent provision methodology, captures the underlying credit risk without a material time lag. There is no reassessment of the PD at the time forbearance is granted but the loan is subject to the latent provisioning methodology described above.
Provisions for all non-performing personal loans are collectively assessed. The loans are grouped by asset type. Characteristics such as LTVs, arrears status and default vintage are also considered when assessing recoverable amount and calculating the related provision requirement. Ulster Bank personal non-performing loans in the Republic of Ireland form a separate risk pool where specific LGDs are allocated using observed performance of these loans. While non-performing forbearance personal loans in the UK (10% of portfolio) do not form a separate risk pool, the LGD models used to calculate the collective impairment provision are affected by forbearance agreements.
In CFG, personal loans subject to forbearance are assessed individually, taking into account the value of any collateral, for impairment loss throughout their lives until repaid or fully written off. If there is no collateral the impairment amount considers the excess of the loans’ carrying amount over the present value of expected future cash flows. Any confirmed losses are charged off immediately.
Recoveries
Once a loan has been identified as impaired it is managed by recoveries teams in the relevant businesses. They seek to reduce RBS’s loss by maximising cash recovery while treating customers fairly. Where an acceptable repayment arrangement cannot be agreed with the customer litigation may be considered. In the UK and Northern Ireland, no repossession procedures are initiated until at least six months following the emergence of arrears (in the Republic of Ireland, regulations prohibit taking legal action for an extended period). Additionally, certain forbearance options are made available to customers managed by the recoveries function.
Impairments
Impairments in the personal portfolios decreased compared with 2013. Ulster Bank was a significant driver of this decrease as a result of the better economic environment and higher asset prices, which led to the release of credit impairments during the year. Outside of Ulster Bank, impairments in the UK portfolio decreased which also saw provision releases owing to rising asset prices and strong recoveries. The level of new impairments in the UK portfolio decreased by 26% compared to 2013.
Business review Capital and risk management
Key portfolios
Overview of personal portfolios split by product type and segment*
| | 2014 | | 2013 |
| | | | Private | | | | | | Private | | |
| | UK PBB | Ulster Bank | Banking | CFG | Total | | UK PBB | Ulster Bank | Banking | CFG | Total |
| | £m | £m | £m | £m | £m | | £m | £m | £m | £m | £m |
Mortgages (1) | 103,235 | 17,506 | 8,889 | 21,122 | 150,752 | | 99,338 | 19,034 | 8,701 | 19,584 | 146,657 |
| of which: interest only | 24,287 | 1,263 | 6,357 | 9,929 | 41,836 | | 25,439 | 2,069 | 5,968 | 9,272 | 42,748 |
| buy-to-let | 11,602 | 2,091 | 1,388 | 147 | 15,228 | | 9,073 | 2,242 | 1,024 | 241 | 12,580 |
| forbearance | 4,873 | 3,880 | 100 | 409 | 9,262 | | 5,446 | 2,782 | 127 | 373�� | 8,728 |
| | | | | | | | | | | | |
Other lending (2) | 12,335 | 591 | 5,186 | 10,924 | 29,036 | | 13,760 | 740 | 5,353 | 8,302 | 28,155 |
| of which: credit cards | 4,951 | 192 | 124 | 952 | 6,219 | | 5,766 | 212 | 129 | 945 | 7,052 |
loans | 5,020 | 322 | 4,298 | 1,933 | 11,573 | | 5,357 | 421 | 4,656 | 1,712 | 12,146 |
| overdrafts | 2,364 | 77 | 365 | 91 | 2,897 | | 2,637 | 107 | 355 | 100 | 3,199 |
| auto loans | — | — | — | 7,947 | 7,947 | | — | — | — | 5,545 | 5,545 |
| Total | 115,570 | 18,097 | 14,075 | 32,046 | 179,788 | | 113,098 | 19,774 | 14,054 | 27,886 | 174,812 |
| Non-performing % | 3.3% | 20.3% | 1.0% | 1.4% | 4.5% | | 3.9% | 18.3% | 0.7% | 1.5% | 4.9% |
| (1) | It is possible for a mortgage loan to appear in more than one category. |
| (2) | There are other less material categories of personal lending not listed. |
Overview of impairments and REIL
| | 2014 | | 2013 |
| | | | Private | | | | | Private | |
| | UK PBB | Ulster Bank | Banking | CFG | | UK PBB | Ulster Bank | Banking | CFG |
| Loan impairment charge as a % of gross customer loans | | | | | | | | | |
| and advances | | | | | | | | | |
| Mortgages | — | (1.0%) | 0.1% | 0.2% | | — | 1.2% | — | 0.5% |
| Other lending | 2.0% | 2.9% | (0.1%) | 0.8% | | 1.8% | 2.2% | 0.6% | 1.0% |
| | | | | | | | | | |
| Loan impairment provisions (£m) | | | | | | | | | |
| Mortgages | 217 | 1,413 | 27 | 146 | | 259 | 1,726 | 33 | 123 |
| Other lending | 1,515 | 104 | 35 | 49 | | 1,671 | 187 | 50 | 33 |
| | | | | | | | | | |
| Risk elements in lending (£m) | | | | | | | | | |
| Mortgages | 1,218 | 3,362 | 95 | 949 | | 1,702 | 3,235 | 116 | 761 |
| Other lending | 1,520 | 110 | 80 | 195 | | 1,863 | 193 | 80 | 148 |
*unaudited
Business review Capital and risk management
UK PBB
Overview
The majority of the UK PBB personal portfolio consists of mortgages. Total gross personal lending of £115.6 billion comprised 64% of RBS’s gross personal lending of £179.8 billion. £103.2 billion related to mortgage lending and £12.3 billion to other lending (loans, credit cards and overdrafts).
Mortgages
Risk mitigation
The table below shows LTVs for the UK PBB residential mortgage portfolio split between performing (AQ1-AQ9) and non-performing (AQ10), with the average LTV calculated on a weighted-value basis. Loan balances are shown as at the end of the year whereas property values are calculated using property index movements since the last formal valuation.
| | 2014 | | 2013 | | 2012 |
| | | Non- | | Of which: | | | Non- | | Of which: | | | Non- | | Of which |
| | Performing | performing | Total | IOL (1) | | Performing | performing | Total | IOL (1) | | Performing | performing | Total | IOL (1) |
| Loan-to-value ratio by value | £m | £m | £m | £m | £m | £m | £m | £m | £m | £m | £m | £m |
| <= 50% | 34,889 | 430 | 35,319 | 7,802 | | 26,392 | 313 | 26,705 | 5,977 | | 22,306 | 327 | 22,633 | 5,702 |
| > 50% and <= 70% | 38,355 | 783 | 39,138 | 9,935 | | 34,699 | 591 | 35,290 | 9,280 | | 27,408 | 457 | 27,865 | 7,921 |
| > 70% and <= 90% | 23,660 | 705 | 24,365 | 4,978 | | 28,920 | 854 | 29,774 | 6,909 | | 34,002 | 767 | 34,769 | 9,267 |
| > 90% and <= 100% | 2,837 | 187 | 3,024 | 1,071 | | 4,057 | 315 | 4,372 | 1,846 | | 7,073 | 366 | 7,439 | 2,370 |
| > 100% and <= 110% | 609 | 73 | 682 | 413 | | 1,790 | 182 | 1,972 | 1,039 | | 3,301 | 290 | 3,591 | 1,666 |
| > 110% and <= 130% | 143 | 29 | 172 | 104 | | 552 | 100 | 652 | 382 | | 1,919 | 239 | 2,158 | 1,091 |
| > 130% and <= 150% | 27 | 2 | 29 | 4 | | 37 | 5 | 42 | 6 | | 83 | 26 | 109 | 45 |
| Total with LTVs | 100,520 | 2,209 | 102,729 | 24,307 | | 96,447 | 2,360 | 98,807 | 25,439 | | 96,092 | 2,472 | 98,564 | 28,062 |
Other (2) | 486 | 20 | 506 | (20) | | 511 | 20 | 531 | — | | 486 | 12 | 498 | 7 |
| Total | 101,006 | 2,229 | 103,235 | 24,287 | | 96,958 | 2,380 | 99,338 | 25,439 | | 96,578 | 2,484 | 99,062 | 28,069 |
| | | | | | | | | | | | | | | |
Total portfolio average LTV (3) | 57% | 67% | 57% | | | 62% | 75% | 62% | | | 66% | 80% | 67% | |
| | | | | | | | | | | | | | | |
Average LTV on new originations during the year (3) | 71% | | | | | 67% | | | | | 65% | |
| (2) | Where no indexed LTV is held. |
| (3) | Average LTV weighted by value is calculated using the LTV on each individual mortgage and applying a weighting based on the value of each mortgage. |
Key points
| · | The UK personal mortgage portfolio increased by 4% to £103.2 billion, of which £91.6 billion (2013 - £90.3 billion) was owner-occupied and £11.6 billion (2013 - £9.0 billion) buy-to-let. |
| · | Based on the Halifax Price Index at September 2014, the portfolio average indexed LTV by volume was 50.4% (2013 - 54.1%) and 57.3% by weighted value of debt outstanding (2013 - 62.0%). The ratio of total outstanding balances to total indexed property valuations was 41.5% (2013 - 45.1%). |
| · | Fixed interest rate products of varying time durations accounted for approximately 56%, with 3% a combination of fixed and variable rates and the remainder variable rate. Approximately 19% of owner-occupied mortgages were on interest only terms with a bullet repayment and 7% were on a combination of interest only and capital and interest. |
| · | During 2014 buy-to-let balances increased by £2.6 billion (28.2%) in support of UK PBB’s growth strategy with new business subject to rental cover and loan-to-value risk appetite requirements. Approximately 63% of buy-to-let mortgages were on interest only lending terms with a bullet repayment, 34% repayable by regular capital and interest repayments and the remaining 3% a combination of interest only and capital and interest. Buy-to-let lending includes lending to customers who were originally owner occupiers who subsequently, with the agreement of RBS, let out the property to a third party, this represents 26.5% of buy-to-let mortgages. |
| · | The portfolio average indexed LTV improved from 62.0% to 57.3%. Within owner-occupied, the average LTV by weighted value improved from 61.6% to 57.0% and within buy-to-let from 66.0% to 59.6%. |
Business review Capital and risk management
| · | Gross new mortgage lending of £19.7 billion (2013 - £14.4 billion) had an average LTV by weighted value of 70.5%, which was higher than 2013 (66.6%), reflecting growth in the market and RBS’s strong support for the Help To Buy scheme. Within this: owner-occupier lending was £16.6 billion (2013 - £13.2 billion) and had an average LTV by weighted value of 71.7% (2013 - 66.9%). Buy-to-let lending was £3.1 billion (2013 - £1.3 billion) with an average LTV by weighted value of 63.9% (2013 - 63.0%). |
| · | All new mortgage business is subject to a comprehensive assessment which includes: i) an affordability test; ii) credit scoring; iii) a maximum loan-to-value of 90% (75% on buy-to-let), with the exception of government-backed schemes, for example Help to Buy and New Buy, where lending of up to 95% is provided; and iv) a range of policy rules that restrict the availability of credit to riskier borrowers. |
| · | The arrears rate (more than three payments in arrears, excluding repossessions and shortfalls after property sale), fell from 1.3% to 1.0%. The number of repossessions was also lower (1,129 compared with 1,532 in 2013). The arrears rate for buy-to-let mortgages was 0.6% (2013 - 0.9%). |
| · | There was an overall release of impairment provision of £26 million. This compares to a charge of £31 million in 2013 and reflects improvements in underlying asset quality, including house price increases. |
Arrears status and provisions
The mortgage arrears information for accounts in forbearance and related provision are shown in the tables below.
| | No missed payments | | 1-3 months in arrears | | >3 months in arrears | | Total |
| Balance | Provision | | Balance | Provision | | Balance | Provision | | Balance | Provision | Forborne balances (1) |
| | £m | £m | | £m | £m | | £m | £m | | £m | £m | % |
| 2014 | 4,158 | 15 | | 364 | 16 | | 351 | 26 | | 4,873 | 57 | 4.7 |
| 2013 | 4,596 | 17 | | 426 | 23 | | 424 | 51 | | 5,446 | 91 | 5.5 |
| 2012 | 4,006 | 20 | | 388 | 16 | | 450 | 64 | | 4,844 | 100 | 4.9 |
| (1) | As a percentage of mortgage loans. |
| (2) | Until June 2014, forbearance in UK PBB included all changes to the contractual payment terms, including those where the customer was up-to-date on payments and there was no obvious evidence of financial difficulty. From July 2014, only customers exhibiting signs of financial stress are reported in forbearance disclosures. |
| (3) | Includes the current stock position of forbearance deals agreed since early 2008 for UK PBB. |
The incidence of the main types of personal forbearance on the balance sheet are analysed below.
| | 2014 | 2013 | 2012 |
| | £m | £m | £m |
| Interest only conversions - temporary and permanent | 1,632 | 1,784 | 1,220 |
| Term extensions - capital repayment and interest only | 2,308 | 2,478 | 2,271 |
| Payment concessions | 228 | 241 | 215 |
| Capitalisation of arrears | 876 | 907 | 932 |
| Other | 223 | 366 | 452 |
Total (1) | 5,267 | 5,776 | 5,090 |
| (1) | As an individual case can include more than one type of arrangement, the analysis above exceeds the total value of cases subject to forbearance. |
Business review Capital and risk management
| The table below shows forbearance agreed during the year analysed between performing and non-performing. |
| | | | |
| | 2014 | 2013 | 2012 |
| | £m | £m | £m |
| Performing forbearance | 785 | 1,332 | 1,809 |
| Non-performing forbearance | 148 | 186 | 184 |
Total forbearance (1,2) | 933 | 1,518 | 1,993 |
| (1) | An individual case can include more than one type of arrangement. |
| (2) | Includes all arrangements agreed during the year (new customers and renewals) including those deals that have expired at the year end. Balances are as at the year end. |
Key points
| · | At 31 December 2014, forbearance balances where the forbearance treatment was provided in the last 24 months amounted to £1.2 billion, representing 1.2% of total mortgage stock. |
| · | The flow of new forbearance was £367 million in the second half of 2014. This compared to £748 million in the first half 2014, which included changes in contractual terms for both financially stressed and non-financially stressed customers. The underlying flow of new forbearance continued on a downward trend and, on a like-for-like basis, was 18% lower in 2014 compared to 2013. |
| · | Since January 2008, 4.7% of total mortgage assets (£4.9 billion) have been subject to a forbearance arrangement with stock levels decreasing by 10.5% since the end of 2013. The year-on-year reduction partly reflects the change in definition to report only financially stressed customers from July 2014 onwards. On a like-for-like basis underlying stock was down by 5.3%. |
| · | The majority (91%) of UK PBB forbearance is permanent in nature (term extensions, capitalisation of arrears, historic conversions to interest only). Temporary forbearance comprises payment concessions such as reduced or deferred payments with such arrangements typically agreed for a period of three to six months. |
| · | The most frequently granted forbearance types were term extensions (44% of forbearance loans at 31 December 2014), interest only conversions (31%) and capitalisations of arrears (17%). |
| · | Conversions to interest only have only been permitted on a very exceptional basis since the fourth quarter of 2012 and have not been permitted for customers in financial difficulty since 2009. |
| · | Approximately 85% of forbearance loans (2013 - 85%) were up to date with payments compared with approximately 98% of assets not subject to forbearance activity. The impairment provision cover on forbearance loans remained significantly higher than that on assets not subject to forbearance as a result of a bespoke provisioning methodology. |
Interest only*
UK PBB stopped offering interest only terms for owner-occupier mortgages from 1 December 2012. This policy is reviewed periodically. Interest only repayment remains an option for buy-to-let mortgages. Exposure to interest only reduced by 5% during 2014.
| | 2014 | 2013 |
| | Mortgages | Mortgages |
| | £m | £m |
| Variable rate | 15,165 | 18,400 |
| Fixed rate | 9,122 | 7,039 |
| Interest only loans | 24,287 | 25,439 |
Mixed repayment (1) | 6,820 | 7,665 |
| Total | 31,107 | 33,104 |
| (1) | Mortgages with partial interest only and partial capital repayments. |
*unaudited
Business review Capital and risk management
The tables below show interest only mortgage portfolios (excluding mixed repayment mortgages) split by type and by contractual year of maturity.
| | 2015 (1) | 2016-17 | 2018-22 | 2023-27 | 2028-32 | 2033-42 | After 2042 | Total |
| 2014 | £m | £m | £m | £m | £m | £m | £m | £m |
Bullet principal repayment (2) | 503 | 1,086 | 3,853 | 5,300 | 6,965 | 6,277 | 303 | 24,287 |
| | | | | | | | | |
| | 2014 (3) | 2015-16 | 2017-21 | 2022-26 | 2027-31 | 2032-41 | After 2041 | Total |
| 2013 | £m | £m | £m | £m | £m | £m | £m | £m |
Bullet principal repayment (2) | 460 | 1,006 | 4,045 | 5,255 | 7,194 | 7,109 | 370 | 25,439 |
| (1) | 2015 includes pre-2015 maturity exposure. |
| (2) | Includes £1.6 billion (2013 - £1.8 billion) of repayment mortgages that have been granted interest only concessions (forbearance). |
| (3) | 2014 includes pre-2014 maturity exposure. |
The table below shows the arrears status of the personal mortgage portfolio by mortgage type.
| | 2014 | | 2013 |
| | Interest only | | | | Interest only | | |
| | Bullet principal | | | | Bullet principal | | |
| | repayment | Other | Total | | repayment | Other | Total |
| | £m | £m | £m | | £m | £m | £m |
| Arrears status | | | | | | | |
| Current | 23,445 | 77,056 | 100,501 | | 24,395 | 71,629 | 96,024 |
| 1 to 90 days in arrears | 514 | 1,214 | 1,727 | | 612 | 1,390 | 2,002 |
| 90+ days in arrears | 328 | 678 | 1,007 | | 432 | 880 | 1,312 |
| Total | 24,287 | 78,948 | 103,235 | | 25,439 | 73,899 | 99,338 |
Key points
| · | UK PBB’s interest only mortgages require full principal repayment (also known as a bullet payment) at the time of maturity. Typically such loans have remaining terms of between 10 and 20 years. Customers are reminded of the need to have an adequate repayment vehicle in place during the mortgage term. |
| · | Of the £24.3 billion interest only mortgages, £17.0 billion (70.0%) were residential owner occupied mortgages (2013 - £19.9 billion) and £7.3 billion (30.0%) related to buy-to-let lending (2013 - £5.6 billion). |
| · | Of the bullet loans that matured in the six months to 30 June 2014, 60.3% had been fully repaid by 31 December 2014. The unpaid balance totalled £58.8 million, of which 94.4% continued to meet agreed payment arrangements (including balances with a term extension agreed on either a capital and interest or interest only basis). Of the £58.8 million unpaid balance, 84.1% of the loans had an indexed LTV of 70% or less with 2.6% above 90%. |
| · | Customers may be offered an extension to the term of an interest only mortgage or a conversion of an interest only mortgage to one featuring repayment of both capital and interest, subject to affordability and characteristics such as the customers' income and ultimate repayment vehicle. These term extensions are considered forbearance and are subject to a bespoke provision methodology resulting in a higher provision rate. |
| · | UK PBB personal recognises impairment provisions in respect of interest-only mortgages that are due to mature within five years. The impairment calculation is based on historical analysis coupled with data obtained from a sample of customers who were asked about how they intended to repay their borrowing at the end of term. The impairment provision held recognises that a proportion of customers may not be able to fulfil their contractual obligation to repay the debt. The analysis is updated as new trends and data become available. |
Personal lending
The UK PBB personal lending portfolio comprised credit cards, unsecured loans and overdrafts, and totalled £12.3 billion at 31 December 2014 (2013 - £13.8 billion). Credit card balances fell by 14.1 % reflecting RBS’s withdrawal from the 0% interest rate balance transfer market. Unsecured loans fell by 6.3% and overdrafts fell by 10.3%.
The impairment charge on unsecured lending was £241 million for the year, down 17.6% on 2013. The reduction reflects continued strong underlying credit quality together with fortuitous recoveries from aged defaulted debt.
Forbearance levels are low and comprise reduced or deferred payments. Arrangements for the repayment of overdraft excesses or loan arrears can be agreed dependent on affordability. Where repayment arrangements are not affordable debt consolidation loans can be provided to customers in collections. £100 million of balances (0.83% of the total unsecured balances) were subject to forbearance at the 2014 year end.
Business review Capital and risk management
Ulster Bank
Overview
The majority (97%) of the Ulster Bank personal portfolio related to mortgage lending. Total gross lending of £18.1 billion comprised 10.1% of RBS’s gross lending of £179.8 billion. £17.5 billion related to mortgage lending and £0.6 billion to other lending (loans and overdrafts).
Mortgages
Risk mitigation
The table below shows LTVs for the Ulster Bank residential mortgage portfolio split between performing (AQ1-AQ9) and non-performing (AQ10), with the average LTV calculated on a weighted value basis. Loan balances are shown as at the end of the year whereas property values are calculated using property index movements since the last formal valuation.
| | 2014 | | 2013 | | 2012 |
| | | | Non- | | Of which: | | | | Non- | | Of which: | | | | Non- | | Of which: |
| | Performing | | performing | Total | IOL (1) | | Performing | | performing | Total | IOL (1) | | Performing | | performing | Total | IOL (1) |
| Loan-to-value ratio by value | £m | | £m | £m | £m | £m | | £m | £m | £m | £m | | £m | £m | £m |
| <= 50% | 2,529 | | 188 | 2,717 | 100 | | 2,025 | | 170 | 2,195 | 113 | | 2,182 | | 274 | 2,456 | 166 |
| > 50% and <= 70% | 2,316 | | 203 | 2,519 | 118 | | 1,837 | | 195 | 2,032 | 118 | | 1,635 | | 197 | 1,832 | 170 |
| > 70% and <= 90% | 2,856 | | 276 | 3,132 | 184 | | 2,326 | | 288 | 2,614 | 206 | | 2,019 | | 294 | 2,313 | 271 |
| > 90% and <= 100% | 1,406 | | 174 | 1,580 | 101 | | 1,214 | | 162 | 1,376 | 122 | | 1,119 | | 156 | 1,275 | 169 |
| > 100% and <= 110% | 1,404 | | 203 | 1,607 | 127 | | 1,302 | | 182 | 1,484 | 129 | | 1,239 | | 174 | 1,413 | 181 |
| > 110% and <= 130% | 2,382 | | 512 | 2,894 | 295 | | 2,509 | | 461 | 2,970 | 332 | | 2,412 | | 397 | 2,809 | 457 |
| > 130% and <= 150% | 1,554 | | 547 | 2,101 | 218 | | 2,202 | | 549 | 2,751 | 425 | | 2,144 | | 474 | 2,618 | 613 |
| > 150% | 481 | | 475 | 956 | 120 | | 2,385 | | 1,227 | 3,612 | 624 | | 3,156 | | 1,290 | 4,446 | 1,110 |
| Total | 14,928 | | 2,578 | 17,506 | 1,263 | | 15,800 | | 3,234 | 19,034 | 2,069 | | 15,906 | | 3,256 | 19,162 | 3,137 |
| | | | | | | | | | | | | | | | | | |
Total portfolio average LTV (2) | 88% | | 115% | 92% | | | 103% | | 130% | 108% | | | 108% | | 132% | 112% | |
| | | | | | | | | | | | | | | | | | |
Average LTV on new originations during the year (2) | 75% | | | | | | 73% | | | | | | 74% | |
| (2) | Average LTV weighted by value is calculated using the LTV on each individual mortgage and applying a weighting based on the value of each mortgage. |
Key points
| · | Of Ulster Bank’s portfolio of £17.5 billion, 86% was in the Republic of Ireland and 14% in Northern Ireland. The portfolio decreased 5.6% during the year as a result of exchange rate movement and amortisation. |
| · | The assets included £2.1 billion (12%) of residential buy-to-let loans. |
| · | The interest rate product mix was approximately 64% on tracker rate products, 23% on variable rate products and 13% on fixed rate. |
| · | Interest only represented 7% of the total portfolio. |
| · | Ulster Bank stopped offering interest only loans as a standard mortgage offering for new lending in the Republic of Ireland in 2010 and in Northern Ireland in 2012. |
| · | The average individual LTV on new originations was 75% in 2014, (2013 - 73%); the volume of new business increased from £438 million in 2013 to £618 million in 2014. The maximum LTV available to Ulster Bank customers was 90%. |
| · | Based on updated house price indices as at October 2014, the portfolio average indexed LTV improved from 108% to 92% during 2014, reflecting positive house price index trends over the last 12 months. In particular, the Republic of Ireland house price index increased by 16% during 2014, with the Irish market being led by the Dublin area, where the index increased by 22% during the year. The Republic of Ireland house price index is 38% below its peak, which was in September 2007. |
| · | The average LTV of new business for owner occupier mortgages was 75%, compared to 69% for buy-to-let. |
| · | Indexed loan to value, excluding 2014 new business, was 93% as at 31 December 2014. |
| · | Repossessions increased to 497 in 2014 from 262 in 2013. |
| · | Ulster Bank provisioning methodology used a point-in-time provision rate based on the latest available house price index prepared by the Central Statistics Office. This is used to create an indexed valuation at property level, which also takes into account costs of realisation and a discount for forced sales, and is one of the primary factors used in the determination of the likely size of the loss upon crystallisation. Loss likelihood rates are also determined and (amongst other considerations) assess whether an active forbearance arrangement is in place. The provision rate is then a combination of these measures and is updated as required depending on the movement of the drivers applied as part of the methodology. |
| · | REIL increased from £3.2 billion to £3.4 billion primarily reflecting higher forbearance arrangements. Provision coverage was lower at 41% (2013 - 53%) reflecting an increase in collateral values. |
Business review Capital and risk management
| Arrears status and provisions | | | | | | | | | | | | |
The mortgage arrears information for accounts in forbearance and related provision are shown in the tables below. |
| | No missed payments | | 1-3 months in arrears | | >3 months in arrears | | Total |
| Balance | Provision | | Balance | Provision | | Balance | Provision | | Balance | Provision | Forborne balances (1) |
| | £m | £m | | £m | £m | | £m | £m | | £m | £m | % |
| 2014 | 2,231 | 299 | | 689 | 110 | | 960 | 267 | | 3,880 | 676 | 22.2 |
| 2013 | 1,362 | 166 | | 631 | 76 | | 789 | 323 | | 2,782 | 565 | 14.6 |
| 2012 | 915 | 100 | | 546 | 60 | | 527 | 194 | | 1,988 | 354 | 10.4 |
| (1) | As a percentage of mortgage loans. |
| (2) | Forbearance in Ulster Bank includes all changes to the contractual payment terms, including those where the customer is up-to-date on payments and there is no obvious evidence of financial difficulty. |
| (3) | Includes the current stock position of forbearance deals agreed since early 2009 for Ulster Bank. |
The incidence of the main types of personal forbearance on the balance sheet are analysed below.
| | 2014 | 2013 | 2012 |
| | £m | £m | £m |
| Interest only conversions - temporary and permanent | 346 | 512 | 924 |
| Term extensions - capital repayment and interest only | 501 | 325 | 183 |
Payment concessions (1) | 2,305 | 1,567 | 762 |
| Capitalisation of arrears | 1,364 | 494 | 119 |
Total (2) | 4,516 | 2,898 | 1,988 |
| (1) | Includes £77 million of loans (2013 - £365 million; 2012 - £10 million) where an interest rate discount has been agreed resulting in a reduction of contractual cash flows through forgiveness of interest. |
| (2) | As an individual case can include more than one type of arrangement, the analysis above exceeds the total value of cases subject to forbearance. |
The table below shows forbearance agreed during the year split between performing and non-performing.
| | 2014 | 2013 | 2012 |
| | £m | £m | £m |
| Performing forbearance | 2,177 | 2,223 | 2,111 |
| Non-performing forbearance | 1,053 | 1,213 | 1,009 |
Total forbearance (1,2) | 3,230 | 3,436 | 3,120 |
| (1) | An individual case can include more than one type of arrangement. |
| (2) | Includes all arrangements agreed during the year (new customers and renewals) including those deals that have expired at the year end. Balances are as at the year end. |
Business review Capital and risk management
Key points
| · | At 31 December 2014, 22.2% of total mortgage assets (£3.9 billion) were subject to a forbearance arrangement, an increase of 40% (£2.8 billion) from 31 December 2013. This reflects Ulster Bank’s proactive strategies to contact customers in financial difficulty to offer assistance. |
| · | Although the forbearance stock increased by 40% during the year, the number of customers approaching Ulster Bank for assistance for the first time has declined through 2014. This can be attributed to a greater number of mortgages being moved to longer-term arrangements, and therefore not exiting forbearance. |
| · | The majority of loans subject to forbearance arrangements (75%) were less than 90 days in arrears. |
| · | The mix of forbearance treatments in Ulster Bank changed, with an increase in longer-term solutions. A total of 61% of forbearance loans were subject to a long-term arrangement at 31 December 2014 (2013 - 41%). These long-term arrangements were comprised of: i) Capitalisations which represented 30% of forbearance stock at 31 December 2014 (2013 - 17%); ii) Term extensions - 11% (unchanged from 2013); and iii) economic concessions - 20% (2013 - 13%). Economic concessions are offered for periods up to eight years and incorporate different levels of repayment based on customer circumstances. |
| · | The remaining forbearance loans were short-term arrangements accounting for 39% of the forbearance portfolio. |
| · | Temporary interest only arrangements decreased during 2014 to 8% of forbearance loans at 31 December 2014 (2013 - 18%). This reflects Ulster Bank’s strategy to transition customers in financial difficulty to long-term arrangements. |
| · | Payment concessions represented the remaining 31%, comprising: arrangements where payments amortised the outstanding balance (26%); a diminishing portfolio of arrangements that negatively amortised (4%); and payment holidays (1%). |
| · | The impairment provision cover on forbearance loans remained significantly higher than that on assets not subject to forbearance. |
Interest only*
Ulster Bank stopped offering interest only loans as a standard mortgage offering for new lending in the Republic of Ireland in 2010 and in Northern Ireland in 2012. Interest only mortgages are now granted only to high net worth customers or customers in need of forbearance.
| | 2014 | 2013 |
| | Mortgages | Mortgages |
| | £m | £m |
| Variable rate | 1,238 | 2,031 |
| Fixed rate | 25 | 38 |
| Interest only loans | 1,263 | 2,069 |
Mixed repayment (1) | 204 | 277 |
| Total | 1,467 | 2,346 |
| (1) | Mortgages with partial interest only and partial capital repayments. |
Business review Capital and risk management
The tables below show interest only mortgage portfolios (excluding mixed repayment mortgages) by type and by contractual year of maturity.
| | | | | | | | | |
| | 2015 (1) | 2016-17 | 2018-22 | 2023-27 | 2028-32 | 2033-42 | After 2042 | Total |
| 2014 | £m | £m | £m | £m | £m | £m | £m | £m |
Bullet principal repayment (2) | 9 | 30 | 80 | 109 | 250 | 152 | 26 | 656 |
Conversion to amortising (2,3) | 366 | 206 | 29 | 2 | 4 | — | — | 607 |
| Total | 375 | 236 | 109 | 111 | 254 | 152 | 26 | 1,263 |
| | | | | | | | | |
| | 2014 (4) | 2015-16 | 2017-21 | 2022-26 | 2027-31 | 2032-41 | After 2041 | Total |
| 2013 | £m | £m | £m | £m | £m | £m | £m | £m |
Bullet principal repayment (2) | 10 | 25 | 85 | 106 | 224 | 200 | 28 | 678 |
Conversion to amortising (2,3) | 864 | 350 | 120 | 9 | 13 | 27 | 8 | 1,391 |
| Total | 874 | 375 | 205 | 115 | 237 | 227 | 36 | 2,069 |
| (1) | 2015 includes pre-2015 maturity exposure. |
| (2) | Includes £0.3 billion (2013 - £0.5 billion) of repayment mortgages that have been granted interest only concessions (forbearance). |
| (3) | Maturity date relates to the expiry of the interest only period. |
| (4) | 2014 includes pre-2014 maturity exposure. |
The table below shows the arrears status of the personal mortgage portfolio by mortgage type.
| | | | | | | | | | |
| | 2014 | | 2013 |
| | Interest only | | | | Interest only | | |
| | Bullet principal | Conversion to | | | | Bullet principal | Conversion to | | |
| | repayment | amortising | Other | Total | | repayment | amortising | Other | Total |
| | £m | £m | £m | £m | | £m | £m | £m | £m |
| Arrears status | | | | | | | | | |
| Current | 561 | 474 | 12,756 | 13,791 | | 565 | 1,053 | 12,642 | 14,260 |
| 1 to 90 days in arrears | 25 | 54 | 1,058 | 1,137 | | 35 | 152 | 1,352 | 1,539 |
| 90+ days in arrears | 70 | 79 | 2,429 | 2,578 | | 78 | 186 | 2,971 | 3,235 |
| Total | 656 | 607 | 16,243 | 17,506 | | 678 | 1,391 | 16,965 | 19,034 |
Key points
| · | Ulster Bank’s interest only mortgages require full principal repayment (bullet) at the time of maturity; or payment of both capital and interest from the end of the interest only period, typically seven years, so that customers meet their contractual repayment obligations. For bullet customers, contact strategies are in place to remind them of the need to repay principal at the end of the mortgage term. |
| · | Typically interest only mortgages have a remaining term of 16 years. |
| · | Of the bullet mortgages that matured in the six months to 30 June 2014 (£3.3 million), 37% had been fully repaid by 31 December 2014 leaving residual balances of £2.1 million, 81% of which were meeting the terms of a revised repayment schedule. Of the amortising loans that matured in the six months to 30 June 2014 (£232.6 million), 66% were either fully repaid or meeting the terms of a revised repayment schedule. |
| · | Of the £1.3 billion interest only mortgages £0.9 billion related to owner-occupier mortgages and £0.3 billion related to buy-to-let mortgages. |
Personal lending
The Ulster Bank personal lending portfolio comprised credit cards, unsecured loans and overdrafts, and totalled £591 million at 31 December 2014 (2013 - £740 million). Loans decreased by 24%.
The impairment charge on unsecured lending was £19.9 million for the year, down 12% on 2013.
Business review Capital and risk management
Private Banking
Overview
The majority of the Private Banking personal lending portfolio relates to mortgage lending. Total gross lending of £14.1 billion comprised 7.8% of RBS’s gross personal lending of £179.8 billion. £8.9 billion related to mortgage lending and £5.2 billion to other lending (loans, overdrafts and current accounts).
Mortgages
Risk mitigation
The table below shows LTVs for the Private Banking residential mortgage portfolio split between performing (AQ1-AQ9) and non-performing (AQ10), with the average LTV calculated on a weighted value basis. Loan balances are shown as at the end of the year whereas property values are calculated using property index movements since the last formal valuation.
| | 2014 | | 2013 | | 2012 |
| | | Non- | | Of Which: | | | Non- | | Of Which: | | | Non- | | Of Which: |
| | Performing | performing | Total | IOL (1) | | Performing | performing | Total | IOL (1) | | Performing | performing | Total | IOL (1) |
| Loan-to-value ratio by value | £m | £m | £m | £m | | £m | £m | £m | £m | | £m | £m | £m | £m |
| <= 50% | 3,493 | 14 | 3,507 | 2,727 | | 3,400 | 16 | 3,416 | 2,561 | | 3,905 | 9 | 3,914 | 2,982 |
| > 50% and <= 70% | 3,667 | 14 | 3,681 | 2,711 | | 3,397 | 20 | 3,417 | 2,332 | | 2,790 | 12 | 2,802 | 1,897 |
| > 70% and <= 90% | 1,379 | 24 | 1,403 | 679 | | 1,337 | 44 | 1,381 | 660 | | 1,080 | 27 | 1,107 | 474 |
| > 90% and <= 100% | 64 | 9 | 73 | 44 | | 87 | 7 | 94 | 65 | | 93 | 7 | 100 | 74 |
| > 100% and <= 110% | 33 | 5 | 38 | 35 | | 87 | 15 | 102 | 96 | | 69 | 13 | 82 | 75 |
| > 110% and <= 130% | 15 | 9 | 24 | 22 | | 27 | 6 | 33 | 30 | | 49 | 7 | 56 | 50 |
| > 130% and <= 150% | 12 | 1 | 13 | 12 | | 4 | 4 | 8 | 7 | | 16 | 3 | 19 | 19 |
| > 150% | 22 | 3 | 25 | 22 | | 24 | 6 | 30 | 26 | | 29 | 3 | 32 | 22 |
| Total with LTVs | 8,685 | 79 | 8,764 | 6,252 | | 8,363 | 118 | 8,481 | 5,777 | | 8,031 | 81 | 8,112 | 5,593 |
Other (2) | 124 | 1 | 125 | 105 | | 215 | 5 | 220 | 191 | | 674 | — | 674 | 245 |
| Total | 8,809 | 80 | 8,889 | 6,357 | | 8,578 | 123 | 8,701 | 5,968 | | 8,705 | 81 | 8,786 | 5,838 |
| | | | | | | | | | | | | | | |
Total portfolio average LTV (3) | 51% | 80% | 51% | | | 51% | 77% | 51% | | | 51% | 78% | 51% | |
| | | | | | | | | | | | | | | |
Average LTV on new originations during the year (3) | 48% | | | | | 52% | | | | | | |
| (2) | Where no indexed LTV is held. |
| (3) | Average LTV weighted by value is calculated using the LTV on each individual mortgage and applying a weighting based on the value of each mortgage. |
Forbearance
Forbearance is offered to private banking customers on a limited basis and represents less than 1.1% of the total mortgage portfolio. The main types of forbearance offered are in the form of term extensions.
Arrears status and provisions
The mortgage arrears information for accounts in forbearance and related provision are shown in the tables below.
| | No missed payments | | 1-3 months in arrears | | >3 months in arrears | | Total |
| | Balance | Provision | | Balance | | Balance | Provision | | Balance | Provision | Forborne balances (1) |
| | £m | £m | | £m | | £m | £m | | £m | £m | % |
| 2014 | 91 | 1 | | 3 | | 6 | 1 | | 100 | 2 | 1.1 |
| 2013 | 112 | 3 | | 6 | | 9 | — | | 127 | 3 | 1.5 |
| 2012 | 38 | — | | — | | 7 | — | | 45 | — | 0.5 |
| (1) | As a percentage of mortgage loans. |
| | | | |
| | 2014 | 2013 | 2012 |
| | £m | £m | £m |
| Interest only conversions - temporary and permanent | 1 | — | 6 |
| Term extensions - capital repayment and interest only | 46 | 29 | 27 |
| Payment concessions | 18 | 12 | 9 |
| Other | 35 | 86 | 3 |
Total (1) | 100 | 127 | 45 |
Note:
| (1) | As an individual case can include more than one type of arrangement, the analysis above exceeds the total value of cases subject to forbearance. |
Business review Capital and risk management
The table below shows forbearance agreed during the year split between performing and non-performing.
| | 2014 | 2013 | 2012 |
| | £m | £m | £m |
| Performing forbearance | 89 | 41 | 18 |
| Non-performing forbearance | 22 | 22 | 2 |
Total forbearance (1,2) | 111 | 63 | 20 |
| (1) | An individual case can include more than one type of arrangement. |
| (2) | Includes all arrangements agreed during the year (new customers and renewals) including those deals that have expired at the year end. Balances are as at the year end. |
Interest only*
Private Banking portfolios offer interest only mortgages to high net worth customers.
The table below shows interest only mortgages by interest rate and repayment type.
| | | | | | |
| | 2014 | | 2013 |
| | Mortgages | Other loans | | Mortgages | Other loans |
| | £m | £m | | £m | £m |
| Variable rate | 4,810 | 1,779 | | 5,062 | 1,276 |
| Fixed rate | 1,547 | 99 | | 906 | 71 |
| Interest only loans | 6,357 | 1,878 | | 5,968 | 1,347 |
Mixed repayment (1) | — | 11 | | 375 | 6 |
| Total | 6,357 | 1,889 | | 6,343 | 1,353 |
| (1) | Mortgages with partial interest only and partial capital repayments. |
The tables below show interest only mortgage portfolios (excluding mixed repayment mortgages) by type and by contractual year of maturity.
| | 2015 (1) | 2016-17 | 2018-22 | 2023-27 | 2028-32 | 2033-42 | After 2042 | Total |
| 2014 | £m | £m | £m | £m | £m | £m | £m | £m |
| Bullet principal repayment | 1,290 | 1,634 | 2,284 | 630 | 356 | 162 | 1 | 6,357 |
| | | | | | | | | |
| | 2014 (2) | 2015-16 | 2017-21 | 2022-26 | 2027-31 | 2032-41 | After 2041 | Total |
| 2013 | £m | £m | £m | £m | £m | £m | £m | £m |
| Bullet principal repayment | 239 | 911 | 1,853 | 2,250 | 492 | 159 | 48 | 5,952 |
Conversion to amortising (3) | 1 | — | — | 2 | 4 | 9 | — | 16 |
| Total | 240 | 911 | 1,853 | 2,252 | 496 | 168 | 48 | 5,968 |
| (1) | 2015 includes pre-2015 maturity exposure. |
| (2) | 2014 includes pre-2014 maturity exposure. |
| (3) | Maturity date relates to the expiry of the interest only period. |
The table below shows the arrears status of Private Banking’s personal mortgage portfolio by mortgage type.
| | | | | | | | | |
| | 2014 | | 2013 |
| | Interest only | | | | Interest only | | |
| | Bullet principal | | | | Bullet principal | Conversion to | | |
| | repayment | Other | Total | | repayment | amortising | Other | Total |
| | £m | £m | £m | | £m | £m | £m | £m |
| Arrears status | | | | | | | | |
| Current | 6,311 | 2,497 | 8,808 | | 5,839 | 16 | 2,694 | 8,549 |
| 1 to 90 days in arrears | 13 | 19 | 32 | | 33 | — | 17 | 50 |
| 90+ days in arrears | 33 | 16 | 49 | | 80 | — | 22 | 102 |
| Total | 6,357 | 2,532 | 8,889 | | 5,952 | 16 | 2,733 | 8,701 |
*unaudited
Business review Capital and risk management
CFG
Overview
The majority of the CFG personal portfolio relates to mortgage lending. Total gross lending of £32.0 billion comprised 17.8% of RBS’s gross personal lending of £179.8 billion. £21.1 billion related to mortgage lending and £10.9 billion to other lending (loans and overdrafts) and auto loans.
Mortgages
Risk mitigation
The table below shows LTVs for CFG, residential mortgages split between performing (AQ1-AQ9) and non-performing (AQ10), with the average LTV calculated on a weighted value basis. Loan balances are shown as at the end of the year whereas property values are calculated using property index movements since the last formal valuation.
| | 2014 | | 2013 | | 2012 |
| | | | Non- | | Of which: | | | | Non- | | Of which: | | | | Non- | | Of which: |
| | Performing | | performing | Total | IOL (2) | | Performing | | performing | Total | IOL (2) | | Performing | | performing | Total | IOL (2) |
| Loan-to-value ratio by value (1) | £m | | £m | £m | £m | | £m | | £m | £m | £m | | £m | | £m | £m | £m |
| <= 50% | 4,498 | | 77 | 4,575 | 1,792 | | 4,669 | | 98 | 4,767 | 2,146 | | 4,167 | | 51 | 4,218 | 1,433 |
| > 50% and <= 70% | 6,601 | | 105 | 6,706 | 3,436 | | 5,529 | | 89 | 5,618 | 2,929 | | 4,806 | | 76 | 4,882 | 2,363 |
| > 70% and <= 90% | 6,350 | | 141 | 6,491 | 3,372 | | 5,553 | | 110 | 5,663 | 3,019 | | 6,461 | | 114 | 6,575 | 3,595 |
| > 90% and <= 100% | 1,256 | | 48 | 1,304 | 624 | | 1,309 | | 39 | 1,348 | 525 | | 2,011 | | 57 | 2,068 | 959 |
| > 100% and <= 110% | 672 | | 24 | 696 | 311 | | 752 | | 22 | 774 | 223 | | 1,280 | | 43 | 1,323 | 509 |
| > 110% and <= 130% | 516 | | 17 | 533 | 191 | | 637 | | 17 | 654 | 144 | | 1,263 | | 42 | 1,305 | 431 |
| > 130% and <= 150% | 119 | | 4 | 123 | 32 | | 183 | | 5 | 188 | 32 | | 463 | | 14 | 477 | 123 |
| > 150% | 64 | | 3 | 67 | 14 | | 102 | | 4 | 106 | 20 | | 365 | | 14 | 379 | 98 |
| Total with LTVs | 20,076 | | 419 | 20,495 | 9,772 | | 18,734 | | 384 | 19,118 | 9,038 | | 20,816 | | 411 | 21,227 | 9,511 |
Other (3) | 624 | | 3 | 627 | 157 | | 463 | | 3 | 466 | 234 | | 292 | | 19 | 311 | 30 |
| Total | 20,700 | | 422 | 21,122 | 9,929 | | 19,197 | | 387 | 19,584 | 9,272 | | 21,108 | | 430 | 21,538 | 9,541 |
| | | | | | | | | | | | | | | | | | |
Total portfolio average LTV (4) | 67% | | 73% | 67% | | | 67% | | 69% | 67% | | | 75% | | 86% | 75% | |
| | | | | | | | | | | | | | | | | | |
Average LTV on new originations during the year (4) | 68% | | | | | | 68% | | | | | | 64% | |
| (1) | Includes residential mortgages and home equity loans and lines. |
| (3) | Where no indexed LTV is held. |
| (4) | Average LTV weighted by value is calculated using the LTV on each individual mortgage and applying a weighting based on the value of each mortgage. |
Key points
| · | The mortgage portfolio consisted of £7.8 billion of residential mortgages (1% in second lien position) and £13.3 billion of home equity loans and lines of credit (HELOC) - first and second liens. Home equity consisted of 45% in first lien position. A Serviced By Others (SBO) portfolio, which is predominantly (95%) second lien, is included in the home equity book. |
| · | CFG continued to focus on its ‘footprint states’ of New England, Mid-Atlantic and Mid-West regions. At 31 December 2014, the portfolio consisted of £17.1 billion (82% of the total portfolio) within footprint. |
| · | The SBO portfolio, which was closed to new purchases in the third quarter of 2007, decreased from £1.4 billion to £1.3 billion. |
| · | The overall mortgage portfolio credit characteristics are stable with a weighted average LTV of 67% at 31 December 2014. The weighted average LTV of the portfolio, excluding SBO, was 65%. |
Arrears status and provisions
The mortgage arrears information for accounts in forbearance and related provision are shown in the tables below.
| | No missed payments | | 1-3 months in arrears | | >3 months in arrears | | Total |
| Balance | Provision | | Balance | Provision | | Balance | Provision | | Balance | Provision | Forborne balances (1) |
| | £m | £m | | £m | £m | | £m | £m | | £m | £m | % |
| 2014 | 310 | 25 | | 34 | 4 | | 65 | — | | 409 | 29 | 1.9 |
| 2013 | 287 | 26 | | 33 | 3 | | 53 | — | | 373 | 29 | 1.9 |
| 2012 | — | — | | 179 | 25 | | 160 | 10 | | 339 | 35 | 1.6 |
| (1) | As a percentage of mortgage loans. |
Business review Capital and risk management
The incidence of the main types of personal forbearance on the balance sheet are shown below.| | 2014 | 2013 | 2012 |
| | £m | £m | £m |
| Term extensions - capital repayment and interest only | 56 | 35 | — |
Payment concessions (1) | 254 | 246 | 339 |
| Other | 99 | 92 | — |
Total (2) | 409 | 373 | 339 |
Notes:
| (1) | Includes £18 million of loans (2013 - £62 million) where an interest rate discount has been agreed resulting in a reduction of contractual cash flows through forgiveness of interest. |
| (2) | As an individual case can include more than one type of arrangement, the analysis above exceeds the total value of cases subject to forbearance. |
The table below shows forbearance agreed during the year split between performing and non-performing.
| | 2014 | 2013 | 2012 |
| | £m | £m | £m |
| Performing forbearance | — | — | 88 |
| Non-performing forbearance | 76 | 101 | 71 |
Total forbearance (1,2) | 76 | 101 | 159 |
| (1) | An individual case can include more than one type of arrangement. |
| (2) | Includes all arrangements agreed during the year (new customers and renewals) including those deals that have expired at the year end. Balances are as at the year end. |
Key point
| · | CFG participates in the US-government mandated Home Affordable Modification Program, as well as its own proprietary programme. Both feature a combination of term extensions, capitalisations of arrears, interest rate reductions and loan conversions from interest only to amortising. These tend to be permanent changes to contractual terms. In order to qualify for either of these programmes, customers must meet government-specified or internal criteria that provide evidence of financial difficulty and demonstrate a willingness to pay. The 12-month default rate, on a value basis, for forbearance was 15% in 2014. |
Interest only*
The table below shows the interest only mortgage and HELOC portfolios by interest rate and repayment type.
| | 2014 | | 2013 |
| | Mortgages | Other loans | | Mortgages | Other loans |
| | £m | £m | | £m | £m |
| Variable rate | 9,637 | 59 | | 9,221 | 23 |
| Fixed rate | 292 | 34 | | 51 | 40 |
| Interest only loans | 9,929 | 93 | | 9,272 | 63 |
| Mixed repayment | 788 | — | | 1,149 | — |
| Total | 10,717 | 93 | | 10,421 | 63 |
*unaudited
Business review Capital and risk management
The table below shows the interest only mortgage and HELOC portfolios (excluding mixed repayment mortgages) by type and contractual year of maturity.
| | 2015 (1) | 2016-17 | 2018-22 | 2023-27 | 2028-32 | 2033-42 | After 2042 | Total |
| 2014 | £m | £m | £m | £m | £m | £m | £m | £m |
Bullet principal repayment (2) | 93 | 70 | 9 | — | — | — | — | 172 |
Conversion to amortising (2,3) | 1,156 | 1,879 | 4,432 | 2,147 | 19 | 9 | 115 | 9,757 |
| Total | 1,249 | 1,949 | 4,441 | 2,147 | 19 | 9 | 115 | 9,929 |
| | | | | | | | | |
| | 2014 (3) | 2015-16 | 2017-21 | 2022-26 | 2027-31 | 2032-41 | After 2041 | Total |
| 2013 | £m | £m | £m | £m | £m | £m | £m | £m |
Bullet principal repayment (2) | 133 | 193 | 13 | 13 | 17 | 17 | 17 | 403 |
Conversion to amortising (2,3) | 997 | 5,609 | 2,123 | 133 | — | 7 | — | 8,869 |
| Total | 1,130 | 5,802 | 2,136 | 146 | 17 | 24 | 17 | 9,272 |
| (1) | 2015 includes pre-2015 maturity exposure. |
| (2) | Maturity date relates to the expiry of the interest only period. |
| (3) | 2014 includes pre-2014 maturity exposure. |
The table below shows the arrears status of personal mortgages and HELOC loans by type.
| | | | | | | | | | |
| | 2014 | | 2013 |
| | Interest only | | | | Interest only | | |
| | Bullet principal | Conversion to | | | | Bullet principal | Conversion to | | |
| | repayment | amortising | Other | Total | | repayment | amortising | Other | Total |
| | £m | £m | £m | £m | | £m | £m | £m | £m |
| Arrears status | | | | | | | | | |
| Current | 145 | 9,365 | 10,247 | 19,757 | | 348 | 8,529 | 10,002 | 18,879 |
| 1 to 90 days in arrears | 17 | 314 | 612 | 943 | | 37 | 260 | 65 | 362 |
| 90+ days in arrears | 10 | 78 | 334 | 422 | | 18 | 80 | 245 | 343 |
| Total | 172 | 9,757 | 11,193 | 21,122 | | 403 | 8,869 | 10,312 | 19,584 |
Key points
| · | CFG has a portfolio of interest only bullet repayment HELOC loans (£0.2 billion at 31 December 2014) for which repayment of principal is due at maturity, and an interest only portfolio that comprises loans that convert to amortising after an interest only period (typically ten years). The majority of the bullet loans are due to mature in 2015. |
| · | Of the bullet repayment loans that matured in the six months to 30 June 2014, 48.9% had been fully repaid by 31 December 2014. The unpaid balance totalled £103 million, 90.8% of which continued to meet agreed payment arrangements. Of the amortising loans that matured in the six months to 30 June 2014, 64.3% had been fully repaid by 31 December 2014. The unpaid balance totalled £15 million, 83.2% of which continued to meet agreed payment arrangements. |
Personal lending
CFG’s credit card portfolio is comprised of good quality consumer loans originated in-footprint through the branch network and totalled £952 million at 31 December 2014 (2013 - £945 million). The product portfolio credit quality continued to improve with weighted average credit scores for new originations throughout 2014 higher than the portfolio average.
The auto portfolio totalled £7.9 billion at 31 December 2014 of which £6.9 billion has been originated through dealer networks and £1.0 billion of purchased pools of prime auto loans. CFG increased its exposure to auto loans during the year, within the risk appetite set as part of CFG’s strategy.
For loans secured by vehicles and credit cards, CFG may offer temporary interest rate modifications, but no principal reductions. Forbearance may also be offered to student loan customers consistent with the policy guidelines of the US Office of the Comptroller of the Currency. £140 million (1.3% of the unsecured balances) were subject to forbearance at 31 December 2014 (includes auto and recreational vehicle marine portfolios and excludes small business loans as these are included as part of wholesale reporting).
Business review Capital and risk management
| Balance sheet analysis |
| 271 | Financial assets |
| 271 | - Exposure summary and credit mitigation |
| 273 | - Sector concentration |
| 275 | - Asset quality |
| 277 | Debt securities |
| 277 | - Issuer and IFRS measurement classification |
| 278 | - Ratings |
| 279 | - Asset-backed securities |
| 280 | Equity shares |
| 281 | Derivatives |
| 281 | - Summary and uncollateralised exposure |
| 283 | - Settlement basis and central counterparties |
| 283 | - Credit derivatives |
| 284 | REIL, provisions and AFS reserves |
| 284 | - Loans and related credit metrics |
| 284 | - Segmental analysis |
| 286 | - Sector and geographical concentration |
| 289 | - REILs and impairments |
| 293 | - AFS reserves |
| 293 | - By issuer |
| 293 | - Gross unrealised losses |
Business review Capital and risk management
Balance sheet analysis
Credit risk assets analysed on pages 227 to 269 are reported internally to senior risk management. However, they exclude certain exposures, primarily securities and reverse repurchase agreements and take account of legal netting agreements, that provide a right of legal set-off but do not meet the criteria for offset in IFRS. The tables that follow are therefore provided to supplement the credit risk assets analysis and other analysis to reconcile to the balance sheet. All the disclosures in this section are audited.
Financial assets
Exposure summary and credit mitigation
The following table analyses financial assets exposures, both gross and net of offset arrangements as well as credit mitigation and enhancement.
| | | | | | | | Exposure |
| | | | | | Collateral | | post credit |
| | Gross | IFRS | Carrying | Balance sheet | | | Real estate and other | Credit | mitigation and |
| | exposure | offset (1) | value (2) | offset (3) | Cash (4) | Securities (5) | Residential (6) | Commercial (6) | enhancement(7) | enhancement |
| 2014 | £bn | £bn | £bn | £bn | £bn | £bn | £bn | £bn | £bn | £bn |
| Cash and balances at central banks | 75.5 | — | 75.5 | — | — | — | — | — | — | 75.5 |
| Reverse repos | 95.5 | (30.8) | 64.7 | (5.0) | — | (59.7) | — | — | — | — |
| Lending | 423.4 | (3.8) | 419.6 | (40.2) | (1.6) | (4.1) | (149.5) | (57.7) | (5.8) | 160.7 |
| Debt securities | 101.9 | — | 101.9 | — | — | — | — | — | (0.2) | 101.7 |
| Equity shares | 6.2 | — | 6.2 | — | — | — | — | — | — | 6.2 |
| Derivatives | 599.4 | (245.4) | 354.0 | (295.3) | (33.3) | (7.0) | — | — | (14.3) | 4.1 |
| Settlement balances | 6.7 | (2.0) | 4.7 | — | — | — | — | — | — | 4.7 |
| Total | 1,308.6 | (282.0) | 1,026.6 | (340.5) | (34.9) | (70.8) | (149.5) | (57.7) | (20.3) | 352.9 |
| Short positions | (23.0) | — | (23.0) | — | — | — | — | — | — | (23.0) |
| Net of short positions | 1,285.6 | (282.0) | 1,003.6 | (340.5) | (34.9) | (70.8) | (149.5) | (57.7) | (20.3) | 329.9 |
| | | | | | | | | | | |
| 2013 | | | | | | | | | | |
| Cash and balances at central banks | 82.7 | — | 82.7 | — | — | — | — | — | — | 82.7 |
| Reverse repos | 117.2 | (40.7) | 76.5 | (11.4) | — | (65.0) | — | — | — | 0.1 |
| Lending | 423.6 | (3.4) | 420.2 | (37.2) | (1.6) | (2.7) | (145.4) | (60.0) | (3.9) | 169.4 |
| Debt securities | 113.6 | — | 113.6 | — | — | — | — | — | (1.3) | 112.3 |
| Equity shares | 8.8 | — | 8.8 | — | — | — | — | — | — | 8.8 |
| Derivatives | 553.7 | (265.7) | 288.0 | (241.3) | (24.4) | (6.0) | — | — | (7.3) | 9.0 |
| Settlement balances | 8.2 | (2.7) | 5.5 | (0.3) | — | — | — | — | — | 5.2 |
| Total | 1,307.8 | (312.5) | 995.3 | (290.2) | (26.0) | (73.7) | (145.4) | (60.0) | (12.5) | 387.5 |
| Short positions | (28.0) | — | (28.0) | — | — | — | — | — | — | (28.0) |
| Net of short positions | 1,279.8 | (312.5) | 967.3 | (290.2) | (26.0) | (73.7) | (145.4) | (60.0) | (12.5) | 359.5 |
| (1) | Relates to offset arrangements that comply with IFRS criteria and transactions cleared through and novated to central clearing houses, primarily London Clearing House and US Government Securities Clearing Corporation. |
| (2) | The carrying value on the balance sheet represents the exposure to credit risk by class of financial instrument. |
| (3) | Balance sheet offset reflects the amounts by which RBS’s credit risk is reduced through master netting and cash management pooling arrangements. Derivative master netting agreements include cash pledged with counterparties in respect of net derivative liability positions and are included in lending. |
| (4) | Includes cash collateral pledged by counterparties based on daily mark-to-market movements of net derivative positions with the counterparty. |
| (5) | Securities collateral represent the fair value of securities received from counterparties, mainly relating to reverse repo transactions as part of netting arrangements. |
| (6) | Property valuations are capped at loan value and reflect the application of haircuts in line with regulatory rules to indexed valuations. Commercial collateral includes ships and plant and equipment collateral. |
| (7) | Credit enhancement comprises credit derivatives (bought protection) and guarantees and reflects notional amounts less fair value and notional amounts respectively. |
Business review Capital and risk management
| | Gross | IFRS | Carrying | Balance sheet | Exposure |
| | exposure | offset (1) | value | offset (2) | post offset |
| 2012 | £bn | £bn | £bn | £bn | £bn |
| Cash and balances at central banks | 79.3 | — | 79.3 | — | 79.3 |
| Reverse repos | 143.2 | (38.4) | 104.8 | (17.4) | 87.4 |
| Lending | 464.7 | (1.5) | 463.2 | (42.2) | 421.0 |
| Debt securities | 164.6 | — | 164.6 | — | 164.6 |
| Equity shares | 15.2 | — | 15.2 | — | 15.2 |
Derivatives (3) | 815.4 | (373.5) | 441.9 | (409.2) | 32.7 |
| Settlement balances | 8.1 | (2.4) | 5.7 | (1.8) | 3.9 |
| Other financial assets | 1.1 | — | 1.1 | — | 1.1 |
| Total | 1,691.6 | (415.8) | 1,275.8 | (470.6) | 805.2 |
| Short positions | (27.6) | — | (27.6) | — | (27.6) |
| Net of short positions | 1,664.0 | (415.8) | 1,248.2 | (470.6) | 777.6 |
| (1) | Relates to offset arrangements that comply with IFRS criteria and transactions cleared through and novated to central clearing houses, primarily London Clearing House and US Government Securities Clearing Corporation. |
| (2) | This reflects the amounts by which RBS’s credit risk is reduced through master netting and cash management pooling arrangements. Derivative master netting agreements include cash pledged with counterparties in respect of net derivative liability positions and are included in lending. |
| (3) | Includes cash collateral required against derivative assets of £34.3 billion. |
Key points
| · | Financial assets after credit mitigation and enhancement fell by £35 billion or 9% principally reflecting lower funded assets (£35 billion) as both CIB and RCR implemented strategic balance sheet reductions through wind-down and disposals. |
| · | The major components of net exposure are cash and balances at central banks, unsecured commercial, corporate and bank loans, debt securities and short-term settlement balances. |
| · | Of the £102 billion of debt securities, £25 billion are asset-backed but underlying collateral is not reflected above as RBS only has access to cash flows from the collateral. |
Business review Capital and risk management
Sector concentration
The following tables analyse financial assets by industry sector.
| | | | | | | | Other | | | | |
| | Reverse | | Securities | Derivatives | financial | Balance | | | Exposure |
| | repos | Lending | Debt | Equity | assets | sheet value | Offset (1) | post offset |
| 2014 | £m | £m | £m | £m | £m | £m | £m | | £m | £m |
| Central and local government | 10 | 9,079 | 69,842 | — | 4,857 | 251 | 84,039 | | (5,041) | 78,998 |
| Financial institutions | - banks | 20,708 | 24,812 | 5,090 | 693 | 240,415 | 75,494 | 367,212 | | (248,341) | 118,871 |
| | - other (2) | 43,682 | 39,611 | 24,735 | 1,842 | 92,851 | 4,284 | 207,005 | | (108,993) | 98,012 |
| Personal - mortgages | — | 150,572 | — | — | — | — | 150,572 | | — | 150,572 |
| - unsecured | — | 29,155 | — | — | — | 2 | 29,157 | | — | 29,157 |
| Property | — | 51,546 | 165 | 137 | 2,360 | 8 | 54,216 | | (903) | 53,313 |
| Construction | — | 5,657 | 11 | 53 | 389 | — | 6,110 | | (896) | 5,214 |
| Manufacturing | 265 | 22,035 | 665 | 1,602 | 2,194 | 48 | 26,809 | | (2,032) | 24,777 |
| Finance leases and instalment credit | — | 14,030 | 21 | — | 26 | — | 14,077 | | (1) | 14,076 |
| Retail, wholesale and repairs | — | 18,498 | 252 | 438 | 735 | 13 | 19,936 | | (1,735) | 18,201 |
| Transport and storage | — | 14,299 | 214 | 57 | 2,261 | — | 16,831 | | (1,027) | 15,804 |
| Health, education and leisure | — | 15,932 | 59 | 25 | 670 | — | 16,686 | | (709) | 15,977 |
| Hotels and restaurants | — | 7,969 | 4 | 37 | 180 | — | 8,190 | | (198) | 7,992 |
| Utilities | — | 4,825 | 242 | 127 | 4,357 | — | 9,551 | | (1,150) | 8,401 |
| Other | 30 | 29,593 | 919 | 1,263 | 2,697 | 61 | 34,563 | | (2,776) | 31,787 |
| Total gross of provisions | 64,695 | 437,613 | 102,219 | 6,274 | 353,992 | 80,161 | 1,044,954 | | (373,802) | 671,152 |
| Provisions | — | (18,040) | (277) | (67) | — | — | (18,384) | | n/a | (18,384) |
| Total | 64,695 | 419,573 | 101,942 | 6,207 | 353,992 | 80,161 | 1,026,570 | | (373,802) | 652,768 |
| | | | | | | | | | | |
| 2013 | | | | | | | | | | |
| Central and local government | 247 | 8,643 | 70,267 | — | 4,049 | 578 | 83,784 | | (4,433) | 79,351 |
| Financial institutions | - banks | 26,557 | 27,640 | 7,869 | 688 | 200,091 | 82,661 | 345,506 | | (207,203) | 138,303 |
| | - other (2) | 49,156 | 35,948 | 33,219 | 2,538 | 69,851 | 4,859 | 195,571 | | (90,610) | 104,961 |
| Personal - mortgages | — | 148,533 | — | — | — | — | 148,533 | | — | 148,533 |
| - unsecured | — | 28,160 | — | — | — | 6 | 28,166 | | — | 28,166 |
| Property | — | 62,292 | 225 | 326 | 2,794 | — | 65,637 | | (689) | 64,948 |
| Construction | — | 6,331 | 24 | 117 | 451 | 7 | 6,930 | | (1,370) | 5,560 |
| Manufacturing | 466 | 21,377 | 735 | 2,168 | 1,265 | 43 | 26,054 | | (2,525) | 23,529 |
| Finance leases and instalment credit | — | 13,587 | 14 | 5 | 13 | — | 13,619 | | (17) | 13,602 |
| Retail, wholesale and repairs | — | 19,574 | 244 | 446 | 882 | 11 | 21,157 | | (1,962) | 19,195 |
| Transport and storage | — | 16,697 | 299 | 82 | 2,186 | — | 19,264 | | (866) | 18,398 |
| Health, education and leisure | — | 16,084 | 103 | 86 | 661 | 14 | 16,948 | | (853) | 16,095 |
| Hotels and restaurants | — | 6,942 | 5 | 57 | 218 | — | 7,222 | | (165) | 7,057 |
| Utilities | — | 4,960 | 176 | 285 | 3,271 | 23 | 8,715 | | (1,064) | 7,651 |
| Other | 28 | 28,624 | 762 | 2,112 | 2,308 | 50 | 33,884 | | (2,776) | 31,108 |
| Total gross of provisions | 76,454 | 445,392 | 113,942 | 8,910 | 288,040 | 88,252 | 1,020,990 | | (314,533) | 706,457 |
| Provisions | — | (25,225) | (319) | (99) | — | — | (25,643) | | n/a | (25,643) |
| Total | 76,454 | 420,167 | 113,623 | 8,811 | 288,040 | 88,252 | 995,347 | | (314,533) | 680,814 |
| | | | | | | | | | | | |
| For the notes to this table refer to the following page. | | | | | | | | | |
Business review Capital and risk management
| | | | | | | | Other | | | | |
| | Reverse | | Securities | | financial | Balance | | | Exposure |
| | repos | Lending | Debt | Equity | Derivatives | assets | sheet value | Offset (1) | post offset |
| 2012 | £m | £m | £m | £m | £m | £m | £m | | £m | £m |
| Central and local government | 441 | 9,853 | 97,339 | — | 5,791 | 591 | 114,015 | | (5,151) | 108,864 |
| Financial institutions | - banks | 34,783 | 31,394 | 11,555 | 1,643 | 335,521 | 79,308 | 494,204 | | (341,103) | 153,101 |
| | - other (2) | 69,256 | 42,198 | 50,104 | 2,672 | 80,817 | 5,591 | 250,638 | | (106,021) | 144,617 |
| Personal - mortgages | — | 149,625 | — | — | — | — | 149,625 | | — | 149,625 |
| - unsecured | — | 32,212 | — | — | — | 4 | 32,216 | | — | 32,216 |
| Property | — | 72,219 | 774 | 318 | 4,118 | — | 77,429 | | (1,333) | 76,096 |
| Construction | — | 8,049 | 17 | 264 | 820 | — | 9,150 | | (1,687) | 7,463 |
| Manufacturing | 326 | 23,787 | 836 | 1,639 | 1,759 | 144 | 28,491 | | (3,775) | 24,716 |
| Finance leases and instalment credit | — | 13,609 | 82 | 1 | 13 | — | 13,705 | | — | 13,705 |
| Retail, wholesale and repairs | — | 21,936 | 461 | 1,807 | 914 | 41 | 25,159 | | (1,785) | 23,374 |
| Transport and storage | — | 18,341 | 659 | 382 | 3,397 | 2 | 22,781 | | (3,240) | 19,541 |
| Health, education and leisure | — | 16,705 | 314 | 554 | 904 | 59 | 18,536 | | (964) | 17,572 |
| Hotels and restaurants | — | 7,877 | 144 | 51 | 493 | 11 | 8,576 | | (348) | 8,228 |
| Utilities | — | 6,631 | 1,311 | 638 | 3,170 | 50 | 11,800 | | (2,766) | 9,034 |
| Other | 24 | 30,057 | 1,886 | 5,380 | 4,201 | 172 | 41,720 | | (2,403) | 39,317 |
| Total gross of provisions | 104,830 | 484,493 | 165,482 | 15,349 | 441,918 | 85,973 | 1,298,045 | | (470,576) | 827,469 |
| Provisions | — | (21,262) | (858) | (112) | — | — | (22,232) | | n/a | (22,232) |
| Total | 104,830 | 463,231 | 164,624 | 15,237 | 441,918 | 85,973 | 1,275,813 | | (470,576) | 805,237 |
| (1) | This shows the amount by which credit risk exposure is reduced through arrangements, such as master netting agreements and cash management pooling, which give RBS a legal right to set off the financial asset against a financial liability due to the same counterparty. In addition, RBS holds collateral in respect of individual loans and advances to banks and customers. This collateral includes mortgages over property (both personal and commercial); charges over business assets such as plant, inventories and trade debtors; and guarantees of lending from parties other than the borrower. RBS obtains collateral in the form of securities in reverse repurchase agreements. Cash and securities are received as collateral in respect of derivative transactions. |
| (2) | Includes loans made by consolidated conduits to asset owning companies. |
For geographic concentrations refer to:
| · | Lending: Loans and related credit metrics |
| · | Debt securities: Issuer and IFRS measurement and Country risk |
| · | Derivatives: Summary and uncollateralised exposures |
Key points
| · | Overall exposure before impairment provision post offset fell by £35.3 billion or 5% in 2014 to £671.2 billion. This was in line with RBS's continued focus on reducing exposure concentrations, running down assets in RCR and winding down certain portfolios in CIB. |
| · | Mortgage lending grew by £2.0 billion reflecting a £3.9 billion increase in UK PBB, partially offset by a £1.5 billion decrease in Ulster Bank where repayments outstripped new lending. CFG also saw an increase reflecting portfolio acquisition as well as through foreign currency movements |
| · | Property and construction exposure fell by £12.0 billion, £9.3 billion of which was in commercial real estate lending (refer to Credit risk - Key credit portfolios - Commercial real estate on page 247). |
| · | There has been a significant increase in CFG lending across a broad range of industry sectors reflecting in line with business strategy and risk appetite |
Business review Capital and risk management
Asset quality
The asset quality analysis presented below is based on internal asset quality ratings which have ranges for the probability of default, as set out below. Customers are assigned credit grades, based on various credit grading models that reflect the key drivers of default for the customer type. All credit grades across RBS map to both an asset quality scale, used for external financial reporting, and a master grading scale for wholesale exposures used for internal management reporting across portfolios. Debt securities are analysed by external ratings and are therefore excluded from the following table and are set out on pages 277 to 279.
The table below details, for illustrative purposes only, the relationship between internal asset quality (AQ) bands and external ratings published by S&P, for illustrative purposes only. This relationship is established by observing S&P’s default study statistics, notably the one year default rates for each S&P rating grade. A degree of judgement is required to relate the probability of default (PD) ranges associated with the master grading scale to these default rates given that, for example, the S&P published default rates do not increase uniformly by grade and the historical default rate is nil for the highest rating categories.
Asset quality band | Probability of default range | Indicative S&P rating |
| AQ1 | 0% - 0.034% | AAA to AA |
| AQ2 | 0.034% - 0.048% | AA- |
| AQ3 | 0.048% - 0.095% | A+ to A |
| AQ4 | 0.095% - 0.381% | A- to BBB- |
| AQ5 | 0.381% - 1.076% | BB+ to BB |
| AQ6 | 1.076% - 2.153% | BB- to B+ |
| AQ7 | 2.153% - 6.089% | B+ to B |
| AQ8 | 6.089% - 17.222% | B- to CCC+ |
| AQ9 | 17.222% - 100% | CCC to C |
| AQ10 | 100% | D |
The mapping to the S&P ratings is used by RBS as one of several benchmarks for its wholesale portfolios, depending on customer type and the purpose of the benchmark. The mapping is based on all issuer types rated by S&P. It should therefore be considered illustrative and does not, for instance, indicate that exposures reported against S&P ratings either have been or would be assigned those ratings if assessed by S&P. In addition, the relationship is not relevant for retail portfolios, smaller corporate exposures or specialist corporate segments given that S&P does not typically assign ratings to such issuers.
| | | Loans and advances | | | | | | |
| | | Banks (1) | | Customers | Settlement | | | | | |
| | Cash and | | Derivative | | | | | Derivative | | | balances and | | | | | |
| | balances at | Reverse | cash | Bank | | | Reverse | cash | Customer | | other financial | | | Contingent | | |
| | central banks | repos | collateral | loans | Total | | repos | collateral | loans | Total | assets | Derivatives | Commitments | liabilities | Total | Total |
| 2014 | £m | £m | £m | £m | £m | | £m | £m | £m | £m | £m | £m | £m | £m | £m | % |
| AQ1 | 73,871 | 2,479 | 3,765 | 5,463 | 11,707 | | 27,007 | 12,526 | 33,913 | 73,446 | 1,610 | 65,632 | 53,246 | 6,364 | 285,876 | 24.7 |
| AQ2 | — | 4,143 | 4,625 | 818 | 9,586 | | 400 | 1,602 | 18,077 | 20,079 | 146 | 100,222 | 17,483 | 3,064 | 150,580 | 13.0 |
| AQ3 | 1,433 | 2,538 | 1,348 | 3,047 | 6,933 | | 8,664 | 4,335 | 29,093 | 42,092 | 460 | 123,882 | 29,768 | 5,946 | 210,514 | 18.1 |
| AQ4 | 185 | 8,336 | 1,391 | 2,891 | 12,618 | | 5,124 | 2,798 | 122,349 | 130,271 | 852 | 49,929 | 56,122 | 5,821 | 255,798 | 22.1 |
| AQ5 | — | 2,076 | 225 | 572 | 2,873 | | 1,902 | 520 | 72,994 | 75,416 | 438 | 10,872 | 35,622 | 2,505 | 127,726 | 11.0 |
| AQ6 | — | 636 | 58 | 106 | 800 | | 42 | 45 | 41,468 | 41,555 | 43 | 1,118 | 13,268 | 1,223 | 58,007 | 5.0 |
| AQ7 | — | 500 | 90 | 292 | 882 | | 848 | 34 | 26,203 | 27,085 | 26 | 1,146 | 6,991 | 930 | 37,060 | 3.2 |
| AQ8 | 5 | — | 1 | 40 | 41 | | — | 6 | 6,386 | 6,392 | 12 | 533 | 848 | 149 | 7,980 | 0.7 |
| AQ9 | — | — | 6 | 32 | 38 | | — | 9 | 4,727 | 4,736 | — | 173 | 404 | 245 | 5,596 | 0.5 |
| AQ10 | — | — | — | — | — | | — | — | 984 | 984 | 31 | 485 | 1,132 | 55 | 2,687 | 0.2 |
| Past due | — | — | — | — | — | | — | — | 8,196 | 8,196 | 1,049 | — | — | — | 9,245 | 0.8 |
| Impaired | — | — | — | 42 | 42 | | — | — | 26,536 | 26,536 | — | — | — | — | 26,578 | 2.3 |
| Impairment | | | | | | | | | | | | | | | | |
provision | — | — | — | (40) | (40) | | — | — | (18,000) | (18,000) | — | — | — | — | (18,040) | (1.6) |
| | 75,494 | 20,708 | 11,509 | 13,263 | 45,480 | | 43,987 | 21,875 | 372,926 | 438,788 | 4,667 | 353,992 | 214,884 | 26,302 | 1,159,607 | 100 |
Business review Capital and risk management
| | | Loans and advances | | | | | | |
| | | Banks (1) | | Customers | Settlement | | | | | |
| | | Reverse | | Bank | | | Reverse | | Customer | | balances and other financial | | | Contingent | | |
| | central banks | repos | collateral | loans | Total | | repos | collateral | loans | Total | assets | Derivatives | Commitments | liabilities | Total | Total |
| 2013 | £m | £m | £m | £m | £m | | £m | £m | £m | £m | £m | £m | £m | £m | £m | % |
| AQ1 | 80,305 | 5,885 | 2,043 | 6,039 | 13,967 | | 30,233 | 10,042 | 34,395 | 74,670 | 2,707 | 71,497 | 64,453 | 6,739 | 314,338 | 28.2 |
| AQ2 | 1 | 4,744 | 4,930 | 672 | 10,346 | | 996 | 1,899 | 17,695 | 20,590 | 192 | 69,949 | 28,717 | 2,940 | 132,735 | 11.9 |
| AQ3 | 1,873 | 2,164 | 1,502 | 2,347 | 6,013 | | 1,857 | 3,796 | 29,364 | 35,017 | 746 | 94,678 | 23,126 | 7,057 | 168,510 | 15.1 |
| AQ4 | 479 | 9,864 | 1,451 | 7,031 | 18,346 | | 10,642 | 1,894 | 99,258 | 111,794 | 470 | 39,157 | 40,984 | 4,430 | 215,660 | 19.3 |
| AQ5 | — | 1,776 | 416 | 662 | 2,854 | | 5,403 | 297 | 77,045 | 82,745 | 717 | 8,826 | 33,507 | 2,087 | 130,736 | 11.7 |
| AQ6 | — | 1,823 | 1 | 157 | 1,981 | | 82 | 38 | 39,324 | 39,444 | 59 | 1,487 | 14,138 | 1,426 | 58,535 | 5.3 |
| AQ7 | — | 301 | — | 237 | 538 | | 684 | 50 | 30,279 | 31,013 | 22 | 978 | 7,437 | 918 | 40,906 | 3.7 |
| AQ8 | 3 | — | — | 48 | 48 | | — | 10 | 8,482 | 8,492 | 58 | 132 | 1,183 | 119 | 10,035 | 0.9 |
| AQ9 | — | — | — | 34 | 34 | | — | 41 | 16,944 | 16,985 | — | 641 | 1,020 | 317 | 18,997 | 1.7 |
| AQ10 | — | — | — | — | — | | — | — | 730 | 730 | — | 695 | 1,274 | 137 | 2,836 | 0.3 |
| Past due | — | — | — | — | — | | — | — | 9,068 | 9,068 | 620 | — | — | — | 9,688 | 0.9 |
| Impaired | — | — | — | 70 | 70 | | — | — | 37,101 | 37,101 | — | — | — | — | 37,171 | 3.3 |
| Impairment | | | | | | | | | | | | | | | | |
| provision | — | — | — | (63) | (63) | | — | — | (25,162) | (25,162) | — | — | — | — | (25,225) | (2.3) |
| | 82,661 | 26,557 | 10,343 | 17,234 | 54,134 | | 49,897 | 18,067 | 374,523 | 442,487 | 5,591 | 288,040 | 215,839 | 26,170 | 1,114,922 | 100 |
| 2012 | | | | | | | | | | | | | | | | |
| AQ1 | 78,039 | 17,806 | 3,713 | 10,913 | 32,432 | | 42,963 | 15,022 | 39,734 | 97,719 | 2,671 | 100,652 | 63,785 | 8,113 | 383,411 | 28.5 |
| AQ2 | 12 | 3,556 | 4,566 | 526 | 8,648 | | 710 | 704 | 13,101 | 14,515 | 185 | 108,733 | 20,333 | 2,810 | 155,236 | 11.6 |
| AQ3 | 1,156 | 5,703 | 2,241 | 2,757 | 10,701 | | 2,886 | 3,917 | 25,252 | 32,055 | 539 | 152,810 | 23,727 | 7,431 | 228,419 | 17.0 |
| AQ4 | 100 | 6,251 | 1,761 | 2,734 | 10,746 | | 14,079 | 2,144 | 104,060 | 120,283 | 1,202 | 58,705 | 40,196 | 5,736 | 236,968 | 17.6 |
| AQ5 | — | 1,183 | 469 | 787 | 2,439 | | 8,163 | 679 | 92,147 | 100,989 | 659 | 13,244 | 28,165 | 2,598 | 148,094 | 11.0 |
| AQ6 | — | 282 | 39 | 357 | 678 | | 86 | 50 | 40,096 | 40,232 | 73 | 2,175 | 13,854 | 1,380 | 58,392 | 4.4 |
| AQ7 | — | 2 | — | 236 | 238 | | 1,133 | 12 | 36,223 | 37,368 | 191 | 3,205 | 19,219 | 1,275 | 61,496 | 4.6 |
| AQ8 | — | — | — | 68 | 68 | | 4 | 2 | 12,812 | 12,818 | 8 | 262 | 5,688 | 185 | 19,029 | 1.4 |
| AQ9 | 1 | — | — | 93 | 93 | | 23 | 7 | 17,431 | 17,461 | 137 | 1,360 | 1,363 | 95 | 20,510 | 1.5 |
| AQ10 | — | — | — | — | — | | — | — | 807 | 807 | 1 | 772 | 1,454 | 238 | 3,272 | 0.2 |
| Past due | — | — | — | — | — | | — | 249 | 10,285 | 10,534 | 999 | — | — | — | 11,533 | 0.9 |
| Impaired | — | — | — | 134 | 134 | | — | — | 38,365 | 38,365 | — | — | — | — | 38,499 | 2.9 |
| Impairment | | | | | | | | | | | | | | | | |
| provision | — | — | — | (114) | (114) | | — | — | (21,148) | (21,148) | — | — | — | — | (21,262) | (1.6) |
| | 79,308 | 34,783 | 12,789 | 18,491 | 66,063 | | 70,047 | 22,786 | 409,165 | 501,998 | 6,665 | 441,918 | 217,784 | 29,861 | 1,343,597 | 100 |
| (1) | Excludes items in the course of collection from other banks of £995 million (2013 - £1,454 million; 2012 - £1,531 million). |
Key points
| · | The improving economic climate and credit conditions and disposals strategy in RCR resulted in the proportion of investment-grade (AQ1-AQ4) increasing from 75% to 78%. |
| · | Derivatives increased by £66.0 billion, primarily in AQ2-AQ4 bands. |
| · | Reverse repos: AQ1 balances decreased by £6.6 billion reflecting reduced overall trading in line with balance sheet management strategies. Also, changes to the large corporate grading models resulted in migrations from higher to lower quality AQ bands; this contributed to the £7.2 billion increase in AQ3. |
| · | Asset quality of customer lending in AQ1-AQ3 remained stable with higher cash collateral against increased fair value of derivatives, partially offset by a reduction in traded loans in CIB asset-backed products. |
| · | The increase of £23 billion in AQ4 customer loans was primarily due to the recalibration of UK residential mortgage models following improvements in observed default rates and the implementation of the large corporate PD model. |
| · | Changes to the residential mortgage model and large corporate PD model also resulted in increases of £6.6 billion and £15.1 billion in AQ3 and AQ4 commitments. |
| · | Past due loans decreased by £0.9 billion including £0.5 billion in Ulster Bank reflecting increased work with customers in arrears and improving economic conditions. Past due loans comprise £1.6 billion (2013 - £2.2 billion) of accruing past due 90 days or more loans included within risk elements in lending and £6.6 billion (2013 - £6.8 billion) of loans that are past due less than 90 days. Of the total past due loans, £4.8 billion (2013 - £5.2 billion) relates to personal loans. |
Business review Capital and risk management
Debt securities
Issuer and IFRS measurement classification The table below analyses debt securities by issuer and IFRS measurement classifications. US central and local government includes US federal agencies. The other financial institutions category includes US government sponsored agencies and securitisation entities, the latter principally relating to asset-backed securities (ABS).
| | Central and local government | | Other financial | | | | Of which |
| | UK | US | Other | Banks | institutions | Corporate | Total | ABS |
| 2014 | £m | £m | £m | £m | £m | £m | £m | | £m |
| Held-for-trading (HFT) | 6,218 | 7,709 | 24,451 | 1,499 | 7,372 | 1,977 | 49,226 | | 3,559 |
| Designated as at fair value (DFV) | — | — | 111 | 2 | 4 | — | 117 | | — |
| Available-for-sale (AFS) | 4,747 | 11,011 | 11,058 | 3,404 | 14,585 | 161 | 44,966 | | 18,884 |
| Loans and receivables (LAR) | — | — | — | 185 | 2,774 | 137 | 3,096 | | 2,734 |
| Held-to-maturity | 4,537 | — | — | — | — | — | 4,537 | | — |
| Long positions | 15,502 | 18,720 | 35,620 | 5,090 | 24,735 | 2,275 | 101,942 | | 25,177 |
| | | | | | | | | | |
| Of which US agencies | — | 6,222 | — | — | 10,860 | — | 17,082 | | 16,053 |
| | | | | | | | | | |
| Short positions (HFT) | (4,167) | (6,413) | (10,276) | (557) | (674) | (731) | (22,818) | | — |
| | | | | | | | | | |
| Available-for-sale | | | | | | | | | |
| Gross unrealised gains | 451 | 210 | 541 | 8 | 361 | 6 | 1,577 | | 389 |
| Gross unrealised losses | (1) | (117) | (3) | (1) | (158) | (2) | (282) | | (257) |
| | | | | | | | | | |
| 2013 | | | | | | | | | |
| Held-for-trading | 6,764 | 10,951 | 22,818 | 1,720 | 12,406 | 1,947 | 56,606 | | 10,674 |
| Designated as at fair value | — | — | 104 | — | 17 | 1 | 122 | | 15 |
| Available-for-sale | 6,436 | 12,880 | 10,303 | 5,974 | 17,330 | 184 | 53,107 | | 24,174 |
| Loans and receivables | 10 | 1 | — | 175 | 3,466 | 136 | 3,788 | | 3,423 |
| Long positions | 13,210 | 23,832 | 33,225 | 7,869 | 33,219 | 2,268 | 113,623 | | 38,286 |
| | | | | | | | | | |
| Of which US agencies | — | 5,599 | — | — | 13,132 | — | 18,731 | | 18,048 |
| | | | | | | | | | |
| Short positions (HFT) | (1,784) | (6,790) | (16,087) | (889) | (1,387) | (826) | (27,763) | | (36) |
| | | | | | | | | | |
| Available-for-sale | | | | | | | | | |
| Gross unrealised gains | 201 | 428 | 445 | 70 | 386 | 11 | 1,541 | | 458 |
| Gross unrealised losses | (69) | (86) | (32) | (205) | (493) | (2) | (887) | | (753) |
| | | | | | | | | | |
| 2012 | | | | | | | | | |
| Held-for-trading | 7,692 | 17,349 | 27,195 | 2,243 | 21,876 | 2,015 | 78,370 | | 18,619 |
| Designated as at fair value | — | — | 123 | 86 | 610 | 54 | 873 | | 516 |
| Available-for-sale | 9,774 | 19,046 | 16,155 | 8,861 | 23,890 | 3,167 | 80,893 | | 30,743 |
| Loans and receivables | 5 | — | — | 365 | 3,728 | 390 | 4,488 | | 3,707 |
| Long positions | 17,471 | 36,395 | 43,473 | 11,555 | 50,104 | 5,626 | 164,624 | | 53,585 |
| | | | | | | | | | |
| Of which US agencies | — | 5,380 | — | — | 21,566 | — | 26,946 | | 24,828 |
| | | | | | | | | | |
| Short positions (HFT) | (1,538) | (10,658) | (11,355) | (1,036) | (1,595) | (798) | (26,980) | | (17) |
| | | | | | | | | | |
| Available-for-sale | | | | | | | | | |
| Gross unrealised gains | 1,007 | 1,092 | 1,187 | 110 | 660 | 120 | 4,176 | | 764 |
| Gross unrealised losses | — | (1) | (14) | (509) | (1,319) | (4) | (1,847) | | (1,817) |
Business review Capital and risk management
Key points
| · | HFT- Holdings of US government and ABS (primarily in the US) decreased reflecting sales and continued focus on balance sheet reduction and capital management in CIB. The increase in other government bonds reflected higher activity and timing of auctions. There was an increase in German, French and Austrian government bonds, partially offset by reductions in Italian, Spanish and Japanese bonds. The decrease in short positions reflects positions settled due to increased prices resulting from low yields due to economic volatility in the eurozone. |
| · | AFS - Treasury took advantage of improved market conditions to reduce legacy banks and other financial institutions positions; consequently it no longer has any mortgage-backed covered bonds (2013 - £4.6 billion). |
| · | Gross unrealised losses on AFS debt securities have declined significantly from £1.8 billion in 2012 and £0.9 billion in 2013 to £282 million at the end of 2014. £257 million of the £282 million was due to asset-backed securities, of which only £128 million related to those that had been in a loss position for more than a year primarily reflecting risk reduction in RCR compared with £0.6 billion and £1.8 billion in 2013 and 2012. |
| Ratings | | | | | | | | | |
| The table below analyses debt securities by issuer and external ratings. Ratings are based on the lowest of Standard and Poor’s, Moody’s and Fitch. |
| | | | | | | | | | |
| | Central and local government | | Other financial | | | | Of which |
| | UK | US | Other | Banks | institutions | Corporate | Total | Total | ABS |
| 2014 | £m | £m | £m | £m | £m | £m | £m | % | £m |
| AAA | — | 6 | 15,533 | 1,319 | 6,086 | 77 | 23,021 | 23 | 4,762 |
| AA to AA+ | 15,502 | 18,714 | 9,879 | 283 | 12,215 | 117 | 56,710 | 56 | 16,956 |
| A to AA- | — | — | 4,958 | 2,670 | 2,534 | 340 | 10,502 | 10 | 688 |
| BBB- to A- | — | — | 4,822 | 277 | 1,184 | 772 | 7,055 | 7 | 853 |
| Non-investment grade | — | — | 331 | 61 | 1,247 | 603 | 2,242 | 2 | 1,060 |
| Unrated | — | — | 97 | 480 | 1,469 | 366 | 2,412 | 2 | 858 |
| | 15,502 | 18,720 | 35,620 | 5,090 | 24,735 | 2,275 | 101,942 | 100 | 25,177 |
| 2013 | | | | | | | | | |
| AAA | — | 18 | 13,106 | 1,434 | 8,155 | 162 | 22,875 | 20 | 6,796 |
| AA to AA+ | 13,210 | 23,812 | 7,847 | 446 | 16,825 | 138 | 62,278 | 55 | 21,054 |
| A to AA- | — | — | 4,200 | 1,657 | 1,521 | 290 | 7,668 | 7 | 1,470 |
| BBB- to A- | — | — | 7,572 | 3,761 | 2,627 | 854 | 14,814 | 13 | 4,941 |
| Non-investment grade | — | — | 494 | 341 | 2,444 | 427 | 3,706 | 3 | 2,571 |
| Unrated | — | 2 | 6 | 230 | 1,647 | 397 | 2,282 | 2 | 1,454 |
| | 13,210 | 23,832 | 33,225 | 7,869 | 33,219 | 2,268 | 113,623 | 100 | 38,286 |
| 2012 | | | | | | | | | |
| AAA | 17,471 | 31 | 17,167 | 2,304 | 11,502 | 174 | 48,649 | 30 | 10,758 |
| AA to AA+ | — | 36,357 | 7,424 | 1,144 | 26,403 | 750 | 72,078 | 44 | 28,775 |
| A to AA- | — | 6 | 11,707 | 2,930 | 3,338 | 1,976 | 19,957 | 12 | 2,897 |
| BBB- to A- | — | — | 6,245 | 4,430 | 4,217 | 1,643 | 16,535 | 10 | 7,394 |
| Non-investment grade | — | — | 928 | 439 | 3,103 | 614 | 5,084 | 3 | 2,674 |
| Unrated | — | 1 | 2 | 308 | 1,541 | 469 | 2,321 | 1 | 1,087 |
| | 17,471 | 36,395 | 43,473 | 11,555 | 50,104 | 5,626 | 164,624 | 100 | 53,585 |
| | | | | | | | | | |
Business review Capital and risk management
| Asset-backed securities | | | | | | | | | | |
| The table below summarises the ratings of asset-backed securities on the balance sheet. | |
| | | | | | | | | | | |
| 2014 | RMBS (1) | | | | | | |
| | Government | Prime | | Sub-prime | MBS | | | | | |
| | sponsored | | Non- | | covered | CMBS (1) | CDOs | CLOs | Other | Total |
| | or similar (2) | | conforming | | bond | | | | ABS | |
| | £m | £m | £m | £m | £m | £m | £m | £m | £m | £m |
| AAA | — | 2,417 | 775 | 14 | — | 30 | 29 | 4 | 1,493 | 4,762 |
| AA to AA+ | 12,906 | 5 | 656 | 17 | — | 3,156 | 7 | 72 | 137 | 16,956 |
| A to AA- | 120 | 83 | 27 | 3 | — | 41 | 6 | 11 | 397 | 688 |
| BBB- to A- | — | 92 | 137 | 12 | — | 18 | 4 | 59 | 531 | 853 |
Non-investment grade (3) | — | 211 | 261 | 135 | — | 65 | 240 | 52 | 96 | 1,060 |
Unrated (4) | — | 22 | — | 24 | — | 474 | 9 | 31 | 298 | 858 |
| | 13,026 | 2,830 | 1,856 | 205 | — | 3,784 | 295 | 229 | 2,952 | 25,177 |
| | | | | | | | | | | |
| Of which: | | | | | | | | | | |
| US | 12,906 | 1,177 | 251 | 196 | — | 3,205 | 226 | 101 | 632 | 18,694 |
| UK | — | 879 | 1,605 | 7 | — | 507 | — | 6 | 975 | 3,979 |
| Europe | 120 | 770 | — | 2 | — | 72 | 69 | 122 | 1,320 | 2,475 |
| RoW | — | 4 | — | — | — | — | — | — | 25 | 29 |
| | 13,026 | 2,830 | 1,856 | 205 | — | 3,784 | 295 | 229 | 2,952 | 25,177 |
| 2013 | | | | | | | | | | |
| AAA | 871 | 2,974 | 790 | 24 | 145 | 165 | 66 | 313 | 1,448 | 6,796 |
| AA to AA+ | 16,226 | 192 | 634 | 28 | 216 | 3,224 | — | 309 | 225 | 21,054 |
| A to AA- | 158 | 151 | 227 | 34 | 48 | 60 | 60 | 167 | 565 | 1,470 |
| BBB- to A- | 13 | 126 | 162 | 95 | 3,806 | 102 | 25 | 165 | 447 | 4,941 |
Non-investment grade (3) | 5 | 559 | 369 | 492 | 351 | 160 | 258 | 144 | 233 | 2,571 |
Unrated (4) | — | 100 | 16 | 225 | — | 498 | 21 | 118 | 476 | 1,454 |
| | 17,273 | 4,102 | 2,198 | 898 | 4,566 | 4,209 | 430 | 1,216 | 3,394 | 38,286 |
| | | | | | | | | | | |
| Of which: | | | | | | | | | | |
| US | 14,870 | 1,532 | 379 | 775 | 48 | 3,523 | 314 | 823 | 1,349 | 23,613 |
| UK | — | 1,696 | 1,770 | 78 | 202 | 558 | 1 | 15 | 943 | 5,263 |
| Europe | 2,403 | 775 | 49 | 45 | 4,316 | 127 | 115 | 378 | 1,063 | 9,271 |
| RoW | — | 99 | — | — | — | 1 | — | — | 39 | 139 |
| | 17,273 | 4,102 | 2,198 | 898 | 4,566 | 4,209 | 430 | 1,216 | 3,394 | 38,286 |
| 2012 | | | | | | | | | | |
| AAA | 2,454 | 2,854 | 1,487 | 11 | 639 | 396 | 92 | 1,181 | 1,644 | 10,758 |
| AA to AA+ | 23,692 | 613 | 88 | 26 | 102 | 2,551 | 7 | 887 | 809 | 28,775 |
| A to AA- | 201 | 302 | 275 | 33 | 155 | 808 | 74 | 146 | 903 | 2,897 |
| BBB- to A- | 990 | 53 | 141 | 86 | 4,698 | 441 | 32 | 291 | 662 | 7,394 |
Non-investment grade (3) | 20 | 641 | 454 | 330 | 136 | 304 | 421 | 133 | 235 | 2,674 |
Unrated (4) | — | 108 | 8 | 298 | — | 23 | 94 | 388 | 168 | 1,087 |
| | 27,357 | 4,571 | 2,453 | 784 | 5,730 | 4,523 | 720 | 3,026 | 4,421 | 53,585 |
| | | | | | | | | | | |
| Of which: | | | | | | | | | | |
| US | 22,460 | 717 | 477 | 660 | 48 | 3,274 | 480 | 2,550 | 1,401 | 32,067 |
| UK | — | 2,552 | 1,918 | 73 | 204 | 821 | 22 | 12 | 1,400 | 7,002 |
| Europe | 4,879 | 912 | 58 | 46 | 5,478 | 425 | 218 | 464 | 1,309 | 13,789 |
| RoW | 18 | 390 | — | 5 | — | 3 | — | — | 311 | 727 |
| | 27,357 | 4,571 | 2,453 | 784 | 5,730 | 4,523 | 720 | 3,026 | 4,421 | 53,585 |
| (1) | Residential mortgage-backed securities (RMBS) and commercial mortgaged-backed securities (CMBS) are securities that represent an interest in a portfolio of residential and commercial mortgages respectively. Repayments made on the underlying mortgages are used to make payments to holders of the mortgage-backed securities (MBS). The risk of the MBS will vary primarily depending on the quality and geographic region in which the underlying mortgage assets are located and the credit enhancement of the securitisation structure. Several tranches of notes are issued, each secured against the same portfolio of mortgages, but providing differing levels of seniority to match the risk appetite of investors. The most junior (or equity) notes will suffer early capital and interest losses experienced by the referenced mortgage collateral, with each more senior note benefiting from the protection provided by the subordinated notes below. Additional credit enhancements may be provided to the holder of senior MBS notes. |
The main categories of mortgages that serve as collateral to RMBS held by RBS are set out below and described in the Glossary on pages 506 to 512. The US market has more established definitions of differing underlying mortgage quality and these are used as the basis for RBS's RMBS categorisation.
| (2) | Includes US agency and Dutch government guaranteed securities. |
| (3) | Comprises HFT £387 million (2013 - £1,275 million; 2012 - £1,177 million), DFV nil (2013 - nil; 2012 - £7 million), AFS £645 million (2013 - £1,138 million; 2012 - £1,173 million) and LAR £28 million (2013 - £158 million; 2012 - £317 million). |
| (4) | Comprises HFT £100 million (2013 - £504 million; 2012 - £808 million), AFS £30 million (2013 - £26 million; 2012 - £149 million) and LAR £728 million (2013 - £924 million; 2012 - £130 million). |
Business review Capital and risk management
Equity shares
The table below analyses holdings of equity shares for eurozone countries and other countries with balances of more than £100 million by country, issuer and measurement classification. The HFT positions in CIB, primarily in run-off and recovery businesses, are used mainly for economic hedging of debt issuances and equity derivatives. The AFS portfolios include capital stock in the Federal Home Loan Bank (a government sponsored entity, included in other financial institutions) and the Federal Reserve Bank, which together amounted to £0.6 billion (2013 - £0.6 billion; 2012 - £0.7 billion) that CFG are required to hold. The remaining AFS balances are individually small holdings in unlisted companies, mainly acquired through debt for equity transactions in Restructuring.
| | 2014 |
| | HFT | | | AFS/DFV (1) | | | | |
| | | | Other financial | | | | | Other financial | | Total | | | | AFS |
| | Banks | | institutions (2) | Corporate | Total | | Banks | institutions (2) | Corporate | AFS/DFV | | Total | reserves |
| Countries | £m | | £m | £m | £m | | £m | £m | £m | £m | | £m | £m |
| Spain | — | | — | 19 | 19 | | — | — | 1 | 1 | | 20 | | — |
| Ireland | — | | 20 | 16 | 36 | | — | 6 | 20 | 26 | | 62 | | — |
| Italy | — | | — | 3 | 3 | | — | 5 | 4 | 9 | | 12 | | — |
| Portugal | — | | — | 1 | 1 | | — | — | — | — | | 1 | | — |
| Eurozone periphery | — | | 20 | 39 | 59 | | — | 11 | 25 | 36 | | 95 | | — |
| | | | | | | | | | | | | | | |
| Luxembourg | — | | 150 | 5 | 155 | | — | — | — | — | | 155 | | — |
| Other | 3 | | 44 | 88 | 135 | | 5 | 72 | 58 | 135 | | 270 | | 17 |
| Total eurozone | 3 | | 214 | 132 | 349 | | 5 | 83 | 83 | 171 | | 520 | | 17 |
| | | | | | | | | | | | | | | |
| US | 1 | | 164 | 123 | 288 | | 305 | 392 | 4 | 701 | | 989 | | 26 |
| UK | 303 | | 445 | 1,458 | 2,206 | | — | 206 | 173 | 379 | | 2,585 | | 84 |
| Japan | 4 | | 161 | 1,509 | 1,674 | | — | 1 | — | 1 | | 1,675 | | — |
| Australia | 39 | | 34 | 36 | 109 | | — | — | — | — | | 109 | | — |
| Other | 33 | | 33 | 129 | 195 | | — | 109 | 25 | 134 | | 329 | | 52 |
| Total | 383 | | 1,051 | 3,387 | 4,821 | | 310 | 791 | 285 | 1,386 | | 6,207 | | 179 |
| | | | | | | | | | | | | | | |
| | | | | | | | | | | | | | | |
| 2013 | 515 | | 1,645 | 5,039 | 7,199 | | 173 | 893 | 546 | 1,612 | | 8,811 | | 149 |
| 2012 | 1,301 | | 2,056 | 9,972 | 13,329 | | 342 | 616 | 950 | 1,908 | | 15,237 | | 84 |
| (1) | Designated as at fair value through profit or loss balances are £301 million (2013 - £400 million; 2012 - £533 million), of which £130 million are other financial institutions (2013 - £105 million; 2012 - £61 million) and £171 million are corporate (2013 - £295 million; 2012 - £472 million). |
| (2) | Includes government sponsored entities. |
| (3) | HFT short positions of £211 million (2013 - £259 million; 2012 - £611 million) included £15 million (2013 - £75 million; 2012 - £101 million) relating to non-periphery eurozone countries. |
Business review Capital and risk management
Summary and uncollateralised exposures
The table below analyses derivatives by type of contract. The master netting agreements and collateral shown below do not result in a net presentation on the balance sheet under IFRS.
| | 2014 | | 2013 | | 2012 |
| | Notional (1) | | | | | | | | | | |
| | GBP | USD | Euro | Other | Total | Assets | Liabilities | | Notional (1) | Assets | Liabilities | | Notional (1) | Assets | Liabilities |
| | £bn | £bn | £bn | £bn | £bn | £m | £m | | £bn | £m | £m | | £bn | £m | £m |
Interest rate (2) | 5,335 | 9,829 | 7,822 | 4,345 | 27,331 | 269,912 | 259,971 | | 35,589 | 218,041 | 208,698 | | 33,483 | 363,454 | 345,565 |
| Exchange rate | 319 | 2,110 | 667 | 1,579 | 4,675 | 78,707 | 83,781 | | 4,555 | 61,923 | 65,749 | | 4,698 | 63,067 | 70,481 |
| Credit | 2 | 66 | 36 | 21 | 125 | 2,254 | 2,615 | | 253 | 5,306 | 5,388 | | 553 | 11,005 | 10,353 |
| Equity and commodity | 21 | 22 | 24 | 11 | 78 | 3,119 | 3,582 | | 81 | 2,770 | 5,692 | | 111 | 4,392 | 7,941 |
| | | | | | | 353,992 | 349,949 | | | 288,040 | 285,527 | | | 441,918 | 434,340 |
| Counterparty mark-to-market netting | | | | (295,315) | (295,315) | | | (241,265) | (241,265) | | | (374,887) | (374,887) |
| Cash collateral | | | | | | (33,272) | (30,203) | | | (24,423) | (25,302) | | | (34,291) | (31,863) |
| Securities collateral | | | | | | (7,013) | (14,437) | | | (5,990) | (8,257) | | | (5,644) | (11,702) |
| Net exposure | | | | | | 18,392 | 9,994 | | | 16,362 | 10,703 | | | 27,096 | 15,888 |
| | | | | | | | | | | | | | | | |
| Net exposure by sector | | | | | | | | | | | | | | |
| Banks | | | | | | 1,875 | 1,534 | | | 1,524 | 1,574 | | | | |
| Other financial institutions | | | | | 4,035 | 3,721 | | | 4,619 | 4,484 | | | | |
| Corporate | | | | | | 11,186 | 4,382 | | | 9,351 | 4,217 | | | | |
| Government | | | | | | 1,296 | 357 | | | 868 | 428 | | | | |
| | | | | | | 18,392 | 9,994 | | | 16,362 | 10,703 | | | | |
| | | | | | | | | | | | | | | | |
| Net exposure by region of counterparty | | | | | | | | | | | | |
| UK | | | | | | 9,037 | 3,233 | | | 8,937 | 3,681 | | | | |
| Europe | | | | | 5,628 | 3,521 | | | 4,497 | 3,717 | | | | |
| US | | | | | | 1,544 | 1,280 | | | 1,441 | 1,806 | | | | |
| RoW | | | | | | 2,183 | 1,960 | | | 1,487 | 1,499 | | | | |
| | | | | | | 18,392 | 9,994 | | | 16,362 | 10,703 | | | | |
| | | | | | | | | | | |
| Asset quality of uncollateralised derivative assets | £m | | | | £m | | | | | |
| AQ1 | | | | | | 3,783 | | | | 5,902 | | | | | |
| AQ2 | | | | | | 1,623 | | | | 271 | | | | | |
| AQ3 | | | | | | 2,875 | | | | 1,799 | | | | | |
| AQ4 | | | | | | 6,266 | | | | 2,115 | | | | | |
| AQ5 | | | | | | 1,779 | | | | 2,833 | | | | | |
| AQ6 | | | | | | 673 | | | | 1,635 | | | | | |
| AQ7 | | | | | | 606 | | | | 749 | | | | | |
| AQ8 | | | | | | 151 | | | | 857 | | | | | |
| AQ9 | | | | | | 151 | | | | 103 | | | | | |
| AQ10 | | | | | | 485 | | | | 98 | | | | | |
| | | | | | | 18,392 | | | | 16,362 | | | | | |
Notes:
| (1) | Includes exchange traded contracts of £2,436 billion (2013 - £2,298 billion; 2012 - £2,497 billion) principally interest rate. Trades are margined daily hence carrying values were insignificant: assets - £8 million (2013 - £69 million; 2012 - £41 million) and liabilities - £119 million (2013 - £299 million; 2012 - £255 million). |
| (2) | Interest rate notional includes £18,452 billion (2013 - £22,563 billion; 2012 - £15,864 billion) in respect of contracts with central clearing counterparties to the extent related assets and liabilities are offset. |
Business review Capital and risk management
Key points
| · | Interest rate contracts: notional balances were £8.3 trillion lower due to increased participation in trade compression cycles in 2014. The fair value increased due to significant downward shifts in major yields following further rate cuts by the European Central Bank, European instability including Germany as well as concerns over falling oil prices. This was partially offset by the impact of strengthening of sterling against the euro and participation in tear ups. |
| · | Foreign exchange contracts: the increase in fair value is driven by the strengthening of the US dollar against the Japanese yen as the portfolio was materially positioned long US dollar and short Japanese yen. |
| · | Credit derivatives: notional and fair value decreased reflecting participation in trade compression cycles and reduction in the US Agency business within CIB. Tightening of credit spreads in Europe and long dated spreads in the US also contributed to decrease in fair values. |
| · | Uncollateralised derivatives predominantly comprise: |
| | ° | Corporates: predominantly large corporates with whom RBS may have netting arrangements in place, but operational capability does not support collateral posting. Transactions include foreign exchange hedges and interest rate swaps. |
| | ° | Banks: transactions with certain counterparties with whom RBS has netting arrangements but collateral is not posted on a daily basis; certain transactions with specific terms that may not fall within netting and collateral arrangements; derivative positions in certain jurisdictions for example China which are either uncollateralised or the collateral agreements are not deemed to be legally enforceable. |
| | ° | Other financial institutions: transactions with securitisation structured purpose entities and funds where collateral posting is contingent on RBS’s external rating. |
| | ° | Government: sovereigns and supranational entities with one way collateral agreements in their favour. |
Business review Capital and risk management
Settlement basis and central counterparties
The table below analyses the derivative notional and fair value by trading and settlement method.
| | Notional | | Asset | | Liability |
| | | Traded over the counter | | | | | | | |
| | Traded on | | Not settled | | | Traded on | Traded | | Traded on | Traded |
| | recognised | Settled by central | by central | | | recognised | over the | | recognised | over the |
| | exchanges | counterparties | counterparties | Total | | exchanges | counter | | exchanges | counter |
| 2014 | £bn | £bn | £bn | £bn | | £m | £m | | £m | £m |
| Interest rate | 2,383 | 18,452 | 6,496 | 27,331 | | 5 | 269,908 | | 5 | 259,966 |
| Exchange rate | 53 | — | 4,622 | 4,675 | | — | 78,706 | | — | 83,781 |
| Credit | — | 22 | 103 | 125 | | — | 2,254 | | — | 2,615 |
| Equity and commodity | — | — | 78 | 78 | | 3 | 3,116 | | 114 | 3,468 |
| | | | | | | | | | | |
| 2013 | | | | | | | | | | |
| Interest rate | 2,203 | 22,565 | 10,821 | 35,589 | | 65 | 217,976 | | 79 | 208,619 |
| Exchange rate | 94 | 2 | 4,459 | 4,555 | | — | 61,923 | | — | 65,749 |
| Credit | — | 30 | 223 | 253 | | — | 5,306 | | — | 5,388 |
| Equity and commodity | — | 1 | 80 | 81 | | 4 | 2,766 | | 220 | 5,472 |
| | | | | | | | | | | |
| 2012 | | | | | | | | | | |
| Interest rate | 2,388 | 15,864 | 15,231 | 33,483 | | 13 | 363,441 | | 55 | 345,510 |
| Exchange rate | 108 | — | 4,590 | 4,698 | | — | 63,067 | | — | 70,481 |
| Credit | — | — | 553 | 553 | | — | 11,005 | | — | 10,353 |
| Equity and commodity | 1 | — | 110 | 111 | | 28 | 4,364 | | 200 | 7,741 |
Credit derivatives
RBS trades credit derivatives to meet client needs and to mitigate its own credit risk. Credit derivative exposures relating to proprietary trading are minimal. The table below analyses bought and sold protection.
| | | | | | | | | | | | | | | | | | |
| | 2014 | | 2013 | | 2012 |
| | Notional | | Fair value | | Notional | | Fair value | | Notional | | Fair value |
| | Bought | Sold | | Bought | Sold | | Bought | Sold | | Bought | Sold | | Bought | Sold | | Bought | Sold |
| By type | £bn | £bn | | £bn | £bn | | £bn | £bn | | £bn | £bn | | £bn | £bn | | £bn | £bn |
Client-led trading/residual risk (1) | 52.1 | 50.0 | | 0.9 | 1.3 | | 124.7 | 111.7 | | 1.2 | 1.5 | | 250.7 | 240.7 | | 3.4 | 3.1 |
Credit hedging - banking book (2) | 1.8 | — | | 0.1 | — | | 2.3 | 0.2 | | 0.2 | — | | 5.4 | 0.4 | | 0.1 | — |
| Credit hedging - trading book | | | | | | | | | | | | | | | | | |
- rates | 14.1 | 6.1 | | 0.2 | 0.3 | | 5.1 | 4.0 | | 0.1 | 0.1 | | 9.4 | 5.8 | | 0.1 | 0.1 |
- credit and mortgage markets | 0.4 | — | | 0.2 | — | | 2.2 | 1.3 | | 0.5 | 0.3 | | 22.4 | 16.0 | | 0.9 | 0.7 |
- other | 0.5 | — | | — | — | | 0.8 | 0.1 | | — | — | | 1.4 | 0.6 | | — | — |
| | 68.9 | 56.1 | | 1.4 | 1.6 | | 135.1 | 117.3 | | 2.0 | 1.9 | | 289.3 | 263.5 | | 4.5 | 3.9 |
| | 2014 | | 2013 | | 2012 |
| | Notional | | Notional | Net exposure | | Notional | Net exposure |
| | £bn | | £bn | £bn | | £bn | £bn |
| of which: | | | | | | | |
Monoline insurers (3) | 0.1 | | 1.6 | 0.1 | | 4.6 | 0.4 |
CDPCs (3) | 15.2 | | 18.8 | 0.1 | | 21.0 | 0.2 |
| (1) | Residual risk relates to legacy positions in RCR in 2014 and in Non-Core in 2013 and 2012. |
| (2) | Credit hedging in the banking book principally relates to portfolio management in RCR and Non-Core. |
| (3) | Credit valuation relating to monoline insurers and credit derivative product companies (CDPCs) were £47 million (2013 - £99 million; 2012 - £506 million). |
Business review Capital and risk management
REIL, provisions and AFS reserves
Risk elements in lending (REIL) comprises impaired loans and accruing loans past due 90 days or more as to principal or interest. Impaired loans are all loans (including loans subject to forbearance) for which an impairment provision has been established; for collectively assessed loans, impairment loss provisions are not allocated to individual loans and the entire portfolio is included in impaired loans. Accruing loans past due 90 days or more comprise loans past due 90 days where no impairment loss is expected.
Loans and related credit metrics
Segmental analysis
The tables below analyse gross loans and advances (excluding reverse repos) and the related credit metrics by reportable segment.
| | | | | | | | | | |
| | | | | Credit metrics | | |
| | | | | REIL as a % | Provisions | Provisions as a % | Impairment | |
| | Gross loans to | | | of gross loans | as a % | of gross loans | charge/ | Amounts |
| | Banks | Customers | REIL | Provisions | to customers | of REIL | to customers | (release) | written-off |
| 2014 | £m | £m | £m | £m | % | % | % | £m | £m |
| UK Personal & Business Banking | 641 | 129,848 | 3,778 | 2,604 | 2.9 | 69 | 2.0 | 268 | 728 |
| Ulster Bank | 1,381 | 24,719 | 4,775 | 2,711 | 19.3 | 57 | 11.0 | (365) | 131 |
| Personal & Business Banking | 2,022 | 154,567 | 8,553 | 5,315 | 5.5 | 62 | 3.4 | (97) | 859 |
| Commercial Banking | 486 | 86,008 | 2,506 | 955 | 2.9 | 38 | 1.1 | 77 | 436 |
| Private Banking | 972 | 16,599 | 226 | 76 | 1.4 | 34 | 0.5 | (5) | 37 |
| Commercial & Private Banking | 1,458 | 102,607 | 2,732 | 1,031 | 2.7 | 38 | 1.0 | 72 | 473 |
| Corporate & Institutional Banking | 16,910 | 72,957 | 197 | 206 | 0.3 | 105 | 0.3 | (7) | — |
| Central items | 2,178 | 619 | 7 | 6 | 1.1 | 86 | 1.0 | (12) | 55 |
| Citizens Financial Group | 1,728 | 60,142 | 1,330 | 536 | 2.2 | 40 | 0.9 | 194 | 300 |
| RCR | 516 | 21,909 | 15,400 | 10,946 | 70.3 | 71 | 50.0 | (1,320) | 3,591 |
| | 24,812 | 412,801 | 28,219 | 18,040 | 6.8 | 64 | 4.4 | (1,170) | 5,278 |
| 2013 | | | | | | | | | |
| UK Personal & Business Banking | 760 | 127,781 | 4,663 | 2,957 | 3.6 | 63 | 2.3 | 497 | 967 |
| Ulster Bank | 591 | 31,446 | 8,466 | 5,378 | 26.9 | 64 | 17.1 | 1,774 | 277 |
| Personal & Business Banking | 1,351 | 159,227 | 13,129 | 8,335 | 8.2 | 63 | 5.2 | 2,271 | 1,244 |
| Commercial Banking | 701 | 85,071 | 4,276 | 1,617 | 5.0 | 38 | 1.9 | 652 | 587 |
| Private Banking | 1,531 | 16,764 | 277 | 120 | 1.7 | 43 | 0.7 | 29 | 15 |
| Commercial & Private Banking | 2,232 | 101,835 | 4,553 | 1,737 | 4.5 | 38 | 1.7 | 681 | 602 |
| Corporate & Institutional Banking | 20,550 | 69,080 | 1,661 | 976 | 2.4 | 59 | 1.4 | 598 | 360 |
| Central items | 2,670 | 341 | 1 | 66 | 0.3 | nm | 19.4 | 65 | — |
| Citizens Financial Group | 406 | 50,551 | 1,034 | 272 | 2.0 | 26 | 0.5 | 151 | 284 |
| Non-Core | 431 | 36,718 | 19,014 | 13,839 | 51.8 | 73 | 37.7 | 4,646 | 1,856 |
| | 27,640 | 417,752 | 39,392 | 25,225 | 9.4 | 64 | 6.0 | 8,412 | 4,346 |
| | | | | | | | | | |
| 2012 | | | | | | | | | |
| UK Personal & Business Banking | 695 | 129,193 | 5,735 | 3,467 | 4.4 | 60 | 2.7 | 740 | 745 |
| Ulster Bank | 632 | 32,652 | 7,533 | 3,910 | 23.1 | 52 | 12.0 | 1,364 | 72 |
| Personal & Business Banking | 1,327 | 161,845 | 13,268 | 7,377 | 8.2 | 56 | 4.6 | 2,104 | 817 |
| Commercial Banking | 746 | 85,243 | 4,007 | 1,547 | 4.7 | 39 | 1.8 | 543 | 358 |
| Private Banking | 1,545 | 17,074 | 248 | 109 | 1.5 | 44 | 0.6 | 46 | 15 |
| Commercial & Private Banking | 2,291 | 102,317 | 4,255 | 1,656 | 4.2 | 39 | 1.6 | 589 | 373 |
| Corporate & Institutional Banking | 21,632 | 80,335 | 1,097 | 743 | 1.4 | 68 | 0.9 | 218 | 564 |
| Central items | 3,196 | 107 | — | 1 | — | nm | 0.9 | 1 | — |
| Citizens Financial Group | 435 | 51,271 | 1,146 | 285 | 2.2 | 25 | 0.6 | 83 | 391 |
| Non-Core | 477 | 56,343 | 21,374 | 11,200 | 37.9 | 52 | 19.9 | 2,320 | 2,121 |
| Direct Line Group | 2,036 | 881 | — | — | — | nm | — | — | — |
| | 31,394 | 453,099 | 41,140 | 21,262 | 9.1 | 52 | 4.7 | 5,315 | 4,266 |
Business review Capital and risk management
| | | | | | | | | | | | | | Impairment provision at |
| | Impairment losses/(releases) for year ended 31 December 2014 | | 31 December 2014 |
| | Individual | | Collective | | Latent | | Total | | | | |
| | Gross | Releases | | Gross | Releases | | Gross | Releases | | Gross | Releases | | Individual | Collective | Latent |
| | £m | £m | | £m | £m | | £m | £m | | £m | £m | | £m | £m | £m |
| UK PBB | 13 | — | | 330 | (133) | | 77 | (19) | | 420 | (152) | | 14 | 2,319 | 271 |
| Ulster Bank | 8 | (18) | | 221 | (251) | | 103 | (428) | | 332 | (697) | | 42 | 2,355 | 314 |
| PBB | 21 | (18) | | 551 | (384) | | 180 | (447) | | 752 | (849) | | 56 | 4,674 | 585 |
| Commercial Banking | 224 | (85) | | 124 | (103) | | 3 | (86) | | 351 | (274) | | 493 | 366 | 96 |
| Private Banking | 8 | (10) | | — | — | | 1 | (4) | | 9 | (14) | | 69 | — | 7 |
| CPB | 232 | (95) | | 124 | (103) | | 4 | (90) | | 360 | (288) | | 562 | 366 | 103 |
| CIB | 88 | (63) | | — | — | | 1 | (33) | | 89 | (96) | | 110 | — | 96 |
| Central items | 11 | (23) | | — | — | | — | — | | 11 | (23) | | 1 | — | 5 |
| CFG | 36 | — | | 142 | — | | 16 | — | | 194 | — | | 83 | 157 | 296 |
| RCR | 761 | (1,759) | | 220 | (235) | | — | (307) | | 981 | 1,217 | | 10,565 | 150 | 231 |
| Total | 1,149 | (1,958) | | 1,037 | (722) | | 201 | (877) | | 2,387 | (39) | | 11,377 | 5,347 | 1,316 |
Key points
| · | Loans to banks decreased by £2.8 billion in the year to £24.8 billion. This reflected RWA focused reduction in trade finance (£5.4 billion) being partially offset by derivative collateral increase, both in CIB, as well as Ulster Bank’s increased cash deposits with Central Bank of Ireland ahead of new regulatory liquidity requirements. |
| · | Overall customer loans fell by £5.0 billion to £412.8 billion reflecting RCR disposal strategy being partly offset by increases in CFG and UK PBB. |
| · | There has been a significant increase in CFG lending across a broad range of industry sectors, including residential mortgages, auto loans and commercial loans, in line with business strategy and risk appetite. Exchange rate movements also contributed to the increase. |
| · | UK PBB’s mortgage book grew strongly by £3.9 billion to £103.2 billion as advisor capacity increased (refer to Credit Risk Key credit portfolios on page 257 for more details). This was partially offset by lower unsecured lending. |
| · | Property and construction lending fell by £11.4 billion, of which £9.3 billion related to commercial real estate lending. Refer to Credit Risk Key loan portfolios on page 247 for more details. |
| · | REIL decreased by £11.2 billion to £28.2 billion, a 28% reduction in the year from £39.4 billion, across all segments except CFG. REIL as a proportion of gross loans improved to 6.8% from 9.4% in 2013 reflecting sales and repayments of £10.2 billion (£6.9 billion in RCR), write-offs of £5.3 billion (£3.6 billion in RCR), transfers to performing book of £1.5 billion, partially off set by new impaired loans of £7.1 billion (£3.0 billion in RCR). The execution of RCR strategy, resulted in a number of disposals of REIL in the year, primarily in the fourth quarter. |
| · | Loan impairment provision coverage of REIL remained stable at 64% and now stands at £18.0 billion, a £7.2 billion reduction in the year. Provision coverage of gross loans has declined steadily during 2014 and is now 4.4% compared with 6.0% at the end of 2013, the latter reflecting the creation of RCR. The reduction in provision reflected write-off of £5.3 billion (£3.6 billion in RCR) and impairment releases of £3.5 billion (£2.3 billion in RCR) partially offset by new charges of £2.4 billion (£1.0 billion in RCR) and currency and other movements. |
| · | Disposal of assets by RCR, primarily in the second half of the year, at higher than anticipated sale prices together with favourable market conditions in Ireland and the UK resulted in impairment releases. Overall, there was a net loan impairment release of £1.2 billion, £1.3 billion in RCR for 2014. |
| · | Commercial real estate (CRE) gross lending reduced by £9.3 billion to £43.3 billion, related REIL is almost half of total RBS REIL and has a provision coverage of 68%. Of the total CRE REIL of £13.3 billion, £11.1 billion is in RCR. |
Within the business segments:
| · | RCR REIL decreased by £8.7 billion or 36% to £15.4 billion from £24.1 billion at 1 January 2014 primarily due to a mixture of asset disposals and write-offs. Provision coverage of REIL and REIL as a proportion of loans were both around 70%. |
| · | In Ulster Bank, REIL as a proportion of loans decreased to 19% from 27% in 2013 and provision coverage of REIL reduced to 57% from 64% in 2013 mainly reflecting asset transfers to RCR on 1 January 2014 but also due to improved market conditions and higher collateral values also contributed. |
| · | Commercial Banking REIL as a proportion of loans decreased to 2.9% from 5.0% in 2013, and REIL decreased by 41% (£1.8 billion) to £2.5 billion, with £0.6 billion of the reduction due to the creation of RCR. REIL reductions in the year were mainly due to lower individual cases, albeit some increases were seen in the fourth quarter and reductions in collectively assessed due to improved credit conditions. |
Business review Capital and risk management
Sector and geographical concentration
The tables below analyse gross loans and advances to banks and customers (excluding reverse repos) and related credit metrics by sector and geography based on the location of lending office.
| | | | | | Credit metrics | | |
| | | | | | REIL | Provisions | Provisions | Impairment | |
| | | Gross | | | as a % of | as a % | as a % of | charge/ | Amounts |
| | | loans | REIL | Provisions | gross loans | of REIL | gross loans | (release) | written-off |
| 2014 | | £m | £m | £m | % | % | % | £m | £m |
| Central and local government | 9,079 | 1 | 1 | — | 100 | — | (1) | — |
| Finance | 39,611 | 364 | 234 | 0.9 | 64 | 0.6 | (5) | 23 |
| Personal | - mortgages | 150,572 | 5,634 | 1,521 | 3.7 | 27 | 1.0 | 36 | 236 |
| | - unsecured | 29,155 | 1,964 | 1,585 | 6.7 | 81 | 5.4 | 401 | 737 |
| Property | 51,546 | 13,021 | 8,918 | 25.3 | 68 | 17.3 | (1,083) | 2,625 |
| Construction | 5,657 | 971 | 612 | 17.2 | 63 | 10.8 | 76 | 202 |
| of which: Commercial real estate | 43,317 | 13,345 | 9,027 | 30.8 | 68 | 20.8 | (1,067) | 2,750 |
| Manufacturing | 22,035 | 461 | 322 | 2.1 | 70 | 1.5 | (26) | 188 |
Finance leases (1) | 14,030 | 156 | 113 | 1.1 | 72 | 0.8 | — | 75 |
| Retail, wholesale and repairs | 18,498 | 956 | 645 | 5.2 | 67 | 3.5 | 106 | 160 |
| Transport and storage | 14,299 | 1,146 | 500 | 8.0 | 44 | 3.5 | 37 | 211 |
| Health, education and leisure | 15,932 | 734 | 366 | 4.6 | 50 | 2.3 | 9 | 349 |
| Hotels and restaurants | 7,969 | 1,094 | 574 | 13.7 | 52 | 7.2 | (40) | 109 |
| Utilities | 4,825 | 156 | 85 | 3.2 | 54 | 1.8 | 16 | 5 |
| Other | 29,593 | 1,519 | 1,208 | 5.1 | 80 | 4.1 | (10) | 349 |
| Latent | — | — | 1,316 | — | — | — | (676) | — |
| | 412,801 | 28,177 | 18,000 | 6.8 | 64 | 4.4 | (1,160) | 5,269 |
| Geographic regional analysis | | | | | | | | |
| UK | | | | | | | | |
- residential mortgages | 113,521 | 1,394 | 191 | 1.2 | 14 | 0.2 | (23) | 76 |
- personal lending | 15,923 | 1,674 | 1,452 | 10.5 | 87 | 9.1 | 290 | 546 |
- property | 37,547 | 6,026 | 3,676 | 16.0 | 61 | 9.8 | (221) | 1,917 |
- construction | 4,098 | 676 | 361 | 16.5 | 53 | 8.8 | (1) | 175 |
- other | 113,782 | 3,287 | 2,467 | 2.9 | 75 | 2.2 | (146) | 847 |
| | | 284,871 | 13,057 | 8,147 | 4.6 | 62 | 2.9 | (101) | 3,561 |
| | | | | | | | | | |
| Europe | | | | | | | | |
- residential mortgages | 15,629 | 3,268 | 1,178 | 20.9 | 36 | 7.5 | (10) | 10 |
- personal lending | 1,051 | 76 | 66 | 7.2 | 87 | 6.3 | 9 | 66 |
- property | 8,021 | 6,907 | 5,197 | 86.1 | 75 | 64.8 | (862) | 699 |
- construction | 1,055 | 289 | 245 | 27.4 | 85 | 23.2 | 78 | 24 |
- other | 19,104 | 2,860 | 2,361 | 15.0 | 83 | 12.4 | (440) | 561 |
| | | 44,860 | 13,400 | 9,047 | 29.9 | 68 | 20.2 | (1,225) | 1,360 |
| | | | | | | | | | |
| US | | | | | | | | |
- residential mortgages | 21,203 | 957 | 150 | 4.5 | 16 | 0.7 | 69 | 150 |
- personal lending | 11,164 | 195 | 49 | 1.7 | 25 | 0.4 | 102 | 125 |
- property | 5,332 | 64 | 19 | 1.2 | 30 | 0.4 | 2 | 7 |
- construction | 413 | 1 | 1 | 0.2 | 100 | 0.2 | — | 1 |
- other | 31,338 | 200 | 342 | 0.6 | 171 | 1.1 | 1 | 39 |
| | | 69,450 | 1,417 | 561 | 2.0 | 40 | 0.8 | 174 | 322 |
| | | | | | | | | | |
| RoW | | | | | | | | |
- residential mortgages | 219 | 15 | 2 | 6.8 | 13 | 0.9 | — | — |
- personal lending | 1,017 | 19 | 18 | 1.9 | 95 | 1.8 | — | — |
- property | 646 | 24 | 26 | 3.7 | 108 | 4.0 | (2) | 2 |
- construction | 91 | 5 | 5 | 5.5 | 100 | 5.5 | (1) | 2 |
- other | 11,647 | 240 | 194 | 2.1 | 81 | 1.7 | (5) | 22 |
| | | 13,620 | 303 | 245 | 2.2 | 81 | 1.8 | (8) | 26 |
| | | | | | | | | | |
| Customers | 412,801 | 28,177 | 18,000 | 6.8 | 64 | 4.4 | (1,160) | 5,269 |
| | | | | | | | | | |
| Banks | 24,812 | 42 | 40 | 0.2 | 95 | 0.2 | (10) | 9 |
| | | | | | | | | | |
| For the note to this table refer to page 288. | | | | | | | |
Business review Capital and risk management
| | | | | | Credit metrics | | |
| | | | | | REIL | Provisions | Provisions | Impairment | |
| | | Gross | | | as a % of | as a % | as a % of | charge/ | Amounts |
| | | loans | REIL | Provisions | gross loans | of REIL | gross loans | (release) | written-off |
| 2013 | | £m | £m | £m | % | % | % | £m | £m |
| Central and local government | 8,643 | 2 | 2 | — | 100 | — | 2 | — |
| Finance | 35,948 | 593 | 292 | 1.6 | 49 | 0.8 | 4 | 72 |
| Personal | - mortgages | 148,533 | 6,025 | 1,799 | 4.1 | 30 | 1.2 | 392 | 441 |
| | - unsecured | 28,160 | 2,417 | 1,909 | 8.6 | 79 | 6.8 | 415 | 861 |
| Property | 62,292 | 20,283 | 13,189 | 32.6 | 65 | 21.2 | 5,130 | 1,642 |
| Construction | 6,331 | 1,334 | 774 | 21.1 | 58 | 12.2 | 291 | 160 |
| of which: Commercial real estate | 52,578 | 20,129 | 13,209 | 38.3 | 66 | 25.1 | 5,212 | 1,749 |
| Manufacturing | 21,377 | 742 | 559 | 3.5 | 75 | 2.6 | 195 | 104 |
Finance leases (1) | 13,587 | 263 | 190 | 1.9 | 72 | 1.4 | 16 | 121 |
| Retail, wholesale and repairs | 19,574 | 1,187 | 783 | 6.1 | 66 | 4.0 | 268 | 128 |
| Transport and storage | 16,697 | 1,491 | 635 | 8.9 | 43 | 3.8 | 487 | 229 |
| Health, education and leisure | 16,084 | 1,324 | 756 | 8.2 | 57 | 4.7 | 359 | 119 |
| Hotels and restaurants | 6,942 | 1,427 | 812 | 20.6 | 57 | 11.7 | 281 | 194 |
| Utilities | 4,960 | 131 | 80 | 2.6 | 61 | 1.6 | 54 | 23 |
| Other | 28,624 | 2,103 | 1,370 | 7.3 | 65 | 4.8 | 489 | 212 |
| Latent | — | — | 2,012 | — | — | — | 44 | — |
| | 417,752 | 39,322 | 25,162 | 9.4 | 64 | 6.0 | 8,427 | 4,306 |
| | | | | | | | | |
| Geographic regional analysis | | | | | | | | |
| UK | | | | | | | | |
- residential mortgages | 110,515 | 1,900 | 319 | 1.7 | 17 | 0.3 | 39 | 180 |
- personal lending | 17,098 | 2,052 | 1,718 | 12.0 | 84 | 10.0 | 264 | 681 |
- property | 44,252 | 9,797 | 5,190 | 22.1 | 53 | 11.7 | 2,014 | 950 |
- construction | 4,691 | 941 | 515 | 20.1 | 55 | 11.0 | 194 | 159 |
- other | 110,466 | 4,684 | 3,202 | 4.2 | 68 | 2.9 | 1,091 | 537 |
| | | 287,022 | 19,374 | 10,944 | 6.8 | 56 | 3.8 | 3,602 | 2,507 |
| | | | | | | | | | |
| Europe | | | | | | | | |
- residential mortgages | 17,540 | 3,155 | 1,303 | 18.0 | 41 | 7.4 | 195 | 26 |
- personal lending | 1,267 | 141 | 129 | 11.1 | 91 | 10.2 | 19 | 26 |
- property | 13,177 | 10,372 | 7,951 | 78.7 | 77 | 60.3 | 3,131 | 659 |
- construction | 979 | 351 | 227 | 35.9 | 65 | 23.2 | 72 | — |
- other | 22,620 | 4,057 | 3,498 | 17.9 | 86 | 15.5 | 1,012 | 465 |
| | | 55,583 | 18,076 | 13,108 | 32.5 | 73 | 23.6 | 4,429 | 1,176 |
| | | | | | | | | | |
| US | | | | | | | | |
��- residential mortgages | 19,901 | 951 | 173 | 4.8 | 18 | 0.9 | 161 | 233 |
- personal lending | 8,722 | 207 | 45 | 2.4 | 22 | 0.5 | 114 | 151 |
- property | 4,279 | 85 | 19 | 2.0 | 22 | 0.4 | (11) | 25 |
- construction | 313 | 34 | 24 | 10.9 | 71 | 7.7 | 25 | 1 |
- other | 27,887 | 198 | 589 | 0.7 | 297 | 2.1 | 65 | 131 |
| | | 61,102 | 1,475 | 850 | 2.4 | 58 | 1.4 | 354 | 541 |
| | | | | | | | | | |
| RoW | | | | | | | | |
- residential mortgages | 577 | 19 | 4 | 3.3 | 21 | 0.7 | (3) | 2 |
- personal lending | 1,073 | 17 | 17 | 1.6 | 100 | 1.6 | 18 | 3 |
- property | 584 | 29 | 29 | 5.0 | 100 | 5.0 | (4) | 8 |
- construction | 348 | 8 | 8 | 2.3 | 100 | 2.3 | — | — |
- other | 11,463 | 324 | 202 | 2.8 | 62 | 1.8 | 31 | 69 |
| | | 14,045 | 397 | 260 | 2.8 | 65 | 1.9 | 42 | 82 |
| | | | | | | | | | |
| Customers | 417,752 | 39,322 | 25,162 | 9.4 | 64 | 6.0 | 8,427 | 4,306 |
| | | | | | | | | |
| Banks | 27,640 | 70 | 63 | 0.3 | 90 | 0.2 | (15) | 40 |
| | | | | | | | | | |
| For the note to this table refer to the following page. | | | | | | | |
Business review Capital and risk management
| | | | | | Credit metrics | | |
| | | | | | REIL | Provisions | Provisions | Impairment | |
| | | Gross | | | as a % of | as a % | as a % of | charge/ | Amounts |
| | | loans | REIL | Provisions | gross loans | of REIL | gross loans | (release) | written-off |
| 2012 | | £m | £m | £m | % | % | % | £m | £m |
| Central and local government | 9,853 | — | — | — | — | — | — | — |
| Finance | 42,198 | 592 | 317 | 1.4 | 54 | 0.8 | 145 | 380 |
| Personal | - mortgages | 149,625 | 6,549 | 1,824 | 4.4 | 28 | 1.2 | 948 | 461 |
| | - unsecured | 32,212 | 2,903 | 2,409 | 9.0 | 83 | 7.5 | 631 | 793 |
| Property | 72,219 | 21,223 | 9,859 | 29.4 | 46 | 13.7 | 2,212 | 1,080 |
| Construction | 8,049 | 1,483 | 640 | 18.4 | 43 | 8.0 | 94 | 182 |
| of which: Commercial real estate | 63,040 | 22,108 | 10,077 | 35.1 | 46 | 16.0 | 2,016 | 1,186 |
| Manufacturing | 23,787 | 755 | 357 | 3.2 | 47 | 1.5 | 134 | 203 |
Finance leases (1) | 13,609 | 442 | 294 | 3.2 | 67 | 2.2 | 44 | 263 |
| Retail, wholesale and repairs | 21,936 | 1,143 | 644 | 5.2 | 56 | 2.9 | 230 | 176 |
| Transport and storage | 18,341 | 834 | 336 | 4.5 | 40 | 1.8 | 289 | 102 |
| Health, education and leisure | 16,705 | 1,190 | 521 | 7.1 | 44 | 3.1 | 144 | 100 |
| Hotels and restaurants | 7,877 | 1,597 | 726 | 20.3 | 45 | 9.2 | 176 | 102 |
| Utilities | 6,631 | 118 | 21 | 1.8 | 18 | 0.3 | (4) | — |
| Other | 30,057 | 2,177 | 1,240 | 7.2 | 57 | 4.1 | 322 | 395 |
| Latent | — | — | 1,960 | — | — | — | (73) | — |
| | 453,099 | 41,006 | 21,148 | 9.1 | 52 | 4.7 | 5,292 | 4,237 |
| | | | | | | | | |
| Geographic regional analysis | | | | | | | | |
| UK | | | | | | | | |
- residential mortgages | 109,530 | 2,440 | 457 | 2.2 | 19 | 0.4 | 122 | 32 |
- personal lending | 20,498 | 2,477 | 2,152 | 12.1 | 87 | 10.5 | 479 | 610 |
- property | 53,730 | 10,521 | 3,944 | 19.6 | 37 | 7.3 | 964 | 490 |
- construction | 6,507 | 1,165 | 483 | 17.9 | 41 | 7.4 | 100 | 158 |
- other | 122,029 | 3,729 | 2,611 | 3.1 | 70 | 2.1 | 674 | 823 |
| | | 312,294 | 20,332 | 9,647 | 6.5 | 47 | 3.1 | 2,339 | 2,113 |
| | | | | | | | | | |
| Europe | | | | | | | | |
- residential mortgages | 17,836 | 3,092 | 1,151 | 17.3 | 37 | 6.5 | 526 | 50 |
- personal lending | 1,905 | 226 | 208 | 11.9 | 92 | 10.9 | 38 | 13 |
- property | 14,634 | 10,347 | 5,766 | 70.7 | 56 | 39.4 | 1,264 | 441 |
- construction | 1,132 | 289 | 146 | 25.5 | 51 | 12.9 | (11) | 12 |
- other | 27,424 | 4,451 | 2,996 | 16.2 | 67 | 10.9 | 817 | 539 |
| | | 62,931 | 18,405 | 10,267 | 29.2 | 56 | 16.3 | 2,634 | 1,055 |
| | | | | | | | | | |
| US | | | | | | | | |
- residential mortgages | 21,929 | 990 | 208 | 4.5 | 21 | 0.9 | 298 | 377 |
- personal lending | 8,748 | 199 | 48 | 2.3 | 24 | 0.5 | 109 | 162 |
- property | 3,343 | 170 | 29 | 5.1 | 17 | 0.9 | (11) | 83 |
- construction | 388 | 8 | 1 | 2.1 | 13 | 0.3 | — | 12 |
- other | 29,354 | 352 | 630 | 1.2 | 179 | 2.1 | (86) | 149 |
| | | 63,762 | 1,719 | 916 | 2.7 | 53 | 1.4 | 310 | 783 |
| | | | | | | | | | |
| RoW | | | | | | | | |
- residential mortgages | 330 | 27 | 8 | 8.2 | 30 | 2.4 | 2 | 2 |
- personal lending | 1,061 | 1 | 1 | 0.1 | 100 | 0.1 | 5 | 8 |
- property | 512 | 185 | 120 | 36.1 | 65 | 23.4 | (5) | 66 |
- construction | 22 | 21 | 10 | 95.5 | 48 | 45.5 | 5 | — |
- other | 12,187 | 316 | 179 | 2.6 | 57 | 1.5 | 2 | 210 |
| | | 14,112 | 550 | 318 | 3.9 | 58 | 2.3 | 9 | 286 |
| | | | | | | | | | |
| Customers | 453,099 | 41,006 | 21,148 | 9.1 | 52 | 4.7 | 5,292 | 4,237 |
| | | | | | | | | |
| Banks | 31,394 | 134 | 114 | 0.4 | 85 | 0.4 | 23 | 29 |
| (1) | Includes instalment credit. |
Business review Capital and risk management
| REILs and impairments | | | | | | | | | | | |
| Risk elements in lending | | | | | | | | | | | |
| The table below analyses REIL between UK and overseas, based on the location of the lending office. | | | | | |
| | | | | | | | | | | | |
| | 2014 | | 2013 | | 2012 |
| | RBS excluding | | | | RBS excluding | | | | RBS excluding | | |
| | RCR | RCR | Total | | Non-Core | Non-Core | Total | | Non-Core | Non-Core | Total |
| | £m | £m | £m | £m | £m | £m | £m | £m | £m |
| Impaired loans | | | | | | | | | | | |
- UK | 5,527 | 6,035 | 11,562 | | 9,288 | 8,193 | 17,481 | | 9,332 | 9,081 | 18,413 |
- overseas | 5,844 | 9,173 | 15,017 | | 9,145 | 10,545 | 19,690 | | 8,219 | 11,867 | 20,086 |
| | 11,371 | 15,208 | 26,579 | | 18,433 | 18,738 | 37,171 | | 17,551 | 20,948 | 38,499 |
| | | | | | | | | | | | |
| Accruing loans past due 90 days or more | | | | | | | | | | | |
- UK | 1,418 | 117 | 1,535 | | 1,709 | 253 | 1,962 | | 1,759 | 248 | 2,007 |
- overseas | 30 | 75 | 105 | | 236 | 23 | 259 | | 456 | 178 | 634 |
| | 1,448 | 192 | 1,640 | | 1,945 | 276 | 2,221 | | 2,215 | 426 | 2,641 |
| Total REIL | 12,819 | 15,400 | 28,219 | | 20,378 | 19,014 | 39,392 | | 19,766 | 21,374 | 41,140 |
| | | | | | | | | | | | |
REIL as a % of gross loans and advances (1) | 3.3% | 70.3% | 6.8% | | 5.3% | 51.8% | 9.4% | | 5.0% | 37.9% | 9.1% |
| Provisions as a % of REIL | 55% | 71% | 64% | | 56% | 73% | 64% | | 51% | 52% | 52% |
| (1) | Gross loans and advances to customers includes disposal groups but excludes reverse repos. |
| | | | | | | | | | | | |
| REIL flow statement | | | | | | | | | | | |
| REIL are stated without giving effect to any security held that could reduce the eventual loss should it occur or to any provisions marked. | |
| | | | | | | | | | | | |
| | | | | | | | | RBS | | | |
| | | Ulster | Commercial | Private | | Central | | excluding | | | |
| | UK PBB | Bank | Banking | Banking | CIB | items | CFG | RCR | RCR | Non-Core | Total |
| | £m | £m | £m | £m | £m | £m | £m | £m | £m | £m | £m |
| At 31 December 2013 | 4,663 | 8,466 | 4,276 | 277 | 1,661 | 1 | 1,034 | 20,378 | — | 19,014 | 39,392 |
| Impact of dissolution of | | | | | | | | | | | |
| Non-Core and creation of RCR | 137 | (3,547) | (560) | — | (1,421) | — | 289 | (5,102) | 24,116 | (19,014) | — |
| At 1 January 2014 | 4,800 | 4,919 | 3,716 | 277 | 240 | 1 | 1,323 | 15,276 | 24,116 | — | 39,392 |
| Currency translation and | | | | | | | | | | | |
other adjustments | — | (250) | — | (3) | 1 | 6 | 75 | (171) | (879) | — | (1,050) |
| Disposal of subsidiaries | — | — | — | — | — | — | — | — | (6) | — | (6) |
| Additions | 1,353 | 555 | 1,716 | 58 | 100 | — | 335 | 4,117 | 2,951 | — | 7,068 |
Transfers (1) | (309) | — | 31 | (15) | 4 | — | — | (289) | 29 | — | (260) |
| Transfers to performing book | (326) | (120) | (582) | (3) | (92) | — | — | (1,123) | (337) | — | (1,460) |
| Repayments | (1,012) | (198) | (1,884) | (51) | (56) | — | (103) | (3,304) | (6,883) | — | (10,187) |
| Amounts written-off | (728) | (131) | (491) | (37) | — | — | (300) | (1,687) | (3,591) | — | (5,278) |
| At 31 December 2014 | 3,778 | 4,775 | 2,506 | 226 | 197 | 7 | 1,330 | 12,819 | 15,400 | — | 28,219 |
| | | | | | | | | | | | |
Business review Capital and risk management
| | | | | | | | | RBS | | |
| | | Ulster | Commercial | Private | | Central | | excluding | | |
| | UK PBB | Bank | Banking | Banking | CIB | items | CFG | Non-Core | Non-Core | Total |
| | £m | £m | £m | £m | £m | £m | £m | £m | £m | £m |
| At 1 January 2013 | 5,735 | 7,533 | 4,007 | 248 | 1,097 | — | 1,146 | 19,766 | 21,374 | 41,140 |
| Currency translation and other adjustments | 8 | 134 | 8 | 2 | (15) | — | (21) | 116 | 279 | 395 |
| Disposal of subsidiaries | — | — | — | — | — | — | — | — | (89) | (89) |
| Additions | 1,638 | 2,479 | 3,597 | 132 | 1,337 | 1 | 282 | 9,466 | 3,397 | 12,863 |
Transfers (1) | (445) | — | 355 | — | 196 | — | — | 106 | (1) | 105 |
| Transfer to performing book and repayments | (1,306) | (1,403) | (3,104) | (90) | (594) | — | (89) | (6,586) | (4,090) | (10,676) |
| Amounts written-off | (967) | (277) | (587) | (15) | (360) | — | (284) | (2,490) | (1,856) | (4,346) |
| At 31 December 2013 | 4,663 | 8,466 | 4,276 | 277 | 1,661 | 1 | 1,034 | 20,378 | 19,014 | 39,392 |
| (1) | Represents transfers between REIL and potential problem loans. |
| (2) | For details on impairment methodology refer to Credit risk on page 230 and Accounting policy 15 Impairment of financial assets on page 345. |
Impairment provisions flow statement
RBS’s consumer portfolios, which consist of high volume, small value credits, have highly efficient largely automated processes for identifying problem credits and very short timescales, typically three months, before resolution or adoption of various recovery methods. Corporate portfolios consist of higher value, lower volume credits, which tend to be structured to meet individual customer requirements.
Provisions are assessed on a case by case basis by experienced specialists with input from professional valuers and accountants. RBS operates a transparent provisions governance framework, setting thresholds to trigger enhanced oversight and challenge.
The movement in loan impairment provisions by segment is shown in the table below.
| | | | | | | | | | | | |
| | | | | | | | | RBS | | | |
| | | Ulster | Commercial | Private | | Central | | excluding | | | |
| | UK PBB | Bank | Banking | Banking | CIB | items | CFG | RCR | RCR | Non-Core | Total |
| | £m | £m | £m | £m | £m | £m | £m | £m | £m | £m | £m |
| At 31 December 2013 | 2,957 | 5,378 | 1,617 | 120 | 976 | 66 | 272 | 11,386 | — | 13,839 | 25,225 |
| Impact of dissolution of Non-Core | | | | | | | | | | | |
and creation of RCR (1) | 150 | (1,985) | (306) | — | (766) | — | 246 | (2,661) | 16,500 | (13,839) | — |
| At 1 January 2014 | 3,107 | 3,393 | 1,311 | 120 | 210 | 66 | 518 | 8,725 | 16,500 | — | 25,225 |
| Currency translation | | | | | | | | | | | |
and other adjustments | — | (172) | 10 | (1) | 1 | 7 | 21 | (134) | (555) | — | (689) |
| Disposal of subsidiaries | — | — | — | — | — | — | — | — | (6) | — | (6) |
| Amounts written-off | (728) | (131) | (436) | (37) | — | (55) | (300) | (1,687) | (3,591) | — | (5,278) |
| Recoveries of amounts | | | | | | | | | | | |
previously written-off | 24 | 23 | 12 | 2 | 2 | — | 103 | 166 | 39 | — | 205 |
| Charged to income statement | | | | | | | | | | | |
- continuing operations | 268 | (365) | 77 | (5) | (7) | (12) | — | (44) | (1,320) | — | (1,364) |
- discontinued operations | — | — | — | — | — | — | 194 | 194 | — | — | 194 |
| Unwind of discount | | | | | | | | | | | |
| (recognised in interest income) | (67) | (37) | (19) | (3) | — | — | — | (126) | (121) | — | (247) |
| At 31 December 2014 | 2,604 | 2,711 | 955 | 76 | 206 | 6 | 536 | 7,094 | 10,946 | — | 18,040 |
| | | | | | | | | | | | |
| Individually assessed | | | | | | | | | | | |
- banks | — | — | — | — | 1 | — | — | 1 | 39 | — | 40 |
- customers | 14 | 42 | 493 | 69 | 109 | 1 | 83 | 811 | 10,526 | — | 11,337 |
| Collectively assessed | 2,319 | 2,355 | 366 | — | — | — | 157 | 5,197 | 150 | — | 5,347 |
| Latent | 271 | 314 | 96 | 7 | 96 | 5 | 296 | 1,085 | 231 | — | 1,316 |
| | 2,604 | 2,711 | 955 | 76 | 206 | 6 | 536 | 7,094 | 10,946 | — | 18,040 |
| (1) Transfers in Non-Core dissolution and RCR creation includes amounts in relation to latent. |
Business review Capital and risk management
| | | | | | | | | RBS | | |
| | | Ulster | Commercial | Private | | Central | | excluding | | |
| | UK PBB | Bank | Banking | Banking | CIB | Items | CFG | Non-Core | Non-Core | Total |
| | £m | £m | £m | £m | £m | £m | £m | £m | £m | £m |
| At 1 January 2013 | 3,467 | 3,910 | 1,547 | 109 | 743 | 1 | 285 | 10,062 | 11,200 | 21,262 |
| Currency translation | | | | | | | | | | |
and other adjustments | (2) | 51 | 17 | — | (16) | — | 31 | 81 | 28 | 109 |
| Disposal of subsidiaries | — | — | — | — | — | — | — | — | (77) | (77) |
| Amounts written-off | (967) | (277) | (587) | (15) | (360) | — | (284) | (2,490) | (1,856) | (4,346) |
| Recoveries of amounts | | | | | | | | | | |
previously written-off | 47 | 1 | 14 | — | 17 | — | 89 | 168 | 88 | 256 |
| Charge to income statement | | | | | | | | | | |
| - continuing operations | 497 | 1,774 | 652 | 29 | 598 | 65 | — | 3,615 | 4,490 | 8,105 |
| - discontinued operations | — | — | — | — | — | — | 151 | 151 | 156 | 307 |
Unwind of discount (recognised in interest income) | (85) | (81) | (26) | (3) | (6) | — | — | (201) | (190) | (391) |
| At 31 December 2013 | 2,957 | 5,378 | 1,617 | 120 | 976 | 66 | 272 | 11,386 | 13,839 | 25,225 |
| | | | | | | | | | | |
| Individually assessed | | | | | | | | | | |
- banks | — | — | — | — | 62 | — | — | 62 | 1 | 63 |
- customers | 2 | 2,078 | 1,116 | 109 | 765 | 66 | 60 | 4,196 | 12,650 | 16,846 |
| Collectively assessed | 2,741 | 2,596 | 283 | — | — | — | 118 | 5,738 | 565 | 6,303 |
| Latent | 214 | 704 | 218 | 11 | 149 | — | 94 | 1,390 | 623 | 2,013 |
| | 2,957 | 5,378 | 1,617 | 120 | 976 | 66 | 272 | 11,386 | 13,839 | 25,225 |
| Past due analysis | | | |
| The table below shows loans and advances to customers that were past due at the balance sheet date but are not considered impaired. |
| | | | |
| | 2014 | 2013 | 2012 |
| | £m | £m | £m |
| Past due 1-29 days | 4,834 | 4,765 | 5,599 |
| Past due 30-59 days | 1,055 | 1,260 | 1,117 |
| Past due 60-89 days | 667 | 822 | 1,177 |
| Past due 90 days or more | 1,640 | 2,221 | 2,641 |
| | 8,196 | 9,068 | 10,534 |
| | | | |
| Past due analysis by sector | | | |
| Personal | 4,837 | 5,172 | 5,501 |
| Property and construction | 1,343 | 1,373 | 1,863 |
| Financial institution | 86 | 368 | 103 |
| Other corporate | 1,930 | 2,155 | 3,067 |
| | 8,196 | 9,068 | 10,534 |
Business review Capital and risk management
Impairment charge analysis
The table below analyses the impairment charge for loans and securities.
| | | | | | | | | | | | | | Citizens | | RBS | | | | |
| | | | Ulster | | Commercial | | Private | | | | Central | | Financial | | excluding | | | | |
| | UK PBB | | Bank | | Banking | | Banking | | CIB | | items | | Group | | RCR | | RCR | | Total |
| 2014 | £m | | £m | | £m | | £m | | £m | | £m | | £m | | £m | | £m | | £m |
| Individually assessed | 13 | | (10) | | 139 | | (2) | | 25 | | (12) | | 36 | | 189 | | (988) | | (799) |
| Collectively assessed | 197 | | (30) | | 21 | | — | | — | | — | | 142 | | 330 | | (15) | | 315 |
| Latent loss | 58 | | (325) | | (83) | | (3) | | (32) | | — | | 16 | | (369) | | (307) | | (676) |
| Loans to customers | 268 | | (365) | | 77 | | (5) | | (7) | | (12) | | 194 | | 150 | | (1,310) | | (1,160) |
| Loans to banks | — | | — | | — | | — | | — | | — | | — | | — | | (10) | | (10) |
| Securities | — | | — | | — | | — | | (2) | | — | | 3 | | 1 | | 14 | | 15 |
| Charge/(release) to income statement | 268 | | (365) | | 77 | | (5) | | (9) | | (12) | | 197 | | 151 | | (1,306) | | (1,155) |
| | | | | | | | | | | | | | | | | | | | |
| | | | | | | | | | | | | | | | RBS | | | | |
| | | | | | | | | | | | | | | | excluding | | | | |
| 2013 | | | | | | | | | | | | | | | Non-Core | | Non-Core | | |
| Individually assessed | 3 | | 1,082 | | 629 | | 32 | | 590 | | 65 | | 16 | | 2,417 | | 4,502 | | 6,919 |
| Collectively assessed | 517 | | 580 | | 49 | | — | | 6 | | — | | 189 | | 1,341 | | 123 | | 1,464 |
| Latent loss | (23) | | 112 | | (26) | | (3) | | 17 | | — | | (54) | | 23 | | 21 | | 44 |
| Loans to customers | 497 | | 1,774 | | 652 | | 29 | | 613 | | 65 | | 151 | | 3,781 | | 4,646 | | 8,427 |
| Loans to banks | — | | — | | — | | — | | (15) | | — | | — | | (15) | | — | | (15) |
| Securities | 5 | | — | | — | | — | | 81 | | (1) | | 5 | | 90 | | (70) | | 20 |
| Charge to income statement | 502 | | 1,774 | | 652 | | 29 | | 679 | | 64 | | 156 | | 3,856 | | 4,576 | | 8,432 |
| | | | | | | | | | | | | | | | | | | | |
| | | | | | | | | | | | | | | | RBS | | | | |
| | | | | | | | | | | | | | | | excluding | | | | |
| 2012 | | | | | | | | | | | | | | | Non-Core | | Non-Core | | |
| Individually assessed | 8 | | 457 | | 514 | | 42 | | 196 | | 1 | | 15 | | 1,233 | | 1,936 | | 3,169 |
| Collectively assessed | 767 | | 787 | | 47 | | — | | 46 | | — | | 237 | | 1,884 | | 312 | | 2,196 |
| Latent loss | (35) | | 120 | | (18) | | 4 | | (47) | | — | | (169) | | (145) | | 72 | | (73) |
| Loans to customers | 740 | | 1,364 | | 543 | | 46 | | 195 | | 1 | | 83 | | 2,972 | | 2,320 | | 5,292 |
| Loans to banks | — | | — | | — | | — | | 23 | | — | | — | | 23 | | — | | 23 |
| Securities | — | | — | | 2 | | — | | 12 | | 39 | | 8 | | 61 | | (97) | | (36) |
| Charge to income statement | 740 | | 1,364 | | 545 | | 46 | | 230 | | 40 | | 91 | | 3,056 | | 2,223 | | 5,279 |
Business review Capital and risk management
AFS reserves
By issuer
Available-for-sale financial assets are initially recognised at fair value plus directly related transaction costs and are subsequently measured at fair value with changes in fair value reported in owners’ equity until disposal, at which stage the cumulative gain or loss is recognised in profit or loss. When there is objective evidence that an available-for-sale financial asset is impaired, any decline in its fair value below original cost is removed from equity and recognised in profit or loss.
The table below analyses available-for-sale debt securities and related reserves, gross of tax.
| | | | | | | | | | | | | | | |
| | 2014 | | 2013 | | 2012 |
| | UK | US | Other | Total | | UK | US | Other | Total | | UK | US | Other | Total |
| | £m | £m | £m | £m | | £m | £m | £m | £m | | £m | £m | £m | £m |
| Central and local government | 4,747 | 11,011 | 11,058 | 26,816 | | 6,436 | 12,880 | 10,303 | 29,619 | | 9,774 | 19,046 | 16,155 | 44,975 |
| Banks | 508 | — | 2,896 | 3,404 | | 492 | 92 | 5,390 | 5,974 | | 1,085 | 357 | 7,419 | 8,861 |
| Other financial institutions | 1,505 | 9,912 | 3,168 | 14,585 | | 2,335 | 8,327 | 6,668 | 17,330 | | 2,861 | 10,613 | 10,416 | 23,890 |
| Corporate | 23 | 15 | 123 | 161 | | 21 | 71 | 92 | 184 | | 1,318 | 719 | 1,130 | 3,167 |
| Total | 6,783 | 20,938 | 17,245 | 44,966 | | 9,284 | 21,370 | 22,453 | 53,107 | | 15,038 | 30,735 | 35,120 | 80,893 |
| | | | | | | | | | | | | | | |
| Of which ABS | 1,478 | 15,626 | 1,780 | 18,884 | | 2,487 | 13,149 | 8,538 | 24,174 | | 3,558 | 14,209 | 12,976 | 30,743 |
| | | | | | | | | | | | | | | |
| AFS reserves (gross) | 27 | 363 | 17 | 407 | | 77 | (22) | (445) | (390) | | 667 | 763 | (1,277) | 153 |
Gross unrealised losses
The table below shows the fair value of available-for-sale debt securities that were in an unrealised loss position at the end of the year and the related gross unrealised losses.
| | Less than 12 months | | More than 12 months | | Total |
| | | Gross | | | Gross | | | Gross |
| | | unrealised | | unrealised | | | unrealised |
| | Fair value | losses | Fair value | losses | | Fair value | losses |
| 2014 | £m | £m | | £m | £m | | £m | £m |
| Central and local government | | | | | | | | |
| - UK | 1 | 1 | | — | — | | 1 | 1 |
- US | 2,417 | 82 | | 1,239 | 35 | | 3,656 | 117 |
- other | 607 | 3 | | 154 | — | | 761 | 3 |
| Banks | 36 | 1 | | — | — | | 36 | 1 |
| Other financial institutions | 684 | 49 | | 1,130 | 109 | | 1,814 | 158 |
| Corporate | — | — | | 5 | 2 | | 5 | 2 |
| Total | 3,745 | 136 | | 2,528 | 146 | | 6,273 | 282 |
| | | | | | | | | |
| Of which ABS | 3,108 | 129 | | 1,813 | 128 | | 4,921 | 257 |
| | | | | | | | | |
| 2013 | | | | | | | | |
| Central and local government | | | | | | | | |
| - UK | 6,987 | 69 | | — | — | | 6,987 | 69 |
- US | 4,189 | 85 | | 8 | 1 | | 4,197 | 86 |
- other | 2,605 | 18 | | 852 | 14 | | 3,457 | 32 |
| Banks | 726 | 1 | | 3,319 | 204 | | 4,045 | 205 |
| Other financial institutions | 6,063 | 65 | | 4,842 | 428 | | 10,905 | 493 |
| Corporate | 19 | 2 | | 15 | — | | 34 | 2 |
| Total | 20,589 | 240 | | 9,036 | 647 | | 29,625 | 887 |
| | | | | | | | | |
| Of which ABS | 8,964 | 119 | | 8,067 | 634 | | 17,031 | 753 |
| | | | | | | | | |
| 2012 | | | | | | | | |
| Central and local government | | | | | | | | |
- US | 59 | 1 | | — | — | | 59 | 1 |
- other | 1,625 | 2 | | 145 | 12 | | 1,770 | 14 |
| Banks | 398 | 2 | | 3,466 | 507 | | 3,864 | 509 |
| Other financial institutions | 248 | 19 | | 7,686 | 1,300 | | 7,934 | 1,319 |
| Corporate | 346 | 4 | | 4 | — | | 350 | 4 |
| Total | 2,676 | 28 | | 11,301 | 1,819 | | 13,977 | 1,847 |
| | | | | | | | | |
| Of which ABS | 398 | 20 | | 10,999 | 1,797 | | 11,397 | 1,817 |
Business review Capital and risk management
| Market risk |
| 295 | Definition |
| 295 | Key developments in 2014 |
| 295 | Sources of risk |
| 299 | Risk governance |
| 299 | Traded market risk |
| 312 | Non-traded market risk |
Business review Capital and risk management
Market risk
Definition
Market risk is the risk of losses arising from fluctuations in interest rates, credit spreads, foreign currency rates, equity prices, commodity prices and other factors, such as market volatilities, that may lead to a reduction in earnings, economic value or both.
RBS is exposed to traded market risk through its trading activities and to non-traded market risk as a result of its banking activities. In many respects, it manages its traded and non-traded market risk exposures separately, as described in this section, largely in line with the regulatory definitions of the trading and non-trading books.
Key developments in 2014*
Traded market risk
RBS’s traded market risk profile decreased significantly, with market risk limits being reduced across all businesses, in some instances by 50-60%. These reductions resulted from:
| · | The creation of RCR and consequent accelerated wind-down of capital-intensive and potentially volatile exposures; and |
| | ° | the continuing run-down of non-strategic products and exposures in the run-off and recovery business set up towards the end of 2013; and |
| | ° | the decision to exit the US asset-backed product (ABP) trading business. |
Technology and process improvements continued to be made to enhance the measurement and management of market risk exposures. This covered key systems spanning areas such as market data and information technology architectures.
Risk measurement improvements also continued. Notably, credit and funding valuation adjustments were included in the internal measure of RBS’s value-at-risk (VaR) (refer to page 300 for more information). Previously, only associated hedges were included. The change in scope reflects a more comprehensive economic view of the risk.
Non-traded market risk
RBS continued to manage its non-traded market risk exposures within risk limits throughout the year. Although the restructure of customer facing businesses in 2014 did not affect underlying non-traded market risk exposures, the planned divestment of CFG is expected to reduce structural interest rate and foreign exchange risk exposures. However, at the year end RBS retained a majority stake in CFG and fully consolidated the position.
Longer-term interest rates remained at historically low levels during 2014. RBS maintained its structural hedge of invested equity and rate-insensitive customer deposit portfolios. The aim of the hedge is to stabilise interest earnings. During the year, the duration profile of the hedge did not change materially but action was taken to match the hedge’s currency profile more closely to underlying balance sheet exposures.
The increased hedging of US dollar structural exposures was related to the planned disposal of CFG. This was balanced by the requirement to maintain RBS’s current capital ratio sensitivity to foreign exchange rate movements within risk limits.
Sources of risk
Traded market risk
The majority of traded market risk exposure arises in CIB and RCR.
The primary objective of RBS’s trading activities is to provide a range of financing, risk management and investment services to its customers - including major corporations and financial institutions around the world. From a market risk perspective, the trading activities are included within the following markets: currencies; emerging markets; rates; asset-backed products; and traded credit.
RBS undertakes transactions in financial instruments including debt securities, loans, deposits and equities, as well as securities financing and derivatives.
Some of these transactions involve trading or clearing financial instruments on an exchange, including interest rate swaps, futures and options. Holders of these instruments provide margin on a daily basis with cash or other security at the exchange.
Other products are not transacted on an exchange. Of these over-the-counter transactions, those with standard terms may be cleared through central counterparties, while those that are more complex are settled directly with the counterparty and may give rise to counterparty credit risk. For more information on the management of counterparty credit risk, refer to the Credit risk section on page 227.
Non-traded market risk
The majority of RBS’s non-traded market risk exposure arises from retail and commercial banking activities in all franchises from assets and liabilities that are not classified as held for trading.
The management of non-traded market risk is largely organised in line with the following three key categories: non-traded interest rate risk; non-traded foreign exchange risk; and non-traded equity risk.
Interest rate risk
Non-traded interest rate risk (NTIRR) arises from the provision to customers of a range of banking products that have differing interest rate characteristics. Therefore, when aggregated, these products form portfolios of assets and liabilities with varying degrees of sensitivity to changes in market interest rates. Mismatches in these characteristics can give rise to volatility in net interest income as interest rates rise and fall.
NTIRR comprises four primary risk factors: repricing risk, yield curve risk, basis risk and optionality risk. For more information, refer to page 313.
Business review Capital and risk management
Foreign exchange risk
Non-traded foreign exchange risk exposures arise from two main sources:
| · | Structural foreign exchange risk - arising from the capital deployed in foreign subsidiaries, branches and associates and related currency funding where it differs from sterling; and |
| · | Transactional foreign exchange risk - arising from customer transactions and profits and losses that are in a currency other than the functional currency of the transacting operation. |
Equity risk
Non-traded equity risk is the potential variation in income and reserves arising from changes in the values of non-trading book equity positions. Equity exposures may arise through strategic acquisitions, venture capital investments and certain restructuring arrangements.
Pension risk
Pension-related activities also give rise to market risk. Refer to pages 327 and 333 for more information on risk related to pensions.
Business review Capital and risk management
| Linkage to balance sheet* | | | | | |
| The table below analyses RBS’s balance sheet by trading and non-trading business. | | |
| | | | | | |
| | | Trading | Non-trading | | |
| | Total | business (1) | business (2) | | Non-trading business |
| 2014 | £bn | £bn | £bn | | primary risk factor |
| Assets | | | | | |
| Cash and balances at central banks | 75.5 | — | 75.5 | | Interest rate, foreign exchange |
| Net loans and advances to banks | 24.8 | 11.2 | 13.6 | | Interest rate |
| Net loans and advances to customers | 394.8 | 23.2 | 371.6 | | Interest rate |
| Reverse repurchase agreements and stock borrowing | 64.7 | 61.1 | 3.6 | | Interest rate |
| Debt securities | 101.9 | 49.3 | 52.6 | | Interest rate |
| Equity shares | 6.2 | 4.9 | 1.3 | | Equity |
| Derivatives | 354.0 | 350.1 | 3.9 | | Interest rate, foreign exchange |
| Settlement balances | 4.7 | 4.7 | — | | |
| Other assets | 24.2 | — | 24.2 | | Interest rate |
| Total assets | 1,050.8 | 504.5 | 546.3 | | |
| | | | | | |
| Liabilities | | | | | |
| Deposits by banks | 40.9 | 25.5 | 15.4 | | Interest rate |
| Customer deposits | 414.9 | 14.2 | 400.7 | | Interest rate |
| Repurchase agreements and stock lending | 64.6 | 60.0 | 4.6 | | Interest rate |
| Debt securities in issue | 51.9 | 12.4 | 39.5 | | Interest rate |
| Settlement balances | 4.5 | 4.5 | — | | |
| Short positions | 23.0 | 23.0 | — | | |
| Derivatives | 350.0 | 346.9 | 3.1 | | Interest rate, foreign exchange |
| Subordinated liabilities | 23.1 | — | 23.1 | | Interest rate |
| Other liabilities | 17.7 | — | 17.7 | | Interest rate, credit spreads |
| Total liabilities | 990.6 | 486.5 | 504.1 | | |
| | | | | | |
| 2013 | | | | | |
| Assets | | | | | |
| Cash and balances at central banks | 82.7 | — | 82.7 | | Interest rate, foreign exchange |
| Net loans and advances to banks | 27.6 | 9.3 | 18.3 | | Interest rate |
| Net loans and advances to customers | 390.8 | 19.4 | 371.4 | | Interest rate |
| Reverse repurchase agreements and stock borrowing | 76.4 | 75.7 | 0.7 | | Interest rate |
| Debt securities | 113.6 | 56.7 | 56.9 | | Interest rate |
| Equity shares | 8.8 | 7.2 | 1.6 | | Equity |
| Derivatives | 288.0 | 284.9 | 3.1 | | Interest rate, foreign exchange |
| Settlement balances | 5.6 | 5.6 | — | | |
| Other assets | 34.4 | — | 34.4 | | Interest rate |
| Total assets | 1,027.9 | 458.8 | 569.1 | | |
| | | | | | |
| Liabilities | | | | | |
| Deposits by banks | 35.3 | 19.2 | 16.1 | | Interest rate |
| Customer deposits | 414.4 | 9.7 | 404.7 | | Interest rate |
| Repurchase agreements and stock lending | 85.1 | 73.6 | 11.5 | | Interest rate |
| Debt securities in issue | 67.8 | 19.7 | 48.1 | | Interest rate |
| Settlement balances | 5.3 | 5.3 | — | | |
| Short positions | 28.0 | 28.0 | — | | |
| Derivatives | 285.5 | 283.4 | 2.1 | | Interest rate, foreign exchange |
| Subordinated liabilities | 24.0 | — | 24.0 | | Interest rate |
| Other liabilities | 23.3 | — | 23.3 | | Interest rate, credit spreads |
| Total liabilities | 968.7 | 438.9 | 529.8 | | |
| (1) | Trading businesses are entities that primarily have exposures that are classified as trading book under regulatory rules. For these exposures, the main methods used by RBS to measure market risk are detailed under Traded market risk measurement on page 300. |
| (2) | Non-trading businesses are entities that primarily have exposures that are not classified as trading book. For these exposures, with the exception of pension-related activities, the main measurement methods are sensitivity analysis of net interest income, internal non-traded VaR and fair value calculations. For more information refer to pages 312 to 318. |
*unaudited
Business review Capital and risk management
Trading balance sheet and VaR linkage
The table below shows the trading business balance sheet split by trading portfolios within CIB and the associated trading VaR for the period ended
31 December 2014.
Portfolio | Description of business | Assets £bn | Liabilities £bn | Standalone internal 99% 1-day VaR £m | | Principal market risk exposure |
| Rates | Delivers interest rate services through research-based insight to corporates, central banks, financial institutions and hedge funds. | 414.0 | 409.0 | 23.7 | | Interest rates |
| Currencies | Provides currency services to corporate, institutional and retail clients globally covering FX, emerging and short-term markets. | 33.4 | 33.1 | 2.4 | | Foreign exchange and interest rates |
| Asset-backed products | Structures and distributes mortgage-backed securities, asset-backed securities and commercial mortgage-backed securities, covering both agency and non-agency segments of the market, from executing flow business to creating complex structured derivatives. | 9.1 | 3.2 | 4.9 | | Interest rates and credit spreads. |
| Credit | Provides liquidity and capital to corporates and operates across investment-grade, high-yield and distressed credit. Offers a full-service credit-trading platform covering derivatives, bonds, bank loans and trade claims. | 12.8 | 8.7 | 2.6 | | Credit spreads |
| Run-off & Recovery | Responsible for active divestment of all products identified for exit from RBS, through a combination of restructuring, asset sales or, where possible, business sales. | 20.2 | 20.3 | 4.2 | | Equities, interest rates and credit spreads. |
| Centre | Primarily relates to the Counterparty Exposure Management desk which manages counterparty risk exposures arising from over-the-counter derivative contracts, primarily credit risk and funding risk. | — | — | 10.4 | | Credit spreads, interest rates and foreign exchange, |
| VaR diversification | | — | — | (26.9) | | |
| Total CIB | | 489.5 | 474.3 | 21.3 | | |
| Total RCR | RCR is responsible for the accelerated rundown of assets that are capital intensive or have volatile outcomes under stress. | 14.3 | 11.1 | 3.0 | | Equities, interest rates and credit spreads. |
| (1) | The VaR amounts presented above represent the risk associated with external and internal transactions within each portfolio. VaR diversification represents the degree of correlation between portfolios within RBS. The diversification factor is the sum of the VaR on individual businesses less the total portfolio VaR. |
| (2) | Assets and liabilities presented above represent external transactions for each portfolio. |
| (3) | VaR in Centre relates primarily to market risks arising from credit valuation adjustment (CVA), funding valuation adjustment (FVA) and the related hedges which are booked and managed centrally. The corresponding assets and liabilities are reflected in the underlying portfolio amounts where the CVA and FVA risks arise. |
Business review Capital and risk management
Market risk continued
Risk governance
The Market Risk function is responsible for identifying, measuring, monitoring and controlling the market risk arising from both trading and non-trading activities.
For general information on risk governance, refer to the Risk governance section on page 172.
More specific information on the governance, management and measurement of traded and non-traded market risk is provided in each of the dedicated sections below.
Traded market risk
Controls and assurance
The market risk control and assurance framework has three key components: market risk policy; assurance approach policy; and independent assurance.
The Group Market Risk Policy Standard is part of the Group Policy Framework. It sets out the rules that RBS’s businesses must follow to ensure that market risks are identified, measured and effectively managed.
The assurance approach policy comprises various elements, including the Risk and Control Assurance Framework process. This process ensures that, on an ongoing basis, specifically designed controls are in place for the risks that RBS faces to ensure that its exposure does not exceed its appetite. The adequacy and effectiveness of these controls are tested according to their rating, at least annually. The results of this testing are shared regularly at the Market Risk Governance and Control Committee.
Market Risk Assurance forms part of Risk Assurance. This independent second line of defence function provides assurance on the robustness of the market risk framework within RBS, via centralised analysis of the control framework, complemented by the application of expert judgement through qualitative reviews. These findings are escalated to senior management and plans to address any shortcomings are recorded and tracked in the operational risk system. Market Risk Assurance activities are also reported directly and independently to the Group Audit Committee.
For information on valuation controls, independent price verification and model validation, refer to page 311.
Risk appetite*
Market risk appetite is the level of market risk that RBS accepts when pursuing its business objectives, taking into account stressed scenarios. A comprehensive structure and controls are in place aimed at ensuring that this appetite is not exceeded.
RBS’s qualitative market risk appetite is set out in policy statements. These define the governance, responsibilities, control framework and requirements for the identification, measurement, analysis, management and reporting of market risk arising from trading and non-trading activities. These policies are also cascaded, as appropriate, to the legal entities, franchises and businesses to ensure there is a consistent control framework throughout.
The quantitative market risk appetite is expressed in terms of limits for the trading and non-trading activities. These limits, which establish a set of comprehensive boundaries within which business activities are conducted and monitored based on business plans, are proposed by the Director of Market Risk.
Once RBS-level limits are approved by the Executive Risk Forum (ERF), the Director of Market Risk may cascade the limits further down the organisation as required. For each trading business, a document known as a dealing authority compiles details of all applicable limits and trading restrictions.
The limit framework at RBS-level comprises VaR, stressed value-at-risk (SVaR) and sensitivity and stress limits (for more details on VaR and SVaR, refer to pages 300 to 305). The limit framework at the lower levels also comprises additional metrics that are specific to the market risk exposures within its scope. These additional metrics aim to control various risk dimensions such as product type, exposure size, aged inventory, currency and tenor.
The limits are reviewed to reflect changes in risk appetite, business plans, portfolio composition and the market and economic environments.
Limit breaches at RBS-level require escalation by the Director of Market Risk, as appropriate, to the ERF. Limit breaches at the lower levels require escalation by the head of the relevant market risk segment to the Director of Market Risk, as appropriate.
Risk assessment
Identification and assessment of traded market risk is achieved through gathering, analysing, monitoring and reporting market risk information by business line or at a consolidated level. Industry expertise, continued system developments and techniques such as stress testing are also used to enhance the effectiveness of the identification and assessment of all material market risks.
This is complemented by the New Product Risk Assessment process, which requires market risk teams to assess and quantify the market risk associated with all proposed new products.
Risk monitoring
Traded market risk exposures are monitored against limits and analysed daily by market risk reporting and control functions. A daily report that summarises market risk exposures against the limits set by the ERF is sent to the Chief Risk Officer and market risk managers across the franchises.
*unaudited
Business review Capital and risk management
The market risk functions also prepare daily risk reports that detail exposures against a more granular set of limits and triggers.
Limit reporting is supplemented with regulatory capital and stress testing information as well as ad hoc reporting.
A market risk update is also included in the RBS Risk Management Monthly Report provided to the Executive Committee, the Board Risk Committee and the Board. The update focuses on risk positions relative to risk appetite; it also covers the key risks and trends, together with a discussion of relevant issues and market topics.
The reporting and updates facilitate frequent reviews and discussions of traded market risk exposures and related issues between the market risk functions, senior management and the front office.
Risk control
To ensure approved limits are not breached and that RBS remains within its risk appetite, triggers at RBS and lower levels have been set such that if exposures exceed a specified level, action plans are developed by the front office, Market Risk and Finance.
Risk measurement
RBS uses a comprehensive and complementary set of methodologies and techniques to measure traded market risk that collectively ensure a complete approach to the measurement of material market risks.
 | The main measurement methods are VaR and SVaR. Risks that are not adequately captured by these model methodologies are captured by the Risks Not in VaR (RNIV) framework to ensure that RBS is adequately capitalised for market risk. In addition, stress testing is used to identify any vulnerabilities and potential losses in excess of VaR and SVaR. |
These methods have been designed to capture correlation effects and allow RBS to form an aggregated view of its traded market risk across risk types, markets and business lines while also taking into account the characteristics of each risk type.
Value-at-risk
VaR is a statistical estimate of the potential change in the market value of a portfolio (and, thus, the impact on the income statement) over a specified time horizon at a given confidence level.
For internal risk management purposes, VaR assumes a time horizon of one trading day and a confidence level of 99%. The VaR model is based on a historical simulation, utilising data from the previous 500 days on an equally weighted basis.
The internal traded VaR model captures all trading book positions including those products approved by the regulator. As noted earlier, from February 2014, credit and funding valuation adjustments were included in the internal measure of VaR. For an explanation of the distinction between internal VaR and regulatory VaR, refer to page 307.
The internal VaR model captures the impact on the income statement of the following risk factors:
| · | Interest rate risk, which arises from the impact of changes in interest rates and volatilities on cash instruments and derivatives. This includes interest rate tenor basis risk and cross-currency basis risk. |
| · | Credit spread risk, which arises from the impact of changes in the credit spreads of sovereign bonds, corporate bonds, securitised products and credit derivatives. |
| · | Currency risk, which arises from the impact of changes in currency rates and volatilities. |
| · | Equity risk, which arises from the impact of changes in equity prices, volatilities and dividend yields. |
| · | Commodity risk, which arises from the impact of changes in commodity prices and volatilities. |
The factors noted above are sufficient to define RBS’s overall market risk exposures. Other types of risk which are components of the above-mentioned factors, are also monitored by individual businesses to identify and address any material concentrations.
Examples of such risk types include:
| · | Basis risk, which is the risk that imperfect correlation between two instruments in a hedging strategy creates the potential for excess gains or losses, thus adding risk to the position; |
| · | Prepayment risk, which is the risk associated with early unscheduled return of principal on a fixed rate security; and |
| · | Inflation risk, which is the risk of a decrease in the value of instruments as a result of changes in inflation rates and associated volatilities. |
Business review Capital and risk management
VaR limitations*
| · | Historical VaR and RBS’s implementation of this risk measurement methodology have a number of known limitations, as summarised below, and VaR should be interpreted in light of these. RBS’s approach is to supplement VaR with other risk metrics that address these limitations to ensure appropriate coverage of all material market risks. |
| · | Historical simulation VaR may not provide the best estimate of future market movements. It can only provide a forecast of portfolio losses based on events that occurred in the past. The RBS model uses the previous two years of data; this period represents a balance between model responsiveness to recent shocks and risk factor data coverage. |
| · | The use of a 99% confidence level VaR statistic does not provide information about losses beyond this level, usually referred to as ‘tail’ risks. These risks are more appropriately assessed using measures such as Stressed VaR and stress testing. |
| · | The use of a one-day time horizon does not fully capture the profit and loss implications of positions that cannot be liquidated or hedged within one day. This may not fully reflect market risk at times of severe illiquidity in the market when a one-day period may be insufficient to liquidate or hedge positions fully. Thus, the regulatory VaR that is used for modelled market risk capital uses a ten-day time horizon. |
· | When RBS uses ten-day risk factor changes in the calculation of the regulatory VaR, the ten-day periods overlap, which can introduce an autocorrelation bias in the 99% confidence level VaR statistic. The analysis performed has shown the bias to be small and acceptable for a ten-day period. |
| · | The VaR of trading positions is computed at the close of business. Positions may change substantially during the course of the trading day and so intra-day price volatility and trading may not be captured by the model. |
| · | The data used in the model are collected from global sources. For some sources, local end-of-day, rather than London end-of-day, data may be used, resulting in a timing mismatch. This timing mismatch is more material for 1-day return periods than for 10-day periods (which are used for capitalisation purposes) as the overlaps are inherently smaller across shorter periods. When deciding whether or not to use local end-of-day timing, the internal model review committee balances the principle of aligning the treatment of positions and their associated hedges against the goal of using London end-of-day timing consistently. |
| · | Risk factors relevant to a specific portfolio may be omitted, due to a lack of reliable data, or the use of proxy risk factors, for example. RBS has developed the RNIV framework to address these issues. |
1-Day 99% traded internal VaR 2014.*
*unaudited
Business review Capital and risk management
1-day 99% traded internal VaR
The table below analyses the internal VaR for RBS’s trading portfolios, segregated by type of market risk exposure, and split between CIB and RCR or Non-Core.
| | 2014 | | 2013 | | 2012 |
| | Average | Period end | Maximum | Minimum | | Average | Period end | Maximum | Minimum | | Average | Period end | Maximum | Minimum |
| £m | £m | £m | £m | £m | £m | £m | £m | £m | £m | £m | £m |
| Interest rate | 17.4 | 16.9 | 39.8 | 10.8 | | 37.2 | 44.1 | 78.2 | 19.1 | | 62.6 | 75.6 | 95.7 | 40.8 |
| Credit spread | 23.1 | 14.2 | 42.8 | 13.4 | | 60.0 | 37.3 | 86.8 | 33.3 | | 69.2 | 74.1 | 94.9 | 44.9 |
| Currency | 4.7 | 5.5 | 9.7 | 1.0 | | 8.6 | 6.5 | 20.6 | 3.6 | | 10.3 | 7.6 | 21.3 | 2.6 |
| Equity | 3.0 | 3.7 | 6.5 | 1.2 | | 5.8 | 4.1 | 12.8 | 3.2 | | 6.0 | 3.9 | 12.5 | 1.7 |
| Commodity | 0.6 | 0.4 | 2.5 | 0.3 | | 0.9 | 0.5 | 3.7 | 0.3 | | 2.0 | 1.5 | 6.0 | 0.9 |
Diversification (1) | | (18.2) | | | | | (23.7) | | | | | (55.4) | | |
| Total | 27.8 | 22.5 | 58.2 | 17.1 | | 79.3 | 68.8 | 118.8 | 42.1 | | 97.3 | 107.3 | 137.0 | 66.5 |
| | | | | | | | | | | | | | | |
| CIB | 26.3 | 21.3 | 48.8 | 15.5 | | 64.2 | 52.4 | 104.6 | 35.6 | | 74.6 | 88.1 | 118.0 | 47.4 |
| RCR | 4.5 | 3.0 | 16.2 | 2.6 | | n/a | n/a | n/a | n/a | | n/a | n/a | n/a | n/a |
| Non-Core | n/a | n/a | n/a | n/a | | 19.3 | 15.2 | 24.9 | 14.9 | | 30.1 | 22.8 | 41.9 | 22.0 |
| (1) | RBS benefits from diversification as it reduces risk by allocating positions across various financial instrument types, currencies and markets. The extent of the diversification benefit depends on the correlation between the assets and risk factors in the portfolio at a particular time. The diversification factor is the sum of the VaR on individual risk types less the total portfolio VaR. |
Key points
| · | The total traded VaR decreased significantly in 2014 compared with 2013, on both a period-end and average basis, for the following two key reasons: |
| | ° | the inclusion of CVA and FVA trades in the internal VaR measure in February 2014, which primarily affected Q1 2014.Prior to this change, VaR was higher as only the associated hedges, which had a risk-additive impact on overall trading book exposures, were captured in the internal risk management framework. |
| | ° | the decision to exit the US ABP trading business and the unwinding of equity positions in Run-off & Recovery (RoR) within CIB in line with the exit strategy, which largely affected the last three quarters of the year. |
| · | The declines in interest rate and credit spread VaR were also affected by specific factors: |
| | ° | Interest rate VaR declined in Q1 2014 due to reduced risk appetite for flow market-making in the Rates business in CIB. |
| | ° | Credit spread VaR declined in H2 2014, because the volatilecredit spread series rolled out of the 500-day window for VaR. |
| · | Total VaR was notably volatile in the second half of the year, largely as a result of heightened geopolitical risks given the Ukraine/Russia crisis and Middle East tensions and the developments in the eurozone periphery. |
| · | The decrease in the average and period end RCR VaR reflects the inclusion of CVA and FVA trades in the calculation of internal VaR and the accelerated wind-down of capital-intensive and potentially volatile exposures. |
Business review Capital and risk management
Market risk continued
Traded market risk continued
VaR validation*
A dedicated model-testing team in Market Risk works with the risk managers to:
| · | Test the accuracy of the valuation methods used in the VaR model on appropriately chosen test portfolios and trades; |
| · | Apply in-house models to perform advanced internal back-testing to complement the regulatory back-testing; |
| · | Identify risks not adequately captured in VaR, and ensure that such risks are addressed via the RNIV framework (refer to page 305); |
| · | Identify any model weaknesses or scope limitations and their impact; and |
| · | Identify and give early warning of any market or portfolio weakness that may become significant. |
In addition, independent VaR model reviews are carried out by Model Risk (as detailed on page 311).
As well as being an important market risk measurement and control tool, the VaR model is also used to determine a significant component of the market risk capital requirement (refer to page 309 for more information on calculation of capital requirements). Therefore, it is subject to not only ongoing internal review and validation but also regulator-prescribed back-testing.
VaR back-testing*
The main approach employed to assess the ongoing model performance is back-testing, which counts the number of days when a loss exceeds the corresponding daily VaR estimate, measured at a 99% confidence level.
There are two types of profit and loss (P&L) used in back-testing comparisons: Clean P&L and Hypothetical (Hypo) P&L.
The Clean P&L for a particular business day is the firm’s actual P&L for that day in respect of the trading activities within the scope of the firm’s regulatory VaR model, including any intraday activities, adjusted by stripping out:
| · | Additions to, and releases from, reserves that are not directly related to market risk; and |
| · | Any Day 1 P&L exceeding an amount of £500,000 (per transaction). |
The Hypo P&L reflects the firm’s Clean P&L excluding any intra-day activities.
A portfolio is said to produce a back-testing exception when the Clean or Hypo P&L exceeds the VaR level on a given day. Such an event may be caused by a large market movement or may highlight issues such as missing risk factors or inappropriate time series. Any such issues identified are analysed and addressed through taking appropriate remediation or development action. RBS monitors both Clean and Hypo back-testing exceptions.
Regulatory back-testing is performed and reported on a daily basis for legal entities and major business portfolios. Franchise-level market risk teams also perform back-testing at the lower levels as part of the internal ongoing VaR model validation.
The back-testing described above primarily applies to CIB and RCR models, which are approved by the regulators. However, where appropriate, back-testing is also performed for other portfolios that are not subject to regulatory approval.
The graph below presents 1-day 99% regulatory VaR vs. Hypo P&L for RBS plc, RBS's largest legal entity by market risk RWAs and positions.
*unaudited
Business review Capital and risk management
The table below shows regulatory back-testing exceptions for a period of 250 days for 1-day 99% traded regulatory VaR vs. Clean and Hypo P&L for the legal entities approved by the PRA and De Nederlandsche Bank.
| Description | Back-testing exceptions | Model |
| Clean | Hypo | status |
| The Royal Bank of Scotland plc | — | — | Green |
| National Westminster Bank Plc | 3 | 3 | Green |
| RBS Securities Inc (RBSSI) | 1 | 1 | Green |
| RBS Financial Products Inc | — | — | Green |
| The Royal Bank of Scotland N.V. | 1 | — | Green |
Key points
| · | Statistically RBS would expect to see back-testing exceptions 1% of the time over a one-year period. From a capital requirement perspective, the PRA categorises a firm’s VaR model as green, amber or red. A green model status is consistent with a satisfactory VaR model and is achieved for models that have four or fewer exceptions in a continuous 12 month period. RBS’s VaR model has maintained a green status for its regulated legal entities and hence has considered that no action is required to rectify or adapt its VaR models. |
| · | The exception at the RBSSI level resulted from losses in the US Credit business relating to the mining and chemical sectors and from losses on inflation securities. |
| · | The exceptions at the NatWest level were driven by: the re-marking in August of certain inflation products following independent price verification; losses on euro and sterling positions as foreign exchange spot rates moved significantly in September; and a one-day delay in booking by a trader in September. |
| · | The exception at the RBS N.V. level in December was primarily driven by the unwinding of a Brazilian fund. |
The table below shows internal back-testing exceptions for a period of 250 days for 1-day 99% traded internal VaR vs. Clean and Hypo P&L for major CIB businesses.
| Description | Back-testing exceptions |
| Actual | Hypo |
| Credit | 1 | 1 |
| Currencies | — | 2 |
| CIB ROR | 1 | 2 |
| (1) | The business classification for the purpose of back-testing has been revised to bring it in line with the new RBS business hierarchy effective 3 February 2014. Back-testing exceptions for these businesses are also counted from this date. |
Key points
| · | As noted above, statistically RBS would expect to see back-testing exceptions 1% of the time over a one-year period. At RBS plc level, there was one exception during 2014, confirming that the model was satisfactory. |
| · | The top-level businesses presented in the table above are subject to quarterly governance by the PRA. For some of these businesses, exceptions were noted during 2014 and analysis conducted as explained below. |
| · | The exceptions in the Currencies business occurred in the normal course of business and were mainly due to market moves adversely affecting spot and volatility foreign exchange positions in the business. |
| · | The exceptions in the Credit business mainly occurred due to CDS spread tightening adversely affecting the overall short position. |
| · | CIB RoR experienced one actual and two hypothetical exceptions during 2014. All exceptions were due to fair value differences on the execution of a risk migration trade. |
*unaudited
Business review Capital and risk management
Stressed VaR (SVaR)*
As with VaR, the SVaR technique produces estimates of the potential change in the market value of a portfolio, over a specified time horizon, at a given confidence level. SVaR is a VaR-based measure using historical data from a one-year period of stressed market conditions.
The risk system simulates 99% VaR on the current portfolio for each 260-day period from 1 January 2005 to the current VaR date, moving forward one day at a time. The SVaR is the worst VaR outcome of the simulated results.
This is in contrast with VaR, which is based on a rolling 500-day historical data set. For the purposes of both internal risk management and regulatory SVaR calculation, a time horizon of ten trading days is assumed with a confidence level of 99%.
Trading SVaR*
| | 2014 | 2013 | 2012 |
| | £m | £m | £m |
| Total RBS | 194 | 309 | 396 |
| CIB | 189 | 298 | 372 |
| RCR | 23 | n/a | n/a |
| Non-Core | n/a | 51 | 69 |
Key point
| · | The period end traded SVaR declined in 2014 compared with 2013. This was consistent with the decrease in VaR and was primarily driven by the decision to exit the US ABP trading business. |
Risks not in VaR (RNIVs)*
The RNIV approach is used for market risks that fall within the scope of VaR and SVaR but that are insufficiently captured by the model methodology, for example due to a lack of suitable historical data. The RNIV framework has been developed to quantify these market risks and to ensure that RBS holds adequate capital.
The need for an RNIV calculation is typically identified in one of the following two circumstances: (i) as part of the New Product Risk Assessment process, when a risk manager assesses that the associated risk is not adequately captured by the VaR model; or (ii) as a result of a recommendation made by Model Risk or the model validation team when reviewing the VaR model.
The RNIV calculations provide a capital estimate of risks not captured in the VaR model and are regularly reported and discussed with senior management and the regulator. The methodology used in the material RNIV calculations is internally reviewed by Model Risk. Where appropriate, risk managers set sensitivity limits to control specific risk factors giving rise to the RNIV. RNIV calculations form an integral part of RBS’s ongoing model and data improvement efforts to capture all market risks in scope for model approval in VaR and SVaR. Since the introduction of the RNIV framework, progress has been made in transitioning RNIVs into the VaR model.
RBS adopts two approaches for the quantification of RNIVs:
| · | A standalone VaR approach. Under this approach, two values are calculated: (i) the VaR RNIV; and (ii) the SVaR RNIV. |
| · | A stress-scenario approach. Under this approach, an assessment of ten-day extreme, but plausible, market moves is used in combination with position sensitivities to give a stress-type loss number - the stressed RNIV value. |
For each legal entity covered by the PRA VaR approval (refer to Regulatory VaR), RNIV amounts are aggregated to obtain the following three measures: (i) Total VaR RNIV; (ii) Total SVaR RNIV; and (iii) Total stressed RNIV. In each of these categories, potential diversification benefits between RNIVs are ignored.
The top ten RNIVs represent approximately two thirds of the total RNIV capital requirement.
RNIVs are broadly classified as follows:
| · | Proxied sensitivities or risk factors: to cover instruments for which market data is not available. |
| · | Higher-order sensitivity terms: to account for the fact that the VaR model is based on a P&L approximation function rather than full repricing of deals. |
| · | Interpolation and re-bucketing inaccuracy: to cover residual errors resulting from the pre-processing of risk factors into a standard set across tenors. |
| · | Data selection bias: to cover the possibility of suboptimal data sources being selected for risk factors. |
| · | Static pricing parameters: to cover the possibility that suboptimal assumed values are used for certain unobserved parameters in pricing models. |
| · | Missing basis risks: to cover cases where data sources are not detailed enough to differentiate the risks of long and short pairs of closely related instruments. |
The most material of these are proxied sensitivities, followed by higher-order sensitivity terms.
RNIVs that are related specifically to instruments that have level 3 valuation hierarchy assumptions (refer to pages 379 and 380) are mainly included in the following categories: proxied sensitivities or risk factors; higher-order sensitivity terms; and static pricing parameters.
*unaudited
Business review Capital and risk management
| The table below analyses capital requirements related to RNIVs. | | |
| | 2014 | 2013 |
| | £m | £m |
| Risks not in VaR | 57 | 30 |
| Risks not in SVaR | 79 | 39 |
| Stressed RNIV | 183 | 149 |
| | 319 | 218 |
Key point
| · | The RNIV charge increased by 41% year on year. This was primarily due to the removal of the materiality threshold in Q1, and hence all RNIVs are now subject to capital requirements, following an agreement with the PRA. This initial increase was partially offset by risk reductions across the portfolio in H2. |
Stress testing*
RBS undertakes daily market risk stress testing to identify vulnerabilities and potential losses in excess of or not captured in VaR. The calculated stresses measure the impact of changes in risk factors on the fair values of the trading and available-for-sale portfolios.
RBS conducts historical, macroeconomic and vulnerability-based stress testing.
Scenario-based sensitivity analysis measures the sensitivity of the current portfolio to defined movements in market risk factors. These risk factor movements and the resulting valuation changes are typically smaller than those considered in other stress tests.
Historical stress testing is a measure that is used for internal management. Using a similar technical framework to VaR, the current portfolio is stressed using historical data since 1 January 2005. The methodology simulates the impact of the worst loss that would be incurred by historical risk factor movements over the period, assuming a holding period specific to the risk factors and the businesses. At present, a holding period of 60 business days is applied for credit risk factors including in the case of asset-backed securities (ABS) and for the available-for-sale (AFS) portfolios that are held by CIB Treasury and generally a period of 10 business days for other risk factors. RBS reviews the holding periods annually.
Historical stress tests form part of the market risk limit framework and their results are reported daily to senior management.
Macroeconomic stress tests are carried out periodically as part of the firm-wide, cross-risk capital planning process. The scenario narratives are translated into risk factor shocks using historical events and insights by economists, risk managers and the front office. Market risk stress results are combined with those for other risks into the capital plan that is presented to the Board. The cross-risk capital planning process is conducted twice a year, in April/May and October/November, with a planning horizon of five years. The scenario narratives cover both regulatory scenarios such as the PRA Anchor and the Federal Reserve Comprehensive Capital Analysis and Review and macroeconomic scenarios identified by the firm such as a euro crisis and a China hard landing.
Vulnerability-based stress testing begins with the analysis of a portfolio and expresses the key vulnerabilities of the portfolio in terms of plausible, so-called vulnerability scenarios under which the portfolio would suffer material losses. These scenarios can be historical, forward-looking, macroeconomic or hypothetical. Vulnerability-based stress testing is used for internal management information and is not subject to limits. However, relevant scenarios are reported to senior management.
Economic capital
A market risk economic capital framework was developed in 2013 and was introduced in internal reporting in 2014.
The associated models calculate the market and default risk in the trading book and are aligned with other models that are used for limit setting and market risk management. The results are annualised to be consistent with the other economic capital models to permit consolidation of all risk types as part of the RBS-wide economic capital programme.
Other risk measures
In addition to SVaR and stress tests, RBS uses a range of other risk measures to complement VaR. These measures often represent local (small-amplitude) risk calculations which provide valuable additional controls, often at individual desk or business unit level. They mainly include, but are not limited to, sensitivity and position-based risk measures.
Sensitivity measures refer to the changes in deal or portfolio value that result from small changes in market parameters that are subject to the market risk limit framework.
Position-based measures are also used and are stated in terms that relate directly to the business activity they are applied to. Examples of such measures include the aggregate open foreign exchange position or the long, short and net amount of security or currency held and aged inventory in trading books.
*unaudited
Business review Capital and risk management
Market risk continued
Traded market risk continued
Calculation of regulatory capital*
Regulatory treatment
The market risks subject to capital requirements under Pillar 1 are primarily interest rate, credit spread and equity risks in the trading book and foreign exchange and commodity risks in both the trading and non-trading books. Interest rate and equity risks are split between general and specific risks. General risks represent market risks due to a move in a market as a whole, such as a main index or yield curve, while specific risks represent market risks arising from events particular to an underlying issuer.
Firms can choose from two broad methodologies to calculate their market risk capital charge: (i) the standard rules, whereby regulator-prescribed rules must be applied, and (ii) the internal model approach, where, subject to regulatory approval, a model such as VaR is used to calculate the capital charge.
RBS uses both methods, with the internal model approach being used to calculate about 76% (2013 - 86%) of its capital charge.
VaR and SVaR capture general and specific risks but not risks arising from the impact of defaults and rating changes associated with traded credit products and their derivatives. For these risks, three product-dependent approaches are used:
| · | The incremental risk charge (IRC) model captures risks arising from rating migration and default events for the more liquid traded credit instruments and their derivatives. |
| · | The all price risk model covers the generally lower-liquidity correlation trades and their liquid hedges (such as first-to-default basket trades). RBS ceased using an internal model for all price risk during Q2 2014, refer to page 308. |
| · | Securitisation and re-securitisation risks in the trading book are treated with the non-trading book standardised capitalisation approach. |
RWAs by legal entity and by regulatory approach*
Market risk RWAs of £24 billion and minimum capital requirement of £1.9 billion are analysed below.
Regulatory VaR*
RBS’s VaR model has been approved by the PRA to calculate its regulatory market risk capital requirement for the trading book for those legal entities under its jurisdiction. These legal entities are The Royal Bank of Scotland plc, RBS Securities Inc, RBS Financial Products Inc, and National Westminster Bank Plc. As from 1 December 2014, this approval takes the form of an internal model approach permission, replacing the earlier VaR waiver.
While internal VaR provides a measure of the economic risk, regulatory VaR is one of the measures of regulatory capital by legal entity.
The calculation of regulatory VaR differs from that of the internal VaR as it takes into account only regulator-approved products, locations and legal entities and it is based on a ten-day, rather than a one-day, holding period for market risk capital calculations.
The PRA approval covers general market risk in interest rate, foreign exchange, equity and commodity products and specific market risk in interest rate and equity products.
*unaudited
Business review Capital and risk management
Market risk continued
Traded market risk continued
VaR back-testing*
For RBS’s trading book, a green model status was maintained throughout 2014. For details of back-testing results for regulatory VaR, refer to the table on page 304.
Regulatory SVaR*
RBS’s SVaR model has also been approved by the PRA for use in the capital requirement calculation. The regulatory SVaR differs from internal SVaR as it covers only regulator-approved products, locations and legal entities.
Risks not in VaR
As discussed earlier, RBS has an established RNIV framework that ensures that the risks not captured in VaR are adequately covered by its capital.
The RNIV framework does not include tail event risks; these risks are covered indirectly by the regulatory multiplier applied to VaR and directly by relevant charges, notably the IRC discussed below.
Incremental risk charge (IRC)*
The IRC model quantifies the impact of rating migration and default events on the market value of instruments with embedded credit risk (in particular, bonds and credit default swaps) that are held in the trading book. It further captures basis risk between different instruments, maturities and reference entities. Following the internal ratings-based approach for credit risk, the IRC is calculated over a one-year capital horizon with a 99.9% confidence level.
The dependency of positions is modelled using a single-factor Gaussian copula, which facilitates an efficient calculation of the charge using numerical integration.
IRC is mainly driven by three-month transition, default and correlation parameters. The portfolio impact of correlated defaults and rating changes is assessed by observing changes in the market value of positions using stressed recovery rates and modelled credit spread changes. Revaluation matrices are used to capture any non-linear behaviour.
The model has distinct parameter sets for sovereign and corporate exposures. It reflects the overall liquidity of each position referencing an entity, using product type, product maturity and product concentration characteristics.
The constant level of risk requirement is met by replacing positions that default or migrate in one period with equivalent positions in the next. The average liquidity horizon by position at the year end was 3.3 months (2013 - 3.7 months).
All price risk (APR)*
Until Q2 2014, RBS’s APR model was used to determine the capital that should be held against all material price risks, including those arising from defaults and credit rating changes affecting securities in the hedged portfolio, using a 99.9% confidence level over a one year time horizon.
This model was applied to the correlation trading portfolio subject to certain eligibility criteria (principally that the underlying names be liquid corporate CDS positions).
Given the reduction in the size of the correlation trading portfolio, RBS ceased using an internal model for all price risk during Q2 2014. With the PRA’s approval, all remaining open risk is now capitalised under standardised rules.
Business review Capital and risk management
Market risk capital*
Minimum capital requirements
The following table analyses RBS’s total market risk minimum capital requirement of £1,917 million at 31 December 2014, calculated in accordance with the Capital Requirements Regulation (CRR); this represents 8% of the corresponding RWA amount, £24 billion. It comprises a number of regulatory capital requirements split into two categories: (i) the standardised position risk requirement (PRR) of £459 million, which has several components; and (ii) the Pillar 1 model-based PRR of £1,458 million, which comprises several modelled charges. For 2013 and 2012, the capital requirements were calculated in accordance with Basel 2.5.
| | | | |
| | CRR | Basel 2.5 | Basel 2.5 |
| | 2014 | 2013 | 2012 |
| | £m | £m | £m |
| Interest rate position risk requirement | 116 | 147 | 254 |
| Equity position risk requirement | 1 | 1 | 1 |
| Option position risk requirement | 7 | 10 | 26 |
| Commodity position risk requirement | 2 | 13 | 2 |
| Foreign currency position risk requirement | 63 | 39 | 12 |
| Specific interest rate risk of securitisation positions | 270 | 123 | 156 |
| Total (standard method) | 459 | 333 | 451 |
| Pillar 1 model based position risk requirement | 1,458 | 2,086 | 2,959 |
| Total market risk minimum capital requirement | 1,917 | 2,419 | 3,410 |
The following table analyses the principal contributors to the Pillar 1 model based PRR presented in the previous table. Following the implementation of the CRR on 1 January 2014, credit hedges eligible for CVA are no longer included in the modelled market risk capital charges. Such hedges are now included in the CVA capital charge, which forms part of the capital calculation for counterparty credit risk.
| | CRR | | Basel 2.5 | Basel 2.5 |
| | 2014 | | 2013 | 2012 |
| | Average | Maximum | Minimum | Period end | | Period end | Period end |
| 2014 | £m | £m | £m | £m | | £m | £m |
| Value-at-risk | 323 | 527 | 232 | 329 | | 576 | 825 |
| Stressed VaR | 681 | 856 | 511 | 511 | | 841 | 1,226 |
| Incremental risk charge | 402 | 530 | 299 | 299 | | 443 | 467 |
| All price risk | 2 | 6 | — | — | | 8 | 12 |
| Risk not in VaR | 412 | 472 | 319 | 319 | | 218 | 429 |
| | | | | 1,458 | | 2,086 | 2,959 |
Key points
| · | RBS’s total market risk minimum capital requirement fell in 2014, largely driven by the decreases in the Pillar 1 model-based contributors (primarily VaR, SVaR and the IRC). The standard method requirement rose, chiefly driven by the rise in the specific interest rate risk of securitisation positions. |
| · | The interest rate position risk requirement decreased, primarily due to the closure of the interest rate trading business in Japan and the associated disposal of bond positions. |
| · | The decrease in the commodity position risk requirement was driven by a change in the treatment of options under the CRR standardised approach. |
| · | The foreign currency position risk requirement increased, reflecting increased foreign currency cash positions over the period. |
| · | Specific interest rate risk of securitisation positions: This charge rose, reflecting the change in treatment regarding securitisation exposures with a risk weight of 1,250%. |
| · | Overall, the Pillar 1 model-based PRR declined 30% during 2014, driven by reductions in the VaR and SVaR charges and the IRC, offset somewhat by an increase in the RNIV charge. |
| · | The decrease in the VaR and SVaR charges was primarily driven by the removal of the CVA eligible hedges (as noted above) in Q1 and ongoing risk reduction in Q2 and Q3 relating to the asset backed product portfolio as part of the risk reduction strategy. |
| · | The IRC declined by 32%, notably in Q4 reflecting a reduced exposure to the eurozone periphery and continued risk reduction in the US ABP portfolio. The IRC figures presented in the table above differ from those in the table on page 313 for the reasons explained in the note to that table. |
| · | Given the reduction in the size of the correlation trading portfolio, RBS ceased using an internal model for all price risk during Q2. With the PRA’s approval, all remaining open risk is now capitalised under standardised rules. |
| · | For details of the drivers of the increase in the RNIV charge, refer to the commentary on page 305. |
Business review Capital and risk management
| IRC by rating and product category | | | | | | | | |
| The following table analyses the IRC by rating and product. | | | | | | |
| | Internal ratings (1) |
| 2014 | AAA | AA | A | BBB | BB | B | CCC | Total |
| £m | £m | £m | £m | £m | £m | £m | £m |
| Product categories | | | | | | | | |
| Cash - asset-backed securities | 1.6 | — | 0.2 | 0.3 | (1.6) | 0.6 | — | 1.1 |
| Cash - regular | 36.3 | 49.4 | 71.0 | 67.0 | 53.4 | 3.5 | 2.3 | 282.9 |
| Derivatives - credit | (3.9) | (11.8) | 4.4 | 3.2 | (19.1) | 0.8 | (0.3) | (26.7) |
| Derivatives - interest rate | (10.0) | (1.4) | 0.2 | 1.5 | 1.2 | — | — | (8.5) |
| Other | 0.8 | — | — | — | — | — | — | 0.8 |
| Total | 24.8 | 36.2 | 75.8 | 72.0 | 33.9 | 4.9 | 2.0 | 249.6 |
| 2013 | | | | | | | | |
| Product categories | | | | | | | | |
| Cash - asset backed securities | 31.4 | — | — | 0.2 | (1.5) | 0.1 | — | 30.2 |
| Cash - regular | 73.5 | 15.5 | 7.2 | 132.3 | 21.4 | 2.9 | 33.9 | 286.7 |
| Derivatives - credit | (4.5) | (1.2) | (4.6) | (21.4) | (19.5) | (13.4) | (23.0) | (87.6) |
| Derivatives - interest rate | 29.7 | 5.4 | 0.6 | 165.5 | 5.8 | 0.6 | — | 207.6 |
| Other | 1.7 | — | — | — | — | — | — | 1.7 |
| Total | 131.8 | 19.7 | 3.2 | 276.6 | 6.2 | (9.8) | 10.9 | 438.6 |
| (1) | Based on an assessment of S&P, Moody’s and Fitch ratings, where available, or on RBS’s internal master grading scale. |
| (2) | The figures presented are based on the spot IRC charge at 31 December 2014 and will therefore not agree with the IRC position risk requirement, as this is based on the 60-day average. The figures presented above are in capital terms. |
| (3) | The IRC figures by product category presented above are based on an internal allocation and do not constitute standalone position risk requirements. |
Key points
| · | Spot IRC capital fell £189 million or 43% year on year, for the same reasons noted on the previous page for the IRC PRR. The largest decline was in the interest rate derivatives (much of it due to decreased positions in BBB-rated EU periphery exposure). This was partially offset by the removal of CVA eligible hedges under the CRR, which drove the movement in credit derivatives. |
| · | The decrease in the AAA rating category reflects the continued reduction in US ABP business. |
| Securitisation positions in the trading book | | | | | | | | |
| The following table shows the capital requirement for trading book securitisation positions by rating. | | |
| | | | | | | | | | |
| | Ratings (1) | | | |
| | | | | | Non-investment | | | | Capital |
| | AAA | AA | A | BBB | grade | Unrated | Total (1,2) | STD PRR (3) | deductions |
| 2014 | £m | £m | £m | £m | £m | £m | £m | % | £m |
| Trading book securitisation charge | 3.9 | 1.0 | 4.1 | 22.1 | 148.9 | 90.3 | 270.3 | 10.0 | — |
| | | | | | | | | | |
| 2013 | | | | | | | | | |
| Trading book securitisation charge | 8.9 | 6.2 | 12.7 | 35.5 | 54.5 | 5.4 | 123.2 | 42.9 | 932.1 |
| (2) | Excludes the capital deductions. |
| (3) | Percentage of total standardised position risk requirement. |
Key point
| · | The increase in the non-investment grade and unrated categories was caused by the change in treatment regarding securitisation exposures with a risk weight of 1,250%. This increase was partially offset by the disposal of assets across the rating categories. |
*unaudited
Business review Capital and risk management
Market risk continued
Valuation and independent price verification
Traders are responsible for marking-to-market their trading book positions daily, ensuring that assets and liabilities in the trading book are measured at their fair value. Any profits or losses on the revaluation of positions are recognised daily.
Product controllers are responsible for ensuring that independent price verification processes are in place covering all trading book positions held by their business. Independent price verification and trader supervision are the key controls over front office marking of positions.
For more information on valuation controls, refer to page 299. The validation of pricing models is discussed below.
Model validation
The independent model validation framework governing both pricing models and risk models (including VaR) is described below.
RBS uses a variety of models to manage and measure market risk, as described below. These models comprise pricing models (used for valuation of positions) and risk models (for risk measurement and capital calculation purposes). They are developed in both RBS-level and lower-level functions and are subject to independent review and sign-off.
A dedicated independent model review and challenge function - Model Risk - performs reviews of relevant models in two instances: (i) for new models or amendments to existing models and (ii) as part of its ongoing programme to assess the performance of these models.
A new model is typically introduced when an existing model is no longer fit for purpose or a new product requires a new methodology or model to quantify the risk appropriately. Amendments are usually made when a weakness is identified during use of a model or following analysis either by the model developers or by Model Risk.
Pricing models*
Pricing models are developed by a dedicated front office quantitative team, in conjunction with the trading desk. They are used for the valuation of positions for which prices are not directly observable and for the risk management of the portfolio.
Any pricing models that are used as the basis for valuing books and records are subject to approval and oversight by asset-level modelled product review committees.
These committees comprise representatives of the major stakeholders in the valuation process - trading, finance, market risk, model development and model review functions.
The review process comprises the following steps:
| · | The committees prioritise models for review by Model Risk, considering the materiality of the risk booked against the model and an assessment of the degree of model risk, that is the valuation uncertainty arising from the choice of modelling assumptions. |
| · | Model Risk quantifies the model risk by comparing front office model outputs with those of alternative models independently developed by Model Risk. |
| · | The sensitivities derived from the pricing models are validated. |
| · | The conclusions of the review are used by Market Risk to inform risk limits and by Finance to inform model reserves. |
Risk models*
All new risk models are subject to review and sign-off by Model Risk.
All model changes are approved through model governance at the franchise level. Changes to existing models that have an impact on VaR exceeding 5% at legal entity level or 15% at a major business level are also subject to Model Risk review and sign-off as are all model changes that require regulator approval before implementation.
Model Risk’s independent review comprises some or all of the following steps, as appropriate:
| · | Testing and challenging the logical and conceptual soundness of the methodology; |
| · | Testing the assumptions underlying the model, where feasible, against actual behaviour. In its validation report, Model Risk will opine on the reasonableness and stability of the assumptions and specify which assumptions, if any, should be routinely monitored in production; |
| · | Testing whether all key market risks have been sufficiently captured; |
| · | Re-applying the proposed approach to verify that the same outcome is achieved; |
| · | Comparing outputs with results from alternative methods; |
| · | Testing parameter selection and calibration; |
| · | Ensuring model outputs are sufficiently conservative in areas where there is significant model uncertainty; |
| · | Confirming the applicability of tests for accuracy and stability; recalculating and ensuring that results are robust; and |
| · | Ensuring appropriate sensitivity analysis has been performed and documented. |
*unaudited
Business review Capital and risk management
Based on the review and findings from Model Risk, an internal model governance committee with appropriate delegated authority considers whether a model can be approved for use and whether any conditions need to be imposed, including those relating to the remediation of material issues raised through the review process. Once approved through internal governance, the new or amended model is implemented. Models used for regulatory reporting may additionally require PRA approval before implementation.
Model Risk also reassesses the appropriateness of approved risk models on a periodic basis according to the approved Periodic Review Policy. Each periodic review consists of a quick scan assessment and a subsequent decision by an internal model governance committee with appropriate delegated authority to re-ratify a model based on the quick scan assessment or to perform additional work prior to making a decision whether or not to re-ratify a model. In the quick scan assessment Model Risk assesses changes since the last approval along the following dimensions: change in size/composition of the portfolio, market changes, model performance, model changes, status of any outstanding issues, scheduled activities including work carried over from previous reviews.
This independent oversight also provides additional assurance that RBS holds appropriate capital for the market risk to which it is exposed.
The model testing team in Market Risk also performs regular VaR model testing, which is discussed in more detail under Risk measurement - value-at-risk on page 300.
Non-traded market risk
Risk governance
RBS manages the three key categories of non-traded market risk separately. The categories are: non-traded interest rate risk; non-traded foreign exchange risk; and non-traded equity risk.
The Chief Risk Officer delegates responsibility for day-to-day control of non-traded interest rate risk and foreign exchange risk to the Director of Market Risk.
Non-traded market risk positions are reported to the ALCo and the Board, monthly in the case of interest rate risk and quarterly in the case of foreign exchange and equity risk.
Controls and assurance
The ERF approves the non-traded market risk framework. The non-traded market risk policy statement sets out the governance and risk management framework through effective identification, measurement, reporting, mitigation, monitoring and control.
The models used for managing non-traded market risk are subject to the validation process described on page 311.
Risk appetite*
The ERF sets RBS’s appetite for non-traded market risk and approves appropriate risk limits as recommended by the Director of Market Risk and the ALCo. Further information on the process and the limit framework can be found on pages 176 to 179.
Risk assessment, monitoring and mitigation
Interest rate risk
Non-traded interest rate risk (NTIRR) factors are grouped into the following categories:
| · | Repricing risk, which arises when asset and liability positions either mature (in the case of fixed-rate positions) or their interest rates reset (in the case of floating-rate positions) at different dates. These mismatches may give rise to net interest income and economic value volatility as interest rates vary. |
| · | Yield curve risk, which arises from unanticipated changes in the shape of the yield curve, such that rates at different maturity points may move differently. Such movements may give rise to interest income and economic value volatility. |
| · | The two risk factors above incorporate the duration risk arising from the reinvestment of maturing swaps hedging net free reserves (or net exposure to equity and other low fixed-rate or non-interest-bearing liability balances including, but not limited to, current accounts). |
| · | Basis risk, which arises when related instruments with the same tenor are valued using different reference yield curves. Changes in the spread between the different reference curves can result in unexpected changes in the valuation of or income difference between assets, liabilities or derivative instruments. This occurs, for example, in the retail and commercial portfolios, when products valued on the basis of the Bank of England base rate are funded with LIBOR-linked instruments. |
| · | Optionality risk, which arises when customers have the right to terminate, prepay or otherwise alter a transaction without penalty, resulting in a change in the timing or magnitude of the cash flows of an asset, liability or off-balance sheet instrument. This risk primarily arises in the US mortgage business in CFG where long-term fixed-rate loans are the norm and prepayment penalties are rare. |
Due to the long-term nature of many non-trading book portfolios and their varied interest rate repricing characteristics and maturities, it is likely that net interest income will vary from period to period, even if interest rates remain the same. New business originated in any period will alter RBS’s interest rate sensitivity if the resulting portfolio differs from portfolios originated in prior periods, depending on the extent to which exposure has been hedged.
RBS’s policy is to manage the interest rate sensitivity within risk limits that are approved by the ERF and endorsed by the ALCo before being cascaded to lower levels. These include, in particular, interest rate sensitivity and VaR limits.
In order to manage exposures within these limits, RBS aggregates its interest rate positions and hedges them externally using cash and derivatives - primarily interest rate swaps.
This task is primarily carried out by RBS Treasury, to which all businesses except CFG and CIB transfer most of their NTIRR. The main exposures and limit utilisations are reported to the ALCo and the Board monthly.
Business review Capital and risk management
Foreign exchange risk
The only material non-traded open currency positions are the structural foreign exchange exposures arising from investments in foreign subsidiaries, branches and associates and their related currency funding. These exposures are assessed and managed by RBS Treasury to predefined risk appetite levels under delegated authority from the ALCo. RBS Treasury seeks to limit the potential volatility impact on RBS’s Common Equity Tier 1 (CET1) ratio from exchange rate movements by maintaining a structural open currency position. Gains or losses arising from the retranslation of net investments in overseas operations are recognised in equity reserves and reduce the sensitivity of capital ratios to foreign exchange rate movements primarily arising from the retranslation of non-sterling-denominated RWAs. Sensitivity is minimised where, for a given currency, the ratio of the structural open position to RWAs equals RBS’s CET1 ratio. The sensitivity of the CET1 capital ratio to exchange rates is monitored monthly and reported to the ALCo at least quarterly.
Foreign exchange exposures arising from customer transactions are sold down by businesses on a regular basis in line with RBS policy.
Equity risk
Non-traded equity risk is the potential variation in the income and reserves arising from changes in non-trading book equity valuations. Any such risk is identified prior to any investments and then mitigated through a framework of controls.
Investments, acquisitions or disposals of a strategic nature are referred to RBS’s Acquisitions and Disposals Committee (ADCo). Once approved by ADCo for execution, such transactions are referred for approval to the Board, the RBS Executive Committee (ExCo), the RBS Chief Financial Officer or as otherwise required. Decisions to acquire or hold equity positions in the non-trading book that are not of a strategic nature, such as customer restructurings, are taken by authorised persons with delegated authority under the credit approval framework.
Risk measurement
Interest rate risk
NTIRR can be measured from either an economic value-based or earnings-based perspective (or both). Value-based approaches measure the change in value of the balance sheet assets and liabilities over a longer timeframe, including all cash flows. Earnings-based approaches measure the potential short-term (generally one year) impact on the income statement of charges in interest rates.
RBS uses both approaches to quantify its interest rate risk: VaR as its value-based approach and sensitivity of net interest income (NII) as its earnings-based approach.
These two approaches provide different yet complementary views of the impact of interest rate risk on the balance sheet at a point in time. The scenarios employed in the NII sensitivity approach incorporate business assumptions and simulated modifications in customer behaviour as interest rates change. In contrast, the VaR approach assumes static underlying positions and therefore does not provide a dynamic measurement of interest rate risk. In addition, while the NII sensitivity calculations are measured to a 12-month horizon and thus provide a shorter-term view of the risks on the balance sheet, the VaR approach can identify risks not captured in the sensitivity analysis, in particular the impact of duration and repricing risk on earnings beyond 12 months.
Value-at-risk
RBS’s standard VaR metrics - which assume a time horizon of one trading day and a confidence level of 99% - are based on interest rate repricing gaps at the reporting date. Daily rate moves are modelled using observations over the last 500 business days. These incorporate customer products plus associated funding and hedging transactions as well as non-financial assets and liabilities such as property, plant and equipment, capital and reserves. Behavioural assumptions are applied as appropriate.
The table below shows the NTIRR VaR for RBS’s retail and commercial banking activities at a 99% confidence level together with a currency analysis of period end VaR.
| | Average | Period end | Maximum | Minimum |
| | £m | £m | £m | £m |
| 2014 | 50 | 23 | 79 | 23 |
| 2013 | 45 | 51 | 57 | 30 |
| 2012 | 46 | 21 | 65 | 20 |
| | | | | |
| | | 2014 | 2013 | 2012 |
| | £m | £m | £m |
| Euro | | 2 | 4 | 19 |
| Sterling | | 12 | 19 | 17 |
| US dollar | | 27 | 44 | 15 |
| Other | | 3 | 2 | 4 |
Key points
| · | The decline in VaR between 2013 and 2014 reflects RBS policy to reduce economic exposure to changes in interest rates. This notably related to US dollar and sterling interest rate exposures. |
| · | The reduction in exposure was achieved in the second half of the year through both hedging and the utilisation of naturally arising balance sheet offsets, such as the increase in net free reserves following the partial IPO of CFG. This resulted in period end VaR decreasing significantly more than the average for the year. |
| · | These movements remained well within RBS’s approved market risk appetite. |
Business review Capital and risk management
Sensitivity of net interest income*
To analyse earnings sensitivities, forecasts are generated using implied forward rates, projected new business volumes, mix and pricing generated using business assumptions. Based on the balance sheet at the most recent month end, two NII forecasts are calculated each month: (i) a forecast for the current full year, which incorporates actuals monthly as the year progresses; and (ii) a base-case 12 month rolling forecast.
In addition, the 12 month rolling forecast is re-run using alternative rates under various scenarios, incorporating changes in customer behaviour and business assumptions as appropriate. Variances between these scenarios are analysed to identify key drivers. These forecasts and sensitivities form part of the information used by senior management to manage the bank's NII targets.
This sensitivity analysis also incorporates assumptions relating to optionality risk.
The following table shows the sensitivity of net interest income, over the next 12 months, to an immediate upward or downward change of 100 basis points to all interest rates. In addition, the table includes the impact of a gradual 400 basis point steepening (bear steepener) and a gradual 300 basis point flattening (bull flattener) of the yield curve at tenors greater than a year.
The scenarios represent annualised interest rate stresses of a scale deemed sufficient to trigger a modification in customer behaviour. The asymmetry in the steepening and flattening scenarios reflects the difference in the expected behaviour of interest rates as they approach zero.
The reported sensitivities will vary over time due to a number of factors such as market conditions and strategic changes to the balance sheet mix and should not therefore be considered predictive of future performance.
| | | | | | | |
| | Euro | Sterling | US dollar | Other | Total | Of which CFG |
| 2014 | £m | £m | £m | £m | £m | US$m |
| + 100 basis point shift in yield curves | (28) | 347 | 214 | (17) | 516 | 154 |
| − 100 basis point shift in yield curves | (34) | (298) | (87) | (12) | (431) | (85) |
| Bear steepener | | | | | 406 | 105 |
| Bull flattener | | | | | (116) | (58) |
| | | | | | | |
| 2013 | | | | | | |
| + 100 basis point shift in yield curves | 59 | 416 | 175 | 31 | 681 | 183 |
| − 100 basis point shift in yield curves | (29) | (333) | (82) | (15) | (459) | (76) |
| Bear steepener | | | | | 403 | 122 |
| Bull flattener | | | | | (273) | (88) |
| | | | | | | |
| 2012 | | | | | | |
| + 100 basis point shift in yield curves | (29) | 472 | 119 | 27 | 589 | 255 |
| − 100 basis point shift in yield curves | (20) | (257) | (29) | (11) | (317) | (76) |
| Bear steepener | | | | | 216 | 65 |
| Bull flattener | | | | | (77) | (33) |
Key points
| · | Interest rate exposure remains asset sensitive, such that rising rates will have a positive impact on net interest income. |
| · | The decreased sensitivity to parallel shifts in the yield curve over a 12 month horizon is due to increased exposure to fixed rate assets and changes in assumptions regarding the impact on customer pricing. |
Structural hedging*
Banks generally have the benefit of a significant pool of stable, non and low interest bearing liabilities, principally comprising equity and money transmission accounts. These balances are usually hedged, either by investing directly in longer-term fixed rate assets or by the use of interest rate swaps, in order to provide a consistent and predictable revenue stream.
RBS targets a weighted average life for these economic hedges. This is accomplished using a continuous rolling maturity programme, which is primarily managed by Treasury to achieve the desired profile. The maturity profile of the hedge aims to reduce the potential sensitivity of income to rate movements. The structural hedging programme is RBS-wide, capturing the position in the UK banking businesses and regulated subsidiaries in other jurisdictions.
*unaudited
Business review Capital and risk management
Non-traded market risk continued
Product hedging*
Product structural hedges are used to minimise the volatility on earnings related to specific products, primarily customer deposits. The balances are primarily hedged with medium-term interest rate swaps, so that reported income is less sensitive to movements in short -term interest rates. The size and term of the hedge are based on the stability of the underlying portfolio.
The table below shows the impact on net interest income associated with product hedges managed by RBS Treasury. These relate to the main UK banking businesses except Private Banking. The figure shown represents the incremental contribution of the hedge relative to short-term wholesale cash rates.
| Net interest income | | |
| 2014 | 2013 |
| £m | £m |
| UK Personal & Business Banking | 393 | 387 |
| Commercial Banking | 180 | 121 |
| Corporate & Institutional Banking | 75 | 77 |
| Total product hedges | 648 | 585 |
| | | |
Key points
| · | The incremental impact of product hedges on net interest income remained positive in 2014, increasing from £585 million to £648 million. Throughout the year, short term wholesale cash rates remained at or close to historical low levels. The notional size of the hedge increased from £48 billion to £64 billion. The scope of the hedging programme was extended to cover not only customer current accounts but also customer savings deposits. The incremental yield on the portfolio above 3-month LIBOR fell from 1.2% to 1.0%, largely as a result of the one-off effect of establishing the new hedge. At the end of December 2014, the equivalent incremental yield available in the market was 0.8% compared with 1.5% at the end of 2013. |
| · | Across RBS, banking book exposure to medium-term fixed rates fell during 2014. The increased exposure established by the product hedge was offset by reducing exposure in Treasury. |
Equity hedging*
Equity structural hedges are used to minimise the volatility on earnings arising from returns on equity. The hedges managed by Treasury relate mainly to the UK banking businesses and contributed £0.8 billion to these businesses in 2014 (2013 - £0.8 billion), which is an incremental benefit relative to short-term wholesale cash rates. The size of the hedge increased from £39 billion in 2013 to £41 billion in 2014. The fall in yield mainly results from reinvestment of maturing hedges at lower rates.
*unaudited
Business review Capital and risk management
Foreign exchange risk
The table below shows structural foreign currency exposures.
| | Net assets of | | Non- | | Net assets of | | Net | | Structural foreign | | | | Residual structural |
| overseas | | controlling | | overseas operations | | investment | | currency exposures | | Economic | | foreign currency |
| operations | | interests | | excluding NCI (1) | | hedges | | pre-economic hedges | | hedges (2) | | exposures |
| 2014 | £m | | £m | | £m | | £m | | £m | | £m | | £m |
| US dollar | 11,402 | | (2,321) | | 9,081 | | (3,683) | | 5,398 | | (4,034) | | 1,364 |
| Euro | 6,076 | | (39) | | 6,037 | | (192) | | 5,845 | | (2,081) | | 3,764 |
| Other non-sterling | 4,178 | | (456) | | 3,722 | | (2,930) | | 792 | | — | | 792 |
| | 21,656 | | (2,816) | | 18,840 | | (6,805) | | 12,035 | | (6,115) | | 5,920 |
| | | | | | | | | | | | | | |
| 2013 | | | | | | | | | | | | | |
| US dollar | 16,176 | | — | | 16,176 | | (1,581) | | 14,595 | | (3,808) | | 10,787 |
| Euro | 6,606 | | (9) | | 6,597 | | (190) | | 6,407 | | (2,226) | | 4,181 |
| Other non-sterling | 4,233 | | (372) | | 3,861 | | (3,185) | | 676 | | — | | 676 |
| | 27,015 | | (381) | | 26,634 | | (4,956) | | 21,678 | | (6,034) | | 15,644 |
| | | | | | | | | | | | | | |
| 2012 | | | | | | | | | | | | | |
| US dollar | 17,313 | | (1) | | 17,312 | | (2,476) | | 14,836 | | (3,897) | | 10,939 |
| Euro | 8,903 | | (2) | | 8,901 | | (636) | | 8,265 | | (2,179) | | 6,086 |
| Other non-sterling | 4,754 | | (260) | | 4,494 | | (3,597) | | 897 | | — | | 897 |
| | 30,970 | | (263) | | 30,707 | | (6,709) | | 23,998 | | (6,076) | | 17,922 |
| (1) | Non-controlling interests (NCI) represents the structural foreign exchange exposure not attributable to owners’ equity, which consisted mainly of CFG in US dollar in 2014 (2013 and 2012: mainly RFS MI in other non-sterling) |
| (2) | Economic hedges mainly represent US dollar and euro preference shares in issue that are treated as equity under IFRS and do not qualify as hedges for accounting purposes. |
Key points
| · | Structural foreign currency exposure at 31 December 2014 was £12.0 billion and £5.9 billion before and after economic hedges, respectively, £9.6 billion and £9.7 billion lower than at 31 December 2013, of which £7.5 billion related to CFG. Movements in structural foreign currency exposure result from changes in the net assets of overseas operations, non-controlling interests and net investment hedges. |
| · | Net assets of overseas operations declined by £5.4 billion, largely due to write-downs relating to CFG and US deferred tax assets. |
| · | Non-controlling interests increased by £2.4 billion, as a result of the partial disposal of CFG during the year. |
| · | Net investment hedges increased by £1.8 billion, primarily due to an increase in US dollar hedging to manage the disposal of CFG. |
| · | Economic hedges, which mainly consist of equity capital securities in issue, remained broadly unchanged. |
| · | Changes in foreign currency exchange rates affect equity in proportion to structural foreign currency exposure. For example, a 5% strengthening in foreign currencies against sterling would result in a gain of £0.6 billion in equity (2013 - £1.1 billion), while a 5% weakening would result in a loss of £0.6 billion in equity (2013 - £1 billion). |
Business review Capital and risk management
Equity risk
Equity positions are carried at fair value on the balance sheet based on available market prices where possible. In the event that market prices are not available, fair value is based on appropriate valuation techniques or management estimates.
Refer to the table below for the balance sheet carrying value of non-traded book equity positions.
| | 2014 | 2013 | 2012 |
| | £m | £m | £m |
| Exchange-traded equity | 132 | 368 | 472 |
| Private equity | 544 | 621 | 632 |
| Other | 681 | 623 | 799 |
| | 1,357 | 1,612 | 1,903 |
The exposures may take the form of (i) equity shares listed on a recognised exchange, (ii) private equity shares or (iii) other equity shares consisting mainly of Federal Reserve and Federal Home Loan Bank stock. Refer to the table below for the net realised and unrealised gains from these positions.
| | 2014 | 2013 | 2012 |
| £m | £m | £m |
| Net realised gains arising from disposals | 111 | 48 | 89 |
| Unrealised gains included in Tier 1 or Tier 2 capital | 199 | 232 | 168 |
| (1) | Includes gains or losses on available-for-sale instruments only. |
Gains on equity securities designated at fair value through profit or loss but not held for trading purposes were £222 million for 2014 (2013 - gains of £96 million; 2012 - gains of £184 million).
Business review Capital and risk management
Non-traded market risk continued
VaR for selected AFS non-trading portfolios
Available-for-sale portfolios in CIB and RCR, other than the structured credit portfolio, do not typically form part of the structural interest rate framework due to the short-term nature of the interest rate risks they carry. They are thus monitored and managed through the same framework and using the same metrics as portfolios in the trading book.
| | 2014 | | 2013 | | 2012 |
| | Average | Period end | Maximum | Minimum | | Average | Period end | Maximum | Minimum | | Average | Period end | Maximum | Minimum |
| £m | £m | £m | £m | £m | £m | £m | £m | £m | £m | £m | £m |
| Interest rate | 2.7 | 2.7 | 6.8 | 1.1 | | 2.7 | 2.4 | 4.8 | 1.9 | | 6.9 | 4.5 | 10.7 | 4.1 |
| Credit spread | 3.6 | 2.4 | 5.4 | 2.4 | | 8.5 | 4.4 | 13.3 | 4.4 | | 10.5 | 8.8 | 15.4 | 7.3 |
| Currency | 0.5 | 0.4 | 1.1 | 0.1 | | 1.3 | 1.0 | 2.8 | 1.0 | | 3.0 | 1.3 | 4.5 | 1.3 |
| Equity | 0.7 | 0.8 | 1.2 | — | | 0.2 | 0.1 | 0.3 | — | | 1.7 | 0.3 | 1.9 | 0.3 |
Diversification (1) | | (2.5) | | | | | (2.9) | | | | | (5.4) | | |
| Total | 4.6 | 3.8 | 7.1 | 3.0 | | 9.2 | 5.0 | 13.6 | 5.0 | | 11.8 | 9.5 | 18.3 | 8.5 |
| | | | | | | | | | | | | | | |
| CIB | 3.9 | 3.6 | 5.8 | 2.6 | | 8.7 | 5.0 | 12.7 | 5.0 | | 11.3 | 7.5 | 19.0 | 7.1 |
| RCR | 2.3 | 1.5 | 3.5 | 1.5 | | n/a | n/a | n/a | n/a | | n/a | n/a | n/a | n/a |
| Non-Core | n/a | n/a | n/a | n/a | | 2.2 | 0.4 | 3.4 | 0.4 | | 2.5 | 3.4 | 3.6 | 1.6 |
| (1) | RBS benefits from diversification as it reduces risk by allocating positions across various financial instrument types, currencies and markets. The extent of the diversification benefit depends on the correlation between the assets and risk factors in the portfolio at a particular time. The diversification factor is the sum of the VaR on individual risk types less the total portfolio VaR. |
| (2) | The table above excludes the structured credit portfolio and loans and receivables. |
Key points
| · | The average VaR for the non-trading book, predominantly comprising available-for-sale portfolios, was £4.6 million during 2014 compared with £9.2 million during the same period in 2013. This was largely driven by a decline in the credit spread VaR in Q1, which partly reflected a decision to switch some of the securities held as collateral from floating-rate notes issued by financial institutions to government bonds during March as part of RWA reductions. |
| · | A further driver of the decline, which largely affected the last three quarters of the year, was the decision to reduce the US ABP business in line with the exit strategy. |
Structured credit portfolio
The structured credit portfolio is measured on a notional and fair value basis because of its illiquid nature. Notional and fair value decreased to £0.4 billion and £0.3 billion respectively (2013 - £0.7 billion and £0.5 billion), reflecting the sale of underlying assets, primarily consumer ABS, RMBS and CLOs/CDOs, in line with RCR strategy.
Calculation of regulatory capital
RBS holds capital for two types of non-traded market risk exposures: NTIRR and non-trading book foreign exchange.
Capital for NTIRR is captured under the Pillar 2A process. This is calculated by considering the potential impact on RBS’s economic value over a one year horizon. The four main sources of NTIRR - repricing, yield curve, basis and optionality risks - are captured in the calculation.
Pillar 1 capital must be held for non-trading book foreign exchange exposures, as outlined under CRR Articles 455 and 92(3)c. Structural foreign exchange exposures as these are excluded from the calculations as outlined under CRR Article 352(2). Such expposures are considered under Pillar 2A.
Non-traded equity risk is captured in credit risk RWAs.
The capital calculations under internal capital adequacy assessment process are also used for economic capital purposes.
Business review Capital and risk management
| Country risk |
| 320 | Definition |
| 320 | Sources of risk |
| 320 | Overview |
| 320 | Outlook for 2015 |
| 320 | Governance |
| 320 | Risk appetite |
| 321 | Risk mitigation |
| 321 | Risk monitoring |
| 321 | Measurement |
| 321 | Basis of preparation |
| 322 | Summary of country exposures |
Business review Capital and risk management
Country risk
Definition
Country risk is the risk of losses occurring as a result of either a country event or unfavourable country operating conditions. As country events may simultaneously affect all or many individual exposures to a country, country event risk is a concentration risk. For other types of concentration risks such as product, sector or single-name concentration, refer to the Credit risk section.
Sources of risk
Country risk has the potential to affect all parts of RBS’s portfolio across wholesale and retail activities that are directly or indirectly linked to the country in question. It arises from possible economic or political events in each country to which RBS has exposure, and from unfavourable conditions affecting daily operations in a country.
Country events may include a sovereign default, a political conflict, a banking crisis or a deep and prolonged recession leading to possible counterparty defaults. Transfer or convertibility restrictions imposed by a country’s government to stem the loss of foreign currency reserves may temporarily prevent counterparties from meeting their foreign currency payment obligations. Major currency depreciation may also affect a customer’s income or debt burden, leading to default.
Unfavourable operating conditions may include the risk that a weak or creditor-unfriendly legal system within a country makes it difficult for RBS to recover its claims in the event of customer default. An unreliable or unstable political system may lead to sudden compliance or reputational issues, or even expropriation without proper compensation.
Overview*
The conflict between Ukraine and Russia and the consequent escalating tensions between Russia and the West triggered an internal review of credit grades. Limits for both countries were adjusted, additional credit restrictions were placed on new business and exposures were reviewed against international sanctions.
The eurozone region emerged from recession, with some of the periphery countries recovering but growth in other countries, including Germany mostly sluggish. The EU’s Single Supervisory Mechanism (SSM) commenced in November 2014 when the European Central Bank (ECB) assumed supervisory responsibility for the 130 largest banks of the eurozone, after concluding a detailed Asset Quality Review of their books, adjusting balance sheets and stress testing their capital positions. This SSM is the first pillar of the EU Banking Union that should reduce the risk of a repeat of the financial crisis over the longer term and that helps to support the quality of the bank’s exposure, particularly in Europe. The other pillar will be the Single Resolution Mechanism, scheduled for 2016.
Important shifts in exposure occurred in 2014 as a result of the sale of a significant portion of RBS N.V.’s liquidity portfolio AFS bonds following internal asset quality reviews and stress tests. The sale consisted of Spanish covered bonds, contributing to a reduction in Spanish net balance sheet exposure to £3.3 billion (2013 - £9.1 billion; 2012 - £11.5 billion).
Outlook for 2015*
In 2015, recovery in the advanced economies will likely remain uneven, with widening differentials between the US and Europe in growth, price levels and policies. The policy divergence will be amplified by the January 2015 ECB announcement of a €1,000 billion quantitative easing programme, aimed at reversing deflation and stimulating credit growth, while the US Federal Reserve is expected to start tightening interest rates in the second half of 2015.
The Chinese economy continues its structural slowdown; broad reforms aim at ensuring more sustainable long-term growth, but accumulated financial vulnerabilities bear downside risks. Growth in emerging markets is expected to be restrained by reduced capital inflows, depressed global commodity prices, and geopolitical conflicts, at times resulting in market volatility in the most vulnerable economies.
Governance*
The Executive Risk Forum (ERF) delegates authority to set sovereign ratings, sovereign loss given default rates, and country Watchlist colours to the Group Chief Credit Officer (CCO), who may further delegate this authority to Strategic Risk. The ERF delegates authority to decide on country risk matters such as risk appetite, risk management strategy and framework, and risk exposure and policy to the Credit Risk Committee (CRC), which may further delegate it to Country Risk Management (CoRM). This includes the setting of country limits, where appropriate including allocations for specific product groups. The CCO and CRC can escalate issues to the ERF when necessary.
For further information on governance, refer to the Risk governance section on page 172.
Risk appetite*
RBS’s country risk appetite framework has “top-down” and “bottom-up” components.
The top-down component is guided by global risk appetite; each country’s internal sovereign rating; its strategic importance to the bank; the composition of the bank’s portfolio; the funding profile; and an assessment of the potential for losses arising from possible key country risk events. This component provides a clear structure for the consideration of downside scenarios, the identification of countries that pose material concentration risks to the bank, and possible management actions.
Bottom-up analysis includes the risk/return relationship as well as reputational and regulatory risk.
Country limits are set for almost all countries. The UK is an exception, given its home country status. The US is another exception because of the specific local risk management structure, the size of the local portfolio and corresponding role in RBS-wide risk management, together with the country's strong ratings.
*unaudited
Business review Capital and risk management
Risk mitigation*
Part of RBS’s exposure is mitigated by guarantors or insurers (including export credit agencies), credit default swap (CDS) protection providers, or collateral in third countries, which will not be directly affected by a country event in the obligor’s country. Further details on credit mitigation instruments are provided in the Credit risk section.
CDS contracts are used to hedge either entire portfolios or specific individual exposures. These transactions are subject to regular margining, which usually takes the form of cash collateral. For European peripheral sovereigns, credit protection is purchased from a number of major European banks, mostly outside the country of the reference entity. In a few cases where protection was bought from banks in the country of the reference entity, giving rise to wrong-way risk, this risk is mitigated through specific collateralisation and monitored weekly.
Risk monitoring*
The CoRM team monitors and reports on exposures to all countries, and follows up with the customer businesses in the event of limit excesses. CoRM has delegated authority up to specified levels to decide on country limit increases; any such decision must be reported to the CRC. Persistent excesses are escalated to the CRC.
A country risk Watchlist process identifies emerging issues, facilitating the development of mitigation strategies. Monthly reports discussing RBS’s main country risks and trends are sent to the CRC leadership team, with any key risks reported to the Executive Committee and the Board Risk Committee.
Countries Watchlisted Amber are monitored closely. Appetite for countries Watchlisted Red is limited to short-term business in areas such as trade finance and derivatives, unless the country is deemed a strategic priority country.
Detailed portfolio reviews are conducted to ensure that the composition of country portfolios remains aligned with RBS’s country risk appetite in light of economic and political developments. Changes in sovereign ratings or country Watchlist status trigger a review of appetite and, where appropriate, are referred to the CRC for discussion.
Measurement*
In this section, country exposure includes wholesale and retail net on-balance sheet exposure (drawn amounts under lending facilities, net of provisions, mark-to-market derivatives positions and issuer-risk debt securities positions in the banking book and trading book) together with off-balance sheet exposure (contingent obligations and undrawn commitments).
RBS also estimates its funding mismatches at risk of redenomination in vulnerable eurozone countries. These mismatches are defined as the exposures (net of provisions) that would be expected to convert to a new national currency minus the liabilities that would be expected to re-denominate at the same time. Exposures exclude balances at low risk of redenomination, as identified through consideration of the relevant documentation, particularly the currency of exposure, governing law, court of jurisdiction, precise definition of the contract currency (for euro facilities), and location of payment.
Basis of preparation
The tables on pages 322 and 323 show RBS’s exposure at 31 December 2014, 2013 and 2012. Exposures are reported by country of operation of the obligor, except exposures to governments and individuals, which are shown by country of residence.
The country of operation is the country where the main operating assets of a legal entity are held, or where its main cash flows are generated, taking account of the entity’s dependency on subsidiaries' activities.
Countries shown are those which had ratings of A+ or below from Standard and Poor’s, Moody’s or Fitch at 31 December 2014, where RBS’s balance sheet exposure (as defined in this section) to counterparties operating (or individuals residing) in them exceeded £1 billion. Also included are selected eurozone countries.
The exposures are stated before taking into account risk mitigants such as guarantees, insurance or collateral (with the exception of reverse repos) which may have been put in place to reduce or eliminate exposure to country risk events. The tables show CDS positions separately, as RBS may be either a net buyer or a net seller of protection.
Exposures relating to ocean-going vessels are not included as they cannot be meaningfully assigned to specific countries from a country risk perspective.
*unaudited
Business review Capital and risk management
| Summary of country exposures | | | | | | | | | | | | | | | | | | | |
| | | | | | | | | | | | | | | | | | | | | CDS | | |
| | Net balance sheet exposure | | Analysis of net balance sheet exposures | | Off- | | | | notional | | |
| | | | Other | | | | | Net | | Debt securities | | Net | | balance | | Total | | less | Gross |
| | Sovereign | Banks | FI | Corporate | Personal | Total | | lending | | AFS/LAR | HFT (net) | | Derivatives | SFT | | sheet | | exposure | | fair value | Derivatives | SFT |
| 2014 | £m | £m | £m | £m | £m | £m | | £m | | £m | £m | | £m | £m | | £m | | £m | | £m | £m | £m |
| | | | | | | | | | | | | | | | | | | | | | | |
| Eurozone | | | | | | | | | | | | | | | | | | | | | | |
| Ireland | 826 | 726 | 839 | 5,653 | 14,593 | 22,637 | | 21,176 | | 56 | 413 | | 991 | 1 | | 2,922 | | 25,559 | | (48) | 2,330 | 1,464 |
| Italy | 127 | 2,519 | 368 | 1,187 | 25 | 4,226 | | 1,095 | | 169 | 5 | | 2,957 | — | | 2,031 | | 6,257 | | (625) | 9,192 | 823 |
| Spain | 251 | 583 | 164 | 2,184 | 88 | 3,270 | | 2,024 | | 47 | 364 | | 835 | — | | 1,923 | | 5,193 | | (312) | 3,913 | 422 |
| Portugal | 111 | 246 | 97 | 322 | 8 | 784 | | 282 | | 20 | 152 | | 330 | — | | 222 | | 1,006 | | (155) | 390 | 613 |
| Greece | 8 | 258 | 1 | 92 | 17 | 376 | | 63 | | — | 8 | | 305 | — | | 23 | | 399 | | (8) | 416 | — |
| Cyprus | — | — | — | 113 | 14 | 127 | | 108 | | — | — | | 19 | — | | 16 | | 143 | | — | 19 | — |
| | | | | | | | | | | | | | | | | | | | | | | |
| Eurozone | | | | | | | | | | | | | | | | | | | | | | |
| periphery | 1,323 | 4,332 | 1,469 | 9,551 | 14,745 | 31,420 | | 24,748 | | 292 | 942 | | 5,437 | 1 | | 7,137 | | 38,557 | | (1,148) | 16,260 | 3,322 |
| | | | | | | | | | | | | | | | | | | | | | | |
| Germany | 14,982 | 3,940 | 5,496 | 2,083 | 86 | 26,587 | | 4,601 | | 7,121 | 5,653 | | 8,317 | 895 | | 6,090 | | 32,677 | | (1,749) | 39,275 | 8,704 |
| France | 5,206 | 7,089 | 1,924 | 1,774 | 81 | 16,074 | | 2,931 | | 1,951 | 4,034 | | 6,392 | 766 | | 8,586 | | 24,660 | | (2,406) | 41,132 | 17,598 |
| Netherlands | 998 | 5,557 | 5,981 | 2,130 | 29 | 14,695 | | 3,582 | | 1,690 | 2,509 | | 6,830 | 84 | | 9,323 | | 24,018 | | (815) | 20,986 | 3,573 |
| Belgium | 806 | 2,330 | 93 | 396 | 21 | 3,646 | | 579 | | 274 | 375 | | 2,334 | 84 | | 858 | | 4,504 | | (219) | 3,374 | 932 |
| Luxembourg | 18 | 556 | 645 | 781 | 5 | 2,005 | | 968 | | 329 | 70 | | 461 | 177 | | 1,475 | | 3,480 | | (53) | 701 | 2,628 |
| Other | 1,708 | 762 | 132 | 533 | 16 | 3,151 | | 612 | | 456 | 930 | | 1,148 | 5 | | 1,047 | | 4,198 | | (562) | 4,818 | 302 |
| | | | | | | | | | | | | | | | | | | | | | | |
| Total | | | | | | | | | | | | | | | | | | | | | | |
| eurozone | 25,041 | 24,566 | 15,740 | 17,248 | 14,983 | 97,578 | | 38,021 | | 12,113 | 14,513 | | 30,919 | 2,012 | | 34,516 | | 132,094 | | (6,952) | 126,546 | 37,059 |
| | | | | | | | | | | | | | | | | | | | | | | |
| Japan | 4,264 | 1,927 | 514 | 325 | 33 | 7,063 | | 1,633 | | 3 | 3,043 | | 2,358 | 26 | | 844 | | 7,907 | | (25) | 10,129 | 10,005 |
| China | 459 | 1,011 | 363 | 1,674 | 41 | 3,548 | | 2,886 | | 243 | 62 | | 243 | 114 | | 531 | | 4,079 | | (4) | 244 | 4,770 |
| India | 611 | 133 | 156 | 1,053 | 36 | 1,989 | | 1,336 | | 415 | 132 | | 106 | — | | 639 | | 2,628 | | (47) | 180 | — |
| Russia | 53 | 711 | 101 | 915 | 50 | 1,830 | | 1,673 | | 39 | — | | 118 | — | | 167 | | 1,997 | | (166) | 202 | — |
| South Korea | 325 | 507 | 108 | 397 | 3 | 1,340 | | 639 | | 203 | 167 | | 331 | — | | 450 | | 1,790 | | 106 | 600 | 29 |
| Turkey | 161 | 217 | 103 | 716 | 19 | 1,216 | | 1,160 | | 44 | 5 | | 7 | — | | 130 | | 1,346 | | (36) | 40 | 1,209 |
| | | | | | | | | | | | | | | | | | | | | | | |
| 2013 | | | | | | | | | | | | | | | | | | | | | | |
| | | | | | | | | | | | | | | | | | | | | | | |
| Eurozone | | | | | | | | | | | | | | | | | | | | | | |
| Ireland | 304 | 688 | 561 | 8,973 | 15,821 | 26,347 | | 24,893 | | 233 | 248 | | 900 | 73 | | 2,711 | | 29,058 | | (166) | 2,476 | 2,329 |
| Italy | 1,698 | 1,329 | 891 | 1,171 | 26 | 5,115 | | 1,582 | | 519 | 1,240 | | 1,774 | — | | 1,962 | | 7,077 | | (734) | 7,183 | 527 |
| Spain | 858 | 3,439 | 1,405 | 3,093 | 293 | 9,088 | | 3,084 | | 4,162 | 853 | | 989 | — | | 1,981 | | 11,069 | | (444) | 4,128 | 2,126 |
| Portugal | 35 | 310 | 114 | 312 | 6 | 777 | | 290 | | 93 | 43 | | 351 | — | | 280 | | 1,057 | | (163) | 418 | 614 |
| Greece | 1 | 228 | 1 | 105 | 14 | 349 | | 89 | | — | — | | 260 | — | | 38 | | 387 | | (12) | 455 | — |
| Cyprus | 2 | 1 | — | 144 | 10 | 157 | | 139 | | — | 2 | | 16 | — | | 18 | | 175 | | — | 16 | — |
| | | | | | | | | | | | | | | | | | | | | | | |
| Eurozone | | | | | | | | | | | | | | | | | | | | | | |
| periphery | 2,898 | 5,995 | 2,972 | 13,798 | 16,170 | 41,833 | | 30,077 | | 5,007 | 2,386 | | 4,290 | 73 | | 6,990 | | 48,823 | | (1,519) | 14,676 | 5,596 |
| | | | | | | | | | | | | | | | | | | | | | | |
| Germany | 10,803 | 5,044 | 4,265 | 3,520 | 90 | 23,722 | | 8,013 | | 5,168 | 2,524 | | 7,416 | 601 | | 7,189 | | 30,911 | | (1,340) | 35,529 | 1,128 |
| France | 2,806 | 6,714 | 1,832 | 2,427 | 79 | 13,858 | | 4,197 | | 1,692 | 1,678 | | 5,660 | 631 | | 9,807 | | 23,665 | | (1,747) | 30,644 | 7,536 |
| Netherlands | 3,222 | 4,604 | 5,786 | 2,303 | 21 | 15,936 | | 4,652 | | 4,661 | 819 | | 5,697 | 107 | | 9,763 | | 25,699 | | (356) | 15,388 | 835 |
| Belgium | 106 | 1,995 | 267 | 431 | 2 | 2,801 | | 713 | | 443 | (480) | | 2,123 | 2 | | 1,170 | | 3,971 | | (123) | 2,966 | 594 |
| Luxembourg | 10 | 524 | 659 | 386 | 4 | 1,583 | | 741 | | 75 | 98 | | 581 | 88 | | 1,043 | | 2,626 | | (58) | 1,373 | 253 |
| Other | 1,097 | 654 | 160 | 783 | 18 | 2,712 | | 879 | | 510 | 331 | | 918 | 74 | | 1,202 | | 3,914 | | (476) | 3,554 | 622 |
| | | | | | | | | | | | | | | | | | | | | | | |
| Total | | | | | | | | | | | | | | | | | | | | | | |
| eurozone | 20,942 | 25,530 | 15,941 | 23,648 | 16,384 | 102,445 | | 49,272 | | 17,556 | 7,356 | | 26,685 | 1,576 | | 37,164 | | 139,609 | | (5,619) | 104,130 | 16,564 |
| | | | | | | | | | | | | | | | | | | | | | | |
| Japan | 1,471 | 2,240 | 830 | 687 | 34 | 5,262 | | 2,795 | | 72 | (172) | | 2,365 | 202 | | 352 | | 5,614 | | 4 | 9,057 | 16,445 |
| China | 545 | 2,794 | 244 | 1,518 | 33 | 5,134 | | 4,584 | | 166 | 13 | | 370 | 1 | | 1,689 | | 6,823 | | (14) | 372 | 830 |
| India | 606 | 949 | 91 | 2,050 | 36 | 3,732 | | 2,909 | | 571 | 160 | | 92 | — | | 813 | | 4,545 | | (21) | 190 | 45 |
| Russia | 189 | 754 | 6 | 949 | 53 | 1,951 | | 1,781 | | 149 | 2 | | 19 | — | | 364 | | 2,315 | | (65) | 33 | 27 |
| South Korea | 242 | 755 | 133 | 576 | 2 | 1,708 | | 1,125 | | 179 | 154 | | 250 | — | | 681 | | 2,389 | | 176 | 541 | 50 |
| Turkey | 232 | 169 | 126 | 1,064 | 24 | 1,615 | | 1,404 | | 50 | 67 | | 94 | — | | 324 | | 1,939 | | (32) | 119 | 998 |
Business review Capital and risk management
| Summary of country exposures | | | | | | | | | | | | | | | | | | |
| | | | | | | | | | | | | | | | | | | | | | | |
| | | | | | | | | | | | | | | | | | | | | CDS | | |
| | Net balance sheet exposure | | Analysis of net balance sheet exposures | | Off- | | | | notional | | |
| | | | Other | | | | | Net | | Debt securities | | Net | | balance | | Total | | less | Gross |
| | Sovereign | Banks | FI | Corporate | Personal | Total | | lending | | AFS/LAR | HFT (net) | | Derivatives | SFT | | sheet | | exposure | | fair value | Derivatives | SFT |
| 2012 | £m | £m | £m | £m | £m | £m | | £m | | £m | £m | | £m | £m | | £m | | £m | | £m | £m | £m |
| | | | | | | | | | | | | | | | | | | | | | | |
| Eurozone | | | | | | | | | | | | | | | | | | | | | | |
| Ireland | 267 | 1,477 | 931 | 12,395 | 16,205 | 31,275 | | 28,772 | | 424 | 363 | | 1,213 | 503 | | 2,855 | | 34,130 | | (71) | 3,244 | 4,915 |
| Italy | 1,075 | 1,789 | 1,186 | 2,402 | 23 | 6,475 | | 2,510 | | 977 | 630 | | 2,358 | — | | 2,669 | | 9,144 | | (548) | 9,653 | 3 |
| Spain | 444 | 4,448 | 1,838 | 4,501 | 313 | 11,544 | | 4,416 | | 4,871 | 503 | | 1,754 | — | | 1,592 | | 13,136 | | (375) | 5,694 | 610 |
| Portugal | 102 | 451 | 177 | 389 | 7 | 1,126 | | 397 | | 180 | 35 | | 514 | — | | 332 | | 1,458 | | (126) | 618 | 26 |
| Greece | 33 | 299 | (4) | 186 | 13 | 527 | | 163 | | — | 1 | | 363 | — | | 40 | | 567 | | (31) | 609 | — |
| Cyprus | 3 | 11 | 1 | 70 | 14 | 99 | | 63 | | — | 4 | | 32 | — | | 14 | | 113 | | — | 33 | — |
| | | | | | | | | | | | | | | | | | | | | | | |
| Eurozone | | | | | | | | | | | | | | | | | | | | | | |
| periphery | 1,924 | 8,475 | 4,129 | 19,943 | 16,575 | 51,046 | | 36,321 | | 6,452 | 1,536 | | 6,234 | 503 | | 7,502 | | 58,548 | | (1,151) | 19,851 | 5,554 |
| | | | | | | | | | | | | | | | | | | | | | | |
| Germany | 32,119 | 6,865 | 4,138 | 5,059 | 85 | 48,266 | | 25,765 | | 9,263 | 3,500 | | 9,474 | 264 | | 7,689 | | 55,955 | | (1,448) | 57,285 | 8,209 |
| France | 4,419 | 8,969 | 2,718 | 3,439 | 71 | 19,616 | | 5,580 | | 2,242 | 3,581 | | 7,515 | 698 | | 9,675 | | 29,291 | | (2,288) | 45,154 | 16,636 |
| Netherlands | 3,174 | 7,994 | 8,996 | 3,299 | 26 | 23,489 | | 5,660 | | 7,800 | 647 | | 9,047 | 335 | | 10,775 | | 34,264 | | (1,030) | 23,679 | 4,602 |
| Belgium | 1,489 | 2,784 | 514 | 640 | 2 | 5,429 | | 891 | | 844 | 564 | | 3,130 | — | | 1,041 | | 6,470 | | (215) | 4,902 | 476 |
| Luxembourg | 13 | 721 | 977 | 358 | 4 | 2,073 | | 972 | | 59 | 192 | | 709 | 141 | | 1,285 | | 3,358 | | (206) | 2,018 | 3,858 |
| Other | 1,776 | 1,111 | 202 | 1,153 | 14 | 4,256 | | 1,269 | | 576 | 666 | | 1,737 | 8 | | 1,380 | | 5,636 | | (437) | 5,975 | 1,432 |
| | | | | | | | | | | | | | | | | | | | | | | |
| Total | | | | | | | | | | | | | | | | | | | | | | |
| eurozone | 44,914 | 36,919 | 21,674 | 33,891 | 16,777 | 154,175 | | 76,458 | | 27,236 | 10,686 | | 37,846 | 1,949 | | 39,347 | | 193,522 | | (6,775) | 158,864 | 40,767 |
| | | | | | | | | | | | | | | | | | | | | | | |
| Japan | 7,129 | 2,650 | 884 | 567 | 37 | 11,267 | | 1,752 | | 1,548 | 4,890 | | 2,878 | 199 | | 577 | | 11,844 | | (71) | 13,266 | 15,047 |
| China | 1,069 | 1,076 | 67 | 998 | 32 | 3,242 | | 2,063 | | 201 | 61 | | 916 | 1 | | 851 | | 4,093 | | 36 | 221 | 1,818 |
| India | 820 | 1,259 | 144 | 2,725 | 106 | 5,054 | | 3,906 | | 683 | 391 | | 74 | — | | 930 | | 5,984 | | (43) | 177 | 108 |
| Russia | 310 | 982 | 125 | 807 | 53 | 2,277 | | 1,748 | | 160 | 249 | | 120 | — | | 518 | | 2,795 | | (251) | 124 | 15 |
| South Korea | 292 | 857 | 196 | 390 | 3 | 1,738 | | 1,184 | | 144 | 163 | | 221 | 26 | | 704 | | 2,442 | | (58) | 617 | 94 |
| Turkey | 459 | 97 | 95 | 1,061 | 11 | 1,723 | | 1,449 | | 56 | 125 | | 93 | — | | 481 | | 2,204 | | (37) | 111 | 449 |
| (1) | Net lending - Comprises loans and advances, including cash balances and risk elements in lending - net of provisions. |
| (2) | Debt securities - Comprise securities classified as available-for-sale (AFS), loans and receivables (LAR), held-for-trading (HFT) and designated as at fair value through profit or loss (DFV). All debt securities other than LAR securities are carried at fair value. LAR debt securities are carried at amortised cost less impairment. HFT debt securities are presented as long positions (including DFV securities) net of short positions per country. Impairment losses and exchange differences relating to AFS debt securities, together with interest, are recognised in the income statement. Other changes in the fair value of AFS securities are reported in AFS reserves. |
| (3) | Derivatives (net) - Comprise the mark-to-market (mtm) value of such contracts after the effect of legally enforceable netting agreements in line with the corresponding regulatory capital models, but before the effect of collateral. |
| (4) | Securities financing transactions (SFT) (net) - Comprise the mtm value of the cash and securities that are due to RBS at a future date under repurchase agreements, reverse repurchase agreements, stock borrowing, stock lending and equity financing transactions, after the effect of collateral intrinsic to the transaction and legally enforceable netting agreements. Counterparty netting is applied as per the corresponding regulatory capital approach. Additional collateral called to offset mtm positions (variation margin) is not included. |
| (5) | Net balance sheet exposure - Comprises net lending, debt securities, derivatives (net) and SFT (net) exposures, as defined above. |
| (6) | Off-balance sheet - Comprises letters of credit, guarantees, other contingent obligations and legally committed undrawn facilities. |
| (7) | Total exposure - Comprises net balance sheet exposure and off-balance sheet exposure, as defined above. |
| (8) | Credit default swaps (CDSs) - Under a CDS contract, the credit risk on the reference entity is transferred from the buyer to the seller. ‘Fair value’ (or ‘mtm value’) represents the balance sheet carrying value of the resulting exposure. The mtm value of CDSs is included in derivatives against the counterparty of the trade, as opposed to the reference entity. The notional is the par value of the credit protection bought or sold and is included against the reference entity of the CDS contract. The column ‘CDS notional less fair value’ represents the net effect on exposure should the CDS contracts be triggered by a credit event, assuming a zero recovery rate on the reference exposure. This net effect would be the increase in exposure arising from sold positions netted against the decrease arising from bought positions. For a sold position, the change in exposure equals the notional less the fair value amount; this represents the amount RBS would owe to its CDS counterparties if the reference entity defaulted. Positive recovery rates would tend to reduce the gross components (increases and decreases) of those numbers. Exposures relating to credit derivative product companies (CDPCs) and related hedges as well as Nth-to-default basket swaps have been excluded, as they cannot be meaningfully attributed to a particular reference entity or country. Exposures to CDPCs are disclosed on page 283. |
| (9) | Sovereign - Comprises central, regional and local government, and central banks. |
| (10) | Eurozone periphery - Ireland, Italy, Spain, Portugal, Greece and Cyprus. |
| (11) | Other eurozone - Austria, Estonia, Finland, Latvia, Malta, Slovakia and Slovenia. |
Business review Capital and risk management
Key points*
| · | The comments below relate to changes in country exposures in 2014 unless indicated otherwise. |
| · | Net balance sheet and off-balance sheet exposure to most countries declined across most products. RBS maintained a cautious stance and many clients continued to reduce debt levels. The euro depreciated against sterling by 6.5% while the US dollar appreciated by 5.9%. |
| · | Total eurozone net balance sheet exposure decreased by £4.9 billion or 5% to £97.6 billion. Reductions in eurozone periphery countries and in net lending in other countries were partly offset by increases in debt securities in Germany and France. The main reductions were in lending to corporate clients (mostly in Ireland, Germany, Spain and France) and to the Irish personal sector; in cash deposits held with central banks in Germany and the Netherlands; in available-for-sale (AFS) debt securities issued by Spanish and Dutch financial institutions; and in net held-for-trading (HFT) government bond positions in Italy and Spain. Net HFT debt securities in Germany, France, the Netherlands, Belgium and a few other countries increased, driven by trading activity and auctions. Notional bought and sold CDS decreased significantly, primarily as a result of novations. On balance, net bought CDS protection on eurozone exposures increased by £1.3 billion. This largely related to hedging of the credit valuation adjustment on uncollateralised or under-collateralised positions, the fair value of which increased driven by much lower interest rates and a stronger US dollar. Net lending exposure in RCR fell to £4.1 billion for the eurozone as a whole, including £2.0 billion in Ireland, £0.8 billion in Spain and £0.6 billion in Germany, with the commercial real estate sector (CRE) accounting for broadly half of the total. |
| · | Eurozone periphery net balance sheet exposure decreased by £10.4 billion to £31.4 billion. |
| | ° | Ireland - net balance sheet exposure fell by £3.7 billion or 14% to £22.6 billion, with exposure to corporates and households decreasing by £3.3 billion and £1.2 billion respectively, reflecting sales, repayments and write-offs (partly offset by impairment write-backs) plus currency movements. Provisions fell by £2.2 billion to £8.5 billion, reflecting improved collateral values. Cash deposits with the Central Bank of Ireland increased by £0.5 billion as part of Ulster Bank’s preparations for the new Capital Requirements Regulation liquidity coverage ratio requirements which come into effect in 2015. |
| | ° | Italy - exposure fell by £0.9 billion to £4.2 billion, largely reflecting fluctuations in net HFT. Most AFS government bonds were sold, and lending and derivatives exposure to non-bank financial institutions fell by £0.5 billion. Net derivatives exposure to banks increased by £1.2 billion, driven by the acquisition of a fully cash-collateralised exposure from another bank. |
| | ° | Spain - exposure decreased by £5.8 billion to £3.3 billion, largely due to sales of €4.8 billion (mostly covered bonds) from the RBS N.V. liquidity portfolio, under favourable market conditions. These sales also reduced concentrations in Spanish banks and CRE. Net HFT debt exposure and lending to the construction, telecommunications and other sectors also fell. |
| | ° | Portugal - exposure was stable at £0.8 billion. HFT debt securities increased as trading returned but remained small. |
| | ° | Greece - exposure was essentially unchanged at £0.4 billion. This comprised mostly collateralised derivatives exposure to banks and corporate lending, including exposure to local subsidiaries of international companies. Net of collateral held under credit support annex and reflecting the effect of credit agency cover and parental guarantees, total committed exposure was approximately £120 million net of provisions, mostly in RCR. Contingency planning, including any potential operational and system changes, has been refreshed to ensure readiness for any downside scenario. |
| | ° | Funding mismatches - material estimated funding mismatches at risk of redenomination at 31 December 2014 were: |
| | - | Ireland £4.0 billion (down from £6.5 billion due to reduced lending). |
| | - | Spain £0.5 billion (down from £6.5 billion, largely due to the reduction in AFS securities). |
| | - | Italy £1.5 billion (up from £0.5 billion due to higher derivatives exposure, lower euro deposits and as the central bank funding line was no longer used). |
| | - | Portugal £0.5 billion (slightly up due to higher debt trading). |
The net positions for Greece and Cyprus were minimal. With the possible exception of Greece, risks of eurozone break-up (redenomination events) have materially receded since 2011-2012, owing to major improvements in liquidity conditions, driven by the availability of substantial new tools for the European Central Bank, the establishment of the European Stability Mechanism and member countries’ progress on reducing imbalances.
| · | Germany - net balance sheet exposure rose by £2.9 billion to £26.6 billion, as a result of increases in net HFT exposure, AFS debt securities and derivatives exposure to non-bank financial institutions. This was partially offset by decreases in corporate lending (particularly in CRE) and to securitisation vehicles, and in cash deposits with the Bundesbank. Off-balance sheet exposure decreased by £1.1 billion, mostly in the insurance and corporate sectors. Government bond holdings were £14.0 billion (AFS - £6.7 billion; HFT long positions - £7.3 billion) at the end of the year. |
Business review Capital and risk management
| · | France - net balance sheet exposure rose by £2.2 billion to £16.1 billion, mainly reflecting debt trading fluctuations and increased derivatives exposure to banks and SFT. Lending to the public, CRE and telecommunications sectors decreased. RBS had £6.8 billion government bond holdings at 31 December 2014 (AFS - £1.1 billion; HFT long positions - £5.7 billion). Off-balance exposure fell by £1.2 billion to £8.6 billion, particularly in the corporate and government sectors. |
| · | Netherlands - net balance sheet exposure fell by £1.2 billion to £14.7 billion, as a result of reductions in AFS debt securities in the RBS N.V. liquidity portfolio and in cash deposits held with the central bank, as RBS N.V.'s liquidity needs decreased in line with balance sheet reductions. Net HFT exposure rose by £1.7 billion through normal market fluctuations while derivatives exposure increased by £1.1 billion to £6.8 billion, largely driven by business with a few major banks. |
| · | Belgium - net balance sheet exposure increased by £0.8 billion to £3.6 billion, mostly in HFT government bonds and derivatives exposure to banks. |
| · | Other eurozone - net HFT government bonds increased by £0.6 billion to £0.9 billion, reflecting increased long positions. |
| · | Japan - HFT government bond exposure increased by £3.2 billion to £3.0 billion, driven by market fluctuations. This rise was partly offset by reductions in central bank deposits, in corporate and bank lending, and in derivatives and SFT exposure to financial institutions. In 2015, RBS will be closing its onshore trading business and withdrawing from Japanese government primary bonds dealership activity. |
· | China - lending to banks and off-balance sheet exposure decreased by £1.9 billion and £1.2 billion respectively to £0.7 billion and £0.5 billion, mostly in trade finance, driven by more stringent capital requirements and an effort by RBS to improve average returns in a highly competitive environment. Given concerns about economic risks, RBS undertook stress testing across both financial institutions and corporate portfolios and started setting early warning indicators and action plans. |
| · | India - net balance sheet exposure fell by £1.7 billion to £2.0 billion, with reductions in corporate lending, particularly in the oil and gas and mining and metals sectors, and in lending to banks, largely trade finance. The reductions in part reflected increasing capital requirements and sales of low-yielding assets. |
| · | Russia - net balance sheet exposure was £1.8 billion and included £0.9 billion of corporate lending and £0.7 billion of bank lending, around half of which was fully hedged. Internal ratings were reviewed, additional credit restrictions placed on new business, and limits adjusted downwards. Exposures were reviewed against all international sanctions. |
| · | South Korea - net lending to banks and corporate clients decreased by £0.4 billion, reflecting a greater focus on capital efficiency. Net balance sheet exposure was £1.3 billion. |
| · | Turkey - net balance sheet exposure fell by £0.4 billion to £1.2 billion, mainly reflecting lower lending to corporates. |
| · | Shipping - exposures relating to ocean-going vessels are not included in the country risk disclosures as they cannot be meaningfully assigned to specific countries. RBS’s shipping portfolio of £10.4 billion (refer to the Credit risk section on page 243 for more details) is predominantly US dollar-denominated and under English law, and is not expected to be affected by specific country events. |
*unaudited
Business review Capital and risk management
| Other risks |
| 327 | Pension risk |
| 328 | Business risk |
| 329 | Strategic risk |
Business review Capital and risk management
Other risks*
Pension risk
Definition
Pension risk is the risk arising from contractual or other obligations to, or with respect to, RBS’s pension schemes, whether established for its employees or for those of a related company. It is also the risk that RBS may make payments or other contributions to, or with respect to, a pension scheme because of a moral obligation, or for any other reason.
Sources of risk
RBS has exposure to pension risk through its defined benefit schemes worldwide. The five largest schemes, which represent around 96% of the bank’s pension liabilities, are the Royal Bank of Scotland Group Pension Fund (‘Main scheme’), the Ulster Bank Pension Scheme (Republic of Ireland), the Ulster Bank Pension Scheme, the Royal Bank of Scotland Americas Pension Plan and the Royal Bank of Scotland International Pension Trust. The Main scheme is the principal source of pension risk.
Pension scheme liabilities vary with changes in long-term interest rates and inflation as well as with pensionable salaries, the longevity of scheme members, and legislation. Meanwhile, pension scheme assets vary with changes in interest rates, inflation expectations, credit spreads, exchange rates and equity and property prices. RBS is exposed to the risk that the schemes’ assets together with future returns and any additional future contributions are insufficient to meet liabilities as they fall due. In such circumstances, it could be obliged (or might choose) to make additional contributions to the schemes or be required to hold additional capital to mitigate this risk.
Key developments in 2014
The 31 March 2013 triennial funding valuation of the Main scheme was agreed in May 2014. It showed the value of liabilities exceeded the value of assets by £5.6 billion at the valuation date, a ratio of assets to liabilities of 82%. RBS and the trustee agreed a plan to fund the Main scheme. To eliminate this deficit, RBS agreed to pay additional contributions from 2014 until 2023. Contributions will start at £650 million in 2014 to 2016 and will fall to £450 million (indexed in line with inflation) for the period 2017 to 2023. These contributions are in addition to regular annual contributions of around £270 million for ongoing accrual of benefits as well as contributions to meet the expenses of running the scheme. The agreed deficit payments supersede all previous schedules of contributions.
Throughout 2014, various pension risk stress-testing initiatives were undertaken, focused both on internally defined scenarios and on scenarios to meet integrated Prudential Regulation Authority (PRA) and European Banking Authority (EBA) stress testing requirements. For more information on stress testing, refer to page 214.
Governance
The Main scheme operates under a trust deed. The corporate trustee, RBS Pension Trustee Limited, is a wholly owned subsidiary of The Royal Bank of Scotland plc. The trustee board currently comprises six directors selected by RBS and four directors nominated by members. The trustee is supported by RBS Investment Executive Ltd (RIEL), a team specialising in pension investment and risk management.
The Pension Risk Committee (PRC), acting as a sub-committee of the RBS Asset and Liability Committee, formulates RBS’s view of pension risk. The PRC considers mechanisms that could potentially be used for managing risk within the funds as well as financial strategy and employee welfare implications, and also reviews actuarial assumptions from a sponsor perspective as appropriate. The PRC is a key component of RBS’s approach to pension risk where risk management, asset strategy and financing issues are reviewed and monitored on behalf of RBS. The PRC also serves as a formal link between RBS, RIEL and the trustee.
For further information on risk governance, refer to page 172.
Risk appetite and monitoring
Investment policy for the schemes is defined by the trustee with quantitative and qualitative input from RIEL and other specialist advisers employed by the trustee. While the trustee is responsible for the management of the scheme assets, it consults with RBS on material changes to risk appetite and investment policy.
As the sponsor of its defined benefit pension schemes, RBS manages the risk it faces using a pension risk management framework. This encompasses risk monitoring, modelling, stress testing and reporting. As sponsor, RBS maintains an independent view of the risk inherent in its pension funds. In addition to the scrutiny provided by the PRC, RBS also achieves this through regular pension risk monitoring and reporting to the Board, the Executive Committee and the Board Risk Committee on the material pension schemes that RBS has an obligation to support. If agreement is not reached between RBS and the trustee, the Pensions Regulator can take action by appointing independent trustees, or by serving a contribution notice on the employer requiring payment to the scheme.
Risk mitigation
The trustee has taken measures to mitigate inflation and interest rate risks both by investing in suitable physical assets and by entering into inflation and interest rate swaps. The Main scheme also uses derivatives to manage the allocation of the portfolio to different asset classes and to manage risk within asset classes. The assets of the Main scheme, which represented 88% of RBS’s pension plan assets at 31 December 2014, are invested in a diversified portfolio of quoted and private equity, government and corporate fixed interest and index-linked bonds, property and other alternative assets.
Risk is also mitigated in other ways. In October 2006, the Main scheme was closed to new employees. In November 2009, RBS confirmed that it was making changes to the Main scheme and a number of other defined benefit schemes, including the introduction of a limit of 2% per annum (or the annual change in the Consumer Price Index, if lower) to the amount of any salary increase that will count for pensionable purposes.
In October 2012, RBS confirmed that it was offering employees in the Main scheme the choice between an increase to the charge, made through its flexible benefits programme, of 5% of salaries and an increase in Normal Pension Age from 60 to 65 in respect of service from October 2012 with no additional charge.
*unaudited
Business review Capital and risk management
Risk measurement
Pension risk reporting is submitted monthly to the Board in the RBS Risk Monthly Management Report. The report includes a measurement of the overall deficit or surplus position based on the latest data and estimated capital requirements, and an assessment of the sensitivities of the pension schemes to interest rates, inflation and credit spreads.
RBS also undertakes a number of stress tests and scenario analyses on its material defined benefit pension schemes each year as part of its risk measurement framework. These stress tests are also used to satisfy the requests of regulatory bodies such as the EBA and the PRA. The stress testing framework includes the production of the pension risk internal capital adequacy assessment process as well as additional stress tests for a number of internal management purposes.
Pension stress tests take the form of both stochastic (one that cannot be predicted precisely) and deterministic stresses over time horizons from one to five years in duration. They are designed to examine the behaviour of the pension schemes’ assets and liabilities under a range of financial and demographic shocks. The results of the stress tests and their consequential impact on RBS’s balance sheet, income statement and capital position are incorporated into the overall enterprise-wide stress test results.
The table below shows the sensitivity of the Main scheme’s assets and liabilities (measured according to IAS 19 ‘Employee Benefits’) to changes in interest rates and equity values at the year end, taking account of the current asset allocation and hedging arrangements.
| | Change | Change | Change in net |
| | in value | in value of | pension |
| | of assets | liabilities | obligations |
| | £m | £m | £m |
| At 31 December 2014 | | | |
| Fall in nominal swap yields of 0.25% at all durations with no change in credit spreads or real swap yields | 447 | 413 | 34 |
| Fall in real swap yields of 0.25% at all durations with no change in credit spreads or nominal swap yields | 932 | 1,159 | (227) |
| Fall in credit spreads of 0.25% at all durations with no change in nominal or real swap yields | 65 | 1,581 | (1,516) |
| Fall in equity values of 10% | (771) | — | (771) |
| | | | |
| At 31 December 2013 | | | |
| Fall in nominal swap yields of 0.25% at all durations with no change in credit spreads or real swap yields | 217 | 333 | (116) |
| Fall in real swap yields of 0.25% at all durations with no change in credit spreads or nominal swap yields | 595 | 895 | (300) |
| Fall in credit spreads of 0.25% at all durations with no change in nominal or real swap yields | 60 | 1,245 | (1,185) |
| Fall in equity values of 10% | (894) | — | (894) |
| | | | |
| At 31 December 2012 | | | |
| Fall in nominal swap yields of 0.25% at all durations with no change in credit spreads or real swap yields | 76 | 255 | (179) |
| Fall in real swap yields of 0.25% at all durations with no change in credit spreads or nominal swap yields | 578 | 995 | (417) |
| Fall in credit spreads of 0.25% at all durations with no change in nominal or real swap yields | 71 | 1,261 | (1,190) |
| Fall in equity values of 10% | (862) | — | (862) |
Business risk
Definition
Business risk is the risk that RBS suffers losses as a result of adverse variances in its revenues, costs or both as a result of its business plan and strategy. Such variances may be caused by a variety of specific factors such as volatility in pricing, sales volumes, and input costs as well as more general factors such as exposure to macroeconomic, regulatory and industry risks.
Sources of risk
Business risk exists at all levels of the organisation and is generated at the transaction level. It is affected by other risks RBS faces, which could contribute to any adverse changes in revenues or costs. Refer to page 167 for a full list of risks.
Key developments in 2014
RBS reduced its business risk profile as it curtailed riskier activities in CIB, made disposals through RCR, and announced an intensified cost management programme.
An increase in regulatory scrutiny of the industry’s approach to stress testing affected the management of business risk in 2014. Additional stress testing was undertaken in response, and scenario modelling capability was enhanced further. In the US, CFG strengthened its capital planning capabilities following the Federal Reserve’s Comprehensive Capital and Analysis and Review stress test.
Business review Capital and risk management
Other risks* continued
Governance
The Board has ultimate responsibility for business risk. Refer to the Risk governance section on page 172.
Responsibility for the day-to-day management of business risk lies primarily with the franchises with oversight by the Finance function. The franchises are responsible for delivery of their business plans and the management of such factors as pricing, sales volumes, marketing expenditure and other factors that can introduce volatility into earnings.
Risk appetite
RBS assesses volatility in revenues and costs in determining whether RBS and its underlying businesses are within risk appetite. Each franchise is responsible for the implementation of its business plan and the management of associated risks within approved risk appetite targets.
Risk identification and monitoring
Business risk is identified and managed at the product and transaction level. Estimated revenue and costs, including the potential range of outcomes, are key considerations in the design of any new product or investment decision. All policies that ultimately seek to manage and control financial impact at the product and transaction level are therefore relevant to business risk management, including policies on conduct, funding and investment spending.
Business risk is reported, assessed and challenged at every governance level within the organisation. Each franchise monitors its revenues and costs relative to plans, reporting this on a regular basis to the finance directors of each franchise and to bank-wide functions. The Finance function challenges financial results and reports performance against plan to the Board and executive committees, focusing on revenue generation, cost management initiatives and risk mitigation.
Business risk is reviewed and assessed through RBS’s planning cycles, which are discussed with RBS Risk Management, and performance management processes.
In the planning cycles, expected and potential scenarios for revenues and costs are determined, on a bottom-up basis, through plans reflecting expectations of the external environment and the bank’s strategic priorities. These scenarios are tested against a range of sensitivities and stresses to identify the key risk drivers behind any potential volatility, together with management actions to address and manage them.
Risk mitigation
RBS operates a forecasting process to identify projected changes in, or risks to, key financial metrics, and ensures appropriate actions are taken. RBS responded to business risk challenges by designing cost management programmes to deliver substantial savings in 2014 and beyond. RBS Risk Management was also involved in these discussions.
Risk measurement
The stress test outcomes form a core part of the assessment of earnings and capital adequacy risk appetite and are approved by the Board. The measurement of change in profit and loss of the franchises under stress thereby acts as a measure of business risk. Franchises also conduct their own bottom-up stress testing exercises to assess the financial performance of their businesses under stress.
Strategic risk
Definition
Strategic risk is the risk that RBS will make inappropriate strategic choices, or that there will be changes in the external environment to which RBS fails to adapt its strategies.
Sources of risk
Strategic risk arises from decisions that fail to reflect the operating environment, or which do not take adequate account of execution challenges. These include decisions related to RBS products and services which have implications for profitability, risk, the customer base, and for business growth.
Failure to manage this risk could have a wide-ranging impact. It could lower revenues, profitability and returns to shareholders, and severely impair RBS’s ability to meet other financial and non-financial objectives.
Key developments in 2014
RBS announced the results of a strategic review with a defined plan to shift the business mix towards the UK and the retail and commercial banking segments, with the aim of a lower risk profile for the bank.
The year saw good progress against this plan. Business results in general exceeded targets and the run-down and sell-off of non-core assets were ahead of schedule. RBS’s capital ratios increased markedly, a significant step towards targeted levels of financial strength which, when attained, will provide RBS with more strategic options.
There were improvements in the monitoring processes with a focus on the “Top Risks” that could prevent RBS achieving its strategic objectives.
Governance
RBS’s strategic planning process is managed by the Strategy and Corporate Development team. The Risk and Finance functions are key contributors to strategic planning. As part of the process, each customer business develops a strategic plan for its business within a framework set by the bank’s senior management. The strategic plans are consolidated at bank-wide level, and reviewed and assessed against risk appetite by the CEO, the CFO and the bank’s Director of Strategy and Corporate Finance before presentation to and approval by the Board.
The Board has ultimate responsibility for approving strategic plans, initiatives and changes to strategic direction. In addition to the annual cycle, each customer business presents a more detailed individual “deep dive” review of key dimensions of its strategy at a Board meeting at different points during the year.
*unaudited
Business review Capital and risk management
Other risks* continued
Risk appetite and identification
Strategic plans are assessed against, and must comply with, RBS’s strategic risk objectives (refer to Risk appetite section, page 176). These objectives are intended to ensure that RBS’s chosen strategies do not expose it to an inappropriate degree of financial and non-financial risk. These therefore represent the appetite for strategic risk.
RBS employs robust strategy development processes which consider the implications of economic, industrial, market, technological and customer developments and trends. RBS Risk Management is involved in defining risk appetite for the customer businesses, and in challenging and reviewing strategic plans.
In addition, there are “top risks” and “emerging risks” processes in place which aim to identify early, monitor closely and avoid or otherwise manage effectively strategic risks that have the highest likelihood of impacting strategic plans.
Risk monitoring
Top and emerging risks processes monitor the most material risks to strategic objectives. Strategic progress is monitored through quarterly performance review meetings between customer business CEOs and the RBS CEO, CFO, and Director of Strategy and Corporate Finance.
Individual customer businesses bear much of the responsibility for managing strategic risks. The senior leadership of the customer businesses track progress on the initiatives and action plans to deliver the strategy through a range of key performance indicators such as financial performance, risk metrics, market shares and numbers of customers, and satisfaction scores.
Risk mitigation
A major part of the top risks process is to ensure that all appropriate action is taken to mitigate the most material risks to strategic objectives.
Key strategies are reviewed and approved by the Board. These reviews are intended to maximise the capture of market and customer insight while providing independent scrutiny and challenge. Strategic plans contain analysis of current and expected operating conditions, current and targeted competitive and market positioning, key strategic initiatives, financial and customer targets and milestones, and upside and downside risks.
A full sensitivity analysis of the consolidated strategic plan is undertaken, at the end of the strategic and financial planning process, to assess the robustness of the plan, and compliance with strategic risk objectives, under a variety of stressed conditions. In certain cases, following consideration of an opportunity, RBS may decide not to pursue the opportunity as a result of a perceived strategic risk.
RBS also undertakes strategic reviews to decide how to react to specific developments. It is now considering, for instance, how best to react to the Independent Commission on Banking’s proposals for ring-fencing of retail banking operations.
Risk measurement
A wide variety of financial, risk, customer and market metrics are used to monitor business performance and thus, inter alia, the effectiveness of chosen strategies. Any deviations from the expected values are analysed to determine drivers which could be strategic, environmental or management. Example metrics include: customer attrition; deposit balances; revenues; impairments or loan losses; profitability; and risk-weighted returns.
*unaudited
| 332 | | Report of Independent Registered Public Accounting Firm |
| 333 | | Consolidated income statement |
| 334 | | Consolidated statement of comprehensive income |
| 335 | | Consolidated balance sheet |
| 336 | | Consolidated statement of changes in equity |
| 339 | | Consolidated cash flow statement |
| 340 | | Accounting policies |
| 352 | | Notes on the consolidated accounts |
| 352 | 1 | Net interest income |
| 353 | 2 | Non-interest income |
| 354 | 3 | Operating expenses |
| 358 | 4 | Pensions |
| 363 | 5 | Auditor’s remuneration |
| 364 | 6 | Tax |
| 365 | 7 | Profit attributable to preference shareholders and paid-in equity holders |
| 365 | 8 | Ordinary dividends |
| 365 | 9 | Earnings per ordinary and equivalent B share |
| 366 | 10 | Financial instruments - classification |
| 371 | 11 | Financial instruments - valuation |
| 384 | 12 | Financial instruments - maturity analysis |
| 387 | 13 | Financial assets - impairments |
| 389 | 14 | Derivatives |
| 391 | 15 | Debt securities |
| 393 | 16 | Equity shares |
| 394 | 17 | Intangible assets |
| 397 | 18 | Property, plant and equipment |
| 398 | 19 | Prepayments, accrued income and other assets |
| 399 | 20 | Discontinued operations and assets and liabilities of disposal groups |
| 402 | 21 | Short positions |
| 402 | 22 | Accruals, deferred income and other liabilities |
| 404 | 23 | Deferred tax |
| 406 | 24 | Subordinated liabilities |
| 409 | 25 | Non-controlling interests |
| 409 | 26 | Share capital |
| 412 | 27 | Other equity |
| 413 | 28 | Leases |
| 415 | 29 | Structured entities |
| 417 | 30 | Asset transfers |
| 418 | 31 | Capital resources |
| 420 | 32 | Memorandum items |
| 432 | 33 | Net cash flow from operating activities |
| 432 | 34 | Analysis of the net investment in business interests and intangible assets |
| 433 | 35 | Interest received and paid |
| 433 | 36 | Analysis of changes in financing during the year |
| 433 | 37 | Analysis of cash and cash equivalents |
| 434 | 38 | Segmental analysis |
| 440 | 39 | Directors’ and key management remuneration |
| 440 | 40 | Transactions with directors and key management |
| 441 | 41 | Related parties |
| 441 | 42 | Post balance sheet events |
| 443 | 43 | Consolidating financial information |
Report of Independent Registered Public Accounting Firm to the members of The Royal Bank of Scotland Group plc
Report of Independent Registered Public Accounting Firm to the Members of The Royal Bank Of Scotland Group plc
We have audited the accompanying consolidated balance sheets of The Royal Bank of Scotland Group plc and its subsidiaries (together “the Group”) as at 31 December 2014, 2013 and 2012, and the related consolidated statements of income, comprehensive income, changes in equity and cash flows for each of the three years in the period ended 31 December 2014, the notes 1 to 43 and the information identified as ‘audited’ in the Risk and balance sheet management section of the Business review (‘’financial statements’’). These financial statements are the responsibility of the Group’s management. Our responsibility is to express an opinion on the financial statements based on our audits.
We conducted our audits in accordance with standards of the Public Company Accounting Oversight Board (United States). Those standards require that we plan and perform the audit to obtain reasonable assurance about whether the financial statements are free of material misstatement. An audit includes examining, on a test basis, evidence supporting the amounts and disclosures in the financial statements. An audit also includes assessing the accounting principles used and significant estimates made by management, as well as evaluating the overall financial statement presentation. We believe that our audits provide a reasonable basis for our opinion.
In our opinion, such financial statements present fairly, in all material respects, the financial position of the Group as at 31 December 2014, 2013 and 2012, and the results of its operations and its cash flows for each of the three years in the period ended 31 December 2014, in conformity with International Financial Reporting Standards (“IFRS”) as adopted for use in the European Union and IFRS as issued by the International Accounting Standards Board (“IASB”).
Note 43 to the financial statements was added for the inclusion of consolidating financial information in respect of The Royal Bank of Scotland plc in accordance with Regulation S-X Rule 3-10.
We have also audited, in accordance with the standards of the Public Company Accounting Oversight Board (United States), the Group’s internal control over financial reporting as of 31 December 2014, based on the criteria established in ‘’Internal Control—Integrated Framework (2013)’’ issued by the Committee of Sponsoring Organizations of the Treadway Commission and our report dated 25 February 2015 expressed an unqualified opinion on the Group’s internal control over financial reporting.
25 February 2015 (31 March 2015 for the consolidating financial information in Note 43) |
Consolidated income statement for the year ended 31 December 2014
| | Note | 2014 £m | 2013 £m | 2012 £m |
| Interest receivable | | 13,079 | 14,488 | 16,083 |
| Interest payable | | (3,821) | (5,471) | (6,727) |
| Net interest income | 1 | 9,258 | 9,017 | 9,356 |
| Fees and commissions receivable | | 4,414 | 4,678 | 4,898 |
| Fees and commissions payable | | (875) | (923) | (818) |
| Income from trading activities | | 1,285 | 2,571 | 1,459 |
| Gain on redemption of own debt | | 20 | 175 | 454 |
| Other operating income | | 1,048 | 1,219 | (634) |
| Non-interest income | 2 | 5,892 | 7,720 | 5,359 |
| Total income | | 15,150 | 16,737 | 14,715 |
| Staff costs | | (5,757) | (6,086) | (7,150) |
| Premises and equipment | | (2,081) | (2,038) | (1,951) |
| Other administrative expenses | | (4,568) | (6,692) | (4,929) |
| Depreciation and amortisation | | (930) | (1,247) | (1,603) |
| Write down of goodwill and other intangible assets | | (523) | (1,403) | (124) |
| Operating expenses | 3 | (13,859) | (17,466) | (15,757) |
| Profit/(loss) before impairment losses | | 1,291 | (729) | (1,042) |
| Impairment releases/(losses) | 13 | 1,352 | (8,120) | (5,010) |
| Operating profit/(loss) before tax | | 2,643 | (8,849) | (6,052) |
| Tax charge | 6 | (1,909) | (186) | (156) |
| Profit/(loss) from continuing operations | | 734 | (9,035) | (6,208) |
| (Loss)/profit from discontinued operations, net of tax | | | | |
| - Citizens | | (3,486) | 410 | 490 |
| - Other | | 41 | 148 | (172) |
| (Loss)/profit from discontinued operations, net of tax | 20 | (3,445) | 558 | 318 |
| Loss for the year | | (2,711) | (8,477) | (5,890) |
| | | | | |
| Attributable to: | | | | |
| Non-controlling interests | | 60 | 120 | (136) |
| Preference shareholders | 7 | 330 | 349 | 273 |
| Paid-in equity holders | 7 | 49 | 49 | 28 |
| Dividend access share | 9 | 320 | — | — |
| Ordinary and B shareholders | | (3,470) | (8,995) | (6,055) |
| | | (2,711) | (8,477) | (5,890) |
| | | | | |
Per ordinary and equivalent B share (1) | | | | |
| Basic and diluted earnings/(loss) from continuing operations | 9 | 0.5p | (85.0p) | (58.9p) |
| | | | | |
| Basic and diluted loss from continuing and discontinued operations | 9 | (30.6p) | (80.3p) | (55.0p) |
| (1) | Ten B shares rank pari-passu with one ordinary share (see Note 27). |
The accompanying notes on pages 352 to 448, the accounting policies on pages 340 to 351 and the audited sections of the Business review: Capital and risk management on pages 164 to 330 form an integral part of these financial statements.
Consolidated statement of comprehensive income for the year ended 31 December 2014
| Loss for the year | | (2,711) | (8,477) | (5,890) |
| Items that do not qualify for reclassification | | | | |
| Actuarial (losses)/gains on defined benefit plans | 4 | (108) | 446 | (2,158) |
| Tax | | (36) | (246) | 352 |
| | | (144) | 200 | (1,806) |
| | | | | |
| Items that do qualify for reclassification | | | | |
| Available-for-sale financial assets | | 807 | (406) | 645 |
| Cash flow hedges | | 1,413 | (2,291) | 1,006 |
| Currency translation | | 307 | (229) | (900) |
| Tax | | (455) | 1,014 | (152) |
| | | 2,072 | (1,912) | 599 |
| Other comprehensive income/(loss) after tax | | 1,928 | (1,712) | (1,207) |
| Total comprehensive loss for the year | | (783) | (10,189) | (7,097) |
| | | | | |
| Attributable to: | | | | |
| Non-controlling interests | | 246 | 137 | (129) |
| Preference shareholders | | 330 | 349 | 273 |
| Paid-in equity holders | | 49 | 49 | 28 |
| Dividend access share | | 320 | — | — |
| Ordinary and B shareholders | | (1,728) | (10,724) | (7,269) |
| | | (783) | (10,189) | (7,097) |
The accompanying notes on pages 352 to 448, the accounting policies on pages 340 to 351 and the audited sections of the Business review: Capital and risk management on pages 164 to 330 form an integral part of these financial statements.
Consolidated balance sheet as at 31 December 2014
| Assets | | | | |
| Cash and balances at central banks | 10 | 74,872 | 82,659 | 79,290 |
| Loans and advances to banks | 10 | 43,735 | 54,071 | 63,951 |
| Loans and advances to customers | 10 | 378,238 | 440,722 | 500,135 |
| Debt securities subject to repurchase agreements | 30 | 23,048 | 55,554 | 91,173 |
| Other debt securities | | 63,601 | 58,045 | 66,265 |
| Debt securities | 15 | 86,649 | 113,599 | 157,438 |
| Equity shares | 16 | 5,635 | 8,811 | 15,232 |
| Settlement balances | | 4,667 | 5,591 | 5,741 |
| Derivatives | 14 | 353,590 | 288,039 | 441,903 |
| Intangible assets | 17 | 7,781 | 12,368 | 13,545 |
| Property, plant and equipment | 18 | 6,167 | 7,909 | 9,784 |
| Deferred tax | 23 | 1,540 | 3,478 | 3,443 |
| Prepayments, accrued income and other assets | 19 | 5,878 | 7,614 | 7,820 |
| Assets of disposal groups | 20 | 82,011 | 3,017 | 14,013 |
| Total assets | | 1,050,763 | 1,027,878 | 1,312,295 |
| | | | | |
| Liabilities | | | | |
| Deposits by banks | 10 | 60,665 | 63,979 | 101,405 |
| Customer accounts | 10 | 391,639 | 470,880 | 521,279 |
| Debt securities in issue | 10 | 50,280 | 67,819 | 94,592 |
| Settlement balances | | 4,503 | 5,313 | 5,878 |
| Short positions | 21 | 23,029 | 28,022 | 27,591 |
| Derivatives | 14 | 349,805 | 285,526 | 434,333 |
| Accruals, deferred income and other liabilities | 22 | 13,346 | 16,017 | 14,801 |
| Retirement benefit liabilities | 4 | 2,579 | 3,210 | 3,884 |
| Deferred tax | 23 | 500 | 507 | 1,141 |
| Subordinated liabilities | 24 | 22,905 | 24,012 | 26,773 |
| Liabilities of disposal groups | 20 | 71,320 | 3,378 | 10,170 |
| Total liabilities | | 990,571 | 968,663 | 1,241,847 |
| | | | | |
| Non-controlling interests | 25 | 2,946 | 473 | 1,770 |
| Owners’ equity | 26, 27 | 57,246 | 58,742 | 68,678 |
| Total equity | | 60,192 | 59,215 | 70,448 |
| | | | | |
| Total liabilities and equity | | 1,050,763 | 1,027,878 | 1,312,295 |
| | | | | |
The accompanying notes on pages 352 to 448, the accounting policies on pages 340 to 351 and the audited sections of the Business review: Capital and risk management on pages 164 to 330 form an integral part of these financial statements.
The accounts were approved by the Board of directors on 25 February 2015 and signed on its behalf by:
Philip Hampton Chairman | | Ross McEwan Chief Executive | | Ewen Stevenson Chief Financial Officer |
The Royal Bank of Scotland Group plc
Registered No. SC45551
Consolidated statement of changes in equity for the year ended 31 December 2014
| Called-up share capital | | | |
| At 1 January | 6,714 | 6,582 | 15,318 |
| Ordinary shares issued | 163 | 132 | 197 |
| Share capital sub-division and consolidation | — | — | (8,933) |
| At 31 December | 6,877 | 6,714 | 6,582 |
| | | | |
| Paid-in equity | | | |
| At 1 January | 979 | 979 | 979 |
Reclassification (1) | (195) | — | — |
| At 31 December | 784 | 979 | 979 |
| | | | |
| Share premium account | | | |
| At 1 January | 24,667 | 24,361 | 24,001 |
| Ordinary shares issued | 385 | 306 | 360 |
| At 31 December | 25,052 | 24,667 | 24,361 |
| | | | |
| Merger reserve | | | |
| At 1 January and 31 December | 13,222 | 13,222 | 13,222 |
| | | | |
| Available-for-sale reserve | | | |
| At 1 January | (308) | (346) | (957) |
| Unrealised gains | 980 | 607 | 1,939 |
| Realised gains | (333) | (891) | (1,319) |
| Tax | (67) | 432 | 50 |
Recycled to profit or loss on disposal of businesses (2) | 36 | (110) | — |
| Transfer to retained earnings | (9) | — | (59) |
| At 31 December | 299 | (308) | (346) |
| | | | |
| Cash flow hedging reserve | | | |
| At 1 January | (84) | 1,666 | 879 |
| Amount recognised in equity | 2,871 | (967) | 2,093 |
| Amount transferred from equity to earnings | (1,458) | (1,324) | (1,087) |
| Tax | (334) | 541 | (219) |
| Transfer to retained earnings | 34 | — | — |
| At 31 December | 1,029 | (84) | 1,666 |
Consolidated statement of changes in equity for the year ended 31 December 2014
| | 2014 | 2013 | 2012 |
| | £m | £m | £m |
| Foreign exchange reserve | | | |
| At 1 January | 3,691 | 3,908 | 4,775 |
| Retranslation of net assets | 113 | (325) | (1,056) |
| Foreign currency gains on hedges of net assets | 108 | 105 | 177 |
| Tax | (30) | 6 | 17 |
| Recycled to profit or loss on disposal of businesses | — | (3) | (3) |
| Transfer to retained earnings | (399) | — | (2) |
| At 31 December | 3,483 | 3,691 | 3,908 |
| | | | |
| Capital redemption reserve | | | |
| At 1 January | 9,131 | 9,131 | 198 |
| Share capital sub-division and consolidation | — | — | 8,933 |
| At 31 December | 9,131 | 9,131 | 9,131 |
| | | | |
| Contingent capital reserve | | | |
| At 1 January | — | (1,208) | (1,208) |
| Transfer to retained earnings | — | 1,208 | — |
| At 31 December | — | — | (1,208) |
| | | | |
| Retained earnings | | | |
| At 1 January | 867 | 10,596 | 18,929 |
| Transfer to non-controlling interests | — | — | (361) |
| Profit/(loss) attributable to ordinary and B shareholders and other equity owners | | | |
- continuing operations | 756 | (9,118) | (6,184) |
- discontinued operations | (3,527) | 521 | 430 |
| Equity preference dividends paid | (330) | (349) | (273) |
| Paid-in equity dividends paid, net of tax | (49) | (49) | (28) |
| Dividend access share dividend | (320) | — | — |
| Citizens Financial Group initial public offering: | | | |
| - transfer from available-for-sale reserve | 9 | — | 59 |
| - transfer from cash flow hedging reserve | (34) | — | — |
| - transfer from foreign exchange reserve | 399 | — | 2 |
| Costs relating to Citizens Financial Group initial public offering | (45) | — | — |
| Transfer from contingent capital reserve | — | (1,208) | — |
| Termination of contingent capital agreement | — | 320 | — |
| Actuarial (losses)/gains recognised in retirement benefit schemes | | | |
- gross | (108) | 446 | (2,158) |
- tax | (36) | (246) | 352 |
| Loss on disposal of own shares held | (8) | (18) | (196) |
| Shares issued under employee share schemes | (91) | (77) | (87) |
| Share-based payments | | | |
- gross | 29 | 48 | 117 |
- tax | 3 | 1 | (6) |
| Reclassification of paid-in equity | (33) | — | — |
| At 31 December | (2,518) | 867 | 10,596 |
| | | | |
| Own shares held | | | |
| At 1 January | (137) | (213) | (769) |
| Disposal of own shares | 1 | 75 | 441 |
| Shares issued under employee share schemes | 23 | 1 | 115 |
| At 31 December | (113) | (137) | (213) |
| | | | |
| Owners’ equity at 31 December | 57,246 | 58,742 | 68,678 |
| | | | |
Consolidated statement of changes in equity for the year ended 31 December 2014
| | 2014 £m | 2013 £m | 2012 £m |
| Non-controlling interests (see Note 25) | | | |
| At 1 January | 473 | 1,770 | 686 |
| Currency translation adjustments and other movements | 86 | (6) | (18) |
| (Loss)/profit attributable to non-controlling interests | | | |
- continuing operations | (22) | 83 | (24) |
- discontinued operations | 82 | 37 | (112) |
| Dividends paid | (4) | (5) | — |
| Movements in available-for-sale securities | | | |
- unrealised gains | 36 | 8 | 3 |
- realised losses | 77 | 21 | 22 |
- tax | (13) | (1) | — |
- recycled to profit or loss on disposal of businesses (3) | — | (5) | — |
| Movements in cash flow hedging reserve | | | |
- amount recognised in equity | 18 | — | — |
| - amount transferred from equity to earnings | (18) | — | — |
- tax | — | — | — |
Equity raised (4) | 2,232 | — | 875 |
| Equity withdrawn and disposals | (1) | (1,429) | (23) |
| Transfer from retained earnings | — | — | 361 |
| At 31 December | 2,946 | 473 | 1,770 |
| | | | |
| Total equity at 31 December | 60,192 | 59,215 | 70,448 |
| | | | |
| Total equity is attributable to: | | | |
| Non-controlling interests | 2,946 | 473 | 1,770 |
| Preference shareholders | 4,313 | 4,313 | 3,765 |
| Paid-in equity holders | 784 | 979 | 979 |
| Ordinary and B shareholders | 52,149 | 53,450 | 63,934 |
| | 60,192 | 59,215 | 70,448 |
| (1) | Paid-in equity reclassified to liabilities as a result of the call of RBS Capital Trust III on 23 December 2014 (see Note 27). |
| (2) | Net of tax - £11 million charge (2013 - £35 million charge). |
| (3) | 2013 - net of tax of £1 million. |
| (4) | Includes £2,117 million relating to the initial public offering of Citizens Financial Group. |
The accompanying notes on pages 352 to 448, the accounting policies on pages 340 to 351 and the audited sections of the Business review: Capital and risk management on pages 164 to 330 form an integral part of these financial statements.
Consolidated cash flow statement for the year ended 31 December 2014
| | Note | 2014 £m | 2013 £m | 2012 £m |
| Operating activities | | | | |
| Operating profit/(loss) before tax from continuing operations | | 2,643 | (8,849) | (6,052) |
| (Loss)/profit before tax from discontinued operations | | (3,207) | 783 | 664 |
| Adjustments for: | | | | |
| Depreciation and amortisation | | 1,109 | 1,410 | 1,854 |
| Write down of goodwill and other intangible assets | | 533 | 1,403 | 518 |
| Interest on subordinated liabilities | | 886 | 886 | 841 |
| Charge for defined benefit pension schemes | | 466 | 517 | 558 |
| Pension scheme curtailment and settlement gains | | — | (7) | (41) |
| Cash contribution to defined benefit pension schemes | | (1,065) | (821) | (977) |
| Gain on redemption of own debt | | (20) | (175) | (454) |
| Loss on reclassification to disposal groups | | 3,994 | — | — |
| (Recoveries)/impairment losses | | (1,155) | 8,432 | 5,283 |
| Loans and advances written-off net of recoveries | | (5,073) | (4,090) | (3,925) |
| Elimination of foreign exchange differences | | (724) | (47) | 7,140 |
| Other non-cash items | | (412) | (947) | (1,491) |
| Net cash flows from trading activities | | (2,025) | (1,505) | 3,918 |
| Changes in operating assets and liabilities | | (17,948) | (28,780) | (48,736) |
| Net cash flows from operating activities before tax | | (19,973) | (30,285) | (44,818) |
| Income taxes paid | | (414) | (346) | (295) |
| Net cash flows from operating activities | 33 | (20,387) | (30,631) | (45,113) |
| | | | | |
| Investing activities | | | | |
| Sale and maturity of securities | | 28,020 | 41,772 | 49,079 |
| Purchase of securities | | (20,276) | (22,561) | (22,987) |
| Sale of property, plant and equipment | | 1,162 | 1,448 | 2,215 |
| Purchase of property, plant and equipment | | (816) | (626) | (1,484) |
| Net (investment in)/divestment of business interests and intangible assets | 34 | (1,481) | 1,150 | 352 |
| Net cash flows from investing activities | | 6,609 | 21,183 | 27,175 |
| | | | | |
| Financing activities | | | | |
| Issue of ordinary shares | | 314 | 264 | 120 |
| Issue of subordinated liabilities | | 2,159 | 1,796 | 2,093 |
| Issue of exchangeable bonds | | — | 330 | — |
| Proceeds of non-controlling interests issued | | 2,147 | — | 889 |
| Redemption of non-controlling interests | | (1) | (301) | (23) |
| Disposal of own shares | | 14 | 44 | 243 |
| Repayment of subordinated liabilities | | (3,480) | (3,500) | (258) |
| Dividends paid | | (383) | (403) | (301) |
| Dividend access share | | (320) | — | — |
| Interest on subordinated liabilities | | (854) | (958) | (746) |
| Net cash flows from financing activities | | (404) | (2,728) | 2,017 |
| Effects of exchange rate changes on cash and cash equivalents | | 909 | 512 | (3,893) |
| | | | | |
| Net decrease in cash and cash equivalents | | (13,273) | (11,664) | (19,814) |
| Cash and cash equivalents at 1 January | | 121,177 | 132,841 | 152,655 |
| Cash and cash equivalents at 31 December | 37 | 107,904 | 121,177 | 132,841 |
The accompanying notes on pages 352 to 448, the accounting policies on pages 340 a 351 and the audited sections of the Business review: Capital and risk management on pages 164 to 330 form an integral part of these financial statements.
1. Presentation of accounts
The accounts are prepared on a going concern basis (see the Report of the directors, page 99) and in accordance with International Financial Reporting Standards issued by the International Accounting Standards Board (IASB) and interpretations issued by the IFRS Interpretations Committee of the IASB as adopted by the European Union (EU) (together IFRS). The EU has not adopted the complete text of IAS 39 ‘Financial Instruments: Recognition and Measurement’; it has relaxed some of the standard's hedging requirements. The Group has not taken advantage of this relaxation: its financial statements are prepared in accordance with IFRS as issued by the IASB.
The company is incorporated in the UK and registered in Scotland. Its accounts are presented in accordance with the Companies Act 2006. With the exception of investment property and certain financial instruments as described in Accounting policies 9, 14, 16 and 18, the accounts are presented on an historical cost basis.
Citizens was classified as a disposal group on 31 December 2014; its assets and liabilities at that date have been aggregated and presented in separate balance sheet captions. It has been treated as a discontinued operation and prior periods re-presented.
The Group adopted a number of new and revised IFRSs effective 1 January 2014:
‘Offsetting Financial Assets and Financial Liabilities (Amendments to IAS 32)’ adds application guidance to IAS 32 to address inconsistencies identified in the application of the standard’s criteria for offsetting financial assets and financial liabilities.
‘Investment Entities (amendments to IFRS 10, IFRS 12 and IAS 27)’ applies to investment entities; such entities should account for their subsidiaries (other than those that provide services related to the entity’s
investment activities) at fair value through profit or loss.
IFRIC 21 ‘Levies’ provides guidance on accounting for levies payable to public authorities if certain conditions are met on a particular date.
IAS 36 ‘Recoverable Amount Disclosures for Non-Financial Assets (Amendments to IAS 36)’ aligns IAS 36’s disclosure requirement about recoverable amount with IASB’s original intentions.
IAS 39 ‘Novation of Derivatives and Continuation of Hedge Accounting (Amendments to IAS 39)’ provides relief from discontinuing hedge accounting on novation of a derivative designated as a hedging instrument.
The implementation of these requirements has not had a material effect on the Group’s accounts.
2. Basis of consolidation
The consolidated accounts incorporate the financial statements of the company and entities (including certain structured entities) that are controlled by the Group. The Group controls another entity (a subsidiary) when it is exposed, or has rights, to variable returns from its involvement with that entity and has the ability to affect those returns through its power over the other entity; power generally arises from holding a majority of voting rights. On acquisition of a subsidiary, its identifiable assets, liabilities and contingent liabilities are included in the consolidated accounts at their fair value. A subsidiary is included in the consolidated financial statements from the date it is controlled by the Group until the date the Group ceases to control it through a sale or a significant change in circumstances. Changes in the Group’s interest in a subsidiary that do not result in the Group ceasing to control that subsidiary are accounted for as equity transactions.
All intergroup balances, transactions, income and expenses are eliminated on consolidation. The consolidated accounts are prepared under uniform accounting policies.
3. Revenue recognition
Interest income on financial assets that are classified as loans and receivables, available-for-sale or held-to-maturity and interest expense on financial liabilities other than those measured at fair value are determined using the effective interest method. The effective interest method is a method of calculating the amortised cost of a financial asset or financial liability (or group of financial assets or liabilities) and of allocating the interest income or interest expense over the expected life of the asset or liability. The effective interest rate is the rate that exactly discounts estimated future cash flows to the instrument's initial carrying amount. Calculation of the effective interest rate takes into account fees payable or receivable that are an integral part of the instrument's yield, premiums or discounts on acquisition or issue, early redemption fees and transaction costs. All contractual terms of a financial instrument are considered when estimating future cash flows.
Financial assets and financial liabilities held for trading or designated as at fair value through profit or loss are recorded at fair value. Changes in fair value are recognised in profit or loss.
Fees in respect of services are recognised as the right to consideration accrues through the provision of the service to the customer. The arrangements are generally contractual and the cost of providing the service is incurred as the service is rendered. The price is usually fixed and always determinable. The application of this policy to significant fee types is outlined below.
Payment services - this comprises income received for payment services including cheques cashed, direct debits, Clearing House Automated Payments (the UK electronic settlement system) and BACS payments (the automated clearing house that processes direct debits and direct credits). These are generally charged on a per transaction basis. The income is earned when the payment or transaction occurs. Charges for payment services are usually debited to the customer's account monthly or quarterly in arrears. Income is accrued at period end for services provided but not yet charged.
Credit and debit card fees - fees from card business include:
| · | Interchange received: as issuer, the Group receives a fee (interchange) each time a cardholder purchases goods and services. The Group also receives interchange fees from other card issuers for providing cash advances through its branch and automated teller machine networks. These fees are accrued once the transaction has taken place. |
| · | Periodic fees payable by a credit card or debit card holder are deferred and taken to profit or loss over the period of the service. |
Lending (credit facilities) - commitment and utilisation fees are determined as a percentage of the outstanding facility. If it is unlikely that a specific lending arrangement will be entered into, such fees are taken to profit or loss over the life of the facility otherwise they are deferred and included in the effective interest rate on the loan.
Brokerage fees - in respect of securities, foreign exchange, futures or options transactions entered into on behalf of a customer are recognised as income on execution of a significant act.
Trade finance - income from the provision of trade finance is recognised over the term of the finance unless specifically related to a significant act, in which case income is recognised when the act is executed.
Investment management - fees charged for managing investments are recognised as revenue as the services are provided. Incremental costs that are directly attributable to securing an investment management contract are deferred and charged as expense as the related revenue is recognised.
4. Assets held for sale and discontinued operations
A non-current asset (or disposal group) is classified as held for sale if the Group will recover its carrying amount principally through a sale transaction rather than through continuing use. A non-current asset (or disposal group) classified as held for sale is measured at the lower of its carrying amount and fair value less costs to sell. If the asset (or disposal group) is acquired as part of a business combination it is initially measured at fair value less costs to sell. Assets and liabilities of disposal groups classified as held for sale and non-current assets classified as held for sale are shown separately on the face of the balance sheet.
The results of discontinued operations - comprising the post-tax profit or loss of discontinued operations and the post-tax gain or loss recognised either on measurement to fair value less costs to sell or on disposal of the discontinued operation - are shown as a single amount on the face of the income statement; an analysis of this amount is presented in Note 20 on the accounts. A discontinued operation is a cash generating unit or a group of cash generating units that either has been disposed of, or is classified as held for sale, and (a) represents a separate major line of business or geographical area of operations, (b) is part of a single co-ordinated plan to dispose of a separate major line of business or geographical area of operations or (c) is a subsidiary acquired exclusively with a view to resale.
5. Employee benefits
Short-term employee benefits, such as salaries, paid absences, and other benefits are accounted for on an accruals basis over the period in which the employees provide the related services. Employees may receive variable compensation satisfied by cash, by debt instruments issued by the Group or by RBSG shares. The treatment of share-based compensation is set out in Accounting policy 25. Variable compensation that is settled in cash or debt instruments is charged to profit or loss over the period from the start of the year to which the variable compensation relates to the expected settlement date taking account of forfeiture and clawback criteria.
The Group provides post-retirement benefits in the form of pensions and healthcare plans to eligible employees.
Contributions to defined contribution pension schemes are recognised in profit or loss when payable.
For defined benefit schemes, the defined benefit obligation is measured on an actuarial basis using the projected unit credit method and discounted at a rate determined by reference to market yields at the end of the reporting period on high quality corporate bonds of equivalent term and currency to the scheme liabilities. Scheme assets are measured at their fair value. The difference between scheme assets and scheme liabilities – the net defined benefit asset or liability - is recognised in the balance sheet. A defined benefit asset is limited to the present value of any economic benefits available to the Group in the form of refunds from the plan or reduced contributions to it.
The charge to profit or loss for pension costs (recorded in operating expenses) comprises:
| · | the current service cost |
| · | interest, computed at the rate used to discount scheme liabilities, on the net defined benefit liability or asset |
| · | past service cost resulting from a scheme amendment or curtailment |
| · | gains or losses on settlement. |
A curtailment occurs when the Group significantly reduces the number of employees covered by a plan. A plan amendment occurs when the Group introduces, or withdraws, a defined benefit plan or changes the benefits payable under an existing defined benefit plan. Past service cost may be either positive (when benefits are introduced or changed so that the present value of the defined benefit obligation increases) or negative (when benefits are withdrawn or changed so that the present value of the defined benefit obligation decreases). A settlement is a transaction that eliminates all further obligation for part or all of the benefits.
Actuarial gains and losses (i.e. gains or and losses on re-measuring the net defined benefit asset or liability) are recognised in other comprehensive income in full in the period in which they arise.
6. Intangible assets and goodwill
Intangible assets acquired by the Group are stated at cost less accumulated amortisation and impairment losses. Amortisation is charged to profit or loss over the assets' estimated economic lives using methods that best reflect the pattern of economic benefits and is included in Depreciation and amortisation. These estimated useful economic lives are:
| Computer software | 3 to 12 years |
| Other acquired intangibles | 5 to 10 years |
Expenditure on internally generated goodwill and brands is written-off as incurred. Direct costs relating to the development of internal-use computer software are capitalised once technical feasibility and economic viability have been established. These costs include payroll, the costs of materials and services, and directly attributable overheads. Capitalisation of costs ceases when the software is capable of operating as intended. During and after development, accumulated costs are reviewed for impairment against the benefits that the software is expected to generate. Costs incurred prior to the establishment of technical feasibility and economic viability are expensed as incurred as are all training costs and general overheads. The costs of licences to use computer software that are expected to generate economic benefits beyond one year are also capitalised.
Intangible assets include goodwill arising on the acquisition of subsidiaries and joint ventures. Goodwill on the acquisition of a subsidiary is the excess of the fair value of the consideration transferred, the fair value of any existing interest in the subsidiary and the amount of any non-controlling interest measured either at fair value or at its share of the subsidiary’s net assets over the Group's interest in the net fair value of the subsidiary’s identifiable assets, liabilities and contingent liabilities. Goodwill arises on the acquisition of a joint venture when the cost of investment exceeds the Group’s share of the net fair value of the joint venture’s identifiable assets and liabilities. Goodwill is measured at initial cost less any subsequent impairment losses. Goodwill arising on the acquisition of associates is included within their carrying amounts. The gain or loss on the disposal of a subsidiary, associate or joint venture includes the carrying value of any related goodwill.
7. Property, plant and equipment
Items of property, plant and equipment (except investment property - see Accounting policy 9) are stated at cost less accumulated depreciation and impairment losses. Where an item of property, plant and equipment comprises major components having different useful lives, these are accounted for separately.
Depreciation is charged to profit or loss on a straight-line basis so as to write-off the depreciable amount of property, plant and equipment (including assets owned and let on operating leases) over their estimated useful lives. The depreciable amount is the cost of an asset less its residual value. Freehold land is not depreciated.
The estimated useful lives of the Group’s property, plant and equipment are:
| Freehold buildings | 50 years |
| Long leasehold property (leases | |
| with more than 50 years to run) | 50 years |
| Short leaseholds | unexpired period of the lease |
| Property adaptation costs | 10 to 15 years |
| Computer equipment | up to 5 years |
| Other equipment | 4 to 15 years |
The residual value and useful life of property, plant and equipment are reviewed at each balance sheet date and updated for any changes to previous estimates.
8. Impairment of intangible assets and property, plant and equipment
At each reporting date, the Group assesses whether there is any indication that its intangible assets, or property, plant and equipment are impaired. If any such indication exists, the Group estimates the recoverable amount of the asset and the impairment loss if any. Goodwill is tested for impairment annually or more frequently if events or changes in circumstances indicate that it might be impaired.
If an asset does not generate cash flows that are independent from those of other assets or groups of assets, the recoverable amount is determined for the cash-generating unit to which the asset belongs. A cash-generating unit is the smallest identifiable group of assets that generates cash inflows that are largely independent of the cash inflows from other assets or groups of assets. For the purposes of impairment testing, goodwill acquired in a business combination is allocated to each of the Group’s cash-generating units or groups of cash-generating units expected to benefit from the combination. The recoverable amount of an asset or cash-generating unit is the higher of its fair value less cost to sell and its value in use. Value in use is the present value of future cash flows from the asset or cash-generating unit discounted at a rate that reflects market interest rates adjusted for risks specific to the asset or cash-generating unit that have not been taken into account in estimating future cash flows. If the recoverable amount of an intangible or tangible asset is less than its carrying value, an impairment loss is recognised immediately in profit or loss and the carrying value of the asset reduced by the amount of the loss. A reversal of an impairment loss on intangible assets (excluding goodwill) or property, plant and equipment is recognised as it arises provided the increased carrying value is not greater than it would have been had no impairment loss been recognised. Impairment losses on goodwill are not reversed.
9. Investment property
Investment property comprises freehold and leasehold properties that are held to earn rentals or for capital appreciation or both. Investment property is not depreciated but is stated at fair value. Fair value is based on current prices for similar properties in the same location and condition. Any gain or loss arising from a change in fair value is recognised in profit or loss. Rental income from investment property is recognised on a straight-line basis over the term of the lease in Other operating income. Lease incentives granted are recognised as an integral part of the total rental income.
10. Foreign currencies
The Group's consolidated financial statements are presented in sterling which is the functional currency of the company.
Group entities record transactions in foreign currencies in their functional currency - the currency of the primary economic environment in which they operate - at the foreign exchange rate ruling at the date of the transaction. Monetary assets and liabilities denominated in foreign currencies are translated into the relevant functional currency at the foreign exchange rates ruling at the balance sheet date. Foreign exchange differences arising on the settlement of foreign currency transactions and from the translation of monetary assets and liabilities are reported in income from trading activities except for differences arising on cash flow hedges and hedges of net investments in foreign operations (see Accounting policy 23).
Non-monetary items denominated in foreign currencies that are stated at fair value are translated into the relevant functional currency at the foreign exchange rates ruling at the dates the values are determined. Translation differences arising on non-monetary items measured at fair value are recognised in profit or loss except for differences arising on available-for-sale non-monetary financial assets, for example equity shares, which are recognised in other comprehensive income unless the asset is the hedged item in a fair value hedge.
Assets and liabilities of foreign operations, including goodwill and fair value adjustments arising on acquisition, are translated into sterling at foreign exchange rates ruling at the balance sheet date. Income and expenses of foreign operations are translated into sterling at average exchange rates unless these do not approximate to the foreign exchange rates ruling at the dates of the transactions. Foreign exchange differences arising on the translation of a foreign operation are recognised in other comprehensive income. The amount accumulated in equity is reclassified from equity to profit or loss on disposal of a foreign operation.
11. Leases
As lessor
Contracts with customers to lease assets are classified as finance leases if they transfer substantially all the risks and rewards of ownership of the asset to the customer; all other contracts with customers to lease assets are classified as operating leases.
Finance lease receivables are included in the balance sheet, within Loans and advances to customers, at the amount of the net investment in the lease being the minimum lease payments and any unguaranteed residual value discounted at the interest rate implicit in the lease. Finance lease income is allocated to accounting periods so as to give a constant periodic rate of return before tax on the net investment and included in Interest receivable. Unguaranteed residual values are subject to regular review; if there is a reduction in their value, income allocation is revised and any reduction in respect of amounts accrued is recognised immediately.
Rental income from operating leases is recognised in income on a straight-line basis over the lease term unless another systematic basis better represents the time pattern of the asset’s use. Operating lease assets are included within Property, plant and equipment and depreciated over their useful lives (see Accounting policy 7). Operating lease rentals receivable are included in Other operating income.
As lessee
The Group’s contracts to lease assets are principally operating leases. Operating lease rental expense is included in Premises and equipment costs and recognised as an expense on a straight-line basis over the lease term unless another systematic basis better represents the benefit to the Group.
12. Provisions
The Group recognises a provision for a present obligation resulting from a past event when it is more likely than not that it will be required to transfer economic benefits to settle the obligation and the amount of the obligation can be estimated reliably.
Provision is made for restructuring costs, including the costs of redundancy, when the Group has a constructive obligation to restructure. An obligation exists when the Group has a detailed formal plan for the restructuring and has raised a valid expectation in those affected by starting to implement the plan or by announcing its main features.
If the Group has a contract that is onerous, it recognises the present obligation under the contract as a provision. An onerous contract is one where the unavoidable costs of meeting the Group’s contractual obligations exceed the expected economic benefits. When the Group vacates a leasehold property, a provision is recognised for the costs under the lease less any expected economic benefits (such as rental income).
Contingent liabilities are possible obligations arising from past events, whose existence will be confirmed only by uncertain future events, or present obligations arising from past events that are not recognised because either an outflow of economic benefits is not probable or the amount of the obligation cannot be reliably measured. Contingent liabilities are not recognised but information about them is disclosed unless the possibility of any outflow of economic benefits in settlement is remote.
13. Tax
Income tax expense or income, comprising current tax and deferred tax, is recorded in the income statement except income tax on items recognised outside profit or loss which is credited or charged to other comprehensive income or to equity as appropriate.
Current tax is income tax payable or recoverable in respect of the taxable profit or loss for the year arising in profit or loss, other comprehensive income or equity. Provision is made for current tax at rates enacted or substantively enacted at the balance sheet date.
Deferred tax is the tax expected to be payable or recoverable in respect of temporary differences between the carrying amount of an asset or liability for accounting purposes and its carrying amount for tax purposes. Deferred tax liabilities are generally recognised for all taxable temporary differences and deferred tax assets are recognised to the extent that it is probable that they will be recovered. Deferred tax is not recognised on temporary differences that arise from initial recognition of an asset or a liability in a transaction (other than a business combination) that at the time of the transaction affects neither accounting nor taxable profit or loss. Deferred tax is calculated using tax rates expected to apply in the periods when the assets will be realised or the liabilities settled, based on tax rates and laws enacted, or substantively enacted, at the balance sheet date.
Deferred tax assets and liabilities are offset where the Group has a legally enforceable right to offset and where they relate to income taxes levied by the same taxation authority either on an individual Group company or on Group companies in the same tax group that intend, in future periods, to settle current tax liabilities and assets on a net basis or on a gross basis simultaneously.
14. Financial assets
On initial recognition, financial assets are classified into held-to-maturity investments; held-for-trading; designated as at fair value through profit or loss; loans and receivables; or available-for-sale financial assets. Regular way purchases of financial assets classified as loans and receivables are recognised on settlement date; all other regular way transactions in financial assets are recognised on trade date.
Held-to-maturity investments - a financial asset may be classified as a held-to-maturity investment only if it has fixed or determinable payments, a fixed maturity and the Group has the positive intention and ability to hold to maturity. Held-to-maturity investments are initially recognised at fair value plus directly related transaction costs. They are subsequently measured at amortised cost using the effective interest method (see Accounting policy 3) less any impairment losses.
Held-for-trading - a financial asset is classified as held-for-trading if it is acquired principally for sale in the near term, or forms part of a portfolio of financial instruments that are managed together and for which there is evidence of short-term profit taking, or it is a derivative (not in a qualifying hedge relationship). Held-for-trading financial assets are recognised at fair value with transaction costs being recognised in profit or loss. Subsequently they are measured at fair value. Gains and losses on held-for-trading financial assets are recognised in profit or loss as they arise.
Designated as at fair value through profit or loss - financial assets may be designated as at fair value through profit or loss only if such designation (a) eliminates or significantly reduces a measurement or recognition inconsistency; or (b) applies to a group of financial assets, financial liabilities or both, that the Group manages and evaluates on a fair value basis; or (c) relates to an instrument that contains an embedded derivative which is not evidently closely related to the host contract. Financial assets that the Group designates on initial recognition as being at fair value through profit or loss are recognised at fair value, with transaction costs being recognised in profit or loss, and are subsequently measured at fair value. Gains and losses are recognised in profit or loss as they arise.
Loans and receivables - non-derivative financial assets with fixed or determinable repayments that are not quoted in an active market are classified as loans and receivables, except those that are classified as available-for-sale or as held-for-trading, or designated as at fair value through profit or loss. Loans and receivables are initially recognised at fair value plus directly related transaction costs. They are subsequently measured at amortised cost using the effective interest method (see Accounting policy 3) less any impairment losses.
Available-for-sale financial assets - financial assets that are not classified as held-to-maturity; held-for-trading; designated as at fair value through profit or loss; or loans and receivables are classified as available-for-sale. Financial assets can be designated as available-for-sale on initial recognition. Available-for-sale financial assets are initially recognised at fair value plus directly related transaction costs. They are subsequently measured at fair value. Unquoted equity investments whose fair value cannot be measured reliably are carried at cost and classified as available-for-sale financial assets. Impairment losses and exchange differences resulting from retranslating the amortised cost of foreign currency monetary available-for-sale financial assets are recognised in profit or loss together with interest calculated using the effective interest method (see Accounting policy 3) as are gains and losses attributable to the hedged risk on available-for-sale financial assets that are hedged items in fair value hedges (see Accounting policy 23). Other changes in the fair value of available-for-sale financial assets and any related tax are reported in other comprehensive income until disposal, when the cumulative gain or loss is reclassified from equity to profit or loss.
Reclassifications - held-for-trading and available-for-sale financial assets that meet the definition of loans and receivables (non-derivative financial assets with fixed or determinable payments that are not quoted in an active market) may be reclassified to loans and receivables if the Group has the intention and ability to hold the financial asset for the foreseeable future or until maturity. The Group typically regards the foreseeable future for this purpose as twelve months from the date of reclassification. Additionally, held-for-trading financial assets that do not meet the definition of loans and receivables may, in rare circumstances, be transferred to available-for-sale financial assets or to held-to-maturity investments. Reclassifications are made at fair value. This fair value becomes the asset's new cost or amortised cost as appropriate. Gains and losses recognised up to the date of reclassification are not reversed.
Fair value - the Group’s approach to determining the fair value of financial instruments measured at fair value is set out in the section of Critical accounting policies and key sources of estimation uncertainty entitled Fair value - financial instruments; further details are given in Note 11.
15. Impairment of financial assets
The Group assesses at each balance sheet date whether there is any objective evidence that a financial asset or group of financial assets classified as held-to-maturity, as available-for-sale or as loans and receivables is impaired. A financial asset or group of financial assets is impaired and an impairment loss incurred if there is objective evidence that an event or events since initial recognition of the asset have adversely affected the amount or timing of future cash flows from the asset.
Financial assets carried at amortised cost - if there is objective evidence that an impairment loss on a financial asset or group of financial assets classified as loans and receivables or as held-to-maturity investments has been incurred, the Group measures the amount of the loss as the difference between the carrying amount of the asset or group of assets and the present value of estimated future cash flows from the asset or group of assets discounted at the effective interest rate of the instrument at initial recognition. For collateralised loans and receivables, estimated future cash flows include cash flows that may result from foreclosure less the costs of obtaining and selling the collateral, whether or not foreclosure is probable.
Where, in the course of the orderly realisation of a loan, it is exchanged for equity shares or property, the exchange is accounted for as the sale of the loan and the acquisition of equity securities or investment property. Where the Group’s interest in equity shares following the exchange is such that the Group controls an entity, that entity is consolidated. Impairment losses are assessed individually for financial assets that are individually significant and individually or collectively for assets that are not individually significant. In making collective impairment assessments, financial assets are grouped into portfolios on the basis of similar risk characteristics. Future cash flows from these portfolios are estimated on the basis of the contractual cash flows and historical loss experience for assets with similar credit risk characteristics. Historical loss experience is adjusted, on the basis of observable data, to reflect current conditions not affecting the period of historical experience. Impairment losses are recognised in profit or loss and the carrying amount of the financial asset or group of financial assets reduced by establishing an allowance for impairment losses. If, in a subsequent period, the amount of the impairment loss reduces and the reduction can be ascribed to an event after the impairment was recognised, the previously recognised loss is reversed by adjusting the allowance. Once an impairment loss has been recognised on a financial asset or group of financial assets, interest income is recognised on the carrying amount using the rate of interest at which estimated future cash flows were discounted in measuring impairment.
Impaired loans and receivables are written off, i.e. the impairment provision is applied in writing down the loan's carrying value partially or in full, when the Group concludes that there is no longer any realistic prospect of recovery of part or all of the loan. For loans that are individually assessed for impairment, the timing of write off is determined on a case-by-case basis. Such loans are reviewed regularly and write off will be prompted by bankruptcy, insolvency, renegotiation and similar events.
Except for US retail portfolios, where write off of the irrecoverable amount takes place within 60 - 180 days, the typical time frames from initial impairment to write off for the Group’s collectively-assessed portfolios are:
| · | Retail mortgages: write off usually occurs within five years, or when an account is closed if earlier. |
| · | Credit cards: the irrecoverable amount is written off after 12 months; three years later any remaining amounts outstanding are written off. |
| · | Overdrafts and other unsecured loans: write off occurs within six years. |
| · | Business and commercial loans: write offs of commercial loans are determined in the light of individual circumstances; the period does not exceed five years. Business loans are generally written off within five years. |
Amounts recovered after a loan has been written off are credited to the loan impairment charge for the period in which they are received.
Financial assets carried at fair value - when a decline in the fair value of a financial asset classified as available-for-sale has been recognised directly in other comprehensive income and there is objective evidence that it is impaired, the cumulative loss is reclassified from equity to profit or loss. The loss is measured as the difference between the amortised cost (including any hedge accounting adjustments) of the financial asset and its current fair value. Impairment losses on available-for-sale equity instruments are not reversed through profit or loss, but those on available-for-sale debt instruments are reversed, if there is an increase in fair value that is objectively related to a subsequent event.
16. Financial liabilities
Financial liabilities are recognised initially at fair value and classified into held-for-trading; designated as at fair value through profit or loss; or amortised cost. Issues of financial liabilities measured at amortised cost are recognised on settlement date; all other regular way transactions in financial liabilities are recognised on trade date.
Held-for-trading - a financial liability is classified as held-for-trading if it is incurred principally for repurchase in the near term, or forms part of a portfolio of financial instruments that are managed together and for which there is evidence of short-term profit taking, or it is a derivative (not in a qualifying hedge relationship). Held-for-trading financial liabilities are recognised at fair value with transaction costs being recognised in profit or loss. Subsequently they are measured at fair value. Gains and losses are recognised in profit or loss as they arise.
Designated as at fair value through profit or loss - financial liabilities may be designated as at fair value through profit or loss only if such designation (a) eliminates or significantly reduces a measurement or recognition inconsistency; or (b) applies to a group of financial assets, financial liabilities or both that the Group manages and evaluates on a fair value basis; or (c) relates to an instrument that contains an embedded derivative which is not evidently closely related to the host contract.
Financial liabilities that the Group designates on initial recognition as being at fair value through profit or loss are recognised at fair value, with transaction costs being recognised in profit or loss, and are subsequently measured at fair value. Gains and losses are recognised in profit or loss as they arise.
Financial liabilities designated as at fair value through profit or loss principally comprise structured liabilities issued by the Group: designation significantly reduces the measurement inconsistency between these liabilities and the related derivatives carried at fair value.
Amortised cost - all other financial liabilities are measured at amortised cost using the effective interest method (see Accounting policy 3).
Fair value - the Group’s approach to determining the fair value of financial instruments measured at fair value is set out in the section of Critical accounting policies and key sources of estimation uncertainty entitled Fair value - financial instruments; further details are given in Note 11.
17. Financial guarantee contracts
Under a financial guarantee contract, the Group, in return for a fee, undertakes to meet a customer’s obligations under the terms of a debt instrument if the customer fails to do so. A financial guarantee is recognised as a liability; initially at fair value and, if not designated as at fair value through profit or loss, subsequently at the higher of its initial value less cumulative amortisation and any provision under the contract measured in accordance with Accounting policy 12. Amortisation is calculated so as to recognise fees receivable in profit or loss over the period of the guarantee.
18. Loan commitments
Provision is made for loan commitments, other than those classified as held-for-trading, if it is probable that the facility will be drawn and the resulting loan will be recognised at an amount less than the cash advanced. Syndicated loan commitments in excess of the level of lending under the commitment approved for retention by the Group are classified as held-for-trading and measured at fair value.
19. Derecognition
A financial asset is derecognised when the contractual right to receive cash flows from the asset has expired or when it has been transferred and the transfer qualifies for derecognition. A transfer requires that the Group either (a) transfers the contractual rights to receive the asset's cash flows; or (b) retains the right to the asset's cash flows but assumes a contractual obligation to pay those cash flows to a third party. After a transfer, the Group assesses the extent to which it has retained the risks and rewards of ownership of the transferred asset. The asset remains on the balance sheet if substantially all the risks and rewards have been retained. It is derecognised if substantially all the risks and rewards have been transferred. If substantially all the risks and rewards have been neither retained nor transferred, the Group assesses whether or not it has retained control of the asset. If the Group has retained control of the asset, it continues to recognise the asset to the extent of its continuing involvement; if the Group has not retained control of the asset, it is derecognised.
A financial liability is removed from the balance sheet when the obligation is discharged, or is cancelled, or expires. On the redemption or settlement of debt securities (including subordinated liabilities) issued by the Group, the Group derecognises the debt instrument and records a gain or loss being the difference between the debt's carrying amount and the cost of redemption or settlement. The same treatment applies where the debt is exchanged for a new debt issue that has terms substantially different from those of the existing debt. The assessment of whether the terms of the new debt instrument are substantially different takes into account qualitative and quantitative characteristics including a comparison of the present value of the cash flows under the new terms with the present value of the remaining cash flows of the original debt issue discounted at the effective interest rate of the original debt issue.
20. Sale and repurchase transactions
Securities subject to a sale and repurchase agreement under which substantially all the risks and rewards of ownership are retained by the Group continue to be shown on the balance sheet and the sale proceeds recorded as a financial liability. Securities acquired in a reverse sale and repurchase transaction under which the Group is not exposed to substantially all the risks and rewards of ownership are not recognised on the balance sheet and the consideration paid is recorded as a financial asset.
Securities borrowing and lending transactions are usually secured by cash or securities advanced by the borrower. Borrowed securities are not recognised on the balance sheet or lent securities derecognised. Cash collateral given or received is treated as a loan or deposit; collateral in the form of securities is not recognised. However, where securities borrowed are transferred to third parties, a liability for the obligation to return the securities to the stock lending counterparty is recorded.
21. Netting
Financial assets and financial liabilities are offset and the net amount presented in the balance sheet when, and only when, the Group currently has a legally enforceable right to set off the recognised amounts and it intends either to settle on a net basis or to realise the asset and settle the liability simultaneously. The Group is party to a number of arrangements, including master netting agreements, that give it the right to offset financial assets and financial liabilities but where it does not intend to settle the amounts net or simultaneously and therefore the assets and liabilities concerned are presented gross.
22. Capital instruments
The Group classifies a financial instrument that it issues as a liability if it is a contractual obligation to deliver cash or another financial asset, or to exchange financial assets or financial liabilities on potentially unfavourable terms and as equity if it evidences a residual interest in the assets of the Group after the deduction of liabilities. The components of a compound financial instrument issued by the Group are classified and accounted for separately as financial assets, financial liabilities or equity as appropriate.
Incremental costs and related tax that are directly attributable to an equity transaction are deducted from equity.
The consideration for any ordinary shares of the company purchased by the Group (treasury shares) is deducted from equity. On the cancellation of treasury shares their nominal value is removed from equity and any excess of consideration over nominal value is treated in accordance with the capital maintenance provisions of the Companies Act. On the sale or reissue of treasury shares the consideration received and related tax are credited to equity, net of any directly attributable incremental costs.
23. Derivatives and hedging
Derivative financial instruments are initially recognised, and subsequently measured, at fair value. The Group’s approach to determining the fair value of financial instruments is set out in the section of Critical accounting policies and key sources of estimation uncertainty entitled Fair value - financial instruments; further details are given in Note 11.
A derivative embedded in a contract is accounted for as a standalone derivative if its economic characteristics are not closely related to the economic characteristics of the host contract; unless the entire contract is measured at fair value with changes in fair value recognised in profit or loss.
Gains and losses arising from changes in the fair value of derivatives that are not the hedging instrument in a qualifying hedge are recognised as they arise in profit or loss. Gains and losses are recorded in Income from trading activities except for gains and losses on those derivatives that are managed together with financial instruments designated at fair value; these gains and losses are included in Other operating income.
The Group enters into three types of hedge relationship: hedges of changes in the fair value of a recognised asset or liability or unrecognised firm commitment (fair value hedges); hedges of the variability in cash flows from a recognised asset or liability or a highly probable forecast transaction (cash flow hedges); and hedges of the net investment in a foreign operation.
Hedge relationships are formally designated and documented at inception. The documentation identifies the hedged item and the hedging instrument and details the risk that is being hedged and the way in which effectiveness will be assessed at inception and during the period of the hedge. If the hedge is not highly effective in offsetting changes in fair values or cash flows attributable to the hedged risk, consistent with the documented risk management strategy, hedge accounting is discontinued. Hedge accounting is also discontinued if the Group revokes the designation of a hedge relationship.
Fair value hedge - in a fair value hedge, the gain or loss on the hedging instrument is recognised in profit or loss. The gain or loss on the hedged item attributable to the hedged risk is recognised in profit or loss and, where the hedged item is measured at amortised cost, adjusts the carrying amount of the hedged item. Hedge accounting is discontinued if the hedge no longer meets the criteria for hedge accounting; or if the hedging instrument expires or is sold, terminated or exercised; or if hedge designation is revoked. If the hedged item is one for which the effective interest rate method is used, any cumulative adjustment is amortised to profit or loss over the life of the hedged item using a recalculated effective interest rate.
Cash flow hedge - in a cash flow hedge, the effective portion of the gain or loss on the hedging instrument is recognised in other comprehensive income and the ineffective portion in profit or loss. When the forecast transaction results in the recognition of a financial asset or financial liability, the cumulative gain or loss is reclassified from equity to profit or loss in the same periods in which the hedged forecast cash flows affect profit or loss. Otherwise the cumulative gain or loss is removed from equity and recognised in profit or loss at the same time as the hedged transaction. Hedge accounting is discontinued if the hedge no longer meets the criteria for hedge accounting; if the hedging instrument expires or is sold, terminated or exercised; if the forecast transaction is no longer expected to occur; or if hedge designation is revoked. On the discontinuance of hedge accounting (except where a forecast transaction is no longer expected to occur), the cumulative unrealised gain or loss is reclassified from equity to profit or loss when the hedged cash flows occur or, if the forecast transaction results in the recognition of a financial asset or financial liability, when the hedged forecast cash flows affect profit or loss. Where a forecast transaction is no longer expected to occur, the cumulative unrealised gain or loss is reclassified from equity to profit or loss immediately.
Hedge of net investment in a foreign operation - in the hedge of a net investment in a foreign operation, the portion of foreign exchange differences arising on the hedging instrument determined to be an effective hedge is recognised in other comprehensive income. Any ineffective portion is recognised in profit or loss. Non-derivative financial liabilities as well as derivatives may be the hedging instrument in a net investment hedge. On disposal or partial disposal of a foreign operation, the amount accumulated in equity is reclassified from equity to profit or loss.
24. Associates and joint ventures
An associate is an entity over which the Group has significant influence. A joint venture is one which it controls jointly with other parties. Investments in associates and interests in joint ventures are recognised using the equity method. They are stated initially at cost, including attributable goodwill, and subsequently adjusted for post-acquisition changes in the Group’s share of net assets.
25. Share-based compensation
The Group operates a number of share-based compensation schemes under which it awards RBSG shares and share options to its employees. Such awards are generally subject to vesting conditions: conditions that vary the amount of cash or shares to which an employee is entitled. Vesting conditions include service conditions (requiring the employee to complete a specified period of service) and performance conditions (requiring the employee to complete a specified period of service and specified performance targets to be met). Other conditions to which an award is subject are non-vesting conditions (such as a requirement to save throughout the vesting period).
The cost of employee services received in exchange for an award of shares or share options granted is measured by reference to the fair value of the shares or share options on the date the award is granted and takes into account non-vesting conditions and market performance conditions (conditions related to the market price of RBSG shares): an award is treated as vesting irrespective of whether any market performance condition or non-vesting condition is met. The fair value of options granted is estimated using valuation techniques which incorporate exercise price, term, risk-free interest rates, the current share price and its expected volatility. The cost is expensed on a straight-line basis over the vesting period (the period during which all the specified vesting conditions must be satisfied) with a corresponding increase in equity in an equity-settled award, or a corresponding liability in a cash-settled award. The cost is adjusted for vesting conditions (other than market performance conditions) so as to reflect the number of shares or share options that actually vest.
If an award is modified, the original cost continues to be recognised as if there had been no modification. Where modification increases the fair value of the award, this increase is recognised as an expense over the modified vesting period. A new award of shares or share options is treated as the modification of a cancelled award if, on the date the new award is granted, the Group identifies them as replacing the cancelled award. The cancellation of an award through failure to meet non-vesting conditions triggers an immediate expense for any unrecognised element of the cost of an award.
26. Cash and cash equivalents
In the cash flow statement, cash and cash equivalents comprises cash and deposits with banks with an original maturity of less than three months together with short-term highly liquid investments that are readily convertible to known amounts of cash and subject to insignificant risk of change in value.
Critical accounting policies and key sources of estimation uncertainty
The reported results of the Group are sensitive to the accounting policies, assumptions and estimates that underlie the preparation of its financial statements. UK company law and IFRS require the directors, in preparing the Group's financial statements, to select suitable accounting policies, apply them consistently and make judgements and estimates that are reasonable and prudent. In the absence of an applicable standard or interpretation, IAS 8 ‘Accounting Policies, Changes in Accounting Estimates and Errors’, requires management to develop and apply an accounting policy that results in relevant and reliable information in the light of the requirements and guidance in IFRS dealing with similar and related issues and the IASB's ’Conceptual Framework for Financial Reporting’. The judgements and assumptions involved in the Group's accounting policies that are considered by the Board to be the most important to the portrayal of its financial condition are discussed below. The use of estimates, assumptions or models that differ from those adopted by the Group would affect its reported results.
Pensions
The Group operates a number of defined benefit pension schemes as described in Note 4 on the accounts. As described in Accounting policy 5, the assets of the schemes are measured at their fair value at the balance sheet date. Scheme liabilities are measured using the projected unit credit method, which takes account of projected earnings increases, using actuarial assumptions that give the best estimate of the future cash flows that will arise under the scheme liabilities. These cash flows are discounted at the interest rate applicable to high-quality corporate bonds of the same currency and term as the liabilities. Any recognisable surplus or deficit of scheme assets over liabilities is recorded in the balance sheet as an asset (surplus) or liability (deficit).
In determining the value of scheme liabilities, financial and demographic assumptions are made including price inflation, pension increases, earnings growth and the longevity of scheme members. A range of assumptions could be adopted in valuing the schemes' liabilities. Different assumptions could significantly alter the amount of the surplus or deficit recognised in the balance sheet and the pension cost charged to the income statement. The assumptions adopted for the Group's pension schemes are set out in Note 4 on the accounts, together with sensitivities of the balance sheet and income statement to changes in those assumptions.
A pension asset of £295 million and a liability of £2,579 million were recognised on the balance sheet at 31 December 2014 (2013 - asset £214 million, liability £3,210 million; 2012 - asset £144 million, liability £3,884 million).
Goodwill
The Group capitalises goodwill arising on the acquisition of businesses, as discussed in Accounting policy 6. The carrying value of goodwill as at 31 December 2014 was £6,264 million (2013 - £10,139 million; 2012 - £11,266 million).
Goodwill is the excess of the cost of an acquired business over the fair value of its net assets. Goodwill is not amortised but is tested for impairment annually or more frequently if events or changes in circumstances indicate that it might be impaired.
Impairment testing in accordance with Accounting policy 8 above inherently involves a number of judgmental areas: the preparation of cash flow forecasts for periods that are beyond the normal requirements of management reporting; the assessment of the discount rate appropriate to the business; estimation of the fair value of cash-generating units; and the valuation of their separable assets. The sensitivity of the assessment to changes in assumptions is discussed in Note 17 on page 394.
Provisions for liabilities
As set out in Note 22, at 31 December 2014 the Group recognised provisions for liabilities in respect of Payment Protection Insurance, £799 million (2013 - £926 million; 2012 - £895 million), Interest Rate Hedging Products, £424 million (2013 - £1,077 million; 2012 - £676 million), foreign exchange investigations £320 million (2013 and 2012 - nil), LIBOR investigations, nil (2013 - £416 million; 2012 - £381 million) and other regulatory proceedings and litigation, £1,988 million (2013 - £2,168 million; 2012 - £368 million). Provisions are liabilities of uncertain timing or amount, and are recognised when there is a present obligation as a result of a past event, the outflow of economic benefit is probable and the outflow can be estimated reliably. Judgement is involved in determining whether an obligation exists, and in estimating the probability, timing and amount of any outflows. Where the Group can look to another party such as an insurer to pay some or all of the expenditure required to settle a provision, any reimbursement is recognised when, and only when, it is virtually certain that it will be received.
Payment Protection Insurance - the Group has established a provision for redress payable in respect of the mis-selling of Payment Protection Insurance policies. The provision is management’s best estimate of the anticipated costs of redress and related administration expenses. The determination of appropriate assumptions to underpin the provision requires significant judgement by management. The principal assumptions underlying the provision together with sensitivities to changes in those assumptions are given in Note 22.
Interest Rate Hedging Products - following an industry-wide review conducted in 2012 in conjunction with the Financial Services Authority (now being dealt with by the Financial Conduct Authority (FCA)), the Group agreed to provide redress to customers in relation to certain interest rate hedging products sold to small and medium-sized businesses classified as retail clients under FSA rules. There remain uncertainties over the eventual cost of redress, including any consequential loss claims. Estimating the liability depends on a number of assumptions. These are discussed in Note 22.
Provisions for litigation - the Group and members of the Group are party to legal proceedings in the United Kingdom, the United States and other jurisdictions, arising out of their normal business operations. The measurement and recognition of liabilities in respect of litigation involves a high degree of management judgement. Before the existence of a present obligation as the result of a past event can be confirmed, numerous facts may need to be established, involving extensive and time-consuming discovery, and novel or unsettled legal questions addressed. Once it is determined there is an obligation, assessing the probability of economic outflows and estimating the amount of any liability can be very difficult. In many proceedings, it is not possible to determine whether any loss is probable or to estimate the amount of any loss. Furthermore, for an individual matter, there can be a wide range of possible outcomes and often it is not practicable to quantify a range of such outcomes. The Group’s outstanding litigation is periodically assessed in consultation with external professional advisers, where appropriate, to determine the likelihood of the Group incurring a liability. A detailed description of the Group’s material legal proceedings and a discussion of the nature of the associated uncertainties are given in Note 32.
Tax contingencies - determining the Group’s income tax charge and its provisions for income taxes necessarily involves a significant degree of estimation and judgement. The tax treatment of some transactions is uncertain and tax computations are yet to be agreed with the tax authorities in a number of jurisdictions. The Group recognises anticipated tax liabilities based on all available evidence and, where appropriate, in the light of external advice. Any difference between the final outcome and the amounts provided will affect current and deferred income tax assets and liabilities in the period when the matter is resolved.
Deferred tax
The Group makes provision for deferred tax on temporary differences where tax recognition occurs at a different time from accounting recognition. Deferred tax assets of £1,540 million were recognised as at 31 December 2014 (2013 - £3,478 million; 2012 - £3,443 million).
The Group has recognised deferred tax assets in respect of losses, principally in the UK, and temporary differences. Deferred tax assets are recognised in respect of unused tax losses and other temporary differences to the extent that it is probable that there will be future UK taxable profits against which the losses and other temporary differences can be utilised. The Group has considered the carrying value of the deferred tax asset as at 31 December 2014 and concluded that it is recoverable based on future projections. Deferred tax assets of £5,738 million (2013 - £4,942 million; 2012 - £3,827 million) have not been recognised in respect of tax losses and other temporary differences where the availability of future taxable profits is uncertain. Further details about the Group’s deferred tax assets are given in Note 23.
Loan impairment provisions
The Group's loan impairment provisions are established to recognise incurred impairment losses in its portfolio of loans classified as loans and receivables and carried at amortised cost in accordance with Accounting policy 15. A loan is impaired when there is objective evidence that events since the loan was granted have affected expected cash flows from the loan. Such objective evidence, indicative that a borrower’s financial condition has deteriorated, can include for loans that are individually assessed: the non-payment of interest or principal; debt renegotiation; probable bankruptcy or liquidation; significant reduction in the value of any security; breach of limits or covenants; and deteriorating trading performance and, for collectively assessed portfolios: the borrowers’ payment status and observable data about relevant macroeconomic measures.
The impairment loss is the difference between the carrying value of the loan and the present value of estimated future cash flows at the loan's original effective interest rate.
At 31 December 2014, loans and advances to customers classified as loans and receivables totalled £307,971 million (2013 - £364,772 million; 2012 - £397,846 million) and customer loan impairment provisions amounted to £17,460 million (2013 - £25,153 million; 2012 - £21,136 million). Customer loan impairment releases in 2014 amounted to £1,354 million (2013 - £8,120 million losses; 2012 - £5,031 million losses). The losses in 2013 include loan impairment provisions in respect of loans transferred to RBS Capital Resolution Group. These loans are expected to be exited within three years and impairment provisions in respect of these loans have been reassessed in the light of this change in recovery strategy.
There are two components to the Group's loan impairment provisions: individual and collective.
Individual component - all impaired loans that exceed specific thresholds are individually assessed for impairment. Individually assessed loans principally comprise the Group's portfolio of commercial loans to medium and large businesses. Impairment losses are recognised as the difference between the carrying value of the loan and the discounted value of management's best estimate of future cash repayments and proceeds from any security held. These estimates take into account the customer's debt capacity and financial flexibility; the level and quality of its earnings; the amount and sources of cash flows; the industry in which the counterparty operates; and the realisable value of any security held. Estimating the quantum and timing of future recoveries involves significant judgement. The size of receipts will depend on the future performance of the borrower and the value of security, both of which will be affected by future economic conditions; additionally, collateral may not be readily marketable. The actual amount of future cash flows and the date they are received may differ from these estimates and consequently actual losses incurred may differ from those recognised in these financial statements.
Collective component - this is made up of two elements: loan impairment provisions for impaired loans that are below individual assessment thresholds (collectively assessed provisions) and for loan losses that have been incurred but have not been separately identified at the balance sheet date (latent loss provisions). Collectively assessed provisions are established on a portfolio basis using a present value methodology taking into account the level of arrears, security, past loss experience, credit scores and defaults based on portfolio trends. The most significant factors in establishing these provisions are the expected loss rates and the related average life. These portfolios include mortgages, credit card receivables and other personal lending. The future credit quality of these portfolios is subject to uncertainties that could cause actual credit losses to differ materially from reported loan impairment provisions. These uncertainties include the economic environment, notably interest rates and their effect on customer spending, the unemployment level, payment behaviour and bankruptcy trends. Latent loss provisions are held against estimated impairment losses in the performing portfolio that have yet to be identified as at the balance sheet date. To assess the latent loss within its portfolios, the Group has developed methodologies to estimate the time that an asset can remain impaired within a performing portfolio before it is identified and reported as such.
Fair value - financial instruments
In accordance with Accounting policies 14, 16 and 23, financial instruments classified as held-for-trading or designated as at fair value through profit or loss and financial assets classified as available-for-sale are recognised in the financial statements at fair value. All derivatives are measured at fair value.
Fair value is the price that would be received to sell an asset or paid to transfer a liability in an orderly transaction between market participants at the measurement date. A fair value measurement takes into account the characteristics of the asset or liability if market participants would take those characteristics into account when pricing the asset or liability at the measurement date. It also uses the assumptions that market participants would use when pricing the asset or liability. In determining fair value the Group maximises the use of relevant observable inputs and minimises the use of unobservable inputs.
Where the Group manages a group of financial assets and financial liabilities on the basis of its net exposure to either market risks or credit risk, it measures the fair value of a group of financial assets and financial liabilities on the basis of the price that it would receive to sell a net long position (i.e. an asset) for a particular risk exposure or to transfer a net short position (i.e. a liability) for a particular risk exposure in an orderly transaction at the measurement date under current market conditions.
Credit valuation adjustments are made when valuing derivative financial assets to incorporate counterparty credit risk. Adjustments are also made when valuing financial liabilities measured at fair value to reflect the Group’s own credit standing.
Where the market for a financial instrument is not active, fair value is established using a valuation technique. These valuation techniques involve a degree of estimation, the extent of which depends on the instrument’s complexity and the availability of market-based data. Further details about the Group’s valuation methodologies and the sensitivity to reasonably possible alternative assumptions of the fair value of financial instruments valued using techniques where at least one significant input is unobservable are given in Note 11 on pages 371 to 383.
Accounting developments
International Financial Reporting Standards
A number of IFRSs and amendments to IFRS were in issue at 31 December 2014 that would affect RBS from 1 January 2015 or later.
Effective for 2015
IAS 19 ‘Defined Benefit Plans: Employee Contributions’ was issued in November 2013. This amendment distinguishes the accounting for employee contributions that are related to service from that for those that are independent of service.
Annual Improvements to IFRS 2010 - 2012 and 2011 - 2013 cycles were issued in December 2013 making a number of minor amendments to IFRS.
Implementation of these changes is not expected to have a material effect on the Group’s financial statements.
Effective after 2015
In July 2014 the IASB published IFRS 9 ‘Financial Instruments’. IFRS 9 replaces the current financial instruments standard IAS 39, setting out new accounting requirements in a number of areas. First, there are revisions to the classification and measurement of financial instruments. There are new restrictions on the ability to account for financial assets at amortised cost and a prohibition on the bifurcation of embedded derivatives from financial assets. Accounting for financial liabilities is largely unchanged except for the treatment of changes in the fair value of liabilities designated as at fair value through profit or loss attributable to own credit risk; these are recognised in other comprehensive income. Secondly, there are amended requirements for hedge accounting designed to align the accounting more closely to the risk management framework and remove or simplify some of the rule-based requirements of IAS 39. The basic mechanics of hedge accounting: fair value, cash flow and net investment hedges are retained. Finally, there is a new approach to credit impairment provisions moving from IAS 39’s incurred loss model to an expected loss model. An expected loss model will result in the recognition of credit impairment losses earlier than an incurred loss model. Subject to EU endorsement, IFRS 9 is applicable for periods beginning on or after 1 January 2018.
IFRS 9 makes major and fundamental changes to accounting for financial instruments. The Group is continuing its assessment of its effect on the Group’s financial statements.
IFRS 15 ‘Revenue from Contracts with Customers’ was issued in May 2014. It will replace IAS 11 ‘Construction Contracts’, IAS 18 ‘Revenue’ and several Interpretations. Contracts are bundled or unbundled into distinct performance obligations with revenue recognised as the obligations are met. It is effective from 1 January 2017.
‘Accounting for Acquisitions of interests in Joint Operations’ issued in May 2014 amends IFRS 11 ‘Joint Arrangements’ to clarify that the donor of assets and liabilities to a joint operation should hold its continuing interest in them at the lower of cost and recoverable amount. The effective date is 1 January 2016.
‘Clarification of Acceptable Methods of Depreciation and Amortisation’ issued in May 2014 amends IAS 16 ‘Property, Plant and Equipment’ and IAS 38 ‘Intangible Assets’ requiring amortisation to be based on the consumption of an asset, introducing a rebuttable presumption that this is not achieved by an amortisation profile aligned to revenue. The effective date is 1 January 2016.
Annual Improvements to IFRS 2012 - 2014 cycle was issued in September 2014 making a number of minor amendments to IFRS. Its effective date is 1 January 2016.
Amendments to IFRS 10 ‘Consolidated Financial Statements’, IFRS 12 ‘Disclosure of Interests in Other Entities’ and IAS 28 ‘Investments in Associates and Joint Ventures’ were issued in September 2014 to clarify the accounting for sales between an investor, its associate or joint ventures, and in December 2014 to clarify the application of the investment entity consolidation exception. The effective date of these amendments is 1 January 2016.
An amendment to IAS 1 ‘Presentation of Financial Statements’ was issued in December 2014 to clarify the application of materiality to financial statements. Its effective date is 1 January 2016.
The Group is assessing the effects of these new standards.
Notes on the consolidated accounts
| 1 Net interest income | | | |
| | 2014 £m | 2013 £m | 2012 £m |
| Loans and advances to customers | 12,339 | 13,165 | 14,120 |
| Loans and advances to banks | 367 | 433 | 496 |
| Debt securities | 373 | 890 | 1,467 |
| Interest receivable | 13,079 | 14,488 | 16,083 |
| | | | |
| Customer accounts: demand deposits | 598 | 664 | 828 |
| Customer accounts: savings deposits | 731 | 1,299 | 1,523 |
| Customer accounts: other time deposits | 440 | 719 | 934 |
| Deposits by banks | 75 | 277 | 413 |
| Debt securities in issue | 1,010 | 1,306 | 2,023 |
| Subordinated liabilities | 876 | 877 | 807 |
| Internal funding of trading businesses | 91 | 329 | 199 |
| Interest payable | 3,821 | 5,471 | 6,727 |
| | | | |
| Net interest income | 9,258 | 9,017 | 9,356 |
Notes on the consolidated accounts
| 2 Non-interest income | | | |
| | 2014 | 2013 | 2012 |
| | £m | £m | £m |
| Fees and commissions receivable | | | |
| Payment services | 989 | 1,090 | 996 |
| Credit and debit card fees | 822 | 892 | 892 |
| Lending (credit facilities) | 1,250 | 1,291 | 1,389 |
| Brokerage | 321 | 397 | 479 |
| Investment management | 391 | 434 | 455 |
| Trade finance | 280 | 269 | 282 |
| Other | 361 | 305 | 405 |
| | 4,414 | 4,678 | 4,898 |
| | | | |
| Fees and commissions payable | | | |
| Banking | (875) | (923) | (818) |
| | | | |
Income from trading activities (1) | | | |
| Foreign exchange | 849 | 821 | 619 |
| Interest rate | 339 | 515 | 1,753 |
| Credit | 284 | 998 | 735 |
| Changes in fair value of own debt and derivative liabilities attributable to own credit | | | |
- debt securities in issue | 44 | 131 | (1,473) |
- derivative liabilities | (84) | (96) | (340) |
| Equities and other | (147) | 202 | 165 |
| | 1,285 | 2,571 | 1,459 |
| | | | |
| Gain on redemption of own debt | 20 | 175 | 454 |
| | | | |
| Other operating income | | | |
| Operating lease and other rental income | 380 | 484 | 876 |
| Changes in the fair value of own debt designated as at fair value through profit or loss attributable | | | |
to own credit risk (2) | | | |
- debt securities in issue | (89) | (49) | (2,531) |
- subordinated liabilities | (17) | (106) | (305) |
| Other changes in the fair value of financial assets and liabilities designated as at fair value through profit | | | |
| or loss and related derivatives | 83 | (26) | 153 |
| Changes in the fair value of investment properties | (25) | (281) | (153) |
| Profit on sale of securities | 227 | 737 | 1,039 |
| Profit on sale of property, plant and equipment | 137 | 35 | 32 |
| Profit on sale of subsidiaries and associates | 192 | 168 | 95 |
| Dividend income | 30 | 67 | 37 |
| Share of profits of associated entities | 126 | 320 | 29 |
Other income (3) | 4 | (130) | 94 |
| | 1,048 | 1,219 | (634) |
| (1) | The analysis of income from trading activities is based on how the business is organised and the underlying risks managed. Income from trading activities comprises gains and losses on financial instruments held for trading, both realised and unrealised, interest income and dividends and the related funding costs. The types of instruments include: |
| | - Foreign exchange: spot foreign exchange contracts, currency swaps and options, emerging markets and related hedges and funding. |
| | - Interest rate: interest rate swaps, forward foreign exchange contracts, forward rate agreements, interest rate options, interest rate futures and related hedges and funding. |
| | - Credit: asset-backed securities, corporate bonds, credit derivatives and related hedges and funding. |
| | - Equities: equities, equity derivatives and related hedges and funding. |
| | - Commodities: commodities, commodity contracts and related hedges and funding. |
| (2) | Measured as the change in fair value from movements in the year in the credit risk premium payable by RBS. |
| (3) | Includes income from activities other than banking. |
Notes on the consolidated accounts
| 3 Operating expenses | | | |
| | 2014 | 2013 | 2012 |
| | £m | £m | £m |
| Salaries | 3,503 | 3,661 | 4,008 |
| Variable compensation | 408 | 548 | 670 |
| Temporary and contract costs | 526 | 650 | 699 |
| Social security costs | 379 | 422 | 500 |
| Share-based compensation | 43 | 49 | 126 |
| Pension costs | | | |
- defined benefit schemes (see Note 4) | 462 | 508 | 514 |
- curtailment and settlement gains (see Note 4) | — | (7) | (13) |
- defined contribution schemes | 87 | 76 | 29 |
| Severance | 196 | 69 | 426 |
| Other | 153 | 110 | 191 |
| Staff costs | 5,757 | 6,086 | 7,150 |
| | | | |
| Premises and equipment | 2,081 | 2,038 | 1,951 |
| Other administrative expenses | 4,568 | 6,692 | 4,929 |
| | | | |
| Property, plant and equipment (see Note 18) | 671 | 759 | 987 |
| Intangible assets (see Note 17) | 259 | 488 | 616 |
| Depreciation and amortisation | 930 | 1,247 | 1,603 |
| | | | |
| Write down of goodwill and other intangible assets (see Note 17) | 523 | 1,403 | 124 |
| | 13,859 | 17,466 | 15,757 |
| | | | |
Other administrative expenses include:
| · | Payment Protection Insurance costs, Interest Rate Hedging Products redress and related costs, and other litigation and conduct costs. Further details are provided in Note 22. |
| · | The UK bank levy, which was charged at a rate of 0.156% on chargeable liabilities in excess of £20 billion, and amounted to £250 million for 2014 (2013 - 0.13%, £200 million; 2012 - 0.088%, £175 million). |
Integration, restructuring and divestment costs
Included in operating expenses are the following integration, restructuring and divestment costs.
| | | | | | Continuing | Discontinued | |
| | Staff | Premises | Other | Depreciation | operations | operations | Total |
| | £m | £m | £m | £m | £m | £m | £m |
| Restructuring | | | | | | | |
| 2014 | 261 | 266 | 268 | 3 | 798 | 103 | 901 |
| 2013 | 191 | 112 | 164 | 6 | 473 | 24 | 497 |
| 2012 | 699 | 148 | 256 | 142 | 1,245 | 49 | 1,294 |
| | | | | | | | |
| Divestment | | | | | | | |
| 2014 | 120 | 3 | 233 | — | 356 | — | 356 |
| 2013 | 86 | 2 | 77 | — | 165 | — | 165 |
| 2012 | 111 | (2) | 62 | — | 171 | 85 | 256 |
| | | | | | | | |
| Integration | | | | | | | |
| 2014 | — | — | — | — | — | — | — |
| 2013 | — | 1 | 1 | — | 2 | — | 2 |
| 2012 | — | (2) | 2 | — | — | — | — |
Notes on the consolidated accounts
The average number of persons employed, rounded to the nearest hundred, in continuing operations during the year, excluding temporary staff, was 92,800 (2013 - 97,900; 2012 - 103,600); on the same basis there were 18,200 people employed in discontinued operations (2013 - 22,900; 2012 - 34,800). The average number of temporary employees during 2014 was 8,100 (2013 - 9,800; 2012 - 10,100). The number of persons employed in continuing operations at 31 December, excluding temporary staff, by reportable segment (see Note 38 for more details), were as follows:
| | 2014 | 2013* | 2012* |
| UK Personal & Business Banking | 26,700 | 28,500 | 30,500 |
| Ulster Bank | 4,400 | 4,700 | 4,400 |
| Personal & Business Banking | 31,100 | 33,200 | 34,900 |
| Commercial Banking | 6,100 | 7,000 | 6,700 |
| Private Banking | 3,500 | 3,600 | 3,600 |
| Commercial & Private Banking | 9,600 | 10,600 | 10,300 |
| Corporate & Institutional Banking | 3,600 | 4,500 | 4,900 |
| Centre | 10,500 | 11,200 | 11,700 |
| RCR | 600 | n/a | n/a |
| Non-Core | n/a | 1,000 | 2,700 |
| Services | 34,200 | 35,200 | 34,800 |
| Integration and restructuring | 100 | 200 | 500 |
| Total | 89,700 | 95,900 | 99,800 |
| | | | |
| UK | 63,400 | 68,700 | 71,200 |
| USA | 2,000 | 2,400 | 2,900 |
| Europe | 7,400 | 8,400 | 9,200 |
| Rest of the World | 16,900 | 16,400 | 16,500 |
| Total | 89,700 | 95,900 | 99,800 |
| | | | |
| *Restated | | | |
| | | | |
| There were 17,400 people employed in discontinued operations at 31 December 2014 (2013 - 19,000; 2012 - 33,700). |
Share-based payments
As described in the Remuneration report on page 91, the Group grants share-based awards to employees principally on the following bases:
| Award plan | Eligible employees | Nature of award (1) | Vesting conditions (2) | Settlement |
| Sharesave | UK, Republic of Ireland, Channel Islands, Gibraltar and Isle of Man | Option to buy shares under employee savings plan | Continuing employment or leavers in certain circumstances | 2015 to 2020 |
| Deferred performance awards | All | Awards of ordinary shares | Continuing employment or leavers in certain circumstances | 2015 to 2018 |
Long-term incentives (3) | Senior employees | Awards of conditional shares or share options | Continuing employment or leavers in certain circumstances and/or achievement of performance conditions | 2019 to 2020 |
| (1) | Awards are equity-settled unless international comparability is better served by cash-settled awards. |
| (2) | All awards have vesting conditions and therefore some may not vest. |
| (3) | Long-term incentives include the Executive Share Option Plan, the Long-Term Incentive Plan and the Medium-Term Performance Plan. |
Notes on the consolidated accounts
| Sharesave | 2014 | | 2013 | | 2012 |
| | Average exercise price £ | Shares under option (million) | | Average exercise price £ | Shares under option (million) | | Average exercise price £ | Shares under option (million) |
| At 1 January | 2.90 | 62 | | 2.86 | 57 | | 3.36 | 64 |
| Granted | 3.43 | 12 | | 2.96 | 13 | | 2.49 | 14 |
| Exercised | 2.34 | (6) | | 2.36 | — | | 2.37 | — |
| Cancelled | 3.61 | (17) | | 3.38 | (8) | | 3.76 | (21) |
| At 31 December | 2.85 | 51 | | 2.90 | 62 | | 2.86 | 57 |
The fair value of options granted in 2014 was determined using a pricing model that included: expected volatility of shares determined at the grant date based on historical volatility over a period of up to seven years; expected option lives that equal the vesting period; no dividends on equity shares; and risk-free interest rates determined from UK gilts with terms matching the expected lives of the options.
The strike price of options and the fair value on granting awards of fully paid shares is the average market price over the five trading days preceding grant date.
Options are exercisable within six months of vesting; 1.9 million options were exercisable at 31 December 2014 (2013 - 1.3 million; 2012 - 0.2 million). The weighted average share price at the date of exercise of options was £3.65 (2013 - £3.36; 2012 - £2.78). At 31 December 2014, exercise prices ranged from £2.33 to £39.27 (2013 and 2012 - £2.33 to £39.27) and the average contractual life was 3.7 years (2013 - 3.5 years; 2012 - 3.9 years). The fair value of options granted in 2014 was £18 million (2013 - £25 million; 2012 - £28 million).
| Deferred performance awards | 2014 | | 2013 | | 2012 |
| | Value at grant £m | Shares awarded (million) | | Value at grant £m | Shares awarded (million) | | Value at grant £m | Shares awarded (million) |
| At 1 January | 180 | 55 | | 261 | 73 | | 756 | 191 |
| Granted | 311 | 95 | | 113 | 36 | | 141 | 50 |
| Forfeited | (28) | (7) | | (48) | (14) | | (98) | (25) |
| Vested | (170) | (51) | | (146) | (40) | | (538) | (143) |
| CFG awards | (21) | (7) | | — | — | | — | — |
| At 31 December | 272 | 85 | | 180 | 55 | | 261 | 73 |
| | | | | | | | | |
| The awards granted in 2014 vest evenly over the following three anniversaries. | | | | | | |
| | 2014 | | 2013 | | 2012 |
| | Value at grant £m | Shares awarded (million) | Options over shares (million) | | Value at grant £m | Shares awarded (million) | Options over shares (million) | | Value at grant £m | Shares awarded (million) | Options over shares (million) |
| At 1 January | 320 | 94 | 13 | | 375 | 98 | 20 | | 345 | 58 | 37 |
| Granted | 72 | 22 | — | | 109 | 35 | — | | 157 | 59 | — |
| Exercised | (61) | (14) | (5) | | (51) | (11) | (3) | | (15) | (4) | (1) |
| Lapsed | (85) | (22) | (1) | | (113) | (28) | (4) | | (112) | (15) | (16) |
| CFG awards | (32) | (11) | — | | — | — | — | | — | — | — |
| At 31 December | 214 | 69 | 7 | | 320 | 94 | 13 | | 375 | 98 | 20 |
In conjunction with the Initial Public Offering of Citizens Financial Group, Inc. (CFG), incentive awards of over 11 million RBSG shares and a convertible bond were replaced with awards of over 3 million CFG shares having the same market value.
The market value of awards exercised in 2014 was £44 million (2013 - £37 million; 2012 - £10 million). There are vested options over 7 million shares exercisable up to 2019 (2013 - 13 million; 2012 - 18 million).
At 31 December 2014, a provision of £1 million had been made in respect of 0.1 million options over shares that may be cash-settled (2013 - £1 million in respect of 0.1 million share awards; 2012 - £1 million in respect of 0.1 million share awards and 0.3 million options over shares).
Notes on the consolidated accounts
| Variable compensation awards | | | | | | | |
The following tables analyse Group and CIB variable compensation awards for 2014(1). |
| | Group | | CIB |
| | 2014 £m | 2013 £m | Change % | | 2014 £m | 2013 £m | Change % |
Non-deferred cash awards (2) | 66 | 62 | 6 | | 5 | 7 | (29) |
| Total non-deferred variable compensation | 66 | 62 | 6 | | 5 | 7 | (29) |
| Deferred bond awards | 168 | 168 | — | | 30 | 47 | (36) |
| Deferred share awards | 187 | 306 | (39) | | 79 | 191 | (59) |
| Total deferred variable compensation | 355 | 474 | (25) | | 109 | 238 | (54) |
Total variable compensation (3) | 421 | 536 | (21) | | 114 | 245 | (53) |
| | | | | | | | |
Variable compensation as a % of operating profit (4) | 6% | 24% | | | 23% | 30% | |
| Proportion of variable compensation that is deferred | 84% | 88% | | | 96% | 97% | |
| Of which | | | | | | | |
| - deferred bond awards | 47% | 35% | | | 28% | 20% | |
| - deferred share awards | 53% | 65% | | | 72% | 80% | |
| Reconciliation of variable compensation awards to income statement charge | 2014 £m | 2013 £m | 2012 £m |
| Variable compensation awarded | 421 | 536 | 636 |
| Less: deferral of charge for amounts awarded for current year | (150) | (230) | (252) |
| Income statement charge for amounts awarded in current year | 271 | 306 | 384 |
| | | | |
| Add: current year charge for amounts deferred from prior years | 201 | 279 | 342 |
| Less: forfeiture of amounts deferred from prior years | (64) | (37) | (56) |
| Income statement charge for amounts deferred from prior years | 137 | 242 | 286 |
| | | | |
Income statement charge for variable compensation (3) | 408 | 548 | 670 |
| | Actual | | Expected |
| Year in which income statement charge is expected to be taken for deferred variable compensation | 2012 £m | 2013 £m | 2014 £m | | 2015 £m | 2016 and beyond £m |
| Variable compensation deferred from 2012 and earlier | 401 | 289 | 42 | | 20 | 2 |
| Variable compensation deferred from 2013 | — | — | 162 | | 44 | 21 |
| Less: clawback of variable compensation deferred from prior years | (59) | (10) | (3) | | — | — |
| Less: forfeiture of amounts deferred from prior years | (56) | (37) | (64) | | — | — |
| Variable compensation for 2014 deferred | — | — | — | | 123 | 28 |
| | 286 | 242 | 137 | | 187 | 51 |
| (1) | The tables above relate to continuing businesses only; variable compensation relating to discontinued businesses in 2014 totalled £62 million (2013 - £40 million). |
| (2) | Cash payments to all employees are limited to £2,000. |
| (3) | Excludes other performance related compensation. |
| (4) | Reported operating profit excluding Citizens Financial Group before variable compensation expense and one-off and other items. 2013 also excludes the impact of the creation of RCR. |
Notes on the consolidated accounts
4 Pensions
The Group sponsors a number of pension schemes in the UK and overseas.
The Royal Bank of Scotland Group Pension Fund (the “Main scheme”) operates under UK trust law and is managed and administered on behalf of its members in accordance with the terms of the trust deed, the scheme rules and UK legislation (principally the Pension Schemes Act 1993, the Pensions Act 1995 and the Pensions Act 2004). Under UK legislation a defined benefit pension scheme is required to meet the statutory funding objective of having sufficient and appropriate assets to cover its liabilities. Pension fund trustees are required to: prepare a statement of funding principles; obtain regular actuarial valuations and reports; put in place a recovery plan addressing any funding shortfall; and send regular summary funding statements to members of the scheme.
The Main scheme corporate trustee is RBS Pension Trustee Limited (RBSPT), a wholly owned subsidiary of National Westminster Bank Plc. RBSPT is the legal owner of the Main scheme assets which are held separately from the assets of the Group. The Board of RBSPT comprises four trustee directors nominated by members selected from eligible active staff and pensioner members who apply and six appointed by the Group. The Board is responsible for operating the scheme in line with its formal rules and pensions law. It has a duty to act in the best interests of all scheme members, including pensioners and those who are no longer employed by the Group, but who still have benefits in the scheme.
Similar governance principles apply to the Group’s other pension schemes, although different legislative frameworks apply to the Group’s overseas schemes.
The Main scheme, accounting for 87% (2013 - 86%; 2012 - 85%) of the Group’s retirement benefit obligations, was closed to new entrants in 2006. Since 2009, pensionable salary increases in the Main scheme and certain other UK and Irish schemes have been limited to 2% per annum or CPI inflation if lower. Also, with effect from 1 October 2012, the normal pension age for future benefits was increased to 65 unless members elected to make a contribution to maintain a normal pension age of 60.
The Group’s defined benefit schemes generally provide a pension of one-sixtieth of final pensionable salary for each year of service prior to retirement up to a maximum of 40 years. Employees making additional contributions can secure additional benefits.
Since October 2006, new UK entrants may join The Royal Bank of Scotland Retirement Savings Plan, a defined contribution pension scheme.
The Group also provides post-retirement benefits other than pensions, principally through subscriptions to private healthcare schemes in the UK and the US and unfunded post-retirement benefit plans. Provision for the costs of these benefits is charged to the income statement over the average remaining future service lives of eligible employees. The amounts are not material.
Interim valuations of the Group’s schemes under IAS 19 ‘Employee Benefits’ were prepared at 31 December with the support of independent actuaries, using the following assumptions:
| | Main scheme | | All schemes |
| Principal actuarial assumptions (weighted average) | 2014 % | 2013 % | 2012 % | | 2014 % | 2013 % | 2012 % |
Discount rate (1) | 3.7 | 4.7 | 4.5 | | 3.6 | 4.5 | 4.4 |
Expected return on plan assets (1) | 3.7 | 4.7 | 4.5 | | 3.6 | 4.5 | 4.4 |
| Rate of increase in salaries | 1.8 | 1.8 | 1.8 | | 1.8 | 1.8 | 1.7 |
| Rate of increase in pensions in payment | 2.8 | 3.1 | 2.8 | | 2.7 | 2.9 | 2.6 |
| Inflation assumption | 3.0 | 3.3 | 2.9 | | 2.8 | 3.2 | 2.8 |
| (1) | The discount rate and the expected return on plan assets for the Main scheme as at 31 December 2013 was 4.65%. |
Notes on the consolidated accounts
Discount rate
The Group discounts its defined benefit pension obligations at discount rates determined by reference to the yield on ‘high quality’ corporate bonds.
The sterling yield curve (applied to 91% of the Group’s defined benefit obligations) is constructed by reference to yields on ‘AA’ corporate bonds from which a single discount rate is derived based on a cash flow profile similar in structure and duration to the pension obligations. Significant judgement is required when setting the criteria for bonds to be included in the population from which the yield curve is derived. The criteria include issue size, quality of pricing and the exclusion of outliers. Judgement is also required in determining the shape of the yield curve at long durations: a constant credit spread relative to gilts is assumed.
Discount rates for other currencies are derived using a variety of methodologies. In the case of US dollar defined benefit obligations, a matching portfolio of high-quality ‘AA’ corporate bonds is used for the first 30 years’ cash flows; cash flows beyond 30 years are discounted using a yield curve determined in a similar way to the UK. For euro defined benefit obligations, a similar approach to the UK has been used at 31 December 2014. However, at longer durations, rates are derived by extrapolating yields on ‘A’ and ‘AAA’ corporate bonds to derive equivalent ‘AA’ yields.
| | Main scheme | | All schemes |
| Major classes of plan assets as a percentage of total plan assets | 2014 % | 2013 % | 2012 % | | 2014 % | 2013 % | 2012 % |
| Quoted assets | | | | | | | |
| Quoted equities | | | | | | | |
| - Consumer industry | 4.3 | 4.2 | 4.2 | | 5.5 | 4.3 | 4.4 |
| - Manufacturing industry | 3.2 | 4.0 | 5.6 | | 2.8 | 4.1 | 6.0 |
| - Energy and utilities | 2.9 | 3.6 | 4.1 | | 2.7 | 3.6 | 4.4 |
| - Financial institutions | 3.9 | 3.9 | 4.1 | | 3.5 | 3.9 | 4.4 |
| - Technology and telecommunications | 4.2 | 4.7 | 4.9 | | 3.8 | 4.7 | 5.3 |
| - Other | 2.8 | 3.5 | 0.5 | | 4.6 | 3.7 | 0.5 |
| Private equity | 4.3 | 4.9 | 5.4 | | 3.8 | 4.4 | 4.7 |
| Index-linked bonds | 28.1 | 29.0 | 30.7 | | 26.6 | 28.3 | 28.7 |
| Government fixed interest bonds | 3.6 | 2.1 | 1.9 | | 5.0 | 2.2 | 2.9 |
| Corporate fixed interest bonds | 15.3 | 19.5 | 19.5 | | 15.6 | 19.6 | 19.5 |
| | | | | | | | |
| Unquoted assets | | | | | | | |
| Corporate and other bonds | 2.3 | 2.1 | 1.6 | | 2.0 | 1.9 | 1.5 |
| Hedge funds | 1.6 | 5.2 | 2.2 | | 1.5 | 5.1 | 2.5 |
| Real estate | 5.8 | 4.0 | 4.3 | | 5.5 | 4.0 | 4.2 |
| Derivatives | 10.6 | 3.0 | 2.2 | | 9.8 | 2.8 | 2.0 |
| Cash and other assets | 7.1 | 6.0 | 8.7 | | 7.3 | 7.1 | 9.0 |
| Equity exposure of equity futures | 1.3 | 8.0 | 9.0 | | 1.6 | 8.0 | 8.4 |
| Cash exposure of equity futures | (1.3) | (7.7) | (8.9) | | (1.6) | (7.7) | (8.4) |
| | 100.0 | 100.0 | 100.0 | | 100.0 | 100.0 | 100.0 |
Notes on the consolidated accounts
The assets of the Main scheme, which represent 88% of plan assets at 31 December 2014 (2013 and 2012 - 85%), are invested in a diversified portfolio of quoted and private equity, government and corporate fixed-interest and index-linked bonds, and other assets including property and hedge funds.
The Main scheme also employs derivative instruments, where appropriate, to achieve a desired asset class exposure or to match assets more closely to liabilities. The value of assets shown reflects the actual physical assets held by the scheme, with any derivative holdings valued on a mark-to-market basis.
| The Main scheme’s holdings of derivative instruments are summarised in the table below: |
| | 2014 | | 2013 | | 2012 |
| | Notional | Fair value | | Notional | Fair value | | Notional | Fair value |
| | amounts | Assets | Liabilities | amounts | Assets | Liabilities | amounts | Assets | Liabilities |
| | £m | £m | £m | | £m | £m | £m | | £m | £m | £m |
| Inflation rate swaps | 8,467 | 73 | 415 | | 6,273 | 258 | 141 | | 5,474 | 20 | 335 |
| Interest rate swaps | 23,858 | 6,055 | 3,305 | | 22,108 | 3,283 | 2,867 | | 19,304 | 3,424 | 2,811 |
| Total return swaps | 181 | 1 | — | | 187 | 1 | — | | 515 | 6 | — |
| Currency swaps | 782 | 223 | 191 | | 2,196 | 813 | 720 | | 2,539 | 326 | 259 |
| Credit default swaps | 875 | 427 | 435 | | 900 | 13 | 16 | | 709 | 11 | 12 |
| Equity and bond futures | 599 | 14 | 2 | | 1,904 | 71 | 2 | | 2,109 | 16 | 17 |
| Currency forwards | 8,562 | 2 | — | | 9,182 | 66 | — | | 8,551 | 41 | — |
| Equity and bond call options | 7,382 | 846 | 48 | | 4,102 | 108 | 63 | | 963 | 94 | — |
| Equity and bond put options | 7,409 | 1 | 61 | | 4,071 | 11 | 90 | | 963 | 13 | 31 |
The investment strategy of other schemes is similar to that of the Main scheme, adjusted to take account of the nature of liabilities, risk appetite of the trustees, size of the scheme and any local regulatory constraints. The use of derivative instruments outside the Main scheme is not material.
Swaps are part of the management of the inflation and interest rate sensitivity of the Main scheme liabilities. They have been executed at prevailing market rates and within standard market bid/offer spreads. The majority of swaps are with The Royal Bank of Scotland plc and National Westminster Bank Plc (the “banks”). At 31 December 2014, the gross notional value of the swaps was £34,163 million (2013 - £31,664 million; 2012 - £28,541 million) and had a net positive fair value of £2,433 million (2013 - £624 million; 2012 - £370 million).
Collateral is required on all swap transactions with those between the banks and the Main scheme on terms that do not allow the banks to re-hypothecate. The banks had delivered £2,908 million of collateral at 31 December 2014 (2013 - £633 million; 2012 - £521 million).
Ordinary shares of the company with a fair value of £2 million (2013 and 2012 - £4 million) and other financial instruments issued by the Group with a value of £2,172 million (2013 - £416 million; 2012 - £610 million) are held by the Main scheme.
| Post-retirement mortality assumptions (Main scheme) | 2014 | 2013 | 2012 |
| Longevity at age 60 for current pensioners (years) | | | |
| Males | 28.0 | 27.6 | 27.3 |
| Females | 30.0 | 29.5 | 29.2 |
| | | | |
| Longevity at age 60 for future pensioners currently aged 40 (years) | | | |
| Males | 29.3 | 28.6 | 29.4 |
| Females | 31.6 | 30.8 | 31.0 |
Notes on the consolidated accounts
| | Main scheme | | All schemes |
| Changes in value of net pension deficit | Fair value of plan assets £m | Present value of defined benefit obligation £m | Net pension deficit £m | | Fair value of plan assets £m | Present value of defined benefit obligation £m | Net pension deficit £m |
| At 1 January 2013 | 22,441 | 25,648 | 3,207 | | 26,370 | 30,110 | 3,740 |
| Currency translation and other adjustments | — | — | — | | 1 | 14 | 13 |
| Income statement | | | | | | | |
Net interest expense | 1,011 | 1,137 | 126 | | 1,173 | 1,317 | 144 |
Current service cost | | 296 | 296 | | | 372 | 372 |
Past service cost | | 15 | 15 | | | 1 | 1 |
| Gains on settlements | | — | — | | | (7) | (7) |
| | 1,011 | 1,448 | 437 | | 1,173 | 1,683 | 510 |
| Statement of comprehensive income | | | | | | | |
Return on plan assets above recognised interest income | 986 | — | (986) | | 1,097 | — | (1,097) |
Experience gains and losses | — | (102) | (102) | | — | (176) | (176) |
Actuarial gains and losses due to changes in financial assumptions | — | 562 | 562 | | — | 589 | 589 |
Actuarial gains and losses due to changes in demographic assumptions | — | 224 | 224 | | — | 238 | 238 |
| | 986 | 684 | (302) | | 1,097 | 651 | (446) |
| Contributions by employer | 656 | — | (656) | | 821 | — | (821) |
| Contributions by plan participants and other scheme members | — | — | — | | 14 | 14 | — |
| Benefits paid | (822) | (822) | — | | (988) | (988) | — |
| At 1 January 2014 | 24,272 | 26,958 | 2,686 | | 28,488 | 31,484 | 2,996 |
| Currency translation and other adjustments | — | — | — | | (60) | (85) | (25) |
| Income statement | | | | | | | |
Net interest expense | 1,137 | 1,234 | 97 | | 1,314 | 1,421 | 107 |
Current service cost | | 278 | 278 | | | 357 | 357 |
Past service cost | | 18 | 18 | | | 2 | 2 |
| | 1,137 | 1,530 | 393 | | 1,314 | 1,780 | 466 |
| Statement of comprehensive income | | | | | | | |
Return on plan assets above recognised interest income | 4,629 | — | (4,629) | | 5,171 | — | (5,171) |
Experience gains and losses | — | (3) | (3) | | — | (18) | (18) |
Actuarial gains and losses due to changes in financial assumptions | — | 3,757 | 3,757 | | — | 4,806 | 4,806 |
Actuarial gains and losses due to changes in demographic assumptions | — | 401 | 401 | | — | 491 | 491 |
| | 4,629 | 4,155 | (474) | | 5,171 | 5,279 | 108 |
| Contributions by employer | 906 | — | (906) | | 1,065 | — | (1,065) |
| Contributions by plan participants and other scheme members | — | — | — | | 5 | 5 | — |
| Benefits paid | (867) | (867) | — | | (1,030) | (1,030) | — |
| Transfer to disposal groups | — | — | — | | (594) | (790) | (196) |
| At 31 December 2014 | 30,077 | 31,776 | 1,699 | | 34,359 | 36,643 | 2,284 |
| Net pension deficit comprises | 2014 £m | 2013 £m | 2012 £m |
| Net assets of schemes in surplus (included in Prepayments, accrued income and other assets, Note 19) | (295) | (214) | (144) |
| Net liabilities of schemes in deficit | 2,579 | 3,210 | 3,884 |
| | 2,284 | 2,996 | 3,740 |
| The income statement charge comprises: | | | |
| | 2014 £m | 2013 £m | 2012 £m |
| Continuing operations | 462 | 501 | 501 |
| Discontinued operations | 4 | 9 | 16 |
| | 466 | 510 | 517 |
Notes on the consolidated accounts
The weighted average duration of the Main scheme’s defined benefit obligation at 31 December 2014 is 20.0 years (2013 - 18.0 years; 2012 - 19.2 years).
| The defined benefit obligation is attributable to the different classes of scheme members in the following proportions (Main scheme): |
| | | | |
| | 2014 | 2013 | 2012 |
| | % | % | % |
| Active | 18.8 | 19.5 | 23.8 |
| Deferred | 41.0 | 38.4 | 32.4 |
| Pensioner | 40.2 | 42.1 | 43.8 |
| | 100.0 | 100.0 | 100.0 |
Following the legal separation of ABN AMRO Bank N.V. on 1 April 2010, ABN AMRO’s principal pension scheme in the Netherlands was transferred to the State of the Netherlands. At 31 December 2009, this scheme had fair value of plan assets of £8.3 billion and present value of defined benefit obligations of £8.3 billion. The principal actuarial assumptions at 31 December 2009 were: discount rate 5.25%; expected return on plan assets (weighted average) 5.25%; rate of increase in salaries 2.5%; rate of increase in pensions in payment 2.0%; and inflation assumption 2.0%.
| | Main scheme | | All schemes |
| History of defined benefit schemes | 2014 £m | 2013 £m | 2012 £m | 2011 £m | 2010 £m | | 2014 £m | 2013 £m | 2012 £m | 2011 £m | 2010 £m |
| Fair value of plan assets | 30,077 | 24,272 | 22,441 | 21,111 | 19,110 | | 34,359 | 28,488 | 26,370 | 25,086 | 22,816 |
| Present value of defined benefit obligations | 31,776 | 26,958 | 25,648 | 22,955 | 21,092 | | 36,643 | 31,484 | 30,110 | 27,137 | 24,999 |
| Net deficit | 1,699 | 2,686 | 3,207 | 1,844 | 1,982 | | 2,284 | 2,996 | 3,740 | 2,051 | 2,183 |
| | | | | | | | | | | | |
| Experience gains/(losses) on plan liabilities | 3 | 102 | (232) | (208) | (858) | | 18 | 176 | (207) | (200) | (882) |
| Experience gains on plan assets | 4,629 | 986 | 301 | 935 | 1,830 | | 5,171 | 1,097 | 485 | 842 | 1,941 |
| Actual return on pension schemes assets | 5,766 | 1,997 | 1,329 | 1,966 | 2,779 | | 6,485 | 2,270 | 1,696 | 2,065 | 3,170 |
| Actual return on pension schemes assets - % | 23.8% | 8.9% | 6.3% | 10.3% | 16.7% | | 22.8% | 8.6% | 6.8% | 9.1% | 11.4% |
| | | | | | | | | | | | |
Triennial funding valuation
In May 2014, the triennial funding valuation of The Royal Bank of Scotland Group Pension Fund was agreed which showed that the value of the liabilities exceeded the value of assets by £5.6 billion at 31 March 2013, a ratio of 82%. To eliminate this deficit, RBS will pay annual contributions of £650 million from 2014 to 2016 and £450 million (indexed in line with inflation) from 2017 to 2023. These contributions are in addition to regular annual contributions of approximately £270 million in respect of the ongoing accrual of benefits as well as contributions to meet the expenses of running the scheme.
Notes on the consolidated accounts
The table below sets out the sensitivities of the pension cost for the year and the present value of defined benefit obligations at 31 December to a change in the principal actuarial assumptions:
| | Main scheme | | All schemes |
| | (Decrease)/increase | | (Decrease)/increase |
| | in pension cost for year | | in obligation at 31 December | | in pension cost for year | | in obligation at 31 December |
| | 2014 | 2013 | 2012 | | 2014 | 2013 | 2012 | | 2014 | 2013 | 2012 | | 2014 | 2013 | 2012 |
| | £m | £m | £m | | £m | £m | £m | | £m | £m | £m | | £m | £m | £m |
| 0.25% increase in the discount rate | (67) | (66) | (66) | | (1,466) | (1,187) | (1,199) | | (79) | (80) | (80) | | (1,695) | (1,379) | (1,392) |
| 0.25% increase in inflation | 55 | 52 | 60 | | 1,159 | 895 | 995 | | 63 | 58 | 66 | | 1,334 | 1,000 | 1,129 |
| 0.25% additional rate of increase in | | | | | | | | | | | | | | | |
pensions in payment | 43 | 42 | 39 | | 982 | 758 | 690 | | 49 | 48 | 45 | | 1,107 | 844 | 782 |
| 0.25% additional rate of increase in | | | | | | | | | | | | | | | |
deferred pensions | 21 | 18 | 20 | | 394 | 329 | 297 | | 24 | 21 | 23 | | 476 | 383 | 342 |
| 0.25% additional rate of increase in | | | | | | | | | | | | | | | |
salaries | 9 | 9 | 6 | | 100 | 83 | 95 | | 12 | 12 | 9 | | 131 | 110 | 125 |
| Longevity increase of one year | 39 | 35 | 33 | | 988 | 728 | 647 | | 42 | 39 | 38 | | 1,053 | 801 | 727 |
Pension costs and liabilities are calculated on the central assumptions and under the relevant sensitivity scenarios. The sensitivity to pension costs/liabilities is the difference between these calculations.
The sensitivity analysis presented above may not be representative of the actual change in the pension cost or defined benefit obligation as it is unlikely that the changes in assumptions would occur in isolation of one another as some of the assumptions may be correlated.
5 Auditor’s remuneration
Amounts paid to the Group's auditors for statutory audit and other services are set out below. All audit-related and other services are approved by the Group Audit Committee and are subject to strict controls to ensure the external auditor’s independence is unaffected by the provision of other services. The Group Audit Committee recognise that for certain assignments the auditors are best placed to perform the work economically; for other work the Group selects the supplier best placed to meet its requirements. The Group’s auditors are permitted to tender for such work in competition with other firms where the work is permissible under audit independence rules.
The analysis of auditor’s remuneration is as follows:
| | 2014 £m | 2013 £m |
| Fees payable for the audit of the Group’s annual accounts | 4.0 | 4.0 |
| Fees payable to the auditor and its associates for other services to the Group | | |
- the audit of the company’s subsidiaries | 24.2 | 22.1 |
- audit-related assurance services (1) | 4.8 | 3.8 |
| Total audit and audit-related assurance services fees | 33.0 | 29.9 |
| | | |
| Taxation compliance services | 0.3 | 0.2 |
| Taxation advisory services | 0.1 | 0.1 |
| Other assurance services | 1.6 | 2.8 |
Corporate finance services (2) | 1.7 | 0.8 |
| Consulting services | 0.1 | 0.2 |
| Total other services | 3.8 | 4.1 |
| | | |
| Total | 36.8 | 34.0 |
| (1) | Comprises fees of £0.9 million (2013 - £0.9 million) in relation to reviews of interim financial information, £2.5 million (2013 - £2.3 million) in respect of reports to the Group’s regulators in the UK and overseas, £0.3 million (2013 - £0.3 million) in respect of internal controls assurance and £1.1 million (2013 - £0.3 million) in relation to non-statutory audit opinions. |
| (2) | Comprises fees of £0.9 million (2013 - £0.8 million) in respect of work performed by the auditors as reporting accountants on debt and equity issuances undertaken by the Group, including securitisations and £0.8 million (2013 - nil) in respect of reporting accountant services in connection with disposals by the Group. |
Notes on the consolidated accounts
| 6 Tax | | | |
| | 2014 | 2013 | 2012 |
| | £m | £m | £m |
| Current tax | | | |
| Charge for the year | (423) | (315) | (487) |
| Over/(under) provision in respect of prior years | 247 | 120 | (62) |
| | (176) | (195) | (549) |
| Deferred tax | | | |
| (Charge)/credit for the year | (259) | 586 | 745 |
| Reduction in the carrying value of deferred tax assets | (1,472) | (701) | (394) |
| (Under)/over provision in respect of prior year | (2) | 124 | 42 |
| Tax charge for the year | (1,909) | (186) | (156) |
The actual tax charge differs from the expected tax (charge)/credit computed by applying the standard rate of UK corporation tax of 21.5% (2013 - 23.25%; 2012 - 24.5%) as follows:
| | 2014 | 2013 | 2012 |
| | £m | £m | £m |
| Expected tax (charge)/credit | (568) | 2,057 | 1,483 |
| Losses in year where no deferred tax asset recognised | (86) | (879) | (511) |
| Foreign profits taxed at other rates | 76 | (117) | (295) |
UK tax rate change impact (1) | — | (313) | (149) |
| Unrecognised timing differences | (3) | (8) | 59 |
| Non-deductible goodwill impairment | (28) | (247) | — |
| Items not allowed for tax | | | |
- losses on disposals and write-downs | (12) | (20) | (49) |
- UK bank levy | (54) | (47) | (43) |
- regulatory and legal actions | (182) | (144) | (93) |
- other disallowable items | (191) | (212) | (255) |
| Non-taxable items | | | |
| - gain on sale of Direct Line Insurance Group | 41 | — | — |
- gain on sale of WorldPay (Global Merchant Services) | — | 37 | — |
- gain on sale of RBS Aviation Capital | — | — | 26 |
- other non-taxable items | 79 | 153 | 84 |
| Taxable foreign exchange movements | 21 | (25) | (1) |
| Losses brought forward and utilised | 225 | 36 | 2 |
| (Reduction)/increase in carrying value of deferred tax asset in respect of: | | | |
| - UK losses | (850) | (701) | — |
| - US losses and temporary differences | (775) | — | — |
- Australia losses | — | — | (191) |
- Ireland losses | 153 | — | (203) |
Adjustments in respect of prior years (2) | 245 | 244 | (20) |
| Actual tax charge | (1,909) | (186) | (156) |
| (1) | In recent years the UK Government has steadily reduced the rate of UK corporation tax, with the latest enacted rates standing at 21% with effect from 1 April 2014 and 20% with effect from 1 April 2015. The closing deferred tax assets and liabilities have been calculated in accordance with the rates enacted at the balance sheet date. |
| (2) | Prior year tax adjustments include releases of tax provisions in respect of structured transactions and adjustments to reflect submitted tax computations in the UK and overseas. In addition, a prior year tax credit of £151 million has been recognised in 2014 in respect of tax losses arising in the Belfast Branch of Ulster Bank Ireland Limited reflecting UK tax law changes and European Court of Justice decisions on the surrender of tax losses. |
Notes on the consolidated accounts
| 7 Profit attributable to preference shareholders and paid-in equity holders | | | |
| | 2014 £m | 2013 £m | 2012 £m |
| Preference shareholders | | | |
| Non-cumulative preference shares of US$0.01 | 213 | 226 | 153 |
| Non-cumulative preference shares of €0.01 | 115 | 121 | 115 |
| Non-cumulative preference shares of £1 | 2 | 2 | 5 |
| | 330 | 349 | 273 |
| Paid-in equity holders | | | |
| Interest on securities classified as equity, net of tax | 49 | 49 | 28 |
Total (1) | 379 | 398 | 301 |
| (1) | Discretionary dividends on certain non-cumulative preference shares and discretionary distributions on certain innovative securities recommenced in May 2012. |
| (2) | Between 1 January 2015 and the date of approval of these accounts, dividends amounting to US$107 million and £0.4 million have been declared in respect of equity preference shares for payment on 31 March 2015. |
8 Ordinary dividends
The company did not pay an ordinary dividend in 2014, 2013 or 2012.
| 9 Earnings per ordinary and equivalent B share | | | |
| Earnings per ordinary and equivalent B share have been calculated based on the following: | | | |
| | 2014 £m | 2013 £m | 2012 £m |
| Earnings | | | |
| Loss attributable to ordinary and B shareholders | (3,470) | (8,995) | (6,055) |
| Loss/(profit) from discontinued operations attributable to ordinary and B shareholders | 3,527 | (521) | (430) |
| Profit/(loss) from continuing operations attributable to ordinary and B shareholders | 57 | (9,516) | (6,485) |
| | | | |
| Weighted average number of shares (millions) | | | |
| Ordinary shares outstanding during the year | 6,256 | 6,096 | 5,902 |
| Equivalent B shares in issue during the year | 5,100 | 5,100 | 5,100 |
| Weighted average number of ordinary shares and equivalent B shares outstanding during the year | 11,356 | 11,196 | 11,002 |
| Effect of dilutive share options and convertible securities | 91 | 115 | 105 |
| Diluted weighted average number of ordinary shares and equivalent B shares outstanding during the year | 11,447 | 11,311 | 11,107 |
Basic (loss)/earnings per ordinary and equivalent B share from discontinued operations was (31.1p) (2013 - 4.7p; 2012 - 3.9p). Diluted earnings per ordinary and equivalent B share from discontinued operations was 4.6p in 2013. There was no dilutive impact in 2014 or 2012.
At a General Meeting on 25 June 2014, the company’s independent shareholders approved an agreement between RBS and HM Treasury for the retirement of the Dividend Access Share (the DAS retirement agreement).
Prior to the DAS retirement agreement, the DAS was entitled to a dividend amounting to the greater of 7% of the aggregate issue price of B shares and 250% of the ordinary dividend rate multiplied by the number of B shares issued, less any dividends paid on the B shares and on ordinary shares issued on their conversion. When calculating earnings per share, IFRS requires profit or loss to be allocated to participating equity instruments as if all of the profit or loss for the period had been distributed.
Under the DAS retirement agreement, once RBS has paid dividends on the DAS totalling £1.5 billion, it will lose its preferential dividend rights and become a single B share. The dividends are payable at the discretion of the directors. The first DAS dividend of £320 million was paid in August 2014. Unpaid DAS dividends will be subject to an increase of 5% per annum from 1 January 2016 and an increase of 10% per annum from 1 January 2021.
These changes to the DAS agreement have re-characterised the DAS such that it is no longer a participating share; it is only entitled to total dividends of £1.5 billion, subject to increases after 1 January 2016. Consequently earnings per share for periods ended after 25 June 2014 only reflect DAS dividends recognised before the end of a reporting period; this amounted to £320 million in respect of the year ended 31 December 2014. Dividends can be paid on ordinary and B shares only once the remaining £1,180 million of retirement dividend, subject to increases as above, has been paid.
Notes on the consolidated accounts
10 Financial instruments - classification
The following tables analyse financial assets and liabilities in accordance with the categories of financial instruments in IAS 39. Assets and liabilities outside the scope of IAS 39 are shown separately.
| 2014 | Held-for- trading £m | Designated as at fair value through profit or loss £m | Hedging derivatives £m | Available- for-sale £m | Loans and receivables £m | Held-to- maturity £m | Amortised cost £m | Finance leases £m | Other assets/ liabilities £m | Total £m |
| Assets | | | | | | | | | | |
| Cash and balances at central banks | — | — | | — | 74,872 | — | | | | 74,872 |
| Loans and advances to banks | | | | | | | | | | |
- reverse repos | 18,129 | — | | — | 2,579 | — | | | | 20,708 |
- other (1) | 11,773 | — | | — | 11,254 | — | | | | 23,027 |
| Loans and advances to customers | | | | | | — | | | | |
- reverse repos | 43,018 | — | | — | 969 | — | | | | 43,987 |
- other | 23,038 | 61 | | — | 307,002 | — | | 4,150 | | 334,251 |
| Debt securities | 49,226 | 117 | | 29,673 | 3,096 | 4,537 | | | | 86,649 |
| Equity shares | 4,821 | 301 | | 513 | — | — | | | | 5,635 |
| Settlement balances | — | — | | — | 4,667 | | | | | 4,667 |
| Derivatives | 348,149 | | 5,441 | | | | | | | 353,590 |
| Intangible assets | | | | | | | | | 7,781 | 7,781 |
| Property, plant and equipment | | | | | | | | | 6,167 | 6,167 |
| Deferred tax | | | | | | | | | 1,540 | 1,540 |
| Prepayments, accrued income and | | | | | | | | | | |
other assets | — | — | | — | — | — | | | 5,878 | 5,878 |
| Assets of disposal groups | | | | | | | | | 82,011 | 82,011 |
| | 498,154 | 479 | 5,441 | 30,186 | 404,439 | 4,537 | | 4,150 | 103,377 | 1,050,763 |
| | | | | | | | | | | |
| Liabilities | | | | | | | | | | |
| Deposits by banks | | | | | | | | | | |
- repos | 23,990 | — | | | | | 869 | | | 24,859 |
- other (2) | 26,118 | — | | | | | 9,688 | | | 35,806 |
| Customer accounts | | | | | | | | | | |
- repos | 35,985 | — | | | | | 1,366 | | | 37,351 |
- other (3) | 15,308 | 4,731 | | | | | 334,249 | | | 354,288 |
Debt securities in issue (4) | 6,490 | 10,216 | | | | | 33,574 | | | 50,280 |
| Settlement balances | — | — | | | | | 4,503 | | | 4,503 |
| Short positions | 23,029 | — | | | | | | | | 23,029 |
| Derivatives | 346,184 | | 3,621 | | | | | | | 349,805 |
| Accruals, deferred income and | | | | | | | | | | |
other liabilities | — | — | | | | | 1,801 | — | 11,545 | 13,346 |
| Retirement benefit liabilities | | | | | | | | | 2,579 | 2,579 |
| Deferred tax | | | | | | | | | 500 | 500 |
| Subordinated liabilities | — | 863 | | | | | 22,042 | | | 22,905 |
| Liabilities of disposal groups | | | | | | | | | 71,320 | 71,320 |
| | 477,104 | 15,810 | 3,621 | | | | 408,092 | — | 85,944 | 990,571 |
| Equity | | | | | | | | | | 60,192 |
| | | | | | | | | | | 1,050,763 |
| For the notes to this table refer to page 368. | | | | | | | | | |
Notes on the consolidated accounts
| 2013 | Held-for- trading £m | Designated as at fair value through profit or loss £m | Hedging derivatives £m | Available- for-sale £m | Loans and receivables £m | Amortised cost £m | Finance leases £m | Other assets/ liabilities £m | Total £m |
| Assets | | | | | | | | | |
| Cash and balances at central banks | — | — | | — | 82,659 | | | | 82,659 |
| Loans and advances to banks | | | | | | | | | |
- reverse repos | 25,795 | — | | — | 721 | | | | 26,516 |
- other (1) | 9,952 | — | | — | 17,603 | | | | 27,555 |
| Loans and advances to customers | | | | | | | | | |
- reverse repos | 49,897 | — | | — | — | | | | 49,897 |
- other | 19,170 | 49 | | — | 364,772 | | 6,834 | | 390,825 |
| Debt securities | 56,582 | 122 | | 53,107 | 3,788 | | | | 113,599 |
| Equity shares | 7,199 | 400 | | 1,212 | — | | | | 8,811 |
| Settlement balances | — | — | | — | 5,591 | | | | 5,591 |
| Derivatives | 283,508 | | 4,531 | | | | | | 288,039 |
| Intangible assets | | | | | | | | 12,368 | 12,368 |
| Property, plant and equipment | | | | | | | | 7,909 | 7,909 |
| Deferred tax | | | | | | | | 3,478 | 3,478 |
| Prepayments, accrued income and | | | | | | | | | |
other assets | — | — | | — | — | | | 7,614 | 7,614 |
| Assets of disposal groups | | | | | | | | 3,017 | 3,017 |
| | 452,103 | 571 | 4,531 | 54,319 | 475,134 | | 6,834 | 34,386 | 1,027,878 |
| | | | | | | | | | |
| Liabilities | | | | | | | | | |
| Deposits by banks | | | | | | | | | |
- repos | 23,127 | — | | | | 5,523 | | | 28,650 |
- other (2) | 19,764 | — | | | | 15,565 | | | 35,329 |
| Customer accounts | | | | | | | | | |
- repos | 52,300 | — | | | | 4,184 | | | 56,484 |
- other (3) | 10,236 | 5,862 | | | | 398,298 | | | 414,396 |
Debt securities in issue (4) | 8,560 | 15,848 | | | | 43,411 | | | 67,819 |
| Settlement balances | — | — | | | | 5,313 | | | 5,313 |
| Short positions | 28,022 | — | | | | | | | 28,022 |
| Derivatives | 281,299 | | 4,227 | | | | | | 285,526 |
| Accruals, deferred income and other | | | | | | | | | |
liabilities | — | — | | | | 1,764 | 19 | 14,234 | 16,017 |
| Retirement benefit liabilities | | | | | | | | 3,210 | 3,210 |
| Deferred tax | | | | | | | | 507 | 507 |
| Subordinated liabilities | — | 868 | | | | 23,144 | | | 24,012 |
| Liabilities of disposal groups | | | | | | | | 3,378 | 3,378 |
| | 423,308 | 22,578 | 4,227 | | | 497,202 | 19 | 21,329 | 968,663 |
| Equity | | | | | | | | | 59,215 |
| | | | | | | | | | 1,027,878 |
| For the notes to this table refer to the following page. | | | | |
Notes on the consolidated accounts
2012 | Held-for- trading £m | Designated as at fair value through profit or loss £m | Hedging derivatives £m | Available- for-sale £m | Loans and receivables £m | Amortised cost £m | Finance leases £m | Other assets/ liabilities £m | Total £m |
| Assets | | | | | | | | | |
| Cash and balances at central banks | — | — | | — | 79,290 | | | | 79,290 |
| Loans and advances to banks | | | | | | | | | |
- reverse repos | 33,394 | — | | — | 1,389 | | | | 34,783 |
- other (1) | 13,265 | — | | — | 15,903 | | | | 29,168 |
| Loans and advances to customers | | | | | | | | | |
- reverse repos | 70,025 | — | | — | 22 | | | | 70,047 |
- other | 24,841 | 189 | | — | 397,824 | | 7,234 | | 430,088 |
| Debt securities | 78,340 | 873 | | 73,737 | 4,488 | | | | 157,438 |
| Equity shares | 13,329 | 533 | | 1,370 | | | | | 15,232 |
| Settlement balances | — | — | | — | 5,741 | | | | 5,741 |
| Derivatives | 433,264 | | 8,639 | | | | | | 441,903 |
| Intangible assets | | | | | | | | 13,545 | 13,545 |
| Property, plant and equipment | | | | | | | | 9,784 | 9,784 |
| Deferred tax | | | | | | | | 3,443 | 3,443 |
| Prepayments, accrued income and | | | | | | | | | |
other assets | — | — | | — | — | | | 7,820 | 7,820 |
| Assets of disposal groups | | | | | | | | 14,013 | 14,013 |
| | 666,458 | 1,595 | 8,639 | 75,107 | 504,657 | | 7,234 | 48,605 | 1,312,295 |
| | | | | | | | | | |
| Liabilities | | | | | | | | | |
| Deposits by banks | | | | | | | | | |
- repos | 36,370 | — | | | | 7,962 | | | 44,332 |
- other (2) | 30,571 | — | | | | 26,502 | | | 57,073 |
| Customer accounts | | | | | | | | | |
- repos | 82,224 | — | | | | 5,816 | | | 88,040 |
- other (3) | 12,077 | 6,323 | | | | 414,839 | | | 433,239 |
Debt securities in issue (4) | 10,879 | 23,614 | | | | 60,099 | | | 94,592 |
| Settlement balances | — | — | | | | 5,878 | | | 5,878 |
| Short positions | 27,591 | — | | | | | | | 27,591 |
| Derivatives | 428,537 | | 5,796 | | | | | | 434,333 |
| Accruals, deferred income and other | | | | | | | | | |
liabilities | — | — | | | | 1,684 | 12 | 13,105 | 14,801 |
| Retirement benefit liabilities | | | | | | | | 3,884 | 3,884 |
| Deferred tax | | | | | | | | 1,141 | 1,141 |
| Subordinated liabilities | — | 1,128 | | | | 25,645 | | | 26,773 |
| Liabilities of disposal groups | | | | | | | | 10,170 | 10,170 |
| | 628,249 | 31,065 | 5,796 | | | 548,425 | 12 | 28,300 | 1,241,847 |
| Equity | | | | | | | | | 70,448 |
| | | | | | | | | | 1,312,295 |
| Amounts included in the consolidated income statement: | | | |
| | 2014 £m | 2013 £m | 2012 £m |
| Gains/(losses) on financial assets/liabilities designated as at fair value through profit or loss | | | |
| - continuing operations | 55 | (113) | (2,612) |
| (Losses)/gains on disposal or settlement of loans and receivables | | | |
| - continuing operations | (232) | (179) | 1 |
| - discontinued operations | (48) | (69) | (77) |
| (1) | Includes items in the course of collection from other banks of £980 million (2013 - £1,454 million; 2012 - £1,531 million). |
| (2) | Includes items in the course of transmission to other banks of £513 million (2013 - £828 million; 2012 - £521 million). |
| (3) | The carrying amount of other customer accounts designated as at fair value through profit or loss is £432 million (2013 - £412 million; 2012 - £305 million) higher than the principal amount. No amounts have been recognised in profit or loss for changes in credit risk associated with these liabilities as the changes are immaterial, measured as the change in fair value from movements in the period in the credit risk premium payable. |
| (4) | Comprises bonds and medium term notes of £48,476 million (2013 - £63,959 million; 2012 - £88,723 million) and certificates of deposit and other commercial paper of £1,804 million (2013 - £3,860 million; 2012 - £5,869 million). |
Notes on the consolidated accounts
The tables below present information on financial assets and liabilities that are offset in the balance sheet under IFRS or subject to enforceable master netting agreement together with financial collateral received or given.
| 2014 | Gross £m | IFRS offset £m | Balance sheet £m | Effect of master netting and similar agreements £m | Cash collateral £m | Other financial collateral £m | Net amount after the effect of netting arrangements and related collateral £m |
| Assets | | | | | | | |
| Derivatives | 588,525 | (245,418) | 343,107 | (295,315) | (33,272) | (7,014) | 7,506 |
| Reverse repos | 95,393 | (30,823) | 64,570 | (5,016) | — | (59,505) | 49 |
| Loans to customers | 3,781 | (3,781) | — | — | — | — | — |
| Settlement balances | 2,084 | (1,997) | 97 | — | — | — | 97 |
| | 689,793 | (282,019) | 407,774 | (300,331) | (33,272) | (66,519) | 7,652 |
| | | | | | | | |
| Liabilities | | | | | | | |
| Derivatives | 583,363 | (241,235) | 342,128 | (295,315) | (30,203) | (14,437) | 2,173 |
| Repos | 91,888 | (30,823) | 61,065 | (5,016) | — | (56,049) | — |
| Customer accounts | 7,964 | (7,964) | — | — | — | — | — |
| Settlement balances | 1,998 | (1,997) | 1 | — | — | — | 1 |
| | 685,213 | (282,019) | 403,194 | (300,331) | (30,203) | (70,486) | 2,174 |
| 2013 | | | | | | | |
| Assets | | | | | | | |
| Derivatives | 545,867 | (265,709) | 280,158 | (241,265) | (24,423) | (5,990) | 8,480 |
| Reverse repos | 115,715 | (40,658) | 75,057 | (11,379) | — | (63,589) | 89 |
| Loans to customers | 3,438 | (3,438) | — | — | — | — | — |
| Settlement balances | 2,950 | (2,672) | 278 | (262) | — | — | 16 |
| | 667,970 | (312,477) | 355,493 | (252,906) | (24,423) | (69,579) | 8,585 |
| | | | | | | | |
| Liabilities | | | | | | | |
| Derivatives | 540,622 | (262,656) | 277,966 | (241,265) | (25,302) | (8,257) | 3,142 |
| Repos | 120,639 | (40,658) | 79,981 | (11,379) | — | (68,602) | — |
| Customer accounts | 6,491 | (6,491) | — | — | — | — | — |
| Settlement balances | 3,682 | (2,672) | 1,010 | (262) | — | — | 748 |
| | 671,434 | (312,477) | 358,957 | (252,906) | (25,302) | (76,859) | 3,890 |
| 2012 | | | | | | | |
| Assets | | | | | | | |
| Derivatives | 801,606 | (373,476) | 428,130 | (374,887) | (34,291) | (5,644) | 13,308 |
| Reverse repos | 139,120 | (38,377) | 100,743 | (17,439) | — | (83,304) | — |
| Loans to customers | 1,748 | (1,460) | 288 | — | — | — | 288 |
| Settlement balances | 3,680 | (2,456) | 1,224 | (345) | — | — | 879 |
| | 946,154 | (415,769) | 530,385 | (392,671) | (34,291) | (88,948) | 14,475 |
| | | | | | | | |
| Liabilities | | | | | | | |
| Derivatives | 796,991 | (373,476) | 423,515 | (374,887) | (31,863) | (11,702) | 5,063 |
| Repos | 163,500 | (38,377) | 125,123 | (17,439) | — | (107,684) | — |
| Customer accounts | 1,897 | (1,460) | 437 | — | — | — | 437 |
| Settlement balances | 4,270 | (2,456) | 1,814 | (345) | — | — | 1,469 |
| | 966,658 | (415,769) | 550,889 | (392,671) | (31,863) | (119,386) | 6,969 |
Notes on the consolidated accounts
Reclassification of financial instruments
In 2014, UK Government bonds with a fair value of £3.6 billion were reclassified from available-for-sale (AFS) to held-to-maturity (HTM). In 2008 and 2009, RBS reclassified financial assets from held-for-trading (HFT) and AFS categories into loans and receivables (LAR) and from HFT into AFS. The tables below show the carrying value, fair value and the effect on profit or loss of these reclassifications.
| | | | Amount recognised in the income statemen | Amount that would have been recognised had reclassification not occurred £m | Reduction/ (increase) in profit or loss as a result of reclassification £m |
| 2014 | Carrying value £m | Fair value £m | Income £m | Impairment (losses)/ releases £m |
| Reclassified from HFT to LAR | | | | | | |
| Loans | 671 | 561 | 33 | (76) | 65 | 108 |
| Debt securities | 835 | 787 | (22) | — | 128 | 150 |
| | 1,506 | 1,348 | 11 | (76) | 193 | 258 |
| | | | | | | |
Reclassified from HFT to AFS (1) | | | | | | |
| Debt securities | 251 | 251 | 29 | — | 27 | (2) |
| | | | | | | |
Reclassified from AFS to HTM (2) | | | | | | |
| Debt securities | 3,625 | 3,766 | 68 | — | 67 | (1) |
| | 5,382 | 5,365 | 108 | (76) | 287 | 255 |
| 2013 | | | | | | |
| Reclassified from HFT to LAR | | | | | | |
| Loans | 1,417 | 1,160 | (28) | (13) | 42 | 83 |
| Debt securities | 1,293 | 901 | (29) | 3 | (74) | (48) |
| | 2,710 | 2,061 | (57) | (10) | (32) | 35 |
| | | | | | | |
Reclassified from HFT to AFS (1) | | | | | | |
| Debt securities | 311 | 311 | 56 | — | 111 | 55 |
| | | | | | | |
Reclassified from AFS to LAR (3) | | | | | | |
| Debt securities | — | — | 4 | 7 | — | (11) |
| | 3,021 | 2,372 | 3 | (3) | 79 | 79 |
| 2012 | | | | | | |
| Reclassified from HFT to LAR | | | | | | |
| Loans | 2,892 | 2,546 | 42 | 15 | 517 | 460 |
| Debt securities | 1,671 | 1,333 | (120) | (6) | 251 | 377 |
| | 4,563 | 3,879 | (78) | 9 | 768 | 837 |
| | | | | | | |
Reclassified from HFT to AFS (1) | | | | | | |
| Debt securities | 1,548 | 1,548 | (158) | (20) | 25 | 203 |
| | | | | | | |
Reclassified from AFS to LAR (3) | | | | | | |
| Debt securities | 167 | 90 | 7 | — | 7 | — |
| | 6,278 | 5,517 | (229) | (11) | 800 | 1,040 |
| (1) | £12 million (2013 - £113 million; 2012 - £171 million) was taken to AFS reserves. |
| (2) | £155 million would have been taken to AFS reserves if reclassification had not occurred. |
| (3) | £1 million in 2013 and 2012 would have been taken to AFS reserves if reclassification had not occurred. |
Notes on the consolidated accounts
11 Financial instruments - valuation
Valuation of financial instruments carried at fair value
Control environment
RBS's control environment for the determination of the fair value of financial instruments includes formalised protocols for the review and validation of fair values independent of the businesses entering into the transactions. There are specific controls to ensure consistent pricing policies and procedures, incorporating disciplined price verification. RBS ensures that appropriate attention is given to bespoke transactions, structured products, illiquid products and other instruments which are difficult to price.
A key element of the control environment is the independent price verification (IPV) process. Valuations are first performed by the business which entered into the transaction. Such valuations may be directly from available prices, or may be derived using a model and variable model inputs. These valuations are reviewed, and if necessary amended, by a team independent of those trading the financial instruments, in the light of available pricing evidence.
IPV differences are classified according to the quality of independent market observables into IPV quality bands linked to the fair value hierarchy principles, as laid out in IFRS 13 ‘Fair Value Measurement’. These differences are classified into fair value levels 1, 2 and 3 (with the valuation uncertainty risk increasing as the levels rise from 1 to 3) and then further classified into high, medium, low and indicative depending on the quality of the independent data available to validate the prices. Valuations are revised if they are outside agreed thresholds.
IPV takes place at least monthly, at month end date, for exposures in the regulatory trading book and at least quarterly for exposures in the regulatory banking book. Monthly meetings are held between the business and the support functions to discuss the results of the IPV and pricing reserves. The IPV control includes formalised reporting and escalation of any valuation differences in breach of established thresholds. The Pricing Unit determines IPV policy, monitors adherence to that policy and performs additional independent reviews of highly subjective valuation issues.
Valuation models are subject to a review process which requires different levels of model documentation, testing and review, depending on the complexity of the model and the size of RBS's exposure. A key element of the control environment for model use is a Modelled Product Review Committee, made up of valuations experts from several functions within RBS. This committee sets the policy for model documentation, testing and review, and prioritises models with significant exposure for review by the RBS Pricing Model Risk team. Potential valuation uncertainty is a key input in determining model review priorities at these meetings. The Pricing Model Risk team within Risk Management, which is independent of the trading businesses, assesses the appropriateness of the application of the model to the product, the mathematical robustness of the model, and where appropriate, considers alternative modelling approaches.
The CIB and RCR Valuation Control Committees meet formally on a monthly basis to discuss independent pricing, reserving and valuation issues. All material methodology changes require review and ratification by these committees. The committees, which include valuation specialists representing several independent review functions, comprise Market Risk, Pricing Model Risk, Finance and senior business representatives.
The Executive Valuation Committee discusses the issues escalated by CIB and RCR Valuations Committees, and other relevant issues including prudential valuation. This committee covers key material and subjective valuation issues within the trading businesses and provides a ratification to the appropriateness of areas with high levels of residual valuation uncertainty. Committee members include the Chief Financial Officer, the Financial Controller, the Chief Accountant, and other senior members within finance and risk.
The CIB Valuation Committee operates under delegated authority of the CIB Risk Committee. The CIB Valuation Committee submits a quarterly paper covering the key areas that are governed by them to the CIB Risk Committee. Additionally, the CIB Valuation Committee may escalate items to the CIB Risk Committee on a more frequent basis as appropriate.
Market risk metrics such as value-at-risk (VaR), Incremental Risk Charge and stressed value-at-risk (SVaR) cover financial instruments in CIB and RCR. RBS has a framework to quantify those market risks not adequately captured by standard market risk framework such as VaR and SVaR - refer to pages 300 to 305 for details.
Notes on the consolidated accounts
Valuation hierarchy
There is a process to review and control the classification of financial instruments into the three level hierarchy established by IFRS 13. Some instruments may not easily fall into a level of the fair value hierarchy and judgment may be required as to which level the instrument is classified.
Initial classification of a financial instrument is carried out by the Product Control team following the principles in IFRS 13. They base their judgment on information gathered during the IPV process for instruments which include the sourcing of independent prices and model inputs. The quality and completeness of the information gathered in the IPV process gives an indication as to the liquidity and valuation uncertainty of an instrument.
These initial classifications are reviewed and challenged by the Pricing Unit and are also subject to senior management review. Particular attention is paid to instruments crossing from one level to another, new instrument classes or products, instruments that are generating significant profit and loss and instruments where valuation uncertainty is high.
Valuation techniques
RBS derives fair value of its instruments differently depending on whether the instrument is a non-modelled or a modelled product.
Non-modelled products
Non-modelled products are valued directly from a price input typically on a position by position basis and include cash, equities and most debt securities.
Modelled products
Modelled products valued using a pricing model range in complexity from comparatively vanilla products such as interest rate swaps and options (e.g. interest rate caps and floors) through to more complex derivatives. The valuation of modelled products requires an appropriate model and inputs into this model. Sometimes models are also used to derive inputs (e.g. to construct volatility surfaces). RBS uses a number of modelling methodologies.
Inputs to valuation models
Values between and beyond available data points are obtained by interpolation and extrapolation. When utilising valuation techniques, the fair value can be significantly affected by the choice of valuation model and by underlying assumptions concerning factors such as the amounts and timing of cash flows, discount rates and credit risk. The principal inputs to these valuation techniques are as follows:
| · | Bond prices - quoted prices are generally available for government bonds, certain corporate securities and some mortgage-related products. |
| · | Credit spreads - where available, these are derived from prices of credit default swaps or other credit based instruments, such as debt securities. For others, credit spreads are obtained from pricing services. |
| · | Interest rates - these are principally benchmark interest rates such as the London Interbank Offered Rate (LIBOR), Overnight Index Swaps rate (OIS) and other quoted interest rates in the swap, bond and futures markets. |
| · | Foreign currency exchange rates - there are observable markets both for spot and forward contracts and futures in the world's major currencies. |
| · | Equity and equity index prices - quoted prices are generally readily available for equity shares listed on the world's major stock exchanges and for major indices on such shares. |
| · | Commodity prices - many commodities are actively traded in spot and forward contracts and futures on exchanges in London, New York and other commercial centres. |
| · | Price volatilities and correlations - volatility is a measure of the tendency of a price to change with time. Correlation measures the degree which two or more prices or other variables are observed to move together. If they move in the same direction there is positive correlation; if they move in opposite directions there is negative correlation. Volatility is a key input in valuing options and in the valuation of certain products such as derivatives with multiple underlying variables that are correlation-dependent. Volatility and correlation values are obtained from broker quotations, pricing services or derived from option prices. |
| · | Prepayment rates - the fair value of a financial instrument that can be prepaid by the issuer or borrower differs from that of an instrument that cannot be prepaid. In valuing prepayable instruments that are not quoted in active markets, RBS considers the value of the prepayment option. |
| · | Counterparty credit spreads - adjustments are made to market prices (or parameters) when the creditworthiness of the counterparty differs from that of the assumed counterparty in the market price (or parameters). |
| · | Recovery rates/loss given default - these are used as an input to valuation models and reserves for asset-backed securities and other credit products as an indicator of severity of losses on default. Recovery rates are primarily sourced from market data providers or inferred from observable credit spreads. |
Notes on the consolidated accounts
11 Financial instruments - valuation continued
RBS uses consensus prices for the IPV of some instruments. The consensus service encompasses the equity, interest rate, currency, commodity, credit, property, fund and bond markets, providing comprehensive matrices of vanilla prices and a wide selection of exotic products. CIB and RCR contribute to consensus pricing services where there is a significant interest either from a positional point of view or to test models for future business use. Data sourced from consensus pricing services is used for a combination of control processes including direct price testing, evidence of observability and model testing. In practice this means that RBS submits prices for all material positions for which a service is available. Data from consensus services are subject to the same level of quality review as other inputs used for IPV process.
In order to determine a reliable fair value, where appropriate, management applies valuation adjustments to the pricing information gathered from the above sources. The sources of independent data are reviewed for quality and are applied in the IPV processes using a formalised input quality hierarchy. These adjustments reflect RBS's assessment of factors that market participants would consider in setting a price.
Furthermore, on an ongoing basis, RBS assesses the appropriateness of any model used. To the extent that the price determined by internal models does not represent the fair value of the instrument, for instance in highly stressed market conditions, RBS makes adjustments to the model valuation to calibrate to other available pricing sources.
Where unobservable inputs are used, RBS may determine a range of possible valuations derived from differing stress scenarios to determine the sensitivity associated with the valuation. When establishing the fair value of a financial instrument using a valuation technique, RBS considers adjustments to the modelled price which market participants would make when pricing that instrument. Such adjustments include the credit quality of the counterparty and adjustments to compensate for model limitations.
Valuation reserves
When valuing financial instruments in the trading book, adjustments are made to mid-market valuations to cover bid-offer spread, liquidity and credit risk. The following table shows credit valuation adjustments (CVA) and other valuation reserves. CVA represents an estimate of the adjustment to fair value that a market participant would make to incorporate the risk inherent in derivative exposures.
| | 2014 £m | 2013 £m | 2012 £m |
| Credit valuation adjustments (CVA) | 1,414 | 1,766 | 2,814 |
- of which: monoline insurers and credit derivative product companies (CDPC) | 47 | 99 | 506 |
| | | | |
| Other valuation reserves | | | |
- bid-offer | 398 | 513 | 625 |
- funding valuation adjustment | 718 | 424 | 475 |
- product and deal specific | 657 | 753 | 897 |
| | 1,773 | 1,690 | 1,997 |
| Valuation reserves | 3,187 | 3,456 | 4,811 |
| | | |
| The table below analyses CVA relating to counterparties other than monoline insurers and CDPCs by rating and sector. | | |
| | 2014 £m | 2013 £m |
| Ratings | | |
| AAA | 82 | 104 |
| AA to AA+ | 35 | 13 |
| A to AA- | 78 | 168 |
| BBB- to A- | 401 | 446 |
| Non-investment grade and unrated | 771 | 936 |
| | 1,367 | 1,667 |
| Counterparty | | |
| Banks | 32 | 89 |
| Other financial institutions | 203 | 199 |
| Corporate | 938 | 1,126 |
| Government | 194 | 253 |
| | 1,367 | 1,667 |
Notes on the consolidated accounts
Credit valuation adjustments
Credit valuation adjustments represent an estimate of the adjustment to fair value that a market participant would make to incorporate the counterparty credit risk inherent in derivative exposures. CVA is actively managed by a credit and market risk hedging process, and therefore movements in CVA are partially offset by trading revenue on the hedges.
The CVA is calculated on a portfolio basis reflecting an estimate of the amount a third party would charge to assume the credit risk.
Where a positive exposure exists to a counterparty that is considered to be close to default, the CVA is calculated by applying expected losses to the current level of exposure. Otherwise, expected losses are applied to estimated potential future positive exposures which are modelled to reflect the volatility of the market factors which drive the exposures and the correlation between those factors.
Potential future positive exposures arising from vanilla products (including interest rate and foreign exchange derivatives, as well as some inflation derivatives) are modelled using RBS's core counterparty risk systems. The majority of CVA arises on these vanilla products together with exposures to counterparties which are considered to be close to default. The exposures arising from all other product types are modelled and assessed separately. The potential future positive exposure to each counterparty is the aggregate of the exposures arising on the underlying product types.
Expected losses are determined from market implied probabilities of default and internally assessed recovery levels. The probability of default is calculated with reference to observable credit spreads and observable recovery levels. For counterparties where observable data do not exist, the probability of default is determined from the credit spreads and recovery levels of similarly rated entities.
The correlation between exposure and counterparty risk is also incorporated within the CVA calculation where this risk is considered significant. The risk primarily arises on credit derivative trades where the default risk of the referenced entity is correlated with the counterparty risk. The risk also arises on trades with emerging market counterparties where the gross mark-to-market value of the trade, and
therefore the counterparty exposure can increase based on weakening of the local currency.
Collateral held under a credit support agreement is factored into the CVA calculation. In such cases where RBS holds collateral against counterparty exposures, CVA is held to the extent that residual risk remains.
Bid-offer, liquidity and other reserves
Fair value positions are adjusted to bid (long positions) or offer (short positions) levels, by marking individual cash positions directly to bid or offer or by taking bid-offer reserves calculated on a portfolio basis for derivatives exposures. The bid-offer approach is based on current market spreads and standard market bucketing of risk.
Risk data are used as the primary sources of information within bid-offer calculations and are aggregated when they are more granular than market standard buckets. Bid-offer adjustments for each risk factor (including delta (the degree to which the price of an instrument changes in response to a change in the price of the underlying), vega (the degree to which the price of an instrument changes in response to the volatility in the price of the underlying), correlation (the degree to which prices of different instruments move together)) are determined by aggregating similar risk exposures arising on different products. Additional basis bid-offer reserves are taken where these are charged in the market. Risk associated with non-identical underlying exposures is not netted down unless there is evidence that the cost of closing the combined risk exposure is less than the cost of closing individual exposures.
Bid-offer spreads vary by maturity and risk type to reflect different spreads in the market. For positions where there is no observable quote, the bid-offer spreads are widened in comparison to proxies to reflect reduced liquidity or observability. Bid-offer methodologies may also incorporate liquidity triggers whereby wider spreads are applied to risks above pre-defined thresholds.
As permitted by IFRS 13, netting is applied on a portfolio basis to reflect the value at which RBS believes it could exit the portfolio, rather than the sum of exit costs for each of the portfolio’s individual trades. This is applied where the asset and liability positions are managed as a portfolio for risk and reporting purposes. For example, netting is applied where long and short risk in two different maturity buckets can be closed out in a single market transaction at lower cost than two separate transactions (calendar netting). This reflects the fact that to close down the portfolio, the net risk can be settled rather than each long and short trade individually.
Vanilla risk on exotic products is typically reserved as part of the overall portfolio based calculation e.g. delta and vega risk on exotic products are included within the delta and vega bid-offer calculations. Aggregation of risk arising from different models is in line with RBS’s risk management practices; the model review control process considers the appropriateness of model selection in this respect.
Product related risks such as correlation risk, attract specific bid-offer reserves. Additional reserves are provided for exotic products to ensure overall reserves match market close-out costs. These market close-out costs inherently incorporate risk decay and cross-effects (taking into account how changes in one risk factor may affect other inputs rather than treating all risk factors independently) that are unlikely to be adequately reflected in a static hedge based on vanilla instruments. Where there is limited bid-offer information for a product, the pricing approach and risk management strategy are taken into account when assessing the reserve.
The discount rates applied to derivative cash-flows in determining fair value reflect any underlying collateral agreements. Collateralised derivatives are generally discounted at the relevant OIS rates at an individual trade level. Uncollateralised derivatives are discounted with reference to funding levels by applying a funding spread over benchmark interest rates on a portfolio basis (funding valuation adjustment).
Notes on the consolidated accounts
Funding valuation adjustment (FVA)
Funding valuation adjustments represent an estimate of the adjustment to fair value that a market participant would make to incorporate funding costs and benefits that arise in relation to uncollateralised derivative exposures.
Funding levels are applied to estimated potential future exposures, the modelling of which is consistent with the approach used in the calculation of CVA relating to other counterparties. The counterparty contingent nature of the exposures is reflected in the calculation.
Amounts deferred on initial recognition
On initial recognition of financial assets and liabilities valued using valuation techniques incorporating information other than observable market data, any difference between the transaction price and that derived from the valuation technique is deferred. Such amounts are recognised in profit or loss over the life of the transaction; when market data becomes observable; or when the transaction matures or is closed out as appropriate. At 31 December 2014, net gains of £119 million (2013 - £205 million; 2012 - £153 million) were carried forward. During the year, net gains of £53 million (2013 - £134 million; 2012 - £39 million) were deferred and £139 million (2013 - £82 million; 2012 - £47 million) were recognised in the income statement.
Own credit
RBS takes into account the effect of its own credit standing when valuing financial liabilities recorded at fair value in accordance with IFRS. Own credit spread adjustments are made when valuing issued debt held at fair value, including issued structured notes, and derivatives. An own credit adjustment is applied to positions where it is believed that counterparties would consider RBS's creditworthiness when pricing trades.
For issued debt and structured notes this adjustment is based on debt issuance spreads above average inter-bank rates (at a range of tenors). Secondary senior debt issuance spreads are used in the calculation of the own credit adjustment applied to senior debt.
The fair value of RBS's derivative financial liabilities is also adjusted to reflect RBS's own credit risk (DVA). Expected gains are applied to estimated potential future negative exposures, the modelling of which is consistent with the approach used in calculation of CVA relating to other counterparties. Expected gains are determined from market implied probabilities of default and recovery levels. FVA is considered the primary adjustment applied to derivative liabilities. The extent to which DVA and FVA overlap is eliminated from DVA.
The own credit adjustment for fair value does not alter cash flows, is not used for performance management, is disregarded for regulatory capital reporting processes and will reverse over time as the liabilities mature.
The reserve movement between periods will not equate to the reported profit or loss for own credit. The balance sheet reserves are stated by conversion of underlying currency balances at spot rates for each period whereas the income statement includes intra-period foreign exchange sell-offs.
The effect of change in credit spreads could reverse in future periods provided the liability is not repaid at a premium or a discount.
The cumulative own credit adjustment (OCA) recorded on held-for-trading (HFT) and designated as at fair value through profit or loss (DFV) debt securities in issue, subordinated liabilities and derivative liabilities are set out below.
| Debt securities in issue (2) | Subordinated liabilities | | | |
| Cumulative own credit adjustment | HFT | DFV | Total | DFV | Total | Derivatives (3) | Total |
(increase)/decrease in liability (1) | £m | £m | £m | £m | £m | £m | £m |
| 2014 | (397) | (123) | (520) | 221 | (299) | 12 | (287) |
| 2013 | (467) | (33) | (500) | 256 | (244) | 96 | (148) |
| 2012 | (648) | 56 | (592) | 362 | (230) | 259 | 29 |
| | | | | | | | |
| | | | | | | | |
| Carrying values of underlying liabilities | £bn | £bn | £bn | £bn | £bn | | |
| 2014 | 6.5 | 10.4 | 16.9 | 0.9 | 17.8 | | |
| 2013 | 8.6 | 15.8 | 24.4 | 0.9 | 25.3 | | |
| 2012 | 10.9 | 23.6 | 34.5 | 1.1 | 35.6 | | |
| (1) | The OCA does not alter cash flows and is not used for performance management. |
| (2) | Includes wholesale and retail note issuances. |
| (3) | The reserve movement between periods will not equate to the reported profit or loss for own credit. The balance sheet reserve is stated by conversion of underlying currency balances at spot rates for each period, whereas the income statement includes intra-period foreign exchange sell-offs. |
Notes on the consolidated accounts
| Financial instruments carried at fair value - valuation hierarchy |
| The following tables show financial instruments carried at fair value on the balance sheet by valuation hierarchy - level 1, level 2 and level 3. |
| | 2014 | | 2013 | | 2012 |
| | Level 1 £bn | Level 2 £bn | Level 3 £bn | Total £bn | | Level 1 £bn | Level 2 £bn | Level 3 £bn | Total £bn | | Level 1 £bn | Level 2 £bn | Level 3 £bn | Total £bn |
| Assets | | | | | | | | | | | | | | |
| Loans and advances | — | 95.4 | 0.6 | 96.0 | | — | 104.4 | 0.5 | 104.9 | | — | 140.7 | 1.0 | 141.7 |
| Debt securities | | | | | | | | | | | | | | |
| Government | 53.5 | 6.0 | — | 59.5 | | 56.6 | 13.5 | 0.1 | 70.2 | | 81.0 | 14.4 | — | 95.4 |
| Other | 2.0 | 16.3 | 1.2 | 19.5 | | 1.4 | 36.2 | 2.0 | 39.6 | | 2.6 | 50.2 | 4.8 | 57.6 |
| | 55.5 | 22.3 | 1.2 | 79.0 | | 58.0 | 49.7 | 2.1 | 109.8 | | 83.6 | 64.6 | 4.8 | 153.0 |
| | | | | | | | | | | | | | | |
| Of which ABS | — | 6.4 | 0.8 | 7.2 | | — | 33.2 | 1.7 | 34.9 | | — | 45.1 | 4.2 | 49.3 |
| | | | | | | | | | | | | | | |
| Equity shares | 4.6 | 0.5 | 0.5 | 5.6 | | 7.0 | 1.1 | 0.7 | 8.8 | | 13.1 | 1.3 | 0.8 | 15.2 |
| Derivatives | | | | | | | | | | | | | | |
| Credit | — | 1.9 | 0.4 | 2.3 | | — | 4.5 | 0.8 | 5.3 | | — | 9.3 | 1.7 | 11.0 |
| Other | — | 348.8 | 2.6 | 351.4 | | 0.1 | 279.9 | 2.7 | 282.7 | | 0.1 | 428.7 | 2.1 | 430.9 |
| | — | 350.7 | 3.0 | 353.7 | | 0.1 | 284.4 | 3.5 | 288.0 | | 0.1 | 438.0 | 3.8 | 441.9 |
| | 60.1 | 468.9 | 5.3 | 534.3 | | 65.1 | 439.6 | 6.8 | 511.5 | | 96.8 | 644.6 | 10.4 | 751.8 |
| | | | | | | | | | | | | | | |
| Proportion | 11.2% | 87.8% | 1.0% | 100.0% | | 12.7% | 86.0% | 1.3% | 100.0% | | 12.9% | 85.7% | 1.4% | 100.0% |
| | | | | | | | | | | | | | | |
| Liabilities | | | | | | | | | | | | | | |
| Deposits | — | 105.9 | 0.2 | 106.1 | | — | 111.0 | 0.3 | 111.3 | | — | 167.4 | 0.2 | 167.6 |
| Debt securities in issue | — | 15.5 | 1.2 | 16.7 | | — | 23.1 | 1.3 | 24.4 | | — | 33.1 | 1.4 | 34.5 |
| Short positions | 19.9 | 3.1 | — | 23.0 | | 23.9 | 4.1 | — | 28.0 | | 23.6 | 4.0 | — | 27.6 |
| Derivatives | | | | | | | | | | | | | | |
| Credit | — | 2.1 | 0.6 | 2.7 | | — | 4.5 | 0.9 | 5.4 | | — | 9.6 | 0.8 | 10.4 |
| Other | 0.1 | 344.4 | 2.6 | 347.1 | | 0.1 | 277.9 | 2.1 | 280.1 | | 0.1 | 421.3 | 2.5 | 423.9 |
| | 0.1 | 346.5 | 3.2 | 349.8 | | 0.1 | 282.4 | 3.0 | 285.5 | | 0.1 | 430.9 | 3.3 | 434.3 |
| Subordinated liabilities | — | 0.9 | — | 0.9 | | — | 0.9 | — | 0.9 | | — | 1.1 | — | 1.1 |
| | 20.0 | 471.9 | 4.6 | 496.5 | | 24.0 | 421.5 | 4.6 | 450.1 | | 23.7 | 636.5 | 4.9 | 665.1 |
| | | | | | | | | | | | | | | |
| Proportion | 4.1% | 95.0% | 0.9% | 100.0% | | 5.3% | 93.7% | 1.0% | 100.0% | | 3.6% | 95.7% | 0.7% | 100.0% |
| | | | | | | | | | | | | | | |
| | | | | | | | | | | | |
| (1) | Level 1: valued using unadjusted quoted prices in active markets, for identical financial instruments. Examples include G10 government securities, listed equity shares, certain exchange-traded derivatives and certain US agency securities. |
| | Level 2: valued using techniques based significantly on observable market data. Instruments in this category are valued using: |
(a) quoted prices for similar instruments or identical instruments in markets which are not considered to be active; or
(b) valuation techniques where all the inputs that have a significant effect on the valuations are directly or indirectly based on observable market data.
Level 2 instruments included non-G10 government securities, most government agency securities, investment-grade corporate bonds, certain mortgage products, including CLOs, most bank loans, repos and reverse repos, less liquid listed equities, state and municipal obligations, most notes issued, and certain money market securities and loan commitments and most OTC derivatives.
Level 3: instruments in this category have been valued using a valuation technique where at least one input which could have a significant effect on the instrument’s valuation, is not based on observable market data. Level 3 instruments primarily include cash instruments which trade infrequently, certain syndicated and commercial mortgage loans, certain emerging markets instruments, unlisted equity shares, certain residual interests in securitisations, CDOs, other mortgage-backed products and less liquid debt securities, certain structured debt securities in issue, and OTC derivatives where valuation depends upon unobservable inputs such as certain credit and exotic derivatives. No gain or loss is recognised on the initial recognition of a financial instrument valued using a technique incorporating significant unobservable data.
| (2) | Transfers between levels are deemed to have occurred at the beginning of the quarter in which the instruments were transferred. There were no significant transfers between level 1 and level 2. |
| (3) | For an analysis of derivatives by type of contract see Capital and risk management – Balance Sheet analysis - derivatives, which includes balances relating to disposal groups. |
Notes on the consolidated accounts
The following table analyses level 3 balances and related valuation sensitivities.
| | 2014 | | 2013 | | 2012 |
| | | Sensitivity (1) | | | Sensitivity (1) | | | Sensitivity (1) |
| | Balance £bn | Favourable £m | Unfavourable £m | | Balance £bn | Favourable £m | Unfavourable £m | | Balance £bn | Favourable £m | Unfavourable £m |
| Assets | | | | | | | | | | | |
| Loans and advances | 0.6 | 30 | (30) | | 0.5 | 50 | (40) | | 1.0 | 140 | (70) |
| Debt securities | | | | | | | | | | | |
| Government | — | — | — | | 0.1 | — | — | | — | — | — |
Other | 1.2 | 50 | (40) | | 2.0 | 160 | (100) | | 4.8 | 370 | (190) |
| | 1.2 | 50 | (40) | | 2.1 | 160 | (100) | | 4.8 | 370 | (190) |
| Equity shares | 0.5 | 90 | (80) | | 0.7 | 120 | (110) | | 0.8 | 60 | (100) |
| Derivatives | | | | | | | | | | | |
Credit | 0.4 | 40 | (40) | | 0.8 | 70 | (110) | | 1.7 | 230 | (230) |
Other | 2.6 | 250 | (250) | | 2.7 | 320 | (140) | | 2.1 | 200 | (120) |
| | 3.0 | 290 | (290) | | 3.5 | 390 | (250) | | 3.8 | 430 | (350) |
| | 5.3 | 460 | (440) | | 6.8 | 720 | (500) | | 10.4 | 1,000 | (710) |
| Of which ABS | 0.8 | 30 | (30) | | 1.7 | 120 | (90) | | 4.2 | 290 | (120) |
| | | | | | | | | | | | |
| Liabilities | | | | | | | | | | | |
| Deposits | 0.2 | — | (10) | | 0.3 | 10 | (10) | | 0.2 | 30 | (50) |
| Debt securities in issue | 1.2 | 40 | (40) | | 1.3 | 50 | (70) | | 1.4 | 60 | (70) |
| Derivatives | | | | | | | | | | | |
Credit | 0.6 | 60 | (60) | | 0.9 | 40 | (60) | | 0.8 | 40 | (90) |
Other | 2.6 | 160 | (180) | | 2.1 | 90 | (60) | | 2.5 | 100 | (60) |
| | 3.2 | 220 | (240) | | 3.0 | 130 | (120) | | 3.3 | 140 | (150) |
| | 4.6 | 260 | (290) | | 4.6 | 190 | (200) | | 4.9 | 230 | (270) |
Note:
| (1) | Sensitivity represents the favourable and unfavourable effect on the income statement or the statement of comprehensive income due to reasonably possible changes to valuations using reasonably possible alternative inputs in RBS’s valuation techniques or models. Level 3 sensitivities are calculated at a sub-portfolio level and hence these aggregated figures do not reflect the correlation between some of the sensitivities. In particular, for some portfolios, the sensitivities may be negatively correlated where a downward movement in one asset would produce an upward movement in another, but due to the additive presentation above, this correlation cannot be shown. |
Notes on the consolidated accounts
Valuation techniques
The table below shows a breakdown of valuation techniques and the ranges for those unobservable inputs used in valuation models and techniques that have a material impact on the valuation of Level 3 financial instruments. The table excludes unobservable inputs where the impact on valuation is less significant. Movements in the underlying input may have a favourable or unfavourable impact on the valuation depending on the particular terms of the contract and the exposure. For example an increase in the credit spread of a bond would be favourable for the issuer and unfavourable for the note holder. Whilst RBS indicates where it considers that there are significant relationships between the inputs, these inter-relationships will be affected by macro economic factors including interest rates, foreign exchange rates or equity index levels.
| | Level 3 (£bn) | | | Range |
| Financial instruments | Assets | Liabilities | Valuation technique | Unobservable inputs | Low | High |
| Debt securities | 1.2 | | | | | |
| | | | Price based | Price (2) | 0% | 100% |
| | | | DCF | Yield (2) | 10% | 30% |
| | | | | | | |
| Derivatives | | | | | | |
| | | | | | | |
| Credit | 0.4 | 0.6 | DCF based on recoveries | Recovery rates (3) | 0% | 100% |
| | | | | Credit spreads (4) | 80bps | 700bps |
| Other | 2.6 | 2.6 | Option pricing model | | | |
| | | | | Correlation (5) | (40%) | 85% |
| | | | | Volatility (6) | 15% | 83% |
Notes:
| (1) | Level 3 structured issued debt securities of £1.2 billion are not included in the table above as valuation is consistent with the valuation of the embedded derivative component. |
| (2) | Price and yield: There may be a range of price based information used to value an instrument. This may be a direct comparison of one instrument or portfolio with another or movements in a more liquid instrument may be used to indicate the movement in the value of less liquid instrument. The comparison may also be indirect in that adjustments are made to the price to reflect differences between the pricing source and the instrument being valued, for example different maturity, credit quality, seniority or expected payouts. Similarly to price, an instrument’s yield may be compared to other instruments either directly or indirectly. Prices move inversely to yields. |
| (3) | Recovery rate: Reflects market expectations about the return of principal for a debt instrument or other obligations after a credit event or on liquidation. Recovery rates tend to move conversely to credit spreads. |
| (4) | Credit spreads and discount margins: Credit spreads and margins express the return required over a benchmark rate or index to compensate for the credit risk associated with a cash instrument. A higher credit spread would indicate that the underlying instrument has more credit risk associated with it. Consequently, investors require a higher yield to compensate for the higher risk. The discount rate comprises credit spread or margin plus the benchmark rate; it is used to value future cash flows. |
| (5) | Correlation: Measures the degree by which two prices or other variables are observed to move together. If they move in the same direction there is positive correlation; if they move in opposite directions there is negative correlation. Correlations typically include relationships between: default probabilities of assets in a basket (a group of separate assets), exchange rates, interest rates and other financial variables. |
| (6) | Volatility: A measure of the tendency of a price to change with time. |
| (7) | RBS does not have any material liabilities measured at fair value that are issued with an inseparable third party credit enhancement. |
The Level 3 sensitivities above are calculated at a trade or low level portfolio basis. They are not calculated on an overall portfolio basis and therefore do not reflect the likely potential uncertainty on the portfolio as a whole. The figures are aggregated and do not reflect the correlated nature of some of the sensitivities. In particular, for some of the portfolios the sensitivities may be negatively correlated where a downwards movement in one asset would produce an upwards movement in another, but due to the additive presentation of the above figures this correlation cannot be displayed. The actual potential downside sensitivity of the total portfolio may be less than the non-correlated sum of the additive figures as shown in the above table.
Judgemental issues
The diverse range of products traded by RBS results in a wide range of instruments that are classified into Level 3 of the hierarchy. Whilst the majority of these instruments naturally fall into a particular level, for some products an element of judgment is required. The majority of RBS’s financial instruments carried at fair value are classified as Level 2: inputs are observable either directly (i.e. as a price) or indirectly (i.e. derived from prices).
Active and inactive markets
A key input in the decision making process for the allocation of assets to a particular level is liquidity. In general, the degree of valuation uncertainty depends on the degree of liquidity of an input.
Where markets are liquid or very liquid, little judgment is required. However, when the information regarding the liquidity in a particular market is not clear, a judgment may need to be made. This can be more difficult as assessing the liquidity of a market is not always straightforward. For an equity traded on an exchange, daily volumes of trading can be seen, but for an over-the counter (OTC) derivative assessing the liquidity of the market with no central exchange is more difficult.
A key related issue is where a market moves from liquid to illiquid or vice versa. Where this change is considered to be temporary, the classification is not changed. For example, if there is little market trading in a product on a reporting date but at the previous reporting date and during the intervening period the market has been considered to be liquid, the instrument will continue to be classified in the same level in the hierarchy. This is to provide consistency so that transfers between levels are driven by genuine changes in market liquidity and do not reflect short term or seasonal effects.
Interaction with the IPV process
The determination of an instrument’s level cannot be made at a global product level as a single product type can be in more than one level. For example, a single name corporate credit default swap could be in Level 2 or Level 3 depending on whether the reference counterparty’s obligations are liquid or illiquid.
As part of RBS’s IPV process, data are gathered at a trade level from market trading activity, trading systems, pricing services, consensus pricing providers, brokers and research material amongst other sources.
Notes on the consolidated accounts
11 Financial instruments - valuation continued
The breadth and depth of the IPV data allows for a rules based quality assessment to be made of market activity, liquidity and pricing uncertainty, which assists with the process of allocation to an appropriate level. Where suitable independent pricing information is not readily available, the quality assessment will result in the instrument being assessed as Level 3.
Modelled products
For modelled products the market convention is to quote these trades through the model inputs or parameters as opposed to a cash price equivalent. A mark-to-market is derived from the use of the independent market inputs calculated using RBS’s model.
The decision to classify a modelled asset as Level 2 or 3 will be dependent upon the product/model combination, the currency, the maturity, the observability and quality of input parameters and other factors. All these must be assessed to classify the asset.
An assessment is made of each input into a model. There may be multiple inputs into a model and each is assessed in turn for observability and quality. As part of the process of classifying the quality of IPV results the IPV quality classifications have been designed to follow the accounting level classifications, although with a further level of granularity. For example there are a number of different IPV quality levels that equate to a Level 2 classification and so on.
If an input fails the observability or quality tests then the instrument is considered to be in Level 3 unless the input can be shown to have an insignificant effect on the overall valuation of the product.
The majority of derivative instruments for example vanilla interest rate swaps, foreign exchange swaps and liquid single name credit derivatives are classified as Level 2 as they are vanilla products valued using observable inputs. The valuation uncertainty on these is considered to be low and both input and output testing may be available.
Non-modelled products
Non-modelled products are generally quoted on a price basis and can therefore be considered for each of the three levels. This is determined by the market activity, liquidity and valuation uncertainty of the instruments which is in turn measured from the availability of independent data used by the IPV process to allocate positions to IPV quality levels.
The availability and quality of independent pricing information is considered during the classification process. An assessment is made regarding the quality of the independent information. For example, where consensus prices are used for non-modelled products, a key assessment of the quality of a price is the depth of the number of prices used to provide the consensus price. If the depth of contributors falls below a set hurdle rate, the instrument is considered to be Level 3. This hurdle rate is that used in the IPV process to determine the IPV quality rating. However, where an instrument is generally considered to be illiquid, but regular quotes from market participants exist, these instruments may be classified as Level 2 depending on frequency of quotes, other available pricing and whether the quotes are used as part of the IPV process or not.
For some instruments with a wide number of available price sources, there may be differing quality of available information and there may be a wide range of prices from different sources. In these situations the highest quality source is used to determine the classification of the asset. For example, a tradable quote would be considered a better source than a consensus price.
Level 3 portfolios and sensitively methodologies
Reasonably possible alternative assumptions of unobservable inputs are determined based on a 90% confidence interval. The assessments recognise different favourable and unfavourable valuation movements where appropriate. Each unobservable input within a product is considered separately and sensitivity is reported on an additive basis.
Alternative assumptions are determined with reference to all available evidence including consideration of the following: quality of independent pricing information taking into account consistency between different sources, variation over time, perceived tradability or otherwise of available quotes; consensus service dispersion ranges; volume of trading activity and market bias (e.g. one-way inventory); day 1 profit or loss arising on new trades; number and nature of market participants; market conditions; modelling consistency in the market; size and nature of risk; length of holding of position; and market intelligence.
Other considerations
Valuation adjustments
CVA applied to derivative exposures to other counterparties and own credit adjustments applied to derivative liabilities (DVA) are calculated on a portfolio basis. Whilst the methodology used to calculate each of these adjustments references certain inputs which are not based on observable market data, these inputs are not considered to have a significant effect on the net valuation of the related portfolios. The classification of the derivative portfolios which the valuation adjustments are applied to is not determined by the observability of the valuation adjustments, and any related sensitivity does not form part of the Level 3 sensitivities presented.
Funding related adjustments
The discount rates applied to derivative cash-flows in determining fair value reflect any underlying collateral agreements. Collateralised derivative exposures are generally discounted at the relevant OIS rates whilst funding valuation adjustments are applied to uncollateralised derivative exposures. Whilst these adjustments reference certain inputs which are not based on observable market data, these inputs are not considered to have a significant effect on the valuation of the individual trades. The classification of derivatives is not determined by the observability of these adjustments, and any related sensitivity does not form part of the Level 3 sensitivities presented.
Own credit - issued debt
For structured notes issued the own credit adjustment is based on debt issuance spreads above average inter-bank rates at the reporting date (at a range of tenors). Whilst certain debt issuance spreads are not based on observable market data, these inputs are not considered to have a significant effect on the valuation of individual trades. Neither the classification of structured notes issued nor any related valuation sensitivities are determined by the observability of the debt issuance spreads.
Notes on the consolidated accounts
Movement in level
| | | Amount recorded in the | | Level 3 transfers | | | | | | | | Amounts recorded in the income statement in respect of balances held at year end |
2014 | At 1 January £m | Income statement (1) £m | SOCI (2) £m | | In £m | Out £m | Issuances (3) £m | Purchases £m | Settlements £m | Sales £m | Foreign exchange and other £m | At 31 December £m | | Unrealised £m | Realised £m |
| Assets | | | | | | | | | | | | | | | |
FVTPL assets (3) | 5,167 | 107 | — | | 1,142 | (967) | — | 861 | (998) | (622) | (17) | 4,673 | | 151 | (83) |
| AFS assets | 1,594 | (1) | (45) | | 6 | (158) | — | 8 | (367) | (428) | 25 | 634 | | (4) | 3 |
| | 6,761 | 106 | (45) | | 1,148 | (1,125) | — | 869 | (1,365) | (1,050) | 8 | 5,307 | | 147 | (80) |
| | | | | | | | | | | | | | | | |
| Liabilities | 4,631 | 1 | — | | 1,770 | (690) | 109 | 59 | (1,253) | (51) | 19 | 4,595 | | (171) | 105 |
| | | | | | | | | | | | | | | | |
| Net gains/(losses) | | 105 | (45) | | | | | | | | | | | 318 | (185) |
| | | | | | | | | | | | | | | | |
| 2013 | | | | | | | | | | | | | | | |
| Assets | | | | | | | | | | | | | | | |
FVTPL assets (3) | 7,067 | (570) | — | | 1,207 | (387) | 4 | 1,054 | (850) | (2,328) | (30) | 5,167 | | (838) | 156 |
| AFS assets | 3,338 | 70 | 159 | | 183 | (14) | — | 122 | (725) | (1,493) | (46) | 1,594 | | 4 | 41 |
| | 10,405 | (500) | 159 | | 1,390 | (401) | 4 | 1,176 | (1,575) | (3,821) | (76) | 6,761 | | (834) | 197 |
| | | | | | | | | | | | | | | | |
| Liabilities | 4,850 | 32 | — | | 922 | (482) | 436 | 343 | (1,240) | (212) | (18) | 4,631 | | (150) | 67 |
| | | | | | | | | | | | | | | | |
| Net (losses)/gains | | (532) | 159 | | | | | | | | | | | (684) | 130 |
| | | | | | | | | | | | | | | | |
| 2012 | | | | | | | | | | | | | | | |
| Assets | | | | | | | | | | | | | | | |
FVTPL assets (3) | 10,308 | (1,960) | — | | 1,124 | (653) | — | 2,306 | (1,638) | (2,312) | (108) | 7,067 | | (1,843) | 113 |
| AFS assets | 6,092 | 174 | 77 | | 465 | (472) | — | 52 | (1,005) | (2,026) | (19) | 3,338 | | (51) | 51 |
| | 16,400 | (1,786) | 77 | | 1,589 | (1,125) | — | 2,358 | (2,643) | (4,338) | (127) | 10,405 | | (1,894) | 164 |
| | | | | | | | | | | | | | | | |
| Liabilities | 6,323 | (399) | — | | 936 | (514) | 542 | 171 | (2,157) | 1 | (53) | 4,850 | | (346) | (2) |
| | | | | | | | | | | | | | | | |
| Net (losses)/gains | | (1,387) | 77 | | | | | | | | | | | (1,548) | 166 |
| (1) | Net losses on HFT instruments of £100 million (2013 - £543 million; 2012 - £1,528 million) were recorded in income from trading activities in continuing operations. Net gains on other instruments of £205 million (2013 - £11 million; 2012 - £141 million) were recorded in other operating income and interest income as appropriate in continuing operations. There were no losses (2013 - nil; 2012 - £19 million) in discontinued operations. |
| (2) | Consolidated statement of comprehensive income. |
| (3) | Fair value through profit or loss comprises held-for-trading predominantly and designated at fair value through profit and loss. |
Notes on the consolidated accounts
| Fair value of financial instruments not carried at fair value |
| The following table shows the carrying value and fair value of financial instruments carried at amortised cost on the balance sheet. |
| | | | | Fair value of hierarchy level |
2014 | Items where fair value approximates carrying value £bn | Carrying value £bn | Fair value £bn | Level 1 £bn | Level 2 £bn | Level 3 £bn |
| Financial assets | | | | | | |
| Cash and balances at central banks | 74.9 | | | | | |
| | | | | | | |
| Loans and advances to banks | | | | | | |
| - items in the course of collection from other banks | 1.0 | | | | | |
| - other | | 12.8 | 12.8 | — | 6.6 | 6.2 |
| | | | | | | |
| Loans and advances to customers | | | | | | |
| UK PBB | | | | | | |
| - mortgages | | 103.0 | 102.7 | — | — | 102.7 |
| - other | | 24.2 | 23.8 | — | — | 23.8 |
| Ulster Bank | | | | | | |
| - mortgages | | 16.1 | 13.7 | — | — | 13.7 |
| - other | | 5.9 | 5.7 | — | — | 5.7 |
| Commercial Banking | | | | | | |
| - commercial real estate | | 17.5 | 16.5 | — | — | 16.5 |
| - other | | 67.5 | 65.1 | — | — | 65.1 |
| Private Banking | | 16.5 | 16.5 | — | — | 16.5 |
| CIB | | 50.0 | 48.6 | — | 0.9 | 47.7 |
| Central items | | 1.1 | 1.1 | — | 1.1 | — |
| RCR | | | | | | |
| - commercial real estate | | 4.5 | 4.3 | — | — | 4.3 |
| - other | | 5.8 | 5.5 | — | — | 5.5 |
| Total loans and advances to customers | | 312.1 | 303.5 | — | 2.0 | 301.5 |
| | | | | | | |
| Of which: | | | | | | |
| Performing | | 300.5 | 292.5 | — | 2.0 | 290.5 |
| Non-performing | | 11.6 | 11.0 | — | — | 11.0 |
| | | | | | | |
| Debt securities | | 7.6 | 7.5 | 4.7 | 1.9 | 0.9 |
| Settlement balances | 4.7 | | | | | |
| | | | | | | |
| Financial liabilities | | | | | | |
| Deposits by banks | | | | | | |
| - demand deposits | 3.7 | | | | | |
| - items in the course of transmission to other banks | 0.5 | | | | | |
| - other | | 6.4 | 6.4 | — | 1.4 | 5.0 |
| Customer accounts | | | | | | |
| - demand deposits | 234.9 | | | | | |
| - other | | 100.7 | 100.7 | — | 54.8 | 45.9 |
| Debt securities in issue | | 33.6 | 35.0 | — | 32.0 | 3.0 |
| Settlement balances | 4.5 | | | | | |
| Notes in circulation | 1.8 | | | | | |
| Subordinated liabilities | | 22.0 | 22.5 | — | 22.4 | 0.1 |
Notes on the consolidated accounts
The fair value is the price that would be received to sell an asset or paid to transfer a liability in an orderly transaction between market participants at the measurement date. Quoted market values are used where available; otherwise, fair values have been estimated based on discounted expected future cash flows and other valuation techniques. These techniques involve uncertainties and require assumptions and judgments covering prepayments, credit risk and discount rates. Furthermore there is a wide range of potential valuation techniques. Changes in these assumptions would significantly affect estimated fair values. The fair values reported would not necessarily be realised in an immediate sale or settlement.
The assumptions and methodologies underlying the calculation of fair values of financial instruments at the balance sheet date are as follows:
Short-term financial instruments
For certain short-term financial instruments: cash and balances at central banks, items in the course of collection from other banks, settlement balances, items in the course of transmission to other banks, demand deposits and notes in circulation, fair value approximates to carrying value.
Loans and advances to banks and customers
In estimating the fair value of loans and advances to banks and customers measured at amortised cost, RBS’s loans are segregated into appropriate portfolios reflecting the characteristics of the constituent loans. Two principal methods are used to estimate fair value:
| (a) | Contractual cash flows are discounted using a market discount rate that incorporates the current spread for the borrower or where this is not observable, the spread for borrowers of a similar credit standing. This method is used for portfolios where counterparties have external ratings: large corporate loans in Commercial Banking and institutional and corporate lending in CIB. |
| (b) | Expected cash flows (unadjusted for credit losses) are discounted at the current offer rate for the same or similar products. This approach is adopted for lending portfolios in UK PBB, Commercial Banking (SME loans), Ulster Bank and Private Banking in order to reflect the homogeneous nature of these portfolios. |
For certain portfolios where there are very few or no recent transactions, such as Ulster Bank’s portfolio of lifetime tracker mortgages, a bespoke approach is used based on available market data.
Debt securities
The majority of debt securities are valued using quoted prices in active markets, or using quoted prices for similar assets in active markets.
Fair values of the rest are determined using discounted cash flow valuation techniques.
Deposits by banks and customer accounts
Fair values of deposits are estimated using discounted cash flow valuation techniques.
Debt securities in issue and subordinated liabilities
Fair values are determined using quoted prices for similar liabilities where available or by reference to valuation techniques, adjusting for own credit spreads where appropriate.
Notes on the consolidated accounts
Fair value of financial instruments not carried at fair value continued |
| | | | Fair value of hierarchy level |
| 2013 | Items where fair value approximates carrying value £bn | Carrying value £bn | Fair value £bn | Level 2 £bn | Level 3 £bn |
| Financial assets | | | | | |
| Cash and balances at central banks | 82.7 | | | | |
| | | | | | |
| Loans and advances to banks | | | | | |
| - items in the course of collection from other banks | 1.5 | | | | |
| - other | | 16.8 | 16.8 | 6.0 | 10.8 |
| | | | | | |
| Loans and advances to customers | | | | | |
| UK PBB | | 124.8 | 123.7 | | |
| 222 Bank | | 26.1 | 20.5 | | |
| Commercial Banking | | 83.4 | 80.1 | | |
| Private Banking | | 16.6 | 16.6 | | |
| CIB | | 49.1 | 48.5 | | |
| Central items | | 0.6 | 0.5 | | |
| Citizens Financial Group | | 49.3 | 49.5 | | |
| RCR | | 21.7 | 20.6 | | |
| Total loans and advances to customers | | 371.6 | 360.0 | 13.5 | 346.5 |
| | | | | | |
| Of which: | | | | | |
| Performing | | 354.6 | 343.9 | | |
| Non-performing | | 17.0 | 16.1 | | |
| | | | | | |
| Debt securities | | 3.8 | 3.2 | 1.9 | 1.3 |
| Settlement balances | 5.6 | | | | |
| | | | | | |
| Financial liabilities | | | | | |
| Deposits by banks | | | | | |
| - items in the course of transmission to other banks | 0.8 | | | | |
| - other | | 20.3 | 20.3 | 6.9 | 13.4 |
| Customer accounts | | | | | |
| - demand deposits | 268.7 | | | | |
| - other | | 133.8 | 134.0 | 89.4 | 44.6 |
| Debt securities in issue | | 43.4 | 44.7 | 40.5 | 4.2 |
| Settlement balances | 5.3 | | | | |
| Notes in circulation | 1.8 | | | | |
| Subordinated liabilities | | 23.1 | 22.5 | 22.3 | 0.2 |
| | | | | |
| | | | 2012 | 2012 |
| | | | Carrying value | Fair value |
| | | | £bn | £bn |
| Financial assets | | | | |
| Cash and balances at central banks | | | 79.3 | 79.3 |
| Loans and advances to banks | | | 17.3 | 17.3 |
| Loans and advances to customers | | | 405.1 | 385.4 |
| Debt securities | | | 4.5 | 4.0 |
| Settlement balances | | | 5.7 | 5.7 |
| | | | | |
| Financial liabilities | | | | |
| Deposits by banks | | | 34.5 | 34.5 |
| Customer accounts | | | 420.7 | 421.0 |
| Debt securities in issue | | | 60.1 | 59.8 |
| Settlement balances | | | 5.9 | 5.9 |
| Notes in circulation | | | 1.7 | 1.7 |
| Subordinated liabilities | | | 25.6 | 24.3 |
Notes on the consolidated accounts
| 12 Financial instruments - maturity analysis |
| Remaining maturity |
| The following table shows the residual maturity of financial instruments, based on contractual date of maturity. |
| | 2014 | | 2013 | | 2012 |
| | Less than 12 months | More than 12 months | Total | | Less than 12 months | More than 12 months | Total | | Less than 12 months | More than 12 months | Total |
| | £m | £m | £m | | £m | £m | £m | | £m | £m | £m |
| Assets | | | | | | | | | | | |
| Cash and balances at central banks | 74,872 | — | 74,872 | | 82,659 | — | 82,659 | | 79,290 | — | 79,290 |
| Loans and advances to banks | 43,175 | 560 | 43,735 | | 53,206 | 865 | 54,071 | | 63,143 | 808 | 63,951 |
| Loans and advances to customers | 149,118 | 229,120 | 378,238 | | 169,314 | 271,408 | 440,722 | | 197,855 | 302,280 | 500,135 |
| Debt securities | 24,756 | 61,893 | 86,649 | | 19,542 | 94,057 | 113,599 | | 26,363 | 131,075 | 157,438 |
| Equity shares | — | 5,635 | 5,635 | | — | 8,811 | 8,811 | | — | 15,232 | 15,232 |
| Settlement balances | 4,667 | — | 4,667 | | 5,591 | — | 5,591 | | 5,741 | — | 5,741 |
| Derivatives | 67,022 | 286,568 | 353,590 | | 45,067 | 242,972 | 288,039 | | 51,021 | 390,882 | 441,903 |
| | | | | | | | | | | | |
| Liabilities | | | | | | | | | | | |
| Deposits by banks | 59,034 | 1,631 | 60,665 | | 61,108 | 2,871 | 63,979 | | 90,704 | 10,701 | 101,405 |
| Customer accounts | 384,079 | 7,560 | 391,639 | | 455,620 | 15,260 | 470,880 | | 494,405 | 26,874 | 521,279 |
| Debt securities in issue | 10,690 | 39,590 | 50,280 | | 16,547 | 51,272 | 67,819 | | 20,296 | 74,296 | 94,592 |
| Settlement balances and short | | | | | | | | | | | |
| positions | 6,426 | 21,106 | 27,532 | | 10,490 | 22,845 | 33,335 | | 8,573 | 24,896 | 33,469 |
| Derivatives | 69,103 | 280,702 | 349,805 | | 45,385 | 240,141 | 285,526 | | 51,503 | 382,830 | 434,333 |
| Subordinated liabilities | 3,272 | 19,633 | 22,905 | | 1,350 | 22,662 | 24,012 | | 2,351 | 24,422 | 26,773 |
Assets and liabilities by contractual cash flow maturity
The tables below show the contractual undiscounted cash flows receivable and payable, up to a period of 20 years, including future receipts and payments of interest of financial assets and liabilities by contractual maturity. The balances in the following tables do not agree directly with the consolidated balance sheet, as the tables include all cash flows relating to principal and future coupon payments, presented on an undiscounted basis. The tables have been prepared on the following basis:
Financial assets have been reflected in the time band of the latest date on which they could be repaid, unless earlier repayment can be demanded by RBS. Financial liabilities are included at the earliest date on which the counterparty can require repayment, regardless of whether or not such early repayment results in a penalty. If the repayment of a financial instrument is triggered by, or is subject to, specific criteria such as market price hurdles being reached, the asset is included in the time band that contains the latest date on which it can be repaid, regardless of early repayment.
The liability is included in the time band that contains the earliest possible date on which the conditions could be fulfilled, without considering the probability of the conditions being met.
For example, if a structured note is automatically prepaid when an equity index exceeds a certain level, the cash outflow will be included in the less than three months period, whatever the level of the index at the year end. The settlement date of debt securities in issue, issued by certain securitisation vehicles consolidated by RBS, depends on when cash flows are received from the securitised assets. Where these assets are prepayable, the timing of the cash outflow relating to securities assumes that each asset will be prepaid at the earliest possible date. As the repayments of assets and liabilities are linked, the repayment of assets in securitisations is shown on the earliest date that the asset can be prepaid, as this is the basis used for liabilities.
The principal amounts of financial assets and liabilities that are repayable after 20 years or where the counterparty has no right to repayment of the principal are excluded from the table, as are interest payments after 20 years.
Held-for-trading assets of £498.2 billion (2013 - £452.1 billion; 2012 - £666.5 billion) and liabilities of £477.1 billion (2013 - £423.3 billion; 2012 - £628.2 billion) have been excluded from the following tables in view of their short-term nature.
Notes on the consolidated accounts
| | 0-3 months | 3-12 months | 1-3 years | 3-5 years | 5-10 years | 10-20 years |
| 2014 | £m | £m | £m | £m | £m | £m |
| Assets by contractual maturity | | | | | | |
| Cash and balances at central banks | 74,872 | — | — | — | — | — |
| Loans and advances to banks | 15,110 | 975 | 219 | 46 | 15 | — |
| Debt securities | 5,889 | 5,328 | 5,014 | 4,684 | 6,103 | 2,602 |
| Settlement balances | 4,667 | — | — | — | — | — |
| Total maturing assets | 100,538 | 6,303 | 5,233 | 4,730 | 6,118 | 2,602 |
| Loans and advances to customers | 56,664 | 37,249 | 64,266 | 56,726 | 64,051 | 71,492 |
| Derivatives held for hedging | 611 | 1,483 | 2,281 | 711 | 380 | 63 |
| | 157,813 | 45,035 | 71,780 | 62,167 | 70,549 | 74,157 |
| | | | | | | |
| Liabilities by contractual maturity | | | | | | |
| Deposits by banks | 8,287 | 754 | 793 | 8 | 575 | 140 |
| Debt securities in issue | 2,591 | 7,585 | 12,952 | 8,536 | 8,897 | 1,926 |
| Subordinated liabilities | 1,243 | 2,731 | 3,045 | 4,365 | 13,394 | 3,698 |
| Settlement balances and other liabilities | 6,295 | 5 | 4 | — | — | — |
| Total maturing liabilities | 18,416 | 11,075 | 16,794 | 12,909 | 22,866 | 5,764 |
| Customer accounts | 328,158 | 7,884 | 3,170 | 1,082 | 114 | 23 |
| Derivatives held for hedging | 140 | 348 | 789 | 543 | 949 | 1,010 |
| | 346,714 | 19,307 | 20,753 | 14,534 | 23,929 | 6,797 |
| | | | | | | |
| Maturity gap | 82,122 | (4,772) | (11,561) | (8,179) | (16,748) | (3,162) |
| Cumulative maturity gap | 82,122 | 77,350 | 65,789 | 57,610 | 40,862 | 37,700 |
| | | | | | | |
| Guarantees and commitments notional amount | | | | | | |
Guarantees (1) | 16,721 | — | — | — | — | — |
Commitments (2) | 212,777 | — | — | — | — | — |
| | 229,498 | — | — | — | — | — |
| | | | | | | |
| For the notes relating to this table refer to page 387. | | | | | | |
Notes on the consolidated accounts
| | 0-3 months | 3-12 months | 1-3 years | 3-5 years | 5-10 years | 10-20 years |
| 2013 | £m | £m | £m | £m | £m | £m |
| Assets by contractual maturity | | | | | | |
| Cash and balances at central banks | 82,659 | — | — | — | — | — |
| Loans and advances to banks | 16,096 | 1,876 | 279 | 4 | 74 | 5 |
| Debt securities | 3,078 | 5,044 | 10,667 | 11,310 | 14,189 | 7,238 |
| Settlement balances | 5,591 | — | — | — | — | — |
| Total maturing assets | 107,424 | 6,920 | 10,946 | 11,314 | 14,263 | 7,243 |
| Loans and advances to customers | 70,511 | 48,027 | 84,836 | 65,542 | 74,296 | 69,242 |
| Derivatives held for hedging | 545 | 1,282 | 2,148 | 427 | 115 | 93 |
| | 178,480 | 56,229 | 97,930 | 77,283 | 88,674 | 76,578 |
| | | | | | | |
| Liabilities by contractual maturity | | | | | | |
| Deposits by banks | 16,867 | 1,550 | 1,306 | 158 | 944 | 426 |
| Debt securities in issue | 11,457 | 7,601 | 16,375 | 7,356 | 9,879 | 4,840 |
| Subordinated liabilities | 324 | 1,982 | 6,473 | 6,140 | 11,376 | 3,345 |
| Settlement balances and other liabilities | 7,074 | 4 | 9 | 4 | — | 1 |
| Total maturing liabilities | 35,722 | 11,137 | 24,163 | 13,658 | 22,199 | 8,612 |
| Customer accounts | 388,322 | 9,524 | 5,889 | 2,356 | 698 | 35 |
| Derivatives held for hedging | 130 | 271 | 933 | 1,190 | 1,732 | 330 |
| | 424,174 | 20,932 | 30,985 | 17,204 | 24,629 | 8,977 |
| | | | | | | |
| Maturity gap | 71,702 | (4,217) | (13,217) | (2,344) | (7,936) | (1,369) |
| Cumulative maturity gap | 71,702 | 67,485 | 54,268 | 51,924 | 43,988 | 42,619 |
| | | | | | | |
| Guarantees and commitments notional amount | | | | | | |
Guarantees (1) | 20,179 | — | — | — | — | — |
Commitments (2) | 213,046 | — | — | — | — | — |
| | 233,225 | — | — | — | — | — |
| | | | | | | |
| For the notes relating to this table refer to the following page. | | | | | | |
Notes on the consolidated accounts
| | 0-3 months | 3-12 months | 1-3 years | 3-5 years | 5-10 years | 10-20 years |
| 2012 | £m | £m | £m | £m | £m | £m |
| Assets by contractual maturity | | | | | | |
| Cash and balances at central banks | 79,290 | — | — | — | — | — |
| Loans and advances to banks | 15,592 | 1,393 | 272 | 27 | 20 | 62 |
| Debt securities | 6,320 | 4,505 | 13,330 | 19,369 | 25,772 | 10,644 |
| Settlement balances | 5,741 | — | — | — | — | — |
| Total maturing assets | 106,943 | 5,898 | 13,602 | 19,396 | 25,792 | 10,706 |
| Loans and advances to customers | 73,590 | 57,403 | 93,445 | 65,569 | 76,682 | 87,450 |
| Derivatives held for hedging | 571 | 1,878 | 3,909 | 1,879 | 429 | 67 |
| | 181,104 | 65,179 | 110,956 | 86,844 | 102,903 | 98,223 |
| | | | | | | |
| Liabilities by contractual maturity | | | | | | |
| Deposits by banks | 23,363 | 973 | 8,336 | 388 | 1,091 | 594 |
| Debt securities in issue | 15,072 | 14,555 | 23,733 | 13,118 | 20,154 | 4,975 |
| Subordinated liabilities | 318 | 2,979 | 7,045 | 3,182 | 11,134 | 3,603 |
| Settlement balances and other liabilities | 7,560 | 4 | 9 | 1 | — | 1 |
| Total maturing liabilities | 46,313 | 18,511 | 39,123 | 16,689 | 32,379 | 9,173 |
| Customer accounts | 386,504 | 24,123 | 11,791 | 2,186 | 1,246 | 63 |
| Derivatives held for hedging | 310 | 752 | 1,790 | 1,262 | 1,244 | 684 |
| | 433,127 | 43,386 | 52,704 | 20,137 | 34,869 | 9,920 |
| | | | | | | |
| Maturity gap | 60,630 | (12,613) | (25,521) | 2,707 | (6,587) | 1,533 |
| Cumulative maturity gap | 60,630 | 48,017 | 22,496 | 25,203 | 18,616 | 20,149 |
| | | | | | | |
| Guarantees and commitments notional amount | | | | | | |
Guarantees (1) | 19,025 | — | — | — | — | — |
Commitments (2) | 215,808 | — | — | — | — | — |
| | 234,833 | — | — | — | — | — |
| (1) | RBS is only called upon to satisfy a guarantee when the guaranteed party fails to meet its obligations. RBS expects most guarantees it provides to expire unused. |
| (2) | RBS has given commitments to provide funds to customers under undrawn formal facilities, credit lines and other commitments to lend subject to certain conditions being met by the counterparty. RBS does not expect all facilities to be drawn, and some may lapse before drawdown. |
| 13 Financial assets - impairments |
| The following table shows the movement in the provision for impairment losses on loans and advances. |
| | Individually assessed | Collectively assessed | Latent | 2014 | 2013 | 2012 |
| | £m | £m | £m | £m | £m | £m |
| At 1 January | 16,909 | 6,304 | 2,003 | 25,216 | 21,250 | 19,883 |
| Transfers (to)/from disposal groups | (100) | (158) | (295) | (553) | (9) | 764 |
| Currency translation and other adjustments | (630) | (21) | (16) | (667) | 121 | (310) |
| Disposals | (6) | — | — | (6) | (77) | (5) |
| Amounts written-off | (4,004) | (1,274) | — | (5,278) | (4,346) | (4,266) |
| Recoveries of amounts previously written-off | 72 | 133 | — | 205 | 256 | 341 |
| (Release)/charge to income statement | | | | | | |
- continuing operations | (845) | 173 | (692) | (1,364) | 8,105 | 5,054 |
- discontinued operations | 36 | 142 | 16 | 194 | 307 | 265 |
| Unwind of discount (recognised in interest income) | (138) | (109) | — | (247) | (391) | (476) |
At 31 December (1) | 11,294 | 5,190 | 1,016 | 17,500 | 25,216 | 21,250 |
| (1) | Includes £40 million relating to loans and advances to banks (2013 - £63 million; 2012 - £114 million). |
| (2) | The table above excludes impairments relating to securities. |
Notes on the consolidated accounts
| Impairment (releases)/losses charged to the income statement | 2014 £m | 2013 £m | 2012 £m |
| Loans and advances to customers | (1,354) | 8,120 | 5,031 |
| Loans and advances to banks | (10) | (15) | 23 |
| | (1,364) | 8,105 | 5,054 |
| Debt securities | 12 | 15 | (75) |
| Equity shares | — | — | 31 |
| | 12 | 15 | (44) |
| | (1,352) | 8,120 | 5,010 |
| The following tables analyse impaired financial assets. |
| | 2014 | | 2013 | | 2012 |
| | | | Carrying | | | | Carrying | | | | Carrying |
| | Cost | Provision | value | | Cost | Provision | value | | Cost | Provision | value |
| | £m | £m | £m | | £m | £m | £m | | £m | £m | £m |
| Loans and receivables | | | | | | | | | | | |
Loans and advances to banks (1) | 42 | 40 | 2 | | 70 | 63 | 7 | | 134 | 114 | 20 |
Loans and advances to customers (2) | 25,201 | 16,444 | 8,757 | | 37,101 | 23,150 | 13,951 | | 38,352 | 19,176 | 19,176 |
| | 25,243 | 16,484 | 8,759 | | 37,171 | 23,213 | 13,958 | | 38,486 | 19,290 | 19,196 |
| (1) | Impairment provisions individually assessed. |
| (2) | Impairment provisions individually assessed on balances of £17,655 million (2013 - £26,939 million; 2012 - £26,797 million). |
| | Carrying | Carrying | Carrying |
| | value | value | value |
| | 2014 | 2013 | 2012 |
| | £m | £m | £m |
| Available-for-sale securities | | | |
| Debt securities | 143 | 145 | 225 |
| Equity shares | 22 | 30 | 31 |
| | | | |
| Loans and receivables | | | |
| Debt securities | 29 | 585 | 1,008 |
| | 194 | 760 | 1,264 |
The following table shows financial and non-financial assets, recognised on RBS's balance sheet, obtained during the year by taking possession of collateral or calling on other credit enhancements.
| | 2014 | 2013 | 2012 |
| | £m | £m | £m |
| Residential property | — | 18 | 67 |
| Other property | 3 | 13 | 46 |
| Cash | 40 | 44 | 49 |
| Other assets | — | 2 | 1 |
| | 43 | 77 | 163 |
In general, RBS seeks to dispose of property and other assets not readily convertible into cash, obtained by taking possession of collateral, as rapidly as the market for the individual asset permits.
Notes on the consolidated accounts
14 Derivatives
Companies within RBS transact derivatives as principal either as a trading activity or to manage balance sheet foreign exchange, interest rate and credit risk.
RBS enters into fair value hedges, cash flow hedges and hedges of net investments in foreign operations. The majority of RBS’s interest rate hedges relate to the management of RBS’s non-trading interest rate risk. RBS manages this risk within approved limits. Residual risk positions are hedged with derivatives principally interest rate swaps. Suitable larger financial instruments are fair value hedged; the remaining exposure, where possible, is hedged by derivatives documented as cash flow hedges and qualifying for hedge accounting. The majority of RBS’s fair value hedges involve interest rate swaps hedging the interest rate risk in recognised financial assets and financial liabilities. Cash flow hedges relate to exposures to the variability in future interest payments and receipts on forecast transactions and on recognised financial assets and financial liabilities. RBS hedges its net investments in foreign operations with currency borrowings and forward foreign exchange contracts.
For cash flow hedge relationships of interest rate risk, the hedged items are actual and forecast variable interest rate cash flows arising from financial assets and financial liabilities with interest rates linked to LIBOR, EURIBOR or the Bank of England official Bank Rate. The financial assets are customer loans and the financial liabilities are customer deposits and LIBOR linked medium-term notes and other issued securities. At 31 December 2014, variable rate financial assets of £80 billion (2013 - £74 billion; 2012 - £61 billion) and variable rate financial liabilities of £14 billion (2013 - £10 billion; 2012 - £9 billion) were hedged in such cash flow hedge relationships.
For cash flow hedging relationships, the initial and ongoing prospective effectiveness is assessed by comparing movements in the fair value of the expected highly probable forecast interest cash flows with movements in the fair value of the expected changes in cash flows from the hedging interest rate swap. Prospective effectiveness is measured on a cumulative basis i.e. over the entire life of the hedge relationship. The method of calculating hedge ineffectiveness is the hypothetical derivative method. Retrospective effectiveness is assessed by comparing the actual movements in the fair value of the cash flows and actual movements in the fair value of the hedged cash flows from the interest rate swap over the life to date of the hedging relationship.
For fair value hedge relationships of interest rate risk, the hedged items are typically, large corporate fixed-rate loans, fixed rate finance leases, fixed rate medium-term notes or preference shares classified as debt. At 31 December 2014, fixed rate financial assets of £18 billion (2013 - £23 billion; 2012 - £25 billion) and fixed rate financial liabilities of £32 billion (2013 - £34 billion; 2012 - £39 billion) were hedged by interest rate swaps in fair value hedge relationships.
The initial and ongoing prospective effectiveness of fair value hedge relationships is assessed on a cumulative basis by comparing movements in the fair value of the hedged item attributable to the hedged risk with changes in the fair value of the hedging interest rate swap. Retrospective effectiveness is assessed by comparing the actual movements in the fair value of the hedged items attributable to the hedged risk with actual movements in the fair value of the hedging derivative over the life to date of the hedging relationship.
The following table shows the notional amounts and fair values of RBS's derivatives.
| | 2014 | | 2013 | | 2012 |
| | Notional amount £bn | Assets £m | Liabilities £m | | Notional amount £bn | Assets £m | Liabilities £m | | Notional amount £bn | Assets £m | Liabilities £m |
| Exchange rate contracts | | | | | | | | | | | |
| Spot, forwards and futures | 2,025 | 32,960 | 33,419 | | 2,041 | 24,495 | 24,136 | | 2,259 | 23,237 | 22,721 |
| Currency swaps | 870 | 22,254 | 26,844 | | 956 | 18,576 | 22,846 | | 1,071 | 22,238 | 30,223 |
| Options purchased | 896 | 23,458 | — | | 792 | 18,852 | — | | 683 | 17,580 | — |
| Options written | 881 | — | 23,457 | | 766 | — | 18,767 | | 684 | — | 17,536 |
| | | | | | | | | | | | |
| Interest rate contracts | | | | | | | | | | | |
| Interest rate swaps | 20,161 | 219,411 | 211,287 | | 27,483 | 179,891 | 172,618 | | 25,474 | 300,907 | 286,620 |
| Options purchased | 1,471 | 49,248 | — | | 1,568 | 37,437 | — | | 1,934 | 61,798 | — |
| Options written | 1,552 | — | 47,866 | | 1,513 | — | 35,410 | | 1,884 | — | 58,289 |
| Futures and forwards | 4,133 | 886 | 739 | | 5,025 | 712 | 669 | | 4,191 | 749 | 653 |
| | | | | | | | | | | | |
| Credit derivatives | 125 | 2,254 | 2,611 | | 253 | 5,306 | 5,388 | | 553 | 11,005 | 10,353 |
| | | | | | | | | | | | |
| Equity and commodity contracts | 78 | 3,119 | 3,582 | | 81 | 2,770 | 5,692 | | 111 | 4,389 | 7,938 |
| | | 353,590 | 349,805 | | | 288,039 | 285,526 | | | 441,903 | 434,333 |
Notes on the consolidated accounts
| Included in the table above are derivatives held for hedging purposes as follows: |
| | 2014 | | 2013 | | 2012 |
| | Assets £m | Liabilities £m | | Assets £m | Liabilities £m | | Assets £m | Liabilities £m |
| Fair value hedging | | | | | | | | |
| Interest rate contracts | 2,122 | 2,319 | | 2,086 | 2,587 | | 3,779 | 4,488 |
| | | | | | | | | |
| Cash flow hedging | | | | | | | | |
| Interest rate contracts | 3,240 | 1,291 | | 2,390 | 1,602 | | 4,854 | 1,276 |
| Exchange rate contacts | — | 5 | | — | — | | — | — |
| | | | | | | | | |
| Net investment hedging | | | | | | | | |
| Exchange rate contracts | 78 | 6 | | 55 | 38 | | 6 | 32 |
| Hedge ineffectiveness recognised in other operating income in continuing operations comprised: |
| | 2014 | 2013 | 2012 |
| | £m | £m | £m |
| Fair value hedging | | | |
| Gains/(losses) on the hedged items attributable to the hedged risk | 809 | (165) | 178 |
| (Losses)/gains on the hedging instruments | (840) | 154 | (132) |
| Fair value hedging ineffectiveness | (31) | (11) | 46 |
| Cash flow hedging ineffectiveness | (33) | (64) | 25 |
| | (64) | (75) | 71 |
| Hedge ineffectivness recognised in other operating income in discontinued operations was £1 million in 2012. |
| The following table shows when hedged cash flows are expected to occur and when they will affect income for designated cash flow hedges. |
| | | | | | Over | |
| | 0-1 years | 1-5 years | 5-10 years | 10-20 years | 20 years | Total |
| 2014 | £m | £m | £m | £m | £m | £m |
| Hedged forecast cash flows expected to occur | | | | | | |
| Forecast receivable cash flows | 278 | 844 | 227 | — | — | 1,349 |
| Forecast payable cash flows | (49) | (100) | (61) | (92) | (12) | (314) |
| | | | | | | |
| Hedged forecast cash flows affect on profit or loss | | | | | | |
| Forecast receivable cash flows | 303 | 826 | 218 | — | — | 1,347 |
| Forecast payable cash flows | (52) | (97) | (62) | (92) | (12) | (315) |
| | | | | | | |
| 2013 | | | | | | |
| Hedged forecast cash flows expected to occur | | | | | | |
| Forecast receivable cash flows | 303 | 877 | 271 | — | — | 1,451 |
| Forecast payable cash flows | (33) | (69) | (64) | (101) | (19) | (286) |
| | | | | | | |
| Hedged forecast cash flows affect on profit or loss | | | | | | |
| Forecast receivable cash flows | 302 | 859 | 261 | — | — | 1,422 |
| Forecast payable cash flows | (32) | (69) | (64) | (101) | (19) | (285) |
| | | | | | | |
| 2012 | | | | | | |
| Hedged forecast cash flows expected to occur | | | | | | |
| Forecast receivable cash flows | 285 | 806 | 190 | — | — | 1,281 |
| Forecast payable cash flows | (56) | (152) | (172) | (259) | (39) | (678) |
| | | | | | | |
| Hedged forecast cash flows affect on profit or loss | | | | | | |
| Forecast receivable cash flows | 277 | 785 | 180 | — | — | 1,242 |
| Forecast payable cash flows | (55) | (150) | (173) | (257) | (37) | (672) |
Notes on the consolidated accounts
15 Debt securities
| | Central and local government | | | | | |
| | UK | US | Other | Banks | Other financial institutions | Corporate | Total | Of which ABS (1) |
| 2014 | £m | £m | £m | £m | £m | £m | £m | £m |
| Held-for-trading | 6,218 | 7,709 | 24,451 | 1,499 | 7,372 | 1,977 | 49,226 | 3,559 |
| Designated as at fair value through profit or loss | — | — | 111 | 2 | 4 | — | 117 | — |
| Available-for-sale | 4,747 | 5,230 | 11,058 | 3,404 | 5,073 | 161 | 29,673 | 3,608 |
| Loans and receivables | — | — | — | 185 | 2,774 | 137 | 3,096 | 2,734 |
| Held to maturity | 4,537 | — | — | — | — | — | 4,537 | — |
| | 15,502 | 12,939 | 35,620 | 5,090 | 15,223 | 2,275 | 86,649 | 9,901 |
| | | | | | | | | |
| Available-for-sale | | | | | | | | |
| Gross unrealised gains | 451 | 144 | 541 | 8 | 166 | 6 | 1,316 | 128 |
| Gross unrealised losses | (1) | (5) | (3) | (1) | (133) | (2) | (145) | (120) |
| | | | | | | | | |
| 2013 | | | | | | | | |
| Held-for-trading | 6,764 | 10,951 | 22,794 | 1,720 | 12,406 | 1,947 | 56,582 | 10,674 |
| Designated as at fair value through profit or loss | — | — | 104 | — | 17 | 1 | 122 | 15 |
| Available-for-sale | 6,436 | 12,880 | 10,303 | 5,974 | 17,330 | 184 | 53,107 | 24,174 |
| Loans and receivables | 10 | 1 | — | 175 | 3,466 | 136 | 3,788 | 3,423 |
| | 13,210 | 23,832 | 33,201 | 7,869 | 33,219 | 2,268 | 113,599 | 38,286 |
| | | | | | | | | |
| Available-for-sale | | | | | | | | |
| Gross unrealised gains | 201 | 428 | 445 | 70 | 386 | 11 | 1,541 | 458 |
| Gross unrealised losses | (69) | (86) | (32) | (205) | (493) | (2) | (887) | (753) |
| | | | | | | | | |
| 2012 | | | | | | | | |
| Held-for-trading | 7,692 | 17,349 | 27,165 | 2,243 | 21,876 | 2,015 | 78,340 | 18,619 |
| Designated as at fair value through profit or loss | — | — | 123 | 86 | 610 | 54 | 873 | 516 |
| Available-for-sale | 7,950 | 19,040 | 15,995 | 7,227 | 23,294 | 231 | 73,737 | 30,184 |
| Loans and receivables | 5 | — | — | 365 | 3,728 | 390 | 4,488 | 3,707 |
| | 15,647 | 36,389 | 43,283 | 9,921 | 49,508 | 2,690 | 157,438 | 53,026 |
| | | | | | | | | |
| Available-for-sale | | | | | | | | |
| Gross unrealised gains | 944 | 1,092 | 1,185 | 56 | 650 | 19 | 3,946 | 748 |
| Gross unrealised losses | — | (1) | (14) | (498) | (1,319) | — | (1,832) | (1,816) |
| (1) | Includes asset-backed securities issued by US federal agencies and government sponsored entities, and covered bonds. |
Gross gains of £502 million (2013 - £1,018 million; 2012 - £1,824 million) and gross losses of £386 million (2013 - £352 million; 2012 - £901 million) were realised on the sale of available-for-sale securities in continuing operations.
Gross gains of £20 million (2013 - £96 million; 2012 - £137 million) and gross losses of £3 million (2013 - £1 million; 2012 - £12 million) were realised on the sale of available-for-sale securities in discontinued operations.
Notes on the consolidated accounts
The following table analyses available-for-sale debt securities and the related yield (based on weighted averages) by remaining maturity and issuer.
| | Within 1 year | | After 1 but within 5 years | | After 5 but within 10 years | | After 10 years | | Total |
| | Amount | Yield | | Amount | Yield | | Amount | Yield | | Amount | Yield | | Amount | Yield |
| 2014 | £m | % | | £m | % | | £m | % | | £m | % | | £m | % |
| Central and local governments | | | | | | | | | | | | | | |
- UK | 124 | 1.0 | | 1,473 | 1.1 | | 1,253 | 2.8 | | 1,897 | 3.8 | | 4,747 | 2.6 |
- US | 241 | 0.3 | | 3,126 | 2.4 | | 1,863 | 2.0 | | — | — | | 5,230 | 2.2 |
- other | 4,838 | 1.1 | | 2,784 | 3.1 | | 2,023 | 1.8 | | 1,413 | 3.0 | | 11,058 | 2.0 |
| Banks | 1,610 | 0.8 | | 571 | 1.1 | | 960 | 1.3 | | 263 | 1.6 | | 3,404 | 1.0 |
| Other financial institutions | 1,237 | 0.5 | | 1,062 | 0.5 | | 1,599 | 1.3 | | 1,175 | 0.6 | | 5,073 | 0.8 |
| Corporate | 127 | 0.2 | | 34 | 0.7 | | — | — | | — | — | | 161 | 0.3 |
| | 8,177 | 0.9 | | 9,050 | 2.1 | | 7,698 | 1.8 | | 4,748 | 2.7 | | 29,673 | 1.8 |
| | | | | | | | | | | | | | | |
Of which ABS (1) | 403 | 0.2 | | 866 | 0.3 | | 1,515 | 0.2 | | 824 | 0.5 | | 3,608 | 0.3 |
| Central and local governments | | | | | | | | | | | | | | |
- UK | 251 | 4.4 | | 1,792 | 2.3 | | 3,167 | 3.0 | | 1,226 | 3.4 | | 6,436 | 2.9 |
- US | 896 | 1.7 | | 6,011 | 2.7 | | 2,892 | 2.7 | | 3,081 | 2.4 | | 12,880 | 2.6 |
- other | 2,347 | 1.3 | | 4,417 | 2.7 | | 1,745 | 2.5 | | 1,794 | 3.7 | | 10,303 | 2.5 |
| Banks | 2,071 | 1.1 | | 3,284 | 1.2 | | 438 | 3.7 | | 181 | 1.9 | | 5,974 | 1.4 |
| Other financial institutions | 1,013 | 1.7 | | 3,416 | 2.4 | | 3,950 | 2.8 | | 8,951 | 1.8 | | 17,330 | 2.1 |
| Corporate | 1 | 0.1 | | 69 | 1.3 | | 114 | 6.9 | | - | - | | 184 | 4.8 |
| | 6,579 | 1.5 | | 18,989 | 2.3 | | 12,306 | 2.9 | | 15,233 | 2.3 | | 53,107 | 2.3 |
| | | | | | | | | | | | | | | |
Of which ABS (1) | 920 | 2.1 | | 5,781 | 2.1 | | 5,346 | 3.0 | | 12,127 | 2.0 | | 24,174 | 2.3 |
| 2012 | |
| Central and local governments | | | | | | | | | | | | | | |
- UK | — | — | | 1,559 | 2.0 | | 4,105 | 3.3 | | 2,286 | 3.5 | | 7,950 | 3.1 |
- US | 139 | 2.4 | | 10,633 | 2.3 | | 6,022 | 2.4 | | 2,246 | 2.5 | | 19,040 | 2.3 |
- other | 3,346 | 0.6 | | 5,849 | 3.0 | | 5,273 | 3.0 | | 1,527 | 3.4 | | 15,995 | 2.6 |
| Banks | 1,764 | 1.6 | | 3,294 | 2.8 | | 1,685 | 1.2 | | 484 | 1.6 | | 7,227 | 2.1 |
| Other financial institutions | 741 | 3.0 | | 5,289 | 2.5 | | 4,378 | 3.0 | | 12,886 | 1.4 | | 23,294 | 2.0 |
| Corporate | 25 | 2.5 | | 140 | 2.4 | | 66 | 1.2 | | — | — | | 231 | 2.0 |
| | 6,015 | 1.2 | | 26,764 | 2.5 | | 21,529 | 2.7 | | 19,429 | 2.0 | | 73,737 | 2.3 |
| | | | | | | | | | | | | | | |
Of which ABS (1) | 1,385 | 1.8 | | 6,413 | 2.9 | | 6,773 | 2.4 | | 15,613 | 1.4 | | 30,184 | 2.0 |
| (1) | Includes asset-backed securities issued by US federal agencies and government sponsored entities, and covered bonds. |
Notes on the consolidated accounts
| 16 Equity shares | |
| | 2014 | | 2013 | | 2012 |
| | Listed | Unlisted | Total | | Listed | Unlisted | Total | | Listed | Unlisted | Total |
| | £m | £m | £m | | £m | £m | £m | | £m | £m | £m |
| Held-for-trading | 4,709 | 112 | 4,821 | | 7,121 | 78 | 7,199 | | 13,261 | 68 | 13,329 |
| Designated as at fair value | 11 | 290 | 301 | | 172 | 228 | 400 | | 251 | 282 | 533 |
through profit or loss |
| Available-for-sale | 145 | 368 | 513 | | 196 | 1,016 | 1,212 | | 221 | 1,149 | 1,370 |
| | 4,865 | 770 | 5,635 | | 7,489 | 1,322 | 8,811 | | 13,733 | 1,499 | 15,232 |
| | | | | | | | | | | | |
| Available-for-sale | | | | | | | | | | | |
| Gross unrealised gains | 26 | 183 | 209 | | 73 | 177 | 250 | | 58 | 172 | 230 |
| Gross unrealised losses | (4) | (8) | (12) | | (9) | (10) | (19) | | (54) | (13) | (67) |
Gross gains of £175 million (2013 - £76 million; 2012 - £118 million) and gross losses of £64 million (2013 - £4 million; 2012 - £2 million) were realised on the sale of available-for-sale equity shares in continuing operations. Gross gains of £71 million in 2012 were realised on the sale of available-for-sale equity shares in discontinued operations.
Dividend income from available-for-sale equity shares was £30 million (2013 - £67 million; 2012 - £37 million) in continuing operations and £22 million (2013 - £21 million; 2012 - £22 million) in discontinued operations.
Unquoted equity investments whose fair value cannot be reliably measured are carried at cost and classified as available-for-sale financial assets. They include capital stock (redeemable at cost) in the Federal Home Loan Bank and the Federal Reserve Bank of nil (2013 - £0.6 billion; 2012 - £0.7 billion) that RBS’s banking subsidiaries in the US are required to hold; and a number of individually small shareholdings in unlisted companies. Unquoted equity shares generated no material gains or losses in 2014, 2013 or 2012.
Notes on the consolidated accounts
2014 | Goodwill £m | Purchased intangibles £m | Internally generated software £m | Total £m |
| Cost | | | | |
| At 1 January | 25,282 | 1,035 | 4,558 | 30,875 |
| Transfers to disposal groups | (8,055) | (394) | (730) | (9,179) |
| Currency translation and other adjustments | (86) | 7 | 13 | (66) |
| Additions | — | 10 | 621 | 631 |
| Disposals and write-off of fully amortised assets | (20) | (608) | (1,464) | (2,092) |
| At 31 December | 17,121 | 50 | 2,998 | 20,169 |
| | | | | |
| Accumulated amortisation and impairment | | | | |
| At 1 January | 15,143 | 917 | 2,447 | 18,507 |
| Transfers to disposal groups | (4,098) | (284) | (248) | (4,630) |
| Currency translation and other adjustments | (298) | (3) | (2) | (303) |
| Disposals and write-off of fully amortised assets | (20) | (608) | (1,450) | (2,078) |
| Charge for the year | | | | |
- continuing operations | — | 2 | 257 | 259 |
- discontinued operations | — | 21 | 79 | 100 |
| Write down of goodwill and other intangible assets | | | | |
- continuing operations | 130 | 2 | 391 | 523 |
- discontinued operations | — | — | 10 | 10 |
| At 31 December | 10,857 | 47 | 1,484 | 12,388 |
| | | | | |
| Net book value at 31 December | 6,264 | 3 | 1,514 | 7,781 |
| | | | | |
| 2013 | | | | |
| Cost | | | | |
| At 1 January | 25,288 | 1,008 | 5,010 | 31,306 |
| Transfers to disposal groups | — | (43) | (24) | (67) |
| Currency translation and other adjustments | (5) | 5 | (14) | (14) |
| Additions | — | 84 | 907 | 991 |
| Disposals and write-off of fully amortised assets | (1) | (19) | (1,321) | (1,341) |
| At 31 December | 25,282 | 1,035 | 4,558 | 30,875 |
| | | | | |
| Accumulated amortisation and impairment | | | | |
| At 1 January | 14,022 | 679 | 3,060 | 17,761 |
| Transfers to disposal groups | — | (9) | (1) | (10) |
| Currency translation and other adjustments | 62 | (24) | (10) | 28 |
| Disposals and write-off of fully amortised assets | — | (11) | (1,221) | (1,232) |
| Charge for the year | | | | |
- continuing operations | — | 147 | 341 | 488 |
- discontinued operations | — | 6 | 63 | 69 |
| Write down of goodwill and other intangible assets | | | | |
- continuing operations | 1,059 | 129 | 215 | 1,403 |
- discontinued operations | — | — | — | — |
| At 31 December | 15,143 | 917 | 2,447 | 18,507 |
| | | | | |
| Net book value at 31 December | 10,139 | 118 | 2,111 | 12,368 |
Notes on the consolidated accounts
| | Goodwill | Purchased intangibles | Internally generated software | Total |
| 2012 | £m | £m | £m | £m |
| Cost | | | | |
| At 1 January | 26,843 | 3,052 | 5,448 | 35,343 |
| Transfers to disposal groups | (984) | (15) | (341) | (1,340) |
| Currency translation and other adjustments | (486) | (90) | (368) | (944) |
| Acquisition of subsidiaries | — | — | 5 | 5 |
| Additions | — | 39 | 909 | 948 |
| Disposals and write-off of fully amortised assets | (85) | (1,978) | (643) | (2,706) |
| At 31 December | 25,288 | 1,008 | 5,010 | 31,306 |
| | | | | |
| Accumulated amortisation and impairment | | | | |
| At 1 January | 14,419 | 2,446 | 3,620 | 20,485 |
| Transfers to disposal groups | (444) | (10) | (136) | (590) |
| Currency translation and other adjustments | (289) | (68) | (356) | (713) |
| Disposals and write-off of fully amortised assets | (76) | (1,968) | (638) | (2,682) |
| Charge for the year | | | | |
- continuing operations | — | 137 | 479 | 616 |
- discontinued operations | — | 41 | 86 | 127 |
| Write down of goodwill and other intangible assets | | | | |
- continuing operations | 18 | 101 | 5 | 124 |
- discontinued operations | 394 | — | — | 394 |
| At 31 December | 14,022 | 679 | 3,060 | 17,761 |
| | | | | |
| Net book value at 31 December | 11,266 | 329 | 1,950 | 13,545 |
The Group's goodwill acquired in business combinations is reviewed annually at 30 September for impairment by comparing the recoverable amount of each cash-generating unit (CGU) to which goodwill has been allocated with its carrying value.
Impairment testing involves the comparison of the carrying value of a CGU or group of CGUs with its recoverable amount. Recoverable amount is the higher of fair value and value in use. Value in use is the present value of expected future cash flows from the CGU or group of CGUs. Fair value is the price that would be received to sell an asset in an orderly transaction between market participants.
Impairment testing inherently involves a number of judgmental areas: the preparation of cash flow forecasts for periods that are beyond the normal requirements of management reporting; the assessment of the discount rate appropriate to the business; estimation of the fair value of CGUs; and the valuation of the separable assets of each business whose goodwill is being reviewed. Sensitivity to the more significant variables in each assessment are presented in the tables on the following page.
The recoverable amounts for all CGUs at 30 September 2014 were based on the value in use test, using management's latest five-year forecasts. The long-term growth rates have been based on respective country nominal GDP growth rates. The risk discount rates are based on observable market long-term government bond yields and average industry betas adjusted for an appropriate risk premium.
The results of the annual impairment test for 2013 and 2012 are presented using the reportable segments for those years which differ as a result of the changes to RBS’s structure implemented in 2014.
Following the change in reportable segments in 2014, the £2.8 billion goodwill attributed to UK Corporate was allocated to Commercial Banking (£2.1 billion), UK Personal & Business Banking (£0.6 billion) and Corporate & Institutional Banking (£0.1 billion). All UK Retail, Wealth and US Retail & Commercial goodwill was allocated to UK Personal & Business Banking, Private Banking and Citizens Financial Group respectively. The goodwill allocated to Corporate & Institutional Banking was written off immediately following re-segmentation. The change in reportable segments in 2014 did not impact the impairment tests performed in 2013 and 2012.
The analysis of goodwill by reportable segment is shown in Note 38.
Notes on the consolidated accounts
The carrying value of goodwill and amount by which it is exceeded by the recoverable amount is set out below by reportable segment along with the key assumptions applied in calculating the recoverable amount and sensitivities to changes in those assumptions.
| | | | | | | | | Consequential |
| | | | | | Consequential impact of 1% | | impact of 5% |
| | | Assumptions | Recoverable | adverse movement in | | adverse movement |
| | | Terminal | Pre-tax | amount exceeded | Discount | Terminal | | in forecast |
| | Goodwill | growth rate | discount rate | carrying value | rate | growth rate | | pre-tax earnings |
| September 2014 | £bn | % | % | £bn | £bn | £bn | | £bn |
| UK Personal & Business Banking | 3.4 | 4.5 | 11.5 | 17.6 | (3.6) | (2.5) | | (1.6) |
| Commercial Banking | 2.1 | 4.5 | 11.7 | 3.0 | (1.9) | (0.9) | | (1.0) |
| Private Banking | 0.8 | 4.5 | 11.4 | 0.7 | (0.5) | (0.3) | | (0.2) |
| Citizens Financial Group | 3.8 | 5.0 | 14.4 | 0.3 | (1.1) | (0.7) | | (0.7) |
| | | | | | | | | |
| September 2013 | | | | | | | | |
| UK Retail | 2.8 | 4.4 | 10.4 | 20.4 | (4.2) | (3.3) | | (1.7) |
| UK Corporate | 2.8 | 4.4 | 10.5 | 7.3 | (3.3) | (2.1) | | (1.6) |
| Wealth | 0.8 | 4.4 | 12.0 | 0.7 | (0.4) | (0.3) | | (0.2) |
| US Retail & Commercial | 3.8 | 4.8 | 12.8 | 4.1 | (1.5) | (0.8) | | (0.8) |
| September 2012 | | | | | | | | |
| UK Retail | 2.8 | 4.7 | 13.5 | 13.8 | (2.5) | (2.4) | | (1.3) |
| UK Corporate | 2.8 | 4.7 | 13.5 | 6.3 | (2.3) | (1.8) | | (1.4) |
| Wealth | 0.8 | 4.7 | 14.8 | 1.9 | (0.5) | (0.4) | | (0.3) |
| International Banking | 1.0 | 4.7 | 12.2 | 0.3 | (1.1) | (1.2) | | (0.6) |
| US Retail & Commercial | 3.8 | 5.3 | 16.9 | 2.0 | (1.2) | (0.8) | | (0.7) |
Other intangible assets are reviewed for indicators of impairment. In 2014, £401 million (2013 - £215 million; 2012 - £5 million) of previously capitalised software was written off.
Notes on the consolidated accounts
| 18 Property, plant and equipment | | | | | | | |
| | | | Long | Short | Computers | Operating | |
| | Investment | Freehold | leasehold | leasehold | and other | lease | |
| | properties | premises | premises | premises | equipment | assets | Total |
| 2014 | £m | £m | £m | £m | £m | £m | £m |
| Cost or valuation | | | | | | | |
| At 1 January | 2,633 | 2,978 | 286 | 1,732 | 4,244 | 1,899 | 13,772 |
| Transfers to disposal groups | — | (131) | — | (275) | (1,034) | (210) | (1,650) |
| Currency translation and other adjustments | (175) | 17 | (2) | 11 | 59 | 23 | (67) |
| Reclassifications | — | (8) | — | — | 8 | — | — |
| Additions | 117 | 52 | 2 | 60 | 319 | 230 | 780 |
| Expenditure on investment properties | 13 | — | — | — | — | — | 13 |
| Change in fair value of investment properties | | | | | | | |
- continuing operations | (25) | — | — | — | — | — | (25) |
| Disposals and write-off of fully depreciated assets | (630) | (48) | (46) | (194) | (614) | (391) | (1,923) |
| At 31 December | 1,933 | 2,860 | 240 | 1,334 | 2,982 | 1,551 | 10,900 |
| | | | | | | | |
| Accumulated impairment, depreciation and amortisation | | | | | | | |
| At 1 January | — | 963 | 169 | 980 | 2,981 | 770 | 5,863 |
| Transfers to disposal groups | — | (41) | — | (205) | (800) | (55) | (1,101) |
| Currency translation and other adjustments | — | 1 | (6) | 7 | 50 | 7 | 59 |
| Reclassifications | — | — | — | 1 | (1) | — | — |
| Write down of property, plant and equipment | — | 4 | — | 2 | 4 | — | 10 |
| Disposals and write-off of fully depreciated assets | — | (20) | (42) | (103) | (449) | (234) | (848) |
| Charge for the year | | | | | | | |
- continuing operations | — | 95 | 9 | 97 | 305 | 165 | 671 |
- discontinued operations | — | 4 | — | 19 | 47 | 9 | 79 |
| At 31 December | — | 1,006 | 130 | 798 | 2,137 | 662 | 4,733 |
| | | | | | | | |
| Net book value at 31 December | 1,933 | 1,854 | 110 | 536 | 845 | 889 | 6,167 |
| | | | | | | | |
| 2013 | | | | | | | |
| Cost or valuation | | | | | | | |
| At 1 January | 3,111 | 2,998 | 289 | 1,732 | 4,606 | 3,325 | 16,061 |
| Transfers to disposal groups | (26) | (30) | — | (12) | (45) | — | (113) |
| Currency translation and other adjustments | 34 | (10) | (2) | (15) | (42) | (1) | (36) |
| Reclassifications | — | 5 | — | 4 | (9) | — | — |
| Additions | 121 | 49 | 9 | 102 | 411 | 60 | 752 |
| Expenditure on investment properties | 13 | — | — | — | — | — | 13 |
| Change in fair value of investment properties | | | | | | | |
- continuing operations | (281) | — | — | — | — | — | (281) |
- discontinued operations | — | — | — | — | — | — | — |
| Disposals and write-off of fully depreciated assets | (339) | (34) | (10) | (79) | (677) | (1,485) | (2,624) |
| At 31 December | 2,633 | 2,978 | 286 | 1,732 | 4,244 | 1,899 | 13,772 |
| | | | | | | | |
| Accumulated impairment, depreciation and amortisation | | | | | | | |
| At 1 January | — | 852 | 151 | 924 | 3,228 | 1,122 | 6,277 |
| Transfers to disposal groups | — | (6) | — | (9) | (35) | — | (50) |
| Currency translation and other adjustments | — | 4 | 5 | (7) | (35) | (4) | (37) |
| Write down of property, plant and equipment | — | 15 | 3 | — | — | — | 18 |
| Disposals and write-off of fully depreciated assets | — | (12) | (1) | (65) | (561) | (559) | (1,198) |
| Charge for the year | | | | | | | |
- continuing operations | — | 104 | 11 | 115 | 324 | 205 | 759 |
- discontinued operations | — | 6 | — | 22 | 60 | 6 | 94 |
| At 31 December | — | 963 | 169 | 980 | 2,981 | 770 | 5,863 |
| | | | | | | | |
| Net book value at 31 December | 2,633 | 2,015 | 117 | 752 | 1,263 | 1,129 | 7,909 |
Notes on the consolidated accounts
| | | | Long | Short | Computers | Operating | |
| | Investment | Freehold | leasehold | leasehold | and other | lease | |
| | properties | premises | premises | premises | equipment | assets | Total |
| 2012 | £m | £m | £m | £m | £m | £m | £m |
| Cost or valuation | | | | | | | |
| At 1 January | 4,468 | 2,855 | 273 | 1,823 | 4,479 | 3,892 | 17,790 |
| Transfers (to)/from disposal groups | (129) | 101 | 11 | 95 | (135) | — | (57) |
| Currency translation and other adjustments | (51) | 21 | 13 | (124) | (182) | (53) | (376) |
| Reclassifications | 24 | (47) | 21 | (6) | 8 | — | — |
| Additions | 372 | 153 | 8 | 121 | 519 | 402 | 1,575 |
| Expenditure on investment properties | 10 | — | — | — | — | — | 10 |
| Change in fair value of investment properties | | | | | | | |
- continuing operations | (153) | — | — | — | — | — | (153) |
- discontinued operations | (5) | — | — | — | — | — | (5) |
| Disposals and write-off of fully depreciated assets | (1,425) | (85) | (37) | (177) | (83) | (916) | (2,723) |
| At 31 December | 3,111 | 2,998 | 289 | 1,732 | 4,606 | 3,325 | 16,061 |
| | | | | | | | |
| Accumulated impairment, depreciation and amortisation | | | | | | | |
| At 1 January | — | 736 | 114 | 850 | 3,035 | 1,187 | 5,922 |
| Transfers from/(to) disposal groups | — | 43 | 6 | 66 | (65) | — | 50 |
| Currency translation and other adjustments | — | (9) | 11 | (114) | (157) | (21) | (290) |
| Reclassifications | — | (7) | 7 | — | — | — | — |
| Write down of property, plant and equipment | — | 9 | 7 | 1 | — | — | 17 |
| Disposals and write-off of fully depreciated assets | — | (15) | (4) | (16) | (36) | (462) | (533) |
| Charge for the year | | | | | | | |
- continuing operations | — | 88 | 10 | 114 | 365 | 410 | 987 |
- discontinued operations | — | 7 | — | 23 | 86 | 8 | 124 |
| At 31 December | — | 852 | 151 | 924 | 3,228 | 1,122 | 6,277 |
| | | | | | | | |
| Net book value at 31 December | 3,111 | 2,146 | 138 | 808 | 1,378 | 2,203 | 9,784 |
Investment property valuations principally employ present value techniques that discount expected cash flows. Expected cash flows reflect rental income, occupancy and residual market values; valuations are sensitive to changes in these factors. The fair value measurement of non-specialised properties in locations where the market for such properties is active and transparent are categorised as level 2 - 78% (2013 - 46%); otherwise investment property fair value measurements are categorised as level 3 - 22% (2013 - 54%).
Valuations were carried out by qualified surveyors who are members of the Royal Institution of Chartered Surveyors, or an equivalent overseas body; property with a fair value of £932 million (2013 - £985 million) was valued by independent valuers.
The fair value of investment properties includes £235 million of depreciation since purchase (2013 - £271 million; 2012 - £186 million).
Rental income from investment properties in continuing operations was £217 million (2013 - £244 million; 2012 - £267 million). Direct operating expenses of investment properties in continuing operations were £81 million (2013 - £91 million; 2012 - £125 million).
Property, plant and equipment, excluding investment properties, include £2 million (2013 - £42 million; 2012 - £35 million) assets in the course of construction.
| 19 Prepayments, accrued income and other assets | | | |
| | 2014 | 2013 | 2012 |
| | £m | £m | £m |
| Prepayments | 623 | 612 | 904 |
| Accrued income | 486 | 530 | 526 |
| Tax recoverable | 342 | 337 | 231 |
| Pension schemes in net surplus (see Note 4) | 295 | 214 | 144 |
| Interests in associates | 1,054 | 902 | 776 |
| Other assets | 3,078 | 5,019 | 5,239 |
| | 5,878 | 7,614 | 7,820 |
Notes on the consolidated accounts
20 Discontinued operations and assets and liabilities of disposal groups
In accordance with a commitment to the EC to sell Citizens Financial Group, Inc. (Citizens) by 31 December 2016, RBS disposed of 29.5% of its interest in Citizens during the second half of 2014 primarily through an initial public offering in the USA. RBS plans to cede control by the end of 2015 and therefore Citizens is classified as a disposal group and its results presented as discontinued operations, with comparatives re-presented.
On reclassification to disposal groups at 31 December 2014, the carrying value of Citizens exceeded its fair value less costs to sell (Fair Value Hierarchy level 2: based on the quoted price of shares in Citizens Financial Group, Inc.) by £3,994 million and the carrying value of the assets and liabilities of the disposal group has been adjusted by this amount. This loss has been attributed to the intangible assets of the disposal group.
| (a) Loss/(profit) from discontinued operations, net of tax | | | |
| | 2014 | 2013 | 2012 |
| | £m | £m | £m |
| Citizens | | | |
| Interest income | 2,204 | 2,252 | 2,447 |
| Interest expense | (191) | (288) | (401) |
| Net interest income | 2,013 | 1,964 | 2,046 |
| Other income | 1,043 | 1,056 | 1,180 |
| Total income | 3,056 | 3,020 | 3,226 |
| Operating expenses | (2,123) | (2,102) | (2,182) |
| Profit before impairment losses | 933 | 918 | 1,044 |
| Impairment losses | (197) | (312) | (269) |
| Operating profit/(loss) before tax | 736 | 606 | 775 |
| Tax charge | (228) | (196) | (285) |
| Profit after tax | 508 | 410 | 490 |
| Loss on reclassification to disposal groups | (3,994) | — | — |
| (Loss)/profit from Citizens discontinued operations, net of tax | (3,486) | 410 | 490 |
| | | | |
| Other | | | |
| Net premium income | — | 699 | 3,718 |
| Other income from insurance business | — | 62 | (16) |
| Insurance income | — | 761 | 3,702 |
| Other income | 24 | 26 | 29 |
| Total income | 24 | 787 | 3,731 |
| Operating expenses | (2) | (172) | (1,409) |
| Profit before insurance net claims and impairment losses | 22 | 615 | 2,322 |
| Insurance net claims | — | (445) | (2,427) |
| Impairment losses | — | — | (4) |
| Operating profit/(loss) before tax | 22 | 170 | (109) |
| Tax charge | (10) | (29) | (61) |
| Profit/(loss) after tax | 12 | 141 | (170) |
| | | | |
| Businesses acquired exclusively with a view to disposal | | | |
| Profit/(loss) after tax | 29 | 7 | (2) |
| Profit from other discontinued operations, net of tax | 41 | 148 | (172) |
Other discontinued operations reflect the results of Direct Line Insurance Group plc (DLG) presented as a discontinued operation until 12 March 2013 and as an associate thereafter and the results of RFS Holdings attributable to the State of the Netherlands and Santander following the legal separation of ABN AMRO Bank N.V. on 1 April 2010. The profit from discontinued operations includes a gain of £82 million (2013 - £37 million gain; 2012 - £112 million loss) attributable to non-controlling interests.
Notes on the consolidated accounts
(b) Cash flows attributable to discontinued operations
Included within RBS’s cash flows are the following amounts attributable to discontinued operations:
| | 2014 | 2013 | 2012 |
| | £m | £m | £m |
| Net cash flows from operating activities | 3,997 | 359 | (2,410) |
| Net cash flows from investing activities | (4,194) | (1,172) | 3,910 |
| Net cash flows from financing activities | 596 | (355) | (827) |
| Net increase/(decrease) in cash and cash equivalents | 129 | (218) | 1 |
| (c) Assets and liabilities of disposal groups | |
| | 2014 | | |
| | Citizens | Other | Total | 2013 | 2012 |
| | £m | £m | £m | £m | £m |
| Assets of disposal groups | | | | | |
| Cash and balances at central banks | 622 | — | 622 | 2 | 18 |
| Loans and advances to banks | 1,728 | 17 | 1,745 | 63 | 2,112 |
| Loans and advances to customers | 59,606 | 944 | 60,550 | 1,765 | 1,863 |
| Debt securities and equity shares | 15,865 | — | 15,865 | 24 | 7,191 |
| Derivatives | 402 | — | 402 | 1 | 15 |
| Intangible assets | 555 | 28 | 583 | 30 | 750 |
| Property, plant and equipment | 503 | 46 | 549 | 32 | 223 |
| Interests in associates | — | — | — | 879 | — |
| Other assets | 1,686 | 9 | 1,695 | 58 | 1,666 |
| Discontinued operations and other disposal groups | 80,967 | 1,044 | 82,011 | 2,854 | 13,838 |
| Assets acquired exclusively with a view to disposal | — | — | — | 163 | 175 |
| | 80,967 | 1,044 | 82,011 | 3,017 | 14,013 |
| | | | | | |
| Liabilities of disposal groups | | | | | |
| Deposits by banks | 6,794 | — | 6,794 | — | 1 |
| Customer accounts | 61,256 | 33 | 61,289 | 3,273 | 753 |
| Debt securities in issue | 1,625 | — | 1,625 | — | — |
| Derivatives | 144 | — | 144 | 1 | 7 |
| Insurance liabilities | — | — | — | — | 6,193 |
| Subordinated liabilities | 226 | — | 226 | — | 529 |
| Other liabilities | 1,223 | 19 | 1,242 | 102 | 2,679 |
| Discontinued operations and other disposal groups | 71,268 | 52 | 71,320 | 3,376 | 10,162 |
| Liabilities acquired exclusively with a view to disposal | — | — | — | 2 | 8 |
| | 71,268 | 52 | 71,320 | 3,378 | 10,170 |
Citizens is included in disposal groups at 31 December 2014.
DLG is included in disposal groups at 31 December 2013 and 2012. In addition, disposal groups at 31 December 2013 include the Chicago area retail branches, small business operations and select middle market relationships in the Chicago market which form part of CFG. No adjustment was required to the carrying value of these assets and liabilities on reclassification.
Notes on the consolidated accounts
| (d) Financial instruments: Classification and valuation hierarchy | |
| | 2014 |
Citizens | Carrying value £bn | Fair value £bn | Fair value approximates carrying value £bn | Level 2 £bn | Level 3 £bn |
| Assets | | | | | |
| Cash and balances at central banks - loans and receivables | 0.6 | 0.6 | 0.6 | | |
| Loans and advances | | | | | |
| - held-for-trading | 0.2 | 0.2 | | 0.2 | |
| - loans and receivables | 58.4 | | | | |
| - finance leases | 2.7 | | | | |
| | 61.1 | 61.1 | | 1.7 | 59.4 |
| Debt securities - available-for-sale | 15.3 | 15.3 | | 15.3 | |
| Equity shares - available-for-sale | 0.6 | 0.6 | | 0.6 | |
| Derivatives | 0.4 | 0.4 | | 0.4 | |
| | | | | | |
| Liabilities | | | | | |
| Deposits by banks - held-for-trading | 1.7 | 1.7 | | 1.7 | |
| Deposits by banks - amortised cost | | | | | |
| - demand deposits | 0.1 | 0.1 | 0.1 | | |
| - other | 5.0 | 5.0 | | 5.0 | |
| Customer accounts - amortised cost | | | | | |
| - demand deposits | 28.9 | 28.9 | 28.9 | | |
| - other | 32.4 | 32.4 | | 32.4 | |
| Debt securities in issue - amortised cost | 1.6 | 1.6 | | 1.6 | |
| Derivatives | 0.1 | 0.1 | | 0.1 | |
| Subordinated liabilities - amortised cost | 0.2 | 0.2 | | 0.2 | |
Fair values have been established in accordance with Accounting policy 14 (page 348) and 16 (page 349), and Note 11.
Notes on the consolidated accounts
| 21 Short positions | | | |
| | 2014 | 2013 | 2012 |
| | £m | £m | £m |
| Debt securities | | | |
- Government | 20,856 | 24,661 | 23,551 |
- Other issuers | 1,962 | 3,102 | 3,429 |
| Equity shares | 211 | 259 | 611 |
| | 23,029 | 28,022 | 27,591 |
| (1) | All short positions are classified as held-for-trading. |
| 22 Accruals, deferred income and other liabilities | | | |
| | 2014 | 2013 | 2012 |
| | £m | £m | £m |
| Notes in circulation | 1,803 | 1,759 | 1,684 |
| Current tax | 586 | 516 | 527 |
| Accruals | 2,833 | 3,116 | 3,579 |
| Deferred income | 502 | 589 | 875 |
| Provisions for liabilities and charges (see table below) | 4,774 | 5,489 | 3,147 |
Other liabilities (1) | 2,848 | 4,548 | 4,989 |
| | 13,346 | 16,017 | 14,801 |
| (1) | Other liabilities include £28 million (2013 - £25 million; 2012 - £24 million) in respect of share-based compensation. |
| | | | Regulatory and legal actions | | |
| Provisions for liabilities and charges | Payment protection insurance (1) £m | Interest rate hedging products (2) £m | Other customer redress (3) £m | LIBOR (4) £m | FX investigations (5) £m | Other regulatory provisions (5) £m | Litigation (6) £m | Property and other (7) £m | Total £m |
| At 1 January 2014 | 926 | 1,077 | 337 | 416 | — | 150 | 2,018 | 565 | 5,489 |
| Transfer from accruals and other liabilities | — | — | 52 | — | — | — | — | 10 | 62 |
| Transfers to disposal groups | — | — | (53) | — | — | — | (4) | — | (57) |
| Currency translation and other movements | — | — | (7) | (2) | 2 | 4 | 107 | (7) | 97 |
| Charge to income statement | | | | | | | | | |
- continuing operations | 650 | 208 | 444 | — | 720 | 100 | 236 | 528 | 2,886 |
- discontinued operations | — | — | — | — | — | — | 4 | — | 4 |
| Releases to income statement | | | | | | | | | |
- continuing operations | — | (23) | (18) | — | — | — | (33) | (75) | (149) |
- discontinued operations | — | — | — | — | — | — | (30) | — | (30) |
| Provisions utilised | (777) | (838) | (175) | (414) | (402) | (71) | (493) | (358) | (3,528) |
| At 31 December 2014 | 799 | 424 | 580 | — | 320 | 183 | 1,805 | 663 | 4,774 |
| (1) | To reflect current experience of PPI complaints received, the Group increased its provision for PPI by £650 million in 2014 (2013 - £900 million; 2012 - £1,110 million), bringing the cumulative charge to £3.7 billion, of which £2.9 billion (79%) in redress had been paid by 31 December 2014. Of the £3.7 billion cumulative charge, £3.4 billion relates to redress and £0.3 billion to administrative expenses. |
The principal assumptions underlying the Group’s provision in respect of PPI sales are: assessment of the total number of complaints that the Group will receive; the proportion of these that will result in redress; and the average cost of such redress. The number of complaints has been estimated from an analysis of the Group’s portfolio of PPI policies sold by vintage and by product. Estimates of the percentage of policyholders that will lodge complaints (the take up rate) and of the number of these that will be upheld (the uphold rate) have been established based on recent experience, guidance in FSA policy statements and the expected rate of responses from proactive customer contact. The average redress assumption is based on recent experience and FSA calculation rules. The table below shows the sensitivity of the provision to changes in the principal assumptions (all other assumptions remaining the same).
Notes on the consolidated accounts
| | | Sensitivity |
| Assumption | Actual to date | Current assumptions | Change in assumption % | Consequential change in provision £m |
| Single premium book past business review take up rate | 49% | 52% | +/-5 | +/-56 |
Uphold rate (1) | 90% | 89% | +/-5 | +/-25 |
| Average redress | £1,700 | £1,660 | +/-5 | +/-26 |
Note:
(1) Uphold rates exclude claims where no PPI policy was held.
Interest that will be payable on successful complaints has been included in the provision as has the estimated cost to the Group of administering the redress process. The Group expects the majority of the cash outflows associated with the remaining provision to have occurred by Q2 2016. There are uncertainties as to the eventual cost of redress which will depend on actual complaint volumes, take up and uphold rates and average redress costs.
Background information in relation to PPI claims is given in Note 32.
| (2) | The Group has estimated £1,435 million for its liability in respect of the sale of Interest Rate Hedging Products based on experience, having now agreed all outcomes with the independent skilled person appointed to review all decisions. The provision includes redress that will be paid to customers, consequential loss (including interest) on customer redress, the cost to the Group of exiting the hedging positions and the cost of undertaking the review. |
In 2014, the Group increased its provision by £185 million (2013 - £550 million; 2012 - £700 million), principally reflecting a marginal increase in redress experience compared to expectations and the cost of a small number of consequential loss claims over and above interest offered as part of basic redress payments. The outcomes of all cases have now been agreed with the independent skilled person appointed to review all decisions.
The cumulative charge for IRHP is £1.4 billion, of which £1.1 billion relates to redress and £0.3 billion to administrative expenses.
The principal assumptions underlying the Group’s provision are:
| · | the proportion of relevant customers with interest rate caps that will ask to be included in the review |
| · | the type of consequential loss claims that will be received |
| · | movements in market rates that will impact the cost of closing out legacy hedging positions |
Uncertainties remain over the number of transactions that will qualify for redress and the nature and cost of that redress, including the cost of consequential loss claims.
Background information in relation to Interest Rate Hedging Products claims is given in Note 32.
| (3) | The Group has provided for other customer redress, primarily in relation to investment advice in retail and private banking (£190 million) and packaged accounts (£150 million). |
| (4) | On 6 February 2013, the Group reached agreement with the FSA, the US Department of Justice and the Commodity Futures Trading Commission in relation to the setting of LIBOR and other trading rates, including financial penalties of £381 million. In December 2013, the Group agreed to pay settlement penalties of approximately €260 million and €131 million to resolve investigations by the European Commission into Yen LIBOR competition infringements and EURIBOR competition infringements respectively. For further details see Note 32. |
| (5) | The Group is party to certain legal proceedings and regulatory investigations and continues to co-operate with a number of regulators. All such matters are periodically reassessed with the assistance of external professional advisers, where appropriate, to determine the likelihood of the Group incurring a liability and to evaluate the extent to which a reliable estimate of any liability can be made. An additional charge of £820 million was booked in 2014 (2013 - £124 million; 2012 - £75 million), primarily relating to investigations into the foreign exchange market, regulatory fines in connection with the June 2012 technology incident and other conduct and regulatory matters. Details of these investigations and a discussion of the nature of the associated uncertainties are given in Note 32. |
| (6) | Arising out of its normal business operations, the Group is party to legal proceedings in the United Kingdom, the United States and other jurisdictions. An additional charge of £2,050 million was recorded in 2013 as a result of greater levels of certainty on expected outcomes, primarily in respect of mortgage-backed securities and securities-related litigation following third party settlements and regulatory decisions. Detailed descriptions of the Group’s legal proceedings and discussion of the associated uncertainties are given in Note 32. |
| (7) | The property provisions principally comprise provisions for onerous lease contracts. Provision is made for future rentals payable in respect of vacant leasehold property and for any shortfall where leased property is sub-let at a rental lower than the lease rentals payable by the Group. |
Notes on the consolidated accounts
| 23 Deferred tax | | | |
| | 2014 £m | 2013 £m | 2012 £m |
| Deferred tax liability | 500 | 507 | 1,141 |
| Deferred tax asset | (1,540) | (3,478) | (3,443) |
| Net deferred tax asset | (1,040) | (2,971) | (2,302) |
| Net deferred tax asset comprised: | | | | | | | | | | | | | |
| | | | | | | Fair | Available- | | | | Tax | | |
| | | Accelerated | | | | value of | for-sale | | Cash | | losses | | |
| | | capital | | Deferred | IFRS | financial | financial | | flow | Share | carried | | |
| | Pension | allowances | Provisions | gains | transition | instruments | assets | Intangibles | hedging | schemes | forward | Other | Total |
| | £m | £m | £m | £m | £m | £m | £m | £m | £m | £m | £m | £m | £m |
| At 1 January 2013 | (803) | 1,744 | (1,071) | 385 | (160) | (8) | 135 | 227 | 577 | (12) | (3,231) | (85) | (2,302) |
| (Disposal)/acquisition of subsidiaries | — | (21) | 5 | — | — | — | — | — | — | — | — | — | (16) |
| Charge/(credit) to income statement | | | | | | | | | | | | | |
- continuing operations | 60 | (493) | (472) | (60) | 68 | 16 | (37) | (35) | 3 | 1 | 1,086 | (146) | (9) |
- discontinued operations | — | 48 | 33 | — | — | — | (23) | 39 | 51 | — | — | 57 | 205 |
| Charge/(credit) to other | | | | | | | | | | | | | |
comprehensive income | 245 | — | (3) | — | — | — | (93) | — | (633) | (1) | (348) | (3) | (836) |
| Currency translation and other | | | | | | | | | | | | | |
adjustments | — | (20) | 25 | 2 | 1 | (5) | 3 | (5) | 3 | — | (3) | (14) | (13) |
| At 1 January 2014 | (498) | 1,258 | (1,483) | 327 | (91) | 3 | (15) | 226 | 1 | (12) | (2,496) | (191) | (2,971) |
| Transfer to disposal groups | 28 | (579) | 423 | — | — | — | 60 | (276) | 48 | — | — | 33 | (263) |
| Charge/(credit) to income statement | | | | | | | | | | | | | |
- continuing operations | 47 | (181) | 878 | (4) | 50 | (18) | (5) | — | (62) | (13) | 1,019 | 22 | 1,733 |
- discontinued operations | (6) | 33 | (38) | — | — | — | (2) | 51 | 6 | — | — | 38 | 82 |
| Charge/(credit) to other | | | | | | | | | | | | | |
comprehensive income | 80 | — | — | — | — | — | 34 | — | 281 | (3) | (12) | — | 380 |
| Currency translation and other | | | | | | | | | | | | | |
adjustments | 2 | 10 | (33) | — | (6) | (13) | (6) | 4 | 6 | (2) | 10 | 27 | (1) |
| At 31 December 2014 | (347) | 541 | (253) | 323 | (47) | (28) | 66 | 5 | 280 | (30) | (1,479) | (71) | (1,040) |
Deferred tax assets in respect of unused tax losses are recognised if the losses can be used to offset probable future taxable profits after taking into account the expected reversal of other temporary differences. Recognised deferred tax assets in respect of tax losses are analysed further below.
| | 2014 £m | 2013 £m | 2012 £m |
| UK tax losses carried forward | | | |
- The Royal Bank of Scotland plc | 489 | 1,693 | 2,654 |
- UK branch of RBS N.V. | — | — | 322 |
- National Westminster Bank Plc | 768 | 718 | 66 |
- RBS Management Services (UK) Ltd | — | — | 30 |
| | 1,257 | 2,411 | 3,072 |
| Overseas tax losses carried forward | | | |
- Ulster Bank Ireland | 222 | 74 | 72 |
- Citizens Financial Group | — | 11 | 87 |
| | 222 | 85 | 159 |
| | 1,479 | 2,496 | 3,231 |
Notes on the consolidated accounts
UK tax losses
Under UK tax rules, tax losses do not expire and can be carried forward indefinitely. In his 2014 Autumn Statement, the UK Chancellor of the Exchequer announced proposals to restrict the use of losses carried forward by UK banks to a maximum of 50% of profits in periods from April 2015 onwards. A longer recovery period of the DTA associated with UK tax losses will therefore arise, assuming that these proposals are enacted by Parliament in 2015. International Accounting Standards require the recoverability of DTAs to be considered by reference to legislation in force at the balance sheet reporting date.
The Royal Bank of Scotland plc - the deferred tax asset in respect of taxable losses brought forward at 1 January 2014 related mainly to trading losses that arose in the UK branch of RBS N.V. These were transferred following the transfer of activities of the UK Branch of RBS N.V. to The Royal Bank of Scotland plc. The UK Branch tax losses attributable to credit market write-downs during the financial crisis were principally incurred between 2007 and 2009.
The Royal Bank of Scotland plc reported a taxable profit in 2011 and tax losses in 2012 and 2013. The taxable loss for 2012 reflected the reversal of previous own credit gains offset by core banking profitability. In 2013 UK tax losses were largely attributable to loan impairment charges arising from the RCR accelerated recovery strategy recorded in the final quarter of the period. In 2014, core profitability remained strong and a taxable profit arises. A reduction in the carrying value of deferred tax assets of £701 million was recorded in 2013. In addition, deferred tax of £150 million was not recognised in respect of excess 2013 UK taxable losses. CIB restructuring will constrain the utilisation of carried forward tax losses in the near-term. Consequently, a further reduction in the carrying value of deferred tax assets of £850 million has been recorded in 2014. The bank expects that the recognised deferred tax asset of £489 million in respect of tax losses amounting to £2,445 million will be recovered by the end of 2019. The proposed UK tax law change referred to above, if enacted, is expected to extend the recovery period by approximately one year.
National Westminster Bank Plc - the deferred tax asset in respect of tax losses at 31 December 2014 relates to residual unrelieved trading losses that arose between 2009 and 2014. 60% of the losses that arose were relieved against taxable profits arising in other UK Group companies. Based on the Group’s strategic plan, the bank expects that the recognised deferred tax asset of £768 million in respect of tax losses amounting to £3,838 million will be recovered by the end of 2018. The proposed UK tax law change referred to above, if enacted, is expected to extend the recovery period by approximately two years.
Overseas tax losses
Ulster Bank Ireland - a deferred tax asset of £222 million has been recognised in respect of losses of £1,776 million (2013 - £592 million; 2012 - £575 million) of total tax losses of £8,599 million (2013 - £11,575 million; 2012 - £7,627 million) carried forward at 31 December 2013. These losses arose principally as a result of significant impairment charges that arose between 2008 and 2013 reflecting the challenging economic conditions in the Republic of Ireland during that period. Impairment charges have reduced and Ulster Bank Ireland returned to profitability during 2014. Based on the Group’s strategic plan, the losses on which a deferred tax asset has been recognised will be utilised against future taxable profits of the company by the end of 2021.
Unrecognised deferred tax
Deferred tax assets of £5,738 million (2013 - £4,942 million; 2012 - £3,827 million) have not been recognised in respect of tax losses and other temporary differences carried forward of £26,742 million (2013 - £28,099 million; 2012 - £20,432 million) in jurisdictions where doubt exists over the availability of future taxable profits. Of these losses and other temporary differences, £4,378 million expire within five years and £5,311 million thereafter. The balance of tax losses and other temporary differences carried forward has no time limit.
Deferred tax liabilities of £186 million (2013 - £186 million; 2012 - £214 million) have not been recognised in respect of retained earnings of overseas subsidiaries and held-over gains on the incorporation of overseas branches. Retained earnings of overseas subsidiaries are expected to be reinvested indefinitely or remitted to the UK free from further taxation. No taxation is expected to arise in the foreseeable future in respect of held-over gains. Changes to UK tax legislation largely exempts from UK tax overseas dividends received on or after 1 July 2009.
Notes on the consolidated accounts
| 24 Subordinated liabilities | | | |
| | 2014 | 2013 | 2012 |
| | £m | £m | £m |
| Dated loan capital | 17,028 | 17,597 | 20,210 |
| Undated loan capital | 4,771 | 5,376 | 5,488 |
| Preference shares | 1,106 | 1,039 | 1,075 |
| | 22,905 | 24,012 | 26,773 |
| The following tables analyse the remaining contractual maturity of subordinated liabilities by the final redemption date and by the next call date. |
| | | | | | | | | |
| | | 2015 | 2016 | 2017-2019 | 2020-2024 | Thereafter | Perpetual | Total |
| 2014 - final redemption | | £m | £m | £m | £m | £m | £m | £m |
| Sterling | | 700 | — | — | 381 | — | 640 | 1,721 |
| US dollar | | 926 | — | 793 | 6,371 | 2,766 | 1,948 | 12,804 |
| Euro | | 1,120 | 27 | 2,672 | 2,420 | 267 | 195 | 6,701 |
| Other | | 526 | — | 77 | 796 | — | 280 | 1,679 |
| | | 3,272 | 27 | 3,542 | 9,968 | 3,033 | 3,063 | 22,905 |
| | | | | | | | | |
| | Currently | 2015 | 2016 | 2017-2019 | 2020-2024 | Thereafter | Perpetual | Total |
| 2014 - call date | £m | £m | £m | £m | £m | £m | £m | £m |
| Sterling | 15 | 700 | 57 | 212 | 495 | 45 | 197 | 1,721 |
| US dollar | 2,871 | 1,962 | — | 2,020 | 5,007 | 944 | — | 12,804 |
| Euro | — | 1,284 | 861 | 3,893 | 347 | 267 | 49 | 6,701 |
| Other | 8 | 602 | 273 | 796 | — | — | — | 1,679 |
| | 2,894 | 4,548 | 1,191 | 6,921 | 5,849 | 1,256 | 246 | 22,905 |
| | | | | | | | | |
| | | 2014 | 2015 | 2016-2018 | 2019-2023 | Thereafter | Perpetual | Total |
| 2013 - final redemption | | £m | £m | £m | £m | £m | £m | £m |
| Sterling | | 45 | 608 | 60 | 366 | — | 785 | 1,864 |
| US dollar | | 706 | 961 | 1,386 | 4,735 | 91 | 4,486 | 12,365 |
| Euro | | 200 | 1,005 | 2,985 | 1,946 | 166 | 823 | 7,125 |
| Other | | 399 | 617 | 531 | 813 | — | 298 | 2,658 |
| | | 1,350 | 3,191 | 4,962 | 7,860 | 257 | 6,392 | 24,012 |
| | | | | | | | | |
| | Currently | 2014 | 2015 | 2016-2018 | 2019-2023 | Thereafter | Perpetual | Total |
| 2013 - call date | £m | £m | £m | £m | £m | £m | £m | £m |
| Sterling | 1 | 103 | 695 | 290 | 518 | 59 | 198 | 1,864 |
| US dollar | 3,084 | 2,701 | 426 | 1,849 | 3,447 | 848 | 10 | 12,365 |
| Euro | 326 | 1,267 | 657 | 4,098 | 560 | 166 | 51 | 7,125 |
| Other | 761 | 1,230 | 292 | 375 | — | — | — | 2,658 |
| | 4,172 | 5,301 | 2,070 | 6,612 | 4,525 | 1,073 | 259 | 24,012 |
| | | | | | | | | |
| | | 2013 | 2014 | 2015-2017 | 2018-2022 | Thereafter | Perpetual | Total |
| 2012 - final redemption | | £m | £m | £m | £m | £m | £m | £m |
| Sterling | | 214 | — | 630 | 464 | — | 994 | 2,302 |
| US dollar | | 611 | 664 | 2,388 | 3,722 | 177 | 4,409 | 11,971 |
| Euro | | 1,478 | — | 3,035 | 3,814 | 397 | 806 | 9,530 |
| Other | | 48 | 425 | 790 | 1,381 | — | 326 | 2,970 |
| | | 2,351 | 1,089 | 6,843 | 9,381 | 574 | 6,535 | 26,773 |
| | | | | | | | | |
| | Currently | 2013 | 2014 | 2015-2017 | 2018-2022 | Thereafter | Perpetual | Total |
| 2012 - call date | £m | £m | £m | £m | £m | £m | £m | £m |
| Sterling | 24 | 429 | 60 | 826 | 715 | 36 | 212 | 2,302 |
| US dollar | 2,577 | 3,546 | 664 | 1,767 | 2,408 | 1,009 | — | 11,971 |
| Euro | — | 3,509 | 289 | 2,863 | 2,427 | 397 | 45 | 9,530 |
| Other | — | 1,192 | — | 1,214 | 564 | — | — | 2,970 |
| | 2,601 | 8,676 | 1,013 | 6,670 | 6,114 | 1,442 | 257 | 26,773 |
Notes on the consolidated accounts
| Issuances and redemptions during the year (values as at date of transaction). | | | | |
| | | | | |
| | Capital | 2014 | 2013 | 2012 |
| | treatment | £m | £m | £m |
| New issues | | | | |
| The Royal Bank of Scotland Group plc | | | | |
| €1,000 million 3.625% subordinated notes 2024 | Tier 2 | 828 | — | — |
| US$2,250 million 5.125% subordinated notes 2024 | Tier 2 | 1,331 | — | — |
| US$2,000 million 6% subordinated notes 2023 | Tier 2 | — | 1,193 | — |
| US$1,000 million 6.1% subordinated notes 2023 | Tier 2 | — | 603 | — |
| US$2,250 million 6.125% subordinated notes 2022 | Tier 2 | — | — | 1,385 |
| | | | | |
| The Royal Bank of Scotland plc | | | | |
| AUD883 million 13.125% subordinated notes 2022 | Tier 2 | — | — | 590 |
| CAD420 million 10.5% subordinated notes 2022 | Tier 2 | — | — | 268 |
| CHF124 million 9.375% subordinated notes 2022 | Tier 2 | — | — | 86 |
| €564 million 10.5% subordinated notes 2022 | Tier 2 | — | — | 469 |
| US$2,132 million 9.5% subordinated notes 2022 | Tier 2 | — | — | 1,346 |
| | | | | |
| Charter One Financial, Inc | | | | |
US$350 million 4.150% subordinated notes 2022 (1) | Ineligible | — | — | 214 |
| | | 2,159 | 1,796 | 4,358 |
| | | | | |
| Redemptions | | | | |
| The Royal Bank of Scotland Group plc | | | | |
| US$750 million 5% subordinated notes | Tier 2 | 453 | — | — |
| US$250 million 5% subordinated notes | Tier 2 | 151 | — | — |
| €391 million floating rate undated notes | Tier 1 | 310 | — | — |
| US$318 million floating rate undated notes | Tier 1 | 188 | — | — |
| US$750 million 5% subordinated notes | Tier 2 | — | 464 | — |
| | | | | |
| The Royal Bank of Scotland plc | | | | |
| AUD397 million floating rate subordinated notes | Tier 2 | 217 | — | — |
| AUD265 million floating rate subordinated notes | Tier 2 | 145 | — | — |
| CAD217 million floating rate subordinated notes | Tier 2 | 94 | — | — |
| US$322 million floating rate subordinated notes | Tier 2 | 177 | — | — |
| US$229 million floating rate subordinated notes | Tier 2 | 144 | — | — |
| US$686 million floating rate subordinated notes | Tier 2 | 431 | — | — |
| €227 million floating rate subordinated notes | Tier 2 | 179 | — | — |
| (1) | Transferred to disposal groups at 31 December 2014. |
Notes on the consolidated accounts
| | Capital | 2014 | 2013 | 2012 |
| | treatment | £m | £m | £m |
Redemptions continued | | | | |
| The Royal Bank of Scotland plc continued | | | | |
| CHF34 million floating rate subordinated notes | Tier 2 | 23 | — | — |
| £56 million 6% undated notes | Tier 2 | 56 | — | — |
| €176 million floating rate undated notes | Tier 2 | 138 | — | — |
| €170 million floating rate undated notes | Tier 2 | 133 | — | — |
| £1 million floating rate undated notes | Tier 2 | 1 | — | — |
| AUD32 million floating rate subordinated notes 2017 (partial redemption) | Tier 2 | 17 | — | — |
| AUD53.7 million floating rate subordinated notes 2017 (partial redemption) | Tier 2 | 29 | — | — |
| €79.75 million floating rate notes 2017 (partial redemption) | Tier 2 | 65 | — | — |
| US$211.9 million floating rate subordinated notes 2017 (partial redemption) | Tier 2 | 129 | — | — |
| €1,000 million 6% subordinated notes | Tier 2 | — | 808 | — |
| US$50 million floating rate subordinated notes | Tier 2 | — | 31 | — |
| €500 million 6% subordinated notes | Tier 2 | — | 415 | — |
| £150 million 10.5% subordinated bonds | Tier 2 | — | 150 | — |
| AUD193 million 6% subordinated notes 2014 (partial redemption) | Tier 2 | — | — | 129 |
| AUD145 million floating rate subordinated notes (partial redemption) | Tier 2 | — | — | 97 |
| CAD483 million 4.25% subordinated notes (partial redemption) | Tier 2 | — | — | 308 |
| US$428 million floating rate subordinated notes (partial redemption) | Tier 2 | — | — | 270 |
| US$271 million floating rate subordinated notes (partial redemption) | Tier 2 | — | — | 171 |
| US$814 million floating rate subordinated notes (partial redemption) | Tier 2 | — | — | 514 |
| €273 million 4.5% subordinated (partial redemption) | Tier 2 | — | — | 227 |
| CHF166 million floating subordinated notes (partial redemption) | Tier 2 | — | — | 114 |
| €398 million floating rate subordinated notes (partial redemption) | Tier 2 | — | — | 331 |
| AUD400 million 6.5% subordinated notes (partial redemption) | Tier 2 | — | — | 267 |
| AUD360 million floating rate subordinated notes (partial redemption) | Tier 2 | — | — | 241 |
| US$1,050 million floating rate subordinated notes (partial redemption) | Tier 2 | — | — | 663 |
| | | | | |
| Charter One Financial Inc | | | | |
| US$400 million 6.375% subordinated notes | Ineligible | — | — | 258 |
| | | | | |
| Ulster Banking Group | | | | |
| £60 million floating rate subordinated notes | Tier 2 | 60 | — | — |
| | | | | |
| RBS N.V. and subsidiaries | | | | |
| AUD451.8 million 6.50% subordinated notes 2018 (partial redemption) | Tier 2 | 240 | — | — |
| AUD149.2 million 7.461% subordinated notes 2018 (partial redemption) | Tier 2 | 79 | — | — |
| US$72.8 million 6.14% subordinated notes 2019 (partial redemption) | Tier 2 | 45 | — | — |
| €100 million 5.13% flip flop subordinated notes | Tier 2 | — | 81 | — |
| €13 million zero coupon subordinated notes | Tier 2 | — | 11 | — |
| €1,085 million floating rate subordinated notes (partial redemption) | Tier 2 | — | 904 | — |
| US$9 million 6.14% subordinated notes (partial redemption) | Tier 2 | — | 5 | — |
| US$936 million floating rate subordinated notes (partial redemption) | Tier 2 | — | 566 | — |
| | | | | |
| The Royal Bank of Scotland Berhad | | | | |
| MYR200 million 4.15% subordinated notes | Ineligible | 36 | — | — |
| | | 3,540 | 3,435 | 3,590 |
RBS has now resumed payments on all discretionary non-equity capital instruments following the end of the European Commission ban in 2012 for RBSG and 2013 for RBS N.V. Future coupons and dividends on hybrid capital instruments will only be paid subject to, and in accordance with, the terms of the relevant instruments.
Certain preference shares issued by the company are classified as liabilities; these securities remain subject to the capital maintenance rules of the Companies Act 2006.
Notes on the consolidated accounts
| 25 Non-controlling interests |
| | Citizens | Direct Line | | | |
| | Financial | Insurance | ABN | Other | |
| | Group | Group plc | AMRO | interests | Total |
| | £m | £m | £m | £m | £m |
| At 1 January 2013 | — | 1,109 | 266 | 395 | 1,770 |
| Currency translation and other adjustments | — | — | (8) | 2 | (6) |
| Profit/(loss) attributable to non-controlling interests | | | | | |
- continuing operations | — | — | 95 | (12) | 83 |
- discontinued operations | — | 19 | 18 | — | 37 |
| Dividends paid | — | — | — | (5) | (5) |
| Gains on available-for-sale financial assets, net of tax | — | — | 23 | — | 23 |
| Equity withdrawn and disposals | — | (1,128) | — | (301) | (1,429) |
| At 1 January 2014 | — | — | 394 | 79 | 473 |
| Currency translation and other adjustments | 114 | — | (24) | (4) | 86 |
| (Loss)/profit attributable to non-controlling interests | | | | | |
- continuing operations | — | — | (27) | 5 | (22) |
- discontinued operations | 52 | — | 30 | — | 82 |
| Dividends paid | — | — | — | (4) | (4) |
| Gains on available-for-sale financial assets, net of tax | 24 | — | 76 | — | 100 |
| Equity raised | 2,117 | — | 115 | — | 2,232 |
| Equity withdrawn and disposals | — | — | — | (1) | (1) |
| At 31 December 2014 | 2,307 | — | 564 | 75 | 2,946 |
| 26 Share capital |
| | | | | | | | |
| | | | | | Number of shares |
| | 2014 | 2013 | 2012 | | 2014 | 2013 | 2012 |
| Allotted, called up and fully paid | £m | £m | £m | | 000s | 000s | 000s |
| Ordinary shares of £1 | 6,366 | 6,203 | 6,071 | | 6,365,896 | 6,203,022 | 6,070,765 |
| B shares of £0.01 | 510 | 510 | 510 | | 51,000,000 | 51,000,000 | 51,000,000 |
Dividend access share of £0.01 (1) | — | — | — | | — | — | — |
| Non-cumulative preference shares of US$0.01 | 1 | 1 | 1 | | 209,609 | 209,609 | 209,609 |
| Non-cumulative convertible preference shares of US$0.01 | — | — | — | | 65 | 65 | 65 |
| Non-cumulative preference shares of €0.01 | — | — | — | | 2,044 | 2,044 | 2,044 |
| Non-cumulative convertible preference shares of £0.01 | — | — | — | | 15 | 15 | 15 |
| Non-cumulative preference shares of £1 | — | — | — | | 54 | 54 | 54 |
| Cumulative preference shares of £1 | 1 | 1 | 1 | | 900 | 900 | 900 |
| (1) | One dividend access share in issue. |
| Movement in allotted, called up and fully paid ordinary shares | | | | £m | Number of shares - thousands |
| At 1 January 2013 | | | | | 6,071 | 6,070,765 |
| Shares issued | | | | | 132 | 132,257 |
| At 1 January 2014 | | | | | 6,203 | 6,203,022 |
| Shares issued | | | | | 163 | 162,874 |
| At 31 December 2014 | | | | | 6,366 | 6,365,896 |
Notes on the consolidated accounts
Ordinary shares
There is no authorised share capital under the company’s constitution. The directors have the authority to issue £17.7 billion nominal of ordinary shares in connection with a conversion of B shares. At 31 December 2014 they had a remaining authority granted at the 2014 Annual General Meeting to issue up to £256 million nominal of ordinary shares other than by pre-emption to existing shareholders.
During 2014, the company allotted and issued the following new ordinary shares of £1 each:
| Month | Number of shares | Subscription price per share | Gross proceeds |
| May | 32.8m | 305.329p | £100 million |
| July | 15.5m | 328.910p | £51 million |
| October | 23.9m | 355.890p | £85 million |
| December | 16.8m | 381.398p | £64 million |
In addition, the company issued 73.9 million ordinary shares of £1 each in connection with employee share plans.
B shares and dividend access share
In December 2009, the company entered into an acquisition and contingent capital agreement with HM Treasury. HM Treasury agreed to acquire at 50p per share 51 billion B shares with a nominal value of £0.01 each and a dividend access share with a nominal value of £0.01; these shares were issued to HM Treasury on 22 December 2009. Net proceeds were £25.1 billion.
The B shares do not generally carry voting rights at general meetings of ordinary shareholders. Following the subdivision and consolidation of ordinary shares in 2012 and subject to anti-dilution adjustments, each B share is entitled to one tenth of the cash dividend of an ordinary share and may be converted at any time at the option of the holder into ordinary shares at the rate of ten B shares for each ordinary share.
HM Treasury has agreed not to convert its B shares into ordinary shares to the extent that its holding of ordinary shares following the conversion would represent more than 75% of the company's issued ordinary share capital.
On 25 June 2014, the company’s independent shareholders approved the ‘DAS Retirement Agreement’ between RBS and HM Treasury to provide for the future retirement of the Dividend Access Share (‘DAS’). The DAS Retirement Agreement sets out terms for the removal of the DAS. Under the DAS Retirement Agreement once RBS has paid dividends on the DAS totalling £1.5 billion, it will lose its preferential rights and become a single B share.
Preference shares
Under IFRS certain of the Group's preference shares are classified as debt and are included in subordinated liabilities on the balance sheet.
Other securities
Certain of the Group's subordinated securities in the legal form of debt are classified as equity under IFRS.
These securities entitle the holders to interest which may be deferred at the sole discretion of the company. Repayment of the securities is at the sole discretion of the company on giving between 30 and 60 days notice.
Non-cumulative preference shares
Non-cumulative preference shares entitle the holders thereof (subject to the terms of issue) to receive periodic non-cumulative cash dividends at specified fixed rates for each Series payable out of distributable profits of the company.
The non-cumulative preference shares are redeemable at the option of the company, in whole or in part from time to time at the rates detailed in the table below plus dividends otherwise payable for the then current dividend period accrued to the date of redemption.
Notes on the consolidated accounts
| Class of preference share | Number of shares in issue | Interest rate | Redemption date on or after | Redemption price per share | Debt/equity (1) |
| Non-cumulative preference shares of US$0.01 | | | | | |
Series F | 6.3 million | 7.65% | 31 March 2007 | US$25 | Debt |
Series H | 9.7 million | 7.25% | 31 March 2004 | US$25 | Debt |
Series L | 30.0 million | 5.75% | 30 September 2009 | US$25 | Debt |
Series M | 23.1 million | 6.40% | 30 September 2009 | US$25 | Equity |
Series N | 22.1 million | 6.35% | 30 June 2010 | US$25 | Equity |
Series P | 9.9 million | 6.25% | 31 December 2010 | US$25 | Equity |
Series Q | 20.6 million | 6.75% | 30 June 2011 | US$25 | Equity |
Series R | 10.2 million | 6.125% | 30 December 2011 | US$25 | Equity |
Series S | 26.4 million | 6.60% | 30 June 2012 | US$25 | Equity |
Series T | 51.2 million | 7.25% | 31 December 2012 | US$25 | Equity |
Series U | 10,130 | 7.64% | 29 September 2017 | US$100,000 | Equity |
| | | | | | |
| Non-cumulative convertible preference shares of US$0.01 | | | | | |
Series 1 | 64,772 | 9.118% | 31 March 2010 | US$1,000 | Debt |
| | | | | | |
| Non-cumulative preference shares of €0.01 | | | | | |
Series 1 | 1.25 million | 5.50% | 31 December 2009 | € 1,000 | Equity |
Series 2 | 784,989 | 5.25% | 30 June 2010 | € 1,000 | Equity |
Series 3 | 9,429 | 7.0916% | 29 September 2017 | € 50,000 | Equity |
| | | | | | |
| Non-cumulative convertible preference shares of £0.01 | | | | | |
Series 1 | 14,866 | 7.387% | 31 December 2010 | £1,000 | Debt |
| | | | | | |
| Non-cumulative preference shares of £1 | | | | | |
Series 1 | 54,442 | 3 month LIBOR + 2.33% | 5 October 2012 | £1,000 | Equity |
Note:
| (1) | Those preference shares where the Group has an obligation to pay dividends are classified as debt; those where distributions are discretionary are classified as equity. The conversion rights attaching to the convertible preference shares may result in the Group delivering a variable number of equity shares to preference shareholders; these convertible preference shares are treated as debt. |
In the event that the non-cumulative convertible preference shares are not redeemed on or before the redemption date, the holder may convert them into ordinary shares in the company at the prevailing market price.
Under existing arrangements, no redemption or purchase of any non-cumulative preference shares may be made by the company without the prior consent of the Prudential Regulation Authority.
On a winding-up or liquidation of the company, the holders of the non-cumulative preference shares are entitled to receive, out of any surplus assets available for distribution to the company's shareholders (after payment of arrears of dividends on the cumulative preference shares up to the date of repayment) pari passu with the cumulative preference shares and all other shares of the company ranking pari passu with the non-cumulative preference shares as regards participation in the surplus assets of the company, a liquidation distribution per share equal to the applicable redemption price detailed in the table above, together with an amount equal to dividends for the then current dividend period accrued to the date of payment, before any distribution or payment may be made to holders of the ordinary shares as regards participation in the surplus assets of the company.
Except as described above, the holders of the non-cumulative preference shares have no right to participate in the surplus assets of the company. Holders of the non-cumulative preference shares are not entitled to receive notice of or attend general meetings of the company except if any resolution is proposed for adoption by the shareholders of the company to vary or abrogate any of the rights attaching to the non-cumulative preference shares or proposing the winding-up or liquidation of the company. In any such case, they are entitled to receive notice of and to attend the general meeting of shareholders at which such resolution is to be proposed and are entitled to speak and vote on such resolution (but not on any other resolution). In addition, in the event that, prior to any general meeting of shareholders, the company has failed to pay in full the three most recent quarterly dividend payments due on the non-cumulative dollar preference shares (other than Series U), the two most recent semi-annual dividend payments due on the non-cumulative convertible dollar preference shares and the most recent dividend payments due on the non-cumulative euro preference shares, the non-cumulative sterling preference shares, the Series U non-cumulative dollar preference shares and the non-cumulative convertible sterling preference shares, the holders shall be entitled to receive notice of, attend, speak and vote at such meeting on all matters together with the holders of the ordinary shares. In these circumstances only, the rights of the holders of the non-cumulative preference shares so to vote shall continue until the company shall have resumed the payment in full of the dividends in arrears.
Notes on the consolidated accounts
The Group has now resumed payments on all discretionary non-equity capital instruments following the end of the European Commission ban in 2012 for RBSG and 2013 for RBS N.V. Future coupons and dividends on hybrid capital instruments will only be paid subject to, and in accordance with, the terms of the relevant instruments.
27 Other equity
Paid-in equity - comprises equity instruments issued by the company other than those legally constituted as shares.
| | 2014 | 2013 |
| | £m | £m |
| EMTN notes | | |
US$564 million 6.99% capital securities (callable October 2017) | 275 | 275 |
CAD321 million 6.666% notes (callable October 2017) | 156 | 156 |
| | | |
Trust preferred issues: subordinated notes (1) | | |
US$357 million 5.512% 2044 (callable September 2014) (2) | — | 195 |
US$276 million 3 month US$ LIBOR plus 0.80% 2044 (callable September 2014) (3) | 150 | 150 |
€166 million 4.243% 2046 (callable January 2016) (4) | 110 | 110 |
£93 million 5.6457% 2047 (callable June 2017) (5) | 93 | 93 |
| | 784 | 979 |
| (1) | Subordinated notes issued to limited partnerships that have in turn issued partnership preferred securities to trusts that have issued trust preferred securities to investors. The trust preferred securities are redeemable only at the issuer’s option and dividends are payable at the Group’s discretion. On maturity of the subordinated notes, the partnerships are required to reinvest in eligible capital instruments issued by the Group. Prior to the implementation of IFRS 10 in 2013, the limited partnerships and the trusts were consolidated and the trust preferred securities recorded as non-controlling interests. |
| (2) | Preferred securities in issue - US$357 million RBS Capital Trust III, fixed/floating non-cumulative trust preferred securities. Notice of redemption issued in December 2014. As a result, the related subordinated notes have been reclassified to liabilities. |
| (3) | Preferred securities in issue - US$276 million RBS Capital Trust IV, floating rate non-cumulative trust preferred securities. Notice of redemption issued in January 2015. |
| (4) | Preferred securities in issue - €166 million RBS Capital Trust C, fixed/floating rate non-cumulative trust preferred securities. |
| (5) | Preferred securities in issue - £93 million RBS Capital Trust D, fixed/floating rate non-cumulative trust preferred securities. |
Merger reserve - the merger reserve comprises the premium on shares issued to acquire NatWest, less goodwill amortisation charged under previous GAAP, and the premium arising on shares issued to acquire Aonach Mor Limited, less amounts realised through subsequent share redemptions by Aonach Mor Limited. No share premium was recorded in the company financial statements through the operation of the merger relief provisions of the Companies Act.
Capital redemption reserve - under UK companies legislation, when shares are redeemed or purchased wholly or partly out of the company's profits, the amount by which the company's issued share capital is diminished must be transferred to the capital redemption reserve. The capital maintenance provisions of UK companies legislation apply to the capital redemption reserve as if it were part of the company’s paid up share capital.
Contingent capital reserve - in December 2009, HM Treasury agreed to subscribe for up to 16 billion B shares of £0.01 each at 50p per share subject to certain conditions including the Group's Core Tier 1 capital ratio falling below 5%. The fair value of the consideration payable by the company on entering into this agreement amounted to £1,458 million to be settled in instalments; of this £1,208 million was debited to the contingent capital reserve. The reserve and £320 million in respect of the final instalment were transferred to Retained earnings on cancellation of the contingent capital arrangements on 16 December 2013.
Own shares held - at 31 December 2014, 28 million ordinary shares of £1 each of the company (2013 - 34 million; 2012 - 51 million) were held by employee share trusts in respect of share awards and options granted to employees. During the year the employee share trusts awarded 6.5 million ordinary shares in satisfaction of the exercise of options and the vesting of share awards under the employee share plans.
The Group optimises capital efficiency by maintaining reserves in subsidiaries, including regulated entities. Certain preference shares and subordinated debt are also included within regulatory capital. The remittance of reserves to the company or the redemption of shares or subordinated capital by regulated entities may be subject to maintaining the capital resources required by the relevant regulator.
UK law prescribes that only the reserves of the company are taken into account for the purpose of making distributions and in determining permissible applications of the share premium account.
Notes on the consolidated accounts
| 28 Leases |
| | | Operating lease |
| | Finance lease contracts and hire purchase agreements | assets: |
| | Gross | Present value | Other | Present | future minimum |
| | amounts | adjustments | movements | value | lease rentals |
| Year in which receipt will occur | £m | £m | £m | £m | £m |
| 2014 | | | | | |
| Within 1 year | 3,046 | (227) | (20) | 2,799 | 175 |
| After 1 year but within 5 years | 4,924 | (445) | (85) | 4,394 | 297 |
| After 5 years | 2,998 | (1,239) | (37) | 1,722 | 176 |
| Total | 10,968 | (1,911) | (142) | 8,915 | 648 |
| | | | | | |
| 2013 | | | | | |
| Within 1 year | 3,513 | (300) | (44) | 3,169 | 186 |
| After 1 year but within 5 years | 6,014 | (534) | (251) | 5,229 | 341 |
| After 5 years | 4,244 | (1,481) | (428) | 2,335 | 141 |
| Total | 13,771 | (2,315) | (723) | 10,733 | 668 |
| | | | | | |
| 2012 | | | | | |
| Within 1 year | 3,605 | (330) | (40) | 3,235 | 293 |
| After 1 year but within 5 years | 5,963 | (600) | (197) | 5,166 | 512 |
| After 5 years | 4,984 | (1,709) | (315) | 2,960 | 291 |
| Total | 14,552 | (2,639) | (552) | 11,361 | 1,096 |
| | 2014 £m | 2013 £m | 2012 £m |
| Nature of operating lease assets on the balance sheet | | | |
| Transportation | 570 | 822 | 1,501 |
| Cars and light commercial vehicles | 49 | 64 | 435 |
| Other | 270 | 243 | 267 |
| | 889 | 1,129 | 2,203 |
| | | | |
| Amounts recognised as income and expense in continuing operations | | | |
| Finance leases - contingent rental income | (85) | (94) | (110) |
| Operating leases - minimum rentals payable | 249 | 255 | 259 |
| | | | |
| Finance lease contracts and hire purchase agreements | | | |
| Accumulated allowance for uncollectable minimum receivables | 104 | 197 | 278 |
Amounts recognised as income and expense in discontinued operations are £124 million (2013 - £134 million; 2012 - £133 million) in relation to operating leases - minimum rentals payable.
Notes on the consolidated accounts
Residual value exposures
The table below gives details of the unguaranteed residual values included in the carrying value of finance lease receivables (see pages 366 to 368) and operating lease assets (see pages 397 and 398).
| | Year in which residual value will be recovered |
| | | After 1 year | After 2 years | | Total |
| | Within 1 | but within | but within | After 5 | |
| | year | 2 years | 5 years | years | |
| 2014 | £m | £m | £m | £m | £m |
| Operating leases | | | | | |
- transportation | 24 | 122 | 92 | 99 | 337 |
- cars and light commercial vehicles | 10 | 4 | 6 | — | 20 |
- other | 24 | 26 | 38 | 6 | 94 |
| Finance lease contracts | 20 | 24 | 59 | 37 | 140 |
| Hire purchase agreements | — | 1 | 2 | — | 3 |
| | 78 | 177 | 197 | 142 | 594 |
| | | | | | |
| 2013 | | | | | |
| Operating leases | | | | | |
- transportation | 197 | 34 | 217 | 134 | 582 |
- cars and light commercial vehicles | 18 | 8 | 7 | — | 33 |
- other | 24 | 25 | 32 | 1 | 82 |
| Finance lease contracts | 41 | 53 | 198 | 429 | 721 |
| Hire purchase agreements | — | 1 | — | 1 | 2 |
| | 280 | 121 | 454 | 565 | 1,420 |
| | | | | | |
| 2012 | | | | | |
| Operating leases | | | | | |
- transportation | 284 | 182 | 207 | 333 | 1,006 |
- cars and light commercial vehicles | 317 | 44 | 49 | 1 | 411 |
- other | 30 | 19 | 39 | 3 | 91 |
| Finance lease contracts | 38 | 47 | 148 | 318 | 551 |
| Hire purchase agreements | 1 | — | 1 | — | 2 |
| | 670 | 292 | 444 | 655 | 2,061 |
RBS provides asset finance to its customers through acting as a lessor. It purchases plant, equipment and intellectual property, renting them to customers under lease arrangements that, depending on their terms, qualify as either operating or finance leases.
Notes on the consolidated accounts
29 Structured entities
A structured entity (SE) is an entity that has been designed such that voting or similar rights are not the dominant factor in deciding who controls the entity, for example, when any voting rights relate to administrative tasks only and the relevant activities are directed by means of contractual arrangements. SEs are usually established for a specific, limited purpose. They do not carry out a business or trade and typically have no employees. They take a variety of legal forms - trusts, partnerships and companies - and fulfil many different functions. As well as being a key element of securitisations, SEs are also used in fund management activities in order to segregate custodial duties from the provision of fund management advice.
Consolidated structured entities
Securitisations
In a securitisation, assets, or interests in a pool of assets, are transferred generally to an SE which then issues liabilities to third party investors. The majority of securitisations are supported through liquidity facilities or other credit enhancements. RBS arranges securitisations to facilitate client transactions and undertakes own asset securitisations to sell or to fund portfolios of financial assets. RBS also acts as an underwriter and depositor in securitisation transactions in both client and proprietary transactions.
RBS’s involvement in client securitisations takes a number of forms. It may: sponsor or administer a securitisation programme; provide liquidity facilities or programme-wide credit enhancement; and purchase securities issued by the vehicle.
Own asset securitisations
In own-asset securitisations, the pool of assets held by the SE is either originated by RBS, or (in the case of whole loan programmes) purchased from third parties.
The table below analyses the asset categories for those own-asset securitisations where the transferred assets continue to be recorded on RBS’s balance sheet.
| | 2014 | | 2013 | | 2012 |
| | | | Debt securities in issue | | | | Debt securities in issue | | | | Debt securities in issue |
| | | | Held by third | Held by | | | | | Held by third | Held by | | | | | Held by third | Held by | |
| | Assets | parties | RBS (1) | Total | Assets | parties | RBS (1) | Total | Assets | parties | RBS (1) | Total |
| Asset type | £m | £m | £m | £m | £m | £m | £m | £m | £m | £m | £m | £m |
| Mortgages | | | | | | | | | | | | | | | | | |
- UK | 11,992 | | 3,543 | 9,877 | 13,420 | | 14,434 | | 4,876 | 10,978 | 15,854 | | 16,448 | | 6,462 | 11,963 | 18,425 |
- Irish | 8,593 | | 1,697 | 7,846 | 9,543 | | 9,300 | | 1,890 | 8,751 | 10,641 | | 10,587 | | 3,217 | 7,634 | 10,851 |
| UK credit cards | 2,717 | | — | 1,567 | 1,567 | | 3,261 | | 500 | 1,625 | 2,125 | | 3,019 | | 1,243 | 1,736 | 2,979 |
| UK personal loans | — | | — | — | — | | 3,382 | | — | 3,677 | 3,677 | | 4,658 | | — | 4,283 | 4,283 |
Other loans (2) | 5,373 | | 334 | 5,245 | 5,579 | | 12,326 | | 488 | 12,078 | 12,566 | | 18,008 | | 1,059 | 18,064 | 19,123 |
| | 28,675 | | 5,574 | 24,535 | 30,109 | | 42,703 | | 7,754 | 37,109 | 44,863 | | 52,720 | | 11,981 | 43,680 | 55,661 |
| Cash deposits | 4,616 | | | | | | 6,245 | | | | | | 5,366 | | | | |
| | 33,291 | | | | | | 48,948 | | | | | | 58,086 | | | | |
| (1) | Debt securities retained by RBS may be pledged with central banks. |
| (2) | Corporate, social housing and student loans. |
Commercial paper conduits
RBS consolidates a number of asset-backed commercial paper (ABCP) conduits. A conduit is an SE that issues commercial paper and uses the proceeds to purchase or fund a pool of assets. The commercial paper is secured on the assets and is redeemed by further commercial paper issuance, repayment of assets or funding from liquidity facilities. Commercial paper is typically short-dated, usually up to three months. At 31 December 2014 assets held by the conduits totalled £0.6 billion (2013 - £1.6 billion; 2012 - £3.6 billion). At 31 December 2014, 2013 and 2012 the conduits were funded entirely by RBS.
Covered bond programme
Certain loans and advances to customers have been assigned to bankruptcy remote limited liability partnerships to provide security for issues of debt securities by RBS. RBS retains all of the risks and rewards of these loans, the partnerships are consolidated, the loans retained on RBS’s balance sheet and the related covered bonds included within debt securities in issue. At 31 December 2014, £13,401 million of mortgages provided security for debt securities in issue of £7,114 million (2013: mortgages - £16,177 million, bonds - £9,041 million; 2012: mortgages - £15,990 million, bonds - £10,139 million).
Notes on the consolidated accounts
Unconsolidated structured entities
RBS’s interests in unconsolidated structured entities are analysed below.
| | Asset backed | Asset backed | | |
| | securitisation | securitisation | Investment | |
| | vehicles - | vehicles - | funds | |
| | sponsored | not sponsored | and other | Total |
| 2014 | £m | £m | £m | £m |
| Held-for-trading | | | | |
| Loans and advances to customers | — | 449 | 22 | 471 |
| Debt securities | 167 | 3,687 | 2 | 3,856 |
| Equity shares | — | — | 327 | 327 |
| Derivative assets | — | 1,670 | 10 | 1,680 |
| Derivative liabilities | (1) | (850) | (28) | (879) |
| Total | 166 | 4,956 | 333 | 5,455 |
| | | | | |
| Other than held-for-trading | | | | |
| Loans and advances to customers | 202 | 5,347 | 23 | 5,572 |
| Debt securities | 476 | 5,168 | 147 | 5,791 |
| Total | 678 | 10,515 | 170 | 11,363 |
| | | | | |
| Liquidity facilities/loan commitments | — | 2,759 | — | 2,759 |
| Guarantees | — | 71 | — | 71 |
| | | | | |
| Maximum exposure | 844 | 18,301 | 503 | 19,648 |
| | | | | |
| 2013 | | | | |
| Held-for-trading | | | | |
| Loans and advances to customers | 8 | 140 | 143 | 291 |
| Debt securities | 358 | 9,476 | 109 | 9,943 |
| Equity shares | — | 1 | 622 | 623 |
| Derivatives assets | 263 | 1,163 | 333 | 1,759 |
| Derivatives liabilities | (113) | (329) | (234) | (676) |
| Total | 516 | 10,451 | 973 | 11,940 |
| | | | | |
| Other than held-for-trading | | | | |
| Loans and advances to customers | 26 | 3,967 | 30 | 4,023 |
| Debt securities | 481 | 19,926 | 51 | 20,458 |
| Total | 507 | 23,893 | 81 | 24,481 |
| | | | | |
| Liquidity facilities/loan commitments | 4 | 2,830 | 34 | 2,868 |
| Guarantees | — | 83 | 9 | 92 |
| | | | | |
| Maximum exposure | 1,027 | 37,257 | 1,097 | 39,381 |
| (1) | Income from interests in unconsolidated structured entities includes interest receivable, changes in fair value and other income less impairments. |
| (2) | A sponsored entity is a structured entity established by RBS where RBS provides liquidity and/or credit enhancements or provides ongoing services to the entity. RBS can act as sponsor for its own or for customers’ transactions. |
| (3) | In 2014 RBS transferred £1,756 million (2013 - £2,119 million) of assets into sponsored structured entities which are not consolidated by RBS and for which RBS held no interest at 31 December 2014. Income arising from these entities was £172 million (2013 - £192 million). |
| (4) | The 2013 interests in unconsolidated structured entities have been revised. |
Notes on the consolidated accounts
30 Asset transfers
Transfers that do not qualify for derecognition
Securities repurchase agreements and lending transactions
The Group enters into securities repurchase agreements and securities lending transactions under which it transfers securities in accordance with normal market practice.
Generally, the agreements require additional collateral to be provided if the value of the securities falls below a predetermined level. Under standard terms for repurchase transactions in the UK and US markets, the recipient of collateral has an unrestricted right to sell or repledge it, subject to returning equivalent securities on settlement of the transaction.
Securities sold under repurchase transactions are not derecognised if the Group retains substantially all the risks and rewards of ownership. The fair value (and carrying value) of securities transferred under such repurchase transactions included on the balance sheet, are set out below. All of these securities could be sold or repledged by the holder.
| | | | |
| Assets subject to securities repurchase agreements or security lending transactions | 2014 £m | 2013 £m | 2012 £m |
| Debt securities | 23,048 | 55,554 | 91,173 |
| Equity shares | 2,557 | 5,310 | 6,772 |
Assets pledged as collateral
The Group pledges collateral with its counterparties in respect of derivative liabilities and bank and other borrowings.
| | | | |
| Assets pledged against liabilities | 2014 £m | 2013 £m | 2012 £m |
| Loans and advances to banks | 11,973 | 10,342 | 12,784 |
| Loans and advances to customers | 23,245 | 23,594 | 25,186 |
| Securities | 9,595 | 8,673 | 24,236 |
| | 44,813 | 42,609 | 62,206 |
| | | | |
| Liabilities secured by assets | | | |
| Deposits by banks | 770 | 3,254 | 12,309 |
| Customer accounts | 130 | 2,766 | 3,000 |
| Derivatives | 39,289 | 42,691 | 60,434 |
| | 40,189 | 48,711 | 75,743 |
Notes on the consolidated accounts
| 31 Capital resources | | | | |
| RBS's regulatory capital resources in accordance with PRA definitions were as follows: | | | | |
| | PRA | | | |
| | transitional basis | | Basel 2.5 basis |
| | 2014 | | 2013 | 2012 |
| | £m | | £m | £m |
| Shareholders’ equity (excluding non-controlling interests) | | | | |
| Shareholders’ equity | 57,246 | | 58,742 | 68,678 |
| Preference shares - equity | (4,313) | | (4,313) | (4,313) |
| Other equity instruments | (784) | | (979) | (979) |
| | 52,149 | | 53,450 | 63,386 |
| | | | | |
| Non-controlling interests | — | | 473 | 403 |
| | | | | |
| Regulatory adjustments and deductions | | | | |
| Own credit | 500 | | 726 | 691 |
| Defined benefit pension fund adjustment | (238) | | 362 | 913 |
| Net unrealised AFS losses | — | | 308 | 346 |
| Cash flow hedging reserve | (1,029) | | 84 | (1,666) |
| Deferred tax assets | (1,222) | | — | — |
| Prudential valuation adjustments | (384) | | — | — |
| Goodwill and other intangible assets | (7,781) | | (12,368) | (13,545) |
| Expected losses less impairments | (1,491) | | (19) | (1,904) |
| 50% of securitisation positions | — | | (748) | (1,107) |
| Other regulatory adjustments | (855) | | (103) | (197) |
| | (12,500) | | (11,758) | (16,469) |
| CET1 capital | 39,649 | | 42,165 | 47,320 |
| | | | | |
| Additional Tier 1 capital | | | | |
| Preference shares - equity | — | | 4,313 | 4,313 |
| Preference shares - debt | — | | 911 | 1,054 |
| Innovative/hybrid Tier 1 securities | — | | 4,207 | 4,125 |
| Qualifying instruments and related share premium subject to phase out | 5,820 | | — | — |
| Qualifying instruments issued by subsidiaries and held by third parties | 1,648 | | — | — |
| | 7,468 | | 9,431 | 9,492 |
| | | | | |
| Tier 1 deductions | | | | |
| 50% of material holdings | — | | (976) | (295) |
| Tax on expected losses less impairments | — | | 6 | 618 |
| | — | | (970) | 323 |
| Tier 1 capital | 47,117 | | 50,626 | 57,135 |
Notes on the consolidated accounts
| | PRA | | | |
| | transitional basis | | Basel 2.5 basis |
| | 2014 | | 2013 | 2012 |
| | £m | | £m | £m |
| Qualifying Tier 2 capital | | | | |
| Undated subordinated debt | — | | 2,109 | 2,194 |
| Dated subordinated debt - net of amortisation | — | | 12,436 | 13,420 |
| Qualifying instruments and related share premium | 6,136 | | — | — |
| Qualifying instruments issued by subsidiaries and held by third parties | 7,490 | | — | — |
| Unrealised gains on AFS equity shares | — | | 114 | 63 |
| Collectively assessed impairment provisions | — | | 395 | 399 |
| | 13,626 | | 15,054 | 16,076 |
| | | | | |
| Tier 2 deductions | | | | |
50% of securitisation positions | — | | (748) | (1,107) |
Expected losses less impairments | — | | (25) | (2,522) |
50% of material holdings | — | | (976) | (295) |
| | — | | (1,749) | (3,924) |
| Tier 2 capital | 13,626 | | 13,305 | 12,152 |
| | | | | |
| Supervisory deductions | | | | |
Unconsolidated investments | — | | (36) | (2,243) |
Other deductions | — | | (236) | (244) |
| | — | | (272) | (2,487) |
| Total regulatory capital | 60,743 | | 63,659 | 66,800 |
It is RBS’s policy to maintain a strong capital base, to expand it as appropriate and to utilise it efficiently throughout its activities to optimise the return to shareholders while maintaining a prudent relationship between the capital base and the underlying risks of the business. In carrying out this policy, RBS has regard to the supervisory requirements of the PRA. The PRA uses risk asset ratio (RAR) as a measure of capital adequacy in the UK banking sector, comparing a bank's capital resources with its risk-weighted assets (the assets and off-balance sheet exposures are ‘weighted’ to reflect the inherent credit and other risks); by international agreement, the RAR should be not less than 8% with a Tier 1 component of not less than 4%. RBS has complied with the PRA’s capital requirements throughout the year.
A number of subsidiaries and sub-groups within RBS, principally banking entities, are subject to various individual regulatory capital requirements in the UK and overseas. Furthermore, the payment of dividends by subsidiaries and the ability of members of RBS to lend money to other members of RBS may be subject to restrictions such as local regulatory or legal requirements, the availability of reserves and financial and operating performance.
Notes on the consolidated accounts
32 Memorandum items
Contingent liabilities and commitments
The amounts shown in the table below are intended only to provide an indication of the volume of business outstanding at 31 December 2014. Although the Group is exposed to credit risk in the event of a customer’s failure to meet its obligations, the amounts shown do not, and are not intended to, provide any indication of the Group's expectation of future losses.
| | | More than | More than | | | | |
| | | 1 year but | 3 years but | | | | |
| | Less than | less than | less than | Over | | | |
| | 1 year | 3 years | 5 years | 5 years | 2014 | 2013 | 2012 |
| | £m | £m | £m | £m | £m | £m | £m |
| Contingent liabilities | | | | | | | |
| Guarantees and assets pledged as collateral security | 7,437 | 2,102 | 2,992 | 4,190 | 16,721 | 20,179 | 19,164 |
| Other contingent liabilities | 4,958 | 2,013 | 1,104 | 1,506 | 9,581 | 5,991 | 10,697 |
| | 12,395 | 4,115 | 4,096 | 5,696 | 26,302 | 26,170 | 29,861 |
| | | | | | | | |
Commitments (1) | | | | | | | |
| Undrawn formal standby facilities, credit lines and other | | | | | | | |
commitments to lend |
- less than one year | 74,868 | — | — | — | 74,868 | 77,592 | 83,461 |
- one year and over | 10,082 | 36,285 | 77,575 | 13,967 | 137,909 | 135,454 | 132,347 |
| Other commitments | 1,993 | 53 | 21 | 40 | 2,107 | 2,793 | 1,976 |
| | 86,943 | 36,338 | 77,596 | 14,007 | 214,884 | 215,839 | 217,784 |
| | | | | | | | |
| Contingent liabilities and commitments | 99,338 | 40,453 | 81,692 | 19,703 | 241,186 | 242,009 | 247,645 |
| (1) | Includes liquidity facilities provided to Group sponsored conduits. |
Banking commitments and contingent obligations, which have been entered into on behalf of customers and for which there are corresponding obligations from customers, are not included in assets and liabilities. The Group's maximum exposure to credit loss, in the event of its obligation crystallising and all counterclaims, collateral or security proving valueless, is represented by the contractual nominal amount of these instruments included in the table above. These commitments and contingent obligations are subject to the Group's normal credit approval processes.
Contingent liabilities
Guarantees - the Group gives guarantees on behalf of customers. A financial guarantee represents an irrevocable undertaking that the Group will meet a customer's specified obligations to a third party if the customer fails to do so. The maximum amount that the Group could be required to pay under a guarantee is its principal amount as in the table above. The Group expects most guarantees to expire unused.
Other contingent liabilities - these include standby letters of credit, supporting customer debt issues and contingent liabilities relating to customer trading activities such as those arising from performance and customs bonds, warranties and indemnities.
Commitments
Commitments to lend - under a loan commitment the Group agrees to make funds available to a customer in the future. Loan commitments, which are usually for a specified term may be unconditionally cancellable or may persist, provided all conditions in the loan facility are satisfied or waived. Commitments to lend include commercial standby facilities and credit lines, liquidity facilities to commercial paper conduits and unutilised overdraft facilities.
Other commitments - these include documentary credits, which are commercial letters of credit providing for payment by the Group to a named beneficiary against presentation of specified documents, forward asset purchases, forward deposits placed and undrawn note issuance and revolving underwriting facilities, and other short-term trade related transactions.
Notes on the consolidated accounts
| Contractual obligations for future expenditure not provided for in the accounts | | | |
| The following table shows contractual obligations for future expenditure not provided for in the accounts at the year end. | |
| | | | |
| | 2014 | 2013 | 2012 |
| | £m | £m | £m |
| Operating leases | | | |
Minimum rentals payable under non-cancellable leases (1) | | | |
- within 1 year | 237 | 348 | 399 |
- after 1 year but within 5 years | 784 | 1,143 | 1,253 |
- after 5 years | 2,110 | 2,144 | 2,286 |
| | 3,131 | 3,635 | 3,938 |
| Capital expenditure on property, plant and equipment | 35 | 38 | 37 |
Contracts to purchase goods or services (2) | 1,827 | 1,162 | 959 |
| | 4,993 | 4,835 | 4,934 |
| (1) | Predominantly property leases. |
| (2) | Of which due within 1 year: £389 million (2013 - £373 million; 2012 - £444 million). |
Trustee and other fiduciary activities
In its capacity as trustee or other fiduciary role, the Group may hold or place assets on behalf of individuals, trusts, companies, pension schemes and others. The assets and their income are not included in the Group's financial statements. The Group earned fee income of £425 million (2013 - £462 million; 2012 - £476 million) from these activities.
The Financial Services Compensation Scheme
The Financial Services Compensation Scheme (FSCS), the UK's statutory fund of last resort for customers of authorised financial services firms, pays compensation if a firm is unable to meet its obligations. The FSCS funds compensation for customers by raising management expenses levies and compensation levies on the industry. In relation to protected deposits, each deposit-taking institution contributes towards these levies in proportion to their share of total protected deposits on 31 December of the year preceding the scheme year (which runs from 1 April to 31 March), subject to annual maxima set by the Prudential Regulation Authority. In addition, the FSCS has the power to raise levies on a firm that has ceased to participate in the scheme and is in the process of ceasing to be authorised for the costs that it would have been liable to pay had the FSCS made a levy in the financial year it ceased to be a participant in the scheme.
The FSCS has borrowed from HM Treasury to fund compensation costs associated with the failure of Bradford & Bingley, Heritable Bank, Kaupthing Singer & Friedlander, Landsbanki ‘Icesave’ and London Scottish Bank plc. The interest rate on these borrowings is subject to a floor being the higher of 12 month LIBOR plus 100 basis points or the relevant gilt rate for the equivalent cost of borrowing from HMT. The FSCS and HM Treasury have agreed that the period of these loans will reflect the expected timetable for recoveries from the estates of Bradford & Bingley and the other failed banks. The FSCS will levy the deposit- taking sector for its share of the balance of the principal outstanding for the non-Bradford & Bingley loan prior to the FSCS loan facility with HMT expiring in March 2015. In addition, the FSCS levied an interim payment relating to resolution costs for Dunfermline Building Society of £100 million. The total capital element levied on the industry in the 2014/15 scheme year was £399 million (£363 million in the 2013/14 scheme year).
The Group has accrued £110 million for its share of estimated FSCS levies.
Notes on the consolidated accounts
Litigation, investigations and reviews
The company and certain members of the Group are party to legal proceedings and the subject of investigation and other regulatory and governmental action in the United Kingdom, the European Union, the United States and other jurisdictions.
RBS recognises a provision for a liability in relation to these matters when it is probable that an outflow of economic benefits will be required to settle an obligation resulting from past events, and a reliable estimate can be made of the amount of the obligation. While the outcome of the legal proceedings, investigations and regulatory and governmental matters in which RBS is involved is inherently uncertain, the directors believe that, based on the information available to them, appropriate provisions have been made in respect of legal proceedings, investigations and regulatory and governmental matters as at 31 December 2014 (see Note 22). The aggregate provisions for litigation and regulatory proceedings of £1,500 million recognised in 2014, included a provision of £720 million related to the foreign exchange related investigations, of which £320 million was taken in the last quarter of 2014. The future outflow of resources in respect of any matter may ultimately prove to be substantially greater than or less than the aggregate provision that RBS has recognised.
In many proceedings, it is not possible to determine whether any loss is probable or to estimate the amount of any loss. Numerous legal and factual issues may need to be resolved, including through potentially lengthy discovery and document production exercises and determination of important factual matters, and by addressing novel or unsettled legal questions relevant to the proceedings in question, before a liability can be reasonably estimated for any claim. RBS cannot predict if, how, or when such claims will be resolved or what the eventual settlement, damages, fine, penalty or other relief, if any, may be, particularly for claims that are at an early stage in their development or where claimants seek substantial or indeterminate damages.
There are also situations where RBS may enter into a settlement agreement. This may occur in order to avoid the expense, management distraction or reputational implications of continuing to contest liability, or in order to take account of the risks inherent in defending claims or investigations even for those matters for which RBS believes it has credible defences and should prevail on the merits. The uncertainties inherent in all such matters affect the amount and timing of any potential outflows for both matters with respect to which provisions have been established and other contingent liabilities. The future outflow of resources in respect of any matter may ultimately prove to be substantially greater than or less than the aggregate provision that RBS has recognised for that matter.
Other than those discussed below, no member of the Group is or has been involved in governmental, legal or regulatory proceedings (including those which are pending or threatened) that are expected to be material individually or in aggregate.
Litigation
Shareholder litigation (US)
RBS and certain of its subsidiaries, together with certain current and former officers and directors were named as defendants in a purported class action filed in the United States District Court for the Southern District of New York involving holders of American Depositary Receipts (the ADR claims).
A consolidated amended complaint asserting claims under Sections 10 and 20 of the US Securities Exchange Act of 1934 and Sections 11, 12 and 15 of the Securities Act was filed in November 2011 on behalf of all persons who purchased or otherwise acquired the Group's American Depositary Receipts (ADRs) from issuance through 20 January 2009. In September 2012, the Court dismissed the ADR claims with prejudice. In August 2013, the Court denied the plaintiffs’ motions for reconsideration and for leave to re-plead their case. The plaintiffs appealed the dismissal of this case to the Second Circuit Court of Appeals and that appeal was heard on 19 June 2014. A decision in respect of the appeal has not yet been issued.
Shareholder litigation (UK)
Between March and July 2013, claims were issued in the High Court of Justice of England and Wales by sets of current and former shareholders, against RBS (and in one of those claims, also against certain former individual officers and directors) alleging that untrue and misleading statements and/or improper omissions were made in connection with the rights issue announced by RBS on 22 April 2008 in breach of the Financial Services and Markets Act 2000. In July 2013 these and other similar threatened claims were consolidated by the Court via a Group Litigation Order. RBS’s defence to the claims was filed on 13 December 2013. Since then, further High Court claims have been issued against RBS under the Group Litigation Order. At a case management conference in December 2014 the judge ordered that trial commence in December 2016.
Other securitisation and securities related litigation in the United States
RBS companies have been named as defendants in their various roles as issuer, depositor and/or underwriter in a number of claims in the United States that relate to the securitisation and securities underwriting businesses. These cases include actions by individual purchasers of securities and purported class action suits. Together, the pending individual and class action cases involve the issuance of more than US$46 billion of mortgage-backed securities (MBS) issued primarily from 2005 to 2007. In general, plaintiffs in these actions claim that certain disclosures made in connection with the relevant offerings contained materially false or misleading statements and/or omissions regarding the underwriting standards pursuant to which the mortgage loans underlying the securities were issued. RBS companies remain as defendants in more than 30 lawsuits brought by purchasers of MBS, including the purported class action identified below.
Notes on the consolidated accounts
Among these MBS lawsuits are two cases filed in September 2011 by the US Federal Housing Finance Agency (FHFA) as conservator for the Federal National Mortgage Association (Fannie Mae) and the Federal Home Loan Mortgage Corporation (Freddie Mac). The primary FHFA lawsuit remains pending in the United States District Court for the District of Connecticut, and it relates to approximately US$32 billion of MBS for which RBS entities acted as sponsor/depositor and/or lead underwriter or co-lead underwriter. Of these approximately US$9.5 billion were outstanding at 31 December 2014 with cumulative write downs to date of approximately US$1.09 billion (being the recognised loss of principal value suffered by security holders). In September 2013, the Court denied the defendants’ motion to dismiss FHFA’s amended complaint in this case. Discovery is ongoing and is scheduled to be substantially completed by the end of 2015.
The other remaining FHFA lawsuit that involves RBS (in which the primary defendant is Nomura Holding America Inc. and subsidiaries) names RBS Securities Inc. as a defendant by virtue of the fact that it was an underwriter of some of the securities at issue. Trial in this matter is scheduled to commence in March 2015 in the United States District Court for the Southern District of New York. Three other FHFA lawsuits (against JP Morgan, Morgan Stanley and Countrywide) in which RBS Securities Inc. was an underwriter defendant were settled without any contribution from RBS Securities Inc. On 19 June 2014, another FHFA lawsuit in which RBS Securities Inc. was an underwriter defendant (against Ally Financial Group) was settled by RBS Securities Inc. by payment of US$99.5 million.
Other MBS lawsuits against RBS companies include three cases filed by the National Credit Union Administration Board (on behalf of US Central Federal Credit Union, Western Corporate Federal Credit Union, Southwest Corporate Federal Credit Union, and Members United Corporate Federal Credit Union), five cases filed by the Federal Home Loan Banks of Boston, Chicago, Seattle and San Francisco, and a case filed by the Commonwealth of Virginia on behalf of the Virginia Retirement System.
RBS companies are also defendants in a purported MBS class action entitled New Jersey Carpenters Health Fund v. Novastar Mortgage Inc. et al; which remains pending in the United States District Court for the Southern District of New York.
The status of the previously disclosed settlements in the other MBS class actions in which RBS companies were defendants is as follows: In re IndyMac Mortgage-Backed Securities Litigation (the court indicated its intention to approve settlement at the final settlement hearing held on 3 February 2015), New Jersey Carpenters Vacation Fund et al. v. The Royal Bank of Scotland plc et al. (final court approval of the settlement granted in November 2014), and Luther v. Countrywide Financial Corp. et al. and related class action cases (final court approval of the settlement granted in December 2013). In the latter matter, several members of the settlement class are appealing the court-approved settlement to the United States Court of Appeals for the Ninth Circuit.
Certain other claims on behalf of public and private institutional investors have been threatened against RBS in connection with various mortgage-related offerings. RBS cannot predict whether any of these threatened claims will be pursued, but expects that several may. If such claims are asserted and were successful, the amounts involved may be material.
In many of the securitisation and securities related cases in the US, RBS has or will have contractual claims to indemnification from the issuers of the securities (where an RBS company is underwriter) and/or the underlying mortgage originator (where an RBS company is issuer). The amount and extent of any recovery on an indemnification claim, however, is uncertain and subject to a number of factors, including the ongoing creditworthiness of the indemnifying party a number of whom are or may be insolvent.
London Interbank Offered Rate (LIBOR)
Certain members of the Group have been named as defendants in a number of class actions and individual claims filed in the US with respect to the setting of LIBOR and certain other benchmark interest rates. The complaints are substantially similar and allege that certain members of the Group and other panel banks individually and collectively violated various federal laws, including the US commodities and antitrust laws, and state statutory and common law, as well as contracts, by manipulating LIBOR and prices of LIBOR-based derivatives in various markets through various means.
Most of the USD LIBOR-related actions in which RBS companies are defendants, including all purported class actions relating to USD LIBOR, have been transferred to a coordinated proceeding in the United States District Court for the Southern District of New York. In the coordinated proceeding, consolidated class action complaints were filed on behalf of (1) exchange-based purchaser plaintiffs, (2) over-the-counter purchaser plaintiffs, and (3) corporate debt purchaser plaintiffs. In orders dated 29 March 2013 and 23 June 2014, the Court dismissed plaintiffs' antitrust claims and claims under RICO (Racketeer Influenced and Corrupt Organizations Act), but declined to dismiss (a) certain Commodities Exchange Act claims on behalf of persons who transacted in Eurodollar futures contracts and options on futures contracts on the Chicago Mercantile Exchange (on the theory that defendants' alleged persistent suppression of USD LIBOR caused loss to plaintiffs), and (b) certain contract and unjust enrichment claims on behalf of over-the-counter purchaser plaintiffs who transacted directly with a defendant. Over 35 other USD LIBOR-related actions involving RBS, including purported class actions on behalf of lenders and mortgage borrowers, are subject to motions to dismiss that are being litigated. Discovery has been stayed in all cases in the coordinated proceeding pending further order from the Court. On 21 January 2015, the U.S. Supreme Court held in Gelboim v. Bank of America Corp. that plaintiffs in the class action on behalf of corporate debt purchasers do not need to wait until there is a final judgment in the coordinated proceeding before they can appeal the dismissal of their antitrust claims to the United States Court of Appeals for the Second Circuit.
Notes on the consolidated accounts
Certain members of the Group have also been named as defendants in class actions relating to (i) JPY LIBOR and Euroyen TIBOR (the "Yen action"), (ii) Euribor, and (iii) Swiss Franc LIBOR, all three of which are pending in the United States District Court for the Southern District of New York. On 28 March 2014, the Court in the Yen action dismissed the plaintiffs’ antitrust claims, but refused to dismiss their claims under the Commodity Exchange Act for price manipulation.
Details of LIBOR investigations and their outcomes affecting RBS are set out under ‘Investigations and reviews’ on the next page.
ISDAFIX antitrust litigation
Beginning in September 2014, RBS plc and a number of other financial institutions were named as defendants in several purported class action complaints (now consolidated into one complaint) alleging manipulation of USD ISDAFIX rates, to the detriment of persons who entered into transactions that referenced those rates. The complaints were filed in the United States District Court for the Southern District of New York and contain claims for unjust enrichment and violations of the U.S. antitrust laws and the Commodities Exchange Act. This matter is subject to pre-discovery motions to dismiss some or all of the claims against the defendants.
Credit default swap antitrust litigation
Certain members of the Group, as well as a number of other financial institutions, are defendants in a consolidated antitrust class action pending in the United States District Court for the Southern District of New York. The plaintiffs generally allege that defendants violated the U.S. antitrust laws by restraining competition in the market for credit default swaps through various means and thereby causing inflated bid-ask spreads for credit default swaps. On 4 September 2014, the Court largely denied the defendants' motion to dismiss this matter.
FX antitrust litigation
Certain members of the Group, as well as a number of other financial institutions, are defendants in a consolidated antitrust class action on behalf of U.S. based plaintiffs that is pending in the United States District Court for the Southern District of New York. The plaintiffs in this action allege that the defendants violated the U.S. antitrust laws by conspiring to manipulate the foreign exchange market by manipulating benchmark foreign exchange rates. On 28 January 2015, the court denied the defendants’ motion to dismiss this action. On the same day, the court dismissed two similar class action complaints that had been filed on behalf of non-U.S. plaintiffs in Norway and South Korea on the principal ground that such claims are barred by the Foreign Trade Antitrust Improvements Act. On 23 February 2015, an additional class action complaint was filed in the United States District Court for the Southern District of New York on behalf of investors that transacted in exchange-traded foreign exchange futures contracts and/or options on foreign exchange futures contracts. The complaint contains allegations that are substantially similar to those contained in the consolidated antitrust class action, and it asserts both antitrust claims and claims under the Commodities Exchange Act.
Madoff
In December 2010, Irving Picard, as trustee for the bankruptcy estates of Bernard L. Madoff and Bernard L. Madoff Investment Securities LLC., filed a clawback claim against The Royal Bank of Scotland N.V. (RBS N.V.) in the New York bankruptcy court. The trustee seeks to recover US$75.8 million in redemptions that RBS N.V. allegedly received from certain Madoff feeder funds and US$162.1 million that RBS N.V. allegedly received from its swap counterparties at a time when RBS N.V. allegedly ‘knew or should have known of Madoff’s possible fraud’. The Trustee alleges that those transfers were preferences or fraudulent conveyances under the US bankruptcy code and New York law and he asserts the purported right to claw them back for the benefit of Madoff’s estate. A further claim, for US$21.8 million, was filed in October 2011.This matter is subject to pre-discovery motions to dismiss the claims against RBS N.V..
Thornburg adversary proceeding
RBS Securities Inc. and certain other RBS companies, as well as several other financial institutions, are defendants in an adversary proceeding filed in the U.S. bankruptcy court in Maryland by the trustee for TMST, Inc. (formerly known as Thornburg Mortgage, Inc.).
The trustee seeks recovery of transfers made under certain restructuring agreements as, among other things, avoidable fraudulent and preferential conveyances and transfers. On 25 September 2014, the Court largely denied the defendants' motion to dismiss this matter and as a result, discovery has commenced.
CPDO Litigation
CPDO claims have been served on RBS N.V. in England, the Netherlands and Australia relating to the sale of a type of structured financial product known as a constant proportion debt obligation (CPDO). In November 2012, the Federal Court of Australia issued a judgment against RBS N.V. and others in one such case holding that RBS N.V. and others committed certain wrongful acts in connection with the rating and sale of the CPDO. In March 2013, RBS N.V. was ordered to pay A$19.7 million. RBS N.V. appealed this decision and the appeal court found against RBS N.V. in May 2014. The decision is not being further appealed. RBS N.V. made the required payments totalling A$19.7 million in March and April 2013. The judgment may potentially have significance to the other claims served and to any future similar claims.
Interest rate hedging products
RBS is dealing with a large number of active litigation claims in the UK in relation to the sale of interest rate hedging products. In general claimants allege that the relevant interest rate hedge products were mis-sold to them, with some also alleging RBS made misrepresentations in relation to LIBOR. Claims have been brought by customers who are being considered under the UK Financial Conduct Authority (FCA) redress programme, as well as customers who are outside of the scope of that programme. RBS is encouraging those customers that are eligible to seek redress under the FCA redress programme to participate in that programme. RBS remains exposed to potential claims from customers who were either ineligible to be considered for redress or who are dissatisfied with their redress offers.
Notes on the consolidated accounts
Weiss v. National Westminster Bank PLC
NatWest is defending a lawsuit filed by a number of United States nationals (or their estates, survivors, or heirs) who were victims of terrorist attacks in Israel. The plaintiffs allege that NatWest is liable for damages arising from those attacks pursuant to the U.S. Antiterrorism Act because NatWest previously maintained bank accounts and transferred funds for the Palestine Relief & Development Fund, an organisation which plaintiffs allege solicited funds for Hamas, the alleged perpetrator of the attacks. On 28 March 2013, the trial court (the United States District Court for the Eastern District of New York) granted summary judgment in favour of NatWest on the issue of scienter, but on 22 September 2014, that summary judgment ruling was vacated by the United States Court of Appeals for the Second Circuit. The appeals court returned the case to the trial court for consideration of NatWest's other asserted grounds for summary judgment and, if necessary, for trial.
Freeman v. HSBC Holdings PLC
On 10 November 2014, RBS N.V. and certain other financial institutions (HSBC, Barclays, Standard Chartered, Credit Suisse, and Bank Saderat) were named as defendants in a complaint filed by a number of United States nationals (or their estates, survivors, or heirs), most of whom are or were United States military personnel, who were killed or injured in more than 70 attacks in Iraq between 2004 and 2011. The attacks were allegedly perpetrated by Hezbollah and certain Iraqi terror cells allegedly funded by the Islamic Republic of Iran. According to the complaint, RBS N.V. and the other defendants are liable for damages arising from the attacks because they allegedly conspired with Iran and certain Iranian banks to assist Iran in transferring money to Hezbollah and the Iraqi terror cells, in violation of the U.S. Antiterrorism Act, by agreeing to engage in "stripping" of transactions initiated by the Iranian banks so that the Iranian nexus to the transactions would not be detected. The defendants will move to dismiss the complaint.
Investigations and reviews
RBS’s businesses and financial condition can be affected by the fiscal or other policies and actions of various governmental and regulatory authorities in the United Kingdom, the European Union (EU), the United States and elsewhere. RBS has engaged, and will continue to engage, in discussions with relevant governmental and regulatory authorities, including in the United Kingdom, the EU, the United States and elsewhere, on an ongoing and regular basis regarding operational, systems and control evaluations and issues including those related to compliance with applicable laws and regulations, including consumer protection, competition, anti-bribery, anti-money laundering and sanctions regimes. It is possible that any matters discussed or identified may result in investigatory or other action being taken by governmental and regulatory authorities, increased costs being incurred by RBS, remediation of systems and controls, public or private censure, restriction of RBS’s business activities or fines. Any of the events or circumstances mentioned below could have a material adverse effect on RBS, its business, authorisations and licences, reputation, results of operations or the price of securities issued by it.
RBS is co-operating fully with the investigations and reviews described below.
LIBOR and other trading rates
In February 2013, RBS announced settlements with the Financial Services Authority (FSA) in the United Kingdom, the United States Commodity Futures Trading Commission and the United States Department of Justice (DOJ) in relation to investigations into submissions, communications and procedures around the setting of LIBOR. RBS agreed to pay penalties of £87.5 million, US$325 million and US$150 million to these authorities respectively to resolve the investigations. As part of the agreement with the DOJ, RBS plc entered into a Deferred Prosecution Agreement in relation to one count of wire fraud relating to Swiss Franc LIBOR and one count for an antitrust violation relating to Yen LIBOR. In addition, on 12 April 2013, RBS Securities Japan Limited entered a plea of guilty to one count of wire fraud relating to Yen LIBOR and on 6 January 2014, the US District Court for the District of Connecticut entered a final judgment in relation to the conviction of RBS Securities Japan Limited pursuant to the plea agreement.
In February 2014, RBS paid settlement penalties of approximately €260 million and €131 million to resolve investigations by the European Commission (EC) into Yen LIBOR competition infringements and EURIBOR competition infringements respectively.
In July 2014, RBS entered into an Enforceable Undertaking with the Australian Securities and Investments Commission (ASIC) in relation to potential misconduct involving the Australian Bank Bill Swap Rate. RBS undertakes in the Enforceable Undertaking to (a) comply with its existing undertakings arising out of the February 2013 settlement with the United States Commodity Futures Trading Commission as they relate to Australian Benchmark Interest Rates, (b) implement remedial measures with respect to its trading in Australian reference bank bills and (c) appoint an independent compliance expert to review and report on RBS’s implementation of such remedial measures. The remediation measures include ensuring appropriate records retention, training, communications surveillance and trading reviews are in place. As part of the Enforceable Undertaking, RBS also agreed to make a voluntary contribution of A$1.6 million to fund independent financial literacy projects in Australia.
On 21 October 2014, the EC announced its findings that RBS and one other financial institution had participated in a bilateral cartel aimed at influencing the Swiss franc LIBOR benchmark interest rate between March 2008 and July 2009. RBS agreed to settle the case with the EC and received full immunity from fines for revealing the existence of the cartel to the EC and co-operating closely with the EC’s ongoing investigation. Also on 21 October 2014, the EC announced its findings that RBS and three other financial institutions had participated in a related cartel on bid-ask spreads of Swiss franc interest rate derivatives in the European Economic Area (EEA). Again, RBS received full immunity from fines for revealing the existence of the cartel to the EC and co-operating closely with the EC’s ongoing investigation.
Notes on the consolidated accounts
RBS is co-operating with investigations and new and ongoing requests for information by various other governmental and regulatory authorities, including in the UK, US and Asia, into its submissions, communications and procedures relating to a number of trading rates, including LIBOR and other interest rate settings, and non-deliverable forwards. RBS is providing information and documents to the CFTC and the DOJ as part of an investigation into the setting of USD, EUR and GBP ISDAFIX and related trading activities. RBS is also under investigation by competition authorities in a number of jurisdictions stemming from the actions of certain individuals in the setting of LIBOR and other trading rates, as well as interest rate-related trading. At this stage, RBS cannot estimate reliably what effect, if any, the outcome of these investigations may have on RBS.
Foreign exchange related investigations
In November 2014, RBS plc reached a settlement with the FCA in the United Kingdom and the United States Commodity Futures Trading Commission (CFTC) in relation to investigations into failings in the bank’s Foreign Exchange businesses within its Corporate & Institutional Banking (CIB) segment. RBS plc agreed to pay penalties of £217 million to the FCA and $290 million to the CFTC to resolve the investigations. Payment of the fines was made on 19 November 2014.
As previously disclosed, RBS remains in discussions with other governmental and regulatory authorities on similar issues relating to failings in the Bank’s Foreign Exchange business within its CIB segment, including settlement discussions regarding the criminal investigation being conducted by the DOJ and certain other financial regulatory authorities. The timing and amounts of any further settlements and related litigation risks and consequences remain uncertain and could be material.
On 21 July 2014, the Serious Fraud Office announced that it was launching a criminal investigation into allegations of fraudulent conduct in the foreign exchange market, apparently involving multiple financial institutions.
Technology incident in June 2012
In June 2012, RBS was affected by a technology incident, as a result of which the processing of certain customer accounts and payments were subject to considerable delay. RBS agreed to reimburse customers for any loss suffered as a result of the incident and RBS made a provision of £175 million in 2012.
In April 2013, the FCA announced that it had commenced an enforcement investigation into the incident. This was a joint investigation conducted by the FCA together with the UK Prudential Regulation Authority (PRA). Enforcement proceedings were then commenced. On 20 November 2014, RBS announced that it had reached agreement with the FCA and the PRA over failings in relation to the incident. RBS agreed a penalty of £42 million with the FCA and £14 million with the PRA. Separately the Central Bank of Ireland initiated an investigation and issued enforcement proceedings against Ulster Bank Ireland Limited (UBIL), an RBS company. On 12 November 2014, the Central Bank of Ireland announced that it had fined UBIL €3.5 million in relation to its investigation.
Interest rate hedging products
In June 2012, following an industry wide review, the FSA announced that RBS and other UK banks had agreed to a redress exercise and past business review in relation to the sale of interest rate hedging products to some small and medium sized businesses who were classified as retail clients or private customers under FSA rules. In January 2013, the FSA issued a report outlining the principles to which it wished RBS and other UK banks to adhere in conducting the review and redress exercise. This exercise is being scrutinised by an independent reviewer, who is reviewing and approving all redress outcomes, and the FCA is overseeing this. RBS has reached agreement with the independent reviewer in relation to redress outcomes for in scope customers. RBS and the independent reviewer are now focussing on customer responses to review outcomes, securing acceptance of offers and assessing ancillary issues such as consequential loss claims. The FCA has announced that the review and redress exercise will be closed to new entrants on 31 March 2015.
The Central Bank of Ireland also requested UBIL, along with a number of Irish banks, to undertake a similar exercise and past business review in relation to the sale of interest rate hedging products to retail designated small and medium sized businesses in the Republic of Ireland. RBS also agreed to undertake a similar exercise and past business review in respect of relevant customers of RBS International. The review of the sale of interest rate hedging products to eligible RBS International customers is complete, and the review of the sale of interest rate hedging products to eligible Republic of Ireland customers is expected to be completed during Q1 2015.
RBS has made provisions in relation to the above redress exercises totalling £1.4 billion to date for these matters, including £0.2 billion in 2014, of which £1 billion had been utilised at 31 December 2014.
FSA mystery shopping review
In February 2013, the FSA announced the results of a mystery shopping review it undertook into the investment advice offered by banks and building societies to retail clients. As a result of that review the FSA announced that firms involved were cooperative and agreed to take immediate action. RBS was one of the firms involved.
The action required included a review of the training provided to advisers, considering whether changes are necessary to advice processes and controls for new business, and undertaking a past business review to identify any historic poor advice (and where breaches of regulatory requirements are identified, to put this right for customers).
Notes on the consolidated accounts
Subsequent to the FSA announcing the results of its mystery shopping review, the FCA has required RBS to carry out a past business review and customer contact exercise on a sample of historic customers that received investment advice on certain lump sum products through the UK Financial Planning channel of the Personal & Business Banking (PBB) segment of RBS, which includes RBS plc and NatWest, during the period from March 2012 until December 2012. This review is being conducted under section 166 of the Financial Services and Markets Act, under which a skilled person has been appointed to carry out the exercise. Redress is currently being offered to certain customers in this sample group. In addition, RBS has agreed with the FCA that it will carry out a remediation exercise, for a specific customer segment who were sold a particular structured product, in response to concerns raised by the FCA with regard to (a) the target market for the product and (b) how the product may have been described to customers by certain advisers. A pilot customer communications exercise to certain cohorts of customers was undertaken between November 2014 and January 2015 with a further communication exercise to the remaining cohorts due to be completed by mid 2015.
Card Protection Plan Limited
In August 2013, the FCA announced that Card Protection Plan Limited and 13 banks and credit card issuers, including RBS, had agreed to a compensation scheme in relation to the sale of card and/or identity protection insurance to certain retail customers. The closing date before which any claims under the compensation scheme must have been submitted has now passed and only exceptional cases will be dealt with prior to a final closure date for the scheme of 28 February 2015. RBS has made appropriate provision based on its estimate of ultimate exposure.
Packaged accounts
As a result of an uplift in packaged account complaints, RBS has proactively put in place dedicated resource to investigate and resolve complaints on an individual basis.
FCA review of GRG treatment of SMEs
In November 2013, a report by Lawrence Tomlinson, entrepreneur in residence at the UK Government’s Department for Business Innovation and Skills, was published (Tomlinson Report). The Tomlinson Report was critical of RBS’s Global Restructuring Group’s treatment of SMEs. The Tomlinson Report was passed to the PRA and FCA. Shortly thereafter, the FCA announced that an independent skilled person would be appointed under Section 166 of the Financial Services and Markets Act to review the allegations in the Tomlinson Report. On 17 January 2014, Promontory Financial Group and Mazars were appointed as the skilled person. RBS is fully cooperating with the FCA in its investigation.
Separately, in November 2013 RBS instructed the law firm Clifford Chance to conduct an independent review of the principal allegation made in the Tomlinson Report: RBS’s Global Restructuring Group was alleged to be culpable of systematic and institutional behaviour in artificially distressing otherwise viable businesses and through that putting businesses into insolvency. Clifford Chance published its report on 17 April 2014 and concluded that there was no evidence to support the principal allegation.
A separate independent review of the principal allegation, led by Mason Hayes & Curran, Solicitors, was conducted in the Republic of Ireland. The report was published in December 2014 and found no evidence to support the principal allegation.
Multilateral interchange fees
On 11 September 2014, the Court of Justice upheld earlier decisions by the EU Commission and the General Court that MasterCard’s multilateral interchange fee (MIF) arrangements for cross border payment card transactions with MasterCard and Maestro branded consumer credit and debit cards in the EEA are in breach of competition law.
In April 2013, the EC announced it was opening a new investigation into interchange fees payable in respect of payments made in the EEA by MasterCard cardholders from non-EEA countries.
In May 2013, the EC announced it had reached an agreement with Visa regarding immediate cross border credit card MIF rates. This agreement has now been market tested and was made legally binding on 26 February 2014. The agreement is to last for four years.
In addition, the EC has proposed a draft regulation on interchange fees for card payments. The draft regulation is subject to a consultation process, prior to being finalised and enacted. It is currently expected that the regulation will be enacted during the first half of 2015. The current draft regulation proposes the capping of both cross-border and domestic MIF rates for debit and credit consumer cards. The draft regulation also sets out other proposals for reform including to the Honour All Cards Rule so merchants will be required to accept all cards with the same level of MIF but not cards with different MIF levels.
In the UK, the Office of Fair Trading (OFT) had previously opened investigations into domestic interchange fees applicable in respect of Visa and MasterCard consumer and commercial credit and debit card transactions. On 4 November 2014, the successor body to the OFT, the Competition & Markets Authority (CMA), announced that it would not proceed with its investigations. The CMA took this decision primarily based on the expected implementation of the draft EC regulation on interchange fees for card payments, coupled with some commitments made by Visa and MasterCard around its implementation in the UK. Whilst not currently proceeding, the CMA’s investigations do formally remain open and CMA has noted that, if the EC regulation on interchange fees did not address its concerns, it would then look again at continuing with its investigations.
The outcomes of these ongoing investigations, proceedings and proposed regulation are not yet known, but they may have a material adverse effect on the structure and operation of four party card payment schemes in general and, therefore, on RBS’s business in this sector.
Payment Protection Insurance
Since 2011, RBS has been implementing a policy statement agreed with the FCA for the handling of complaints about the mis-selling of Payment Protection Insurance (PPI). RBS has made provisions totalling £3.7 billion to date for this matter, including £0.7 billion in 2014, of which £2.9 billion has been utilised at 31 December 2014.
Notes on the consolidated accounts
Retail banking - EC
Since initiating an inquiry into retail banking in the EU in 2005, the EC continues to keep retail banking under review. In late 2010 the EC launched an initiative pressing for greater transparency of bank fees and is currently proposing to legislate for increased harmonisation of terminology across Member States. RBS cannot predict the outcome of these actions at this stage.
UK personal current accounts/retail banking
Following the OFT’s publication of a market study report into the Personal Current Account (PCA) market in July 2008, the OFT launched a follow up review of the PCA market in July 2012. This review was intended to consider whether certain initiatives agreed by the OFT with banks in light of the July 2008 report, primarily around transparency, unarranged overdrafts and customers in financial difficulty, had been successful and whether the market should be referred to the Competition Commission (CC) for a fuller market investigation.
The OFT’s PCA report following this July 2012 launch was published in January 2013. The OFT acknowledged some specific improvements in the market since its last review but concluded that further changes were required to tackle ongoing concerns, including a lack of switching, the ability of consumers to compare products and the complexity of overdraft charges. The OFT decided not to refer the market to the CC but said that it expected to return to the question of a referral to the CC in 2015, or earlier. The OFT also announced that it would be carrying out behavioural economic research on the way consumers make decisions and engage with retail banking service, and would study the operation of payment systems as well as the SME banking market.
On 11 March 2014, the successor body to the OFT and CC, the CMA, announced that in addition to its pending SME review (see below), it would be undertaking an update of the OFT’s 2013 PCA review. On 18 July 2014 the CMA published its preliminary findings in respect of both the PCA and SME market studies. The CMA provisionally decided to make a market investigation reference (MIR) for both the PCA and SME market studies. The provisional decision on both PCAs and SMEs was then subject to a consultation period until 17 September 2014. Following this period of consultation, on 6 November 2014, the CMA made its final decision to proceed with a MIR. The MIR will be a wide-ranging 18-24 month Phase 2 inquiry but at this stage it is not possible to estimate potential impacts on RBS.
SME banking market study
The OFT announced its market study on competition in banking for SMEs in England and Wales, Scotland and Northern Ireland on 19 June 2013. Following a consultation on the scope of the market study, the OFT published an update paper on 27 September 2013 setting out its proposed scope. On 11 March 2014, the OFT set out some competition concerns on SME banking and also announced that its successor body, the CMA, would continue the review. As discussed above, the CMA has decided to make a MIR for the SME market study in addition to the PCA study. As regards SMEs, the CMA concluded that it would be more appropriate to make a MIR than accept a set of undertakings in lieu put forward by RBS, Barclays, HSBC and Lloyds. Alongside the MIR, the CMA will also be reviewing the previous undertakings given following the CC’s investigation into SME banking in 2002 and whether these undertakings need to be varied. At this stage it is not possible to estimate potential impacts on RBS.
FCA Wholesale Sector Competition Review
On 9 July 2014, the FCA launched a review of competition in the wholesale sector to identify any areas which may merit further investigation through an in-depth market study.
The initial review was an exploratory exercise and focused primarily on competition in wholesale securities and investment markets, and related activities such as corporate banking. It commenced with a three month consultation exercise, including a call for inputs from stakeholders. Following this consultation period, the FCA published its feedback statement on 19 February 2015. The FCA now intends to undertake a market study into investment and corporate banking (to launch in Spring 2015) and potentially into asset management (to launch late 2015 if undertaken).
Credit default swaps (CDS) investigation
RBS is a party to the EC’s antitrust investigation into the CDS information market. RBS has received and responded to a Statement of Objections from the EC and continues to co-operate fully with the EC's ongoing investigation. In general terms, the EC has raised concerns that a number of banks, Markit and ISDA may have jointly prevented exchanges from entering the CDS market. At this stage, RBS cannot estimate reliably what effect the outcome of the investigation may have on RBS, which may be material.
Securitisation and collateralised debt obligation business
In the United States, RBS is involved in reviews, investigations and proceedings (both formal and informal) by federal and state governmental law enforcement and other agencies and self-regulatory organisations, including the DOJ and various other members of the RMBS Working Group of the Financial Fraud Enforcement Task Force relating to, among other things, issuance, underwriting and trading in mortgage-backed securities, collateralised debt obligations (CDOs), and synthetic products. In connection with these inquiries, Group companies have received requests for information and subpoenas seeking information about, among other things, the structuring of CDOs, financing to loan originators, purchase of whole loans, sponsorship and underwriting of securitisations, due diligence, representations and warranties, communications with ratings agencies, disclosure to investors, document deficiencies, trading activities and practices and repurchase requests.
In November 2013, RBS announced that it had settled with the US Securities and Exchange Commission (SEC) over its investigation of RBS Securities Inc. relating to due diligence conducted in connection with a 2007 offering of residential mortgage-backed securities and corresponding disclosures.
Pursuant to the settlement, RBS Securities Inc., without admitting or denying the SEC's allegations, consented to the entry of a final judgment ordering certain relief, including an injunction and the payment of approximately US$153 million in disgorgement, penalties, and interest. The settlement was subsequently approved by the United States District Court for the District of Connecticut. RBS co-operated fully with the SEC throughout the investigation.
Notes on the consolidated accounts
In 2007, the New York State Attorney General issued subpoenas to a wide array of participants in the securitisation and securities industry, focusing on the information underwriters obtained from the independent firms hired to perform due diligence on mortgages. RBS completed its production of documents requested by the New York State Attorney General in 2008, principally producing documents related to loans that were pooled into one securitisation transaction. In May 2011, the New York State Attorney General requested additional information about RBS’s mortgage securitisation business and, following the formation of the RMBS Working Group, has focused on the same or similar issues as the other state and federal RMBS Working Group investigations described above. The investigation is ongoing and RBS continues to respond to requests for information.
US mortgages - loan repurchase matters
RBS’s CIB business in North America has been a purchaser of non-agency US residential mortgages in the secondary market, and an issuer and underwriter of non-agency residential mortgage-backed securities (RMBS). CIB did not originate or service any US residential mortgages and it was not a significant seller of mortgage loans to government sponsored enterprises (GSEs) (e.g. the Federal National Mortgage Association and the Federal Home Loan Mortgage Association).
In issuing RMBS, CIB generally assigned certain representations and warranties regarding the characteristics of the underlying loans made by the originator of the residential mortgages; however, in some circumstances, CIB made such representations and warranties itself. Where CIB has given those or other representations and warranties (whether relating to underlying loans or otherwise), CIB may be contractually required to repurchase such loans or indemnify certain parties against losses for certain breaches of such representations and warranties. In certain instances where it is required to repurchase loans or related securities, CIB may be able to assert claims against third parties who provided representations or warranties to CIB when selling loans to it, although the ability to recover against such parties is uncertain. Between the start of 2009 and 31 December 2014, CIB received approximately US$741 million in repurchase demands in respect of loans made primarily from 2005 to 2008 and related securities sold where obligations in respect of contractual representations or warranties were undertaken by CIB. However, repurchase demands presented to CIB are subject to challenge and rebuttal by CIB.
Citizens Financial Group, Inc (Citizens) has not been an issuer or underwriter of non-agency RMBS. However, Citizens is an originator and servicer of residential mortgages, and it routinely sells such mortgage loans in the secondary market and to GSEs. In the context of such sales,
Citizens makes certain representations and warranties regarding the characteristics of the underlying loans and, as a result, may be contractually required to repurchase such loans or indemnify certain parties against losses for certain breaches of the representations and warranties concerning the underlying loans. Between the start of 2009 and 31 December 2014, Citizens received US$257 million in repurchase demands and indemnification payment requests in respect of loans originated primarily since 2003. However, repurchase demands presented to Citizens are subject to challenge and rebuttal by Citizens.
Although there has in recent times been disruption in the ability of certain financial institutions operating in the United States to complete foreclosure proceedings in respect of US mortgage loans in a timely manner or at all (including as a result of interventions by certain states and local governments), to date, Citizens has not been materially impacted by such disruptions and RBS has not ceased making foreclosures.
RBS cannot currently estimate what the ultimate exposure may be with respect to repurchase demands. Furthermore, RBS is unable to estimate the extent to which the matters described above will impact it, and future developments may have an adverse impact on RBS’s net assets, operating results or cash flows in any particular period.
Citizens consent orders
The activities of Citizens' two US bank subsidiaries - Citizens Bank, N.A. and Citizens Bank of Pennsylvania - are subject to extensive US laws and regulations concerning unfair or deceptive acts or practices in connection with customer products. Certain of the bank subsidiaries’ practices with respect to overdraft protection and other consumer products have not met applicable standards. The bank subsidiaries have implemented and are continuing to implement changes to improve and bring their practices into compliance with regulatory guidance. In April 2013, the bank subsidiaries consented to the issuance of orders by their respective primary federal banking regulators, the Office of the Comptroller of the Currency (OCC) and the Federal Deposit Insurance Corporation (FDIC) (Consent Orders). In the Consent Orders (which are publicly available and will remain in effect until terminated by the regulators), the bank subsidiaries neither admitted nor denied the regulators’ findings that they had engaged in deceptive marketing and implementation of the bank's overdraft protection programme, checking rewards programmes, and stop-payment process for pre-authorised recurring electronic fund transfers.
In connection with the Consent Orders, the bank subsidiaries paid a total of US$10 million in civil monetary penalties. The Consent Orders also require the bank subsidiaries to develop plans to provide restitution to affected customers (the amount of which is anticipated to be approximately US$8 million), to cease and desist any operations in violation of Section 5 of the Federal Trade Commission Act, and to submit to the regulators periodic written progress reports regarding compliance with the Consent Orders.
In addition, Citizens Bank, N.A. agreed to take certain remedial actions to improve its compliance risk management systems and to create a comprehensive action plan designed to achieve compliance with the relevant Consent Order. Restitution plans have been prepared and submitted for approval, and Citizens Bank, N.A. has submitted for approval and is in the process of implementing its action plan for compliance with the Consent Order, as well as updated policies, procedures and programmes related to its compliance risk management systems.
Notes on the consolidated accounts
In addition to the above, the bank subsidiaries could face further formal administrative enforcement actions from their federal supervisory agencies, including the assessment of civil monetary penalties and restitution, relating to issues identified by Citizens arising from other consumer products and related practices and policies, and they could face potential civil litigation.
Governance and risk management consent order
In July 2011, RBS agreed with the Board of Governors of the Federal Reserve System, the New York State Banking Department, the Connecticut Department of Banking, and the Illinois Department of Financial and Professional Regulation to enter into a consent Cease and Desist Order (Governance Order) to address deficiencies related to governance, risk management and compliance systems and controls in RBS plc and RBS N.V. branches. In the Governance Order, RBS agreed to create the following written plans or programmes:
| · | a plan to strengthen board and senior management oversight of the corporate governance, management, risk management, and operations of RBS’s U.S. operations on an enterprise-wide and business line basis, |
| · | an enterprise-wide risk management programme for RBS’s U.S. operations, |
| · | a plan to oversee compliance by RBS’s U.S. operations with all applicable U.S. laws, rules, regulations, and supervisory guidance, |
| · | a Bank Secrecy Act/anti-money laundering compliance programme for the RBS plc and RBS N.V. branches in the U.S. (the U.S. Branches) on a consolidated basis, |
| · | a plan to improve the U.S. Branches’ compliance with all applicable provisions of the Bank Secrecy Act and its rules and regulations as well as the requirements of Regulation K of the Federal Reserve, |
| · | a customer due diligence programme designed to reasonably ensure the identification and timely, accurate, and complete reporting by the U.S. Branches of all known or suspected violations of law or suspicious transactions to law enforcement and supervisory authorities, as required by applicable suspicious activity reporting laws and regulations, and |
| · | a plan designed to enhance the U.S. Branches’ compliance with OFAC requirements. |
The Governance Order (which is publicly available) identified specific items to be addressed, considered, and included in each proposed plan or programme. RBS also agreed in the Governance Order to adopt and implement the plans and programmes after approval by the regulators, to fully comply with the plans and programmes thereafter, and to submit to the regulators periodic written progress reports regarding compliance with the Governance Order. RBS has created, submitted, and adopted plans and/or programmes to address each of the areas identified above. In connection with RBS’s efforts to implement these plans and programmes, it has, among other things, made investments in technology, hired and trained additional personnel, and revised compliance, risk management, and other policies and procedures for RBS’s U.S. operations. RBS continues to test the effectiveness of the remediation efforts undertaken by RBS to ensure they are sustainable and meet regulators' expectations. Furthermore, RBS continues to work closely with the regulators in its efforts to fulfil its obligations under the Governance Order, which will remain in effect until terminated by the regulators.
RBS may be subject to formal and informal supervisory actions and may be required by its US banking supervisors to take further actions and implement additional remedial measures with respect to these and additional matters. RBS's activities in the United States may be subject to significant limitations and/or conditions.
US dollar processing consent order
In December 2013 RBS and The Royal Bank of Scotland plc agreed a settlement with the Board of Governors of the Federal Reserve System (Fed), the New York State Department of Financial Services (DFS), and the Office of Foreign Assets Control (OFAC) with respect to The Royal Bank of Scotland plc’s historical compliance with US economic sanction regulations outside the US. As part of the settlement, RBS and The Royal Bank of Scotland plc entered into a consent Cease and Desist Order with the Fed (US Dollar Processing Order), which remains in effect until terminated by the Fed. The US Dollar Processing Order (which is publicly available) indicated, among other things, that RBS and The Royal Bank of Scotland plc lacked adequate risk management and legal review policies and procedures to ensure that activities conducted outside the United States comply with applicable OFAC regulations. RBS agreed to create an OFAC compliance programme to ensure compliance with OFAC regulations by RBS’s global business lines outside of the United States, and to adopt, implement, and comply with the programme. Prior to and in connection with the US Dollar Processing Order, RBS has made investments in technology, hired and trained personnel, and revised compliance, risk management, and other policies and procedures. RBS also agreed in the US Dollar Processing Order (as part of the OFAC compliance programme) to hire an independent consultant to conduct an annual OFAC compliance review of compliance policies and their implementation and an appropriate risk-focused sampling of U.S. dollar payments.
US/Swiss tax programme
In August 2013, the DOJ announced a programme for Swiss banks (the Programme), to settle the long-running dispute between the US tax authorities and Switzerland regarding the role of Swiss banks in concealing the assets of US tax payers in offshore accounts. The Programme provides Swiss banks with an opportunity to obtain resolution, through non-prosecution agreements or non-target letters, concerning their status in connection with the DOJ’s investigations.
Notes on the consolidated accounts
Coutts & Co Ltd, a member of the Group incorporated in Switzerland, notified the DOJ that it intended to participate in the Programme based on the possibility that some of its clients may not have declared their assets in compliance with US tax laws. The Programme required a detailed review of all US related accounts. The results of Coutts & Co Ltd’s review were presented to the DOJ in June 2014. Coutts & Co Ltd has now completed the collection of evidence of the tax status of all US related account holders, including those US account holders participating in an offshore voluntary disclosure programme. The results of the review were presented by Coutts to the DOJ on 5 November 2014. Coutts continues to cooperate with the DOJ pursuant to the terms of the Programme. Coutts expects to reach resolution with the DOJ in 2015, under the terms of the Programme. Provision has been made for the estimated liability arising from this programme/review.
German prosecutor investigation into Coutts & Co Ltd
A prosecuting authority in Germany is undertaking an investigation into Coutts & Co Ltd in Switzerland, and current and former employees, for alleged aiding and abetting of tax evasion by certain Coutts & Co Ltd clients. Coutts & Co Ltd is cooperating with the authority.
��
Review of suitability of advice provided by Coutts & Co
In 2013 the FCA conducted a thematic review of the advice processes across the UK wealth management industry. As a result of this review, Coutts & Co, a member of the Group incorporated in England and Wales, decided to undertake a past business review into the suitability of investment advice provided to its clients. This review is ongoing. Coutts & Co is in the process of contacting clients and redress is being offered in appropriate cases. Provision has been made for the estimated liability arising from this programme/review.
Enterprise Finance Guarantee Scheme
The Enterprise Finance Guarantee (EFG) is a government lending initiative for small businesses with viable business proposals that lack security for conventional lending. RBS has identified a number of instances where it has not properly explained to customers how borrower and guarantor liabilities work under the EFG scheme and will now undertake a review of affected and potentially affected customers to determine whether affected customers should be offered redress. From 2009 to the end of 2014, RBS provided over £940 million of lending under the EFG scheme.
Notes on the consolidated accounts
| 33 Net cash flow from operating activities | | | |
| | 2014 | 2013 | 2012 |
| | £m | £m | £m |
| Operating profit/(loss) before tax - continuing operations | 2,643 | (8,849) | (6,052) |
| (Loss)/profit before tax - discontinued operations | (3,207) | 783 | 664 |
| Decrease in prepayments and accrued income | 5 | 300 | 787 |
| Interest on subordinated liabilities | 886 | 886 | 841 |
| Decrease in accruals and deferred income | (313) | (889) | (3,653) |
| (Recoveries)/impairment losses | (1,155) | 8,432 | 5,283 |
| Loans and advances written-off net of recoveries | (5,073) | (4,090) | (3,925) |
| Unwind of discount on impairment losses | (247) | (391) | (476) |
| Profit on sale of property, plant and equipment | (137) | (44) | (20) |
| Profit on sale of subsidiaries and associates | (363) | (240) | (95) |
| Profit on sale of securities | (244) | (830) | (1,235) |
| Charge for defined benefit pension schemes | 466 | 517 | 558 |
| Pension schemes curtailment and settlement gains | — | (7) | (41) |
| Cash contribution to defined benefit pension schemes | (1,065) | (821) | (977) |
| Other provisions charged net of releases | 2,711 | 4,422 | 2,899 |
| Other provisions utilised | (3,528) | (2,066) | (1,507) |
| Depreciation and amortisation | 1,109 | 1,410 | 1,854 |
| Gain on redemption of own debt | (20) | (175) | (454) |
| Loss on reclassification to disposal groups | 3,994 | — | — |
| Write down of goodwill and other intangible assets | 533 | 1,403 | 518 |
| Elimination of foreign exchange differences | (724) | (47) | 7,140 |
| Other non-cash items | 1,704 | (1,209) | 1,809 |
| Net cash (outflow)/inflow from trading activities | (2,025) | (1,505) | 3,918 |
| Decrease in loans and advances to banks and customers | 11,245 | 49,314 | 30,719 |
| Decrease in securities | 8,399 | 29,140 | 13,537 |
| Decrease/(increase) in other assets | 375 | (190) | 1,672 |
| (Increase)/decrease in derivative assets | (65,958) | 153,864 | 88,134 |
| Changes in operating assets | (45,939) | 232,128 | 134,062 |
| Decrease in deposits by banks and customers | (11,508) | (84,364) | (7,848) |
| Decrease in debt securities in issue | (15,894) | (26,868) | (68,029) |
| Decrease in other liabilities | (4,150) | (885) | (4,141) |
| Increase/(decrease) in derivative liabilities | 64,424 | (148,807) | (89,763) |
| (Decrease)/increase in settlement balances and short positions | (4,881) | 16 | (13,017) |
| Changes in operating liabilities | 27,991 | (260,908) | (182,798) |
| Income taxes paid | (414) | (346) | (295) |
| Net cash outflow from operating activities | (20,387) | (30,631) | (45,113) |
| 34 Analysis of the net investment in business interests and intangible assets | | | |
| | 2014 | 2013 | 2012 |
| Acquisitions and disposals | £m | £m | £m |
| Fair value given for businesses acquired | (54) | — | (68) |
| Net (liabilities)/assets sold | (1,180) | 1,435 | 1,317 |
| Non-cash consideration | — | 3 | (90) |
| Profit on disposal | 363 | 240 | 95 |
| Net cash and cash equivalents disposed | 11 | 210 | — |
| Net (outflow)/inflow of cash in respect of disposals | (806) | 1,888 | 1,322 |
| Dividends received from associates | 10 | 134 | 22 |
| Cash expenditure on intangible assets | (631) | (872) | (924) |
| Net (outflow)/inflow | (1,481) | 1,150 | 352 |
| | | | |
| (1) | Includes cash proceeds of £578 million in 2013 relating to the disposal of the controlling interest in Direct Line Group. |
Notes on the consolidated accounts
| 35 Interest received and paid | | | |
| | 2014 £m | 2013 £m | 2012 £m |
| Interest received | 13,453 | 17,948 | 19,238 |
| Interest paid | (4,194) | (6,450) | (7,044) |
| | 9,259 | 11,498 | 12,194 |
| 36 Analysis of changes in financing during the year |
| | Share capital, share premium, | | Subordinated liabilities |
| | paid-in equity and merger reserve | |
| | 2014 | 2013 | 2012 | | 2014 | 2013 | 2012 |
| | £m | £m | £m | £m | £m | £m |
| At 1 January | 45,582 | 45,144 | 53,520 | | 24,012 | 26,773 | 26,319 |
| Issue of ordinary shares | 314 | 264 | 120 | | | | |
| Net proceeds from issue of subordinated liabilities | | | | | 2,159 | 1,796 | 2,093 |
| Repayment of subordinated liabilities | | | | | (3,480) | (3,500) | (258) |
| Net cash inflow/(outflow) from financing | 314 | 264 | 120 | | (1,321) | (1,704) | 1,835 |
| Share capital sub-division and consolidation | — | — | (8,933) | | | | |
| Ordinary shares issued in respect of employee share schemes | 234 | 174 | 437 | | | | |
| Reclassification of paid-in equity | (195) | — | — | | | | |
| Other adjustments including foreign exchange | — | — | — | | 214 | (1,057) | (1,381) |
| At 31 December | 45,935 | 45,582 | 45,144 | | 22,905 | 24,012 | 26,773 |
| | | | | | | | |
| 37 Analysis of cash and cash equivalents | | | |
| | 2014 | 2013 | 2012 |
| | £m | £m | £m |
| At 1 January | | | |
- cash | 101,172 | 91,658 | 109,888 |
- cash equivalents | 20,005 | 41,183 | 42,767 |
| | 121,177 | 132,841 | 152,655 |
| Net cash outflow | (13,273) | (11,664) | (19,814) |
| At 31 December | 107,904 | 121,177 | 132,841 |
| | | | |
| Comprising: | | | |
| Cash and balances at central banks | 74,872 | 82,659 | 79,290 |
| Treasury bills and debt securities | 1,899 | 702 | 772 |
| Loans and advances to banks | 31,133 | 37,816 | 52,779 |
| Cash and cash equivalents | 107,904 | 121,177 | 132,841 |
| (1) | Includes cash collateral posted with bank counterparties in respect of derivative liabilities of £11,508 million (2013 - £10,342 million; 2012 - £12,784 million). |
Certain members of the Group are required by law or regulation to maintain balances with the central banks in the jurisdictions in which they operate. These balances are set out below.
| | 2014 | 2013 | 2012 |
| Bank of England | £0.6bn | £0.6bn | £0.4bn |
| US Federal Reserve | US$1.3bn | US$1.2bn | US$1.2bn |
| De Nederlandsche Bank | €0.2bn | €0.2bn | €0.4bn |
Notes on the consolidated accounts
38 Segmental analysis
(a) Reportable segments
The directors manage the Group primarily by class of business and present the segmental analysis on that basis. This includes the review of net interest income for each class of business - interest receivable and payable for all reportable segments is therefore presented net. Segments charge market prices for services rendered between each other; funding charges between segments are determined by RBS Treasury, having regard to commercial demands. The segment performance measure is operating profit/(loss).
Organisational structure
On 27 February 2014, RBS announced a revised organisational structure comprising the following reportable segments.
UK Personal & Business Banking offers a comprehensive range of banking products and related financial services to the UK personal and small business markets. It serves customers through a number of channels including: the RBS and NatWest network of branches and ATMs in the United Kingdom, telephony, online and mobile. Small businesses include accounts having less than £2 million annual turnover and no currency transactions.
Ulster Bank is a retail and commercial bank in Northern Ireland and the Republic of Ireland. It provides a comprehensive range of financial services through both its Retail Banking division, which provides loan and deposit products through a network of branches and direct channels, and its Corporate Banking division, which provides services to businesses and corporate customers.
Commercial Banking provides banking, finance and risk management services to the commercial, mid-corporate and corporate sector in the UK. It offers a full range of banking products and related financial services through a nationwide network of relationship managers, telephone and internet channels. The product range includes invoice finance through the RBSIF brand and asset finance through the Lombard brand.
Private Banking provides banking and wealth management services in the UK through Coutts & Co and Adam & Company, offshore through RBS International and Isle of Man Bank and internationally through Coutts & Co Ltd.
Corporate & Institutional Banking serves corporate and institutional clients primarily in the UK and Western Europe, as well as those US and Asian multinationals with substantial trade and investment links in the region. Products include debt financing, risk management and trade services, focusing on core product capabilities that are of most relevance to clients.
Central Functions comprises Group and corporate functions, such as treasury, finance, risk management, compliance, legal, communications and human resources. The Centre manages the Group's capital resources and Group-wide regulatory projects and provides services to the operating segments.
Citizens Financial Group (CFG) provides financial services primarily through the Citizens and Charter One brands. CFG is engaged in retail and corporate banking activities through its branch network in 11 states in the United States and through non-branch offices in other states.
Although CFG has been reclassified as a discontinued operation, it continues to be presented as a reportable segment.
RBS Capital Resolution (RCR) became fully operational on 1 January 2014 with a pool of c.£29 billion of assets with particularly high long-term capital intensity, credit risk and/or potentially volatile outcomes in stressed environments. RCR brings assets under common management and increases focus on managing these assets so as to release capital. No business lines were moved to RCR so comparative data has not been restated.
Non-Core Division was dissolved on 31 December 2013. It managed separately assets that RBS intended to run off or dispose of. The division contained a range of businesses and asset portfolios primarily from the legacy GBM businesses, higher risk profile asset portfolios including excess risk concentrations, and other illiquid portfolios. It also included a number of other portfolios and businesses including those in regional markets that were no longer strategic to RBS.
Reporting changes
A number of previously reported reconciling items (Payment Protection Insurance costs, Interest Rate Hedging Products redress and related costs, regulatory and legal actions, restructuring costs, amortisation of purchased intangible assets, write down of other intangible assets and bank levy) have now been allocated to the reportable segments. Consistent with the manner in which RBS is managed, operating profit on a non-statutory basis excludes:
| · | Own credit adjustments; |
| · | Gain on redemption of own debt; |
| · | Write down of goodwill; |
| · | Asset Protection Scheme; |
| · | Strategic disposals; and |
| · | RFS Holdings minority interest (RFS MI), |
and includes the results of Citizens that are included in discontinued operations in the statutory results.
In addition, during 2014 RBS also made changes to the method of allocating costs relating to Services and Functions and the basis of allocation of RBS Treasury costs. The costs relating to Services and Functions previously reported as direct expenses in the divisions are now reallocated to businesses using appropriate drivers and reported as indirect expenses in the segmental income statements. In addition, the basis of allocation of Treasury costs has been amended to align the recovery of funding and hedging costs across RBS and for the transfer of certain assets and their associated costs out of Treasury.
Comparatives have been restated accordingly for the changes outlined above.
Notes on the consolidated accounts
| | Net | | | | Depreciation | Impairment | |
| | interest | Non-interest | Total | Operating | and | (losses)/ | Operating |
| | income | income | income | expenses | amortisation | releases | profit/(loss) |
| 2014 | £m | £m | £m | £m | £m | £m | £m |
| UK Personal & Business Banking | 4,683 | 1,354 | 6,037 | (4,319) | — | (268) | 1,450 |
| Ulster Bank | 636 | 194 | 830 | (589) | — | 365 | 606 |
| | | | | | | | |
| Personal & Business Banking | 5,319 | 1,548 | 6,867 | (4,908) | — | 97 | 2,056 |
| | | | | | | | |
| Commercial Banking | 2,041 | 1,169 | 3,210 | (1,703) | (141) | (76) | 1,290 |
| Private Banking | 691 | 391 | 1,082 | (936) | — | 4 | 150 |
| | | | | | | | |
| Commercial & Private Banking | 2,732 | 1,560 | 4,292 | (2,639) | (141) | (72) | 1,440 |
| | | | | | | | |
| Corporate & Institutional Banking | 817 | 3,132 | 3,949 | (4,830) | (20) | 9 | (892) |
| Central items | 440 | (477) | (37) | (68) | (757) | 12 | (850) |
| Citizens Financial Group | 2,013 | 1,068 | 3,081 | (1,942) | (181) | (197) | 761 |
| RCR | (47) | 92 | 45 | (352) | (11) | 1,306 | 988 |
| Non-statutory basis | 11,274 | 6,923 | 18,197 | (14,739) | (1,110) | 1,155 | 3,503 |
| | | | | | | | |
| Reconciling items | | | | | | | |
| Own credit adjustments | — | (146) | (146) | — | — | — | (146) |
| Gain on redemption of own debt | — | 20 | 20 | — | — | — | 20 |
| Write down of goodwill | — | — | — | (130) | — | — | (130) |
| Strategic disposals | — | 191 | 191 | — | — | — | 191 |
| Citizens discontinued operations | (2,013) | (1,078) | (3,091) | 1,943 | 180 | 197 | (771) |
| RFS Holdings minority interest | (3) | (18) | (21) | (3) | — | — | (24) |
| Statutory basis | 9,258 | 5,892 | 15,150 | (12,929) | (930) | 1,352 | 2,643 |
| 2013* | | | | | | | |
| UK Personal & Business Banking | 4,490 | 1,323 | 5,813 | (4,492) | (1) | (501) | 819 |
| Ulster Bank | 619 | 240 | 859 | (693) | (1) | (1,774) | (1,609) |
| | | | | | | | |
| Personal & Business Banking | 5,109 | 1,563 | 6,672 | (5,185) | (2) | (2,275) | (790) |
| | | | | | | | |
| Commercial Banking | 1,962 | 1,195 | 3,157 | (1,839) | (136) | (652) | 530 |
| Private Banking | 658 | 419 | 1,077 | (1,109) | — | (29) | (61) |
| | | | | | | | |
| Commercial & Private Banking | 2,620 | 1,614 | 4,234 | (2,948) | (136) | (681) | 469 |
| | | | | | | | |
| Corporate & Institutional Banking | 684 | 4,324 | 5,008 | (7,095) | (115) | (680) | (2,882) |
| Central items | 783 | 126 | 909 | 718 | (916) | (64) | 647 |
| Citizens Financial Group | 1,892 | 1,073 | 2,965 | (2,042) | (162) | (156) | 605 |
| Non-Core | (96) | (250) | (346) | (548) | (79) | (4,576) | (5,549) |
| Non-statutory basis | 10,992 | 8,450 | 19,442 | (17,100) | (1,410) | (8,432) | (7,500) |
| | | | | | | | |
| Reconciling items | | | | | | | |
| Own credit adjustments | — | (120) | (120) | — | — | — | (120) |
| Gain on redemption of own debt | — | 175 | 175 | — | — | — | 175 |
| Write-down of goodwill | — | — | — | (1,059) | — | — | (1,059) |
| Strategic disposals | — | 161 | 161 | — | — | — | 161 |
| Citizens discontinued operations | (1,964) | (1,056) | (3,020) | 1,939 | 163 | 312 | (606) |
| RFS Holdings minority interest | (11) | 110 | 99 | 1 | — | — | 100 |
| Statutory basis | 9,017 | 7,720 | 16,737 | (16,219) | (1,247) | (8,120) | (8,849) |
| | | | | | | | |
| *Restated | | | | | | | |
Notes on the consolidated accounts
| | Net | | | | Depreciation | | |
| | interest | Non-interest | Total | Operating | and | Impairment | Operating |
| | income | income | income | expenses | amortisation | losses | profit/(loss) |
| 2012* | £m | £m | £m | £m | £m | £m | £m |
| UK Personal & Business Banking | 4,532 | 1,352 | 5,884 | (4,472) | — | (741) | 671 |
| Ulster Bank | 635 | 196 | 831 | (600) | — | (1,364) | (1,133) |
| | | | | | | | |
| Personal & Business Banking | 5,167 | 1,548 | 6,715 | (5,072) | — | (2,105) | (462) |
| | | | | | | | |
| Commercial Banking | 1,969 | 1,351 | 3,320 | (1,859) | (168) | (545) | 748 |
| Private Banking | 676 | 450 | 1,126 | (945) | 6 | (46) | 141 |
| | | | | | | | |
| Commercial & Private Banking | 2,645 | 1,801 | 4,446 | (2,804) | (162) | (591) | 889 |
| | | | | | | | |
| Corporate & Institutional Banking | 816 | 5,595 | 6,411 | (6,279) | (150) | (229) | (247) |
| Central items | 620 | 508 | 1,128 | 790 | (1,033) | (40) | 845 |
| Citizens Financial Group | 1,938 | 1,159 | 3,097 | (2,046) | (200) | (91) | 760 |
| Non-Core | 231 | 57 | 288 | (706) | (257) | (2,223) | (2,898) |
| Non-statutory basis | 11,417 | 10,668 | 22,085 | (16,117) | (1,802) | (5,279) | (1,113) |
| | | | | | | | |
| Reconciling items | | | | | | | |
| Own credit adjustments | — | (4,649) | (4,649) | — | — | — | (4,649) |
| Gain on redemption of own debt | — | 454 | 454 | — | — | — | 454 |
| Write down of goodwill | — | — | — | (18) | — | — | (18) |
| Asset Protection Scheme | — | (44) | (44) | — | — | — | (44) |
| Strategic disposals | — | 113 | 113 | — | — | — | 113 |
| Citizens discontinued operations | (2,046) | (1,180) | (3,226) | 1,983 | 199 | 269 | (775) |
| RFS Holdings minority interest | (15) | (3) | (18) | (2) | — | — | (20) |
| Statutory basis | 9,356 | 5,359 | 14,715 | (14,154) | (1,603) | (5,010) | (6,052) |
| | 2014 | | 2013* | | 2012* |
| | | Inter | | | | Inter | | | | Inter | |
| | External | segment | Total | External | segment | Total | External | segment | Total |
| Total income | £m | £m | £m | £m | £m | £m | £m | £m | £m |
| UK Personal & Business Banking | 6,051 | (14) | 6,037 | | 5,820 | (7) | 5,813 | | 6,007 | (123) | 5,884 |
| Ulster Bank | 688 | 142 | 830 | | 736 | 123 | 859 | | 754 | 77 | 831 |
| | | | | | | | | | | | |
| Personal & Business Banking | 6,739 | 128 | 6,867 | | 6,556 | 116 | 6,672 | | 6,761 | (46) | 6,715 |
| | | | | | | | | | | | |
| Commercial Banking | 3,525 | (315) | 3,210 | | 3,472 | (315) | 3,157 | | 3,742 | (422) | 3,320 |
| Private Banking | 697 | 385 | 1,082 | | 585 | 492 | 1,077 | | 448 | 678 | 1,126 |
| | | | | | | | | | | | |
| Commercial & Private Banking | 4,222 | 70 | 4,292 | | 4,057 | 177 | 4,234 | | 4,190 | 256 | 4,446 |
| | | | | | | | | | | | |
| Corporate & Institutional Banking | 3,890 | 59 | 3,949 | | 4,736 | 272 | 5,008 | | 6,057 | 354 | 6,411 |
| Central items | (49) | 12 | (37) | | 1,164 | (255) | 909 | | 998 | 130 | 1,128 |
| Citizens Financial Group | 3,110 | (29) | 3,081 | | 2,883 | 82 | 2,965 | | 2,973 | 124 | 3,097 |
| RCR | 275 | (230) | 45 | | n/a | n/a | n/a | | n/a | n/a | n/a |
| Non-Core | n/a | n/a | n/a | | 44 | (390) | (346) | | 1,104 | (816) | 288 |
| Non-statutory basis | 18,187 | 10 | 18,197 | | 19,440 | 2 | 19,442 | | 22,083 | 2 | 22,085 |
| | | | | | | | | | | | |
| Reconciling items | | | | | | | | | | | |
| Own credit adjustments | (146) | — | (146) | | (120) | — | (120) | | (4,649) | — | (4,649) |
| Gain on redemption of own debt | 20 | — | 20 | | 175 | — | 175 | | 454 | — | 454 |
| Asset Protection Scheme | — | — | — | | — | — | — | | (44) | — | (44) |
| Strategic disposals | 191 | — | 191 | | 161 | — | 161 | | 113 | — | 113 |
| Citizens discontinued operations | (3,081) | (10) | (3,091) | | (3,020) | — | (3,020) | | (3,226) | — | (3,226) |
| RFS Holdings minority interest | (21) | — | (21) | | 101 | (2) | 99 | | (16) | (2) | (18) |
| Statutory basis | 15,150 | — | 15,150 | | 16,737 | — | 16,737 | | 14,715 | — | 14,715 |
| | | | | | | | | | | | |
| *Restated | | | | | | | | | | | |
Notes on the consolidated accounts
| | 2014 | | 2013* | | 2012* |
| | | Inter | | | | Inter | | | | Inter | |
| | External | segment | Total | External | segment | Total | External | segment | Total |
| Total revenue | £m | £m | £m | £m | £m | £m | £m | £m | £m |
| UK Personal & Business Banking | 7,205 | 13 | 7,218 | | 7,306 | 17 | 7,323 | | 7,491 | 870 | 8,361 |
| Ulster Bank | 822 | 76 | 898 | | 1,022 | 67 | 1,089 | | 1,076 | — | 1,076 |
| | | | | | | | | | | | |
| Personal & Business Banking | 8,027 | 89 | 8,116 | | 8,328 | 84 | 8,412 | | 8,567 | 870 | 9,437 |
| | | | | | | | | | | | |
| Commercial Banking | 3,500 | 26 | 3,526 | | 3,545 | 31 | 3,576 | | 3,778 | 47 | 3,825 |
| Private Banking | 933 | 515 | 1,448 | | 984 | 635 | 1,619 | | 1,043 | 839 | 1,882 |
| | | | | | | | | | | | |
| Commercial & Private Banking | 4,433 | 541 | 4,974 | | 4,529 | 666 | 5,195 | | 4,821 | 886 | 5,707 |
| | | | | | | | | | | | |
| Corporate & Institutional Banking | 5,025 | 3,996 | 9,021 | | 6,419 | 4,925 | 11,344 | | 8,130 | 6,130 | 14,260 |
| Central items | 1,652 | 2,627 | 4,279 | | 2,700 | 8,675 | 11,375 | | 2,936 | 14,248 | 17,184 |
| Citizens Financial Group | 3,336 | 10 | 3,346 | | 3,208 | 94 | 3,302 | | 3,413 | 132 | 3,545 |
| RCR | 632 | 319 | 951 | | n/a | n/a | n/a | | n/a | n/a | n/a |
| Non-Core | n/a | n/a | n/a | | 948 | 523 | 1,471 | | 2,164 | 815 | 2,979 |
| Non-statutory basis | 23,105 | 7,582 | 30,687 | | 26,132 | 14,967 | 41,099 | | 30,031 | 23,081 | 53,112 |
| | | | | | | | | | | | |
| Reconciling items | | | | | | | | | | | |
| Own credit adjustments | (146) | — | (146) | | (120) | — | (120) | | (4,649) | — | (4,649) |
| Gain on redemption of own debt | 20 | — | 20 | | 175 | — | 175 | | 454 | — | 454 |
| Asset Protection Scheme | — | — | — | | — | — | — | | (44) | — | (44) |
| Strategic disposals | 191 | — | 191 | | 161 | — | 161 | | 113 | — | 113 |
| Citizens discontinued operations | (3,307) | — | (3,307) | | (3,327) | — | (3,327) | | (3,643) | — | (3,643) |
| RFS Holdings minority interest | (18) | — | (18) | | 110 | — | 110 | | (2) | — | (2) |
| Eliminations | — | (7,582) | (7,582) | | — | (14,967) | (14,967) | | — | (23,081) | (23,081) |
| Statutory basis | 19,845 | — | 19,845 | | 23,131 | — | 23,131 | | 22,260 | — | 22,260 |
| | | | | | | | | | | | |
| | 2014 | | 2013* | | 2012* |
| | | | Cost to | | | | Cost to | | | | Cost to |
| | | | acquire fixed | | | acquire fixed | | | acquire fixed |
| | | | assets and | | | assets and | | | assets and |
| | | | intangible | | | intangible | | | intangible |
| | Assets | Liabilities | assets | Assets | Liabilities | assets | Assets | Liabilities | assets |
| | £m | £m | £m | £m | £m | £m | £m | £m | £m |
| UK Personal & Business Banking | 134,257 | 150,481 | — | | 132,154 | 146,256 | — | | 133,004 | 136,686 | — |
| Ulster Bank | 27,596 | 24,657 | — | | 28,183 | 27,047 | 11 | | 30,727 | 28,745 | 4 |
| | | | | | | | | | | | |
| Personal & Business Banking | 161,853 | 175,138 | — | | 160,337 | 173,303 | 11 | | 163,731 | 165,431 | 4 |
| | | | | | | | | | | | |
| Commercial Banking | 89,382 | 88,987 | 218 | | 87,899 | 93,200 | 83 | | 88,322 | 94,378 | 345 |
| Private Banking | 20,480 | 36,793 | 21 | | 21,148 | 37,564 | 27 | | 21,494 | 39,431 | 51 |
| | | | | | | | | | | | |
| Commercial & Private Banking | 109,862 | 125,780 | 239 | | 109,047 | 130,764 | 110 | | 109,816 | 133,809 | 396 |
| | | | | | | | | | | | |
| Corporate & Institutional Banking | 577,230 | 536,243 | 28 | | 551,200 | 512,691 | 508 | | 775,549 | 754,953 | 390 |
| Central items | 86,947 | 69,394 | 832 | | 103,470 | 84,279 | 842 | | 113,380 | 105,180 | 991 |
| RCR | 29,030 | 12,683 | 111 | | n/a | n/a | n/a | | n/a | n/a | n/a |
| Non-Core | n/a | n/a | n/a | | 31,177 | 6,100 | 18 | | 63,380 | 9,858 | 169 |
| Citizens Financial Group | 84,932 | 71,258 | 215 | | 71,738 | 61,289 | 267 | | 72,904 | 63,116 | 308 |
| Direct Line Group | — | — | — | | — | — | — | | 12,697 | 9,267 | 275 |
| RFS Holdings minority interest | 909 | 75 | — | | 909 | 237 | — | | 838 | 233 | — |
| | 1,050,763 | 990,571 | 1,425 | | 1,027,878 | 968,663 | 1,756 | | 1,312,295 | 1,241,847 | 2,533 |
| *Restated | | | | | | | | | | | |
Notes on the consolidated accounts
| Segmental analysis of assets and liabilities included in disposal groups: | | | | | | | |
| | | | | | | | | |
| | 2014 | | 2013* | | 2012* |
| | Assets | Liabilities | | Assets | Liabilities | | Assets | Liabilities |
| | £m | £m | £m | £m | £m | £m |
| Private Banking | 2 | — | | 3 | — | | — | — |
| Corporate & Institutional Banking | 18 | 14 | | 78 | 48 | | 235 | 53 |
| Central items | — | — | | 882 | 1 | | (74) | 1 |
| Citizens Financial Group | 80,967 | 71,268 | | 679 | 3,190 | | — | — |
| RCR | 569 | 2 | | n/a | n/a | | n/a | n/a |
| Non-Core | n/a | n/a | | 773 | 21 | | 576 | 808 |
| Direct Line Group | — | — | | — | — | | 12,697 | 9,267 |
| RFS Holdings minority interest | 455 | 36 | | 602 | 118 | | 579 | 41 |
| | 82,011 | 71,320 | | 3,017 | 3,378 | | 14,013 | 10,170 |
| *Restated | | | | | | | | |
| Segmental analysis of goodwill is as follows: | | | | | | | |
| | UK Personal | | | Corporate & | Citizens | | |
| | & Business | Commercial | Private | Institutional | Financial | Direct Line | |
| | Banking | Banking | Banking | Banking | Group | Group | Total |
| | £m | £m | £m | £m | £m | £m | £m |
| At 1 January 2012* | 3,351 | 2,121 | 812 | 1,214 | 3,992 | 934 | 12,424 |
| Transfer to disposal groups | — | — | — | — | — | (540) | (540) |
| Disposals | — | — | (9) | — | — | — | (9) |
| Currency translation and other adjustments | — | — | (3) | (25) | (169) | — | (197) |
| Write down of goodwill | | | | | | | |
- continuing operations | — | — | — | (18) | — | — | (18) |
- discontinued operations | — | — | — | — | — | (394) | (394) |
| At 1 January 2013* | 3,351 | 2,121 | 800 | 1,171 | 3,823 | — | 11,266 |
| Disposals | — | — | (1) | — | — | — | (1) |
| Currency translation and other adjustments | — | — | 2 | 18 | (87) | — | (67) |
| Write down of goodwill - continuing operations | — | — | — | (1,059) | — | — | (1,059) |
| At 1 January 2014* | 3,351 | 2,121 | 801 | 130 | 3,736 | — | 10,139 |
| Transfers to disposal groups | — | — | — | — | (3,957) | — | (3,957) |
| Currency translation and other adjustments | — | — | (9) | — | 221 | — | 212 |
| Write down of goodwill - continuing operations | — | — | — | (130) | — | — | (130) |
| At 31 December 2014 | 3,351 | 2,121 | 792 | — | — | — | 6,264 |
| | | | | | | | |
| *Restated | | | | | | | |
Notes on the consolidated accounts
| (b) Geographical segments |
| The geographical analysis in the tables below has been compiled on the basis of location of office where the transactions are recorded. |
| 2014 | UK | USA | Europe | RoW | Total |
| | £m | £m | £m | £m | £m |
| Total revenue | 15,913 | 1,261 | 1,817 | 854 | 19,845 |
| | | | | | |
| Net interest income | 7,976 | 223 | 637 | 422 | 9,258 |
| Net fees and commissions | 2,483 | 285 | 595 | 176 | 3,539 |
| Income from trading activities | 530 | 538 | 238 | (21) | 1,285 |
| Other operating income/(loss) | 941 | 89 | (83) | 121 | 1,068 |
| Total income | 11,930 | 1,135 | 1,387 | 698 | 15,150 |
| | | | | | |
| Operating profit before tax | 828 | 375 | 1,354 | 86 | 2,643 |
| Total assets | 779,885 | 182,471 | 51,227 | 37,180 | 1,050,763 |
| Of which total assets held for sale | 48 | 80,985 | — | 978 | 82,011 |
| Total liabilities | 744,604 | 166,489 | 45,417 | 34,061 | 990,571 |
| Of which total liabilities held for sale | 2 | 71,282 | — | 36 | 71,320 |
| Net assets attributable to equity owners and non-controlling interests | 35,281 | 15,982 | 5,810 | 3,119 | 60,192 |
| Contingent liabilities and commitments | 103,576 | 89,002 | 41,399 | 7,209 | 241,186 |
| Cost to acquire property, plant and equipment and intangible assets | 1,025 | 244 | 133 | 23 | 1,425 |
| | | | | | |
| 2013 | | | | | |
| Total revenue | 16,015 | 2,188 | 2,913 | 2,015 | 23,131 |
| | | | | | |
| Net interest income | 7,794 | 236 | 746 | 241 | 9,017 |
| Net fees and commissions | 2,544 | 336 | 663 | 212 | 3,755 |
| Income from trading activities | 1,474 | 899 | 106 | 92 | 2,571 |
| Other operating income | 644 | 203 | 242 | 305 | 1,394 |
| Total income | 12,456 | 1,674 | 1,757 | 850 | 16,737 |
| | | | | | |
| Operating (loss)/profit before tax | (2,444) | (1,221) | (5,262) | 78 | (8,849) |
| Total assets | 747,347 | 197,789 | 40,113 | 42,629 | 1,027,878 |
| Of which total assets held for sale | 915 | 750 | 198 | 1,154 | 3,017 |
| Total liabilities | 692,861 | 183,549 | 50,107 | 42,146 | 968,663 |
| Of which total liabilities held for sale | — | 3,210 | 81 | 87 | 3,378 |
| Net assets attributable to equity owners and non-controlling interests | 54,486 | 14,240 | (9,994) | 483 | 59,215 |
| Contingent liabilities and commitments | 107,500 | 83,048 | 41,368 | 10,093 | 242,009 |
| Cost to acquire property, plant and equipment and intangible assets | 1,086 | 428 | 232 | 10 | 1,756 |
| | | | | | |
| 2012 | | | | | |
| Total revenue | 12,396 | 3,181 | 3,790 | 2,893 | 22,260 |
| | | | | | |
| Net interest income | 8,212 | 111 | 770 | 263 | 9,356 |
| Net fees and commissions | 2,834 | 425 | 564 | 257 | 4,080 |
| Income from trading activities | (314) | 1,323 | 193 | 257 | 1,459 |
| Other operating (loss)/income | (710) | 113 | 356 | 61 | (180) |
| Total income | 10,022 | 1,972 | 1,883 | 838 | 14,715 |
| | | | | | |
| Operating (loss)/profit before tax | (4,671) | 1,046 | (2,034) | (393) | (6,052) |
| Total assets | 899,604 | 305,588 | 47,966 | 59,137 | 1,312,295 |
| Of which total assets held for sale | 11,638 | 291 | 1,001 | 1,083 | 14,013 |
| Total liabilities | 835,268 | 288,005 | 61,801 | 56,773 | 1,241,847 |
| Of which total liabilities held for sale | 8,405 | 129 | 871 | 765 | 10,170 |
| Net assets attributable to equity owners and non-controlling interests | 64,336 | 17,583 | (13,835) | 2,364 | 70,448 |
| Contingent liabilities and commitments | 105,018 | 84,788 | 49,341 | 8,498 | 247,645 |
| Cost to acquire property, plant and equipment and intangible assets | 1,953 | 325 | 186 | 69 | 2,533 |
| | | | | | |
Notes on the consolidated accounts
| 39 Directors' and key management remuneration | | |
| | | |
| | 2014 | 2013 |
| Directors' remuneration | £000 | £000 |
| Non-executive directors - emoluments | 1,367 | 1,208 |
| Chairman and executive directors | | |
- emoluments | 4,211 | 3,632 |
- contributions and allowances in respect of money purchase schemes | — | 348 |
| | 5,578 | 5,188 |
- amounts receivable under long-term incentive plans and share option plans | 1,469 | — |
| | 7,047 | 5,188 |
No directors accrued benefits under defined benefit schemes during 2014 and 2013. No directors are accruing benefits under a money purchase scheme (2013 - one).
The executive directors may participate in the company's long-term incentive plans, executive share option and sharesave schemes and details of their interests in the company's shares arising from their participation are given in the Directors' remuneration report. Details of the remuneration received by each director is also given in the Directors' remuneration report.
Compensation of key management
The aggregate remuneration of directors and other members of key management during the year was as follows:
| | 2014 | 2013 |
| | £000 | £000 |
| Short-term benefits | 20,917 | 30,590 |
| Post-employment benefits | 1,964 | 238 |
| Termination benefits | 3,481 | 2,033 |
| Share-based payments | 4,889 | 13,003 |
| | 31,251 | 45,864 |
In 2014, key management includes only members of the Executive Committee; in 2013 key management also included members of the Management Committee.
40 Transactions with directors and key management
(a) At 31 December 2014, amounts outstanding in relation to transactions, arrangements and agreements entered into by authorised institutions in the Group, as defined in UK legislation, were £654,534 in respect of loans to six persons who were directors of the company at any time during the financial period.
(b) For the purposes of IAS 24 ‘Related Party Disclosures’, key management comprise directors of the company and members of the Executive Committee. The captions in the Group's primary financial statements include the following amounts attributable, in aggregate, to key management:
| | 2014 £000 | 2013 £000 |
| Loans and advances to customers | 4,089 | 10,750 |
| Customer accounts | 22,037 | 33,279 |
Key management have banking relationships with Group entities which are entered into in the normal course of business and on substantially the same terms, including interest rates and security, as for comparable transactions with other persons of a similar standing or, where applicable, with other employees. These transactions did not involve more than the normal risk of repayment or present other unfavourable features.
Notes on the consolidated accounts
41 Related parties
UK Government
On 1 December 2008, the UK Government through HM Treasury became the ultimate controlling party of The Royal Bank of Scotland Group plc. The UK Government's shareholding is managed by UK Financial Investments Limited, a company wholly owned by the UK Government. As a result, the UK Government and UK Government controlled bodies became related parties of the Group.
The Group enters into transactions with many of these bodies on an arm’s length basis. The principal transactions during 2014, 2013 and 2012 included: Bank of England facilities and the issue of debt guaranteed by the UK Government discussed below and the Asset Protection Scheme which the Group exited on 18 October 2012 having paid total premiums of £2.5 billion. In addition, the redemption of non-cumulative sterling preference shares and the placing and open offer in April 2009 was underwritten by HM Treasury and, in December 2009, B shares were issued to HM Treasury and a contingent capital agreement concluded with HM Treasury (see Note 27). Other transactions include the payment of: taxes principally UK corporation tax (page 368) and value added tax; national insurance contributions; local authority rates; and regulatory fees and levies (including the bank levy (page 358) and FSCS levies (page 425)), together with banking transactions such as loans and deposits undertaken in the normal course of banker-customer relationships.
Bank of England facilities
The Group may participate in a number of schemes operated by the Bank of England in the normal course of business.
Members of the Group that are UK authorised institutions are required to maintain non-interest bearing (cash ratio) deposits with the Bank of England amounting to 0.18% of their eligible liabilities in excess of £600 million. They also have access to Bank of England reserve accounts: sterling current accounts that earn interest at the Bank of England Rate.
National Loan Guarantee Scheme
The Group participated in the National Loan Guarantee Scheme (NLGS), providing loans and facilities to eligible customers at a discount of one percent. It did not issue any guaranteed debt under the scheme and consequently, it was not committed to providing a particular volume of reduced rate facilities. At 31 December 2014, the Group had no amounts outstanding under the scheme (2013 - nil; 2012 - £898 million). The NLGS was superseded by the Funding for Lending Scheme.
The Funding for Lending Scheme
The Funding for Lending Scheme was launched in July 2012. Under the scheme UK banks and building societies are able to borrow UK treasury bills from the Bank of England at a price that depends on the participant’s net lending to the UK non-financial sector. As at 31 December 2014, the Group had no amounts outstanding under the scheme (2013 - nil; 2012 - £749 million).
Other related parties
| (a) | In their roles as providers of finance, Group companies provide development and other types of capital support to businesses. These investments are made in the normal course of business and on arm's length terms. In some instances, the investment may extend to ownership or control over 20% or more of the voting rights of the investee company. However, these investments are not considered to give rise to transactions of a materiality requiring disclosure under IAS 24. |
| (b) | The Group recharges The Royal Bank of Scotland Group Pension Fund with the cost of administration services incurred by it. The amounts involved are not material to the Group. |
| (c) | In accordance with IAS 24, transactions or balances between Group entities that have been eliminated on consolidation are not reported. |
| (d) | The captions in the primary financial statements of the parent company include amounts attributable to subsidiaries. These amounts have been disclosed in aggregate in the relevant notes to the financial statements. |
42 Post balance sheet events
There have been no significant events between 31 December 2014 and the date of approval of these accounts which would require a change to or additional disclosure in the accounts.
Notes on the consolidated accounts
43 Consolidating financial information
The Royal Bank of Scotland plc ('RBS plc') is a wholly owned subsidiary of The Royal Bank of Scotland Group plc ('RBSG plc') and is able to offer and sell certain securities in the US from time to time pursuant to a registration statement on Form F-3 filed with the SEC with a full and unconditional guarantee from RBSG plc.
RBS plc utilises an exception provided in Rule 3-10 of Regulation S-X, and therefore does not file its financial statements with the SEC. In accordance with the requirements to qualify for the exception, presented below is condensed consolidating financial information for:
| · | RBSG plc on a stand-alone basis as guarantor; |
| · | RBS plc on a stand-alone basis as issuer; |
| · | Non-guarantor Subsidiaries of RBSG plc and RBS plc on a combined basis ('Subsidiaries'); |
| · | Consolidation adjustments; and |
| · | RBSG plc consolidated amounts ('RBSG Group'). |
Under IAS 27 (Revised 2011) – Separate Financial Statements, RBSG plc and RBS plc account for investments in their subsidiary undertakings at cost less impairment. Rule 3-10 of Regulation S-X requires a company to account for its investments in subsidiary undertakings using the equity method, which would decrease the results for the period of RBSG plc and RBS plc in the information below by £3,920 million and £1,115 million respectively for the year ended 31 December 2014 (£9,580 million and £6,053 million for the year ended 31 December 2013; £5,083 million and £3,093 million for the year ended 31 December 2012). The net assets of RBSG plc and RBS plc in the information below would also be decreased by £4,069 million and £5,767 million respectively at 31 December 2014 (decreased by £1,575 million and £5,536 million at 31 December 2013; increased by £9,704 million and £1,178 million at 31 December 2012).
| For the year ended 31 December 2014 | RBSG plc £m | RBS plc £m | Subsidiaries(1) £m | Consolidation Adjustments(2) £m | RBSG Group £m |
| Net interest income | 257 | 2,995 | 7,770 | (1,764) | 9,258 |
| Non-interest income | 980 | 4,880 | 1,693 | (1,661) | 5,892 |
| Total income | 1,237 | 7,875 | 9,463 | (3,425) | 15,150 |
| Operating expenses | (151) | (8,880) | (7,261) | 2,433 | (13,859) |
| Impairment recoveries | 15 | 46 | 1,051 | 240 | 1,352 |
| Operating profit(loss) before tax | 1,101 | (959) | 3,253 | (752) | 2,643 |
| Tax charge | 27 | (1,099) | (1,299) | 462 | (1,909) |
| Profit/(loss) from continuing operations | 1,128 | (2,058) | 1,954 | (290) | 734 |
| Loss from discontinued operations, net of tax | - | - | 42 | (3,487) | (3,445) |
| Profit/(loss) for the year | 1,128 | (2,058) | 1,996 | (3,777) | (2,711) |
| Attributable to: | | | | | |
| Non-controlling interests | — | — | 4 | 56 | 60 |
| Preference shareholders | 330 | 61 | — | (61) | 330 |
| Paid-in equity holders | 28 | — | — | 21 | 49 |
| Dividend access share | 320 | — | — | — | 320 |
| Ordinary and B shareholders | 450 | (2,119) | 1,992 | (3,793) | (3,470) |
| | 1,128 | (2,058) | 1,996 | (3,777) | (2,711) |
Statement of comprehensive income
| For the year ended 31 December 2014 | RBSG plc £m | RBS plc £m | Subsidiaries(1) £m | Consolidation Adjustments(2) £m | RBSG Group £m |
| Profit/(loss) for the year | 1,128 | (2,058) | 1,996 | (3,777) | (2,711) |
| Items that do not qualify for reclassification | | | | | |
| Actuarial losses on defined benefit plans | - | (107) | (1) | - | (108) |
| Tax charge | - | 16 | (52) | - | (36) |
| | - | (91) | (53) | - | (144) |
| Items that do qualify for reclassification | | | | | |
| Available-for-sale financial assets | - | (62) | 775 | 94 | 807 |
| Cash flow hedges | - | 506 | 277 | 630 | 1,413 |
| Currency translation | - | 111 | 316 | (120) | 307 |
| Tax charge | - | (89) | (156) | (210) | (455) |
| | - | 466 | 1,212 | 394 | 2,072 |
| Other comprehensive income after tax | - | 375 | 1,159 | 394 | 1,928 |
| Total comprehensive income/(loss) for the year | 1,128 | (1,683) | 3,155 | (3,383) | (783) |
For the notes to this table see page 445.
Notes on the consolidated accounts
43 Consolidating financial information continued For the year ended 31 December 2014 (continued) Total comprehensive (loss)/income is attributable to: | | | | | |
| Non-controlling interests | - | - | (40) | 286 | 246 |
| Preference shareholders | 330 | 61 | - | (61) | 330 |
| Paid-in equity holders | 28 | - | - | 21 | 49 |
| Dividend access share | 320 | - | - | - | 320 |
| Ordinary and B shareholders | 450 | (1,744) | 3,195 | (3,629) | (1,728) |
| | 1,128 | (1,683) | 3,155 | (3,383) | (783) |
Income statement
| For the year ended 31 December 2013 | RBSG plc £m | RBS plc £m | Subsidiaries(1) £m | Consolidation Adjustments(2) £m | RBSG Group £m |
| Net interest income | 258 | 3,370 | 7,102 | (1,713) | 9,017 |
| Non-interest income | 700 | 7,391 | 3,523 | (3,894) | 7,720 |
| Total income | 958 | 10,761 | 10,625 | (5,607) | 16,737 |
| Operating expenses | 40 | (8,217) | (11,399) | 2,110 | (17,466) |
| Impairment (losses)/recoveries | - | (2,536) | (5,704) | 120 | (8,120) |
| Operating profit/(loss) before tax | 998 | 8 | (6,478) | (3,377) | (8,849) |
| Tax charge | (34) | (1,207) | 681 | 374 | (186) |
| Profit/(loss) from continuing operations | 964 | (1,199) | (5,797) | (3,003) | (9,035) |
| Profit from discontinued operations, net of tax | - | - | 76 | 482 | 558 |
| Profit/(loss) for the year | 964 | (1,199) | (5,721) | (2,521) | (8,477) |
| Attributable to: | | | | | |
| Non-controlling interests | — | — | (13) | 133 | 120 |
| Preference shareholders | 349 | 58 | — | (58) | 349 |
| Paid-in equity holders | 30 | — | (1) | 20 | 49 |
| Ordinary and B shareholders | 585 | (1,257) | (5,707) | (2,616) | (8,995) |
| | 964 | (1,199) | (5,721) | (2,521) | (8,477) |
Statement of comprehensive income
| For the year ended 31 December 2013 | RBSG plc £m | RBS plc £m | Subsidiaries £m | Consolidation Adjustments £m | RBSG Group £m |
| Profit/(loss) for the year | 964 | (1,199) | (5,721) | (2,521) | (8,477) |
| Items that do not qualify for reclassification | | | | | |
| Actuarial (losses)/gains on defined benefit plans | — | (13) | 459 | — | 446 |
| Tax charge | — | 6 | (252) | — | (246) |
| | — | (7) | 207 | — | 200 |
| Items that do qualify for reclassification | | | | | |
| Available-for-sale financial assets | — | (1,497) | 789 | 302 | (406) |
| Cash flow hedges | — | (1,857) | (125) | (309) | (2,291) |
| Currency translation | — | (66) | 77 | (240) | (229) |
| Tax charge | — | 796 | 188 | 30 | 1,014 |
| | — | (2,624) | 929 | (217) | (1,912) |
| Other comprehensive (loss)/income after tax | — | (2,631) | 1,136 | (217) | (1,712) |
| Total comprehensive income/(loss) for the year | 964 | (3,830) | (4,585) | (2,738) | (10,189) |
| | | | | | |
| Total comprehensive income/(loss) is attributable to: | | | | | |
| Non-controlling interests | — | — | 6 | 131 | 137 |
| Preference shareholders | 349 | 58 | — | (58) | 349 |
| Paid-in equity holders | 30 | — | — | 19 | 49 |
| Ordinary and B shareholders | 585 | (3,888) | (4,591) | (2,830) | (10,724) |
| | 964 | (3,830) | (4,585) | (2,738) | (10,189) |
For the notes to this table see page 445.
Notes on the consolidated accounts
43 Consolidating financial information continued
Income statement
| For the year ended 31 December 2012 | RBSG plc £m | RBS plc £m | Subsidiaries(1) £m | Consolidation Adjustments(2) £m | RBSG Group £m |
| Net interest income | 390 | 4,038 | 6,816 | (1,888) | 9,356 |
| Non-interest income | 2,263 | 5,830 | 2,391 | (5,125) | 5,359 |
| Total income | 2,653 | 9,868 | 9,207 | (7,013) | 14,715 |
| Operating expenses | 12 | (9,138) | (9,234) | 2,603 | (15,757) |
| Impairment (losses)/recoveries | (3,194) | (1,548) | (1,825) | 1,557 | (5,010) |
| Operating loss before tax | (529) | (818) | (1,852) | (2,853) | (6,052) |
| Tax charge | (155) | 37 | (419) | 381 | (156) |
| Loss from continuing operations | (684) | (781) | (2,271) | (2,472) | (6,208) |
| Profit from discontinued operations, net of tax | - | - | 222 | 96 | 318 |
| Loss for the year | (684) | (781) | (2,049) | (2,376) | (5,890) |
| Attributable to: | | | | | |
| Non-controlling interests | — | — | 19 | (155) | (136) |
| Preference shareholders | 273 | 58 | 179 | (237) | 273 |
| Paid-in equity holders | 15 | — | — | 13 | 28 |
| Ordinary and B shareholders | (972) | (839) | (2,247) | (1,997) | (6,055) |
| | (684) | (781) | (2,049) | (2,376) | (5,890) |
Statement of comprehensive income
| For the year ended 31 December 2012 | RBSG plc £m | RBS plc £m | Subsidiaries £m | Consolidation Adjustments £m | RBSG Group £m |
| Loss for the year | (684) | (781) | (2,049) | (2,376) | (5,890) |
| Items that do not qualify for reclassification | | | | | |
| Actuarial losses on defined benefit plans | — | (126) | (67) | (1,965) | (2,158) |
| Tax charge | — | 26 | 28 | 298 | 352 |
| | — | (100) | (39) | (1,667) | (1,806) |
| Items that do qualify for reclassification | | | | | |
| Available-for-sale financial assets | — | (693) | 516 | 822 | 645 |
| Cash flow hedges | — | 554 | 240 | 212 | 1,006 |
| Currency translation | — | 11 | (394) | (517) | (900) |
| Tax charge | — | 117 | (72) | (197) | (152) |
| | — | (11) | 290 | 320 | 599 |
| Other comprehensive loss after tax | — | (111) | 251 | (1,347) | (1,207) |
| Total comprehensive loss for the year | (684) | (892) | (1,798) | (3,723) | (7,097) |
| | | | | | |
| Total comprehensive loss is attributable to: | | | | | |
| Non-controlling interests | — | — | (15) | (114) | (129) |
| Preference shareholders | 273 | 58 | — | (58) | 273 |
| Paid-in equity holders | 15 | — | — | 13 | 28 |
| Ordinary and B shareholders | (972) | (950) | (1,783) | (3,564) | (7,269) |
| | (684) | (892) | (1,798) | (3,723) | (7,097) |
For the notes to this table see page 445.
Notes on the consolidated accounts
43 Consolidating financial information continued
Balance sheet
| | RBSG plc £m | RBS plc £m | Subsidiaries(1) £m | Consolidation Adjustments(2) £m | RBSG Group £m |
| |
| At 31 December 2014 |
| Assets | | | | | |
| Cash and balances at central banks | - | 70,952 | 4,542 | (622) | 74,872 |
| Loans and advances to banks | 24,490 | 54,901 | 160,668 | (196,324) | 43,735 |
| Loans and advances to customers | 299 | 217,777 | 260,750 | (100,588) | 378,238 |
| Debt securities | 911 | 87,594 | 39,221 | (41,077) | 86,649 |
| Equity shares | - | 4,880 | 1,954 | (1,199) | 5,635 |
| Investments in Group undertakings | 54,858 | 39,857 | 9,428 | (104,143) | - |
| Settlement balances | - | 3,381 | 2,017 | (731) | 4,667 |
| Derivatives | 179 | 359,825 | 9,841 | (16,255) | 353,590 |
| Intangible assets | - | 917 | 5,523 | 1,341 | 7,781 |
| Property, plant and equipment | - | 1,976 | 4,669 | (478) | 6,167 |
| Deferred tax | - | 733 | 1,405 | (598) | 1,540 |
| Prepayments, accrued income and other assets | 193 | 2,203 | 5,785 | (2,303) | 5,878 |
| Assets of disposals groups | - | - | 1,044 | 80,967 | 82,011 |
| Total assets | 80,930 | 844,996 | 506,847 | (382,010) | 1,050,763 |
| | | | | | |
| Liabilities | | | | | |
| Deposits by banks | 1,202 | 174,455 | 79,707 | (194,699) | 60,665 |
| Customer accounts | - | 173,516 | 316,688 | (98,565) | 391,639 |
| Debt securities in issue | 7,510 | 36,743 | 24,358 | (18,331) | 50,280 |
| Settlement balances | - | 3,098 | 2,136 | (731) | 4,503 |
| Short positions | - | 16,590 | 6,893 | (454) | 23,029 |
| Derivatives | 30 | 354,747 | 11,025 | (15,997) | 349,805 |
| Accruals, deferred income and other liabilities | 165 | 5,622 | 8,231 | (672) | 13,346 |
| Retirement benefit liabilities | - | 192 | 2,562 | (175) | 2,579 |
| Deferred tax | - | - | 1,244 | (744) | 500 |
| Subordinated liabilities | 10,708 | 27,480 | 5,876 | (21,159) | 22,905 |
| Liabilities of disposal groups | - | - | 52 | 71,268 | 71,320 |
| Total liabilities | 19,615 | 792,443 | 458,772 | (280,259) | 990,571 |
| | | | | | |
| Non-controlling interests | - | - | 451 | 2,495 | 2,946 |
| Owners’ equity | 61,315 | 52,553 | 47,624 | (104,246) | 57,246 |
| Total equity | 61,315 | 52,553 | 48,075 | (101,751) | 60,192 |
| Total liabilities and equity | 80,930 | 844,996 | 506,847 | (382,010) | 1,050,763 |
Notes:
(1) The financial statements of CFG are incorporated on a line-by-line basis.
(2) Includes adjustments to present CFG as a disposal group as at 31 December 2014 and as a discontinued operation for 2014 and prior periods.
Notes on the consolidated accounts
43 Consolidating financial information continued
Balance sheet
| | RBSG plc £m | RBS plc £m | Subsidiaries £m | Consolidation Adjustments £m | RBSG Group £m |
| |
| At 31 December 2013 |
| Assets | | | | | |
| Cash and balances at central banks | - | 75,792 | 6,867 | - | 82,659 |
| Loans and advances to banks | 24,574 | 77,768 | 193,024 | (241,295) | 54,071 |
| Loans and advances to customers | 153 | 225,374 | 269,326 | (54,131) | 440,722 |
| Debt securities | 1,517 | 92,327 | 52,316 | (32,561) | 113,599 |
| Equity shares | - | 7,301 | 2,274 | (764) | 8,811 |
| Investments in Group undertakings | 54,813 | 42,328 | 13,233 | (110,374) | - |
| Settlement balances | - | 3,492 | 2,417 | (318) | 5,591 |
| Derivatives | 164 | 292,880 | 9,638 | (14,643) | 288,039 |
| Intangible assets | - | 1,127 | 5,033 | 6,208 | 12,368 |
| Property, plant and equipment | - | 2,284 | 5,616 | 9 | 7,909 |
| Deferred tax | - | 2,298 | 1,402 | (222) | 3,478 |
| Prepayments, accrued income and other assets | 36 | 3,246 | 7,263 | (2,931) | 7,614 |
| Assets of disposals groups | 842 | - | 2,136 | 39 | 3,017 |
| Total assets | 82,099 | 826,217 | 570,545 | (450,983) | 1,027,878 |
| | | | | | |
| Liabilities | | | | | |
| Deposits by banks | 1,490 | 180,293 | 108,129 | (225,933) | 63,979 |
| Customer accounts | 740 | 193,553 | 328,090 | (51,503) | 470,880 |
| Debt securities in issue | 7,015 | 51,538 | 36,147 | (26,881) | 67,819 |
| Settlement balances | - | 2,274 | 3,328 | (289) | 5,313 |
| Short positions | - | 17,898 | 10,815 | (691) | 28,022 |
| Derivatives | 62 | 288,507 | 11,600 | (14,643) | 285,526 |
| Accruals, deferred income and other liabilities | 49 | 7,201 | 10,006 | (1,239) | 16,017 |
| Retirement benefit liabilities | - | 65 | (336) | 3,481 | 3,210 |
| Deferred tax | - | - | 1,617 | (1,110) | 507 |
| Subordinated liabilities | 12,426 | 30,566 | 6,009 | (24,989) | 24,012 |
| Liabilities of disposal groups | - | - | 3,378 | - | 3,378 |
| Total liabilities | 21,782 | 771,895 | 518,783 | (343,797) | 968,663 |
| | | | | | |
| Non-controlling interests | - | - | 1,194 | (721) | 473 |
| Owners’ equity | 60,317 | 54,322 | 50,568 | (106,465) | 58,742 |
| Total equity | 60,317 | 54,322 | 51,762 | (107,186) | 59,215 |
| Total liabilities and equity | 82,099 | 826,217 | 570,545 | (450,983) | 1,027,878 |
Notes on the consolidated accounts
43 Consolidating financial information continued
| | RBSG plc £m | RBS plc £m | Subsidiaries £m | Consolidation Adjustments £m | RBSG Group £m |
| |
| At 31 December 2012 |
| Assets | | | | | |
| Cash and balances at central banks | - | 70,374 | 8,916 | - | 79,290 |
| Loans and advances to banks | 24,066 | 109,571 | 229,459 | (299,145) | 63,951 |
| Loans and advances to customers | 1,266 | 271,549 | 283,552 | (56,232) | 500,135 |
| Debt securities | 1,522 | 122,447 | 72,097 | (38,628) | 157,438 |
| Equity shares | - | 12,766 | 3,240 | (774) | 15,232 |
| Investments in Group undertakings | 54,995 | 40,262 | 12,081 | (107,338) | - |
| Settlement balances | - | 3,090 | 2,709 | (58) | 5,741 |
| Derivatives | 511 | 449,838 | 15,828 | (24,274) | 441,903 |
| Intangible assets | - | 1,033 | 6,367 | 6,145 | 13,545 |
| Property, plant and equipment | - | 2,430 | 7,345 | 9 | 9,784 |
| Deferred tax | - | 2,878 | 763 | (198) | 3,443 |
| Prepayments, accrued income and other assets | 20 | 4,433 | 5,834 | (2,467) | 7,820 |
| Assets of disposals groups | - | - | 13,755 | 258 | 14,013 |
| Total assets | 82,380 | 1,090,671 | 661,946 | (522,702) | 1,312,295 |
| | | | | | |
| Liabilities | | | | | |
| Deposits by banks | 1,455 | 209,583 | 143,259 | (252,892) | 101,405 |
| Customer accounts | 838 | 256,334 | 354,409 | (90,302) | 521,279 |
| Debt securities in issue | 9,310 | 71,494 | 48,693 | (34,905) | 94,592 |
| Settlement balances | - | 2,878 | 3,025 | (25) | 5,878 |
| Short positions | - | 14,074 | 14,208 | (691) | 27,591 |
| Derivatives | 7 | 439,152 | 19,448 | (24,274) | 434,333 |
| Accruals, deferred income and other liabilities | 491 | 7,355 | 842 | 6,113 | 14,801 |
| Retirement benefit liabilities | - | 56 | 347 | 3,481 | 3,884 |
| Deferred tax | - | - | 2,175 | (1,034) | 1,141 |
| Subordinated liabilities | 11,305 | 31,635 | 9,363 | (25,530) | 26,773 |
| Liabilities of disposal groups | - | - | 10,167 | 3 | 10,170 |
| Total liabilities | 23,406 | 1,032,561 | 605,936 | (420,056) | 1,241,847 |
| | | | | | |
| Non-controlling interests | - | - | 928 | 842 | 1,770 |
| Owners’ equity | 58,974 | 58,110 | 55,082 | (103,488) | 68,678 |
| Total equity | 58,974 | 58,110 | 56,010 | (102,646) | 70,448 |
| Total liabilities and equity | 82,380 | 1,090,671 | 661,946 | (522,702) | 1,312,295 |
Notes on the consolidated accounts
43 Consolidating financial information continued
Cash flow statement
| | RBSG plc £m | RBS plc £m | Subsidiaries £m | Consolidation Adjustments £m | RBSG Group £m |
| |
| For the year ended 31 December 2014 |
| Net cash flows from operating activities | (3,159) | (27,651) | (17,376) | 27,799 | (20,387) |
| Net cash flows from investing activities | 1,782 | 8,437 | (5,110) | 1,500 | 6,609 |
| Net cash flows from financing activities | 1,140 | (4,585) | 2,654 | 387 | (404) |
| Effects of exchange rate changes on cash and cash equivalents | (3) | 541 | 344 | 27 | 909 |
| Net (decrease)/increase in cash and cash equivalents | (240) | (23,258) | (19,488) | 29,713 | (13,273) |
| Cash and cash equivalents at 1 January 2014 | 1,345 | 124,628 | 113,504 | (118,300) | 121,177 |
| Cash and cash equivalents at 31 December 2014 | 1,105 | 101,370 | 94,016 | (88,587) | 107,904 |
| | | | | | |
| For the year ended 31 December 2013 | | | | | |
| Net cash flows from operating activities | (2,865) | (21,590) | (6,527) | 351 | (30,361) |
| Net cash flows from investing activities | 1,206 | 20,758 | 1,143 | (1,924) | 21,183 |
| Net cash flows from financing activities | 1,993 | (1,387) | (5,834) | 2,500 | (2,728) |
| Effects of exchange rate changes on cash and cash equivalents | 14 | 604 | (323) | 217 | 512 |
| Net (decrease)/increase in cash and cash equivalents | 348 | (1,615) | (11,541) | 1,144 | (11,664) |
| Cash and cash equivalents at 1 January 2013 | 997 | 126,243 | 125,045 | (119,444) | 132,841 |
| Cash and cash equivalents at 31 December 2013 | 1,345 | 124,628 | 113,504 | (118,300) | 121,177 |
| For the year ended 31 December 2012 |
| Net cash flows from operating activities | (984) | (50,033) | (32,975) | 38,879 | (45,113) |
| Net cash flows from investing activities | (2,008) | 49,347 | (22,387) | 2,223 | 27,175 |
| Net cash flows from financing activities | 2,156 | 4,535 | (2,898) | (1,776) | 2,017 |
| Effects of exchange rate changes on cash and cash equivalents | (50) | (2,938) | (1,708) | 803 | (3,893) |
| Net (decrease)/increase in cash and cash equivalents | (886) | 911 | (59,968) | 40,129 | (19,814) |
| Cash and cash equivalents at 1 January 2012 | 1,883 | 125,332 | 185,013 | (159,573) | 152,655 |
| Cash and cash equivalents at 31 December 2012 | 997 | 126,243 | 125,045 | (119,444) | 132,841 |
Trust preferred securities
The Group has issued trust preferred securities through trusts 100% owned by the Group (through partnership interests held by RBSG Capital Corporation and RBS) which meet the definition of a finance subsidiary in Regulation S-X, Rule 3-10. The securities represent undivided beneficial interests in the assets of the trusts, which consist of partnership preferred securities representing non-cumulative perpetual preferred limited partnership interests issued by Delaware limited partnerships. The Royal Bank of Scotland Group plc has provided subordinated guarantees for the benefit of the holders of the trust preferred securities and the partnership preferred securities. Under the terms of the guarantees, the Group has fully and unconditionally guaranteed on a subordinated basis, payments on such trust preferred securities and partnership preferred securities, to the extent they are due to be paid and have not been paid by, or on behalf of the trusts and the partnerships, as the case may be. Following implementation of IFRS 10 the trusts are no longer consolidated by the Group. For those trust preferred securities that were classified as non-controlling interests, the Group’s outstanding instruments with the trusts have been classified as Other equity. For those securities that were classified as subordinated liabilities, the Group’s outstanding instruments with the trusts are classified as subordinated liabilities.
Additional information
| 450 | Financial summary |
| 460 | Exchange rates |
| 461 | Supervision |
| 461 | Description of property and equipment |
| 462 | Major shareholders |
462 465 | Material contracts ADR payment information |
| 466 | Risk factors |
| 485 | Iran sanctions and related disclosures |
Financial summary
RBS's financial statements are prepared in accordance with IFRS. Selected data under IFRS for each of the last five years are presented below.
| Summary consolidated income statement | 2014 £m | 2013 £m | 2012 £m | 2011 £m | 2010 £m |
| Net interest income | 9,258 | 9,017 | 9,356 | 10,226 | 11,637 |
Non-interest income (1,2,3) | 5,892 | 7,720 | 5,359 | 11,159 | 11,599 |
| Total income | 15,150 | 16,737 | 14,715 | 21,385 | 23,236 |
Operating expenses (4) | (13,859) | (17,466) | (15,757) | (15,167) | (15,279) |
| Profit/(loss) before insurance net claims and impairment losses | 1,291 | (729) | (1,042) | 6,218 | 7,957 |
| Insurance net claims | — | — | — | — | (85) |
Impairment releases/(losses) (5) | 1,352 | (8,120) | (5,010) | (8,078) | (8,135) |
| Operating profit/(loss) before tax | 2,643 | (8,849) | (6,052) | (1,860) | (263) |
| Tax charge | (1,909) | (186) | (156) | (914) | (700) |
| Profit/(loss) from continuing operations | 734 | (9,035) | (6,208) | (2,774) | (963) |
(Loss)/profit from discontinued operations, net of tax (6) | (3,445) | 558 | 318 | 651 | (808) |
| Loss for the year | (2,711) | (8,477) | (5,890) | (2,123) | (1,771) |
| | | | | | |
| Attributable to: | | | | | |
| Non-controlling interests | 60 | 120 | (136) | 28 | (675) |
| Preference shareholders | 330 | 349 | 273 | — | 105 |
| Paid-in equity holders | 49 | 49 | 28 | — | 29 |
| Dividend access share | 320 | — | — | — | — |
| Ordinary and B shareholders | (3,470) | (8,995) | (6,055) | (2,151) | (1,230) |
Notes:
| (1) | Includes profit on strategic disposals of £191 million (2013 - £161 million profit; 2012 - £111 million profit; 2011 - £25 million loss; 2010 - £171 million profit). |
| (2) | Includes gain on redemption of own debt of £20 million (2013 - £175 million; 2012 - £454 million; 2011 - £255 million; 2010 - £553 million). |
| (3) | Includes own credit adjustments of £146 million loss (2013 - £120 million loss; 2012 - £4,649 million loss; 2011 - £1,914 million gain; 2010 - £242 million gain). |
| (4) | Includes write down of goodwill of £130 million (2013 - £1,059 million; 2012 - £18 million; 2011 - £80 million; 2010 - £1 million). |
| (5) | Includes sovereign debt impairment of £1,099 million and related interest rate hedge adjustments of £169 million in 2011. |
| (6) | Includes £3,994 million loss provision in 2014 relating to the transfer of Citizens to disposal groups. |
| Summary consolidated balance sheet | 2014 £m | 2013 £m | 2012 £m | 2011 £m | 2010 £m |
| Loans and advances | 421,973 | 494,793 | 564,086 | 598,916 | 655,778 |
| Debt securities and equity shares | 92,284 | 122,410 | 172,670 | 224,263 | 239,678 |
| Derivatives and settlement balances | 358,257 | 293,630 | 447,644 | 537,389 | 438,682 |
| Other assets | 178,249 | 117,045 | 127,895 | 146,299 | 119,438 |
| Total assets | 1,050,763 | 1,027,878 | 1,312,295 | 1,506,867 | 1,453,576 |
| | | | | | |
| Owners' equity | 57,246 | 58,742 | 68,678 | 75,367 | 75,680 |
| Non-controlling interests | 2,946 | 473 | 1,770 | 686 | 1,171 |
| Subordinated liabilities | 22,905 | 24,012 | 26,773 | 26,319 | 27,053 |
| Deposits | 452,304 | 534,859 | 622,684 | 611,759 | 609,483 |
| Derivatives, settlement balances and short positions | 377,337 | 318,861 | 467,802 | 572,499 | 478,076 |
| Other liabilities | 138,025 | 90,931 | 124,588 | 220,237 | 262,113 |
| Total liabilities and equity | 1,050,763 | 1,027,878 | 1,312,295 | 1,506,867 | 1,453,576 |
| Other financial data | 2014 | 2013 | 2012 | 2011 | 2010 |
Basic and diluted earnings/(loss) per ordinary and equivalent B share from continuing operations - pence (1) | 0.5 | (85.0) | (58.9) | (19.8) | (7.7) |
| Share price per ordinary share at year end - £ | 3.94 | 3.38 | 3.25 | 2.02 | 3.91 |
| Market capitalisation at year end - £bn | 45.2 | 38.2 | 36.3 | 22.3 | 42.8 |
| Net asset value per ordinary and equivalent B share - £ | 5.25 | 5.24 | 6.31 | 6.90 | 7.02 |
Return on average total assets (2) | (0.3%) | (0.7%) | (0.4%) | (0.1%) | (0.1%) |
Return on average owners' equity (3) | (4.6%) | (12.6%) | (7.8%) | (2.8%) | (1.5%) |
Return on average ordinary and B shareholders' equity (4) | (6.3%) | (14.5%) | (8.9%) | (3.1%) | (0.9%) |
| Average owners' equity as a percentage of average total assets | 5.9% | 5.6% | 5.2% | 4.9% | 4.6% |
| Risk asset ratio - Tier 1 | 13.2% | 13.1% | 12.4% | 13.0% | 12.9% |
| Risk asset ratio - Total | 17.1% | 16.5% | 14.5% | 13.8% | 14.0% |
Ratio of earnings to combined fixed charges and preference share dividends (5) | | | | | |
| - including interest on deposits | 1.52 | (0.51) | 0.13 | 0.78 | 0.95 |
| - excluding interest on deposits | 2.61 | (5.12) | (3.73) | (0.86) | 0.52 |
Ratio of earnings to fixed charges only (5,6) | | | | | |
| - including interest on deposits | 1.67 | (0.55) | 0.13 | 0.78 | 0.97 |
| - excluding interest on deposits | 3.58 | (6.95) | (4.80) | (0.86) | 0.61 |
Notes:
| (1) | None of the convertible securities had a dilutive effect in the years 2010 to 2014. |
| (2) | Return on average total assets represents loss attributable to ordinary and B shareholders as a percentage of average total assets. |
| (3) | Return on average owners’ equity represents loss attributable to equity owners expressed as a percentage of average owners equity. |
| (4) | Return on average ordinary and B shareholders' equity represents loss attributable to ordinary and B shareholders expressed as a percentage of average ordinary and B shareholders' equity. |
| (5) | For this purpose, earnings consist of income before tax and non-controlling interests, plus fixed charges less the unremitted income of associated undertakings (share of profits less dividends received). Fixed charges consist of total interest expense, including or excluding interest on deposits and debt securities in issue, as appropriate, and the proportion of rental expense deemed representative of the interest factor (one third of total rental expenses). |
| (6) | The earnings for the years ended 31 December 2013, 2012, 2011 and 2010, were inadequate to cover total fixed charges and preference share dividends. The coverage deficiency for total fixed charges and preference share dividends for the years ended 31 December 2013, 2012, 2011 and 2010 was £9,247 million, £6,353 million, £1,860 million and £397 million, respectively. The coverage deficiency for fixed charges only for the years ended 31 December 2013, 2012, 2011 and 2010 was £8,849 million, £6,052 million, £1,860 million and £263 million, respectively. |
Analysis of loans and advances to customers
The following table analyses gross loans and advances to customers by remaining maturity, geographical area (location of office) and type of customer.
| | Within 1 year £m | After 1 year but within 5 years £m | After 5 years £m | 2014 Total £m | 2013 £m | 2012 £m | 2011 £m | 2010 £m |
| UK | | | | | | | | |
| Central and local government | 5,853 | 20 | 1,792 | 7,665 | 6,951 | 8,087 | 8,037 | 5,901 |
| Finance | 24,028 | 5,399 | 2,335 | 31,762 | 28,937 | 33,955 | 33,235 | 34,018 |
| Residential mortgages | 9,788 | 24,497 | 79,236 | 113,521 | 110,515 | 109,530 | 100,726 | 101,593 |
| Personal lending | 7,280 | 4,786 | 3,857 | 15,923 | 17,098 | 19,692 | 20,207 | 23,620 |
| Property | 12,212 | 15,108 | 10,227 | 37,547 | 44,252 | 53,730 | 55,751 | 65,462 |
| Construction | 2,586 | 1,163 | 349 | 4,098 | 4,691 | 6,507 | 7,173 | 9,351 |
| Manufacturing | 5,884 | 2,783 | 665 | 9,332 | 8,739 | 10,058 | 10,476 | 13,810 |
| Service industries and business activities | 21,851 | 19,319 | 9,451 | 50,621 | 52,253 | 56,435 | 59,190 | 70,006 |
| Agriculture, forestry and fishing | 1,130 | 1,103 | 978 | 3,211 | 2,887 | 2,699 | 2,736 | 2,939 |
| Finance leases and instalment credit | 4,051 | 4,572 | 2,310 | 10,933 | 10,524 | 10,532 | 11,216 | 13,374 |
| Accrued interest | 235 | 12 | 11 | 258 | 136 | 263 | 375 | 513 |
| Total UK | 94,898 | 78,762 | 111,211 | 284,871 | 286,983 | 311,488 | 309,122 | 340,587 |
| | | | | | | | | |
| Overseas | | | | | | | | |
| US | 3,726 | 5,008 | 574 | 9,308 | 60,440 | 63,496 | 72,933 | 74,598 |
| Rest of the World | 23,967 | 17,201 | 16,364 | 57,532 | 68,555 | 76,240 | 91,817 | 105,618 |
| Total Overseas | 27,693 | 22,209 | 16,938 | 66,840 | 128,995 | 139,736 | 164,750 | 180,216 |
| | | | | | | | | |
| Reverse repos | | | | | | | | |
| UK | 29,228 | — | — | 29,228 | 19,777 | 42,989 | 42,025 | 34,234 |
| US | 8,216 | — | — | 8,216 | 18,603 | 22,811 | 17,397 | 16,154 |
| Rest of World | 6,543 | — | — | 6,543 | 11,517 | 4,247 | 2,072 | 2,124 |
| Total reverse repos | 43,987 | — | — | 43,987 | 49,897 | 70,047 | 61,494 | 52,512 |
| | | | | | | | | |
| Loans and advances to customers - gross | 166,578 | 100,971 | 128,149 | 395,698 | 465,875 | 521,271 | 535,366 | 573,315 |
| Loan impairment provisions | | | | (17,460) | (25,153) | (21,136) | (19,760) | (18,055) |
| Loans and advances to customers - net | | | | 378,238 | 440,722 | 500,135 | 515,606 | 555,260 |
| | | | | | | | | |
| Fixed rate | 34,528 | 23,470 | 56,666 | 114,664 | 117,452 | 123,941 | 88,429 | 95,000 |
| Variable rate | 88,063 | 77,501 | 71,483 | 237,047 | 298,526 | 327,283 | 385,443 | 425,803 |
| Reverse repos | 43,987 | — | — | 43,987 | 49,897 | 70,047 | 61,494 | 52,512 |
| Loans and advances to customers - gross | 166,578 | 100,971 | 128,149 | 395,698 | 465,875 | 521,271 | 535,366 | 573,315 |
RBS provides credit facilities at variable rates to its corporate and retail customers. Variable rate credit extended to RBS’s corporate and commercial customers includes bullet and instalment loans, finance lease agreements and overdrafts; interest is generally charged at a margin over a benchmark rate such as LIBOR or base rate. Interest on variable rate retail loans may also be based on LIBOR or base rate; other variable rate retail lending is charged at variable interest rates set by RBS such as its mortgage standard variable rate in the UK.
Loan impairment provisions
For details of the factors considered in determining the amount of provisions, refer to the accounting policy on page 343 and ‘Critical accounting policies and key sources of estimation uncertainty’ on page 348. The following table shows the movements in loan impairment provisions.
| | 2014 £m | 2013 £m | 2012 £m | 2011 £m | 2010 £m |
| Provisions at the beginning of the year | | | | | |
| UK | 11,005 | 9,754 | 8,222 | 8,537 | 7,004 |
| Overseas | 14,211 | 11,496 | 11,661 | 9,645 | 10,279 |
| | 25,216 | 21,250 | 19,883 | 18,182 | 17,283 |
| Transfer (to)/from disposal groups | | | | | |
| UK | — | — | 764 | (773) | (25) |
| Overseas | (553) | (9) | — | — | (47) |
| | (553) | (9) | 764 | (773) | (72) |
| Currency translation and other adjustments | | | | | |
| UK | 929 | 323 | 635 | 6 | (23) |
| Overseas | (1,596) | (202) | (945) | (289) | 66 |
| | (667) | 121 | (310) | (283) | 43 |
| Disposals | | | | | |
| Overseas | (6) | (77) | (5) | 8 | (2,172) |
| | | | | | |
| Amounts written-off | | | | | |
| UK | (3,570) | (2,547) | (2,127) | (2,408) | (2,270) |
| Overseas | (1,708) | (1,799) | (2,139) | (2,119) | (3,772) |
| | (5,278) | (4,346) | (4,266) | (4,527) | (6,042) |
| Recoveries of amounts previously written-off | | | | | |
| UK | 77 | 78 | 164 | 158 | 151 |
| Overseas | 128 | 178 | 177 | 369 | 260 |
| | 205 | 256 | 341 | 527 | 411 |
(Released)/charged to income statement - continuing operations (1) | | | | | |
| UK | (110) | 3,593 | 2,351 | 2,937 | 3,916 |
| Overseas | (1,254) | 4,512 | 2,703 | 3,753 | 4,164 |
| | (1,364) | 8,105 | 5,054 | 6,690 | 8,080 |
| Charged to income statement - discontinued operations | | | | | |
| Overseas | 194 | 307 | 265 | 543 | 1,106 |
| | | | | | |
| Unwind of discount (recognised in interest income) | | | | | |
| UK | (146) | (196) | (255) | (235) | (216) |
| Overseas | (101) | (195) | (221) | (249) | (239) |
| | (247) | (391) | (476) | (484) | (455) |
| Provisions at the end of the year | | | | | |
| UK | 8,185 | 11,005 | 9,754 | 8,222 | 8,537 |
| Overseas | 9,315 | 14,211 | 11,496 | 11,661 | 9,645 |
| | 17,500 | 25,216 | 21,250 | 19,883 | 18,182 |
| Provisions at the end of the year comprise | | | | | |
| Customers | 17,460 | 25,153 | 21,136 | 19,760 | 18,055 |
| Banks | 40 | 63 | 114 | 123 | 127 |
| | 17,500 | 25,216 | 21,250 | 19,883 | 18,182 |
| | | | | | |
Gross loans and advances to customers (2) | | | | | |
| UK | 284,871 | 286,983 | 311,488 | 309,122 | 340,587 |
| Overseas | 66,840 | 128,995 | 139,736 | 164,750 | 180,216 |
| | 351,711 | 415,978 | 451,224 | 473,872 | 520,803 |
For the notes to this table refer to the following page.
| | 2014 | 2013 | 2012 | 2011 | 2010 |
Closing customer provisions as a % of gross loans and advances to customers (2) | | | | | |
| UK | 2.9% | 3.8% | 3.1% | 2.6% | 2.5% |
| Overseas | 13.9% | 11.0% | 8.2% | 7.1% | 5.3% |
| Total | 5.0% | 6.0% | 4.7% | 4.2% | 3.5% |
| | | | | | |
Customer (releases)/charge to income statement as a % of gross loans and advances to customers (2) | | | | | |
| UK | — | 1.3% | 0.8% | 1.0% | 1.1% |
| Overseas | (1.9%) | 3.5% | 1.9% | 2.3% | 2.3% |
| Total | (0.4%) | 2.0% | 1.1% | 1.4% | 1.6% |
| | | | | | |
| Average loans and advances to customers - gross | 472,545 | 509,937 | 541,588 | 578,057 | 610,131 |
| | | | | | |
| As a % of average loans and advances to customers during the year | | | | | |
| Total customer provisions charged to income statement | (0.3%) | 1.6% | 0.9% | 1.2% | 1.3% |
| Amounts written-off (net of recoveries) - customers | 1.1% | 0.8% | 0.7% | 0.7% | 0.9% |
Notes:
| (1) | Includes £10 million release relating to loans and advances to banks (2013 - £15 million release; 2012 - £23 million charge; 2011 - nil; 2010 - £13 million release). |
| (2) | Excludes reverse repos. |
Analysis of closing customer loan impairment provisions
The following table analyses customer loan impairment provisions by geographical area and type of UK customer.
| | 2014 | | 2013 | | 2012 | | 2011 | | 2010 |
| | | | | | | | | | | | | | | |
| UK | | | | | | | | | | | | | | |
| Central and local government | 1 | 2.2 | | 2 | 1.7 | | — | 1.8 | | — | 1.7 | | — | 1.1 |
| Manufacturing | 142 | 2.7 | | 140 | 2.1 | | 134 | 2.2 | | 135 | 2.2 | | 99 | 2.7 |
| Construction | 365 | 1.2 | | 515 | 1.1 | | 483 | 1.4 | | 502 | 1.5 | | 605 | 1.8 |
| Finance | 65 | 9.0 | | 73 | 7.0 | | 104 | 7.5 | | 64 | 7.0 | | 97 | 6.5 |
| Service industries and business activities | 1,510 | 14.4 | | 2,192 | 12.6 | | 1,480 | 12.5 | | 1,219 | 12.5 | | 1,091 | 13.4 |
| Agriculture, forestry and fishing | 33 | 0.9 | | 45 | 0.7 | | 34 | 0.6 | | 36 | 0.6 | | 26 | 0.6 |
| Property | 3,671 | 10.7 | | 5,190 | 10.6 | | 3,944 | 11.9 | | 2,860 | 11.8 | | 2,124 | 12.6 |
| Residential mortgages | 191 | 32.3 | | 319 | 26.6 | | 457 | 24.3 | | 397 | 21.3 | | 313 | 19.5 |
| Personal lending | 1,453 | 4.5 | | 1,718 | 4.1 | | 2,152 | 4.4 | | 1,926 | 4.3 | | 2,517 | 4.5 |
| Finance leases and instalment credit | 82 | 3.1 | | 136 | 2.5 | | 184 | 2.3 | | 367 | 2.4 | | 436 | 2.6 |
| Accrued interest | — | — | | — | — | | — | 0.1 | | — | 0.1 | | — | 0.1 |
| Total UK | 7,513 | 81.0 | | 10,330 | 69.0 | | 8,972 | 69.0 | | 7,506 | 65.4 | | 7,308 | 65.4 |
| Overseas | 8,931 | 19.0 | | 12,820 | 31.0 | | 10,204 | 31.0 | | 10,268 | 34.6 | | 8,097 | 34.6 |
| Impaired book provisions | 16,444 | 100.0 | | 23,150 | 100.0 | | 19,176 | 100.0 | | 17,774 | 100.0 | | 15,405 | 100.0 |
| Latent book provisions | 1,016 | | | 2,003 | | | 1,960 | | | 1,986 | | | 2,650 | |
| Total provisions | 17,460 | | | 25,153 | | | 21,136 | | | 19,760 | | | 18,055 | |
The following table analyses amounts written-off by geographical area and type of UK customer.
| | 2014 | 2013 | 2012 | 2011 | 2010 |
| | £m | £m | £m | £m | £m |
| UK | | | | | |
| Manufacturing | 48 | 41 | 61 | 115 | 107 |
| Construction | 175 | 159 | 158 | 228 | 110 |
| Finance | 28 | 47 | 30 | 24 | 6 |
| Service industries and business activities | 719 | 422 | 542 | 383 | 410 |
| Agriculture, forestry and fishing | 3 | 6 | 11 | 4 | 5 |
| Property | 1,917 | 950 | 490 | 493 | 396 |
| Residential mortgages | 76 | 180 | 32 | 25 | 17 |
| Personal lending | 546 | 681 | 610 | 1,007 | 1,152 |
| Finance leases and instalment credit | 58 | 61 | 193 | 129 | 67 |
| Total UK | 3,570 | 2,547 | 2,127 | 2,408 | 2,270 |
| Overseas | 1,708 | 1,799 | 2,139 | 2,119 | 3,772 |
Total write-offs (1) | 5,278 | 4,346 | 4,266 | 4,527 | 6,042 |
| (1) | Includes £8 million written-off in respect of loans and advances to banks (2013 - £40 million; 2012 - £29 million). |
The following table analyses recoveries of amounts written-off by geographical area and type of UK customer.
| | 2014 £m | 2013 £m | 2012 £m | 2011 £m | 2010 £m |
| UK | | | | | |
| Manufacturing | 2 | 1 | 1 | 4 | 2 |
| Construction | 9 | 1 | 10 | 6 | 1 |
| Finance | — | — | 1 | — | — |
| Service industries and business activities | 11 | 21 | 16 | 10 | 7 |
| Property | 29 | 5 | 33 | 8 | 4 |
| Residential mortgages | — | — | 6 | 9 | 6 |
| Personal lending | 26 | 48 | 93 | 111 | 128 |
| Finance leases and instalment credit | — | 2 | 4 | 10 | 3 |
| Total UK | 77 | 78 | 164 | 158 | 151 |
| Overseas | 128 | 178 | 177 | 369 | 260 |
| Total recoveries | 205 | 256 | 341 | 527 | 411 |
Risk elements in lending
Risk elements in lending (REIL) comprises impaired loans and accruing loans past due 90 days or more as to principal or interest.
Impaired loans are all loans (including loans subject to forbearance) for which an impairment provision has been established; for collectively assessed loans, impairment loss provisions are not allocated to individual loans and the entire portfolio is included in impaired loans.
Accruing loans past due 90 days or more comprises loans past due 90 days where no impairment loss is expected.
| | 2014 £m | 2013 £m | 2012 £m | 2011 £m | 2010 £m |
Impaired loans (1) | | | | | |
| UK | 11,562 | 17,480 | 18,412 | 15,576 | 15,738 |
| Overseas | 13,681 | 19,691 | 20,074 | 23,171 | 19,963 |
| Total | 25,243 | 37,171 | 38,486 | 38,747 | 35,701 |
| Accruing loans which are contractually overdue 90 days or more as to principal or interest | | | | | |
| UK | 1,536 | 1,962 | 2,007 | 1,698 | 2,374 |
| Overseas | 105 | 259 | 634 | 400 | 523 |
| Total | 1,641 | 2,221 | 2,641 | 2,098 | 2,897 |
| Total REIL | 26,884 | 39,392 | 41,127 | 40,845 | 38,598 |
| | | | | | |
| Closing provisions for impairment as a % of total REIL | 65% | 64% | 52% | 49% | 47% |
| REIL as a % of gross lending to customers excluding reverse repos | 7.6% | 9.5% | 9.1% | 8.6% | 7.4% |
| (1) | The write-off of impaired loans affects closing provisions for impairment as a % of total REIL (the coverage ratio). The coverage ratio reduces if the loan written-off carries a higher than average provision and increases if the loan written-off carries a lower than average provision. |
| (2) | Impaired loans at 31 December 2014 include £7,052 million (2013 - £7,687 million; 2012 - £6,009 million) of loans subject to forbearance granted during the year. |
| | 2014 £m | 2013 £m | 2012 £m | 2011 £m | 2010 £m |
| Gross income not recognised but which would have been recognised under the original terms of impaired loans | | | | | |
| UK | 404 | 571 | 665 | 636 | 579 |
| Overseas | 165 | 601 | 805 | 811 | 648 |
| | 569 | 1,172 | 1,470 | 1,447 | 1,227 |
| | | | | | |
| Interest on impaired loans included in net interest income | | | | | |
| UK | 146 | 196 | 255 | 235 | 216 |
| Overseas | 101 | 195 | 221 | 249 | 239 |
| | 247 | 391 | 476 | 484 | 455 |
Potential problem loans
Potential problem loans (PPL) are loans for which an impairment event has taken place but no impairment loss is expected. This category is used for advances which are not past due 90 days or revolving credit facilities where identification as 90 days overdue is not feasible.
| | 2014 £m | 2013 £m | 2012 £m | 2011 £m | 2010 £m |
| Potential problem loans | 1,206 | 789 | 807 | 739 | 633 |
Both REIL and PPL are reported gross and take no account of the value of any security held which could reduce the eventual loss should it occur, nor of any provision marked. Therefore impaired assets which are highly collateralised, such as mortgages, will have a low coverage ratio of provisions held against the reported impaired balance.
Forbearance
The table below shows loans granted forbearance during the year. These loans are unimpaired: either the loan was performing before and after the granting of forbearance or the loan was non-performing before but subsequently transferred to the performing book. Loans with impairment provisions subject to forbearance continue to be reported as impaired loans.
| | 2014 £m | 2013 £m | 2012 £m | 2011 £m | 2010 £m |
| Loans granted forbearance | 6,091 | 7,901 | 11,196 | 7,674 | 5,758 |
| (1) | Wholesale loans subject to forbearance include only those arrangements above thresholds set individually by the segments, ranging from nil to £3 million. |
| (2) | For 2014, wholesale loans subject to forbearance were £3,040 million (2013 - £4,305 million) (refer to page 245) and secured retail loans subject to forbearance were £3,051 million (2013 - £3,596 million) (refer to pages 257 to 269). Unsecured retail loans subject to forbearance are not included. The balance of unsecured retail loans subject to forbearance amounted to £244 million (2013 - £272 million). |
Cross border exposures
Cross border exposures are loans and advances including finance leases and instalment credit receivables and other monetary assets, such as debt securities, including non-local currency claims of overseas offices on local residents. RBS monitors the geographical breakdown of these exposures based on the country of domicile of the borrower or guarantor of ultimate risk. Cross border exposures exclude exposures to local residents in local currencies.
The table below sets out cross border exposures greater than 0.5% of RBS’s total assets. None of these countries have experienced repayment difficulties that have required restructuring of outstanding debt.
| 2014 | | | | | | |
| Germany | 15,923 | 5,111 | 2,442 | 23,476 | 2,166 | 21,310 |
| France | 7,405 | 11,660 | 4,240 | 23,305 | 2,226 | 21,079 |
| United States | 393 | 2,576 | 18,403 | 21,372 | 7,029 | 14,343 |
| Netherlands | 5,050 | 1,308 | 6,925 | 13,283 | 1,392 | 11,891 |
| Japan | 3,093 | 3,626 | 2,125 | 8,844 | 66 | 8,778 |
| Italy | 3,484 | 996 | 769 | 5,249 | 3,029 | 2,220 |
| Spain | 813 | 913 | 2,449 | 4,175 | 566 | 3,609 |
| Republic of Ireland | 180 | 1,454 | 1,816 | 3,450 | 10 | 3,440 |
| | | | | | | |
| 2013 | | | | | | |
| Germany | 12,308 | 2,931 | 4,819 | 20,058 | 4,435 | 15,623 |
| France | 4,686 | 10,234 | 4,406 | 19,326 | 2,352 | 16,974 |
| United States | 9,016 | 2,062 | 24,722 | 35,800 | 7,984 | 27,816 |
| Netherlands | 4,979 | 1,685 | 6,023 | 12,687 | 1,192 | 11,495 |
| Japan | 34 | 4,872 | 1,876 | 6,782 | 2,556 | 4,226 |
| Italy | 5,350 | 646 | 1,141 | 7,137 | 3,302 | 3,835 |
| Spain | 1,461 | 5,748 | 4,814 | 12,023 | 801 | 11,222 |
| Republic of Ireland | 170 | 2,600 | 2,773 | 5,543 | 51 | 5,492 |
| | | | | | | |
| 2012 | | | | | | |
| Germany | 14,678 | 4,289 | 6,812 | 25,779 | 1,956 | 23,823 |
| France | 6,563 | 13,285 | 6,224 | 26,072 | 2,157 | 23,915 |
| United States | 18,936 | 1,736 | 30,983 | 51,655 | 12,080 | 39,575 |
| Netherlands | 5,350 | 2,227 | 11,200 | 18,777 | 1,124 | 17,653 |
| Japan | 4,338 | 6,822 | 1,410 | 12,570 | 2,326 | 10,244 |
| Italy | 3,767 | 373 | 1,165 | 5,305 | 2,301 | 3,004 |
| Spain | 893 | 4,789 | 6,328 | 12,010 | 515 | 11,495 |
| Republic of Ireland | 217 | 3,557 | 3,071 | 6,845 | 59 | 6,786 |
Analysis of deposits - product analysis
The following table analyses deposits excluding repos by geographical area (location of office) and type of deposit.
| | 2014 £m | 2013 £m | 2012 £m |
| UK | | | |
| Deposits | | | |
| - interest-free | 98,582 | 85,268 | 73,439 |
| - interest-bearing | 243,315 | 253,980 | 290,127 |
| Total UK | 341,897 | 339,248 | 363,566 |
| Overseas | | | |
| Deposits | | | |
| - interest-free | 13,992 | 38,235 | 42,250 |
| - interest-bearing | 34,205 | 72,242 | 84,496 |
| Total overseas | 48,197 | 110,477 | 126,746 |
| Total deposits | 390,094 | 449,725 | 490,312 |
| | | | |
| Overseas | | | |
| US | 1,915 | 59,046 | 65,734 |
| Rest of the World | 46,282 | 51,431 | 61,012 |
| Total overseas | 48,197 | 110,477 | 126,746 |
| | | | |
| Repos | | | |
| UK | 42,708 | 40,018 | 62,055 |
| US | 14,626 | 38,085 | 63,744 |
| Rest of the World | 4,876 | 7,031 | 6,573 |
| Total repos | 62,210 | 85,134 | 132,372 |
Certificates of deposit and other time deposits
The following table shows certificates of deposit and other time deposits over $100,000 or equivalent by remaining maturity.
| 2014 | | | Over 6 months but within 12 months £m | | |
| UK based companies and branches | | | | | |
| Certificates of deposit | 208 | 351 | 421 | 149 | 1,129 |
| Other time deposits | 18,552 | 1,521 | 2,995 | 2,573 | 25,641 |
| | | | | | |
| Overseas based companies and branches | | | | | |
| Certificates of deposit | 1 | — | — | — | 1 |
| Other time deposits | 4,773 | 965 | 875 | 1,343 | 7,956 |
| | 23,534 | 2,837 | 4,291 | 4,065 | 34,727 |
Short-term borrowings
Short-term borrowings comprise repurchase agreements, borrowings from financial institutions, commercial paper (CP) and certificates of deposit (CD). Derivative collateral received from financial institutions is excluded from the table, as are certain long-term borrowings.
| | Repos | Financial institutions (1,2) | | | | Repos | Financial institutions (1,2) | | | | |
| At year end | | | | | | | | | | | |
- balance (£bn) | 62 | 56 | 1 | 1 | 120 | 84 | 61 | 2 | 2 | 149 | 218 |
| - weighted average interest rate | 0.4% | 0.3% | 0.4% | 0.7% | 0.3% | 0.3% | 0.6% | 0.4% | 0.6% | 0.4% | 0.5% |
| | | | | | | | | | | | |
| During the year | | | | | | | | | | | |
- maximum balance (£bn) | 129 | 72 | 2 | 2 | 205 | 172 | 155 | 3 | 3 | 333 | 322 |
- average balance (£bn) | 91 | 59 | 1 | 2 | 153 | 130 | 71 | 3 | 3 | 207 | 251 |
| - weighted average interest rate | 0.3% | 0.4% | 0.5% | 0.5% | 0.3% | 0.3% | 0.6% | 0.4% | 0.9% | 0.4% | 0.5% |
| (1) | Excludes derivative cash collateral of £39 billion at 31 December 2014 (2013 - £26 billion; 2012 - £37 billion); and 2014 average of £30 billion (2013 - £31 billion; 2012 - £38 billion). |
| (2) | Excludes Federal Home Loan Bank long-term borrowings of nil at 31 December 2014 (2013 - £2 billion; 2012 - £1 billion); and 2014 average of £1 billion (2013 and 2012 - £1 billion). |
Balances are generally based on monthly data. Average interest rates during the year are computed by dividing total interest expense by the average amount borrowed. Weighted average interest rates at year end are for a single day and as such may reflect one-day market distortions, which may not be indicative of generally prevailing rates.
Other contractual cash obligations
The table below summarises other contractual cash obligations by payment date.
| 2014 | 0-3 months £m | 3-12 months £m | 1-3 years £m | 3-5 years £m | 5-10 years £m | 10-20 years £m |
| Operating leases | 62 | 175 | 424 | 360 | 695 | 1,415 |
| Contractual obligations to purchase goods or services | 104 | 285 | 703 | 734 | 1 | — |
| | 166 | 460 | 1,127 | 1,094 | 696 | 1,415 |
| | | | | | | |
| 2013 | | | | | | |
| Operating leases | 90 | 258 | 630 | 513 | 786 | 1,358 |
| Contractual obligations to purchase goods or services | 107 | 266 | 189 | 588 | 12 | — |
| | 197 | 524 | 819 | 1,101 | 798 | 1,358 |
| | | | | | | |
| 2012 | | | | | | |
| Operating leases | 214 | 185 | 694 | 559 | 910 | 1,376 |
| Contractual obligations to purchase goods or services | 110 | 334 | 500 | 15 | — | — |
| | 324 | 519 | 1,194 | 574 | 910 | 1,376 |
Undrawn formal facilities, credit lines and other commitments to lend were £212,777 million (2013 - £213,046 million; 2012 - £215,808 million). While RBS has given commitments to provide these funds, some facilities may be subject to certain conditions being met by the counterparty. RBS does not expect all facilities to be drawn, and some may lapse before drawdown.
Exchange rates
The following tables show the Noon Buying Rate in New York for cable transfers in sterling as certified for customs purposes by the Federal Reserve Bank of New York.
| US dollars per £1 | February 2015 | January 2015 | December 2014 | November 2014 | October 2014 | September 2014 |
| Noon Buying Rate | | | | | | |
| High | 1.5499 | 1.5361 | 1.5743 | 1.5991 | 1.6216 | 1.6502 |
| Low | 1.5027 | 1.5022 | 1.5517 | 1.5638 | 1.5930 | 1.6088 |
| | | | | | | |
| | | 2014 | 2013 | 2012 | 2011 | 2010 |
| Noon Buying Rate | | | | | | |
| Period end rate | | 1.5578 | 1.6574 | 1.6262 | 1.5537 | 1.5392 |
Average rate for the year (1) | | 1.6461 | 1.5673 | 1.5924 | 1.6105 | 1.5415 |
| | | | | | | |
Consolidation rate (2) | | | | | | |
| Period end rate | | 1.5615 | 1.6542 | 1.6164 | 1.5475 | 1.5524 |
| Average rate for the year | | 1.6475 | 1.5646 | 1.5850 | 1.6039 | 1.5455 |
| (1) | The average of the Noon Buying Rates on the last US business day of each month during the year. |
| (2) | The rates used for translating US dollars into sterling in the preparation of the financial statements. |
| (3) | On 20 March 2015, the Noon Buying Rate was £1.00 = US$1.4923. |
Supervision
United Kingdom
The home supervisors for RBS are the Prudential Regulation Authority (PRA) and the Financial Conduct Authority (FCA). As with all significant banking institutions, the PRA is the consolidated supervisor of RBS. The PRA, an operationally independent subsidiary of the Bank of England, is responsible for promoting the safety and soundness of systemically important financial institutions in the UK. The FCA's overall objective is to ensure financial markets function well. This is supported by its operational objectives of: securing an appropriate degree of protection for consumers; protecting and enhancing the integrity of the UK financial system; and promoting effective competition in the interests of consumers.
As at 31 December 2014, 16 companies in RBSG, spanning a range of financial services sectors (banking, insurance and investment business), were authorised to conduct financial activities in the UK. The UK authorised banks in RBS Group include The Royal Bank of Scotland plc, National Westminster Bank Plc, Coutts & Co and Ulster Bank Limited. Wholesale activities, other than Treasury activities, are concentrated in the Corporate & Institutional Banking business, and are undertaken under the names of The Royal Bank of Scotland plc and National Westminster Bank Plc. Retail banking activities in England, Scotland and Wales are managed by the Personal & Business Banking business, and by Ulster Bank Limited in Northern Ireland. The banking service in the Republic of Ireland is provided by Ulster Bank Ireland Limited, which is supervised by the Central Bank of Ireland and the European Central Bank under the Single Supervisory Mechanism.
Investment management business is principally undertaken by companies in the Commercial & Private Banking business, including Coutts & Co, Adam & Company Investment Management Limited, and in the Corporate & Institutional Banking business, through RBS Asset Management Limited and The Royal Bank of Scotland plc.
RBS is subject to extensive regulations that impose obligations on financial institutions to maintain appropriate policies, procedures and controls to ensure compliance with the rules and regulations to which they are subject.
United States
The Royal Bank of Scotland Group plc is both a bank holding company and a financial holding company within the meaning of the US Bank Holding Company Act of 1956. As such, it is subject to the regulation and supervision of the Board of Governors of the Federal Reserve System (the “Federal Reserve”). Among other things, the Group's direct and indirect activities and investments in the United States are limited to those that are 'financial in nature' or 'incidental' or 'complementary' to a financial activity, as determined by the Federal Reserve. The Group is also required to obtain the prior approval of the Federal Reserve before acquiring directly or indirectly, the ownership or control of more than 5% of any class of the voting shares of any US bank or holding company. Under current Federal Reserve policy, the Group is required to act as a source of financial strength for its US bank subsidiaries. Among other things, this source of strength obligation could require the Group to inject capital into any of its US bank subsidiaries if any of them became undercapitalised.
Anti-money laundering, anti-terrorism and economic sanctions regulations are a major focus of the US government for financial institutions and are rigorously enforced by the US government agencies.
The Group is in the process of selling down its holding in Citizens Financial Group, but currently retains a sufficient ownership stake as to come under the regulatory arrangements described below.
RBS’s US bank and non-bank subsidiaries, and RBS's US branches are also subject to supervision and regulation by a variety of other US regulatory agencies. Citizens Bank, NA is supervised by the Office of the Comptroller of the Currency, which is charged with the regulation and supervision of nationally chartered banks. Citizens Bank, NA owns Citizens Securities, Inc., a US registered broker dealer subject to regulation and supervision by the US Securities and Exchange Commission (SEC) and the Financial Industry Regulatory Authority (FINRA) with respect to its securities activities. Citizens Bank of Pennsylvania is subject to the regulation and supervision of the US Federal Deposit Insurance Corporation (FDIC) and the Pennsylvania Department of Banking. Both banks are subject to supervision and regulation by the Consumer Financial Protection Bureau (CFPB). Citizens Financial Group, Inc. is under the supervision of the Federal Reserve Bank of Boston as a bank holding company. RBS’s Connecticut branch is supervised by the Connecticut Department of Banking and the Federal Reserve Bank of Boston.
The Group's primary US broker dealer, RBS Securities Inc. (RBSSI), formerly known as Greenwich Capital Markets, Inc., is also subject to regulation and supervision mainly by the SEC and FINRA with respect to its securities activities. The futures activities of RBSSI are subject to regulation and oversight mainly by the US Commodity Futures Trading Commission (CFTC), National Futures Association (NFA) and the Chicago Mercantile Exchange Group (CME). RBSSI is also supervised by the Federal Reserve Bank of Boston.
The Royal Bank of Scotland plc is a provisionally registered swap dealer; it too is subject to oversight by the CFTC and the NFA.
Other jurisdictions
RBS operates in over 45 countries through a network of branches, local banks and non-bank subsidiaries and these activities are subject to supervision in most cases by a local regulator or central bank.
Description of property and equipment
RBS operates from a number of locations worldwide, principally in the UK. At 31 December 2014, the Royal Bank and NatWest had 563 and 1,286 retail branches, respectively, in the UK. Ulster Bank has a footprint of 199 branches and an extensive network of business banking offices across Northern Ireland and the Republic of Ireland. Citizens Financial Group, Inc. had 1,218 retail banking offices (including in-store branches) covering Connecticut, Delaware, Massachusetts, Michigan, New Hampshire, New Jersey, New York, Ohio, Pennsylvania, Rhode Island and Vermont. A substantial majority of the UK branches are owned by the Royal Bank, NatWest and their subsidiaries or are held under leases with unexpired terms of over 50 years. RBS's principal properties include its headquarters at Gogarburn, Edinburgh, its principal offices in London at 135 and 280 Bishopsgate and the Drummond House administration centre located at South Gyle, Edinburgh.
Total capital expenditure on premises (excluding investment properties), computers and other equipment in the year ended 31 December 2014 was £433 million (2013 - £571 million; 2012 - £801 million).
Major shareholders
In December 2008, The Solicitor for the Affairs of Her Majesty's Treasury (HM Treasury) acquired 22,854 million ordinary shares of 25p each representing 57.9% of the company's issued ordinary share capital. During 2009, HM Treasury acquired a further 16,791 million ordinary shares of 25p each raising their holding to 70.3% of the company's issued ordinary share capital.
In December 2009, HM Treasury acquired 51 billion B shares in the company representing the entire issued B share capital. As a result of the ordinary share sub-division and consolidation which took place in June 2012, HM Treasury’s holding in the company’s ordinary shares became 3,964 million ordinary shares of £1 each. At 31 December 2014, HM Treasury’s holding in the company’s ordinary shares was 62.3%.
As far as the company is aware, there have been no significant changes in the percentage ownership of major shareholders of the company's ordinary shares, B shares or preference shares during the three years ended 25 February 2015. All shareholders within a class of the company's shares have the same voting rights.
As at 31 December 2014, almost all of the company's US$ denominated preference shares and American Depository Shares representing ordinary shares were held by shareholders registered in the US. All other shares were predominantly held by shareholders registered outside the US.
The company and its subsidiaries are party to various contracts in the ordinary course of business. Material contracts include the following:
B Share Acquisition and Contingent Capital Agreement
On 26 November 2009, the company and HM Treasury entered into the Acquisition and Contingent Capital Agreement pursuant to which HM Treasury subscribed for the initial B shares and the Dividend Access Share (the "Acquisitions") and agreed the terms of HM Treasury's subscription (the “Contingent Subscription”) for an additional £8 billion in aggregate in the form of further B shares (the "Contingent B shares"), which will be issued on the same terms as the initial B shares. The Acquisitions were subject to the satisfaction of various conditions, including the company having obtained the approval of its shareholders in relation to the Acquisitions.
The company and HM Treasury further agreed the terms of the £8 billion Contingent Subscription of the Contingent B shares in the Acquisition and Contingent Capital Agreement. For a period of five years from 22 December 2009 or, if earlier, until the occurrence of a termination event or until the company’s decision (with PRA (formerly FSA) consent) to terminate such Contingent Subscription (the "Contingent Period"), if the Core Tier 1 ratio of the company fell below five per cent (and if certain other conditions were met) HM Treasury committed to subscribe for the Contingent B shares in no fewer than two tranches of £6 billion and £2 billion (or such smaller amounts as the company and HM Treasury may agree). Any unused portion of the £8 billion could have been subscribed in one or more further tranches.
On December 16, 2013, the company announced that, having received approval from the PRA, it had terminated the £8 billion Contingent Subscription. RBS was able to cancel the Contingent Subscription as a result of the actions announced in the second half of 2013 to further strengthen its capital position.
On entering into the Contingent Subscription in 2009, the company recognised the present value of the annual fees payable under the agreement (£1,208 million) as a liability and debited a contingent capital reserve within equity. Following termination of the Contingent Subscription, the outstanding final annual fee of £320 million was not payable. The balance sheet liability for this fee was extinguished with a corresponding entry to equity
The company gave certain representations and warranties to HM Treasury on the date of the Acquisition and Contingent Capital Agreement, on the date the circular was posted to shareholders, on the first date on which all of the conditions precedent were satisfied, or waived, and on the date of the Acquisitions.
The company agreed to reimburse HM Treasury for its expenses incurred in connection with the Acquisitions.
The company agreed to a number of undertakings, including with respect to: (i) restrictions on the payment of dividends or other distributions on, and the redemption of, certain securities; (ii) expectations regarding the repurchase of the B shares by the company; (iii) negotiating in good faith to maintain the status of the B shares and Dividend Access Share as Core Tier 1 capital; and (iv) restrictions in relation to the company's share premium account.
HM Treasury has agreed to waive its statutory pre-emption rights arising out of the B shares and the Dividend Access Share in respect of any future issue of equity securities by the company other than B shares and has agreed to vote its B shares and the Dividend Access Share, as applicable, in favour of each special resolution to disapply its pre- emption rights under the B shares and/or the Dividend Access Share then held by HM Treasury every time they arise in respect of any such future issue. The pre-emption rights arising out of the B shares and the Dividend Access Share have also been disapplied in the Articles of Association.
HM Treasury has agreed that it shall not be entitled to exercise its option to convert B shares into ordinary shares to the extent that it holds more than 75 per cent of the ordinary shares of the company or to the extent that the exercise of such option would result in it holding more than 75 per cent of the ordinary shares of the company.
HM Treasury has agreed that it shall not be entitled to vote the B shares or the Dividend Access Share to the extent that votes cast on such B shares and the Dividend Access Share, together with any other votes which HM Treasury is entitled to cast in respect of any ordinary shares held by or on behalf of HM Treasury, would exceed 75 per cent of the total votes eligible to be cast on a resolution proposed at a general meeting of the company.
For as long as it is a substantial shareholder of the company (within the meaning of the UKLA's Listing Rules), HM Treasury has undertaken not to vote on related party transaction resolutions at general meetings and to direct that its affiliates do not so vote.
DAS Retirement Agreement
The Dividend Access Share (“DAS”) was created in 2009 (see B Share Acquisition and Contingent Capital Agreement above). On 9 April 2014, the Company entered into the DAS Retirement Agreement (“DRA”) with HMT which was approved by the Company’s shareholders on 25 June 2014. Pursuant to the terms of the DRA the company has paid HMT an initial DAS dividend of £320 million. A further £1.18 billion is payable to HMT (together with the initial dividend, the “DAS Retirement Dividend Amount”), in the form of one or more further DAS dividends, at the discretion of the directors of the company. Any unpaid portion of the DAS Retirement Dividend Amount will be subject to an increase of 5 percent. per annum, calculated on a daily accruals basis from 1 January 2016, if such portion has not been paid before 1 January 2016 and an increase of 10 per cent. per annum, calculated on a daily accruals basis from 1 January 2021, on any part of the balance that has not been paid before 1 January 2021. Once the DAS Retirement Dividend Amount (subject to any increase) has been paid, the DAS will lose its enhanced dividend rights and will become a single B share.
State Aid Commitment Deed
As a result of the State Aid granted to the company, it was required to work with HM Treasury to submit a State Aid restructuring plan to the European Commission (EC), which was then approved under the State Aid rules. The company agreed a series of measures which supplemented the measures in the company's strategic plan.
RBS entered into a State Aid Commitment Deed with HM Treasury at the time of the initial EC decision and following the European Commission’s approval of amendments to the restructuring plan in April 2014 entered into a Revised State Aid Commitment Deed with HM Treasury (together referred to as the “State Aid Commitment Deeds”).
These provide that RBS will comply or procure compliance with these measures and behavioural commitments. RBS agreed to do all acts and take all measures to ensure HM Treasury's compliance with its obligations under any EC decision approving State Aid to RBS.
The State Aid Commitment Deeds also provide that if the EC adopts a decision that the UK Government must recover any State Aid (a "Repayment Decision") and the recovery order of the Repayment Decision has not been annulled or suspended by the General Court or the European Court of Justice, then RBS must repay HM Treasury any aid ordered to be recovered under the Repayment Decision.
The State Aid Commitment Deeds also provide for RBS's undertakings in respect of State Aid to be modified in certain limited circumstances. However, HM Treasury has undertaken that it will not, without the consent of RBS, agree modifications to RBS's undertakings with respect to State Aid which are significantly more onerous to RBS than those granted in order to obtain the State Aid approval.
State Aid Costs Reimbursement Deed
Under the State Aid Costs Reimbursement Deed, RBS has agreed to reimburse HM Treasury for fees, costs and expenses associated with the State Aid and State Aid approval.
Sale of RBS England & Wales and NatWest Scotland branch based business
On 27 September 2013, RBS agreed a £600 million pre-IPO investment with a consortium of investors led by Corsair Capital and Centerbridge Partners, in relation to its RBS England & Wales and NatWest Scotland branch based business. Following completion of the operational and legal separation of the business into a standalone bank to be branded Williams & Glyn, RBS will pursue an Initial Public Offering (IPO). The pre-IPO investment took the form of a £600 million bond, which was issued by the Royal Bank on 21 October 2013, which will be exchangeable for a significant minority interest in Williams & Glyn at the time of the IPO. The bond will convert into Williams & Glyn shares at the IPO price, subject to a minimum ownership level which will be linked to the tangible book value of Williams & Glyn prior to the IPO, and in any case no more than a stake of 49%. To the extent the maximum ownership level is reached, the bond will be partially redeemed in cash such that investors will receive a total value of £600 million of cash and shares at the IPO price. At the IPO, subject to RBS’s consent, investors will have the option to acquire up to 10% additionally at the IPO price, subject to their pro forma ownership being no more than 49% in aggregate. RBS provided a £270 million secured financing package to the investor consortium in relation to the investment.
Separation and Shareholder Agreement (SSA) with Citizens Financial Group, Inc.
On 26 September 2014, the company entered into an SSA with Citizens Financial Group, Inc. (CFG) immediately prior to the completion of the IPO of CFG. The SSA governs the relationship between the parties during the divestment of the company’s shareholding in CFG. The SSA will remain in place until the date on which the company ceases to own at least 4.99% of CFG’s issued and outstanding common stock or, if earlier, the date on which the company receives written notice from the Federal Reserve Board that the company is not deemed to control CFG for the purposes of the US Bank Holding Company Act. Certain provisions of the SSA will terminate upon a reduction of the company’s ownership of CFG below specified thresholds. The SSA details, inter alia, the governance of CFG (and certain rights of the company relating to the appointment of directors, members of board committees and certain executives of CFG), corporate actions requiring the consent of the company, information rights and rights of access to CFG personnel and compliance covenants. The SSA includes mutual indemnities for breach of the SSA, losses arising from the indemnifying party’s business and, in the case of CFG, losses arising from material inaccuracies in CFG’s filings with governmental authorities and securities exchanges (excluding any liabilities arising out of information provided by the company for inclusion therein, with respect to which the company has agreed to indemnify CFG).
HMT and UKFI Relationship Deed
On 7 November 2014, in order to comply with an amendment to the UK Listing Rules, the company entered into a Relationship Deed with HM Treasury and UK Financial Investments Limited in relation to the company’s obligations under the UK Listing Rules to put in place an agreement with any controlling shareholder (as defined for these purposes in the Listing Rules). The Relationship Deed covers the three independence provisions mandated by the Listing Rules: (i) that contracts between the company and HM Treasury (or any of its subsidiaries) will be arm's length and normal commercial arrangements, (ii) that neither HM Treasury nor any of its associates will take any action that would have the effect of preventing the company from complying with its obligations under the Listing Rules; and (iii) neither HM Treasury nor any of its associates will propose or procure the proposal of a shareholder resolution which is intended or appears to be intended to circumvent the proper application of the Listing Rules.
ADR payment information
Fees paid by ADR holders
The depositary collects its fees for delivery and surrender of ADSs directly from investors depositing shares or surrendering ADSs for the purpose of withdrawal or from intermediaries acting for them. The depositary collects fees for making distributions to investors by deducting those fees from the amounts distributed or by selling a portion of distributable property to pay the fees.
The depository may collect its annual fee for depository services by deductions from cash distributions or by directly billing investors or by changing the book-entry system accounts of participants acting for them. The depository may generally refuse to provide fee-attracting services until its fees for those services are paid.
| Persons depositing or withdrawing shares must pay: | | For: |
| $5.00 (or less) per 100 ADSs (or portion of 100 ADSs) | | Issuance of ADSs, including issuances resulting from a distribution of shares or rights or other property. |
| | | |
| | | Cancellation of ADSs for the purpose of withdrawal, including if the deposit agreement terminates. |
| | | |
| $0.02 (or less) per ADS | | Any cash distribution to ADS registered holders. |
| | | |
| A fee equivalent to the fee that would be payable if securities distributed to you had been shares and the shares had been deposited for issuance of ADSs | | Distribution of securities distributed to holders of securities of deposited securities to ADS registered holders. |
| | | |
| Registration or transfer fees | | Transfer and registration of shares on our share register to or from the name of the depository or its agent when you deposit or withdraw shares. |
| | | |
| Expenses of the depository | | Cable, telex and facsimile transmissions (when expressly provided in the deposit agreement). |
| | | |
| | | Converting foreign currency to U.S. dollars. |
| | | |
| Taxes and other governmental charges the depositary or the custodian have to pay on any ADS or share underlying an ADS, for example, stock transfer taxes, stamp duty or withholding taxes | | As necessary. |
| | | |
| Any charges incurred by the depository or its agents for servicing the deposited securities | | As necessary. |
Fees payable by the depository to the issuer
Fees incurred in past annual Period
From 1 January 2014 to 31 December 2014, the company received from the depository $400,000 for continuing annual stock exchange listing fees, standard out-of-pocket maintenance costs for the ADRs (consisting of the expenses of postage and envelopes for mailing annual and interim financial reports, printing and distributing dividend cheques, electronic filling of U.S. Federal tax information, mailing required tax forms, stationary, postage, facsimile, and telephone calls), any applicable performance indicators relating to the ADR facility, underwriting fees and legal fees.
Fees to be paid in the future.
The bank of New York Mellon, as depository, has agreed to reimburse the Company for expenses they incur that are related to establishment and maintenance expenses of the ADS program. The depository has agreed to reimburse the Company for its continuing annual stock exchange listing fees, the depository has also agreed to pay the standard out-of-pocket maintenance costs for the ADRs, which consist of the expenses of postage and envelopes for mailing annual and interim reports, printing and distributing dividend cheques, electronic filing of U.S. federal tax information, mailing required tax forms, stationary, postage, facsimile, and telephone calls. It has also agreed to reimburse the Company annually for certain investor relationship programs of special investor relations promotional activities. In certain instances, the depository has agreed to provide additional payments to the Company based on any applicable performance indicators relating to the ADR facility. There are limits on the amount of expenses for which the depository will reimburse the Company, but the amount of reimbursement available to the Company is not necessarily tied to the amount of fees the depository collects from investors
Risk factors
Set out below are certain risk factors which could adversely affect the Group's future results, its financial condition and prospects and cause them to be materially different from what is expected. The factors discussed below and elsewhere in this report should not be regarded as a complete and comprehensive statement of all potential risks and uncertainties facing the Group.
The Group’s ability to achieve its capital targets will depend on the success of the Group's plans to further reduce the size of its business through the restructuring of its corporate and institutional banking business and make further divestments of certain of its portfolios and businesses including its remaining stake in Citizens Financial Group.
In response to the global economic and financial crisis that began in 2008 and the weak economic environment that followed, the Group engaged in a financial and core business restructuring focused on achieving appropriate risk-adjusted returns under these changed circumstances, reducing reliance on wholesale funding, lowering exposure to capital-intensive businesses and meeting new capital standard requirements. In November 2013, following HM Treasury’s assessment of the merits of creating an external “bad bank” to hold certain assets of the Group, the Group committed to take a series of actions to further derisk its business and strengthen its capital position. In order to strengthen its capital position and CET1 ratio, the Group decided to accelerate the divestment of Citizens Financial Group (CFG), the Group’s US banking subsidiary, by selling off 28.75% in an initial public offering in September 2014, and selling a further 28.4 per cent. of its interest in a public offering in March 2015, and fully divesting its interest in CFG by the end of 2016; and to intensify management actions to reduce risk weighted assets (including through an accelerated divestment of certain of the non-core assets transferred to RBS Capital Resolution (“RCR”)).
In the first quarter of 2015, the Group announced its intention to restructure its corporate and institutional banking (“CIB”) business to focus on UK corporate and financial institutions with a targeted presence in selected western European customer segments. The future CIB model will:
| · | focus on the Group’s leading positions in UK rates, debt capital markets and foreign exchange; |
| · | retain two trading hubs in the US and Singapore to support the main London trading operation; |
| · | exit central and eastern Europe, the Middle East and Africa, and substantially reduce its presence in Asia and in the US; and |
| · | complete the run-down of US asset-backed products. |
Following the decision to refine the CIB business model, the Group has decided to lift its capital targets and move to a CET1 ratio of around 13% during the restructuring period (higher than the targets of 11% by 31 December 2015 and above 12% by the end of 2016 previously announced).
In addition, the Group is in the process of implementing the new divisional and functional structure put into place in 2014 and, as a result of the restructuring of its CIB business, is now taking further steps to implement a number of strategic initiatives which will result in a further reduction of the Group’s balance sheet as well as the scope of its activities. Implementation by the Group of these initiatives will require significant restructuring of the Group at the same time that it will also be implementing structural changes to comply with regulatory changes, including those introduced under the UK Financial Services (Banking Reform) Act 2013 (the “Banking Reform Act 2013”), including its ring-fencing requirements (the “ring-fence”). See also ‘Implementation of the ring-fence in the UK which will begin in 2015 will result in material structural changes to the Group’s business. These changes could have a material adverse effect on the Group’. There can be no assurance that the Group will be able to successfully implement this restructuring programme together with other changes required of the Group in the time frames contemplated or at all, and, as a result, the Group may not be able to meet its capital targets.
The Group’s ability to dispose of businesses and certain portfolios, including the further disposal of its remaining stake in CFG and potential disposals associated with the restructuring of its CIB business, and the price achieved for such disposals will be dependent on prevailing economic and market conditions, which remain volatile. As a result there is no assurance that the Group will be able to sell or run-down (as applicable) the businesses it is now planning to sell or exit or asset portfolios it is seeking to sell either on favourable economic terms to the Group or at all. Material tax or other contingent liabilities could arise on the disposal or run-down of assets or businesses and there is no assurance that any conditions precedent agreed will be satisfied, or consents and approvals required will be obtained in a timely manner, or at all. The Group may be exposed to deteriorations in the businesses or portfolios being sold between the announcement of the disposal and its completion, which period may span many months. In addition, the Group may be exposed to certain risks, including risks arising out of ongoing liabilities and obligations, breaches of covenants, representations and warranties, indemnity claims, transitional services arrangements and redundancy or other transaction related costs.
The occurrence of any of the risks described above could negatively affect the Group’s ability to implement its strategic plan and achieve its capital targets and could have a material adverse effect on the Group’s business, reputation, results of operations, financial condition and cash flows. There can also be no assurance that if the Group is able to execute its new strategic plan that the new strategy will ultimately be successful or beneficial to the Group.
Implementation of the ring-fence in the UK which will begin in 2015 will result in material structural changes to the Group’s business. These changes could have a material adverse effect on the Group.
The UK Government’s White Paper on Banking Reform published in September 2012 outlined material structural reforms in the UK banking industry. The measures were drawn in large part from the recommendations of the Independent Commission on Banking (“ICB”), which in its final report published in 2012, included the implementation of a ring-fence of retail banking operations. The implementation of the ring-fencing of retail banking operations was introduced under the Banking Reform Act 2013. The Banking Reform Act 2013 provided primary enabling legislation in the short term with a view to completing the legislative framework for the ring-fence of retail banking operations by May 2015, requiring compliance as soon as practicable thereafter and setting a final deadline for full implementation by 2019. In June 2014, HM Treasury published two statutory instruments, which were passed by Parliament in July 2014, setting out the detail of the ring-fencing regime, specifying which entities will be “ring-fenced banks” and the activities and services that ring-fenced banks can, and cannot, conduct which came into force on 1 January 2015. The third and final statutory instrument on pensions regulation was passed by Parliament on 4 March 2015. In October 2014, the PRA published its first consultation paper (CP19/14) on the PRA's ring-fencing rules, focusing on legal structure, governance and continuity of services and facilities. The PRA requested that all firms expected to be affected by ring-fencing, including the Group, submit a preliminary plan of their anticipated legal and operating structures to their supervisors by 6 January 2015, which the Group has done. The PRA will carry out further consultations during 2015 with the Group and other affected UK banks and is expected publish its final rules and supervisory statements during 2016.
Although final rules and supervisory statements will not be available until later in 2015 and early 2016, based on the proposals put forward by the Group to the PRA and the FCA to implement the ring-fence, the Group has identified a number of material risks associated with such implementation in addition to the uncertainty associated with starting to plan implementation before final rules and guidance are in place. These risks will be exacerbated by the Group’s other ongoing restructuring efforts.
| · | The Group intends to establish a ring-fence bank (“RFB”) for its banking services while the non-ring-fence group (“NRFB”) will hold the Group’s remaining CIB activities, the operations of RBS international and some corporate banking activities that are not permitted activities for the RFB and will be the remaining businesses following completion of the restructuring of the Group’s CIB business. The establishment of the RFB and the NRFB will require a significant legal and organisational restructuring of the Group and the transfer of large numbers of customers between legal entities. The scale and complexity of completing this process and the operational and legal challenges that will need to be overcome will pose significant execution risks for the Group. The legal restructuring and migration of customers will have a material impact on how the Group conducts its business and the Group is unable to predict how some customers may react to any requirement to deal with both the RFB and NRFB to obtain certain products and services. Such implementation will be costly and although final implementation is not required until 2019, there is no certainty that the Group will be able to complete the legal restructuring and migration of customers to the RFB or NFRB, as applicable, such that the ring-fence exercise is completed on time or in accordance with future regulatory rules for which there is currently significant uncertainty. |
| · | As part of the establishment of the RFB, it will be necessary for the RFB to operate independently from the NRFB and an entirely new corporate governance structure will need to be put in place by the Group to ensure the RFB’s independence. These requirements have implications for how the Group sets up its board and committee corporate governance structure and the Group cannot predict how the Group will function as a public listed company with a subsidiary (the RFB) that will have an independent board and committee structure. In addition, the Group will need to revise its operations infrastructure so as to establish an appropriate level of segregation of the infrastructure of the RFB in areas such as information technology (“IT”) infrastructure, human resources and the management of treasury operations, including capital and liquidity. The Group will also need to evaluate, among other things, the tax exposure of each of the RFB and NRFB, as well as the impact of the ring-fence on intra-group funding and the credit ratings and external funding arrangements of each of these entities. As this structure has never been tested, the Group cannot provide any assurances regarding its ability to successfully implement such a structure. Although the intention is to establish corporate governance and operations in accordance with applicable rules (although not yet finalised) that are as cost efficient as possible, the effects of operating the Group, the RFB and the NRFB in this manner could have a material adverse effect on the Group’s business, financial condition and results of operations. |
| · | In order to comply with the ring-fence requirements, from 2026 it will not be possible for the RFB and the NRFB to participate in the same pension plan. As a result, it will be necessary for either the RFB or NRFB to leave the pension plan which will trigger certain legal and regulatory obligations. Although the Group will have a number of options available to it to meet its obligations resulting from the separation, it is expected that the costs of separation will be material, including possibly increasing annual cash contributions required to be made into the Group’s pension plans. See ‘The Group may be required to make further contributions to its pension schemes if the value of pension fund assets is not sufficient to cover potential obligations and to satisfy ring-fencing requirements’. |
Implementation of the ring-fence proposals in the UK will result in major changes to the Group’s corporate structure, to the delivery of its business activities conducted in the UK and other jurisdictions where the Group will operate, as well as changes to the Group’s business model. The steps required to implement the ring-fence of its retail and certain other core banking activities in the UK from other activities of the Group as well as restructuring other operations within the Group in order to comply with the new rules and regulations are extraordinarily complex and will take an extended period of time to put into place. Implementation will be costly and there can be no assurance that the ring-fence of the RFB and the NRFB will be completed on time to meet the regulatory deadline in 2019. As a result, the implementation of the ring-fence could have a material adverse effect on the Group’s reputation, results of operations, financial condition and prospects.
The Group continues to implement certain divestment and restructuring activities announced in 2013 and 2014 as part of its 2013/2014 Strategic Plan but will now enter a further period of major restructuring through the implementation of the regulatory regime relating to the ring-fence of financial institutions by 2019 and the restructuring of the Group’s CIB business. Although the goals of this long period of restructuring are to emerge as a less complex and safer bank there can be no assurance that the final results will be successful and that the Group will be a viable, competitive, customer focused and profitable bank.
In the third quarter of 2013 and in 2014, the Group revised its strategic plan by implementing its new divisional and functional structure and embarked on a major investment program to upgrade the Group’s operations and IT infrastructure (the “2013/2014 Strategic Plan”). The 2013/2014 Strategic Plan built on the core business restructuring implemented by the Group after the financial crisis which initially focused on reducing the size of the Group’s balance sheet, disposing of the “higher risk and capital intensive assets” in RCR and strengthening the Group’s capital position, including though the full divestment of the Group’s interest in CFG. The 2013/2014 Strategic Plan was intended to reduce the size of the Group’s business, mainly within the Markets division, and further strengthen its capital position in response to continuing regulatory change and simplifying the Group by replacing the previous divisional structure with three customer facing franchises focused on the UK and a smaller group of UK based customers.
The 2013/2014 Strategic Plan, the restructuring of the Group’s CIB business, the implementation of a ring-fence compliant structure and the IT and operational investment programme (as described below) hereinafter collectively referred to as the “Transformation Plan”. With the implementation of the Transformation Plan, and in particular the restructuring of the Group’s CIB business and implementation of the regulatory ring-fence regime coming into force in the UK, the Group is entering a further period of major restructuring, that will require significant resource and management attention over the next four years, with the intent to continue simplifying the Group’s business, making the bank safer by narrowing its business focus, further strengthening its capital position and improving its customer offering.
Each aspect of the implementation of the Transformation Plan carries material risks. See also ‘Implementation by the Group of the various initiatives and programmes which form part of the Group’s Transformation Plan subjects the Group to increased and material execution risk’. In addition, although the goal is to emerge as a simpler, safer, customer focused and profitable bank, the aggregate business of the Group will be materially smaller and different than the institution that entered the financial crisis as one of the largest and most diverse financial institutions in the world. On completion of the Transformation Plan in 2019 the Group will be primarily a UK and Western Europe focused bank with a much less diverse group of businesses, products and services. It will service a much smaller group of customers, including large corporate and financial institutions, with its focus and its potential for profitability and growth largely dependent on its success with its retail and SME customers in the UK.
This smaller customer base and geographic concentration also carry material business risks. As a result, in addition to the execution risks associated with completion of the Transformation Plan there can be no assurance that even if the Group executes the Transformation Plan it will prove to be a successful strategy or that the Group, on completion of the Transformation Plan, will be a viable, competitive, customer focused and profitable bank. For a further description of the risks associated with the various initiatives comprised in the Transformation Plan, See ‘The Group’s ability to achieve its capital targets will depend on the success of the Group's plans to further reduce the size of its business through the restructuring of its corporate and institutional banking business and make further divestments of certain of its portfolios and businesses including its remaining stake in Citizens Financial Group’, ‘Implementation of the ring-fence in the UK which will begin in 2015 will result in material structural changes to the Group’s business. These changes could have a material adverse effect on the Group’, ‘The Group is currently implementing a number of significant investment and rationalisation initiatives as part of the Group’s IT and operational investment programme. Should such investment and rationalisation initiatives fail to achieve the expected results, it could have a material adverse impact on the Group’s operations and its ability to retain or grow its customer business’. Failure of the Transformation Plan to result in a viable, competitive, customer focused and profitable bank would have a material adverse effect on the Group’s business, results of operations and financial condition.
The Group is currently implementing a number of significant investment and rationalisation initiatives as part of the Group’s IT and operational investment programme. Should such investment and rationalisation initiatives fail to achieve the expected results, it could have a material adverse impact on the Group’s operations and its ability to retain or grow its customer business.
The intent of the 2013/2014 Strategic Plan and of the restructuring of the Group’s CIB business is to further simplify and downsize the Group with an increased focus on service to its customers. Such initiatives are being combined and supplemented with significant investments in technology and more efficient support functions intended to contribute to delivering significant improvements in the Group’s Return on Equity and costs: income ratio in the longer term as well as improve the resilience, accessibility and product offering of the Group.
The Group started implementing an investment programme of £750 million in 2013 expected to run through 2015 to materially upgrade its IT capability in the UK, to enhance the digital services provided to its bank customers and also improve the reliability and resilience of the IT systems following a number of system failures in the past couple of years. This investment in the Group’s IT capability is intended to address the material increase in customer use of online and mobile technology for banking over the past few years as well as provide the capability to continue to grow such services in the future. Increasingly many of the products and services offered by the Group are, and will become, technology intensive and the Group’s ability to develop such services has become increasingly important to retaining and growing the Group’s customer business in the UK.
If the Group is unable to offer competitive, attractive and innovative products that are also profitable, it could lose market share, incur losses on some or all of its activities and lose opportunities for growth. In addition to upgrading its current IT infrastructure, the Group is also undertaking a major project to rationalise its legacy IT infrastructure, aiming to lower costs and improve resilience. With the implementation of the ring-fence regulatory regime there will be further need to manage the Group’s IT infrastructure to comply with the regulatory requirements of such regime.
As with any project of comparable size and complexity, there can be no assurance that the Group will be able to implement all of the initiatives forming part of its investment plan, including the IT investment programme on time or at all, and it may experience unexpected cost increases and delays. Any failure by the Group to realise the benefits of this investment programme, whether on time or at all, could have a material adverse effect on the Group’s business, results of operations and its ability to retain or grow its customer business.
Implementation by the Group of the various initiatives and programmes which form part of the Group’s Transformation Plan subjects the Group to increased and material execution risk.
The level of structural change intended to be implemented within the Group over the medium term as a result of the Transformation Plan, taken together with the overall scale of change to make the Group a smaller, more focused financial institution, will be disruptive and is likely to increase operational and people risks for the Group and to impact its revenues and business. As a result of the material restructuring plans that make up the Transformation Plan, the Group is subject to increased and material execution risk in many areas including:
| · | Implementation of the Transformation Plan is expected to result in significant costs, mainly in connection with the Group’s restructuring of its CIB business, which costs will be incremental to current plans and exclude potential losses on the sale of financial assets and transfer of financial liabilities. Due to material uncertainties and factors outside the Group’s control, the costs of implementation could be materially higher than currently contemplated. One of the objectives of the Transformation Plan is also to achieve a medium-term reduction in annual underlying costs (i.e., excluding restructuring and conduct-related charges). Due to material uncertainties and factors outside the Group’s control, this level of cost saving may not be achieved within the planned timescale or at any time. |
| · | The Transformation Plan includes assumptions on levels of customer retention and revenue generation from the new business model. Due to material uncertainties and factors outside the Group’s control, including normal levels of market fluctuation, this level of revenue may not be achieved in the timescale envisaged or at any time. |
| · | The Group will be reliant on attracting and retaining qualified employees to manage the implementation of the Transformation Plan and, in particular, the restructuring of the Group’s CIB business and to oversee the implementation of the ring-fence and operate in the new ring-fence environment. No assurance can be given that it will be able to attract and retain such employees. See also ‘The Group may be unable to attract or retain senior management (including members of the board) and other skilled personnel of the appropriate qualification and competence. The Group may also suffer if it does not maintain good employee relations’. |
| · | The significant reorganisation and restructuring resulting from the combined initiatives constituting the Transformation Plan will fundamentally change the Group’s business. Implementation will be disruptive and will increase operational risk. See ‘Operational risks are inherent in the Group’s businesses and these risks could increase as the Group implements its Transformation Plan’. |
| · | The Transformation Plan makes certain assumptions about future regulation including, but not limited to, the rules to be issued by PRA and FCA in connection with the ring-fence regime. Material differences between the rules ultimately adopted and the assumptions made in the plan proposed to implement the ring-fence could make it impossible to execute the ring-fence as currently envisaged. The Transformation Plan is also intended to improve the Group’s control environment, particularly in its remaining CIB franchise. Due to material uncertainties, factors beyond the Group’s control, and the increased operational risk described above, there can be no guarantee that such improvements will be achieved in the timescale envisaged or at any time or that it will not result in further regulatory scrutiny. |
If any of the risks outlined above were to occur, singly or in the aggregate, they could have a material adverse effect on the Group’s business, results of operations and financial condition.
The Group is subject to a number of legal, regulatory and governmental actions and investigations. Unfavourable outcomes in such actions and investigations could have a material adverse effect on the Group’s operations, operating results, investor confidence and reputation
The Group’s operations are diverse and complex, and it operates in legal and regulatory environments that expose it to potentially significant litigation, regulatory and governmental investigations and other regulatory risk. As a result, the Group has recently settled a number of legal and regulatory investigations and is, and may in the future be, involved in a number of legal and regulatory proceedings and investigations in the UK, the EU, the US and other jurisdictions.
The Group is involved in ongoing class action litigation, investigations into foreign exchange trading and rate setting activities, continuing LIBOR related litigation and investigations, securitisation and securities related litigation and civil and criminal investigations, and anti-money laundering, sanctions, mis-selling and compliance related investigations, in addition to a number of other matters. In November 2014, the Group announced that it had reached a settlement with the FCA in the United Kingdom and with the Commodity Futures Trading Commission (CFTC) in the US in relation to investigations into failings in RBS’s foreign exchange business within its Corporate and Institutional Banking division. The Group agreed to pay penalties of £217 million to the FCA and $290 million to the CFTC to resolve the investigations. The Group continues to cooperate with these and other governmental and regulatory authorities and remains in discussion with these authorities on these issues including settlement discussions regarding the criminal investigation being conducted by the anti-trust and criminal division of the US Department of Justice and certain other financial regulatory authorities. Settlements in relation to these ongoing investigations may result in additional financial, non-monetary penalties, and collateral consequences, which may be material, and may give rise to additional legal claims being asserted against the Group. The Group entered into a deferred prosecution agreement in 2013 in connection with the settlement of the charges relating to the LIBOR investigation (the “LIBOR DPA”). Findings of misconduct by the US Department of Justice relating to the Group, its subsidiaries or employees, may result in a breach of the terms of the LIBOR DPA which may lead to an extension of its terms or further prosecution.
Legal, governmental and regulatory proceedings and investigations are subject to many uncertainties, and their outcomes, including the timing and amount of fines or settlements, which may be material, are often difficult to predict, particularly in the early stages of a case or investigation. It is expected that the Group will continue to have a material exposure to legacy litigation and governmental and regulatory proceedings and investigations in the medium term. For more detail on certain of the Group’s ongoing legal, governmental and regulatory proceedings, see pages 422 to 431. Adverse regulatory, governmental or law enforcement proceedings or adverse judgements in litigation could result in restrictions or limitations on the Group’s operations or have a significant effect on the Group’s reputation, results of operations and capital position.
The Group may be required to make new or increase existing provisions in relation to legal proceedings, investigations and governmental and regulatory matters. In Q3 2014, the Group booked a provision of £400 million relating to penalties incurred in connection with the investigations and reviews relating to foreign exchange trading settled with the FCA and the CFTC and during Q4 2014 an additional provision of £320 million was taken in respect of foreign exchange trading-related investigations. The Group also booked during 2014 additional provisions of £650 million for Payment Protection Insurance (resulting in total provisions made for this matter of £3.7 billion, of which £2.9 billion had been utilised at 31 December 2014). The provision for interest rate hedging products redress and administration costs was also increased by £185 million in 2014, with total provisions relating to this matter totalling £1.4 billion, of which £1.0 billion had been utilised at 31 December 2014. Significant increases in provisions relating to ongoing investigations may have an adverse effect on the Group’s reputation as well as its financial condition and results of operations.
The Group, like many other financial institutions, has come under greater regulatory scrutiny in recent years and expects heightened levels of regulatory supervision to continue for the foreseeable future, particularly as it relates to compliance with historical, new and existing corporate governance, employee compensation, conduct of business, consumer protection regimes, anti-money laundering and antiterrorism laws and regulations, as well as the provisions of applicable sanctions programmes. Past, current or future failures to comply with any one or more of these laws or regulations could have a material adverse effect on the Group’s reputation, financial condition and results of operations.
The Group is subject to political risks
Ahead of the upcoming UK election in May 2015, there is uncertainty around how the policies of the elected government may impact the Group, including a possible referendum on the UK's membership of the EU. The implementation of these policies, including the outcome of the EU referendum, could significantly impact the environment in which the Group operates and the fiscal, monetary, legal and regulatory requirements to which it is subject, and in turn could have a material adverse effect on its business, financial condition and results of operations.
The Group may be unable to attract or retain senior management (including members of the board) and other skilled personnel of the appropriate qualification and competence. The Group may also suffer if it does not maintain good employee relations
Implementation of the Group’s strategy and its future success depends on its ability to attract, retain and remunerate highly skilled and qualified personnel, including senior management (which include directors and other key employees), in a highly competitive labour market. This cannot be guaranteed, particularly in light of heightened regulatory oversight of banks and the increasing scrutiny of, and (in some cases) restrictions placed upon, employee compensation arrangements, in particular those of banks in receipt of Government support (such as the Group). Following the implementation in the UK of provisions of CRD IV relating to compensation in the financial sector and taking into account the views of UKFI, the Group is restricted from paying variable remuneration to individuals for a particular year in an amount higher than the level of his or her fixed remuneration which may place the Group at a competitive disadvantage.
The Group’s directors as well as members of its executive committee and certain other senior managers and employees will also be subject to the new responsibility regime introduced under the Banking Reform Act 2013 which will impose greater responsibility on such individuals. The new rules include (i) a senior managers’ regime which will require such senior managers to be pre-approved either by the PRA or FCA whilst the new rules themselves also introduce a “presumption of responsibility” for those approved as such - where contraventions of a relevant regulatory requirement occur, the accountable senior manager will be presumed guilty of misconduct unless he or she shows to the satisfaction of the relevant regulator that he or she took all reasonable steps to prevent the contravention occurring (or continuing) , (ii) a certification regime which will require the Group to assess the fitness and propriety of certain of its employees (other than senior managers), who are considered to pose a risk of significant harm to the Group or its customers and (iii) a conduct rules regime (which as currently proposed would apply regulatory prescribed conduct rules to most employees of the Group with a UK nexus).
The rules implementing the new regime are still under consultation by the PRA and the FCA and there remains uncertainty as to the final scope of the new rules and any transitional arrangements. Final rules are expected to enter into force in late 2015 (and early 2016 for the new certification regime). The new regulatory regime may contribute to reduce the pool of candidates for key management and non-executive roles, including non-executive directors with the right skills, knowledge and experience, or increase the number of departures of existing employees, given concerns over the reverse burden of proof as well as the allocation of responsibilities introduced by the new rules.
In addition to the effects of such measures on the Group’s ability to retain non-executive directors, senior management and other key employees, the market for skilled personnel is increasingly competitive, thereby raising the cost of hiring, training and retaining skilled personnel.
The Group’s changing strategy, particularly as a result of the Group’s 2013/2014 Strategic Plan, including the accelerated disposal of the Group’s interest in CFG, led to the departure of many experienced and capable employees. The continuing restructuring of the Group, including as a result of the restructuring of the Group’s CIB business and the implementation of the ring-fence regulatory regime, is expected to lead to the departure of additional experienced and capable employees. The lack of continuity of senior management and the loss of important personnel coordinating certain or several aspects of the Transformation Plan could have an adverse impact on the implementation of the Group’s Transformation Plan and regulatory commitments. The failure to attract or retain a sufficient number of appropriately skilled personnel to manage the complex restructuring required to implement the Transformation Plan, and in particular the implementation of the ring-fence and the restructuring of the Group’s CIB business could prevent the Group from successfully implementing its strategy. This could have a material adverse effect on the Group’s business, financial condition and results of operations.
In addition, certain of the Group’s employees in the UK, continental Europe and other jurisdictions in which the Group operates are represented by employee representative bodies, including trade unions. Engagement with its employees and such bodies is important to the Group and a breakdown of these relationships could adversely affect the Group’s business, reputation and results.
Operational risks are inherent in the Group’s businesses and these risks could increase as the Group implements its Transformation Plan
Operational risk is the risk of loss resulting from inadequate or failed internal processes, people and systems, or from external events. The Group has complex and geographically diverse operations and operational risk and losses can result from internal and external fraud, errors by employees or third parties, failure to document transactions properly or to obtain proper authorisations, failure to comply with applicable regulatory requirements and conduct of business rules (including those arising out of anti-bribery, anti-money laundering and anti-terrorism legislation, as well as the provisions of applicable sanctions programmes), equipment failures, business continuity and data security system failures, natural disasters or the inadequacy or failure of systems and controls, including those of the Group’s suppliers or counterparties. Operational risks will be heightened as a result of the Group’s implementation of its Transformation Plan as described in more detail under ‘Implementation by the Group of the various initiatives and programmes which form part of the Group’s Transformation Plan subjects the Group to increased and material execution risk’. Although the Group has implemented risk controls and loss mitigation actions and significant resources and planning have been devoted to plans to mitigate operational risk associated with the Group’s activities as well as the implementation of the Group’s Transformation Plan, it is not possible to be certain that such actions have been or will be effective in controlling each of the operational risks faced by the Group. Ineffective management of operational risks, including the material operational risks that will arise in implementing the Transformation Plan, could have a material adverse effect on the Group’s business, financial condition and results of operations.
The Group operates in highly competitive markets that are subject to intense scrutiny by the competition authorities. Its business and results of operations may be adversely affected by increasing competitive pressures and competition rulings and other government measures.
The competitive landscape for banks and other financial institutions in the UK, the US and throughout the rest of Europe is changing rapidly. Recent regulatory and legal changes are likely to result in new market participants and changed competitive dynamics in certain key areas, such as in retail banking in the UK. The UK retail banking sector has been subjected to intense scrutiny by the UK competition authorities and by other bodies in recent years, including market reviews conducted by the Competition & Markets Authority (CMA) and its predecessor the Office of Fair Trading regarding SME banking and Personal Current Accounts (PCAs), the ICB, whose final report was published in 2012 and the Parliamentary Commission on Banking Standards whose report was published in 2013. These reviews raised significant concerns about the effectiveness of competition in the banking sector.
In 2014, the CMA published two market studies about SME banking and PCAs. On the basis of its findings and following consultation, the CMA made a market investigation reference (MIR) in relation to both SME banking and PCAs. An MIR can be made only if the CMA has reasonable grounds for suspecting that any feature, or combination of features, of a market in the UK for goods or services prevents, restricts or distorts competition. Such investigations typically last between 15-24 months and the CMA currently expects to publish provisional findings in September 2015. While it is too early to assess the potential impact on the Group of these reviews and investigations, the competitive landscape in which the Group operates may be significantly affected as a result and this impact will become more significant as the Group implements its Transformation Plan and its business is increasingly concentrated in the UK on retail activities.
The wholesale banking sector has also been the subject of recent scrutiny. In 2014, the FCA launched a review of competition in the wholesale sector (primarily relating to competition in wholesale securities and investment markets and related activities such as corporate banking) to identify areas which might merit in-depth market study and in February 2015 announced that it would be launching a market study to investigate competition in investment and corporate banking services. Adverse findings resulting from this study may result in the imposition of fines or restrictions on mergers and consolidations within the UK financial sector and the FCA may also refer the matter further to the CMA, which has extensive powers to take measures to restore effective competition.
The competitive landscape in the UK is also likely to be affected by the UK Government’s implementation of the ring-fence regime and other customer protection measures introduced by the Banking Reform Act 2013. Although final ring-fence rules will not be available until 2016, firms (including the Group) have submitted plans for their legal and operational structures to implement the new ring-fence regime to the PRA. The implementation of such plans may result in the consolidation of newly separated businesses or assets of certain financial institutions with those of other parties to realise new synergies or protect their competitive position. This consolidation, in combination with the introduction of new entrants into the markets in which the Group operates which is being actively encouraged by the UK Government is likely to increase competitive pressures on the Group.
In addition, certain competitors may have more efficient operations, including better IT systems allowing them to implement innovative technologies for delivering services to their customers, and may have access to lower cost funding and/or be able to attract deposits on more favourable terms than the Group. Furthermore, the Group’s competitors may be better able to attract and retain clients and key employees, which may negatively impact the Group’s relative performance and future prospects. In addition, recent and future disposals and restructurings by the Group in the context of its Transformation Plan as well as constraints imposed on the Group’s compensation structure and its ability to compensate its employees at the same level as its competitors may also have an impact on its ability to compete effectively.
These and other changes to competition could have a material adverse effect on the Group’s business, margins, profitability, financial condition and prospects.
The Group’s businesses and performance can be negatively affected by actual or perceived global economic and financial market conditions and other global risks although the Group will be increasingly impacted by developments in the UK as its operations become gradually more focused on the UK
On completion of the Group’s Transformation Programme its business focus will be preponderantly in the UK. However, the Group’s businesses and many of its customers are, and will be, affected by global economic conditions, perceptions of those conditions and future economic prospects. The outlook for the global economy over the near to medium-term is increasingly uncertain due to a number of factors including geopolitical risks, concerns around global growth and deflation. Risks to growth and stability stem mainly from continued imbalances in many countries in Europe and elsewhere, slowing growth in emerging markets and China and the potential consequences of continued sanctions and depressed oil prices on the Russian economy. Further instability may result from uncertainty as to how economies and counterparties will be affected, directly or indirectly, by lower oil prices and other commodity prices as well as to the impact of monetary policy measures adopted by the ECB, the US Federal Reserve and the Swiss Central Bank. There remains considerable uncertainty about when the Bank of England and the Federal Reserve will begin to raise policy interest rates. The Group’s businesses and performance are also affected by financial market conditions. Although capital and credit markets around the world have been relatively stable since 2012, financial markets, in particular equity markets, experienced higher volatility in the last quarter of 2014 which has continued into 2015. This volatility is attributable to many of the factors noted above.
In addition, the Group is exposed to risks arising out of geopolitical events, such as trade barriers, exchange controls and other measures taken by sovereign governments that can hinder economic or financial activity levels. Furthermore, unfavourable political, military or diplomatic events, armed conflict, pandemics and terrorist acts and threats, and the responses to them by governments could also adversely affect economic activity and have an adverse effect upon the Group’s business, financial condition and results of operations.
The challenging operating environment for the Group’s businesses, created by uncertain economic and market conditions is characterised by:
| · | reduced activity levels, additional write-downs and impairment charges and lower profitability, which either alone or in combination with regulatory changes or the activities of other market participants may restrict the ability of the Group to access capital, funding and liquidity; |
| · | prolonged periods of low interest rates resulting from ongoing central bank measures to foster economic growth which constrain, through margin compression and low returns on assets, the interest income earned by the Group; and |
| · | the risk of increased volatility in yields and asset valuations as central banks start or accelerate looser monetary policies or tighten or unwind historically unprecedented loose monetary policy or extraordinary measures. The resulting environment of uncertainty for the market and consumers could lead to challenging trading and market conditions. |
Developments relating to current economic conditions and the risk of a return to a volatile financial environment, including those discussed above, could have a material adverse effect on the Group’s business, financial condition, results of operations and prospects.
As the Group refocuses on its operations in the UK as a result of its Transformation Plan, and in particular the restructuring of the Group’s CIB business, it is increasingly exposed to the UK economy. Although the prospects for the UK and the US remain the strongest among the G-7 and Ireland’s economy continues to improve, actual or perceived difficult global economic conditions, failure to meet economic growth projections, particularly in the UK and the Group’s key markets, the worsening of the scope and severity of the weak economic conditions currently experienced by a number of EU member states and elsewhere, potential volatility in the UK housing market and restrictions on mortgage lending as well as increased competition, particularly in the UK, would create challenging economic and market conditions and a difficult operating environment for the Group’s businesses.
The Group is exposed to any weakening of the European economy and the renewed threat of default by certain countries in the Eurozone
With few exceptions, countries in Europe have not yet recovered from the effects of the financial crisis. Consensus forecasts of growth in 2015 and 2016 for some of the largest European economies such as France and Italy are low. In addition, the possibility of a European sovereign default has risen due to the recent election in Greece and the outcome and impact of ongoing negotiations by the new Greek government with respect to its outstanding debt is uncertain. The risk that the effect of any sovereign default spreads by contagion to other EU economies and the UK economy remains. The euro could be abandoned as a currency by one or more countries, or in an extreme scenario, the abandonment of the euro could result in the dissolution of the European Economic and Monetary Union (EEMU). While the European Central Bank announced in January 2015 a €1.1 trillion quantitative easing programme designed to improve confidence in Eurozone equities and encourage more private bank lending, there remains considerable uncertainty as to whether such measures will be successful.
The effects on the UK, European and global economies of any potential dissolution of the EEMU or exit of one or more EU member states from the EEMU and the resulting redenomination of financial instruments from the euro to a different currency, are impossible to predict fully. However, if any such events were to occur they would likely:
| · | result in significant market dislocation; |
| · | heighten counterparty risk; |
| · | result in downgrades of credit ratings for European borrowers, giving rise to increases in credit spreads and decreases in security values; |
| · | disrupt and adversely affect the economic activity of the UK and other European markets; and |
| · | adversely affect the management of market risk and in particular asset and liability management due, in part, to redenomination of financial assets and liabilities and the potential for mismatches. |
The occurrence of any of these events would have a material adverse effect on the Group’s business, financial condition, results of operations and prospects.
The Group is subject to a variety of risks as a result of implementing the State Aid restructuring plan
The Group obtained State Aid approval for the aid given to the Group by the UK Government as part of the placing and open offer undertaken by the Group in December 2008. The Group announced on 9 April 2014 that it had entered into an agreement (“DAS Retirement Agreement”) with HM Treasury for the future retirement of the Dividend Access Share (“DAS”). The EC concluded that these new arrangements did not constitute new State aid and approved changes to the Group’s restructuring plan in its State Aid Amendment Decision of 9 April 2014. RBSG also entered into a Revised State Aid Commitment Deed with HMT under which it undertook to do all acts and things necessary to ensure that HMT is able to comply with the revised State Aid commitments made by HMT to the EC, which mainly relate to the deadline for the Group’s divestment of the Williams & Glyn business and the divestment of the rest of the Group’s interest in CFG.
Implementation of the State Aid restructuring plan exposes the Group to a number of risks. The most significant risks relate to required asset disposals, a number of which are now completed. The Group completed an initial public offering of CFG’s common stock in September 2014. The divestment of Williams & Glyn continues to progress following the announcement of a pre-IPO investment by a consortium of investors in September 2013. The Group is required, pursuant to the terms of the State Aid Amendment Decision, to dispose of its remaining interest in CFG by the end of 2016 (with a possible 12 month extension) and must divest its interest in Williams & Glyn by way of an initial public offering by the end of 2016 with the disposal of the remainder of its interest by the end of 2017. Under the terms of the State Aid Amendment Decision, a divestiture trustee may be empowered to conduct these disposals, with the mandate to complete the disposal at no minimum price, if the Group fails to complete such required disposals within agreed or renegotiated time frames, which may result in the Group achieving less than the full value of its investment due to then prevailing market conditions. Furthermore, if the Group is unable to comply with the terms of the State Aid Amendment Decision, including the required divestments, it might constitute a misuse of aid which could have a material adverse impact on the Group.
The occurrence of any of the risks described above could have a material adverse effect on the Group’s business, results of operations, financial condition, capital position and competitive position.
HM Treasury (or UK Financial Investments Limited (UKFI) on its behalf) may be able to exercise a significant degree of influence over the Group and any proposed offer or sale of its interests may affect the price of securities issued by the Group
The UK Government, through HM Treasury, currently holds 62.3% of the issued ordinary share capital of the Group. On 22 December 2009, the Group issued £25.5 billion of B Shares to the UK Government. The B Shares are convertible, at the option of the holder at any time, into ordinary shares. The UK Government has agreed that it shall not exercise the rights of conversion in respect of the B Shares if and to the extent that following any such conversion it would hold more than 75% of the total issued shares in the Group. Any breach of this agreement could result in the delisting of RBSG from the Official List of the UK Listing Authority and potentially other exchanges where its securities are currently listed and traded. HM Treasury (or UKFI on its behalf) may sell all or a part of its holding of ordinary shares at any time. Any offers or sale of a substantial number of ordinary shares or securities convertible or exchangeable into ordinary shares by or on behalf of HM Treasury, or an expectation that it may undertake such an offer or sale, could negatively affect prevailing market prices for securities issued by the Group.
In addition, UKFI manages HM Treasury’s shareholder relationship with the Group and, although HM Treasury has indicated that it intends to respect the commercial decisions of the Group and that the Group will continue to have its own independent board of directors and management team determining its own strategy, should HM Treasury’s intentions change, its position as a majority shareholder (and UKFI’s position as manager of this shareholding) means that HM Treasury or UKFI might be able to exercise a significant degree of influence over, among other things, the election of directors and appointment of senior management, dividend policy, remuneration policy, or limiting the Group’s operations. The manner in which HM Treasury or UKFI exercises HM Treasury’s rights as majority shareholder could give rise to conflict between the interests of HM Treasury and the interests of other shareholders. The Board has a duty to promote the success of the Group for the benefit of its members as a whole.
The Group’s business performance could be adversely affected if its capital is not managed effectively or as a result of changes to capital adequacy requirements
Effective management of the Group’s capital is critical to its ability to operate its businesses, and to pursue its strategy of returning to standalone strength. The Group is required by regulators in the UK, the EU, the US and other jurisdictions in which it undertakes regulated activities to maintain adequate capital resources. Adequate capital also gives the Group financial flexibility in the face of continuing turbulence and uncertainty in the global economy and specifically in its core UK, US and European markets. From 2016, in accordance with the provisions of the Capital Requirements Regulation (“CRR”), a minimum level of capital adequacy will be required to meet new regulatory capital requirements allowing the Group to make certain discretionary payments relating to CET1 (dividends), variable remuneration and payments on additional tier 1 instruments.
The Basel Committee on Banking Supervision’s package of reforms to the regulatory capital framework (“Basel III”) raised the quantity and quality of capital required to be held by a financial institution with an emphasis on Common Equity Tier 1 (CET1) capital and introduces an additional requirement for both a capital conservation buffer and a countercyclical buffer to be met with CET1 capital. Global systemically important banks (GSIBs) will be subject to an additional CET1 capital requirement, depending on a bank’s systemic importance. The Group has been identified by the Financial Stability Board (FSB) as a GSIB. The FSB list of GSIBs is updated annually, based on new data and changes to methodology. The November 2014 update placed the Group in the second from bottom category of GSIBs, subjecting it to more intensive oversight and supervision and requiring the Group to have additional loss absorption capacity of 1.5% in CET1, to be phased in from the beginning of 2016.
In addition, regulatory proposals relating to domestically systemically important banks (DSIBs) continue to be progressed and could impact the level of CET1 that is required to be held by the Group. The EBA published in December 2014 a quantitative methodology as to how European regulators could quantify which firms would qualify as DSIBs. In addition the Financial Policy Committee (“FPC”) of the Bank of England intends to consult with firms in the UK on the UK framework.
Basel III has been implemented in the EU with a new Directive and Regulation (collectively known as “CRD IV”) which became effective from 1 January 2014, subject to a number of transitional provisions and clarifications. A number of the requirements introduced under CRD IV have been and continue to be further supplemented through the Regulatory and Implementing Technical Standards (“RTSs”/”ITSs”) produced by the European Banking Authority (EBA) and to be adopted by the European Commission which are not yet all finalised. The EU rules deviate from the Basel III rules in certain aspects, and provide national flexibility to apply more stringent prudential requirements than set out in the Basel framework.
Under CRD IV, the Group is required, on a consolidated basis, to hold a minimum amount of regulatory capital of 8% of risk weighted assets of which at least 4.5% must be CET1 capital and at least 6% must be tier 1 capital (together, the “Pillar 1 requirements”). In addition, national supervisory authorities may add extra capital requirements to cover risks they believe are not covered or insufficiently covered by the Pillar 1 requirements (the “Pillar 2A guidance”). The PRA requires that Pillar 2A risks should be met with at least 56% CET1 capital, no more than 44% additional tier 1 capital and at most 25% tier 2 capital. CRD IV also introduces five new capital buffers that are in addition to the Pillar 1 and Pillar 2A requirements and are to be met with CET1 capital: (i) the capital conservation buffer, (ii) the institution-specific counter-cyclical buffer, (iii) the global systemically important institutions buffer, (iv) the other systemically important institutions buffer and (v) the systemic risk buffer. Some or all of these buffers may be applicable to the Group as determined by the PRA.
The combination of the capital conservation buffer, the institution-specific counter-cyclical capital buffer and the higher of (depending on the institution), the systemic risk buffer, the global systemically important institutions buffer and the other systemically important institution buffer, in each case (as applicable to the institution) is referred to as the “combined buffer requirement”. The PRA has also introduced a firm specific Pillar 2B buffer (“Pillar 2B buffer”) which is based on various factors including firm-specific stress test results and is to be met with CET1. The PRA will assess the Pillar 2B buffer annually and UK Banks are required to meet the higher of the combined buffer requirement or Pillar 2B requirement. The PRA published a consultation in January 2015 suggesting certain changes to its Pillar 2A framework which will introduce new methodologies for determining Pillar 2A capital as well as the PRA’s approach to operating the Pillar 2A buffer.
In addition, under the provisions of the CRR, which took effect from 1 January 2014, deferred tax assets that rely on future profitability (for example, deferred tax assets related to trade losses) and do not arise from temporary differences must be deducted in full from CET1 capital. Other deferred tax assets which rely on future profitability and arise from temporary differences are subject to a threshold test and only the amount in excess of the threshold is deducted from CET1 capital. The regulatory treatment of such deferred tax assets is dependent on there being no adverse changes to regulatory requirements.
Under Article 141 (Restrictions on distribution) of the CRD IV Directive, member states of the EU must require that institutions that fail to meet the “combined buffer requirement” will be subject to restricted “discretionary payments” (which are defined broadly by CRD IV as payments relating to CET1 (dividends), variable remuneration and payments on additional tier 1 instruments). The restrictions will be scaled according to the extent of the breach of the “combined buffer requirement” and calculated as a percentage of the profits of the institution since the last distribution of profits or “discretionary payment”. Such calculation will result in a “maximum distributable amount” (or “MDA”) in each relevant period. As an example, the scaling is such that in the bottom quartile of the “combined buffer requirement”, no “discretionary distributions” will be permitted to be paid. In the event of a breach of the combined buffer requirement, the Group will be required to calculate its maximum distributable amount, and as a consequence it may be necessary for the Group to reduce discretionary payments.
In October 2014 the FPC published its recommendation on the overall leverage ratio framework for the UK banking system. The FPC recommended a minimum leverage ratio requirement of 3% (to be met 75% by CET1 and a maximum of 25% by additional tier 1 capital), a supplementary leverage buffer applied to G-SIBs equal to 35% of the corresponding risk weighted systemic risk buffer (to be met by CET1) and a countercyclical buffer equal to 35% of the risk weighted countercyclical capital buffer (also to be met by CET1). Transition timings have been aligned to those laid out in Basel III and the exposure measure will follow that laid out by the Basel Committee for Banking Supervision. The FPC explicitly ruled out a breach of the leverage ratio resulting in an automatic constraint to capital distributions via the “maximum distributable amount”, preferring to leave this linked to risk weighted assets for the purposes of simplicity.
However, if a breach of the leverage buffers (both G-SIB and countercyclical) were to occur then a recovery plan would need to be discussed with the PRA. The current Group leverage ratio is 4.2% fully met through CET1 leaving it above the minimum requirement while the countercyclical buffer is close to zero.
In addition to the capital requirements under CRD IV, the bank resolution and recovery directive (“BRRD”) introduces requirements for banks to maintain at all times a sufficient aggregate amount of own funds and “eligible liabilities” (that is, liabilities that may be bailed in using the bail-in tool), known as the minimum requirements for eligible liabilities (“MREL”). The aim is that the minimum amount should be proportionate and adapted for each category of bank on the basis of their risk or the composition of their sources of funding. The UK Government has transposed the BRRD's provisions into law with a requirement that the Bank of England implements further secondary legislation to implement MREL requirements by 2016 which will take into account the regulatory technical standards to be developed by the EBA specifying the assessment criteria that resolution authorities should use to determine the minimum requirement for own funds and eligible liabilities for individual firms. The EBA noted that the technical standards would be compatible with the proposed term sheet published by the FSB on total loss absorbing capacity (“TLAC”) requirements for GSIBs but there remains a degree of uncertainty as to the extent to which MREL and TLAC requirements may differ. As the implementation of capital and loss absorption requirements under BRRD in the UK is subject to adoption of secondary legislation and subject to PRA supervisory discretion in places, and the implementation and scope of TLAC remains subject to significant uncertainty, the Group is currently unable to predict the impact such rules would have on its overall capital and loss absorption requirements or its ability to comply with applicable capital or loss absorbency requirements or to make certain discretionary distributions.
Building on changes made to requirements in relation to the quality and aggregate quantity of capital that banks must hold, the Basel Committee and other agencies are increasingly focussed on changes that will increase, or re-calibrate, measures of risk weighted assets as the key measure of the different categories of risk in the denominator of the risk-based capital ratio. There is no current global consensus regarding the key objectives of this further evolution of the international capital framework. One extreme position advocated by some regulators would materially deemphasise the role of a risk-based capital ratio. A more broadly held opinion among regulators seeks to retain the ratio but also reform it, in particular by addressing perceived excessive complexity and variability between banks and banking systems. In particular, the Basel Committee on Banking Supervision published a consultation paper in December 2014, in which it recommended reduced reliance on external credit ratings when assessing risk weighted assets and to replace such ratings with certain risk drivers based on the particular type of exposure of each asset. While they are at different stages of maturity, a number of initiatives across risk types and business lines are in progress that will impact RWAs at their conclusion. While the quantum of impacts is uncertain owing to lack of clarity of definition of the changes and the timing of their introduction, the likelihood of an impact resulting from each initiative is high and such impacts could result in higher levels of risk weighted assets.
The Basel Committee changes and other future changes to capital adequacy and loss absorbency and liquidity requirements in the European Union, the UK, the US and in other jurisdictions in which the Group operates, including the Group’s ability to satisfy the increasingly stringent stress case scenarios imposed by regulators and the adoption of the MREL and TLAC proposals, may require the Group to issue Tier 1 capital (including CET1), Tier 2 capital and certain loss absorbing debt securities, and may result in existing Tier 1 and Tier 2 securities issued by the Group ceasing to count towards the Group’s regulatory capital. The requirement to increase the Group’s levels of CET1 and Tier 2 capital, or loss absorbing debt securities, which could be mandated by the Group’s regulators, could have a number of negative consequences for the Group and its shareholders, including impairing the Group’s ability to pay dividends on, or make other distributions in respect of, ordinary shares and diluting the ownership of existing shareholders of the Group. If the Group is unable to raise the requisite amount of Tier 1 and Tier 2 capital, or loss absorbing debt securities it may be required to reduce further the amount of its risk weighted assets or total assets and engage in the disposal of core and other non-core businesses, which may not occur on a timely basis or achieve prices which would otherwise be attractive to the Group.
On a fully loaded Basel III basis, the Group’s CET1 ratio was 11.2% at December 31, 2014. The Group’s Transformation Plan targets a fully loaded Basel III CET1 ratio of 13% over the restructuring period. The Group’s ability to achieve such targets depends on a number of factors, including the implementation of the ring-fence, the execution of the restructuring of the Group’s CIB business and the implementation of the 2013/2014 Strategic Plan, which includes plans for a further significant restructuring of the Group as well as further sales of its remaining stake in CFG in the U.S. See ‘Forward looking Statements’ and ‘The Group’s ability to achieve its capital targets will depend on the success of the Group's plans to further reduce the size of its business through the restructuring of its corporate and institutional banking business and make further divestments of certain of its portfolios and businesses including its remaining stake in Citizens Financial Group'.
Any change that limits the Group’s ability to implement its capital plan, to access funding sources or to manage effectively its balance sheet and capital resources (including, for example, reductions in profits and retained earnings as a result of write-downs or otherwise, increases in risk-weighted assets, regulatory changes, actions by regulators, delays in the disposal of certain key assets or the inability to syndicate loans as a result of market conditions, a growth in unfunded pension exposures or otherwise) could have a material adverse effect on its business, financial condition and regulatory capital position.
The Group’s borrowing costs, its access to the debt capital markets and its liquidity depend significantly on its credit ratings and, to a lesser extent, on the rating of the UK Government
The credit ratings of RBSG, The Royal Bank of Scotland plc (the “Royal Bank”) and other Group members directly affect the cost of, access to and sources of their financing and liquidity. A number of UK and other European financial institutions, including RBSG, the Royal Bank and other Group members, have been downgraded multiple times in recent years in connection with rating methodology changes, a review of systemic support assumptions incorporated into bank ratings and the likelihood, in the case of UK banks, that the UK Government is more likely in the future to make greater use of its resolution tools that allow burden sharing with debt holders.
In 2014 credit ratings of RBSG, the Royal Bank and other Group members were downgraded in connection with the Group’s creation of RCR, coupled with concerns about execution risks, litigation risk and the potential for conduct related fines. Rating agencies have continued to evaluate the rating methodologies applicable to UK and European financial institutions and any change in such rating agencies’ methodologies could materially adversely affect the credit ratings of Group companies. RBSG’s long-term and short-term credit ratings were further downgraded by two notches in 2015 by Standard & Poor’s Rating Services (“S&P”) to reflect S&P’s view that extraordinary government support would now be unlikely in the case of UK non-operating bank holding companies and is likely to become less predictable for bank operating companies in the UK under the newly enacted legislation implementing the bail-in provisions of the BRRD. On 17 March 2015 Moody’s announced multiple rating reviews following the publication of its new bank rating methodology on 16 March 2015. The new methodology affects banking entities globally and reflects, among other things, Moody’s lowered expectations about the likelihood of government support for European banks in light of the introduction of the BRRD. Moody’s provided a preliminary indication of the outcome of its review which is to be completed later in 2015. Moody’s preliminary indication contemplates that RBSG’s long-term senior unsecured and issuer credit ratings would be downgraded by two notches to Ba1 and that the credit ratings of certain of the Group’s subsidiaries may also be downgraded. If these downgrades occur, the credit ratings of RBSG and of certain of its subsidiaries would, therefore, be considered to be below-investment grade by that credit agency.
Any further reductions in the long-term or short-term credit ratings of RBSG or of certain of its subsidiaries (particularly the Royal Bank) would increase borrowing costs, require the Group to replace funding lost due to the downgrade, which may include the loss of customer deposits and, may limit the Group’s access to capital and money markets and trigger additional collateral or other requirements in derivatives contracts and other secured funding arrangements or the need to amend such arrangements. At 31 December 2014, a simultaneous one notch long-term and associated short-term downgrade in the credit ratings of RBSG and the Royal Bank by the three main ratings agencies would have required the Group to post estimated additional collateral of £4.5 billion, without taking account of mitigating action by management.
Any downgrade in the UK Government’s credit ratings could adversely affect the credit ratings of Group companies and may have the effects noted above. Credit ratings of RBSG, the Royal Bank, The Royal Bank of Scotland N.V. (“RBS N.V.”) and Ulster Bank Limited are also important to the Group when competing in certain markets, such as over-the-counter derivatives. Any further reductions in RBSG’s long-term or short-term credit ratings or those of its subsidiaries could adversely affect the Group’s access to liquidity and capital markets, limit the range of counterparties willing to enter into transactions with the Group and its subsidiaries, trigger additional collateral or other requirements, adversely affect its competitive position, and/or increase its funding costs all of which could have a material adverse impact on the Group’s earnings, cash flow and financial condition.
The Group’s ability to meet its obligations including its funding commitments depends on the Group’s ability to access sources of liquidity and funding
Liquidity risk is the risk that a bank will be unable to meet its obligations, including funding commitments, as they fall due. This risk is inherent in banking operations and can be heightened by a number of factors, including an over reliance on a particular source of wholesale funding (including, for example, short-term and overnight funding), changes in credit ratings or market-wide phenomena such as market dislocation and major disasters. Credit markets worldwide, including interbank markets, have experienced severe reductions in liquidity and term-funding during prolonged periods in recent years. Although credit markets continued to improve during 2014 and such markets remain accommodating in the early part of 2015 (in part as a result of measures taken by central banks around the world, including the ECB), and the Group’s overall liquidity position remained strong, certain European banks, in particular in the peripheral countries of Spain, Portugal, Greece, Italy and Ireland, remained reliant on central banks as one of their principal sources of liquidity. Although the measures taken by Central Banks have had a positive impact, the risk of volatility returning to the global credit markets remains.
The market view of bank credit risk has changed radically as a result of the financial crisis and banks perceived by the market to be riskier have had to issue debt at significant spreads. Any uncertainty relating to the credit risk of financial institutions may lead to reductions in levels of interbank lending and may restrict the Group’s access to traditional sources of funding or increase the costs of accessing such funding. The ability of the Group’s regulator to bail-in senior and subordinated debt under the provisions of BRRD implemented in the UK since January 2015 may also increase investors’ perception of risk and hence affect the availability and cost of funding for the Group.
Management of the Group’s liquidity and funding focuses, among other things, on maintaining a resilient funding strategy for its assets in line with the Group’s wider strategic plan. Although conditions have improved, there have been recent periods where corporate and financial institution counterparties have reduced their credit exposures to banks and other financial institutions, limiting the availability of these sources of funding. Under certain circumstances, the Group may need to seek funds from alternative sources potentially at higher costs than has previously been the case, and/or with higher collateral or may be required to consider disposals of other assets not previously identified for disposal to reduce its funding commitments. The Group has, at times, been required to rely on shorter-term and overnight funding with a consequent reduction in overall liquidity, and to increase its recourse to liquidity schemes provided by central banks. Such schemes require assets to be pledged as collateral. Changes in asset values or eligibility criteria can reduce available assets and consequently available liquidity, particularly during periods of stress when access to the schemes may be needed most.
The Group relies on customer deposits to meet a considerable portion of its funding and it has targeted maintaining a loan to deposit ratio of around 100%. The level of deposits may fluctuate due to factors outside the Group’s control, such as a loss of confidence, increasing competitive pressures for retail customer deposits or the repatriation of deposits by foreign wholesale or central bank depositors, which could result in a significant outflow of deposits within a short period of time. An inability to grow, or any material decrease in, the Group’s deposits could, particularly if accompanied by one of the other factors described above, have a material adverse impact on the Group’s ability to satisfy its liquidity needs.
The occurrence of any of the risks described above could have a material adverse impact on the Group’s financial condition and results of operations.
The Group’s businesses are subject to substantial regulation and oversight. Significant regulatory developments and increased scrutiny by the Group’s key regulators has had and is likely to continue to increase compliance risks and could have a material adverse effect on how the Group conducts its business and on its results of operations and financial condition
The Group is subject to extensive financial services laws, regulations, corporate governance requirements, administrative actions and policies in each jurisdiction in which it operates. Many of these have changed recently and are subject to further material changes. Among others, the adoption of rules relating to ring-fencing, prohibitions on proprietary trading, the entry into force of CRD IV and the BRRD and certain other measures in the UK, the EU and the US has considerably affected the regulatory landscape in which the Group operates and will operate in the future. Increasing regulatory focus in certain areas and ongoing and possible future changes in the financial services regulatory landscape (including requirements imposed by virtue of the Group’s participation in government or regulator-led initiatives), have resulted in the Group facing greater regulation and scrutiny in the UK, the US and other countries in which it operates.
Although it is difficult to predict with certainty the effect that the recent regulatory changes, developments and heightened levels of public and regulatory scrutiny will have on the Group, the enactment of legislation and regulations in the UK and the EU, the other parts of Europe in which the Group operates and the US has resulted in increased capital, funding and liquidity requirements, changes in the competitive landscape, changes in other regulatory requirements and increased operating costs and has impacted, and will continue to impact, products offerings and business models. See also ‘Implementation of the ring-fence in the UK which will begin in 2015 will result in material structural changes to the Group’s business. These changes could have a material adverse effect on the Group’. Such changes may also result in an increased number of regulatory investigations and proceedings and have increased the risks relating to the Group’s ability to comply with the applicable body of rules and regulations in the manner and within the timeframes required.
Any of these developments (including failures to comply with new rules and regulations) could have an impact on how the Group conducts its business, its authorisations and licences, the products and services it offers, its reputation, the value of its assets, and could have a material adverse effect on its business, funding costs and its results of operations and financial condition. See ‘Implementation by the Group of the various initiatives and programmes which form part of the Group’s Transformation Plan subjects the Group to increased and material execution risk’.
Areas in which, and examples of where, governmental policies, regulatory and accounting changes and increased public and regulatory scrutiny could have an adverse impact (some of which could be material) on the Group include those set out above as well as the following:
| · | requirements to separate retail banking from investment banking (ring-fencing); |
| · | restrictions on proprietary trading and similar activities within a commercial bank and/or a group which contains a commercial bank; |
| · | the implementation of additional or conflicting capital, loss absorption or liquidity requirements, including those mandated under MREL or by the Financial Stability Board’s recommendations on TLAC; |
| · | restructuring certain of the Group’s non-retail banking activities in jurisdictions outside the UK in order to satisfy local capital, liquidity and other prudential requirements; |
| · | the monetary, fiscal, interest rate and other policies of central banks and other governmental or regulatory bodies; |
| · | the design and implementation of national or supra-national mandated recovery, resolution or insolvency regimes; |
| · | additional rules and requirements adopted at the European level relating to the separation of certain trading activities from retail banking operations; |
| · | further investigations, proceedings or fines either against the Group in isolation or together with other large financial institutions with respect to market conduct wrongdoing; |
| · | the imposition of government imposed requirements and/or related fines and sanctions with respect to lending to the UK SME market and larger commercial and corporate entities and residential mortgage lending; |
| · | additional rules and regulatory initiatives and review relating to customer protection, including the FCA’s Treating Customers Fairly regime; |
| · | requirements to operate in a way that prioritises objectives other than shareholder value creation; |
| · | the imposition of restrictions on the Group’s ability to compensate its senior management and other employees and increased responsibility and liability rules applicable to senior and key employees; |
| · | regulations relating to, and enforcement of, anti-bribery, anti-money laundering, anti-terrorism or other similar sanctions regimes; |
| · | rules relating to foreign ownership, expropriation, nationalisation and confiscation of assets; |
| · | other requirements or policies affecting the Group’s profitability, such as the imposition of onerous compliance obligations, further restrictions on business growth, product offering, or pricing; |
| · | changes to financial reporting standards (including accounting standards), corporate governance requirements, corporate structures and conduct of business rules; |
| · | reviews and investigations relating to the retail banking sector in the UK, including with respect to SME banking and PCAs; |
| · | the introduction of, and changes to, taxes, levies or fees applicable to the Group’s operations (such as the imposition of a financial transaction tax or changes in tax rates or to the treatment of carry-forward tax losses that reduce the value of deferred tax assets and require increased payments of tax); and |
| · | the regulation or endorsement of credit ratings used in the EU (whether issued by agencies in EU member states or in other countries, such as the US). |
Changes in laws, rules or regulations, or in their interpretation or enforcement, or the implementation of new laws, rules or regulations, including contradictory laws, rules or regulations by key regulators in different jurisdictions, or failure by the Group to comply with such laws, rules and regulations, may have a material adverse effect on the Group’s business, financial condition and results of operations. In addition, uncertainty and lack of international regulatory coordination as enhanced supervisory standards are developed and implemented may adversely affect the Group’s ability to engage in effective business, capital and risk management planning.
The Group is subject to resolution procedures under resolution and recovery schemes which may result in various actions being taken in relation to the Group and any securities of the Group, including the write off, write-down or conversion of the Group’s securities
In the EU, the UK and the US regulators have or are in the process of implementing resolution regimes to ensure the timely and orderly resolution of financial institutions and limit the systemic risks resulting from the failure of global and complex financial groups. In the EU and the UK, the BRRD which came into force on 1 January 2015, sets out a harmonised legal framework governing the tools and powers available to national authorities to address the failure of banks and certain other financial institutions. These tools and powers include preparatory and preventive measures, early supervisory intervention powers and resolution tools. In July 2014, the PRA published a paper on the implementation of the BRRD in the UK and in December 2014 HM Treasury published final versions of the statutory instruments transposing the BRRD which came into effect in January 2015. The PRA published its final rules and requirements implementing the BRRD in January 2015. The EBA also published final draft regulatory technical standards in December 2014 on the content of resolution plans and final guidelines on measures to reduce or remove impediments to resolvability. The implementation of the BRRD in the UK may also continue to evolve over time to ensure continued consistency with the FSB recommendations on resolution regimes and resolution planning for GSIBs, in particular with respect to TLAC requirements.
As a result of its status as a GSIB and in accordance with the PRA’s resolution and recovery schemes then in place in the UK, the Group was required to meet certain resolution planning requirements by the end of 2012 and 2013. The Group’s US businesses and CFG made their required submissions to the Federal Reserve and the FDIC by their July 1, 2014 due dates. The US supervisory agencies subsequently announced that, beginning in 2015, banks would be required to submit their annual resolution plans by 31 December of each year instead of by 1 July. Similar to other major financial institutions, both the Group and its key subsidiaries remain engaged in a constructive dialogue on resolution and recovery planning with key national regulators and other authorities.
In addition to the preventive measures set out above, the UK resolution authority now has available a wide range of powers to deal with failing financial institutions. As a result of the implementation of BRRD in the UK in January 2015, the provisions of the Banking Act 2009 have been substantially amended to enable the relevant authorities to deal with and stabilise certain deposit-taking UK incorporated institutions that are failing, or are likely to fail. In addition to the existing stabilisation options available under the Banking Act 2009 being (i) the transfer of all or part of the business of the relevant entity and/or the securities of the relevant entity to a private sector purchaser, (ii) the transfer of all or part of the business of the relevant entity to a ‘bridge bank’ wholly owned by the Bank of England and (iii) temporary public ownership (nationalisation) of the relevant entity, the resolution entity will now be able to rely on an asset separation tool which will enable the Bank of England to use property transfer powers to transfer assets, rights and liabilities of a failing bank to an asset management vehicle. In addition, the new rules have transposed the BRRD requirement that the government stabilisation options may only be used once there has been a contribution to loss absorption and recapitalisation of at least 8% of the total liabilities of the institution under resolution.
Among the changes introduced by the Banking Reform Act 2013, the Banking Act 2009 was amended to insert a bail-in option as part of the powers available to the UK resolution authority. The bail-in option was introduced as an additional power available to the Bank of England to enable it to recapitalise a failed institution by allocating losses to its shareholders and unsecured creditors in a manner that seeks to respect the hierarchy of claims in liquidation. The BRRD also includes a “bail-in” tool, which gives the relevant supervisory authorities the power to write down or write off claims (including debt securities issued by the Group and its subsidiaries) of certain unsecured creditors of a failing institution and/or to convert certain debt claims to equity or to other securities of the failing institution or to alter the terms of an existing liability. The UK Government amended the provisions of the Banking Act 2009, as amended by the Banking Reform Act 2013, to ensure the consistency of these provisions with the bail-in provisions under the BRRD which came into effect on 1 January 2015, subject to certain transition provisions effective for debt instruments as of 19 February 2015 and with the exception of provisions relating to MREL and Article 55 of the BRRD which relates to liabilities within the scope of the bail-in powers but governed by the law of a third country. Such bail-in mechanism, pursuant to which losses would be imposed on shareholders and, as appropriate, creditors (including senior creditors) of the Group (through write-down or conversion into equity of liabilities including debt securities) would be used to recapitalise and restore the Group to solvency. The bail-in regime adopted under the BRRD (and implemented in the UK) also provides that shareholders and creditors should not be left worse off as a result of the exercise of the stabilisation powers than they would have been had the bank not been resolved, but instead placed into insolvency. The exercise of the bail-in option will be determined by the resolution authority which will have discretion to determine whether the Group has reached a point of non-viability. Because of this inherent uncertainty, it will be difficult to predict when, if at all, the exercise of the bail-in power may occur.
The methods for implementation of any resolution and recovery scheme remain the subject of debate, particularly with respect to banking group companies and for GSIBs with complex cross border activities. Such debate includes whether the bail-in tool may be exercised through a single point of entry at the holding company or at various levels of the corporate structure of a GSIB.
The potential impact of these resolution and recovery powers may include the total loss of value of securities issued by the Group and, in addition for debt holders, the possible conversion into equity securities, and under certain circumstances the inability of the Group to perform its obligations under its securities. The possible application of bail-in to the Group’s or certain of its subsidiaries’ debt securities and additional Tier 1 and Tier 2 capital securities may also make it more difficult to issue such securities in the capital markets and the cost of raising such funds may be higher than has historically been the case.
The Group’s operations are highly dependent on its IT systems and is increasingly exposed to cyber security threats.
The Group’s operations are dependent on the ability to process a very large number of transactions efficiently and accurately while complying with applicable laws and regulations where it does business. The proper functioning of the Group’s payment systems, financial and sanctions controls, risk management, credit analysis and reporting, accounting, customer service and other IT systems, as well as the communication networks between its branches and main data processing centres, are critical to the Group’s operations. In June 2012, computer system failures prevented NatWest, RBS and Ulster Bank customers from accessing accounts in both the UK and Ireland. Ongoing issues relating to the failure continued for several months, requiring the Group to set aside a provision for compensation to customers who suffered losses as a result of the system failure. In addition, in November 2014, the Group reached a settlement with the FCA and the PRA in relation to this incident and agreed a penalty of £42 million with the FCA and £14 million with the PRA. Ulster Bank, one of the Group’s subsidiaries, was also fined €3.5m by the Central Bank of Ireland in relation to the IT incident and IT governance failures which occurred in 2012. The vulnerabilities of the Group’s IT systems are due to the complexity of the Group’s IT infrastructure attributable in part to overlapping multiple legacy systems resulting from the Group’s acquisitions and the consequential gaps in how the IT systems operate, and insufficient-investments in IT infrastructure in the past, creating challenges in recovering from system breakdowns. Critical system failure, any prolonged loss of service availability or any material breach of data security, particularly involving confidential customer data, could cause serious damage to the Group’s ability to service its customers, could result in significant compensation costs, could breach regulations under which the Group operates and could cause long-term damage to the Group’s reputation, business and brands. The Group is also currently implementing a significant IT investment programme which involves execution risks and may not be successful. See ‘The Group is currently implementing a number of significant investment and rationalisation initiatives as part of the Group’s IT and operational investment programme. Should such investment and rationalisation initiatives fail to achieve the expected results, it could have a material adverse impact on the Group’s operations and its ability to retain or grow its customer business’.
In addition, the Group is subject to cyber-security threats which have targeted financial institutions as well as governments and other institutions and have increased in the recent years. Failure to protect the Group’s operations from cyber-attacks could result in the loss of customer data or other sensitive information. During 2013, the Group experienced a number of IT failures following a series of deliberate attacks which temporarily prevented RBS, CFG and NatWest customers from accessing their accounts or making payments. The Bank of England, the FCA and HM Treasury have identified cyber security as a systemic risk to the UK financial sector and highlighted the need for financial institutions to improve resilience to cyber-attacks and the Group expects greater regulatory engagement on cyber security in the future. Although the Group has been implementing remedial actions to improve its resilience to the increasing intensity and sophistication of cyber-attacks, the Group expects to be the target of continued attacks in the future and there can be no assurance that the Group will be able to prevent all threats.
The Group’s operations have inherent reputational risk
Reputational risk, meaning the risk of brand damage and/or financial loss due to a failure to meet stakeholders’ expectations of the Group’s conduct and performance, is inherent in the Group’s business. Stakeholders include customers, investors, rating agencies, employees, suppliers, government, politicians, regulators, special interest groups, consumer groups, media and the general public. Brand damage can be detrimental to the business of the Group in a number of ways, including its ability to build or sustain business relationships with customers, low staff morale, regulatory censure or reduced access to, or an increase in the cost of, funding. In particular, negative public opinion resulting from the actual or perceived manner in which the Group conducts its business activities, the Group’s financial performance, ongoing investigations and proceedings and the settlement of any such investigations and proceedings, the level of direct and indirect government support or actual or perceived practices in the banking and financial industry may adversely affect the Group’s ability to keep and attract customers and, in particular, corporate and retail depositors. Reputational risks may be increased as a result of the implementation of the Group’s Transformation Plan. Modern technologies, in particular online social networks and other broadcast tools which facilitate communication with large audiences in short time frames and with minimal costs, may significantly enhance and accelerate the impact of damaging information and allegations. The Group cannot ensure that it will be successful in avoiding damage to its business from reputational risk, which could result in a material adverse effect on the Group’s business, financial condition, results of operations and prospects.
The Group may suffer losses due to employee misconduct
The Group’s businesses are exposed to risk from potential non-compliance with policies, regulatory rules, employee misconduct or negligence and fraud, which could result in regulatory sanctions and serious reputational or financial harm to the Group. In recent years, a number of multinational financial institutions, including the Group, have suffered material losses due to the actions of employees, including, for example, in connection with the LIBOR and foreign exchange investigations. It is not always possible to deter employee misconduct and the precautions the Group takes to prevent and detect this activity may not always be effective.
The Group’s earnings and financial condition have been, and its future earnings and financial condition may continue to be, materially affected by depressed asset valuations resulting from poor market conditions
In previous years, severe market events resulted in the Group recording large write-downs on its credit market exposures. Any deterioration in economic and financial market conditions or weak economic growth could lead to further impairment charges and write-downs. Moreover, market volatility and illiquidity (and the assumptions, judgements and estimates in relation to such matters that may change over time and may ultimately not turn out to be accurate) make it difficult to value certain of the Group’s exposures. Valuations in future periods, reflecting, among other things, the then prevailing market conditions and changes in the credit ratings of certain of the Group’s assets, may result in significant changes in the fair values of the Group’s exposures, such as credit market exposures and the value ultimately realised by the Group may be materially different from the current or estimated fair value.
As part of the Group’s previous restructuring and capital initiatives, including the 2013/2014 Strategic Plan, it has already materially reduced the size of its balance sheet mainly through the sale and run-off of non-core assets. The assets transferred to RCR (which included assets formerly part of the Group’s Non-Core division together with additional assets identified as part of a HM Treasury review), became part of the Group’s Capital Resolution Group (“CRG”) as of 1 January 2014. In connection with the establishment of CRG, the Group indicated its aspiration to remove the vast majority, if not all of the assets comprising RCR within three years which resulted in increased impairments of £4.5 billion which were recognised in Q4 2013. The value of the assets in RCR, excluding derivatives, was £14.9 billion at December 31, 2014 following significant reductions during 2014. Although the Group to date has successfully reduced the size of the RCR portfolio, the remaining assets in RCR may be difficult to sell and could be subject to further write downs or, when sold, realised losses. The CRG also includes the Group’s stake in the Williams & Glyn business as well as its remaining stake in CFG. In addition, as part of the restructuring of the Group’s CIB business, the Group will be exiting or disposing of substantial parts of that business. The Group’s interest in these businesses may be difficult to sell due to unfavourable market conditions for such assets or businesses. See also ‘The Group’s ability to achieve its capital targets will depend on the success of the Group's plans to further reduce the size of its business through the restructuring of its corporate and institutional banking business and make further divestments of certain of its portfolios and businesses including its remaining stake in Citizens Financial Group’. Any of these factors could require the Group to recognise further significant write-downs, realise increased impairment charges or goodwill impairments, all of which may have a material adverse effect on its financial condition, results of operations and capital ratios.
The Group may be required to make further contributions to its pension schemes if the value of pension fund assets is not sufficient to cover potential obligations and to satisfy ring-fencing requirements
The Group maintains a number of defined benefit pension schemes for certain former and current employees. Pension risk is the risk that the assets of the Group’s various defined benefit pension schemes do not fully match the timing and amount of the schemes’ liabilities which are long-term in nature, and as a result of which, the Group is required or chooses to make additional contributions to the schemes. Pension scheme liabilities vary with changes to long-term interest rates, inflation, pensionable salaries and the longevity of scheme members as well as changes in applicable legislation. The funded schemes hold assets to meet projected liabilities to the scheme members. Risk arises from the schemes because the value of the asset portfolios, together with any additional future contributions to the schemes, may be less than expected and because there may be greater than expected increases in the estimated value of the schemes’ liabilities.
In these circumstances, the Group could be obliged, or may choose, to make additional contributions to the schemes. Given the economic and financial market difficulties that arose out of the financial crisis and the risk that such conditions may occur again over the near and medium term, the Group has experienced and may continue to experience increasing pension deficits or be required or elect to make further contributions to its pension schemes. Such deficits and contributions could be significant and have an adverse impact on the Group’s results of operations or financial condition. In May 2014, the triennial funding valuation of The Royal Bank of Scotland Group Pension Fund was agreed which showed that the value of the liabilities exceeded the value of assets by £5.6 billion at 31 March 2013,a ratio of 82%. To eliminate this deficit, RBSG will pay annual contributions of £650 million from 2014 to 2016 and £450 million (indexed in line with inflation) from 2017 to 2023. These contributions are in addition to regular annual contributions of approximately £270 million in respect of the ongoing accrual of benefits as well as contributions to meet the expenses of running the scheme.
The Banking Reform Act 2013 requires banks to ring-fence specific activities (principally retail and small business deposits) from certain other activities. Ring-fencing will require changes to the structure of the Group’s existing defined benefit pension schemes as ring-fenced banks may not be liable for debts to pension schemes that might arise as a result of the failure of another entity of the ring-fenced bank’s group, which could affect assessments of the Group’s schemes deficits. The Financial Services and Markets Act 2000 (Banking Reform Pensions) Regulations 2015 requires that ring-fence banks ensure that they cannot become liable for the pension schemes of the rest of their group, or anyone else after January 1, 2026. The Group is developing a strategy to meet the requirements of these regulations, which has been discussed with the PRA. The implementation of this strategy will require the agreement of pension scheme trustees. Discussions with the pension trustee will be influenced by the Group’s overall ring-fence strategy and its pension funding and investment strategies. If agreement is not reached with the pension trustee, alternative options less favourable to the Group will need to be developed to meet the requirements of the pension regulations. The costs associated with the restructuring of the Group’s existing defined benefit pension schemes could be material and could result in higher levels of additional contributions than those described above and currently agreed with the pension trustee.
The financial performance of the Group has been, and may continue to be, materially affected by counterparty credit quality and deterioration in credit quality could arise due to prevailing economic and market conditions and legal and regulatory developments
The Group has exposure to many different industries and counterparties, and risks arising from actual or perceived changes in credit quality and the recoverability of monies due from borrowers and counterparties are inherent in a wide range of the Group’s businesses. In particular, the Group has significant exposure to certain individual counterparties in weaker business sectors and geographic markets and also has concentrated country exposure in the UK, the US and across the rest of Europe (principally Germany, The Netherlands, Ireland and France) (at 31 December 2014 credit risk assets (excluding personal finance) in the UK were £180.8 billion, in North America £81.8 billion and in Western Europe (excluding the UK) £76.3 billion); and within certain business sectors, namely personal finance, financial institutions, commercial real estate, shipping and the oil and gas sector (at 31 December 2014 personal finance lending amounted to £180.8 billion, lending to financial institutions was £91.5 billion, commercial real estate lending was £43.3 billion, lending to the oil and gas sector was £10.7 billion and lending against ocean going vessels was £10.4 billion). As the Group implements its new strategy and withdraws from many geographic markets and materially scales down its activities in the United States, the Group’s relative exposure to the UK will increase significantly as its business becomes more concentrated in the UK.
The credit quality of the Group’s borrowers and counterparties is impacted by prevailing economic and market conditions and by the legal and regulatory landscape in their respective markets.
Credit quality has improved in certain of the Group’s core markets, in particular the UK and Ireland, as these economies have improved. However, a further deterioration in economic and market conditions or changes to legal or regulatory landscapes could worsen borrower and counterparty credit quality and also impact the Group’s ability to enforce contractual security rights. In addition, the Group’s credit risk is exacerbated when the collateral it holds cannot be realised or is liquidated at prices not sufficient to recover the full amount of the loan or derivative exposure that is due to the Group, which is most likely to occur during periods of illiquidity and depressed asset valuations, such as those experienced in recent years. This has been particularly the case with respect to large parts of the Group’s commercial real estate portfolio. Any such losses could have an adverse effect on the Group’s results of operations and financial condition.
Concerns about, or a default by, one financial institution could lead to significant liquidity problems and losses or defaults by other financial institutions, as the commercial and financial soundness of many financial institutions may be closely related as a result of credit, trading, clearing and other relationships. Even the perceived lack of creditworthiness of, or questions about, a counterparty may lead to market-wide liquidity problems and losses for, or defaults by, the Group. This systemic risk may adversely affect financial intermediaries, such as clearing agencies, clearing houses, banks, securities firms and exchanges with which the Group interacts on a daily basis, all of which could have a material adverse effect on the Group’s access to liquidity or could result in losses which could have a material adverse effect on the Group’s financial condition, results of operations and prospects.
In certain jurisdictions in which the Group does business, particularly Ireland, additional constraints have been imposed in recent years on the ability of certain financial institutions to complete foreclosure proceedings in a timely manner (or at all), including as a result of interventions by certain states and local and national governments. These constraints have lengthened the time to complete foreclosures, increased the backlog of repossessed properties and, in certain cases, have resulted in the invalidation of purported foreclosures.
The EU, the ECB, the International Monetary Fund and various national authorities have proposed and implemented certain measures intended to address systemic financial stresses in the Eurozone, including the creation of a European Banking Union which, through a Single Resolution Mechanism (SRM) will apply the substantive rules of bank recovery and resolution set out in the BRRD. Current expectations are that the SRM will apply from 1 January 2016, subject to certain provisions which came into effect from 1 January 2015 relating to the cooperation between national resolution authorities and the financial stability board. The effectiveness of these and other actions proposed and implemented at both the EU and national level to address systemic stresses in the Eurozone is not assured.
The trends and risks affecting borrower and counterparty credit quality have caused, and in the future may cause, the Group to experience further and accelerated impairment charges, increased repurchase demands, higher costs, additional write-downs and losses for the Group and an inability to engage in routine funding transactions.
Changes in interest rates, foreign exchange rates, credit spreads, bond, equity and commodity prices, basis, volatility and correlation risks and other market factors have significantly affected and will continue to affect the Group’s business and results of operations
Some of the most significant market risks the Group faces are interest rate, foreign exchange, credit spread, bond, equity and commodity prices and basis, volatility and correlation risks. Changes in interest rate levels (or extended periods of low interest rates such as experienced over the past several years), yield curves (which remain depressed) and spreads may affect the interest rate margin realised between lending and borrowing costs, the effect of which may be heightened during periods of liquidity stress. Changes in currency rates, particularly in the sterling-US dollar and sterling-euro exchange rates, affect the value of assets, liabilities, income and expenses denominated in foreign currencies and the reported earnings of the Group’s non-UK subsidiaries and may affect the Group’s reported consolidated financial condition or its income from foreign exchange dealing. Such changes may result from the decisions of Central Banks in Europe and of the Federal Reserve in the US and lead to sharp and sudden variations in foreign exchange rates. For accounting purposes, the Group carries some of its issued debt, such as debt securities, at the current market price on its balance sheet. Factors affecting the current market price for such debt, such as the credit spreads of the Group, may result in a change to the fair value of such debt, which is recognised in the income statement as a profit or loss.
The performance and volatility of financial markets affects bond and equity prices, has caused, and may in the future cause, changes in the value of the Group’s investment and trading portfolios. Financial markets experienced significant volatility towards the end of 2014 and this trend has continued in early 2015, resulting in further short term changes in the valuation of certain of the Group’s assets. In addition, during the last quarter of 2014, oil prices fell significantly against their historical levels and other commodity prices also decreased. The Group is exposed to oil prices though its exposure to counterparties in the energy sector and oil producing countries. Further or sustained decreases in oil prices could negatively impact counterparties and the value of the Group’s trading portfolios. As part of its on-going derivatives operations, the Group also faces significant basis, volatility and correlation risks, the occurrence of which are also impacted by the factors noted above.
While the Group has implemented risk management methods to mitigate and control these and other market risks to which it is exposed, it is difficult to predict with accuracy changes in economic or market conditions and to anticipate the effects that such changes could have on the Group’s financial performance and business operations.
The value or effectiveness of any credit protection that the Group has purchased depends on the value of the underlying assets and the financial condition of the insurers and counterparties
The Group has credit exposure arising from over-the-counter derivative contracts, mainly credit default swaps (CDSs), and other credit derivatives, each of which are carried at fair value. The fair value of these CDSs, as well as the Group’s exposure to the risk of default by the underlying counterparties, depends on the valuation and the perceived credit risk of the instrument against which protection has been bought. Many market counterparties have been adversely affected by their exposure to residential mortgage linked and corporate credit products, whether synthetic or otherwise, and their actual and perceived creditworthiness may deteriorate rapidly. If the financial condition of these counterparties or their actual or perceived creditworthiness deteriorates, the Group may record further credit valuation adjustments on the credit protection bought from these counterparties under the CDSs. The Group also recognises any fluctuations in the fair value of other credit derivatives. Any such adjustments or fair value changes may have a material adverse impact on the Group’s financial condition and results of operations.
In the UK and in other jurisdictions, the Group is responsible for contributing to compensation schemes in respect of banks and other authorised financial services firms that are unable to meet their obligations to customers
In the UK, the Financial Services Compensation Scheme (FSCS) was established under the FSMA and is the UK’s statutory fund of last resort for customers of authorised financial services firms. The FSCS can pay compensation to customers if a firm is unable, or likely to be unable, to pay claims against it and may be required to make payments either in connection with the exercise of a stabilisation power or in exercise of the bank insolvency procedures under the Banking Act 2009.
The FSCS is funded by levies on firms authorised by the FCA, including the Group. In the event that the FSCS raises funds from the authorised firms, raises those funds more frequently or significantly increases the levies to be paid by such firms, the associated costs to the Group may have an adverse impact on its results of operations and financial condition.
In addition, the BRRD requires Member States to establish financing arrangements for the purpose of ensuring the effective application by national resolution authorities of the resolution tools and powers, which will require national resolution funds to raise “ex ante” contributions on banks and investment firms in proportion to their liabilities and risk profiles as well as “ex post” funding contributions. Following the adoption of the European delegated regulation on “ex-ante” contributions, the UK government confirmed that it would implement the “ex post” funding requirements through the UK bank levy of the Finance Act 2011.
To the extent that other jurisdictions where the Group operates have introduced or plan to introduce similar compensation, contributory or reimbursement schemes (such as in the US with the Federal Deposit Insurance Corporation), the Group may make further provisions and may incur additional costs and liabilities, which may have an adverse impact on its financial condition and results of operations.
The value of certain financial instruments recorded at fair value is determined using financial models incorporating assumptions, judgements and estimates that may change over time or may ultimately not turn out to be accurate
Under International Financial Reporting Standards (IFRS), the Group recognises at fair value: (i) financial instruments classified as held-for-trading or designated as at fair value through profit or loss; (ii) financial assets classified as available-for-sale; and (iii) derivatives.
Generally, to establish the fair value of these instruments, the Group relies on quoted market prices or, where the market for a financial instrument is not sufficiently active, internal valuation models that utilise observable market data. In certain circumstances, the data for individual financial instruments or classes of financial instruments utilised by such valuation models may not be available or may become unavailable due to prevailing market conditions. In such circumstances, the Group’s internal valuation models require the Group to make assumptions, judgements and estimates to establish fair value, which are complex and often relate to matters that are inherently uncertain. These assumptions, judgements and estimates also need to be updated to reflect changing facts, trends and market conditions. The resulting change in the fair values of the financial instruments has had and could continue to have a material adverse effect on the Group’s earnings, financial condition and capital position.
The Group relies on valuation, capital and stress test models to conduct its business and anticipate capital and funding requirements. Failure of these models to provide accurate results or accurately reflect changes in the micro and macro economic environment in which the Group operates could have a material adverse effect on the Group’s business, capital and results.
Given the complexity of the Group’s business, strategy and capital requirements, the Group relies on analytical models to assess the value of its assets and its risk exposure and anticipate capital and funding requirements. The Group’s valuation, capital and stress test models and the parameters and assumptions on which they are based need to be constantly updated to ensure their accuracy. Failure of these models to accurately reflect changes in the environment in which the Group operates or the failure to properly input any such changes could have an adverse impact on the modelled results or could fail to accurately capture the risk profile of the Group’s financial instruments. Some of the analytical models used by the Group are predictive in nature. The use of predictive models has inherent risks and may incorrectly forecast future behaviour, leading to flawed decision making and potential losses. The Group also uses valuation models that rely on market data inputs. If incorrect market data is input into a valuation model, it may result in incorrect valuations or valuations different to those which were predicted and used by the Group in its forecasts or decision making. Should such models prove to be incorrect or misleading, decisions made by the Group in reliance thereon could expose the Group to business, capital and funding risk.
The Group’s results could be adversely affected in the event of goodwill impairment
The Group capitalises goodwill, which is calculated as the excess of the cost of an acquisition over the net fair value of the identifiable assets, liabilities and contingent liabilities acquired. Acquired goodwill is recognised initially at cost and subsequently at cost less any accumulated impairment losses. As required by IFRS, the Group tests goodwill for impairment annually, or more frequently when events or circumstances indicate that it might be impaired. An impairment test involves comparing the recoverable amount (the higher of the value in use and fair value less cost to sell) of an individual cash generating unit with its carrying value. At 31 December 2014, the Group carried goodwill of £6.3 billion on its balance sheet.
The value in use and fair value of the Group’s cash generating units are affected by market conditions and the performance of the economies in which the Group operates. Where the Group is required to recognise a goodwill impairment, it is recorded in the Group’s income statement, although it has no effect on the Group’s regulatory capital position. Further impairments of the Group’s goodwill could have an adverse effect on the Group’s results and financial condition.
Any significant write-down of goodwill could have a material adverse effect on the Group’s results of operations.
The recoverability of certain deferred tax assets recognised by the Group depends on the Group’s ability to generate sufficient future taxable profits and may be affected by changes to tax legislation
In accordance with IFRS, the Group has recognised deferred tax assets on losses available to relieve future profits from tax only to the extent that it is probable that they will be recovered. The deferred tax assets are quantified on the basis of current tax legislation and accounting standards and are subject to change in respect of the future rates of tax or the rules for computing taxable profits and offsetting allowable losses. Failure to generate sufficient future taxable profits or changes in tax legislation (including rates of tax) or accounting standards may reduce the recoverable amount of the recognised deferred tax assets. At 31 December 2014, the value of the Group’s deferred tax assets was £1.5 billion. In December 2014 the UK Government announced a proposed restriction on the use of certain brought forward tax losses of banking companies to 50% of relevant profits from 1 April 2015 which may also affect the recoverable amount of recognised deferred tax assets. In addition, the implementation of the rules relating to ring-fencing and the resulting restructuring of the Group may further restrict the Group’s ability to recognise tax losses within the Group as deferred tax assets .
Iran sanctions and related disclosures
Disclosure pursuant to section 13(r) of the Securities Exchange Act
Section 13(r) to the Securities Exchange Act as amended by section 219 of the Iran Threat Reduction and Syria Human Rights Act of 2012 requires an issuer to disclose in its annual or quarterly reports, as applicable, whether, during the period covered by the report, it or any of its affiliates knowingly engaged in specified activities or transactions relating to Iran or with individuals or entities designated under Executive Order 13382 or 13224. Disclosure is required of certain activities conducted outside the United States by non-U.S. entities in compliance with local law, whether or not the activities are sanctionable under U.S. law.
Licensed Payments
During 2014, in full compliance with applicable sanctions and under applicable licenses granted by appropriate authorities, RBS Group facilitated a small number of payments that were remitted by Iranian government-owned financial institutions and/or financial institutions designated under Executive Order 13382 or 13224. These payments were remitted and received by non-designated third parties in relation to food stuffs and medical supplies. All payments were received in full compliance with applicable sanctions and under applicable licences.
RBS Group also facilitated a small number of payments from frozen accounts of Iranian government-owned financial institutions and/or financial institutions designated under Executive Order 13382 or 13224 maintained at other financial institutions. These payments related to amounts due to non-designated third parties for legal services and one payment related to insurance premiums. All payments were received in full compliance with applicable sanctions and under applicable licences.
During 2014, RBS Group also made and received a small number of payments from and to frozen accounts related to entities identified as part of the Government of Iran and/or entities designated under Executive Order 13382 or 13324. These payments related to amounts due to third parties for legal services. All such payments were made or received in compliance with applicable sanctions and under applicable licences
The transactions described in the above paragraphs resulted in less than the equivalent of £30 in gross revenue to RBS Group for each transaction. RBS Group intends to continue to engage in transactions similar to those described in these paragraphs as long as such transactions are licensed by the proper authorities.
Legacy Guarantees
Under appropriate license from the applicable authorities, the Bank holds 8 legacy guarantees entered into between 1998 and 2005, which support arrangements entered into lawfully by Bank customers with Iranian counterparties. These legacy guarantees are in favour of Iranian government-owned financial institutions that are also designated under Executive Order 13882. RBS Group has made considerable efforts to exit and formally cancel the guarantees but has been unable to do so to date.
RBS Group received revenue of £1,509.19 in the reporting period in respect of one of these legacy guarantees. No other payments were made under these guarantees in the Reporting Period. If any payments are required to be made under the legacy guarantees while the beneficiary banks remain the target of EU sanctions, RBS Group intends to make the payments under applicable licence into frozen bank accounts.
Clearing System
RBS Group participates in local government-run clearing and settlement exchange systems in a number of countries in compliance with applicable laws and regulations. Iranian government-owned banks, including certain banks designated under Executive Order 13382 or 13224, also participate in some of these clearing systems, which creates the risk that RBS Group could participate in transactions in which such Iranian banks are involved. Where legally permissible, RBS Group has instituted procedures to screen and halt any outgoing and incoming payments to and from Iranian banks in these clearing systems prior to settlement. RBS Group has obtained a license from Her Majesty’s Treasury to participate in local payment and settlement systems in the United Arab Emirates (UAE). RBS Group intends to continue to participate in the clearing and settlement exchange systems in various countries and will continue to seek to limit the risk of participating in transactions involving Iranian government-owned financial institutions in accordance with applicable laws and regulations. It intends to participate in transactions involving such entities only pursuant to licenses from the appropriate authorities.
Iranian Petroleum Industry
Section 219 requires disclosure of any knowing engagement in activity described in section 5 (a) or (b) of the Iran Sanctions Act including significant investments in or transactions that could develop the Iranian petroleum or petrochemical sectors. In full compliance with applicable laws and after discussions with relevant sanctions authorities RBS Group maintains limited transactional banking facilities on behalf of a UK Company (Non-Iranian Party) and a Company owned and controlled by the Government of Iran (Iranian Party) in relation to their interest in a joint operating agreement with a UK oil field located in the North Sea.
Under authorisation from relevant sanctions authorities the Non-Iranian Party is able to under take all transactions and activities incident to the operation and production of the UK oil field and sale of gas, oil, condensate, natural gas liquids or other hydrocarbons products produced from the UK oil field. Under licence from relevant sanctions authorities RBS Group operates a Temporary Management Account to facilitate these activities for the joint venture, no proceeds from the account are made available to the Iranian Party. RBS Group intends to continue to provide these services as long as such transactions are licensed by the proper authorities.
| 487 | Financial calendar |
| 487 | Shareholder enquiries |
| 488 | Analyses of ordinary shareholders |
| 489 | Trading market |
| 491 | Dividend history |
| 492 | Taxation for US Holders |
| 495 | Exchange controls |
| 495 | Memorandum and Articles of Association |
| 504 | Documents on display |
| 504 | Incorporation and registration |
| 505 | Abbreviations and acronyms |
| 506 | Glossary of terms |
| 513 | EDTF recommendations |
| 514 | Index |
| 517 | Important addresses |
| 517 | Principal offices |
Financial calendar
| Annual General Meeting | 23 June 2015RBS Conference Centre RBS GogarburnEdinburgh EH12 1HQ |
| | |
| | |
| Interim results | 30 July 2015 |
Shareholder enquiries
Shareholdings in the company may be checked by visiting the Shareholder centre section of our website, www.rbs.com. You will need the shareholder reference number printed on your share certificate or tax voucher to gain access to this information.
Listed below are the most commonly used features on the website:
| · | holding enquiry - view balances, values, history, payments and reinvestments; |
| · | address change - change your registered address; |
| · | e-Comms sign-up - choose to receive email notification when your shareholder communications become available instead of paper communications; |
| · | outstanding payments - reissue any uncashed payments using our online replacement service; and |
| · | downloadable forms - including stock transfer and change of address forms. |
You may also check your shareholding by contacting our Registrar:
Computershare Investor Services PLC
The Pavilions
Bridgwater Road
Bristol BS99 6ZZ
Telephone: +44 (0)870 702 0135
Fax: +44 (0)870 703 6009
Website: www.investorcentre.co.uk/contactus
Dividends
| Payment dates | |
| Cumulative preference shares | 31 May and 31 December 2015 |
| | |
| Non-cumulative preference shares | 31 March, 30 June, 30 September |
| | |
| Ex-dividend date | |
| Cumulative preference shares | 30 April 2015 |
| | |
| Record date | |
| Cumulative preference shares | 1 May 2015 |
For further information on the payment of dividends, see page 99.
Braille and audio Strategic report with additional information
Shareholders requiring a Braille or audio version of the Strategic report with additional information should contact the Registrar on +44 (0)870 702 0135.
ShareGift
The company is aware that shareholders who hold a small number of shares may be retaining these shares because dealing costs make it uneconomical to dispose of them. ShareGift, the charity share donation scheme, is a free service operated by The Orr Mackintosh Foundation (registered charity 1052686) to enable shareholders to donate shares to charity.
Donating your shares in this way will not give rise to either a gain or a loss for UK capital gains tax purposes and you may be able to reclaim UK income tax on gifted shares. Further information can be obtained from HM Revenue & Customs.
Should you wish to donate your shares to charity in this way you should contact ShareGift for further information:
ShareGift, The Orr Mackintosh Foundation
17 Carlton House Terrace, London SW1Y 5AH
Telephone: +44 (0)20 7930 3737
Website: www.sharegift.org
Share fraud warning
Fraudsters use persuasive and high-pressure tactics to lure investors into scams. They may offer to sell shares that turn out to be worthless or non-existent, or to buy shares at an inflated price in return for an upfront payment. While high profits are promised, if you buy or sell shares in this way you will probably lose your money.
| · | Keep in mind that firms authorised by the FCA are unlikely to contact you out of the blue with an offer to buy or sell shares. |
| · | Do not get into a conversation, note the name of the person and firm contacting you and then end the call. |
| · | Check the Financial Services Register at www.fca.org.uk to see if the person and firm contacting you is authorised by the FCA. |
| · | Beware of fraudsters claiming to be from an authorised firm, copying its website or giving you false contact details. |
| · | Use the firm’s contact details listed on the Register if you want to call it back. |
| · | Call the FCA on 0800 111 6768 if the firm does not have contact details on the Register or you are told they are out of date. |
| · | Search the list of unauthorised firms to avoid at www.fca.org.uk/scams |
| · | Consider that if you buy or sell shares from an unauthorised firm you will not have access to the Financial Ombudsman Service or Financial Services Compensation Scheme. |
| · | Think about getting independent financial and professional advice before you hand over any money. |
| · | Remember if it sounds too good to be true, it probably is. |
Report a scam
If you are approached by fraudsters please tell the FCA using the share fraud reporting form at www.fca.gov.uk/scams, where you can find out more about investment scams. You can also call the FCA Consumer Helpline on 0800 111 6768. If you have already paid money to share fraudsters you should contact Action Fraud on 0300 123 2040.
Analyses of ordinary shareholders
| At 31 December 2014 | Shareholdings | Number of shares - millions | % |
| Individuals | 194,957 | 112.1 | 1.8 |
| Banks and nominee companies | 10,181 | 6,189.9 | 97.2 |
| Investment trusts | 97 | 0.7 | — |
| Insurance companies | 90 | 0.3 | — |
| Other companies | 903 | 16.9 | 0.3 |
| Pension trusts | 28 | 0.9 | — |
| Other corporate bodies | 85 | 45.1 | 0.7 |
| | 206,341 | 6,365.9 | 100.0 |
| | | | |
| Range of shareholdings: | | | |
| 1 - 1,000 | 178,446 | 44.6 | 0.7 |
| 1,001 - 10,000 | 26,206 | 59.3 | 0.9 |
| 10,001 - 100,000 | 1,050 | 29.4 | 0.5 |
| 100,001 - 1,000,000 | 412 | 143.2 | 2.2 |
| 1,000,001 - 10,000,000 | 182 | 579.0 | 9.1 |
| 10,000,001 and over | 45 | 5,510.4 | 86.6 |
| | 206,341 | 6,365.9 | 100.0 |
Trading market
Non-cumulative dollar preference shares
The following series of American Depositary shares (ADSs) representing non-cumulative preference shares issued in the US were outstanding at 31 December 2014:
| Date of issue | Series of ADS | Number of ADSs/non-cumulative preference shares in issue | Number of registered holders |
| 26 March 1997 | F | 6,255,408 | 48 |
| 8 February 1999 | H | 9,687,654 | 30 |
| 30 September 2004 | L | 30,027,877 | 17 |
| 26 August 2004 | M | 23,125,869 | 6 |
| 19 May 2005 | N | 22,113,160 | 10 |
| 9 November 2005 | P | 9,883,307 | 19 |
| 25 May 2006 | Q | 20,646,938 | 6 |
| 27 December 2006 | R | 10,163,932 | 3 |
| 28 June 2007 | S | 26,449,040 | 2 |
| 27 September 2007 | T | 51,245,839 | 14 |
| 4 October 2007 | U | 10,130 | 1 |
Each of the respective ADSs set out above represents the right to receive one corresponding preference share, and is evidenced by an American Depository Receipt (ADR) and is listed on the New York Stock Exchange, a subsidiary of NYSE Euronext (NYSE).
The ADRs evidencing the ADSs above were issued pursuant to Deposit Agreements, among the company, The Bank of New York, as depository, and all holders from time-to-time of ADRs issued thereunder. Currently, there is no non-United States trading market for any of the non-cumulative dollar preference shares. All of the non-cumulative dollar preference shares are held by the depository, as custodian, in bearer form.
PROs
In August 2001, the company issued US$1.2 billion perpetual regulatory tier one securities (PROs) which are listed on the NYSE.
ADSs representing ordinary shares
In October 2007, the company listed ADSs, each representing one ordinary share nominal value 25p each (or a right to receive one ordinary share), and evidenced by an ADR or uncertificated securities, on the NYSE. With effect from 7 November 2008, the ratio of one ADS representing one ordinary share changed to one ADS representing 20 ordinary shares.
Following a sub-division and one-for-ten consolidation of RBS’s ordinary shares in June 2012, the ratio of one ADS representing 20 ordinary shares was adjusted to one ADS representing two ordinary shares. As at 31 December 2014, 30.7 million ordinary ADSs were outstanding.
The ordinary ADSs were issued pursuant to a Deposit Agreement, among the company, The Bank of New York Mellon, as depository, and all owners and holders from time to time of ordinary ADSs issued thereunder. The ordinary shares of the company are listed and traded on the London Stock Exchange. All ordinary shares are deposited with the principal London office of The Bank of New York Mellon, as custodian for the depository.
The following table shows the high and low sales prices for each of the outstanding ADSs representing non-cumulative dollar preference shares, PROs, ordinary shares and ADSs representing ordinary shares.
| | | | | Series F ADSs (1) | | Series H ADSs (1) | | Series L ADSs (1) | | Series M ADSs (1) | | Series N ADSs (1) | | Series P ADSs (1) | | Series Q ADSs (1) | | Series R ADSs (1) | | Series S ADSs (1) | | Series T ADSs (1) | | Series U ADSs (1) | | PROs (1,2) | | Ordinary shares (3) | | Ordinary ADSs (4) |
| | | | | US$ | | US$ | | US$ | | US$ | | US$ | | US$ | | US$ | | US$ | | US$ | | US$ | | US$ | | US$ | | £ | | US$ |
| By month | | | | | | | | | | | | | | | | | | | | | | | | | | | | | | |
| Feb 2015 | | High | | 26.46 | | 25.75 | | 24.09 | | 25.05 | | 25.15 | | 24.98 | | 25.38 | | 24.69 | | 25.5 | | 25.65 | | 110.00 | | 124.50 | | 4.039 | | 12.43 |
| | | Low | | 26.04 | | 25.56 | | 23.81 | | 24.81 | | 24.96 | | 24.63 | | 25.14 | | 24.45 | | 25.12 | | 25.40 | | 107.75 | | 119.09 | | 3.655 | | 11.02 |
| Jan 2015 | | High | | 26.24 | | 25.80 | | 24.00 | | 24.91 | | 25.06 | | 24.82 | | 25.30 | | 24.51 | | 25.28 | | 25.66 | | 107.75 | | 119.09 | | 3.944 | | 11.93 |
| | | Low | | 25.65 | | 25.45 | | 23.50 | | 24.68 | | 24.76 | | 24.11 | | 25.09 | | 23.90 | | 24.88 | | 25.35 | | 104.25 | | 117.04 | | 3.624 | | 10.86 |
| Dec 2014 | | High | | 26.19 | | 25.79 | | 23.92 | | 24.84 | | 24.90 | | 24.49 | | 25.35 | | 24.32 | | 25.07 | | 25.60 | | 105.50 | | 117.51 | | 4.035 | | 12.57 |
| | | Low | | 25.39 | | 25.13 | | 23.18 | | 24.15 | | 24.08 | | 23.77 | | 24.81 | | 23.58 | | 24.48 | | 25.05 | | 104.00 | | 116.99 | | 3.637 | | 11.32 |
| Nov 2014 | | High | | 26.16 | | 25.92 | | 24.05 | | 24.93 | | 24.99 | | 24.58 | | 25.39 | | 24.52 | | 25.06 | | 25.80 | | 105.88 | | 117.44 | | 3.953 | | 12.34 |
| | | Low | | 25.78 | | 25.56 | | 23.57 | | 24.66 | | 24.61 | | 24.10 | | 25.22 | | 24.01 | | 24.91 | | 25.37 | | 104.38 | | 116.84 | | 3.738 | | 11.63 |
| Oct 2014 | | High | | 26.06 | | 25.55 | | 23.49 | | 24.58 | | 24.61 | | 24.02 | | 25.13 | | 24.04 | | 24.82 | | 25.35 | | 106.13 | | 117.28 | | 3.880 | | 12.43 |
| | | Low | | 25.78 | | 25.13 | | 23.10 | | 24.20 | | 24.03 | | 23.63 | | 24.70 | | 23.48 | | 24.40 | | 25.12 | | 105.00 | | 116.68 | | 3.377 | | 10.85 |
| Sep 2014 | | High | | 25.95 | | 25.70 | | 23.74 | | 24.90 | | 24.95 | | 24.38 | | 25.43 | | 24.34 | | 25.01 | | 25.68 | | 106.50 | | 118.58 | | 3.682 | | 11.93 |
| | | Low | | 25.29 | | 25.15 | | 22.40 | | 23.78 | | 23.83 | | 23.42 | | 24.45 | | 23.34 | | 23.96 | | 24.90 | | 103.50 | | 116.88 | | 3.422 | | 11.01 |
| | | | | | | | | | | | | | | | | | | | | | | | | | | | | | | |
| By quarter | | | | | | | | | | | | | | | | | | | | | | | | | | | | | | |
| 2014: Q4 | | High | | 26.19 | | 25.92 | | 24.05 | | 24.93 | | 24.99 | | 24.58 | | 25.39 | | 24.52 | | 25.07 | | 25.80 | | 106.13 | | 117.51 | | 4.035 | | 12.57 |
| | | Low | | 25.39 | | 25.13 | | 23.10 | | 24.15 | | 24.03 | | 23.63 | | 24.70 | | 23.48 | | 24.40 | | 25.05 | | 104.00 | | 116.68 | | 3.377 | | 10.85 |
| 2014: Q3 | | High | | 26.07 | | 25.70 | | 23.78 | | 24.90 | | 24.95 | | 24.38 | | 25.43 | | 24.34 | | 25.03 | | 25.68 | | 107.00 | | 121.97 | | 3.682 | | 12.38 |
| | | Low | | 25.29 | | 25.15 | | 22.40 | | 23.78 | | 23.83 | | 23.42 | | 24.45 | | 23.34 | | 23.96 | | 24.90 | | 103.50 | | 116.88 | | 3.141 | | 10.75 |
| 2014: Q2 | | High | | 26.44 | | 25.65 | | 23.40 | | 24.29 | | 24.08 | | 23.84 | | 24.99 | | 23.80 | | 24.63 | | 25.57 | | 107.13 | | 121.92 | | 3.466 | | 11.59 |
| | | Low | | 25.35 | | 24.93 | | 21.35 | | 22.74 | | 22.53 | | 22.18 | | 23.63 | | 21.93 | | 23.17 | | 24.90 | | 101.75 | | 107.64 | | 2.955 | | 9.91 |
| 2014: Q1 | | High | | 25.59 | | 25.15 | | 21.66 | | 22.84 | | 22.75 | | 22.33 | | 23.73 | | 22.26 | | 23.16 | | 25.12 | | 101.50 | | 107.72 | | 3.750 | | 12.40 |
| | | Low | | 24.93 | | 24.23 | | 19.89 | | 20.86 | | 20.68 | | 20.39 | | 21.85 | | 20.06 | | 21.68 | | 24.17 | | 97.25 | | 105.04 | | 2.991 | | 9.86 |
| 2013: Q4 | | High | | 25.24 | | 24.85 | | 20.25 | | 21.88 | | 21.75 | | 21.40 | | 22.95 | | 21.18 | | 22.49 | | 24.76 | | 97.50 | | 105.16 | | 3.849 | | 12.35 |
| | | Low | | 24.32 | | 23.83 | | 19.13 | | 20.23 | | 20.07 | | 19.88 | | 21.16 | | 19.70 | | 20.72 | | 23.05 | | 92.50 | | 102.20 | | 3.159 | | 10.25 |
| 2013: Q3 | | High | | 24.95 | | 24.70 | | 20.42 | | 21.16 | | 21.08 | | 20.89 | | 22.24 | | 20.71 | | 21.82 | | 23.84 | | 95.00 | | 102.80 | | 3.727 | | 11.97 |
| | | Low | | 24.16 | | 23.64 | | 18.46 | | 19.58 | | 19.46 | | 19.29 | | 20.57 | | 19.26 | | 20.23 | | 22.28 | | 89.00 | | 91.38 | | 2.700 | | 8.23 |
| 2013: Q2 | | High | | 25.86 | | 25.55 | | 23.87 | | 24.03 | | 23.72 | | 23.92 | | 24.63 | | 23.70 | | 24.45 | | 25.44 | | 98.50 | | 106.76 | | 3.519 | | 10.81 |
| | | Low | | 24.07 | | 23.52 | | 18.99 | | 20.21 | | 20.16 | | 20.00 | | 21.05 | | 19.79 | | 20.49 | | 21.83 | | 84.00 | | 90.27 | | 2.661 | | 8.15 |
| 2013: Q1 | | High | | 25.62 | | 25.41 | | 24.00 | | 23.87 | | 23.69 | | 23.71 | | 24.54 | | 23.47 | | 24.21 | | 25.03 | | 97.00 | | 107.70 | | 3.678 | | 11.84 |
| | | Low | | 24.77 | | 24.70 | | 22.39 | | 22.24 | | 22.20 | | 21.92 | | 23.32 | | 21.77 | | 23.03 | | 24.19 | | 89.00 | | 100.24 | | 2.755 | | 8.37 |
| | | | | | | | | | | | | | | | | | | | | | | | | | | | | | | |
| By year | | | | | | | | | | | | | | | | | | | | | | | | | | | | | | |
| 2014 | | High | | 26.44 | | 25.92 | | 24.05 | | 24.93 | | 24.99 | | 24.58 | | 25.43 | | 24.52 | | 25.07 | | 25.80 | | 107.13 | | 121.97 | | 4.035 | | 12.57 |
| | | Low | | 24.93 | | 24.23 | | 19.89 | | 20.86 | | 20.68 | | 20.39 | | 21.85 | | 20.06 | | 21.68 | | 24.17 | | 97.25 | | 105.04 | | 2.955 | | 9.86 |
| 2013 | | High | | 25.86 | | 25.55 | | 24.00 | | 24.03 | | 23.72 | | 23.92 | | 24.63 | | 23.70 | | 24.45 | | 25.44 | | 98.50 | | 107.70 | | 3.849 | | 12.35 |
| | | Low | | 24.07 | | 23.52 | | 18.46 | | 19.58 | | 19.46 | | 19.29 | | 20.57 | | 19.26 | | 20.23 | | 21.83 | | 84.00 | | 90.27 | | 2.661 | | 8.15 |
| 2012 | | High | | 25.35 | | 24.96 | | 23.57 | | 23.09 | | 22.98 | | 22.83 | | 23.40 | | 22.96 | | 23.31 | | 24.50 | | 90.00 | | 100.59 | | 3.250 | | 10.79 |
| | | Low | | 17.60 | | 16.76 | | 15.46 | | 11.63 | | 11.53 | | 11.41 | | 12.24 | | 11.41 | | 11.83 | | 13.08 | | 53.63 | | 66.58 | | 1.966 | | 6.09 |
| 2011 | | High | | 25.05 | | 23.95 | | 19.40 | | 18.80 | | 18.82 | | 18.40 | | 19.40 | | 18.35 | | 18.88 | | 20.60 | | 84.00 | | 96.69 | | 4.900 | | 15.83 |
| | | Low | | 16.21 | | 15.35 | | 13.87 | | 10.21 | | 10.11 | | 9.97 | | 10.62 | | 9.98 | | 10.22 | | 11.43 | | 46.00 | | 63.58 | | 1.734 | | 5.36 |
| 2010 | | High | | 23.97 | | 23.85 | | 19.88 | | 17.75 | | 17.73 | | 17.77 | | 17.91 | | 17.75 | | 17.73 | | 18.64 | | 78.25 | | 97.06 | | 5.804 | | 17.30 |
| | | Low | | 16.57 | | 15.10 | | 13.35 | | 10.95 | | 10.91 | | 10.75 | | 11.24 | | 10.80 | | 10.99 | | 11.90 | | 53.00 | | 67.13 | | 3.125 | | 9.89 |
Notes:
| (1) | Prices as reported on the NYSE or NASDAQ. |
| (2) | Price quoted as a % of US$1,000 nominal. |
| (3) | Prices as reported in the Daily Official List of the London Stock Exchange. Following the sub-division and one-for-ten consolidation of ordinary shares in June 2012, prices prior to that date were restated accordingly. |
| (4) | Prices as reported on the NYSE composite tape. Following the sub-division and one-for-ten consolidation of ordinary shares in June 2012, the ratio of one ADS representing 20 ordinary shares was adjusted to one ADS representing two ordinary shares. |
On 20 March 2015, the closing price of the ordinary shares on the London Stock Exchange was £3.563 equivalent to $5.317 per ordinary share translated at the Noon Buying Rate of $1.4923 per £1.00, and the closing price of the ordinary ADSs on the NYSE was $10.63.
| Amount per share | 2014 $ | 2014 £ | 2013 $ | 2013 £ | 2012 $ | 2012 £ | 2011 $ | 2011 £ | 2010 $ | 2010 £ |
| Non-cumulative preference shares of US$0.01 | | | | | | | | | | |
- Series F (1) | 1.91 | 1.16 | 1.91 | 1.16 | 1.91 | 1.21 | 1.91 | 1.19 | 1.91 | 1.06 |
- Series H (1) | 1.81 | 1.10 | 1.81 | 1.10 | 1.81 | 1.14 | 1.81 | 1.13 | 1.81 | 1.03 |
- Series L (1) | 1.44 | 0.87 | 1.44 | 0.87 | 1.44 | 0.91 | 1.44 | 0.90 | 1.44 | 0.86 |
- Series M (2) | 1.60 | 0.97 | 1.60 | 1.03 | 1.20 | 0.75 | | — | 0.40 | 0.26 |
- Series N (2) | 1.59 | 0.96 | 1.59 | 1.03 | 1.19 | 0.74 | | — | 0.40 | 0.26 |
- Series P (2) | 1.56 | 0.95 | 1.56 | 1.01 | 1.17 | 0.73 | | — | 0.39 | 0.25 |
- Series Q (2) | 1.69 | 1.02 | 1.69 | 1.09 | 1.27 | 0.79 | | — | 0.42 | 0.27 |
- Series R (2) | 1.53 | 0.93 | 1.53 | 0.99 | 1.15 | 0.72 | | — | 0.38 | 0.25 |
- Series S (2) | 1.65 | 1.00 | 1.65 | 1.07 | 1.24 | 0.77 | | — | 0.41 | 0.27 |
- Series T (2) | 1.81 | 1.10 | 1.81 | 1.17 | 1.36 | 0.85 | | — | 0.45 | 0.29 |
- Series U (2) | 7,640 | 4,637 | 7,640 | 4,881 | 3,820 | 2,406 | | — | 3,820 | 2,474 |
| Non-cumulative convertible preference shares of US$0.01 | | | | | | | | | | |
- Series 1 (1) | 91.18 | 55.34 | 91.18 | 55.12 | 91.18 | 57.86 | 91.18 | 56.87 | 91.18 | 59.98 |
| Non-cumulative preference shares of €0.01 | | | | | | | | | | |
- Series 1 (2) | 73.02 | 44.32 | 75.77 | 45.76 | 72.17 | 44.65 | | — | | — |
- Series 2 (2) | 69.70 | 42.31 | 72.32 | 44.83 | 68.29 | 42.25 | | — | | — |
- Series 3 (2) | 4,667 | 2,833 | 4,885 | 3,027 | 4,547 | 2,813 | | — | | — |
| Non-cumulative convertible preference shares of £0.01 | | | | | | | | | | |
- Series 1 (1) | 121.70 | 73.87 | 122.20 | 73.87 | 119.40 | 73.87 | 118.48 | 73.87 | 114.68 | 73.87 |
| Non-cumulative preference shares of £1 | | | | | | | | | | |
- Series 1 (2) | 47.80 | 29.01 | 47.02 | 28.42 | 144.86 | 89.62 | | — | | — |
| (1) | Classified as subordinated liabilities. |
On 26 November 2009, RBS entered into a State Aid Commitment Deed with HM Treasury containing commitments and undertakings that were designed to ensure that HM Treasury was able to comply with the commitments to be given by it to the European Commission for the purposes of obtaining approval for the State aid provided to RBS. As part of these commitments and undertakings, RBS agreed not to pay discretionary coupons and dividends on its existing hybrid capital instruments for a period of two years. This period commenced on 30 April 2010 for RBS Group instruments and ended on 30 April 2012; the two year deferral period for RBS Holdings N.V. instruments commenced on 1 April 2011 and ended on 1 April 2013.
On 4 May 2012, RBS determined that it was in a position to recommence payments on RBS Group instruments. In June 2013 RBS Holdings N.V. resumed payments on its hybrid capital instruments. Future coupons and dividends on hybrid capital instruments will only be paid subject to, and in accordance with, the terms of the relevant instruments.
For further information, see Note 7 on the consolidated accounts.
Ordinary dividends
The company has not paid an ordinary dividend since 2007. In 2008, the company issued new ordinary shares by way of a capitalisation issue rather than paying an interim dividend.
Taxation for US Holders
The following discussion summarises certain US federal and UK tax consequences of the ownership and disposition of ordinary shares, ADSs representing ordinary shares (ordinary ADSs), ADSs representing non-cumulative dollar preference shares (preference ADSs) or PROs by a beneficial owner that is a citizen or resident of the United States or that otherwise will be subject to US federal income tax on a net income basis in respect of the ordinary shares, ordinary ADSs, preference ADSs or PROs (a “US Holder”). This summary assumes that a US Holder is holding ordinary shares, ordinary ADSs, preference ADSs or PROs, as applicable, as capital assets. This summary does not address the tax consequences to a US Holder (i) that is resident in the UK for UK tax purposes, (ii) that carries on a trade, profession or vocation through a branch, agency or permanent establishment in the UK in connection with which their ordinary shares, ordinary ADSs, preference ADSs or PROs are held, used or acquired, or (iii) generally, that is a corporation which alone or together with one or more associated companies, controls, directly or indirectly, 10% or more of the voting stock of the company, nor does this summary address all of the tax consequences that may be relevant to a US Holder in light of its particular circumstances, including alternative minimum tax and Medicare contribution tax consequences, as well as differing tax consequences that may apply to US Holders subject to special rules, such as certain financial institutions, dealers or traders in securities who use a mark-to-market method of tax accounting, persons holding ordinary shares, ordinary ADSs, preference ADSs or PROs as part of a hedging transaction, straddle, wash sale, conversion transaction or integrated transaction or persons entering into a constructive sale with respect to such securities, persons whose functional currency for US federal income tax purposes is not the US dollar, entities classified as partnerships for US federal income tax purposes, tax-exempt entities or persons that own or are deemed to own 10% or more of the voting stock of the company.
The statements and practices set forth below regarding US and UK tax laws, including the US/UK double taxation convention relating to income and capital gains which entered into force on 31 March 2003 (the “Treaty”) and the US/UK double taxation convention relating to estate and gift taxes (the “Estate Taxation Treaty”), are based on those laws and practices as in force and as applied in practice on the date of this report. This summary is not exhaustive of all possible tax considerations and holders are advised to satisfy themselves as to the overall tax consequences, including specifically the consequences under US federal, state, local and other laws, and possible changes in taxation law, of the acquisition, ownership and disposition of ordinary shares, ordinary ADSs, preference ADSs or PROs by consulting their own tax advisers.
The following discussion assumes that the company was not for the taxable year ended 31 December 2014, and will not become in the foreseeable future, a passive foreign investment company - see ‘Passive Foreign Investment Company (PFIC) considerations’ on page 495.
Ordinary shares, ordinary ADSs and preference ADSs
Taxation of dividends
For the purposes of the Treaty, the Estate Taxation Treaty and the US Internal Revenue Code of 1986 as amended (the “Code”), US Holders of ordinary ADSs and preference ADSs should be treated as owners of the respective ordinary shares and the non-cumulative dollar preference shares underlying such ADSs.
The US Treasury has expressed concerns that parties to whom depositary receipts are released before shares are delivered to the depositary, or intermediaries in the chain of ownership between US holders and the issuer of the security underlying the depositary receipts, may be taking actions that are inconsistent with the claiming of foreign tax credits for US holders of depositary receipts. Such actions would also be inconsistent with the claiming of the favourable US tax rates applicable to dividends received by certain non-corporate US holders (described below). Accordingly, the availability of the favourable tax rates for dividends received by certain non-corporate US holders could be affected by actions taken by such parties or intermediaries.
The company is not required to withhold UK tax at source from dividend payments it makes or from any amount (including any amounts in respect of accrued dividends) distributed by the company. US Holders who are not resident in the UK and who do not carry on a trade, profession or vocation in the UK through a branch, agency or permanent establishment in connection with which their ordinary shares, ordinary ADSs or preference ADSs are held, used or acquired will not be subject to UK tax in respect of any dividends received on the relevant shares or ADSs.
Distributions by the company (other than certain pro-rata distributions of ordinary shares or rights to receive such shares) will constitute foreign source dividend income for US federal income tax purposes to the extent paid out of the current or accumulated earnings and profits of the company, as determined under US federal income tax principles. Because the company does not maintain calculations of its earnings and profits under US federal income tax principles, it is expected that distributions will be reported to US Holders as dividends. Payments will not be eligible for the dividends-received deduction generally allowed to corporate US holders.
Subject to applicable limitations that vary depending upon a US Holder's particular circumstances and the discussion above regarding concerns expressed by the US Treasury, dividends paid to certain non-corporate US Holders may be taxable at the favourable rates applicable to long-term capital gain. Non-corporate US Holders should consult their own tax advisers to determine whether they are subject to any special rules that limit their ability to be taxed at these favourable rates.
Dividends will be included in a US Holder's income on the date of the US Holder's (or in the case of ADSs, the depositary's) receipt of the dividend. The amount of any dividend paid in pounds sterling to be included in income by a US Holder will be the US dollar amount calculated by reference to the relevant exchange rate in effect on the date of such receipt regardless of whether the payment is in fact converted into US dollars. If the dividend is converted into US dollars on the date of receipt, the US Holder generally should not be required to recognise foreign currency gain or loss in respect of the dividend income. If the amount of such dividend is converted into US dollars after the date of receipt, the US Holder may have foreign currency gain or loss.
Taxation of capital gains
A US Holder that is not resident in the UK will not normally be liable for UK tax on capital gains realised on the disposition of an ordinary share, an ordinary ADS or a preference ADS unless at the time of the disposal, in the case of a corporate US Holder, such US Holder carries on a trade in the UK through a permanent establishment or, in the case of any other US Holder, such US Holder carries on a trade, profession or vocation in the UK through a branch or agency and, in each case, such ordinary share, ordinary ADS or preference ADS is or has been used, held or acquired by or for the purposes of such trade (or profession or vocation), carried on through such permanent establishment, branch or agency. Special rules apply to individuals who are temporarily not resident in the UK.
A US Holder will, upon the sale or other disposition of an ordinary share, an ordinary ADS or a preference ADS, or upon the redemption of preference ADS, generally recognise capital gain or loss for US federal income tax purposes (assuming that in the case of a redemption of a preference ADS, such US Holder does not own, and is not deemed to own, any ordinary shares or ordinary ADSs of the company) in an amount equal to the difference between the amount realised (excluding in the case of a redemption any amount treated as a dividend for US federal income tax purposes, which will be taxed accordingly) and the US Holder's tax basis in such share or ADS. This capital gain or loss will be long-term capital gain or loss if the US Holder held the share or ADS so sold, disposed or redeemed for more than one year. The deductibility of capital losses is subject to limitations.
A US Holder who is liable for both UK and US tax on a gain recognised on the disposal of an ordinary share, an ordinary ADS or a preference ADS may be entitled, subject to certain limitations, to credit the UK tax against its US federal income tax liability in respect of such gain.
Estate and gift tax
Subject to the discussion of the Estate Tax Treaty in the following paragraph, ordinary shares, ordinary ADSs or preference ADSs beneficially owned by an individual may be subject to UK inheritance tax (subject to exemptions and reliefs) on the death of the individual or in certain circumstances, if such shares or ADSs are the subject of a gift (including a transfer at less than market value) by such individual. Inheritance tax is not generally chargeable on gifts to individuals made more than seven years before the death of the donor. Ordinary shares, ordinary ADSs or preference ADSs held by the trustees of a settlement may also be subject to UK inheritance tax. Special rules apply to such settlements.
An ordinary share, an ordinary ADS or a preference ADS beneficially owned by an individual, whose domicile is determined to be the United States for purposes of the Estate Tax Treaty and who is not a national of the UK, will not be subject to UK inheritance tax on the individual's death or on a lifetime transfer of such share or ADS, except in certain cases where the share or ADS (i) is comprised in a settlement (unless, at the time of the settlement, the settlor was domiciled in the United States and was not a national of the UK); (ii) is part of the business property of a UK permanent establishment of an enterprise; or (iii) pertains to a UK fixed base of an individual used for the performance of independent personal services.
The Estate Tax Treaty generally provides a credit against US federal estate or gift tax liability for the amount of any tax paid in the UK in a case where the ordinary share, ordinary ADS or preference ADS is subject to both UK inheritance tax and US federal estate or gift tax.
UK stamp duty and stamp duty reserve tax (SDRT)
The following is a summary of the UK stamp duty and SDRT consequences of transferring an ADS (otherwise than to the custodian on cancellation of the ADS) or of transferring an ordinary share. A transfer of an ADS executed and retained in the United States will not give rise to a liability to pay stamp duty and an agreement to transfer an ADS will not give rise to SDRT. Stamp duty or SDRT will normally be payable on or in respect of transfers of ordinary shares and accordingly any holder that acquires or intends to acquire ordinary shares is advised to consult its own tax adviser in relation to stamp duty and SDRT.
PROs
United States
Payments of interest on a PRO (including any UK withholding tax, as to which see below) will constitute foreign source dividend income for US federal income tax purposes to the extent paid out of the current or accumulated earnings and profits of the company, as determined under US federal income tax principles. Because the company does not maintain calculations of its earnings and profits under US federal income tax principles, it is expected that distributions will be reported to US Holders as dividends. Payments will not be eligible for the dividends-received deduction generally allowed to corporate US holders. A US Holder who is entitled under the Treaty to a refund of UK tax, if any, withheld on a payment will not be entitled to claim a foreign tax credit with respect to the refundable tax. Subject to applicable limitations that vary depending upon a US Holder's particular circumstances and the discussion above regarding concerns expressed by the US Treasury, dividends paid to certain non-corporate US Holders may be taxable at the favourable rates applicable to long-term capital gain. Non-corporate US Holders should consult their own tax advisers to determine whether they are subject to any special rules that limit their ability to be taxed at these favourable rates.
A US Holder will, upon the sale, exchange or redemption of a PRO, generally recognise capital gain or loss for US federal income tax purposes (assuming that in the case of a redemption, such US Holder does not own, and is not deemed to own, any ordinary shares or ordinary ADSs of the company) in an amount equal to the difference between the amount realised (excluding any amount in respect of mandatory interest and any missed payments which are to be satisfied on a missed payment satisfaction date, which would be treated as ordinary income) and the US Holder's tax basis in the PRO. This capital gain or loss will be long-term capital gain or loss if the US Holder held the PRO so sold, disposed or redeemed for more than one year. The deductibility of capital losses is subject to limitations.
A US Holder who is liable for both UK and US tax on gain recognised on the disposal of PROs may be entitled, subject to certain limitations, to credit the UK tax against all or a portion of its US federal income tax liability in respect of such gain.
United Kingdom
Taxation of payments on the PROs
Payments on the PROs will constitute interest rather than dividends for UK withholding tax purposes. The PROs are not expected to fall within the exemption from withholding tax provided for in the Taxation of Regulatory Capital Securities Regulations 2013 which apply to securities which qualify (or have qualified) as Additional Tier 1 instruments under Article 52 of the Commission Regulation (EU) No. 575/2013 or Tier 2 instruments under Article 63 of that regulation and which form (or have formed) a component of Additional Tier 1 capital or Tier 2 capital. However, the PROs constitute ‘quoted eurobonds’ within the meaning of section 987 of the Income Tax Act 2007 and therefore payments of interest will not be subject to withholding or deduction for or on account of UK tax as long as the PROs remain at all times listed on a ‘recognised stock exchange’ within the meaning of section 1005 of the Income Tax Act 2007, such as the main market of the New York Stock Exchange. In all other cases, an amount must be withheld on account of UK income tax at the basic rate (currently 20%) subject to any direction to the contrary by HM Revenue & Customs under the Treaty and except that the withholding obligation does not apply to payments to persons who the company reasonably believes are within the charge to corporation tax or fall within various categories enjoying a special tax status (including charities and pension funds), or are partnerships consisting of such persons (unless HM Revenue & Customs directs otherwise). Where interest has been paid under deduction of UK withholding tax, US Holders may be able to recover the tax deducted under the Treaty.
HM Revenue & Customs have powers in certain circumstances to obtain information in relation to interest and payments derived from securities. HM Revenue & Customs may communicate this information to the tax authorities of other jurisdictions.
HM Revenue & Customs confirmed at around the time of the issue of the PROs that interest payments would not be treated as distributions for UK tax purposes by reason of (i) the fact that interest may be deferred under the terms of issue; or (ii) the undated nature of the PROs, provided that at the time an interest payment is made, the PROs are not held by a company which is 'associated' with the company or by a 'funded company'. A company will be associated with the company if, broadly speaking, it is part of the same group as the company. A company will be a 'funded company' for these purposes if there are arrangements involving that company being put in funds (directly or indirectly) by the company, or an entity associated with the company. In this respect, HM Revenue & Customs has confirmed that a company holding an interest in the PROs which incidentally has banking facilities with any company associated with the company will not be a 'funded company' by virtue of such facilities.
Interest on the PROs constitutes UK source income for UK tax purposes and, as such, may be subject to income tax by direct assessment even where paid without withholding. However, interest with a UK source received without deduction or withholding on account of UK tax will not be chargeable to UK tax in the hands of a US Holder unless, in the case of a corporate US Holder, such US Holder carries on a trade in the UK through a UK permanent establishment or in the case of other US Holders, such persons carry on a trade, profession or vocation in the UK through a branch or agency in each case in connection with which the interest is received or to which the PROs are attributable. There are also exemptions for interest received by certain categories of agents (such as some brokers and investment managers).
EU Directive on taxation of savings income
Under the European Union Council Directive 2003/48/EC on the taxation of savings income, member states of the European Union are required to provide to the tax authorities of other member states details of payments of interest and other similar income paid by a person to an individual or certain other persons resident in another member state, except that Austria (and, prior to 1 January 2015, Luxembourg) may instead impose a withholding system for a transitional period unless during such period they elect otherwise.
An amending directive has been adopted which will, when implemented, amend and broaden the scope of the above requirements. It will expand the range of payments covered by the European Union Council Directive 2003/48/EC, in particular to include additional types of income payable on securities, and the circumstances in which payments must be reported or paid subject to withholding. The amending directive requires member states to adopt implementing legislation by 1 January 2016 to take effect from 1 January 2017.
Disposal (including redemption)
A disposal (including redemption) of PROs by a non-corporate US Holder will not give rise to any liability to UK tax on capital gains unless the US Holder carries on a trade (which for this purpose includes a profession or a vocation) in the UK through a branch or agency and the PROs are, or have been, held or acquired for the purposes of that trade, carried on through such branch or agency.
A transfer of PROs by a US Holder will not give rise to a charge to UK tax on accrued but unpaid interest payments, unless the US Holder is an individual or other non-corporate taxpayer and at any time in the relevant year of assessment or accounting period carries on a trade, profession or vocation in the UK through a branch or agency to which the PROs are attributable.
Annual tax charges
Corporate US Holders of PROs may be subject to UK tax charges (or tax relief) by reference to fluctuations in exchange rates and in respect of profits, gains and losses arising from the PROs (including on a disposal or redemption), but only if such corporate US Holders carry on a trade in the UK through a UK permanent establishment to which the PROs are attributable.
Inheritance tax
In relation to PROs held through Depository Trust Company (or any other clearing system), the UK inheritance tax position is not free from doubt in respect of a lifetime transfer, or death of, a US Holder who is not domiciled nor deemed to be domiciled in the UK for inheritance tax purposes; HM Revenue & Customs is known to consider that the situs of securities held in this manner is not necessarily determined by the place where the securities are registered. In appropriate circumstances, there may be a charge to UK inheritance tax as a result of a lifetime transfer at less than market value by, or on the death of, such US Holder. Inheritance tax is not generally chargeable on gifts to individuals made more than seven years before the death of the donor. However, exemption from, or a reduction of, any such UK tax liability may be available under the Estate Tax Treaty (see below). US Holders should consult their professional advisers in relation to such potential liability. PROs beneficially owned by an individual, whose domicile is determined to be the United States for the purposes of the Estate Tax Treaty and who is not a national of the UK, will not be subject to UK inheritance tax on the individual's death or on a lifetime transfer of the PRO, except in certain cases where the PRO (i) is comprised in a settlement (unless, at the time of the settlement, the settlor was domiciled in the United States and was not a national of the UK); (ii) is part of the business property of a UK permanent establishment of an enterprise; or (iii) pertains to a UK fixed base of an individual used for the performance of independent personal services.
The Estate Tax Treaty generally provides a credit against US federal estate or gift tax liability for the amount of any tax paid in the UK in a case where the PRO is subject to both UK inheritance tax and US federal estate or gift tax.
Stamp duty and SDRT
No stamp duty, SDRT or similar tax is imposed in the UK on the issue, transfer or redemption of the PROs.
Passive Foreign Investment Company (PFIC) considerations In general, a foreign corporation will be a PFIC for any taxable year in which, after taking into account the income and assets of the corporation and certain subsidiaries pursuant to applicable 'look-through rules', either (i) at least 75% of its gross income is 'passive income' or (ii) at least 50% of the average quarterly value of its assets is attributable to assets that produce passive income or are held for the production of passive income. The company does not believe that it was a PFIC for its 2014 taxable year. Although interest income is generally passive income, a special rule allows banks to treat their banking business income as non-passive. To qualify for this rule, a bank must satisfy certain requirements regarding its licensing and activities. The company's possible status as a PFIC is determined annually, however, and may be subject to change if the company fails to qualify under this special rule for any year in which a US Holder owned ordinary shares, ordinary ADSs, preference ADSs or PROs. If the company were to be treated as a PFIC for any taxable year during which a US Holder owns ordinary shares, ordinary ADSs, preference ADSs or PROs, US Holders would generally be subject to adverse US federal income tax consequences and certain reporting obligations. Holders should consult their own tax advisers as to the potential application of the PFIC rules to the ownership and disposition of the company's ordinary shares, ordinary ADSs, preference ADSs or PROs.
Information reporting and backup withholding
Payments on, and proceeds from the sale of, ordinary shares, ordinary ADSs, preference ADSs or PROs that are made within the United States or through certain U.S-related financial intermediaries may be subject to information reporting and backup withholding unless (i) the US Holder is an exempt recipient or (ii) in the case of backup withholding, the US Holder provides a correct taxpayer identification number and certifies that it is not subject to backup withholding. The amount of any backup withholding from a payment to a US Holder will be allowed as a credit against the US Holder’s US federal income tax liability and may entitle it to a refund, provided that the required information is timely furnished to the Internal Revenue Service.
Foreign financial assets reporting
Certain US Holders who are individuals (and under proposed regulations, certain entities) may be required to report information relating to the company’s securities, subject to certain exceptions (including an exception for securities held in accounts maintained by US financial institutions). US Holders are urged to consult their tax advisers regarding the application of these rules in the US Holders’ particular circumstances.
Exchange controls
The company has been advised that there are currently no UK laws, decrees or regulations which would prevent the import or export of capital, including the availability of cash or cash equivalents for use by the Group, or the remittance of dividends, interest or other payments to non-UK resident holders of the company's securities.
There are no restrictions under the Articles of Association of the company or under UK law, as currently in effect, which limit the right of non-UK resident owners to hold or, when entitled to vote, freely to vote the company's securities.
Memorandum and Articles of Association
The company’s Memorandum and Articles of Association as in effect at the date of this Annual Report are registered with the Registrar of Companies of Scotland.
The following information is a summary of certain terms of the company’s Memorandum of Association (the “Memorandum”) and Articles of Association (the “Articles”) as in effect at the date of this Annual Report and certain relevant provisions of the Companies Act 2006 (the “2006 Act”) where appropriate and as relevant to the holders of any class of share. The current Articles were adopted on 28 April 2010. The Articles were updated primarily to reflect the coming into force of the remaining provisions of the 2006 Act and the implementation of the Shareholder Rights Directive in the UK. An amendment was made to the Articles at a General Meeting held on 28 April 2010 in relation to the price at which certain classes of preference shares may be purchased.
A further amendment was made to the Articles at the Annual General Meeting held on 19 April 2011 to the effect that subject to existing class rights of shareholders, new preference shares can be issued with such rights and restrictions as the directors may determine. A further amendment was made to the Articles at the Annual General Meeting held on 30 May 2012 to include a new sub-article specifying the rights attaching to the Deferred shares arising as a result of share subdivision and consolidation.
The following summary description is qualified in its entirety by reference to the terms and provisions of the Memorandum and Articles (and, in the case of the summary description of the non-cumulative preference shares, the B Shares and the Dividend Access Share, by reference to the terms of issue of those shares determined by the Directors pursuant to the Articles prior to allotment). The Memorandum and Articles are registered with the Registrar of Companies of Scotland. Holders of any class of share are encouraged to read the full Memorandum and Articles, which have been filed as an exhibit to this Annual Report on Form 20-F.
Incorporation and registration
The company was incorporated and registered in Scotland under the Companies Act 1948 as a limited company on 25 March 1968 under the name National and Commercial Banking Group Limited. On 3 September 1979 the name was changed to The Royal Bank of Scotland Group Limited and on 10 March 1982, it changed its name to its present name and was registered under the Companies Acts 1948 to 1980 as a public company with limited liability. The company is registered under Company No. SC 45551.
Purpose and objects
The 2006 Act greatly reduces the constitutional significance of a company’s memorandum of association and provides that a memorandum of association will record only the names of the subscribers and the number of shares each subscriber has agreed to take in the company. The 2006 Act further states that, unless a company’s articles provide otherwise, a company’s objects are unrestricted and abolishes the need for companies to have objects clauses. The company removed its objects clause together with all other provisions of its memorandum of association which by virtue of the 2006 Act were treated as forming part of the company’s articles. The articles of association contain an express statement regarding the limited liability of the shareholders.
Directors
At each annual general meeting of the company, any Director appointed since the last annual general meeting and any Directors who were not appointed at one of the preceding two annual general meetings shall retire from office and may offer themselves for re-election by the members. Directors may be appointed by the company by ordinary resolution or by the Board. A director appointed by the Board holds office only until the next annual general meeting, whereupon he will be eligible for re-election. Unless and until otherwise determined by ordinary resolution, the directors (other than alternate directors) shall be not more than twenty five. There is no stipulation in the Articles regarding a minimum number of directors; under the 2006 Act, and in the absence of express provision, the minimum number is two.
Directors’ interests
A director shall not vote at a meeting of the Board or a Committee of the Board on any resolution of the Board concerning a matter in which he has an interest (otherwise than by virtue of his interest in shares, debentures or other securities of, or otherwise in or through, the company) which (together with any interest of any person connected with him) is, to his knowledge, material unless his interests arises only because the resolution relates to one or more of the following matters:
(i) the giving of any security or indemnity to him pursuant to the Articles or in respect of money lent, or obligations incurred, by him at the request of, or for the benefit of, the company or any of its subsidiary undertakings;
(ii) the giving of any security or indemnity to a third party in respect of a debt or obligation of the company or any of its subsidiary undertakings for which he has assumed responsibility (in whole or in part) under a guarantee or indemnity or by the giving of security;
(iii) a proposal concerning an offer of shares, debentures or other securities of the company, or any of its subsidiary undertakings, for subscription or purchase, in which offer he is, or may be, entitled to participate as a holder of securities or in the underwriting or sub-underwriting of which he is to participate;
(iv) any proposal concerning any other body corporate in which he is interested, directly or indirectly, whether as an officer or shareholder or otherwise, provided that he is not the holder of shares representing one per cent or more of any class of the equity share capital of such body corporate;
(v) any proposal concerning the adoption, modification or operation of a pension fund or retirement, death or disability benefits scheme or employees’ share scheme which relates both to directors and employees of the company or a subsidiary of the company and does not provide any privilege or advantage in respect of any director which it does not accord to the employees to which the fund or scheme relates;
(vi) a contract or arrangement for the benefit of the employees of the company or any of its subsidiary undertakings which does not accord him any privilege or advantage not generally accorded to the employees to whom the contract or arrangement relates; and
(vii) a proposal concerning any insurance which the company proposes to purchase and/or maintain for the benefit of any directors or for persons who include directors of the company.
Under the 2006 Act, a director must avoid a situation where he has, or can have, a direct or indirect interest that conflicts, or possibly may conflict, with the company’s interests. The 2006 Act allows directors of public companies, where appropriate, to authorise conflicts and potential conflicts where the articles of association contain a provision to this effect. The 2006 Act also allows the articles of association to contain other provisions for dealing with directors’ conflicts of interest to avoid a breach of duty.
Clause 92 of the Articles, gives the directors authority to authorise any matter which would or might otherwise constitute or give rise to a breach of the duty of a director under the 2006 Act to avoid a situation in which he has, or can have, a direct or indirect interest that conflicts, or possibly may conflict with the company.
Authorisation of any matter pursuant to Clause 92 must be approved in accordance with normal board procedures by directors who have no interest in the matter being considered. In taking the decision, the directors must act in a way they consider, in good faith, will be most likely to promote the company’s success.
Any authorisation of a matter may be given on or subject to such conditions or limitations as the directors determine, whether at the time of authorisation or subsequently, including providing for the exclusion of the interested directors from the receipt of information or participation in discussion relating to the matter authorised by the directors and providing that interested directors in receipt of confidential information from a third party are not obliged to disclose such information to the company or use the information in relation to the company’s affairs. Any authorisation may be terminated by the directors at any time.
A director is not, except as otherwise agreed by him, accountable to the company for any benefit which he, or a person connected with him, derives from any matter authorised by the directors and any contract, transaction or arrangement relating to such matter is not liable to be avoided on the grounds of such benefit.
Directors’ power to allot securities
In line with market practice, the Articles provide that the authority to allot shares and the disapplication of pre-emption rights will not be set out in the Articles, but subject to resolutions passed at the company’s annual general meeting to obtain these authorities on an annual basis.
Borrowing powers
The directors may exercise all the powers of the company to borrow money and to mortgage or charge its undertaking, property and uncalled capital and to issue debentures and other securities, whether outright or as collateral security for any debt, guarantee, liability or obligation of the company, or of any third party.
Qualifying shareholding
Directors are not required to hold any shares of the company by way of qualification.
Classes of shares
The company has issued and outstanding the following four general classes of shares, namely ordinary shares, preference shares, B Shares and a Dividend Access Share, to which the provisions set forth below apply. In addition, the company has as part of its share capital Additional Value Shares (“AVSs”). All of the issued AVSs were converted into non-voting deferred shares in December 2003. The terms of those AVSs are set out in Schedule 3 to the Articles. The terms of the issued B Shares (designated Series 1 Class B Shares) and the Dividend Access Share (designated a Series 1 Dividend Access Share) were determined by the directors pursuant to the Articles prior to the time of allotment, and apply as if they were set out in the Articles.
Dividends
General
Subject to the provisions of the 2006 Act and Clause 123 of the Articles, the company may, by ordinary resolution, declare dividends on ordinary shares save that no dividend shall be payable except out of profits available for distribution, or in excess of the amount recommended by the Board or in contravention of the special rights attaching to any share. Any dividend which has remained unclaimed for 12 years from the date of declaration shall be forfeited and shall revert to the company.
The company may cease sending dividend warrants and cheques by post or otherwise to a member if such instruments have been returned undelivered to, or left uncashed by, that member on at least two consecutive occasions, or, following one such occasion, reasonable enquiries have failed to establish any new address or account of the registered holder. The company may resume sending warrants and cheques if the holder requests such recommencement in writing.
Preference shares
Each cumulative preference share confers the right to a fixed cumulative preferential dividend payable half-yearly. Each non-cumulative preference share confers the right to a preferential dividend (not exceeding a specified amount) payable in the currency of the relevant share. The rate of such dividend and the date of payment thereof, together with the terms and conditions of the dividend, are as may be determined by the directors prior to allotment. Cumulative preference share dividends are paid in priority to any dividend on any other class of share.
The non-cumulative preference shares rank for dividend after the cumulative preference shares but rank pari passu with each other and any shares expressed to rank, in terms of participation in the profits of the company, in some or all respects pari passu therewith and otherwise in priority to dividends payable on the ordinary shares and any other share capital in the company.
The directors may resolve prior to the issue and allotment of any series of non-cumulative preference shares that full dividends in respect of a particular dividend payment date will not be declared and paid if, (i) in its sole and absolute discretion, the directors resolve prior to the relevant dividend payment date that such dividend (or part thereof) shall not be paid and/or (ii) in the opinion of the directors, payment of a dividend would cause a breach of the UK Financial Services Authority’s capital adequacy requirements applicable to the company or its subsidiaries, or subject to the next following paragraph, insufficient distributable profits of the company are available to cover the payment in full of all dividends after having paid any dividends payable on any of the cumulative preference shares.
If dividends will be paid but, in the opinion of the directors, insufficient distributable profits of the company are available to cover the payment in full of dividends after having paid any dividends payable on any of the cumulative preference shares, dividends will be declared by the directors, pro rata on the non-cumulative preference shares to the extent of the available distributable profits.
The non-cumulative preference shares will carry no further rights to participate in the profits of the company and if, and to the extent, any dividend or part of any dividend is on any occasion not paid for any of the reasons described above, holders of non-cumulative preference shares will have no claim in respect of such non-payment.
If any dividend is not payable for the reasons described in clause (ii) of the third paragraph of this subsection, the directors may pay a special dividend not exceeding US$0.01, £0.01 or €0.01 (depending on the currency of the relevant preference share) per share.
If the dividend payable on any series of non-cumulative preference shares on the most recent payment date is not paid in full, or if a sum is not set aside to provide for such payment in full, in either case for the reasons set forth in clause (ii) of the third paragraph of this subsection, no dividends may be declared on any other share capital of the company and no sum may be set aside for the payment of a dividend on any other share capital (in each case other than the cumulative preference shares), unless, on the date of declaration, an amount equal to the dividend payable in respect of the then current dividend period for such series of non-cumulative preference shares is set aside for payment in full on the next dividend payment date.
If any dividend payable on the non-cumulative preference shares is not paid in full or if a sum is not set aside to provide for such payment in full (in either case for the reasons set forth in clause (ii) of the third paragraph of this subsection), the company may not redeem or purchase or otherwise acquire any other share capital of the company and may not set aside any sum nor establish any sinking fund for its redemption, purchase or other such acquisition, until such time as dividends have been declared and paid in full in respect of successive dividend periods together aggregating not less than twelve months.
The non-payment of any dividend (in full or in part) by reason of the exercise of the directors’ discretion referred to in clause (i) of the third paragraph of this subsection, shall not prevent or restrict (a) the declaration and payment of dividends on any other series of non-cumulative preference shares or on any non-cumulative preference shares expressed to rank pari passu with the non-cumulative preference shares, (b) the setting aside of sums for the payment of such dividends, (c) except as set forth in the following paragraph, the redemption, purchase or other acquisition of shares in the company by the company, or (d) except as set forth in the following paragraph, the setting aside of sums, or the establishment of sinking funds, for any such redemption, purchase or other acquisition by the company.
If dividends are not declared and paid in full on any series of non-cumulative preference shares as a result of the directors’ discretion referred to in clause (i) of the third paragraph of this subsection, then the company may not redeem, purchase or otherwise acquire for any consideration any share capital ranking after such preference shares, and may not set aside any sum nor establish any sinking fund for the redemption, purchase or other acquisition thereof, until such time as the company has declared and paid in full dividends on such series of non-cumulative preference shares in respect of successive dividend periods together aggregating no less than twelve months. In addition, no dividend may be declared or paid on any of the company’s share capital ranking after such preference shares until the dividend in respect of a particular dividend payment date payable on the preference shares to which the directors’ discretion in clause (i) of the third paragraph of this subsection applies has been declared and paid in full.
With effect from 19 April 2011, subject to existing class rights of shareholders, new preference shares can be issued with such rights and restrictions as the directors may determine.
Non-voting deferred shares
The holders of non-voting deferred shares are not entitled to the payment of any dividend or other distribution.
B Shares
Prior to the occurrence of a Trigger Event (as defined below) in respect of any Series 1 Class B Shares, those Series 1 Class B Shares rank equally with the holders of ordinary shares in respect of any cash dividends, and each Series 1 Class B Share will entitle its holder to the same cash dividend as is (or may, at the election of a holder of the ordinary share, be) payable to the holder of one ordinary share, as adjusted from time to time to reflect any consolidation, reclassification or subdivision in relation to the ordinary shares.
If a Trigger Event has occurred in respect of any Series 1 Class B Shares, the Series 1 Class B Shares in respect of which the Trigger Event has occurred will rank pari passu with the holders of the ordinary shares in respect of any dividends paid on the ordinary shares. Each Series 1 Class B Share will entitle its holder to the same dividend as is (or may, at the election of a holder of an ordinary share, be) payable to the holder of one (as adjusted from time to time) ordinary share. If a bonus issue of fully paid ordinary shares is made to holders of ordinary shares in lieu of a dividend, a holder of a Series 1 Class B Share in respect of which the Trigger Event has occurred will be entitled to receive the same number of ordinary shares as is payable to the holder of one (as adjusted from time to time) ordinary share, save that if the issue of such ordinary share(s) to such holder would result in it holding directly or indirectly more than 75% of the total issued ordinary shares, then such holder will instead receive further Series 1 Class B Shares of the same value.
A Trigger Event occurs in relation to the Series 1 Class B Shares in issue at the relevant time, if the daily volume weighted average price of the company’s ordinary shares on the London Stock Exchange equals or exceeds £0.65 per ordinary share (subject to adjustment) for 20 or more complete dealing days in any period of 30 consecutive dealing days.
Dividend Access Share
Subject to the discretions, limitations and qualifications described in this subsection, non-cumulative dividends on the Series 1 Dividend Access Share will be payable from 22 December 2009 up to and including the Stop Date (if any). No dividends will be payable on the Series 1 Dividend Access Share after the Stop Date (if any). Up to and including the Stop Date, the company will pay dividends on the Series 1 Dividend Access Share when, as and if declared by its board of directors or a duly authorised committee of such board of directors (the ‘‘board of directors’’). Up to and including the Stop Date, subject to the discretions, limitations and qualifications described in this section, the Series 1 Dividend Access Share will entitle the holder to receive out of the distributable profits of the company a non-cumulative dividend at the rate described below (the ‘‘Dividend Access Share Dividend’’), in priority to the payment of any dividend to the holders of any class of ordinary share or Class B Share and pari passu in such regard with the holder of any other dividend access share then in issue.
The board of directors may in its sole and absolute discretion resolve that no Dividend Access Share Dividend shall be paid on a Dividend Access Share Dividend payment date.
The board of directors will, by 31 October in each financial year of the company, decide whether or not to pay an interim dividend on the ordinary shares or make an interim Ordinary Share Bonus Issue in that financial year. If it is decided that an interim dividend on the ordinary shares or an interim Ordinary Share Bonus Issue is to be paid or made in any financial year, the corresponding semi-annual (hereinafter referred to as ‘‘first semi-annual’’) Dividend Access Share Dividend or Bonus Issue on the Series 1 Dividend Access Share in the same financial year will be paid or made at the time set out below. The record date for any first semi-annual Dividend Access Share Dividend or Bonus Issue on the Series 1 Dividend Access Share will be the same as the record date for any interim dividend on the ordinary shares or interim Ordinary Share Bonus Issue in the relevant financial year or otherwise will be three business days before 31 October in each year. If paid or made, the first semi-annual Dividend Access Share Dividend or Bonus Issue on the Series 1 Dividend Access Share in a financial year will be paid or made on the same date that the corresponding interim dividend on the ordinary shares is paid or interim Ordinary Share Bonus Issue is made. If it is decided that no such interim dividend on the ordinary shares or interim Ordinary Share Bonus Issue will be paid or made in a financial year, the first semi-annual Dividend Access Share Dividend or Bonus Issue on the Series 1 Dividend Access Share in such financial year will, if to be paid or made, be so paid or made on 31 October in such financial year (commencing in 2010).
The Board of directors will, by 31 May in each financial year of the company, decide whether or not to recommend a dividend on the ordinary shares or make an Ordinary Share Bonus Issue which is expressed to be a final dividend for the immediately preceding financial year. If it is decided that such a dividend on the ordinary shares or Ordinary Share Bonus Issue is to be recommended and is subsequently approved by shareholders, the corresponding semi-annual (hereinafter referred to as ‘‘second semi-annual’’) Dividend Access Share Dividend or Bonus Issue on the Series 1 Dividend Access Share expressed to be for the corresponding period will be paid at the time set out below. The record date for any second semi-annual Dividend Access Share Dividend or Bonus Issue on the Series 1 Dividend Access Share will be the same as the record date for any final dividend on the ordinary shares or final Ordinary Share Bonus Issue for the relevant financial year or otherwise will be three business days before 31 May in each year. If paid or made, the second semi-annual Dividend Access Share Dividend or Bonus Issue on the Series 1 Dividend Access Share in a financial year will be paid or made on the same date that the corresponding final dividend on the ordinary shares is paid or final Ordinary Share Bonus Issue is made. If it is decided that no such final dividend on the ordinary shares or Ordinary Share Bonus Issue will be paid or made in any year (the ‘‘current year’’) for the immediately preceding financial year, any second semi-annual Dividend Access Share Dividend or Bonus Issue on the Series 1 Dividend Access Share expressed to be for the corresponding period will, if to be paid or made, be so paid or made on 31 May in the current year (commencing in 2010).
Any first semi-annual Dividend Access Share Dividend or second semi-annual Dividend Access Share Dividend will only be paid if (to the extent legally required) profits are available for distribution and are permitted by law to be distributed.
If paid or made, the first semi-annual Dividend Access Share Dividend on the Series 1 Dividend Access Share will be equal to an amount which, before taking account of any withholding or deduction required to be made on account of tax from such dividend and when added to any other cash dividends previously paid by the Company on the Series 1 Dividend Access Share since the Issue Date (before taking account of any withholding or deduction required to be made on account of tax from such cash dividends) equals the DAS Retirement Dividend Amount.
If paid or made, any second semi-annual Dividend Access Share Dividend on the Series 1 Dividend Access Share will be equivalent to (a) the greater of (i) on an annual basis, 7 per cent. of the aggregate issue price of all B Shares issued to HM Treasury, and (ii) 25 per cent. (subject to adjustment) of any cash dividend paid per Ordinary Shares, multiplied by the number of B Shares issued to HM Treasury, less (b) the fair market value of the aggregate amount of any dividends or distributions paid or made on any B Shares and/or on any Ordinary Shares issued on conversion of the B Shares, provided that any second semi-annual Dividend Access Share Dividend will not in any event exceed a sum which, before taking account of any withholding or deduction required to be made on account of tax from such dividend and when added to any other cash dividends previously paid by the Company on the Series 1 Dividend Access Share since the Issue Date (before taking account of any withholding or deduction required to be made on account of tax from such cash dividends), would exceed the DAS Retirement Dividend Amount.
In the event of a change in the frequency of dividend payments on the ordinary shares such that they are not paid semi-annually consistent with the payment of Dividend Access Share Dividends on the Series 1 Dividend Access Share, the company will make such changes to the Dividend Access Share Dividend payment arrangements described above as, following consultation with the Independent Financial Adviser (acting as an expert), it determines are fair and reasonable to take account of such changed frequency.
Non-cumulative dividends on the Series 1 Dividend Access Share will be payable in respect of the period up to and including the Stop Date (if any). After the Stop Date (if any), the right of the holder of the Series 1 Dividend Access Share to any dividends (including any Dividend Access Share Dividends) shall cease and the Series 1 Dividend Access Share shall, without the need for any consent or approval from the holder of the Series 1 Dividend Access Share or any other action by the Company or the holder of the Series 1 Dividend Access Share, be re-designated as a Single Series 1 Class B Share on terms identical to all other Series 1 Class B Shares in issue at the Stop Date.
Any unpaid portion of the DAS Retirement Dividend Amount will be subject to an increase of 5 per cent per annum, calculated on a daily accrual basis from 1 January 2016, if such portion has not been paid before 1 January 2016 and an increase of 10 per cent. per annum calculated on a daily accruals basis from 1 January 2021, on any part of the balance that has not been paid before 1 January 2021.
Bonus Issue of Series 1 Class B Shares on the Series 1 Dividend Access Share
If the board of directors decides to pay a Dividend Access Share Dividend and either (i) no dividend has been paid on the ordinary shares and/or distribution made thereon in respect of the corresponding period, or (ii) a dividend has been paid and/or a distribution has been made on the ordinary shares otherwise than in cash in respect of the corresponding period, the board of directors may in its discretion determine that such Dividend Access Share Dividend will be paid in whole or in part by the company issuing Series 1 Class B Shares, credited as fully paid, to the holder of the Series 1 Dividend Access Share. The number of such further Series 1 Class B Shares to be issued to the holder will be such number of Series 1 Class B Shares as is certified by an Independent Financial Adviser (acting as an expert) to be as nearly as possible equal to (but not greater than) the cash amount (disregarding any withholding or deduction required to be made on account of any tax and any associated tax credit) of such semi-annual Dividend Access Share Dividend or part thereof otherwise payable to such holder of the Series 1 Dividend Access Share, based on the fair market value of a Series 1 Class B Share at the time of such determination. A written opinion of such Independent Financial Adviser will be conclusive and binding on all parties, save in the case of manifest error. The additional Series 1 Class B Shares will rank pari passu in all respects with the fully paid Series 1 Class B Shares then in issue save only as regards participation in the relevant dividend.
Restrictions following non-payment of dividend
If any Dividend Access Share Dividend is not declared and paid in full in cash or otherwise, the company:
(i) may not, and will procure that no subsidiary undertaking of the company will, declare or pay dividends or other distributions on any Parity Securities (whether in cash or otherwise, and whether payable on the same date as the relevant Dividend Access Share Dividend or subsequently) or make any Ordinary Share Bonus Issue (whether to be made on the same date as the relevant Dividend Access Share Dividend or subsequently), and the company may not, and will procure that no subsidiary undertaking of the company shall, set aside any sum for the payment of these dividends or distributions; and
(ii) may not, and will procure that no subsidiary undertaking of the company will, redeem, purchase or otherwise acquire (whether on the same date as the relevant Dividend Access Share Dividend is payable or subsequently) for any consideration any of its Parity Securities or any depository or other receipts or certificates representing Parity Securities (other than any such purchases or acquisitions which are made in connection with any Employee Share Scheme (as defined in the terms of issue of the Series 1 Dividend Access Share) and (save as aforesaid) the company may not, and will procure that no subsidiary undertaking of the company shall, set aside any sum or establish any sinking fund (whether on the same date as the relevant Dividend Access Share Dividend is payable or subsequently) for the redemption, purchase or other acquisition of Parity Securities or any depositary or other receipts or certificates representing Parity Securities.
In each case until such time as Dividend Access Share Dividends are no longer payable (including as a result of the Stop Date occurring), or payment of Dividend Access Share Dividends in cash or otherwise has resumed in full, as the case may be.
Definitions in relation to this Dividend Access Share subsection
“Bonus Issue” means a bonus issue of Series 1 Class B Shares to the holder of the Series 1 Dividend Access Share.
“DAS Retirement Dividend Amount” means £1,500,000,000 (subject to increase).
“Independent Financial Adviser” means an independent financial institution appointed by the company and approved by HM Treasury.
“Ordinary Share Bonus Issue” means a bonus issue of fully paid ordinary shares to holders of ordinary shares in lieu of a dividend.
“Parity Securities” means ordinary shares, Series 1 Class B Shares and any other securities of the company or its subsidiary undertakings which rank pari passu with the ordinary shares, and/or Series 1 Class B Shares on a return of capital on a winding up, either issued by the company or issued by a subsidiary undertaking of the company with terms attached which benefit from a guarantee or support agreement entered into by the company which ranks pari passu with the ordinary shares, and/or Series 1 Class B Shares on a return of capital on a winding up.
“Series 1 Class B Dividend Trigger Event” means in relation to any Series 1 Class B Shares in issue at any time, the payment by the Company of total cash dividends on the Series 1 Dividend Access Share since the Issue Date in an aggregate amount (before taking account of any withholding or deduction required to be made on account of tax from such cash dividends) equal to the DAS Retirement Dividend Amount.
“Stop Date” means the date on which the Series 1 Class B Dividend Trigger Event occurs.
Distribution of assets on liquidation
Cumulative preference shares
In the event of a return of capital on a winding-up or otherwise, the holders of cumulative preference shares are entitled to receive out of t he surplus assets of the company available for distribution amongst the members (i) in priority to the holders of the non-cumulative preference shares and any other shares ranking pari passu therewith, the arrears of any fixed dividends including the amount of any dividend due for a payment after the date of commencement of any winding-up or liquidation but which is payable in respect of a half-year period ending on or before such date and (ii) pari passu with the holders of the non-cumulative preference shares and any other shares ranking pari passu therewith, the amount paid up or credited as paid up on such shares together with any premium.
Non-cumulative preference shares
Each non-cumulative preference share will confer on a winding up or liquidation (except (unless otherwise provided by the terms of issue) a redemption or purchase by the company of any shares in the capital of the company), the right to receive out of surplus assets of the company available for distribution amongst the members after payment of the arrears (if any) of the cumulative dividend on the cumulative preference shares and in priority to the holders of the ordinary shares, repayment of the amount paid up or credited as paid up on the non-cumulative preference shares together with any premium paid on issue pari passu with the holders of the cumulative preference shares and together with an amount equal to accrued and unpaid dividends.
Non-voting deferred shares
On a winding-up or other return of capital of the company, holders of non-voting deferred shares are entitled only to payment of the amounts paid up on the non-voting deferred shares, after repayment to the holders of ordinary shares of the nominal amount paid up on the ordinary shares held by them and payment of £100,000 on each ordinary share.
B Shares
On a winding-up, holders of the Series 1 Class B Shares will rank equally with the holders of the ordinary shares, the Series 1 Dividend Access Share and any other class of shares or securities of the company which rank equally with the Series 1 Class B Shares, the Series 1 Dividend Access Share or the ordinary shares on a winding-up or liquidation, and junior to all other shareholders and all creditors of the company. For these purposes, on a winding-up each holder of a Series 1 Class B Share will be deemed to hold one (as adjusted from time to time) ordinary share of the company for every Series 1 Class B Share held at the date of the commencement of such winding-up, and will be entitled to receive out of the surplus assets of the company remaining after payment of all prior-ranking claims, a sum equal to that payable to a holder of one (as adjusted) ordinary share in such event.
Dividend Access Share
On a winding-up, the holder of the Series 1 Dividend Access Share will rank equally with the holders of the ordinary shares, the Series 1 Class B Shares and any other class of shares or securities of the company which rank equally with the Series 1 Dividend Access Share, the Series 1 Class B Shares or the ordinary shares on a winding-up or liquidation, and junior to all other shareholders and all creditors of the company. For these purposes, on a winding-up the holder of the Series 1 Dividend Access Share will be deemed to hold one-tenth (as adjusted from time to time) of one ordinary share of the company, and will be entitled to receive out of the surplus assets of the company remaining after payment of all prior-ranking claims, a sum equal to that payable to a holder of one-tenth (as adjusted) of one ordinary share in such event.
General
On a winding-up of the company, the liquidator may, with the authority of any extraordinary resolution and any other sanction required by the Insolvency Act 1986 and subject to the rights attaching to any class of shares after payment of all liabilities, including the payment to holders of preference shares, divide amongst the members in specie or kind the whole or any part of the assets of the company or vest the whole or any part of the assets in trustees upon such trusts for the benefit of the members and may determine the scope and terms of those trusts. No member shall be compelled to accept any assets on which there is a liability.
Voting Rights
General
Subject to any rights or restrictions as to voting attaching to any shares or class of shares, on a show of hands every member who is present in person or by proxy at a general meeting shall have one vote (except that a proxy who is appointed by more than one member has one vote for and one vote against if the proxy has been instructed by one or more members to vote for the resolution and by one or more members to vote against the resolution) and on a poll every member present in person or by proxy shall have one vote for each 25 pence in nominal amount of shares held by him. No member shall, unless the directors otherwise determine, be entitled to vote at a general meeting or at a separate meeting of the holders of shares in the capital of the company, either in person or by proxy, in respect of any share held by him unless all monies presently payable by him in respect of that share have been paid. There is no obligation on the company to check and ensure that a proxy is voting at a general meeting in accordance with the voting directions provided by the appointing member. The chairman of a general meeting does not have a casting vote in the event of an equality of votes, as this is not permitted under the 2006 Act. The quorum required for a meeting of members is not less than five members present in person and entitled to vote. If a meeting is adjourned because of the lack of a quorum, the members present in person or by proxy and entitled to vote will constitute a quorum at the adjourned meeting.
Meetings are convened upon written notice of not less than 21 days in respect of annual general meetings of members and not less than 14 days in respect of other meetings of members subject to certain conditions. An adjourned meeting may be called at shorter notice than applied to the original meeting, but where a meeting is adjourned for lack of quorum only if the adjourned meeting is held at least ten days after the original meeting and does not include any new business.
Cumulative preference shares
At a general meeting of the company, every holder of a cumulative preference share who is present in person or by proxy shall be entitled to one vote on a show of hands and, on a poll, every person who is present in person or by proxy shall have one vote for each 25 pence in nominal amount of shares held. No member shall be entitled to vote any share in person or by proxy unless all moneys owed in respect of that share have been paid.
Non-cumulative preference shares
Holders of non-cumulative preference shares are not entitled to attend or vote at any general meeting unless the business of the meeting includes the consideration of a resolution for the winding-up of the company or any resolution directly varying or abrogating the rights attached to any such shares and then in such case only to speak to and vote upon any such resolution. However, holders have the right to vote in respect of any matter when the dividend payable on their shares has not been declared in full for such number of dividend periods as the directors shall determine prior to the allotment thereof. Whenever a holder is entitled to vote at a general meeting, on a show of hands every shareholder who is present in person has one vote and, on a poll, every such holder who is present in person or by proxy shall have such number of votes as may be determined by the directors prior to allotment.
Non-voting deferred shares
The holders of non-voting deferred shares are not entitled to receive notice of or to attend or vote at any general meeting of the company or otherwise receive any shareholder communication.
B Shares
Holders of the Series 1 Class B Shares are not entitled to attend or vote at any general meeting unless the business of the meeting includes the consideration of a resolution for the winding-up of the company or any resolution varying or abrogating the rights attached to any such shares and then in such case only to speak to and vote upon any such resolution. If entitled to vote, each holder is entitled on a poll to two votes for each Series 1 Class B Share held.
Dividend Access Share
The holder of the Series 1 Dividend Access Share is not entitled to attend or vote at any general meeting unless the business of the meeting includes the consideration of a resolution for the winding-up of the company or any resolution varying or abrogating the rights attached to such share and then in such case only to speak to and vote upon any such resolution. If entitled to vote, the holder is entitled on a poll to one vote.
Redemption
Except as set forth in the following paragraph, unless the directors determine, prior to allotment of any particular series of non-cumulative preference shares, that such series shall be non-redeemable, the preference shares will be redeemable at the option of the company on any date which (subject to certain exceptions described in the terms of such shares) falls no earlier than such date (if any) as may be fixed by the directors, prior to allotment of such shares. On redemption, there shall be paid on each non-cumulative preference share the aggregate of its nominal amount together with any premium paid on issue, where applicable a redemption premium and accruals of dividend.
If the company wishes to issue redeemable shares, the Directors are authorised to determine the terms and manner of redemption.
Purchase
General
Under the 2006 Act a company requires shareholder authority to purchase its own shares, consolidate and sub-divide its shares and reduce its share capital. Whenever non-cumulative preference shares are issued in the future the Articles have no restriction on the maximum purchase price payable by the company unless such restriction is expressly applied by the directors in relation to an issuance of non-cumulative preference shares.
Conversion rights
Convertible preference shares carry the right to convert into ordinary shares if they have not been the subject of a notice of redemption from the company, on or before a specified date determined by the directors. The right to convert will be exercisable by service of a conversion notice on the company within a specified period. The company will use reasonable endeavours to arrange the sale, on behalf of convertible preference shareholders who have submitted a conversion notice, of the ordinary shares which result from such conversion and to pay to them the proceeds of such sale so that they receive net proceeds equal to the nominal value of the convertible preference shares which were the subject of the conversion notice and any premium at which such shares were issued, provided that ordinary shares will not be sold at below a benchmark price (as determined prior to the issue of the relevant convertible preference shares by the directors).
B Shares
The B Shares are convertible into ordinary shares at HM Treasury’s option at an initial conversion price of £0.50 per share, subject to adjustment. In December 2003, following the payment of aggregate dividends of £1 in respect of each AVS, all issued and outstanding AVSs were de-listed from the Official List and from trading on the London Stock Exchange’s market for listed securities and converted into non-voting deferred shares of £0.01 each.
Changes in share capital and variation of rights
Subject to the provisions of the 2006 Act and without prejudice to any rights attached to any existing shares or class of shares, any share may be issued with such rights or restrictions as the company may by ordinary resolution determine or, subject to and in default of such determination, as the Board shall determine. Subject to the provisions of the 2006 Act, the company may issue shares which are, or at the option of the company or the holder are liable, to be redeemed. Subject to the provisions of the 2006 Act and the Articles, unissued shares are at the disposal of the Board.
The company may by ordinary resolution: increase its share capital; consolidate and divide all or any of its share capital into shares of larger amount than its existing shares; subject to the provisions of the 2006 Act, subdivide its shares, or any of them, into shares of smaller amount than is fixed by the Memorandum; or cancel any shares which have not been taken or agreed to be taken by any person and diminish the amount of its share capital by the amount of the shares so cancelled.
Subject to the provisions of the 2006 Act, if at any time the capital of the company is divided into different classes of shares, the rights attached to any class of shares may (unless further conditions are provided by the terms of issue of the shares of that class) be varied or abrogated, whether or not the company is being wound up, either with the consent in writing of the holders of three-quarters in-nominal value of the issued shares of the class or with the sanction of an extraordinary resolution passed at a separate general meeting of holders of the shares of the class (but not otherwise). To any such separate general meeting the provision of the Articles relating to general meeting s will apply, save that:
(i) if at any adjourned meeting of such holders a quorum as defined above is not present, two people who hold shares of the class, or their proxies, are a quorum; and
(ii) any such holder present in person or by proxy may demand a poll
The rights attaching to any class of shares having preferential rights are not, unless otherwise expressly provided by the terms of issue thereof, deemed to be varied by the creation or issue of further shares ranking, as regards participation in t he profits or assets of the company, pari passu therewith, but in no respect in priority thereto.
Disclosure of interests in shares
The 2006 Act gives the company the power to require persons who it believes to be, or have been within the previous three years, interested in its shares, to disclose prescribed particulars of those interests. Failure to supply the information or supplying a statement which is materially false may lead to the Board imposing restrictions upon the relevant shares. The restrictions available are the suspension of voting or other rights conferred by membership in relation to meetings of the company in respect of the relevant shares and, additionally, in the case of a shareholding representing at least 0.25 per cent of the class of shares concerned, the withholding of payment of dividends on, and the restriction of transfers of, the relevant shares.
Limitations on rights to own share
There are no limitations imposed by UK law or the Memorandum and Articles on the right of non-residents or foreign persons to hold or vote the company's shares other than the limitations that would generally apply to all of the company's shareholders.
Members resident abroad
Members with registered addresses outside the United Kingdom are not entitled to receive notices from the company unless they have given the company an address within the United Kingdom at which such notices may be served.
Sending notices and other documents to shareholders
The company may communicate with members by electronic and/or website communications. A member whose registered address is not within the United Kingdom shall not be entitled to receive any notice from the Company unless he gives the Company a postal address within the United Kingdom at which notices may be given to him.
Documents on display
Documents concerning the company may be inspected at 36 St Andrew Square, Edinburgh, EH2 2YB.
Executive directors’ service contracts and copies of directors’ indemnities granted by the company in terms of section 236 of the Companies Act 2006 may be inspected at the company’s office at Gogarburn, Edinburgh, EH12 1HQ (telephone 0131 626 4114).
In addition, we file reports and other information with the SEC. You can read and copy these reports and other information at the SEC’s Public Reference Room at 100 F Street, N.E., Washington, D.C. 20549. You can call the SEC at 1-800-SEC-0330 for further information on the Public Reference Room or contact the offices of The New York Stock Exchange, on which certain of our securities are listed, at 20 Broad Street, New York, New York 10005. The SEC also maintains a website at www.sec.gov which contains in electronic form each of the reports and other information that we have filed electronically with the SEC.
Incorporation and registration
The company was incorporated and registered in Scotland under the Companies Act 1948 as a limited company on 25 March 1968 under the name National and Commercial Banking Group Limited, and changed its name to The Royal Bank of Scotland Group Limited on 3 September 1979. On 10 March 1982 it was re-registered under the Companies Acts 1948 to 1980 as a public company with limited liability. The company is registered under Company No. SC45551.
Abbreviations and acronyms
| ABS | Asset-Backed Securities |
| AFS | Available-For-Sale |
| AQ | Asset Quality |
| AT1 | Additional Tier 1 |
| BCBS | Basel Committee on Banking Supervision |
| C&RA | Conduct & Regulatory Affairs |
| CD | Certificate Of Deposit |
| CDO | Collateralised Debt Obligation |
| CDPC | Credit Derivative Product Company |
| CDS | Credit Default Swap |
| CET1 | Common Equity Tier 1 |
| CFG | Citizens Financial Group Inc |
| CIB | Corporate & Institutional Banking |
| CLO | Collateralised Loan Obligation |
| CMBS | Commercial mortgage-backed securities |
| CPB | Commercial & Private Banking |
| CRA | Credit Risk Assets |
| CRC | Credit Risk Committee |
| CRD | Capital Requirements Directive |
| CRE | Commercial Real Estate |
| CRO | Chief Risk Officer |
| CRR | Capital Requirements Regulation |
| CVA | Credit Valuation Adjustment |
| DFV | Designated as at Fair Value through profit or loss |
| EAD | Exposure At Default |
| EBA | European Banking Authority |
| EC | European Commission |
| EMEA | Europe, the Middle East and Africa |
| ERF | Executive Risk Forum |
| EU | European Union |
| FCA | Financial Conduct Authority |
| FI | Financial Institution |
| FINRA | Financial Industry Regulatory Authority |
| FLB3 | Fully Loaded Basel III |
| FSA | Financial Services Authority |
| FSCS | Financial Services Compensation Scheme |
| FVTPL | Fair Value Through Profit or Loss |
| G-SIB | Global-Systemically Important Bank |
| GCCO | Group Chief Credit Officer |
| GDP | Gross Domestic Product |
| HFT | Held-For-Trading |
| HMT | HM Treasury |
| HTM | Held-to-maturity |
| IAS | International Accounting Standards |
| IASB | International Accounting Standards Board |
| ICAAP | Internal Capital Adequacy Assessment Process |
| IFRS | International Financial Reporting Standards |
| IOC | Integrated Oil Companies |
| IPV | Independent Price Verification |
| IRC | Incremental Risk Charge |
| ISDA | International Swaps and Derivatives Association |
| LAR | Loans and Receivables |
| LCR | Liquidity coverage ratio |
| LGD | Loss Given Default |
| LIBOR | London Interbank Offered Rate |
| LTIP | Long Term Incentive Plan |
| LTV | Loan-To-Value |
| MBS | Mortgage-Backed Securities |
| MDA | Maximum Distributable Amount |
| MIRA | Material Integrated Risk Assessment |
| NI | Northern Ireland |
| NOC | National Oil Companies |
| NSFR | Net Stable Funding Ratio |
| NYSE | New York Stock Exchange |
| OFT | Office of Fair Trading |
| PBB | Personal & Business Banking |
| PD | Probability of Default |
| PFIC | Passive Foreign Investment Company |
| PPI | Payment Protection Insurance |
| PRA | Prudential Regulation Authority |
| RBSG | The Royal Bank of Scotland Group plc |
| RCR | RBS Capital Resolution |
| REIL | Risk Elements In Lending |
| RFS | RFS Holdings B.V. |
| RMBS | Residential Mortgage-Backed Securities |
| RNIV | Risks Not In VaR |
| ROI | Republic of Ireland |
| RoW | Rest of the World |
| RWA | Risk-Weighted Asset |
| SE | Structured Entity |
| SEC | US Securities and Exchange Commission |
| SEPA | Single European Payments Area |
| SFT | Securities Financing Transaction |
| SME | Small and Medium-sized Enterprise |
| SVaR | Stressed Value-at-Risk |
| TLAC | Total Loss Absorbing Capacity |
| TSR | Total Shareholder Return |
| UK | United Kingdom |
| UKFI | UK Financial Investments Limited |
| US/USA | United States of America |
| VaR | Value-at-Risk |
Arrears - the aggregate of contractual payments due on a debt that have not been met by the borrower. A loan or other financial asset is said to be 'in arrears' when payments have not been made.
Asset-backed commercial paper (ABCP) - a form of asset-backed security generally issued by a commercial paper conduit.
Asset-backed securities (ABS) - securities that represent interests in specific portfolios of assets. They are issued by a structured entity following a securitisation. The underlying portfolios commonly comprise residential or commercial mortgages but can include any class of asset that yields predictable cash flows. Payments on the securities depend primarily on the cash flows generated by the assets in the underlying pool and other rights designed to assure timely payment, such as guarantees or other credit enhancements. Collateralised debt obligations, collateralised loan obligations, commercial mortgage backed securities and residential mortgage backed securities are all types of ABS.
Asset quality (AQ) band - probability of default banding for all counterparties on a scale of 1 to 10.
Assets under management - assets managed by the Group on behalf of clients.
Back-testing - statistical techniques that assess the performance of a model, and how that model would have performed had it been applied in the past.
Basel II - the capital adequacy framework issued by the Basel Committee on Banking Supervision in June 2006 in the form of the ‘International Convergence of Capital Measurement and Capital Standards’.
Basel III - in December 2010, the Basel Committee on Banking Supervision issued final rules: ‘Basel III: A global regulatory framework for more resilient banks and banking systems’ and ‘Basel III: International framework for liquidity risk measurement, standards and monitoring’.
Basis point - one hundredth of a per cent i.e. 0.01 per cent. 100 basis points is 1 per cent. Used when quoting movements in interest rates or yields on securities.
Bear steepener - a steepening of the yield curve caused by long-term rates increasing faster than short term rates.
BIPRU - the prudential sourcebook for banks, building societies and investment firms. The part of the Financial Conduct Authority (FCA) Handbook that sets out detailed prudential requirements for the banks that they regulate.
Bull flattener - a flattening of the yield curve in which long term rates are decreasing faster than short term rates.
Buy-to-let mortgages - mortgages to customers for the purchase of residential property as a rental investment.
Capital requirements regulation (CRR) - see CRD IV.
Central counterparty (CCP) - an intermediary between a buyer and a seller (generally a clearing house).
Certificates of deposit (CDs) - bearer negotiable instruments acknowledging the receipt of a fixed term deposit at a specified interest rate.
Collateralised debt obligations (CDOs) - asset-backed securities for which the underlying asset portfolios are debt obligations: either bonds (collateralised bond obligations) or loans (collateralised loan obligations) or both. The credit exposure underlying synthetic CDOs derives from credit default swaps. The CDOs issued by an individual vehicle are usually divided in different tranches: senior tranches (rated AAA), mezzanine tranches (AA to BB), and equity tranches (unrated). Losses are borne first by the equity securities, next by the junior securities, and finally by the senior securities; junior tranches offer higher coupons (interest payments) to compensate for their increased risk.
Collateralised loan obligations (CLOs) - asset-backed securities for which the underlying asset portfolios are loans, often leveraged loans.
Collectively assessed loan impairment provisions - impairment loss provisions in respect of impaired loans, such as credit cards or personal loans, that are below individual assessment thresholds. Such provisions are established on a portfolio basis, taking account of the level of arrears, security, past loss experience, credit scores and defaults based on portfolio trends.
Commercial mortgage backed securities (CMBS) - asset-backed securities for which the underlying asset portfolios are loans secured on commercial real estate.
Commercial paper (CP) - unsecured obligations issued by a corporate or a bank directly or secured obligations (asset-backed CP), often issued through a commercial paper conduit, to fund working capital. Maturities typically range from two to 270 days. However, the depth and reliability of some CP markets means that issuers can repeatedly roll over CP issuance and effectively achieve longer term funding. CP is issued in a wide range of denominations and can be either discounted or interest-bearing.
Commercial paper conduit - a structured entity that issues commercial paper and uses the proceeds to purchase or fund a pool of assets. The commercial paper is secured on the assets and is redeemed either by further commercial paper issuance, repayment of assets or liquidity drawings.
Commercial real estate - freehold and leasehold properties used for business activities. Commercial real estate includes office buildings, industrial property, medical centres, hotels, retail stores, shopping centres, agricultural land and buildings, warehouses, garages etc.
Common Equity Tier 1 capital - the highest quality form of regulatory capital under Basel III comprising common shares issued and related share premium, retained earnings and other reserves excluding the cash flow hedging reserve, less specified regulatory adjustments.
Constant currency - reported results for the current reporting period are compared to results for comparative periods retranslated at exchange rates for the current period.
Contractual maturity - the date in the terms of a financial instrument on which the last payment or receipt under the contract is due for settlement.
Core Tier 1 capital - under Basel II called-up share capital and eligible reserves plus equity non-controlling interests, less intangible assets and other regulatory deductions.
Core Tier 1 capital ratio - Core Tier 1 capital as a percentage of risk-weighted assets.
Cost:income ratio - operating expenses as a percentage of total income.
Counterparty credit risk - the risk that a counterparty defaults before the maturity of a derivative or sale and repurchase contract. In contrast to non-counterparty credit risk, the exposure to counterparty credit risk varies by reference to a market factor (e.g. interest rate, exchange rate, asset price).
Coverage ratio - impairment provisions as a percentage of impaired loans.
Covered bonds - debt securities backed by a portfolio of mortgages that are segregated from the issuer's other assets solely for the benefit of the holders of the covered bonds.
CRD IV - the European Union has implemented the Basel III capital proposals through the Capital Requirements Regulation (CRR) and the Capital Requirements Directive (CRD), collectively known as CRD IV. CRD IV was implemented on 1 January 2014. The European Banking Authority’s technical standards are still to be finalised through adoption by the European Commission and implemented within the UK.
Credit default swap (CDS) - a contract where the protection seller receives premium or interest-related payments in return for contracting to make payments to the protection buyer upon a defined credit event in relation to a reference financial asset or portfolio of financial assets. Credit events usually include bankruptcy, payment default and rating downgrades.
Credit derivative product company (CDPC) - a structured entity that sells credit protection under credit default swaps or certain approved forms of insurance policies. Sometimes they can also buy credit protection. CDPCs are similar to monoline insurers. However, unlike monoline insurers, they are not regulated as insurers.
Credit derivatives - contractual agreements that provide protection against a credit event on one or more reference entities or financial assets. The nature of a credit event is established by the protection buyer and protection seller at the inception of a transaction, and such events include bankruptcy, insolvency or failure to meet payment obligations when due. The buyer of the credit derivative pays a periodic fee in return for a payment by the protection seller upon the occurrence, if any, of a credit event. Credit derivatives include credit default swaps, total return swaps and credit swap options.
Credit enhancements - techniques that improve the credit standing of financial obligations; generally those issued by a structured entity in a securitisation. External credit enhancements include financial guarantees and letters of credit from third party providers. Internal enhancements include excess spread - the difference between the interest rate received on the underlying portfolio and the coupon on the issued securities; and over-collateralisation - on securitisation, the value of the underlying portfolio is greater than the securities issued.
Credit grade - a rating that represents an assessment of the creditworthiness of a customer. It is a point on a scale representing the probability of default of a customer.
Credit risk - the risk of financial loss due to the failure of a customer, or counterparty, to meet its obligation to settle outstanding amounts.
Credit risk mitigation - reducing the credit risk of an exposure by application of techniques such as netting, collateral, guarantees and credit derivatives.
Credit valuation adjustment (CVA) - the CVA is the difference between the risk-free value of a portfolio of trades and its market value, taking into account the counterparty’s risk of default. It represents the market value of counterparty credit risk, or an estimate of the adjustment to fair value that a market participant would make to reflect the creditworthiness of its counterparty.
Currency swap - an arrangement in which two parties exchange specific principal amounts of different currencies at inception and subsequently interest payments on the principal amounts. Often, one party will pay a fixed rate of interest, while the other will pay a floating rate (though there are also fixed-fixed and floating-floating arrangements). At the maturity of the swap, the principal amounts are usually re-exchanged.
Customer accounts - money deposited with the Group by counterparties other than banks and classified as liabilities. They include demand, savings and time deposits; securities sold under repurchase agreements; and other short term deposits. Deposits received from banks are classified as deposits by banks.
Debit valuation adjustment (DVA) - an adjustment made by an entity to the valuation of OTC derivative liabilities to reflect within fair value the entity's own credit risk.
Debt securities - transferable instruments creating or acknowledging indebtedness. They include debentures, bonds, certificates of deposit, notes and commercial paper. The holder of a debt security is typically entitled to the payment of principal and interest, together with other contractual rights under the terms of the issue, such as the right to receive certain information. Debt securities are generally issued for a fixed term and redeemable by the issuer at the end of that term. Debt securities can be secured or unsecured.
Debt securities in issue - unsubordinated debt securities issued by the Group. They include commercial paper, certificates of deposit, bonds and medium-term notes.
Deferred tax asset - income taxes recoverable in future periods as a result of deductible temporary differences (temporary differences between the accounting and tax base of an asset or liability that will result in tax deductible amounts in future periods) and the carry-forward of tax losses and unused tax credits.
Deferred tax liability - income taxes payable in future periods as a result of taxable temporary differences (temporary differences between the accounting and tax base of an asset or liability that will result in taxable amounts in future periods).
Defined benefit obligation - the present value of expected future payments required to settle the obligations of a defined benefit plan resulting from employee service.
Defined benefit plan/scheme - pension or other post-retirement benefit plan other than a defined contribution plan.
Defined contribution plan/scheme - pension or other post-retirement benefit plan where the employer's obligation is limited to its contributions to the fund.
Deposits by banks - money deposited with the Group by banks and recorded as liabilities. They include money-market deposits, securities sold under repurchase agreements, federal funds purchased and other short term deposits. Deposits received from customers are recorded as customer accounts.
Derivative - a contract or agreement whose value changes with changes in an underlying index such as interest rates, foreign exchange rates, share prices or indices and which requires no initial investment or an initial investment that is smaller than would be required for other types of contracts with a similar response to market factors. The principal types of derivatives are: swaps, forwards, futures and options.
Discontinued operation - a component of the Group that either has been disposed of or is classified as held for sale. A discontinued operation is either: a separate major line of business or geographical area of operations or part of a single co-ordinated plan to dispose of a separate major line of business or geographical area of operations; or a subsidiary acquired exclusively with a view to resale.
Economic capital - an internal measure of the capital required by the Group to support the risks to which it is exposed.
Economic profit - the difference between the return on shareholders funds and the cost of that capital. Economic profit is usually expressed as a percentage.
Effective interest rate method - the effective interest method is a method of calculating the amortised cost of a financial asset or financial liability (or group of financial assets or liabilities) and of allocating the interest income or interest expense over the expected life of the asset or liability. The effective interest rate is the rate that exactly discounts estimated future cash flows to the instrument's initial carrying amount. Calculation of the effective interest rate takes into account fees payable or receivable that are an integral part of the instrument's yield, premiums or discounts on acquisition or issue, early redemption fees and transaction costs. All contractual terms of a financial instrument are considered when estimating future cash flows.
Encumbrance - an interest in an asset held by another party. Encumbrance usually impacts the transferability of the asset and can restrict its free use until the encumbrance is removed.
Equity risk - the risk of changes in the market price of the equities or equity instruments arising from positions, either long or short, in equities or equity-based financial instruments.
Eurozone - the 17 European Union countries that have adopted the euro: Austria, Belgium, Cyprus, Estonia, Finland, France, Germany, Greece, Ireland, Italy, Luxembourg, Malta, the Netherlands, Portugal, Slovakia, Slovenia and Spain.
Expected loss (EL) - expected loss represents the anticipated loss on an exposure over one year. It is determined by multiplying probability of default, loss given default and exposure at default and can be calculated at individual, credit facility, customer or portfolio level.
Exposure - a claim, contingent claim or position which carries a risk of financial loss.
Exposure at default (EAD) - an estimate of the extent to which the bank will be exposed under a specific facility, in the event of the default of a counterparty.
FICO score - a credit score calculated using proprietary software developed by the Fair Isaac Corporation in the US from a consumer's credit profile. The scores range between 300 and 850 and are used in credit decisions made by banks and other providers of credit.
Financial Conduct Authority (FCA) - the statutory body responsible for conduct of business regulation and supervision of UK authorised firms from 1 April 2013. The FCA also has responsibility for the prudential regulation of firms that do not fall within the PRA’s scope.
Financial Services Compensation Scheme (FSCS) - the UK's statutory fund of last resort for customers of authorised financial services firms. It pays compensation if a firm is unable to meet its obligations. The FSCS funds compensation for customers by raising management expenses levies and compensation levies on the financial services industry.
First/second lien - a lien is a charge such as a mortgage held by one party, over property owned by a second party, as security for payment of some debt, obligation, or duty owed by that second party. The holder of a first lien takes precedence over all other encumbrances on that property i.e. second and subsequent liens.
Forbearance - forbearance takes place when a concession is made on the contractual terms of a loan in response to a customer’s financial difficulties.
Forward contract - a contract to buy (or sell) a specified amount of a physical or financial commodity, at an agreed price, at an agreed future date.
Fully loaded Basel III basis - capital ratios based on the rules that will apply at the end of the Basel III transition period.
Futures contract - a contract which provides for the future delivery (or acceptance of delivery) of some type of financial instrument or commodity under terms established at the outset. Futures differ from forward contracts in that they are traded on recognised exchanges and rarely result in actual delivery; most contracts are closed out prior to maturity by acquisition of an offsetting position.
G10 - the Group of Ten comprises the eleven industrial countries (Belgium, Canada, France, Germany, Italy, Japan, the Netherlands, Sweden, Switzerland, the United Kingdom and the United States) that have agreed to participate in the International Monetary Fund’s (IMF’s) General Arrangements to Borrow.
Government Sponsored Enterprises (GSEs) - a group of financial services corporations created by the US Congress. Their function is to improve the efficiency of capital markets and to overcome statutory and other market imperfections which otherwise prevent funds from moving easily from suppliers of funds to areas of high loan demand. They include the Federal Home Loan Mortgage Corporation and the Federal National Mortgage Association.
Gross yield - the interest rate earned on average interest-earning assets i.e. interest income divided by average interest-earning assets.
Haircut - a downward adjustment to collateral value to reflect its nature, any currency or maturity mismatches between a credit risk mitigant and the underlying exposure to which it is being applied.
Hedge funds - pooled investment vehicles that are not widely available to the public; their assets are managed by professional asset managers who participate in the performance of the fund.
Impaired loans - all loans for which an impairment provision has been established; for collectively assessed loans, impairment loss provisions are not allocated to individual loans and the entire portfolio is included in impaired loans.
Impairment allowance - see Loan impairment provisions.
Impairment losses - (a) for impaired financial assets measured at amortised cost, impairment losses - the difference between carrying value and the present value of estimated future cash flows discounted at the asset's original effective interest rate - are recognised in profit or loss and the carrying amount of the financial asset reduced by establishing a provision (allowance) (b) for impaired available-for-sale financial assets, the cumulative loss that had been recognised directly in equity is removed from equity and recognised in profit or loss as an impairment loss.
Individual liquidity guidance (ILG) - guidance from the PRA on a firm's required quantity of liquidity resources and funding profile.
Individually assessed loan impairment provisions - impairment loss provisions for individually significant impaired loans assessed on a case-by-case basis, taking into account the financial condition of the counterparty and any guarantor and the realisable value of any collateral held.
Interest rate swap - a contract under which two counterparties agree to exchange periodic interest payments on a predetermined monetary principal, the notional amount.
Interest spread - the difference between the gross yield and the interest rate paid on average interest-bearing liabilities.
Internal Capital Adequacy Assessment Process (ICAAP) - the Group’s own assessment, as part of Basel II requirements, of its risks, how it intends to mitigate those risks and how much current and future capital is necessary having considered other mitigating factors.
Internal funding of trading business - the internal funding of the trading book comprises net banking book financial liabilities that fund financial assets in the Group’s trading portfolios. Interest payable on these financial liabilities is charged to the trading book.
International Accounting Standards Board (IASB) - the independent standard-setting body of the IFRS Foundation. Its members are responsible for the development and publication of International Financial Reporting Standards (IFRSs) and for approving Interpretations of IFRS as developed by the IFRS Interpretations Committee.
International Swaps and Derivatives Association (ISDA) master agreement - a standardised contract developed by ISDA for bilateral derivatives transactions. The contract grants legal rights of set-off for derivative transactions with the same counterparty.
Investment grade - generally represents a risk profile similar to a rating of BBB-/Baa3 or better, as defined by independent rating agencies.
Key management - members of the RBS Executive Committee.
Latent loss provisions - loan impairment provisions held against impairments in the performing loan portfolio that have been incurred as a result of events occurring before the balance sheet date but which have not been identified as impaired at the balance sheet date.
Level 1 - level 1 fair value measurements are derived from quoted prices (unadjusted) in active markets for identical assets or liabilities that the entity can access at the measurement date.
Level 2 - level 2 fair value measurements use inputs, other than quoted prices included within level 1, that are observable for the asset or liability, either directly or indirectly.
Level 3 - level 3 fair value measurements use one or more unobservable inputs for the asset or liability.
Leverage ratio - a measure prescribed under Basel III. It is the ratio of Tier 1 capital to total exposures. Total exposures include on-balance sheet items, off-balance sheet items and derivatives, and generally follow the accounting measure of exposure.
Leveraged finance - funding (leveraged finance) provided to a business resulting in an overall level of debt in relation to cash flow that exceeds that which would be considered usual for the business or for the industry in which it operates. Leveraged finance is commonly employed to achieve a specific, often temporary, objective: to make an acquisition, to effect a buy-out or to repurchase shares.
Liquidity and funding risk - the risk that the Group is unable to meet its financial liabilities when they fall due.
Liquidity coverage ratio (LCR) - the ratio of the stock of high quality liquid assets to expected net cash outflows over the following 30 days. High quality liquid assets should be unencumbered, liquid in markets during a time of stress and, ideally, central bank eligible.
Loan:deposit ratio - the ratio of loans and advances to customers net of provision for impairment losses and excluding reverse repurchase agreements to customer deposits excluding repurchase agreements.
Loan impairment provisions - loan impairment provisions are established to recognise incurred impairment losses on a portfolio of loans classified as loans and receivables and carried at amortised cost. It has three components: individually assessed loan impairment provisions, collectively assessed loan impairment provisions and latent loss provisions.
Loan-to-value ratio - the amount of a secured loan as a percentage of the appraised value of the security e.g. the outstanding amount of a mortgage loan as a percentage of the property's value.
London Interbank Offered Rate (LIBOR) - the benchmark interest rate at which banks can borrow funds from other banks in the London interbank market.
Loss given default (LGD) - an estimate of the amount that will not be recovered by the Group in the event of default, plus the cost of debt collection activities and the delay in cash recovery.
Market risk - the risk of loss arising from fluctuations in interest rates, credit spreads, foreign currency rates, equity prices, commodity prices and other risk-related factors such as market volatilities that may lead to a reduction in earnings, economic value or both.
Master netting agreement - an agreement between two counterparties that have multiple derivative contracts with each other that provides for the net settlement of all contracts through a single payment, in a single currency, in the event of default on, or termination of, any one contract.
Maximum distributable amount (MDA) - a restriction on distributions which may be made by a bank which does not meet the combined buffer requirements as set out in the PRA Supervisory Statement SS6/14 ‘Implementing CRD IV: capital buffers’.
Medium term notes (MTNs) - debt securities usually with a maturity of five to ten years, but the term may be less than one year or as long as 50 years. They can be issued on a fixed or floating coupon basis or with an exotic coupon; with a fixed maturity date (non-callable) or with embedded call or put options or early repayment triggers. MTNs are generally issued as senior unsecured debt.
Monoline insurers (monolines) - entities that specialise in providing credit protection against the notional and interest cash flows due to the holders of debt instruments in the event of default. This protection is typically in the form of derivatives such as credit default swaps.
Mortgage-backed securities - asset-backed securities for which the underlying asset portfolios are loans secured on property. See Residential mortgage backed securities and Commercial mortgage backed securities.
Mortgage servicing rights - the rights of a mortgage servicer to collect mortgage payments and forward them, after deducting a fee, to the mortgage lender.
Negative equity mortgages - mortgages where the value of the property mortgaged is less than the outstanding balance on the loan.
Net interest income - the difference between interest receivable on financial assets classified as loans and receivables or available-for-sale and interest payable on financial liabilities carried at amortised cost.
Net interest margin - net interest income as a percentage of average interest-earning assets.
Net stable funding ratio (NSFR) - the ratio of available stable funding to required stable funding over a one year time horizon, assuming a stressed scenario. Available stable funding includes items such as equity capital, preferred stock with a maturity of over one year and liabilities with an assessed maturity of over one year.
Non-performing loans - loans classified as Risk elements in lending and potential problem loans. They have a 100% probability of default and have been assigned an AQ10 internal credit grade.
Operational risk - the risk of loss resulting from inadequate or failed processes, people, systems or from external events.
Option - an option is a contract that gives the holder the right but not the obligation to buy (or sell) a specified amount of the underlying physical or financial commodity, at a specific price, at an agreed date or over an agreed period. Options can be exchange-traded or traded over-the-counter.
Over-the-counter (OTC) derivatives - derivatives with tailored terms and conditions negotiated bilaterally, in contrast to exchange traded derivatives that have standardised terms and conditions.
Own credit adjustment (OCA) - the effect of the Group’s own credit standing on the fair value of financial liabilities.
Past due - a financial asset such as a loan is past due when the counterparty has failed to make a payment when contractually due.
Pillar 1 - the part of Basel II that sets out the process by which regulatory capital requirements should be calculated for credit, market and operational risk.
Pillar 2 - Pillar 2 is intended to ensure that firms have adequate capital to support all the relevant risks in their business and is divided into capital held against risks not captured or not fully captured by the Pillar 1 regulations (Pillar 2A) and risks to which a firm may become exposed over a forward-looking planning horizon (Pillar 2B). Capital held under Pillar 2A, in addition to the Pillar 1 requirements, is the minimum level of regulatory capital a bank should maintain at all times to cover adequately the risks to which it is or might be exposed, and to comply with the overall financial adequacy rules. Pillar 2B is a capital buffer which helps to ensure that a bank can continue to meet minimum requirements during a stressed period, and is determined by the PRA evaluating the risks to which the firm may become exposed (e.g. due to changes to the economic environment) during the supervisory review and evaluation process. All firms will be subject to a PRA buffer assessment and the PRA will set a PRA buffer only if it judges that the CRD IV buffers are inadequate for a particular firm given its vulnerability in a stress scenario, or where the PRA has identified risk management and governance failings, which the CRD IV buffers are not intended to address.
Pillar 3 - the part of Basel II that sets out the information banks must disclose about their risks, the amount of capital required to absorb them, and their approach to risk management. The aim is to strengthen market discipline.
Position risk requirement - a capital requirement applied to a position treated under BIPRU 7 (Market risk) as part of the calculation of the market risk capital requirement.
Potential future exposure - is a measure of counterparty risk/credit risk. It is calculated by evaluating existing trades done against the possible market prices in future during the lifetime of the transactions.
Potential problem loans (PPL) - loans for which an impairment event has taken place but no impairment loss is expected. This category is used for advances which are not past due 90 days or revolving credit facilities where identification as 90 days overdue is not feasible.
Private equity investments - equity investments in operating companies not quoted on a public exchange. Capital for private equity investment is raised from retail or institutional investors and used to fund investment strategies such as leveraged buyouts, venture capital, growth capital, distressed investments and mezzanine capital.
Probability of default (PD) - the likelihood that a customer will fail to make full and timely repayment of credit obligations over a one year time horizon.
Prudential Regulation Authority (PRA) - the statutory body responsible, from 1 April 2013, for the prudential supervision of banks, building societies, insurers and a small number of significant investment firms in the UK. The PRA is a subsidiary of the Bank of England.
Regular way purchase or sale - a purchase or sale of a financial asset under a contract whose terms require delivery of the asset within the time frame established generally by regulation or convention in the marketplace concerned.
Regulatory capital - the amount of capital that the Group holds, determined in accordance with rules established by the PRA for the consolidated Group and by local regulators for individual Group companies.
Repurchase agreement (Repo) - see Sale and repurchase agreements.
Residential mortgage - a loan to purchase a residential property where the property forms collateral for the loan. The borrower gives the lender a lien against the property and the lender can foreclose on the property if the borrower does not repay the loan per the agreed terms. Also known as a home loan.
Residential mortgage backed securities (RMBS) - asset-backed securities for which the underlying asset portfolios are residential mortgages. RBS RMBS classifications, including prime, non-conforming and sub-prime, reflect the characteristics of the underlying mortgage portfolios. RMBS are classified as prime RMBS where the loans have low default risk and are made to borrowers with good credit records and reliable payment histories and there is full documentation. Non-conforming RMBS include US Alt-A RMBS, together with RMBS-in
jurisdictions other than the US where the underlying mortgages are not classified as either prime or sub-prime. Classification of RMBS as subprime or Alt-A is based on Fair Isaac Corporation scores (FICO), level of documentation and loan-to-value ratios of the underlying mortgage loans. US RMBS are classified as sub-prime if the mortgage portfolio comprises loans with FICO scores between 500 and 650 with full or limited documentation. Mortgages in Alt-A RMBS portfolios have FICO scores of 640 to 720, limited documentation and an original LTV of 70% to 100%. In other jurisdictions, RMBS are classified as sub-prime if the mortgage portfolio comprises loans with one or more high risk characteristics such as: unreliable or poor payment histories; high loan-to-value ratios; high debt-to-income ratio; the loan is not secured on the borrower's primary residence; or a history of delinquencies or late payments on the loan.
Retail loans - loans made to individuals rather than institutions. The loans may be for car purchases, home purchases, medical care, home repair, holidays and other consumer uses.
Return on equity - profit attributable to ordinary and B shareholders divided by average shareholders’ equity as a percentage.
Reverse repurchase agreement (Reverse repo) - see Sale and repurchase agreements.
Risk appetite - an expression of the maximum level of risk that the Group is prepared to accept to deliver its business objectives.
Risk asset ratio (RAR) - total regulatory capital as a percentage of risk-weighted assets.
Risk elements in lending (REIL) - impaired loans and accruing loans which are contractually overdue 90 days or more as to principal or interest.
Risk-weighted assets (RWAs) - assets adjusted for their associated risks using weightings established in accordance with the Basel Capital Accord as implemented by the PRA. Certain assets are not weighted but deducted from capital.
Sale and repurchase agreements - in a sale and repurchase agreement one party, the seller, sells a financial asset to another party, the buyer, at the same time the seller agrees to reacquire and the buyer to resell the asset at a later date. From the seller's perspective such agreements are repurchase agreements (repos) and from the buyer's reverse repurchase agreements (reverse repos).
Securitisation - a process by which assets or cash flows are transformed into transferable securities. The underlying assets or cash flows are transferred by the originator or an intermediary, typically an investment bank, to a structured entity which issues securities to investors. Asset securitisations involve issuing debt securities (asset-backed securities) that are backed by the cash flows of income-generating assets (ranging from credit card receivables to residential mortgage loans).
Settlement balances - payables and receivables that result from purchases and sales of financial instruments recognised on trade date. Asset settlement balances are amounts owed to the Group in respect of sales and liability settlement balances are amounts owed by the Group in respect of purchases.
Sovereign exposures - exposures to governments, ministries, departments of governments and central banks.
Standardised approach - a method used to calculate credit risk capital requirements under Pillar 1 of Basel II. In this approach the risk weights used in the capital calculation are determined by regulators. For operational risk, capital requirements are determined by multiplying three years’ historical gross income by a percentage determined by the regulator. The percentage ranges from 12 to 18%, depending on the type of underlying business being considered.
Standstill - is an agreement, usually for a specified period of time, not to enforce the Bank’s rights as a result of a customer breaching the terms and conditions of their facilities. This is a concession to the customer. A standstill is most commonly used in a complex restructuring of a company’s debts, where a group of creditors agree to delay enforcement action to give the company time to gather information and formulate a strategy with a view to establishing a formal restructuring.
Stress testing - a technique used to evaluate the potential effects on an institution’s financial condition of an exceptional but plausible event and/or movement in a set of financial variables.
Stressed value-at-risk (SVaR) - a VaR measure using historical data from a one year period of stressed market conditions. For the purposes of calculating regulatory SVaR, a time horizon of ten trading days is assumed at a confidence level of 99%. See also Value-at-risk below.
Structured credit portfolio (SCP) - a portfolio of certain of the Group’s illiquid assets - principally CDO super senior positions, negative basis trades and monoline exposures - held within Non-Core division.
Structured entity (SE) - an entity that has been designed such that voting or similar rights are not the dominant factor in deciding who controls the entity, for example when any voting rights relate to administrative tasks only and the relevant activities are directed by means of contractual arrangements. SEs are usually established for a specific, limited purpose, they do not carry out a business or trade and typically have no employees. They take a variety of legal forms - trusts, partnerships and companies - and fulfil many different functions.
Structured notes - securities that pay a return linked to the value or level of a specified asset or index. Structured notes can be linked to equities, interest rates, funds, commodities and foreign currency.
Subordinated liabilities - liabilities which, in the event of insolvency or liquidation of the issuer, are subordinated to the claims of depositors and other creditors of the issuer.
Super senior CDO - the most senior class of instrument issued by a CDO vehicle. They benefit from the subordination of all other instruments, including AAA rated securities, issued by the CDO vehicle.
Supervisory slotting approach - a method of calculating regulatory capital, specifically for lending exposures in project finance and income producing real estate, where the PD estimates do not meet the minimum IRB standards. Under this approach, the bank classifies exposures from 1 to 5, where 1 is strong and 5 is default. Specific risk-weights are assigned to each classification.
Tier 1 capital - a component of regulatory capital, comprising common equity tier 1 and additional tier 1. Additional tier 1 capital includes eligible non-common equity capital securities and any related share premium. Under Basel II, Tier 1 capital comprises Core Tier 1 capital plus other Tier 1 securities in issue, less certain regulatory deductions.
Tier 1 capital ratio - a component of regulatory capital, comprising eligible capital securities and any related share premium. Under Basel II, qualifying subordinated debt and other Tier 2 securities in issue, eligible collective impairment allowances, unrealised gains arising on the fair valuation of equity instruments held as available-for-sale, less certain regulatory deductions.
Tier 2 capital - qualifying subordinated debt and other Tier 2 securities in issue, eligible collective impairment allowances, unrealised available-for-sale equity gains and revaluation reserves less certain regulatory deductions.
Total loss absorbing capacity (TLAC) - an FSB proposal for global systemically important banks to have a sufficient amount of specific types of liabilities which can be used to absorb losses and recapitalise a bank in resolution. These proposals are intended to facilitate an orderly resolution that minimises any impact on financial stability, ensures the continuity of critical functions, and avoids exposing taxpayers to loss.
Unaudited - financial information that has not been subjected to the audit procedures undertaken by the Group's auditors to enable them to express an opinion on the Group's financial statements.
US Federal Agencies - are independent bodies established by the US Government for specific purposes such as the management of natural resources, financial oversight or national security. A number of agencies, including, the Government National Mortgage Association, issue or guarantee publicly traded debt securities.
Value-at-risk (VaR) - a technique that produces estimates of the potential loss in the market value of a portfolio over a specified time period at a given confidence level.
Wholesale funding - wholesale funding comprises Deposits by banks, Debt securities in issue and Subordinated liabilities.
Write-down - a reduction in the carrying value of an asset to record a decline in its fair value or value in use.
Wrong-way risk - the risk of loss when the risk factors driving the exposure to a counterparty or customer are positively correlated with the creditworthiness of that counterparty i.e. the size of the exposure increases at the same time as the risk of the counterparty or customer being unable to meet that obligation, increases.
The Enhanced Disclosure Taskforce (EDTF), established by the Financial Stability Board, published its report ‘Enhancing the Risk Disclosures of Banks’ in October 2012. The report suggests improvements to address the quality, comparability and transparency of risk disclosures in areas of risk governance, capital adequacy, liquidity and funding, credit risk and market risk.
RBS implemented the majority of the EDTF recommendations in its 2012 Annual Report and Accounts and Pillar 3 Report, and the remainder in its 2013 reports. All EDTF recommendations are also reflected in the 2014 reports.
The table below sets out the EDTF recommendations and the related locations in the 2014 Annual Report and Accounts and Pillar 3 Report.
| | | | Page reference |
| Risk type | | Recommendation | Report & Accounts | | Pillar 3 |
| General | 1 | Present all risk information together. Where this is not practicable, provide an index. | 1,37-38,63-71,162-163,164-330 466-484,505,513 | | |
| | 2 | Risk terminology, risk measures and key parameter values used. | 163-330,505,513 | | ü |
| | 3 | Top and emerging risks. | 37-38, 170-171 | | |
| | 4 | Key future regulatory ratios. | 4,12,167-168,192-193,198,200 213-214,216 | | |
Risk governance and risk management strategies/business model | 5 | Summarise risk management organisation, processes and key functions. | 65-69,172-175 181,182,184,188,190 193-199, 213-215 | | |
| 6 | Risk culture and risk appetite. | 65-69,176-179,182,185,188 190,192,198,213, 229,299,320,327,329 | | |
| 7 | Key risks arising from business models and activities. | 13-14,166-169 | | |
| 8 | Stress testing. | 192-193,195-199,214-216 305-310,318,328 | | |
Capital adequacy and risk-weighted assets | 9 | Pillar 1 minimal capital requirements. | 161,186,192-193 | | ü |
| 10 | Composition of capital and reconciliation between accounting and regulatory balance sheet. | 192-193,202-204 208-209,210-211 | | |
| 11 | Regulatory capital flow statement. | 204 | | |
| 12 | Capital planning and management. | 192-201 | | |
| 13 | Risk-weighted assets (RWAs) and business activities. | 5,15,128,166,207-209 | | ü |
| 14 | Capital requirements and RWAs. | 128,166,192-193,198-201,202-209 | | ü |
| 15 | Credit risk in the banking book for major portfolios. | 206,208-209,242,247-269 271-274,286-288 | | ü |
| 16 | RWA flow statements. | 206-207 | | |
| 17 | Back-testing of models. | 196,303-304,311 | | ü |
| Liquidity | 18 | Liquid assets and their management. | 213-216 | | |
| Funding | 19 | Encumbered assets. | 224-226,415 | | |
| | 20 | Contractual maturity of assets, liabilities and off-balance sheet commitments. | 219-223 384-387,420-421 | | |
| | 21 | Funding strategy including key sources. | 167,213-214,217-221,224-226 | | |
| Market risk | 22 | Linkages the balance sheet and market risk portfolios. | 297-298 | | |
| | 23 | Significant trading and non-trading market risk factors. | 300-310,312-314 | | |
| | 24 | Model limitations, assumptions and validation procedures | 301-303,312,371-372,378-379 | | |
| | 25 | Stress testing and scenario analysis. | 306,314,316 | | |
| Credit risk | 26 | Credit risk exposures, including linkage to balance sheet. | 211,233,234,242,256 | | ü |
| | 27 | Policies for impaired loans and forbearance. | 239-241,254-255,344-345,350 | | |
| | 28 | Flow statements for impaired loans and allowance for loan losses. | 284-292 | | |
| | 29 | Counterparty credit risk that arises from derivatives transactions. | 253,281-283 | | ü |
| | 30 | Credit risk mitigation. | 232,250,253-254,257,261,265,267 271-274,281,321-322 | | ü |
| Other risks | 31 | Other risk types. | 37,166-169,180-190,319-330,409-485 | | |
| | 32 | Discussion of publicly known risk events. | 6,37,44,54,63,66-68, 72,74,124,167,171,181,184 186,188,190,422,431 | | |
| |
| Accounting developments | 351 |
| Accounting policies | 340 |
| Critical accounting policies | 348 |
| Asset-backed securities | 279 |
| Audit Committee | |
| Letter from the Chairman of the Group Audit Committee | 58 |
| Report of the Group Audit Committee | 59 |
| Auditors | |
| Auditor’s remuneration | 363 |
| Independent auditor’s report | 332 |
| Available-for-sale financial assets | |
| Accounting policies | 345 |
| Notes on the consolidated accounts | 366 |
| Balance sheet | |
| Business review | 157 |
| Consolidated | 335 |
| Board Risk Committee report | |
| Letter from the Chairman of the Board Risk Committee | 63 |
| Report of the Board Risk Committee | 65 |
| Business divestments | |
| Business review | 100 |
| Notes on the consolidated accounts | 399 |
| Capital adequacy | |
| Capital ratios | 161,203 |
| Capital resources | 161,203 |
| Notes on the consolidated accounts | 419 |
| Capital and risk management | |
| Balance sheet analysis | 270 |
| Capital management | 191 |
| Country risk | 319 |
| Credit risk | 227 |
| Liquidity, funding and related risks | 212 |
| Market risk | 294 |
| Other risks | 180 |
| Risk appetite | 176 |
| Risk coverage | 167 |
| Risk governance | 172 |
| Cash flow statement | |
| Business review | 160 |
| Consolidated | 339 |
| Notes on the consolidated accounts | 432, 433 |
| Central functions/items | 33,108,145,434 |
| Chairman | |
| Chairman’s statement | 8 |
| Letter from the Chairman | 44 |
| Chief Executive’s review | 9 |
| Citizens Financial Group | 31,108,146,434 |
| Commercial Banking | 27,108,136,434 |
| Commercial & Private Banking | 27,107, 154 |
| Consolidated financial statements | |
| Consolidated balance sheet | 335 |
| Consolidated cash flow statement | 339 |
| Consolidated income statement | 333 |
| Consolidated statement of changes in equity | 336 |
| Consolidated statement of comprehensive income | 334 |
| Notes on the consolidated accounts | 352 |
| Contingent liabilities and commitments | 420 |
| Corporate governance | |
| Compliance report | 96 |
| Governance at a glance | 35 |
| Risk management | 172 |
| The Board and its committees | 46 |
| Corporate & Institutional Banking | 29,108,142,434 |
| Debt securities | |
| Capital and risk management | 277 |
| Notes on the consolidated accounts | 391 |
| | |
| Deposits | |
| Customer accounts | 366 |
| Deposits by banks | 366 |
| Derivatives | |
| Capital and risk management | 281 |
| Notes on the consolidated accounts | 389 |
| Description of business | 107 |
| Directors | |
| Biographies | 47 |
| Interests in shares | 87 |
| Remuneration | 83 |
| Remuneration policy | 83 |
| Report of the directors | 99 |
| Service contracts and exit payment policy | 85 |
| | |
| Discontinued operations | |
| Notes on the consolidated accounts | 399 |
| Disposal groups | |
| Notes on the consolidated accounts | 399 |
| Dividends | |
| History | 491 |
| Notes on the accounts | 365 |
| Earnings per share | |
| Business review | 115 |
| Notes on the consolidated accounts | 365 |
| Employees | |
| Business review | 129 |
| Headcount | 355 |
| Notes on the consolidated accounts | 355 |
| Report of the directors | 101 |
| Variable compensation | 74 |
| Financial instruments | |
| Accounting policies | 344 |
| Critical accounting policies | 350 |
| Notes on the consolidated accounts | 366 |
| | |
| Financial Services Compensation Scheme | 421 |
Forward-looking statements | 2 |
| Going concern | |
| Report of the directors | 102 |
| Goodwill | |
| Critical accounting policies | 349 |
| Notes on the consolidated accounts | 394 |
| Group Performance and Remuneration Committee | |
| Directors’ remuneration report | 76 |
| Letter from the Chair of the Group Performance and Remuneration Committee | 74 |
| Impairment | |
| Accounting policies | 344 |
| Business review | 125 |
| Critical accounting policies | 350 |
| Notes on the consolidated accounts | 387 |
| Income statement | |
| Business review | 114 |
| Consolidated | 333 |
| Intangible assets | |
| Accounting policies | 342 |
| Segmental analysis of goodwill | 434 |
| Notes on the consolidated accounts | 394 |
| Interest Rate Hedging Products | |
| Critical accounting policies | 349 |
| Notes on the consolidated accounts | 355 |
Litigation, investigations and reviews | 422 |
| Loans and advances | |
| Loans and advances to banks | 366 |
| Loans and advances to customers | 366 |
| Net interest income | |
| Business review | 117 |
| Notes on the consolidated accounts | 352 |
| Non-interest income | |
| Business review | 122 |
| Notes on the consolidated accounts | 353 |
| Operating expenses | |
| Business review | 123 |
| Notes on the consolidated accounts | 354 |
| Payment Protection Insurance | |
| Notes on the consolidated accounts | 354 |
| Critical accounting policies | 349 |
| Pensions | |
| Accounting policies | 341 |
| Critical accounting policies | 348 |
| Notes on the consolidated accounts | 358 |
| Pension risk | 326 |
| Personal & Business Banking | 25,107 |
| Post balance sheet events | 441 |
| Potential problem loans | 456 |
| Presentation of information | 2 |
| | |
| Principal risks and uncertainties | |
| Risk factors | 110,466 |
| | |
| Private Banking | 27,108,139,434 |
| Provisions | |
| Accounting policies | 343 |
| Additional information | 453 |
| Notes on the consolidated accounts | 387 |
| RBS Capital Resolution (RCR) | 32,108,149,434 |
| Risk elements in lending | 456 |
| Risk-weighted assets | 128,206 |
| Segmental reporting | |
| Business review | 127 |
| Description of business | 107 |
| Notes on the consolidated accounts | 434 |
| Services and Functions | 33,108,145,434 |
| Share-based payments | |
| Accounting policies | 341 |
| Notes on the consolidated accounts | 355 |
| Share capital | |
| Notes on the consolidated accounts | 409 |
| Shareholder information | |
| Analysis of ordinary shareholders | 488 |
| Annual General Meeting | 487 |
| Shareholder enquiries | 487 |
| Statement of changes in equity | |
| Consolidated | 336 |
| | |
| Statement of comprehensive income | |
| Consolidated | 334 |
| | |
| Statement of directors’ responsibilities | 105 |
| Subordinated liabilities | |
| Notes on the consolidated accounts | 406 |
| | |
| Supervision | 461 |
| Sustainability | |
| Letter from the Chairman of the Sustainable Banking Committee | 72 |
| Report of the Sustainable Banking Committee | 73 |
| Strategic Report | 36 |
| Tax | |
| Accounting policies | 343 |
| Business review | 126 |
| Critical accounting policies | 349 |
| Notes on the consolidated accounts | 364 |
| Notes on the consolidated accounts - deferred tax | 404 |
| UK Personal & Business Banking | 25,108,130,434 |
| Ulster Bank | 25,108,133,434 |
| Variable compensation | |
| Notes on the consolidated accounts | 357 |
Important addresses
Shareholder enquiries
Registrar
Computershare Investor Services PLC
The Pavilions
Bridgwater Road
Bristol BS99 6ZZ
Telephone: +44 (0)870 702 0135
Facsimile: +44 (0)870 703 6009
Website: www.investorcentre.co.uk/contactus
ADR Depositary Bank
BNY Mellon Shareowner Services
PO Box 30170
College Station, TX 77842-3170
Telephone: +1 888 269 2377 (US callers)
Telephone: +1 201 680 6825 (International)
Email: shrrelations@cpushareownerservices.com
Website: www.mybnymdr.com
Corporate Governance and Secretariat
The Royal Bank of Scotland Group plc
PO Box 1000
Gogarburn Edinburgh EH12 1HQ
Telephone: +44 (0)131 556 8555
Facsimile: +44 (0)131 626 3081
Investor Relations
280 Bishopsgate
London EC2M 4RB
Telephone: +44 (0)207 672 1758
Facsimile: +44 (0)207 672 1801
Email: investor.relations@rbs.com
Registered office
36 St Andrew Square
Edinburgh EH2 2YB
Telephone: +44 (0)131 556 8555
Registered in Scotland No. SC45551
Website
rbs.com
Principal offices
The Royal Bank of Scotland Group plc
PO Box 1000 Gogarburn Edinburgh EH12 1HQ
Telephone: +44 (0)131 626 0000
The Royal Bank of Scotland plc
PO Box 1000 Gogarburn Edinburgh EH12 1HQ
280 Bishopsgate London EC2M 4RB
National Westminster Bank Plc
135 Bishopsgate London EC2M 3UR
Citizens Financial Group, Inc.
One Citizens Plaza Providence RI 02903 USA
Ulster Bank
11-16 Donegall Square East Belfast BT1 5UB
George's Quay Dublin 2
RBS Holdings USA Inc.
600 Washington Blvd
Stamford CT
06901 USA
Coutts Group
440 Strand London WC2R 0QS
The Royal Bank of Scotland International Limited
Royal Bank House 71 Bath Street
St Helier Jersey Channel Islands JE4 8PJ
RBS Holdings N.V.
Gustav Mahlerlaan 350
1082 ME Amsterdam
PO Box 12925
The Netherlands
Exhibit Index
Exhibit Number | Description |
1.1(1) | Memorandum and Articles of Association of The Royal Bank of Scotland Group plc |
2.1(2) | Form of Deposit agreement among The Royal Bank of Scotland Group plc, The Bank of New York as Depositary, and all Owners and Holders from time to time of American Depositary Receipts issued thereunder |
2.2(3) | Form of American Depositary Receipt for ordinary shares of the par value of £1 each |
2.3(4) | Letter dated May 12, 2008 from The Bank of New York Mellon as Depository to The Royal Bank of Scotland Group plc relating to the Prerelease of American Depository Receipts |
| 2.4 | Neither The Royal Bank of Scotland Group plc nor The Royal Bank of Scotland plc is party to any single instrument relating to long-term debt pursuant to which a total amount of securities exceeding 10% of the Group’s total assets (on a consolidated basis) is authorized to be issued. Each of The Royal Bank of Scotland Group plc and The Royal Bank of Scotland plc hereby agrees to furnish to the Securities and Exchange Commission (the “Commission”), upon its request, a copy of any instrument defining the rights of holders of its long-term debt or the rights of holders of the long-term debt of any of its subsidiaries for which consolidated or unconsolidated financial statements are required to be filed with the Commission. |
4.1(5) | Service agreement for Ross McEwan |
| 4.2 | Service Agreement for Ewen Stevenson |
| 4.3 | Form of Deed of Indemnity for Directors |
4.4(6) | Acquisition and contingent capital agreement dated 26 November 2009 among The Royal Bank of Scotland Group plc and The Commissioners of Her Majesty’s Treasury |
4.5(6,8) | State Aid Commitment Deed dated 26 November 2009 among The Commissioners of Her Majesty’s Treasury and The Royal Bank of Scotland Group plc |
4.6(6,8) | State Aid Cost Reimbursement Deed dated 26 November 2009 among The Commissioners of Her Majesty’s Treasury and The Royal Bank of Scotland Group plc |
4.8(5,8) | Investment Agreement, dated September 27, 2013, among the Royal Bank of Scotland Group plc, The Royal Bank of Scotland plc, National Westminster Bank plc, Williams & Glyn’s Limited, Lunar Investors LLP, Corsair IV-B FSCP AIV II Cayman, L.P., Corsair IV FSCP AIV II Cayman, L.P., Corsair Rainbow Investors L.P., Centerbridge Capital Partners SBS II (Cayman), L.P., Centerbridge Capital Partners II (Cayman), L.P. |
4.9(5,8) | Amendment Agreement in relation to the Investment Agreement, dated October 20, 2013, among the parties to the Investment Agreement listed above at 4.11 |
4.10(5,8) | Revised State Aid Commitment Deed dated 9 April 2014 among The Commissioners of Her Majesty’s Treasury and The Royal Bank of Scotland Group plc |
4.11(5,8) | Dividend Access Share Retirement Agreement, dated 9 April 2014 among The Commissioners of Her Majesty’s Treasury and The Royal Bank of Scotland Group plc |
| 4.12 | Relationship Agreement, dated November 7, 2014 among Her Majesty’s Treasury and The Royal Bank of Scotland Group plc |
4.13(7) | Separation and Shareholder Agreement, dated September 26, 2014, between Citizens Financial Group, Inc and The Royal Bank of Scotland Group, plc |
| 7.1 | Explanation of ratio calculations |
| 8.1 | Principal subsidiaries of The Royal Bank of Scotland Group plc |
| 12.1 | CEO certification required by Rule 13a-14(a) |
| 12.2 | CFO certification required by Rule 13a-14(a) |
| 13.1 | Certification required by Rule 13a-14(b) |
| 15.1 | Consent of independent registered public accounting firm |
Notes:
| (1) | Previously filed and incorporated by reference to Exhibit 1 to the Group’s Annual Report on Form 20-F for the fiscal year ended 31 December 2011 (File No. 1-10306) |
(2) | Previously filed and incorporated by reference to Exhibit 1 to the Registration Statement on Form F-6 (Registration No. 333-144756) (filed on 20 July 2007) |
| (3) | Previously filed and incorporated by reference to the prospectus filed pursuant to Rule 424(b)(3) (filed on 7 June 2012) relating to the Registration Statement on Form F-6 (Registration No. 333-144756) (filed on 20 July 2007) |
| (4) | Previously filed and incorporated by reference to Exhibit 2.3 to the Group’s Annual Report on Form 20-F for the fiscal year ended 31 December 2007 (File No. 1-10306) |
| (5) | Previously filed and incorporated by reference to Exhibit 4.1, 4.11, 4.12, 4.13 and 4.14 to the Group’s Annual Report on Form 20-F for the fiscal year ended 31 December 2013 (file No. 1-10306) |
| (6) | Previously filed and incorporated by reference to Exhibit 4.19, 4.24 and 4.25, respectively, to the Group’s Annual Report on Form 20-F for the fiscal year ended 31 December 2009 (File No. 1-10306) |
| (7) | Previously filed and incorporate by reference to Exhibit 10.1 of the Quarterly Report on Form 10-Q of Citizens Financial Group, Inc. (filed 14 November 2014) (File No. 001-36636) |
| (8) | Confidential treatment has been requested. Confidential materials have been redacted and separately filed with the SEC. |
SIGNATURE
The registrant hereby certifies that it meets all of the requirements for filing on Form 20-F and that it has duly caused and authorized the undersigned to sign this annual report on its behalf.
The Royal Bank of Scotland Group plc
Registrant
/s/ Ewen Stevenson
Ewen Stevenson
Chief Financial Officer
31 March 2015