UNITED STATES
SECURITIES AND EXCHANGE COMMISSION
Washington, D.C. 20549
FORM 20-F
(Mark One)
| |
☐ | REGISTRATION STATEMENT PURSUANT TO SECTION 12(b) OR (g) OF THE SECURITIES EXCHANGE ACT OF 1934 |
| |
OR | |
| |
☒ | ANNUAL REPORT PURSUANT TO SECTION 13 OR 15(d) OF THE SECURITIES EXCHANGE ACT OF 1934 |
For the fiscal year ended December 31, 2023 | |
| |
OR | |
| |
☐ | TRANSITION REPORT PURSUANT TO SECTION 13 OR 15(d) OF THE SECURITIES EXCHANGE ACT OF 1934 |
| |
OR | |
| |
☐ | SHELL COMPANY REPORT PURSUANT TO SECTION 13 OR 15(d) OF THE SECURITIES EXCHANGE ACT OF 1934 |
Commission file number: 001-10306
NATWEST GROUP plc
(Exact name of Registrant as specified in its charter)
United Kingdom
(Jurisdiction of incorporation)
Gogarburn, PO Box 1000, Edinburgh EH12 1HQ, United Kingdom
(Address of principal executive offices)
Jan Cargill, Chief Governance Officer and Company Secretary,
Tel: +44 (0) 370 702 0135, Fax: +44 (0) 131 626 3081
PO Box 1000, Gogarburn, Edinburgh EH12 1HQ
(Name, Telephone, E-mail and/or Facsimile number and Address of Company Contact Person)
Securities registered or to be registered pursuant to Section 12(b) of the Act:
Title of each class |
| Trading |
| Name of each exchange |
American Depositary Shares, each representing 2 ordinary shares, nominal value £1.0769 per share | | NWG | | New York Stock Exchange |
Ordinary shares, nominal value £1.0769 per share* | | | | New York Stock Exchange |
5.125% Subordinated Tier 2 Notes due 2024 | | NWG24 | | New York Stock Exchange |
3.754% Fixed-to-fixed Reset Rate Subordinated Tier 2 Notes due 2029 | | NWG29A | | New York Stock Exchange |
3.032% Fixed-to-fixed Reset Rate Subordinated Tier 2 Notes due 2035 | | NWG35 | | New York Stock Exchange |
4.269% Fixed Rate / Floating Rate Senior Notes due 2025 | | NWG25 | | New York Stock Exchange |
1.642% Senior Callable Fixed-to-fixed Reset Rate Notes due 2027 | | NWG27 | | New York Stock Exchange |
5.847% Senior Callable Fixed-to-fixed Reset Rate Notes due 2027 | | NWG27A | | New York Stock Exchange |
5.516% Senior Callable Fixed-to-fixed Reset Rate Notes due 2028 | | NWG/28A | | New York Stock Exchange |
5.808% Senior Callable Fixed-to-fixed Reset Rate Notes due 2029 | | NWG29B | | New York Stock Exchange |
6.016% Senior Callable Fixed-to-fixed Reset Rate Notes due 2034 | | NWG34 | | New York Stock Exchange |
7.472% Callable Fixed-to-fixed Reset Rate Senior Notes due 2026 | | NWG26A | | New York Stock Exchange |
3.073% Callable Fixed-to-fixed Reset Rate Senior Notes due 2028 | | NWG28 | | New York Stock Exchange |
4.892% Fixed Rate / Floating Rate Senior Notes due 2029 | | NWG29 | | New York Stock Exchange |
5.076% Fixed Rate / Floating Rate Senior Notes due 2030 | | NWG30 | | New York Stock Exchange |
4.445% Fixed Rate / Floating Rate Senior Notes due 2030 | | NWG30A | | New York Stock Exchange |
* Not for trading, but only in connection with the registration of American Depositary Shares representing such ordinary shares pursuant to the requirements of the Securities and Exchange Commission.
Securities registered or to be registered pursuant to Section 12(g) of the Act:
None
Securities for which there is a reporting obligation pursuant to Section 15(d) of the Act:
Perpetual Subordinated Contingent Convertible Additional Tier 1 Capital Notes callable 2025 | Irish Stock Exchange |
Perpetual Subordinated Contingent Convertible Additional Tier 1 Capital Notes callable 2025 | London Stock Exchange |
Perpetual Subordinated Contingent Convertible Additional Tier 1 Capital Notes callable 2027 | London Stock Exchange |
Reset Perpetual Subordinated Contingent Convertible Additional Tier 1 Capital Notes callable 2028 | London Stock Exchange |
Perpetual Subordinated Contingent Convertible Additional Tier 1 Capital Notes callable 2031 | London Stock Exchange |
Indicate the number of outstanding shares of each of the issuer’s classes of capital or common stock as of December 31, 2023, the close of the period covered by the annual report:
(Title of each class) |
| (Number of outstanding shares) |
Ordinary shares of £1.0769* each | | 8,991,736,976 |
11% cumulative preference shares | | 240,686 |
5½% cumulative preference shares | | 242,454 |
| | |
* nominal value of Ordinary shares without rounding is £1.076923076923077 | | |
Indicate by check mark if the registrant is a well-known seasoned issuer, as defined in Rule 405 of the Securities Act.
☐ Yes ☒ No
If this report is an annual or transition report, indicate by check mark if the registrant is not required to file reports pursuant to Section 13 or 15(d) of the Securities Exchange Act of 1934.
☐ Yes ☒ No
Indicate by check mark whether the registrant (1) has filed all reports required to be filed by Section 13 or 15(d) of the Securities Exchange Act of 1934 during the preceding 12 months (or for such shorter period that the registrant was required to file such reports), and (2) has been subject to such filing requirements for the past 90 days.
☒ Yes ☐ No
Indicate by check mark whether the registrant has submitted electronically and posted on its corporate Web site, if any, every Interactive Data File required to be submitted and posted pursuant to Rule 405 of Regulation S-T (§232.405 of this chapter) during the preceding 12 months (or for such shorter period that the registrant was required to submit and post such files).
☒ Yes ☐ No
Indicate by check mark whether the registrant is a large accelerated filer, an accelerated filer, a non-accelerated filer, or an emerging growth company. See definition of “large accelerated filer ", "accelerated filer" and "emerging growth company” in Rule 12b-2 of the Exchange Act. (Check one):
| | | |
Large accelerated filer ☒ | Accelerated filer ☐ | Non-Accelerated filer ☐ | Emerging growth company ☐ |
If an emerging growth company that prepares its financial statements in accordance with U.S. GAAP, indicate by check mark if the registrant has elected not to use the extended transition period for complying with any new ore revised financial accounting standards † provided pursuant to Section 13(a) of the Exchange Act. ☐
†The term “new or revised financial accounting standard” refers to any update issues by the Financial Accounting Standards Board to its Accounting Standards Codification after April 5, 2012.
Indicate by check mark whether the registrant has filed a report on and attestation to its management's assessment of the effectiveness of its internal control over financial reporting under Section 404(b) of the Sarbanes-Oxley Act (15 U.S.C. 7262(b)) by the registered public accounting firm that prepared or issued its audit report.
☒ Yes ☐ No
If securities are registered pursuant to Section 12(b) of the Act, indicate by check mark whether the financial statements of the registrant included in the filing reflect the correction of an error to previously issued financial statements. ☐
Indicate by check mark whether any of those error corrections are restatements that required a recovery analysis of incentive-based compensation received by any of the registrant’s executive officers during the relevant recovery period pursuant to §240.10D-1(b). ☐
Indicate by check mark which basis of accounting the registrant has used to prepare the financial statements included in this filing:
☐ U.S. GAAP
☒ International Financial Reporting Standards as issued by the International Accounting Standards Board
☐ Other
If “Other” has been checked in response to the previous question, indicate by check mark which financial statement item the registrant has elected to follow.
☐ Item 17 ☐ Item 18
If this is an annual report, indicate by check mark whether the registrant is a shell company (as defined in Rule 12b-2 of the Exchange Act).
☐ Yes ☒ No
SEC Form 20-F cross reference guide
Item |
| Item Caption | | Pages | ||
PART I | | |
| Annual Report on Form 20-F |
| Exhibit 15.2: Annual Report and Form 20-F Information |
1 | | Identity of Directors, Senior Management and Advisers | | Not applicable | | Not applicable |
2 | | Offer Statistics and Expected Timetable | | Not applicable | | Not applicable |
3 | | Key Information A. [Reserved] B. Capitalisation and indebtedness C. Reasons for the offer and use of proceeds D. Risk factors | | Not applicable Not applicable 4-5, 160-184 | | Not applicable Not applicable 60-66 |
4 | | Information on the Company A. History and development of the Company B. Business overview C. Organisational structure D. Property, plants and equipment | | 9-10, 59-64, 194-206 1-28, 63-64, 147-156, 185-193 3, Exhibit 8.1 54, 114, 185 | | 4-5, 6-7, 8, 18-19, 150-153 1-24, 48-59, 150-153 130 58-59 |
4a | | Unresolved Staff Comments | | Not applicable | | Not applicable |
5 | | Operating and Financial Review and Prospects A. Operating results B. Liquidity and capital resources C. Research and development, patents and licences etc. D. Trend information E. Critical Accounting Estimates | | 1-26 7, 25, 38, 42, 98-110, 115-117 Not applicable 4-27 Not applicable | | 1-24, 48-67, 247-258 8, 228-246 Not applicable 1-24, 48-59 Not applicable |
6 | | Directors, Senior Management and Employees A. Directors and senior management B. Compensation C. Board practices D. Employees E. Share ownership F. Disclosure of a registrant’s action to recover erroneously awarded compensation | | Not applicable 55-72, 134 Not applicable 56 57-59, 134-135, 185, 196-197 Not applicable | | 69-72, 150-154 112-147 69-72, 74-89, 90-112, 150-153 36-37 112-147 Not applicable |
7 | | Major Shareholders and Related Party Transactions A. Major shareholders B. Related party transactions C. Interests of experts and counsel | | 185-186, 189-191 135, 189-191 Not applicable | | 150-153 Not applicable Not applicable |
8 | | Financial Information A. Consolidated statements and other financial information B. Significant changes | | 28-137 3, 137 | | Not applicable Not applicable |
9 | | The Offer and Listing A. Offer and listing details B. Plan of distribution C. Markets D. Selling shareholders E. Dilution F. Expenses of the issue | | 118, 196-197 Not applicable 196-197 Not applicable Not applicable Not applicable | | 149 Not applicable 149 Not applicable Not applicable Not applicable |
10 | | Additional Information A. Share capital B. Memorandum and articles of association C. Material contracts D. Exchange controls E. Taxation F. Dividends and paying agents G. Statement of experts H. Documents on display I. Subsidiary information J. Annual Report to Security Holders | | Not applicable 200-205 189-193 199 197-199 Not applicable Not applicable 204 Not applicable Not applicable | | Not applicable Not applicable Not applicable Not applicable Not applicable Not applicable Not applicable Not applicable Not applicable Not applicable |
11 | | Quantitative & Qualitative Disclosure about Market Risk | | 101-112 | | 160-258 |
12 | | Description of Securities Other than Equity Securities A. Debt Securities B. Warrants and Rights C. Other Securities D. American Depositary Shares | | Exhibit 2.4 Not applicable Not applicable 159 | | Not applicable Not applicable Not applicable Not applicable Not applicable |
SEC Form 20-F cross reference guide continued
Item | | Item Caption |
| Pages | ||
| | | | | | Exhibit 15.2: Annual Report and |
PART II |
| | | Annual Report on Form 20-F |
| Form 20-F Information |
13 | | Defaults, Dividend Arrearages and Delinquencies | | Not applicable | | Not applicable |
14 | | Material Modifications to the Rights of Security Holders and Use of Proceeds | | Not applicable | | Not applicable |
15 | | Controls and Procedures | | 35, Exhibits 12.1 and 12.2 | | 60-65, 95-99, 147-149 |
16 | | [Reserved] | | | | |
16a | | Audit Committee financial expert | | Not applicable | | 95 |
16b | | Code of ethics | | 187 | | 6-7, 26-30 |
16c | | Principal Accountant Fees and services | | 72 | | 99 |
16d | | Exemptions from the Listing Standards | | Not applicable | | Not applicable |
16e | | Purchases of Equity Securities by the Issuer and Affiliated Purchasers | | 185-186 | | 151-153 |
16f | | Change in Registrant’s Certifying Accountant | | Not applicable | | Not applicable |
16g | | Corporate Governance | | Not applicable | | 74-100, 154 |
16h | | Mine Safety Disclosure | | Not applicable | | Not applicable |
16i | | Disclosure Regarding Foreign Jurisdictions that Prevent Inspection | | Not applicable | | Not applicable |
16j | | Insider Trading Policies | | Not applicable | | Not applicable |
16k | | Cybersecurity | | 191-193 | | Not applicable |
| | | | | | |
PART III | | | | | ||
17 | | Financial Statements | | Not applicable | | Not applicable |
18 | | Financial Statements | | 28-137 | | Not applicable |
19 | | Exhibits | | 207-208 | | Not applicable |
Forward-looking statements and important notices
Cautionary statement regarding forward-looking statements
Certain sections in this document contain ‘forward-looking statements’ as that term is defined in the United States Private Securities Litigation Reform Act of 1995, such as statements that include the words ‘expect’, ‘estimate’, ‘project’, ‘anticipate’, ‘commit’, ‘believe’, ‘should’, ‘intend’, ‘will’, ‘plan’, ‘could’, ‘probability’, ‘risk’, ‘Value-at-Risk (VaR)’, ‘target’, ‘goal’, ‘objective’, ‘may’, ‘endeavour’, ‘outlook’, ‘optimistic’, ‘prospects’ and similar expressions or variations on these expressions. In particular, this document includes forward-looking targets and guidance relating to financial performance measures, such as income growth, operating expense, RoTE, ROE, discretionary capital distribution targets, impairment loss rates, balance sheet reduction, including the reduction of RWAs, CET1 ratio (and key drivers of the CET1 ratio including timing, impact and details), Pillar 2 and other regulatory buffer requirements and MREL and non-financial performance measures, such as NatWest Group’s initial area of focus, climate and sustainability-related performance ambitions, targets and metrics, including in relation to initiatives to transition to a net zero economy, Climate and Sustainable Funding and Financing (CSFF) and financed emissions. In addition, this document includes forward-looking statements relating, but not limited to: implementation of NatWest Group’s strategy (including in relation to: cost-controlling measures, the Commercial & Institutional segment and achieving a number of various targets within the relevant timeframe); the timing and outcome of litigation and government and regulatory investigations; direct and on-market buy-backs; funding plans and credit risk profile; managing its capital position; liquidity ratio; portfolios; net interest margin and drivers related thereto; lending and income growth, product share and growth in target segments; impairments and write-downs; restructuring and remediation costs and charges; NatWest Group’s exposure to political risk, economic assumptions and risk, climate, environmental and sustainability risk, operational risk, conduct risk, financial crime risk, cyber, data and IT risk and credit rating risk and to various types of market risk, including interest rate risk, foreign exchange rate risk and commodity and equity price risk; customer experience, including our Net Promoter Score; employee engagement and gender balance in leadership positions.
Limitations inherent to forward-looking statements
These statements are based on current plans, expectations, estimates, targets and projections, and are subject to significant inherent risks, uncertainties and other factors, both external and relating to NatWest Group’s strategy or operations, which may result in NatWest Group being unable to achieve the current plans, expectations, estimates, targets, projections and other anticipated outcomes expressed or implied by such forward-looking statements. In addition, certain of these disclosures are dependent on choices relying on key model characteristics and assumptions and are subject to various limitations, including assumptions and estimates made by management. By their nature, certain of these disclosures are only estimates and, as a result, actual future results, gains or losses could differ materially from those that have been estimated. Accordingly, undue reliance should not be placed on these statements. The forward-looking statements contained in this document speak only as of the date we make them and we expressly disclaim any obligation or undertaking to update or revise any forward-looking statements contained herein, whether to reflect any change in our expectations with regard thereto, any change in events, conditions or circumstances on which any such statement is based, or otherwise, except to the extent legally required.
Important factors that could affect the actual outcome of the forward-looking statements
We caution you that a large number of important factors could adversely affect our results or our ability to implement our strategy, cause us to fail to meet our targets, predictions, expectations and other anticipated outcomes or affect the accuracy of forward-looking statements described in this document. These factors include, but are not limited to, those set forth in the risk factors and the other uncertainties described in NatWest Group plc’s Annual Report on Form 20-F and its other filings with the US Securities and Exchange Commission. The principal risks and uncertainties that could adversely affect NatWest Group’s future results, its financial condition and/or prospects and cause them to be materially different from what is forecast or expected, include, but are not limited to: economic and political risk (including in respect of: political and economic risks and uncertainty in the UK and global markets, including due to GDP growth, inflation and interest rates, political uncertainty and instability, supply chain disruption and geopolitical tensions and armed conflict); changes in foreign currency exchange rates; uncertainty regarding the effects of Brexit; and HM Treasury’s ownership as the largest shareholder of NatWest Group plc); strategic risk (including in respect of the implementation of NatWest Group’s strategy; future acquisitions and divestments (including the phased withdrawal from ROI), and the transfer of its Western European corporate portfolio); financial resilience risk (including in respect of: NatWest Group’s ability to meet targets and to make discretionary capital distributions; the competitive environment; counterparty and borrower risk; liquidity and funding risks; prudential regulatory requirements for capital and MREL; reductions in the credit ratings; the requirements of regulatory stress tests; model risk; sensitivity to accounting policies, judgements, estimates and assumptions (and the economic, climate, competitive and other forward looking information affecting those judgements, estimates and assumptions); changes in applicable accounting standards; the value or effectiveness of credit protection; the adequacy of NatWest Group’s future assessments by the Prudential Regulation Authority and the Bank of England; and the application of UK statutory stabilisation or resolution powers); climate and sustainability risk (including in respect of: risks relating to climate-related and sustainability-related risks; both the execution and reputational risk relating to NatWest Group’s climate change-related strategy, ambitions, targets and transition plan; climate and sustainability-related data and model risk; the failure to implement climate change resilient governance, systems, controls and procedures; increasing levels of climate, environmental, human rights and sustainability-related regulation and oversight; increasing anti-greenwashing regulations; climate, environmental and sustainability-related litigation, enforcement proceedings investigations and conduct risk; and reductions in ESG ratings); operational and IT resilience risk (including in respect of: operational risks (including reliance on third party suppliers); cyberattacks; the accuracy and effective use of data; complex IT systems; attracting, retaining and developing diverse senior management and skilled personnel; NatWest Group’s risk management framework; and reputational risk); and legal, regulatory and conduct risk (including in respect of: the impact of substantial regulation and oversight; the outcome of legal, regulatory and governmental actions, investigations and remedial undertakings; and changes in tax legislation or failure to generate future taxable profits).
Forward-looking statements and important notices continued
Climate and sustainability-related disclosures
Climate and sustainability-related disclosures in this document are not measures within the scope of International Financial Reporting Standards (‘IFRS’), use a greater number and level of judgements, assumptions and estimates, including with respect to the classification of climate and sustainable funding and financing activities, than our reporting of historical financial information in accordance with IFRS. These judgements, assumptions and estimates are highly likely to change materially over time, and, when coupled with the longer time frames used in these disclosures, make any assessment of materiality inherently uncertain. In addition, our climate risk analysis, net zero strategy, including the implementation of our climate transition plan remain under development, and the data underlying our analysis and strategy remain subject to evolution over time. The process we have adopted to define, gather and report data on our performance on climate and sustainability-related measures is not subject to the formal processes adopted for financial reporting in accordance with IFRS and there are currently limited industry standards or globally recognised established practices for measuring and defining climate and sustainability-related metrics. As a result, we expect that certain climate and sustainability-related disclosures made in this document are likely to be amended, updated, recalculated or restated in the future. Please also refer to the cautionary statement in the section entitled ‘Climate-related and other forward-looking statements and metrics’ of the NatWest Group 2023 Climate-related Disclosures Report.
Cautionary statement regarding Non-IFRS financial measures and APMs
NatWest Group prepares its financial statements in accordance with generally accepted accounting principles (GAAP). This document may contain financial measures and ratios not specifically defined under GAAP or IFRS (‘Non-IFRS’) and/or alternative performance measures (‘APMs’) as defined in European Securities and Markets Authority (‘ESMA’) guidelines. Non-IFRS measures and APMs are adjusted for notable and other defined items which management believes are not representative of the underlying performance of the business and which distort period-on-period comparison. Non-IFRS measures provide users of the financial statements with a consistent basis for comparing business performance between financial periods and information on elements of performance that are one-off in nature. Any Non-IFRS measures and/or APMs included in this document, are not measures within the scope of IFRS, are based on a number of assumptions that are subject to uncertainties and change, and are not a substitute for IFRS measures.
The information, statements and opinions contained in this document do not constitute a public offer under any applicable legislation or an offer to sell or a solicitation of an offer to buy any securities or financial instruments or any advice or recommendation with respect to such securities or other financial instruments.
| |
NatWest Group – Annual Report on Form 20-F 2023 | 2 |
Presentation of information
In the Annual Report and Accounts, unless specified otherwise, ‘parent company’ refers to NatWest Group plc, and ‘NatWest Group’, ‘Group’ or ‘we’ refers to NatWest Group plc and its subsidiaries. The term ‘NWH Group’ refers to NatWest Holdings Limited (‘NWH Limited’) and its subsidiary and associated undertakings. The term ‘NWM Group’ refers to NatWest Markets Plc (‘NWM Plc’) and its subsidiary and associated undertakings. The term ‘NWM N.V.’ refers to NatWest Markets N.V. The term ‘NWM N.V. Group’ refers to Natwest Markets N.V. and its subsidiary and associated undertakings The term ‘NWMSI’ refers to NatWest Markets Securities, Inc. The term ‘RBS plc’ refers to The Royal Bank of Scotland plc. The term ‘NWB Plc’ refers to National Westminster Bank Plc. The term ‘UBIDAC’ refers to Ulster Bank Ireland DAC. The term ‘RBSI Ltd’ refers to The Royal Bank of Scotland International Limited.
NatWest Group publishes its financial statements in pounds sterling (‘£’ or ‘sterling’). The abbreviations ‘£m’ and ‘£bn’ represent millions and thousands of millions of pounds sterling, respectively, and references to ‘pence’ represent pence where the amounts are denominated in pounds sterling (‘GBP’). Reference to ‘dollars’ or ‘$’ are to United States of America (‘US’) dollars. The abbreviations ‘$m’ and ‘$bn’ represent millions and thousands of millions of dollars, respectively. The abbreviation ‘€’ represents the ‘euro’, and the abbreviations ‘€m’ and ‘€bn’ represent millions and thousands of millions of euros, respectively.
To aid readability, this document retains references to EU legislative and regulatory provisions in effect in the UK before 1 January 2021 that have now been implemented in UK domestic law. These references should be read and construed as including references to the applicable UK implementation measures with effect from 1 January 2021.
Any information contained on websites linked or reports referenced in this Annual Report on Form 20-F is for information only and will not be deemed to be incorporated by reference herein.
Non-IFRS financial information
NatWest Group prepares its financial statements in accordance with generally accepted accounting principles (GAAP). This document contains a number of adjusted or alternative performance measures, also known as non-GAAP or non-IFRS performance measures. These measures are adjusted for notable and other defined items which management believe are not representative of the underlying performance of the business and which distort period-on-period comparison. The non-IFRS measures provide users of the financial statements with a consistent basis for comparing business performance between financial periods and information on elements of performance that are one-off in nature. The non-IFRS measures also include the calculation of metrics that are used throughout the banking industry. These non-IFRS measures are not measures within the scope of IFRS and are not a substitute for IFRS measures. For further information please refer to page 138.
| |
NatWest Group – Annual Report on Form 20-F 2023 | 3 |
Summary risk factors
Principal risks and uncertainties
Set out below is a summary of the principal risks and uncertainties that could adversely affect NatWest Group’s future results, its financial condition and prospects and cause them to be materially different from what is forecast or expected, and directly or indirectly impact the value of its securities in issue. This summary should not be regarded as a complete and comprehensive statement of all potential risks and uncertainties; a fuller description of these and other risk factors is included on pages 160 to 184 of this report on Form 20-F and should be read together with NatWest Group’s other public disclosures. Any of the risks identified may have a material adverse effect on NatWest Group’s business, operations, financial condition or prospects.
Economic and political risk
- | NatWest Group, its customers and its counterparties face continued economic and political risks and uncertainties in the UK and global markets, including as a result of inflation and interest rates, supply chain disruption, and geopolitical developments. |
- | Changes in interest rates will continue to affect NatWest Group’s business and results. |
- | Fluctuations in currency exchange rates may adversely affect NatWest Group’s results and financial condition. |
- | Continuing uncertainty regarding the effects and extent of the UK’s post Brexit divergence from EU laws and regulation, and NatWest Group’s post Brexit EU operating model may adversely affect NatWest Group and its operating environment. |
- | HM Treasury (or UKGI on its behalf) could exercise a significant degree of influence over NatWest Group and further offers or sales of NatWest Group’s shares held by HM Treasury may affect the price of NatWest Group securities. |
Strategic risk
- | NatWest Group continues to implement its strategy, which carries significant execution and operational risks and it may not achieve its stated aims and targeted outcomes. |
- | Acquisitions, divestments, other strategic transactions and/or the withdrawal from the Republic of Ireland by NatWest Group may not be successful, and consolidation or fragmentation of the financial services industry may adversely affect NatWest Group. |
- | The transfer of NatWest Group’s Western European corporate portfolio involves certain risks. |
Financial resilience risk
- | NatWest Group may not achieve its ambitions, targets, guidance it communicates or be in a position to continue to make discretionary capital distributions (including dividends to shareholders). |
- | NatWest Group operates in markets that are highly competitive, with competitive pressures and technology disruption. |
- | NatWest Group has significant exposure to counterparty and borrower risk including credit losses, which may have an adverse effect on NatWest Group. |
- | NatWest Group may not meet the prudential regulatory requirements for liquidity and funding or may not be able to adequately access sources of liquidity and funding, which could trigger the execution of certain management actions or recovery options. |
- | NatWest Group may not meet the prudential regulatory requirements for regulatory capital and MREL, or manage its capital effectively, which could trigger the execution of certain management actions or recovery options. |
- | Any reduction in the credit rating and/or outlooks assigned to NatWest Group plc, any of its subsidiaries or any of their respective debt securities could adversely affect the availability of funding for NatWest Group, reduce NatWest Group’s liquidity and funding position and increase the cost of funding. |
- | NatWest Group may be adversely affected if it fails to meet the requirements of regulatory stress tests. |
- | NatWest Group could incur losses or be required to maintain higher levels of capital as a result of limitations or failure of various models. |
- | NatWest Group’s financial statements are sensitive to underlying accounting policies, judgments, estimates and assumptions. |
- | Changes in accounting standards may materially impact NatWest Group’s financial results. |
- | The value or effectiveness of any credit protection that NatWest Group has purchased depends on the value of the underlying assets and the financial condition of the insurers and counterparties. |
- | NatWest Group is subject to Bank of England and PRA oversight in respect of resolution, and NatWest Group could be adversely affected should the Bank of England in the future deem NatWest Group’s preparations to be inadequate. |
- | NatWest Group may become subject to the application of UK statutory stabilisation or resolution powers which may result in, for example, the cancellation, transfer or dilution of ordinary shares, or the write-down or conversion of certain other of NatWest Group’s securities. |
Summary risk factors continued
Climate and sustainability-related risks
- | NatWest Group and its value chain face climate-related and sustainability-related risk that may adversely affect NatWest Group. |
- | Climate-related risks may adversely affect the global financial system, NatWest Group or its value chain. |
- | NatWest Group and its value chain may, face other sustainability-related risks that may adversely affect NatWest Group. |
- | NatWest Group’s climate change related strategy, ambitions, targets and transition plan entail significant execution and/or reputational risks and are unlikely to be achieved without significant and timely government policy, technology and customer behavioural changes. |
- | There are significant limitations related to accessing accurate, reliable, verifiable, auditable, consistent and comparable climate and other sustainability-related data that contribute to substantial uncertainties in accurately modelling and reporting on climate and sustainability information, as well as making appropriate important internal decisions. |
- | Failure to implement effective governance, procedures, systems and controls in compliance with legal, regulatory requirements and societal expectations to manage climate and sustainability-related risks and opportunities could adversely affect NatWest Group. |
- | Increasing levels of climate and other sustainability-related laws, regulation and oversight may adversely affect NatWest Group. |
- | Increasing regulation of “greenwashing” is likely to increase the risk of regulatory enforcement and investigation and litigation. |
- | NatWest Group may be subject to potential climate and other sustainability-related litigation, enforcement proceedings, investigations and conduct risk. |
- | A reduction in the ESG ratings of NatWest Group could have a negative impact on NatWest Group’s reputation and on investors’ risk appetite and customers’ willingness to deal with NatWest Group. |
Operational and IT resilience risk
- | Operational risks (including reliance on third party suppliers and outsourcing of certain activities) are inherent in NatWest Group’s businesses. |
- | NatWest Group is subject to sophisticated and frequent cyberattacks. |
- | NatWest Group operations and strategy are highly dependent on the accuracy and effective use of data. |
- | NatWest Group’s operations are highly dependent on its complex IT systems and any IT failure could adversely affect NatWest Group. |
- | NatWest Group relies on attracting, retaining and developing diverse senior management and skilled personnel, and is required to maintain good employee relations. |
- | A failure in NatWest Group’s risk management framework could adversely affect NatWest Group, including its ability to achieve its strategic objectives. |
- | NatWest Group’s operations are subject to inherent reputational risk. |
Legal, regulatory and conduct risk
- | NatWest Group’s businesses are subject to substantial regulation and oversight, which are constantly evolving and may adversely affect NatWest Group. |
- | NatWest Group is exposed to the risks of various litigation matters, regulatory and governmental actions and investigations as well as remedial undertakings, the outcomes of which are inherently difficult to predict, and which could have an adverse effect on NatWest Group. |
- | Changes in tax legislation or failure to generate future taxable profits may impact the recoverability of certain deferred tax assets recognised by NatWest Group. |
| |
NatWest Group – Annual Report on Form 20-F 2023 | 5 |
CFO Review
We have delivered a strong operating performance in 2023 with a return on equity of 12.1% and a RoTE of 17.8%. Total income increased by 12.1% to £14,752 million. Total income excluding notable items of £14.3 billion was up by 9.8% and levels of default remain stable across our portfolio. We remain focused on cost discipline and have achieved our cost target of around £7.6 billion, with a cost:income ratio of 51.8%.
Financial performance
Total income increased by 12.1% to £14.8 billion compared with 2022. Total income excluding notable items, was 9.8% higher than the prior year principally driven by lending growth, higher income in our markets business and favourable yield curve movements partially offset by the change in deposit mix from non-interest bearing to interest bearing and lower deposit balances. Net interest margin increased by 31 basis points to 2.12%. Bank NIM of 3.04% was 19 basis points higher than 2022 primarily due to benefits from yield curve movements, net of changes in deposit mix, partially offset by lending margin pressure.
Total operating expenses of £7,996 million were £309 million higher than 2022. Other operating expenses were £339 million, or 4.6%, higher for the year at £7.6 billion, in line with our full year guidance. The increase was principally due to higher staff costs, including a payment to support our colleagues with cost of living challenges and inflationary pressures on utility and contract costs. FTE(1) reduced by c.300 to c.61,200 principally reflecting reductions as we continue our exit from the Republic of Ireland and automation and simplification in Retail Banking, partially offset by investment in technology and data roles.
A net impairment charge of £578 million, or 15 basis points of gross customer loans, primarily reflects continued low and stable levels of stage 3 defaults across the portfolio and good book charges related to unsecured lending. Compared with 2022, our ECL provision increased by £0.2 billion to £3.6 billion and our ECL coverage ratio has increased from 0.91% to 0.93%. We retain post model adjustments of £0.4 billion related to economic uncertainty, or 11.8% of total impairment provisions.
As a result, we are pleased to report an attributable profit for 2023 of £4.4 billion, with earnings per share of 47.9 pence and a RoTE of 17.8%, above our guided range. The profit for the year includes a deferred tax asset write back of £385 million in respect of tax losses.
Loans to customers increased by £15.1 billion to £381.4 billion. Net loans to customers excluding central items increased by £8.9 billion in the year largely reflecting a £7.6 billion increase in Retail Banking and £2.0 billion of growth in Commercial & Institutional due to an increase in term loan facilities and private financing within Corporate & Institutions, net of £2.7 billion of UK Government scheme repayments. Retail Banking mortgage lending increased by £5.9 billion, with gross new mortgage lending of £29.8 billion in 2023 compared with £41.4 billion in 2022 reflecting the smaller mortgage market, and unsecured lending increased by £2.0 billion with continued strong customer demand. Private Banking net loans to customers decreased by £0.7 billion driven by higher repayments on mortgages. Up to 31 December 2023 we have provided £61.9 billion against our target to provide £100 billion climate and sustainable funding and financing between 1 July 2021 and the end of 2025 (2).
As part of this we aim to provide at least £10 billion in lending for residential properties with Energy Performance Certificate (EPC) ratings A and B between 1 January 2023(2) and the end of 2025(2). During 2023 we provided £29.3 billion climate and sustainable funding and financing, which included £3.9 billion in lending for residential properties with EPC ratings A and B.
Customer deposits decreased by £18.9 billion in 2023 from £450.3 billion in 2022. Customer deposits excluding central items decreased by £13.8 billion during 2023 to £419.1 billion principally reflecting the competitive environment for deposits and an overall market liquidity contraction. Despite the reduction, LDR (excl. repos and reverse repos) remains healthy at 84%. In the fourth quarter customer deposit balances reduced by £4.5 billion largely within Corporate & Institutions as a result of active management, with growth in Retail Banking and Private Banking partially offsetting. We have continued to see the mix of our book shift towards interest bearing and term balances, with non-interest bearing balances now accounting for 34% of balances and term at 16%.
TNAV per share increased by 28 pence in the year to 292 pence primarily reflecting the attributable profit for the period and an £872 million movement in cash flow hedging reserves as rate expectations lowered, partially offset by the impact of distributions. Intangible assets increased by £498 million in the year, primarily reflecting software capitalisation and the acquisition of Cushon.
(1)Full Time Equivalents of our permanent and internal fixed term resource. Each full-time employee is one FTE, with part-time employees recorded based on hours worked.
(2) | The guidance, targets, expectations, and trends discussed in this section represent NatWest Group plc management's current expectations and are subject to change, including as a result of the factors described in the Risk Factors section of the 2023 NatWest Group plc Annual Report on Form 20-F. These statements constitute forward-looking statements. Refer to Forward-looking statements in this document. |
| |
NatWest Group – Annual Report on Form 20-F 2023 | 6 |
CFO Review continued
Capital and leverage
The CET1 ratio remains strong at 13.4%, or 13.2% excluding IFRS 9 transitional relief. The 80 basis point reduction compared with 31 December 2022 principally reflected distributions deducted from capital of c.200 basis points, partially offset by the attributable profit. The NatWest Group’s minimum requirement for own funds and eligible liabilities (MREL) ratio was 30.5%. RWAs increased by £6.9 billion during 2023 to £183.0 billion principally reflecting lending growth in Commercial & Institutional and a £3.0 billion uplift associated with CRD IV model updates, partially offset by a £4.0 billion reduction as we continue our exit from the Republic of Ireland.
Funding and liquidity
The LCR of 144%, representing £45.4 billion headroom above 100% minimum requirement, decreased by 1 percentage point during the year, driven by growth in customer lending and reduced customer deposits offset by an increase in wholesale funding and UBIDAC asset sale.
Business performance summary
| | | | | | | |
| | Year ended |
| ||||
|
| 31-Dec |
| 31-Dec | | 31-Dec |
|
| | 2023 | | 2022 | | 2021 |
|
Summary consolidated income statement | | £m | | £m | | £m |
|
Net interest income |
| 11,049 |
| 9,842 | | 7,535 | |
Non-interest income |
| 3,703 |
| 3,314 | | 2,894 | |
Total income |
| 14,752 |
| 13,156 | | 10,429 | |
Litigation and conduct costs |
| (355) |
| (385) | | (466) | |
Other operating expenses |
| (7,641) |
| (7,302) | | (7,292) | |
Operating expenses |
| (7,996) |
| (7,687) | | (7,758) | |
Profit before impairment losses |
| 6,756 |
| 5,469 | | 2,671 | |
Impairment losses |
| (578) |
| (337) | | 1,173 | |
Operating profit before tax |
| 6,178 |
| 5,132 | | 3,844 | |
Tax (charge)/credit |
| (1,434) |
| (1,275) | | (996) | |
Profit from continuing operations |
| 4,744 |
| 3,857 | | 2,848 | |
(Loss)/profit from discontinued operations, net of tax |
| (112) |
| (262) | | 464 | |
Profit for the period |
| 4,632 |
| 3,595 | | 3,312 | |
Performance key metrics and ratios |
|
|
|
| | | |
Notable items within total income (1) |
| £413m |
| £95m | | £245m | |
Total income excluding notable items (1) |
| £14,339m |
| £13,061m | | £10,184m | |
Bank net interest margin (1) |
| 3.04 | % | 2.85 | % | 2.30 | % |
Bank average interest earning assets (1) |
| £363bn |
| £345bn | | £327bn | |
Cost:income ratio (excl. litigation and conduct) (1) |
| 51.8 | % | 55.50 | % | 69.90 | % |
Loan impairment rate (1) |
| 15bps |
| 9bps | | (32bps) | |
Profit attributable to ordinary shareholders |
| £4,394m |
| £3,340m | | £2,950m | |
Total earnings per share attributable to ordinary |
|
|
|
| | | |
shareholders - basic |
| 47.9p |
| 33.8p | | 27.3p | |
Return on tangible equity (RoTE) (1) |
| 17.8 | % | 12.30 | % | 9.40 | % |
Climate and sustainable funding and financing (2) |
| £29.3bn |
| £24.5bn | | £8.1bn | |
| |
NatWest Group – Annual Report on Form 20-F 2023 | 7 |
CFO Review continued
| | | | | | | |
| | As at |
| ||||
|
| 31-Dec |
| 31-Dec |
| 31-Dec |
|
| | 2023 | | 2022 | | 2021 |
|
| | £bn | | £bn | | £bn |
|
Balance sheet |
|
|
|
|
|
| |
Total assets |
| 692.7 |
| 720.1 |
| 782.0 | |
Loans to customers - amortised cost |
| 381.4 |
| 366.3 |
| 359.0 | |
Loans to customers excluding central items (1,3) |
| 355.6 |
| 346.7 |
| 324.8 | |
Loans to customers and banks - amortised cost and FVOCI |
| 392 |
| 377.1 |
| 369.8 | |
Total impairment provisions (4) |
| 3.5 |
| 3.4 |
| 3.8 | |
Expected credit loss (ECL) coverage ratio |
| 0.93 | % | 0.91 | % | 1.03 | % |
Assets under management and administration (AUMA) (1) |
| 40.8 |
| 33.4 |
| 35.6 | |
Customer deposits |
| 431.4 |
| 450.3 |
| 479.8 | |
Customer deposits excluding central items (1,3) |
| 419.1 |
| 432.9 |
| 445.7 | |
Liquidity and funding |
|
|
|
|
|
| |
Liquidity coverage ratio (LCR) |
| 144 | % | 145 | % | 172 | % |
Liquidity portfolio (5) |
| 223 |
| 233 |
| 286 | |
Net stable funding ratio (NSFR) |
| 133 | % | 145 | % | 157 | % |
Loan:deposit ratio (excl. repos and reverse repos) (1) |
| 84 | % | 79 | % | 72 | % |
Total wholesale funding |
| 80 |
| 74 |
| 77 | |
Short-term wholesale funding |
| 28 |
| 21 |
| 23 | |
Capital and leverage |
|
|
|
|
|
| |
Common Equity Tier 1 (CET1) ratio (6) |
| 13.4 | % | 14.2 | % | 18.2 | % |
Total capital ratio (6) |
| 18.4 | % | 19.3 | % | 24.7 | % |
Pro forma CET1 ratio (excl. foreseeable items) (7) |
| 14.2 | % | 15.4 | % | 19.5 | % |
Risk-weighted assets (RWAs) |
| 183.0 |
| 176.1 |
| 157.0 | |
UK leverage ratio |
| 5.0 | % | 5.4 | % | 5.9 | % |
Tangible net asset value (TNAV) per ordinary share (1,8) |
| 292p |
| 264p |
| 272p | |
Number of ordinary shares in issues (millions) (8) |
| 8,792 |
| 9,659 |
| 11,272 | |
(1)Refer to the Non-IFRS financial measures appendix for details of the basis of preparation and reconciliation of non-IFRS financial measures and performance metrics.
(2) | NatWest Group uses its climate and sustainable funding and financing inclusion (CSFFI) criteria to determine the assets, activities and companies that are eligible to be included within its climate and sustainable funding and financing target. This includes both provision of committed (on and off-balance sheet) funding and financing, including provision of services for underwriting issuances and private placements. |
(3) | Central items includes Treasury repo activity and Ulster Bank Republic of Ireland. |
(4) | Excludes £0.1 billion relating to off-balance sheet exposures (30 September 2023 – £0.1 billion; 31 December 2022 – £0.1 billion). |
(5) | Comparative periods have been re-presented on an LCR basis in line with the Liquidity portfolio definition as of 31 December 2023. |
(6) | Refer to the Capital, liquidity and funding section for details of the basis of preparation. |
(7) | The pro forma CET1 ratio at 31 December 2023 excludes foreseeable items of £1,538 million: £1,013 million for ordinary dividends and £525 million foreseeable charges. (30 September 2023 excludes foreseeable items of £1,004 million: £643 million for ordinary dividends and £361 million foreseeable charges. 31 December 2022 excludes foreseeable charges of £2,132 million: £967 million for ordinary dividends and £1,165 million foreseeable charges). |
(8) | The number of ordinary shares in issue excludes own shares held. |
| |
NatWest Group – Annual Report on Form 20-F 2023 | 8 |
Financial summary
| | | | | | |
| | 2023 | | 2022 | | 2021 |
Income - continuing operations |
| £m |
| £m |
| £m |
Interest receivable (1) |
| 21,026 |
| 12,637 |
| 9,234 |
Interest payable (1) |
| (9,977) |
| (2,795) |
| (1,699) |
Net interest income |
| 11,049 |
| 9,842 |
| 7,535 |
| | | | | | |
Net fees and commissions |
| 2,330 |
| 2,292 |
| 2,120 |
Income from trading activities |
| 794 |
| 1,133 |
| 323 |
Other operating income |
| 579 |
| (111) |
| 451 |
Non-interest income |
| 3,703 |
| 3,314 |
| 2,894 |
Total income |
| 14,752 |
| 13,156 |
| 10,429 |
| | | | | | |
Total income excluding notable items |
| 14,339 |
| 13,061 |
| 10,184 |
Notable items within total income |
|
|
|
|
|
|
Private Banking |
|
|
|
|
|
|
Consideration on the sale of the Adam & Company |
| |
| |
|
|
Investment Management Ltd | | — | | — | | 54 |
Commercial & Institutional |
|
|
| |
| |
Fair value, disposal losses and asset disposals/strategic risk reduction | | — | | (45) | | (86) |
Tax variable lease repricing |
| — |
| — |
| 32 |
Own credit adjustments (OCA) |
| (2) |
| 42 |
| 6 |
Tax interest on prior periods | | 3 | | — | | — |
Central items & other |
| |
| |
|
|
Loss on redemption of own debt |
| — |
| (161) |
| (138) |
Effective interest rate adjustment as a result of redemption of own debt |
| — |
| (41) |
| — |
Profit from insurance liabilities |
| — |
| 92 |
| — |
Liquidity Asset Bond sale losses |
| (43) |
| (88) |
| 120 |
Share of associate losses for Business Growth Fund |
| (4) |
| (22) |
| 219 |
Property strategy update |
| (69) |
| — |
| (44) |
Interest and FX management derivatives not in hedge accounting relationships |
| 79 |
| 369 |
| 47 |
FX recycling gains | | 484 | | — | | — |
Ulster Bank RoI gain arising from the restructuring of structural hedges |
| — |
| — |
| 35 |
Ulster Bank RoI fair value mortgage adjustments |
| — |
| (51) |
| — |
Tax interest on prior periods | | (35) | | — | | — |
|
| 413 |
| 95 |
| 245 |
nm = not meaningful
(1) | Interest receivable and interest payable on trading assets and liabilities are included in income from trading activities. |
| |
NatWest Group – Annual Report on Form 20-F 2023 | 9 |
Financial summary continued
2023 compared with 2022
| - | Total income increased by 12.1% to £14,752 million compared with 2022. Total Income excluding notable items was £14,339 million, or 9.8%, higher than 2022 driven by lending growth, higher income in our markets business and favourable yield curve movements partially offset by the change in deposit mix from non-interest bearing to interest bearing and lower deposit balances. |
| - | Net interest margin increased by 31 basis points to 2.12%. Bank NIM of 3.04% was 19 basis points higher than 2022 primarily due to benefits from yield curve movements, net of changes in deposit mix as customers shifted to lower margin fixed term accounts, partially offset with lending margin pressure. |
| - | Interest receivable was materially above the prior year reflecting the higher rate environment. The increase in interest payable reflects the impact of the pass-through of rate increases on interest-bearing deposit balances and the migration of balances from non-interest bearing to interest-bearing and term deposits. Net interest income was £1,207 million higher than 2022 benefitting from favourable yield curve movements partially offset by the change in deposit mix from non-interest bearing to interest bearing and lower deposit balances. |
| - | Net fees and commissions increased £38 million to £2,330 million compared with 2022, largely within Commercial & Institutional, driven by increased lending fees and card volumes coupled with higher payment services income. |
| - | Income from trading activities of £794 million decreased £339 million, or 29.9% primarily due to Treasury volatility, with a partial offset in other operating income, and hedge accounting adjustments on foreign exchange swaps which are largely offset in net interest income. |
| - | Other operating income was £690 million higher for the year principally reflecting movements in notable items, in particular: foreign exchange recycling gains of £484 million; £161 million loss on redemption of own debt in 2022; and lower losses on liquidity asset bond sales. |
2022 compared with 2021
| - | Total income increased by 26.1% to £13,156 million compared with 2021. Total income excluding notable items was £2,877 million, or 28.3%, higher than 2021 driven by volume growth, increased transactional related fees, higher trading income and favourable yield curve movements. |
| - | Net interest margin of 1.81% was 36 basis points higher compared with 2021. Bank NIM of 2.85% was 55 basis points higher than 2021 principally reflecting the impact of base rate increases. |
| - | Net interest income increased by 30.6% to £9,842 million benefitting from the improved yield curve movements, supported by interest rate rises, and net loan growth. |
| - | Interest receivable increased £3,403 million, or 36.9% reflecting the higher rate environment. The increase in interest payable of £1,096 million reflects the impact of pass-through of the rate increases on interest bearing deposit balances. |
| - | Net fees and commissions increased by £172 million to £2,292 million primarily driven by increased card payment fees and higher payment services fees within Commercial & Institutional and higher spend related income in Retail Banking. |
| - | Income from trading activities of £1,133 million increased by £810 million reflecting an increase in Commercial & Institutional primarily driven by higher income in our markets business reflecting a stronger performance across the product suite, gains from risk management derivatives not in hedge accounting relationships partially offset with reduced income as we continued our withdrawal from operations in the Republic of Ireland. |
| - | Other operating income was £562 million lower in 2022 driven by £161 million loss on redemption of own debt, reduced income as we continued our withdrawal from operations in the Republic of Ireland and items not repeated in 2022 including £219 million share of gains under equity accounting for Business Growth Fund and £54 million consideration from the sale of the Adam & Company investment management business in Q4 2021. |
| - | Structural hedges, which averaged £223 billion notional in 2022, generated £2.1 billion of net interest income for the year, compared with £1.4 billion of net interest income on a balance of £190 billion in 2021. |
| |
NatWest Group – Annual Report on Form 20-F 2023 | 10 |
Financial summary continued
| | | | | | |
|
| 2023 |
| 2022 |
| 2021 |
Operating expenses – continuing operations | | £m | | £m | | £m |
Staff expenses |
| 3,839 |
| 3,671 |
| 3,676 |
Premises and equipment |
| 1,153 |
| 1,112 |
| 1,133 |
Other administrative expenses |
| 1,715 |
| 1,686 |
| 1,560 |
Depreciation and amortisation |
| 934 |
| 833 |
| 923 |
Other operating expenses |
| 7,641 |
| 7,302 |
| 7,292 |
Litigation and conduct costs |
| 355 |
| 385 |
| 466 |
Operating expenses |
| 7,996 |
| 7,687 |
| 7,758 |
2023 compared with 2022
| - | Operating expenses were £309 million higher than 2022 at £7,996 million. |
| - | Staff expenses were £168 million, or 4.6%, higher than 2022 primarily due to a 6.4% average wage increase effective in April 2023 and around a £60 million colleague cost of living payment, offset by lower costs, including redundancy expenses, within our operations in the Republic of Ireland. |
| - | Premises and equipment costs of £1,153 million were £41 million higher than 2022 primarily due to increased utilities and repairs costs driven by inflationary pressures. |
| - | Other administrative expenses of £1,686 million were £126 million higher than 2021 primarily reflecting increased managed services costs, higher fraud costs and increased travel and entertainment costs. |
| - | Other administrative expenses increased £29 million over the year driven by inflationary pressures, increasing third party costs, offset by the reduction of operating and strategic costs as a result of the withdrawal of operations in the Republic of Ireland. |
| - | Depreciation and amortisation of £934 million was £101 million higher than 2022 due to capitalised technology spend and a property impairment in 2023. |
| - | Litigation and conduct costs of £355 million represent the net impact of a number of remediation and litigation matters concluding, including customer due diligence costs paid during the year. Refer to Note 26 to the consolidated financial statements for additional information on other litigation and conduct matters. |
2022 compared with 2021
| - | Operating expenses were £71 million lower than 2021 at £7,687 million. |
| - | Staff expenses remained broadly flat in 2022 with investment in franchises, technology and data offset by lower strategic costs. |
| - | Premises and equipment costs of £1,112 million were £21 million lower than 2021 primarily reflecting reduced maintenance costs relating to investment activity. |
| - | Other administrative expenses of £1,686 million were £126 million higher than 2021 primarily reflecting increased managed services costs, higher fraud costs and increased travel and entertainment costs. |
| - | Depreciation and amortisation decreased by 9.8% to £833 million driven by non-repeat of goodwill adjustment. |
| - | Litigation and conduct costs of £385 million represent the net impact of a number of remediation and litigation matters concluding, including customer due diligence costs paid during the year. Refer to Note 26 to the consolidated financial statements for additional information on other litigation and conduct matters. |
| | | | | | | |
|
| 2023 |
| 2022 | | 2021 |
|
Tax - continuing operations |
| £m |
| £m | | £m | |
Tax charge |
| (1,434) |
| (1,275) | | (996) | |
UK corporation tax rate |
| 23.5 | % | 19.0 | % | 19.0 | % |
Effective tax rate |
| 23.2 | % | 24.8 | % | 25.9 | % |
2023 compared with 2022
A tax charge of £1,434 million for the year ended 31 December 2023 arises rather than the expected charge of £1,452 million based on the corporation tax rate of 23.5%. The lower tax charge reflects tax credits in respect of the carrying value of loss DTAs and the foreign exchange recycling on the UBIDAC capital reduction. These factors have been partially offset by the UK banking surcharge, no tax relief for RoI tax losses, adjustments relating to prior years, and other non-deductible items. Further details can be found in Note 7 to the consolidated financial statements.
2022 compared with 2021
A tax charge of £1,275 million for the year ended 31 December 2022 arises rather than the expected charge of £975 million based on the corporation tax rate of 19%. The higher tax charge reflects the UK banking surcharge, no tax relief for RoI tax losses, and other non-deductible items. These factors have been partially offset by tax credits in respect of the carrying value of loss DTAs and the RPI uplift on indexed linked gilts. Further details can be found in Note 7 to the consolidated financial statements.
| |
NatWest Group – Annual Report on Form 20-F 2023 | 11 |
Financial summary continued
| | | | | | | |
| | 2023 | | 2022 | | 2021 | |
Impairments - continuing operations |
| £m |
| £m |
| £m | |
Loans - amortised cost and FVOCI |
| 392,040 |
| 377,153 |
| 369,827 |
|
ECL provisions |
| 3,645 |
| 3,434 |
| 3,806 |
|
ECL provisions coverage ratio |
| 0.93 | % | 0.91 | % | 1.03 | % |
Impairment (releases)/losses |
| |
| |
| |
|
ECL charge/(release) (1) |
| 578 |
| 337 |
| (1,173) |
|
Amounts written off |
| 319 |
| 482 |
| 876 |
|
(1) | The table above summarises loans and related credit impairment measured on an IFRS 9 basis. Refer to Credit Risk – Banking activities in the Risk and capital management section for further details. |
2023 compared with 2022
Compared with 2022, our ECL provision increased by £0.2 billion to £3.6 billion and our ECL coverage ratio has increased from 0.91% to 0.93%. We retain post model adjustments of £0.4 billion related to economic uncertainty, or 11.8% of total impairment provisions.
A net impairment charge of £578 million, or 15 basis points of gross customer loans, primarily reflects continued low and stable levels of stage 3 defaults across the portfolio and good book charges related to unsecured lending.
2022 compared with 2021
Compared with 2021, our ECL provisions have reduced by £0.4 billion to £3.4 billion, and our ECL coverage ratio has decreased from 1.03% to 0.91%. The element of our economic uncertainty post model adjustments (PMA) that relates to COVID-19 risks has been reduced, which, when combined with revisions to our scenario weightings, has allowed us to reduce the amount we hold as economic uncertainty PMA to £0.4 billion, or 10.3% of total impairment provisions.
A net impairment charge of £337 million principally reflects the latest macro-economics, including updated scenarios and their associated weighting, with more weight being placed on the downside scenario. The increase of £1,510 million is due to the non-repeat of an impairment release in 2021, as the economic outlook improved compared with the expectation at the end of 2020, which saw an increased charge as the conditions were uncertain. Underlying book performance remains strong, with credit conditions remaining benign, with levels of default remaining low. Amounts written off decreased by £394 million to £482 million primarily reflecting lower write offs in Commercial & Institutional where levels are significantly reduced compared to historic trends as lower defaults have resulted in reduced write offs.
Profit for the year
| | | | | | |
| | 2023 |
| 2022 | | 2021 |
| | £m | | £m | | £m |
Operating profit before tax |
| 6,178 |
| 5,132 |
| 3,844 |
Tax charge |
| (1,434) |
| (1,275) |
| (996) |
Profit from continuing operations |
| 4,744 |
| 3,857 |
| 2,848 |
(Loss)/profit from discontinued operations, net of tax |
| (112) |
| (262) |
| 464 |
Profit for the year |
| 4,632 |
| 3,595 |
| 3,312 |
| | | | | | |
Attributable to: |
|
|
|
|
|
|
Ordinary shareholders |
| 4,394 |
| 3,340 |
| 2,950 |
Preference shareholders | | — | | — | | 19 |
Paid-in equity holders |
| 242 |
| 249 |
| 299 |
Non-controlling interests |
| (4) |
| 6 |
| 44 |
2023 compared with 2022
Operating profit before tax of £6,178 million is £1,046 million, or 20.4%, higher than 2022 primarily due to increased income as a result of the favourable yield curve movements partially offset with higher costs largely attributable to inflationary pressures.
2022 compared with 2021
Operating profit before tax increased by £1,288 million, or 34% to £5,132 million. This is primarily driven by increased income, reflecting volume growth, increased transaction fees, higher trading income and favourable yield curve movements.
| |
NatWest Group – Annual Report on Form 20-F 2023 | 12 |
Financial summary continued
Summary consolidated balance sheet as at 31 December 2023
| | | | | | |
| | 2023 | | 2022 | | 2021 |
|
| £m |
| £m |
| £m |
Assets |
|
|
|
|
|
|
Cash and balances at central banks |
| 104,262 |
| 144,832 |
| 177,757 |
Trading assets |
| 45,551 |
| 45,577 |
| 59,158 |
Derivatives |
| 78,904 |
| 99,545 |
| 106,139 |
Settlement balances |
| 7,231 |
| 2,572 |
| 2,141 |
Loans to banks - amortised cost |
| 6,914 |
| 7,139 |
| 7,682 |
Loans to customers - amortised cost |
| 381,433 |
| 366,340 |
| 358,990 |
Other financial assets |
| 51,102 |
| 30,895 |
| 46,145 |
Other assets (including intangible assets) |
| 16,374 |
| 16,292 |
| 14,965 |
Assets of disposal groups |
| 902 |
| 6,861 |
| 9,015 |
Total assets |
| 692,673 |
| 720,053 |
| 781,992 |
| | | | | | |
Liabilities |
| |
| |
| |
Bank deposits |
| 22,190 |
| 20,441 |
| 26,279 |
Customer deposits |
| 431,377 |
| 450,318 |
| 479,810 |
Settlement balances |
| 6,645 |
| 2,012 |
| 2,068 |
Trading liabilities |
| 53,636 |
| 52,808 |
| 64,598 |
Derivatives |
| 72,395 |
| 94,047 |
| 100,835 |
Other financial liabilities |
| 55,089 |
| 49,107 |
| 49,326 |
Subordinated liabilities |
| 5,714 |
| 6,260 |
| 8,429 |
Notes in circulation |
| 3,237 |
| 3,218 |
| 3,047 |
Other liabilities |
| 5,202 |
| 5,346 |
| 5,797 |
Total liabilities |
| 655,485 |
| 683,557 |
| 740,189 |
| | | | | | |
Total equity |
| 37,188 |
| 36,496 |
| 41,803 |
| | | | | | |
Total liabilities and equity |
| 692,673 |
| 720,053 |
| 781,992 |
| | | | | | |
Tangible net asset value per ordinary share (1) |
| 292p |
| 264p |
| 272p |
(1) | Tangible net asset value per ordinary share is tangible equity divided by the number of ordinary shares. |
2023 compared with 2022
| - | Total assets of £692.7 billion as at 31 December 2023 decreased by £27.4 billion, 4%, compared with 31 December 2022. This was primarily driven by decreases in cash and balances at central banks and derivative assets partially offset by an increase in other financial assets and loans to customers. |
| - | Cash and balances at central banks decreased by £40.6 billion mainly due to net business segment funding outflows of £17.3 billion and a decrease of £19.5 billion mainly driven by the acquisition of non-cash liquid assets as part of on going liquidity management. |
| - | Other financial assets increased by £20.2 billion mainly as a result of net bonds activity of £16.5 billion and an increase in Commercial & Institutional, £3.8 billion, mainly driven by an increase in held-to-collect securities purchased to support customer primary issuance. |
| - | Derivative assets decreased by £20.6 billion, 21%, to £78.9 billion and liabilities decreased by £21.7 billion, 23%, to £72.4 billion. These movements were driven by a decrease in exchange rate and interest rate trading books mainly due to matured and buyouts trades exceeding new trades. |
| - | Total loans to customers increased by £15.1 billion to £381.4 billion, primarily reflecting £7.6 billion growth mainly in the Retail Banking mortgage and credit cards business and a £6.5 billion increase in Treasury mainly due to higher reverse repos. |
| - | Total loans to banks decreased by £0.2 billion, 3%, to £6.9 billion due to lower Commercial & Institutional nostro balances. |
| - | Other assets increased by £0.1 billion to £16.4 billion mainly due to an increase in internally developed software intangible assets of £0.3 billion, goodwill on acquisition of £0.2 billion and acceptances and financial guarantees of £0.3 billion. These increases have been offset by a decrease of £0.3 billion in deferred tax, £0.2 billion in tax recoverable and £0.1 billion in net pension assets. |
| - | Customer deposits decreased by £18.9 billion reflecting a reduction of £9.9 billion in Commercial & Institutional and £3.5 billion reduction in Private Banking, lower business current accounts, savings and non-interest bearing deposits, and a £6.0 billion reduction as a result of the withdrawal from the Republic of Ireland. |
| |
NatWest Group – Annual Report on Form 20-F 2023 | 13 |
Financial summary continued
Summary consolidated balance sheet as at 31 December 2023 continued
| - | Bank deposits increased by £1.7 billion mainly due to higher repo activity. |
| - | Other financial liabilities, which includes customer deposits at fair value through profit and loss and debt securities in issue, increased by £6.0 billion, to £55.1 billion. |
| - | Subordinated liabilities have decreased by £0.5 billion, 9%, to £5.7 billion due to redemptions partially offset by new issuances. |
| - | Other liabilities decreased by £0.1 billion, 3%, to £5.2 billion mainly due to lower lease liabilities partially offset by higher financial guarantees. |
| - | Total equity increased by £0.7 billion, 2%, to £37.2 billion, driven by higher profit for the year of £4.8 billion offset by dividends paid of £1.5 billion and shares repurchased in the year of £2.0 billion. |
2022 compared with 2021
| - | Total assets of £720.1 billion as at 31 December 2022 decreased by £61.9 billion, 8%, compared with 31 December 2021. This was primarily driven by decreases in cash and balances at central banks, other financial assets, trading assets and derivative assets partially offset by an increase in loans to customers. |
| - | Cash and balances at central banks decreased by £32.9 billion mainly due to net business segment funding outflows driven by an overall market liquidity contraction, £28.0 billion, movements in FX swaps £8.0 billion and higher levels of debt market activity £4.0 billion partly offset by liquidity management measures, £8.0 billion. |
| - | Other financial assets decreased by £15.3 billion mainly as a result of net Government and Supranational bond trading of £13.5 billion and lower mark-to-market valuations of £1.6 billion on account of higher interest rates. |
| - | Trading assets and trading liabilities reduced by £13.6 billion and £11.8 billion respectively, reflecting the lower trading activity in response to the volatility in key currency rates. |
| - | Derivative assets decreased by £6.6 billion, 6%, to £99.5bn and liabilities decreased by £6.8 billion, 7%, to £94.0 billion. These movements were driven by a decrease in interest rate trading books on account of lower mark-to-market valuations in main currencies partially offset by an increase in exchange rate assets trading book. |
| - | Total loans to customers increased by £7.4 billion to £366.3 billion, primarily reflecting £14.4 billion growth in Retail Banking mortgage business and a £5.7 billion increase in Commercial & Institutional partially offset by a £14.6 billion reduction in Central items & other, which included a £6.4 billion decrease as we continued our exit from the Republic of Ireland. |
| - | Loans to banks decreased by £0.5 billion to £7,139 billion mainly driven by a decrease in foreign currency account balances and the redemption of unsecured MRELs, partially offset by an increase in foreign currency swaps. |
| - | Other assets increased by £1.3 billion to £16.3 billion primarily due to increases in deferred tax of £1.0 billion, tax recoverable of £0.1 billion and internally developed software intangible assets of £0.4 billion. These increases have been partially offset by a decrease of £0.2 billion in net pension assets. |
| - | Customer deposits decreased by £29.5 billion principally reflecting a reduction of £14.2 billion in Commercial & Institutional, due to an overall market liquidity contraction in the second half of the year driven by the rising cost of living and a £12.2 billion reduction as a result of the withdrawal from the Republic of Ireland. |
| - | Bank deposits decreased by £5.8 billion mainly due to lower repo activity due to current supply and demand market conditions. |
| - | Other financial liabilities, which includes customer deposits at fair value through profit and loss and debt securities in issue, decreased by £0.2 billion, to £49.1 billion primarily reflecting a decrease in short term issuances and lower MRELs. |
| - | Subordinated liabilities have decreased by £2.2 billion, 26%, to £6.3 billion due to redemptions partially offset by new issuances. |
| - | Other liabilities decreased by £0.5 billion, 8%, to £5.3 billion mainly due to a decrease in financial guarantees and accrued lease liabilities. |
| - | Total equity decreased by £5.3 billion, 13%, to £36.5 billion, driven by share repurchase, ordinary and paid-in equity dividends paid, partially offset by the attributable profit for the year |
| |
NatWest Group – Annual Report on Form 20-F 2023 | 14 |
Segment performance
Segmental summary income statements
| | | | | | | | | | | |
| | | | | | | | Central | | Total |
|
| | Retail | | Private | | Commercial & | | items | | NatWest |
|
| | Banking | | Banking | | Institutional | | & other | | Group |
|
2023 |
| £m |
| £m |
| £m |
| £m |
| £m |
|
Continuing operations | | | | | | | | | | | |
Net interest income |
| 5,496 |
| 710 |
| 5,044 |
| (201) |
| 11,049 | |
Non-interest income |
| 435 |
| 280 |
| 2,377 |
| 611 |
| 3,703 | |
Total income |
| 5,931 |
| 990 |
| 7,421 |
| 410 |
| 14,752 | |
Direct expenses |
| (815) |
| (255) |
| (1,510) |
| (5,061) |
| (7,641) | |
Indirect expenses |
| (1,896) |
| (421) |
| (2,357) |
| 4,674 |
| — | |
Other operating expenses |
| (2,711) |
| (676) |
| (3,867) |
| (387) |
| (7,641) | |
Litigation and conduct costs |
| (117) |
| (9) |
| (224) |
| (5) |
| (355) | |
Operating expenses | | (2,828) | | (685) | | (4,091) | | (392) | | (7,996) | |
Operating profit before impairment losses |
| 3,103 |
| 305 |
| 3,330 |
| 18 |
| 6,756 | |
Impairment losses |
| (465) |
| (14) |
| (94) |
| (5) |
| (578) | |
Operating profit | | 2,638 | | 291 | | 3,236 | | 13 | | 6,178 | |
Total income excluding notable items |
| 5,931 |
| 990 |
| 7,420 |
| (2) |
| 14,339 | |
Return on tangible equity (1) |
| na |
| na |
| na |
| na |
| 17.8 | % |
Return on equity (1,2) |
| 23.8 | % | 14.8 | % | 15.4 | % | nm |
| na | |
Cost:income ratio (excl. litigation and conduct) (1) | | 45.7 | % | 68.3 | % | 52.1 | % | nm | | 51.8 | % |
Customer deposits (£bn) |
| 188.0 | | 37.7 | | 193.4 | | 12.3 |
| 431.4 | |
Average interest earning assets (£bn) |
| 205.4 | | 19.0 | | 131.5 | | nm |
| 362.9 | |
Net interest margin (1) |
| 2.68 | % | 3.74 | % | 3.84 | % | nm |
| 3.04 | % |
Third party asset rate (1) |
| 3.23 | % | 4.54 | % | 6.15 | % | nm |
| nm | |
Third party customer funding rate (1) |
| (1.42) | % | (2.17) | % | (1.40) | % | nm | | nm | |
For the notes to this table, refer to the following page. nm = not meaningful, na = not applicable.
| |
NatWest Group – Annual Report on Form 20-F 2023 | 15 |
Segment performance continued
Segmental summary income statements continued
| | | | | | | | | | | |
| | | | | | | | Central | | Total | |
| | Retail | | Private | | Commercial & | | items | | NatWest | |
| | Banking | | Banking | | Institutional | | & other | | Group | |
2022 |
| £m |
| £m |
| £m |
| £m |
| £m | |
Continuing operations | | | | | | | | | | | |
Net interest income |
| 5,224 |
| 777 |
| 4,171 |
| (330) |
| 9,842 | |
Non-interest income |
| 422 |
| 279 |
| 2,242 |
| 371 |
| 3,314 | |
Total income |
| 5,646 |
| 1,056 |
| 6,413 |
| 41 |
| 13,156 | |
Direct expenses | | (709) | | (235) | | (1,506) | | (4,852) | | (7,302) | |
Indirect expenses |
| (1,775) |
| (375) |
| (2,057) |
| 4,207 |
| — | |
Other operating expenses |
| (2,484) |
| (610) |
| (3,563) |
| (645) |
| (7,302) | |
Litigation and conduct costs | | (109) | | (12) | | (181) | | (83) | | (385) | |
Operating expenses |
| (2,593) |
| (622) |
| (3,744) |
| (728) |
| (7,687) | |
Operating profit/(loss) before impairment losses/releases |
| 3,053 |
| 434 |
| 2,669 |
| (687) |
| 5,469 | |
Impairment (losses)/releases |
| (229) |
| 2 |
| (122) |
| 12 |
| (337) | |
Operating profit/(loss) |
| 2,824 |
| 436 |
| 2,547 |
| (675) |
| 5,132 | |
Total income excluding notable items |
| 5,646 | | 1,056 | | 6,416 | | (57) |
| 13,061 | |
Return on tangible equity (1) | | na | | na | | na | | na | | 12.3 | % |
Return on equity (1,2) |
| 28.6 | % | 24.5 | % | 12.2 | % | nm |
| na | |
Cost:income ratio (excl. litigation and conduct) (1) | | 44.0 | % | 57.8 | % | 55.6 | % | nm | | 55.5 | % |
Customer deposits (£bn) |
| 188.4 | | 41.2 | | 203.3 | | 17.4 |
| 450.3 | |
Average interest earning assets (£bn) |
| 190.8 | | 19.1 | | 126.1 | | nm |
| 345.2 | |
Net interest margin (1) |
| 2.74 | % | 4.07 | % | 3.31 | % | nm |
| 2.85 | % |
Third party asset rate (1) |
| 2.64 | % | 3.01 | % | 3.53 | % | nm |
| nm | |
Third party customer funding rate (1) |
| (0.20) | % | (0.27) | % | (0.21) | % | nm | | nm | |
For the notes to this table, refer to the following page. nm = not meaningful, na = not applicable.
| |
NatWest Group – Annual Report on Form 20-F 2023 | 16 |
Segment performance continued
Segmental summary income statements continued
| | | | | | | | | | | |
| | | | | | | | | | Total | |
| | Retail | | Private | | Commercial & | | Central items | | NatWest | |
| | Banking | | Banking | | Institutional | | & other | | Group | |
2021 |
| £m |
| £m |
| £m |
| £m |
| £m |
|
Continuing operations | | | | | | | | | | | |
Net interest income | | 4,074 |
| 480 |
| 2,974 |
| 7 |
| 7,535 |
|
Non-interest income |
| 371 |
| 336 |
| 1,864 |
| 323 |
| 2,894 | |
Total income |
| 4,445 |
| 816 |
| 4,838 |
| 330 |
| 10,429 | |
Direct expenses (2) |
| (813) |
| (213) |
| (1,784) |
| (4,482) |
| (7,292) | |
Indirect expenses (2) |
| (1,624) |
| (310) |
| (1,862) |
| 3,796 |
| — | |
Other operating expenses |
| (2,437) |
| (523) |
| (3,646) |
| (686) |
| (7,292) | |
Litigation and conduct costs |
| (76) |
| 3 |
| (111) |
| (282) |
| (466) | |
Operating expenses | | (2,513) | | (520) | | (3,757) | | (968) | | (7,758) | |
Operating profit/(loss) before impairment releases/losses | | 1,932 | | 296 | | 1,081 | | (638) | | 2,671 | |
Impairment releases/(losses) | | 36 | | 54 | | 1,160 | | (77) | | 1,173 | |
Operating profit/(loss) | | 1,968 | | 350 | | 2,241 | | (715) | | 3,844 | |
Total income excluding notable items | | 4,445 | | 762 | | 4,886 | | 91 | | 10,184 | |
| | | | | | | | | | | |
Return on tangible equity (1) | | na | | na | | na | | na | | 9.4 | % |
Return on equity (1,2) | | 26.1 | % | 17.0 | % | 10.9 | % | nm | | na | |
Cost:income ratio (excl. litigation and conduct) (1) | | 54.8 | % | 64.1 | % | 75.4 | % | nm | | 69.9 | % |
Customer deposits (£bn) | | 188.9 | | 39.3 | | 217.5 | | 34.1 | | 479.8 | |
Average interest earning assets (£bn) | | 179.1 | | 18.3 | | 121.0 | | nm | | 327.3 | |
Net interest margin | | 2.27 | % | 2.63 | % | 2.46 | % | nm | | 2.30 | % |
Third party customer asset rate (1) | | 2.66 | % | 2.36 | % | 2.71 | % | nm | | nm | |
Third party customer funding rate (1) |
| (0.06) | % | — | | (0.02) | % | nm | | nm | |
nm = not meaningful, na = not applicable.
(1) | Refer to the Non-IFRS financial measures section for details of the basis of preparation. |
(2) | NatWest Group’s CET1 target is approximately 13-14% but for the purposes of computing segmental return on equity (ROE), to better reflect the differential drivers of capital usage, segmental operating profit or loss adjusted for preference share dividends and tax, is divided by average notional equity allocated at different rates of 13.5% for Retail Banking (2022 - 13)%, 11.5% for Private Banking (2022 – 11%), and 14% for Commercial & Institutional (2022 – 14)% of the period average of segmental risk-weighted assets equivalents (RWAe) incorporating the effect of capital deductions. NatWest Group return on equity is calculated using profit attributable to ordinary shareholders. Refer to the Non-IFRS financial measures section for details of the basis of preparation. |
| |
NatWest Group – Annual Report on Form 20-F 2023 | 17 |
Segment performance continued
Retail Banking
| | | | | | | |
| | 2023 | | 2022 | | 2021 | |
Income statement |
| £m |
| £m |
| £m |
|
Net interest income |
| 5,496 |
| 5,224 |
| 4,074 |
|
Non-interest income |
| 435 |
| 422 |
| 371 |
|
Total income |
| 5,931 |
| 5,646 |
| 4,445 |
|
Other operating expenses |
| (2,711) |
| (2,484) |
| 2,437 |
|
Litigation and conduct costs |
| (117) |
| (109) |
| 76 |
|
Operating expenses |
| (2,828) |
| (2,593) |
| 2,513 |
|
Impairment losses |
| (465) |
| (229) |
| 36 |
|
Operating profit |
| 2,638 |
| 2,824 |
| 1,968 |
|
| | | | | | | |
Performance ratios (1) |
|
|
|
|
|
|
|
Return on equity |
| 23.8 | % | 28.6 | % | 26.1 | % |
Net interest margin |
| 2.68 | % | 2.74 | % | 2.27 | % |
Cost: income ratio (excl. litigation and conduct) | | 45.7 | % | 44.0 | % | 54.8 | % |
Loan impairment rate |
| 22bps | | 11bps | | (2bps) | |
(1)Refer to the Non-IFRS financial measures section for details of basis of preparation and reconciliation of non-IFRS financial measures and performance metrics.
| | | | | | |
| | 2023 | | 2022 | | 2021 |
Capital and balance sheet |
| £bn |
| £bn |
| £bn |
Loans to customers (amortised cost) |
|
|
|
|
|
|
- personal advances |
| 8.1 |
| 7.6 |
| 7.1 |
- mortgages |
| 193.1 |
| 187.2 |
| 172.8 |
- cards |
| 5.9 |
| 4.4 |
| 3.8 |
Total loans to customers (amortised cost) |
| 207.1 |
| 199.2 |
| 183.7 |
Loan impairment provisions |
| (1.9) |
| (1.6) |
| (1.5) |
Net loans to customers (amortised cost) |
| 205.2 |
| 197.6 |
| 182.2 |
| | | | | | |
Total assets |
| 228.7 |
| 226.4 |
| 210.0 |
Customer deposits |
| 188.0 |
| 188.4 |
| 188.9 |
Risk-weighted assets |
| 61.6 |
| 54.7 |
| 36.7 |
2023 compared with 2022
| - | During 2023, Retail Banking continued to pursue sustainable lending growth, increasing £7.6 billion, whilst taking a measured approach to risk. Retail Banking delivered operating profit of £2.6 billion and a return on equity of 23.8%, against a more challenging operating environment and inflationary cost impacts. |
| - | Retail Banking provided £3.7 billion of climate and sustainable funding and financing in 2023 from lending on properties with an EPC rating of A or B. |
| - | Total income was £285 million, or 5.0%, higher than 2022 reflecting higher lending growth and the impact of rate rises on deposit income, partly offset by mortgage margin dilution, higher treasury funding costs and the impact of the deposit balance mix shift from non-interest bearing current accounts to interest bearing term balances. |
| - | Net interest margin was 6 basis points lower than 2022 largely reflecting the movements impacting total income, partly offset by the impact of pass-through management and hedges on deposit income as interest rates increased. |
| - | Non-interest income of £435 million was £13 million, or 3.1%, higher than 2022 primarily due to increased spend-related fee income. |
| - | Other operating expenses were £227 million, or 9.1%, higher than 2022 reflecting higher pay awards to support our colleagues with cost of living challenges, property lease termination losses, increased restructuring costs and continued investment in the business. This was partly offset by savings from a 6.3% reduction in headcount. |
| - | An impairment charge of £465 million in 2023, £236 million higher than 2022, reflecting higher stage 3 inflows and increased good book charges driven by both lending growth and normalisation of risk parameters. |
| |
NatWest Group – Annual Report on Form 20-F 2023 | 18 |
Segment performance continued
Retail Banking continued
| - | Net loans to customers increased by £7.6 billion, or 3.8%, in 2023 reflecting mortgage growth of £5.9 billion, with gross new mortgage lending of £29.8 billion, representing flow share of around 13%. Cards balances increased by £1.5 billion and personal advances increased by £0.5 billion in 2023 with continued strong customer demand. |
| - | Customer deposits decreased by £0.4 billion in 2023 reflecting lower current accounts of £10.2 billion, partly offset by higher fixed term deposits driving savings growth of £9.8 billion. Term deposits now represents 11% of deposit balances. |
2022 compared with 2021
| - | In 2022, Retail Banking continued to pursue sustainable growth with an intelligent approach to risk, delivering a return on equity of 28.6% and an operating profit of £2,824 million. |
| - | Retail Banking provided £4.0 billion of climate and sustainable funding and financing in 2022. |
| - | Total income was £1,201 million, or 27.0%, higher than 2021 reflecting strong loan growth and higher transactional-related fee income, higher deposit income, supported by interest rate rises, partially offset by lower mortgage margins. |
| - | Net interest inome increased by £1,150 million to £5,224 million benefitting from improved yield curve movements and net loan growth partially offset with the impact of pass-through of interest rate increases to customers. |
| - | Non-interest income of £422 million increased by £51 million driven by higher spend related income. |
| - | Net interest margin was 47 basis points higher than 2021 reflecting higher deposit returns, partly offset by mortgage margin pressure. |
| - | Operating expense of £2,593 million were £80 million, or 3.2%, higher compared with 2021. Other operating expenses were £47 million, or 1.9%, higher than 2021 primarily driven by higher fraud losses, increased investment in financial crime prevention, increased data related costs and the impact of pay awards to support colleague cost of living challenges. This was partly offset by a 4.1% headcount reduction as a result of the continued digitalisation, automation and improvement of end-to-end customer journeys. |
| - | Impairment losses of £229 million in 2022 primarily reflect continued low level of stage 3 defaults as well as updated economic outlook scenarios partly offset by provision releases in stage 2. Provision coverage of 0.81% remains strong. |
| - | Net loans to customers increased by £15.4 billion, or 8.5%, in 2022 mainly reflecting continued mortgage growth of £14.4 billion, with gross new mortgage lending of £41.4 billion representing flow share of around 13%. Cards balances increased by £0.6 billion and personal advances increased by £0.5 billion in 2022 reflecting continued strong customer demand. |
| - | Customer deposits decreased by £0.5 billion, or 0.3%, in 2022 driven by higher outflows in H2 2022 as customers started to spend following relaxation of Covid-related restrictions and competition for deposit balances increased. Personal savings balances decreased by £0.9 billion partly offset by personal current accounts balance growth of £0.4 billion in 2022. Customer deposits decreased by £0.5 billion, or 0.3%, in 2022 driven by higher outflows in H2 2022 as customers started to spend following relaxation of Covid-related restrictions and competition for deposit balances increased. Personal savings balances decreased by £0.9 billion partly offset by personal current accounts balance growth of £0.4 billion in 2022. |
| - | RWAs increased by £2.6 billion, or 5.0% versus 1 January 2022 reflecting lending growth and a further increase of 1st January 2022 mortgage regulatory changes of £1.0 billion, partly offset by quality improvements. No material impact of procyclicality evident. |
| |
NatWest Group – Annual Report on Form 20-F 2023 | 19 |
Segment performance continued
Private Banking
| | | | | | | |
| | 2023 | | 2022 | | 2021 | |
Income statement |
| £m |
| £m |
| £m | |
Net interest income |
| 710 |
| 777 |
| 480 | |
Non-interest income |
| 280 |
| 279 |
| 336 | |
Total income |
| 990 |
| 1,056 |
| 816 | |
Other operating expenses |
| (676) |
| (610) |
| (523) | |
Litigation and conduct costs |
| (9) |
| (12) |
| 3 | |
Operating expenses | | (685) | | (622) | | (520) | |
Impairment (losses)/releases |
| (14) |
| 2 |
| 54 | |
Operating profit |
| 291 |
| 436 |
| 350 | |
| | | | | | | |
Performance ratios (1) |
|
|
|
|
| | |
Return on equity |
| 14.8 | % | 24.5 | % | 17.0 | % |
Net interest margin |
| 3.74 | % | 4.07 | % | 2.63 | % |
Cost:income ratio (excl. litigation and conduct) | | 68.3 | % | 57.8 | % | 64.1 | % |
Loan impairment rate |
| 8bps | | (1bps) | | (29bps) | |
AUM net flows (£bn) |
| 1.3 |
| 2.0 |
| 3.0 | |
| | | | | | | |
| | 2023 | | 2022 | | 2021 | |
Capital and balance sheet |
| £bn |
| £bn | | £bn |
|
Loans to customers (amortised cost) |
|
|
|
| | |
|
- personal |
| 1.8 |
| 2.2 | | 2.3 | |
- mortgages |
| 12.3 |
| 12.7 | | 11.8 |
|
- other |
| 4.5 |
| 4.4 | | 4.4 |
|
Total loans to customers (amortised cost) |
| 18.6 |
| 19.3 | | 18.5 |
|
Loan impairment provisions |
| (0.1) |
| (0.1) | | (0.1) |
|
Net loans to customers (amortised cost) |
| 18.5 |
| 19.2 | | 18.4 |
|
| | | | | | | |
Total assets |
| 26.9 |
| 29.9 | | 29.9 |
|
Assets under management (AUMs) (1) |
| 31.7 |
| 28.3 | | 30.2 |
|
Assets under administration (AUAs) (1) |
| 9.1 |
| 5.1 | | 5.4 |
|
Assets under management and administration (AUMA) (1) |
| 40.8 |
| 33.4 | | 35.6 |
|
Customer deposits |
| 37.7 |
| 41.2 | | 39.3 |
|
Loan:deposit ratio (excl. repos and reverse repos) (1) |
| 49 | % | 47 | % | 47 | % |
Risk-weighted assets |
| 11.2 |
| 11.2 | | 11.3 |
|
(1) | Refer to the Non-IFRS financial measures section for details of basis of preparation and reconciliation of non-IFRS financial measures and performance metrics. |
2023 compared with 2022
| - | During 2023, Private Banking continued to support customers to meet their financial goals and manage their wealth responsibly, delivering a return on equity of 14.8% which reflected the impact of a more challenging operating environment. AUMA was 22.2% higher at £40.8 billion and is now greater than customer deposits of £37.7 billion which fell as a result of competitive pressure and a change in customer behaviour. |
| - | Private Banking provided £0.2 billion of climate and sustainable funding and financing in 2023, principally in relation to mortgages on residential properties with EPC A or B certificates. |
| - | Total income was £66 million, or 6.3%, lower than 2022 reflecting lower deposit balances with mix shifting from non-interest bearing to interest bearing balances, as customers migrated to savings products offering higher returns, combined with reduced lending volumes and mortgage margin dilution. |
| - | Net interest margin was 33 basis points lower than 2022 reflecting lower deposit balances with mix shift from non-interest bearing to interest bearing balances and an increase in pass-through of interest rate increases to customers, partly offset by the impact of rate rises on deposit income. |
| - | Non-interest income of £280 million was broadly flat compared to 2022 primarily driven by higher payment services fees offset by reduced investment management income due to product re-pricing. |
| |
NatWest Group – Annual Report on Form 20-F 2023 | 20 |
Segment performance continued
Private Banking continued
| - | Other operating expenses were £66 million, or 10.8%, higher than 2022 reflecting an increase in pay awards to support our colleagues with cost of living challenges, an additional VAT charge, property revaluation costs and strategic spend to increase operational efficiency. |
| - | The impairment charge of £14 million in 2023, compared with a £2 million release in 2022, largely reflects non-recurrence of good book releases in 2022 whilst overall impairments remain at low levels. |
| - | A net impairment charge of £5 million in Q4 2023 largely reflects good book charges whilst stage 3 defaults remain at low levels. |
| - | Net loans to customers decreased by £0.7 billion, or 3.6%, in 2023 as higher levels of customer repayments more than offset gross new lending. |
| - | Customer deposits decreased by £3.5 billion, or 8.5%, in 2023 reflecting an increase in competition and higher tax outflows in Q1 2023. Changes in customer behaviour drove a shift in mix of deposits with a decrease in instant access savings and current accounts, and a switch to term and notice accounts which now represent 30% of deposit balances. |
| - | AUMA increased by £7.4 billion to £40.8 billion, reflecting net inflows of £1.3 billion for AUM and £0.4 billion AUA: strong market performance of £3.4 billion and £2.3 billion Cushon balances following the acquisition in June 2023. |
| - | RWAs of £11.2 billion were in line with 2022 primarily due to a reduction in loans to customers, offset by the mix of new lending which has impacted blended risk weights, and higher operational risk. |
2022 compared with 2021
| - | During 2022, Private Banking provided a strong operating performance with continued balance growth, delivering a return on equity of 24.5%, 7.5 percentage points higher than 2021, and operating profit of £436 million. |
| - | Private Banking provided £0.2 billion of climate and sustainable funding and financing in 2022. At the end of 2022, £6.5 billion of AUM are invested in funds that are on net zero trajectory and are decarbonising at an average rate of 7% per annum. |
| - | Total income of £1,056 million was £240 million, or 29.4%, higher than 2021 driven by higher deposit and lending balances and improved deposit returns supported by interest rate rises. This represents a particularly strong performance given that Q4 2021 reflected the £54 million consideration from the sale of Adam & Company Investment Management Ltd. |
| - | Net interest inome increased by £297 million to £777 million benefitting from improved yield curve movements, higher deposit balances and net loan growth partially offset with the impact of pass-through of interest rate increases to customers. |
| - | Non-interest income of £279 million decreased by £57 million primarily driven by the non repeat of a £54 million consideration from the sale of the Adam & Company investment management business in Q4 2021. |
| - | Net interest margin was 144 basis points higher than 2021 reflecting higher deposit returns and lending growth. Mortgage book margin was 163 basis points in the year. |
| - | Operating expenses of £622 million were £102 million, or 19.6%, higher compared with 2021. Other operating expenses were £87 million, or 16.6%, higher than 2021 due to continued investment in people and technology to enhance AUMA growth propositions and increased investment in financial crime prevention. |
| - | Impairment releases of £2 million in 2022 primarily reflect continued low level of stage 3 defaults and release of post model adjustments, partly offset by a revision of the economic outlook scenario assumptions. |
| - | AUM net flows were £2.0 billion during 2022, which represented 5.6% of opening AUMA balances on an annualised basis, demonstrating a strong performance given volatile investment market conditions. Digital net new money was £0.3 billion, which represented 20.6% of opening Digital AUMA balances. AUMAs decreased by £2.2 billion, or 6.2%, in 2022 primarily reflecting adverse investment market movements of £4.0 billion. |
| - | Customer deposits increased by £1.9 billion, or 4.8%, largely driven by strong savings growth, particularly during H1 2022. |
| - | Net loans to customers increased by £0.8 billion, or 4.3%, in 2022 due to above market mortgage growth of 8%, whilst RWAs decreased by £0.1 billion, or 0.9% driven by capital optimisation initiatives. |
| - | RWAs of £11.2 billion decreased by £0.1 billion, or 0.9%, driven by capital optimisation initiatives. |
| |
NatWest Group – Annual Report on Form 20-F 2023 | 21 |
Segment performance continued
Commercial & Institutional
| | | | | | | |
| | 2023 | | 2022 | | 2021 | |
Income statement |
| £m |
| £m |
| £m | |
Net interest income |
| 5,044 |
| 4,171 |
| 2,974 | |
Non-interest income |
| 2,377 |
| 2,242 |
| 1,864 | |
Total income |
| 7,421 |
| 6,413 |
| 4,838 | |
Other operating expenses |
| (3,867) |
| (3,563) |
| (3,646) | |
Litigation and conduct costs |
| (224) |
| (181) |
| (111) | |
Operating expenses |
| (4,091) |
| (3,744) |
| (3,757) | |
Impairment losses |
| (94) |
| (122) |
| 1,160 | |
Operating profit |
| 3,236 |
| 2,547 |
| 2,241 | |
| | | | | | | |
Performance ratios (1) |
| |
| |
| | |
Return on equity |
| 15.4 | % | 12.2 | % | 10.9 | % |
Net interest margin |
| 3.84 | % | 3.31 | % | 2.46 | % |
Cost:income ratio (excl. litigation and conduct) |
| 52.1 | % | 55.6 | % | 75.4 | % |
Loan impairment rate |
| 7bps | | 9bps | | (92bps) | |
| | | | | | | |
| | 2023 | | 2022 | | 2021 | |
Capital and balance sheet |
| £bn |
| £bn |
| £bn |
|
Loans to customers (amortised cost) |
|
|
|
| | |
|
- Business Banking |
| 4.5 |
| 6.1 | | 8.0 |
|
- Commercial Mid-market | | 71.5 | | 71.7 | | 72.5 | |
- Corporate & Institutions | | 57.4 | | 53.7 | | 45.4 | |
Total loans to customers (amortised cost) |
| 133.4 |
| 131.5 | | 125.9 |
|
Loan impairment provisions |
| (1.5) |
| (1.6) | | (1.7) |
|
Net loans to customers (amortised cost) |
| 131.9 |
| 129.9 | | 124.2 |
|
| | | | | | | |
Total assets |
| 385.0 |
| 404.8 | | 425.9 |
|
Funded assets | | 306.9 | | 306.3 | | 321.3 | |
Customer deposits |
| 193.4 |
| 203.3 | | 217.5 |
|
Loan:deposit ratio (excl. repos and reverse repos) (1) |
| 68 | % | 64 | % | 57 | % |
Risk-weighted assets |
| 107.4 |
| 103.2 | | 98.1 | |
(1) | Refer to the Non-IFRS financial measures section for details of basis of preparation and reconciliation of non-IFRS financial measures and performance metrics. |
2023 compared with 2022
| - | During 2023, Commercial & Institutional continued to support customers with an increase in lending of 1.5% and delivered a strong performance with growth in revenues and operating profit supporting a return on equity of 15.4%, an increase from 12.2% in 2022. |
| - | Commercial & Institutional provided £25.4 billion of climate and sustainable funding and financing in 2023 to support customers investing in the transition to net zero. |
| - | Total income was £1,008 million, or 15.7%, higher than 2022 primarily reflecting higher deposit returns supported by interest rate rises, growth in lending and higher markets income partly offset by higher funding costs. |
| - | Net interest margin was 53 basis points higher than 2022 reflecting higher deposit returns partly offset by higher funding costs. |
| - | Non-interest income was £135 million, or 6.0%, higher than 2022 principally driven by higher lending and financing fees in relation to volume growth, increased credit and debit card fees reflecting higher volumes and margins, higher payment services fees and fixed income performance. |
| - | Other operating expenses were £304 million, or 8.5%, higher than 2022 reflecting higher pay awards to support our colleagues with cost of living challenges and continued investment in the business. |
| |
NatWest Group – Annual Report on Form 20-F 2023 | 22 |
Segment performance continued
Commercial & Institutional continued
| - | An impairment charge of £94 million in 2023, £28 million lower than 2022, reflecting good book releases and lower stage 3 charges. |
| - | Net loans to customers increased by £2.0 billion, or 1.5%, in 2023 reflecting an increase of £4.7 billion from growth in private financing activity, an increase in term loan facilities including an increase in revolving credit utilisations within Corporate & Institutions, and asset finance growth within Commercial Mid-market, partly offset by £2.7 billion of UK Government scheme repayments. |
| - | Customer deposits decreased by £9.9 billion, or 4.9%, in 2023 primarily due to overall market liquidity contraction, particularly in Commercial Mid-market. We have seen strong growth in term deposits balances in 2023 which now represent 19% of deposit balances. Across the year we continued to see a reduction in non-interest bearing balances which now represent 36% of deposit balances. |
| - | RWAs increased by £4.2 billion, or 4.1%, in 2023 primarily reflecting lending facility growth, partly offset by capital optimisation activity and foreign exchange benefits. |
2022 compared with 2021
| - | During 2022, Commercial & Institutional delivered a strong performance with a return on equity of 12.2% and an operating profit of £2,547 million. |
| - | Commercial & Institutional provided £20.3 billion of climate and sustainable funding and financing in 2022. |
| - | Total income was £1,575 million, or 32.6%, higher than 2021 reflecting higher deposit returns from an improved interest rate environment, net loan growth, improved card payment fees and higher markets income. Markets income(1) of £698 million, was £231 million, or 49.5%, higher than 2021 reflecting stronger performance across the product suite. |
| - | Net interest income increased by £1,197 million to £4,171 million benefiting from improved yield curve movements, due to interest rate increases, and net loan growth. |
| - | Non-interest income of £2,242 million increased by £378 million primarily driven by increased card payment fees, higher payment services fees and increased income in our markets business. |
| - | Net interest margin was 85 basis points higher than 2021 reflecting higher deposits returns. |
| - | Operating expenses of £3,744 were £13 million, or 0.3%, lower compared with 2021. Other operating expenses were £83 million, or 2.3%, lower than 2021 reflecting cost efficiencies whilst continuing to invest in the business. A 4.2% headcount increase was a result of continuing to build capability including the take payment proposition. |
| - | A net impairment charge of £122 million in 2022 was predominantly driven by the downward revision of economic outlook assumptions in the scenarios compared to a £1,160 million credit in 2021. |
| - | Net loans to customers increased by £5.7 billion, or 4.6%, in 2022 due to increased term loans and funds activity within Corporate & Institutions, growth in invoice and asset finance balances within the Commercial Mid-market business partly offset by UK Government scheme balance reductions of £3.4 billion across Commercial Mid-market and Business Banking. |
| - | Customer deposits decreased by £14.2 billion, or 6.5% in 2022 due to overall market liquidity contraction in the second half of the year following heightened levels built up during Covid in 2020 and 2021 and reductions in Corporate and Institutions, particularly non-operational accounts in Financial Institutions and professional services with relatively low margin and funding value. |
| - | RWAs increased by £5.1 billion, or 5.2%, in 2022 primarily reflecting 1st January 2022 regulatory changes and lending growth partly offset by a reduction in counterparty credit risk, operational risk and management actions. |
Central items & other
| | | | | | |
|
| 2023 |
| 2022 | | 2021 |
Income statement - continuing operations | | £m | | £m |
| £m |
Total income |
| 410 |
| 41 | | 330 |
Operating expenses (1) |
| (392) |
| (728) | | (968) |
of which: Other operating expenses |
| (387) |
| (645) | | (686) |
of which: Ulster Bank RoI direct expenses |
| (275) |
| (433) | | (292) |
Impairment (losses)/releases |
| (5) |
| 12 | | (77) |
Operating profit/(loss) |
| 13 |
| (675) | | (715) |
of which: Ulster Bank RoI |
| (473) |
| (723) | | (414) |
| | | | | | |
| | 2023 | | 2022 | | 2021 |
Capital and balance sheet |
| £bn |
| £bn | | £bn |
Net loans to customers (amortised cost) (2) | | 25.8 | | 19.6 | | 34.2 |
Customer deposits | | 12.3 | | 17.4 | | 34.1 |
RWAs |
| 2.8 |
| 7.0 | | 10.9 |
| (1) | Includes withdrawal-related direct program costs of £91 million for the year ended 31 December 2023 (31 December 2022 – £195 million). |
| (2) | Excludes £0.3 billion of loans to customers held at fair value through profit or loss (31 December 2022 – £0.5 billion). |
| |
NatWest Group – Annual Report on Form 20-F 2023 | 23 |
Segment performance continued
Central items & other continued
2023 compared with 2022
| - | Total income was £369 million higher than 2022 primarily reflecting notable items including foreign exchange recycling gains of £484 million, lower losses on redemption of own debt, business growth fund gains and lower losses on liquidity asset bond sales, partially offset by lower gains on interest and foreign exchange risk management derivatives not in accounting hedge relationships and losses associated with property lease terminations. |
| - | Other operating expenses were £258 million, or 40.0%, lower than 2022 principally reflecting the reduction in cost due to our withdrawal of operations from the Republic of Ireland. |
| - | Net loans to customers increased by £6.2 billion, to £25.8 billion, over the year mainly due to reverse repo activity in Treasury. |
| - | Customer deposits decreased by £5.1 billion 2023 primarily reflecting our withdrawal of our operations from the Republic of Ireland. Ulster Bank RoI customer deposit balances were £0.2 billion as at Q4 2023. |
2022 compared with 2021
| - | Total income for 2022 included £369 million of gains from risk management derivatives not in hedge accounting relationships, partially offset by £202 million of losses on redemption of own debt and £88 million of bond disposal losses. |
| - | 2021 included litigation and conduct charges of £282 million and losses on redemption of own debt of £138 million related to the repurchase of legacy instruments, partially offset by a £219 million share of gains under equity accounting for Business Growth Fund. |
| - | 2022 operating expenses included £678 million in Ulster Bank RoI, of which £195 million were withdrawal related costs. In 2021 operating expenses in Ulster Bank RoI totalled £482 million, of which £17 million were withdrawal related costs. |
| |
NatWest Group – Annual Report on Form 20-F 2023 | 24 |
Summary financial statements
Summary consolidated income statement
For the year ended 31 December 2023
| | | | | | |
|
| 2023 |
| 2022 |
| 2021 |
| | £m | | £m | | £m |
Net interest income |
| 11,049 |
| 9,842 |
| 7,535 |
Non-interest income |
| 3,703 |
| 3,314 |
| 2,894 |
Total income |
| 14,752 |
| 13,156 |
| 10,429 |
Operating expenses |
| (7,996) |
| (7,687) |
| (7,758) |
Profit before impairment losses |
| 6,756 |
| 5,469 |
| 2,671 |
Impairment losses |
| (578) |
| (337) |
| 1,173 |
Operating profit before tax |
| 6,178 |
| 5,132 |
| 3,844 |
Tax charge |
| (1,434) |
| (1,275) |
| (996) |
Profit from continuing operations |
| 4,744 |
| 3,857 |
| 2,848 |
(Loss)/profit from discontinued operations, net of tax |
| (112) |
| (262) |
| 464 |
Profit for the year |
| 4,632 |
| 3,595 |
| 3,312 |
| | | | | | |
Attributable to: |
| |
| |
| |
Ordinary shareholders |
| 4,394 |
| 3,340 |
| 2,950 |
Preference shareholders |
| — |
| — |
| 19 |
Paid-in equity holders |
| 242 |
| 249 |
| 299 |
Non-controlling interests |
| (4) |
| 6 |
| 44 |
|
| 4,632 |
| 3,595 |
| 3,312 |
| |
NatWest Group – Annual Report on Form 20-F 2023 | 25 |
Summary consolidated balance sheet
As at 31 December 2023
| | | | | | |
|
| 2023 |
| 2022 |
| 2021 |
| | £m | | £m | | £m |
Cash and balances at central banks |
| 104,262 |
| 144,832 |
| 177,757 |
Trading assets |
| 45,551 |
| 45,577 |
| 59,158 |
Derivatives |
| 78,904 |
| 99,545 |
| 106,139 |
Settlement balances |
| 7,231 |
| 2,572 |
| 2,141 |
Loans to banks and customers - amortised cost |
| 388,347 |
| 373,479 |
| 366,672 |
Other financial assets |
| 51,102 |
| 30,895 |
| 46,145 |
Other and intangible assets |
| 16,374 |
| 16,292 |
| 14,965 |
Assets of disposal groups |
| 902 |
| 6,861 |
| 9,015 |
Total assets |
| 692,673 |
| 720,053 |
| 781,992 |
| | | | | | |
Deposits |
| 453,567 |
| 470,759 |
| 506,089 |
Trading liabilities |
| 53,636 |
| 52,808 |
| 64,598 |
Settlement balances, derivatives, other financial liabilities and subordinated liabilities |
| 139,843 |
| 151,426 |
| 160,658 |
Other liabilities |
| 5,202 |
| 5,346 |
| 5,797 |
Owners' equity |
| 37,157 |
| 36,488 |
| 41,796 |
Notes in circulation | | 3,237 | | 3,218 | | 3,047 |
Non-controlling interests |
| 31 |
| 8 |
| 7 |
Total liabilities and equity |
| 692,673 |
| 720,053 |
| 781,992 |
NatWest Group’s financial statements are prepared in accordance with UK adopted International Accounting Standards (IAS), and International Financial Reporting Standards (IFRS) as issued by the International Accounting Standards Board (IASB).
| |
NatWest Group – Annual Report on Form 20-F 2023 | 26 |
Competition
Introduction
NatWest Group’s ability to attract and manage funding remains a critical competitive advantage. Other key competitive factors include cost management, growing digital sales focus, branch network re-shaping, and product simplification. Cost management remains a key focus, as banks seek to simplify their organisational and IT architectures while at the same time investing to ensure that they can meet customers’ evolving channel preferences. Customers have increasingly focused on the use of internet and mobile as sales and service channels for certain types of products. Therefore, competitive position and performance increasingly depends on the possession of user-friendly, diverse and efficient online solutions.
Retail Banking
In the Retail Banking business, NatWest Group competes with a range of providers including UK banks and building societies, major retailers and life assurance companies, as well as the UK subsidiaries of major international banks. In the mortgage market, NatWest Group competes with UK banks, building societies and specialist lenders. Increasingly, the ambitions of non-traditional players in the UK market are gaining credibility, with new entrants active and seeking to build their platforms either through organic growth or in some cases by acquiring businesses made available through the restructuring of incumbents.
Entrants with new business models such as peer-to-peer lending platforms, while currently small, continue to grow rapidly and are emerging as significant competitors. Such competitors often target specific elements of the value chain, providing specialised services to particular customer segments.
In the UK credit card market, large retailers and specialist card issuers are active in addition to the UK banks. In addition to physical distribution channels, providers compete through direct marketing activity and digital channels.
NatWest Group distributes life assurance products to banking customers in competition with independent advisors and life assurance companies.
Private Banking
In the Private Banking business, NatWest Group serves UK connected high-net-worth individuals and their business interests. The bank competes with UK private banks, international private banks and wealth managers. Competition remains strong as banks maintain their focus on competing for affluent and high net worth customers, supporting customers in need of financial advice. Investment in digital and M&A remain key themes with fee pressure ongoing, in response to Consumer Duty and market competition.
Commercial & Institutional
Commercial & Institutional consists of customer businesses reported under Business Banking, Commercial Mid-market and Corporate & Institutions support our customers across the full non-personal customer lifecycle, both domestically and internationally. Our Markets offering helps our customers manage financial risks across different geographies, while our International offering provides full-service banking operations in the Channel Islands, Isle of Man, Gibraltar and Luxembourg.
In the business banking market, the bank competes with other UK banks, specialist finance providers and building societies. The Commercial Mid-market segment primarily competes with UK Banks and also includes an asset finance and invoice finance offering which competes with banks and specialist finance providers, both captive and non-captive. Competition for corporate, institutional and business customers in the UK is from UK banks, from specialised global and regional investment banks and from large foreign universal banks that offer combined investment and commercial banking capabilities as well as from new entrants and non-bank challengers.
Our Corporate & Institutions business also competes with international banks which offer offshore and domestic banking services in the Channel Islands, Gibraltar and the Isle of Man as well as depositary services in UK and Luxembourg. In addition, the business provides financing and risk solutions to large corporates in the UK and Western Europe as well as global financial institutions and competes with large domestic banks, major international banks and a number of investment banks that offer risk management, trading solutions and debt financing to financial institutions and UK and European corporate customers.
Key competitive factors in this market include entrants with new technology-based business model, ability to develop digital innovation, expertise and markets insight of employees and delivering value-adding bespoke solutions for customers.
| |
NatWest Group – Annual Report on Form 20-F 2023 | 27 |
Financial statements
| |
| Page |
Independent auditor’s report (PCAOB number: 1438) | 29 |
Consolidated income statement for the year ended 31 December 2023 | 36 |
Consolidated statement of comprehensive income for the year ended 31 December 2023 | 37 |
38 | |
Consolidated statement of changes in equity for the year ended 31 December 2023 | 39 |
Consolidated cash flow statement for the year ended 31 December 2023 | 42 |
43 | |
| |
53 | |
54 | |
55 | |
59 | |
65 | |
72 | |
73 | |
8 Discontinued operations and assets and liabilities of disposal groups | 78 |
80 | |
80 | |
85 | |
98 | |
101 | |
102 | |
110 | |
112 | |
113 | |
114 | |
114 | |
115 | |
116 | |
117 | |
120 | |
122 | |
123 | |
124 | |
131 | |
28 Analysis of the net investment in business interests and intangible assets | 132 |
133 | |
133 | |
134 | |
135 | |
135 | |
137 |
| |
NatWest Group – Annual Report on Form 20-F 2023 | 28 |
Report of Independent Registered Public Accounting Firm
To the Shareholders and the Board of Directors of NatWest Group plc
Opinion on the Financial Statements
We have audited the accompanying consolidated balance sheets of NatWest Group plc (the “Group”) as of 31 December 2023 and 2022 , the related consolidated income statement, consolidated statements of comprehensive income, changes in equity and cash flows for each of the three years in the period ended 31 December 2023, the related Accounting policies and Notes 1 to 34, and the information identified as audited in the Annual remuneration report in the Directors’ remuneration report and in the Risk and capital management section (collectively referred to as the “consolidated financial statements”). In our opinion, the consolidated financial statements present fairly, in all material respects, the financial position of the Group at 31 December 2023 and 2022 and the results of its operations and its cash flows for each of the three years in the period ended 31 December 2023, in conformity with International Financial Reporting Standards as issued by the International Accounting Standards Board.
We also have audited, in accordance with the standards of the Public Company Accounting Oversight Board (United States) (PCAOB), the Group’s internal control over financial reporting as of 31 December 2023, based on criteria established in Internal Control-Integrated Framework issued by the Committee of Sponsoring Organizations of the Treadway Commission (2013 framework), and our report dated 23 February 2024 expressed an unqualified opinion thereon.
Basis for Opinion
These financial statements are the responsibility of the Group’s management. Our responsibility is to express an opinion on the Group’s financial statements based on our audits. We are a public accounting firm registered with the PCAOB and are required to be independent with respect to the Group in accordance with the U.S. federal securities laws and the applicable rules and regulations of the Securities and Exchange Commission and the PCAOB.
We conducted our audits in accordance with the standards of the PCAOB. Those standards require that we plan and perform the audit to obtain reasonable assurance about whether the financial statements are free of material misstatement, whether due to error or fraud. Our audits included performing procedures to assess the risks of material misstatement of the financial statements, whether due to error or fraud, and performing procedures that respond to those risks. Such procedures included examining, on a test basis, evidence regarding the amounts and disclosures in the financial statements. Our audits also included evaluating the accounting principles used and significant estimates made by management, as well as evaluating the overall presentation of the financial statements. We believe that our audits provide a reasonable basis for our opinion.
Critical Audit Matters
The critical audit matters communicated below are matters arising from the current period audit of the financial statements that were communicated or required to be communicated to the audit committee and that: (1) relate to accounts or disclosures that are material to the financial statements and (2) involved our especially challenging, subjective or complex judgements. The communication of critical audit matters does not alter in any way our opinion on the consolidated financial statements, taken as a whole, and we are not, by communicating the critical audit matters below, providing separate opinions on the critical audit matters or on the accounts or disclosures to which they relate.
Report of Independent Registered Public Accounting Firm continued
Description of the Matter | How We Addressed the Matter in Our Audit |
Estimate of expected credit loss provisions | |
At 31 December 2023, the Group reported total gross loans – amortised cost and FVOCI of £392 billion and associated £3.6 billion of expected credit losses (‘ECL’). As explained more fully in the Accounting policies, the credit risk section of the Risk and capital management section and Note 15 to the consolidated financial statements, ECL is recognised for financial instruments classified as amortised cost or fair value through other comprehensive income. Performing assets are measured at either (i) 12-month ECL (stage 1) or (ii) for those assets that are considered to have a significant increase in credit risk (‘SICR’), lifetime ECL (stage 2). Defaulted assets (stage 3) are also measured at lifetime ECL. Auditing the ECL estimate was complex due to the judgemental methods used to estimate the ECL, including: accounting interpretations, modelling assumptions and the selection and use of the data used to build and run modelled estimates of Probability of Default (‘PD’), Loss Given Default (‘LGD’) and Exposure at Default (‘EAD’); how to allocate assets between the stages; multiple economic scenarios incorporated in the models; post-model adjustments applied; and the recovery and timing assumptions for individually provided stage 3 ECLs. The ongoing impact of the uncertain geopolitical and economic outlook led to increased judgements applied in these areas. | We evaluated the design and tested the operating effectiveness of controls over the ECL process, including those over the judgements and estimates noted above. The controls we tested included, amongst others, controls over monitoring of the criteria used to allocate assets into stages, model governance, credit monitoring, individual provisions and the governance over the review of the overall ECL, including the application of model adjustments. To test the ECL provision, amongst other procedures, we performed an overall assessment of the ECL provision levels by stage to assess if they were reasonable by considering the overall credit quality of the Group’s portfolios, risk profile, the current geopolitical and macroeconomic environment, and the industries to which the Group is exposed, as well as performing peer benchmarking, where available, to assess overall staging and provision coverage levels. We evaluated the criteria used to allocate a financial asset to stage 1, 2 or 3 in accordance with IFRS 9, recalculated the staging of the complete population of assets, and performed sensitivity analysis to assess the impact of different criteria on the ECL and the impact of performing collective staging downgrades to industries, geographic regions and high-risk populations particularly impacted by recent economic conditions. We selected a sample of ECL models based on both quantitative and qualitative factors, and involved our modelling specialists to test the assumptions, inputs, methodology and model build. This included a combination of assessing model design and formulae, alternative modelling techniques, recalculating the PD, LGD and EAD, and implementation of new models during the year. We also considered the results of the Group’s internal model monitoring and validation results. To evaluate completeness and accuracy of data used in the ECL calculation, we agreed a sample of data points to source systems, including data used to run the models and historic loss data to monitor the models. We involved our economic specialists to assist us in evaluating the base case and alternative economic scenarios, including evaluating probability weights and considering contrary evidence from external sources. We tested a sample of Post Model Adjustments held at year end. This included challenging the identification of retail customers vulnerable to price and rate increases, commercial sub-sectors susceptible to inflation and liquidity challenges, loss given default assumptions, time to collect and model shortcomings. With our modelling specialists, we assessed the risk of bias and the completeness of these adjustments by considering the data, judgements, methodology, sensitivities, and governance of these adjustments. We evaluated and recalculated the scenarios, assumptions and cash flows for a sample of individual provisions including the alternative scenarios and the probability weights assigned, involving our valuation specialists where appropriate. We also evaluated the adequacy of the related disclosures provided in the consolidated financial statements. |
| |
NatWest Group – Annual Report on Form 20-F 2023 | 30 |
Report of Independent Registered Public Accounting Firm continued
Description of the Matter | How We Addressed the Matter in Our Audit |
Impairment of goodwill and recognition of deferred tax assets | |
At 31 December 2023, the Group had reported goodwill of £5.7 billion and net deferred tax assets of £1.8 billion as explained in Note 17 and Note 7, respectively, to the consolidated financial statements. The assessment of potential impairment of goodwill and recognition of deferred tax assets are based on estimates of future profitability, which require significant management judgement. Auditing the impairment assessment of goodwill was complex because it involved estimates of future profitability, long-term growth rates and discount rates to determine the value in use (VIU). Auditing the recognition of the deferred tax asset was complex because it involved estimates of future profitability and long-term growth rates. The assumptions listed above require significant management judgement, and include the risk of management bias due to the forward-looking nature and inherent uncertainties associated with such assumptions. | We evaluated the design and tested the operating effectiveness of controls over the preparation and review of the forecasts, and the significant assumptions listed above. For example, we tested the controls over management’s review over the long-term growth rate used in the VIU models. To test the valuation of goodwill and recognition of deferred tax assets, amongst other procedures, we involved our economic specialists to evaluate the macroeconomic assumptions used in the Group’s forecasts. We assessed the reasonableness of revenue and cost forecasts by evaluating the underlying business strategies, comparing to expected market trends and historical performance and considering anticipated balance sheet growth. With the assistance of our valuation specialists, we tested the reasonableness of key performance indicators used in the forecasts by comparing against peers. We evaluated how the long-term growth rates used by management compared to our ranges which were developed using peer practice, external market data and calculations performed by our valuation specialists. We evaluated how management considered alternative assumptions and performed our own sensitivity and scenario analyses on certain assumptions, such as revenue and cost forecasts, and long-term growth rates and other key performance indicators on both the detailed forecasts and on an overall basis. In addition to the above to test the valuation of goodwill we evaluated the method of calculating the recoverable amount (VIU) and how the discount rates used by management compared to our ranges which were developed using peer practice, external market data and calculations performed by our valuation specialists. We also evaluated the adequacy of the related dislcosures provided in the consolidated financial statements. |
| |
NatWest Group – Annual Report on Form 20-F 2023 | 31 |
Report of Independent Registered Public Accounting Firm continued
Description of the Matter | How We Addressed the Matter in Our Audit |
Provisions for customer redress, litigation and other regulatory matters | |
At 31 December 2023, the Group has reported £1.0 billion of provisions for liabilities and charges, including £0.6 billion for customer redress, litigation and other regulatory matters as detailed in Note 21 and 26 to the consolidated financial statements. The Group operates in an industry where it is subject to litigation, including regulatory scrutiny and investigations. The Group recognises provisions for customer redress, litigation and other regulatory matters when it has a present obligation. Management judgement is needed to determine whether a present obligation exists, a provision should be recorded and how to measure any required provision in accordance with the accounting criteria set out under IAS 37. Auditing the adequacy of these provisions was complex due to management’s judgement in the selection and use of assumptions, which included expected claim rates, legal costs, and the timing of settlement, to determine if a present obligation exists, an outflow is probable and can be estimated, and adequately disclosed. | We evaluated the design and tested the operating effectiveness of controls over the identification, completeness, estimation, monitoring and disclosure of provisions related to customer redress, litigation and other regulatory matters. Where appropriate, we involved our conduct risk and forensics specialists to assist us in evaluating the assumptions, including expected claim rates, legal costs, and the timing of settlement, to determine the resulting provisions for specific customer redress, litigation and other regulatory matters. We assessed the risks facing the Group, including the status of any investigations and implications of these on the Group’s provisions for customer redress, litigation and other regulatory matters through our inquiries with internal legal counsel. We tested management’s assessment of the potential outcomes, including the completeness of the data considered in making these assessments. Where no provision was booked by management, we assessed this conclusion with reference to the requirements of IAS 37. Where relevant we undertook this assessment with the input of our specialists, including conduct specialists. We examined relevant regulatory and legal correspondence, and where relevant obtained and reviewed reports from external counsel. We also considered regulatory developments to identify actual or possible non-compliance with laws and regulations that might have a material effect on the financial statements. We also evaluated the adequacy of the related disclosures provided in the consolidated financial statements. |
| |
NatWest Group – Annual Report on Form 20-F 2023 | 32 |
Report of Independent Registered Public Accounting Firm continued
Description of the Matter | How We Addressed the Matter in Our Audit |
Valuation of financial instruments with higher risk characteristics | |
As reported in Note 11 to the financial statements, as at 31 December 2023, the Group held financial instruments with higher risk characteristics. This included (but is not limited to) reported level 3 assets of £2.0 billion and level 3 liabilities of £0.7 billion whose value is dependent on unobservable inputs. Auditing management’s judgements and assumptions used in the estimation of the fair value of these instruments was complex due to the judgemental nature of valuation techniques, modelling assumptions, significant illiquid inputs and certain valuation adjustments. Complex models were used to value exotic features in certain interest rate swaps and options. Judgemental unobservable inputs included discount rates associated with derivatives with complex collateral arrangements and illiquid loans. Judgemental fair value adjustments included Funding Valuation Adjustments (FVA), Credit Valuation Adjustments (CVA), and material product and deal specific adjustments on long-dated derivative portfolios. | We evaluated the design and tested the operating effectiveness of controls relating to financial instrument valuation, which included controls over the bank’s independent price verification process, valuation models governance, collateral management and income statement analysis. Amongst other procedures, we involved our financial instrument valuation and modelling specialists to assist us in testing complex model-dependent valuations by performing independent revaluation to assess the appropriateness of models and the adequacy of both assumptions and inputs. We also independently re-priced a sample of instruments that had been valued using illiquid pricing inputs, using alternative pricing sources, where available, to evaluate management’s valuation. In addition, we compared fair value adjustment methodologies against current market practice. With the assistance of our specialists, we revalued a sample of counterparty level FVAs and CVAs, comparing funding spreads to third party data and independently assessed illiquid CVA inputs. We also tested material product and deal specific adjustments on long-dated derivative portfolios and assessed other information, including trading activity, asset disposals and collateral discrepancies, to evaluate modelling assumptions and inputs. |
| |
NatWest Group – Annual Report on Form 20-F 2023 | 33 |
Report of Independent Registered Public Accounting Firm continued
Description of the Matter | How We Addressed the Matter in Our Audit |
Valuation of hard to value pension assets and the defined benefit obligation | |
At 31 December 2023, the Group reported a net pension asset of £102 million comprising £201 million of schemes in surplus and £99 million of schemes in deficit. As explained in the accounting policies and Note 5 to the consolidated financial statements, the defined benefit obligation is measured on an actuarial basis. The charge to the income statement for pension costs is recognised in operating expenses. Actuarial gains and losses are recognised in other comprehensive income in full in the period in which they arise. Auditing the pension plan was complex due to the judgemental nature of the assumptions used in the estimation of the fair value of the schemes’ illiquid assets and the defined benefit obligation. These assumptions included, the discount rate, inflation, pension payment and longevity used in the valuation of retirement benefit liabilities. The estimation of the fair value of the pension schemes’ assets was complex due to the judgemental nature of the assumptions and calibrations for illiquid or complex model-dependent valuations of certain investments held by the pension schemes. | We evaluated the design and tested the operating effectiveness of controls over the process covering the valuation of the defined benefit obligation and hard to value assets. For example, we tested controls over management’s review of the actuarial assumptions used in developing the defined benefit obligation. To test the defined benefit obligation, we involved our actuarial specialists to assist in evaluating the actuarial assumptions as discussed above by comparing them to ranges independently developed from third party sources and market data. With the assistance of our specialists, we assessed the impact on pension liabilities due to changes in financial and longevity assumptions over the year, by comparing to third-party sources and market data. We tested the fair value of scheme assets by independently calculating the fair value for a sample of the assets held. We involved our valuation specialists to assess the appropriateness of management’s valuation methodology including the judgements made in determining significant assumptions used in the valuation of complex and illiquid pension assets. We independently re-priced illiquid and complex assets that had been valued using unobservable market inputs, using alternative pricing sources where available, to evaluate management’s valuations. We also evaluated the adequacy of the related disclosures provided in the consolidated financial statements. |
/s/ Ernst & Young LLP
We have served as the Group’s auditors since 2016.
London, United Kingdom
23 February 2024
| |
NatWest Group – Annual Report on Form 20-F 2023 | 34 |
Report of Independent Registered Public Accounting Firm
To the Shareholders and the Board of Directors of NatWest Group plc
Opinion on Internal Control over Financial Reporting
We have audited NatWest Group plc and subsidiaries’ (the “Group”) internal control over financial reporting as of 31 December 2023, based on criteria established in Internal Control—Integrated Framework issued by the Committee of Sponsoring Organizations of the Treadway Commission (2013 framework) (the COSO criteria). In our opinion, the Group maintained, in all material respects, effective internal control over financial reporting as of 31 December 2023, based on the COSO criteria.
We also have audited, in accordance with the standards of the Public Company Accounting Oversight Board (United States) (PCAOB), the consolidated balance sheets of the Group as of 31 December 2023 and 2022, the related consolidated income statement, consolidated statements of comprehensive income, changes in equity and cash flows for each of the three years in the period ended 31 December 2023, the related Accounting policies and Notes 1 to 34, and the information identified as audited in the Annual remuneration report in the Directors’ remuneration report and in the Risk and capital management section and our report dated 23 February 2024 expressed an unqualified opinion thereon.
Basis for Opinion
The Group’s management is responsible for maintaining effective internal control over financial reporting and for its assessment of the effectiveness of internal control over financial reporting included in the accompanying Management’s Report on Internal Control over Financial Reporting. Our responsibility is to express an opinion on the Group’s internal control over financial reporting based on our audit. We are a public accounting firm registered with the PCAOB and are required to be independent with respect to the Group in accordance with the U.S. federal securities laws and the applicable rules and regulations of the Securities and Exchange Commission and the PCAOB.
We conducted our audit in accordance with the standards of the PCAOB. Those standards require that we plan and perform the audit to obtain reasonable assurance about whether effective internal control over financial reporting was maintained in all material respects.
Our audit included obtaining an understanding of internal control over financial reporting, assessing the risk that a material weakness exists, testing and evaluating the design and operating effectiveness of internal control based on the assessed risk, and performing such other procedures as we considered necessary in the circumstances. We believe that our audit provides a reasonable basis for our opinion.
Definition and Limitations of Internal Control Over Financial Reporting
A company’s internal control over financial reporting is a process designed to provide reasonable assurance regarding the reliability of financial reporting and the preparation of financial statements for external purposes in accordance with generally accepted accounting principles. A company’s internal control over financial reporting includes those policies and procedures that (1) pertain to the maintenance of records that, in reasonable detail, accurately and fairly reflect the transactions and dispositions of the assets of the company; (2) provide reasonable assurance that transactions are recorded as necessary to permit preparation of financial statements in accordance with generally accepted accounting principles, and that receipts and expenditures of the company are being made only in accordance with authorisations of management and directors of the company; and (3) provide reasonable assurance regarding prevention or timely detection of unauthorised acquisition, use, or disposition of the company’s assets that could have a material effect on the financial statements.
Because of its inherent limitations, internal control over financial reporting may not prevent or detect misstatements. Also, projections of any evaluation of effectiveness to future periods are subject to the risk that controls may become inadequate because of changes in conditions, or that the degree of compliance with the policies or procedures may deteriorate.
/s/ Ernst & Young LLP
We have served as the Group’s auditors since 2016.
London, United Kingdom
23 February 2024
| |
NatWest Group – Annual Report on Form 20-F 2023 | 35 |
Consolidated income statement
For the year ended 31 December 2023
| | | | | | | | |
|
| |
| 2023 |
| 2022 |
| 2021 (1) |
|
| Note |
| £m |
| £m |
| £m |
Interest receivable | | |
| 21,026 |
| 12,637 |
| 9,234 |
Interest payable | | |
| (9,977) |
| (2,795) |
| (1,699) |
Net interest income |
| 1 |
| 11,049 |
| 9,842 |
| 7,535 |
Fees and commissions receivable | | | | 2,983 | | 2,915 | | 2,694 |
Fees and commissions payable | | |
| (653) |
| (623) |
| (574) |
Trading income | | |
| 794 |
| 1,133 |
| 323 |
Other operating income | | |
| 579 |
| (111) |
| 451 |
Non-interest income |
| 2 |
| 3,703 |
| 3,314 |
| 2,894 |
Total income | | |
| 14,752 |
| 13,156 |
| 10,429 |
Staff costs | | | | (3,901) | | (3,716) | | (3,676) |
Premises and equipment | | |
| (1,153) |
| (1,112) |
| (1,133) |
Other administrative expenses | | |
| (2,008) |
| (2,026) |
| (2,026) |
Depreciation and amortisation | | |
| (934) |
| (833) |
| (923) |
Operating expenses | | 3 |
| (7,996) |
| (7,687) |
| (7,758) |
Profit before impairment losses/releases | | |
| 6,756 |
| 5,469 |
| 2,671 |
Impairment (losses)/releases |
| 15 |
| (578) |
| (337) |
| 1,173 |
Operating profit before tax | | |
| 6,178 | | 5,132 |
| 3,844 |
Tax charge |
| 7 |
| (1,434) | | (1,275) |
| (996) |
Profit from continuing operations | | |
| 4,744 | | 3,857 |
| 2,848 |
(Loss)/profit from discontinued operations, net of tax (3) |
| 8 |
| (112) |
| (262) |
| 464 |
Profit for the year | | | | 4,632 | | 3,595 | | 3,312 |
| | | | | | | | |
Attributable to: | | |
| | | |
| |
Ordinary shareholders | | | | 4,394 | | 3,340 | | 2,950 |
Preference shareholders | | | | — | | — | | 19 |
Paid-in equity holders | | |
| 242 | | 249 |
| 299 |
Non-controlling interests | | |
| (4) | | 6 |
| 44 |
| | | | 4,632 | | 3,595 | | 3,312 |
| | | | | | | | |
| | | | | | | | |
Earnings per ordinary share - continuing operations | | 9 | | 49.2p | | 36.5p | | 23.0p |
Earnings per ordinary share - discontinued operations | | 9 | | (1.2p) | | (2.7p) | | 4.3p |
Total earnings per share attributable to ordinary shareholders - basic (4) | | 9 | | 47.9p | | 33.8p | | 27.3p |
Earnings per ordinary share - fully diluted continuing operations | | 9 | | 48.9p | | 36.2p | | 22.9p |
Earnings per ordinary share - fully diluted discontinued operations | | 9 | | (1.2p) | | (2.6p) | | 4.3p |
Total earnings per share attributable to ordinary shareholders - fully diluted | | 9 | | 47.7p | | 33.6p | | 27.2p |
The accompanying notes on pages 53 to 137, the Accounting policies on pages 43 to 52 and the audited sections of the Risk and capital management section on pages 156 to 267 (exhibit 15.2) form an integral part of these financial statements.
| (1) | Comparative results have been re-presented from those previously published to reclassify certain items as discontinued operations as described in Note 8 to the consolidated financial statements. |
| (2) | At the General Meeting and Class Meeting on 25 August 2022, the shareholders approved the proposed special dividend and share consolidation. On 30 August 2022 the issued ordinary share capital was consolidated in the ratio of 14 existing shares for 13 new shares. The average number of shares and earnings per share have been adjusted retrospectively. |
| (3) | The results of discontinued operations, comprising the post-tax profit, is shown as a single amount on the face of the income statement. An analysis of this amount is presented in Note 8 to the consolidated financial statements. |
| (4) | In 2023, the unrounded Total earnings per share attributable to ordinary shareholders – basic is 47.948p. The unrounded Earnings per ordinary share – continuing operations was 49.170p. The unrounded Earnings per ordinary share – discontinued operations was (1.222p). |
Consolidated statement of comprehensive income
For the year ended 31 December 2023
| | | | | | |
|
| 2023 |
| 2022 |
| 2021 |
| | £m |
| £m |
| £m |
Profit for the year | | 4,632 |
| 3,595 |
| 3,312 |
Items that do not qualify for reclassification | | | | | | |
Remeasurement of retirement benefit schemes | | (280) | | (840) | | (669) |
Changes in fair value of credit in financial liabilities designated at FVTPL | | (39) | | 50 | | (29) |
FVOCI financial assets | | 17 | | 59 | | 13 |
Tax | | 79 |
| 187 |
| 164 |
| | (223) |
| (544) |
| (521) |
| | | | | | |
Items that do qualify for reclassification | | | | | | |
FVOCI financial assets | | 49 |
| (457) |
| (100) |
Cash flow hedges (1) | | 1,208 |
| (3,277) |
| (848) |
Currency translation | | (619) |
| 241 |
| (382) |
Tax | | (361) |
| 1,067 |
| 213 |
| | 277 |
| (2,426) |
| (1,117) |
Other comprehensive income/(losses) after tax | | 54 |
| (2,970) |
| (1,638) |
Total comprehensive income for the year | | 4,686 |
| 625 |
| 1,674 |
| | | | | | |
Attributable to: | | | | | | |
Ordinary shareholders | | 4,448 |
| 370 |
| 1,308 |
Preference shareholders | | — |
| — |
| 19 |
Paid-in equity holders | | 242 |
| 249 |
| 299 |
Non-controlling interests | | (4) |
| 6 |
| 48 |
| | 4,686 |
| 625 |
| 1,674 |
The accompanying notes on pages 53 to 137, the Accounting policies on pages 43 to 52 and the audited sections of the Risk and capital management section on pages 156 to 267 (exhibit 15.2) form an integral part of these financial statements.
(1) | Refer to footnotes 6 and 7 of the Consolidated statement of changes in equity. |
| |
NatWest Group – Annual Report on Form 20-F 2023 | 37 |
Consolidated balance sheet
As at 31 December 2023
| | | | | | |
|
| |
| 2023 |
| 2022 |
|
| Note |
| £m |
| £m |
Assets | | | | | | |
Cash and balances at central banks |
| 10 |
| 104,262 |
| 144,832 |
Trading assets | | 13 | | 45,551 | | 45,577 |
Derivatives | | 14 | | 78,904 | | 99,545 |
Settlement balances |
| |
| 7,231 |
| 2,572 |
Loans to banks - amortised cost |
| 10 |
| 6,914 |
| 7,139 |
Loans to customers - amortised cost | | 10 |
| 381,433 |
| 366,340 |
Securities subject to repurchase agreements |
| |
| 8,764 | | 2,901 |
Other financial assets excluding securities subject to repurchase agreements |
| |
| 42,338 |
| 27,994 |
Other financial assets |
| 16 |
| 51,102 |
| 30,895 |
Intangible assets |
| 17 |
| 7,614 |
| 7,116 |
Other assets |
| 18 |
| 8,760 |
| 9,176 |
Assets of disposal groups | | 8 | | 902 | | 6,861 |
Total assets | | |
| 692,673 |
| 720,053 |
| | | | | | |
Liabilities | | | | | | |
Bank deposits | | 10 | | 22,190 | | 20,441 |
Customer deposits | | 10 | | 431,377 | | 450,318 |
Settlement balances |
| |
| 6,645 |
| 2,012 |
Trading liabilities |
| 13 |
| 53,636 |
| 52,808 |
Derivatives | | 14 | | 72,395 | | 94,047 |
Other financial liabilities | | 19 | | 55,089 | | 49,107 |
Subordinated liabilities |
| 20 |
| 5,714 |
| 6,260 |
Notes in circulation | | | | 3,237 | | 3,218 |
Other liabilities | | 21 |
| 5,202 |
| 5,346 |
Total liabilities | | |
| 655,485 |
| 683,557 |
| | | | | | |
Ordinary shareholders' interests | | | | 33,267 | | 32,598 |
Other owners’ interests |
| |
| 3,890 | | 3,890 |
Owners’ equity | | 22 | | 37,157 | | 36,488 |
Non-controlling interests |
| |
| 31 | | 8 |
Total equity | | |
| 37,188 | | 36,496 |
| | | | | | |
Total liabilities and equity | | |
| 692,673 | | 720,053 |
The accompanying notes on pages 53 to 137, the Accounting policies on pages 43 to 52 and the audited sections of the Risk and capital management section on pages 156 to 267 (exhibit 15.2) form an integral part of these financial statements.
The accounts were approved by the Board of directors on 15 February 2024 and signed on its behalf by:
Howard Davies |
| John-Paul Thwaite |
| Katie Murray |
| NatWest Group plc |
Chairman | | Group Chief Executive Officer | | Group Chief Financial Officer | | Registered No. SC45551 |
| |
NatWest Group – Annual Report on Form 20-F 2023 | 38 |
Consolidated statement of changes in equity
For the year ended 31 December 2023
| | | | | | | | | | | | | | | | | | | | | | |
| | | | | | | | | | Other reserves | | | | | | | ||||||
| | Share | | | | Other | | | | | | Total | | Non | | | ||||||
| | capital and | | Paid-in | | statutory | | Retained | ��� | | | Cash flow | | Foreign | | | | owners' | | controlling | | Total |
| | share premium | | equity | | reserves (9) | | earnings | | Fair value | | hedging (6,7) | | exchange | | Merger | | equity | | interests | | equity |
| | £m |
| £m |
| £m |
| £m |
| £m |
| £m |
| £m |
| £m |
| £m |
| £m |
| £m |
At 1 January 2023 | | 11,700 | | 3,890 | | 1,393 | | 10,019 | | (102) | | (2,771) | | 1,478 | | 10,881 | | 36,488 | | 8 | | 36,496 |
Profit/(loss) attributable to ordinary shareholders and other equity owners | | | | | | | | | | | | | | | | | | | | | | |
- continuing operations |
| | | | | | | 4,748 | | | | | | | | | | 4,748 | | (4) | | 4,744 |
- discontinued operations | | | | | | | | (112) | | | | | | | | | | (112) | | | | (112) |
| | | | | | | | | | | | | | | | | | | | | | |
Other comprehensive income | | | | | | | | | | | | | | | | | | | | | | |
Realised gains in period on FVOCI equity shares |
| | | | | | | 1 | | (1) | | | | | | | | — |
| |
| — |
Remeasurement of retirement benefit schemes |
| | | | | | | (280) | | | | | | | | | | (280) | | | | (280) |
Changes in fair value of credit in financial liabilities designated at FVTPL due to own credit risk |
| | | | | | | (39) | | | | | | | | | | (39) |
| |
| (39) |
Unrealised losses | | | | | | | | | | 22 | | | | | | | | 22 | | | | 22 |
Amounts recognised in equity | | | | | | | | | | | | 187 | | | | | | 187 | | | | 187 |
Retranslation of net assets | | | | | | | | | | | | | | (239) | | | | (239) | | | | (239) |
Gains on hedges of net assets |
| | | | | | | | | | | | | 107 | | | | 107 | | | | 107 |
Amount transferred from equity to earnings (4) |
| | | | | | | | | 44 | | 1,021 | | (487) | | | | 578 |
| |
| 578 |
Tax | | | | | | | | 84 | | (12) | | (336) | | (18) | | | | (282) | | | | (282) |
Total comprehensive income |
| | | | | | | 4,402 | | 53 | | 872 | | (637) | | — | | 4,690 |
| (4) |
| 4,686 |
| | | | | | | | | | | | | | | | | | | | | | |
Transactions with owners | | | | | | | | | | | | | | | | | | | | | | |
Ordinary share dividends paid |
| | | | | | | (1,456) | | | | | | | | | | (1,456) |
| (5) |
| (1,461) |
Paid-in equity dividends paid | | | | | | | | (242) | | | | | | | | | | (242) | | | | (242) |
Shares repurchased during the period (1,2) | | (856) | | | | 856 | | (2,057) | | | | | | | | | | (2,057) | | | | (2,057) |
Employee share schemes | | | | | | | | 14 | | | | | | | | | | 14 | | | | 14 |
Shares vested under employee share schemes | | | | | | 114 | | | | | | | | | | | | 114 | | | | 114 |
Share-based payments | | | | | | | | (35) | | | | | | | | | | (35) | | | | (35) |
Own shares acquired (2) |
| | | | | (359) | | | | | | | | | | | | (359) |
| |
| (359) |
Acquisition of subsidiary | | | | | | | | | | | | | | | | | | | | 32 | | 32 |
At 31 December 2023 |
| 10,844 | | 3,890 | | 2,004 | | 10,645 | | (49) | | (1,899) | | 841 | | 10,881 | | 37,157 | | 31 | | 37,188 |
The accompanying notes on pages 53 to 137, the Accounting policies on pages 43 to 52 and the audited sections of the Risk and capital management section on pages 156 to 267 (exhibit 15.2) form an integral part of these financial statements.
For the notes to this table refer to page 41.
| |
NatWest Group – Annual Report on Form 20-F 2023 | 39 |
Consolidated statement of changes in equity continued
| | | | | | | | | | | | | | | | | | | | | | |
|
| | | | | | | | | Other reserves | | | | | | | ||||||
| | Share | | | | Other | | | | | | | | | | | | Total | | Non | | |
| | capital and | | Paid-in | | statutory | | Retained | | | | Cash flow | | Foreign | | | | owners' | | controlling | | Total |
| | share premium | | equity | | reserves (9) | | earnings | | Fair value | | hedging (6,7) | | exchange | | Merger | | equity | | interests | | equity |
|
| £m |
| £m |
| £m |
| £m |
| £m |
| £m |
| £m |
| £m |
| £m |
| £m |
| £m |
At 1 January 2022 | | 12,629 | | 3,890 | | 351 | | 12,966 | | 269 | | (395) | | 1,205 | | 10,881 | | 41,796 | | 7 | | 41,803 |
Profit/(loss) attributable to ordinary shareholders and other equity owners | | | | | | | | | | | | | | | | | | | | | | |
- continuing operations | | | | | | | | 3,851 | | | | | | | | | | 3,851 | | 6 | | 3,857 |
- discontinued operations | | | | | | | | (262) | | | | | | | | | | (262) | | | | (262) |
| | | | | | | | | | | | | | | | | | | | | | |
Other comprehensive income | | | | | | | | | | | | | | | | | | | | | | |
Realised gains in period on FVOCI equity shares | | | | | | | | 113 | | (113) | | | | | | | | — | | | | — |
Remeasurement of retirement benefit schemes | | | | | | | | (840) | | | | | | | | | | (840) | | | | (840) |
Changes in fair value of credit in financial liabilities designated at FVTPL due to own credit risk |
| | | | | | | 50 | | | | | | | | | | 50 | | |
| 50 |
Unrealised losses |
| | | | | | | | | (570) | | | | | | | | (570) | | |
| (570) |
Amounts recognised in equity |
| | | | | | | | | | | (2,973) | | | | | | (2,973) | | |
| (2,973) |
Retranslation of net assets |
| | | | | | | | | | | | | 512 | | | | 512 | | |
| 512 |
Losses on hedges of net assets | | | | | | | | | | | | | | (266) | | | | (266) | | | | (266) |
Amount transferred from equity to earnings (4) |
| | | | | | | | | 172 | | (304) | | (5) | | | | (137) | | |
| (137) |
Tax | | | | | | | | 181 | | 140 | | 901 | | 32 | | | | 1,254 | | | | 1,254 |
Total comprehensive income |
| | | | | | | 3,093 | | (371) | | (2,376) | | 273 | | — | | 619 | | 6 |
| 625 |
|
| | | | | | | | | | | | | | | | | | | |
| |
Transactions with owners | | | | | | | | | | | | | | | | | | | | | | |
Ordinary share dividends paid | | | | | | | | (1,205) | | | | | | | | | | (1,205) | | (5) | | (1,210) |
Special dividends paid | | | | | | | | (1,746) | | | | | | | | | | (1,746) | | — | | (1,746) |
Paid-in equity dividends paid | | | | | | | | (249) | | | | | | | | | | (249) | | | | (249) |
Shares repurchased during the period (1,2) | | (929) | | | | 929 | | (2,054) | | | | | | | | | | (2,054) | | | | (2,054) |
Redemption of preference shares (5) | | | | | | | | (750) | | | | | | | | | | (750) | | | | (750) |
Enployee share schemes | | | | | | | | 6 | | | | | | | | | | 6 | | | | 6 |
Shares vested under employee share schemes | | | | | | 113 | | | | | | | | | | | | 113 | | | | 113 |
Share-based payments | | | | | | | | (6) | | | | | | | | | | (6) | | | | (6) |
Tax on redemption of paid-in equity | | | | — | | | | (36) | | | | | | | | | | (36) | | | | (36) |
At 31 December 2022 | | 11,700 | | 3,890 | | 1,393 | | 10,019 | | (102) | | (2,771) | | 1,478 | | 10,881 | | 36,488 | | 8 | | 36,496 |
For the notes to this table refer to the following page.
| |
NatWest Group – Annual Report on Form 20-F 2023 | 40 |
Consolidated statement of changes in equity continued
| | | | | | | | | | | | | | | | | | | | | | |
| | | | | | | | | | Other reserves | | | | | | | ||||||
| | Share | | | | Other | | | | | | | | | | | | Total | | Non | | |
| | capital and | | Paid-in | | statutory | | Retained | | | | Cash flow | | Foreign | | | | owners' | | controlling | | Total |
| | share premium | | equity | | reserves (9) | | earnings | | Fair value | | hedging (6,7) | | exchange | | Merger | | equity | | interests | | equity |
| | £m | | £m | | £m | | £m | | £m | | £m | | £m | | £m | | £m | | £m | | £m |
At 1 January 2021 | | 13,240 | | 4,999 | | (24) | | 12,567 | | 360 | | 229 | | 1,608 | | 10,881 | | 43,860 | | (36) | | 43,824 |
Profit attributable to ordinary shareholders and other equity owners | | | | | | | | | | | | | | | | | | | | | | |
- continuing operations | | | | | | | | 2,804 | | | | | | | | | | 2,804 | | 44 | | 2,848 |
- discontinued operations | | | | | | | | 464 | | | | | | | | | | 464 | | | | 464 |
| | | | | | | | | | | | | | | | | | | | | | |
Other comprehensive income | | | | | | | | | | | | | | | | | | | | | | |
Realised gains in period on FVOCI equity shares | | | | | | | | 3 | | (3) | | | | | | | | — | | | | — |
Remeasurement of retirement benefit schemes | | | | | | | | (669) | | | | | | | | |
| (669) | | | | (669) |
Changes in fair value of credit in financial liabilities designated at FVTPL due to own credit risk | | | | | | | | (29) | | | | | | | | | | (29) | | | | (29) |
Unrealised losses | | | | | | | | | | 32 | | | | | | | | 32 | | | | 32 |
Amounts recognised in equity | | | | | | | | | | | | (687) | | | | |
| (687) | | | | (687) |
Retranslation of net assets | | | | | | | | | | | | | | (484) | | | | (484) | | 4 | | (480) |
Gains on hedges of net assets | | | | | | | | | | | | | | 88 | | |
| 88 | | | | 88 |
Amount transferred from equity to earnings (4) | | | | | | | | | | (119) | | (161) | | 10 | | |
| (270) | | | | (270) |
Tax | | | | | | | | 171 | | (1) | | 224 | | (17) | | | | 377 | | | | 377 |
Total comprehensive income | | | | | | | | 2,744 | | (91) | | (624) | | (403) | | — |
| 1,626 |
| 48 |
| 1,674 |
| | | | | | | | | | | | | | | | | | | | | | |
Transactions with owners | | | | | | | | | | | | | | | | | | | | | | |
Ordinary share dividends paid | | | | | | | | (693) | | | | | | | | |
| (693) |
| (5) |
| (698) |
Equity preference dividends paid | | | | | | | | (19) | | | | | | | | |
| (19) |
| — |
| (19) |
Paid-in equity dividends paid | | | | | | | | (299) | | | | | | | | |
| (299) |
| |
| (299) |
Shares repurchased during the period (1,2) | | (698) | | | | 698 | | (1,423) | | | | | | | | | | (1,423) | | | | (1,423) |
Redemption of preference shares | | | | | | 24 | | (24) | | | | | | | | | | — | | | | — |
Shares and securities issued during the period (8) | | 87 | | 937 | | | | | | | | | | | | | | 1,024 | | | | 1,024 |
Reclassification of paid-in equity (3) | | | | (2,046) | | | | 150 | | | | | | | | | | (1,896) | | | | (1,896) |
Employee share schemes | | | | | | | | 8 | | | | | | | | | | 8 | | | | 8 |
Shares vested under employee share schemes | | | | | | 36 | | | | | | | | | | | | 36 | | | | 36 |
Share-based payments | | | | | | | | (45) | | | | | | | | | | (45) | | | | (45) |
Own shares acquired (2) | | | | | | (383) | | | | | | | | | | |
| (383) |
| |
| (383) |
At 31 December 2021 (10) | | 12,629 | | 3,890 | | 351 | | 12,966 | | 269 | | (395) | | 1,205 | | 10,881 |
| 41,796 |
| 7 |
| 41,803 |
| (1) | NatWest Group plc repurchased and cancelled 460.3 million (2022 – 379.3 million, 2021 - 310.8 million) shares, of which 2.3 million were settled in January 2024. The total consideration of these shares excluding fees was £1,151.7 million (2022 - £829.3 million, 2021 £676.2 million), of which £4.9 million were settled in January 2024, as part of the On Market Share Buyback Programmes. The nominal value of the share cancellations has been transferred to the capital redemption reserve. |
| (2) | In May 2023, there was an agreement to buy 469.2 million (March 2022 – 549.9 million, March 2021 - 591.0 million) ordinary shares of the Company from UK Government Investments Ltd (UKGI) at 268.4 pence per share (March 2022 - 220.5 pence per share, March 2021 - 190.5 pence per share) for the total consideration of £1.3 billion (2022 - £1.2 billion, 2021 - £1.1 billion). NatWest Group cancelled 336.2 million of the purchased ordinary shares, amounting to £906.9 million excluding fees and held the remaining 133.0 million shares as Own Shares Held, amounting to £358.8 million excluding fees. The nominal value of the share cancellation has been transferred to the capital redemption reserve. |
| (3) | In July 2021, paid-in equity was reclassified to liabilities as the result of a call in August 2021 of US$2.65 billion AT1 capital notes. |
| (4) | Includes £460 million foreign exchange recycled to profit or loss upon completion of a capital repayment by UBIDAC. |
| (5) | Following an announcement of a Regulatory Call in February 2022, the Series U preference shares were reclassified to liabilities. A £254 million loss was recognised in retained earnings as a result of foreign exchange unlocking. |
| (6) | The change in the cash flow hedging reserve is driven by realised accrued interest transferred into the income statement and a decrease in swap rates compared to previous periods where they rose. The portfolio of hedging instruments is predominantly receive fixed swaps. |
| (7) | As referred in Note 14, the amount transferred from equity to the income statement is mostly recorded within net interest income mainly in loans to customers, balances at central banks and customer deposits as per Note 1. |
| (8) | There was an issue of shares in 2021. This is split between Ordinary share capital of £37 million and Share premium of £50 million. |
| (9) | Other statutory reserves consist of Capital redemption reserves of £2,507 million (2022 - £1,651 million, 2021 - £722 million) and Own shares held reserves of £503 million (2022 - £258 million, 2021 - £371 million). |
| (10) | In 2021, the Total equity balance of £41,803 million includes £494 million attributable to Preference shareholders. |
| |
NatWest Group – Annual Report on Form 20-F 2023 | 41 |
Consolidated cash flow statement
For the year ended 31 December 2023
| | | | | | | | |
|
| |
| 2023 |
| 2022 |
| 2021 |
|
| Note |
| £m |
| £m |
| £m |
Cash flows from operating activities | | | | | | | | |
Operating profit before tax from continuing operations (1) | | |
| 6,178 |
| 5,132 |
| 3,844 |
Operating (loss)/profit before tax from discontinued operations (1) | | | | (112) | | (262) | | 467 |
| | | | | | | | |
Adjustments for: | | |
| | | |
| |
Non-cash and other items | | 27 | | 3,208 | | 1,203 | | 3,623 |
Change in operating assets and liabilities | | 27 |
| (25,679) |
| (48,447) |
| 46,606 |
Income taxes paid | | |
| (1,033) | | (1,223) |
| (856) |
Net cash flows from operating activities (2,3) | | |
| (17,438) | | (43,597) |
| 53,684 |
| | | | | | | | |
Cash flows from investing activities | | |
| | | |
| |
Sale and maturity of other financial assets | | | | 25,195 | | 36,975 | | 16,859 |
Purchase of other financial assets | | | | (44,906) | | (23,510) | | (10,150) |
Income received on other financial assets | | | | 1,099 | | 659 | | 581 |
Net movement in business interests and intangible assets | | 28 | | 4,601 | | 5,420 | | (3,489) |
Sale of property, plant and equipment | | | | 128 | | 154 | | 165 |
Purchase of property, plant and equipment | | | | (811) | | (639) | | (901) |
Net cash flows from investing activities | | | | (14,694) | | 19,059 | | 3,065 |
| | | | | | | | |
Cash flows from financing activities |
| |
| |
| |
| |
Issue of paid-in equity | | | | — | | — | | 937 |
Issue of subordinated liabilities | | | | 611 | | 648 | | 1,634 |
Redemption of subordinated liabilities | | | | (1,250) | | (3,693) | | (4,765) |
Interest paid on subordinated liabilities | | | | (439) | | (374) | | (321) |
Issue of MRELs | | | | 3,973 | | 3,721 | | 3,383 |
Maturity and redemption MRELs | | | | (4,236) | | (4,992) | | — |
Interest paid on MRELs | | | | (844) | | (703) | | (647) |
Shares repurchased | | | | (2,416) | | (2,054) | | (1,806) |
Dividends paid | | | | (1,703) | | (3,205) | | (1,016) |
Net cash flows from financing activities | | 29 | | (6,304) | | (10,652) | | (2,601) |
| | | | | | | | |
Effects of exchange rate changes on cash and cash equivalents | | |
| (1,189) | | 2,933 |
| (2,641) |
| | | | | | | | |
Net (decrease)/increase in cash and cash equivalents | | |
| (39,625) | | (32,257) |
| 51,507 |
Cash and cash equivalents at 1 January | | | | 158,449 | | 190,706 | | 139,199 |
Cash and cash equivalents at 31 December | | 30 |
| 118,824 |
| 158,449 |
| 190,706 |
The accompanying notes on pages 53 to 137, the Accounting policies on pages 43 to 52 and the audited sections of the Risk and capital management section on pages 156 to 267 (exhibit 15.2) form an integral part of these financial statements.
(1) | Comparative results have been re-presented from those previously published to reclassify certain operations as discontinued operations as described in Note 8 to the consolidated financial statements. |
(2) | Includes interest received of £20,345 million (2022 - £12,638 million, 2021 - £9,696 million) and interest paid of £8,871 million (2022 - £2,357 million, 2021 - £1,668 million). |
(3) | The total cash outflow for leases is £122 million (2022 - £170 million; 2021 - £195 million), including payment of principal amount of £102 million (2022 - £145 million, 2021 - £164 million) which are included in the operating activities. |
| |
NatWest Group – Annual Report on Form 20-F 2023 | 42 |
Accounting policies
This section includes the basis of preparation, critical and material accounting policies used to prepare the financial statements. Our accounting policies are the specific principles, bases, conventions, rules, and practices we apply in preparing and presenting the financial statements. Further information is provided where judgement and estimation is applied to critical accounting policies and key sources of estimation uncertainty. Future accounting developments details new, or amendments to existing, accounting standards, when they are effective from and where we are assessing their impact on future financial statements. |
1. Presentation of financial statements
NatWest Group plc is incorporated in the UK and registered in Scotland. The financial statements are presented in the functional currency, pounds sterling.
The audited financial statements include audited sections of the Risk and capital management section. The directors have prepared the financial statements on a going concern basis after assessing the principal risks, forecasts, projections and other relevant evidence over the twelve months from the date the financial statements are approved (refer to the Report of the directors) and in accordance with UK adopted International Accounting Standards (IAS), and International Financial Reporting Standards (IFRS) as issued by the International Accounting Standards Board (IASB). The critical and material accounting policies and related judgements are set out below.
The financial statements are presented on a historical cost basis except for certain financial instruments which are stated at fair value.
The effect of the amendments to IFRS effective from 1 January 2023 on our financial statements was immaterial.
We have applied the exception issued by the IASB in May 2023 from the accounting requirements for deferred taxes in IAS 12 Income taxes in respect of Pillar Two income taxes. Accordingly, we have not recognised or disclosed information about deferred tax assets and liabilities related to Pillar Two income taxes.
Our consolidated financial statements incorporate the results of NatWest Group plc and the entities it controls. Control arises when we have the power to direct the activities of an entity so as to affect the return from the entity. Control is assessed by reference to our ability to enforce our will on the other entity, typically through voting rights. The consolidated financial statements are prepared under consistent accounting policies.
A subsidiary is included in the consolidated financial statements at fair value on acquisition from the date it is controlled by us until the date we cease to control it through a sale or a significant change in circumstances. Changes in our interest in a subsidiary that do not result in us ceasing to control that subsidiary are accounted for as equity transactions.
We apply accounting for associates and joint arrangements to entities where we have significant influence, but not control, over the operating and financial policies. We assess significant influence by reference to a presumption of voting rights of more than 20%, but less than 50%, supplemented by a qualitative assessment of substantive rights which include representation at the Board of Directors, significant exchange of managerial personnel or technology amongst others.
Investments in associates and joint ventures are recorded upon initial recognition at cost, increased or decreased each period by the share of the subsequent levels of profit or loss, and other changes in equity are considered in line with their nature.
The judgements and assumptions involved in our accounting policies that are considered by the Board to be the most important to the portrayal of its financial condition are noted below. The use of estimates, assumptions or models that differ from those adopted by us would affect our reported results.
| |
NatWest Group – Annual Report on Form 20-F 2023 | 43 |
Accounting policies continued
How Climate risk affects our accounting judgements and estimates
Business planning
Key financial estimates are based on management's latest five-year revenue and cost forecasts. The outputs from this forecast affect forward-looking accounting estimates. Measurement of deferred tax and expected credit losses are highly sensitive to reasonably possible changes in those anticipated conditions. In 2023, our scenario planning was enhanced by the further integration of NatWest Group’s climate transition plan, including the assessment of climate-related risks and opportunities.
| - | Our Climate transition plan includes an assessment of: |
| - | changes in products, services and business operations to support customer transition towards net zero; |
| - | financial impacts of supporting customer transition, including investment required. The linkage between our financial plan and our Climate transition plan will continue to be developed and refreshed annually as part of the financial planning cycle; |
| - | the climate impact of policies, using the UK Climate Change Committee (UK CCC) Balanced Net Zero (BNZ) pathway scenario, aligned with the UK’s Sixth Carbon Budget. In addition, we have used the credibility ratings for sectoral policies provided by the UK CCC 2023 Progress Report, published in June, to the Parliament to develop a BNZ adjusted pathway to reflect estimated time delays of these policies. |
| - | There remains considerable uncertainty regarding this policy response, including the effect of wider geo-political uncertainty on governmental ambitions regarding climate transition and the effect of decarbonisation on wider economic growth, technology development and customer behaviours. |
Information used in other accounting estimates
We make use of reasonable and supportable information to make accounting judgements and estimates. This includes information about the observable effects of the physical and transition risks of climate change on the current creditworthiness of borrowers, asset values and market indicators. It also includes the effect on our competitiveness and profitability. Many of the effects arising from climate change will be longer term in nature, with an inherent level of uncertainty, and have limited effect on accounting judgements and estimates for the current period. Some physical and transition risks can manifest in the shorter term. The following items represent the most significant effects:
| - | The classification of financial instruments linked to climate, or other sustainability indicators: consideration is given to whether the effect of climate related terms prevent the instrument cashflows being solely payments of principal and interest. |
| - | The use of market indicators as inputs to fair value is assumed to include current information and knowledge regarding the effect of climate risk. |
Effect of climate change in the estimation of expected credit loss
We are monitoring the effect of the physical and transition consequences of climate change on our experience of loan loss. We use available information regarding the effect of climate transition policy largely driven by carbon prices as an adjustment to macroeconomic factors that are used as inputs to the models that generate PD and LGD outcomes, which are key inputs to the ECL calculation. The determination of whether specific loss drivers and climate events generate specific losses is ongoing and is necessary to determine how sensitive changes in ECL could be to climate inputs.
Future cashflows are discounted, so long dated cashflows are less likely to affect current expectations on credit loss. Our assessment of sector specific risks, and whether additional adjustments are required, include expectations of the ability of those sectors to meet their financing needs in the market. Changes in credit stewardship and credit risk appetite that stem from climate considerations, such as oil and gas, will directly affect our positions.
| |
NatWest Group – Annual Report on Form 20-F 2023 | 44 |
Accounting policies continued
2. Critical accounting policies
The judgements and assumptions involved in our accounting policies that are considered by the Board to be the most important to the portrayal of our financial condition are noted below. The use of estimates, assumptions or models that differ from those adopted by us would affect our reported results. Management’s consideration of uncertainty is outlined in the relevant sections, including the ECL estimate in the Risk and capital management section.
Information used for significant estimate
Policy |
| Judgement |
| Estimate |
| Further information |
Deferred tax | | Determination of whether sufficient sustainable taxable profits will be generated in future years to recover the deferred tax asset. | | Our estimates are based on the five year revenue and cost forecasts (which include inherent uncertainties). | | Note 7 |
Fair value – financial instruments | | Classification of a fair value instrument as level 3, where the valuation is driven by unobservable inputs. | | Estimation of the fair value, where it is reasonably possible to have alternative assumptions in determining the FV. | | Note 11 |
Loan impairment provisions | | Definition of default against which to apply PD, LGD and EAD models. Selection of multiple economic scenarios.Criteria for a significant increase in credit risk. Identification of risks not captured by the models. | | ECL estimates contain a number of measurement uncertainties (such as the weighting of multiple economic scenarios) and disclosures include sensitivities to show impact on other reasonably possible scenarios. | | Note 15 |
Provisions for liabilities and charges | | Determination of whether a present obligation exists in respect of customer redress, litigation and other regulatory, property and other provisions. Legal proceedings often require a high degree of judgement and these are likely to change as the matter progresses. | | Provisions remain sensitive to the assumptions used in the estimate. We consider a wide range of possible outcomes. It is often not practical to meaningfully quantify ranges of possible outcomes, given the uncertainties involved. | | Note 21 |
Changes in judgements and assumptions could result in a material adjustment to those estimates in future reporting periods.
2.1. Deferred tax
Deferred tax is the estimated tax expected to be payable or recoverable in respect of temporary differences between the carrying amount of an asset or liability for accounting purposes and the carrying amount for tax purposes in the future. Deferred tax liabilities are generally recognised for all taxable temporary differences and deferred tax assets are recognised to the extent their recovery is probable.
Deferred tax is calculated using tax rates expected to apply in the periods when the assets will be realised or the liabilities settled, based on tax rates and laws enacted, or substantively enacted, at the balance sheet date.
Deferred tax asset recoverability is based on the level of supporting offsetable deferred tax liabilities we have and of our future taxable profits. These future taxable profits are based on our five-year revenue and cost forecasts and the expectation of long term economic growth beyond this period. The five-year forecast takes account of management’s current expectations on competitiveness and profitability. The long term growth rate reflects external indicators which will include market expectations on climate risk. We do not consider any additional adjustments to this indicator.
2.2. Fair value – financial instruments
We measure financial instruments at fair value when they are classified as mandatory fair value through profit or loss; held-for-trading; designated fair value through profit or loss and fair value through other comprehensive income and they are recognised in the financial statements at fair value. All derivatives are measured at fair value.
We manage some portfolios of financial assets and financial liabilities based on our net exposure to either market or credit risk. In these cases, the fair value is derived from the net risk exposure of that portfolio with portfolio level adjustments applied to incorporate bid-offer spreads, counterparty credit risk, and funding costs (refer to ‘Valuation Adjustments’).
Where the market for a financial instrument is not active, fair value is established using a valuation technique. These valuation techniques involve a degree of estimation, the extent of which depends on the instrument’s complexity and the availability of market-based data. The complexity and uncertainty in the financial instrument’s fair value is categorised using the fair value hierarchy.
The use of market indicators as inputs to fair value is assumed to include current information and knowledge regarding the effect of climate risk.
| |
NatWest Group – Annual Report on Form 20-F 2023 | 45 |
Accounting policies continued
2.3. Loan impairment provisions: expected credit losses (ECL)
At each balance sheet date each financial asset or portfolio of financial assets measured at amortised cost or at fair value through other comprehensive income, issued financial guarantee and loan commitment (other than those classified as held for trading) is assessed for impairment. Any change in impairment is reported in the income statement.
Loss allowances are forward-looking, based on 12-month ECL where there has not been a significant increase in credit risk rating, otherwise allowances are based on lifetime expected losses.
ECL are a probability-weighted estimate of credit losses. The probability is determined by the risk of default which is applied to the cash flow estimates. In the absence of a change in credit rating, allowances are recognised when there is a reduction in the net present value of expected cash flows. Following a significant increase in credit risk, ECL are adjusted from 12 months to lifetime. This will lead to a higher impairment charge.
The measurement of expected credit loss considers the ability of borrowers to make payments as they fall due. Future cashflows are discounted, so long-dated cashflows are less likely to affect current expectations on credit loss. Our assessment of sector specific risks, and whether additional adjustments are required, include expectations of the ability of those sectors to meet their financing needs in the market. Changes in credit risk appetite and how we manage credit positions that stem from climate considerations, such as oil and gas, will directly affect our positions.
Judgement is exercised as follows:
| - | Models – in certain low default portfolios, Basel parameter estimates are also applied for IFRS 9. |
| - | Non-modelled portfolios – use a standardised capital requirement under Basel II. Under IFRS 9, they have bespoke treatments for the identification of significant increase in credit risk. Benchmark PDs, EADs and LGDs are reviewed annually for appropriateness. The ECL calculation is based on expected future cash flows, which is typically applied at a portfolio level. |
| - | Multiple economic scenarios (MES) – the central, or base, scenario is most critical to the ECL calculation, independent of the method used to generate a range of alternative outcomes and their probabilities. |
| - | Significant increase in credit risk - IFRS 9 requires that at each reporting date, an entity shall assess whether the credit risk on an account has increased significantly since initial recognition. Part of this assessment requires a comparison to be made between the current lifetime PD (i.e. the current probability of default over the remaining lifetime) with the equivalent lifetime PD as determined at the date of initial recognition. |
On restructuring where a financial asset is not derecognised, the revised cash flows are used in re-estimating the credit loss. Where restructuring causes derecognition of the original financial asset, the fair value of the replacement asset is used as the closing cash flow of the original asset.
Where in the course of the orderly realisation of a loan, it is exchanged for equity shares or property, the exchange is accounted for as the sale of the loan and the acquisition of equity securities or investment property. Where our acquired interest is in equity shares, relevant policies for control, associates and joint ventures apply.
Impaired financial assets are written off and therefore derecognised from the balance sheet when we conclude that there is no longer any realistic prospect of recovery of part, or all, of the loan. For financial assets that are individually assessed for impairment, the timing of the write-off is determined on a case-by-case basis. Such financial assets are reviewed regularly and write-off will be prompted by bankruptcy, insolvency, re-negotiation, and similar events
The typical time frames from initial impairment to write-off for our collectively assessed portfolios are:
| - | Retail mortgages: write-off usually occurs within five years, or earlier, when an account is closed, but can be longer where the customer engages constructively; |
| - | Credit cards: the irrecoverable amount is typically written off after twelve arrears cycles or at four years post default any remaining amounts outstanding are written off; |
| - | Overdrafts and other unsecured loans: write-off occurs within six years; |
| - | Commercial loans: write-offs are determined in the light of individual circumstances; and Business loans are generally written off within five years. |
| |
NatWest Group – Annual Report on Form 20-F 2023 | 46 |
Accounting policies continued
2.4. Provisions
We recognise a provision for a present obligation resulting from a past event when it is more likely than not that we will be required to pay to settle the obligation and the amount of the obligation can be estimated reliably.
Provision is made for restructuring costs, including the costs of redundancy, when we have a constructive obligation. An obligation exists when we have a detailed formal plan for the restructuring and have raised a valid expectation in those affected either by starting to implement the plan or by announcing its main features.
We recognise any onerous cost of the present obligation under a contract as a provision. An onerous cost is the unavoidable cost of meeting our contractual obligations that exceed the expected economic benefits. When we intend to vacate a leasehold property or right of use asset, the asset would be tested for impairment and a provision may be recognised for the ancillary contractual occupancy costs.
3. Material accounting policies
3.1. Revenue recognition
Interest receivable and payable are recognised in the income statement using the effective interest rate method for: all financial instruments measured at amortised cost; debt instruments measured as fair value through other comprehensive income; and the effective part of any related accounting hedging instruments. Finance lease income is recognised at a constant periodic rate of return before tax on the net investment on the lease.
Other interest relating to financial instruments measured at fair value is recognised as part of the movement in fair value and is reported in income from trading activities or other operating income as relevant. Fees in respect of services are recognised as the right to consideration accrues through the performance of each distinct service obligation to the customer. The arrangements are generally contractual and the cost of providing the service is incurred as the service is rendered. The price is usually fixed and always determinable.
3.2. Discontinued operations, Held for sale and Disposal group
The results of discontinued operations are excluded from the results of continuing operations and are presented as a single amount as profit/(loss) from discontinued operations, net of tax in the income statement. Comparatives are represented for the income statement, cash flow statement, statement of changes in equity and related notes.
An asset or disposal group (assets and liabilities) is classified as held for sale if we will recover its carrying amount principally through a sale transaction rather than through continuing use. These are measured at the lower of its carrying amount or fair value less cost to sell unless the existing measurement provisions of IFRS apply. These are presented as single amounts; comparatives are not represented.
3.3. Staff costs
Employee costs, such as salaries, paid absences, and other benefits are recognised over the period in which the employees provide the related services to us. Employees may receive variable compensation in cash, in deferred cash or debt instruments of NatWest Group or in ordinary shares of NatWest Group plc subject to deferral, clawback and forfeiture criteria. We operate a number of share-based compensation schemes under which we grant awards of NatWest Group plc shares and share options to our employees. Such awards are subject to vesting conditions.
Variable compensation that is settled in cash or debt instruments is charged to the income statement on a straight-line basis over the period during which services are provided, taking account of forfeiture and clawback criteria. The value of employee services received in exchange for NatWest Group plc shares and share options is recognised as an expense over the vesting period, subject to deferral, clawback, cancelation and forfeiture criteria with a corresponding increase in equity. The fair value of shares granted is the market price adjusted for the expected effect of dividends as employees are not entitled to dividends until shares are vested.
The fair value of options granted is determined using option pricing models to estimate the numbers of shares likely to vest. These consider the exercise price of the option, the current share price, the risk-free interest rate, the expected volatility of the share price over the life of the option and other relevant factors such as the dividend yield.
Defined contribution pension scheme
A scheme where we pay fixed contributions and there is no legal or constructive obligation to pay further contributions or benefits. Contributions are recognised in the income statement as employee service costs accrue.
| |
NatWest Group – Annual Report on Form 20-F 2023 | 47 |
Accounting policies continued
Defined benefit pension scheme
A scheme that defines the benefit an employee will receive on retirement and is dependent on one or more factors such as age, salary, and years of service. The net of the recognisable scheme assets and obligations is reported on the balance sheet in other assets or other liabilities. The defined benefit obligation is measured on an actuarial basis. The charge to the income statement for pension costs (mainly the service cost and the net interest on the net defined benefit asset or liability) is recognised in operating expenses.
Actuarial gains and losses (i.e. gains and/or losses on re-measuring the net defined benefit asset or liability due to changes in actuarial measurement assumptions) are recognised in other comprehensive income in full in the period in which they arise, and not subject to recycling to the income statement.
The difference between scheme assets and scheme liabilities, the net defined benefit asset or liability, is recognised on the balance sheet if the criteria of the asset ceiling test are met. This requires the net defined benefit surplus to be limited to the present value of any economic benefits available to us in the form of refunds from the plan or reduced contributions to it.
We will recognise a liability where a minimum funding requirement exists for any of our defined benefit pension schemes. This reflects agreed minimum funding and the availability of a net surplus as determined as described above. When estimating the liability for minimum funding requirements we only include contributions that are substantively or contractually agreed and do not include contingent and discretionary features, including dividend-linked contributions or contributions subject to contingent events requiring future verification.
We will recognise a net defined benefit asset when the net defined benefit surplus can generate a benefit in the form of a refund or reduction in future contributions to the plan. The net benefit pension asset is recognised at the present value of the benefits that will be available to us excluding interest and the effect of the asset ceiling (if any, excluding interest). Changes in the present value of the net benefit pension asset are recognised immediately in other comprehensive income.
In instances where Trustees have the ability to declare augmented benefits to participants, we do not recognise a defined benefit pension asset and write-off the surplus immediately in other comprehensive income.
3.4. Intangible assets and goodwill
Intangible assets are identifiable non-monetary assets without physical substance acquired or developed by us, and are stated at cost less accumulated amortisation and impairment losses. Amortisation is a method to spread the cost of such assets over time in the income statement.
This is charged to the income statement over the assets' estimated useful economic lives using methods that best reflect the pattern of economic benefits.
The estimated useful economic lives are:
Computer software | 3 to 10 years |
Other acquired intangibles | 3 to 5 years |
Direct costs relating to the development of internal-use computer software are reported on the balance sheet after technical feasibility and economic viability have been established.
These direct costs include payroll, the costs of materials and services, and directly attributable overheads. Capitalisation of costs ceases when the software can operate as intended.
During and after development, accumulated costs are reviewed for impairment against the benefits that the software is expected to generate. Costs incurred prior to the establishment of technical feasibility and economic viability are expensed to the income statement as incurred, as are all training costs and general overheads. The costs of licences to use computer software that are expected to generate economic benefits beyond three years are also reported on the balance sheet.
Goodwill on the acquisition of a subsidiary is the excess of the fair value of the consideration paid, the fair value of any existing interest in the subsidiary and the amount of any non-controlling interest measured either at fair value or at its share of the subsidiary’s net assets over the net fair value of the subsidiary’s identifiable assets, liabilities, and contingent liabilities.
Goodwill is measured at initial cost less any subsequent impairment losses. The gain or loss on the disposal of a subsidiary includes the carrying value of any related goodwill when such transactions occur.
| |
NatWest Group – Annual Report on Form 20-F 2023 | 48 |
Accounting policies continued
3.5. Impairment of non-financial assets
Goodwill is tested for impairment annually or more frequently if events or changes in circumstances indicate that it might be impaired.
At each balance sheet date, we assess whether there is any indication that other intangible assets or property, plant and equipment are impaired. If any such indication exists, we estimate the recoverable amount of the asset and compare it to its balance sheet value to calculate if an impairment loss should be recognised in the income statement. A reversal of an impairment loss on other intangible assets or property, plant and equipment is recognised in the income statement provided the increased carrying value is not greater than it would have been had no impairment loss been recognised.
The recoverable amount of an asset that does not generate cash flows that are independent from those of other assets or groups of assets, is determined as part of the cash-generating unit to which the asset belongs. A cash-generating unit is the smallest identifiable group of assets that generates cash inflows that are largely independent of the cash inflows from other assets or groups of assets. For the purposes of impairment testing, goodwill acquired in a business combination is allocated to our cash-generating units or groups of cash-generating units expected to benefit from the combination.
The recoverable amount of an asset or cash-generating unit is the higher of its fair value less cost to sell or its value in use. Value in use is the present value of future cash flows from the asset or cash-generating unit discounted at a rate that reflects market interest rates adjusted for risks specific to the asset or cash-generating unit that have not been considered in estimating future cash flows.
The assessment of asset impairment is based upon value in use. This represents the value of future cashflows and uses our five-year revenue and cost forecasts and the expectation of long term economic growth beyond this period. The five-year forecast takes account of management’s current expectations on competitiveness and profitability, including near term effects of climate transition risk. The long term growth rate reflects external indicators which will include market expectations on climate risk. We do not consider any additional adjustments to this indicator.
3.6. Foreign currencies
Foreign exchange differences arising on the settlement of foreign currency transactions and from the translation of monetary assets and liabilities are reported in income from trading activities except for differences arising on cash flow hedges and hedges of net investments in foreign operations.
Non-monetary items denominated in foreign currencies that are stated at fair value are translated into the functional currency at the foreign exchange rates ruling at the dates the values are determined. Translation differences are recognised in the income statement except for differences arising on non-monetary financial assets classified as fair value through other comprehensive income.
Income and expenses of foreign subsidiaries and branches are translated into sterling at average exchange rates unless these do not approximate the foreign exchange rates ruling at the dates of the transactions. Foreign exchange differences arising on the translation of a foreign operation are recognised in other comprehensive income. The amount accumulated in equity is reclassified from equity to the income statement on disposal of a foreign operation.
3.7. Tax
Tax encompassing current tax and deferred tax is recognised in the income statement except when taxable items are recognised in other comprehensive income or equity. Tax consequences arising from servicing financial instruments classified as equity are recognised in the income statement.
Accounting for taxes is judgemental and carries a degree of uncertainty because tax law is subject to interpretation, which might be questioned by the relevant tax authority. We recognise the most likely current and deferred tax liability or asset, assessed for uncertainty using consistent judgements and estimates. Current and deferred tax assets are only recognised where their recovery is deemed probable, and current and deferred tax liabilities are recognised at the amount that represents the best estimate of the probable outcome having regard to their acceptance by the tax authorities.
3.8. Financial instruments
Financial instruments are measured at fair value on initial recognition on the balance sheet.
Monetary financial assets are classified into one of the following subsequent measurement categories (subject to business model assessment and review of contractual cash flow for the purposes of sole payments of principal and interest where applicable):
| - | amortised cost measured at cost using the effective interest rate method, less any impairment allowance; |
| - | fair value through other comprehensive income (FVOCI) measured at fair value, using the effective interest rate method and changes in fair value through other comprehensive income; |
| - | mandatory fair value through profit or loss (MFVTPL) measured at fair value and changes in fair value reported in the income statement; or |
| - | designated at fair value through profit or loss (DFV) measured at fair value and changes in fair value reported in the income statement. |
| |
NatWest Group – Annual Report on Form 20-F 2023 | 49 |
Accounting policies continued
Classification by business model reflects how we manage our financial assets to generate cash flows. A business model assessment helps to ascertain the measurement approach depending on whether cash flows result from holding financial assets to collect the contractual cash flows, from selling those financial assets, or both.
Business model assessment of assets is made at portfolio level, being the level at which they are managed to achieve a predefined business objective. This is expected to result in the most consistent classification of assets because it aligns with the stated objectives for the portfolio, its risk management, manager’s remuneration and the ability to monitor sales of assets from a portfolio. When a significant change to our business is communicated to external parties, we reassess our business model for managing those financial assets. We reclassify financial assets if we have a significant change to the business model. A reclassification is applied prospectively from the reclassification date.
The contractual terms of a financial asset; any leverage features; prepayment and extension terms; and discounts or penalties to interest rates that are part of meeting environmental, social and governance targets as well as other contingent and leverage features, non-recourse arrangements and features that could modify the timing and/or amount of the contractual cash flows that might reset the effective rate of interest; are considered in determining whether cash flows are solely payments of principal and interest.
Certain financial assets may be designated at fair value through profit or loss (DFV) upon initial recognition if such designation eliminates, or significantly reduces, accounting mismatch.
Equity shares are measured at fair value through profit or loss unless specifically elected as at fair value through other comprehensive income (FVOCI).
Upon disposal, the cumulative gains or losses in fair value through other comprehensive income reserve are recycled to the income statement for monetary assets and for non-monetary assets (equity shares) the cumulative gains or losses are transferred directly to retained earnings.
Regular way purchases and sales of financial assets classified as amortised cost are recognised on the settlement date; all other regular way transactions in financial assets are recognised on the trade date.
Financial liabilities are classified into one of following measurement categories:
| - | amortised cost measured at cost using the effective interest rate method; |
| - | held for trading measured at fair value and changes in fair value reported in income statement; or |
| - | designated at fair value through profit or loss measured at fair value and changes in fair value reported in the income statement except changes in fair value attributable to the credit risk component recognised in other comprehensive income when no accounting mismatch occurs. |
3.9. Netting
Financial assets and financial liabilities are offset, and the net amount presented on the balance sheet when, and only when, we currently have a legally enforceable right to set off the recognised amounts and we intend either to settle on a net basis or to realise the asset and settle the liability simultaneously. We are party to a number of arrangements, including master netting agreements, that give us the right to offset financial assets and financial liabilities, but where we do not intend to settle the amounts net or simultaneously, the assets and liabilities concerned are presented separately on the balance sheet.
3.10. Capital instruments
We classify a financial instrument that we issue as a liability if it is a contractual obligation to deliver cash or another financial asset, or to exchange financial assets or financial liabilities on potentially unfavourable terms and as equity if we evidence a residual interest in our assets after the deduction of liabilities. Incremental costs and related tax that are directly attributable to an equity transaction are deducted from equity.
The consideration for any ordinary shares of NatWest Group plc purchased by us (known as treasury shares or own shares held) is deducted from retained earnings. On the cancellation of treasury shares their nominal value is removed from retained earnings and a consequential amount recognised in capital redemption in compliance with the Companies Act 2006.
On the sale or re-issue of treasury shares the consideration received and related tax are credited to equity, net of any directly attributable incremental costs.
| |
NatWest Group – Annual Report on Form 20-F 2023 | 50 |
Accounting policies continued
3.11. Derivatives and hedging
Derivatives are reported on the balance sheet at fair value.
We use derivatives as part of our trading activities, to manage our own risk such as interest rate, foreign exchange, or credit risk or in certain customer transactions. Not all derivatives used to manage risk are in hedge accounting relationships (an IFRS method to reduce accounting mismatch from changes in the fair value of the derivatives reported in the income statement).
Gains and losses arising from changes in the fair value of derivatives that are not in hedge relationships are recognised in Income from trading activities unless those derivatives are managed together with financial instruments designated at fair value; these gains and losses are included in Other operating income.
Hedge accounting
Hedge accounting relationships are designated and documented at inception in line with the requirements of IAS 39 Financial instruments – Recognition and Measurement.
The documentation identifies the hedged item, the hedging instrument and details of the risk that is being hedged and the way in which effectiveness will be assessed at inception and during the period of the hedge. When designating a hedging relationship, we consider: the economic relationship between the hedged item (including the risk being hedged) and the hedging instrument; the nature of the risk; the risk management objective and strategy for undertaking the hedge; and the appropriateness of the method that will be used to assess hedge effectiveness.
Designated hedging relationships must be expected to be highly effective both on a prospective and retrospective basis. This is assessed using regression techniques which model the degree of offsetting between the changes in fair value or cash flows attributable to the hedged risk and the changes in fair value of the designated hedging derivatives. Ineffectiveness is measured based on actual levels of offsetting and recognised in the income statement.
We enter into three types of hedge accounting relationships.
Fair value hedge - the gain or loss on the hedging instrument and the hedged item attributable to the hedged risk is recognised in the income statement. Where the hedged item is measured at amortised cost, the balance sheet amount of the hedged item is also adjusted.
Cash flow hedge - the effective portion of the designated hedge relationship is recognised in other comprehensive income and the ineffective portion in the income statement. When the hedged item (forecasted cash flows) results in the recognition of a financial asset or financial liability, the cumulative gain or loss is reclassified from equity to the income statement in the same periods in which the hedged forecasted cash flows affect the income statement.
Hedge of net investment in a foreign operation - in the hedge of a net investment in a foreign operation, the effective portion of the designated hedge relationship is recognised in other comprehensive income. Any ineffective portion is recognised in profit or loss. Non-derivative financial liabilities as well as derivatives may be designated as a hedging instrument in a net investment hedge.
Discontinuation of hedge accounting
Hedge accounting is discontinued if the hedge no longer meets the criteria for hedge accounting i.e. the hedge is not highly effective in offsetting changes in fair value or cash flows attributable to the hedged risk, consistent with the documented risk management strategy; the hedging instrument expires or is sold, terminated or exercised; or if hedge designation is revoked.
For fair value hedging any cumulative adjustment is amortised to the income statement over the life of the hedged item. Where the hedged item is no longer on the balance sheet the adjustment to the hedged item is reported in the income statement. For cash flow hedging the cumulative unrealised gain or loss is reclassified from equity to the income statement when the hedged cash flows occur or, if the forecast transaction results in the recognition of a financial asset or financial liability, when the hedged forecast cash flows affect the income statement. Where a forecast transaction is no longer expected to occur, the cumulative unrealised gain or loss is reclassified from equity to the income statement immediately.
For net investment hedging on disposal or partial disposal of a foreign operation, the amount accumulated in equity is reclassified from equity to the income statement.
| |
NatWest Group – Annual Report on Form 20-F 2023 | 51 |
Accounting policies continued
4. Future accounting developments
International Financial Reporting Standards
Effective 1 January 2024
| – | Classification of Liabilities as Current or Non-current (Amendments to IAS 1); |
| – | Non-current Liabilities with Covenants (Amendments to IAS 1) |
| – | Lease Liability in a Sale and Leaseback (Amendments to IFRS 16) |
| – | Supplier Finance Arrangements (Amendments to IAS 7 and IFRS 7) |
Effective 1 January 2025
| – | Lack of Exchangeability (Amendments to IAS 21) |
We are assessing the effect of adopting these amendments on our financial statements but do not expect the effect to be material.
| |
NatWest Group – Annual Report on Form 20-F 2023 | 52 |
Notes to the consolidated financial statements
1 Net interest income
Net interest income is the difference between the interest NatWest Group earns from its interest-bearing assets, such as loans, balances with central banks and other financial assets, and the interest paid on its interest-bearing liabilities, such as deposits and subordinated liabilities. |
Interest receivable on financial instruments classified as amortised cost, debt instruments classified as FVOCI and the interest element of the effective portion of any designated hedging relationships are measured using the effective interest rate, which allocates the interest receivable or interest payable over the expected life of the financial instrument at the rate that exactly discounts all estimated future cash flows to equal the financial instrument's initial carrying amount. Calculation of the effective interest rate takes into account fees payable or receivable that are an integral part of the financial instrument’s yield, premiums or discounts on acquisition or issue, early redemption fees and transaction costs. All contractual terms of a financial instrument are considered when estimating future cash flows. Negative interest on financial assets is presented in interest payable and negative interest on financial liabilities is presented in interest receivable. Included in interest receivable is finance lease income of £484 million (2022 - £314 million; 2021 - £298 million) which is recognised at a constant periodic rate of return before tax on the net investment.
For accounting policy information refer to Accounting policy 3.1.
| | | | | | |
|
| 2023 |
| 2022 |
| 2021 (1) |
Continuing operations |
| £m |
| £m |
| £m |
Balances at central banks and loans to banks - amortised cost |
| 3,737 |
| 1,987 |
| 445 |
Loans to customers - amortised cost |
| 15,553 |
| 10,085 |
| 8,536 |
Other financial assets |
| 1,736 |
| 565 |
| 253 |
Interest receivable | | 21,026 | | 12,637 | | 9,234 |
|
| |
| |
| |
Balances with banks |
| 1,039 |
| 379 |
| 204 |
Customer deposits |
| 5,276 |
| 785 |
| 556 |
Other financial liabilities |
| 2,977 |
| 1,196 |
| 670 |
Subordinated liabilities |
| 464 |
| 370 |
| 267 |
Internal funding of trading businesses |
| 221 |
| 65 |
| 2 |
Interest payable | | 9,977 | | 2,795 | | 1,699 |
Net interest income |
| 11,049 |
| 9,842 |
| 7,535 |
(1) | Comparative results have been re-presented from those previously published to reclassify certain items as discontinued operations as described in Note 8 to the consolidated financial statements. |
| |
NatWest Group – Annual Report on Form 20-F 2023 | 53 |
Notes to the consolidated financial statements continued
2 Non-interest income
There are three main categories of non-interest income: net fees and commissions, trading income, and other operating income. Net fees and commissions is the difference between fees received from customers for services provided by NatWest Group, such as credit card annual fees, underwriting fees, payment services, brokerage fees, trade finance, investment management fees, trustee and fiduciary services, and fees incurred in the provision of those services, such as credit card interchange fees, customer incentives, loan administration, foreign currency transaction charges, and brokerage fees. Trading income is earned from short-term financial assets and financial liabilities to either make a spread between purchase and sale price or held to take advantage of movements in prices and yields. Other operating income includes revenue from other operating activities which are not related to the principal activities of the company, such as: share of profit or loss from associates; operating lease income; the profit or loss on the sale of a subsidiary; or property, plant and equipment; profit or loss on own debt; and changes in the fair value of financial assets and liabilities designated at fair value through profit or loss. For accounting policy information refer to Accounting policies 3.1 and 3.6. |
| | | | | | |
|
| 2023 |
| 2022 |
| 2021 (1) |
Continuing operations | | £m | | £m | | £m |
Net fees and commissions (2) |
| 2,330 |
| 2,292 |
| 2,120 |
Trading income | | | | | | |
Foreign exchange |
| 270 | | 305 | | 364 |
Interest rate (3) |
| 595 | | 752 | | (130) |
Credit |
| (72) | | 17 | | 83 |
Changes in fair value of own debt and derivative liabilities attributable to own credit risk | | | | | | |
- debt securities in issue |
| (2) | | 42 | | 6 |
Equities, commodities and other |
| 3 | | 17 | | — |
|
| 794 | | 1,133 | | 323 |
Other operating income | | | | | | |
Gain/(loss) on redemption of own debt | | 3 | | (161) | | (145) |
Rental income on operating lease assets and investment property |
| 234 |
| 230 |
| 225 |
Changes in fair value of financial assets and liabilities designated at fair value through profit or loss (4) | | (150) | | 17 | | (8) |
Changes in fair value of other financial assets at fair value through profit or loss (5) | | 50 | | (45) | | 5 |
Hedge ineffectiveness |
| 52 |
| (20) |
| 25 |
Loss on disposal of amortised cost assets and liabilities |
| (5) |
| (15) |
| (15) |
(Loss)/profit on disposal of fair value through other comprehensive income assets |
| (43) |
| (168) |
| 117 |
Loss on sale of property, plant and equipment |
| (21) |
| (5) |
| (30) |
Share of (losses)/profits of associated entities |
| (9) |
| (30) |
| 216 |
Profit on disposal of subsidiaries and associates | | — | | — | | 48 |
Foreign exchange recycling gains/(losses) | | 484 | | 5 | | (10) |
Other income (6) |
| (16) |
| 81 |
| 23 |
| | 579 | | (111) | | 451 |
| | 3,703 | | 3,314 | | 2,894 |
(1) | Comparative results have been re-presented from those previously published to reclassify certain items as discontinued operations as described in Note 8 to the consolidated financial statements. |
(2) | Refer to Note 4 for further analysis. |
(3) | Includes fair value changes on derivatives which have not been designated in a hedge accounting relationship and gains and losses from the management of the NatWest Group’s funding requirements involving the use of derivatives including foreign exchange. These are aimed at managing the interest rate and foreign exchange risk that NatWest Group is exposed to. |
(4) | Includes related derivatives. |
(5) | Includes instruments that have failed solely payments of principal and interest testing under IFRS 9. |
(6) | 2022 includes £92 million profit from insurance liabilities. |
| |
NatWest Group – Annual Report on Form 20-F 2023 | 54 |
Notes to the consolidated financial statements continued
3 Operating expenses
Operating expenses are expenses NatWest Group incurs in the running of its business such as all staff costs (for example salaries, bonus awards, pension costs and social security costs), premises and equipment costs that arise from the occupation of premises and the use of equipment, depreciation and amortisation and other administrative expenses. For accounting policy information refer to Accounting policies 3.3, 3.4 and 3.5. |
| | | | | | |
|
| 2023 |
| 2022 |
| 2021 |
Continuing operations | | £m | | £m | | £m |
Salaries |
| 2,483 |
| 2,250 |
| 2,295 |
Bonus awards |
| 353 |
| 334 |
| 267 |
Temporary and contract costs | | 199 | | 234 | | 240 |
Social security costs |
| 352 |
| 328 |
| 300 |
Pension costs | | 313 | | 363 | | 354 |
- defined benefit schemes (Note 5) |
| 122 |
| 205 |
| 215 |
- defined contribution schemes |
| 191 |
| 158 |
| 139 |
Other |
| 201 |
| 207 |
| 220 |
Staff costs |
| 3,901 |
| 3,716 |
| 3,676 |
| | | | | | |
Premises and equipment |
| 1,153 |
| 1,112 |
| 1,133 |
UK bank levy |
| 109 |
| 101 |
| 99 |
Depreciation and amortisation (1,2) |
| 934 |
| 833 |
| 923 |
Other administrative expenses (3) |
| 1,899 |
| 1,925 |
| 1,927 |
Administrative expenses |
| 4,095 |
| 3,971 |
| 4,082 |
| | 7,996 | | 7,687 | | 7,758 |
(1)Includes depreciation of right of use assets of £104 million (2022 - £119 million; 2021 - £167 million).
(2)2021 includes impairment of goodwill of £85 million.
(3)Includes litigation and conduct costs, net of amounts recovered. Refer to Note 21 for further details.
| |
NatWest Group – Annual Report on Form 20-F 2023 | 55 |
Notes to the consolidated financial statements continued
3 Operating expenses continued
The average number of persons employed, rounded to the nearest hundred, during the year, excluding temporary staff,was 61,500 (2022 - 60,000; 2021- 59,200). The average number of temporary employees during 2023 was 2,100 (2022 - 2,500; 2021 - 2,500).
The number of persons employed at 31 December, excluding temporary staff, by reportable segment, was as follows:
| | | | | | |
Continuing operations |
| 2023 |
| 2022 (1) |
| 2021 (1) |
Retail Banking |
| 14,300 |
| 15,100 |
| 16,000 |
Private Banking |
| 2,400 |
| 2,300 |
| 2,000 |
Commercial & Institutional |
| 12,400 |
| 12,200 |
| 11,700 |
Central items & other (2) |
| 32,500 |
| 31,400 |
| 28,100 |
Total |
| 61,600 |
| 61,000 |
| 57,800 |
| | | | | | |
UK |
| 41,500 |
| 41,200 |
| 40,600 |
USA |
| 300 |
| 300 |
| 300 |
India |
| 16,900 |
| 15,700 |
| 13,500 |
Poland | | 1,500 | | 1,500 | | 1,400 |
Republic of Ireland | | 400 | | 1,400 | | 1,200 |
Rest of the World |
| 1,000 |
| 900 |
| 800 |
Total |
| 61,600 |
| 61,000 |
| 57,800 |
(1) | Comparatives have been re-presented to reflect the movement of headcount across segments due to segment reorganisation. |
(2) | Central items & other includes Ulster Bank RoI. The total number of persons employed in Ulster Bank RoI of 500 (2022 – 2,200; 2021 – 2,400) includes nil people employed in discontinued operations at 31 December 2023 (2022 – 400; 2021 – 700). |
| |
NatWest Group – Annual Report on Form 20-F 2023 | 56 |
Notes to the consolidated financial statements continued
3 Operating expenses continued
Share-based payments
| | | | | | | | |
Award plan |
| Eligible employees |
| Nature of award |
| Vesting conditions (1) |
| Settlement |
Sharesave | | UK, Channel Islands, Gibraltar, Isle of Man, Poland and India. | | Option to buy shares under employee savings plan | | Continuing employment or leavers in certain circumstances | | 2024 to 2028 |
Deferred performance awards | | All | | Awards of ordinary shares and conditional shares | | Continuing employment or leavers in certain circumstances | | 2024 to 2031 |
Long-term incentives (2,3) | | Senior employees | | Awards of ordinary shares and conditional shares | | Continuing employment or leavers in certain circumstances and/or satisfaction of the pre-vesting assessment and underpins | | 2024 to 2030 |
(1) | All awards have vesting conditions which may not be met. |
(2) | Long-term incentives include buy-out awards offered to compensate certain new hires for the loss of forfeited awards from their previous employment. All awards are granted under the Employee Share Plan. |
(3) | The existing Long-term incentive scheme has been closed for new awards and members as at 31 December 2022. The scheme has been replaced by a new Restricted share plan scheme with similar granting and vesting conditions. |
| | | | | | | | | | | | |
Sharesave | | 2023 | | 2022 | | 2021 | ||||||
|
| Average |
| Shares |
| Average |
| Shares |
| Average |
| Shares |
| | exercise price | | under option | | exercise price | | under option | | exercise price | | under option |
| | £ | | (million) | | £ | | (million) | | £ | | (million) |
At 1 January |
| 1.63 |
| 99 |
| 1.61 |
| 95 |
| 1.64 |
| 96 |
Granted |
| 1.42 |
| 43 |
| 1.86 |
| 25 |
| 1.80 |
| 24 |
Exercised |
| 1.44 |
| (23) |
| 1.88 |
| (15) |
| 1.76 |
| (10) |
Cancelled |
| 1.72 |
| (5) |
| 1.60 |
| (6) |
| 2.02 |
| (15) |
At 31 December |
| 1.59 |
| 114 |
| 1.63 |
| 99 |
| 1.61 |
| 95 |
The fair value of Sharesave options granted in 2023 was determined using a pricing model that included: expected volatility of share price determined at the grant date based on historical share price volatility over a period of up to five years; expected option lives that equal the vesting period; estimated dividend yield on equity shares; and risk-free interest rates determined from UK gilts with terms matching the expected lives of the options.
The exercise price of options and the fair value on granting awards of fully paid shares is the average market price over the five trading days (three trading days for Sharesave) preceding grant date. When estimating the fair value of the award, the number of shares granted and the prevailing market price as defined on page 133 (exhibit 15.2) are used. The fair value of the award is recognised as services are provided by employees over the vesting period.
Options are exercisable within six months of vesting; 19.0 million options were exercisable at 31 December 2023 (2022 – 5.1 million; 2021 – 6.0 million). The weighted average share price at the date of exercise of options was £2.20 (2022 - £2.59; 2021 - £2.19). At 31 December 2023, exercise prices ranged from £1.12 to £1.89 (2022 - £1.12 to £2.27; 2021 - £1.12 to £2.27) and the remaining average contractual life was 2.25 years (2022 – 2 years; 2021 – 2.1 years). The fair value of options granted in 2023 was £27.3 million (2022 - £22.1 million; 2021 - £17 million).
| | | | | �� | | | | | | | |
Deferred performance awards | | 2023 | | 2022 | | 2021 | ||||||
|
| Value at |
| Shares |
| Value at |
| Shares |
| Value at |
| Shares |
| | grant | | awarded | | grant | | awarded | | grant | | awarded |
| | £m | | (million) | | £m | | (million) | | £m | | (million) |
At 1 January |
| 93 |
| 46 |
| 132 |
| 65 |
| 169 |
| 77 |
Granted |
| 52 |
| 20 |
| 46 |
| 20 |
| 61 |
| 32 |
Forfeited |
| (2) |
| (1) |
| (4) |
| (2) |
| (10) |
| (5) |
Vested |
| (67) |
| (30) |
| (81) |
| (37) |
| (88) |
| (39) |
At 31 December |
| 76 |
| 35 |
| 93 |
| 46 |
| 132 |
| 65 |
| |
NatWest Group – Annual Report on Form 20-F 2023 | 57 |
Notes to the consolidated financial statements continued
3 Operating expenses continued
The awards granted in 2023 vest in equal tranches on the anniversary of the award, predominantly over three years.
| | | | | | | | | | | | |
Long-term incentives | | 2023 | | 2022 | | 2021 | ||||||
|
| Value at |
| Shares |
| Value at |
| Shares |
| Value at |
| Shares |
| | grant | | awarded | | grant | | awarded | | grant | | awarded |
| | £m | | (million) | | £m | | (million) | | £m | | (million) |
At 1 January |
| 49 |
| 23 |
| 44 |
| 21 |
| 50 |
| 24 |
Granted |
| 11 |
| 5 |
| 16 |
| 7 |
| 6 |
| 3 |
Vested/exercised |
| (10) |
| (4) |
| (10) |
| (4) |
| (12) |
| (6) |
Lapsed |
| (1) |
| (1) |
| (1) |
| (1) |
| — |
| — |
At 31 December |
| 49 |
| 23 |
| 49 |
| 23 |
| 44 |
| 21 |
The market value of awards vested/exercised in 2023 was £9.5 million (2022 - £11.7 million; 2021 - £13 million).
| | | | | | | |
Bonus awards | | 2023 | | 2022 | | Change |
|
|
| £m |
| £m |
| % |
|
Non-deferred cash awards (1) | | 43 | | 40 | | 8 | % |
Deferred cash awards |
| 262 |
| 270 |
| (3) | % |
Deferred share awards |
| 51 |
| 60 |
| (15) | % |
Total deferred bonus awards |
| 313 |
| 330 |
| (5) | % |
Total bonus awards (2) |
| 356 |
| 370 |
| (4) | % |
Bonus awards as a % of operating profit before tax (3) |
| 5 | % | 7 | % | | |
Proportion of bonus awards that are deferred |
| 88 | % | 89 | % | | |
- deferred cash awards |
| 84 | % | 82 | % | | |
- deferred share awards |
| 16 | % | 18 | % | | |
(1) | Non-deferred cash awards are limited to £2,000 for all employees. |
(2) | Excludes other performance-related compensation. |
(3) | Operating profit before tax and income statement charge for bonus awards. |
Reconciliation of bonus awards to income statement charge
| | | | | | |
|
| 2023 |
| 2022 |
| 2021 |
| | £m | | £m | | £m |
Bonus awarded |
| 356 |
| 370 |
| 301 |
Less: deferral of charge for amounts awarded for current year |
| (114) |
| (127) |
| (99) |
Income statement charge for amounts awarded in current year |
| 242 |
| 243 |
| 202 |
| | | | | | |
Add: current year charge for amounts deferred from prior years |
| 115 |
| 94 |
| 80 |
Less: forfeiture of amounts deferred from prior years |
| (4) |
| (3) |
| (15) |
Income statement charge for amounts deferred from prior years |
| 111 |
| 91 |
| 65 |
Income statement charge for bonus awards (2) |
| 353 |
| 334 |
| 267 |
| |
NatWest Group – Annual Report on Form 20-F 2023 | 58 |
Notes to the consolidated financial statements continued
3 Operating expenses continued
Year in which income statement charge is expected to be taken for deferred bonus awards
| | | | | | | | | | |
| | Actual | | Expected | ||||||
|
| |
| |
| |
| |
| 2025 |
| | 2021 | | 2022 | | 2023 | | 2024 | | and beyond |
| | £m | | £m | | £m | | £m | | £m |
Bonus awards deferred from 2021 and earlier |
| 80 |
| 94 |
| 16 | | 7 | | 5 |
Bonus awards deferred from 2022 | | — | | — | | 99 | | 9 | | 9 |
Less: forfeiture of amounts deferred from prior years |
| (15) |
| (3) |
| (4) | | — | | — |
Bonus awards for 2023 deferred |
| — |
| — |
| — | | 98 | | 16 |
|
| 65 |
| 91 |
| 111 | | 114 | | 30 |
4 Segmental analysis
NatWest Group analyses its performance between the different operating segments of the Group as required by IFRS 8, Operating segments. The presentation is consistent with internal financial reporting and how senior management assesses the performance of each operating segment |
Reportable operating segments:
The business is organised into the following reportable segments: Retail Banking, Private Banking, Commercial & Institutional, and Central items & other.
Retail Banking serves personal customers in the UK, including Ulster Bank customers in Northern Ireland.
Private Banking serves UK-connected high-net-worth individuals and their business interests.
Commercial & Institutional consists of customer businesses reported under Business Banking, Commercial Mid-market and Corporate & Institutions, supporting our customers across the full non-personal customer lifecycle, both domestically and internationally. Our Markets offering helps our customers manage financial risks across different geographies, while our International offering provides full-service banking operations in the Channel Islands, Isle of Man, Gibraltar and Luxembourg.
Central items & other includes corporate functions, such as treasury, finance, risk management, compliance, legal, communications and human resources. Central functions manage NatWest Group capital resources and NatWest Group-wide regulatory projects and provide services to the reportable segments. Central items & other includes businesses and amounts not directly related to any of the other reportable segments. Ulster Bank RoI is no longer an operating segment and its continuing operations now form part of Central items & other.
| |
NatWest Group – Annual Report on Form 20-F 2023 | 59 |
Notes to the consolidated financial statements continued
4 Segmental analysis continued
Allocation of central balance sheet items
NatWest Group allocates all central costs relating to central functions to the business using appropriate drivers; these are reported as indirect costs in the segmental income statements. Assets and risk-weighted assets held centrally, mainly relating to NatWest Group Treasury, are allocated to the business using appropriate drivers.
| | | | | | | | | | |
| | | | | | | | Central | | |
| | Retail | | Private | | Commercial & | | items | | |
|
| Banking |
| Banking |
| Institutional |
| & other |
| Total |
2023 |
| £m |
| £m |
| £m |
| £m |
| £m |
Continuing operations | | | | | | | | | | |
Net interest income |
| 5,496 |
| 710 |
| 5,044 |
| (201) |
| 11,049 |
Net fees and commissions |
| 427 |
| 249 |
| 1,654 |
| — |
| 2,330 |
Other non-interest income |
| 8 |
| 31 |
| 723 |
| 611 |
| 1,373 |
Total income |
| 5,931 |
| 990 |
| 7,421 |
| 410 |
| 14,752 |
Depreciation and amortisation |
| (1) |
| (1) |
| (154) |
| (778) |
| (934) |
Other operating expenses |
| (2,827) |
| (684) |
| (3,937) |
| 386 |
| (7,062) |
Impairment losses |
| (465) |
| (14) |
| (94) |
| (5) |
| (578) |
Operating profit |
| 2,638 |
| 291 |
| 3,236 |
| 13 |
| 6,178 |
| | | | | | | | | | |
2022 |
| |
| |
| |
| |
| |
Continuing operations | | | | | | | | | | |
Net interest income |
| 5,224 |
| 777 |
| 4,171 |
| (330) |
| 9,842 |
Net fees and commissions |
| 422 |
| 250 |
| 1,580 |
| 40 |
| 2,292 |
Other non-interest income |
| — |
| 29 |
| 662 |
| 331 |
| 1,022 |
Total income |
| 5,646 |
| 1,056 |
| 6,413 |
| 41 |
| 13,156 |
Depreciation and amortisation |
| — |
| — |
| (161) |
| (672) |
| (833) |
Other operating expenses |
| (2,593) |
| (622) |
| (3,583) |
| (56) |
| (6,854) |
Impairment (losses)/releases |
| (229) |
| 2 |
| (122) |
| 12 |
| (337) |
Operating profit/(loss) |
| 2,824 |
| 436 |
| 2,547 |
| (675) |
| 5,132 |
2021 | | | | | | | | | | |
Continuing operations | | | | | | | | | | |
Net interest income | | 4,074 | | 480 | | 2,974 | | 7 | | 7,535 |
Net fees and commissions | | 377 | | 258 | | 1,440 | | 45 | | 2,120 |
Other non-interest income | | (6) | | 78 | | 424 | | 278 | | 774 |
Total income | | 4,445 | | 816 | | 4,838 | | 330 | | 10,429 |
Depreciation and amortisation | | (85) | | - | | (173) | | (665) | | (923) |
Other operating expenses | | (2,428) | | (520) | | (3,584) | | (303) | | (6,835) |
Impairment releases/(losses) | | 36 | | 54 | | 1,160 | | (77) | | 1,173 |
Operating profit/(loss) | | 1,968 | | 350 | | 2,241 | | (715) | | 3,844 |
| |
NatWest Group – Annual Report on Form 20-F 2023 | 60 |
Notes to the consolidated financial statements continued
4 Segmental analysis continued
| | | | | | | | | | |
Total revenue (1) | | | | | | | | | | |
| | | | | | | | Central | | |
| | Retail | | Private | | Commercial & | | items & | | |
|
| Banking |
| Banking |
| Institutional |
| other |
| Total |
2023 |
| £m |
| £m |
| £m |
| £m |
| £m |
Continuing operations |
| |
| |
| |
| |
| |
External |
| 7,366 |
| 1,157 |
| 12,519 |
| 4,340 |
| 25,382 |
Inter-segmental (4) |
| 5 |
| 1,000 |
| (1,602) |
| 597 |
| — |
Total |
| 7,371 |
| 2,157 |
| 10,917 |
| 4,937 |
| 25,382 |
|
| |
| |
| |
| |
| |
2022 |
| |
| |
| |
| |
| |
Continuing operations | | | | | | | | | | |
External | | 5,773 | | 874 | | 7,258 | | 2,669 | | 16,574 |
Inter-segmental (4) |
| — |
| 389 |
| (395) |
| 6 |
| — |
Total |
| 5,773 |
| 1,263 |
| 6,863 |
| 2,675 |
| 16,574 |
| | | | | | | | | | |
| | | | | | | | | | |
2021 | | | | | | | | | | |
Continuing operations | | | | | | | | | | |
External | | 5,415 | | 792 | | 5,189 | | 1,306 | | 12,702 |
Inter-segmental (4) | | 18 | | 127 | | 102 | | (247) | | — |
Total | | 5,433 | | 919 | | 5,291 | | 1,059 | | 12,702 |
| | | | | | | | | | |
Total income | | | | | | | | | | |
| | | | | | | | Central | | |
| | Retail | | Private | | Commercial & | | items & | | |
|
| Banking |
| Banking |
| Institutional |
| other |
| Total |
2023 |
| £m |
| £m |
| £m |
| £m |
| £m |
Continuing operations | | | | | | | | | | |
External |
| 4,170 | | 327 |
| 7,730 |
| 2,525 | | 14,752 |
Inter-segmental (4) |
| 1,761 | | 663 |
| (309) |
| (2,115) | | — |
Total |
| 5,931 | | 990 |
| 7,421 |
| 410 | | 14,752 |
| | | | | | | | | | |
2022 |
| | | |
| |
| | | |
Continuing operations | | | | | | | | | | |
External |
| 4,956 | | 778 |
| 5,920 |
| 1,502 | | 13,156 |
Inter-segmental (4) | | 690 | | 278 | | 493 | | (1,461) | | — |
Total | | 5,646 | | 1,056 | | 6,413 | | 41 | | 13,156 |
| | | | | | | | | | |
2021 | | | | | | | | | | |
Continuing operations | | | | | | | | | | |
External | | 4,933 | | 801 | | 4,634 | | 61 | | 10,429 |
Inter-segmental (4) | | (488) | | 15 | | 204 | | 269 | | — |
Total | | 4,445 | | 816 | | 4,838 | | 330 | | 10,429 |
For the notes to this table refer to page 64.
| |
NatWest Group – Annual Report on Form 20-F 2023 | 61 |
Notes to the consolidated financial statements continued
4 Segmental analysis continued
Analysis of net fees and commissions
| | | | | | | | | | |
|
| |
| |
| |
| Central |
| |
| | Retail | | Private | | Commercial & | | items | | |
|
| Banking | | Banking | | Institutional | | & other | | Total |
2023 |
| £m | | £m | | £m | | £m | | £m |
Continuing operations | | | | | | | | | | |
Fees and commissions receivable |
|
|
| | |
|
|
|
|
|
- Payment services |
| 324 |
| 32 | | 671 |
| 3 |
| 1,030 |
- Credit and debit card fees |
| 400 |
| 13 | | 260 |
| 3 |
| 676 |
- Lending and financing | | 14 | | 5 | | 709 | | 1 | | 729 |
- Brokerage |
| 35 |
| 6 | | 42 |
| — |
| 83 |
- Investment management, trustee and fiduciary services (2) | | 2 |
| 209 | | 45 |
| 10 |
| 266 |
- Underwriting fees |
| — |
| — | | 123 |
| — |
| 123 |
- Other |
| 4 |
| 5 | | 73 |
| (6) |
| 76 |
Total |
| 779 |
| 270 | | 1,923 |
| 11 |
| 2,983 |
Fees and commissions payable |
| (352) |
| (21) | | (269) |
| (11) |
| (653) |
Net fees and commissions |
| 427 |
| 249 | | 1,654 |
| — |
| 2,330 |
| | | | | | | | | | |
2022 | | | | | | | | | | |
Continuing operations | | | | | | | | | | |
Fees and commissions receivable |
|
|
| | |
|
|
|
|
|
- Payment services |
| 314 |
| 25 | | 642 |
| 43 |
| 1,024 |
- Credit and debit card fees |
| 401 |
| 15 | | 227 |
| 18 |
| 661 |
- Lending and financing |
| 17 |
| 8 | | 673 |
| 3 |
| 701 |
- Brokerage |
| 43 | | 6 | | 44 |
| — |
| 93 |
- Investment management, trustee and fiduciary services (2) |
| 4 |
| 219 | | 46 |
| — |
| 269 |
- Underwriting fees |
| — | | — | | 120 | | — | | 120 |
- Other |
| — |
| 3 | | 88 |
| (44) |
| 47 |
Total |
| 779 |
| 276 | | 1,840 |
| 20 |
| 2,915 |
Fees and commissions payable |
| (357) |
| (26) | | (260) |
| 20 |
| (623) |
Net fees and commissions |
| 422 |
| 250 | | 1,580 |
| 40 |
| 2,292 |
| | | | | | | | | | |
2021 | | | | | | | | | | |
Fees and commissions receivable |
|
|
| | |
|
|
|
|
|
- Payment services |
| 306 |
| 35 | | 577 |
| 49 |
| 967 |
- Credit and debit card fees |
| 344 |
| 10 | | 149 |
| 19 |
| 522 |
- Lending and financing |
| 13 |
| 10 | | 643 |
| 4 |
| 670 |
- Brokerage |
| 48 |
| 6 | | 42 |
| — |
| 96 |
- Investment management, trustee and fiduciary services (2) |
| 3 |
| 230 | | 45 |
| 2 |
| 280 |
- Underwriting fees |
| — |
| — | | 127 |
| — |
| 127 |
- Other |
| — |
| 35 | | 109 |
| (112) |
| 32 |
Total |
| 714 |
| 326 | | 1,692 |
| (38) |
| 2,694 |
Fees and commissions payable |
| (337) |
| (68) | | (252) |
| 83 |
| (574) |
Net fees and commissions |
| 377 |
| 258 | | 1,440 |
| 45 |
| 2,120 |
For the notes to this table refer to page 64.
| |
NatWest Group – Annual Report on Form 20-F 2023 | 62 |
Notes to the consolidated financial statements continued
4 Segmental analysis continued
| | | | | | | | | | | | ��� |
| | 2023 | | 2022 | | 2021 | ||||||
| | Assets | | Liabilities | | Assets | | Liabilities | | Assets | | Liabilities |
|
| £m |
| £m |
| £m |
| £m |
| £m |
| £m |
Retail Banking |
| 228,684 | | 191,936 | | 226,375 |
| 192,282 | | 209,973 |
| 192,715 |
Private Banking |
| 26,894 | | 37,806 | | 29,867 |
| 41,491 | | 29,854 |
| 39,388 |
Commercial & Institutional |
| 384,958 | | 359,766 | | 404,817 |
| 383,768 | | 425,718 |
| 411,757 |
Central items & other |
| 52,137 | | 65,977 | | 58,994 |
| 66,016 | | 116,447 |
| 96,329 |
Total |
| 692,673 | | 655,485 | | 720,053 |
| 683,557 | | 781,992 |
| 740,189 |
Segmental analysis of goodwill
The total carrying value of goodwill at 31 December 2023 was £5,680 million (2022 - £5,522 million) comprising: Retail Banking £2,607 million (2022 - £2,607 million); Commercial & Institutional £2,905 million (2022 - £2,906 million); Private Banking £9 million (2022 - £9 million) and Central items & other £159 million (2022 - nil).
| |
NatWest Group – Annual Report on Form 20-F 2023 | 63 |
Notes to the consolidated financial statements continued
4 Segmental analysis continued
Geographical segments
The geographical analysis in the tables below has been compiled on the basis of location of office where the transactions are recorded.
| | | | | | | | | | |
|
| UK |
| USA |
| Europe |
| RoW |
| Total |
2023 |
| £m |
| £m |
| £m |
| £m |
| £m |
Continuing operations | | | | | | | | | | |
Total revenue |
| 24,096 |
| 167 | | 1,016 | | 103 | | 25,382 |
Interest receivable |
| 20,192 |
| 39 | | 774 | | 21 | | 21,026 |
Interest payable | | (9,500) | | (1) | | (472) | | (4) | | (9,977) |
Net fees and commissions |
| 2,052 |
| 49 | | 172 | | 57 | | 2,330 |
Trading income |
| 704 |
| 66 | | 1 | | 23 | | 794 |
Other operating income |
| 556 |
| (10) | | 30 | | 3 | | 579 |
Total income (3) |
| 14,004 |
| 143 | | 505 | | 100 | | 14,752 |
Operating profit/(loss) before tax |
| 6,196 |
| 45 | | (149) | | 86 | | 6,178 |
Total assets |
| 610,831 |
| 23,725 | | 56,001 | | 2,116 | | 692,673 |
Total liabilities |
| 594,250 |
| 22,106 | | 37,506 | | 1,623 | | 655,485 |
Contingent liabilities and commitments |
| 112,199 |
| — | | 7,411 | | 21 | | 119,631 |
| | | | | | | | | | |
2022 | | | | | | | | | | |
Continuing operations | | | | | | | | | | |
Total revenue |
| 15,795 |
| 117 |
| 558 |
| 104 |
| 16,574 |
Interest receivable |
| 12,242 |
| 37 |
| 344 |
| 14 |
| 12,637 |
Interest payable | | (2,567) | | (2) | | (221) | | (5) | | (2,795) |
Net fees and commissions |
| 1,983 |
| 44 |
| 207 |
| 58 |
| 2,292 |
Trading income |
| 1,208 |
| 1 |
| (104) |
| 28 |
| 1,133 |
Other operating income |
| (140) |
| 14 |
| 12 |
| 3 |
| (111) |
Total income (3) |
| 12,726 |
| 94 |
| 238 |
| 98 |
| 13,156 |
Operating profit/(loss) before tax |
| 5,716 |
| (46) |
| (620) |
| 82 |
| 5,132 |
Total assets |
| 589,758 |
| 25,979 |
| 101,164 |
| 3,152 |
| 720,053 |
Total liabilities |
| 579,476 |
| 27,039 |
| 75,092 |
| 1,950 |
| 683,557 |
Contingent liabilities and commitments |
| 117,915 |
| — |
| 8,649 |
| 17 |
| 126,581 |
| | | | | | | | | | |
2021 |
|
|
|
|
|
|
|
|
|
|
Continuing operations | | | | | | | | | | |
Total revenue |
| 12,100 |
| 87 |
| 482 |
| 33 |
| 12,702 |
Interest receivable |
| 8,949 |
| 20 |
| 257 |
| 8 |
| 9,234 |
Interest payable | | (1,483) | | (2) | | (211) | | (3) | | (1,699) |
Net fees and commissions |
| 1,820 |
| 27 |
| 231 |
| 42 |
| 2,120 |
Trading income |
| 247 |
| 53 |
| (1) |
| 24 |
| 323 |
Other operating income |
| 387 |
| 2 |
| 62 |
| — |
| 451 |
Total income (3) |
| 9,920 |
| 100 |
| 338 |
| 71 |
| 10,429 |
Operating (loss)/profit before tax |
| 4,143 |
| 48 |
| (387) |
| 40 |
| 3,844 |
Total assets |
| 693,221 |
| 21,776 |
| 64,415 |
| 2,580 |
| 781,992 |
Total liabilities |
| 676,684 |
| 23,286 |
| 38,835 |
| 1,384 |
| 740,189 |
Contingent liabilities and commitments |
| 117,225 |
| 1 |
| 8,114 |
| 27 |
| 125,367 |
(1) | Total revenue comprises interest receivable, fees and commissions receivable, income from trading activities and other operating income. |
(2) | Comparisons with prior periods are affected by the transfer of the Private Client Advice business to Private Banking from 1 January 2021. |
(3) | Total income excludes internal service fee income which has been calculated on a cost plus mark-up basis. |
(4) | Revenue and income from transactions between segments of the group are now reported as inter-segment in both the current and comparative information. |
| |
NatWest Group – Annual Report on Form 20-F 2023 | 64 |
Notes to the consolidated financial statements continued
5 Pensions
NatWest Group operates two types of pension scheme: defined benefit and defined contribution. The defined contribution schemes invest contributions in a choice of funds and the accumulated contributions and investment returns are used by the employee to provide benefits on retirement. There is no legal or constructive obligation for NatWest Group to pay any further contributions or benefits. The defined benefit schemes provide pensions in retirement based on employees’ pensionable salary and service. |
NatWest Group’s balance sheet includes any defined benefit pension scheme surplus or deficit as a retirement benefit asset or liability reported in other assets and other liabilities. The surplus or deficit is the difference between the liabilities to be paid from the defined benefit scheme and the assets held by the scheme to meet these liabilities. The liabilities are calculated by external actuaries using a number of financial and demographic assumptions.
For some NatWest Group defined benefit schemes where there is a net defined benefit surplus in excess of the present value of any economic benefits that can be obtained from that surplus, the application of accounting standards means we do not recognise that surplus on the balance sheet.
For accounting policy information refer to Accounting policy 3.3.
Defined contribution schemes
NatWest Group sponsors several defined contribution schemes in different territories, which new employees are entitled to join. NatWest Group pays specific contributions into individual investment funds on employees’ behalf. Once those contributions are paid, there is no further liability on the NatWest Group balance sheet relating to the defined contribution schemes.
Defined benefit schemes
NatWest Group sponsors a number of pension schemes in the UK and overseas, including the Main section of the NatWest Group Pension Fund (the Main section) which operates under UK trust law and is managed and administered on behalf of its members in accordance with the terms of the trust deed, the scheme rules and UK legislation.
Pension fund trustees are appointed to operate each fund and ensure benefits are paid in accordance with the scheme rules and national law. The trustees are the legal owner of a scheme’s assets, and have a duty to act in the best interests of all scheme members.
The schemes generally provide a pension of one -sixtieth of final pensionable salary for each year of service prior to retirement up to a maximum of 40 years and are contributory for current members. These have been closed to new entrants for over ten years, although active members continue to build up additional pension benefits, currently subject to 2% maximum annual salary inflation, while they remain employed by NatWest Group.
The Main section corporate trustee is NatWest Pension Trustee Limited (the Trustee), a wholly owned subsidiary of NWB Plc, Principal Employer of the Main section. The Board of the Trustee includes member trustee directors selected from eligible active staff, deferred and pensioner members who apply and trustee directors appointed by NatWest Group.
Under UK legislation, a defined benefit pension scheme is required to meet the statutory funding objective of having sufficient and appropriate assets to cover its liabilities (the pensions that have been promised to members).
Similar governance principles apply to NatWest Group’s other defined benefit pension schemes.
Investment strategy
The assets of the Main section, which is typical of other group schemes (aside from AA section), represent 91% of all plan assets at 31 December 2023 (2022 - 91%) and are invested as shown below.
The Main section employs physical, derivative and non-derivative instruments to achieve a desired asset class exposure and to reduce the section’s interest rate, inflation, and currency risk. This means that the net funding position is considerably less sensitive to changes in market conditions than the value of the assets or liabilities in isolation. In particular, movements in interest rate and inflation are substantially hedged by the Trustee.
| |
NatWest Group – Annual Report on Form 20-F 2023 | 65 |
Notes to the consolidated financial statements continued
5 Pensions continued
During 2023, the Trustee completed a buy-in transaction for the AA section of the Group Pension Fund, passing all material longevity and investment risk for the section to an insurer. At 31 December 2023, the assets of this section comprised mainly of the buy-in asset (a bulk annuity policy valued at £546 million under IAS 19, covering 99% of the defined benefit obligation attributable to this section), together with residual assets of c. £145 million. In exchange for an upfront premium paid to the insurer, the buy-in asset provides a stream of cashflows to the Trustee replicating payments due to members.
The premium was determined by the insurer using its pricing basis. Under IAS 19, the value placed on this asset mirrors the valuation of the defined benefit obligations covered, incorporating an assessment of credit risk. Since the insurer’s pricing basis is more conservative than the best-estimate valuation under IAS 19, an asset loss arises at the outset, which is recognised through OCI along with the impact of other movements in asset values over the year. In future, the buy-in asset value will move in line with movements in the defined benefit obligations covered, meaning that the scheme is protected against longevity and market risk.
Major classes of plan assets as a percentage of total plan assets of the Main section
| | | | | | | | | | | | |
| | 2023 | | 2022 | ||||||||
|
| Quoted |
| Unquoted |
| Total |
| Quoted |
| Unquoted |
| Total |
| | % | | % | | % | | % | | % | | % |
Equities | | 0.1 | | 6.7 | | 6.8 | | 0.1 | | 7.7 | | 7.8 |
Index linked bonds |
| 36.7 | | — | | 36.7 | | 37.7 | | — | | 37.7 |
Government bonds |
| 13.3 | | — | | 13.3 | | 18.4 | | — | | 18.4 |
Corporate and other bonds |
| 19.2 | | 6.4 | | 25.6 | | 15.3 | | 6.7 | | 22.0 |
Real estate |
| — |
| 4.5 | | 4.5 | | — |
| 6.0 | | 6.0 |
Derivatives |
| — |
| 2.7 | | 2.7 | | — |
| 8.2 | | 8.2 |
Cash and other assets | | — | | 10.4 | | 10.4 | | — | | (0.1) | | (0.1) |
|
| 69.3 | | 30.7 | | 100.0 | | 71.5 | | 28.5 | | 100.0 |
The Main section’s holdings of derivative instruments are summarised in the table below:
| | | | | | | | | | | | |
| | 2023 | | 2022 | ||||||||
| | Notional | | Fair value | | Notional | | Fair value | ||||
|
| amounts |
| Assets |
| Liabilities |
| amounts |
| Assets |
| Liabilities |
| | £bn | | £m | | £m | | £bn | | £m | | £m |
Inflation rate swaps |
| 29 |
| 1,929 |
| 940 |
| 21 |
| 1,873 |
| 990 |
Interest rate swaps |
| 52 |
| 3,121 |
| 3,394 |
| 103 |
| 14,317 |
| 12,546 |
Currency forwards |
| 13 |
| 235 |
| 34 |
| 12 |
| 310 |
| 113 |
Equity and bond call options |
| — |
| — |
| — |
| — |
| — |
| — |
Equity and bond put options |
| — |
| — |
| 4 |
| — |
| 2 |
| 70 |
Other |
| 1 |
| 8 |
| 20 |
| 1 |
| 14 |
| 19 |
Swaps have been executed at prevailing market rates and within standard market bid/offer spreads with a number of counterparties, including NWB Plc.
At 31 December 2023, the gross notional value of the swaps was £81 billion (2022 - £124 billion) and had a net positive fair value of £714 million (2022 - £2,642 million) against which the counterparties had posted approximately 128% collateral.
| |
NatWest Group – Annual Report on Form 20-F 2023 | 66 |
Notes to the consolidated financial statements continued
5 Pensions continued
The schemes do not invest directly in NatWest Group but may have exposure to NatWest Group through indirect holdings. The trustees of the respective UK schemes are responsible for ensuring that indirect investments in NatWest Group do not exceed the regulatory limit of 5% of plan assets.
| | | | | | | | | | | | | | | | |
| | Main section | | All schemes | ||||||||||||
|
|
|
| Present value |
| Asset |
| Net |
|
|
| |
| Asset |
| |
| | Fair | | of defined | | ceiling/ | | pension | | Fair | | Present value | | ceiling/ | | Net |
| | value of | | benefit | | minimum | | assets/ | | value of | | of defined | | minimum | | pension |
| | plan assets | | obligation (1) | | funding | | liability | | plan assets | | benefit (2) | | funding | | assets (2) |
Changes in value of net pension assets/(liability) | | £m | | £m | | £m | | £m | | £m | | £m | | £m | | £m |
At 1 January 2022 |
| 52,021 |
| (42,020) |
| (10,001) |
| — |
| 57,787 |
| (46,808) |
| (10,491) |
| 488 |
Currency translation and other adjustments | | — | | — | | — | | — | | 78 | | (65) | | (11) | | 2 |
Income statement - operating expenses | | 932 | | (892) | | (180) | | (140) | | 1,041 | | (1,055) | | (191) | | (205) |
Other comprehensive income | | (18,180) | | 16,714 | | 898 | | (568) | | (20,326) | | 18,570 | | 916 | | (840) |
Contributions by employer | | 708 | | — | | — | | 708 | | 775 | | — | | — | | 775 |
Contributions by plan participants and other scheme members | | 7 | | (7) | | — | | — | | 13 | | (13) | | — | | — |
Assets/liabilities extinguished upon settlement | | — | | — | | — | | — | | (113) | | 113 | | — | | — |
Benefits paid | | (1,472) | | 1,472 | | — | | — | | (1,657) | | 1,657 | | — | | — |
At 1 January 2023 | | 34,016 | | (24,733) | | (9,283) | | — | | 37,598 | | (27,601) | | (9,777) | | 220 |
Currency translation and other adjustments | | — | | — | | — | | — | | (21) | | 21 | | 4 | | 4 |
Income statement - operating expenses | | | | | | | | | | | | | | | | |
Net interest expense | | 1,677 | | (1,208) | | (464) | | 5 | | 1,841 | | (1,341) | | (485) | | 15 |
Current service cost | | — | | (76) | | — | | (76) | | — | | (105) | | — | | (105) |
Past service cost | | — | | (2) | | — | | (2) | | — | | (8) | | — | | (8) |
Loss on curtailments and settlements | | — | | — | | — | | — | | — | | (24) | | — | | (24) |
| | 1,677 | | (1,286) | | (464) | | (73) | | 1,841 | | (1,478) | | (485) | | (122) |
Other comprehensive income | | | | | | | | | | | | | | | | |
Return on plan assets excluding recognised interest income | | (1,042) | | — | | — | | (1,042) | | (1,182) | | — | | — | | (1,182) |
Experience gains and losses | | — | | (1,531) | | — | | (1,531) | | — | | (1,599) | | — | | (1,599) |
Effect of changes in actuarial financial assumptions | | — | | (585) | | — | | (585) | | — | | (776) | | — | | (776) |
Effect of changes in actuarial demographic assumptions | | — | | 379 | | — | | 379 | | — | | 436 | | — | | 436 |
Asset ceiling adjustments | | — | | — | | 2,643 | | 2,643 | | — | | — | | 2,841 | | 2,841 |
| | (1,042) | | (1,737) | | 2,643 | | (136) | | (1,182) | | (1,939) | | 2,841 | | (280) |
Contributions by employer (3) | | 209 | | — | | — | | 209 | | 278 | | 2 | | — | | 280 |
Contributions by plan participants and other scheme members | | 7 | | (7) | | — | | — | | 12 | | (12) | | — | | — |
Assets/liabilities extinguished upon settlement | | — | | — | | — | | — | | (50) | | 50 | | — | | — |
Benefits paid | | (1,229) | | 1,229 | | — | | — | | (1,365) | | 1,365 | | — | | — |
At 31 December 2023 (4) | | 33,638 | | (26,534) | | (7,104) | | — | | 37,111 | | (29,592) | | (7,417) | | 102 |
(1) | Defined benefit obligations are subject to annual valuation by independent actuaries. |
(2) | NatWest Group recognises the net pension scheme surplus or deficit as a net asset or liability. In doing so, the funded status is adjusted to reflect any schemes with a surplus that NatWest Group may not be able to access, as well as any minimum funding requirement to pay in additional contributions. This is most relevant to the Main section, where the surplus is not recognised as the trustees may have control over the use of the surplus. Other NatWest Group schemes that this applies to include the Ulster Bank Pension Scheme (NI) and the NatWest Markets section. |
(3) | NatWest Group expects to make contributions to the Main section of £207 million in 2024. |
(4) | On 16 June 2023 the High Court issued a ruling in respect of Virgin Media v NTL Pension Trustees II Limited (and others), which has the potential to affect the defined benefit obligation (DBO) values. Reasonable due diligence has concluded that DBO values above require no adjustment for the impact of this case. |
| |
NatWest Group – Annual Report on Form 20-F 2023 | 67 |
Notes to the consolidated financial statements continued
5 Pensions continued
| | | | |
| | All schemes | ||
|
| 2023 |
| 2022 |
Amounts recognised on the balance sheet | | £m | | £m |
Fund asset at fair value |
| 37,111 |
| 37,598 |
Present value of fund liabilities |
| (29,592) |
| (27,601) |
Funded status |
| 7,519 |
| 9,997 |
Assets ceiling/minimum funding |
| (7,417) |
| (9,777) |
|
| 102 |
| 220 |
| | | | |
|
| 2023 |
| 2022 |
Net pension asset/(liability) comprises | | £m | | £m |
Net assets of schemes in surplus (refer to Note 18) |
| 201 |
| 318 |
Net liabilities of schemes in deficit (refer to Note 21) |
| (99) |
| (98) |
|
| 102 |
| 220 |
Funding and contributions by NatWest Group
In the UK, the trustees of defined benefit pension schemes are required to perform funding valuations every three years. The trustees and the sponsor, with the support of the Scheme Actuary, agree the assumptions used to value the liabilities and to determine future contribution requirements. The funding assumptions incorporate a margin for prudence over and above the expected cost of providing the benefits promised to members, taking into account the sponsor’s covenant and the investment strategy of the scheme. Similar arrangements apply in the other territories where NatWest Group sponsors defined benefit pension schemes.
A full triennial funding valuation of the Main section, effective 31 December 2020, was completed during financial year 2021.
This triennial funding valuation determined the funding level to be 104%, pension liabilities to be £49 billion and the surplus to be £2 billion, all assessed on the agreed funding basis. The average cost of the future service of current members is 49% of salary before contributions from those members. In addition, the sponsor has agreed to meet administrative expenses. Following the ring-fencing agreement with the Trustee reached in 2018, additional contributions of up to £500 million p.a. were payable to the Main section should the Group make distributions to shareholders of an equal amount.
These contributions were capped at £1.5 billion in total, of which £1.0 billion was paid over 2021 and 2022.
During 2023, NatWest Bank entered a new contractual agreement with the Trustee, such that assets to the value of the remaining contributions falling due under the previous agreement would instead be paid to a Reservoir Trust. These assets have been restricted and are reserved to ensure they are available should they be needed by the Trustee in the future, according to agreed criteria. They are included in the encumbered balance sheet in the Risk section of this report. The assets under this arrangement will be available to the Group in future, to the extent that they are not needed under the defined trigger events.
The key assumptions used to determine the funding liabilities were the discount rate, which is determined based on fixed interest swap and gilt yields plus 0.64% per annum, and mortality assumptions, which result in life expectancies of 27.7/29.4 years for males/females who are currently age 60 and 28.9/30.7 years from age 60 for males/females who are currently aged 40.
Accounting Assumptions
Placing a value on NatWest Group’s defined benefit pension schemes’ liabilities requires NatWest Group’s management to make a number of assumptions, with the support of independent actuaries. The ultimate cost of the defined benefit obligations depends upon actual future events and the assumptions made are unlikely to be exactly borne out in practice, meaning the final cost may be higher or lower than expected.
| |
NatWest Group – Annual Report on Form 20-F 2023 | 68 |
Notes to the consolidated financial statements continued
5 Pensions continued
The most significant assumptions used for the Main section are shown below:
| | | | | |
| | Principal IAS 19 actuarial assumptions (1) | | ||
|
| 2023 |
| 2022 |
|
| | % | | % | |
Discount rate |
| 4.8 |
| 5.0 |
|
Inflation assumption (RPI) |
| 3.1 |
| 3.2 |
|
Rate of increase in salaries |
| 1.8 |
| 1.8 |
|
Rate of increase in deferred pensions |
| 3.2 |
| 3.2 |
|
Rate of increase in pensions in payment |
| 2.4 |
| 2.5 |
|
Lump sum conversion rate at retirement |
| 18 |
| 18 |
|
Longevity at age 60: |
| years |
| years |
|
Current pensioners | | | | | |
Males |
| 26.8 |
| 27.3 |
|
Females |
| 28.6 |
| 29.1 |
|
Future pensioners, currently aged 40 |
| |
| |
|
Males |
| 27.7 |
| 28.3 |
|
Females |
| 29.5 |
| 30.1 |
|
(1) | The above financial assumptions are long-term assumptions set with reference to the period over which the obligations are expected to be settled. |
Discount rate
The IAS 19 valuation uses a single discount rate set by reference to the yield on a basket of ‘high quality’ sterling corporate bonds.
Significant judgement is required when setting the criteria for bonds to be included in the basket of bonds that is used to determine the discount rate used in the IAS 19 valuations. The criteria include issue size, quality of pricing and the exclusion of outliers. Judgement is also required in determining the shape of the yield curve at long durations; a constant credit spread relative to gilts is assumed. Sensitivity to the main assumptions is presented below.
| |
NatWest Group – Annual Report on Form 20-F 2023 | 69 |
Notes to the consolidated financial statements continued
5 Pensions continued
The weighted average duration of the Main section's defined benefit obligation at 31 December 2023 is 14.0 years (2022 – 15.3 years). The chart below shows the projected benefit payment pattern for the Main section in nominal terms. These cashflows are based on the most recent formal actuarial valuation, effective 31 December 2020.
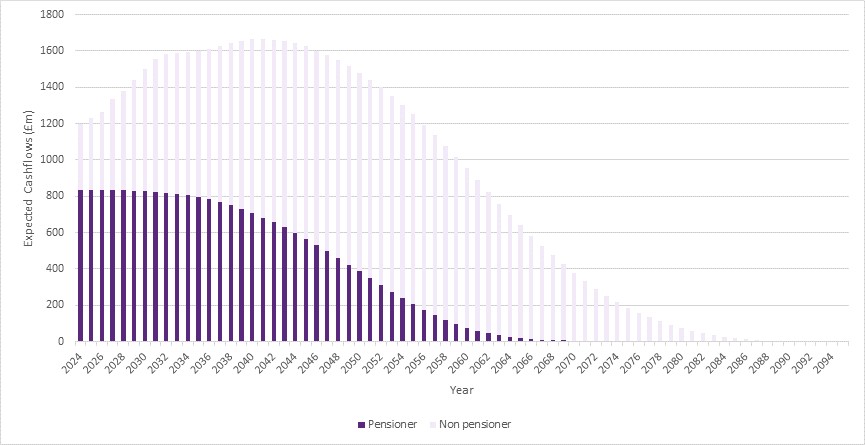
| |
NatWest Group – Annual Report on Form 20-F 2023 | 70 |
Notes to the consolidated financial statements continued
5 Pensions continued
The table below shows how the net pension asset of the Main section would change if the key assumptions used were changed independently. In practice the variables have a degree of correlation and do not move completely in isolation.
| | | | | | |
| | (Decrease)/ | | (Decrease)/ | | Increase in |
| | increase in | | increase in | | net pension |
| | value of | | value of | | (obligations)/ |
|
| assets |
| liabilities |
| assets |
2023 | | £m | | £m | | £m |
0.5% increase in interest rates/discount rate | | (2,292) | | (1,746) | | (546) |
0.25% increase in inflation | | 811 | | 578 | | 233 |
0.5% increase in credit spreads | | (12) | | (1,746) | | 1,734 |
Longevity increase of one year | | — | | 902 | | (902) |
0.25% additional rate of increase in pensions in payment | | — | | 706 | | (706) |
Increase in equity values of 10% (1) | | 229 | | — | | 229 |
| | | | | | |
2022 | | | | | | |
0.5% increase in interest rates/discount rate |
| (2,689) | | (1,766) | | (923) |
0.25% increase in inflation |
| 963 | | 632 | | 331 |
0.5% increase in credit spreads |
| (6) | | (1,766) | | 1,760 |
Longevity increase of one year | | — | | 767 | | (767) |
0.25% additional rate of increase in pensions in payment | | — | | 679 | | (679) |
Increase in equity values of 10% (1) |
| 267 | | — | | 267 |
| (1) | Includes both quoted and private equity. |
The table below shows the combined change in defined benefit obligation from larger movements in these assumptions, assuming no changes in other assumptions.
| | | | | | | | | | | | |
| | |
| Change in life expectancies | ||||||||
| | |
| -2 years |
| -1 year |
| No change |
| + 1 year |
| + 2 years |
2023 |
|
|
| £bn |
| £bn |
| £bn |
| £bn |
| £bn |
Change in credit spreads |
| +50 bps |
| (3.5) |
| (2.6) |
| (1.7) |
| (0.9) |
| (0.1) |
|
| No change |
| (1.9) |
| (0.9) |
| — |
| 0.9 |
| 1.8 |
|
| -50 bps |
| — |
| 1.0 |
| 2.0 |
| 2.9 |
| 3.9 |
| | | | | | | | | | | | |
2022 | | |
| |
| |
| |
| |
| |
Change in credit spreads |
| +50 bps |
| (3.7) |
| (2.8) |
| (1.8) |
| (0.8) |
| 0.2 |
|
| No change |
| (2.1) |
| (1.1) |
| — |
| 1.1 |
| 2.1 |
|
| -50 bps |
| (0.3) |
| 0.9 |
| 2.0 |
| 3.2 |
| 4.3 |
| |
NatWest Group – Annual Report on Form 20-F 2023 | 71 |
Notes to the consolidated financial statements continued
5 Pensions continued
The defined benefit obligation of the Main section is attributable to the different classes of scheme members in the following proportions:
| | | | |
|
| 2023 |
| 2022 |
Membership category | | % | | % |
Active members |
| 7.5 |
| 8.4 |
Deferred members |
| 41.9 |
| 41.0 |
Pensioners and dependants |
| 50.6 |
| 50.6 |
|
| 100.0 |
| 100.0 |
The experience history of NatWest Group schemes is shown below:
| | | | | | | | | | | | | | | | | | | | | |
| | Main section | | All schemes |
| ||||||||||||||||
|
| 2023 |
| 2022 |
| 2021 |
| 2020 |
| 2019 |
| 2023 |
| 2022 |
| 2021 |
| 2020 |
| 2019 |
|
History of defined benefit schemes | | £m |
| £m |
| £m |
| £m |
| £m |
| £m |
| £m |
| £m |
| £m |
| £m |
|
Fair value of plan assets | | 33,638 |
| 34,016 |
| 52,021 |
| 51,323 |
| 46,555 |
| 37,111 |
| 37,598 |
| 57,787 |
| 57,249 |
| 51,925 |
|
Present value of plan obligations | | (26,534) |
| (24,733) |
| (42,020) |
| (43,870) |
| (39,669) |
| (29,592) |
| (27,601) |
| (46,808) |
| (48,864) |
| (44,115) |
|
Net surplus | | 7,104 |
| 9,283 |
| 10,001 |
| 7,453 |
| 6,886 |
| 7,519 |
| 9,997 |
| 10,979 |
| 8,385 |
| 7,810 |
|
| | | | | | | | | | | | | | | | | | | | | |
Experience (losses)/gains on plan liabilities | | (1,531) |
| (2,053) |
| 241 |
| 427 |
| 275 |
| (1,599) |
| (2,137) |
| 237 |
| 455 |
| 279 |
|
Experience (losses)/gains on plan assets | | (1,042) |
| (18,180) |
| 841 |
| 5,486 |
| 3,021 |
| (1,182) |
| (20,326) |
| 872 |
| 6,027 |
| 3,556 |
|
Actual return on plan assets | | 634 |
| (17,248) |
| 1,554 |
| 6,422 |
| 4,266 |
| 659 |
| (19,285) |
| 1,667 |
| 7,064 |
| 4,930 |
|
Actual return on plan assets | | 1.9 | % | (33.2) | % | 3.0 | % | 13.8 | % | 9.7 | % | 1.8 | % | (33.4) | % | 2.9 | % | 13.6 | % | 10.1 | % |
6 Auditor’s remuneration
Amounts payable to NatWest Group's auditors for statutory audit and other services are set out below. |
All audit-related and other services are approved by the Group Audit Committee and are subject to strict controls to ensure the external auditor’s independence is unaffected by the provision of other services. The Group Audit Committee recognises that for certain assignments, the auditors are best placed to perform the work economically; for other work, NatWest Group selects the supplier best placed to meet its requirements. NatWest Group’s auditors are permitted to tender for such work in competition with other firms where the work is permissible under audit independence rules.
| | | | | | |
|
| 2023 |
| 2022 |
| 2021 |
| | £m | | £m |
| £m |
Fees payable for : | | | | | | |
- the audit of NatWest Group’s annual accounts (1) |
| 4.9 |
| 4.7 |
| 4.4 |
- the audit of NatWest Group plc’s subsidiaries (1) |
| 32.3 |
| 31.9 |
| 29.6 |
- audit-related assurance services (1,2) |
| 4.5 |
| 3.9 |
| 5.3 |
Total audit and audit-related assurance services fees |
| 41.7 |
| 40.5 |
| 39.3 |
| | | | | | |
Other assurance services |
| 0.7 |
| 1.2 |
| 0.4 |
Corporate finance services (3) |
| 0.7 |
| 0.5 |
| 0.5 |
Total other services |
| 1.4 |
| 1.7 |
| 0.9 |
(1) | The 2023 audit fee was approved by the Group Audit Committee. At 31 December 2023, £16 million has been billed and paid in respect of the 2023 NatWest Group audit fees. |
(2) | Comprises fees of £1.4 million (2022 - £1.1 million) for reviews of interim financial information, £2.8 million (2022 - £2.3 million) for reports to NatWest Group’s regulators in the UK and overseas, and £0.3 million (2022 - £0.4 million) for non-statutory audit opinions. |
(3) | Comprises fees of £0.7 million (2022 - £0.5 million) for work performed by the auditors as reporting accountants on debt and equity issuances undertaken by NatWest Group. |
| |
NatWest Group – Annual Report on Form 20-F 2023 | 72 |
Notes to the consolidated financial statements continued
7 Tax
NatWest Group’s corporate income tax charge for the period is set out below, together with a reconciliation to the expected tax charge calculated using the UK standard corporation tax rate and details of the NatWest Group’s deferred tax balances.
For accounting policy information refer to Accounting policies 2.1 and 3.7.
Analysis of the tax charge for the year
The tax charge comprises current and deferred tax in respect of profits and losses recognised or originating in the income statement. Tax on items originating outside the income statement is charged to other comprehensive income or direct to equity (as appropriate) and is therefore not reflected in the table below. Current tax is tax payable or recoverable in respect of the taxable profit or loss for the year and any adjustments to tax payable in prior years. Deferred tax is explained on page 75. |
| | | | | | |
| | 2023 | | 2022 | | 2021 |
Continuing operations |
| £m |
| £m |
| £m |
Current tax |
| | |
|
|
|
Charge for the year |
| (1,373) | | (1,611) | | (1,036) |
(Under)/over provision in respect of prior years |
| (123) | | 100 | | 31 |
|
| (1,496) | | (1,511) | | (1,005) |
Deferred tax |
| | | | | |
(Charge)/credit for the year |
| (281) | | 47 | | (185) |
UK tax rate change impact |
| — | | (10) | | 165 |
Net increase in the carrying value of deferred tax assets in respect of UK, RoI and Netherlands losses | | 385 | | 267 | | 12 |
(Under)/over provision in respect of prior years |
| (42) | | (68) | | 17 |
Tax charge for the year |
| (1,434) | | (1,275) | | (996) |
| |
NatWest Group – Annual Report on Form 20-F 2023 | 73 |
Notes to the consolidated financial statements continued
7 Tax continued
Factors affecting the tax charge for the year
Taxable profits differ from profits reported in the income statement as certain amounts of income and expense may not be taxable or deductible. In addition, taxable profits may reflect items that have been included outside the income statement (for instance, in other comprehensive income) or adjustments that are made for tax purposes only.
Current tax for the year ended 31 December 2023 is based on blended rates of 23.5% for the standard rate of UK corporation tax and 4.25% for the UK banking surcharge.
The expected tax charge for the year is calculated by applying the standard UK corporation tax rate of 23.5% (2022 and 2021 – 19%) to the Operating profit or loss before tax in the income statement.
The actual tax charge differs from the expected tax charge as follows:
| | | | | | |
|
| 2023 |
| 2022 |
| 2021 |
Continuing operations | | £m | | £m | | £m |
Expected tax charge |
| (1,452) | | (975) | | (766) |
Losses and temporary differences in year where no deferred tax asset recognised |
| (56) | | (118) | | (51) |
Foreign profits taxed at other rates |
| 10 | | (62) | | (11) |
Non deductible goodwill impairment |
| — | | — | | (16) |
Items not allowed for tax: | | | | | | |
- losses on disposals and write-downs |
| (63) | | (10) | | (55) |
- UK bank levy |
| (27) | | (20) | | (18) |
- regulatory and legal actions |
| (1) | | (7) | | (74) |
- other disallowable items |
| (57) | | (51) | | (28) |
Non-taxable items: |
| | | | | |
- Foreign exchange recycling on UBIDAC capital reduction | | 114 | | — | | — |
- RPI-related uplift on index linked gilts | | 6 | | 67 | | — |
- other non-taxable items | | 20 | | 29 | | 73 |
Taxable foreign exchange movements |
| 9 | | (19) | | 8 |
Unrecognised losses brought forward and utilised |
| 27 | | 6 | | 10 |
Net increase/(decrease) in the carrying value of deferred tax assets in respect of: |
| | | | | |
- UK losses (2) | | 371 | | 272 | | (9) |
- RoI losses | | (1) | | (5) | | (27) |
- Netherlands losses | | 15 | | — | | 48 |
Banking surcharge |
| (236) | | (447) | | (341) |
Tax on paid-in equity dividends | | 52 | | 43 | | 48 |
UK tax rate change impact |
| — | | (10) | | 165 |
Adjustments in respect of prior years (1, 2) | | (165) | | 32 | | 48 |
Actual tax charge |
| (1,434) | | (1,275) | | (996) |
(1)Prior year tax adjustments incorporate refinements to tax computations made on submission and agreement with the tax authorities and adjustments to provisions in respect of uncertain tax positions.
(2)Includes a net £69 million benefit from UK group relief and loss relief claims at higher tax rates (refer to the Deferred Tax section below for details of the recent changes in UK tax rates).
On 11 July 2023, the UK government enacted the Pillar 2 income taxes legislation effective for the financial year beginning 1 January 2024. Under the legislation, NatWest Group plc will be required to pay, in the UK, top-up tax on profits of its subsidiaries and permanent establishments that are taxed at a Pillar 2 effective tax rate of less than 15%. The assessment of the potential exposure to Pillar 2 income taxes is based on the most recent tax filings, country-by-country reporting, and financial statements for the constituent entities in the NatWest Group. The main jurisdictions in which exposure to this top-up tax may exist include Jersey, Guernsey, Isle of Man and Gibraltar. This legislation is expected to have no material impact for NatWest Group plc.
In future periods, part of this top-up tax may be payable instead in the relevant jurisdiction, if that jurisdiction implements a Qualifying Domestic Minimum Top Up Tax (QDMTT). This is expected in most jurisdictions in which we operate.
| |
NatWest Group – Annual Report on Form 20-F 2023 | 74 |
Notes to the consolidated financial statements continued
7 Tax continued
Judgement: tax contingencies
NatWest Group’s corporate income tax charge and its provisions for corporate income taxes necessarily involve a degree of estimation and judgement. The tax treatment of some transactions is uncertain and tax computations are yet to be agreed with the relevant tax authorities. NatWest Group recognises anticipated tax liabilities based on all available evidence and, where appropriate, in the light of external advice. Any difference between the final outcome and the amounts provided will affect current and deferred income tax charges in the period when the matter is resolved.
Deferred tax
Deferred tax is the tax expected to be payable or recoverable in respect of temporary differences where the carrying amount of an asset or liability differs for accounting and tax purposes. Deferred tax liabilities reflect the expected amount of tax payable in the future on these temporary differences. Deferred tax assets reflect the expected amount of tax recoverable in the future on these differences. The net deferred tax asset recognised by the NatWest Group is shown below, together with details of the accounting judgements and tax rates that have been used to calculate the deferred tax. Details are also provided of any deferred tax assets or liabilities that have not been recognised on the balance sheet. |
Analysis of deferred tax
| | | | |
|
| 2023 |
| 2022 |
|
| £m |
| £m |
Deferred tax asset |
| (1,894) |
| (2,178) |
Deferred tax liability |
| 141 |
| 227 |
Net deferred tax asset |
| (1,753) |
| (1,951) |
| | | | | | | | | | | | | | |
| | | | Accelerated | | | | | | Tax losses | | | | |
| | | | capital | | Expense | | Financial | | carried | | | | |
| | Pension | | allowances | | provisions | | instruments (1) | | forward | | Other | | Total |
|
| £m |
| £m |
| £m |
| £m |
| £m |
| £m |
| £m |
At 1 January 2022 |
| 24 |
| (42) |
| (97) |
| 248 |
| (899) |
| (70) |
| (836) |
Charge/(credit) to income statement: |
| | | | | | | | | | | | | |
- continuing operations | | 1 | | (43) | | 14 | | (171) | | (51) | | 14 | | (236) |
- discontinued operations | | — | | — | | — | | — | | — | | — | | — |
(Credit)/charge to other comprehensive income |
| (2) | | — | | 1 | | (913) | | — | | (2) | | (916) |
Currency translation and other adjustments |
| — |
| 10 |
| — |
| 31 |
| (2) |
| (2) |
| 37 |
At 1 January 2023 |
| 23 |
| (75) |
| (82) |
| (805) |
| (952) |
| (60) |
| (1,951) |
Charge/(credit) to income statement: |
| |
| |
| |
| |
| |
| |
| |
- continuing operations | | 1 | | (1) | | 21 | | 16 | | (67) | | (32) | | (62) |
- discontinued operations | | — | | — | | — | | — | | — | | — | | — |
(Credit)/charge to other comprehensive income |
| (8) |
| — |
| — |
| 249 |
| — |
| 17 |
| 258 |
Currency translation and other adjustments |
| — |
| — |
| — |
| 2 |
| — |
| — |
| 2 |
At 31 December 2023 |
| 16 |
| (76) |
| (61) |
| (538) |
| (1,019) |
| (75) |
| (1,753) |
(1) | The in-year movement predominantly relates to cash flow hedges. |
| |
NatWest Group – Annual Report on Form 20-F 2023 | 75 |
Notes to the consolidated financial statements continued
7 Tax continued
Deferred tax assets in respect of carried forward tax losses are recognised if the losses can be used to offset probable future taxable profits after taking into account the expected reversal of other temporary differences. Recognised deferred tax assets in respect of tax losses are analysed further below.
| | | | |
|
| 2023 |
| 2022 |
| | £m | | £m |
UK tax losses carried forward | | | | |
- NWM Plc |
| — |
| 3 |
- NWB Plc |
| 362 |
| 445 |
- RBS plc |
| 597 |
| 452 |
Total |
| 959 |
| 900 |
Overseas tax losses carried forward | | | | |
- UBIDAC | | 5 | | 6 |
- NWM N.V. |
| 55 |
| 46 |
|
| 1,019 |
| 952 |
Critical accounting policy: Deferred tax
NatWest Group has recognised a deferred tax asset of £1,894 million (2022 - £2,178 million) and a deferred tax liability of £141 million (2022 - £227 million). These include amounts recognised in respect of UK and overseas tax losses of £1,019 million (2022 - £952 million).
The main UK corporation tax increased from 19% to 25%, and the UK banking surcharge decreased from 8% to 3%, from 1 April 2023. NatWest Group’s closing deferred tax assets and liabilities are therefore recognised based on these rates.
Judgement – NatWest Group has considered the carrying value of deferred tax assets and concluded that, based on management’s estimates, sufficient sustainable taxable profits will be generated in future years to recover recognised deferred tax assets.
Estimates – These estimates are partly based on forecast performance beyond the horizon for management’s detailed plans. They have regard to inherent uncertainties. The deferred tax assets in NWM Plc and UBIDAC are supported by future reversing taxable temporary differences on which deferred tax liabilities are recognised at 31 December 2023.
UK tax losses
Under UK tax rules, tax losses can be carried forward indefinitely. As the recognised tax losses in NatWest Group arose prior to 1 April 2015, credit in future periods is given against 25% of profits at the main rate of UK corporation tax, excluding the Banking Surcharge rate introduced by The Finance (No. 2) Act 2015.
NWM Plc - A deferred tax asset of nil (2022 - £3 million) has been recognised at 31 December 2023. The basis of recognition in NWM plc is by way of future reversing taxable temporary differences on which deferred tax liabilities are recognised at 31 December 2023. Losses of £5,558 million have not been recognised in the deferred tax balance at 31 December 2023.
NWB Plc – A deferred tax asset of £362 million (2022 - £445 million) has been recognised in respect of losses of £1,448 million of total losses of £2,308 million carried forward at 31 December 2023. The losses arose principally as a result of significant impairment and conduct charges between 2009 and 2012 during challenging economic conditions in the UK banking sector. NWB Plc returned to tax profitability during 2015, and based on a 5 year recovery period, expects the deferred tax asset to be utilised against future taxable profits by the end of 2028.
RBS plc – A deferred tax asset of £597 million (2022 - £452 million) has been recognised in respect of losses of £2,388 million of total losses of £3,297 million carried forward at 31 December 2023. The losses were transferred from NatWest Markets Plc as a consequence of the ring fencing regulations. Based on a 7 year recovery period, RBS plc expects the deferred tax asset to be utilised against future taxable profits by the end of 2030.
Overseas tax losses
UBIDAC – A deferred tax asset of £5 million (2022 - £6 million) has been recognised in respect of losses of £40 million, and is now entirely supported by way of future reversing taxable temporary differences on which deferred tax liabilities are recognised at 31 December 2023.
| |
NatWest Group – Annual Report on Form 20-F 2023 | 76 |
Notes to the consolidated financial statements continued
7 Tax continued
NatWest Markets N.V. (NWM N.V.) - A deferred tax asset of £55 million (2022 - £46 million) has been recognised in respect of losses of £213 million of total losses of £2,496 million carried forward at 31 December 2023. NWM N.V. Group considers it to be probable, based on its 5-year budget forecast, that future taxable profits will be available against which the tax losses and tax credits can be partially utilised. The tax losses and the tax credits have no expiry date.
Unrecognised deferred tax
Deferred tax assets of £5,168 million (2022 - £5,534 million; 2021 - £5,437 million) have not been recognised in respect of tax losses and other deductible temporary differences carried forward of £24,438 million (2022 - £25,742 million; 2021 - £24,699 million) in jurisdictions where doubt exists over the availability of future taxable profits. Of these losses and other deductible temporary differences, £34 million expire within five years and £4,488 million thereafter. The balance of tax losses and other deductible temporary differences carried forward has no expiry date.
Deferred tax liabilities of £256 million (2022 - £257 million; 2021 - £302 million) on aggregate underlying temporary differences of £1,005 million (2022 - £1,010 million; 2021 - £1,032 million) have not been recognised in respect of retained earnings of overseas subsidiaries and held-over gains on the incorporation of certain overseas branches. Retained earnings of overseas subsidiaries are expected to be reinvested indefinitely or remitted to the UK free from further taxation. No taxation is expected to arise in the foreseeable future in respect of held-over gains on which deferred tax is not recognised. Changes to UK tax legislation largely exempts from UK tax overseas dividends received on or after 1 July 2009.
| |
NatWest Group – Annual Report on Form 20-F 2023 | 77 |
Notes to the consolidated financial statements continued
8 Discontinued operations and assets and liabilities of disposal groups
Discontinued operations are reported separately on the income statement to allow users to distinguish the profits and cash flows from continuing operations from those activities that are subject to disposal. Assets and liabilities which we intend to dispose of in a single transaction are also presented separately on the balance sheet. For accounting policy information refer to Accounting policy 3.2. This note sets out the profit/(loss) from the discontinued operations, the assets and liabilities of the disposal group and the operating cash flows attributable to the discontinued operations. |
Four legally binding agreements for the sale of the UBIDAC business have been announced as part of the phased withdrawal from the Republic of Ireland. Material developments since the beginning of 2023 are set out below.
Agreement with Allied Irish Banks p.l.c. (AIB) for the transfer of performing commercial loans.
UBIDAC completed the sale of commercial loans to AIB, with a cumulative €3.1 billion of gross performing loans being fully migrated. The transfer of the final cohort of colleagues to AIB who were wholly or mainly assigned to supporting this part of the business under Transfer of Undertakings, Protection of Employment (TUPE) arrangements has also completed.
Agreement with Permanent TSB Group Holdings p.l.c. (PTSB).
Agreement for the sale of performing non-tracker mortgages, the performing loans in the micro-SME business, the UBIDAC Asset Finance business, including its Lombard digital platform, and 25 Ulster Bank branch locations in the Republic of Ireland. The remaining performing non-tracker mortgages, all micro-SME loans and the Lombard Asset Finance business migrated to PTSB during the year, totalling c. €6.3 billion of gross loan balances. All remaining colleagues eligible under TUPE regulations also migrated to PTSB, as well as 25 former Ulster Bank branches.
Agreement with AIB for the sale of performing tracker and linked mortgages.
UBIDAC completed the migration of €4.0 billion of performing tracker and linked mortgages to AIB. The remaining migrations are expected to complete in 2024.
Agreement with Elmscott Property Finance DAC / AB CarVal (CarVal) Agreement for the sale of a portfolio which consists mostly of non-performing mortgages, unsecured personal loans, and commercial facilities with a gross value of c. €690 million. Pepper Finance Corporation (Ireland) DAC will become the legal owner and servicer of the facilities. In November 2023, c.€400 million of exposures transferred to Pepper Finance Corporation (Ireland) DAC, with the remainder of the portfolio expected to transfer in 2024.
The business activities relating to these sales that meet the requirements of IFRS 5 are presented as a discontinued operation and as a disposal group. Ulster Bank RoI continuing operations are reported within Central items & other.
(a) (Loss)/profit from discontinued operations, net of tax
| | | | | | |
|
| 2023 |
| 2022 |
| 2021 |
| | £m | | £m | | £m |
Interest receivable | | 22 | | 177 | | 339 |
Net interest income | | 22 | | 177 | | 339 |
Non-interest income (1) | | (16) | | (472) | | 13 |
Total income | | 6 | | (295) | | 352 |
Operating expenses | | (124) | | (38) | | (47) |
(Loss)/profit before impairment releases | | (118) | | (333) | | 305 |
Impairment releases | | 6 | | 71 | | 162 |
Operating (loss)/profit before tax | | (112) | | (262) | | 467 |
Tax charge | | — | | — | | (3) |
(Loss)/profit from discontinued operations, net of tax | | (112) | | (262) | | 464 |
| (1) | Excludes gain of £20 million (€24 million) recognised by NatWest Group as a result of acquisition of PTSB shares in relation to disposal of UBIDAC assets to PTSB in 2022. |
| |
NatWest Group – Annual Report on Form 20-F 2023 | 78 |
Notes to the consolidated financial statements continued
8 Discontinued operations and assets and liabilities of disposal groups continued
(b) Assets and liabilities of disposal groups
| | | | |
|
| 2023 |
| 2022 |
| | £m | | £m |
Assets of disposal groups |
| |
|
|
Loans to customers - amortised cost |
| 32 |
| 1,458 |
Other financial assets - loans to customers | | 841 | | 5,397 |
Other assets |
| 29 |
| 6 |
| | 902 | | 6,861 |
Liabilities of disposal groups |
| |
| |
Other liabilities |
| 3 |
| 15 |
|
| 3 |
| 15 |
| | | | |
Net assets of disposal groups |
| 899 |
| 6,846 |
(c) Operating cash flows attributable to discontinued operations
| | | | | | |
|
| 2023 |
| 2022 |
| 2021 |
|
| £m |
| £m |
| £m |
Net cash flows from operating activities |
| 362 |
| 1,090 |
| 2,212 |
Net cash flows from investing activities |
| 5,473 |
| 6,164 |
| — |
Net increase in cash and cash equivalents |
| 5,835 |
| 7,254 |
| 2,212 |
| |
NatWest Group – Annual Report on Form 20-F 2023 | 79 |
Notes to the consolidated financial statements continued
9 Earnings per share
Earnings per share measures how much profit NatWest Group makes for each share in issue during the year. Basic earnings per ordinary share is calculated by dividing the profit attributable to ordinary shareholders by the weighted average number of ordinary shares outstanding. Diluted earnings per ordinary share is calculated by dividing the basic earnings by the weighted average number of ordinary shares outstanding plus the weighted average number of ordinary shares that would be issued on conversion of dilutive share options and convertible securities. The assessment of whether the effect of share options and convertible securities is dilutive or not, is based on the earnings from continuing operations. |
| | | | | | |
|
| 2023 |
| 2022 |
| 2021 |
| | £m | | £m | | £m |
Earnings |
|
|
|
|
|
|
Profit from continuing operations attributable to ordinary shareholders |
| 4,506 |
| 3,602 |
| 2,486 |
(Loss)/profit from discontinued operations attributable to ordinary shareholders |
| (112) |
| (262) |
| 464 |
Profit attributable to ordinary shareholders |
| 4,394 |
| 3,340 |
| 2,950 |
|
| |
|
|
|
|
Weighted average number of shares (millions) |
| |
|
|
|
|
Weighted average number of ordinary shares outstanding during the year |
| 9,164 |
| 9,872 |
| 10,792 |
Effect of dilutive share options and convertible securities (1) |
| 55 |
| 57 |
| 45 |
Diluted weighted average number of ordinary shares outstanding during the year |
| 9,219 |
| 9,929 |
| 10,837 |
| | | | | | |
Earnings per ordinary share - continuing operations | | 49.2p | | 36.5p | | 23.0p |
Earnings per ordinary share - discontinued operations | | (1.2p) | | (2.7p) | | 4.3p |
Total earnings per share attributable to ordinary shareholders - basic (2) |
| 47.9p |
| 33.8p |
| 27.3p |
Earnings per ordinary share - fully diluted continuing operations |
| 48.9p |
| 36.2p |
| 22.9p |
Earnings per ordinary share - fully diluted discontinued operations |
| (1.2p) |
| (2.6p) |
| 4.3p |
Total earnings per share attributable to ordinary shareholders - fully diluted |
| 47.7p |
| 33.6p |
| 27.2p |
(1) | At the General Meeting and Class Meeting on 25 August 2022, the shareholders approved the proposed special dividend and share consolidation. On 30 August 2022 the issued ordinary share capital was consolidated in the ratio of 14 existing shares for 13 new shares. The average number of shares and earnings per share have been adjusted retrospectively. |
(2) | In 2023, the unrounded Total earnings per share attributable to ordinary shareholders – basic is 47.948p. The unrounded Earnings per ordinary share – continuing operations was 49.170p. The unrounded Earnings per ordinary share – discontinued operations was (1.222p). |
10 Financial instruments – classification
Financial instruments are contracts that give rise to a financial asset of one entity and a corresponding financial liability or equity instrument of a counterparty entity, such as cash, derivatives, loans, deposits and settlement balances. This note presents financial instruments classified in accordance with IFRS 9 – Financial Instruments. |
Judgement: classification of financial assets
Classification of financial assets between amortised cost and fair value through other comprehensive income requires a degree of judgement in respect of business models and contractual cashflows.
| - | The business model criteria is assessed at a portfolio level to determine whether assets are classified as held to collect or held to collect and sell. Information that is considered in determining the applicable business model includes: the portfolio’s policies and objectives; how the performance and risks of the portfolio are managed, evaluated and reported to management; and the frequency, volume and timing of sales in prior periods, sales expectation for future periods, and the reasons for sales. |
| - | The contractual cash flow characteristics of financial assets are assessed with reference to whether the cash flows represent solely payments of principal and interest (SPPI). A level of judgement is made in assessing terms that could change the contractual cash flows so that it would not meet the condition for SPPI, including contingent and leverage features, non-recourse arrangements and features that could modify the time value of money. |
For accounting policy information refer to Accounting policies 3.8, 3.9 and 3.11.
| |
NatWest Group – Annual Report on Form 20-F 2023 | 80 |
Notes to the consolidated financial statements continued
10 Financial instruments – classification continued
The following tables analyse financial assets and liabilities in accordance with the categories of financial instruments in IFRS 9.
| | | | | | | | | | | | |
| | | | | | | | Amortised | | Other |
| |
| | MFVTPL | | DFV | | FVOCI | | cost | | assets |
| Total |
Assets |
| £m |
| £m |
| £m |
| £m |
| £m |
| £m |
Cash and balances at central banks |
| — |
| — | | — |
| 104,262 |
| — | | 104,262 |
Trading assets | | 45,551 | | — | | — | | — | | — | | 45,551 |
Derivatives (1) | | 78,904 | | — | | — | | — | | — | | 78,904 |
Settlement balances |
| — | | — | | — | | 7,231 | | — | | 7,231 |
Loans to bank - amortised cost (2) |
| — |
| — | | — |
| 6,914 |
| — | | 6,914 |
Loans to customers - amortised cost (3) |
| — |
| — | | — |
| 381,433 |
| — | | 381,433 |
Other financial assets |
| 703 | | 5 | | 28,699 |
| 21,695 |
| — | | 51,102 |
Intangible assets | | — | | — | | — | | — | | 7,614 | | 7,614 |
Other assets |
| — | | — | | — | | — |
| 8,760 | | 8,760 |
Assets of disposal groups (4) | | — | | — | | — | | — | | 902 | | 902 |
31 December 2023 |
| 125,158 |
| 5 | | 28,699 |
| 521,535 |
| 17,276 |
| 692,673 |
| | | | | | | | | | | | |
Cash and balances at central banks |
| — | | — | | — | | 144,832 |
| — | | 144,832 |
Trading assets | | 45,577 |
| — | | — | | — |
| — | | 45,577 |
Derivatives (1) | | 99,545 |
| — | | — | | — |
| — | | 99,545 |
Settlement balances | | — |
| — | | — | | 2,572 |
| — | | 2,572 |
Loans to bank - amortised cost (2) | | — |
| — | | — | | 7,139 |
| — | | 7,139 |
Loans to customers - amortised cost (3) |
| — |
| — | | — | | 366,340 |
| — | | 366,340 |
Other financial assets |
| 787 |
| — | | 16,973 | | 13,135 |
| — | | 30,895 |
Intangible assets | | — | | — | | — | | — | | 7,116 | | 7,116 |
Other assets | | — | | — | | — | | — |
| 9,176 | | 9,176 |
Assets of disposal groups (4) | | — | | — | | — | | — | | 6,861 | | 6,861 |
31 December 2022 |
| 145,909 |
| — | | 16,973 | | 534,018 |
| 23,153 | | 720,053 |
| |
NatWest Group – Annual Report on Form 20-F 2023 | 81 |
Notes to the consolidated financial statements continued
10 Financial instruments – classification continued
| | | | | | | | | | |
| | Held-for- | | | | Amortised | | Other | | |
|
| trading |
| DFV |
| cost |
| liabilities |
| Total |
Liabilities |
| £m | | £m | | £m | | £m | | £m |
Bank deposits (5) |
| — |
| — | | 22,190 |
| — |
| 22,190 |
Customer deposits |
| — |
| — | | 431,377 |
| — |
| 431,377 |
Settlement balances |
| — |
| — | | 6,645 |
| — |
| 6,645 |
Trading liabilities | | 53,636 | | — | | — | | — | | 53,636 |
Derivatives (1) |
| 72,395 |
| — | | — |
| — |
| 72,395 |
Other financial liabilities (6) |
| — |
| 2,888 | | 52,201 |
| — |
| 55,089 |
Subordinated liabilities |
| — |
| 237 | | 5,477 |
| — |
| 5,714 |
Notes in circulation | | — | | — | | 3,237 | | — | | 3,237 |
Other liabilities (7) |
| — |
| — | | 748 |
| 4,454 |
| 5,202 |
31 December 2023 |
| 126,031 |
| 3,125 | | 521,875 |
| 4,454 |
| 655,485 |
| | | | | | | | | | |
Bank deposits (5) |
| — |
| — | | 20,441 |
| — |
| 20,441 |
Customer deposits |
| — |
| — | | 450,318 |
| — |
| 450,318 |
Settlement balances |
| — |
| — | | 2,012 |
| — |
| 2,012 |
Trading liabilities |
| 52,808 |
| — | | — |
| — |
| 52,808 |
Derivatives (1) |
| 94,047 |
| — | | — |
| — |
| 94,047 |
Other financial liabilities (6) |
| — |
| 2,377 | | 46,730 |
| — |
| 49,107 |
Subordinated liabilities |
| — |
| 345 | | 5,915 |
| — |
| 6,260 |
Notes in circulation | | — | | — | | 3,218 | | — | | 3,218 |
Other liabilities (7) |
| — |
| — | | 1,205 |
| 4,141 |
| 5,346 |
31 December 2022 |
| 146,855 |
| 2,722 | | 529,839 |
| 4,141 |
| 683,557 |
(1) | Includes net hedging derivatives assets of £114 million (2022 - £143 million) and net hedging derivatives liabilities of £270 million (2022 - £132 million). |
(2) | Includes items in the course of collection from other banks of £255 million (2022 - £229 million). |
(3) | Includes finance lease receivables of £8,731 million (2022 - £8,402 million). |
(4) | Includes assets of disposal groups held at FVTPL of £841 million (2022 - £5,397 million). The portfolio is classified as level 3 in the fair value hierarchy. |
(5) | Includes items in the course of transmission to other banks of £92 million (2022 - £242 million). |
(6) | The carrying amount of customer deposits designated at fair value through profit or loss is the same as the principal amount for both periods. No amounts have been recognised in the profit or loss for changes in credit risk associated with these liabilities as the changes are immaterial both during the period and cumulatively. |
(7) | Includes lease liabilities of £670 million (2022 - £1,118 million), held at amortised cost. |
Reclassification of mortgages from amortised cost to fair value through profit or loss
In June 2022 UBIDAC announced the cessation of new mortgage business to its customers. On 1 July 2022 UBIDAC mortgages in both its continuing and discontinued businesses were reclassified from amortised cost to fair value through profit or loss, reflecting the change in business model. We fair value these assets using a discounted cash flow method. Key inputs include assumptions about cash flows from legally binding sales agreements for those mortgage assets that form part of the assets of disposal groups. For details on material developments in assets and liabilities of disposals groups during the year, refer to Note 8.
The effect of the reclassification as at 1 July 2022 is shown below.
| | | | | | |
|
| Amortised cost |
| MFVTPL |
| Change in value |
| | £m | | £m | | £m |
Amounts reclassified on balance sheet |
|
|
|
|
|
|
Loans to customers (1) |
| 587 |
| 606 |
| 19 |
Assets of disposal groups (2) |
| 10,676 |
| 10,383 |
| (293) |
|
| 11,263 |
| 10,989 |
| (274) |
(1)Change in value recognised in continuing operations.
(2)Change in value recognised in discontinued operations.
| |
NatWest Group – Annual Report on Form 20-F 2023 | 82 |
Notes to the consolidated financial statements continued
10 Financial instruments – classification continued
We originate loans that include features that change the contractual cash flows based on the borrower meeting certain contractually specified environmental, social and governance (ESG) targets. These are known as ESG-linked (or sustainability-linked) loans. As part of the terms of these loans, the contractual interest rate is reduced or increased if the borrower meets (or fails to meet) specific targets linked to the activity of the borrower, for example reducing carbon emissions, increasing the level of diversity at Board level, or achieving a sustainable supply chain. ESG features are first assessed to ascertain whether the adjustment to the contractual cash flows results in a de minimis exposure to risks or volatility in those contractual cash flows. If this is the case the classification of the loan is not affected. If the effect of the ESG feature is assessed as being more than de minimis, we apply judgement to ensure that the ESG features do not generate compensation for risks that are not in line with a basic lending arrangement. This includes, amongst other aspects, a review of the consistency of the ESG targets with the asset or activity of the borrower, and consideration of the targets within our risk appetite. Some of these loans are an integral part of our climate and sustainable funding and financing target disclosed on page 16 (exhibit 15.2).
The table below analyses financial assets forming a component of ESG-linked loans and other products with contractual terms that could change the timing or amount of cash flows.
| | | | | | | | | | |
|
| 2023 |
| 2022 | ||||||
| | |
| Positive impact on |
| Negative impact on |
| Reduction in | | |
| | Carrying value | | product margin | | product margin | | cash flows | | Carrying value |
| | £bn | | bps | | bps | | £m | | £bn |
Sustainability-linked loans |
| 6.5 |
| 3.2 |
| 3.9 |
| 2.5 |
| 5.0 |
Other products |
| 16.1 |
| — |
| — |
| — |
| 8.9 |
Lending subject to performance triggers |
| 22.6 |
| | | |
| 2.5 |
| 13.9 |
Additional information on finance lease receivables
The following table shows the reconciliation of undiscounted finance lease receivables to net investment in finance leases which are presented under Loans to customers-amortised cost on the balance sheet.
| | | | |
|
| 2023 |
| 2022 |
| | £m | | £m |
Amount receivable under finance leases | |
| |
|
Within 1 year | | 3,340 | | 3,235 |
1 to 2 years | | 2,358 | | 2,254 |
2 to 3 years | | 1,625 | | 1,388 |
3 to 4 years | | 900 | | 833 |
4 to 5 years | | 388 | | 411 |
After 5 years | | 1,079 | | 1,130 |
Total lease payments | | 9,690 | | 9,251 |
Unguaranteed residual values | | 169 | | 171 |
Future drawdowns | | (12) | | (13) |
Unearned income | | (1,025) | | (889) |
Present value of lease payments | | 8,822 | | 8,520 |
Impairments | | (91) | | (118) |
Net investment in finance leases | | 8,731 | | 8,402 |
| |
NatWest Group – Annual Report on Form 20-F 2023 | 83 |
Notes to the consolidated financial statements continued
10 Financial instruments – classification continued
Financial instruments – financial assets and liabilities that can be offset
The tables below present information on financial assets and financial liabilities that are offset on the balance sheet under IFRS or subject to enforceable master netting agreements together with financial collateral received or given.
| | | | | | | | | | | | | | | | | | |
| | Instruments which can be offset | | Potential for offset not recognised by IFRS | |
| |
| ||||||||||
| | | | | | | | Effect of | | | | | | Net amount | | | | |
| | | | | | | | master | | | | | | after netting | | Instruments | | |
| | | | | | | | netting | | | | | | agreements and | | outside | | |
| | | | IFRS | | Balance | | and similar | | Cash | | Securities | | effect of | | netting | | Balance |
| | Gross | | offset | | sheet | | agreements | | collateral | | collateral | | related collateral | | agreements | | sheet total |
2023 |
| £m |
| £m |
| £m |
| £m |
| £m |
| £m |
| £m |
| £m |
| £m |
Derivative assets |
| 99,023 | | (20,597) | | 78,426 | | (60,355) | | (12,284) | | (3,408) | | 2,379 | | 478 | | 78,904 |
Derivative liabilities |
| 95,734 | | (23,869) | | 71,865 | | (60,355) | | (6,788) | | (1,663) | | 3,059 | | 530 | | 72,395 |
Net position (1) |
| 3,289 | | 3,272 | | 6,561 | | — | | (5,496) | | (1,745) | | (680) | | (52) | | 6,509 |
| | | | | | | | | | | | | | | | | | |
Trading reverse repos |
| 39,573 | | (16,257) | | 23,316 | | (664) | | — | | (22,461) | | 191 | | 378 | | 23,694 |
Trading repos |
| 42,442 | | (16,257) | | 26,185 | | (664) | | — | | (25,520) | | 1 | | 717 | | 26,902 |
Net position |
| (2,869) | | — | | (2,869) | | — | | — | | 3,059 | | 190 | | (339) | | (3,208) |
|
| |
| | | | | | | | | | | | | | | |
Non trading reverse repos |
| 37,477 | | (9,646) | | 27,831 | | (5) | | — | | (27,826) | | — | | 80 | | 27,911 |
Non trading repos |
| 23,605 | | (9,646) | | 13,959 | | (5) | | — | | (13,954) | | — | | 3 | | 13,962 |
Net position |
| 13,872 | | — | | 13,872 | | — | | — | | (13,872) | | — | | 77 | | 13,949 |
| | | | | | | | | | | | | | | | | | |
2022 |
| |
| |
| | | | | | | |
| |
| |
| |
Derivative assets |
| 117,606 | | (18,730) | | 98,876 | | (77,365) | | (14,079) | | (4,571) | | 2,861 | | 669 | | 99,545 |
Derivative liabilities |
| 115,177 | | (22,111) | | 93,066 | | (77,365) | | (9,761) | | (1,185) | | 4,755 | | 981 | | 94,047 |
Net position (1) |
| 2,429 | | 3,381 | | 5,810 | | — | | (4,318) | | (3,386) | | (1,894) | | (312) | | 5,498 |
|
| |
| |
| |
| |
| |
| |
| |
| |
| |
Trading reverse repos |
| 35,612 | | (14,510) | | 21,102 | | (2,445) | | — | | (18,458) | | 199 | | 435 | | 21,537 |
Trading repos |
| 33,767 | | (14,510) | | 19,257 | | (2,445) | | — | | (16,812) | | — | | 4,483 | | 23,740 |
Net position |
| 1,845 | | — | | 1,845 | | — | | — | | (1,646) | | 199 | | (4,048) | | (2,203) |
| | | | | | | | | | | | | | | | | | |
Non trading reverse repos |
| 25,630 | | (5,702) | | 19,928 | | — | | — | | (19,928) | | — | | 98 | | 20,026 |
Non trading repos |
| 16,977 | | (5,702) | | 11,275 | | — | | — | | (11,275) | | — | | — | | 11,275 |
Net position |
| 8,653 | | — | | 8,653 | | — | | — | | (8,653) | | — | | 98 | | 8,751 |
(1) | Net IFRS offset balance of £3,272 million (2022 - £3,381 million)relates to variation margin netting reflected on other balance sheet lines. |
| |
NatWest Group – Annual Report on Form 20-F 2023 | 84 |
Notes to the consolidated financial statements continued
11 Financial instruments – valuation
Financial instruments recognised at fair value are revalued using techniques that can include observable inputs (pricing information that is readily available in the market, for example UK Government securities), and unobservable inputs (pricing information that is not readily available, for example unlisted securities). Gains and losses are recognised in the income statement and statement of comprehensive income as appropriate. This note presents information on the valuation of financial instruments. The table below provides an overview of the various sections contained within the note. |
Critical accounting policy: Fair value - financial instruments
Financial instruments classified as mandatory fair value through profit or loss; held-for-trading; designated fair value through profit or loss; and fair value through other comprehensive income are recognised in the financial statements at fair value. All derivatives are measured at fair value.
Fair value is the price that would be received to sell an asset or paid to transfer a liability in an orderly transaction between market participants at the measurement date. A fair value measurement considers the characteristics of the asset or liability and the assumptions that a market participant would consider when pricing the asset or liability.
NatWest Group manages some portfolios of financial assets and financial liabilities based on its net exposure to either market or credit risk. In these cases, the fair value is derived from the net risk exposure of that portfolio with portfolio level adjustments applied to incorporate bid-offer spreads, counterparty credit risk, and funding costs (refer to ’Valuation Adjustments’).
Where the market for a financial instrument is not active, fair value is established using a valuation technique. These valuation techniques involve a degree of estimation, the extent of which depends on the instrument’s complexity and the availability of market-based data. The complexity and uncertainty in the financial instrument’s fair value is categorised using the fair value hierarchy.
For accounting policy information refer to Accounting policies 2.2, 3.8 and 3.11.
| |
NatWest Group – Annual Report on Form 20-F 2023 | 85 |
Notes to the consolidated financial statements continued
11 Financial instruments - valuation continued
Valuation
| |
| Page |
Financial instruments | |
Critical accounting policy: Fair value | 85 |
Valuation | |
Fair value hierarchy (D) | 87 |
Valuation techniques (D) | 87 |
Inputs to valuation models (D) | 87 |
Valuation control (D) | 88 |
Key areas of judgement (D) | 89 |
Assets and liabilities split by fair value hierarchy level (T) | 90 |
Valuation adjustments | |
Fair value adjustments made (T) | 91 |
Funding valuation adjustments (FVA) (D) | 91 |
Credit valuation adjustments (CVA) (D) | 91 |
Bid-offer (D) | 91 |
Product and deal specific (D) | 92 |
Own credit (D) | 92 |
Level 3 additional information | |
Level 3 ranges of unobservable inputs (D) | 93 |
Level 3 instruments, valuation techniques and inputs (T) | 93 |
Level 3 sensitivities (D) | 94 |
Alternative assumptions (D) | 94 |
Other considerations (D) | 94 |
High and low range of fair value of level 3 assets and liabilities (T) | 94 |
Movement in level 3 assets and liabilities over the reporting period (D) | 95 |
Movement in level 3 assets and liabilities (T) | 95 |
Fair value of financial instruments measured at amortised cost | |
Fair value of financial instruments measured at amortised cost on the balance sheet | 96 |
(D) = Descriptive; (T) = Table | |
| |
NatWest Group – Annual Report on Form 20-F 2023 | 86 |
Notes to the consolidated financial statements continued
11 Financial instruments - valuation continued
Fair value hierarchy
Financial instruments carried at fair value have been classified under the fair value hierarchy. The classification ranges from level 1 to level 3, with more expert judgement and price uncertainty for those classified at level 3.
The determination of an instrument’s level cannot be made at a global product level as a single product type can be in more than one level. For example, a single name corporate credit default swap could be in level 2 or level 3 depending on the level of market activity for the referenced entity.
Level 1 – instruments valued using unadjusted quoted prices in active and liquid markets, for identical financial instruments. Examples include government bonds, listed equity shares and certain exchange-traded derivatives.
Level 2 - instruments valued using valuation techniques that have observable inputs. Observable inputs are those that are readily available with limited adjustments required. Examples include most government agency securities, investment-grade corporate bonds, certain mortgage products - including collateralised loan obligations (CLOs), most bank loans, repos and reverse repos, state and municipal obligations, most notes issued, certain money market securities, loan commitments and most over the counter (OTC) derivatives.
Level 3 - instruments valued using a valuation technique where at least one input which could have a significant effect on the instrument’s valuation, is not based on observable market data. Examples include non-derivative instrument’s which trade infrequently, certain syndicated and commercial mortgage loans, private equity, and derivatives with unobservable model inputs.
Valuation techniques
NatWest Group derives the fair value of its instruments differently depending on whether the instrument is a non-modelled or a modelled product.
Non-modelled products are valued directly from a price input, typically on a position-by-position basis. Examples include equities and most debt securities.
Non-modelled products can fall into any fair value levelling hierarchy depending on the observable market activity, liquidity, and assessment of valuation uncertainty of the instruments. The assessment of fair value and the classification of the instrument to a fair value level is subject to the valuation controls discussed in the Valuation control section.
Modelled products valued using a pricing model range in complexity from comparatively vanilla products such as interest rate swaps and options (e.g., interest rate caps and floors) through to more complex derivatives (e.g., balance guarantee swaps).
For modelled products the fair value is derived using the model and the appropriate model inputs or parameters, as opposed to a cash price equivalent. Model inputs are taken either directly or indirectly from available data, where some inputs are also modelled.
Fair value classification of modelled instruments is either level 2 or level 3, depending on the product/model combination, the observability and quality of input parameters and other factors. All these must be assessed to classify a position. The modelled product is assigned to the lowest fair value hierarchy level of any significant input used in that valuation.
Most derivative instruments, for example vanilla interest rate swaps, foreign exchange swaps and liquid single name credit derivatives, are classified as level 2. This is because they are vanilla products valued using standard market models and with observable inputs. Level 2 products range from vanilla to more complex products, where more complex products remain classified as level 2 due to the low materiality of any unobservable inputs.
Inputs to valuation models
When using valuation techniques, the fair value can be significantly affected by the choice of valuation model and underlying assumptions. Factors considered include the cashflow amounts and timing of those cash flows, and application of appropriate discount rates, incorporating both funding and credit risk. Values between and beyond available data points are obtained by interpolation and extrapolation. The principal inputs to these valuation techniques are as follows:
Bond prices - quoted prices are generally available for government bonds, certain corporate securities, and some mortgage-related products.
| |
NatWest Group – Annual Report on Form 20-F 2023 | 87 |
Notes to the consolidated financial statements continued
11 Financial instruments valuation continued
Credit spreads/margins - these reflect credit default swap levels or the return required over a benchmark rate or index to compensate for the referenced credit risk. Where available, these are derived from the price of credit default swaps or other credit-based instruments, such as debt securities. When direct prices are not available; credit spreads/margins are determined with reference to available prices of entities with similar characteristics.
Interest rates - these are principally based on interest rate swap prices referencing benchmark interest rates. Interest rates, include SONIA (Sterling Overnight Interbank Average Rate) and other overnight rates. Other quoted interest rates may also be used from both the bond, and futures markets.
Foreign currency exchange rates - there are observable prices both for spot and forward contracts and futures in the world's major currencies.
Equity and equity index prices - quoted prices are generally readily available for equity shares listed on the world's major stock exchanges and for major indices on such shares.
Price volatilities and correlations - volatility is a measure of the tendency of a price to change with time. Correlation measures the degree which two or more prices or variables are observed to move together. Variables that move in the same direction show positive correlation; those that move in opposite directions are negatively correlated.
Prepayment rates - are used to reflect how fast a pool of assets prepay. The fair value of a financial instrument that can be prepaid by the issuer or borrower differs from that of an instrument that cannot be prepaid. When valuing prepayable instruments, the value of this prepayment option is considered.
Recovery rates/loss given default - are used as an input to valuation models and reserves for asset-backed securities and other credit products as an indicator of severity of losses on default. Recovery rates are primarily sourced from market data providers, the value of the underlying collateral or inferred from observable credit spreads.
Valuation control
NatWest Group's control environment for the determination of the fair value of financial instruments includes formalised procedures for the review and validation of fair values. The review of market prices and inputs is performed by an independent price verification (IPV) team
IPV is a key element of the control environment. Valuations are first performed by the business which entered into the transaction. These valuations are then reviewed by the IPV team, independent of those trading the financial instruments, in light of available pricing evidence.
Independent pricing data is collated from a range of sources. Each source is reviewed for quality and the independent data applied in the IPV processes using a formalised input quality hierarchy. Consensus services are one source of independent data and encompass interest rate, currency, credit, and bond markets, providing comprehensive coverage of vanilla products and a wide selection of exotic products.
Where measurement differences are identified through the IPV process these are grouped by the quality hierarchy of the independent data. If the size of the difference exceeds defined thresholds, an adjustment is made to bring the valuation to within the independently calculated fair value range.
IPV takes place at least monthly, for all fair value financial instruments. The IPV control includes formalised reporting and escalation of any valuation differences in breach of established thresholds.
The quality and completeness of the information gathered in the IPV process gives an indication as to the liquidity and valuation uncertainty of an instrument and forms part of the information considered when determining fair value hierarchy classifications.
Initial fair value level classification of a financial instrument is carried out by the IPV team. These initial classifications are subject to senior management review. Particular attention is paid to instruments transferring from one level to another, new instrument classes or products, instruments where the transaction price is significantly different from the fair value and instruments where valuation uncertainty is high.
Valuation Committees are made up of valuation specialists and senior business representatives from various functions and oversees pricing, reserving and valuations issues. These committees meet monthly to review and ratify any methodology changes. The Executive Valuation Committee meets quarterly to address key material and subjective valuation issues, to review items escalated by Valuation Committees and to discuss other relevant industry matters.
| |
NatWest Group – Annual Report on Form 20-F 2023 | 88 |
Notes to the consolidated financial statements continued
11 Financial instruments valuation continued
The Group model risk policy sets the policy for model documentation, testing and review. Governance of the model risk policy is carried out by the Group model risk oversight committee, which comprises model risk owners and independent model experts. All models are required to be independently validated in accordance with the Model Risk Policy.
Key areas of judgement
Over the years the business has simplified, with most products classified as level 1 or 2 of the fair value hierarchy. However, the diverse range of products historically traded by NatWest Group means some products remain classified as level 3. Level 3 indicates a significant level of pricing uncertainty, where expert judgement is used. As such, extra disclosures are required in respect of level 3 instruments.
In general, the degree of expert judgement used and hence valuation uncertainty depends on the degree of liquidity of an instrument or input.
Where markets are liquid, little judgement is required. However, when the information regarding the liquidity in a particular market is not clear, a judgement may need to be made. For example, for an equity traded on an exchange, daily volumes of trading can be seen, but for an OTC derivative, assessing the liquidity of the market with no central exchange is more challenging.
A key related matter is where a market moves from liquid to illiquid or vice versa. Where this movement is considered temporary, the fair value level is not changed. For example, if there is little market trading in a product on a reporting date but at the previous reporting date and during the intervening period the market has been liquid. In this case, the instrument will continue to be classified at the same level in the hierarchy. This is to provide consistency so that transfers between levels are driven by genuine changes in market liquidity and do not reflect short term or seasonal effects. Material movements between levels are reviewed quarterly by the business and IPV. The breadth and depth of the IPV data allows for a rules-based quality assessment to be made of market activity, liquidity, and pricing uncertainty, which assists with the process of allocation to an appropriate level. Where suitable independent pricing information is not readily available, the quality assessment will result in the instrument being assessed as level 3.
| |
NatWest Group – Annual Report on Form 20-F 2023 | 89 |
Notes to the consolidated financial statements continued
11 Financial instruments - valuation continued
The table below shows the assets and liabilities held by NatWest Group split by fair value hierarchy level. Level 1 are considered the most liquid instruments, and level 3 the most illiquid, valued using expert judgement and so carry the most significant price uncertainty.
| | | | | | | | | | | | | | | | |
| | 2023 | | 2022 | ||||||||||||
|
| Level 1 |
| Level 2 |
| Level 3 |
| Total | | Level 1 |
| Level 2 |
| Level 3 | | Total |
|
| £m |
| £m |
| £m |
| £m |
| £m |
| £m |
| £m |
| £m |
Assets |
|
|
|
|
|
|
| | |
|
|
|
|
| | |
Trading assets |
|
|
|
|
|
|
| | |
|
|
|
|
| | |
Loans |
| — |
| 33,388 |
| 209 |
| 33,597 | | — |
| 35,260 |
| 395 |
| 35,655 |
Securities |
| 8,447 |
| 3,493 |
| 14 |
| 11,954 | | 7,463 |
| 2,458 |
| 1 |
| 9,922 |
Derivatives |
| |
| | | |
| | | |
| |
| |
| |
Interest rate | | 1 | | 43,912 | | 650 | | 44,563 | | 5 | | 52,764 | | 711 | | 53,480 |
Foreign exchange | | — | | 34,096 | | 65 | | 34,161 | | — | | 45,715 | | 114 | | 45,829 |
Other | | — | | 72 | | 108 | | 180 | | — | | 54 | | 182 | | 236 |
Other financial assets |
| |
| |
| |
| | | |
| |
| |
| |
Loans |
| — |
| 108 |
| 657 |
| 765 | | — |
| 172 |
| 727 |
| 899 |
Securities |
| 17,848 |
| 10,536 |
| 258 |
| 28,642 | | 10,380 |
| 6,278 |
| 203 |
| 16,861 |
Total financial assets held at fair value |
| 26,296 |
| 125,605 |
| 1,961 | | 153,862 | | 17,848 |
| 142,701 |
| 2,333 |
| 162,882 |
As a % of total fair value assets | | 17 | % | 82 | % | 1 | % | — | | 11 | % | 88 | % | 1 | % | — |
| | | | | | | | | | | | | | | | |
Liabilities |
| |
| |
| |
| | |
|
|
|
|
| | |
Trading liabilities |
| |
| |
| |
| | |
|
|
|
|
| | |
Deposits |
| — |
| 43,126 |
| 1 |
| 43,127 | | — |
| 42,486 |
| 1 |
| 42,487 |
Debt securities in issue |
| — |
| 706 |
| — |
| 706 | | — |
| 797 |
| — |
| 797 |
Short positions |
| 7,936 |
| 1,865 |
| 2 |
| 9,803 | | 7,462 |
| 2,062 |
| — |
| 9,524 |
Derivatives |
| |
| |
| |
| | | |
| |
| |
| |
Interest rate | | — | | 38,044 | | 439 | | 38,483 | | 2 | | 47,855 | | 678 | | 48,535 |
Foreign exchange | | — | | 33,528 | | 58 | | 33,586 | | — | | 45,139 | | 98 | | 45,237 |
Other | | — | | 138 | | 188 | | 326 | | — | | 76 | | 199 | | 275 |
Other financial liabilities |
| |
| |
| |
| | | |
| |
| |
| |
Debt securities in issue |
| — |
| 1,605 |
| 3 |
| 1,608 | | — |
| 1,327 |
| — |
| 1,327 |
Other deposits |
| — |
| 1,280 |
| — |
| 1,280 | | — |
| 1,050 |
| — |
| 1,050 |
Subordinated liabilities |
| — |
| 237 |
| — |
| 237 | | — |
| 345 |
| — |
| 345 |
Total financial liabilities held at fair value |
| 7,936 |
| 120,529 |
| 691 |
| 129,156 | | 7,464 |
| 141,137 |
| 976 |
| 149,577 |
As a % of total fair value liabilities | | 6 | % | 93 | % | 1 | % | — | | 5 | % | 94 | % | 1 | % | — |
(1) | Transfers between levels are deemed to have occurred at the beginning of the quarter in which the instrument was transferred. |
(2) | For an analysis of debt securities held at mandatory fair value through profit or loss by issuer as well as ratings and derivatives, by type and contract, refer to Risk and capital management – Credit risk. |
| |
NatWest Group – Annual Report on Form 20-F 2023 | 90 |
Notes to the consolidated financial statements continued
11 Financial instruments - valuation continued
Valuation adjustments
When valuing financial instruments in the trading book, adjustments are made to mid-market valuations to cover bid-offer spread, funding and credit risk. These adjustments are presented in the table below:
| | | | |
|
| 2023 |
| 2022 |
Adjustment | | £m | | £m |
Funding valuation adjustments |
| 132 |
| 173 |
Credit valuation adjustments |
| 236 |
| 300 |
Bid–offer |
| 86 |
| 130 |
Product and deal specific |
| 103 |
| 141 |
Total |
| 557 |
| 744 |
Funding valuation adjustments decreased during the year, primarily driven by changes in GBP interest rates and funding spreads tightening.
The decrease in credit value adjustments was driven by credit spreads tightening and a reduction in exposures, primarily due to portfolio ageing, partially offset by new trade activity. Interest rates tightening, trade restructuring and trade specific valuation adjustments were the drivers of the decrease in product and deal specific. The decrease in bid-offer was driven by risk reduction.
Funding valuation adjustments (FVA)
FVA represents an estimate of the adjustment that a market participant would make to incorporate funding costs and benefits that arise in relation to derivative exposures. FVA is calculated as a portfolio level adjustment and can result in either a funding charge (positive) or funding benefit (negative).
Funding levels are applied to estimated potential future exposures. For uncollateralised derivatives, the exposure reflects the future valuation of the derivative. For collateralised derivatives, the exposure reflects the difference between the future valuation of the derivative and the level of collateral posted.
Credit valuation adjustments (CVA)
CVA represents an estimate of the adjustment to fair value that is made to incorporate the counterparty credit risk inherent in derivative exposures. CVA is calculated on a portfolio basis reflecting an estimate of the amount a third party would charge to assume the credit risk.
Collateral held under a credit support agreement is factored into the CVA calculation. In such cases where NatWest Group holds collateral against counterparty exposures, CVA is held to the extent that residual risk remains.
FVA and CVA are actively managed by a credit and market risk hedging process, and therefore movements in CVA and FVA are partially offset by trading revenue on the hedges.
Bid-offer
Fair value positions are required to be marked to exit levels, represented by bid (long positions) or offer (short positions) levels. Non-derivative positions are typically marked directly to bid or offer prices. However derivative exposures are adjusted to exit levels by taking bid-offer reserves calculated on a portfolio basis. The reserving approach is based on current market bid-offer spreads and standard market bucketing of risk.
Bid-offer spreads vary by maturity and risk type to reflect different spreads in the market. For positions where there is no observable quote, the bid-offer spreads are widened in comparison to proxies to reflect reduced liquidity or observability.
Netting is applied on a portfolio basis to reflect the value at which NatWest Group believes it could exit the net risk of the portfolio, rather than the sum of exit costs for each of the portfolio’s individual trades. This is applied where the asset and liability positions are managed as a portfolio for risk and reporting purposes.
| |
NatWest Group – Annual Report on Form 20-F 2023 | 91 |
Notes to the consolidated financial statements continued
11 Financial instruments – valuation continued
Product and deal specific
On initial recognition of financial assets and liabilities valued using valuation techniques which have a significant dependence on information other than observable market data, any difference between the transaction price and that derived from the valuation technique is deferred. Such amounts are recognised in the income statement over the life of the transaction, when market data becomes observable, or when the transaction matures or is closed out as appropriate. On 31 December 2023, net gains of £78 million (2022 - £74 million) were carried forward. During the year, net gains of £119 million (2022 - £97 million) were deferred and £115 million (2022 - £94 million) were recognised in the income statement.
Where system-generated valuations do not accurately reflect market prices, manual valuation adjustments are applied either at a position or portfolio level. Manual adjustments are subject to the scrutiny of independent control teams and are subject to monthly review by senior management.
Own credit
NatWest Group considers the effect of its own credit standing when valuing financial liabilities recorded at fair value. Own credit spread adjustments are made when valuing issued debt held at fair value, including issued structured notes. An own credit adjustment is applied to positions where it is believed that counterparties would consider NatWest Group's creditworthiness when pricing trades.
| |
NatWest Group – Annual Report on Form 20-F 2023 | 92 |
Notes to the consolidated financial statements continued
11 Financial instruments – valuation continued
Level 3 additional information
For illiquid assets and liabilities, classified as level 3, additional information is provided on the valuation techniques used and price sensitivity of the products to those inputs. This is to enable the reader to gauge the level of uncertainty that arises from positions with significant unobservable inputs or modelling parameters.
Level 3 ranges of unobservable inputs
The table below provides additional information on level 3 instruments and inputs. This shows the valuation technique used for the fair value calculation, the unobservable input and input range.
| | | | | | | | | | | | | | |
| |
| | | | | | 2023 |
| 2022 | ||||
Financial instrument |
| Valuation technique |
| Unobservable inputs |
| Units |
| Low |
| High |
| Low |
| High |
Trading assets and Other financial assets | | | | | | | | | | | | | | |
Loans |
| Price-based | | Price | | % | | — | | 123 | | — | | 113 |
| | Discount cash flow | | Credit spreads | | bps | | 49 | | 119 | | 56 | | 114 |
| | Discount cash flow | | Discount margin | | bps | | 174 | | 228 | | 174 | | 222 |
Debt securities |
| Price-based | | Price |
| % | | — | | 119 | | — | | 255 |
| | | | | | | | | | | | | | |
Equity Shares | | Price-based | | Price | | GBP | | — | | 32,142 | | — | | 34,027 |
| | Price-based | | Price | | % | | — | | 30 | | — | | 30 |
|
| Discount cash flow | | Discount margin | | % | | 7 | | 9 | | 6 | | 8 |
| | Net asset valuation | | Fund NAV | | % | | 80 | | 120 | | 80 | | 120 |
| | | | | | | | | | | | | | |
Derivative assets and liabilities | | | | | | | | | | | | | | |
Credit derivatives | | Credit derivative pricing | | Credit spreads | | bps | | 13 | | 600 | | 7 | | 530 |
|
| Option pricing | | Correlation |
| % | | (15) | | 95 | | (15) | | 95 |
|
|
| | Volatility | | % | | 30 | | 80 | | 30 | | 80 |
|
|
| | Upfront points |
| % | | — | | 99 | | — | | 99 |
|
|
| | Recovery rate |
| % | | — | | 60 | | — | | 60 |
| | | | | | | | | | | | | | |
Interest rate & FX |
| Option pricing | | Correlation |
| % | | (50) | | 99 | | (50) | | 100 |
derivatives | |
| | Volatility | | % | | 30 | | 111 | | 30 | | 127 |
| | | | Constant Prepayment Rate | | % | | 2 | | 22 | | 2 | | 21 |
| | | | Mean Reversion | | % | | — | | 20 | | — | | 92 |
| | | | Inflation volatility | | % | | 2 | | 2 | | 1 | | 2 |
| | | | Inflation rate | | % | | 2 | | 3 | | 2 | | 3 |
(1) | Valuation for private equity investments may be estimated by looking at past prices of similar stocks and from valuation statements where valuations are usually derived from earnings measures such as EBITDA or net asset value (NAV). Similarly, for equity or bond fund investments, prices may be estimated from valuation or credit statements using NAV or similar measures. |
(2) | NatWest Group does not have any material liabilities measured at fair value that are issued with an inseparable third-party credit enhancement. |
| |
NatWest Group – Annual Report on Form 20-F 2023 | 93 |
Notes to the consolidated financial statements continued
11 Financial instruments – valuation continued
Level 3 sensitivities
The level 3 sensitivities presented below are calculated at a trade or low-level portfolio basis rather than an overall portfolio basis. As individual sensitivities are aggregated with no reflection of the correlated nature between instruments, the overall portfolio sensitivity may not be accurately reflected. For example, some portfolios may be negatively correlated to others, where a downwards movement in one asset would produce an upwards movement in another. However, due to the additive presentation of the above figures this correlation impact cannot be displayed. As such, the actual potential downside sensitivity of the total portfolio may be less than the non-correlated sum of the additive figures as shown in the below table.
Alternative assumptions
Reasonably plausible alternative assumptions of unobservable inputs are determined based on a specified target level of certainty of 90%. Alternative assumptions are determined with reference to all available evidence including consideration of the following: quality of independent pricing information considering consistency between different sources, variation over time, perceived tradability or otherwise of available quotes; consensus service dispersion ranges; volume of trading activity and market bias (e.g. one-way inventory); day 1 profit or loss arising on new trades; number and nature of market participants; market conditions; modelling consistency in the market; size and nature of risk; length of holding of position; and market intelligence.
Other considerations
Whilst certain inputs used to calculate CVA, FVA and own credit adjustments are not based on observable market data, the uncertainty of these inputs is not considered to have a significant effect on the net valuation of the related derivative portfolios and issued debt.
As such, the fair value levelling of the derivative portfolios and issued debt is not determined by CVA, FVA or own credit inputs. In addition, any fair value sensitivity driven by these inputs is not included in the level 3 sensitivities presented.
The table below shows the high and low range of fair value of the level 3 assets and liabilities. This range incorporates the range of fair value inputs as described in the previous table.
| | | | | | | | | | | | |
| | 2023 | | 2022 | ||||||||
| | Level 3 | | Favourable | | Unfavourable | | Level 3 | | Favourable | | Unfavourable |
|
| £m |
| £m |
| £m |
| £m |
| £m |
| £m |
Assets | | | | | | | | | | | | |
Trading assets | | | | | | | | | | | | |
Loans |
| 209 |
| — |
| — |
| 395 |
| 10 |
| (10) |
Securities |
| 14 |
| — |
| — |
| 1 |
| — |
| — |
Derivatives |
| |
| |
| |
| |
| |
| |
Interest rate |
| 650 |
| 20 |
| (20) |
| 711 |
| 30 |
| (30) |
Foreign exchange |
| 65 |
| — |
| — |
| 114 |
| 10 |
| (10) |
Other |
| 108 |
| 10 |
| (10) |
| 182 |
| 10 |
| (10) |
Other financial assets |
| | | | | |
| | | | | |
Loans |
| 657 |
| — |
| (40) |
| 727 |
| — |
| (10) |
Securities |
| 258 |
| 20 |
| (50) |
| 203 |
| 20 |
| (30) |
Total financial assets held at fair value |
| 1,961 |
| 50 |
| (120) |
| 2,333 |
| 80 |
| (100) |
|
|
|
|
|
|
|
|
|
|
|
|
|
Liabilities |
|
|
|
|
|
|
|
|
|
|
|
|
Trading liabilities |
|
|
|
|
|
|
|
|
|
|
|
|
Deposits |
| 1 |
| — |
| — |
| 1 |
| — |
| — |
Short positions |
| 2 |
| — |
| — |
| — |
| — |
| — |
Derivatives |
| |
| |
| |
| |
| |
| |
Interest rate | | 439 | | 10 | | (10) | | 678 | | 30 | | (30) |
Foreign exchange | | 58 | | — | | — | | 98 | | — | | — |
Other |
| 188 |
| 10 |
| (10) |
| 199 |
| — |
| — |
Other financial liabilities - debt securities in issue |
| 3 |
| — |
| — |
| — |
| — |
| — |
Total financial liabilities held at fair value |
| 691 |
| 20 |
| (20) |
| 976 |
| 30 |
| (30) |
| |
NatWest Group – Annual Report on Form 20-F 2023 | 94 |
Notes to the consolidated financial statements continued
11 Financial instruments – valuation continued
Movement in level 3 assets and liabilities
The following table shows the movement in level 3 assets and liabilities in the year.
| | | | | | | | | | | | | | | | |
| | | | Other | | Other | | | | | | Other | | Other | | |
| | Derivatives | | trading | | financial | | Total | | Derivatives | | trading | | financial | | Total |
| | assets | | assets (2) | | assets (3) | | assets | | liabilities | | liabilities (2) | | liabilities | | liabilities |
2023 |
| £m |
| £m |
| £m |
| £m |
| £m |
| £m |
| £m |
| £m |
At 1 January |
| 1,007 |
| 396 |
| 930 |
| 2,333 |
| 975 |
| 1 |
| — | | 976 |
Amounts recorded in the income statement (1) |
| (156) |
| (88) |
| 1 |
| (243) |
| (313) |
| — |
| — | | (313) |
Amount recorded in the statement of comprehensive income |
| — |
| — |
| 32 |
| 32 |
| — |
| — |
| — | | — |
Level 3 transfers in |
| 6 |
| 15 |
| 16 |
| 37 |
| 7 |
| 2 |
| — | | 9 |
Level 3 transfers out |
| (5) |
| (32) |
| (190) |
| (227) |
| (9) |
| (2) |
| — | | (11) |
Purchases/originations |
| 180 |
| 8 |
| 275 |
| 463 |
| 195 |
| 2 |
| 3 | | 200 |
Settlements/other decreases |
| (70) |
| (8) |
| (86) |
| (164) |
| (51) |
| — |
| — | | (51) |
Sales |
| (137) |
| (65) |
| (52) |
| (254) |
| (116) |
| — |
| — | | (116) |
Foreign exchange and other adjustments |
| (2) |
| (3) |
| (11) |
| (16) |
| (3) |
| — |
| — | | (3) |
At 31 December |
| 823 |
| 223 |
| 915 |
| 1,961 |
| 685 |
| 3 |
| 3 | | 691 |
| | | | | | | | | | | | | | | | |
Amounts recorded in the income statement in respect of balances held at period end | | | | | | | | | | | | | | | | |
- unrealised |
| 67 |
| (39) |
| 1 |
| 29 |
| (121) |
| — |
| — | | (121) |
| | | | | | | | | | | | | | | | |
2022 |
| |
| |
| |
| |
| |
| |
| | | |
At 1 January | | 918 | | 740 | | 394 | | 2,052 | | 606 | | 3 | | — | | 609 |
Amounts recorded in the income statement (1) | | 126 | | 31 | | (14) | | 143 | | 382 | | (1) | | — | | 381 |
Amount recorded in the statement of | | | | | | | | | | | | | | | | |
comprehensive income | | — | | — | | (20) | | (20) | | — | | — | | — | | — |
Level 3 transfers in | | 193 | | 1 | | 532 | | 726 | | 78 | | 3 | | — | | 81 |
Level 3 transfers out | | (122) | | (147) | | (68) | | (337) | | (61) | | (3) | | — | | (64) |
Purchases/originations | | 355 | | 274 | | 185 | | 814 | | 382 | | — | | — | | 382 |
Settlements/other decreases | | (40) | | (75) | | — | | (115) | | (41) | | — | | — | | (41) |
Sales | | (423) | | (434) | | (101) | | (958) | | (376) | | (2) | | — | | (378) |
Foreign exchange and other adjustments | | — | | 6 | | 22 | | 28 | | 5 | | 1 | | — | | 6 |
At 31 December | | 1,007 | | 396 | | 930 | | 2,333 | | 975 | | 1 | | — | | 976 |
| | | | | | | | | | | | | | | | |
Amounts recorded in the income statement | | | | | | | | | | | | | | | | |
in respect of balances held at period end | | | | | | | | | | | | | | | | |
- unrealised | | 126 | | 31 | | (16) | | 141 | | 382 | | (1) | | — | | 381 |
| (1) | There were £69 million net gains on trading assets and liabilities (2022 - £224 million net losses) recorded in income from trading activities. Net gains on other instruments of £1 million (2022 - £14 million net losses) were recorded in other operating income and interest income as appropriate. |
| (2) | Other trading assets and other trading liabilities comprise assets and liabilities held at fair value in trading portfolios. |
| (3) | Other financial assets comprise fair value through other comprehensive income, designated as at fair value through profit or loss and other fair value through profit or loss. |
| |
NatWest Group – Annual Report on Form 20-F 2023 | 95 |
Notes to the consolidated financial statements continued
11 Financial instruments – valuation continued
Fair value of financial instruments measured at amortised cost on the balance sheet
The following table shows the carrying value and fair value of financial instruments measured at amortised cost on the balance sheet.
| | | | | | | | | | | | |
|
| |
| |
| |
| |
| |
| Items where |
| | | | | | | | | | | | fair value |
| | Carrying | | Fair | | Fair value hierarchy level | | approximates | ||||
| | value | | value | | Level 1 | | Level 2 | | Level 3 | | carrying value |
2023 | | £bn | | £bn | | £bn | | £bn | | £bn | | £bn |
Financial assets |
| |
| |
| |
| |
| |
| |
Cash and balances at central banks |
| 104.3 | | 104.3 | | — | | — | | — | | 104.3 |
Settlement balances | | 7.2 | | 7.2 | | — | | — | | — | | 7.2 |
Loans to banks |
| 6.9 | | 7.0 | | — | | 2.2 | | 0.6 | | 4.2 |
Loans to customers | | 381.4 | | 373.2 | | — | | 27.5 | | 345.7 | | — |
Other financial assets - securities |
| 21.7 | | 21.6 | | 4.0 | | 6.6 | | 11.0 | | — |
| | | | | | | | | | | | |
2022 | | | | | | | | | | | | |
Financial assets |
| | | | | | | | | | | |
Cash and balances at central banks |
| 144.8 | | 144.8 | | — | | — | | — | | 144.8 |
Settlement balances |
| 2.6 | | 2.6 | | — | | — | | — | | 2.6 |
Loans to banks | | 7.1 | | 7.1 | | — | | 4.2 | | 2.8 | | 0.1 |
Loans to customers |
| 366.3 | | 354.5 | | — | | 20.3 | | 334.2 | | — |
Other financial assets - securities |
| 13.1 | | 12.8 | | 3.6 | | 3.2 | | 6.0 | | — |
| | | | | | | | | | | | |
2023 |
| | | | | | | | | | | |
Financial liabilities |
| | | | | | | | | | | |
Bank deposits |
| 22.2 |
| 22.3 |
| — |
| 15.4 |
| 2.7 |
| 4.2 |
Customer deposits |
| 431.4 |
| 431.0 |
| — |
| 30.7 |
| 48.8 |
| 351.5 |
Settlement balances |
| 6.6 |
| 6.6 |
| — |
| — |
| — |
| 6.6 |
Other financial liabilities - debt securities in issue | | 52.2 | | 52.2 | | — | | 41.7 | | 10.5 | | — |
Subordinated liabilities |
| 5.5 |
| 5.4 |
| — |
| 5.4 |
| — |
| — |
Notes in circulation | | 3.2 | | 3.2 | | — | | — | | — | | 3.2 |
| | | | | | | | | | | | |
2022 | | | | | | | | | | | | |
Financial liabilities |
| |
| |
| |
| |
| |
| |
Bank deposits | | 20.4 |
| 20.0 |
| — |
| 13.1 |
| 2.2 |
| 4.7 |
Customer deposits |
| 450.3 |
| 450.3 |
| — |
| 12.7 |
| 30.6 |
| 407.0 |
Settlement balances |
| 2.0 |
| 2.0 |
| — |
| — |
| — |
| 2.0 |
Other financial liabilities - debt securities in issue |
| 46.7 | | 46.1 | | — | | 40.7 | | 5.4 | | — |
Subordinated liabilities |
| 5.9 |
| 5.6 |
| — |
| 5.5 |
| 0.1 |
| — |
Notes in circulation |
| 3.2 | | 3.2 | | — | | — | | — | | 3.2 |
The assumptions and methodologies underlying the calculation of fair values of financial instruments at the balance sheet date are as follows:
Short-term financial instruments
For certain short-term financial instruments, including but not limited to, cash and balances at central banks, settlement balances, loans with short-term maturities, notes in circulation and customer demand deposits, carrying value is deemed a reasonable approximation of fair value.
| |
NatWest Group – Annual Report on Form 20-F 2023 | 96 |
Notes to the consolidated financial statements continued
11 Financial instruments – valuation continued
Loans to banks and customers
In estimating the fair value of net loans to customers and banks measured at amortised cost, NatWest Group's loans are segregated into appropriate portfolios reflecting the characteristics of the constituent loans. Two principal methods are used to estimate fair value:
| (a) | Contractual cashflows that are discounted using a market discount rate that incorporates the current spread for the borrower or where this is not observable, the spread for borrowers of a similar credit standing. |
| (b) | Expected cash flows (unadjusted for credit losses) are discounted at the current offer rate for the same or similar products. The current methodology caps all loan values at par rather than modelling clients' option to repay loans early. This approach is adopted for lending portfolios in Retail Banking, Ulster Bank RoI, Commercial & Institutional (SME loans) and Private Banking in order to reflect the homogeneous nature of these portfolios. |
Debt securities and subordinated liabilities
Most debt securities are valued using quoted prices in active markets or from quoted prices of similar financial instruments. The remaining population is valued using discounted cashflows at current offer rates.
Bank and customer deposits
Fair values of deposits are estimated using discounted cash flow valuation techniques. Where required, methodologies can be revised as additional information and valuation inputs become available.
| |
NatWest Group – Annual Report on Form 20-F 2023 | 97 |
Notes to the consolidated financial statements continued
12 Financial instruments - maturity analysis
This note shows the maturity profile of NatWest Group’s financial assets and liabilities by contractual date of maturity and contractual cash flows. |
Remaining maturity
The following table shows the residual maturity of financial instruments, based on contractual date of maturity.
| | | | | | | | | | | | |
| | 2023 | | 2022 | ||||||||
| | Less than | | More than | | | | Less than | | More than | | |
| | 12 months | | 12 months | | Total | | 12 months | | 12 months | | Total |
|
| £m |
| £m |
| £m |
| £m |
| £m |
| £m |
Assets | | | | | | | | | | | | |
Cash and balances at central banks |
| 104,262 |
| — |
| 104,262 |
| 144,832 |
| — |
| 144,832 |
Trading assets |
| 36,723 |
| 8,828 |
| 45,551 |
| 35,944 |
| 9,633 |
| 45,577 |
Derivatives |
| 29,839 |
| 49,065 |
| 78,904 |
| 38,107 |
| 61,438 |
| 99,545 |
Settlement balances |
| 7,231 |
| — |
| 7,231 |
| 2,572 |
| — |
| 2,572 |
Loans to banks - amortised cost | | 6,650 | | 264 | | 6,914 | | 6,872 | | 267 | | 7,139 |
Loans to customers - amortised cost | | 87,663 | | 293,770 | | 381,433 | | 84,289 | | 282,051 | | 366,340 |
Other financial assets |
| 10,192 |
| 40,910 |
| 51,102 |
| 6,128 |
| 24,767 |
| 30,895 |
| | | | | | | | | | | | |
Liabilities |
| | | | | | | | | | | |
Bank deposits |
| 8,954 | | 13,236 | | 22,190 | | 7,799 | | 12,642 | | 20,441 |
Customer deposits |
| 424,893 |
| 6,484 |
| 431,377 |
| 448,821 |
| 1,497 |
| 450,318 |
Settlement balances |
| 6,645 |
| — |
| 6,645 |
| 2,012 |
| — |
| 2,012 |
Trading liabilities |
| 45,349 |
| 8,287 |
| 53,636 |
| 42,760 |
| 10,048 |
| 52,808 |
Derivatives | | 30,721 | | 41,674 | | 72,395 | | 39,331 | | 54,716 | | 94,047 |
Other financial liabilities |
| 20,310 |
| 34,779 |
| 55,089 |
| 13,796 |
| 35,311 |
| 49,107 |
Subordinated liabilities |
| 1,047 |
| 4,667 |
| 5,714 |
| 973 |
| 5,287 |
| 6,260 |
Notes in circulation | | 3,237 | | — | | 3,237 | | 3,218 | | — | | 3,218 |
Lease liabilities |
| 102 |
| 568 |
| 670 |
| 137 |
| 981 |
| 1,118 |
Assets and liabilities by contractual cash flows up to 20 years
The tables on the following page show the contractual undiscounted cash flows receivable and payable, up to a period of 20 years, including future receipts and payments of interest of financial assets and liabilities by contractual maturity. The balances in the following tables do not agree directly with the consolidated balance sheet, as the tables include all cash flows relating to principal and future coupon payments, presented on an undiscounted basis. The tables have been prepared on the following basis:
Financial assets have been reflected in the time band of the latest date on which they could be repaid, unless earlier repayment can be demanded by NatWest Group. Financial liabilities are included at the earliest date on which the counterparty can require repayment, regardless of whether or not such early repayment results in a penalty. If the repayment of a financial instrument is triggered by, or is subject to, specific criteria such as market price hurdles being reached, the asset is included in the time band that contains the latest date on which it can be repaid, regardless of early repayment.
The liability is included in the time band that contains the earliest possible date on which the conditions could be fulfilled, without considering the probability of the conditions being met.
For example, if a structured note is automatically prepaid when an equity index exceeds a certain level, the cash outflow will be included in the less than three months period, whatever the level of the index at the year end. The settlement date of debt securities in issue, issued by certain securitisation vehicles consolidated by NatWest Group, depends on when cash flows are received from the securitised assets. Where these assets are prepayable, the timing of the cash outflow relating to securities assumes that each asset will be prepaid at the earliest possible date. As the repayments of assets and liabilities are linked, the repayment of assets in securitisations is shown on the earliest date that the asset can be prepaid, as this is the basis used for liabilities.
The principal amounts of financial assets and liabilities that are repayable after 20 years or where the counterparty has no right to repayment of the principal are excluded from the table, as are interest payments after 20 years.
| |
NatWest Group – Annual Report on Form 20-F 2023 | 98 |
Notes to the consolidated financial statements continued
12 Financial instruments - maturity analysis continued
The maturity of guarantees and commitments is based on the earliest possible date they would be drawn in order to evaluate NatWest Group's liquidity position.
MFVTPL assets of £125.1 billion (2022 - £145.8 billion) and HFT liabilities of £125.8 billion (2022 - £146.7 billion) have been excluded from the following tables.
| | | | | | | | | | | | |
|
| 0-3 months |
| 3-12 months |
| 1-3 years |
| 3-5 years |
| 5-10 years |
| 10-20 years |
2023 | | £m | | £m | | £m | | £m | | £m | | £m |
Assets by contractual maturity up to 20 years |
| |
| |
| |
| |
| |
| |
Cash and balances at central banks |
| 104,262 |
| — |
| — |
| — |
| — |
| — |
Derivatives held for hedging | | 31 | | 29 | | 128 | | 104 | | 49 | | 49 |
Settlement balances |
| 7,231 | | — | | — | | — | | — | | — |
Loans to banks - amortised cost |
| 5,234 |
| 1,437 |
| 23 |
| 302 |
| — |
| — |
Loans to customers - amortised cost |
| 52,175 |
| 46,894 |
| 81,445 |
| 61,465 |
| 96,577 |
| 114,806 |
Other financial assets (1) | | 4,897 | | 6,756 | | 12,304 | | 11,183 | | 10,019 | | 8,063 |
Finance lease |
| 61 |
| 242 |
| 735 |
| 401 |
| 656 |
| 359 |
|
| 173,891 | | 55,358 |
| 94,635 |
| 73,455 |
| 107,301 |
| 123,277 |
Liabilities by contractual maturity up to 20 years |
| |
| | | | | | | | | |
Bank deposits |
| 8,334 |
| 1,279 |
| 6,069 |
| 8,307 |
| — |
| — |
Customer deposits |
| 393,363 |
| 31,900 |
| 6,464 |
| 11 |
| 14 |
| 19 |
Settlement balances |
| 6,645 |
| — |
| — |
| — |
| — |
| — |
Derivatives held for hedging |
| 71 |
| 175 |
| 366 |
| 192 |
| 92 |
| 8 |
Other financial liabilities |
| 9,094 |
| 12,319 |
| 18,843 |
| 13,818 |
| 4,769 |
| 346 |
Subordinated liabilities | | 72 | | 1,167 | | 2,301 | | 1,512 | | 1,406 | | 342 |
Other liabilities - Notes in circulation | | 3,237 | | — | | — | | — | | — | | — |
Lease liabilities |
| 30 | | 79 |
| 172 |
| 111 |
| 175 |
| 132 |
|
| 420,846 |
| 46,919 |
| 34,215 |
| 23,951 |
| 6,456 |
| 847 |
Guarantees and commitments - notional amount |
| | | | | | | | | | | |
Guarantees (2) |
| 2,820 |
| — | | — | | — | | — | | — |
Commitments (3) |
| 112,807 |
| — |
| — |
| — |
| — |
| — |
|
| 115,627 |
| — |
| — |
| — |
| — |
| — |
For the notes to this table refer to the following page.
| |
NatWest Group – Annual Report on Form 20-F 2023 | 99 |
Notes to the consolidated financial statements continued
12 Financial instruments - maturity analysis continued
| | | | | | | | | | | | |
|
| 0-3 months |
| 3-12 months |
| 1-3 years |
| 3-5 years |
| 5-10 years |
| 10-20 years |
2022 |
| £m |
| £m |
| £m |
| £m |
| £m |
| £m |
Assets by contractual maturity up to 20 years |
| |
| |
| |
| |
| |
| |
Cash and balances at central banks |
| 144,832 |
| — |
| — |
| — |
| — |
| — |
Derivatives held for hedging |
| 130 | | 345 | | 28 | | 41 | | (44) | | 43 |
Settlement balances | | 2,572 | | — | | — | | — | | — | | — |
Loans to banks - amortised cost |
| 5,254 |
| 1,621 |
| 17 |
| 288 |
| — |
| — |
Loans to customers - amortised cost |
| 50,923 |
| 43,417 |
| 76,278 |
| 55,128 |
| 85,038 |
| 100,085 |
Other financial assets (1) |
| 2,771 | | 4,507 | | 8,391 | | 7,835 | | 5,706 | | 2,524 |
Finance lease | | 96 |
| 267 |
| 857 |
| 482 |
| 549 |
| 296 |
| | 206,578 | | 50,157 |
| 85,571 |
| 63,774 |
| 91,249 |
| 102,948 |
Liabilities by contractual maturity up to 20 years |
| |
| | | | | | | | | |
Bank deposits |
| 6,690 |
| 1,445 |
| 5,662 |
| 8,503 |
| 89 |
| — |
Customer deposits |
| 437,830 |
| 11,389 |
| 1,252 |
| 2 |
| 14 |
| 20 |
Settlement balances |
| 2,012 |
| — |
| — |
| — |
| — |
| — |
Derivatives held for hedging |
| 280 |
| (371) |
| 586 |
| 306 |
| 116 |
| 85 |
Other financial liabilities |
| 6,720 |
| 6,640 |
| 18,833 |
| 13,906 |
| 7,361 |
| 294 |
Subordinated liabilities |
| 96 | | 1,073 | | 2,690 | | 1,897 | | 1,541 | | 328 |
Other liabilities- Notes in circulation | | 3,218 | | — | | — | | — | | — | | — |
Lease liabilities | | 41 | | 113 |
| 260 |
| 203 |
| 318 |
| 254 |
|
| 456,887 |
| 20,289 |
| 29,283 |
| 24,817 |
| 9,439 |
| 981 |
Guarantees and commitments - notional amount |
| | | | | | | | | | | |
Guarantees (2) |
| 3,150 |
| — | | — | | — | | — | | — |
Commitments (3) |
| 118,779 |
| — |
| — |
| — |
| — |
| — |
|
| 121,929 |
| — |
| — |
| — |
| — |
| — |
(1) | Other financial assets exclude equity shares. |
(2) | NatWest Group is only called upon to satisfy a guarantee when the guaranteed party fails to meet its obligations. NatWest Group expects most guarantees it provides to expire unused. |
(3) | NatWest Group has given commitments to provide funds to customers under undrawn formal facilities, credit lines and other commitments to lend subject to certain conditions being met by the counterparty. NatWest Group does not expect all facilities to be drawn, and some may lapse before drawdown. |
| |
NatWest Group – Annual Report on Form 20-F 2023 | 100 |
Notes to the consolidated financial statements continued
13 Trading assets and liabilities
Trading assets and liabilities comprise assets and liabilities held at fair value and classified as held-for-trading. Financial instruments are classified as held-for-trading if they are held for the purpose of selling or repurchasing them in the short term, to make a spread between purchase and sale price or held to take advantage of movements in prices and yields. For accounting policy information refer to Accounting policy 3.8. |
| | | | |
| | 2023 | | 2022 |
Assets |
| £m |
| £m |
Loans |
|
|
|
|
Reverse repos |
| 23,694 |
| 21,537 |
Collateral given |
| 9,141 |
| 13,005 |
Other loans |
| 762 |
| 1,113 |
Total loans |
| 33,597 |
| 35,655 |
Securities |
| |
| |
Central and local government |
| |
| |
- UK |
| 2,729 |
| 2,205 |
- US |
| 2,600 |
| 2,345 |
- Other |
| 3,062 |
| 2,799 |
Financial institutions and corporate |
| 3,563 |
| 2,573 |
Total securities |
| 11,954 |
| 9,922 |
Total |
| 45,551 |
| 45,577 |
| | | | |
Liabilities |
| |
| |
Deposits |
| |
| |
Repos |
| 26,902 |
| 23,740 |
Collateral received |
| 15,075 |
| 17,680 |
Other deposits |
| 1,150 |
| 1,067 |
Total deposits |
| 43,127 |
| 42,487 |
Debt securities in issue |
| 706 |
| 797 |
Short positions |
| |
| |
Central and local government | | | | |
- UK | | 1,893 | | 2,313 |
- US | | 2,071 | | 1,293 |
- Other | | 4,049 | | 3,936 |
Financial institutions and Corporate | | 1,790 | | 1,982 |
Total short positions | | 9,803 | | 9,524 |
Total |
| 53,636 |
| 52,808 |
| |
NatWest Group – Annual Report on Form 20-F 2023 | 101 |
Notes to the consolidated financial statements continued
14 Derivatives
Derivative is a term covering a wide range of financial instruments that derive their fair value from an underlying rate or price, for example interest rates or exchange rates (the underlying). NatWest Group uses derivatives as a part of its trading activities, to manage its own risks such as interest rate, foreign exchange, or credit risk and in certain customer transactions. This note shows contracted volumes of derivatives, how they are used for hedging purposes and more specifically the effects of the application of hedge accounting. For accounting policy information refer to Accounting policies 3.8 and 3.11. |
| | | | | | | | | | | | | | | | | | |
|
| Notional |
| Asset | | Liability | ||||||||||||
| | Traded on | | | | | | Traded on | | | | | | Traded on | | | | |
| | recognised | | Traded over | | | | recognised | | Traded over | | | | recognised | | Traded over | | |
| | exchanges | | the counter | | Total | | exchanges | | the counter | | Total | | exchanges | | the counter | | Total |
2023 | | £bn | | £bn | | £bn | | £m | | £m | | £m | | £m | | £m | | £m |
Interest rate |
| 819 |
| 9,449 |
| 10,268 |
| 48 |
| 44,515 |
| 44,563 |
| 34 |
| 38,449 |
| 38,483 |
- Swaps |
| — |
| 6,533 |
| 6,533 |
| — |
| 33,807 |
| 33,807 |
| — |
| 27,424 |
| 27,424 |
- Options |
| 510 |
| 1,674 |
| 2,184 |
| 48 |
| 10,708 |
| 10,756 |
| 34 |
| 11,025 |
| 11,059 |
- Forwards and futures |
| 309 |
| 1,242 |
| 1,551 |
| — |
| — |
| — |
| — |
| — |
| — |
Exchange rate |
| 1 |
| 3,119 |
| 3,120 |
| — |
| 34,161 |
| 34,161 |
| — |
| 33,586 |
| 33,586 |
- Swaps |
| — |
| 449 |
| 449 |
| — |
| 8,173 |
| 8,173 |
| — |
| 7,370 |
| 7,370 |
- Options |
| 1 |
| 674 |
| 675 |
| — |
| 4,181 |
| 4,181 |
| — |
| 4,197 |
| 4,197 |
- Spot, forwards and futures |
| — |
| 1,996 |
| 1,996 |
| — |
| 21,807 |
| 21,807 |
| — |
| 22,019 |
| 22,019 |
Credit |
| — |
| 15 |
| 15 |
| — |
| 180 |
| 180 |
| — |
| 326 |
| 326 |
Equity and commodity |
| — |
| — |
| — |
| — |
| — |
| — |
| — |
| — |
| — |
Total |
| 820 |
| 12,583 |
| 13,403 |
| 48 |
| 78,856 |
| 78,904 |
| 34 |
| 72,361 |
| 72,395 |
| | | | | | | | | | | | | | | | | | |
2022 |
|
|
|
|
|
|
|
|
|
|
|
|
|
|
|
|
|
|
Interest rate |
| 707 |
| 10,035 |
| 10,742 |
| 113 |
| 53,367 |
| 53,480 |
| 33 |
| 48,502 |
| 48,535 |
- Swaps |
| — |
| 7,201 |
| 7,201 |
| — |
| 39,039 |
| 39,039 |
| — |
| 32,992 |
| 32,992 |
- Options |
| 296 |
| 1,418 |
| 1,714 |
| 113 |
| 14,328 |
| 14,441 |
| 33 |
| 15,510 |
| 15,543 |
- Forwards and futures |
| 411 |
| 1,416 |
| 1,827 |
| — |
| — |
| — |
| — |
| — |
| — |
Exchange rate |
| 2 |
| 3,166 |
| 3,168 |
| — |
| 45,829 |
| 45,829 |
| — |
| 45,237 |
| 45,237 |
- Swaps |
| — |
| 438 |
| 438 |
| — |
| 11,840 |
| 11,840 |
| — |
| 10,430 |
| 10,430 |
- Options |
| 2 |
| 835 |
| 837 |
| — |
| 6,375 |
| 6,375 |
| — |
| 6,647 |
| 6,647 |
- Spot, forwards and futures |
| — |
| 1,893 |
| 1,893 |
| — |
| 27,614 |
| 27,614 |
| — |
| 28,160 |
| 28,160 |
Credit |
| — |
| 15 |
| 15 |
| — |
| 236 |
| 236 |
| — |
| 275 |
| 275 |
Equity and commodity |
| — |
| — |
| — |
| — |
| — |
| — |
| — |
| — |
| — |
Total |
| 709 |
| 13,216 |
| 13,925 |
| 113 |
| 99,432 |
| 99,545 |
| 33 |
| 94,014 |
| 94,047 |
Included in the table above is the notional amount of £7,280 billion (2022 - £8,065 billion) of interest rate derivatives that are traded over the counter and settled through central clearing counterparties. NatWest Group has no other type of derivatives that are settled through central counterparties.
Hedge accounting using derivatives
NatWest Group applies hedge accounting to reduce the accounting mismatch caused in the income statement by using derivatives to hedge the following risks: interest rate, foreign exchange and the foreign exchange risk associated with net investment in foreign operations.
| |
NatWest Group – Annual Report on Form 20-F 2023 | 102 |
Notes to the consolidated financial statements continued
14 Derivatives continued
NatWest Group’s interest rate hedging relates to the management of NatWest Group’s non-trading structural interest rate risk, caused by the mismatch between fixed interest rates and floating interest rates on its financial instruments. NatWest Group manages this risk within approved limits. Residual risk positions are hedged with derivatives, principally interest rate swaps.
Cash flow hedges of interest rate risk relate to exposures to the variability in future interest payments and receipts due to the movement of interest rates on forecast transactions and on financial assets and financial liabilities. This variability in cash flows is hedged by interest rate swaps, which convert variable cash flows into fixed. For these cash flow hedge relationships, the hedged items are actual and forecast variable interest rate cash flows arising from financial assets and financial liabilities with interest rates linked to the relevant interest rates, most notably SOFR, EURIBOR, the European Central Bank deposit rate, SONIA and the Bank of England Official Bank Rate. The variability in cash flows due to movements in the relevant interest rate is hedged; this risk component is identified using the risk management systems of NatWest Group and encompasses the majority of cash flow variability risk.
Suitable larger fixed rate financial instruments are subject to fair value hedging in line with documented risk management strategies.
Fair value hedges of interest rate risk involve interest rate swaps transforming the fixed interest rate risk in financial assets and financial liabilities to floating. The hedged risk is the risk of changes in the hedged item’s fair value attributable to changes in the interest rate risk component of the hedged item. The significant interest rates identified as risk components are SOFR, EURIBOR, ESTR and SONIA. These risk components are identified using the risk management systems of NatWest Group and encompass the majority of the hedged item’s fair value risk.
NatWest Group hedges the exchange rate risk of its net investment in foreign currency denominated operations with currency borrowings and forward foreign exchange contracts. NatWest Group reviews the value of the investments’ net assets, executing hedges where appropriate to reduce the sensitivity of capital ratios to foreign exchange rate movement. Hedge accounting relationships will be designated where required.
Exchange rate risk also arises in NatWest Group where payments are denominated in currencies other than the functional currency. Residual risk positions are hedged with foreign exchange derivatives, fixing the exchange rate the payments will be settled in. The derivatives are documented as cash flow hedges.
For all cash flow hedging, fair value hedge relationships and net investment hedging, NatWest Group determines that there is an economic relationship between the hedged item and hedging instrument via assessing the initial and ongoing effectiveness by comparing movements in the fair value of the expected highly probable forecast interest cash flows/fair value of the hedged item attributable to the hedged risk with movements in the fair value of the expected changes in cash flows from the hedging instrument. The method used for comparing movements is either regression testing, or the dollar offset method. The method for testing effectiveness and the period over which the test is performed depends on the applicable risk management strategy and is applied consistently to each risk management strategy. Hedge effectiveness is assessed on a cumulative basis and the determination of effectiveness is in line with the requirements of IAS 39.
NatWest Group uses either the actual ratio between the hedged item and hedging instrument(s) or one that minimises hedge ineffectiveness to establish the hedge ratio for hedge accounting. Hedge ineffectiveness is measured in line with the requirements of IAS 39 and recognised in the income statement as it arises.
Derivatives in hedge accounting relationships
Included in the table below are derivatives held for hedging purposes as follows.
| | | | | | | | | | | | | | | | |
| | 2023 | | 2022 | ||||||||||||
| | | | | | | | Changes in fair | | | | | | | | Changes in fair |
| | | | | | | | value used for | | | | | | | | value used for |
| | Notional | | Assets | | Liabilities | | hedge ineffectiveness (1) | | Notional | | Assets | | Liabilities | | hedge ineffectiveness (1) |
|
| £bn |
| £m |
| £m |
| £m |
| £bn |
| £m |
| £m |
| £m |
Fair value hedging |
|
|
|
|
|
| | |
| | |
|
|
| | |
Interest rate contracts (2) |
| 67.6 |
| 1,139 |
| 2,607 | | 406 |
| 58.7 |
| 1,554 |
| 3,009 | | 482 |
| | | | | | | | | | | | | | | | |
Cash flow hedging |
| |
| |
| | | |
| |
| |
| | | |
Interest rate contracts |
| 140.0 |
| 1,924 |
| 4,970 | | 1,211 |
| 167.6 |
| 2,681 |
| 6,207 | | (3,342) |
Exchange rate contracts |
| 16.9 |
| 112 |
| 254 | | (12) |
| 6.3 |
| 142 |
| 112 | | (3) |
| | | | | | | | | | | | | | | | |
Net investment hedging |
| |
| |
| | | |
| |
| |
| | | |
Exchange rate contracts |
| 0.3 |
| 2 |
| 7 | | (3) |
| 0.5 |
| 1 |
| 9 | | 4 |
| | 224.8 | | 3,177 | | 7,838 | | 1,602 | | 233.1 | | 4,378 | | 9,337 | | (2,859) |
IFRS netting and clearing house settlements | | | | (3,063) | | (7,568) | | | | | | (4,235) | | (9,205) | | |
|
| |
| 114 |
| 270 | | |
| |
| 143 |
| 132 | | |
| (1) | The change in fair value used for hedge ineffectiveness includes instruments that were derecognised in the year. |
| (2) | The hedged risk includes inflation risk. |
| |
NatWest Group – Annual Report on Form 20-F 2023 | 103 |
Notes to the consolidated financial statements continued
14 Derivatives continued
Hedge ineffectiveness
Hedge ineffectiveness recognised in other operating income comprises.
| | | | | | |
|
| 2023 |
| 2022 |
| 2021 |
| | £m | | £m | | £m |
Fair value hedging |
| |
|
|
|
|
Loss on hedged items attributable to the hedged risk |
| (364) |
| (442) |
| (846) |
Gain on the hedging instruments |
| 406 |
| 482 |
| 897 |
Fair value hedging ineffectiveness |
| 42 |
| 40 |
| 51 |
Cash flow hedging | | | | | | |
Interest rate risk | | 10 | | (60) | | (26) |
Cash flow hedging ineffectiveness |
| 10 |
| (60) |
| (26) |
Total |
| 52 |
| (20) |
| 25 |
The main sources of ineffectiveness for interest rate risk hedge accounting relationships are:
| - | The effect of the counterparty credit risk on the fair value of the interest rate swap which is not reflected in the fair value of the hedged item attributable to the change in interest rate (fair value hedge). |
| - | Differences in the repricing basis between the hedging instrument and hedged cash flows (cash flow hedge); and |
| - | Upfront present values on the hedging derivatives where hedge accounting relationships have been designated after the trade date (cash flow hedge and fair value hedge). |
| |
NatWest Group – Annual Report on Form 20-F 2023 | 104 |
Notes to the consolidated financial statements continued
14 Derivatives continued
Maturity of notional hedging contracts
The following table shows the period in which the notional of hedging contract ends.
| | | | | | | | | | | | | | |
|
| 0-3 months |
| 3-12 months |
| 1-3 years |
| 3-5 years |
| 5-10 years |
| Over 10 years |
| Total |
2023 | | £bn | | £bn | | £bn | | £bn | | £bn | | £bn | | £bn |
Fair value hedging | | | | | | | | | | | | | | |
Interest rate risk (1) | | | | | | | | | | | | | | |
Hedging assets | | 0.1 | | 1.7 | | 7.1 | | 9.0 | | 5.9 | | 4.7 | | 28.5 |
Hedging liabilities | | 2.7 | | 3.3 | | 13.4 | | 11.3 | | 7.7 | | 0.7 | | 39.1 |
2022 | | | | | | | | | | | | | | |
Fair value hedging | | | | | | | | | | | | | | |
Interest rate risk (1) | | | | | | | | | | | | | | |
Hedging assets | | 0.5 | | 1.9 | | 4.7 | | 4.9 | | 4.2 | | 3.6 | | 19.8 |
Hedging liabilities | | 1.0 | | 2.9 | | 14.6 | | 10.3 | | 9.6 | | 0.5 | | 38.9 |
| | | | | | | | | | | | | | |
2023 | | | | | | | | | | | | | | |
Cash flow hedging | | | | | | | | | | | | | | |
Interest rate risk | | | | | | | | | | | | | | |
Hedging assets | | 3.9 | | 14.5 | | 33.9 | | 22.8 | | 10.1 | | — | | 85.2 |
Hedging liabilities | | 0.8 | | 3.9 | | 39.1 | | 10.1 | | 0.3 | | 0.6 | | 54.8 |
Exchange rate risk | | | | | | | | | | | | | | |
Hedging assets | | 0.3 | | 0.7 | | 1.6 | | — | | — | | — | | 2.6 |
Hedging liabilities | | 8.4 | | 0.8 | | 2.4 | | 2.5 | | 0.2 | | — | | 14.3 |
2022 | | | | | | | | | | | | | | |
Cash flow hedging | | | | | | | | | | | | | | |
Interest rate risk | | | | | | | | | | | | | | |
Hedging assets | | 6.6 | | 9.4 | | 46.5 | | 21.9 | | 10.1 | | — | | 94.5 |
Hedging liabilities | | 17.3 | | 26.8 | | 15.7 | | 5.1 | | 7.5 | | 0.7 | | 73.1 |
Exchange rate risk | | | | | | | | | | | | | | |
Hedging assets | | 0.1 | | — | | — | | — | | — | | — | | 0.1 |
Hedging liabilities | | — | | 1.1 | | 2.8 | | 2.1 | | 0.2 | | — | | 6.2 |
| (1) | The hedged risk includes inflation risk. |
| |
NatWest Group – Annual Report on Form 20-F 2023 | 105 |
Notes to the consolidated financial statements continued
14 Derivatives continued
Average fixed interest rates
The following table shows average fixed rate for cash flow hedges, interest rate risk.
| | | | | | | | | | | | | | |
|
| 0-3 months |
| 3-12 months |
| 1-3 years |
| 3-5 years |
| 5-10 years |
| Over 10 years |
| Total |
2023 | | % | | % | | % | | % | | % | | % | | % |
Average fixed interest rate |
|
|
|
|
|
|
|
|
|
|
|
|
|
|
Hedging assets |
| 1.16 |
| 2.46 |
| 1.19 |
| 3.30 |
| 1.77 |
| 3.12 |
| 2.04 |
Hedging liabilities |
| 0.93 |
| 2.54 |
| 4.36 |
| 2.28 |
| 2.36 |
| 4.50 |
| 3.79 |
2022 |
|
|
|
|
|
|
|
|
|
|
|
|
|
|
Average fixed interest rate |
|
|
|
|
|
|
|
|
|
|
|
|
|
|
Hedging assets |
| 1.36 |
| 1.98 |
| 1.71 |
| 2.04 |
| 1.02 |
| 3.12 |
| 1.72 |
Hedging liabilities |
| 1.27 |
| 0.95 |
| 2.75 |
| 1.03 |
| 2.68 |
| 4.55 |
| 1.63 |
Average foreign exchange rates
For cash flow hedging of exchange rate risk, the average foreign exchange rates applicable across the relationships were as below for the main currencies hedged.
| | | | |
|
| 2023 |
| 2022 |
INR/GBP |
| 105.03 |
| 100.54 |
USD/GBP |
| 1.28 |
| 1.29 |
CHF/GBP |
| 1.08 |
| 1.15 |
JPY/GBP |
| 170.54 |
| 132.89 |
JPY/USD |
| 129.75 |
| 128.29 |
NOK/USD |
| 9.21 |
| 9.21 |
| |
NatWest Group – Annual Report on Form 20-F 2023 | 106 |
Notes to the consolidated financial statements continued
14 Derivatives continued
Analysis of hedged items and related hedging instruments
The table below analyses assets and liabilities subject to hedging derivatives.
| | | | | | |
|
| |
| |
| Changes in fair |
| | Carrying value | | Impact on | | value used as |
| | of hedged | | hedged items | | a basis to |
| | assets and | | included in | | determine |
| | liabilities | | carrying value | | ineffectiveness (1) |
2023 | | £m | | £m | | £m |
Fair value hedging - interest rate (2) | | | | | | |
Loans to banks and customers - amortised cost | | 5,663 | | (316) | | 167 |
Other financial assets - securities | | 22,896 | | 174 | | 636 |
Total (3) | | 28,559 | | (142) | | 803 |
| | | | | | |
Bank and customer deposits | | 745 | | (3) | | (6) |
Other financial liabilities - debt securities in issue | | 36,305 | | (1,151) | | (1,023) |
Subordinated liabilities | | 5,346 | | (320) | | (138) |
Total | | 42,396 | | (1,474) | | (1,167) |
| | | | | | |
| | | | | | |
2022 | | | | | | |
Fair value hedging - interest rate (2) | | | | | | |
Loans to banks and customers - amortised cost | | 5,764 | | (526) | | (1,236) |
Other financial assets - securities | | 12,897 | | (922) | | (2,525) |
Total (3) | | 18,661 | | (1,448) | | (3,761) |
| | | | | | |
Bank and customer deposits | | 565 | | (3) | | 3 |
Other financial liabilities - debt securities in issue | | 35,856 | | (2,222) | | 2,790 |
Subordinated liabilities | | 5,504 | | (547) | | 526 |
Total | | 41,925 | | (2,772) | | 3,319 |
For the notes to this table refer to the following page.
| |
NatWest Group – Annual Report on Form 20-F 2023 | 107 |
Notes to the consolidated financial statements continued
14 Derivatives continued
| | | | | | |
| | | | | | Changes in fair value |
| | | | Carrying value of | | used as a basis to |
| | | | hedged assets and liabilities | | determine ineffectiveness (1) |
2023 | | | | £m | | £m |
Cash flow hedging - interest rate | | | | | | |
Loans to banks and customers - amortised cost (4) | | | | 84,583 | | (2,796) |
Other financial assets - securities | | | | 623 | | (22) |
Total | | | | 85,206 | | (2,818) |
| | | | | | |
Bank and customer deposits | | | | 54,675 | | 1,610 |
Other financial liabilities - debt securities in issue | | | | 156 | | 7 |
Total | | | | 54,831 | | 1,617 |
| | | | | | |
Cash flow hedging - exchange rate | | | | | | |
Loans to banks and customers - amortised cost (4) | | | | 583 | | — |
Other financial assets - securities | | | | 1,839 | | — |
Total | | | | 2,422 | | — |
| | | | | | |
Other financial liabilities - debt securities in issue | | | | 11,460 | | 9 |
Subordinated liabilities | | | | — | | — |
Other | | | | 201 | | 3 |
Total | | | | 11,661 | | 12 |
| | | | | | |
2022 | | | | | | |
Cash flow hedging - interest rate |
|
|
| |
| |
Loans to banks and customers - amortised cost (4) |
| |
| 93,212 |
| 5,263 |
Other financial assets - securities |
| |
| 1,176 |
| 73 |
Total |
| |
| 94,388 |
| 5,336 |
| | | | | | |
Bank and customer deposits | | | | 72,610 | | (2,008) |
Other financial liabilities - debt securities in issue | | | | 571 | | (46) |
Total | | | | 73,181 | | (2,054) |
| | | | | | |
Cash flow hedging - exchange rate | | | | | | |
Loans to banks and customer - amortised cost (4) |
| |
| — |
| — |
Other financial assets - securities | | | | — | | — |
Total | | | | — | | — |
| | | | | | |
Other financial liabilities - debt securities in issue | | | | 4,141 | | (2) |
Subordinated liabilities |
| |
| — |
| — |
Other | | | | 204 | | 5 |
Total |
| |
| 4,345 |
| 3 |
| |
NatWest Group – Annual Report on Form 20-F 2023 | 108 |
Notes to the consolidated financial statements continued
14 Derivatives continued
Analysis of cash flow and foreign exchange hedge reserve
The following table shows an analysis of the pre-tax cash flow hedge reserve and foreign exchange hedge reserve.
| | | | | | | | |
| | 2023 | | 2022 | ||||
| | | | Foreign | | | | Foreign |
| | Cash flow | | exchange | | Cash flow | | exchange |
| | hedge reserve | | hedge reserve | | hedge reserve | | hedge reserve |
|
| £m |
| £m |
| £m |
| £m |
Continuing |
| |
| |
| |
| |
Interest rate risk |
| (2,330) |
| — |
| (3,576) |
| — |
Foreign exchange risk |
| 1 | | (18) | | 16 | | (85) |
De-designated |
| |
| |
| |
| |
Interest rate risk |
| (304) |
| — |
| (297) |
| — |
Foreign exchange risk |
| 4 |
| (771) |
| 20 |
| (880) |
Total |
| (2,629) |
| (789) |
| (3,837) |
| (965) |
| | | | | | | | |
| | 2023 | | 2022 | ||||
| | | | Foreign | | | | Foreign |
| | Cash flow | | exchange hedge | | Cash flow | | exchange hedge |
|
| hedge reserve |
| reserve |
| hedge reserve |
| reserve |
|
| £m |
| £m |
| £m |
| £m |
Amount recognised in equity | | | | | | | | |
Interest rate risk |
| 137 | | — |
| (2,997) | | (64) |
Foreign exchange risk |
| 50 |
| 107 |
| 24 |
| (202) |
Total |
| 187 |
| 107 |
| (2,973) |
| (266) |
| | | | | | | | |
Amount transferred from equity to earnings | | | | | | | | |
Interest rate risk to net interest income |
| 1,112 |
| — |
| (252) |
| — |
Interest rate risk to non interest income (1) | | (10) | | — | | (21) | | — |
Interest rate risk to operating expenses |
| — |
| — |
| (14) |
| — |
Foreign exchange risk to net interest income | | (74) | | — | | (29) | | — |
Foreign exchange risk to non interest income | | (9) | | 69 | | 15 | | 7 |
Foreign exchange risk to operating expenses |
| 2 |
| — |
| (3) |
| — |
Total |
| 1,021 |
| 69 |
| (304) |
| 7 |
| (1) | There was £10 million (2022 - £21 million) reclassified with the cash flow reserve to earnings due to forecasted cash flows that are no longer expected to occur. |
| |
NatWest Group – Annual Report on Form 20-F 2023 | 109 |
Notes to the consolidated financial statements continued
15 Loan impairment provisions
There is a risk that customers and counterparties fail to meet their contractual obligation to settle outstanding amounts, known as expected credit losses (ECL). The calculation of ECL considers historic, current and forward-looking information to determine the amount we do not expect to recover. ECL is recognised on current and potential exposures, and contingent liabilities. For accounting policy information refer to Accounting policy 2.3. Further disclosures on credit risk and information on ECL methodology are shown from page 171 (exhibit 15.2). |
Loan exposure and impairment metrics
The table below summarises loans and credit impairment measures within the scope of IFRS 9 Expected credit losses framework.
| | | | |
| | 2023 | | 2022 |
|
| £m |
| £m |
Loans - amortised cost and FVOCI |
|
|
|
|
Stage 1 |
| 348,586 |
| 325,224 |
Stage 2 |
| 37,891 |
| 46,833 |
Stage 3 |
| 5,563 |
| 5,096 |
Of which: individual | | 1,031 | | 1,121 |
Of which: collective |
| 4,532 |
| 3,975 |
| | 392,040 | | 377,153 |
ECL provisions (1) |
| |
| |
- Stage 1 |
| 709 |
| 632 |
- Stage 2 |
| 976 |
| 1,043 |
- Stage 3 |
| 1,960 |
| 1,759 |
Of which: individual | | 332 | | 287 |
Of which: collective | | 1,628 | | 1,472 |
|
| 3,645 |
| 3,434 |
ECL provision coverage (2) |
| |
| |
- Stage 1 (%) | | 0.20 |
| 0.19 |
- Stage 2 (%) | | 2.58 |
| 2.23 |
- Stage 3 (%) | | 35.23 |
| 34.52 |
|
| 0.93 |
| 0.91 |
Continuing operations | | | | |
Impairment (releases)/losses |
| |
| |
ECL (release)/charge (3,4) | | 578 | | 337 |
Stage 1 | | (397) | | (290) |
Stage 2 | | 645 | | 393 |
Stage 3 | | 330 | | 234 |
Of which: individual | | 89 | | 54 |
Of which: collective | | 241 | | 180 |
Amounts written off |
| 319 |
| 482 |
Of which: individual | | 42 | | 168 |
Of which: collective |
| 277 |
| 314 |
(1) | Includes loans to customers and banks. |
(2) | Includes £9 million (2022 - £3 million) related to assets classified as FVOCI and £0.1 billion (2022 - £0.1 billion) related to off-balance sheet exposures. |
(3) | ECL provisions coverage is calculated as ECL provisions divided by loans – amortised cost and FVOCI. It is calculated on loans and total ECL provisions, including ECL for other (non-loan) assets and unutilised exposure. Some segments with a high proportion of debt securities or unutilised exposure may result in a not meaningful coverage ratio. |
(4) | Includes a £16 million release (2022 - £3 million charge) related to other financial assets, of which £6 million charge (2022 - nil) related to assets classified as FVOCI; and £9 million release (2022 - £5 million release) related to contingent liabilities. |
(5) | The table shows gross loans only and excludes amounts that are outside the scope of the ECL framework. Refer to Financial instruments within the scope of the IFRS 9 ECL framework for further details. Other financial assets within the scope of the IFRS 9 ECL framework were cash and balances at central banks totalling £103.1 billion (2022 – £143.3 billion) and debt securities of £50.1 billion (2022 – £29.9 billion). |
| |
NatWest Group – Annual Report on Form 20-F 2023 | 110 |
Notes to the consolidated financial statements continued
15 Loan impairment provisions continued
Credit risk enhancement and mitigation
For information on Credit risk enhancement and mitigation held as security, refer to Risk and capital management – Credit risk enhancement and mitigation section.
Critical accounting policy: Loan impairment provisions
Accounting policy 2.3 sets out how the expected loss approach is applied. At 31 December 2023, customer loan impairment provisions amounted to £3,645 million (2022 - £3,434 million). A loan is impaired when there is objective evidence that the cash flows will not occur in the manner expected when the loan was advanced. Such evidence includes, changes in the credit rating of a borrower, the failure to make payments in accordance with the loan agreement, significant reduction in the value of any security, breach of limits or covenants, and observable data about relevant macroeconomic measures.
The impairment loss is the difference between the carrying value of the loan and the present value of estimated future cash flows at the loan's original effective interest rate.
The measurement of credit impairment under the IFRS expected loss model depends on management's assessment of any potential deterioration in the creditworthiness of the borrower, its modelling of expected performance and the application of economic forecasts. All three elements require judgements that are potentially significant to the estimate of impairment losses. For further information and sensitivity analysis, refer to Risk and capital management - Measurement uncertainty and ECL sensitivity analysis section.
IFRS 9 ECL model design principles
Refer to Credit risk – IFRS 9 ECL model design principles section for further details.
Approach for multiple economic scenarios (MES)
The base scenario plays a greater part in the calculation of ECL than the approach to MES. Refer to Credit risk - Economic loss drivers - Probability weightings of scenarios section for further details.
| |
NatWest Group – Annual Report on Form 20-F 2023 | 111 |
Notes to the consolidated financial statements continued
16 Other financial assets
Other financial assets consist of debt securities, equity shares and loans that are not held for trading. Balances consist of local and central government securities, a component part of NatWest Group’s liquidity portfolio. For accounting policy information refer to Accounting policy 3.8. |
| | | | | | | | | | | | | | | | |
| | Debt securities | | | | | | | ||||||||
| | Central and local government | | Other | | | | Equity | | | | | ||||
| | UK | | US | | Other | | debt | | Total | | shares | | Loans | | Total |
2023 |
| £m |
| £m |
| £m |
| £m |
| £m |
| £m |
| £m |
| £m |
Mandatory fair value through profit or loss |
| — |
| — |
| — |
| 1 |
| 1 |
| 2 | | 700 |
| 703 |
Designated at fair value | | — | | — | | 3 | | 2 | | 5 | | — | | — | | 5 |
Fair value through other comprehensive income (1) |
| 6,441 |
| 5,517 |
| 5,738 |
| 10,627 |
| 28,323 |
| 311 | | 65 |
| 28,699 |
Amortised cost |
| 2,889 |
| 647 |
| 35 |
| 18,124 |
| 21,695 |
| — | | — |
| 21,695 |
Total |
| 9,330 |
| 6,164 |
| 5,776 |
| 28,754 |
| 50,024 |
| 313 | | 765 |
| 51,102 |
| | | | | | | | | | | | | | | | |
2022 | | | | | | | | | | | | | | | | |
Mandatory fair value through profit or loss | | — |
| — |
| — |
| 2 |
| 2 |
| 3 | | 782 |
| 787 |
Designated at fair value | | — | | — | | — | | — | | — | | — | | — | | — |
Fair value through other comprehensive income (1) |
| 802 |
| 7,175 |
| 1,757 |
| 6,765 |
| 16,499 |
| 357 | | 117 |
| 16,973 |
Amortised cost |
| 2,562 |
| 937 |
| 54 |
| 9,582 |
| 13,135 |
| — | | — |
| 13,135 |
Total |
| 3,364 |
| 8,112 |
| 1,811 |
| 16,349 |
| 29,636 |
| 360 | | 899 |
| 30,895 |
(1) | Upon initial recognition, NatWest Group occasionally irrevocably designates some of its equity investments as equity instruments at FVOCI when they meet the definition of equity under IAS 32 Financial instruments: presentation, are not held for trading or they are held for strategic purposes. Such classification is determined on an instrument-by-instrument basis. Gains and losses on these equity instruments are not recycled to the income statement and dividends are recognised in profit or loss except when they represent a recovery of part of the cost of the instrument, in which case such gains are recorded in OCI. Equity instruments at FVOCI are not subject to an impairment assessment. |
There were no significant acquisitions of equity shares in the year. In 2022, NatWest Group acquired £146 million of equity shares in Permanent TSB p.l.c as part consideration on the sale of certain assets and £26 million of equity shares in Vodeno Limited.
NatWest Group disposed of equity shares in Permanent TSB p.l.c of £47 million and UBS Equity Funds of £35 million in the year. In 2022, NatWest Group disposed of equity shares in Visa Inc. of £99 million and UBS Equity Funds of £69 million. There were no significant dividends on equity shares held at FVOCI in either year.
| |
NatWest Group – Annual Report on Form 20-F 2023 | 112 |
Notes to the consolidated financial statements continued
17 Intangible assets
Intangible assets, such as internally generated software and goodwill generated on business combinations, are not physical in nature. This note presents the cost of the assets, which is the amount NatWest Group initially paid or incurred, additions and disposals during the year, and any amortisation or impairment. Amortisation is a charge that reflects the usage of the asset and impairment is a reduction in value arising from specific events identified during the year. For accounting policy information refer to Accounting policies 3.4 and 3.5. |
| | | | | | | | | | | | |
| | 2023 | | 2022 | ||||||||
|
| Goodwill |
| Other (1) |
| Total |
| Goodwill |
| Other (1) |
| Total |
Cost | | £m | | £m | | £m | | £m | | £m | | £m |
At 1 January |
| 9,931 | | 3,763 | | 13,694 |
| 9,939 | | 3,050 | | 12,989 |
Currency translation and other adjustments |
| — |
| — |
| — |
| (8) |
| (3) |
| (11) |
Acquisitions of companies and businesses | | 159 | | 37 | | 196 | | — | | — | | — |
Additions |
| — |
| 762 |
| 762 |
| — |
| 743 |
| 743 |
Disposals and write-off of fully amortised assets |
| — |
| (115) |
| (115) |
| — |
| (27) |
| (27) |
At 31 December |
| 10,090 | | 4,447 | | 14,537 |
| 9,931 | | 3,763 | | 13,694 |
|
| | | | | |
| | | | | |
Accumulated amortisation and impairment |
| | | | | |
| | | | | |
At 1 January |
| 4,409 | | 2,169 | | 6,578 |
| 4,417 | | 1,849 | | 6,266 |
Currency translation and other adjustments |
| — |
| — |
| — |
| (8) |
| (4) |
| (12) |
Disposals and write-off of fully amortised assets |
| — |
| (116) |
| (116) |
| — |
| (17) |
| (17) |
Impairment of intangible assets |
| 1 |
| 22 |
| 23 |
| — |
| — |
| — |
Amortisation charge for the year | | — | | 438 | | 438 | | — | | 341 | | 341 |
At 31 December |
| 4,410 |
| 2,513 |
| 6,923 |
| 4,409 |
| 2,169 |
| 6,578 |
Net book value at 31 December |
| 5,680 |
| 1,934 |
| 7,614 |
| 5,522 |
| 1,594 |
| 7,116 |
(1) | Principally consists of internally generated software. |
Intangible assets and goodwill are reviewed for indicators of impairment. Intangible assets were impaired by £23 million in 2023 (2022 – nil).
NatWest Group’s goodwill acquired in business combinations is reviewed for impairment annually at 31 December by cash-generating unit (CGU): 2023 - Retail Banking £2,607 million (2022 - £2,607 million), Ring-Fenced Bank Commercial & Institutional £2,605 million (2022 - £2,606 million), Private Banking £9 million (2022 - £9 million), RBS International £300 million (2022 - £300 million), and Cushon £159 million (2022 - nil). Our CGUs represent the smallest group of assets to which we have allocated goodwill and reflect the lowest level at which we monitor goodwill post acquisition. For Cushon and RBS International this is at an entity level which represents the lowest level applicable to the business combination and their cash flows are independent of other CGUs. Analysis by reportable segment is in Note 4 Segmental analysis.
Impairment testing involves the comparison of the carrying value of each CGU with its recoverable amount. The carrying values of the segments reflect the equity allocations made by management, which are consistent with NatWest Group’s capital targets.
Recoverable amount is the higher of fair value less costs of disposal and value in use. Fair value is the price that would be received to sell an asset in an orderly transaction between market participants. Value in use is the present value of expected future cash flows from the CGU.
The recoverable amounts for all CGUs at 31 December 2023 were based on value in use, using management's latest five-year revenue and cost forecasts. These are discounted cash flow projections over five years. The forecast is then extrapolated in perpetuity using a long-term growth rate to compute a terminal value, which comprises the majority of the value in use. The long-term growth rates have been based on expected growth of the CGUs (2022 and 2023 - 1.4%). The 2023 pre-tax risk discount rates are based on those observed to be applied to businesses regarded as peers of the CGUs: Retail Banking – 16% (2022 - 15.3%), Ring-Fenced Bank Commercial & Institutional – 16% (2022 - 15.3%), Private Banking – 16% (2022 - 15.3)%, Cushon – 15.3% (2022 – nil), RBS International – 14.6% (2022 – 14%).
| |
NatWest Group – Annual Report on Form 20-F 2023 | 113 |
Notes to the consolidated financial statements continued
18 Other assets
Other assets are not financial assets and reflect a grouping of assets that are not large enough to present separately on the balance sheet. |
| | | | |
|
| 2023 |
| 2022 |
| | £m | | £m |
Interests in associates (1) | | 668 | | 688 |
Property, plant and equipment (2) | | 4,227 | | 4,240 |
Pension schemes in net surplus (Note 5) | | 201 | | 318 |
Prepayments |
| 350 |
| 340 |
Accrued income |
| 292 |
| 327 |
Tax recoverable |
| 49 |
| 279 |
Deferred tax (Note 7) | | 1,894 | | 2,178 |
Acceptances | | 575 | | 237 |
Other |
| 504 |
| 569 |
Other assets |
| 8,760 |
| 9,176 |
(1) | Includes interest in Business Growth Fund £658 million (2022 - £677 million). |
(2) | The estimated useful lives of NatWest Group's property, plant and equipment are: freehold buildings and long leasehold 50 years, short leaseholds for unexpired period of lease, property adaptation costs 10 to 15 years, computer equipment up to 5 years and other equipment 4 to 15 years. |
19 Other financial liabilities
Other financial liabilities consist of customer deposits designated at fair value and debt securities in issue. For accounting policy information refer to Accounting policies 3.8 and 3.10. |
| | | | |
|
| 2023 |
| 2022 |
| | £m | | £m |
Customer deposits |
| |
| |
- designated as at fair value through profit or loss | | 1,280 | | 1,050 |
Debt securities in issue |
| |
|
|
- MRELs |
| 21,660 |
| 22,265 |
- Other medium term notes | | 17,843 | | 16,419 |
- Commercial paper and certificates of deposit | | 11,321 | | 5,672 |
- Covered bonds | | 2,122 | | 2,842 |
- Securitisation |
| 863 |
| 859 |
Total |
| 55,089 |
| 49,107 |
| |
NatWest Group – Annual Report on Form 20-F 2023 | 114 |
Notes to the consolidated financial statements continued
20 Subordinated liabilities
Subordinated liabilities are debt securities that, in the event of winding up or bankruptcy, rank below other liabilities for interest payments and repayment. For accounting policy information refer to Accounting policies 3.8 and 3.10. |
| | | | |
|
| 2023 |
| 2022 |
| | £m | | £m |
Dated loan capital |
| 5,573 |
| 5,968 |
Undated loan capital |
| 22 |
| 173 |
Preference shares |
| 119 |
| 119 |
|
| 5,714 |
| 6,260 |
Certain preference shares issued by the company are classified as liabilities; these securities remain subject to the capital maintenance rules of the Companies Act 2006.
| | | | | | | | | |
| | First call | Maturity | | Capital | | 2023 | | 2022 |
Dated loan capital | | date | date |
| treatment |
| £m |
| £m |
NatWest Group plc | | | |
|
|
|
|
|
|
$2,250 million | 5.125% notes | — | May-24 | | Tier 2 | | 418 | | 706 |
$2,000 million | 6.000% notes | — | Dec-23 | | Tier 2 | | — | | 536 |
£1,000 million | 3.622% notes | May-25 | Aug-30 | | Tier 2 | | 985 | | 964 |
£1,000 million | 2.105% notes | Aug-26 | Nov-31 | | Tier 2 | | 1,000 | | 1,001 |
$1,000 million | 6.100% notes | — | Jun-23 | | Tier 2 | | — | | 126 |
$850 million | 3.032% notes | Aug-30 | Nov-35 | | Tier 2 | | 541 | | 555 |
€750 million | 1.043% notes | Jun-27 | Sep-32 | | Tier 2 | | 652 | | 665 |
$750 million | 3.754% notes | Nov-24 | Nov-29 | | Tier 2 | | 592 | | 626 |
€700 million | 5.763% notes | Nov-28 | Feb-34 | | Tier 2 | | 636 | | |
£650 million | 7.416% notes | Mar-28 | Jun-33 |
| Tier 2 |
| 657 |
| 641 |
| | | |
|
|
| 5,481 |
| 5,820 |
| | | | | | | | | |
Other subsidiaries | | | | | | | | | |
€170 million | Floating rate notes | — | Feb-41 | | Not applicable | | 237 | | 223 |
$150 million | 7.125% notes | — | Oct-93 | | Not applicable | | 17 | | 18 |
€145.6 million | Floating rate notes | — | Apr-23 | | Tier 2 | | — | | 122 |
$136 million | 7.750% notes | — | May-23 | | Not applicable | | — | | 83 |
| | | | | |
| 5,735 |
| 6,266 |
Fair value hedging | | | | | | | (162) | | (298) |
| | | | | | | 5,573 | | 5,968 |
| | | | | | | | | |
Undated loan capital | | | |
|
|
|
|
|
|
| | | | | | | | | |
Other subsidiaries | | | | | | | | | |
£35 million | 11.500% notes | Dec-22 | — | | Not applicable | | — | | 72 |
£31 million | 7.380% notes | — | — | | Not applicable | | 1 | | 2 |
€31 million | 11.375% notes | — | — | | Tier 2 | | — | | 48 |
£16 million | 5.630% notes | Sep-26 | — | | Not applicable | | 18 | | 18 |
£11 million | 11.750% notes | — | — | | Tier 2 | | — | | 25 |
£4.9 million | 2.500% fixed notes | — | — | | Not applicable | | 3 | | 6 |
£1.1 million | SONIA + 2.827% notes | — | — | | Tier 2 | | — | | 2 |
| | | | | | | 22 | | 173 |
| | | | | | | | | |
Preference shares | | | | | | | | | |
Other subsidiaries | | | |
|
|
|
|
|
|
£140 million | Non-cumulative preference shares of £1 | — | — | | Not applicable | | 119 | | 119 |
| | | | | | | 119 | | 119 |
| | | | | | | | | |
Total | | | | | | | 5,714 | | 6,260 |
(1) | Notes redeemed before call date as tax and regulatory benefits discontinued. . |
| |
NatWest Group – Annual Report on Form 20-F 2023 | 115 |
Notes to the consolidated financial statements continued
21 Other liabilities
Other liabilities are amounts due to third parties that are not financial liabilities including lease liabilities, amounts due for goods and services that have been received but not invoiced, tax due to HMRC, and retirement benefit liabilities. Liabilities which have a level of uncertainty regarding their timing or the future cost to settle them are included in other liabilities as provisions for liabilities and charges. |
| | | | |
|
| 2023 |
| 2022 |
Other liabilities | | £m | | £m |
Lease liabilities | | 670 | | 1,118 |
Provisions for liabilities and charges | | 990 | | 1,138 |
Retirement benefit liabilities (Note 5) |
| 99 |
| 98 |
Accruals |
| 1,411 |
| 1,407 |
Deferred income |
| 402 |
| 355 |
Current tax |
| 332 |
| 55 |
Deferred tax (Note 7) | | 141 | | 227 |
Acceptances |
| 575 |
| 237 |
Other liabilities (1) | | 582 | | 711 |
Total |
| 5,202 |
| 5,346 |
(1) | Other liabilities include liabilities of disposal groups of £3 million (2022 - £15 million). Refer to Note 8 for further information. |
| | | | | | | | | | | | |
| | | | Litigation | | | | | | | | |
| | Customer | | and other | | | | Commitments | | | | |
| | redress | | regulatory | | Property | | and guarantees | | Other (1) | | Total |
Provisions for liabilities and charges |
| £m |
| £m |
| £m |
| £m |
| £m |
| £m |
At 1 January 2023 |
| 431 |
| 240 |
| 154 |
| 87 |
| 226 |
| 1,138 |
Expected credit loss impairment release | | — | | — | | — | | (9) | | — | | (9) |
Currency translation and other movements | | (5) | | (9) | | — | | — | | (6) | | (20) |
Charge to income statement | | 276 | | 21 | | 41 | | — | | 136 | | 474 |
Release to income statement |
| (36) |
| (33) |
| (64) |
| — |
| (28) |
| (161) |
Provisions utilised |
| (180) |
| (63) |
| (32) |
| — |
| (157) |
| (432) |
At 31 December 2023 |
| 486 |
| 156 |
| 99 |
| 78 |
| 171 |
| 990 |
(1) | Other materially comprises provisions relating to restructuring costs. |
Provisions are liabilities of uncertain timing or amount and are recognised when there is a present obligation as a result of a past event, the outflow of economic benefit is probable and the outflow can be estimated reliably. Any difference between the final outcome and the amounts provided will affect the reported results in the period when the matter is resolved.
For accounting policy information refer to Accounting policy 2.4.
Critical accounting policy: Provisions for liabilities
The key judgement is involved in determining whether a present obligation exists. There is often a high degree of uncertainty and judgement is based on the specific facts and circumstances relating to individual events in determining whether there is a present obligation. Judgement is also involved in estimation of the probability, timing and amount of any outflows. Where NatWest Group can look to another party such as an insurer to pay some or all of the expenditure required to settle a provision, any reimbursement is recognised when, and only when, it is virtually certain that it will be received.
Estimates - Provisions are liabilities of uncertain timing or amount and are recognised when there is a present obligation as a result of a past event, the outflow of economic benefit is probable and the outflow can be estimated reliably.
| |
NatWest Group – Annual Report on Form 20-F 2023 | 116 |
Notes to the consolidated financial statements continued
21 Other liabilities Continued
Any difference between the final outcome and the amounts provided will affect the reported results in the period when the matter is resolved.
| - | Customer redress: Provisions reflect the estimated cost of redress attributable to claims where it is determined that a present obligation exists. |
| - | Litigation and other regulatory: NatWest Group is engaged in various legal proceedings, both in the UK and in overseas jurisdictions, including the US. For further information in relation to legal proceedings and discussion of the associated uncertainties, refer to Note 26. |
| - | Property: This includes provision for contractual costs associated with vacant properties. |
| - | Other provisions: These materially comprise provisions for onerous contracts and restructuring costs. Onerous contract provisions comprise an estimate of the costs involved in fulfilling the terms and conditions of contracts net of any expected benefits to be received. This includes provision for contractual costs associated with vacant properties. Redundancy and restructuring provisions comprise the estimated cost of restructuring, including redundancy costs where an obligation exists. |
Background information for all material provisions is given in Note 26.
22 Share capital and other equity
Share capital consists of ordinary shares and preference shares and is measured as the number of shares allotted and fully paid, multiplied by the nominal value of a share. Other equity includes paid-in equity, merger reserve, capital redemption reserve and own shares held. For accounting policy information refer to Accounting policy 3.10. |
| | | | | | | | |
| | | | | | Number of shares | ||
| | 2023 | | 2022 | | 2023 | | 2022 |
Allotted, called up and fully paid |
| £m |
| £m |
| 000s |
| 000s |
Ordinary shares of £1.0769 (1) |
| 9,683 |
| 10,539 |
| 8,991,737 |
| 9,786,024 |
Cumulative preference shares of £1 |
| 0.5 |
| 0.5 |
| 483.0 |
| 483.0 |
| (1) | The nominal value of ordinary shares without rounding is £1.076923076923077 per share. |
| | | | |
| | | | Number of |
Movement in allotted, called up and fully paid ordinary shares |
| £m |
| shares 000s |
At 1 January 2022 |
| 11,468 |
| 11,467,982 |
Share cancellation |
| (929) |
| (929,188) |
Share consolidation | | — | | (752,770) |
At 31 December 2022 |
| 10,539 |
| 9,786,024 |
Share cancellation | | (856) | | (794,287) |
At 31 December 2023 |
| 9,683 |
| 8,991,737 |
Ordinary shares
There is no authorised share capital under the company’s constitution. At 31 December 2023, the directors had authority granted at the 2023 Annual General Meeting (AGM) to issue up to £520,573,270 nominal of ordinary shares other than by pre-emption to existing shareholders.
| |
NatWest Group – Annual Report on Form 20-F 2023 | 117 |
Notes to the consolidated financial statements continued
22 Share capital and other equity continued
On-market purchases
At the AGM in 2022, shareholders authorised the company to make market purchases of up to 1,122,905,024 ordinary shares. The authority was amended at the General Meeting held on 25 August 2022 to preserve the position as if the August 2022 share consolidation had not taken place.
The directors used the authority obtained at the 2022 AGM (2022 Authority) to carry out a share buyback programme (Programme) of up to £800 million, as announced to the market on 17 February 2023. The Programme's purpose is to reduce the ordinary share capital of NatWest Group. The maximum number of ordinary shares that could be purchased under the Programme was 966,284,391. This number reflects the impact on the 2022 Authority of the reduction in issued share capital following the off-market buyback announced on 28 March 2022.
The Programme commenced on 20 February 2023 and completed on 16 June 2023. The company purchased 301,380,053 ordinary shares (nominal value £324,563,134) at an average price of 265.4456 pence per ordinary share, for the total consideration of £799,999,997.76. All of the purchased ordinary shares were cancelled, representing 3.16% of the company's issued ordinary share capital. At the AGM in 2023, shareholders renewed the authority for the company to make market purchases of up to 966,778,930 ordinary shares.
The directors used the authority obtained at the 2023 AGM (2023 Authority) to carry out a Programme of up to £500 million, as announced to the market on 28 July 2023. The maximum number of ordinary shared that can be purchased under the Programme is 919,858,922. This number reflects the impact on the 2023 Authority of the reduction in issued share capital following the off-market buyback announced on 22 May 2023.
The Programme commenced on 31 July 2023 and will end no later than 14 March 2024. As at 31 December 2023 158,956,435 ordinary shares (nominal value £171,183,853) had been purchased by the company at an average price of 217.6375 pence per ordinary share for the total consideration of £345,948,738. All of the purchased ordinary shares were cancelled, representing 1.75% of the company's issued ordinary share capital.
Shareholders will be asked to renew the authority for the company to make market purchases of ordinary shares at the AGM in 2024.
Off-market purchases
At a General Meeting held on 6 February 2019, shareholders approved a special resolution authorising the company to make off-market purchases of up to 4.99% of its issued ordinary share capital in any 12-month period from HMT (or its nominee). Full details are set out in the Circular and Notice of General Meeting available at natwestgroup.com. Amendments to the Directed Buyback Contract were approved by the shareholders at a General Meeting on 25 August 2022. The authority for the company to make off-market purchases of its ordinary shares from HMT (or its nominee) under the terms of the Directed Buyback Contract was renewed at the AGM in 2023.
The company used the authority obtained at the 2023 AGM to make an off-market purchase of 469,200,081 ordinary shares (nominal value £505,292,395) in the company from HMT on 22 May 2023, at a price of 268.4 pence per ordinary share for the total consideration of £1,259,333,017, representing 4.95% of the company’s issued ordinary share capital. The company cancelled 336,200,081 of the purchased ordinary shares and transferred the remaining 133,000,000 ordinary shares to own shares held.
Shareholders will be asked to renew the authority for the company to make off-market purchases of its ordinary shares from HMT (or its nominee) at the AGM in 2024.
Dividends
In 2023 NatWest Group paid an interim dividend of £491 million, or 5.5 pence per ordinary share (2022 – £364 million, or 3.5 pence per ordinary share).
The company has announced that the directors have recommended a final dividend of £1.0 billion, or 11.5 pence per ordinary share (2022 – £1.0 billion, or 10.0 pence per ordinary share). The final dividend recommended by directors is subject to shareholders’ approval at the AGM on 23 April 2024. If approved, payment will be made on 29 April 2024 to shareholders on the register at the close of business on 15 March 2024. The ex-dividend date will be 14 March 2024.
Cumulative preference shares
At the AGM in 2023, shareholders renewed the authority for the company to make an off-market purchase of its preference shares. Shareholders will be asked to renew the authority at the AGM in 2024.
| |
NatWest Group – Annual Report on Form 20-F 2023 | 118 |
Notes to the consolidated financial statements continued
22 Share capital and other equity continued
Other equity
| | | | | | |
|
| 2023 |
| 2022 |
| 2021 |
| | £m | | £m | | £m |
Additional Tier 1 notes |
| | |
|
|
|
US$1.15 billion 8.000% notes callable August 2025 (1) | | 735 | | 735 | | 735 |
US$1.50 billion 6.000% notes callable December 2025 - June 2026 (2) |
| 1,220 | | 1,220 | | 1,220 |
GBP£1.00 billion 5.125% notes callable May - November 2027 (3) | | 998 | | 998 | | 998 |
GBP£0.40 billion – March 2028 callable (4) | | 399 | | 399 | | 399 |
US$0.75 billion – June 2031 callable (5) |
| 538 | | 538 | | 538 |
| | 3,890 | | 3,890 | | 3,890 |
(1) | Issued in August 2015. In the event of conversion, converted into ordinary shares at a price of $3.314 per share. |
(2) | Issued in June 2020. In the event of conversion, converted into ordinary shares at a price of $2.191 (translated at applicable exchange rate) per share. |
(3) | Issued in November 2020. In the event of conversion, converted into ordinary shares at a price of £1.764 per share. |
(4) | Issued in March 2021. In the event of conversion, converted into ordinary shares at a price of £1.764 per share. |
(5) | Issued in June 2021. In the event of conversion, converted into ordinary shares at a price of $2.462 (translated at applicable exchange rate) per share. |
Paid-in equity - comprises equity instruments issued by the company other than those legally constituted as shares.
Additional Tier 1 instruments issued by NatWest Group plc having the legal form of debt are classified as equity under IFRS. The coupons on these instruments are non-cumulative and payable at the company’s discretion. In the event NatWest Group’s CET1 ratio falls below 7% any outstanding instruments will be converted into ordinary shares at a fixed price.
Capital recognised for regulatory purposes cannot be redeemed without Prudential Regulation Authority consent. This includes ordinary shares, preference shares and additional Tier 1 instruments.
Merger reserve - the merger reserve comprises the premium on shares issued to acquire NatWest Bank Plc less goodwill amortisation charged under previous GAAP.
Capital redemption reserve - under UK companies legislation, when shares are redeemed or purchased wholly or partly out of the company’s profits, the amount by which the company’s issued share capital is diminished must be transferred to the capital redemption reserve. The capital maintenance provisions of UK companies legislation apply to the capital redemption reserve as if it were part of the company’s paid up share capital. The nominal value of the shares bought back from HMT in March 2023 and via the Programme during 2023 have been transferred to the Capital redemption reserve.
Own shares held - at 31 December 2023, 12 million ordinary shares of £1.0769 each of the company (2022 –13 million) were held by employee share trusts in respect of share awards and options granted to employees. During 2023, the employee share trusts purchased no ordinary shares and delivered 1 million ordinary shares in satisfaction of the exercise of options and the vesting of share awards under the employee share plans. The company retains the flexibility to use newly issued shares, shares purchased by the NatWest Group Employee Share Ownership Trust and any available treasury shares to satisfy obligations under its employee share plans. The company does not use performance conditions or targets based on earnings per share (EPS), total shareholder return (TSR), and net asset value (NAV) in connection with its employee share plans.
As part of the shares bought back from HMT in March 2021 and May 2023, the company transferred 200 million ordinary shares and 133 million ordinary shares, respectively, to own shares held. The company has used a total of 146 million treasury shares to satisfy the exercise of options and the vesting of share awards under the employee share plans. The balance of ordinary shares held in treasury as at 31 December 2023 was 187 million.
NatWest Group plc optimises capital efficiency by maintaining reserves in subsidiaries, including regulated entities. Certain preference shares and subordinated debt are also included within regulatory capital. The remittance of reserves to the company or the redemption of shares or subordinated capital by regulated entities may be subject to maintaining the capital resources required by the relevant regulator.
UK law prescribes that only the reserves of the company are taken into account for the purpose of making distributions and in determining permissible applications of the share premium account.
| |
NatWest Group – Annual Report on Form 20-F 2023 | 119 |
Notes to the consolidated financial statements continued
23 Structured entities
A structured entity (SE) is an entity that has been designed such that voting or similar rights are not the dominant factor in deciding who controls the entity, for example when any voting rights relate to administrative tasks only and the relevant activities are directed by means of contractual arrangements. SEs are usually established for a specific, limited purpose. They do not carry out a business or trade and typically have no employees. |
Securitisations
In a securitisation, assets, or interests in a pool of assets, are transferred, or the credit risk is transferred via a derivative or financial guarantee to a SE which then issues liabilities to third party investors.
NatWest Group’s involvement in client securitisations takes a number of forms. It may provide secured finance to, or purchase asset-backed notes from, client sponsored SEs secured on assets transferred by the client entity; purchase asset backed securities issued by client sponsored SEs in the primary or secondary markets; or provide liquidity facilities to client sponsored SEs. In addition, NatWest Group arranges or acts as lead manager or placement agent in client primary markets securitisations. NatWest Group provides portfolio structured derivative hedging solutions to clients. NatWest Group undertakes own-asset securitisations to transfer the credit risk on portfolios of financial assets.
Other credit risk transfer securitisations
NatWest Group transfers credit risk on originated loans and mortgages without the transfer of assets to a SE. As part of this, NatWest Group enters into credit derivative and financial guarantee contracts with consolidated SEs. At 31 December 2023, debt securities in issue by such SEs (and held by third parties) were £863 million (2022 – £859 million). The associated loans and mortgages at 31 December 2023 were £2,687 million (2022 - £4,361 million).
At 31 December, ECL in relation to non-defaulted assets was reduced by £11 million (2022 - £20 million) as a result of financial guarantee contracts with consolidated SEs.
Covered debt programme
Group companies have assigned loans to customers and debt investments to bankruptcy remote limited liability partnerships to provide security for issues of debt securities. NatWest Group retains all of the risks and rewards of these assets and continues to recognise them. The partnerships are consolidated by NatWest Group and the related covered bonds included within other financial liabilities. At 31 December 2023, £11,067 million (2022 - £8,156 million) of loans to customers provided security for debt securities in issue and other borrowing of £3,619 million (2022 - £4,132 million).
Lending of own issued securities
NatWest Group has issued, retained, and lent debt securities under securities lending arrangements. Under standard terms in the UK and US markets, the recipient has an unrestricted right to sell or repledge collateral, subject to returning equivalent securities on maturity of the transaction. NatWest Group retains all of the risks and rewards of own issued liabilities lent under such arrangements and does not recognise them. At 31 December 2023, £2,312 million (2022 - £2,419 million) of secured own issued liabilities have been retained and lent under securities lending arrangements. At 31 December 2023, £2,414 million (2022 - £2,244 million) of loans and other debt instruments provided security for secured own issued liabilities that have been retained and lent under securities lending arrangements.
| |
NatWest Group – Annual Report on Form 20-F 2023 | 120 |
Notes to the consolidated financial statements continued
23 Structured entities continued
Unconsolidated structured entities
The term 'unconsolidated structured entities' refers to structured entities not controlled by NatWest Group, and which are established either by NatWest Group or a third party. An interest in a structured entity is any form of contractual or non-contractual involvement which creates variability in returns for NatWest Group arising from the performance of the entity. Such interests include holdings of debt or equity securities, derivatives that transfer financial risks from the entity to NatWest Group, provision of lending and loan commitments, financial guarantees and investment management agreements. NatWest Group enters into transactions with unconsolidated structured entities in the normal course of business to facilitate customer transactions, to provide risk management services and for specific investment opportunities. Structured entities may take the form of funds, trusts, partnerships, securitisation vehicles, and private investment companies. NatWest Group considers itself to be the sponsor of a structured entity where it is primarily involved in the set up and design of the entity and where NatWest Group transfers assets to the entity, markets products associated with the entity in its own name, and/or provides guarantees in relation to the performance of the entity.
The nature and extent of NatWest Group's interests in structured entities is summarised in the following table.
| | | | | | | | | | | | |
| | 2023 | | 2022 | ||||||||
| | Asset-backed | | Investment | | | | Asset-backed | | Investment | | |
| | securitisation | | funds and | | | | securitisation | | funds and | | |
| | vehicles | | other | | Total | | vehicles | | other | | Total |
|
| £m |
| £m |
| £m |
| £m |
| £m |
| £m |
Assets |
| | | | | | | | | | | |
Trading assets |
| 303 |
| 311 |
| 614 |
| 616 |
| 137 |
| 753 |
Derivatives |
| 134 |
| — |
| 134 |
| 343 |
| — |
| 343 |
Loans to customers |
| 2,701 |
| 999 |
| 3,700 |
| 2,431 |
| 648 |
| 3,079 |
Other financial assets | | 13,096 | | 1,062 | | 14,158 | | 6,334 | | 849 | | 7,183 |
Total |
| 16,234 |
| 2,372 |
| 18,606 |
| 9,724 |
| 1,634 |
| 11,358 |
|
| |
| |
| |
| |
| |
| |
Liabilities |
| | | | | |
| |
| |
| |
Derivatives |
| 213 |
| 17 |
| 230 |
| 388 |
| 22 |
| 410 |
Total |
| 213 |
| 17 |
| 230 |
| 388 |
| 22 |
| 410 |
|
| |
| |
| |
| |
| |
| |
Off balance sheet |
| | | | | |
| |
| |
| |
Liquidity facilities/loan commitments |
| 1,873 |
| 396 |
| 2,269 |
| 1,723 |
| 320 |
| 2,043 |
Guarantees |
| — |
| 127 |
| 127 |
| — |
| 107 |
| 107 |
Total | | 1,873 | | 523 | | 2,396 | | 1,723 | | 427 | | 2,150 |
| | | | | | | | | | | | |
Maximum exposure |
| 17,894 |
| 2,878 |
| 20,772 |
| 11,059 |
| 2,039 |
| 13,098 |
| |
NatWest Group – Annual Report on Form 20-F 2023 | 121 |
Notes to the consolidated financial statements continued
24 Asset transfers
This note provides an overview of assets that have been transferred but where the NatWest Group retains substantially all the risks and rewards of the transferred assets and therefore continues to recognize them on balance sheet. |
Transfers that do not qualify for derecognition
NatWest Group enters into securities repurchase, lending and total return transactions in accordance with normal market practice which includes the provision of additional collateral if necessary. Under standard terms in the UK and US markets, the recipient has an unrestricted right to sell or repledge collateral, subject to returning equivalent securities on settlement of the transaction.
Securities sold under repurchase transactions and transactions with the substance of securities repurchase agreements are not derecognised if NatWest Group retains substantially all the risks and rewards of ownership. The fair value (and carrying value) of securities transferred under such transactions included on the balance sheet, are set out below. All of these securities could be sold or repledged by the holder.
| | | | |
|
| 2023 |
| 2022 |
The following assets have failed derecognition (1) | | £m | | £m |
Trading assets | | 7,907 | | 6,668 |
Loans to bank - amortised cost | | 10 | | 16 |
Loans to customers - amortised cost | | 281 | | 398 |
Other financial assets | | 8,764 | | 2,901 |
Total |
| 16,962 |
| 9,983 |
(1) | Associated liabilities were £16,522 million (2022 - £9,501 million). |
Assets pledged as collateral
NatWest Group pledges collateral with its counterparties in respect of derivative liabilities, bank and stock borrowings and other transactions.
| | | | �� |
| | 2023 | | 2022 |
Assets pledged against liabilities |
| £m |
| £m |
Trading assets | | 10,976 | | 15,062 |
Loans to banks - amortised cost |
| 63 |
| 66 |
Loans to customers - amortised cost |
| 21,611 |
| 17,493 |
Other financial assets (1) |
| 6,506 |
| 3,351 |
Total |
| 39,156 |
| 35,972 |
(1) | Includes assets pledged for pension derivatives and £482 million of debt securities under the continuing control of NWB Plc. This follows the agreement between NWB Plc and the Group Pension Fund to establish a bankruptcy remote reservoir trust to hold these assets. Refer to Note 5 for additional information. |
As part of the covered debt programme £11,067 million of loans to customers and other debt instruments (2022 – £8,156 million) have been transferred to bankruptcy remote limited liability partnerships within the NatWest Group to provide collateral for issues of debt securities and other borrowing by the NatWest Group of £3,619 million (2022 – £4,132 million). Refer to Note 23.
| |
NatWest Group – Annual Report on Form 20-F 2023 | 122 |
Notes to the consolidated financial statements continued
25 Capital resources
NatWest Group’s regulatory capital is assessed against minimum requirements that are set out under the UK Capital Requirements Regulation to determine the strength of its capital base. This note shows a reconciliation of shareholders’ equity to regulatory capital. |
| | | | |
|
| 2023 |
| 2022 |
| | £m | | £m |
Shareholders’ equity (excluding non-controlling interests) |
|
|
|
|
Shareholders’ equity |
| 37,157 |
| 36,488 |
Other equity instruments |
| (3,890) |
| (3,890) |
|
| 33,267 |
| 32,598 |
Regulatory adjustments and deductions |
| |
| |
Own credit |
| (10) |
| (58) |
Defined benefit pension fund adjustment |
| (143) |
| (227) |
Cash flow hedging reserve |
| 1,899 |
| 2,771 |
Deferred tax assets |
| (979) |
| (912) |
Prudential valuation adjustments |
| (279) |
| (275) |
Goodwill and other intangible assets |
| (7,614) |
| (7,116) |
Foreseeable ordinary dividends | | (1,013) | | (967) |
Adjustment for trust assets (1) | | (365) | | (365) |
Foreseeable charges | | (525) | | (800) |
Adjustment under IFRS 9 transitional arrangements |
| 202 |
| 361 |
Insufficient coverage for non-performing exposures | | — | | (18) |
|
| (8,827) |
| (7,606) |
|
| |
| |
CET1 capital |
| 24,440 |
| 24,992 |
Additional Tier 1 (AT1) capital |
| |
| |
Qualifying instruments and related share premium |
| 3,875 |
| 3,875 |
AT1 capital |
| 3,875 |
| 3,875 |
Tier 1 capital |
| 28,315 |
| 28,867 |
Qualifying Tier 2 capital |
| |
| |
Qualifying instruments and related share premium |
| 5,189 |
| 4,953 |
Qualifying instruments issued by subsidiaries and held by third parties |
| — |
| 82 |
Other regulatory adjustments | | 128 | | 18 |
Tier 2 capital |
| 5,317 |
| 5,053 |
Total regulatory capital |
| 33,632 |
| 33,920 |
(1)Prudent deduction in respect of agreement with the pension fund to establish legal structure to remove dividend linked contribution. Refer Notes 5 and 33.
It is NatWest Group policy to maintain a strong capital base, to expand it as appropriate and to utilise it efficiently throughout its activities to optimise the return to shareholders while maintaining a prudent relationship between the capital base and the underlying risks of the business. In carrying out this policy, NatWest Group has regard to the supervisory requirements of the PRA. The PRA uses capital ratios as a measure of capital adequacy in the UK banking sector, comparing a bank’s capital resources with its risk-weighted assets (the assets and off-balance sheet exposures are weighted to reflect the inherent credit and other risks); by international agreement, the Pillar 1 capital ratios should be not less than 8% with a Common Equity Tier 1 component of not less than 4.5%. NatWest Group has complied with the PRA’s capital requirements throughout the year.
A number of subsidiaries and sub-groups within NatWest Group, principally banking entities, are subject to various individual regulatory capital requirements in the UK and overseas. Furthermore, the payment of dividends by subsidiaries and the ability of members of NatWest Group to lend money to other members of NatWest Group may be subject to restrictions such as local regulatory or legal requirements, the availability of reserves and financial and operating performance.
| |
NatWest Group – Annual Report on Form 20-F 2023 | 123 |
Notes to the consolidated financial statements continued
26 Memorandum items
Contingent liabilities and commitments
NatWest Group provides its customers with a variety of services to support their businesses, such as guarantees. These are reported as commitments. Contingent liabilities are possible obligations dependent on a future event or present obligations which are either not probable or cannot be measured reliably. For accounting policy information refer to Accounting policy 2.4. |
The amounts shown in the table below are intended only to provide an indication of the volume of business outstanding at 31 December 2023. Although NatWest Group is exposed to credit risk in the event of a customer’s failure to meet its obligations, the amounts shown do not, and are not intended to, provide any indication of NatWest Group’s expectation of future losses.
| | | | |
|
| 2023 |
| 2022 |
| | £m | | £m |
Contingent liabilities and commitments | | | | |
Guarantees |
| 2,810 |
| 3,150 |
Other contingent liabilities |
| 1,380 |
| 1,855 |
Standby facilities, credit lines and other commitments |
| 115,441 |
| 121,576 |
Total |
| 119,631 |
| 126,581 |
Banking commitments and contingent obligations, which have been entered into on behalf of customers and for which there are corresponding obligations from customers, are not included in assets and liabilities. NatWest Group’s maximum exposure to credit loss, in the event of its obligation crystallising and all counterclaims, collateral or security proving valueless, is represented by the contractual nominal amount of these instruments included in the table above. These commitments and contingent obligations are subject to NatWest Group’s normal credit approval processes.
Guarantees – NatWest Group gives guarantees on behalf of customers. A financial guarantee represents an irrevocable undertaking that NatWest Group will meet a customer’s specified obligations to a third party if the customer fails to do so. The maximum amount that NatWest Group could be required to pay under a guarantee is its principal amount as disclosed in the table above. NatWest Group expects most guarantees it provides to expire unused.
Other contingent liabilities - these include standby letters of credit, supporting customer debt issues and contingent liabilities relating to customer trading activities such as those arising from performance and customs bonds, warranties and indemnities.
Standby facilities and credit lines - under a loan commitment, NatWest Group agrees to make funds available to a customer in the future. Loan commitments, which are usually for a specified term, may be unconditionally cancellable or may persist, provided all conditions in the loan facility are satisfied or waived. Commitments to lend include commercial standby facilities and credit lines, liquidity facilities to commercial paper conduits and unutilised overdraft facilities.
Other commitments - these include documentary credits, which are commercial letters of credit providing for payment by NatWest Group to a named beneficiary against presentation of specified documents, forward asset purchases, forward deposits placed and undrawn note issuance and revolving underwriting facilities, and other short-term trade related transactions.
Contractual obligations for future expenditure not provided for in the accounts
The following table shows contractual obligations for future expenditure not provided for in the accounts at the year end.
| | | | |
| | 2023 | | 2022 |
|
| £m |
| £m |
Capital expenditure on property, plant and equipment |
| 38 | | 8 |
Contracts to purchase goods or services (1) |
| 1,121 | | 677 |
|
| 1,159 | | 685 |
(1) | Of which due within 1 year: £379 million (2022 - £321 million). |
| |
NatWest Group – Annual Report on Form 20-F 2023 | 124 |
Notes to the consolidated financial statements continued
26 Memorandum items continued
Trustee and other fiduciary activities
In its capacity as trustee or other fiduciary role, NatWest Group may hold or place assets on behalf of individuals, trusts, companies, pension schemes and others. The assets and their income are not included in NatWest Group’s financial statements. NatWest Group earned fee income of £264 million (2022 - £266 million; 2021 - £280 million) from these activities.
The Financial Services Compensation Scheme
The Financial Services Compensation Scheme (FSCS), the UK’s statutory fund of last resort for customers of authorised financial services firms, pays compensation if a firm is unable to meet its obligations. The FSCS funds compensation for customers by raising management expenses levies and compensation levies on the industry. In relation to protected deposits, each deposit-taking institution contributes towards these levies in proportion to their share of total protected deposits on 31 December of the year preceding the scheme year (which runs from 1 April to 31 March), subject to annual maxima set by the Prudential Regulation Authority. In addition, the FSCS has the power to raise levies on a firm that has ceased to participate in the scheme and is in the process of ceasing to be authorised for the costs that it would have been liable to pay had the FSCS made a levy in the financial year it ceased to be a participant in the scheme.
Litigation and regulatory matters
NatWest Group plc and certain members of NatWest Group are party to various legal proceedings and are involved in, or subject to, various regulatory matters, including as the subject of investigations and other regulatory and governmental action (Matters) in the United Kingdom (UK), the United States (US), the European Union (EU) and other jurisdictions.
NatWest Group recognises a provision for a liability in relation to these Matters when it is probable that an outflow of economic benefits will be required to settle an obligation resulting from past events, and a reliable estimate can be made of the amount of the obligation.
In many of the Matters, it is not possible to determine whether any loss is probable, or to estimate reliably the amount of any loss, either as a direct consequence of the relevant proceedings and regulatory matters or as a result of adverse impacts or restrictions on NatWest Group’s reputation, businesses and operations. Numerous legal and factual issues may need to be resolved, including through potentially lengthy discovery and document production exercises and determination of important factual matters, and by addressing novel or unsettled legal questions relevant to the proceedings in question, before the probability of a liability, if any, arising can reasonably be estimated in respect of any Matter. NatWest Group cannot predict if, how, or when such claims will be resolved or what the eventual settlement, damages, fine, penalty or other relief, if any, may be, particularly for Matters that are at an early stage in their development or where claimants seek substantial or indeterminate damages.
There are situations where NatWest Group may pursue an approach that in some instances leads to a settlement agreement. This may occur in order to avoid the expense, management distraction or reputational implications of continuing to contest liability, or in order to take account of the risks inherent in defending or contesting Matters, even for those for which NatWest Group believes it has credible defences and should prevail on the merits. The uncertainties inherent in all Matters affect the amount and timing of any potential economic outflows for both Matters with respect to which provisions have been established and other contingent liabilities in respect of any such Matter.
It is not practicable to provide an aggregate estimate of potential liability for our Matters as a class of contingent liabilities.
The future economic outflow in respect of any Matter may ultimately prove to be substantially greater than, or less than, the aggregate provision, if any, that NatWest Group has recognised in respect of such Matter. Where a reliable estimate of the economic outflow cannot be reasonably made, no provision has been recognised. NatWest Group expects that in future periods, additional provisions and economic outflows relating to Matters that may or may not be currently known by NatWest Group will be necessary, in amounts that are expected to be substantial in some instances. Refer to Note 21 for information on material provisions.
Matters which are, or could be, material, either individually or in aggregate, having regard to NatWest Group, considered as a whole, in which NatWest Group is currently involved are set out below. We have provided information on the procedural history of certain Matters, where we believe appropriate, to aid the understanding of the Matter.
For a discussion of certain risks associated with NatWest Group’s litigation and regulatory matters (including the Matters), refer to the Risk Factor relating to legal, regulatory and governmental actions and investigations set out on pages 160 to 184.
| |
NatWest Group – Annual Report on Form 20-F 2023 | 125 |
Notes to the consolidated financial statements continued
26 Litigation and regulatory matters continued
Litigation
London Interbank Offered Rate (LIBOR) and other rates litigation
NWM Plc and certain other members of NatWest Group, including NatWest Group plc, are defendants in a number of class actions and individual claims pending in the United States District Court for the Southern District of New York (SDNY) with respect to the setting of LIBOR and certain other benchmark interest rates. The complainants allege that certain members of NatWest Group and other panel banks violated various federal laws, including the US commodities and antitrust laws, and state statutory and common law, as well as contracts, by manipulating LIBOR and prices of LIBOR-based derivatives in various markets through various means.
Several purported class actions relating to USD LIBOR, as well as more than two dozen non-class actions concerning USD LIBOR and involving NatWest Group companies, are part of a co-ordinated proceeding in the SDNY. The class actions include claims on behalf of persons who purchased LIBOR-linked instruments from defendants, bonds issued by defendants, persons who transacted futures and options on exchanges, and lenders who made LIBOR-based loans. The coordinated proceeding is currently in the discovery phase. NatWest Group companies’ previously disclosed settlement of a class action on behalf of bondholder plaintiffs has received final court approval. The amount of the settlement was covered by an existing provision.
The non-class claims filed in the SDNY include claims that the FDIC is asserting on behalf of certain failed US banks. In July 2017, the FDIC, on behalf of 39 of those failed US banks, commenced substantially similar claims against NatWest Group companies and others in the High Court of Justice of England and Wales. The action alleges collusion with regard to the setting of USD LIBOR and that the defendants breached UK and European competition law, as well as asserting common law claims of fraud under US law. The defendant banks consented to a request by the FDIC for discontinuance of the claim in respect of 20 failed US banks, leaving 19 failed US banks as claimants. The trial is currently anticipated to commence in Q1 2026.
In addition to the USD LIBOR cases described above, there is a class action relating to derivatives allegedly tied to JPY LIBOR and Euroyen TIBOR, which was dismissed by the SDNY in relation to NWM Plc and other NatWest Group companies in September 2021. That dismissal may be the subject of a future appeal. The SDNY’s dismissal of another class action, which related to Euroyen TIBOR futures contracts, was affirmed by the United States Court of Appeals for the Second Circuit (US Court of Appeals) in October 2022. The plaintiffs filed a petition with the United States Supreme Court seeking review of the dismissal, but that petition was denied in October 2023.
Two other IBOR-related class actions involving NWM Plc, concerning alleged manipulation of Euribor and Pound Sterling LIBOR, were previously dismissed by the SDNY for various reasons. The plaintiffs’ appeals in those two cases remain pending.
Litigation and regulatory matters continued
NWM Plc’s previously disclosed settlement of a class action relating to Swiss Franc LIBOR has received final court approval. The settlement amount has been paid by NWM Plc and was covered in full by an existing provision.
In August 2020, a complaint was filed in the United States District Court for the Northern District of California by several United States retail borrowers against the USD ICE LIBOR panel banks and their affiliates (including NatWest Group plc, NWM Plc, NWMSI and NWB Plc), alleging (i) that the very process of setting USD ICE LIBOR amounts to illegal price-fixing; and (ii) that banks in the United States have illegally agreed to use LIBOR as a component of price in variable retail loans. In September 2022, the district court dismissed the complaint. The plaintiffs filed an amended complaint but in October 2023, the district court dismissed that complaint as well, and indicated that further amendment would not be permitted. The plaintiffs have commenced an appeal to the United States Court of Appeals for the Ninth Circuit which is currently pending.
NWM Plc is also named as a defendant in a motion to certify a class action relating to LIBOR in the Tel Aviv District Court in Israel. NWM Plc filed a motion for cancellation of service outside the jurisdiction, which was granted in July 2020. The claimants appealed that decision and in November 2020 the appeal was refused and the claim dismissed by the Appellate Court. The claim could in future be recommenced depending on the outcome of an appeal to Israel’s Supreme Court in respect of the dismissal of the substantive case against banks that had a presence in Israel.
| |
NatWest Group – Annual Report on Form 20-F 2023 | 126 |
Notes to the consolidated financial statements continued
26 Memorandum items continued
Foreign exchange litigation
NWM Plc, NWMSI and/or NatWest Group plc are defendants in several cases relating to NWM Plc's foreign exchange (FX) business.
An FX-related class action, on behalf of ‘consumers and end-user businesses’, was proceeding in the SDNY against NWM Plc and others. In March 2023, the court granted summary judgment in favour of the defendants, dismissing the plaintiffs’ claims. The plaintiffs have commenced an appeal of that decision as well as a prior decision denying class certification in the case.
In May 2019, a cartel class action was filed in the Federal Court of Australia against NWM Plc and four other banks on behalf of persons who bought or sold currency through FX spots or forwards between 1 January 2008 and 15 October 2013 with a total transaction value exceeding AUD $0.5 million. The claimant has alleged that the banks, including NWM Plc, contravened Australian competition law by sharing information, coordinating conduct, widening spreads and manipulating FX rates for certain currency pairs during this period. NatWest Group plc and NWMSI have been named in the action as 'other cartel participants', but are not respondents. The claim was served in June 2019 and NWM Plc filed its defence in March 2022.
In July and December 2019, two separate applications seeking opt-out collective proceedings orders were filed in the UK Competition Appeal Tribunal (CAT) against NatWest Group plc, NWM Plc and other banks. Both applications were brought on behalf of persons who, between 18 December 2007 and 31 January 2013, entered into a relevant FX spot or outright forward transaction in the EEA with a relevant financial institution or on an electronic communications network. In March 2022, the CAT declined to certify as collective proceedings either of the applications, which was appealed by the applicants, and the subject of an application for judicial review. In its amended judgment in November 2023, the Court of Appeal allowed the appeal and decided that the claims should proceed on an opt-out basis. Separately, the court determined which of the two competing applicants can proceed as class representative, and dismissed the application for judicial review of the CAT’s decision. The case has been remitted to the CAT for further case management and the banks have sought permission to appeal directly to the UK Supreme Court.
Two motions to certify FX-related class actions were filed in the Tel Aviv District Court in Israel in September and October 2018, and were subsequently consolidated into one motion. The consolidated motion to certify, which names The Royal Bank of Scotland plc (now NWM Plc) and several other banks as defendants, was served on NWM Plc in May 2020. The applicants have sought the court’s permission to amend their motions to certify the class actions. NWM Plc has filed a motion challenging the permission granted by the court for the applicants to serve the consolidated motion outside the Israeli jurisdiction. That NWM Plc motion remains pending.
In December 2021, a summons was served in the Netherlands against NatWest Group plc, NWM Plc and NWM N.V. by Stichting FX Claims on behalf of a number of parties, seeking declarations from the court concerning liability for anti-competitive FX market conduct described in decisions of the European Commission (EC) of 16 May 2019, along with unspecified damages. The claimant amended its claim to also refer to a 2 December 2021 decision by the EC, which described anti-competitive FX market conduct. NatWest Group plc, NWM Plc and other defendants contested the jurisdiction of the Dutch court. In March 2023, the district court in Amsterdam accepted that it has jurisdiction to hear claims against NWM N.V. but refused jurisdiction to hear any claims against the other defendant banks (including NatWest Group plc and NWM Plc) brought on behalf of the parties represented by the claimant that are domiciled outside of the Netherlands. The claimant is appealing that decision and the defendant banks have brought cross-appeals which seek a ruling that the Dutch court has no jurisdiction to hear any claims against the defendant banks domiciled outside of the Netherlands, including claims brought on behalf of the parties represented by the claimant that are domiciled in the Netherlands.
In September 2023, second summonses were served by Stichting FX Claims on NWM N.V., NatWest Group plc and NWM Plc, for claims on behalf of a new group of parties that have now been brought before the district court in Amsterdam. The summonses seek declarations from the Dutch court concerning liability for anti-competitive FX market conduct described in the above referenced decisions of the EC of 16 May 2019 and 2 December 2021, along with unspecified damages.
Certain other foreign exchange transaction related claims have been or may be threatened. NatWest Group cannot predict whether all or any of these claims will be pursued.
Government securities antitrust litigation
NWMSI and certain other US broker-dealers are defendants in a consolidated antitrust class action in the SDNY on behalf of persons who transacted in US Treasury securities or derivatives based on such instruments, including futures and options. The plaintiffs allege that the defendants rigged the US Treasury securities auction bidding process to deflate prices at which they bought such securities and colluded to increase the prices at which they sold such securities to the plaintiffs. In March 2022, the SDNY dismissed the complaint, without leave to re-plead. In February 2024, the US Court of Appeals affirmed the SDNY’s decision dismissing the complaint.
Class action antitrust claims commenced in March 2019 are pending in the SDNY against NWM Plc, NWMSI and other banks in respect of Euro-denominated bonds issued by various European central banks (European government bonds or EGBs). The complaint alleges a conspiracy among dealers of EGBs to widen the bid-ask spreads they quoted to customers, thereby increasing the prices customers paid for the EGBs or decreasing the prices at which customers sold EGBs. The class consists of those who purchased or sold EGBs in the US between 2007 and 2012. Previously, in March 2022, the SDNY dismissed the claims against NWM Plc and NWMSI on the ground that the complaint’s conspiracy allegations were insufficient. However, in September 2023, the SDNY ruled that new allegations which plaintiffs have included in an amended complaint are sufficient to bring those NatWest entities back into the case as defendants.
| |
NatWest Group – Annual Report on Form 20-F 2023 | 127 |
Notes to the consolidated financial statements continued
26 Memorandum items continued
Swaps antitrust litigation
NWM Plc and other members of NatWest Group, including NatWest Group plc, as well as a number of other interest rate swap dealers, are defendants in several cases pending in the SDNY alleging violations of the US antitrust laws in the market for interest rate swaps. There is a consolidated class action complaint on behalf of persons who entered into interest rate swaps with the defendants, as well as non-class action claims by three swap execution facilities (TeraExchange, Javelin, and trueEx). The plaintiffs allege that the swap execution facilities would have successfully established exchange-like trading of interest rate swaps if the defendants had not unlawfully conspired to prevent that from happening through boycotts and other means. Discovery in these cases is complete. In December 2023, the SDNY denied the plaintiffs’ motion for class certification. The plaintiffs have filed a petition requesting that the US Court of Appeals review the denial of class certification.
In June 2021, a class action antitrust complaint was filed against a number of credit default swap dealers, in New Mexico federal court on behalf of persons who, from 2005 onwards, settled credit default swaps in the United States by reference to the ISDA credit default swap auction protocol. The complaint alleges that the defendants conspired to manipulate that benchmark through various means in violation of the antitrust laws and the Commodity Exchange Act. The defendants filed a motion to dismiss the complaint and, in June 2023, such motion was denied as regards NWMSI and other financial institutions, but granted as regards to NWM Plc on the ground that the court lacks jurisdiction over that entity. As a result, the case entered the discovery phase as against the non-dismissed defendants. In January 2024, the SDNY issued an order barring the plaintiffs in the New Mexico case from pursuing claims based on conduct occurring before 30 June 2014 on the ground that such claims were extinguished by a 2015 settlement agreement that resolved a prior class action relating to credit default swaps.
Odd lot corporate bond trading antitrust litigation
In October 2021, the SDNY granted the defendants’ motion to dismiss the class action antitrust complaint alleging that from August 2006 onwards various securities dealers, including NWMSI, conspired artificially to widen spreads for odd lots of corporate bonds bought or sold in the United States secondary market and to boycott electronic trading platforms that would have allegedly promoted pricing competition in the market for such bonds. The plaintiffs have filed an appeal.
Spoofing litigation
In December 2021, three substantially similar class actions complaints were filed in federal court in the United States against NWM Plc and NWMSI alleging Commodity Exchange Act and common law unjust enrichment claims arising from manipulative trading known as spoofing. The complaints refer to NWM Plc’s December 2021 spoofing-related guilty plea (described below under “US investigations relating to fixed-income securities”) and purport to assert claims on behalf of those who transacted in US Treasury securities and futures and options on US Treasury securities between 2008 and 2018. In July 2022, defendants filed a motion to dismiss these claims, which have been consolidated into one matter in the United States District Court for the Northern District of Illinois.
Madoff
NWM N.V. was named as a defendant in two actions filed by the trustee for the bankrupt estates of Bernard L. Madoff and Bernard L. Madoff Investment Securities LLC, in bankruptcy court in New York, which together seek to clawback more than US$298 million that NWM N.V. allegedly received from certain Madoff feeder funds and certain swap counterparties. The claims were previously dismissed, but as a result of an August 2021 decision by the US Court of Appeals, they will now proceed in the bankruptcy court, where they have been consolidated into one action, subject to NWM N.V.’s legal and factual defences. In May 2022, NWM N.V. filed a motion to dismiss the amended complaint in the consolidated action and such motion was denied in March 2023. As a result, the case has now entered the discovery phase.
EUA trading litigation
NWM Plc was a named defendant in civil proceedings before the High Court of Justice of England and Wales brought in 2015 by ten companies (all in liquidation) (the 'Liquidated Companies') and their respective liquidators (together, 'the Claimants'). The Liquidated Companies previously traded in European Union Allowances (EUAs) in 2009 and were alleged to be VAT defaulting traders within (or otherwise connected to) EUA supply chains of which NWM Plc was a party. In March 2020, the court held that NWM Plc and Mercuria Energy Europe Trading Limited (‘Mercuria’) were liable for dishonestly assisting and knowingly being a party to fraudulent trading during a seven business day period in 2009.
In October 2020, the High Court quantified total damages against NWM Plc and Mercuria at £45 million plus interest and costs, and permitted the defendants to appeal to the Court of Appeal. In May 2021 the Court of Appeal set aside the High Court’s judgment and ordered that a retrial take place before a different High Court judge. In January 2024, NWM Plc entered into an agreement to resolve the claim against it. The settlement amount paid by NWM Plc was covered in full by an existing provision.
Offshoring VAT assessments
HMRC issued protective tax assessments in 2018 against NatWest Group plc totalling £143 million relating to unpaid VAT in respect of the UK branches of two NatWest Group companies registered in India. NatWest Group formally requested reconsideration by HMRC of their assessments, and this process was completed in November 2020. HMRC upheld their original decision and, as a result, NatWest Group plc lodged an appeal with the Tax Tribunal and an application for judicial review with the High Court of Justice of England and Wales, both in December 2020. In order to lodge the appeal with the Tax Tribunal, NatWest Group plc was required to pay £143 million to HMRC, and payment was made in December 2020. The appeal and the application for judicial review have both been stayed pending resolution of separate cases involving other banks.
| |
NatWest Group – Annual Report on Form 20-F 2023 | 128 |
Notes to the consolidated financial statements continued
26 Memorandum items continued
US Anti-Terrorism Act litigation
NWM N.V. and certain other financial institutions are defendants in several actions filed by a number of US nationals (or their estates, survivors, or heirs), most of whom are or were US military personnel, who were killed or injured in attacks in Iraq between 2003 and 2011. NWM Plc is also a defendant in some of these cases.
According to the plaintiffs’ allegations, the defendants are liable for damages arising from the attacks because they allegedly conspired with and/or aided and abetted Iran and certain Iranian banks to assist Iran in transferring money to Hezbollah and the Iraqi terror cells that committed the attacks, in violation of the US Anti-Terrorism Act, by agreeing to engage in ‘stripping’ of transactions initiated by the Iranian banks so that the Iranian nexus to the transactions would not be detected.
The first of these actions , alleging conspiracy claims but not aiding and abetting claims, was filed in the United States District Court for the Eastern District of New York in November 2014. In September 2019, the district court dismissed the case, finding that the claims were deficient for several reasons, including lack of sufficient allegations as to the alleged conspiracy and causation. In January 2023, the US Court of Appeals affirmed the district court’s dismissal of this case. The plaintiffs filed a petition with the United States Supreme Court seeking review of the dismissal of their claims and that petition was denied in October 2023. It is anticipated that the plaintiffs will file a motion to re-open the case to assert aiding and abetting claims that they previously did not assert. Another action, filed in the SDNY in 2017, which asserted both conspiracy and aiding and abetting claims, was dismissed by the SDNY in March 2019 on similar grounds as the first case, but remains subject to appeal to the US Court of Appeals. Other follow-on actions that are substantially similar to those described above are pending in the same courts.
1MDB litigation
A Malaysian court claim was served in Switzerland in November 2022 by 1MDB, a Sovereign Wealth Fund, in which Coutts & Co Ltd was named, along with six others, as a defendant in respect of losses allegedly incurred by 1MDB. It is claimed that Coutts & Co Ltd is liable as a constructive trustee for having dishonestly assisted the directors of 1MDB in the breach of their fiduciary duties by failing (amongst other alleged claims) to undertake due diligence in relation to a customer of Coutts & Co Ltd, through which funds totalling c.US$1 billion were received and paid out between 2009 and 2011. The claimant seeks the return of that amount plus interest. Coutts & Co Ltd filed an application in January 2023 challenging the validity of service and the Malaysian court’s jurisdiction to hear the claim. Before that application was heard, in April 2023, the claimant filed a notice of discontinuance of its claim against certain defendants including Coutts & Co Ltd. The claimant subsequently indicated that it intended to issue further replacement proceedings. Coutts & Co Ltd challenged the claimant’s ability to take that step. In August 2023, the court disallowed the discontinuation of the claim by the claimant (a decision that the claimant has appealed) and directed that the application by Coutts & Co Ltd challenging the validity of the proceedings should proceed to a hearing , which took place in February 2024. Judgment is awaited.
Coutts & Co Ltd (a subsidiary of RBS Netherlands Holdings B.V., which in turn is a subsidiary of NWM Plc) is a company registered in Switzerland and is in wind-down following the announced sale of its business assets in 2015.
Regulatory matters (including investigations and customer redress programmes)
NatWest Group's businesses and financial condition can be affected by the actions of various governmental and regulatory authorities in the UK, the US, the EU and elsewhere. NatWest Group has engaged, and will continue to engage, in discussions with relevant governmental and regulatory authorities, including in the UK, the US, the EU and elsewhere, on an ongoing and regular basis, and in response to informal and formal inquiries or investigations, regarding operational, systems and control evaluations and issues including those related to compliance with applicable laws and regulations, including consumer protection, investment advice, business conduct, competition/anti-trust, VAT recovery, anti-bribery, anti-money laundering and sanctions regimes. NatWest Group expects government and regulatory intervention in financial services to be high for the foreseeable future, including increased scrutiny from competition and other regulators in the retail and SME business sectors.
Any matters discussed or identified during such discussions and inquiries may result in, among other things, further inquiry or investigation, other action being taken by governmental and regulatory authorities, increased costs being incurred by NatWest Group, remediation of systems and controls, public or private censure, restriction of NatWest Group's business activities and/or fines. Any of the events or circumstances mentioned in this paragraph or below could have a material adverse effect on NatWest Group, its business, authorisations and licences, reputation, results of operations or the price of securities issued by it, or lead to material additional provisions being taken.
NatWest Group is co-operating fully with the matters described below.
| |
NatWest Group – Annual Report on Form 20-F 2023 | 129 |
Notes to the consolidated financial statements continued
26 Memorandum items continued
US investigations relating to fixed-income securities
In December 2021, NWM Plc pled guilty in the United States District Court for the District of Connecticut to one count of wire fraud and one count of securities fraud in connection with historical spoofing conduct by former employees in US Treasuries markets between January 2008 and May 2014 and, separately, during approximately three months in 2018. The 2018 trading occurred during the term of a non-prosecution agreement (NPA) between NWMSI and the United States Attorney’s Office for the District of Connecticut (USAO CT), under which non-prosecution was conditioned on NWMSI and affiliated companies not engaging in criminal conduct during the term of the NPA. The relevant trading in 2018 was conducted by two NWM traders in Singapore and breached that NPA. The plea agreement reached with the US Department of Justice and the USAO CT resolved both the spoofing conduct and the breach of the NPA.
As required by the resolution and sentence imposed by the court, NWM Plc is subject to a probationary period until the conclusion of the independent monitorship, which is also required under the plea agreement. In addition, NWM Plc has committed to compliance programme reviews and improvements and agreed to reporting and co-operation obligations.
Other material adverse collateral consequences may occur as a result of this matter, as further described in the Risk Factor relating to legal, regulatory and governmental actions and investigations set out on pages 160 to 184.
RBSI inspection report and referral to enforcement
Following an inspection by the Isle of Man Financial Services Authority (IOMFSA) in 2021 into The Royal Bank of Scotland International Limited’s (RBSI’s) compliance with the Financial Services Rule Book 2016, the Anti-Money Laundering and Countering the Financing of Terrorism Code 2015 (the “2015 Code”) and the Anti-Money Laundering and Countering the Financing of Terrorism Code 2019, RBSI and the IOMFSA entered into a settlement agreement in February 2024 with an agreed public statement that RBSI had contravened paragraph 7 of the 2015 Code. RBSI did not complete its updated Customer Risk Assessment process following the introduction of the 2015 Code until 2018, resulting in 2,239 non-personal customers (on-boarded to its Isle of Man branches between 2015 and 2018, and not rated as high risk) being on-boarded using Customer Risk Assessments in line with earlier legislation. This constituted less than 3% of the total customer population of the Isle of Man branches. RBSI was fined £1.0 million (after a discount for co-operation), which was covered in full by an existing provision.
RBSI reliance regime and referral to enforcement
In January 2023, the Jersey Financial Services Commission notified RBSI that it had been referred to its Enforcement Division in relation to RBSI’s operation of the reliance regime. The reliance regime is specific to certain Crown Dependencies and enables the bank to rely on regulated third parties for specific due diligence information.
Investment advice review
In October 2019, the FCA notified NatWest Group of its intention to appoint a Skilled Person under section 166 of the Financial Services and Markets Act 2000 to conduct a review of whether NatWest Group’s past business review of investment advice provided during 2010 to 2015 was subject to appropriate governance and accountability and led to appropriate customer outcomes. The Skilled Person’s review has concluded and, after discussion with the FCA, NatWest Group is undertaking additional review / remediation work.
Reviews into customer account closures
In July 2023, NatWest Group plc commissioned an independent review by the law firm Travers Smith LLP into issues that had arisen from treatment of a customer in connection with an account closure decision that attracted significant public attention and certain related interactions with the media. NatWest Group plc has received reports in connection with that review (and in October and December 2023 published summaries of the key findings and recommendations).
In addition, NatWest Group plc is conducting internal reviews with respect to certain governance processes, policies, systems and controls of NatWest Group entities, including with respect to customer account closures.
The FCA is conducting supervisory work into how the governance, systems and controls of NatWest Group and Coutts & Company are working, to identify and address any significant shortcomings.
Review and investigation of treatment of tracker mortgage customers in Ulster Bank Ireland DAC
In December 2015, correspondence was received from the Central Bank of Ireland setting out an industry examination framework in respect of the sale of tracker mortgages from approximately 2001 until the end of 2015. The redress and compensation process has now largely concluded, although certain cases remain outstanding.
UBIDAC customers have lodged tracker mortgage complaints with the Financial Services and Pensions Ombudsman (FSPO). UBIDAC challenged three FSPO adjudications in the Irish High Court. In June 2023, the High Court found in favour of the FSPO in all matters and a provision was recognised. UBIDAC was granted leave to appeal that decision and an appeal hearing has been scheduled to take place in the Court of Appeal.
Other customer remediation in Ulster Bank Ireland DAC
UBIDAC has identified other legacy issues leading to the establishment of remediation requirements and progress is ongoing to conclude activities.
| |
NatWest Group – Annual Report on Form 20-F 2023 | 130 |
Notes to the consolidated financial statements continued
27 Non-cash and other items
This note shows non-cash items adjusted for in the cash flow statement and movement in operating assets and liabilities.
| | | | | | |
|
| 2023 |
| 2022 |
| 2021 |
| | £m | | £m | | £m |
Impairment losses/(releases) | | 572 | | 266 | | (1,335) |
Depreciation and amortisation |
| 934 |
| 833 |
| 923 |
Change in fair value taken to profit or loss of other financial assets |
| (584) |
| 1,267 |
| 1,771 |
Change in fair value taken to profit or loss on other financial liabilities and subordinated liabilities |
| 831 |
| (2,400) |
| (1,083) |
Foreign exchange recycling (gains)/losses | | (484) | | (5) | | 10 |
Elimination of foreign exchange differences |
| 312 |
| 10 |
| 2,446 |
Income receivable on other financial assets |
| (1,415) |
| (585) |
| (378) |
Loss/(profit) on sale of other financial assets |
| 44 |
| 172 |
| (118) |
Profit on sale of subsidiaries and associates |
| — |
| — |
| (48) |
Share of loss/(profit) of associates |
| 9 |
| 30 |
| (216) |
Loss on sale of other assets and net assets and liabilities |
| 125 |
| 154 |
| 23 |
Interest payable on MRELs and subordinated liabilities |
| 1,352 |
| 1,103 |
| 964 |
(Gain)/loss on redemption of own debt |
| (3) |
| 161 |
| 145 |
Charges and releases on provisions |
| 313 |
| 248 |
| 478 |
Change in fair value of cash flow hedges | | 1,021 | | (304) | | (161) |
Other non-cash items |
| 59 |
| 48 |
| (13) |
Defined benefit pension schemes |
| 122 |
| 205 |
| 215 |
Non-cash and other items |
| 3,208 |
| 1,203 |
| 3,623 |
Change in operating assets and liabilities |
| |
|
|
|
|
Change in trading assets |
| 327 |
| 14,991 |
| 7,751 |
Change in derivative assets |
| 20,826 |
| 3,621 |
| 59,697 |
Change in settlement balance assets |
| (4,659) |
| (431) |
| 156 |
Change in loans to banks |
| 752 |
| (202) |
| (252) |
Change in loans to customers |
| (15,626) |
| (7,628) |
| 2,721 |
Change in other financial assets |
| 132 |
| (328) |
| (128) |
Change in other assets |
| (213) |
| (255) |
| (57) |
Change in assets of disposal groups |
| 412 |
| (4,117) |
| (9,015) |
Change in bank deposits |
| 1,749 |
| (5,838) |
| 5,673 |
Change in customer deposits |
| (18,964) |
| (29,492) |
| 48,071 |
Change in settlement balance liabilities |
| 4,633 |
| (56) |
| (350) |
Change in trading liabilities |
| 828 |
| (11,790) |
| (7,658) |
Change in derivative liabilities |
| (21,652) |
| (6,788) |
| (59,870) |
Change in other financial liabilities |
| 6,564 |
| 989 |
| 938 |
Change in notes in circulation |
| 19 |
| 171 |
| 392 |
Change in other liabilities |
| (807) |
| (1,294) |
| (1,463) |
Change in operating assets and liabilities |
| (25,679) |
| (48,447) |
| 46,606 |
| |
NatWest Group – Annual Report on Form 20-F 2023 | 131 |
Notes to the consolidated financial statements continued
28 Analysis of the net investment in business interests and intangible assets
This note shows cash flows relating to obtaining or losing control of associates or subsidiaries and net assets and liabilities purchased and sold. These cash flows are presented as investing activities on the cash flow statement. |
| | | | | | |
|
| 2023 |
| 2022 |
| 2021 |
|
| £m |
| £m |
| £m |
Fair value given for business acquired | | (139) | | — | | — |
Acquisition of interest in associates |
| — |
| (1) |
| — |
Additional investment in associates | | (5) | | — | | (51) |
Net assets and liabilities purchased | | — | | — | | (3,128) |
Net outflow of cash in respect of acquisitions |
| (144) |
| (1) |
| (3,179) |
| | | | | | |
Disposal of net assets and liabilities |
| 5,560 |
| 6,270 |
| 114 |
(Loss)/profit on disposal of net assets and liabilities |
| (87) |
| (106) |
| 55 |
Net inflow of cash in respect of disposals |
| 5,473 |
| 6,164 |
| 169 |
| | | | | | |
Dividends received from associate | | 16 | | — | | — |
Net cash expenditure on intangible assets |
| (744) |
| (743) |
| (479) |
Net inflow/(outflow) of cash |
| 4,601 |
| 5,420 |
| (3,489) |
| |
NatWest Group – Annual Report on Form 20-F 2023 | 132 |
Notes to the consolidated financial statements continued
29 Analysis of changes in financing during the year
This note shows cash flows and non-cash movements relating to the financing activities of the Group. These activities reflect movements in share capital, share premium, paid-in equity, subordinated liabilities and MRELs. |
| | | | | | | | | | | | | | | | | | |
| | Share capital, share premium, | | | | | | | | | | | | | ||||
| | and paid-in equity | | Subordinated liabilities | | MRELs | ||||||||||||
|
| 2023 |
| 2022 |
| 2021 |
| 2023 |
| 2022 |
| 2021 |
| 2023 |
| 2022 |
| 2021 |
| | £m | | £m | | £m | | £m | | £m | | £m | | £m | | £m | | £m |
At 1 January |
| 15,590 |
| 16,519 |
| 18,239 |
| 6,260 |
| 8,429 |
| 9,962 | | 22,265 | | 23,423 | | 20,873 |
| | | | | | | | | | | | | | | | | | |
Issue of paid-in equity |
| — |
| — |
| 937 |
| — |
| — |
| — | | — | | — | | — |
Issue of subordinated liabilities |
| — |
| — |
| — |
| 611 |
| 648 |
| 1,634 | | — | | — | | — |
Issue of MRELs | | — | | — | | — | | — | | — | | | | 3,973 | | 3,721 | | 3,383 |
Redemption of subordinated liabilities |
| — |
| — |
| — |
| (1,250) |
| (3,693) |
| (4,765) | | — | | — | | — |
Interest paid on subordinated liabilities | | — | | — | | — | | (439) | | (374) | | (321) | | — | | — | | — |
Maturity and redemption of MRELs | | — | | — | | — | | — | | — | | — | | (4,236) | | (4,992) | | — |
Interest paid on MRELs | | — | | — | | — | | — | | — | | — | | (844) | | (703) | | (647) |
Net cash flows from financing activities |
| — |
| — |
| 937 |
| (1,078) |
| (3,419) |
| (3,452) | | (1,107) | | (1,974) | | 2,736 |
Ordinary shares issued | | — | | — | | 87 | | — | | — | | — | | — | | — | | — |
Shares repurchased | | (856) | | (929) | | (698) | | — | | — | | — | | — | | — | | — |
Effects of foreign exchange |
| — |
| — |
| — |
| (166) |
| 597 |
| (18) | | (987) | | 1,889 | | (190) |
Changes in fair value of subordinated liabilities and MRELs | | — | | — | | — | | 230 | | (594) | | (434) | | 601 | | (1,806) | | (649) |
Preference shares reclassified to subordinated liabilities | | — | | — | | — | | — | | 750 | | — | | — | | — | | — |
Paid-in equity reclassified to subordinated liabilities | | — | | — | | (2,046) | | — | | — | | 1,915 | | — | | — | | — |
(Gain)/loss on redemption of own debt | | — | | — | | — | | (3) | | 161 | | 145 | | — | | — | | — |
Interest payable on subordinated liabilities and MRELs | | — | | — | | — | | 464 | | 370 | | 311 | | 888 | | 733 | | 653 |
Other |
| — |
| — |
| — |
| 7 |
| (34) |
| — | | — | | — | | — |
At 31 December |
| 14,734 |
| 15,590 |
| 16,519 |
| 5,714 |
| 6,260 |
| 8,429 | | 21,660 | | 22,265 | | 23,423 |
30 Analysis of cash and cash equivalents
Non-cash and other add back items and movements in operating assets and liabilities are adjusted for in the cash flow statement. Loans to banks and treasury bills with an original maturity of less than three months that are readily convertible to known amounts of cash and subject to insignificant risk of change in value. |
| | | | | | |
|
| 2023 |
| 2022 |
| 2021 |
| | £m | | £m | | £m |
Cash and balances at central banks |
| 104,262 |
| 144,832 |
| 177,757 |
Trading assets | | 8,851 | | 8,551 | | 7,137 |
Other financial assets |
| 139 |
| 19 |
| 16 |
Loans to banks (1) |
| 5,572 |
| 5,047 |
| 5,796 |
Cash and cash equivalents |
| 118,824 |
| 158,449 |
| 190,706 |
(1) | Includes cash collateral posted with bank counterparties in respect of derivative liabilities of £4,434 million (2022 - £4,895 million; 2021 - £4,293 million). |
Certain members of NatWest Group are required by law or regulation to maintain balances with the central banks in the jurisdictions in which they operate. NatWest Markets N.V. had mandatory reserve deposits with De Nederlandsche Bank N.V. of €132 million (2022 - €64 million, 2021 - €60 million). The Royal Bank of Scotland International Limited had balances with Central Bank of Luxembourg of £135 million (2022 - £108 million, 2021 - £123 million).
| |
NatWest Group – Annual Report on Form 20-F 2023 | 133 |
Notes to the consolidated financial statements continued
31 Directors' and key management remuneration
Directors and key management are remunerated for services rendered in the period. The executive directors may participate in the company's long-term incentive plans, executive share option and sharesave schemes and details of their interests in the company's shares arising from their participation are given in the directors' remuneration report. Details of the remuneration received by each director are also given in the directors' remuneration report. |
Key management comprises members of the NatWest Group plc and NWH Ltd Boards, members of the NatWest Group plc and NWH Ltd Executive Committees, and the Chief Executives of NatWest Markets Plc and RBS International (Holdings) Limited. This is on the basis that these individuals have been identified as Persons Discharging Managerial Responsibilities of NatWest Group plc under the new governance structure.
| | | | |
|
| 2023 |
| 2022 |
Directors' remuneration | | £000 | | £000 |
Non-executive directors emoluments |
| 1,574 |
| 1,685 |
Chairman and executive directors emoluments |
| 6,408 |
| 5,804 |
|
| 7,982 |
| 7,489 |
Amounts receivable under long-term incentive plans and share option plans |
| 2,708 |
| 542 |
Total |
| 10,690 |
| 8,031 |
Compensation of key management
The aggregate remuneration of directors and other members of key management during the year was as follows:
| | | | |
|
| 2023 |
| 2022 |
| | £000 | | £000 |
Short-term benefits |
| 21,098 |
| 22,175 |
Post-employment benefits |
| 741 |
| 732 |
Share-based payments |
| 7,264 |
| 2,547 |
|
| 29,103 |
| 25,454 |
Short term benefits include benefits expected to be settled wholly within twelve months of balance sheet date. Post-employment benefits include defined benefit contributions for active members and pension funding to support contributions to the defined contribution schemes. Share-based payments include awards vested under rewards schemes.
| |
NatWest Group – Annual Report on Form 20-F 2023 | 134 |
Notes to the consolidated financial statements continued
32 Transactions with directors and key management
This note presents information relating to any transactions with directors and key management. Key management comprises directors of the company and Persons Discharging Managerial Responsibilities (PDMRs) of NatWest Group plc. |
For the purposes of IAS 24 Related party disclosures, key management comprises directors of the company and PDMRs of NatWest Group plc. Key management have banking relationships with NatWest Group entities which are entered into in the normal course of business and on substantially the same terms, including interest rates and security, as for comparable transactions with other persons of a similar standing or, where applicable, with other employees. These transactions did not involve more than the normal risk of repayment or present other unfavourable features.
Amounts in the table below are attributed to each person at their highest level of NatWest Group key management, and relate to those who were key management at any time during the financial period.
| | | | |
|
| At 31 December | ||
| | 2023 | | 2022 |
| | £000 | | £000 |
Loans to customers - amortised cost |
| 11,406 |
| 12,137 |
Customer deposits |
| 55,254 |
| 47,866 |
At 31 December 2023, amounts outstanding in relation to transactions, arrangements and agreements entered into by authorised institutions in NatWest Group, as defined in UK legislation, were £8,397,763 in respect of loans to 9 persons who were directors of the company at any time during the financial period.
33 Related parties
A related party is a person or entity that is related to the entity that is preparing its financial statements. This includes subsidiaries, associates, joint ventures, post-employment benefits plans, Key management personnel and their close family members and entities controlled by them. Transactions between an entity and any related party are disclosed in the financial statements in accordance with both accounting standards and relevant listing rules to ensure readers are aware of how financial statements may be affected by these transactions. |
UK Government
UK Government through HM Treasury is the controlling shareholder of NatWest Group plc as per UK listing rules. The UK Government's shareholding is managed by UK Government Investments Limited, a company wholly owned by the UK Government. At 31 December 2023 HM Treasury's holding in the company's ordinary shares was 37.97%. As a result the UK Government and UK Government-controlled bodies are related parties of the Group.
NatWest Group enters into transactions with many of these bodies. Transactions include the payment of: taxes – principally UK corporation tax (Note 7) and value added tax; national insurance contributions; local authority rates; and regulatory fees and levies (including the bank levy Note 3) and FSCS levy (Note 26) - together with banking transactions such as loans and deposits undertaken in the normal course of banker-customer relationships.
Bank of England facilities
NatWest Group may participate in a number of schemes operated by the Bank of England in the normal course of business.
Members of NatWest Group that are UK authorised institutions are required to maintain non-interest bearing (cash ratio) deposits with the Bank of England amounting to 0.382% of their average eligible liabilities in excess of £600 million. They also have access to Bank of England reserve accounts: sterling current accounts that earn interest at the Bank of England Base rate.
NatWest Group provides guarantees for certain subsidiaries, liabilities to the Bank of England.
Other Related Parties
In accordance with IAS 24, transactions or balances between NatWest Group entities that have been eliminated on consolidation are not reported.
The primary financial statements of the parent company include transactions and balances with its subsidiaries which have been further disclosed in the relevant notes.
| |
NatWest Group – Annual Report on Form 20-F 2023 | 135 |
Notes to the consolidated financial statements continued
33 Related parties continued
Associates, joint ventures (JVs) and equity investments
In their roles as providers of finance, NatWest Group companies provide development and other types of capital support to businesses. These investments are made in the normal course of business. To further strategic partnerships, NatWest Group may seek to invest in third parties or allow third parties to hold a minority interest in a subsidiary of NatWest Group. We disclose as related parties for associates and joint ventures and where equity interest are over 10%. Ongoing business transactions with these entities are on normal commercial terms.
Amounts included in the NatWest Group financial statements, in aggregate, by category of related party are as follows:
| | | | | | |
| | Associates and | | Equity | | |
|
| Joint Ventures |
| Shares (1) |
| Total |
31 December 2023 | | £m | | £m | | £m |
Investments |
| 668 |
| 145 |
| 813 |
Loans to customers- amortised cost |
| — |
| 13 |
| 13 |
Customer deposits |
| 2 |
| 10 |
| 12 |
Settlement balances | | — | | — | | — |
Other comprehensive income | | — | | (8) | | (8) |
Other operating income |
| (11) |
| — |
| (11) |
| | | | | | |
31 December 2022 |
| |
| |
| |
Investments |
| 688 |
| 149 |
| 837 |
Loans to customers- amortised cost |
| — |
| — |
| — |
Customer deposits |
| 1 |
| 4 |
| 5 |
Settlement balances | | — | | 34 | | 34 |
Other comprehensive income |
| — |
| 11 |
| 11 |
Other operating income |
| (30) |
| — |
| (30) |
(1)Represents investments in entities where ownership is more than 10%
Post employment benefits
NatWest Group recharges NatWest Group Pension Fund with the cost of pension management services incurred by it. NatWest Group Pension Fund holds bank accounts held with the NatWest Group plc. At 31 December 2023 these balances amounted to £36.2 million (2022 - £61.7 million).
NatWest Group Pension fund also holds certain interest rate swaps, inflation swaps, credit derivatives, cross currency swaps and forward exchange rate agreements where subsidiaries of NatWest Group act as counterparties. These transactions are on commercial terms and carried out on an arms-length basis.
During February 2023, NatWest Group has entered into an agreement to establish a new legal structure to hold assets, consolidated on NatWest Group’s balance sheet, to meet potential future contributions required by the Main section of the Group’ Pension Fund. This transaction required transfer of £471 million to the Reservoir Trust after the final dividend for 2022 approved by shareholders. This transaction does not create a pension liability with the Main section of the Group Pension Fund. Refer to details in Note 5 and in Material contracts information on page 189.
| |
NatWest Group – Annual Report on Form 20-F 2023 | 136 |
Notes to the consolidated financial statements continued
34 Post balance sheet events
A post balance sheet event is an event that takes place between the reporting date and the date of approval of the financial statements. Significant events are included in the financial statements either to provide new information about conditions that existed at 31 December 2023 (reporting date), including estimates used to prepare the financial statements (known as an adjusting event) or to provide new information about conditions that did not exist at 31 December 2023 (non-adjusting events). This note provides information relating to material non-adjusting events. |
As part of the ongoing on-market share buyback programmes, NatWest Group plc has repurchased and cancelled a further 64.6 million shares since December 2023 for a total consideration (excluding fees) of £138.5 million.
Other than as disclosed in the accounts, there have been no other significant events subsequent to 31 December 2023 which would require a change or additional disclosure.
| |
NatWest Group – Annual Report on Form 20-F 2023 | 137 |
Non-IFRS financial measures
|
NatWest Group prepares its financial statements in accordance with UK-adopted International Accounting Standards (IAS) and International Financial Reporting Standards (IFRS) as issued by the International Accounting Standards Board (IASB). This document contains a number of non-IFRS measures, also known as alternative performance measures, defined under the European Securities and Markets Authority guidance or non-GAAP financial measures in accordance with SEC regulations. These measures are adjusted for notable and other defined items which management believes are not representative of the underlying performance of the business and which distort period-on-period comparison. The non-IFRS measures provide users of the financial statements with a consistent basis for comparing business performance between financial periods and information on elements of performance that are one-off in nature. The non-IFRS measures also include a calculation of metrics that are used throughout the banking industry. These non-IFRS measures are not a substitute for IFRS measures and a reconciliation to the closest IFRS measure is presented where appropriate. |
1. Total income excluding notable items
Total income excluding notable items is calculated as total income less notable items.
The exclusion of notable items aims to remove the impact of one-offs and other volatile items which may distort period-on-period comparisons.
| | | | | | |
|
| 2023 |
| 2022 |
| 2021 |
| | £m | | £m | | £m |
Continuing operations |
|
|
|
|
|
|
Total income |
| 14,752 |
| 13,156 |
| 10,429 |
Less notable items: |
| | | | | |
Private Banking | | | | | | |
Consideration on the sale of the Adam & Company investment management business | | — | | — | | 54 |
Commercial & Institutional | | | | | | |
Fair value, disposal losses and asset disposals/strategic risk reduction | | — | | (45) | | (86) |
Tax variable lease repricing | | — | | — | | 32 |
Own credit adjustments (OCA) | | (2) | | 42 | | 6 |
Tax interest on prior periods | | 3 | | — | | — |
Central items & other | | | | | | |
Loss on redemption of own debt | | — | | (161) | | (138) |
Effective interest rate adjustment as a result of redemption of own debt | | — | | (41) | | — |
Profit from insurance liabilities | | — | | 92 | | — |
Liquidity Asset Bond sale (losses)/gains | | (43) | | (88) | | 120 |
Share of associate (losses)/gains for Business Growth Fund | | (4) | | (22) | | 219 |
Property strategy update | | (69) | | — | | (44) |
Interest and foreign exchange management derivatives not in hedge accounting relationships | | 79 | | 369 | | 47 |
Foreign exchange recycling gains | | 484 | | — | | — |
Ulster Bank RoI fair value mortgage adjustments | | — | | (51) | | — |
Tax interest on prior periods | | (35) | | — | | — |
Ulster Bank Rol gain arising from the restructuring of structural hedges | | — | | — | | 35 |
| | 413 | | 95 | | 245 |
Total income excluding notable items |
| 14,339 |
| 13,061 |
| 10,184 |
��� | |
NatWest Group – Annual Report on Form 20-F 2023 | 138 |
Non-IFRS financial measures continued
2. Operating expenses - management view
The management analysis of operating expenses shows litigation and conduct costs on a separate line. These amounts are included within staff costs and other administrative expenses in the statutory analysis. Other operating expenses excludes litigation and conduct costs, which are more volatile and may distort period-on-period comparisons.
| | | | | | |
| | Litigation | | Other | | Statutory |
| | and conduct | | operating | | operating |
| | costs | | expenses | | expenses |
Year ended 31 December 2023 |
| £m | | £m | | £m |
Continuing operations | | | | | | |
Staff expenses |
| 62 |
| 3,839 |
| 3,901 |
Premises and equipment |
| — |
| 1,153 |
| 1,153 |
Depreciation and amortisation |
| — |
| 934 |
| 934 |
Other administrative expenses |
| 293 |
| 1,715 |
| 2,008 |
Total |
| 355 |
| 7,641 |
| 7,996 |
| | | | | | |
Year ended 31 December 2022 | | | | | | |
Continuing operations | |
|
|
|
|
|
Staff expenses | | 45 |
| 3,671 |
| 3,716 |
Premises and equipment | | — |
| 1,112 |
| 1,112 |
Depreciation and amortisation | | — |
| 833 |
| 833 |
Other administrative expenses | | 340 |
| 1,686 |
| 2,026 |
Total | | 385 |
| 7,302 |
| 7,687 |
| | | | | | |
Year ended 31 December 2021 | | | | | | |
Continuing operations | |
|
|
|
|
|
Staff expenses | | — |
| 3,676 |
| 3,676 |
Premises and equipment | | — |
| 1,133 |
| 1,133 |
Depreciation and amortisation | | — |
| 923 |
| 923 |
Other administrative expenses | | 466 |
| 1,560 |
| 2,026 |
Total | | 466 |
| 7,292 |
| 7,758 |
| |
NatWest Group – Annual Report on Form 20-F 2023 | 139 |
Non-IFRS financial measures continued
3. Cost:income ratio (excl. litigation and conduct)
NatWest Group uses cost:income ratio (excl. litigation and conduct) in the Outlook guidance. It is calculated as other operating expenses (total operating expenses less litigation and conduct costs) divided by total income. Litigation and conduct costs are excluded as they are one-off in nature, difficult to forecast for Outlook purposes and distort period-on-period comparisons.
The calculation of the cost:income ratio (excl. litigation and conduct) is shown below, along with a comparison to cost:income ratio calculated usingl operating expenses.
| | | | | | | | | | | |
| | | | | | Commercial | | Central items | | |
|
| | Retail Banking | | Private Banking | | & Institutional | | & other | | NatWest Group |
|
Year ended 31 December 2023 | | £m | | £m | | £m | | £m | | £m |
|
Continuing operations |
|
|
|
|
|
|
|
|
|
| |
Operating expenses |
| 2,828 |
| 685 |
| 4,091 |
| 392 |
| 7,996 | |
Less litigation and conduct costs |
| (117) |
| (9) |
| (224) |
| (5) |
| (355) | |
Other operating expenses |
| 2,711 |
| 676 |
| 3,867 |
| 387 |
| 7,641 | |
| | | | | | | | | | | |
Total income |
| 5,931 |
| 990 |
| 7,421 |
| 410 |
| 14,752 | |
Cost:income ratio | | 47.7 | % | 69.2 | % | 55.1 | % | nm | | 54.2 | % |
Cost:income ratio (excl. litigation and conduct) |
| 45.7 | % | 68.3 | % | 52.1 | % | nm |
| 51.8 | % |
| | | | | | | | | | | |
Year ended 31 December 2022 |
|
|
|
|
|
|
|
|
|
| |
Continuing operations |
|
|
|
|
|
|
|
|
|
| |
Operating expenses |
| 2,593 |
| 622 |
| 3,744 |
| 728 |
| 7,687 | |
Less litigation and conduct costs |
| (109) |
| (12) |
| (181) |
| (83) |
| (385) | |
Other operating expenses |
| 2,484 |
| 610 |
| 3,563 |
| 645 |
| 7,302 | |
| | | | | | | | | | | |
Total income |
| 5,646 |
| 1,056 |
| 6,413 |
| 41 |
| 13,156 | |
| | | | | | | | | | | |
Cost:income ratio | | 45.9 | % | 58.9 | % | 58.4 | % | nm | | 58.4 | % |
Cost:income ratio (excl. litigation and conduct) |
| 44.0 | % | 57.8 | % | 55.6 | % | nm |
| 55.5 | % |
| | | | | | | | | | | |
Year ended 31 December 2021 |
|
|
|
|
|
|
|
|
|
| |
Continuing operations |
|
|
|
|
|
|
|
|
|
| |
Operating expenses |
| 2,513 |
| 520 |
| 3,757 |
| 968 |
| 7,758 | |
Less litigation and conduct costs |
| (76) |
| 3 |
| (111) |
| (282) |
| (466) | |
Other operating expenses |
| 2,437 |
| 523 |
| 3,646 |
| 686 |
| 7,292 | |
| | | | | | | | | | | |
Total income |
| 4,445 |
| 816 |
| 4,838 |
| 330 |
| 10,429 | |
| | | | | | | | | | | |
Cost:income ratio | | 56.5 | % | 63.7 | % | 77.7 | % | nm | | 74.4 | % |
Cost:income ratio (excl. litigation and conduct) |
| 54.8 | % | 64.1 | % | 75.4 | % | nm |
| 69.9 | % |
| |
NatWest Group – Annual Report on Form 20-F 2023 | 140 |
Non-IFRS financial measures continued
4. NatWest Group return on tangible equity
Return on tangible equity comprises profit or loss for the period attributable to ordinary shareholders divided by average tangible equity. Average tangible equity is average total equity excluding average non-controlling interests, average other owners equity and average intangible assets.
This measure shows the return NatWest Group generates on tangible equity deployed. It is used to determine relative performance of banks and used widely across the sector, although different banks may calculate the rate differently. A reconciliation is shown below including a comparison to the nearest GAAP measure: return on equity. This comprises profit attributable to ordinary shareholders divided by average total equity.
| | | | | |
| | Year ended or as at |
| ||
| | 31 December | | 31 December |
|
| | 2023 | | 2022 |
|
| | £m | | £m |
|
Profit attributable to ordinary shareholders |
| 4,394 |
| 3,340 | |
| | | | | |
Average total equity |
| 36,201 |
| 38,210 | |
Adjustment for other owners' equity and intangibles |
| (11,486) |
| (11,153) | |
Adjusted total tangible equity |
| 24,715 |
| 27,057 | |
| | | | | |
Return on equity | | 12.1 | % | 8.7 | % |
Return on tangible equity |
| 17.8 | % | 12.3 | % |
| |
NatWest Group – Annual Report on Form 20-F 2023 | 141 |
Non-IFRS financial measures continued
5. Segmental return on equity
Segmental return on equity comprises segmental operating profit or loss, adjusted for preference share dividends, paid-in equity and tax, divided by average notional equity. Average RWAe is defined as average segmental RWAs incorporating the effect of capital deductions. This is multiplied by an allocated equity factor for each segment to calculate the average notional tangible equity.
This measure shows the return generated by operating segments on equity deployed.
| | | | | | | |
|
| Retail |
| Private |
| Commercial & | |
Year ended 31 December 2023 |
| Banking |
| Banking |
| Institutional | |
Operating profit (£m) |
| 2,638 |
| 291 |
| 3,236 | |
Paid-in equity cost allocation (£m) |
| (55) |
| (23) |
| (165) | |
Adjustment for tax (£m) |
| (723) |
| (75) |
| (768) | |
Adjusted attributable profit (£m) |
| 1,860 |
| 193 |
| 2,303 | |
Average RWAe (£bn) |
| 57.8 |
| 11.4 |
| 107.0 | |
Equity factor |
| 13.5 | % | 11.5 | % | 14.0 | % |
Average notional equity (£bn) |
| 7.8 | | 1.3 | | 15.0 | |
Return on equity |
| 23.8 | % | 14.8 | % | 15.4 | % |
| | | | | | | |
Year ended 31 December 2022 |
|
|
|
|
|
| |
Operating profit (£m) |
| 2,824 |
| 436 |
| 2,547 | |
Paid-in equity cost allocation (£m) |
| (80) |
| (15) |
| (187) | |
Adjustment for tax (£m) |
| (768) |
| (118) |
| (590) | |
Adjusted attributable profit (£m) |
| 1,976 |
| 303 |
| 1,770 | |
Average RWAe (£bn) |
| 53.1 |
| 11.3 |
| 104.0 | |
Equity factor |
| 13.0 | % | 11.0 | % | 14.0 | % |
Average notional equity (£bn) |
| 6.9 |
| 1.2 |
| 14.6 | |
Return on equity |
| 28.6 | % | 24.5 | % | 12.2 | % |
| | | | | | | |
Year ended 31 December 2021 |
|
|
|
|
|
| |
Operating profit (£m) |
| 1,968 |
| 350 |
| 2,241 | |
Preference share and paid-in equity cost allocation (£m) |
| (80) |
| (20) |
| (236) | |
Adjustment for tax (£m) |
| (529) |
| (92) |
| (501) | |
Adjusted attributable profit (£m) |
| 1,359 |
| 238 |
| 1,504 | |
Average RWAe (£bn) |
| 36.0 |
| 11.2 |
| 106.0 | |
Equity factor |
| 14.5 | % | 12.5 | % | 13.0 | % |
Average notional equity (£bn) |
| 5.2 |
| 1.4 |
| 13.8 | |
Return on equity |
| 26.1 | % | 17.0 | % | 10.9 | % |
| |
NatWest Group – Annual Report on Form 20-F 2023 | 142 |
Non-IFRS financial measures continued
6. Bank net interest margin
Bank net interest margin is net interest income as a percentage of bank average interest-earning assets. Bank average interest earning assets are average interest earning assets of the banking business of NatWest Group excluding liquid asset buffer.
Liquid asset buffer consists of assets held by NatWest Group, such as cash and balances at central banks and debt securities in issue, that can be used to ensure repayment of financial obligations as they fall due. The exclusion of liquid asset buffer presents net interest margin on a basis more comparable with UK peers and excludes the impact of regulatory driven factors. A reconciliation is shown below including a comparison to the nearest GAAP measure: net interest margin. This is net interest income as a percentage of average interest earning assets.
| | | | | | | |
|
| Year ended |
| ||||
| | 31 December |
| 31 December |
| 31 December |
|
| | 2023 | | 2022 | | 2021 |
|
| | £m | | £m | | £m |
|
Continuing operations |
|
|
|
|
|
| |
NatWest Group net interest income |
| 11,049 |
| 9,842 |
| 7,535 | |
Average interest earning assets (IEA) |
| 520,591 |
| 544,162 |
| 519,304 | |
Less liquid asset buffer average IEA |
| (157,677) |
| (198,927) |
| (192,036) | |
Bank average IEA |
| 362,914 |
| 345,235 |
| 327,268 | |
| | | | | | | |
NatWest Group net interest margin | | 2.12 | % | 1.81 | % | 1.45 | % |
Bank net interest margin |
| 3.04 | % | 2.85 | % | 2.30 | % |
| | | | | | | |
Retail Banking |
|
| |
|
|
| |
Net interest income |
| 5,496 | | 5,224 |
| 4,074 | |
Retail Banking average IEA |
| 222,174 | | 210,404 |
| 196,043 | |
Less liquid asset buffer average IEA |
| (16,730) | | (19,581) |
| (16,913) | |
Adjusted Retail Banking average IEA |
| 205,444 | | 190,823 |
| 179,130 | |
| | | | | | | |
Retail Banking net interest margin |
| 2.68 | % | 2.74 | % | 2.27 | % |
| | | | | | | |
Private Banking |
|
| |
|
|
| |
Net interest income |
| 710 | | 777 |
| 480 | |
Private Banking average IEA |
| 27,072 | | 29,308 |
| 27,224 | |
Less liquid asset buffer average IEA |
| (8,088) | | (10,221) |
| (8,949) | |
Adjusted Private Banking average IEA |
| 18,984 | | 19,087 |
| 18,275 | |
| | | | | | | |
Private Banking net interest margin |
| 3.74 | % | 4.07 | % | 2.63 | % |
| | | | | | | |
Commercial & Institutional |
|
| |
|
|
| |
Net interest income |
| 5,044 | | 4,171 |
| 2,974 | |
Commercial & Institutional average IEA |
| 244,445 | | 245,316 |
| 238,642 | |
Less liquid asset buffer average IEA |
| (112,931) | | (119,244) |
| (117,686) | |
Adjusted Commercial & Institutional average IEA |
| 131,514 | | 126,072 |
| 120,956 | |
| | | | | | | |
Commercial & Institutional net interest margin |
| 3.84 | % | 3.31 | % | 2.46 | % |
| |
NatWest Group – Annual Report on Form 20-F 2023 | 143 |
Non-IFRS financial measures continued
7. Tangible net asset value (TNAV) per ordinary share
TNAV per ordinary share is calculated as tangible equity divided by the number of ordinary shares in issue.
This is a measure used by external analysts in valuing the bank and allows for comparison with other per ordinary share metrics including the share price.
| | | | |
| Year ended | |||
| | 31 December |
| 31 December |
| | 2023 | | 2022 |
Ordinary shareholders’ interests (£m) |
| 33,267 |
| 32,598 |
Less intangible assets (£m) |
| (7,614) |
| (7,116) |
Tangible equity (£m) |
| 25,653 |
| 25,482 |
| | | | |
Ordinary shares in issue (millions) (1) |
| 8,792 |
| 9,659 |
| | | | |
TNAV per ordinary share |
| 292p |
| 264p |
(1) | At the General Meeting and Class Meeting on 25 August, the shareholders approved the proposed special dividend and share consolidation. On 30 August the issued ordinary share capital was consolidated in the ratio of 14 existing shares for 13 new shares. Comparatives for the number of shares in issue and TNAV per ordinary share have not been adjusted. The number of ordinary shares in issue excludes own shares held. |
8. Customer deposits excluding central items
Customer deposits excluding central items is calculated as total NatWest Group customer deposits excluding Central items & other customer deposits.
Central items & other includes Treasury repo activity and Ulster Bank RoI. The exclusion of Central items & other removes the volatility relating to Treasury repo activity and the expected reduction of deposits as part of our withdrawal from the Republic of Ireland. These items may distort period-on-period comparisons and their removal gives the user of the financial statements a better understanding of the movements in customer deposits.
| | | | |
|
| 2023 |
| 2022 |
| | £bn | | £bn |
Customer deposits |
| 431.4 |
| 450.3 |
Less Central items & other |
| (12.3) |
| (17.4) |
Customer deposits excluding central items |
| 419.1 |
| 432.9 |
9. Net loans to customers excluding central items
Net loans to customers excluding central items is calculated as total NatWest Group net loans to customers excluding Central items & other net loans to customers.
Central items & other includes Treasury reverse repo activity and Ulster Bank RoI. The exclusion of Central items & other removes the volatility relating to Treasury reverse repo activity and the reduction of loans to customers over 2022 as part of our withdrawal from the Republic of Ireland. This allows for better period-on-period comparisons and gives the user of the financial statements a better understanding of the movements in net loans to customers.
| | | | |
|
| 2023 |
| 2022 |
| | £bn | | £bn |
Total loans to customers (amortised cost) |
| 381.4 |
| 366.3 |
Less Central items & other |
| (25.8) |
| (19.6) |
Net loans to customers excluding central items |
| 355.6 |
| 346.7 |
| |
NatWest Group – Annual Report on Form 20-F 2023 | 144 |
Non-IFRS financial measures continued
10. Loan:deposit ratio (excl. repos and reverse repos)
Loan:deposit ratio (excl. repos and reverse repos) is calculated as net customer loans held at amortised cost excluding reverse repos divided by total customer deposits excluding repos. This is a common metric used to assess liquidity.
The removal of repos and reverse repos reduces volatility and presents the ratio on a basis that is comparable to UK peers. A reconciliation is shown below including a comparison to the nearest GAAP measure: loan:deposit ratio. This is calculated as net loans to customers held at amortised cost divided by customer deposits.
| | | | | | | |
|
| As at |
| ||||
|
| 31 December |
| 31 December |
| 31 December |
|
| | 2023 | | 2022 | | 2021 |
|
| | £m | | £m | | £m |
|
Loans to customers - amortised cost |
| 381,433 |
| 366,340 |
| 358,990 | |
Less reverse repos |
| (27,117) |
| (19,749) |
| (25,962) | |
Loans to customers - amortised cost (excl. reverse repos) |
| 354,316 |
| 346,591 |
| 333,028 | |
| | | | | | | |
Customer deposits |
| 431,377 |
| 450,318 |
| 479,810 | |
Less repos |
| (10,844) |
| (9,828) |
| (14,541) | |
Customer deposits cost (excl. repos) |
| 420,533 |
| 440,490 |
| 465,269 | |
| | | | | | | |
Loan:deposit ratio | | 88 | % | 81 | % | 75 | % |
Loan:deposit ratio | | | | | | | |
(excl. repos and reverse repos) |
| 84 | % | 79 | % | 72 | % |
11. Loan impairment rate
Loan impairment rate is the loan impairment charge divided by gross customer loans. This measure is used to assess the credit quality of the loan book.
| | | | |
| | Year ended | ||
|
| 31 December |
| 31 December |
| | 2023 | | 2022 |
Loan impairment charge/(release) (£m) |
| 578.0 |
| 337 |
Gross customer loans (£bn) |
| 384.9 |
| 369.7 |
Loan impairment rate |
| 15bps |
| 9bps |
12. Funded assets
Funded assets is calculated as total assets less derivative assets. This measure allows review of balance sheet trends exclusive of the volatility associated with derivative fair values.
| | | | |
| | As at | ||
| | 31 December | | 31 December |
| | 2023 | | 2022 |
|
| £m |
| £m |
Total assets |
| 692,673 |
| 720,053 |
Less derivative assets |
| (78,904) |
| (99,545) |
Funded assets |
| 613,769 |
| 620,508 |
| |
NatWest Group – Annual Report on Form 20-F 2023 | 145 |
Non-IFRS financial measures continued
13. AUMA
AUMA comprises both assets under management (AUMs) and assets under administration (AUAs) serviced through the Private Banking segment.
AUMs comprise assets where the investment management is undertaken by Private Banking on behalf of Private Banking, Retail Banking and Commercial & Institutional customers.
AUAs comprise i) third party assets held on an execution-only basis in custody by Private Banking, Retail Banking and Commercial & Institutional for their customers, for which the execution services are supported by Private Banking, and for which Private Banking receives a fee for providing investment management and execution services to Retail Banking and Commercial & Institutional business segments ii) AUAMA of Cushon, acquired on 1 June 2023, which are supported by Private Banking and held and managed by third parties.
This measure is tracked and reported as the amount of funds that we manage or administer directly impacts the level of investment income that we receive.
14. AUM net flows
AUM net flows refers to client cash inflows and outflows relating to investment products (this can include transfers from savings accounts). AUM net flows excludes the impact of European Economic Area (EEA) resident client outflows following the UK’s exit from the EU and Russian client outflows since Q1 2022.
AUM net flows is reported and tracked to monitor the business performance of new business inflows and management of existing client withdrawals across Retail Banking, Private Banking and Commercial & Institutional Banking.
15. Wholesale funding
Wholesale funding comprises deposits by banks (excluding repos), debt securities in issue and subordinated liabilities.
Funding risk is the risk of not maintaining a diversified, stable and cost-effective funding base. The disclosure of wholesale funding highlights the extent of our diversification and how we mitigate funding risk.
16. Third party rates
Third party customer asset rate is calculated as interest receivable on third-party loans to customers as a percentage of third-party loans to customers. This excludes assets of disposal groups, intragroup items, loans to banks and liquid asset portfolios. Third party customer funding rate reflects interest payable or receivable on third-party customer deposits, including interest bearing and non-interest bearing customer deposits. Intragroup items, bank deposits, debt securities in issue and subordinated liabilities are excluded for customer funding rate calculation.
These metrics help investors better understand our net interest margin and interest rate sensitivity.
17. Climate and sustainable funding and financing
The climate and sustainable funding and financing metric is used by NatWest Group to measure the level of support it provides customers, through lending products and underwriting activities, to help in their transition towards a net zero, climate resilient and sustainable economy. We have a target to provide £100 billion of climate and sustainable funding and financing between the 1 of July 2021 and the end of 2025. As part of this, we aim to provide at least £10 billion in lending for residential properties with EPC ratings A and B between 1 January 2023 and the end of 2025.
| |
NatWest Group – Annual Report on Form 20-F 2023 | 146 |
Additional information
| |
NatWest Group – Annual Report on Form 20-F 2023 | 147 |
Selected statistical and other data
The geographic analysis, including the average balance sheet and interest rates, changes in net interest income and average interest rates, yields, spreads and margins in this report have generally been compiled on the basis of location of office - UK and overseas - unless indicated otherwise. ‘UK’ in this context includes transactions conducted through the offices in the UK which service international banking transactions.
Yields, spreads and margins of the banking business
| | | | | | |
| | 2023 | | 2022 | | 2021 |
|
| % |
| % |
| % |
Gross yield on interest-earning assets of the banking business (1) | | 4.04 | | 2.29 | | 1.74 |
Cost of interest-bearing liabilities of the banking business | | (2.72) | | (0.71) | | (0.43) |
Interest spread of the banking business (2) | | 1.32 | | 1.58 | | 1.31 |
Benefit from interest-free funds | | 0.80 | | 0.23 | | 0.14 |
Net interest margin of the banking business (3) | | 2.12 | | 1.81 | | 1.45 |
| | | | | | |
Gross yield (1,4) | |
| |
| |
|
- Group | | 4.04 | | 2.29 | | 1.74 |
- UK | | 4.22 | | 2.42 | | 1.86 |
- Overseas | | 1.45 | | 0.31 | | 0.38 |
Interest spread (2,4) | |
| |
| |
|
- Group | | 1.32 | | 1.58 | | 1.31 |
- UK | | 1.52 | | 1.70 | | 1.42 |
- Overseas | | (2.86) | | (0.03) | | 0.12 |
Net interest margin (3,4) | |
| |
| |
|
- Group | | 2.12 | | 1.81 | | 1.45 |
- UK | | 2.22 | | 1.92 | | 1.56 |
- Overseas | | 0.76 | | 0.19 | | 0.27 |
(1) | Gross yield is the interest earned on average interest-earning assets of the banking book. |
(2) | Interest spread is the difference between the gross yield and the interest rate paid on average interest-bearing liabilities of the banking business. |
(3) | Net interest margin is net interest income as a percentage of average interest earning assets. Bank net interest margin is net interest income as a percentage of bank average interest-earning assets. Bank average interest earning assets are average interest earning assets of the banking business of NatWest Group excluding liquid asset buffer. |
(4) | The analysis into UK and overseas has been compiled on the basis of location of office. |
| |
NatWest Group – Annual Report on Form 20-F 2023 | 148 |
Average balance sheet and related interest
| | | | | | | | | | | | | | | | | | | | |
| | | | 2023 | | 2022 | | 2021 | ||||||||||||
| | | | Average | | | | | | Average | | | | | | Average | | | | |
|
| |
| balance |
| Interest |
| Rate | | balance |
| Interest |
| Rate |
| balance |
| Interest |
| Rate |
| | | | £m | | £m |
| % | | £m | | £m |
| % | | £m | | £m |
| % |
Assets |
|
|
| | | | | | |
|
|
|
|
|
|
|
|
|
|
|
Loans to banks |
| -UK |
| 105,564 | | 3,443 | | 3.26 | | 146,705 |
| 1,859 |
| 1.27 |
| 124,092 |
| 307 |
| 0.25 |
|
| -Overseas |
| 29,072 | | 294 | | 1.01 | | 28,885 |
| 18 |
| 0.06 |
| 31,389 |
| (39) |
| (0.12) |
Loans to customers |
| -UK |
| 345,875 | | 15,458 | | 4.47 | | 328,467 |
| 9,972 |
| 3.04 |
| 311,876 |
| 8,388 |
| 2.69 |
|
| -Overseas |
| 1,744 | | 93 | | 5.31 | | 2,076 |
| 71 |
| 3.42 |
| 8,987 |
| 198 |
| 2.21 |
Other financial assets |
| -UK |
| 35,753 | | 1,638 | | 4.58 | | 34,632 |
| 525 |
| 1.52 |
| 44,301 |
| 241 |
| 0.54 |
|
| -Overseas |
| 2,583 | | 97 | | 3.77 | | 3,468 |
| 16 |
| 0.45 |
| 4,242 |
| 11 |
| 0.27 |
Interest-earning assets |
| -UK |
| 487,192 | | 20,539 | | 4.22 | | 509,804 |
| 12,356 |
| 2.42 |
| 480,268 |
| 8,936 |
| 1.86 |
|
| -Overseas |
| 33,399 | | 484 | | 1.45 | | 34,429 |
| 105 |
| 0.31 |
| 44,618 |
| 171 |
| 0.38 |
Total interest-earning assets |
| -banking business (1,2,4) |
| 520,591 | | 21,023 | | 4.04 | | 544,233 |
| 12,461 |
| 2.29 |
| 524,886 |
| 9,107 |
| 1.74 |
|
| -trading business (3) |
| 51,932 | | | | | | 69,618 | | | | |
| 71,625 | | | | |
Interest-earning assets | | |
| 572,523 | | | | | | 613,851 |
| |
| |
| 596,511 |
| |
| |
Non-interest-earning assets | | |
| 130,927 | | | | | | 151,653 |
| |
| |
| 152,841 |
| |
| |
Total assets | | |
| 703,450 | | | | | | 765,504 |
| |
| |
| 749,352 |
| |
| |
Percentage of assets applicable to overseas operations | | | | 14.27 | % | | | | | 10.44 | % | |
| |
| 11.91 | % | |
| |
| | | | | | | | | | | | | | | | | | | | |
Liabilities |
|
|
| | | | | | |
|
|
|
|
|
|
|
|
|
|
|
Bank deposits |
| -UK |
| 16,428 | | 1,033 | | 6.29 | | 15,443 |
| 266 |
| 1.73 |
| 4,862 |
| 40 |
| 0.82 |
|
| -Overseas |
| 183 | | 6 | | 3.26 | | 279 |
| 3 |
| 0.91 |
| 2,909 |
| (13) |
| (0.45) |
Customer deposits: demand |
| -UK |
| 90,833 | | 1,428 | | 1.57 | | 98,226 |
| 210 |
| 0.21 |
| 98,011 |
| 16 |
| 0.02 |
|
| -Overseas |
| 742 | | — | | — | | 6,808 |
| 1.00 |
| 0.01 |
| 6,365 |
| — |
| — |
Customer deposits: savings |
| -UK |
| 141,374 | | 2,305 | | 1.63 | | 158,453 |
| 240 |
| 0.15 |
| 154,236 |
| 349 |
| 0.23 |
|
| -Overseas |
| 59 | | — | | — | | 2,068 |
| — |
| — |
| 6,221 |
| 27 |
| 0.44 |
Customer deposits: other time |
| -UK |
| 35,307 | | 1,389 | | 3.93 | | 14,755 |
| 285 |
| 1.93 |
| 9,256 |
| 134 |
| 1.45 |
|
| -Overseas |
| 4,569 | | 152 | | 3.33 | | 2,497 |
| 8 |
| 0.34 |
| 3,218 |
| 2 |
| 0.07 |
Other financial liabilities |
| -UK |
| 52,927 | | 2,908 | | 5.49 | | 45,910 |
| 1,161 |
| 2.53 |
| 42,833 |
| 654 |
| 1.53 |
|
| -Overseas |
| 1,978 | | 68 | | 3.45 | | 1,256 |
| 10 |
| 0.83 |
| 1,131 |
| 15 |
| 1.36 |
Subordinated liabilities |
| -UK |
| 6,334 | | 460 | | 7.26 | | 7,426 |
| 353 |
| 4.75 |
| 7,973 |
| 249 |
| 3.12 |
|
| -Overseas |
| 502 | | 4 | | 0.86 | | 459 |
| 17 |
| 3.76 |
| 378 |
| 18 |
| 4.72 |
Internal funding of trading business |
| -UK |
| 17,625 | | 221 | | 1.26 | | 15,590 |
| 65 |
| 0.41 |
| 10,098 |
| 1 |
| 0.01 |
|
| -Overseas |
| (2,691) | | — | | — | | (1,774) |
| — |
| — |
| (1,047) |
| 1 |
| (0.08) |
Interest-bearing liabilities |
| -UK |
| 360,828 | | 9,744 | | 2.70 | | 355,803 |
| 2,580 |
| 0.73 |
| 327,270 |
| 1,443 |
| 0.44 |
|
| -Overseas |
| 5,342 | | 230 | | 4.31 | | 11,593 |
| 39 |
| 0.34 |
| 19,175 |
| 50 |
| 0.26 |
Total interest-bearing liabilities |
| -banking business (1) |
| 366,170 | | 9,974 | | 2.72 | | 367,396 |
| 2,619 |
| 0.71 |
| 346,445 |
| 1,493 |
| 0.43 |
|
| -trading business (3) |
| 72,085 | | | | | | 68,505 | | | | |
| 59,096 | | | | |
Interest-bearing liabilities | | |
| 438,255 | | | | | | 435,901 | | | | | | 405,541 |
| | | |
Non-interest-bearing liabilities: |
|
|
| | | | | | | | | | | | |
|
| | | |
Demand deposits |
| -UK |
| 145,403 | | | | | | 172,175 | | | | | | 169,717 |
| | | |
|
| -Overseas |
| 577 | | | | | | 3,497 | | | | | | 4,234 | | | | |
Other liabilities | | |
| 83,000 | | | | | | 115,724 | | | | | | 127,144 |
| | | |
Total equity | | |
| 36,215 | | | | | | 38,207 | | | | | | 42,716 |
| | | |
Total liabilities and equity | | |
| 703,450 | | | | | | 765,504 | | | | | | 749,352 |
| | | |
Percentage of liabilities applicable to overseas operations | | |
| 9.64 | % | | | | | 7.82 | % | | | | | 8.46 | % | | | |
| (1) | Interest receivable and interest payable have both been decreased by £3 million (2022 - £177 million decrease; 2021 - £206 million decrease) in respect of negative interest relating to financial assets that attracted negative interest. |
| (2) | Interest receivable includes £837 million (2022 - £596 million; 2021 - £494 million) in respect of loan fees forming part of the effective interest rate of loans and receivables. |
| (3) | Interest receivable and interest payable on trading assets and liabilities are included in income from trading activities. |
| (4) | Interest receivable includes amounts (unwind of discount) recognised on impaired loans and receivables. The average balances of such loans are included in average loans to banks and loans to customers. |
| (5) | The analysis into UK and overseas has been compiled on the basis of location of office. |
| (6) | 2023, 2022 and 2021 Loans and advances to customers average balances have been reclassified to exclude assets held for sale (2023 - £3.65 billion, 2022 - £12.69 billion, 2021 – £9.45 billion) |
| | | | | | |
| | 2023 | | 2022 | | 2021 |
Other financial data |
| % |
| % |
| % |
Return on average total assets (1) |
| 0.6 |
| 0.4 |
| 0.4 |
| (1) | Represents profit/(loss) attributable to ordinary shareholders as a percentage of average total assets. |
| |
NatWest Group – Annual Report on Form 20-F 2023 | 149 |
Ratios
| | | | | | | | | | | | | | | | | | | | | |
| | Personal | | Wholesale | | Total |
| ||||||||||||||
| | | | Credit | | Other | | | | | | | | | | | | | | |
|
2023 |
| Mortgages |
| cards |
| personal |
| Total |
| Property |
| Corporate |
| FI |
| Sovereign |
| Total |
| |
|
Average loans (£m) |
| 205,499 |
| 5,099 |
| 8,851 |
| 219,449 |
| 29,976 |
| 77,467 |
| 99,289 |
| 4,278 |
| 211,010 |
| 430,459 | |
Provision charges/(releases) (£m) |
| 35 |
| 193 |
| 254 |
| 482 |
| 34 |
| 58 |
| 6 |
| (2) |
| 96 |
| 578 | |
| | | | | | | | | | | | | | | | | | | | | |
As a % of average loans during the year |
|
|
| |
|
|
|
|
|
|
|
|
|
|
|
|
|
|
|
| |
Total provisions charged/(released) to income statement |
| 0.02 | % | 3.78 | % | 2.87 | % | 0.22 | % | 0.11 | % | 0.07 | % | 0.01 | % | (0.05) | % | 0.05 | % | 0.13 | % |
| | | | | | | | | | | | | | | | | | | | | |
2022 |
|
|
|
|
|
|
|
|
|
|
|
|
|
|
|
|
|
|
|
| |
Average loans (£m) |
| 197,287 |
| 4,050 |
| 9,189 |
| 210,526 |
| 31,595 |
| 81,880 |
| 100,169 |
| 5,084 |
| 218,728 |
| 429,254 | |
Provision charges/(releases) |
| (74) |
| 56 |
| 259 |
| 241 |
| 126 |
| (47) |
| 19 |
| (2) |
| 96 |
| 337 | |
| | | | | | | | | | | | | | | | | | | | | |
As a % of average loans during the year |
|
|
|
|
|
|
|
|
|
|
|
|
|
|
|
|
|
|
|
| |
Total provisions charged/(released) to income statement |
| (0.04) | % | 1.38 | % | 2.82 | % | 0.11 | % | 0.40 | % | (0.06) | % | 0.02 | % | (0.05) | % | 0.04 | % | 0.08 | % |
| | | | | | | | | | | | | | | | | | | | | |
2021 |
|
|
|
|
|
|
|
|
|
|
|
|
|
|
|
|
|
|
|
| |
Average loans (£m) |
| 194,935 |
| 3,651 |
| 8,866 |
| 207,453 |
| 33,491 |
| 76,743 |
| 95,927 |
| 3,907 |
| 210,067 |
| 417,520 | |
Provision charges/(releases) |
| (58) |
| (14) |
| 30 |
| (42) |
| (477) |
| (724) |
| (38) |
| 3 |
| (1,236) |
| (1,278) | |
| | | | | | | | | | | | | | | | | | | | | |
As a % of average loans during the year |
|
|
|
|
|
|
|
|
|
|
|
|
|
|
|
|
|
|
|
| |
Total provisions charged/(released) to income statement |
| (0.03) | % | (0.38) | % | 0.34 | % | (0.02) | % | (1.42) | % | (0.94) | % | (0.04) | % | 0.08 | % | (0.59) | % | (0.31) | % |
Loans
| | | | | | | | | | |
|
| Less than |
| |
| |
| More than |
| |
| | 1 year | | 1-5 Years | | 5-15 years | | 15 years | | Total |
2023 | | £m | | £m | | £m | | £m | | £m |
Personal | | | | | | | | | | |
Mortgages |
| 10,607 |
| 38,432 |
| 83,824 |
| 74,574 |
| 207,437 |
Credit cards |
| 812 |
| 1,583 |
| 2,086 |
| 1,242 |
| 5,723 |
Other personal |
| 3,998 |
| 3,778 |
| 682 |
| 289 |
| 8,747 |
Wholesale |
| |
| |
|
|
| |
| |
Property |
| 6,122 |
| 16,170 |
| 6,003 |
| 2,417 |
| 30,712 |
Financial institutions |
| 77,976 |
| 11,512 |
| 1,689 |
| 6 |
| 91,183 |
Sovereign |
| 2,586 |
| 1,131 |
| 243 |
| 22 |
| 3,982 |
Corporate |
| 28,074 |
| 30,994 |
| 10,643 |
| 5,214 |
| 74,925 |
Total |
| 130,175 |
| 103,600 |
| 105,170 |
| 83,764 |
| 422,709 |
of which: |
|
|
|
|
|
|
|
|
|
|
Amortised cost |
|
|
| |
|
|
|
|
|
|
Fixed interest rates |
| 43,270 |
| 47,768 |
| 83,025 |
| 71,175 |
| 245,238 |
Variable interest rates |
| 53,424 |
| 55,338 |
| 21,894 |
| 12,453 |
| 143,109 |
Trading assets |
|
|
| |
|
|
|
|
|
|
Fixed interest rates |
| 17,698 |
| 90 |
| — |
| — |
| 17,788 |
Variable interest rates |
| 15,660 |
| 42 |
| 107 |
| — |
| 15,809 |
Other financial asset |
|
|
| |
|
|
|
|
|
|
Fixed interest rates |
| 32 |
| 1 |
| 10 |
| 105 |
| 148 |
Variable interest rates |
| 91 |
| 361 |
| 134 |
| 31 |
| 617 |
| |
NatWest Group – Annual Report on Form 20-F 2023 | 150 |
Analysis of change in net interest income - volume and rate analysis
Volume and rate variances have been calculated based on movements in average balances over the period and changes in interest rates on average interest-earning assets and average interest-bearing liabilities. Changes due to a combination of volume and rate are allocated pro rata to volume and rate movements.
| | | | | | | | | | | | | |
|
| | 2023 over 2022 - statutory | | 2022 over 2021 - statutory | ||||||||
| | | (Decrease)/increase due to changes in: | | (Decrease)/increase due to changes in: | ||||||||
| | | Average | | Average | | Net | | Average | | Average | | Net |
| | | volume | | rate | | change | | volume | | rate | | change |
|
|
| £m |
| £m |
| £m |
| £m |
| £m |
| £m |
Interest-earning assets | | | | | | | | | | | | | |
Loans to banks | UK | | (646) |
| 2,230 |
| 1,584 |
| 66 |
| 1,485 |
| 1,551 |
| Overseas | | — |
| 276 |
| 276 |
| 3 |
| 54 |
| 57 |
Loans to customers | UK | | 555 |
| 4,931 |
| 5,486 |
| 460 |
| 1,125 |
| 1,585 |
| Overseas | | (13) |
| 34 |
| 21 |
| (201) |
| 74 |
| (127) |
Other financial assets | UK | | 18 |
| 1,095 |
| 1,113 |
| (63) |
| 346 |
| 283 |
| Overseas | | (5) |
| 87 |
| 82 |
| (2) |
| 7 |
| 5 |
Total interest receivable of the banking business | UK | | (73) |
| 8,256 |
| 8,183 |
| 463 |
| 2,956 |
| 3,419 |
| Overseas | | (18) |
| 397 |
| 379 |
| (200) |
| 135 |
| (65) |
|
| | (91) |
| 8,653 |
| 8,562 |
| 263 |
| 3,091 |
| 3,354 |
| | | | | | | | | | | | | |
Interest-bearing liabilities |
| |
|
|
|
|
|
|
|
|
|
|
|
Bank deposits | UK | | (18) |
| (748) |
| (766) |
| (150) |
| (77) |
| (227) |
| Overseas | | 1 |
| (5) |
| (4) |
| (4) |
| (12) |
| (16) |
Customer deposits: demand | UK | | 17 |
| (1,235) |
| (1,218) |
| — |
| (194) |
| (194) |
| Overseas | | — |
| — |
| — |
| — |
| — |
| — |
Customer deposits: savings | UK | | 28 |
| (2,094) |
| (2,066) |
| (10) |
| 118 |
| 108 |
| Overseas | | — |
| — |
| — |
| 11 |
| 17 |
| 28 |
Customer deposits: other time | UK | | (633) |
| (471) |
| (1,104) |
| (97) |
| (54) |
| (151) |
| Overseas | | (12) |
| (130) |
| (142) |
| 1 |
| (7) |
| (6) |
Other financial liabilities | UK | | (203) |
| (1,545) |
| (1,748) |
| (50) |
| (457) |
| (507) |
| Overseas | | (9) |
| (49) |
| (58) |
| (2) |
| 6 |
| 4 |
Subordinated liabilities | UK | | 58 |
| (165) |
| (107) |
| 18 |
| (122) |
| (104) |
| Overseas | | (1) |
| 14 |
| 13 |
| (3) |
| 4 |
| 1 |
Internal funding of trading business | UK | | (9) |
| (146) |
| (155) |
| (1) |
| (63) |
| (64) |
| Overseas | | — |
| — |
| — |
| — |
| 1 |
| 1 |
Total interest payable of the banking business | UK | | (760) |
| (6,404) |
| (7,164) |
| (290) |
| (849) |
| (1,139) |
| Overseas | | (21) |
| (170) |
| (191) |
| 3 |
| 9 |
| 12 |
|
| | (781) |
| (6,574) |
| (7,355) |
| (287) |
| (840) |
| (1,127) |
|
| | | | | | | | | | | | |
| | | | | | | | | | | | | |
Movement in net interest income | UK | | (833) |
| 1,852 |
| 1,019 |
| 173 |
| 2,107 |
| 2,280 |
| Overseas | | (39) |
| 227 |
| 188 |
| (197) |
| 144 |
| (53) |
| | | (872) |
| 2,079 |
| 1,207 |
| (24) |
| 2,251 |
| 2,227 |
|
| | | | | | | | | | | | |
| |
NatWest Group – Annual Report on Form 20-F 2023 | 151 |
Analysis of debt securities - fair value through other comprehensive income
The following table analyses debt securities and the related yield (based on weighted averages) by remaining maturity and issuer:
| | | | | | | | | | | | | | | | | | | | |
| | Within 1 year | | After 1 but within 5 years | | After 5 but within 10 years | | After 10 years | | Total | ||||||||||
| | Amount | | Yield | | Amount | | Yield | | Amount | | Yield | | Amount | | Yield | | Amount | | Yield |
2023 |
| £m |
| % |
| £m |
| % |
| £m |
| % |
| £m |
| % |
| £m |
| % |
Central and local governments |
|
|
|
|
|
|
|
|
|
|
|
|
|
|
|
|
|
|
|
|
- UK |
| 3,442 |
| 0.1 |
| 620 |
| 4.1 |
| 640 |
| 2.0 |
| 1,739 |
| 3.4 |
| 6,441 |
| 1.5 |
- US |
| 255 |
| 1.4 |
| 3,690 |
| 2.4 |
| 1,310 |
| 3.2 |
| 262 |
| 3.3 |
| 5,517 |
| 2.6 |
- Other | | 2,147 |
| 0.6 |
| 2,323 |
| 2.0 |
| 1,123 |
| — |
| 145 |
| 2.1 |
| 5,738 |
| 1.6 |
Other debt |
| 2,124 |
| 2.2 |
| 6,887 |
| 2.8 |
| 1,418 |
| 2.5 |
| 198 |
| 3.4 |
| 10,627 |
| 2.6 |
|
| 7,968 |
| 0.8 |
| 13,520 |
| 2.6 |
| 4,491 |
| 2.6 |
| 2,344 |
| 3.3 |
| 28,323 |
| 2.2 |
Of which ABS (1) |
| 614 |
| 2.8 |
| 1,571 |
| 2.6 |
| 360 |
| 1.3 |
| 34 |
| 5.0 |
| 2,579 |
| 2.5 |
| | | | | | | | | | | | | | | | | | | | |
2022 |
|
|
|
|
|
|
|
|
|
|
|
|
|
|
|
|
|
|
|
|
Central and local governments |
|
|
|
|
|
|
|
|
|
|
|
|
|
|
|
|
|
|
|
|
- UK |
| — |
| — |
| 154 |
| 4.0 |
| 137 |
| 1.1 |
| 511 |
| 2.7 |
| 802 |
| 2.7 |
- US |
| 2,120 |
| 1.2 |
| 3,934 |
| 2.2 |
| 850 |
| 3.1 |
| 271 |
| 3.2 |
| 7,175 |
| 2.1 |
- Other |
| 1,168 |
| 0.6 |
| 501 |
| 0.9 |
| — |
| — |
| 88 |
| 2.9 |
| 1,757 |
| 0.8 |
Other debt |
| 1,099 |
| 1.3 |
| 4,232 |
| 1.9 |
| 1,309 |
| 1.3 |
| 125 |
| 2.1 |
| 6,765 |
| 1.7 |
|
| 4,387 |
| 1.0 |
| 8,821 |
| 2.1 |
| 2,296 |
| 1.9 |
| 995 |
| 2.8 |
| 16,499 |
| 1.8 |
Of which ABS (1) |
| 425 |
| 1.6 |
| 1,993 |
| 1.8 |
| 470 |
| 1.0 |
| 73 |
| 3.1 |
| 2,961 |
| 1.7 |
| | | | | | | | | | | | | | | | | | | | |
2021 |
|
|
|
|
|
|
|
|
|
|
|
|
|
|
|
|
|
|
|
|
Central and local governments |
|
|
|
|
|
|
|
|
|
|
|
|
|
|
|
|
|
|
|
|
- UK |
| 1,299 |
| 2.2 |
| 1,981 |
| 1.1 |
| 2,048 |
| 0.7 |
| 6,610 |
| 1.2 |
| 11,938 |
| 1.2 |
- US |
| 2,732 |
| 1.3 |
| 4,666 |
| 1.8 |
| 1,173 |
| 2.6 |
| 1,515 |
| 2.5 |
| 10,086 |
| 1.9 |
- Other |
| 1,763 |
| 0.5 |
| 2,667 |
| 0.7 |
| 390 |
| 1.0 |
| 784 |
| 1.6 |
| 5,604 |
| 0.8 |
Other debt |
| 1,840 |
| 0.8 |
| 5,030 |
| 0.8 |
| 1,987 |
| 0.6 |
| 201 |
| 0.6 |
| 9,058 |
| 0.7 |
|
| 7,634 |
| 1.1 |
| 14,344 |
| 1.1 |
| 5,598 |
| 1.1 |
| 9,110 |
| 1.4 |
| 36,686 |
| 1.2 |
Of which ABS (1) |
| 460 |
| 1.3 |
| 2,176 |
| 0.6 |
| 986 |
| 0.4 |
| 116 |
| 0.6 |
| 3,738 |
| 0.6 |
(1) | Includes covered bonds. |
| |
NatWest Group – Annual Report on Form 20-F 2023 | 152 |
Analysis of debt securities – amortised cost
The following table analyses debt securities at amortised cost and the related yield (based on weighted averages) by remaining maturity and issuer.
| | | | | | | | | | | | | | | | | | | | |
| | Within 1 year | | After 1 but within 5 years | | After 5 but within 10 years | | After 10 years | | Total | ||||||||||
| | Amount | | Yield | | Amount | | Yield | | Amount | | Yield | | Amount | | Yield | | Amount | | Yield |
2023 |
| £m |
| % |
| £m |
| % |
| £m |
| % |
| £m |
| % |
| £m |
| % |
Central and local governments |
|
|
|
|
|
|
|
|
|
|
|
|
|
|
|
|
|
|
|
|
- UK |
| 754 |
| 1.9 |
| 2,064 |
| 0.8 |
| 71 |
| 0.9 |
| — |
| — |
| 2,889 |
| 1.1 |
- US |
| 155 |
| 2.3 |
| 492 |
| 1.5 |
| — |
| — |
| — |
| — |
| 647 |
| 1.7 |
- Other |
| 18 |
| — |
| 17 |
| — |
| — |
| — |
| — |
| — |
| 35 |
| — |
Other debt |
| 1,198 |
| 2.7 |
| 4,987 |
| 4.5 |
| 4,410 |
| 1.2 |
| 7,529 |
| 1.1 |
| 18,124 |
| 2.1 |
Total |
| 2,125 |
| 2.3 |
| 7,560 |
| 3.3 |
| 4,481 |
| 1.2 |
| 7,529 |
| 1.1 |
| 21,695 |
| 2.0 |
| | | | | | | | | | | | | | | | | | | | |
2022 | | | | | | | | | | | | | | | | | | | | |
Central and local governments |
|
|
|
|
|
|
|
|
|
|
|
|
|
|
|
|
|
|
|
|
- UK |
| 811 |
| 1.5 |
| 1,330 |
| 1.5 |
| 421 |
| 0.6 |
| — |
| — |
| 2,562 |
| 1.3 |
- US |
| 297 |
| 0.9 |
| 640 |
| 0.9 |
| — |
| — |
| — |
| — |
| 937 |
| 0.9 |
- Other |
| 18 |
| 0.9 |
| 36 |
| 0.9 |
| — |
| — |
| — |
| — |
| 54 |
| 0.9 |
Other debt |
| 786 |
| 2.3 |
| 3,919 |
| 4.7 |
| 2,316 |
| 1.9 |
| 2,561 |
| 1.2 |
| 9,582 |
| 2.9 |
Total |
| 1,912 |
| 1.7 |
| 5,925 |
| 3.5 |
| 2,737 |
| 1.7 |
| 2,561 |
| 1.2 |
| 13,135 |
| 2.4 |
| | | | | | | | | | | | | | | | | | | | |
2021 |
|
|
|
|
|
|
|
|
|
|
|
|
|
|
|
|
|
|
|
|
Central and local governments |
|
|
|
|
|
|
|
|
|
|
|
|
|
|
|
|
|
|
|
|
- UK |
| 1,442 |
| 1.9 |
| 1,946 |
| 1.1 |
| 433 |
| 0.1 |
| — |
| — |
| 3,821 |
| 1.3 |
- US |
| 70 |
| 1.0 |
| 86 |
| 1.0 |
| — |
| — |
| — |
| — |
| 156 |
| 1.0 |
- Other |
| 29 |
| 1.0 |
| 52 |
| 1.0 |
| — |
| — |
| — |
| — |
| 81 |
| 1.0 |
Other debt |
| 1,580 |
| 2.3 |
| 501 |
| 4.2 |
| 655 |
| 2.7 |
| 1,768 |
| 0.7 |
| 4,504 |
| 2.0 |
Total |
| 3,121 |
| 2.1 |
| 2,585 |
| 1.7 |
| 1,088 |
| 1.7 |
| 1,768 |
| 0.7 |
| 8,562 |
| 1.6 |
| |
NatWest Group – Annual Report on Form 20-F 2023 | 153 |
Analysis of deposits - product analysis
The following table analyses deposits excluding repos by geographical area (location of office) and type of deposit.
| | | | | | |
| | 2023 | | 2022 | | 2021 |
|
| £m |
| £m |
| £m |
UK | | | | | | |
Deposits |
|
|
|
|
|
|
- interest-free |
| 142,865 |
| 174,337 |
| 180,077 |
- interest-bearing |
| 299,011 |
| 286,023 |
| 293,903 |
Total UK |
| 441,876 |
| 460,360 |
| 473,981 |
Overseas |
| |
|
|
|
|
Deposits |
|
|
|
|
|
|
- interest-free |
| 832 |
| 2,708 |
| 4,949 |
- interest-bearing |
| 14,402 |
| 16,213 |
| 24,546 |
Total overseas |
| 15,234 |
| 18,921 |
| 29,494 |
Total deposits |
| 457,110 |
| 479,281 |
| 503,475 |
Overseas |
|
|
|
|
|
|
US |
| 23 |
| 22 |
| 264 |
Rest of the World |
| 15,211 |
| 18,899 |
| 29,230 |
Total overseas |
| 15,234 |
| 18,921 |
| 29,494 |
| | | | | | |
Repos |
|
|
|
|
|
|
UK |
| 26,088 |
| 19,991 |
| 27,135 |
US |
| 13,371 |
| 14,647 |
| 13,956 |
Rest of the World |
| 1,405 |
| 377 |
| 750 |
Total repos |
| 40,864 |
| 35,015 |
| 41,842 |
Certificates of deposit and other time deposits
The following table shows certificates of deposit and other time deposits over $100,000 or equivalent by remaining maturity.
| | | | | | | | | | |
| | | | | | | | Over | |
|
| | 0-3 months | | 3-6 months | | 6-12 months | | 12 months | | Total |
2023 |
| £m |
| £m |
| £m |
| £m |
| £m |
UK based companies and branches |
|
|
|
|
|
|
|
|
|
|
Certificates of deposit |
| 2,154 |
| 2,386 |
| 1,469 |
| 811 |
| 6,820 |
Other time deposits |
| 21,139 |
| 9,812 |
| 11,034 |
| 16,763 |
| 58,748 |
Overseas based companies and branches |
|
|
|
|
|
|
|
|
|
|
Other time deposits |
| 3,384 |
| 583 |
| 197 |
| 346 |
| 4,510 |
|
| 26,677 |
| 12,781 |
| 12,700 |
| 17,920 |
| 70,078 |
2022 |
|
|
|
|
|
|
|
|
|
|
UK based companies and branches |
|
|
|
|
|
|
|
|
|
|
Certificates of deposit |
| 1,774 |
| 312 |
| 279 |
| 85 |
| 2,450 |
Other time deposits |
| 10,932 |
| 5,617 |
| 4,056 |
| 14,553 |
| 35,158 |
Overseas based companies and branches |
|
|
|
|
|
|
|
|
|
|
Other time deposits |
| 1,361 |
| 263 |
| 328 |
| 166 |
| 2,118 |
|
| 14,067 |
| 6,192 |
| 4,663 |
| 14,804 |
| 39,726 |
| |
NatWest Group – Annual Report on Form 20-F 2023 | 154 |
Time deposits
| | | | | | |
| | 2023 | | 2022 | | 2021 |
|
| £m |
| £m |
| £m |
US time deposits in excess of the Federal Deposit Insurance |
|
|
|
|
|
|
Corporation (FDIC) insurance limit |
| (60,194) |
| (39,149) |
| (25,623) |
| | | | | | |
Uninsured time deposits by maturity |
|
|
|
|
|
|
0-3 months |
| (17,797) |
| (12,573) |
| (5,411) |
3-6 months |
| (12,941) |
| (6,274) |
| (3,094) |
6-12 months |
| (11,034) |
| (4,889) |
| (2,877) |
Over 12 months |
| (18,422) |
| (15,414) |
| (14,241) |
Short-term borrowings
Short-term borrowings comprise repurchase agreements, borrowings from financial institutions, commercial paper and certificates of deposit. Derivative collateral received from financial institutions is excluded from the table, as are certain long-term borrowings.
| | | | | | | | | | |
| | At year end | | During the year | ||||||
| | | | Weighted average | | | | | | Weighted average |
| | Balance | | interest rate | | Maximum balance | | Average balance | | interest rate |
2023 |
| £bn |
| % |
| £bn |
| £bn |
| % |
Repos |
| 41 |
| 7.3 |
| 56 |
| 40 |
| 7.1 |
Financial institutions (1) |
| 55 |
| 1.2 |
| 62 |
| 58 |
| 0.9 |
Commercial paper |
| 4 |
| 4.5 |
| 8 |
| 6 |
| 3.7 |
Certificates of deposits |
| 7 |
| 4.8 |
| 7 |
| 5 |
| 4.6 |
Total |
| 107 |
| 3.9 |
| 133 |
| 109 |
| 3.5 |
| | | | | | | | | | |
2022 |
|
|
|
|
|
|
|
|
|
|
Repos |
| 35 |
| 1.5 |
| 58 |
| 47 |
| 0.9 |
Financial institutions (1) |
| 57 |
| 0.5 |
| 76 |
| 65 |
| 0.2 |
Commercial paper |
| 3 |
| 1.5 |
| 24 |
| 5 |
| 0.2 |
Certificates of deposits |
| 2 |
| 3.0 |
| 5 |
| 3 |
| 1.0 |
Total |
| 97 |
| 1.0 |
| 163 |
| 120 |
| 0.5 |
| | | | | | | | | | |
2021 |
|
|
|
|
|
|
|
|
|
|
Repos |
| 42 |
| (0.2) |
| 51 |
| 42 |
| (0.3) |
Financial institutions (1) |
| 65 |
| 0.1 |
| 70 |
| 64 |
| 0.1 |
Commercial paper |
| 4 |
| (0.1) |
| 5 |
| 4 |
| — |
Certificates of deposits |
| 5 |
| 0.1 |
| 5 |
| 4 |
| 0.1 |
Total |
| 116 |
| — |
| 131 |
| 114 |
| (0.1) |
(1) | Excludes derivative cash collateral of £15 billion at 31 December 2023 (2022 - £18 billion; 2021 - £18 billion); and 2023 average of £15 billion (2022 - £19 billion; 2021 - £18 billion). |
Balances are generally based on monthly data. Average interest rates during the year are computed by dividing total interest expense by the average amount borrowed. Weighted average interest rates at year end are for a single day and as such may reflect one-day market distortions, which may not be indicative of generally prevailing rates.
| |
NatWest Group – Annual Report on Form 20-F 2023 | 155 |
Other contractual cash obligations
The table below summarises other contractual cash obligations by payment date.
| | | | | | | | | | | | |
| | 0-3 months | | 3-12 months | | 1-3 years | | 3-5 years | | 5-10 years | | 10-20 years |
2023 |
| £m |
| £m |
| £m |
| £m |
| £m |
| £m |
| | | | | | | | | | | | |
Contractual obligations to purchase goods or services |
| 97 |
| 282 |
| 490 |
| 219 |
| 32 |
| — |
Total |
| 97 |
| 282 |
| 490 |
| 219 |
| 32 |
| — |
| | | | | | | | | | | | |
2022 |
|
|
|
|
|
|
|
|
|
|
|
|
| | | | | | | | | | | | |
Contractual obligations to purchase goods or services |
| 86 |
| 236 |
| 279 |
| 75 |
| 3 |
| — |
Total |
| 86 |
| 236 |
| 279 |
| 75 |
| 3 |
| — |
| | | | | | | | | | | | |
2021 |
|
|
|
|
|
|
|
|
|
|
|
|
| | | | | | | | | | | | |
Contractual obligations to purchase goods or services |
| 75 |
| 226 |
| 318 |
| 63 |
| — |
| — |
Total |
| 75 |
| 226 |
| 318 |
| 63 |
| — |
| — |
Undrawn formal facilities, credit lines and other commitments to lend were £112,807 million (2022 - £118,779 million; 2021 - £118,536million). While NatWest Group has given commitments to provide these funds, some facilities may be subject to certain conditions being met by the counterparty. NatWest Group does not expect all facilities to be drawn, and some may lapse before drawdown.
Exchange rates
The following tables show the Noon Buying Rate in New York for cable transfers in sterling as certified for customs purposes by the Federal Reserve Bank of New York.
| | | | | | | | | | | | |
| | January | | December | | November | | October | | September | | August |
US dollars per £1 |
| 2024 |
| 2023 |
| 2023 |
| 2023 |
| 2023 |
| 2023 |
Noon Buying Rate |
|
|
|
|
|
|
|
|
|
|
|
|
High |
| 1.2766 |
| 1.2797 |
| 1.2713 |
| 1.2304 |
| 1.2594 |
| 1.2775 |
Low |
| 1.2632 |
| 1.2527 |
| 1.2127 |
| 1.2069 |
| 1.2133 |
| 1.2570 |
| | | | | | | | | | | | |
|
| | | 2023 |
| 2022 |
| 2021 |
| 2020 |
| 2019 |
Noon Buying Rate |
| | |
|
|
|
|
|
|
|
|
|
Period end rate |
| | | 1.2743 |
| 1.2077 |
| 1.3500 |
| 1.3662 |
| 1.3269 |
Average rate for the year (1) |
| | | 1.2477 |
| 1.2323 |
| 1.3739 |
| 1.2923 |
| 1.2803 |
Consolidation rate (2) |
| | | | �� | |
|
|
|
|
|
|
Period end rate |
| | | 1.2746 |
| 1.2040 |
| 1.3486 |
| 1.3655 |
| 1.3200 |
Average rate for the year |
| | | 1.2437 |
| 1.2370 |
| 1.3755 |
| 1.2836 |
| 1.2771 |
| |
NatWest Group – Annual Report on Form 20-F 2023 | 156 |
Additional information on reverse repos and repos
The following table shows the value of reverse repos and repos included within the below balance sheet captions:
| | | | |
|
| 2023 |
| 2022 |
| | £m | | £m |
Reverse repos |
|
|
|
|
Trading assets |
| 23,694 |
| 21,537 |
Loans to banks - amortised cost |
| 794 |
| 277 |
Loans to customers - amortised cost |
| 27,117 |
| 19,750 |
| | | | |
Repos |
| |
|
|
Bank deposits |
| 3,118 |
| 1,446 |
Customer deposits |
| 10,844 |
| 9,829 |
Trading liabilities |
| 26,902 |
| 23,740 |
AT1 issuances
NatWest Group has issued certain capital instruments, AT1, under which reset clauses are linked to IBOR rates subject to reform. Where under the contractual terms of the instrument the coupon resets to a rate which has IBOR as a specified component of its pricing structure, these are subject to IBOR reform and listed below:
| | |
|
| 2021 |
NatWest Group | | £m |
US$1.15 billion 8% notes |
| 734 |
As part of its capital management activities NatWest Group plc has acquired certain equity instruments issued by its subsidiaries which contain reset clauses linked to IBOR rates subject to reform reported in investment in group undertakings. These are outlined below:
| | |
|
| 2021 |
NatWest Group plc | | £m |
USD$2 billion 8.0169% | | 1,581 |
£300 million 6.597% | | 300 |
USD$2.65 billion 7.9916% | | 1,161 |
USD$950 million 7.9604% | | 749 |
USD$200 million 5.540% | | 155 |
| |
NatWest Group – Annual Report on Form 20-F 2023 | 157 |
Interest rate benchmark reform
NatWest Group has no significant IBOR exposure as at 31 December 2023. During 2022, NatWest Group continued to work on the transition of USD IBOR exposures to risk free rates in advance of the cessation date of 30 June 2023. Derivatives were expected to transition during April and May 2023 and other exposures in line with fallback provisions or deferred switches using widely accepted methodologies. The instruments yet to transition reflected an insignificant element of NatWest Group’s exposures. Instruments with exposures to other rates transitioned at the end of 2021, or at the first contractual reset date, or at a date agreed with the counterparty. The level of exposures without explicit or agreed conversion provisions as of the preceding year were as follows:
| | | | | | | | |
| | NatWest Group | ||||||
| | Rates subject to IBOR reform | ||||||
| | GBP LIBOR | | USD IBOR | | Other IBOR | | Total |
2021 |
| £m |
| £m |
| £m |
| £m |
Trading assets |
| 62 |
| 90 |
| — |
| 152 |
Loans to banks - amortised cost |
| — |
| 11 |
| — |
| 11 |
Loans to customers - amortised cost |
| 4,788 |
| 4,565 |
| 267 |
| 9,620 |
Other financial assets |
| 864 |
| 768 |
| — |
| 1,632 |
| | | | | | | | |
Bank deposits |
| — |
| 37 |
| — |
| 37 |
Trading liabilities |
| 31 |
| 166 |
| — |
| 197 |
Other financial liabilities |
| 2,390 |
| 7,023 |
| 131 |
| 9,544 |
Subordinated liabilities |
| — |
| 90 |
| — |
| 90 |
| | | | | | | | |
Loan commitments (1) |
| 1,016 |
| 6,366 |
| 55 |
| 7,437 |
| | | | | | | | |
Derivatives notional (£bn) |
| 4 |
| 1,152 |
| — |
| 1,156 |
(1) | Certain loan commitments are multi-currency facilities. Where these are fully undrawn, they are allocated to the principal currency of the facility. Where the facilities are partly drawn, the remaining loan commitment is allocated to the currency with the largest drawn amount. |
At 31 December 2021, NatWest Group held certain currency swaps with both legs subject to IBOR reform, for which only the GBP LIBOR leg has an explicit or agreed conversion provisions as of 31 December 2021, but not the entire contract. These include currency swaps of GBP LIBOR of £8.7 billion with USD IBOR £8.2 billion and Other IBOR £0.5 billion; currency swaps of USD IBOR of £117 billion with GBP LIBOR £91.7 billion and Other IBOR £25.3 billion; currency swaps of EURIBOR of £0.1 billion with GBP LIBOR £0.1 billion; currency swaps of Other IBOR of £0.4 billion with USD IBOR £0.4 billion
NatWest Group plc has no significant IBOR exposure as at 31 December 2023. During 2022, NatWest Group plc continued to work on the transition of USD IBOR exposures to risk free rates in advance of the cessation date of 30 June 2023. Derivatives were expected to transition during April and May 2023 and other exposures in line with fallback provisions or deferred switches using widely accepted methodologies. The instruments yet to transition reflected an insignificant element of NatWest Group plc’s exposures. Instruments with exposures to other rates transitioned at the end of 2021, or at the first contractual reset date, or at a date agreed with the counterparty. The level of exposures without explicit or agreed conversion provisions as of the preceding year were as follows:
| | | | | | | | |
| | NatWest Group plc | ||||||
| | Rates subject to IBOR reform | ||||||
| | GBP LIBOR | | USD IBOR | | Other IBOR | | Total |
2021 |
| £m |
| £m |
| £m |
| £m |
Amounts due from subsidiaries |
| — |
| 9,338 |
| — |
| 9,338 |
Other financial assets |
| — |
| 665 |
| — |
| 665 |
| | | | | | | | |
Other financial liabilities |
| 1,320 |
| 7,055 |
| 97 |
| 8,472 |
Subordinated liabilities |
| — |
| 604 |
| — |
| 604 |
| | | | | | | | |
Derivatives notional - with subsidiaries (£bn) |
| — |
| 20.4 |
| — |
| 20.4 |
| |
NatWest Group – Annual Report on Form 20-F 2023 | 158 |
ADR payment information
Fees paid by ADR holders
The depositary collects its fees for delivery and surrender of ADSs directly from investors depositing shares or surrendering ADSs for the purpose of withdrawal or from intermediaries acting for them. The depositary collects fees for making distributions to investors by deducting those fees from the amounts distributed or by selling a portion of distributable property to pay the fees. The depository may collect its annual fee for depository services by deductions from cash distributions or by directly billing investors or by changing the book-entry system accounts of participants acting for them. The depository may generally refuse to provide fee-attracting services until its fees for those services are paid.
Persons depositing or withdrawing shares must pay: |
| For: |
$5.00 (or less) per 100 ADSs (or portion of 100 ADSs) |
| – Issuance of ADSs, including issuances resulting from a distribution of shares or rights or other property. – Cancellation of ADSs for the purpose of withdrawal, including if the deposit agreement terminates. |
|
| |
$0.02 (or less) per ADS |
| – Any cash distribution to ADS registered holders. |
|
|
|
A fee equivalent to the fee that would be payable if securities distributed to you had been shares and the shares had been deposited for issuance of ADSs |
| – Distribution of securities distributed to holders of securities of deposited securities to ADS registered holders. |
|
|
|
Registration or transfer fees |
| – Transfer and registration of shares on our share register to or from the name of the depository or its agent when you deposit or withdraw shares. |
|
|
|
Expenses of the depository |
| – Cable, telex and facsimile transmissions (when expressly provided in the deposit agreement). – Converting foreign currency to U.S. dollars. |
|
|
|
Taxes and other governmental charges the depositary or the custodian have to pay on any ADS or share underlying an ADS, for example, stock transfer taxes, stamp duty or withholding taxes |
| – As necessary. |
|
|
|
Any charges incurred by the depository or its agents for servicing the deposited securities |
| – As necessary. |
Fees payable by the depository to the issuer
Fees incurred in past annual Period
From 1 January 2023 to 31 December 2023, the company received from the depository $566,304 for continuing annual stock exchange listing fees, standard out-of-pocket maintenance costs for the ADRs (consisting of the expenses of postage and envelopes for mailing annual and interim financial reports, printing and distributing dividend cheques, electronic filling of U.S. Federal tax information, mailing required tax forms, stationary, postage, facsimile, and telephone calls), any applicable performance indicators relating to the ADR facility, underwriting fees and legal fees.
Fees to be paid in the future
The Bank of New York Mellon, as depository, has agreed to reimburse the company for expenses they incur that are related to establishment and maintenance expenses of the ADS program. The depository has agreed to reimburse the Company for its continuing annual stock exchange listing fees. The depository has also agreed to pay the standard out-of-pocket maintenance costs for the ADRs, which consist of the expenses of postage and envelopes for mailing annual and interim reports, printing and distributing dividend cheques, electronic filing of U.S. federal tax information, mailing required tax forms, stationary, postage, facsimile, and telephone calls. It has also agreed to reimburse the company annually for certain investor relationship programs of special investor relations promotional activities. In certain instances, the depository has agreed to provide additional payments to the company based on any applicable performance indicators relating to the ADR facility. There are limits on the amount of expenses for which the depository will reimburse the company, but the amount of reimbursement available to the company is not necessarily tied to the amount of fees the depository collects from investors.
| |
NatWest Group – Annual Report on Form 20-F 2023 | 159 |
Risk factors
Principal Risks and Uncertainties
Set out below are certain risk factors that could have a material adverse effect on NatWest Group’s future results, its financial condition and/or prospects and cause them to be materially different from what is forecast or expected, and directly or indirectly impact the value of its securities. These risk factors are broadly categorised and should be read in conjunction with other risk factors in this section and other parts of this annual report, including the forward-looking statements section, the strategic report and the risk and capital management section. They should not be regarded as a complete and comprehensive statement of all potential risks and uncertainties facing NatWest Group.
Economic and political risk
NatWest Group, its customers and its counterparties face continued economic and political risks and uncertainties in the UK and global markets, including as a result of inflation and interest rates, supply chain disruption, and geopolitical developments.
As a principally UK-focused banking group, NatWest Group is affected by global economic and market conditions and is, particularly exposed to those conditions in the UK. Uncertain and volatile economic conditions can create a challenging operating environment for financial services companies such as NatWest Group. The outlook for the UK and the global economy is affected by many factors including: GDP growth, inflation and changing interest rates, changing asset prices (including residential and commercial property), energy prices, supply chain disruption, and changes to monetary and fiscal policy.
These conditions could be exacerbated by a number of factors including: instability in the UK and/or global financial systems, market volatility and change, fluctuations in the value of the pound sterling, new or extended economic sanctions, economic volatility in the UK or globally, volatility in commodity prices, political uncertainty or instability (for example the upcoming US presidential election and the UK general election to take place before February 2025), or concerns regarding sovereign debt or sovereign credit ratings, changing demographics in the markets that NatWest Group and its customers serve, increasing social and other inequalities, rapid changes to the economic environment due to the adoption of technology, automation, artificial intelligence, or due to climate change and/or other sustainability-related risks. Refer to ‘Changes in interest rates will continue to affect NatWest Group’s business and results’ and ‘Fluctuations in currency exchange rates may adversely affect NatWest Group’s results and financial condition’.
NatWest Group is also exposed to risks arising out of geopolitical events or political developments that may hinder economic or financial activity levels. Political, military or diplomatic events, geopolitical tensions, armed conflict (for example the Russia-Ukraine and Israel-Hamas conflicts), terrorist acts or threats, protectionist policies or trade barriers, widespread public health crises, related potential adverse effects on supply chains and the responses to any of the above scenarios by various governments and markets, could negatively affect the business and performance of NatWest Group, including as a result of the direct or indirect impact on UK, regional or global trade and/or NatWest Group’s customers and counterparties.
In recent years, the UK has experienced significant political uncertainty and a general election will take place before February 2025. Heightened political uncertainty could lead to a loss of confidence in the UK that could, in turn, negatively impact the economy and companies operating in the UK. NatWest Group also faces political uncertainty in Scotland as a result of a possible Scottish independence referendum. Scottish independence may adversely affect NatWest Group plc both in relation to its entities incorporated in Scotland and in other jurisdictions. Any changes to Scotland’s relationship with the UK or the EU may adversely affect the environment in which NatWest Group plc and its subsidiaries operate and may require further changes to NatWest Group, independently or in conjunction with other mandatory or strategic structural and organisational changes, any of which could adversely affect NatWest Group. Refer to ‘Continuing uncertainty regarding the effects and extent of the UK’s post Brexit divergence from EU laws and regulation, and NatWest Group’s post Brexit EU operating model may adversely affect NatWest Group and its operating environment’.
The value of NatWest Group’s own and other securities may be materially affected by economic and market conditions. Market volatility, illiquid market conditions and disruptions in the financial markets may make it very difficult to value certain of NatWest Group’s own and other securities, particularly during periods of market displacement. This could cause a decline in the value of NatWest Group’s own and other securities, or inaccurate carrying values for certain financial instruments.
In addition, financial markets are susceptible to severe events evidenced by, or resulting in, rapid depreciation in asset values, which may be accompanied by a reduction in asset liquidity. Under these conditions, hedging and other risk management strategies may not be as effective at mitigating losses as they would be under more normal market conditions. Moreover, under these conditions, market participants are particularly exposed to trading strategies employed by many market participants simultaneously (and often automatically) and on a large scale, increasing NatWest Group’s counterparty risk. NatWest Group’s risk management and monitoring processes seek to quantify and mitigate NatWest Group’s exposure to extreme market moves.
However, market events have historically been difficult to predict, and NatWest Group, its customers and its counterparties could realise significant losses if extreme market events were to occur.
Any of the above may have a material adverse effect on NatWest Group’s future results, financial condition, prospects, and/or reputation.
Changes in interest rates will continue to affect NatWest Group’s business and results.
NatWest Group’s performance is affected by changes in interest rates. Benchmark overnight interest rates, such as the UK base rate, increased in 2023, although forward rates at 31 December 2023 suggested interest rates may begin to fall in 2024.
| |
NatWest Group – Annual Report on Form 20-F 2023 | 160 |
Risk factors continued
Stable interest rates support predictable income flow and less volatility in asset and liability valuations, although persistently low and negative interest rates may adversely affect NatWest Group. Further, volatility in interest rates may result in unexpected outcomes both for interest income and asset and liability valuations which may adversely affect NatWest Group. For example, unexpected movements in spreads between key benchmark rates such as sovereign and swap rates may in turn affect liquidity portfolio valuations. In addition, unexpected sharp rises in rates may also have negative impacts on some asset and derivative valuations.
Furthermore, customer and investor responses to rapid changes in interest rates can have an adverse effect on NatWest Group. For example, customers may make deposit choices that provide them with higher returns than those then being offered by NatWest Group, and NatWest Group may not respond with competitive products as rapidly, for example following an interest rate change, which may in turn decrease NatWest Group’s net interest income.
Movements in interest rates also influence and reflect the macroeconomic situation more broadly, affecting factors such as business and consumer confidence, property prices, default rates on loans, customer behaviour (which may adversely impact the effectiveness of NatWest Group’s hedging strategy) and other indicators that may indirectly affect NatWest Group.
Any of the above may have a material adverse effect on NatWest Group’s future results, financial condition, prospects, and/or reputation.
Fluctuations in currency exchange rates may adversely affect NatWest Group’s results and financial condition.
Decisions of central banks (including the Bank of England, the European Central Bank (ECB) and the US Federal Reserve) and political or market events, which are outside NatWest Group’s control, may lead to sharp and sudden fluctuations in currency exchange rates.
Although NatWest Group is principally a UK-focused banking group, it is subject to structural foreign exchange risk from capital deployed in NatWest Group’s foreign subsidiaries, branches and other strategic equity shareholdings. NatWest Group also relies on issuing securities in non-sterling currencies, such as US dollars and euros, that assist in meeting NatWest Group’s MREL requirements. In addition, NatWest Group conducts banking activities in non-sterling currencies (for example, loans, deposits and dealing activity) which affect its revenue. NatWest Group also uses service providers based outside of the United Kingdom for certain services and as a result certain operating results are subject to fluctuations in currency exchange rates.
NatWest Group maintains policies and procedures designed to manage the impact of its exposure to fluctuations in currency exchange rates.
Nevertheless, changes in currency exchange rates, particularly in the sterling-US dollar and sterling-euro rates, may adversely affect various accounting and financial metrics including, the value of assets, liabilities (including the total amount of MREL-eligible instruments), foreign exchange dealing activity, income and expenses, RWAs and hence the reported earnings and financial condition of NatWest Group.
Any of the above may have a material adverse effect on NatWest Group’s future results, financial condition, prospects, reputation, and/or its ability to meet regulatory capital adequacy requirements.
Continuing uncertainty regarding the effects and extent of the UK’s post Brexit divergence from EU laws and regulation, and NatWest Group’s post Brexit EU operating model may adversely affect NatWest Group and its operating environment.
As a result of the UK’s withdrawal from the EU, certain aspects of the services provided by NatWest Group require local licences or individual equivalence decisions (temporary or otherwise) by relevant regulators. In late 2021 the European Commission proposed legislation that would require non-EU firms to establish a branch or subsidiary in the EU before providing ‘banking services’ in the EU. When these proposals become law all ‘banking services’ provided by NatWest Group in the EU may be licensable activities in each EU member state in which it provides such services and member states may not be permitted to offer bilateral permissions to financial institutions outside the EU allowing them to provide such ‘banking services’, except in limited circumstances.
NatWest Group continues to evaluate its EU operating model, making adaptations as necessary. Changes to NatWest Group’s EU operating model have been, and may continue to be, costly and failure to receive regulatory permissions and/or further changes to its business operations, product offering, customer engagement, and regulatory requirements could result in further costs and/or regulatory sanction.
The long-term effects of Brexit and the uncertainty regarding NatWest Group’s EU operating model may adversely affect NatWest Group and its customers and counterparties who are themselves dependent on trading with the EU or personnel from the EU. The long-term effects of Brexit may also be exacerbated by wider UK and global macroeconomic trends and events.
| |
NatWest Group – Annual Report on Form 20-F 2023 | 161 |
Risk factors continued
Uncertainties remain as to the extent to which EU/EEA laws will diverge from UK law. For example, bank regulation in the UK may diverge from European bank regulation following the enactment of the Financial Services and Markets Act 2023 (‘FSMA 2023’) and the Retained EU Law (Revocation and Reform) Act 2023. In particular, FSMA 2023 provides for the revocation of Retained EU Law relating to financial services regulation but sets out that this process will likely take a number of years and that the intention is that specific retained EU laws will not be revoked until such time as replacement regulatory rules are in place. The actions taken by regulators in response to any new or revised bank regulation and other rules affecting financial services, may adversely affect NatWest Group, including its business, non-UK operations, group structure, compliance costs, intragroup arrangements and capital requirements.
Any of the above may have a material adverse effect on NatWest Group’s future results, financial condition, prospects, and/or reputation.
HM Treasury (or UKGI on its behalf) could exercise a significant degree of influence over NatWest Group and further offers or sales of NatWest Group’s shares held by HM Treasury may affect the price of NatWest Group securities.
In its Autumn Statement 2023 (presented on 22 November 2023), the UK Government confirmed its commitment to exiting its shareholding in NatWest Group plc, subject to market conditions. It also stated that it “intends to fully exit by 2025-26 utilising a range of disposal methods” and “will explore options to launch a share sale to retail investors in the next twelve months, subject to supportive market conditions”.
NatWest Group plc has most recently: (i) carried out a directed buyback of NatWest Group plc ordinary shares from HM Treasury in May 2023, and (ii) made purchases under NatWest Group plc’s on-market buyback programmes announced in July 2023 and February 2024. NatWest Group plc may participate in similar directed or on-market buybacks in the near- and medium-term future. As at 8 January 2024, HM Treasury held 36.94% of the ordinary share capital with voting rights of NatWest Group plc. Achievement of the UK Government’s Autumn Statement 2023 objective is likely to entail it selling a significant number of NatWest Group plc’s shares. The precise timing, method and extent of further HM Treasury’s disposal of NatWest Group plc’s shares may be driven by economic as well as other considerations and is uncertain, which could result in a prolonged period of price volatility for NatWest Group plc’s ordinary shares and its (and NatWest Group’s) other securities.
Any offers or sales of a substantial number of ordinary shares in NatWest Group plc by HM Treasury (including at a discount or with other incentives), market expectations about these offers or sales, or perceptions about the success or failure of any offers or sales (including for example, media or public attention on any such offering or post-offer share price performance), and any directed, on-or off- market buyback activity by NatWest Group plc, could affect the prevailing market price for the outstanding ordinary shares of NatWest Group plc and, in the case of a directed, on-or off-market buyback, could reduce NatWest Group plc’s capital and liquidity, which may have an adverse effect on NatWest Group.
HM Treasury has indicated that it intends to respect the commercial decisions of NatWest Group and that NatWest Group will continue to have its own independent board of directors and management team determining its own strategy. However, for as long as HM Treasury remains NatWest Group plc’s largest single shareholder, HM Treasury and UK Government Investments Limited (‘UKGI’) (as manager of HM Treasury’s shareholding) could exercise a significant degree of influence over NatWest Group including: the election or removal of directors, the appointment or removal of senior management, NatWest Group’s capital strategy, dividend policy, remuneration policy or the conduct of NatWest Group’s operations. HM Treasury or UKGI’s approach largely depends on government policy, which could change.
The manner in which HM Treasury or UKGI exercises HM Treasury’s rights as NatWest Group’s largest single shareholder could give rise to conflicts between the interests of HM Treasury and the interests of other shareholders, including as a result of a change in government policy, which may in turn adversely affect NatWest Group.
Any of the above may have a material adverse effect on NatWest Group’s future results, financial condition, prospects, and/or reputation.
Strategic risk
NatWest Group continues to implement its strategy, which carries significant execution and operational risks and it may not achieve its stated aims and targeted outcomes.
NatWest Group continues to implement its strategy, which is intended to reflect the rapidly shifting environment and backdrop of significant disruption in society driven by technology and changing customer expectations. Further, shifting trends include digitalisation, decarbonisation, automation, artificial intelligence, e-commerce and hybrid working, each of which has resulted in significant market volatility and change. There is also increasing investor, employee, stakeholder, regulatory and customer scrutiny regarding how businesses address these changes and related environmental challenges, including climate change, biodiversity and other sustainability issues, including how NatWest Group supports its customers’ transition to net zero, is tackling inequality, working conditions, workplace health, safety and wellbeing, diversity and inclusion, data protection and management, workforce management, human rights and supply chain management.
| |
NatWest Group – Annual Report on Form 20-F 2023 | 162 |
Risk factors continued
In recent years, as part of its strategy, NatWest Group has refocused its NatWest Markets business, and has also created the Commercial & Institutional business segment. This business segment combines the previously separately reporting Commercial, NatWest Markets and RBS International businesses to form a single business segment, which focuses on serving Commercial & Institutional customers. It was created to promote closer operational and strategic alignment to support growth, with more integrated services to customers across NatWest Group entities within and outside the ring-fenced banks, with the potential increased risk of breach of the UK ring-fencing regime requiring effective conflicts of interest policies.
Many factors may adversely impact the successful implementation of NatWest Group’s strategy and the delivery of its intended benefits, including:
| - | macroeconomic challenges including GDP growth, inflation, changing interest rates, changing asset prices (including residential and commercial property), energy prices, supply chain disruption, changes to monetary and fiscal policy, and the impact of armed conflict, which may adversely affect NatWest Group’s customers, and which could in turn impact adversely certain strategic initiatives and new venture opportunities for NatWest Group; |
| - | changing customer expectations and behaviour in response to macroeconomic conditions or developments, technology and other factors which could reduce the profitability, competitiveness, or volume of the services NatWest Group offers; |
| - | the rapid emergence and rapid deployment of new technologies (such as artificial intelligence, quantum computing, blockchain and digital currencies) resulting in a potential shift across the market towards products and services that are not part of NatWest Group’s core offering today; |
| - | increased competitive threats from incumbent banks, fintech companies, large technology conglomerates and other new market entrants (including those that emerge from mergers and consolidations) who may have competitive advantages in terms of scale, technology and customer engagement; |
| - | uncertainties regarding, or changes by, the senior leadership of NatWest Group; and |
| - | changes to the regulatory environment and associated requirements which could lead to shifts in operating cost and regulatory capital requirements, that impact NatWest Group’s product offerings and business models (refer to ‘NatWest Group’s businesses are subject to substantial regulation and oversight, which are constantly evolving and may adversely affect NatWest Group; and NatWest Group could incur losses or be required to maintain higher levels of capital as a result of limitations or failure of various models.’) |
Delivery of NatWest Group’s strategy will require:
| – | maintaining effective governance, procedures, systems and controls giving effect to NatWest Group’s strategy; |
| – | managing a broad range of risks and opportunities related to changes in the macroeconomic environment, customer expectations and behaviour, technology, regulation and competition alongside the emerging risks and opportunities associated with climate and other sustainability-related areas; |
| – | achieving a number of financial, capital and operational targets and expectations within the relevant timeframe, or at all; and |
| – | continued cost-controlling measures, which may result in provisions in connection to a lower NatWest Group’s cost base, may divert investment from other areas, and may vary considerably from year to year. |
In pursuing its strategy, NatWest Group may not be able to successfully: (i) implement some or all aspects of its strategy; (ii) meet any or all of the related targets or expectations of its strategy; and otherwise realise the anticipated benefits of its strategy, in a timely manner, or at all; or (iii) realise the intended strategic objectives of any other future strategic or growth initiative. The scale and scope of its strategy and the intended changes continue to present material business, operational and regulatory (including compliance with the UK ring-fencing regime), conflicts, legal, execution, IT system, cybersecurity, internal culture, conduct and people risks to NatWest Group. Implementing changes and strategic actions, including in respect of any growth initiatives, requires the effective application of robust governance and controls frameworks and robust IT systems and there is a risk that NatWest Group may not be successful in all these respects. The ongoing implementation of NatWest Group’s strategy could result in materially higher costs than initially contemplated (including due to material uncertainties and factors outside of NatWest Group’s control) and may not be completed as planned (both in terms of substantive targets and timing), or at all. This could lead to additional management actions by NatWest Group.
Each of these risks, and others identified in these Principal Risks and Uncertainties, individually or collectively could jeopardise the implementation and delivery of NatWest Group’s strategy, impact NatWest Group’s products and services offering, its reputation with customers or business model and adversely affect NatWest Group’s ability to deliver its strategy and meet its targets and guidance.
Any of the above may have a material adverse effect on NatWest Group’s future results, financial condition, prospects, and/or reputation.
Acquisitions, divestments, other strategic transactions and/or the withdrawal from the Republic of Ireland by NatWest Group may not be successful, and consolidation or fragmentation of the financial services industry may adversely affect NatWest Group.
The financial services industry is experiencing continued competitive pressure resulting from technological advancement that disrupts traditional business models and from incumbent banks, fintech companies, large technology conglomerates and other new market entrants. To compete effectively, NatWest Group may decide, as part of its strategy, to undertake acquisitions, investments, the purchase of assets and liabilities, divestments, restructurings, reorganisations, joint ventures and other strategic partnerships, as well as other transactions and initiatives.
| |
NatWest Group – Annual Report on Form 20-F 2023 | 163 |
Risk factors continued
In addition, NatWest Group may decide to grow its business through these transactions and initiatives to, amongst others: (i) enhance capabilities that may lead to better productivity or cost efficiencies; (ii) acquire talent; (iii) pursue new products or expand existing products; and/or (iv) enter new markets or enhance its presence in existing markets.
In pursuing its strategy, NatWest Group may not fully realise the expected benefits and value from the above-mentioned transactions and initiatives in the time, or to the degree, anticipated, or at all. In particular, NatWest Group may: (i) fail to realise the business rationale for the transaction or initiative, or rely on assumptions underlying the business plans supporting the valuation of a target transaction or initiative that may prove inaccurate, for example, regarding synergies and expected commercial demand; (ii) fail to successfully integrate any acquired businesses, investment, joint-venture or assets (including in respect of technologies, existing strategies, products, governance, systems and controls, and human capital) or to successfully divest or restructure a business; (iii) fail to retain key employees, customers and suppliers of any acquired or restructured business; (iv) be required or wish to terminate pre-existing contractual relationships, which could prove costly and/or be executed at unfavourable terms and conditions; (v) fail to discover certain contingent or undisclosed liabilities in businesses that it acquires, or its due diligence to discover any such liabilities may be inadequate; (vi) not obtain necessary regulatory and other approvals or onerous conditions may be attached to such approvals; and (vii) compete with existing larger banks or financial institutions (and those that emerge from mergers and consolidations) or other larger entities offering financial services products that may have more bargaining power in negotiations than NatWest Group. Accordingly, NatWest Group may not be successful in changing its business and any particular transaction may not succeed, may be limited in scope or scale (including due to NatWest Group’s current ownership structure) and may not conclude on the terms contemplated, or at all.
For example, in the context of divestments, the remaining phases of NatWest Group’s phased withdrawal from ROI entails commercial, operational, reputational, legal and execution risks, as it will require transfers of business, assets and liabilities. These risks include: (i) inability to return capital from Ulster Bank Ireland DAC to its parent or additional costs for its parent; (ii) higher than anticipated recognition of disposal losses as part of the orderly run-down of certain loan portfolios; (iii) execution risks and additional operational expense and resource to facilitate exit; (iv) the inability to obtain necessary approvals and/or support from governmental authorities, regulators and/or other stakeholders; (v) potential loss of colleagues; (vi) regulatory risk, including in relation to prudential, conduct and other regulatory requirements; (vii) brand and/or reputational risks and stakeholder scrutiny about the phased withdrawal from ROI. These risks and uncertainties may result in the withdrawal costing more, taking more time, being more complex or harder to mitigate than currently estimated. These risks and other divestment risks may have a material adverse effect on NatWest Group’s future results, financial condition, prospects, reputation, or its ability to complete its phased withdrawal from ROI.
Continued competitive pressure in the financial services industry from both established and new market entrants such as technology companies, may have a negative impact on NatWest Group’s business. Existing larger banks or financial institutions (and those that emerge from mergers and consolidations) or other larger entities offering financial services products may have more bargaining power in negotiations than NatWest Group and therefore may be in a position to extract more advantageous terms than NatWest Group. Refer to ‘NatWest Group operates in markets that are highly competitive, with competitive pressures and technology disruption’.
Any of the above may have a material adverse effect on NatWest Group’s future results, financial condition, prospects, and/or reputation.
The transfer of NatWest Group’s Western European corporate portfolio involves certain risks.
To improve efficiencies and best serve customers following Brexit, NatWest Group expects that certain of its assets, liabilities, transactions and activities (including NatWest Group’s Western European corporate portfolio principally consisting of term funding and revolving credit facilities), may be: (i) transferred from the ring-fenced subgroup of NatWest Group to NWM Group and/or (ii) transferred to the ring-fenced subgroup of NatWest Group from NWM Group, subject to regulatory and customer requirements. The timing, success and quantum of any of these transfers remain uncertain as is the impact of these transactions on its results of operations.
As a result, this may have a material adverse effect on NatWest Group’s future results, financial condition, prospects, and/or reputation.
Financial resilience risk
NatWest Group may not achieve its ambitions, targets, guidance it communicates or be in a position to continue to make discretionary capital distributions (including dividends to shareholders).
As part of NatWest Group’s strategy, it has set a number of financial, capital and operational targets including in respect of its: CET1 ratio target, MREL targets, return on tangible equity (ROTE), funding plans and requirements, employee engagement, diversity and inclusion as well as climate-related targets (including its climate and sustainable funding and financing targets) and customer satisfaction targets and discretionary capital distributions (including dividends to shareholders). Refer to ‘NatWest Group continues to implement its strategy, which carries significant execution and operational risks and may not achieve its stated aims and targeted outcomes.’
NatWest Group’s ability to meet its ambitions, targets and guidance and make discretionary capital distributions is subject to various internal and external factors, risks and uncertainties. These include but are not limited to: UK and global macroeconomic, political, market and regulatory uncertainties, operational risks and risks relating to NatWest Group’s business model and strategy (including risks associated with climate and other sustainability-related issues), competitive pressures, and litigation, governmental actions, investigations and regulatory matters. If assumptions, judgements and estimates (for example about future economic conditions) prove to be incorrect NatWest Group may not achieve any or all or its ambitions, targets, or guidance.
| |
NatWest Group – Annual Report on Form 20-F 2023 | 164 |
Risk factors continued
In addition, as NatWest Group plc is a non-operating holding company, its source of income is from its operating subsidiaries that hold the principal assets and operations of NatWest Group and its ability to continue to make capital distributions (including dividends to shareholders) is therefore subject to such subsidiaries’ financial performance, and their respective ability to make capital distributions directly or indirectly to NatWest Group plc which, in certain cases, could also be restricted by applicable laws, regulations and other requirements.
Refer to ‘NatWest Group, its customers and its counterparties face continued economic and political risks and uncertainties in the UK and global markets, including as a result of inflation and interest rates, supply chain disruption and geopolitical developments.’
Any failure of NatWest Group to achieve ambitions, targets or guidance, or make discretionary capital distributions may have a material adverse effect on NatWest Group’s future results, financial condition, prospects, and/or reputation.
NatWest Group operates in markets that are highly competitive, with competitive pressures and technology disruption.
The markets within which NatWest Group operates are highly competitive. NatWest Group expects competition to continue and intensify in response to various changes including: evolving customer behaviour, technological changes (including digital currencies and other instruments, stablecoins and the growth of digital banking, such as from fintech entrants), competitor behaviour, new entrants to the market (including non-traditional financial services providers such as retail or technology conglomerates, who may have competitive advantages in scale, technology and customer engagement), competitive foreign exchange offerings, industry trends resulting in increased disaggregation or unbundling of financial services or conversely the re-intermediation of traditional banking services, and the impact of regulatory actions and other factors. In particular, developments in the financial sector resulting from new (or more competitive) banking, lending and payment products and services offered by rapidly evolving incumbents, challengers (including shadow banks and alternative lenders, i.e. entities which carry out activities of a similar nature to banks but without the same regulatory oversight) and new entrants such as technology companies (which may result in a shift in customer behaviour) and the introduction of disruptive technology, may impede NatWest Group’s ability to grow or retain its market share and impact its revenues and profitability, particularly in its key UK retail and commercial and institutional banking segments. Moreover, innovations such as biometrics, artificial intelligence (including generative artificial intelligence), automation, the cloud, blockchain, cryptocurrencies and quantum computing may rapidly facilitate industry transformation.
Some of these trends have been catalysed by various regulatory and competition policy interventions, including the UK initiative on Open Banking, ‘Open Finance’ and other remedies imposed by the Competition and Markets Authority (‘CMA’), which are designed to further promote competition within the financial sector (including banking). The competition enhancing measures under NatWest Group’s independently administered Alternative Remedies Package (ARP) benefit grant recipients and eligible competitors. The ARP may be more costly than anticipated and may adversely affect NatWest Group’s competitive position and/or reputation. Failure to comply with the terms of the ARP scheme could result in the imposition of additional measures or limitations on NatWest Group’s operations, additional supervision by NatWest Group’s regulators, and loss of investor confidence.
Increasingly, many of the products and services offered by NatWest Group are, and will become, more technology intensive, including through digitalisation and the use of artificial intelligence. For example, NatWest Group has invested in a number of fintech ventures, including Mettle, FreeAgent, Tyl, Rapid Cash, Rooster Money, Vodeno and Cushon. NatWest Group’s ability to develop or acquire such digital solutions (which also need to comply with applicable and evolving regulations) and their integration in NatWest Group’s systems and controls has become increasingly important to retaining and growing NatWest Group’s competitiveness, market share and customer-facing businesses in the UK or elsewhere. There is a risk that NatWest Group’s innovation strategy, which includes investment in its IT capability intended to address the material increase in customer and merchant use of online and mobile technology for banking as well as selective acquisitions, which carry associated risks will be successful or that it will allow NatWest Group to successfully offer innovative products and services in the future. For example, NatWest Group’s current or future competitors may be more successful than NatWest Group in implementing technologies for delivering products or services to their customers, which may adversely affect its competitive position. NatWest Group may also fail to identify future opportunities or fail to derive benefits from technologies in a context of technological innovation, changing customer behaviour and changing regulatory demands, resulting in increased competition from traditional banking businesses as well as new providers of financial services, including technology conglomerates with strong brand recognition, that may be able to develop financial services at a lower cost base.
NatWest Group’s competitors may also be better able to attract and retain customers and key employees, may have more effective IT systems, and may have access to lower cost funding and/or be able to attract deposits on more favourable terms than NatWest Group. Although NatWest Group invests in new technologies and participates in industry and research-led initiatives aimed at developing new technologies, such investments may be insufficient or ineffective, especially given NatWest Group’s focus on cost efficiencies. This could affect NatWest Group’s ability to offer innovative products or technologies for delivering products or services to customers and its competitive position.
Furthermore, the development of innovative products depends on NatWest Group’s ability to effectively produce, acquire, or manage underlying high-quality data, failing which its ability to offer innovative products may be compromised.
| |
NatWest Group – Annual Report on Form 20-F 2023 | 165 |
Risk factors continued
If NatWest Group is unable to offer competitive, attractive and innovative products that are also profitable and rolled out in a timely manner; it will lose market share, incur losses on some or all of its initiatives and lose opportunities for growth. In this context, NatWest Group is investing in the automation of certain solutions and interactions within its customer-facing businesses, including through automated processes and artificial intelligence. Such initiatives may result in operational, reputational and conduct risks if the technology used is not used appropriately, is defective, inadequate or is not fully integrated into NatWest Group’s current solutions, systems and controls. There can be no certainty that such initiatives will deliver the expected cost savings and investment in technology (including automated processes and artificial intelligence) will likely also result in increased costs for NatWest Group.
In addition, the implementation of NatWest Group’s strategy (including in relation to acquisitions, divestments, reorganisations and/or partnerships), delivery on its climate ambition, cost-controlling measures, as well as employee remuneration constraints, may also have an impact on its ability to compete effectively. Intensified competition from incumbents, challengers and new entrants as well as disintermediation by large technology companies could affect NatWest Group’s ability to maintain satisfactory returns. Moreover, activist investors have increasingly become engaged and interventionist in recent years, which may pose a threat to NatWest Group’s strategic initiatives. Furthermore, continued consolidation or technological or other developments in the financial services industry could result in NatWest Group’s competitors gaining greater capital and other resources, including the ability to offer a broader and more attractive or better value range of products and services and geographic diversity, or the emergence of new competitors.
Any of the above may have a material adverse effect on NatWest Group’s future results, financial condition, prospects, and/or reputation.
NatWest Group has significant exposure to counterparty and borrower risk including credit losses, which may have an adverse effect on NatWest Group.
NatWest Group has exposure to many different sectors, customers and counterparties, and risks arising from actual or perceived changes in credit quality and the recoverability of monies due from borrowers and other counterparties are inherent in a wide range of NatWest Group’s businesses. NatWest Group’s lending strategy and associated processes and systems may fail to identify, anticipate or quickly react to weaknesses or risks in a particular sector, market, borrower or counterparty, or NatWest Group’s credit risk appetite relative to competitors, or fail to appropriately value physical or financial collateral. This may result in increased default rates or a higher loss given default for loans, which may, in turn, impact NatWest Group’s profitability. Refer to ‘Risk and capital management — Credit Risk’.
The credit quality of NatWest Group’s borrowers and other counterparties may be affected by UK and global macroeconomic and political uncertainties, prevailing economic and market conditions. These include factors relating to interest rates and inflation, changing asset prices (including residential and commercial property), energy prices, supply chain disruption, changes to monetary and fiscal policy, the impact of armed conflict, and the legal and regulatory landscape in the UK and countries where NatWest Group is exposed to credit risk. Any further deterioration in these conditions or changes to legal or regulatory landscapes could worsen borrower and counterparty credit quality or impact the enforcement of contractual rights, increasing credit risk.
Any increase in drawings upon credit facilities may also increase NatWest Group’s RWAs. In addition, the level of household indebtedness (on a per capita basis) in the UK remains high. The ability of households and businesses to service their debts could be worsened by a period of high unemployment, or high interest rates or inflation, particularly if prolonged.
NatWest Group may be affected by volatility in property prices (including as a result of UK political or economic conditions) given that NatWest Group’s mortgage loan and wholesale property loan portfolios as at 31 December 2023 amounted to £239.5 billion, representing 61% of NatWest Group’s total loan exposure. If property prices in the UK were to weaken this could lead to higher impairment charges, particularly if default rates also increase. In addition, NatWest Group’s credit risk may be exacerbated if the collateral that it holds cannot be realised as a result of market conditions, regulatory intervention, or other applicable laws, or if it is liquidated at prices not sufficient to recover the net amount outstanding to NatWest Group after accounting for any IFRS 9 provisions already made. This is most likely to occur during periods of illiquidity or depressed asset valuations.
NatWest Group is exposed to the financial sector, including sovereign debt securities, financial institutions, financial intermediation providers (including providing facilities to financial sponsors and funds, backed by assets or investor commitments) and securitised products (typically senior lending to special purpose vehicles backed by pools of financial assets). Concerns about, or a default by, a financial institution or intermediary could lead to significant liquidity problems and losses or defaults by other financial institutions or intermediaries, since the commercial and financial soundness of many financial institutions and intermediaries is closely related and interdependent as a result of credit, trading, clearing and other relationships. Any perceived lack of creditworthiness of a counterparty or borrower may lead to market-wide liquidity problems and losses for NatWest Group. This systemic risk may also adversely affect financial intermediaries, such as clearing agencies, clearing houses, banks, securities firms and exchanges with which NatWest Group interacts on a regular basis. Refer to ‘NatWest Group may not meet the prudential regulatory requirements for liquidity and funding or may not be able to adequately access sources of liquidity and funding, which could trigger the execution of certain management actions or recovery options.’
As a result, adverse changes in borrower and counterparty credit risk may cause additional impairment charges under IFRS 9, increased repurchase demands, higher costs, additional write-downs and losses for NatWest Group and an inability to engage in routine funding transactions. If NatWest Group experiences losses and a reduction in profitability, this is likely to affect the recoverable value of fixed assets, including goodwill and deferred taxes, which may lead to write-downs.
| |
NatWest Group – Annual Report on Form 20-F 2023 | 166 |
Risk factors continued
NatWest Group has applied an internal analysis of multiple economic scenarios (MES) together with the determination of specific overlay adjustments to inform its IFRS 9 ECL (Expected Credit Loss). The recognition and measurement of ECL is complex and involves the use of significant judgement and estimation. This includes the formulation and incorporation of multiple forward-looking economic scenarios into ECL to meet the measurement objective of IFRS 9. The ECL provision is sensitive to the model inputs and economic assumptions underlying the estimate. Going forward, NatWest Group anticipates observable credit deterioration of a proportion of assets resulting in a systematic uplift in defaults, which is mitigated by those economic assumption scenarios being reflected in the Stage 2 ECL across portfolios, along with a combination of post model overlays in both wholesale and retail portfolios reflecting the uncertainty of credit outcomes.
Refer to ‘Risk and capital management – Credit Risk’. A credit deterioration would also lead to RWA increases. Furthermore, the assumptions and judgements used in the MES and ECL assessment at 31 December 2023 may not prove to be adequate resulting in incremental ECL provisions for NatWest Group.
Due to NatWest Group’s exposure to the financial industry, it also has exposure to shadow banking entities. NatWest Group is required to identify and monitor its exposure to shadow banking entities, implement and maintain an internal framework for the identification, management, control and mitigation of the risks associated with exposure to shadow banking entities, and ensure effective reporting and governance in respect of such exposure. If NatWest Group is unable to properly identify and monitor its shadow banking exposure, maintain an adequate framework, and/or ensure effective reporting and governance in respect of shadow banking exposure, this may adversely affect NatWest Group.
In line with certain mandated COVID-19 pandemic support schemes, NatWest Group assisted customers with a number of initiatives including NatWest Group’s participation in BBLS, CBILS and CLBILS products. NatWest Group sought to manage the risks of fraud and money laundering against the need for the fast and efficient release of funds to customers and businesses. NatWest Group may be exposed to fraud, conduct and litigation risks arising from inappropriate approval (or denial) of BBLS, CBILS or CLBILS or the enforcing or pursuing repayment of BBLS, CBILS and CLBILS (or a failure to exercise forbearance), which may have an adverse effect on NatWest Group’s reputation and results of operations. The implementation of the initiatives and efforts mentioned above may result in litigation, regulatory and government actions and proceedings. These actions may result in judgements, settlements, penalties, fines, or removal of recourse to the government guarantee provided under those schemes for impacted loans.
Any of the above may have a material adverse effect on NatWest Group’s future results, financial condition, prospects, and/or reputation.
NatWest Group may not meet the prudential regulatory requirements for liquidity and funding or may not be able to adequately access sources of liquidity and funding, which could trigger the execution of certain management actions or recovery options.
Liquidity and the ability to raise funds continues to be a key area of focus for NatWest Group and the industry as a whole. NatWest Group is required by regulators in the UK, the EU and other jurisdictions in which it undertakes regulated activities to maintain adequate liquidity and funding resources. To satisfy its liquidity and funding requirements, NatWest Group may therefore access sources of liquidity and funding through retail and wholesale deposits, as well as through the debt capital markets. As at 31 December 2023, NatWest Group plc subsidiaries held £453.6 billion in deposits from banks and customers.
The level of deposits may fluctuate due to factors outside NatWest Group’s control, such as a loss of customers, loss of customer and/or investor confidence (including in individual NatWest Group entities and as a result of volatility in the financial industry), changes in customer behaviour, changes in interest rates, government support, increasing competitive pressures for retail and corporate customer deposits or the reduction or cessation of deposits by wholesale depositors, which could result in a significant outflow of deposits within a short period of time. An inability to grow or any material decrease in NatWest Group’s deposits could, particularly if accompanied by one or more of the other factors mentioned above, adversely affect NatWest Group’s ability to satisfy its liquidity or funding needs, or comply with its related regulatory requirements. In turn, this could require NatWest Group to adapt its funding plans or change its operations.
Macroeconomic developments, political uncertainty, changes in interest rates, and market volatility could affect NatWest Group’s ability to access sources of liquidity and funding on satisfactory terms, or at all. This may result in higher funding costs and failure to comply with regulatory capital, funding and leverage requirements. As a result, NatWest Group and its subsidiaries could be required to change their funding plans. This could exacerbate funding and liquidity risk, which may adversely affect NatWest Group.
As at 31 December 2023, NatWest Group plc’s liquidity coverage ratio was 144% and net stable funding ratio was 133%. If its liquidity position and/or funding were to come under stress, and if NatWest Group were unable to raise funds through deposits, in the debt capital markets or through other reliable funding sources, on acceptable terms, or at all, its liquidity position would likely be adversely affected and it might be unable to meet deposit withdrawals on demand or at their contractual maturity, to repay borrowings as they mature, to meet its obligations under committed financing facilities, to comply with regulatory funding requirements, to undertake certain capital and/or debt management activities, and/or to fund new loans, investments and businesses or make capital distributions to its shareholders.
If, under a stress scenario, the level of liquidity falls outside of NatWest Group’s risk appetite, there are a range of recovery management actions that NatWest Group could take to manage its liquidity levels, but any such actions may not be sufficient to restore adequate liquidity levels and the related implementation may have adverse consequences for NatWest Group’s operations. Under the EU Bank Recovery and Resolution Directives I and II (BRRD), as implemented in the UK, NatWest Group must maintain a recovery plan acceptable to its regulator, such that a breach of NatWest Group’s applicable liquidity requirements may trigger the application of NatWest Group’s recovery plan to attempt to remediate a deficient liquidity position.
| |
NatWest Group – Annual Report on Form 20-F 2023 | 167 |
Risk factors continued
NatWest Group may need to liquidate assets to meet its liabilities, including disposals of assets not previously identified for disposal to reduce its funding commitments or trigger the execution of certain management actions or recovery options. In a time of reduced liquidity, NatWest Group may be unable to sell its assets, at attractive prices, or at all, which may adversely affect NatWest Group’s liquidity.
Any of the above may have a material adverse effect on NatWest Group’s future results, financial condition, prospects, and/or reputation.
NatWest Group may not meet the prudential regulatory requirements for regulatory capital and MREL, or manage its capital effectively, which could trigger the execution of certain management actions or recovery options.
NatWest Group is required by regulators in the UK, the EU and other jurisdictions in which it undertakes regulated activities to maintain adequate financial resources. Adequate levels of capital provide NatWest Group with financial flexibility specifically in its core UK operations in the face of turbulence and uncertainty in the UK and the global economy. Adequate levels of capital also enable NatWest Group plc to make discretionary capital distributions (including dividends to shareholders) and undertake buybacks of its shares.
As at 31 December 2023, NatWest Group plc’s CET1 ratio was 13.4% and is targeting a CET1 ratio of 13-14%. NatWest Group plc’s target CET1 ratio is based on a combination of its views on the appropriate level of capital and its actual and expected regulatory requirements and internal modelling, including stress scenarios and management’s and/or the Prudential Regulation Authority’s (PRA) views on appropriate buffers above minimum required operating levels.NatWest Group plc’s current capital strategy is based on the expected accumulation of additional capital through the accrual of retained earnings over time, planned capital actions (including issuances, redemptions, and discretionary capital distributions), RWA growth in the form of regulatory uplifts and lending growth and other capital management initiatives which focus on improving capital efficiency and ensuring NatWest Group meets its medium-to-long term targets. NatWest Group intends to make capital distributions to its equity investors of certain amounts surplus to its publicly stated CET1 target, subject to macroeconomic conditions, via a combination of dividends and buybacks. In making dividends distribution and buyback decisions, consideration is given to previously guided ordinary dividend pay-out ratios, an intention to continue to help reduce the government’s stake in the Group, and maximising shareholder value.
A number of factors may impact NatWest Group plc’s ability to maintain its CET1 ratio target and achieve its capital strategy. These include:
| – | a depletion of its capital resources through increased costs or liabilities or reduced profits (for example, due to an increase in provisions due to a deterioration in UK economic conditions); |
| – | an increase in the quantum of RWAs/Leverage Exposure in excess of that expected, including due to regulatory changes (including their interpretation or application), or a failure in internal controls or procedures to accurately measure and report RWAs/ Leverage Exposure; |
| – | changes in prudential regulatory requirements including NatWest Group plc’s Total Capital Requirement/ Leverage Requirement set by the PRA, including Pillar 2 requirements, as applicable, and regulatory buffers as well as any applicable scalars; and |
| – | reduced upstreaming of dividends from NatWest Group plc’s subsidiaries because of changes in their financial performance and/or the extent to which local capital requirements exceed NatWest Group plc’s target ratio; and limitations on the use of double leverage (i.e., NatWest Group plc’s use of debt to invest in the equity of its subsidiaries, as a result of the Bank of England’s and/or NatWest Group’s evolving views on distribution of capital within groups). |
A shortage or reduction of capital could in turn affect NatWest Group plc’s capital ratio, and/or its ability to make capital distributions and in turn NatWest Group may not remain a viable, competitive or profitable banking business.
A minimum level of capital is required to be met by NatWest Group plc for it to be entitled to make certain discretionary payments, and institutions such as NatWest Group plc which fail to meet the regulatory combined buffer requirement are subject to restricted discretionary payments. The resulting restrictions are scaled according to the extent of the breach of the combined buffer requirement and calculated as a percentage of the profits of the institution since the last distribution of profits or discretionary payment which gives rise to a maximum distributable amount (MDA) (if any) that the financial institution can distribute through discretionary payments. Any breach of the combined buffer requirement may necessitate for NatWest Group plc reducing or ceasing discretionary payments to shareholders (including payments of dividends) and buybacks depending on the extent of the breach.
NatWest Group plc is required to maintain a set quantum of MREL set as the higher of its RWAs or the applicable leverage-based minimum capital requirement. The Bank of England has identified single point-of-entry at NatWest Group plc, as the preferred resolution strategy for NatWest Group. As a result, NatWest Group plc is the only entity within NatWest Group that can externally issue securities that count towards its MREL, the proceeds of which can then be downstreamed to meet the internal MREL of its operating entities and intermediate holding companies.
If NatWest Group plc is unable to raise or retain the requisite amount of regulatory capital or MREL, downstream the proceeds of MREL to subsidiaries as required, or to otherwise meet its regulatory capital, MREL and leverage requirements, it may be exposed to increased regulatory supervision or sanctions, loss of customer and/or investor confidence, constrained or more expensive funding and be unable to make discretionary payments on capital instruments.
| |
NatWest Group – Annual Report on Form 20-F 2023 | 168 |
Risk factors continued
If, under a stress scenario, the level of regulatory capital or MREL falls outside of NatWest Group’s risk appetite, there are a range of recovery management actions (focused on risk reduction and mitigation) that NatWest Group could seek to take to manage its capital levels, but any such actions may not be sufficient to restore adequate capital levels. Under the BRRD, as implemented in the UK, NatWest Group must maintain a recovery plan acceptable to its regulator, such that a breach of NatWest Group’s applicable capital or leverage requirements may trigger the application of NatWest Group’s recovery plan to remediate a deficient capital position.
NatWest Group’s regulator may request that NatWest Group carry out certain capital management actions or, if NatWest Group plc’s CET1 ratio falls below 7%, certain regulatory capital instruments issued by NatWest Group plc will be written-down or converted into equity and there may be an issue of additional equity by NatWest Group plc, which could result in the reduction in value of the holdings of NatWest Group plc’s existing shareholders.
The success of such issuances will also be dependent on favourable market conditions and NatWest Group may not be able to raise the amount of capital required on acceptable terms, or at all. Separately, NatWest Group may address a shortage of capital by taking action to reduce leverage exposure and/or RWAs via asset or business disposals. These actions may, in turn, affect: NatWest Group’s product offering, credit ratings, ability to operate its businesses, pursue its strategy and strategic opportunities, any of which may adversely affect NatWest Group. Refer to ‘NatWest Group may become subject to the application of UK statutory stabilisation or resolution powers which may result in, for example, the cancellation, transfer or dilution of ordinary shares, or the write-down or conversion of certain other of NatWest Group’s securities.’; and ‘NatWest Group may be adversely affected if it fails to meet the requirements of regulatory stress tests.’
Any of the above may have a material adverse effect on NatWest Group’s future results, financial condition, prospects, and/or reputation.
Any reduction in the credit rating and/or outlooks assigned to NatWest Group plc, any of its subsidiaries or any of their respective debt securities could adversely affect the availability of funding for NatWest Group, reduce NatWest Group’s liquidity and funding position and increase the cost of funding.
Rating agencies regularly review NatWest Group plc and other NatWest Group entities’ credit ratings and outlooks. NatWest Group entities’ credit ratings and outlooks could be negatively affected (directly and indirectly) by a number of factors that can change over time, including, without limitation: credit rating agencies’ assessment of NatWest Group’s strategy and management’s capability; its financial condition including in respect of profitability, asset quality, capital, funding and liquidity, and risk management practices; the level of political support for the sectors and regions in which NatWest Group operates; the implementation of structural reform; the legal and regulatory frameworks applicable to NatWest Group’s legal structure; business activities and the rights of its creditors; changes in rating methodologies; changes in the relative size of the loss-absorbing buffers protecting bondholders and depositors; the competitive environment; political, geopolitical and economic conditions in NatWest Group’s key markets (including inflation and interest rates), supply chain disruptions and the outcome of any further Scottish independence referendum, any reduction of the UK’s sovereign credit ratings and market uncertainty. In addition, credit ratings agencies are increasingly taking into account sustainability-related factors, including climate, environmental, social and governance related risk, as part of the credit ratings analysis, as are investors in their investment decisions. Refer to ‘A reduction in the ESG ratings of NatWest Group could have a negative impact on NatWest Group’s reputation and on investors’ risk appetite and customers’ willingness to deal with NatWest Group.’
Any reductions in the credit ratings of NatWest Group plc or of certain other NatWest Group entities, including, in particular, any downgrade below investment grade, or a deterioration in the capital markets’ perception of NatWest Group’s financial resilience could significantly affect NatWest Group’s access to capital markets, reduce the size of its deposit base and trigger additional collateral or other requirements in its funding arrangements or the need to amend such arrangements, which could adversely affect NatWest Group’s (and, in particular, NatWest Group plc’s) liquidity and funding position, cost of funding and its access to capital markets and could limit the range of counterparties willing to enter into transactions, on favourable terms, or at all, with NatWest Group (and, in particular, with NatWest Group plc). This may in turn adversely affect NatWest Group’s competitive position and threaten its prospects.
Any of the above may have a material adverse effect on NatWest Group’s future results, financial condition, prospects, and/or reputation.
NatWest Group may be adversely affected if it fails to meet the requirements of regulatory stress tests.
NatWest Group entities are subject to annual and other stress tests by their respective regulators in the UK and EU. Stress tests are designed to assess the resilience of banks such as NatWest Group to potential adverse economic or financial developments and ensure that they have robust, forward-looking capital planning processes that account for the risks associated with their business profile. If the stress tests reveal that a bank’s existing regulatory capital buffers are not sufficient to absorb the impact of the stress, then it is possible that NatWest Group may need to take action to strengthen its capital position.
Failure by NatWest Group to meet the quantitative and qualitative requirements of the stress tests as set forth by its UK regulator may result in: NatWest Group’s regulators requiring NatWest Group to generate additional capital, reputational damage, increased supervision and/or regulatory sanctions, restrictions on capital distributions and loss of investor confidence, all of which may adversely affect NatWest Group.
Any of the above may have a material adverse effect on NatWest Group’s future results, financial condition, prospects, and/or reputation.
| |
NatWest Group – Annual Report on Form 20-F 2023 | 169 |
Risk factors continued
NatWest Group could incur losses or be required to maintain higher levels of capital as a result of limitations or failure of various models.
Given the complexity of NatWest Group’s business, strategy and capital requirements, NatWest Group relies on analytical and other models for a wide range of purposes, including to manage its business, assess the value of its assets and its risk exposure, as well as to anticipate capital and funding requirements (including to facilitate NatWest Group’s mandated stress testing). In addition, NatWest Group utilises models for valuations, credit approvals, calculation of loan impairment charges on an IFRS 9 basis, financial reporting and for financial crime (criminal activities in the form of money laundering, terrorist financing, bribery and corruption, tax evasion and sanctions as well as external or internal fraud (collectively, financial crime)). NatWest Group’s models, and the parameters and assumptions on which they are based, are periodically reviewed.
As model outputs are imperfect representations of real-world phenomena or simplifications of complex real-world systems and processes, and are based on a limited set of observations, model outputs therefore remain uncertain. NatWest Group may face adverse consequences as a result of actions or decisions based on models that are poorly developed, incorrectly implemented, outdated or used inappropriately. This includes models that are based on inaccurate or non-representative data (for example, where there have been changes in the micro or macroeconomic environment in which NatWest Group operates) or as a result of the modelled outcome being misunderstood, or by such information being used for purposes for which it was not designed. This could result in findings of deficiencies by NatWest Group’s regulators (including as part of NatWest Group’s mandated stress testing) and increased capital requirements, may render some business lines uneconomic, may require management action or may subject NatWest Group to regulatory sanction, any of which in turn may also have an adverse effect on NatWest Group and its customers.
Any of the above may have a material adverse effect on NatWest Group’s future results, financial condition, prospects, and/or reputation.
NatWest Group’s financial statements are sensitive to underlying accounting policies, judgements, estimates and assumptions.
The preparation of financial statements requires management to make judgements, estimates and assumptions that affect the reported amounts of assets, liabilities, income, expenses, exposures and RWAs. While estimates, judgements and assumptions take into account historical experience and other factors (including market practice and expectations of future events that are believed to be reasonable under the circumstances), actual results may differ due to the inherent uncertainty in making estimates, judgements and assumptions (particularly those involving the use of complex models). Further, accounting policy and financial statement reporting requirements increasingly require management to adjust existing judgements, estimates and assumptions for the effects of climate-related, sustainability and other matters that are inherently uncertain and for which there is little historical experience which may affect the comparability of NatWest Group’s future financial results with its historical results. Actual results may differ due to the inherent uncertainty in making climate-related and sustainability estimates, judgements and assumptions.
Accounting policies deemed critical to NatWest Group’s results and financial position, based upon materiality and significant judgements and estimates, involve a high degree of uncertainty and may have a material impact on its results. For 2023, these include loan impairments, fair value, deferred tax and conduct and litigation provisions. These are set out in ‘Critical accounting policies and sources of estimation uncertainty’.
Any of the above may have a material adverse effect on NatWest Group’s future results, financial condition, prospects, and/or reputation.
Changes in accounting standards may materially impact NatWest Group’s financial results.
NatWest Group prepares its consolidated financial statements in conformity with the requirements of the Companies Act 2006 and in accordance with IFRS as issued by the International Accounting Standards Board. Changes in accounting standards or guidance by accounting bodies or in the timing of their implementation, whether immediate or foreseeable, could result in NatWest Group having to recognise additional liabilities on its balance sheet, or in further write-downs or impairments to its assets and could also have a material adverse effect on NatWest Group.
From time to time, the International Accounting Standards Board may issue new accounting standards or interpretations that could materially impact how NatWest Group calculates, reports and discloses its financial results and financial condition, and which may affect NatWest Group capital ratios, including the CET1 ratio. New accounting standards and interpretations that have been issued by the International Accounting Standards Board but which have not yet been adopted by NatWest Group are discussed in ‘Future accounting developments’.
Any of the above may have a material adverse effect on NatWest Group’s future results, financial condition, prospects, and/or reputation.
The value or effectiveness of any credit protection that NatWest Group has purchased depends on the value of the underlying assets and the financial condition of the insurers and counterparties.
NatWest Group has credit exposure arising from over-the-counter derivative contracts, mainly credit default swaps (CDSs), and other credit derivatives, each of which are carried at fair value. The fair value of these CDSs, as well as NatWest Group’s exposure to the risk of default by the underlying counterparties, depends on the valuation and the perceived credit risk of the instrument against which protection has been bought. Many market counterparties have been adversely affected by their exposure to residential mortgage-linked and corporate credit products, whether synthetic or otherwise, and their actual and perceived creditworthiness may deteriorate rapidly. If the financial condition of these counterparties or their actual or perceived creditworthiness deteriorates, NatWest Group may record further credit valuation adjustments on the credit protection bought from these counterparties under the CDSs. NatWest Group also recognises any fluctuations in the fair value of other credit derivatives. Any such adjustments or fair value changes may have a material adverse effect on NatWest Group’s future results, financial condition, prospects, and/or reputation.
| |
NatWest Group – Annual Report on Form 20-F 2023 | 170 |
Risk factors continued
NatWest Group is subject to Bank of England and PRA oversight in respect of resolution, and NatWest Group could be adversely affected should the Bank of England in the future deem NatWest Group’s preparations to be inadequate.
NatWest Group is subject to regulatory oversight by the Bank of England and the PRA and is required (under the PRA rulebook) to carry out an assessment of its preparations for resolution, submit a report of the assessment to the PRA, and disclose a summary of this report. NatWest Group has dedicated significant resources towards the preparation of NatWest Group for a potential resolution scenario.
In June 2022 the Bank of England communicated its assessment of NatWest Group’s preparations and did not identify any shortcomings, deficiencies or substantive impediments although two areas were highlighted as requiring further enhancements. NatWest Group could be adversely affected should future Bank of England assessments deem NatWest Group’s preparations to be inadequate.
If future Bank of England assessments identify a significant gap in NatWest Group’s ability to achieve the resolvability outcomes or reveals that NatWest Group is not adequately prepared to be resolved, or does not have adequate plans in place to meet resolvability requirements, NatWest Group may be required to take action to enhance its preparations to be resolvable, resulting in additional costs and the dedication of additional resources. Such a scenario may have an impact on NatWest Group as, depending on the Bank of England’s assessment, potential action may include, but is not limited to, restrictions on NatWest Group’s maximum individual and aggregate exposures, a requirement to dispose of specified assets, a requirement to change its legal or operational structure, a requirement to cease carrying out certain activities, a requirement not to make discretionary distributions or undertake NatWest Group’s shares buybacks, and/or a requirement to maintain a specified amount of MREL.
This may also impact NatWest Group’s strategic plans and may have a material adverse effect on NatWest Group’s future results, financial condition, prospects, and/or reputation, or lead to a loss of investor confidence.
NatWest Group may become subject to the application of UK statutory stabilisation or resolution powers which may result in, for example, the cancellation, transfer or dilution of ordinary shares, or the write-down or conversion of certain other of NatWest Group’s securities.
HM Treasury, the Bank of England, the PRA and the FCA (together, the ‘Authorities’) are granted substantial powers to resolve and stabilise UK-incorporated financial institutions. Five stabilisation options exist: (i) transfer of all of the business of a relevant entity or the shares of the relevant entity to a private sector purchaser; (ii) transfer of all or part of the business of the relevant entity to a ‘bridge bank’ wholly-owned by the Bank of England; (iii) transfer of part of the assets, rights or liabilities of the relevant entity to one or more asset management vehicles for management of the transferor’s assets, rights or liabilities; (iv) the write-down, conversion, transfer, modification, or suspension of the relevant entity’s equity, capital instruments and liabilities; and (v) temporary public ownership of the relevant entity. These options may be applied to NatWest Group plc as the parent company or to any subsidiary where certain conditions are met (such as, whether the firm is failing or likely to fail, or whether it is reasonably likely that action will be taken (outside of resolution) that will result in the firm no longer failing or being likely to fail). Moreover, there are modified insolvency and administration procedures for relevant entities within NatWest Group, and the Authorities have the power to modify or override certain contractual arrangements in certain circumstances and amend the law for the purpose of enabling their powers to be used effectively and may promulgate provisions with retrospective applicability.
Under the UK Banking Act 2009, the Authorities are generally required to have regard to specified objectives in exercising the powers provided for by the UK Banking Act. One of the objectives (which is required to be balanced as appropriate with the other specified objectives) refers to the protection and enhancement of the stability of the financial system of the UK. Moreover, the ‘no creditor worse off’ safeguard provides that where resolution action is taken, the Authorities are required to ensure that no creditor is in a worse position than if the bank had entered into normal insolvency proceedings. Although, this safeguard may not apply in relation to an application of the separate write-down and conversion power relating to capital instruments in circumstances where a stabilisation power is not also used, the UK Banking Act still requires the Authorities to respect the hierarchy on insolvency when using the write-down and conversion power. Further, holders of debt instruments which are subject to the power may, however, have ordinary shares transferred to or issued to them by way of compensation.
Uncertainty exists as to how the Authorities may exercise their powers including the determination of actions undertaken in relation to the ordinary shares and other securities issued by NatWest Group, which may depend on factors outside of NatWest Group’s control. Moreover, the UK Banking Act provisions remain largely untested in practice, particularly in respect of resolutions of large financial institutions and groups.
If NatWest Group is at or is approaching the point such that regulatory intervention is required, any exercise of the resolution regime powers by the Authorities may adversely affect holders of NatWest Group plc’s ordinary shares or other NatWest Group securities. This may result in various actions being undertaken in relation to NatWest Group and any securities of NatWest Group, including cancellation, transfer, dilution, write-down or conversion (as applicable). There may also be a corresponding adverse effect on the market price of such ordinary shares and other NatWest Group securities.
Each of these actions may also have a material adverse effect on NatWest Group’s future results, financial condition, prospects, and/or reputation.
| |
NatWest Group – Annual Report on Form 20-F 2023 | 171 |
Risk factors continued
Climate and sustainability-related risks
NatWest Group and its value chain face climate-related and sustainability-related risk that may adversely affect NatWest Group.
NatWest Group and its value chain (including its investors, customers, counterparties (including its suppliers) and employees) may face financial and non-financial risks arising from sustainability-related risks, including climate-related risks.
Climate and sustainability-related risks may:
| – | adversely affect asset pricing and valuations of NatWest Group’s own and other securities and, in turn, the wider financial system; |
| – | adversely affect economic activities directly (for example through lower corporate profitability or the devaluation of assets) or indirectly (for example through macro-financial changes); |
| – | adversely affect the viability or resilience of business models over the medium to longer term, particularly those business models most vulnerable to climate and sustainability-related risks; |
| – | trigger losses stemming directly or indirectly from liability risks and/or reputational damage, including as a result of adverse media coverage, activists, the public, customers, counterparties (including suppliers) and/or investors associating NatWest Group or its customers with adverse climate and sustainability-related issues; |
| – | adversely affect NatWest Group’s ability to deliver on its strategy, including achieving its climate ambitions and targets; |
| – | exacerbate other risk categories to which NatWest Group is exposed, including credit risk, operational risk (including business continuity), market risk (both traded and non-traded), liquidity and funding risk (for example, net cash outflows or depletion of liquidity buffers), reputational risk, pension risk, regulatory compliance risk and conduct risk; and |
| – | may have a material adverse effect on NatWest Group’s reputation, future results, financial condition, and/or prospects (including cash flows, access to finance or cost of capital over the short, medium or long term). |
Climate and sustainability matters are becoming increasingly political and polarised. Some customers, counterparties (including suppliers) and investors may decide not to do business with NatWest Group because, according to their own assessment, NatWest Group’s strategy, ambitions and targets related to climate and sustainability do not meet their expectations, whereas others may decide not to do business with NatWest Group for failing to progress its climate and sustainability-related strategy, ambitions and targets or if they are of the view that they lack credibility.
If NatWest Group fails to identify, assess, prioritise, monitor and react appropriately to climate and sustainability-related risks, in a timely manner or at all, climate and sustainability-related physical, transition and liability risks and opportunities, changing regulatory and market expectations and societal preferences that NatWest Group, its customers, counterparties (including suppliers) face, this may have a material adverse effect on NatWest Group’s business, future results, financial condition, prospects, reputation or the price of its securities.
Climate-related risks may adversely affect the global financial system, NatWest Group or its value chain.
Climate-related risks represent a source of systemic risk in the global financial system. The financial impacts of climate-related risks are expected to be widespread and may disrupt the orderly functioning of financial markets and have an adverse effect on financial institutions, including NatWest Group.
There are significant uncertainties as to the location, extent and timing of the manifestation of the physical impacts of climate change, such as more severe and frequent extreme weather events (storms, flooding, subsidence, heat waves, droughts and wildfires), rising average global temperatures and sea levels, nature loss, declining food yields, destruction of critical infrastructure, supply chain disruption and resource scarcity. Damage to NatWest Group customers’ and counterparties’(including suppliers’) properties and operations could disrupt business, result in the deterioration of the value of collateral or insurance shortfalls, impair asset values and negatively impact the creditworthiness of customers and their ability and/or willingness to pay fees, afford new products or repay their debts, leading to increased default rates, delinquencies, write-offs and impairment charges in NatWest Group’s portfolios. In addition, NatWest Group’s premises and operations, or those of its critical outsourced functions may experience damage or disruption leading to increased costs. Any of these may have a material adverse effect on NatWest Group’s future results, financial condition, prospects, and/or reputation.
To meet the goals of the UK’s Net Zero Strategy will require a net-zero transition across all sectors of the UK economy. The impacts of the extensive social, commercial, technological, policy and regulatory changes required to achieve this transition remain uncertain but are expected to be significant, subject to continuous changes and developments and may be disruptive across the global economy and markets, especially if these changes do not occur in an orderly or timely manner or are not effective in reducing emissions sufficiently in a timely manner, or at all. NatWest Group’s business and customers in some sectors, including but not limited to, residential mortgages, commercial real estate, agriculture (primary farming), automotive manufacturing, aviation, shipping, land transport and logistics (freight road, passenger rail and road), electricity generation and oil and gas are expected to be particularly impacted. The timing and pace of the net-zero transition is also uncertain, will depend on many factors and uncertainties and may be near-term, gradual and orderly, or delayed, rapid and disorderly, or a combination of these.
Climate-related risks may exacerbate the impact of financial and non-financial risks and they may have a material adverse effect on NatWest Group’s future results, financial condition, prospects, and/or reputation, including as a result of financial losses caused directly or indirectly by climate-related litigation and conduct matters (referred to as ‘liability risk’). Refer to ‘NatWest Group may be subject to potential climate and other sustainability-related litigation, enforcement proceedings, investigations and conduct risk.’
| |
NatWest Group – Annual Report on Form 20-F 2023 | 172 |
Risk factors continued
NatWest Group and its value chain may, face other sustainability-related risks that may adversely affect NatWest Group.
NatWest Group and its value chain (including its investors, customers, counterparties (including its suppliers) and employees) may face financial and non-financial risks arising from broader (i.e. non-climate-related) sustainability issues. These include: (i) risks relating to nature loss (such as the loss and/or decline of the state of nature including but not limited to, the reduction of any aspect of biological diversity and other forms of environmental degradation such as air, water and land pollution, soil quality degradation and water stress); (ii) risks related to societal (including human rights) matters, for example, climate change and environmental degradation negatively impacting people’s standard of living and health, geopolitical tensions and conflict endangering people’s lives and security, the displacement of communities, the violation of indigenous people’s rights, unjust working conditions and labour rights breaches (including discrimination, lack of diversity and inclusion, inequality, gender/ethnicity pay gap and payments under the minimum wage), modern slavery, financial crime, data privacy breaches and lack of support for the vulnerable; and (iii) governance-related risks (including board diversity, ethics, executive compensation and management structure).
NatWest Group is directly and indirectly exposed to multiple types of nature-related risks through the breadth of its activities, products and services offering, including through the risk of default by customers whose businesses are exposed to nature-related risks. In 2021, NatWest Group first classified ‘Biodiversity and Nature Loss’ as an emerging risk for NatWest Group within its Risk Management Framework. From January 2024, NatWest Group has expanded its key risk definition from climate risk to climate and nature risk and updated its climate risk policy to reflect emerging nature-related risks and to capture requirements that go beyond climate risk.
NatWest Group supports the aims of the Task Force on Nature Related Financial Disclosure and continues to enhance its reporting and measurement capabilities, acknowledging challenges associated with data availability, while continuing to review evolving disclosure standards and framework. NatWest Group’s approach is to integrate nature its existing strategy on climate, recognising there is still, much to do in understanding its impacts and dependencies on nature as well as our nature-related risks and opportunities. There is also increased scrutiny from NatWest Group’s investors, customers, counterparties (including its suppliers), employees, communities, regulators, the media and other stakeholders on how NatWest Group addresses societal and governance related matters, including unjust working conditions and labour rights breaches, resilience in the workplace, safety and wellbeing, data protection and management, workforce management, human rights and value chain management. For example, NatWest Group’s ambition is to support decarbonisation while promoting energy security, may lead to continued exposure to carbon-intensive activities and sectors regarded as posing high climate and nature-related and societal (including human rights) risks, (such as the textiles, agriculture and mining sectors) each of which may impact NatWest Group’s employees, customers, counterparties (including suppliers) and stakeholders and their business activities and/or the communities in which they operate and, in turn, result in reputational risk for NatWest Group.
There is also growing expectation of the need for a ‘just transition’ and ‘energy justice’ – in recognition that the transition to net zero should happen in a way that is as fair and inclusive as possible to everyone concerned. Although NatWest Group continues to evaluate and assess how it integrates ‘just transition’ considerations into its climate and sustainability strategy, a failure (or perception of failure) by NatWest Group to sufficiently factor these considerations into existing products and service offerings may adversely affect NatWest Group, including NatWest Group’s reputation.
In 2023, NatWest Group published its initial assessment of its ‘salient human rights issues’. Human rights saliency assessments are high-level scoping exercises based on internal and external stakeholder engagement and involve subjective materiality and other judgements including as to severity and likelihood of human rights impacts. Failure by NatWest Group to identify, assess, prioritise and monitor any actual or potential adverse human rights issues that NatWest Group, contributes to, or is directly linked to, may adversely impact people and communities, which in turn may have a material adverse effect on NatWest Group’s future results, financial condition, prospects and/or reputation.
Sustainability-related risks may have the potential to cause or stress other financial and non-financial risks, including climate-related risks, and they may have a material adverse effect on NatWest Group’s future results, financial condition, prospects, and/or reputation, including as a result of financial losses caused directly or indirectly by sustainability-related litigation and conduct matters (referred to as ‘liability risk’). Refer to ‘NatWest Group may be subject to potential climate and other sustainability-related litigation, enforcement proceedings, investigations and conduct risk’.
NatWest Group’s climate change related strategy, ambitions, targets and transition plan entail significant execution and/or reputational risks and are unlikely to be achieved without significant and timely government policy, technology and customer behavioural changes.
NatWest Group has an ambition to become a leading bank in the UK, helping to address the climate challenge. At NatWest Group’s Annual General Meeting in April 2022, ordinary shareholders passed an advisory ‘Say on Climate’ resolution endorsing NatWest Group’s previously announced strategic direction on climate change, including its ambitions to at least halve the climate impact of its financing activity by 2030, achieve alignment with the 2015 Paris Agreement and reach net zero across its financed emissions, assets under management and operational value chain by 2050. Further, in December 2022, NatWest Group published its science-based targets validated by Science Based Target Initiative for 79% of its lending book as at 31 December 2019 and 57% of debt securities and equity shares, excluding sovereign debt securities.
NatWest Group has also announced and in the future it may also announce other climate ambitions, targets and initiatives which support its aim to help addressing the climate challenge.
| |
NatWest Group – Annual Report on Form 20-F 2023 | 173 |
Risk factors continued
Making the changes necessary to achieve NatWest Group’s strategic direction on climate change, including its climate ambitions and targets and executing its transition plan, together with the active management of climate and sustainability-related risks and other regulatory, policy and market changes, is likely to necessitate material changes to NatWest Group’s business, operating model, its existing exposures and the products and services NatWest Group provides to its customers (potentially on accelerated timescales). NatWest Group may be required to (i) significantly reduce its financed emissions and its exposure to customers that do not align with a transition to net zero or do not have a credible transition plan in place, and (ii) divest or discontinue certain activities for regulatory or legal reasons or in response to the transition to a less carbon-dependent economy. Increases in lending and financing activities may wholly or partially offset some or all these reductions, which may increase the extent of changes and reductions necessary.
Making the necessary changes (or not making the necessary changes in a timely manner, or at all) may have a material adverse effect on NatWest Group’s business and operations, financial condition, prospects and competitive position and NatWest Group’s ability to achieve its climate and financial ambitions and targets, take advantage of climate change-related opportunities and generate sustainable returns.
NatWest Group’s ability to achieve its strategy, including its climate ambitions and targets, will significantly depend on many factors and uncertainties beyond NatWest Group’s control. These include (i) the extent and pace of climate change, including the timing and manifestation of physical and transition risks; (ii) the macroeconomic environment; (iii) the effectiveness of actions of governments, legislators, regulators and businesses; (iv) the response of the wider society, investors, customers, suppliers and other stakeholders to mitigate the impact of climate and sustainability-related risks; (v) changes in customer behaviour and demand; (vi) appetite for new markets, credit appetite, concentration risk appetite, lending opportunities; (vii) developments in the available technology; (viii) the roll-out of low carbon infrastructure; and (ix) the availability of accurate, verifiable, reliable, auditable, consistent and comparable data. These external factors and other uncertainties will make it challenging for NatWest Group to meet its climate ambitions and targets and there is a significant risk that all or some of these ambitions and targets will not be achieved or not achieved within the intended timescales.
NatWest Group’s ability to achieve its climate ambitions and targets depends to a significant extent on the timely implementation and integration of appropriate government policies. The UK CCC June 2023 Progress Report to the UK Parliament states that the rate of emissions reduction will need to significantly increase for the UK to meet its 2030 commitments and continued delays in policy development and implementation mean achievement is increasingly challenging. On 20 September 2023, the UK Government announced its revised plans on reducing emissions to reach net zero, including (i) delaying the proposed ban on the sale of petrol and diesel cars to 2035; (ii) not proceeding with new policies forcing landlords to upgrade the energy efficiency of their properties; and (iii) delaying the ban on new fossil fuel boilers for certain households. Accordingly, NatWest Group considers achievement of the following ambitions increasingly challenging (i) 50% of NatWest Group’s mortgage portfolio to have an EPC rating of C or above by 2030; and (ii) to at least halve the climate impact of NatWest Group’s financing activity by 2030, against a 2019 baseline.
NatWest Group has also stated that it plans to phase-out coal for UK and non-UK customers who have UK coal production, coal fired generation and coal related infrastructure by 1 October 2024, with a full global phase-out by 1 January 2030. Data challenges, particularly the lack of granular customer information, creates challenges in identifying customers with ‘coal related infrastructure’ (e.g. transportation and storage) and other customers with ‘coal- related operations’ within NatWest Group’s large and diversified customer portfolios. Therefore, there is a risk that some customers with UK-based coal activities may not have been identified and that NatWest Group will not be able to identify all relevant activities to achieve these coal phase-out plans.
Any delay or failure in setting, making progress against or meeting NatWest Group’s climate-related ambitions, targets and plans may have a material adverse effect on NatWest Group’s future results, financial condition, prospects, and/or reputation and may increase the climate and sustainability-related risks NatWest Group faces.
There are significant limitations related to accessing accurate, reliable, verifiable, auditable, consistent and comparable climate and other sustainability-related data that contribute to substantial uncertainties in accurately modelling and reporting on climate and sustainability information, as well as making appropriate important internal decisions.
Meaningful reporting of climate and sustainability-related risks and opportunities and their potential impacts and related metrics depends on access to accurate, reliable, verifiable, auditable, consistent and comparable climate and sustainability-related data from counterparties (including suppliers) or customers. Data may not be generally available or, if available, may not be accurate, reliable, verifiable, auditable, consistent, or comparable. Any failure of NatWest Group to proportionately collect or develop accurate, reliable, verifiable, auditable, consistent and comparable counterparty (including supplier) and customer data, may adversely affect NatWest Group’s ability to prepare meaningful reporting which is relevant, represented in an accurate, verifiable, comparable and understandable way of the climate and sustainability-related risks and opportunities which may adversely affect NatWest Group’s ability to meet external disclosure obligations and its reputation, business and its competitive position.
In the absence of other sources, reporting of financed emissions and other sustainability data by financial institutions, including NatWest Group, is necessarily based on aggregated information developed by third parties that may be prepared in an inconsistent way using different methodologies, interpretations, or assumptions. NatWest Group’s climate and sustainability-related disclosures use a greater number and level of assumptions, judgements and estimates than many of its financial disclosures. These assumptions, judgements and estimates are highly likely to change materially over time, and, when coupled with the longer timeframes used in these climate and sustainability-related disclosures, make any assessment of materiality inherently uncertain.
In particular, in the absence of actual emissions monitoring and measurement, emissions estimates are based on sector and other assumptions that may not be accurate for a given counterparty (including supplier) or customer. There may also be data gaps that are filled using proxy data, such as sectoral averages or use of emissions estimated by a third party, again developed in a variety of ways and in some cases not in a timely manner causing data to be potentially outdated at the time when they are used.
| |
NatWest Group – Annual Report on Form 20-F 2023 | 174 |
Risk factors continued
Significant risks, uncertainties and variables are inherent in the assessment, measurement and mitigation of climate and sustainability-related risks. These include data quality gaps and limitations mentioned above, as well as the pace at which climate science, greenhouse gas accounting standards and various emissions reduction solutions develop. In addition, there is significant uncertainty about how climate change and the world’s transition to a net-zero economy will unfold over time and how and when climate and sustainability-related risks will manifest. These timeframes are considerably longer than NatWest Group’s historical and current strategic, financial, resilience and investment planning horizons.
As a result, NatWest Group’s climate and sustainability-related disclosures may be amended, updated or restated in the future as the quality and completeness of NatWest Group’s data and methodologies continue to improve. These data quality challenges, gaps and limitations may have a material impact on NatWest Group’s ability to make effective business decisions about climate and sustainability-related risks and opportunities, including risk management decisions, to comply with disclosure requirements and to monitor and report progress in meeting ambitions, targets and pathways.
Climate-related risks are challenging to model due to their forward-looking nature, the lack of and/or quality of historical testing capabilities, lack of accuracy, standardisation and incompleteness of emissions and other climate and sub-sector related data and the immature nature of risk measurement and modelling methodologies. As a result, it is very difficult to predict and model the impact of climate-related risks into precise financial and economic outcomes.
The evaluation of climate-related risk exposure and the development of associated potential risk mitigation techniques largely depend on the choice of climate scenario modelling methodology and the assumptions made which involves a number of risks and uncertainties, for example:
| – | climate scenarios are not predictions of what is likely to happen or what NatWest Group would like to happen, rather they explore the possible implications of different judgements and assumptions by considering a series of scenarios; |
| – | climate scenarios do not provide a comprehensive description of all possible future outcomes; |
| – | lack of specialist expertise in NatWest Group that needs to rely on third party advice, modelling, and data which is also subject to many limitations and uncertainties; |
| – | immaturity of modelling of and data on climate-related risks on financial assets which will presumably evolve rapidly in the coming years; |
| – | the number of variables and the forward-looking nature of climate scenarios which makes them challenging to back test and benchmark; |
| – | the significant uncertainty as to how the climate will evolve over time, how and when governments, regulators, businesses, investors and customers respond and how those responses impact the economy, asset valuations, land systems, energy systems, technology, policy and wider society; |
| – | the assumptions will continue to evolve with more data/information which may affect the baselines for comparability across reporting periods and impact internal and external verification processes; and |
| – | the pace of the development of the methodologies across different sectors may be different and therefore it may be challenging to report on the whole balance sheet with regard to financed emissions. |
Accordingly, these risks and uncertainties coupled with significantly long timeframes make the outputs of climate-related risk modelling, climate-related targets (including emission reduction targets) and pathways, inherently more uncertain than outputs modelled for traditional financial planning cycles based on historical financial information. Furthermore, there is a lack of scientific, industry and regulatory consensus regarding the appropriate metrics, methodologies, modelling and standardised reporting to enable the assessment of the location, acuteness, and severity of climate-related risks and the monitoring and mitigation of these risks in the economy and financial system.
There is increasing industry concern (acknowledged by the Network for Greening the Financial System) that model scenarios, including those provided by central banks and supervisory bodies and are too benign and may not adequately capture: (i) the financial implications of increasing frequency and severity of acute physical risks as global temperatures increase; (ii) second and third order impacts such as disruptions to supply chains and increased geo-political risks; nor (iii) possible ‘tipping points’ that could lead to large, irreversible changes in the climate system (for example the melting of permafrost or the Greenland and Antarctic ice sheets).
Capabilities within NatWest Group to appropriately assess, model, report and manage climate-related risks and impacts and the suitability of the assumptions required to model and manage climate-related risks appropriately continue to develop. But such development is still in its early stages. Even when those capabilities are appropriately developed, the high level of uncertainty regarding any assumptions modelled, the highly subjective nature of risk measurement and mitigation techniques, incorrect or inadequate assumptions and judgements and data quality gaps and limitations may lead to inadequate risk management information and frameworks, or ineffective business adaptation or mitigation strategies or regulatory non-compliance, all of which may have a material adverse effect on NatWest Group’s business, future results, financial condition, prospects, reputation and the price of its securities.
| |
NatWest Group – Annual Report on Form 20-F 2023 | 175 |
Risk factors continued
Failure to implement effective governance, procedures, systems and controls in compliance with legal, regulatory requirements and societal expectations to manage climate and sustainability-related risks and opportunities could adversely affect NatWest Group.
The UK’s prudential regulation of climate-related risk management is an important driver in how NatWest Group develops its associated risk framework for financing activities or engaging with counterparties (including suppliers). Legislative and regulatory authorities are publishing expectations as to how banks should prudently manage and transparently disclose climate and sustainability-related risks. In the UK this includes the Bank of England’s Supervisory Statement 3/19 on the management of climate-related financial risks, covering governance, risk management, scenario analysis and disclosure which sets out expectations that firms, such as NatWest Group, take a strategic approach to managing climate-related financial risks, identifying current risks and those that can plausibly arise in the future, and appropriate actions to mitigate those risks.
In March 2023 the Bank of England published a report setting out its latest thinking on climate-related risks and regulatory capital frameworks. It found there to be uncertainty over whether banks are sufficiently capitalised for future climate-related losses and it stated that it will undertake further analysis to explore whether changes to the regulatory capital frameworks may be required.
Any failure of NatWest Group to fully and timely embed climate and other sustainability-related risks into its risk management practices and framework to appropriately identify, assess, prioritise and monitor the various climate-related physical and transition risks and other sustainability-related risks and apply the appropriate product governance process in line with applicable legal and regulatory requirements and expectations, may adversely affect NatWest Group’s regulatory compliance, prudential capital requirements, liquidity position and this may have a material adverse effect on NatWest Group’s business, future results, financial condition, prospects, reputation or the price of its securities.
Increasing levels of climate and other sustainability-related laws, regulation and oversight may adversely affect NatWest Group.
NatWest Group as well as its subsidiaries in the UK, EU and elsewhere are increasingly becoming subject to more extensive climate and sustainability-related legal and regulatory requirements. In the UK, these include mandatory requirements by the FCA and under the Companies Act 2006 to make climate-related disclosures consistent with the recommendations of the Task Force on Climate-related Financial Disclosures.
In addition, in August 2023 the FCA set out its intention to consult in 2024 on rules and guidance for listed companies to disclose in line with the UK-endorsed ISSB standards and the Transition Plan Taskforce Disclosure Framework published in October 2023 as a complementary package. Further regulatory requirements may emerge as part of the developing UK sustainability-related disclosure requirements. In the EU, these climate and sustainability-related legal and regulatory requirements include the EU Taxonomy, the EU Corporate Sustainability Reporting Directive (‘CSRD’), the EU Green Bond Standard and proposed EU Corporate Sustainability Due Diligence Directive (‘CSDDD’).
Certain non-UK subsidiaries of NatWest Group in the EU and elsewhere may also be subject to EU, national and other climate and sustainability laws and regulations which in some cases may differ. For example, NatWest Group’s Dutch subsidiary, NWM N.V., is subject to the EU Taxonomy, CSRD, the proposed CSDDD, and other legal, regulatory and supervisory expectations relating to climate-related and environmental risk management and disclosure. A failure of NatWest Group or any of its subsidiaries, including NWM N.V., to comply with these regulations (if applicable), whether through insufficient resources, expertise, support, customer and counterparty data challenges or otherwise may have an adverse effect on NatWest Group’s reputation and the successful implementation of NatWest Group’s strategy.
In some jurisdictions, particularly the United States, regulatory and enforcement activity around climate and sustainability initiatives is becoming increasingly politicised. This has resulted in a polarisation between promoting more extensive climate and sustainability-related requirements, such as the proposed SEC climate disclosure rules, and challenging climate and sustainability-related initiatives on the basis of allegations that they could breach applicable laws.
Divergence between UK, EU, US and other climate and sustainability-related legal and regulatory requirements and their interpretation may increase the cost of doing business (including increased operating costs), may result in contentious regulatory and litigation risk, may require changes to NatWest Group’s business and may restrict NatWest Group’s access to the EU/EEA and US capital markets. Failure to comply with these divergent legal and regulatory requirements which are applicable to NatWest Group may result in NatWest Group and/or its subsidiaries not meeting applicable regulatory requirements or investors’ expectations. Compliance with these complex and evolving climate and sustainability-related legal and regulatory requirements and voluntary standards and initiatives is likely to require NatWest Group to implement significant changes to its business models, IT systems, products, governance, internal controls over financial reporting, disclosure controls and procedures, modelling capability and risk management systems, which may increase the cost of doing business, result in higher capital requirements, and entail additional change risk and increased compliance, regulatory sanctions, conduct and litigation (including settlements) costs.
Failure to implement and comply with these requirements, standards and initiatives may also result in investigations and/or regulatory sanctions, reputational damage and investor disapproval each of which may have a material adverse effect on NatWest Group’s future results, financial condition, prospects, and/or reputation.
| |
NatWest Group – Annual Report on Form 20-F 2023 | 176 |
Risk factors continued
Increasing regulation of “greenwashing” is likely to increase the risk of regulatory enforcement and investigation and litigation.
Misrepresenting or over-emphasising the extent to which an investment or other type of product takes into account ‘green’, ‘environmentally friendly’, ‘sustainable’ or ‘ethical’ features and concerns, using misleading labels and language in relation to such products and/or omitting material information about NatWest Group’s contribution to the climate crisis (including its direct or indirect contribution to greenhouse gas emissions), or other sustainability-related issues, could potentially result in complaints, regulatory investigation and/or sanction, claims and/or litigation and/or reputational damage.
This risk is likely to increase as the UK and other jurisdictions implement and enforce new anti-greenwashing regulations. For example, the FCA’s Sustainability Disclosure Requirements and investment labels policy statement (PS 23/16) published in November 2023 includes a general anti-greenwashing rule that requires regulated firms (such as certain subsidiaries of NatWest Group) to ensure that sustainability claims in financial promotions of their products and services are consistent with the sustainability characteristics of the product or service and are fair, clear and not misleading. The FCA has stated that it would publish guidance as to how regulated firms should comply with its anti-greenwashing rule including the requirements for sustainability claims that will become effective on 31 May 2024 (currently the subject of FCA consultation paper (GC23/3)). In the EU the European Commission has proposed a Green Claims Directive which will address false environmental claims and the proliferation of environmental labels by requiring certain claims to be substantiated with scientific evidence and independently verified.
Natwest Group plans to invest in voluntary carbon credits to mitigate emissions beyond its own value chain whilst transitioning towards a state of net zero emissions by 2050. NatWest Group may also be involved in trading voluntary carbon credits with its clients, or facilitating clients to trade these credits. Financial market and platform regulators are increasingly taking an interest in the voluntary carbon market and voluntary carbon credits retired, sold or traded by financial institutions or used by them as part of their own emissions reduction plans. NatWest Group could potentially be exposed to financial, litigation, regulatory enforcement and reputational risk where it retires, facilitates or is otherwise associated with voluntary carbon credit transactions or use (including use to offset own emissions). This includes where voluntary carbon credits are not of sufficient quality, potential issues or risks with respect to such carbon credits (or projects through which they are generated) are not adequately disclosed or stated benefits are exaggerated or misleading and/or such carbon credits are used either by NatWest Group or by a third party organisation (such as a customer) as a substitute for achieving appropriate emissions reductions in their own operations.
Any failure of NatWest Group to implement robust and effective climate and sustainability-related disclosure, communications and product governance policies, procedures and controls to make accurate public statements and claims about how environmentally friendly, sustainable or ethical NatWest Group’s products and services are and to apply these in line with applicable legal and regulatory requirements and expectations, may adversely affect NatWest Group’s regulatory compliance and/or reputation and could give rise to increased regulatory enforcement, investigation and litigation.
NatWest Group may be subject to potential climate and other sustainability-related litigation, enforcement proceedings, investigations and conduct risk.
Due to increasing new climate and sustainability-related jurisprudence, laws and regulations in the UK and other jurisdictions, growing demand from investors and customers for environmentally sustainable products and services, and regulatory scrutiny, financial institutions, including NatWest Group, may through their business activities, face increasing litigation, conduct, enforcement and contract liability risks related to climate change, nature-related degradation, human rights violations and other social, governance and sustainability-related issues.
These risks may arise, for example, from claims pertaining to:
| – | failure to meet obligations, targets or commitments relating to, or to disclose accurately, or provide updates on material climate and/or sustainability-related risks, or otherwise provide appropriate, balanced, clear, complete, correct, fair, meaningful, understandable, disclosure (which is capable of being substantiated) to investors, customers, counterparties (including suppliers) and other stakeholders; |
| – | conduct, mis-selling and customer protection claims, including claims which may relate to alleged insufficient product understanding, unsuitable product offering and /or reliance upon information provided by NatWest Group or claims alleging unfair pricing of climate-related products, for example in relation to products where limited liquidity or reliable market data exists for benchmarking purposes or which may be impacted by future climate policy uncertainty or other factors; |
| – | marketing that portrays products, securities, activities or policies as having positive climate, nature-related or sustainable outcomes to an extent that may not be the case, or may not adequately be qualified and/or omits material information about NatWest Group’s contribution to the climate crisis and/or its direct / indirect contribution to greenhouse gas emissions or other sustainability-related issues; |
| – | damages claims under various tort theories, including common law public nuisance claims, or negligent mismanagement of physical and/or transition risks; |
| – | alleged violations of officers’, directors’ and other fiduciaries’ duties, for example by financing various carbon-intensive, environmentally harmful or otherwise highly exposed assets, companies, and industries; |
| – | changes in the understanding of what constitutes positive climate, nature-related or sustainable outcomes as a result of developing climate science, leading to discrepancy between current product offerings and investor and/or market and/or broader stakeholder expectations; |
| – | any weaknesses or failures in specific systems or processes associated particularly with climate, nature-related or sustainability linked products, and/or human rights due diligence, including any failure in the timely implementation, onboarding and/or updating of such systems or processes; |
| – | counterparties, collaborators, customers to whom NatWest Group provides services and third parties in NatWest Group’s value chain who act, or fail to act, or undertake due diligence, or apply appropriate risk management and product governance in a manner that may adversely affect NatWest Group’s reputation or sustainability credentials; or |
| |
NatWest Group – Annual Report on Form 20-F 2023 | 177 |
Risk factors continued
| – | NatWest Group’s or its customers’, counterparties’ (including suppliers’) involvement in, or decision not to participate in, certain industries or projects associated with causing or exacerbating climate change and nature-related degradation. |
Furthermore, there is a risk that shareholders, campaign groups, customers and activist groups could seek to take legal action against NatWest Group for financing or contributing to climate change, nature-related degradation and human rights violations, failure to implement or follow adequate governance procedures and for not supporting the principles of ‘just transition’ (i.e. maximising the social benefits of the transition, mitigating the social risks of the transition, empowering those affected by the change, anticipating future shifts to address issues up front and mobilising investments from the public and private sectors).
There is an increase in the number of legal, conduct and regulatory claims as well as an increase in the variety of legal bases being alleged, remedies sought and amount of damages awarded in legal, conduct and regulatory proceedings, investigations, administrative actions and other adversarial proceedings against financial institutions for climate and sustainability matters. There is a risk that as climate, nature-related and environmental science develop and societal understanding of these issues increases and deepens, courts, regulators and enforcement authorities may apply the then current understandings of climate and the broader sustainability-related matters retrospectively when assessing claims about historical conduct or dealings of financial institutions, including NatWest Group. There is also an increase in enforcement and litigation focusing on challenging public and private sector sustainability policies and initiatives intended to address climate change and nature-related degradation. Refer to ‘NatWest Group is exposed to the risk of various litigation matters, regulatory and governmental actions and investigations as well as remedial undertakings, the outcomes of which are inherently difficult to predict, and which could have an adverse effect on NatWest Group’. In addition, supervisors and regulators are increasing their enforcement focus on climate and sustainability-related matters. For example, the ECB has stated that enforcement measures in the form of periodic penalty payments may be imposed on banks that do not fully align with ECB supervisory expectations of sound practices for managing climate and environmental risks.
These potential litigation, conduct, enforcement and contract liability risks may have a material adverse effect on NatWest Group’s ability to achieve its strategy, including its climate ambitions and targets, and this may have a material adverse effect on NatWest Group’s future results, financial condition, prospects, and/or reputation.
A reduction in the ESG ratings of NatWest Group could have a negative impact on NatWest Group’s reputation and on investors’ risk appetite and customers’ willingness to deal with NatWest Group.
ESG ratings from agencies and data providers which rate how NatWest Group manages environmental, social and governance risks are increasingly influencing investment decisions pertaining to NatWest Group’s and/or its subsidiaries’ securities or being used as a basis to label financial products and services as environmentally friendly or sustainable. ESG ratings are often (i) unsolicited; (ii) subject to the assessment and interpretation by the ESG rating agencies; (iii) provided without warranty; (iv) not a sponsorship, endorsement, or promotion of NatWest Group by the relevant rating agency; and (v) may depend on many factors some of which are beyond NatWest Group’s control (e.g. any change in rating methodology). In addition, certain NatWest Group entities offer and sell products and services to customers and counterparties based exclusively or largely on a rating by an unregulated ESG rating agency or data providers. ESG rating agencies, at this stage, are not subject to any specific regulatory or other regime or oversight (although there are proposals by regulators in different jurisdictions to regulate rating agencies and data providers). Regulators have expressed concern that harm may arise from potential conflicts of interest within ESG rating and review or second party opinion providers and there is a lack of transparency in methodologies and data points, which renders ratings and reviews incomparable between agencies or providers. Any material reduction in the ESG ratings of NatWest Group may have a negative impact on NatWest Group’s reputation, could influence investors’ risk appetite for NatWest Group’s and/or its subsidiaries’ securities, particularly ESG securities, could potentially affect the pricing of securities issued by NatWest Group and/or its subsidiaries and could affect a customer’s willingness to deal with NatWest Group. A regulatory sanction or enforcement action involving an ESG rating agency used by a NatWest Group entity could also have a negative impact on NatWest Group’s reputation.
Operational and IT resilience risk
Operational risks (including reliance on third party suppliers and outsourcing of certain activities) are inherent in NatWest Group’s businesses.
Operational risk is the risk of loss or disruption resulting from inadequate or failed internal processes, procedures, people or systems, or from external events, including legal and regulatory risks, third party processes, procedures, people or systems. NatWest Group operates in a number of countries, offering a diverse range of products and services supported directly or indirectly by third party suppliers. As a result, operational risks or losses can arise from a number of internal or external factors (including for example, payment errors or financial crime and fraud), for which there is continued scrutiny by third parties of NatWest Group’s compliance with financial crime requirements; refer to, ‘NatWest Group is exposed to the risks of various litigation matters, regulatory and governmental actions and investigations as well as remedial undertakings, the outcomes of which are inherently difficult to predict, and which could have an adverse effect on NatWest Group.’ These risks are also present when NatWest Group relies on critical service providers (suppliers) or vendors to provide services to it or its customers, as is increasingly the case as NatWest Group outsources certain activities, including with respect to the implementation of technologies, innovation and responding to regulatory and market changes.
Operational risks continue to be heightened as a result of the implementation of NatWest Group’s strategy, and the organisational and operational changes involved, including: NatWest Group’s phased withdrawal from ROI; NatWest Group’s current cost-controlling measures; the progression towards working as One Bank across NatWest Group to serve customers; the implementation of the recommendations from the recent independent reviews by the law firm Travers Smith LLP of customer account closures, as well as the outcome of ongoing FCA and internal reviews with respect to certain governance processes, policies, systems and controls of NatWest Group entities including with respect to customer account closures; and conditions affecting the financial services industry generally (including macroeconomic and other geopolitical developments) as well as the legal and regulatory uncertainty resulting from these conditions. It is unclear as to how the future ways of working may evolve, including in respect of how working practices may further evolve, or how NatWest Group will evolve to best serve its customers. Any of the above may place significant pressure on NatWest Group’s ability to maintain effective internal controls and governance frameworks.
| |
NatWest Group – Annual Report on Form 20-F 2023 | 178 |
Risk factors continued
The effective management of operational risks is critical to meeting customer service expectations and retaining and attracting customer business. Although NatWest Group has implemented risk controls and mitigation actions, with resources and planning having been devoted to mitigate operational risk, such measures may not be effective in controlling each of the operational risks faced by NatWest Group. Ineffective management of such risks may have a material adverse effect on NatWest Group’s future results, financial condition, prospects, and/or reputation.
NatWest Group is subject to sophisticated and frequent cyberattacks.
NatWest Group experiences a constant threat from cyberattacks across the entire NatWest Group and against NatWest Group’s supply chain, reinforcing the importance of due diligence of and close working relationship with the third parties on which NatWest Group relies. NatWest Group is reliant on technology, against which there is a constantly evolving series of attacks that are increasing in terms of frequency, sophistication, impact and severity. As cyberattacks evolve and become more sophisticated, NatWest Group is required to continue to invest in additional capability designed to defend against emerging threats. In 2023, NatWest Group and its supply chain were subjected to a small number of Distributed Denial of Service (‘DDOS’) and ransomware attacks, which are a pervasive threat to the financial services industry. The focus is to manage the impact of the attacks and sustain availability of services for NatWest Group’s customers. Consequently, NatWest Group continues to invest significant resources in developing and evolving of cybersecurity controls that are designed to minimise the potential effect of such attacks.
Third parties continue to make hostile attempts to gain access to, introduce malware (including ransomware) into and exploit potential vulnerabilities of, NatWest Group’s IT systems. NatWest Group has information and cybersecurity controls that seek to minimise the impact of any such attacks, which are subject to review on a regular basis but given the nature of the threat, there can be no assurance that such measures will prevent the potential adverse effect of an attack from occurring. Refer to ‘NatWest Group’s operations are highly dependent on its complex IT systems and any IT failure could adversely affect NatWest Group.’
Any failure in NatWest Group’s information and cybersecurity policies, procedures or controls, may result in significant financial losses, major business disruption, inability to deliver customer services, or loss of, or ability to access, data or systems or other sensitive information (including as a result of an outage) and may cause associated reputational damage. Any of these factors could increase costs (including costs relating to notification of, or compensation for customers, credit monitoring or card reissuance), result in regulatory investigations or sanctions being imposed or may affect NatWest Group’s ability to retain and attract customers. Regulators in the UK, US, Europe and Asia continue to recognise cybersecurity as an important systemic risk to the financial sector and have highlighted the need for financial institutions to improve their monitoring and control of, and resilience (particularly of critical services) to cyberattacks, and to provide timely reporting or notification of them, as appropriate (including, for example, the new SEC cybersecurity requirements). Furthermore, cyberattacks on NatWest Group’s counterparties and suppliers may also have an adverse effect on NatWest Group’s operations.
Additionally, third parties may induce employees, customers, third-party providers or other users with access to NatWest Group’s systems to wrongfully disclose sensitive information to gain access to NatWest Group’s data or systems or that of NatWest Group’s customers or employees. Cybersecurity and information security events can derive from groups or factors such as: internal or external threat actors, human error, fraud or malice on the part of NatWest Group’s employees or third parties, including third party providers, or may result from technological failure.
NatWest Group expects greater regulatory engagement, supervision and enforcement to continue in relation to its overall resilience to withstand IT and IT-related disruption, either through a cyberattack or some other disruptive event. Such increased regulatory engagement, supervision and enforcement is uncertain in relation to the scope, cost, consequence and the pace of change, which may have a material adverse effect on NatWest Group. Due to NatWest Group’s reliance on technology and the increasing sophistication, frequency and impact of cyberattacks, such attacks may have an adverse effect on NatWest Group.
In accordance with the Data Protection Act 2018 and the European Union Withdrawal Act 2018, the Data Protection, Privacy and Electronic Communications (Amendments Etc.) (EU Exit) Regulations 2019, as amended by the Data Protection, Privacy and Electronic Communications (Amendments Etc.) (EU Exit) Regulations 2020 (‘UK Data Protection Framework’) and European Banking Authority (‘EBA’) Guidelines on ICT and Security Risk Management, NatWest Group is required to ensure it implements timely, appropriate and effective organisational and technological safeguards against unauthorised or unlawful access to the data of NatWest Group, its customers and its employees. In order to meet this requirement, NatWest Group relies on the effectiveness of its internal policies, controls and procedures to protect the confidentiality, integrity and availability of information held on its IT systems, networks and devices as well as with third parties with whom NatWest Group interacts. A failure to monitor and manage data in accordance with the UK Data Protection Framework and EBA requirements of the applicable legislation may result in financial losses, regulatory fines and investigations and associated reputational damage.
Any of the above may have a material adverse effect on NatWest Group’s future results, financial condition, prospects, and/or reputation.
| |
NatWest Group – Annual Report on Form 20-F 2023 | 179 |
Risk factors continued
NatWest Group operations and strategy are highly dependent on the accuracy and effective use of data.
NatWest Group relies on the effective use of accurate data to support, monitor, evaluate, manage and enhance its operations, innovate its products offering, meet its regulatory obligations, and deliver its strategy. Investment is being made in data tools and analytics, including raising awareness around ethical data usage (for example, in relation to the use of artificial intelligence) and privacy across NatWest Group. The availability and accessibility of current, complete, detailed, accurate and, wherever possible, machine-readable customer segment and sub-sector data, together with appropriate governance and accountability for data, is fast becoming a critical strategic asset, which is subject to increased regulatory focus. Failure to have or be able to access that data or the ineffective use or governance of that data could result in a failure to manage and report important risks and opportunities or satisfy customers’ expectations including the inability to deliver products and services. This could also result in a failure to deliver NatWest Group’s strategy and could place NatWest Group at a competitive disadvantage by increasing its costs, inhibiting its efforts to reduce costs or its ability to improve its systems, controls and processes, which could result in a failure to deliver NatWest Group’s strategy. These data weaknesses and limitations, or the unethical or inappropriate use of data, and/or non-compliance with data protection laws could give rise to conduct and litigation risks and may increase the risk of operational challenges, losses, reputational damage or other adverse consequences due to inappropriate models, systems, processes, decisions or other actions.
Any of the above may have a material adverse effect on NatWest Group’s future results, financial condition, prospects, and/or reputation.
NatWest Group’s operations are highly dependent on its complex IT systems and any IT failure could adversely affect NatWest Group.
NatWest Group’s operations are highly dependent on the ability to process a very large number of transactions efficiently and accurately while complying with applicable laws and regulations. The proper functioning of NatWest Group’s transactional and payment systems, financial crime, fraud systems and controls, risk management, credit analysis and reporting, accounting, customer service and other IT systems (some of which are owned and operated by other entities in NatWest Group or third parties), as well as the communication networks between its branches and main data processing centres, is critical to NatWest Group’s operations.
Individually or collectively, any system failure, loss of service availability or breach of data security could potentially cause significant damage to: (i) important business services across NatWest Group and (ii) NatWest Group’s ability to provide services to its customers, which could result in reputational damage, significant compensation costs and regulatory sanctions (including fines resulting from regulatory investigations) or a breach of applicable regulations and could affect NatWest Group’s regulatory approvals, competitive position, business and brands, which could undermine its ability to attract and retain customers and talent. NatWest Group outsources certain functions as it innovates and offers new digital solutions to its customers to meet the demand for online and mobile banking. Outsourcing alongside remote working heighten the above risks.
NatWest Group uses IT systems that enable remote working interface with third-party systems, and NatWest Group could experience service denials or disruptions if such systems exceed capacity or if NatWest Group or a third-party system fails or experiences any interruptions, all of which could result in business and customer interruption and related reputational damage, significant compensation costs, regulatory sanctions and/or a breach of applicable regulations.
In 2023, NatWest Group made considerable investments to further simplify, upgrade and improve its IT and technology capabilities (including migration of certain services to cloud platforms). NatWest Group also continues to develop and enhance digital services for its customers and seeks to improve its competitive position through enhancing controls and procedures and strengthening the resilience of services including cybersecurity. Any failure of these investment and rationalisation initiatives to achieve the expected results, due to cost challenges or otherwise, may adversely affect NatWest Group’s operations, its reputation and ability to retain or grow its customer business or adversely affect its competitive position.
Any of the above may have a material adverse effect on NatWest Group’s future results, financial condition, prospects, and/or reputation.
NatWest Group relies on attracting, retaining and developing diverse senior management and skilled personnel, and is required to maintain good employee relations.
NatWest Group’s success depends on its ability to attract, retain through creating an inclusive environment, and develop highly skilled and qualified diverse personnel, including senior management, directors and key employees (including technology and data focused roles), in a highly competitive market and under internal cost efficiency pressures.
NatWest Group’s ability to attract, retain and develop highly skilled and qualified diverse senior management (this may include a new permanent CEO in 2024) and skilled personnel may be more difficult due to the cost-controlling measures, a failure to pay employees competitive compensation, heightened regulatory oversight of banks and the increasing scrutiny of, and (in some cases) restrictions placed upon, employee compensation arrangements (in particular those of banks that have been in receipt of government support such as NatWest Group). In addition, certain economic, market and regulatory conditions and political developments may reduce the pool of candidates for key management and non-executive roles, including non-executive directors with the right skills, knowledge and experience, or may increase the number of departures of existing employees. Moreover, a failure to foster a diverse and inclusive workforce may adversely affect NatWest Group’s employee engagement and the formulation and execution of its strategy and could also have an adverse effect on its reputation with employees, customers, investors and regulators.
Many of NatWest Group’s employees in the UK, the ROI and continental Europe are represented by employee representative bodies, including trade unions and works councils. Engagement with its employees and such bodies is important to NatWest Group in maintaining good employee relations. Any failure to do so may adversely affect NatWest Group’s ability to operate its business effectively.
| |
NatWest Group – Annual Report on Form 20-F 2023 | 180 |
Risk factors continued
Any of the above may have a material adverse effect on NatWest Group’s future results, financial condition, prospects, and/or reputation.
A failure in NatWest Group’s risk management framework could adversely affect NatWest Group, including its ability to achieve its strategic objectives.
Risk management is an integral part of all of NatWest Group’s activities and delivery of its long-term strategy. NatWest Group’s Enterprise-Wide Risk Management Framework sets out the approach for managing risk within NatWest Group including in relation to risk governance and risk appetite. A failure to adhere to this framework, or any material weaknesses or deficiencies in the framework’s controls and procedures, could adversely affect NatWest Group’s financial condition and strategic delivery including in relation to inaccurate adherence to agreed risk appetite statements and accurate risk reporting of risk exposures.
In addition, financial crime risk management is dependent on the use and effectiveness of financial crime assessment, systems and controls. Weak or ineffective financial crime processes and controls may risk NatWest Group inadvertently facilitating financial crime which may result in regulatory investigation, sanction, litigation, fines and/or reputational damage. Financial crime continues to evolve, whether through fraud, scams, cyberattacks or other criminal activity. These risks are exacerbated as NatWest Group continues to innovate its product offering and increasingly offers digital solutions to its customers. NatWest Group has made and continues to make significant, multi-year investments to strengthen and improve its overall financial crime control framework with prevention systems and capabilities. As part of its ongoing programme of investment, there is current and future investment planned to further strengthen financial crime controls over the coming years, including investment in new technologies and capabilities to further enhance customer due diligence, transaction monitoring, sanctions and anti-bribery and corruption systems.
Financial risk management is highly dependent on the use and effectiveness of internal stress tests and models and ineffective risk management may arise from a wide variety of factors, including lack of transparency or incomplete risk reporting, manual processes and controls, inaccurate data, inadequate IT systems, unidentified conflicts or misaligned incentives, lack of accountability control and governance, incomplete risk monitoring and management or insufficient challenges or assurance processes or a failure to commence or timely complete risk remediation projects. Failure to manage risks effectively, or within regulatory expectations, could adversely affect NatWest Group’s reputation or its relationship with its regulators, customers, shareholders or other stakeholders.
NatWest Group’s operations are inherently exposed to conduct risks, which include business decisions, actions or reward mechanisms that are not responsive to or aligned with NatWest Group’s regulatory obligations, customers’ needs or do not reflect NatWest Group’s strategy, ineffective product management, unethical or inappropriate use of data, information asymmetry, implementation and utilisation of new technologies, outsourcing of customer service and product delivery, inappropriate behaviour towards customers, customer outcomes, the possibility of mis-selling of financial products and mishandling of customer complaints. Some of these risks have materialised in the past and ineffective management and oversight of conduct risks may lead to further remediation and regulatory intervention or enforcement.
NatWest Group’s businesses are also exposed to risks from employee, contractor or service providers misconduct including non-compliance with policies and regulations, negligence or fraud (including financial crimes and fraud), any of which could result in regulatory fines or sanctions and serious reputational or financial harm to NatWest Group. Hybrid working arrangements for NatWest Group employees place heavy reliance on the IT systems that enable remote working and may place additional pressure on NatWest Group’s ability to maintain effective internal controls and governance frameworks and increase operational risk. Hybrid working arrangements are also subject to regulatory scrutiny to ensure adequate recording, surveillance and supervision of regulated activities, and compliance with regulatory requirements and expectations, including requirements to: meet threshold conditions for regulated activities; ensure the ability to oversee functions (including any outsourced functions); ensure no detriment is caused to customers; and ensure no increased risk of financial crime.
NatWest Group seeks to embed a risk awareness culture across the organisation and has implemented policies and allocated new resources across all levels of the organisation to manage and mitigate conduct risk and expects to continue to invest in risk management, including the ongoing development of a risk management strategy in line with regulatory expectations. However, such efforts may not insulate NatWest Group from instances of misconduct and no assurance can be given that NatWest Group’s strategy and control framework will be effective. Any failure in NatWest Group’s risk management framework may result in the inability to achieve its strategic objectives for its customers, employees and wider stakeholders.
Any of the above may have a material adverse effect on NatWest Group’s future results, financial condition, prospects, and/or reputation.
NatWest Group’s operations are subject to inherent reputational risk.
Reputational risk relates to stakeholder and public perceptions of NatWest Group arising from an actual or perceived failure to meet stakeholder or the public’s expectations, including with respect to NatWest Group’s strategy and related targets, the progression towards working as One Bank across NatWest Group to serve customers or due to any events, behaviour, action or inaction by NatWest Group, its employees or those with whom NatWest Group is associated. Refer to ‘NatWest Group’s businesses are subject to substantial regulation and oversight, which are constantly evolving and may adversely affect NatWest Group.’ This includes harm to its brand, which may be detrimental to NatWest Group’s business, including its ability to build or sustain business relationships with customers, stakeholders and regulators, and may cause low employee morale, regulatory censure or reduced access to, or an increase in the cost of, funding. Reputational risk may arise whenever there is, or there is perceived to be, a material lapse in standards of integrity, compliance, customer or operating efficiency, or regulatory or press scrutiny, and may adversely affect NatWest Group’s ability to attract and retain customers. For example, NatWest Group’s reputational risks were elevated during 2023 as a result of the departure of its CEO in connection with account closures and related use of customer data that attracted significant public and media attention.
| |
NatWest Group – Annual Report on Form 20-F 2023 | 181 |
Risk factors continued
In particular, NatWest Group’s ability to attract and retain customers (particularly, corporate/institutional and retail depositors), and talent, and engage with counterparties may be adversely affected by factors including: negative public opinion resulting from the actual or perceived manner in which NatWest Group conducts or modifies its business activities and operations, media coverage (whether accurate or otherwise), employee misconduct, NatWest Group’s financial performance, IT systems failures or cyberattacks, data breaches, financial crime and fraud, the level of direct and indirect government support, or the actual or perceived practices in the banking and financial industry in general, or a wide variety of other factors.
Technologies, in particular online social networks and other broadcast tools that facilitate communication with large audiences in short timeframes and with minimal costs, may also significantly increase and accelerate the impact of damaging information and allegations.
Although NatWest Group has implemented a Reputational Risk Policy to identify, measure and manage material reputational risk exposures, NatWest Group cannot be certain that it will be successful in avoiding damage to its business from reputational risk.
Any of the above aspects of reputational risk may have a material adverse effect on NatWest Group’s future results, financial condition, prospects, and/or reputation.
Legal, regulatory and conduct risk
NatWest Group’s businesses are subject to substantial regulation and oversight, which are constantly evolving and may adversely affect NatWest Group.
NatWest Group is subject to extensive laws, regulations, guidelines, corporate governance practice and disclosure requirements, administrative actions and policies in each jurisdiction in which it operates, which represents ongoing compliance and conduct risks. Many of these have been introduced or amended recently and are subject to further material changes, which may increase compliance and conduct risks, particularly as EU/EEA and UK laws diverge as a result of Brexit. NatWest Group expects government and regulatory intervention in the financial services industry to remain high for the foreseeable future.
Regulators and governments continue to focus on reforming the prudential regulation of the financial services industry and the manner in which the business of financial services is conducted. Measures have included: enhanced capital, liquidity and funding requirements, through initiatives such as the Basel 3.1 standards implementation (and any resulting effect on RWAs and models), the UK ring-fencing regime, the strengthening of the recovery and resolution framework applicable to financial institutions in the UK, the EU and the US, financial industry reforms (including in respect of MiFID II and the FSM Act 2023), LIBOR transition, corporate governance requirements, rules relating to the compensation of senior management and other employees, enhanced data protection and IT resilience requirements, financial market infrastructure reforms, enhanced regulations in respect of the provision of ‘investment services and activities’, and increased regulatory focus in certain areas, including conduct, consumer protection (such as the FCA’s Consumer Duty) in retail or other financial markets, competition and disputes regimes, anti-money laundering, anti-corruption, anti-bribery, anti-tax evasion, payment systems, sanctions and anti-terrorism laws and regulations.
In addition, there is significant oversight by competition authorities of the jurisdictions in which NatWest Group operates. The competitive landscape for banks and other financial institutions in the UK, EU/EEA, Asia and the US is rapidly changing. Recent regulatory and legal changes have and may continue to result in new market participants and changed competitive dynamics in certain key areas. Regulatory and competition authorities, including the CMA, are also looking at and focusing more on how they can support competition and innovation in digital and other markets. Future competition investigations, market reviews, or the regulation of mergers may lead to the imposition of financial penalties or market remedies that may adversely affect NatWest Group’s competitive or financial position.
Recent regulatory changes and heightened levels of public and regulatory scrutiny in the UK, the EU and the US have resulted in increased capital, funding and liquidity requirements, changes in the competitive landscape, changes in other regulatory requirements and increased operating costs, and have impacted, and will continue to impact, product offerings and business models.
Other areas in which, and examples of where, governmental policies, regulatory and accounting changes, and increased public and regulatory scrutiny may have an adverse effect (some of which could be material) on NatWest Group include, but are not limited to, the following:
| – | General changes in government, central bank, regulatory or competition policy, or changes in regulatory regimes that may influence investor decisions in the jurisdictions in which NatWest Group operates; |
| – | Rules relating to foreign ownership, expropriation, nationalisation and confiscation or appropriation of assets; |
| – | Increased scrutiny including from the CMA, FCA and Payment Systems Regulator (‘PSR’) for the protection and resilience of, and competition and innovation in, digital and other markets, UK payment systems (with the development of the government’s National Payments Vision and Strategy) and retail banking developments relating to the UK initiative on Open Banking, Open Finance and the European directive on payment services; |
| – | The ongoing compliance by NatWest Group with CMA’s Market Orders including the Retail Banking Market Order 2017 (the ‘Order’) and SME Undertakings as well as legislation being drafted to introduce penalties for breaches of such requirements (in addition to the current customer remediation requirements); |
| |
NatWest Group – Annual Report on Form 20-F 2023 | 182 |
Risk factors continued
| – | Ongoing competition litigation in the English courts around payment card interchange fees, combined with increased regulatory scrutiny (from the PSR) of the Visa and Mastercard card schemes; |
| – | Increased risk of new class action claims being brought against NatWest Group in the Competition Appeal Tribunal for breaches of competition law; |
| – | New or increased regulations relating to customer data protection as well as IT controls and resilience, such as the proposed UK Data Protection and Digital Information Bill (No 2) and in India, the Digital Personal Data Protection Bill 2022; |
| – | The introduction of, and changes to, taxes, levies or fees applicable to NatWest Group’s operations, such as the introduction of global minimum tax rules, changes in tax rates, changes in the scope and administration of the Bank Levy, increases in the bank corporation tax surcharge in the UK, restrictions on the tax deductibility of interest payments or further restrictions imposed on the treatment of carry-forward tax losses that reduce the value of deferred tax assets and require increased payments of tax; |
| – | The potential introduction by the Bank of England of a Central Bank Digital Currency which could result in deposit outflows, higher funding costs, and/or other implications for UK banks including NatWest Group; |
| – | Regulatory enforcement in the form of PRA imposed financial penalties for failings in banks’ regulatory reporting governance and controls, and ongoing regulatory scrutiny, and the PRA’s thematic reviews of the governance, controls and processes for preparing regulatory returns of selected UK banks, including NatWest Group; |
| – | ‘Dear CEO’ letters issued by the Bank of England from time to time; |
| – | Recent or proposed US regulations around cybersecurity incidents, climate disclosures and other climate and sustainability-related rules; |
| – | New or increased regulations relating to financial crime (including the new criminal offence of failure to prevent fraud), and |
| – | Any regulatory requirements relating to the use of artificial intelligence and large language models across the financial services industry (such as the European Union Artificial Intelligence Act). |
Any of these developments (including any failure to comply with new rules and regulations) could also have an adverse effect on NatWest Group’s authorisations and licences, the products and services that NatWest Group may offer, its reputation and the value of its assets, NatWest Group’s operations or legal entity structure, and the manner in which NatWest Group conducts its business. Material consequences could arise should NatWest Group be found to be non-compliant with these regulatory requirements. Regulatory developments may also result in an increased number of regulatory investigations and proceedings and have increased the risks relating to NatWest Group’s ability to comply with the applicable body of rules and regulations in the manner and within the timeframes required.
Changes in laws, rules or regulations, or in their interpretation or enforcement, or the implementation of new laws, rules or regulations, including contradictory or conflicting laws, rules or regulations by key regulators or policymakers in different jurisdictions, or failure by NatWest Group to comply with such laws, rules and regulations, may adversely affect NatWest Group’s business, results of operations and outlook. In addition, uncertainty and insufficient international regulatory coordination as enhanced supervisory standards are developed and implemented may adversely affect NatWest Group’s ability to engage in effective business, capital and risk management planning.
Any of the above may have a material adverse effect on NatWest Group’s future results, financial condition, prospects, and/or reputation.
NatWest Group is exposed to the risks of various litigation matters, regulatory and governmental actions and investigations as well as remedial undertakings, the outcomes of which are inherently difficult to predict, and which could have an adverse effect on NatWest Group.
NatWest Group’s operations are diverse and complex and it operates in legal and regulatory environments that expose it to potentially significant civil actions (including those following on from regulatory sanction), as well as criminal, regulatory and governmental proceedings. NatWest Group has resolved a number of legal and regulatory actions over the past several years but continues to be, and may in the future be, involved in such actions in the US, the UK, Europe, Asia and other jurisdictions.
NatWest Group is, has recently been or will likely be involved in a number of significant legal and regulatory actions, including investigations, proceedings and ongoing reviews (both formal and informal) by governmental law enforcement and other agencies and litigation proceedings, including in relation to the offering of securities, conduct in the foreign exchange market, the setting of benchmark rates such as LIBOR and related derivatives trading, the issuance, underwriting, and sales and trading of fixed-income securities (including government securities), product mis-selling, customer mistreatment, anti-money laundering, antitrust, VAT recovery and various other issues. There is also an increasing risk of new class action claims being brought against NatWest Group in the Competition Appeal Tribunal for breaches of competition law.
Legal and regulatory actions are subject to many uncertainties, and their outcomes, including the timing, amount of fines, damages or settlements or the form of any settlements, which may be material and in excess of any related provisions, are often difficult to predict, particularly in the early stages of a case or investigation. NatWest Group’s expectation for resolution may change and substantial additional provisions and costs may be recognised in respect of any matter.
| |
NatWest Group – Annual Report on Form 20-F 2023 | 183 |
Risk factors continued
The resolution of significant investigations include: NWM Plc’s December 2021 spoofing-related guilty plea in the United States that was agreed with the US Department of Justice ('DOJ'), and involves a multi-year period of probation, an independent corporate monitor and the ongoing implementation of recommendations made by it, and commitments to compliance programme reviews and improvements and reporting obligations. In the event that NWM Plc does not meet its obligations to the DOJ, this may lead to adverse consequences such as increased costs from any extension of monitorship and/or the period of the probation, findings that NWM Plc violated its probation term and possible re-sentencing, amongst other consequences. Ongoing matters include the implementation of recommendations made by the law firm Travers Smith LLP following independent reviews into issues that had arisen from treatment of a customer in connection with an account closure decision that attracted significant public attention and related interactions with the media, and certain account closures more generally. NatWest Group plc has received reports in connection with the Travers Smith reviews, and published summaries of the key findings and recommendations in October and December 2023. In addition, NatWest Group plc is conducting internal reviews with respect to certain governance processes, policies, systems and controls of NatWest Group entities, including with respect to customer account closures and the FCA is conducting supervisory work into how the governance, systems and controls of NatWest Group and Coutts & Company are working, to identify and address any significant shortcomings. For additional information relating to legal, regulatory proceedings and matters to which NatWest Group is exposed, refer to ‘Litigation and regulatory matters’ at Note 26 to the consolidated accounts.
Recently resolved matters or adverse outcomes or resolution of current or future legal, regulatory or other matters, including conduct-related reviews, redress projects or the subject matter and outcomes of any of the independent or internal reviews described above, could increase the risk of greater regulatory and third-party scrutiny and/or result in future legal or regulatory actions, and could have material financial, reputational, or collateral consequences for NatWest Group’s business and result in restrictions or limitations on NatWest Group’s operations.
These may include the effective or actual disqualification from carrying on certain regulated activities and consequences resulting from the need to reapply for various important licences or obtain waivers to conduct certain existing activities of NatWest Group, particularly but not solely in the US, which may take a significant period of time and the results and implications of which are uncertain.
Disqualification from carrying on any activities, whether automatically as a result of the resolution of a particular matter or as a result of the failure to obtain such licences or waivers could adversely affect NatWest Group’s business, in particular in the US. This in turn and/or any fines, settlement payments or penalties may have a material adverse effect on NatWest Group’s future results, financial condition, prospects, and/or reputation.
Failure to comply with undertakings made by NatWest Group to its regulators, or the conditions of probation resulting from the spoofing-related guilty plea, may result in additional measures or penalties being taken against NatWest Group. In addition, any failure to administer conduct redress processes adequately, or to handle individual complaints fairly or appropriately, could result in further claims as well as the imposition of additional measures or limitations on NatWest Group’s operations, additional supervision by NatWest Group’s regulators, and loss of investor confidence.
Any of the above may have a material adverse effect on NatWest Group’s future results, financial condition, prospects, capital position, reputation or its ability to meet regulatory capital adequacy requirements.
Changes in tax legislation or failure to generate future taxable profits may impact the recoverability of certain deferred tax assets recognised by NatWest Group.
In accordance with the accounting policies set out in ‘Critical accounting policies and sources of estimation uncertainty’, NatWest Group has recognised deferred tax assets on losses available to relieve future profits from tax only to the extent it is probable that they will be recovered. The deferred tax assets are quantified on the basis of current tax legislation and accounting standards and are subject to change in respect of the future rates of tax or the rules for computing taxable profits and offsetting allowable losses.
Failure to generate sufficient future taxable profits or further changes in tax legislation (including with respect to rates of tax) or accounting standards may reduce the recoverable amount of the recognised tax loss deferred tax assets, amounting to £1.019 billion as at 31 December 2023. Changes to the treatment of certain deferred tax assets may impact NatWest Group’s capital position. In addition, NatWest Group’s interpretation or application of relevant tax laws may differ from those of the relevant tax authorities and provisions are made for potential tax liabilities that may arise on the basis of the amounts expected to be paid to tax authorities. The amounts ultimately paid may differ materially from the amounts provided depending on the ultimate resolution of such matters.
Any of the above may have a material adverse effect on NatWest Group’s future results, financial condition, prospects, and/or reputation.
| |
NatWest Group – Annual Report on Form 20-F 2023 | 184 |
Additional information
Description of property and equipment
NatWest Group operates from a number of locations worldwide, principally in the UK. At 31 December 2023, RBS plc and NWB Plc had 88 and 460 retail branches respectively, in the UK. Ulster Bank has a footprint of 35 branches and a network of business banking offices across Northern Ireland. All Republic of Ireland branches were closed in H1 2023. A majority of the UK branches are owned by NWB Plc or are held under leases with unexpired terms of over 50 years. NatWest Group’s principal properties include its headquarters at Gogarburn, Edinburgh, its principal office in London is 250 Bishopsgate.
Major shareholders
Following placing and open offers in December 2008 and in April 2009, HM Treasury (HMT) owned approximately 70.3% of the enlarged ordinary share capital of the company. In December 2009, company issued a further £25.5 billion of new capital to HMT in the form of B shares. In August 2015, HMT sold 630 million of its holding of the company’s ordinary shares. In October 2015, HMT converted its entire holding of 51 billion B shares into 5.1 billion new ordinary shares of £1 each in the company. In June 2018, HMT sold a further 925 million of its holding of the company’s ordinary shares.
In March 2021, the company carried out an off-market purchase of 591 million of its ordinary shares from HMT. In May 2021, HMT sold 580 million ordinary shares through an accelerated book building process to institutional investors. In July 2021, HMT announced its intention to sell part of its shareholding over a 12 month period from August 2021 via a trading plan, for up to 15% of the aggregate total trading volume. In March 2022, the company carried out an off-market purchase of 550 million of its ordinary shares from HMT. In June2022 HMT announced that its trading plan was extended for a further 12 month term to August 2023 and, in April 2023, HMT announced a further extension to its trading plan to August 2025.
In May 2023, the company carried out an off-market purchase of 469 million of its ordinary shares from HMT. At 31 December 2023, HMT’s holding in the total voting rights of the company was 37.97%. The percentage was correct as at the date of notification on 8 December 2023.
Since 1 January 2018, the company has redeemed substantially all of the preference shares that were in issue (refer to Note 19 for further details). All shareholders within a class of the company’s shares have the same voting rights.
At the 2023 Annual General Meeting (AGM), shareholders renewed the authority for the company to make an off-market purchase of cumulative preference shares in the company. Shareholders will be asked to renew the authority at the AGM in 2024.
As at 31 December 2023 almost all of the company’s US$ denominated American Depository Shares representing ordinary shares were held by shareholders registered in the US. All other shares were predominantly held by shareholders registered outside the US.
Purchases of Equity Securities by the Issuer and Affiliated Purchasers
The Buyback Programme (Phase 3)
On 17 February 2023, the company announced a share buyback programme (the “Programme”) of up to an aggregate market value equivalent of £800 million in ordinary shares in the company (“Ordinary Shares”). Phase 3 of the Programme commenced on 20 February 2023 and completed on 16 June 2023.
The Programme, the purpose of which was to reduce the capital of the company, was conducted within the limitations of the authority granted by the company’s shareholders to the Board at the company’s Annual General Meeting, held on 28 April 2022 and amended at the General Meeting held on 25 August 2022 to preserve the position as if the August 2022 share consolidation had not taken place (the “2022 Authority”). The maximum number of Ordinary Shares that the company was authorized to repurchase under the Programme was 966,284,391. This number reflects the impact on the 2022 Authority of the reduction in the issued share capital of the company as a result of the off-market buyback on 28 March 2022 by the Company of 550m Ordinary Shares from HM Treasury (the “2022 Off-Market Buyback”).
The company entered into non-discretionary instructions with UBS AG, London Branch to conduct Phase 3 of the Programme on its behalf and to make trading decisions under the Programme independently of the company.
The company cancelled the Ordinary Shares it repurchased under Phase 3 of Programme.
| |
NatWest Group – Annual Report on Form 20-F 2023 | 185 |
Additional information continued
The Buyback Programme (Phase 4)
On 28 July 2023, the company announced a share buyback programme (Phase 4 of the Programme”) of up to an aggregate market value equivalent of £500 million in Ordinary Shares. Phase 4 of the Programme commenced on 31 July 2023 will end no later than 14 March 2024.
Phase 4 of the Programme, the purpose of which is to reduce the issued share capital of the company, is conducted within the limitations of the authority granted by the company’s shareholders to the Board at the company’s Annual General Meeting, held on 25 April 2023 (the “2023 Authority”). The maximum number of Ordinary Shares that the company is authorized to repurchase under Phase 4 of the Programme is 919,858,922. This number reflects the impact on the 2023 Authority of the reduction in the issued share capital of the company as a result of the off-market buyback on 22 May 2023 by the company of 469m Ordinary Shares from HM Treasury (the “2023 Off-Market Buyback”).
The company entered into non-discretionary instructions with UBS AG, London Branch to conduct Phase 4 of the Programme on its behalf and to make trading decisions under the Programme independently of the company.
The Company has cancelled all of the Ordinary Shares it repurchased as at 31 December 2023 under Phase 4 of the Programme.
The Buyback Programme (the 2024 Programme)
On 16 February 2024, the company announced a share buyback programme (“the 2024 Programme”) of up to an aggregate market value equivalent of £300 million in Ordinary Shares. The 2024 Programme commenced on 19 February 2024 will end no later than 18 July 2024.
The 2024 Programme, the purpose of which is to reduce the issued share capital of the company, will take place within the limitations of the authority granted by the company’s shareholders to the Board at the company’s Annual General Meeting, held on 25 April 2023 (the “2023 Authority”). The maximum number of Ordinary Shares that the company is authorized to repurchase under the 2024 Programme is 696,743,990. This number reflects the impact on the 2023 Authority of the reduction in the issued share capital of the company as a result of the 2023 Off-Market Buyback. It is further reduced by the number of shares purchased to date by the Company under the ongoing share buyback programme announced on 31 July 2023 (“Phase 4 of the Programme ”). This number does not take into account further purchases of Ordinary Shares which (i) may have taken place but have not, as at 19 February 2024, settled under Phase 4 of the Programme or (ii) may take place under the Phase 4 of the Programme between 19 February 2024 and the conclusion of the Phase 4 of the Programme. These remaining purchases under Phase 4 of the Programme may occur whilst purchases are taking place under the 2024 Programme.
The company entered into non-discretionary instructions with UBS AG, London Branch to conduct the 2024 Programme on its behalf and to make trading decisions under the Programme independently of the company.
| | | | | | | | |
Issuer Purchases of Equity Securities | ||||||||
| | | | | | Total number of shares purchased | | Maximum value of shares that may |
| | | | Average price paid per | | as part of publicly announced | | yet be purchased under the plans |
Period |
| Total number of shares purchased |
| share in £ |
| or programmes2 |
| or programmes in £ million |
February 20233 | | 13,934,089 | | 284.9121 | | 13,934,089 | | 760 |
March 20233 | | 100,033,306 | | 265.3967 | | 100,033,306 | | 495 |
April 20233 |
| 66,165,066 |
| 269.2043 |
| 66,165,066 |
| 317 |
May 20233 |
| 69,050,344 |
| 261.2810 |
| 69,050,344 |
| 136 |
June 20233 |
| 52,197,248 |
| 261.0873 |
| 52,197,248 |
| — |
July 20234 |
| 1,340,742 |
| 244.8093 |
| 1,340,742 |
| 497 |
August 20234 | | 31,756,917 | | 231.6891 | | 31,756,917 | | 423 |
September 20234 | | 29,812,229 | | 232.9423 | | 29,812,229 | | 354 |
October 20234 | | 56,333,617 | | 207.9936 | | 56,333,617 | | 237 |
November 20234 | | 21,206,532 | | 199.4008 | | 21,206,532 | | 194 |
December 20234 |
| 18,506,398 |
| 217.1550 |
| 18,506,398 |
| 154 |
Total |
| 460,336,488 |
| 248.9372 |
| 460,336,488 |
| — |
| (1) | The table excludes purchases by the Company or its affiliates for market-making in Ordinary Shares. |
| (2) | The table excludes (ithe off-market purchase by the Company of 469,200,081 Ordinary Shares from HM Treasury on 22 May 2023. |
| (3) | Purchases made pursuant to Phase 3 of the Programme. |
| (4) | Purchases made pursuant to Phase 4 of the Programme. |
| |
NatWest Group – Annual Report on Form 20-F 2023 | 186 |
Additional information continued
Our Code of conduct
NatWest Group has adopted a code of conduct (Our Code) which is supplemented by a number of key bank policies. The key policies and guidance include, among others, Anti-Bribery and Corruption, Anti-Money Laundering, Competition Policy, Complaints Management & Errors Management, Customers in Vulnerable Situations, Sanctions, confidentiality, inside information, Health, Safety and Environment, Managing Conflicts, Inside Information and Personal Account Dealing, Market Abuse and Inside Information, Privacy and Client Confidentiality and Security, . By following these policies, NatWest Group’s approach to risk management is consistent and will keep it and its customers safe and secure. There are local country policies which align to country laws and regulations. Our Code applies to permanent colleagues, contractors, agency or temporary workers. Our Code is available to view on NatWest Group’s website at natwestgroup.com.
Iran sanctions and related disclosures
Disclosure pursuant to section 13(r) of the Securities Exchange Act
Section 13(r) of the Securities Exchange Act, added by Section 219 of the Iran Threat Reduction and Syria Human Rights Act of 2012, requires an issuer to disclose in its annual or quarterly reports, as applicable, whether, during the period covered by the report, it or any of its affiliates knowingly engaged in specified activities or transactions relating to Iran or with individuals or entities designated under Executive Order 13382 or 13224. Disclosure is required of certain activities conducted outside the United States by non-U.S. entities in compliance with local law, whether or not the activities are sanctionable under U.S. law.
In order to comply with this requirement, the following activities of NatWest Group’s affiliates are disclosed in response to Section 13(r).
Transactions involving Iranian Government owned entities
During 2023 affiliates of NatWest Group facilitated 1 payment which was remitted by, or on behalf of, an Iranian Government owned entity designated under OFAC Executive Order 13224 and received by a NatWest Group customer (non-designated and located in the United Kingdom) in relation to legal fees.
This payment was processed in full compliance with applicable sanctions.
The transaction described above resulted in £5,000.00 gross revenue to NatWest Group. Considering the processes in place to undertake such transactions, including enhanced due diligence processes, the profit from this transaction was negligible.
NatWest Group has a restrictive risk appetite in relation to transactions involving Iran and will only continue to engage in transactions similar to the one described above as long as such transactions are in compliance with applicable sanctions laws and within NatWest Group’s risk appetite.
NatWest Group maintain one account for an Iranian Government entity located in the United Kingdom. The purpose of the account is to facilitate UK domestic transactions only for employees’ salaries and operating costs such as UK taxes and utilities. No commercial activity is processed through the account.
Guarantees
Under applicable licenses granted by appropriate authorities, affiliates of NatWest Group hold three legacy guarantees entered into between 1984 and 1998, which support arrangements lawfully entered into by affiliates of NatWest Group customers with Iranian counterparties. These legacy guarantees are in favour of Iranian Government owned financial institutions. Any revenue or profit generated by these guarantees is negligible.
Iranian Petroleum Industry
Section 13(r) of the Securities Exchange Act (as amended) requires disclosure of any knowing engagement in activity described in Section 5 (a) or (b) of the Iran Sanctions Act, including significant investments in or transactions that could develop the Iranian petroleum or petrochemical sectors.
During 2023, no transactions that meet these criteria have been facilitated by NatWest Group.
Supervision
United Kingdom
The home supervisors for NatWest Group are the Prudential Regulation Authority (PRA) and the Financial Conduct Authority (FCA). As with all significant banking institutions, the PRA is the consolidated supervisor of NatWest Group. The FCA’s overall objective is to ensure financial markets function well. This is supported by its operational objectives of: securing an appropriate degree of protection for consumers; protecting and enhancing the integrity of the UK financial system; and promoting effective competition in the interests of consumers.
| |
NatWest Group – Annual Report on Form 20-F 2023 | 187 |
Additional information continued
As at 31 December 2023, 11 companies in NatWest Group, spanning a range of financial services sectors, including banking and investment business, were authorised to conduct financial activities in the UK. The material UK authorised banks in NatWest Group are The Royal Bank of Scotland plc (RBS plc), National Westminster Bank Plc (NWB Plc), NatWest Markets Plc (NWM Plc) and Coutts & Company. Wholesale activities, other than Treasury activities, are concentrated in NatWest Markets Plc. Retail banking activities in England, Scotland and Wales are managed by the Retail Banking, Commercial & Institutional Banking and Wealth businesses of RBS plc, NWB Plc and Coutts & Company.
NatWest Group’s banking service in the Republic of Ireland is provided by Ulster Bank Ireland DAC (UBI DAC), which is supervised by the Central Bank of Ireland and the European Central Bank under the Single Supervisory Mechanism. In February 2021, NatWest Group announced the phased withdrawal of UBI DAC from the Republic of Ireland. We are currently at an advanced stage of our withdrawal process and continue to progress in line with our integrated plan whilst also taking the necessary steps to keep the bank safe, help our customers and support our colleagues. We intend to hand back our banking license in H1 2025.
Investment management business is principally undertaken by companies in the Commercial & Institutional Banking and Wealth businesses, including Coutts & Company.
NatWest Group is subject to extensive regulations that impose obligations on financial institutions to maintain appropriate policies, procedures and controls to ensure compliance with the rules and regulations to which they are subject.
United States
NatWest Group conducts business in the US through its investment bank, NWM Plc. NWM Plc’s regulated entities in the US are: its broker-dealer affiliate, NatWest Markets Securities Inc. (NWMSI); NWMSI’s Futures Commission Merchant (FCM); NWM Plc’s non-FCM clearing member; NWM Plc’s non-US-based Swap Dealer; and NWM Plc’s Connecticut Representative Office. NWM Plc is subject to the supervision of the Board of Governors of the Federal Reserve System (Federal Reserve) due to an outstanding enforcement action brought against NatWest Group by the Federal Reserve, namely the 2015 FX Cease and Desist Consent Order.
In addition, NWMSI is a Primary Dealer of the Federal Reserve, which makes it subject to the supervision of the Federal Reserve Bank of New York (FRB-NY).
NWMSI is subject to the regulations of a number of US securities regulators, mainly the Securities and Exchange Commission (SEC), the Financial Industry Regulatory Authority (FINRA), Options Clearing Corporation (OCC), Depository Trust & Clearing Corporation (DTCC), and various state regulators. NWMSI’s FCM is mainly subject to the regulations of the Commodity Futures Trading Commission (CFTC), National Futures Association (NFA) and the Chicago Mercantile Exchange Group (CME).
NWM Plc is a non-FCM clearing member of the CME and is subject to the regulations of the CME and the CFTC. NWM Plc is also a non-US-based provisionally-registered swap dealer and as such it is subject to oversight by the US regulators the CFTC and the NFA.
The NWM Plc Connecticut Representative Office is supervised by the FRB-NY and the Connecticut Department of Banking.
The anti-money laundering, anti-terrorism and economic sanctions regulations are a major focus of the US government for financial institutions and are rigorously enforced by most of the regulators mentioned above and the Financial Crimes Enforcement Network (FinCEN) of US Department of the Treasury.
Other jurisdictions
NatWest Group operates in a number of countries through a network of branches, local banks and non-bank subsidiaries and these activities are subject to supervision in most cases by a local regulator or central bank.
In Q4 2023, the ECB provided formal notification of their intention to undertake joint supervision of our 5 EU institutions (RBSH N.V., NWM N.V., RSBI DS, NWBE and UBIDAC) and to formally commence supervision on 1 January 2024. The ECB have highlighted that NV, as a “true Significant Institution”, will be the focus of supervision but the regulator intends to apply proportionality to all and in particular to the smaller institutions of NWBE and RBSI.
| |
NatWest Group – Annual Report on Form 20-F 2023 | 188 |
Material Contracts
Material Contracts
The company and its subsidiaries are party to various contracts in the ordinary course of business. Material contracts include the following:
B Share Acquisition and Contingent Capital Agreement
On 26 November 2009, the company and HM Treasury entered into the Acquisition and Contingent Capital Agreement pursuant to which HM Treasury subscribed for the initial B shares and the Dividend Access Share (the Acquisitions) and agreed the terms of HM Treasury’s contingent subscription (the Contingent Subscription) for an additional £8 billion in aggregate in the form of further B shares (the Contingent B shares), to be issued on the same terms as the initial B shares. The Acquisitions were subject to the satisfaction of various conditions, including the company having obtained the approval of its shareholders in relation to the Acquisitions.
On 16 December 2013, the company announced that, having received approval from the PRA, it had terminated the £8 billion Contingent Subscription. The company was able to cancel the Contingent Subscription as a result of the actions announced in the second half of 2013 to further strengthen its capital position.
On 9 October 2015, the company announced that on 8 October 2015, it had received a valid conversion notice from HM Treasury in respect of all outstanding B shares held by HM Treasury. The new ordinary shares issued on conversion of the B shares were admitted to the official list of the UK Listing Authority (UKLA), and to trading on the London Stock Exchange plc, on 14 October 2015. Following such conversion, HM Treasury no longer holds any B shares.
The company gave certain representations and warranties to HM Treasury on the date of the Acquisition and Contingent Capital Agreement, on the date the circular was posted to shareholders, on the first date on which all of the conditions precedent were satisfied, or waived, and on the date of the Acquisitions. The company also agreed to a number of undertakings.
The company agreed to reimburse HM Treasury for its expenses incurred in connection with the Acquisitions.
For as long as it is a substantial shareholder of the company (within the meaning of the UKLA’s Listing Rules), HM Treasury has undertaken not to vote on related party transaction resolutions at general meetings and to direct that its affiliates do not so vote
Directed Buyback Contract
On 7 February 2019, the company and HM Treasury entered into the Directed Buyback Contract to help facilitate the return of the company to full private ownership through the use of any excess capital to buy back the company’s ordinary shares held by HM Treasury.
Under the terms of the Directed Buyback Contract, the company may agree with HM Treasury to make off-market purchases from time to time of its ordinary shares held by HM Treasury, including by way of one or more standalone purchases, through a non-discretionary, broker-managed directed trading programme, or in conjunction with any offer or sale by HM Treasury by way of an institutional placing. Neither the company nor HM Treasury would be under an obligation to agree to make such off-market purchases and would only do so subject to regulatory approval at the time.
The aggregate number of ordinary shares which the company may purchase from HM Treasury under the Directed Buyback Contract will not exceed 4.99%. of the company’s issued share capital and the aggregate consideration to be paid will not exceed 4.99%. of the company’s market capitalisation. The price to be paid for each ordinary share will be the market price at the time of purchase or, if the directed buyback is in conjunction with an institutional placing, the placing price.
To date, the company has made three separate off-market purchases under the Directed Buyback Contract. One purchase took place in 2021, the second purchase took place in 2022, and another took place in 2023.
On 19 March 2021, the company announced that it had agreed with HM Treasury to make an off-market purchase under the Directed Buyback Contract for the total consideration of £1,125,341,269 for 590,730,325 ordinary shares representing 4.86% of the company's issued share capital at that point in time.
On 28 March 2022, the company announced an off-market purchase of 549,851,147 ordinary shares for the total consideration of £1,212,421,779. The purchased ordinary shares represented 4.91% of the company's issued share capital at the time (excluding treasury shares). This took HM Treasury's ownership in the company below 50% for the first time since 2008. On 22 May 2023, the company announced an off-market purchase of 469,200,081 ordinary shares for a total consideration of £1,259,333,017. The purchased ordinary shares represented 4.95% of the company's issued ordinary share capital at the time (excluding treasury shares).
| |
NatWest Group – Annual Report on Form 20-F 2023 | 189 |
Material contracts continued
Framework and State Aid Deed
As a result of the State Aid granted to the company, it was required to work with HM Treasury to submit a State Aid restructuring plan to the European Commission (EC), which was then approved by the EC under the State Aid rules on 14 December 2009. The company agreed a series of measures which supplemented the measures in the company’s strategic plan.
The company entered into a State Aid Commitment Deed with HM Treasury at the time of the initial EC decision and, following the EC’s approval of amendments to the restructuring plan in April 2014, the company entered into a revised State Aid Commitment Deed with HM Treasury. In September 2017, the revised State Aid Commitment Deed was amended by a Deed of Variation (as so amended, the ‘Revised State Aid Commitment Deed’) following the EC’s approval of an alternative remedies package (the ‘Alternative Remedies Package’) to replace the company’s final outstanding commitment under its State Aid obligations (to divest the business previously known as Williams & Glyn)
On 25 April 2018, the Revised State Aid Commitment Deed was replaced by the Framework and State Aid Deed between the company, HM Treasury and an independent body established to facilitate and oversee the delivery of the Alternative Remedies Package (the ‘Independent Body’). Under the Framework and State Aid Deed, the company agrees to do all acts and things necessary to ensure that HM Treasury is able to comply with its obligations under any EC decision approving State Aid to the company, including under the Alternative Remedies Package.
Pursuant to the Framework and State Aid Deed, the company has committed: (i) £425 million into a fund for eligible bodies in the UK banking and financial technology sectors to develop and improve their capability to compete with the company in the provision of banking services to small and medium-sized enterprises (SMEs) and develop and improve the financial products and services available to SMEs (the ‘Capability and Innovation Fund’); and (ii) £275 million to eligible bodies to help them incentivise SME banking customers within the division of the company previously known as Williams & Glyn to switch their business current accounts and loans to the eligible bodies (the ‘Incentivised Switching Scheme’).
The company has also agreed to set aside up to a further £75 million in funding to cover certain costs customers may incur as a result of switching under the Incentivised Switching Scheme. In addition, under the terms of the Alternative Remedies Package, should the uptake within the Incentivised Switching Scheme not be sufficient, the company may be required to make a further contribution, capped at £50 million. The Independent Body will distribute funds from the Capability and Innovation Fund and implement the Incentivised Switching Scheme.
Under the Framework and State Aid Deed, the company also agreed to indemnify the Independent Body and HM Treasury, up to an amount of £320 million collectively to cover liabilities that may be incurred in implementing the Alternative Remedies Package. The provisions of the indemnity to the Independent Body are set out in the Framework and State Aid Deed and the provisions of the indemnity to HM Treasury are set out in a separate agreement between the company and HM Treasury, described under “Deed of Indemnity” below.
The Framework and State Aid Deed also provides that if the EC adopts a decision that the UK Government must recover any State Aid (a ‘Repayment Decision’) and the recovery order of the Repayment Decision has not been annulled or suspended by the General Court or the European Court of Justice, then the company must repay HM Treasury any aid ordered to be recovered under the Repayment Decision.
Deed of Indemnity
In the context of the Framework and State Aid Deed, the company entered into a Deed of Indemnity with HM Treasury on 25 April 2018, pursuant to which the company agreed to indemnify HM Treasury to cover liabilities that may be incurred in implementing the Alternative Remedies Package, as described under “Framework and State Aid Deed” above.
Trust Deed
In the context of the Framework and State Aid Deed, the company entered into a Trust Deed with the Independent Body on 25 April 2018, to set up a trust to administer the funds committed by the company under the Framework and State Aid Deed for the Alternative Remedies Package.
State Aid Costs Reimbursement Deed
Under the 2009 State Aid Costs Reimbursement Deed, the company has agreed to reimburse HM Treasury for fees, costs and expenses associated with the State Aid and State Aid approval.
HMT and UKFI Relationship Deed
On 7 November 2014, in order to comply with an amendment to the UK Listing Rules, the company entered into a Relationship Deed with HM Treasury and UK Financial Investments Limited in relation to the company’s obligations under the UK Listing Rules to put in place an agreement with any controlling shareholder (as defined for these purposes in the Listing Rules). The Relationship Deed covers the three independence provisions mandated by the Listing Rules: (i) that contracts between the company and HM Treasury (or any of its subsidiaries) will be arm’s length and normal commercial arrangements, (ii) that neither HM Treasury nor any of its associates will take any action that would have the effect of preventing the company from complying with its obligations under the Listing Rules; and (iii) neither HM Treasury nor any of its associates will propose or procure the proposal of a shareholder resolution which is intended or appears to be intended to circumvent the proper application of the Listing Rules.
| |
NatWest Group – Annual Report on Form 20-F 2023 | 190 |
Material contracts continued
Memorandum of Understanding Relating to The Royal Bank of Scotland Group Pension Fund
On 16 April 2018 the company entered into a Memorandum of Understanding (the ‘MoU’) with the trustee of The Royal Bank of Scotland Group Pension Fund (the ‘Group Fund’), which aimed to facilitate both the necessary changes to the Main Section of the Group Fund to align the employing entity structure with the requirements of the UK ring-fencing legislation and acceleration of the settlement framework for the 31 December 2017 triennial valuation of the Main Section of the Group Fund (brought forward from 31 December 2018).
In addition, the MoU also provided clarity on the additional related funding contributions required to be made by the company to the Main Section of the Group Fund as follows: (i) a pre-tax payment of £2 billion that was made in the second half of 2018 and (ii) from 1 January 2020, further pre-tax contributions of up to £1.5 billion in aggregate linked to the making of future distributions to RBS shareholders including ordinary and special dividends and/or share buy backs (subject to an annual cap on contributions of £500 million before tax).
Framework Agreement Relating to the NatWest Group Pension Fund
On 28 September 2018, National Westminster Bank plc (NWB Plc) entered into a framework agreement (the ‘Framework Agreement’) with, among others, the trustee (‘Trustee’) of the NatWest Group Pension Fund (the ‘Group Fund’). Amongst others, the Framework Agreement set out the funding contributions required to be made by NatWest Group to the Main Section of the Group Fund as follows: (i) a pre-tax payment of £2 billion that was made in the second half of 2018 and (ii) from 1 January 2020, further pre-tax contributions of up to £1.5 billion in aggregate linked to the making of future distributions to NatWest Group shareholders including ordinary and special dividends and/or share buy backs (subject to an annual cap on contributions of £471 million before tax). Pursuant to funding requirements in the Framework Agreement, NatWest Group made contributions to the Main Section of the Group Fund in an aggregate amount of £500 million in 2021 and £500 million in 2022.
On 6 February 2023, NWB Plc and the Trustee entered into an amendment to the Framework Agreement, a supplemental framework agreement and a revised Schedule of Contributions to, among others, restructure the requirement to make a distribution-linked contribution to the Main Section of the Group Fund of up to £500 million (before tax) in 2023. In place of this requirement, NWB Plc and the Trustee agreed to establish a bankruptcy remote reservoir trust to hold assets with a value equivalent to £471 million under the continuing control of NWB Plc. These assets would become transferrable to the Main Section of the Group Fund in the event that specified payment triggers, reflecting a funding requirement, were met in two consecutive financial years. The bankruptcy remote reservoir trust arrangement was given effect through NWB Plc and the Trustee, among others, entering into a suite of related agreements in May 2023. These documents include a Reservoir Trust Deed, a Payment Triggers Agreement and a Security Agreement. Together they establish the reservoir trust and set out the circumstances under which assets are payable to the Group Fund or NWB Plc.
Cybersecurity Risk Management
Cybersecurity Risk Management Processes
Our cybersecurity risk management forms an integral part of NatWest Group's overall enterprise wide risk management framework (EWRMF) which is designed around a three lines of defence model. Specifically, management of cybersecurity risk is a subset of NatWest Group's wider operational risk management. To support our cybersecurity risk management, we have information and cyber security policies in place. These policies are reviewed at least annually and benchmarked against industry best practice standards, including the "Information Security Forum: Standard Of Good Practice" (ISF: SOGP) and relevant publications by competent authorities such as the National Cyber Security Centre (NCSC), to help us identify and remediate any gaps in our controls and procedures. Our policies are also aligned with a number of other international and industry standards, such as ISO 27001 and the National Institute of Standards and Technology Cyber Security Framework. In addition, NatWest Group is certified in Cyber Essentials by the IASME Consortium Ltd (IASME), a recognised government owned scheme operated by the NCSC. The relevant policies form part of our internal process to support NatWest Group's annual attestation to its management's assessment of the effectiveness of its internal control over financial reporting required under Section 404 of the Sarbanes-Oxley Act.
Our cybersecurity risk management framework provides mechanisms for managing cybersecurity threats and incidents which are designed to mitigate the impact of cybersecurity threats and incidents. The framework also includes a structured approach for identifying and managing both internal cybersecurity incidents and external incidents impacting our third-party suppliers. In addition, the framework includes a process for assessing the severity and source of a cybersecurity threat or incident, including in relation to third-party service providers, enabling us to implement mitigating controls as required and to inform NatWest Group's management and board of directors of any material impact.
| |
NatWest Group – Annual Report on Form 20-F 2023 | 191 |
Cybersecurity risk management continued
The functions of our cybersecurity risk management framework are based on a three lines of defence model:
- | NatWest Group’s first line of defence is responsible for setting NatWest Group’s information and cybersecurity risk management strategy, including: delivering effective and efficient cybersecurity products and services and identifying, considering and assessing material cybersecurity threats on an ongoing basis. As part of the first line of defence: |
| a) | We continue to invest significant resources in developing and improving our cybersecurity risk management processes and engage third-party service providers to independently review and test these processes at least annually. |
| b) | We undertake due diligence in respect of third-party service providers involved in our supply chain in line with minimum security requirements defined by us in line with industry practice that suppliers are contractually bound by. These minimum standards, among others, require suppliers to notify NatWest Group of any material cybersecurity incidents. |
| c) | We educate our employees and customers on cybersecurity threats and incidents on the basis of education and awareness programmes that are designed around the most relevant cybersecurity threats and incidents for NatWest Group. These awareness and education programmes are reviewed regularly and updated based on changes to the cybersecurity threat landscape. Our employees are also required to participate in annual information security (including cybersecurity) trainings and additional learning materials relating to cybersecurity threats are available for consultation. |
- | As part of the second line of defence, a dedicated Operational Risk team is responsible for the assessment, identification and management of NatWest Group's cybersecurity risk and provides regular updates and opinions to senior risk committees of NatWest Group. These include monthly updates to the Technology Risk Committee and escalations as required to the NatWest Digital X Risk Committee. The Operational Risk team also provides annual opinions to NatWest Group's Executive Risk Committee and Board Risk Committee. |
- | As part of the third line of defence, NatWest Group's Internal Audit (IA) team has a risk-based coverage approach to assess the adequacy of the design and operational effectiveness of key internal controls, governance and risk management, including in connection with cybersecurity risk. The frequency and scope of the internal audit coverage depends on the ongoing assessment of the key risks to NatWest Group. |
Cybersecurity threats for 2023
NatWest Group is continuously exposed to cybersecurity threats across its business and supply chain, which are closely monitored by NatWest Group. In the year ended December 31, 2023, we did not identify any cybersecurity threats that have materially affected or are reasonably likely to materially affect NatWest Group. However, given the nature of cybersecurity threats, we cannot eliminate all risks from cybersecurity threats, or provide assurances that we have not experienced an undetected cybersecurity incident. For more information about these risks, please see "Risk Factors - NatWest Group is subject to increasingly sophisticated and frequent cyberattacks." in this annual report.
Board Cybersecurity Risk Oversight
Board
The Board of Directors (Board) ensures there is a framework of prudent and effective controls which enables risks - including information and cyber security risk - to be assessed and managed. In addition to approving the Enterprise-Wide Risk Management Framework (EWRMF) (including NatWest Group's risk appetite framework) on recommendation from the Group Board Risk Committee (BRC), the Board approves the risk appetite for principal risks, including operational risk of which information and cyber security is a component. The Board monitors information and cyber security performance against risk appetite through the receipt of regular reporting and receives reporting on top & emerging threats, including the likelihood of a cyber-attack. The Board also considers material risks, including information and cybersecurity, and reviews the effectiveness of risk management and internal control systems.
Group Board Risk Committee (BRC)
In relation to information and cybersecurity risk, BRC provides oversight and advice to the Board on current and future risk exposures of NatWest Group and its subsidiaries; future risk profile including risk appetite; the approval and effectiveness of the EWRMF and the internal controls required to manage risk. It approves the Risk Management Strategy and oversees its effective delivery. BRC reviews all information and cybersecurity risk exposures and management's recommendations to monitor, control and mitigate such exposures. It also reviews NatWest Group's information and cybersecurity performance against risk appetite through the receipt of regular reporting, updates on top & emerging risks; and updates from the first and second lines of defence and escalates matters to the Board as required.
| |
NatWest Group – Annual Report on Form 20-F 2023 | 192 |
Cybersecurity risk management continued
Management responsible for managing information and cybersecurity risk
NatWest Group's first line of defence is responsible for setting NatWest Group's information and cybersecurity risk management strategy, including: delivering effective and efficient cybersecurity products and services and identifying, considering and assessing material cybersecurity threats on an ongoing basis. NatWest Group's cybersecurity programmes are under the direction of the Chief Information Officer (CIO) who holds regulatory accountability under the Senior Managers and Certification Regime for defining and delivering NatWest Group's internal technology, infrastructure services and customer operations, including NatWest Group's IT strategy, cybersecurity, operational continuity and resilience. The Chief Information Security Officer (CISO) reports to the CIO and receives regular reports from the cybersecurity team under his supervision. The CISO, via the cybersecurity team, monitors the prevention, detection, mitigation, and remediation of cybersecurity threats and incidents. The CISO and the cybersecurity team are experienced information security professionals with many years of experience in the information and cyber security industry.
| |
NatWest Group – Annual Report on Form 20-F 2023 | 193 |
Shareholder information
| |
| Page |
194 | |
194 | |
196 | |
196 | |
197 | |
197 | |
199 | |
200 | |
204 | |
204 | |
204 | |
205 |
Financial calendar
Dividends
| |
Payment dates | |
Cumulative preference shares | 31 May and 31 December 2024 |
| |
Ordinary shares (2023 final) | 29 April 2024 |
| |
Ex dividend date | |
Cumulative preference shares | 2 May and 28 November 2024 |
| |
Ordinary shares (2023 final) | 14 March 2024 |
| |
Record date | |
Cumulative preference shares | 3 May and 29 November 2024 |
| |
Ordinary shares (2023 final) | 15 March 2024 |
| |
Annual General Meeting | 23 April 2024 |
| |
Interim results | 26 July 2024 |
Shareholder enquiries
You can check your shareholdings in the company by visiting the Shareholder centre section of our website, www.natwestgroup.com and click the ‘Accessing your shareholding online’ tab. You will need the shareholder reference number printed on your share certificate or dividend confirmation statement to access this information. You can also view any outstanding payments, update bank account and address details and download various forms.
NatWest Group is committed to reducing its impact on the environment. You can choose to receive your shareholder communications electronically via the ‘Sign up for e-comms’ tab and you will receive an email notification when documents become available to view on our website.
| |
NatWest Group – Annual Report on Form 20-F 2023 | 194 |
Shareholder information continued
You can also check your shareholding by contacting our Registrar:
Computershare Investor Services PLC
The Pavilions
Bridgewater Road
Bristol BS99 6ZZ
Telephone: +44 (0)370 702 0135
Website: www-uk.computershare.com/investor/
Braille and audio Strategic report with additional information
Shareholders requiring a Braille or audio version of the Strategic report with additional information should contact the Registrar on +44 (0)370 702 0135.
ShareGift
The company is aware that shareholders who hold a small number of shares may be retaining these shares because dealing costs make it uneconomical to dispose of them. ShareGift, is a free charity share donation service operated by The Orr Mackintosh Foundation (registered charity 1052686) to enable shareholders to donate shares to charity.
If you are a UK taxpayer, donating your shares in this way will not give rise to either a gain or a loss for UK capital gains tax purposes. You may be able to claim UK income tax relief on gifted shares and can do so in various ways. Further information can be obtained from HM Revenue & Customs.
Should you wish to donate your shares to charity please contact ShareGift for further information:
ShareGift, The Orr Mackintosh Foundation
67/68 Jermyn Street, London, SW1Y 6NY
Telephone: +44 (0)20 7930 3737
Website: www.sharegift.org
Share and bond scams
Share and bond scams are often run from ‘boiler rooms’ where fraudsters cold-call investors, offering them worthless, overpriced or even non-existent shares or bonds.
They use increasingly sophisticated tactics to approach investors, offering to buy or sell shares, often pressuring investors to make a quick decision or miss out on the deal. Contact can also be in the form of email, post or word of mouth. Scams are sometimes advertised in newspapers, magazines or online as genuine investment opportunities and may offer free gifts or discounts on dealing charges.
Scammers will request money upfront, as a bond or other form of security, but victims are often left out of pocket, sometimes losing their savings or even their family home. Even seasoned investors have been caught out by scams.
Clone firms
A ‘clone firm’ uses the name, firm registration number (FRN) and address of a firm or individual who is FCA authorised. The scammer may claim that the genuine firm’s contact details on the FCA Register (Register) are out of date and then use their own details, or copy the website of an authorised firm, making subtle changes such as the phone number. They may claim to be an overseas firm, which won’t always have full contact and website details listed on the Register.
How to protect yourself
Always be wary if you’re contacted out of the blue, pressured to invest quickly, or promised returns that sound too good to be true. FCA authorised firms are unlikely to contact you unexpectedly with an offer to buy or sell shares or bonds.
Please do not give any personal details to any caller unless you are certain that they are genuine. Check the Register to ensure the firm contacting you is authorised and also check the FCA’s Warning List of firms to avoid at www.fca.org.uk/scamsmart.
Shareholder information continued
Ask for their (FRN) and contact details and then contact them using the telephone number on the Register. Never use a link in an email or website from the firm offering you an investment.
It is strongly advised that you seek independent professional advice before making any investment
Report a scam
If you suspect that you have been approached by fraudsters, or have any concerns about a potential scam, report this to the FCA by contacting their Consumer Helpline on 0800 111 6768 or by using their reporting form which can be found on their website.
If you have already invested in a scam, fraudsters are likely to target you again or sell your details to other criminals. The follow-up scam may be completely separate, or may be related to the previous scam in the form of an offer to get your money back or buy back the investment on payment of a fee.
Find out more at www.fca.org.uk/consumers.
Analysis of ordinary shareholders
| | | | | | |
| | | | Number | | |
| | | | of shares | | |
At 31 December 2023 |
| Shareholdings |
| - millions |
| % |
Individuals |
| 157,889 |
| 83,297,793 |
| 0.94 |
Banks and nominee companies |
| 1,662 |
| 8,642,080,822 |
| 96.11 |
Investment trusts |
| 39 |
| 289,957 |
| — |
Insurance companies |
| 2 |
| 2,136 |
| — |
Other companies |
| 406 |
| 33,604,044 |
| 0.37 |
Pension trusts |
| 16 |
| 36,564 |
| — |
Other corporate bodies |
| 66 |
| 232,425,660 |
| 2.58 |
|
| 160,080 |
| 8,991,736,976 |
| 100.00 |
Range of shareholdings: |
| |
| |
| |
1 - 1,000 |
| 139,605 |
| 33,104,907 |
| 0.37 |
1,001 - 10,000 |
| 18,728 |
| 42,293,218 |
| 0.47 |
10,001 - 100,000 |
| 852 |
| 26,741,390 |
| 0.30 |
100,001 - 1,000,000 |
| 492 |
| 186,402,587 |
| 2.07 |
1,000,001 - 10,000,000 |
| 315 |
| 1,088,703,837 |
| 12.11 |
10,000,001 and over |
| 88 |
| 7,614,491,037 |
| 84.68 |
|
| 160,080 |
| 8,991,736,976 |
| 100.00 |
Trading market
ADSs representing ordinary shares
In October 2007, the company listed ADSs, each representing one ordinary share nominal value 25p each (or a right to receive one ordinary share), and evidenced by an ADR or uncertificated securities, on the NYSE under the symbol ‘NWG’. With effect from 7 November 2008, the ratio of one ADS representing one ordinary share changed to one ADS representing 20 ordinary shares.
Following a sub-division and one-for-ten consolidation of NatWest Group’s ordinary shares in June 2012, the ratio of one ADS representing 20 ordinary shares was adjusted to one ADS representing two ordinary shares. As at 31 December 2023, 59,801,420 ADSs were outstanding.
At a General Meeting of the company on 25 August 2022, shareholders approved a share consolidation of the company's ordinary shares. Every 14 existing ordinary shares of £1 each in the capital of the company in issue as at 26 August 2022 were consolidated into one intermediate ordinary share of £14.00 and immediately divided into 13 new ordinary shares of £1.0769 in the capital of the company.
As a result, for each existing ADR held on the ADR Register on 26 August 2022, ADR Holders, upon cancellation of their existing ADRs, were issued and received new ADRs in the ratio of 13 new ADRs to replace each 14 existing ADRs (distributed in accordance with the Deposit Agreement after giving effect to the fees and expenses provided for therein).
| |
NatWest Group – Annual Report on Form 20-F 2023 | 196 |
Shareholder information continued
The ordinary ADSs were issued pursuant to a Deposit Agreement, among the company, The Bank of New York Mellon, as depository, and all owners and holders from time to time of ordinary ADSs issued thereunder. The ordinary shares of the company are listed and traded on the London Stock Exchange under the symbol ‘NWG’. All ordinary shares are deposited with the principal London office of The Bank of New York Mellon, as custodian for the depository.
Dividend history
Preference dividends
| | | | | | | | | | | | |
|
| 2023 |
| 2023 |
| 2022 |
| 2021 |
| 2020 |
| 2019 |
Amount per share | | $ | | £ | | £ | | £ | | £ | | £ |
Non-cumulative preference shares of US$0.01 |
|
|
|
|
|
|
|
|
|
|
|
|
-Series U (1) |
| — |
| — |
| — |
| 1,835 |
| 2,602 |
| 3,800 |
| (1) | Classified as equity. |
Ordinary dividends
In 2023 NatWest Group paid an interim dividend of £491 million, or 5.5p per ordinary share (2022 - £364 million, or 3.5p per ordinary share). In addition, the company has announced that the directors have recommended a final dividend of £1.0 billion, or 11.5p per ordinary share (2022 - £1.0 billion, or 10.0p per ordinary share) subject to shareholders’ approval at the Annual General Meeting on 23 April 2024.
If approved, payment will be made on 29 April 2024 to shareholders on the register at the close of business on 15 March 2024. The ex-dividend date will be 14 March 2024.
Taxation of US Holders
The following discussion summarises certain US federal and UK tax consequences of the ownership and disposition of ordinary shares or ADSs representing ordinary shares by a beneficial owner that is a citizen or resident of the United States or that otherwise will be subject to US federal income tax on a net income basis in respect of the ordinary shares or ADSs (a “US Holder”). This summary assumes that a US Holder is holding ordinary shares or ADSs, as applicable, as capital assets. This summary does not address the tax consequences to a US Holder (i) that is resident in the UK for UK tax purposes, (ii) that carries on a trade, profession or vocation through a branch, agency or permanent establishment in the UK in connection with which their ordinary shares or ADSs are held, used or acquired, or (iii) generally, that is a corporation which alone or together with one or more associated companies, controls, directly or indirectly, 10% or more of the voting stock of the company, nor does this summary address all of the tax consequences that may be relevant to a US Holder in light of its particular circumstances, including alternative minimum tax and Medicare contribution tax consequences, as well as differing tax consequences that may apply to US Holders subject to special rules, such as certain financial institutions, dealers or traders in securities that use a mark-to-market method of tax accounting, persons holding ordinary shares or ADSs as part of a hedging transaction, straddle, wash sale, conversion transaction or integrated transaction or persons entering into a constructive sale with respect to such securities, persons whose functional currency for US federal income tax purposes is not the US dollar, persons required for US federal income tax purposes to conform the timing of income accruals to their financial statements under Section 451 of the Internal Revenue Code of 1986, as amended (the “Code”), entities classified as partnerships for US federal income tax purposes, tax-exempt entities or persons that own or are deemed to own 10% or more of the stock of the company by vote or value.
The statements and practices set forth below regarding US and UK tax laws, including the US/UK double taxation convention relating to income and capital gains which entered into force on 31 March 2003 (the “Treaty”) and the US/UK double taxation convention relating to estate and gift taxes (the “Estate Taxation Treaty”), are based on those laws and practices as in force and as applied in practice on the date of this report. This summary is not exhaustive of all possible tax considerations and holders are advised to satisfy themselves as to the overall tax consequences, including specifically the consequences under US federal, state, local and other laws, and possible changes in taxation law, of the acquisition, ownership and disposition of ordinary shares or ADSs by consulting their own tax advisers.
The following discussion assumes that the company was not a passive foreign investment company for the taxable year ended 31 December 2023 - see ‘Passive Foreign Investment Company (PFIC) considerations’ on page 199.
| |
NatWest Group – Annual Report on Form 20-F 2023 | 197 |
Shareholder information continued
Taxation of dividends
For the purposes of the Treaty, the Estate Taxation Treaty and the Code, US Holders of ADSs should be treated as owners of the ordinary shares underlying such ADSs.
The company is not required to withhold UK tax at source from dividend payments it makes or from any amount (including any amounts in respect of accrued dividends) distributed by the company. US Holders who are not resident in the UK and who do not carry on a trade, profession or vocation in the UK through a branch, agency or permanent establishment in connection with which their ordinary shares or ADSs are held, used or acquired will not be subject to UK tax in respect of any dividends received on the shares or ADSs.
Distributions by the company (other than certain pro-rata distributions of ordinary shares or rights to receive such shares) will constitute foreign source dividend income for US federal income tax purposes to the extent paid out of the current or accumulated earnings and profits of the company, as determined under US federal income tax principles. Because the company does not maintain calculations of its earnings and profits under US federal income tax principles, it is expected that distributions will be reported to US Holders as dividends. Payments will not be eligible for the dividends-received deduction generally allowed to corporate US holders.
Subject to applicable limitations that vary depending upon a US Holder’s particular circumstances, dividends paid to certain non-corporate US Holders may be taxable at the favourable rates applicable to long-term capital gain. Non-corporate US Holders should consult their tax advisers to determine whether they are subject to any special rules that limit their ability to be taxed at these favourable rates.
Dividends will be included in a US Holder’s income on the date of the US Holder’s (or in the case of ADSs, the depositary’s) receipt of the dividend. The amount of any dividend paid in pounds sterling to be included in income by a US Holder will be the US dollar amount calculated by reference to the relevant exchange rate in effect on the date of such receipt regardless of whether the payment is in fact converted into US dollars. If the dividend is converted into US dollars on the date of receipt, the US Holder generally should not be required to recognise foreign currency gain or loss in respect of the dividend income. If the amount of such dividend is converted into US dollars after the date of receipt, the US Holder may have foreign currency gain or loss.
Taxation of Capital Gains
A US Holder that is not resident in the UK will not normally be liable for UK tax on capital gains realised on the disposal of an ordinary share or ADS unless at the time of the disposal, in the case of a corporate US Holder, such US Holder carries on a trade in the UK through a permanent establishment or, in the case of any other US Holder, such US Holder carries on a trade, profession or vocation in the UK through a branch or agency and, in each case, such ordinary share ADS is or has been used, held or acquired by or for the purposes of such trade (or profession or vocation), or carried on through such permanent establishment, branch or agency. Special rules apply to individuals who are temporarily not resident in the UK.
A US Holder will, upon the sale or other disposition of an ordinary share or ADS, or upon the redemption of preference ADS, generally recognise capital gain or loss for US federal income tax purposes in an amount equal to the difference between the amount realised and the US Holder’s tax basis in such share or ADS. This capital gain or loss will be long-term capital gain or loss if the US Holder held the share or ADS so sold or disposed for more than one year. The deductibility of capital losses is subject to limitations.
A US Holder who is liable for both UK and US tax on a gain recognised on the disposal of an ordinary share or ADS should consult its tax adviser regarding the credibility or deductibility of such UK tax for US federal income purposes.
Estate and gift tax
Subject to the discussion of the Estate Tax Treaty in the following paragraph, ordinary shares or ADSs beneficially owned by an individual may be subject to UK inheritance tax (subject to exemptions and reliefs) on the death of the individual or in certain circumstances, if such shares or ADSs are the subject of a gift (including a transfer at less than market value) by such individual. Inheritance tax is not generally chargeable on gifts to individuals made more than seven years before the death of the donor.
An ordinary share or ADS beneficially owned by an individual, whose domicile is determined to be the United States for purposes of the Estate Tax Treaty and who is not a national of the UK, will not be subject to UK inheritance tax on the individual’s death or on a lifetime transfer of such share or ADS, except in certain cases where the share or ADS (i) is comprised in a settlement (unless, at the time of the settlement, the settlor was domiciled in the United States and was not a national of the UK); (ii) is part of the business property of a UK permanent establishment of an enterprise; or (iii) pertains to a UK fixed base of an individual used for the performance of independent personal services.
The Estate Tax Treaty generally provides a credit against US federal estate or gift tax liability for the amount of any tax paid in the UK in a case where the ordinary share or ADS is subject to both UK inheritance tax and US federal estate or gift tax.
| |
NatWest Group – Annual Report on Form 20-F 2023 | 198 |
Shareholder information continued
UK stamp duty and stamp duty reserve tax (SDRT)
The following is a summary of the UK stamp duty and SDRT consequences of transferring an ADS (otherwise than to the custodian on cancellation of the ADS) or of transferring an ordinary share. A transfer of an ADS executed and retained in the United States will not give rise to a liability to pay stamp duty and an agreement to transfer an ADS through the facilities of DTC will not give rise to SDRT (provided that DTC has not made an election under section 97A of the UK Finance Act 1986). Stamp duty or SDRT will normally be payable on or in respect of transfers of ordinary shares and accordingly any holder that acquires or intends to acquire ordinary shares is advised to consult its own tax adviser in relation to stamp duty and SDRT.
Any UK stamp duty or SDRT imposed upon transfers of ordinary shares will not be creditable for US federal income tax purposes. US Holders should consult their tax advisers regarding whether any such UK stamp duty or SDRT may be deductible or reduce the amount of gain (or increase the amount of loss) recognized upon a sale or other disposition of ordinary share.
Passive Foreign Investment Company (PFIC) considerations
In general, a foreign corporation will be a PFIC for any taxable year in which, after taking into account the income and assets of the corporation and certain subsidiaries pursuant to applicable ‘look-through rules’, either (i) at least 75% of its gross income is ‘passive income’ or (ii) at least 50% of the average value of its assets (generally determined on a quarterly basis) is attributable to assets that produce passive income or are held for the production of passive income. Although interest income is generally passive income, a special rule (in proposed Treasury regulations that taxpayers can rely on pending finalization) allows banks to treat their banking business income as non-passive. To qualify for this rule, a bank must satisfy certain requirements regarding its licensing and activities. The company does not believe that it was a PFIC for its 2023 taxable year. The company’s possible status as a PFIC is determined annually, however, and may be subject to change if the company fails to qualify under this special rule for any year in which a US Holder owned ordinary shares or ADSs. In addition, no assurance can be given that the proposed Treasury regulations will be finalized in their current form.
If the company is a PFIC for any taxable year during which a US Holder owns ordinary shares or ADSs, it generally will continue to be a PFIC with respect to that US Holder also for subsequent years, and the US Holder generally will be subject to adverse US federal income tax consequences (including an increased tax liability on dispositions of ordinary shares or ADSs or on the receipt of certain excess distributions and the treatment of any gain from the sale of ordinary shares or ADSs as ordinary income) and certain reporting obligations. US Holders should consult their tax advisers as to the potential application of the PFIC rules to the ownership and disposition of the company’s ordinary shares or ADSs.
Information reporting and backup withholding
Payments on, and proceeds from the sale or disposition of ordinary shares or ADSs that are made within the United States or through certain US-related financial intermediaries may be subject to information reporting and backup withholding unless (i) the US Holder is an exempt recipient (and establishes that status if required to do so) or (ii) in the case of backup withholding, the US Holder provides a correct taxpayer identification number and certifies that it is not subject to backup withholding. The amount of any backup withholding from a payment to a US Holder will be allowed as a credit against the US Holder’s US federal income tax liability and may entitle it to a refund, provided that the required information is timely furnished to the Internal Revenue Service.
Foreign financial assets reporting
Certain US Holders who are individuals (and certain entities controlled by individuals) may be required to report information relating to the company’s securities, of non-US. accounts through which such securities are held. US Holders are urged to consult their tax advisers regarding the application of these rules in their particular circumstances.
Exchange controls
The company has been advised that there are currently no UK laws, decrees or regulations which would prevent the import or export of capital, including the availability of cash or cash equivalents for use by the Group, or the remittance of dividends, interest or other payments to non-UK resident holders of the company’s securities.
There are no restrictions under the Articles of Association of the company or under UK law, as currently in effect, which limit the right of non-UK resident owners to hold or, when entitled to vote, freely to vote the company’s securities.
| |
NatWest Group – Annual Report on Form 20-F 2023 | 199 |
Shareholder information continued
Memorandum and Articles of Association
The company’s Memorandum and Articles of Association as in effect at the date of this Annual Report are registered with the Registrar of Companies of Scotland.
The following information is a summary of certain terms of the company’s Memorandum of Association (the “Memorandum”) and Articles of Association (the “Articles”) as in effect at the date of this Annual Report on Form 20-F and certain relevant provisions of the Companies Act 2006 (the “2006 Act”) where appropriate and as relevant to the holders of any class of share. In 2020, the Articles were updated primarily to bring clearer language into the Articles to better reflect modern best practice. The following summary description is qualified in its entirety by reference to the terms and provisions of the Memorandum and Articles (and, in the case of the summary description of the non-cumulative preference shares, by reference to the terms of issue of those shares determined by the Directors pursuant to the Articles prior to allotment). The Memorandum and Articles are registered with the Registrar of Companies of Scotland. Holders of any class of share are encouraged to read the full Memorandum and Articles, which have been filed as an exhibit to this Annual Report on Form 20-F. The company’s Memorandum and Articles of Association as in effect at the date of this Annual Report are registered with the Registrar of Companies of Scotland.
The following summary description is qualified in its entirety by reference to the terms and provisions of the Memorandum and Articles (and, in the case of the summary description of the non-cumulative preference shares, by reference to the terms of issue of those shares determined by the Directors pursuant to the Articles prior to allotment). The Memorandum and Articles are registered with the Registrar of Companies of Scotland. Holders of any class of share are encouraged to read the full Memorandum and Articles, which have been filed as an exhibit to this Annual Report on Form 20-F. The company’s Memorandum and Articles of Association as in effect at the date of this Annual Report are registered with the Registrar of Companies of Scotland.
The current Articles were adopted on 25 August 2022 to amend the nominal value and voting rights of the ordinary shares of the Company following the share consolidation which took place in August 2022.
Incorporation and registration
The company was incorporated and registered in Scotland under the Companies Act 1948 as a limited company on 25 March 1968 under the name National and Commercial Banking Group Limited. On 3 September 1979 the name was changed to The Royal Bank of Scotland Group Limited and on 10 March 1982, it changed its name to its present name and was registered under the Companies Acts 1948 to 1980 as a public company with limited liability. The company is registered under Company No. SC45551. The Royal Bank of Scotland Group plc was renamed NatWest Group plc on 22 July 2020.
Purpose and objects
The 2006 Act greatly reduces the constitutional significance of a company’s memorandum of association and provides that a memorandum of association will record only the names of the subscribers and the number of shares each subscriber has agreed to take in the company. The 2006 Act further states that, unless a company’s articles provide otherwise, a company’s objects are unrestricted and abolishes the need for companies to have objects clauses. The company removed its objects clause together with all other provisions of its memorandum of association which by virtue of the 2006 Act were treated as forming part of the company’s articles. The articles of association contain an express statement regarding the limited liability of the shareholders.
Directors
At each annual general meeting of the company, any Director appointed since the last annual general meeting and any Directors who were not appointed at one of the preceding two annual general meetings shall retire from office and may offer themselves for re-election by the members. Directors may be appointed by the company by ordinary resolution or by the Board. A director appointed by the Board holds office only until the next annual general meeting, whereupon he will be eligible for re-election.
Unless and until otherwise determined by ordinary resolution, the directors (other than alternate directors) shall be not more than twenty five. There is no stipulation in the Articles regarding a minimum number of directors; under the 2006 Act, and in the absence of express provision, the minimum number is two.
Directors’ interests
A director shall not vote at a meeting of the Board or a Committee of the Board on any resolution of the Board concerning a matter in which he has an interest (otherwise than by virtue of his interest in shares, debentures or other securities of, or otherwise in or through, the company) which (together with any interest of any person connected with him) is, to his knowledge, material unless his interests arises only because the resolution relates to one or more of the following matters:
(i) | the giving of any security or indemnity to him pursuant to the Articles or in respect of money lent, or obligations incurred, by him at the request of, or for the benefit of, the company or any of its subsidiary undertakings; |
| |
NatWest Group – Annual Report on Form 20-F 2023 | 200 |
Shareholder information continued
(ii) | the giving of any security or indemnity to a third party in respect of a debt or obligation of the company or any of its subsidiary undertakings for which he has assumed responsibility (in whole or in part) under a guarantee or indemnity or by the giving of security; |
(iii) | a proposal concerning an offer of shares, debentures or other securities of the company, or any of its subsidiary undertakings, for subscription or purchase, in which offer he is, or may be, entitled to participate as a holder of securities or in the underwriting or sub-underwriting of which he is to participate; |
(iv) | any proposal concerning any other body corporate in which he is interested, directly or indirectly, whether as an officer or shareholder or otherwise, provided that he is not the holder of shares representing one per cent or more of any class of the equity share capital of such body corporate; |
(v) | any proposal concerning the adoption, modification or operation of a pension fund or retirement, death or disability benefits scheme or employees’ share scheme which relates both to directors and employees of the company or a subsidiary of the company and does not provide any privilege or advantage in respect of any director which it does not accord to the employees to which the fund or scheme relates; |
(vi) | a contract or arrangement for the benefit of the employees of the company or any of its subsidiary undertakings which does not accord him any privilege or advantage not generally accorded to the employees to whom the contract or arrangement relates; and |
(vii) | a proposal concerning any insurance which the company proposes to purchase and/or maintain for the benefit of any directors or for persons who include directors of the company. |
Under the 2006 Act, a director must avoid a situation where he has, or can have, a direct or indirect interest that conflicts, or possibly may conflict, with the company’s interests.
The 2006 Act allows directors of public companies, where appropriate, to authorise conflicts and potential conflicts where the articles of association contain a provision to this effect. The 2006 Act also allows the articles of association to contain other provisions for dealing with directors’ conflicts of interest to avoid a breach of duty.
Clause 91 of the Articles, gives the directors authority to authorise any matter which would or might otherwise constitute or give rise to a breach of the duty of a director under the 2006 Act to avoid a situation in which he has, or can have, a direct or indirect interest that conflicts, or possibly may conflict with the company.
Authorisation of any matter pursuant to Clause 91 must be approved in accordance with normal board procedures by directors who have no interest in the matter being considered. In taking the decision, the directors must act in a way they consider, in good faith, will be most likely to promote the company’s success.
Any authorisation of a matter may be given on or subject to such conditions or limitations as the directors determine, whether at the time of authorisation or subsequently, including providing for the exclusion of the interested directors from the receipt of information or participation in discussion relating to the matter authorised by the directors and providing that interested directors in receipt of confidential information from a third party are not obliged to disclose such information to the company or use the information in relation to the company’s affairs. Any authorisation may be terminated by the directors at any time.
A director is not, except as otherwise agreed by him, accountable to the company for any benefit which he, or a person connected with him, derives from any matter authorised by the directors and any contract, transaction or arrangement relating to such matter is not liable to be avoided on the grounds of such benefit.
Directors’ power to allot securities
In line with market practice, the Articles provide that the authority to allot shares and the disapplication of pre-emption rights will not be set out in the Articles, but subject to resolutions passed at the company’s annual general meeting to obtain these authorities on an annual basis.
Borrowing powers
The directors may exercise all the powers of the company to borrow money and to mortgage or charge its undertaking, property and uncalled capital and to issue debentures and other securities, whether outright or as collateral security for any debt, guarantee, liability or obligation of the company, or of any third party.
Qualifying shareholding
Directors are not required to hold any shares of the company by way of qualification.
Classes of shares
The company has issued and outstanding the following two general classes of shares, namely ordinary shares, and cumulative preference shares, to which the provisions set forth below apply.
| |
NatWest Group – Annual Report on Form 20-F 2023 | 201 |
Shareholder information continued
Dividends
General
Subject to the provisions of the 2006 Act and Clause 122 of the Articles, the company may, by ordinary resolution, declare dividends on ordinary shares save that no dividend shall be payable except out of profits available for distribution, or in excess of the amount recommended by the Board or in contravention of the special rights attaching to any share. Any dividend which has remained unclaimed for 12 years from the date of declaration shall be forfeited and shall revert to the company.
Dividends may be paid by such method as the Directors, in their absolute discretion may decide, and may include direct debit, bank transfer and electronic funds transfer, cheque, warrant or other financial instrument. The company may cease sending dividend warrants and cheques by post or otherwise to a member if such instruments have been returned undelivered to, or left uncashed by, that member on at least two consecutive occasions, or, following one such occasion, reasonable enquiries have failed to establish any new address or account of the registered holder. The company may resume sending warrants and cheques if the holder requests such recommencement in writing.
Preference shares
Each cumulative preference share confers the right to a fixed cumulative preferential dividend payable half-yearly. The rate of such dividend and the date of payment thereof, together with the terms and conditions of the dividend, are as may be determined by the directors prior to allotment. Cumulative preference share dividends are paid in priority to any dividend on any other class of share.
Subject to existing class rights of shareholders, new preference shares can be issued with such rights and restrictions as the directors may determine.
Distribution of assets on liquidation
Cumulative preference shares
In the event of a return of capital on a winding-up or otherwise, the holders of cumulative preference shares are entitled to receive out of the surplus assets of the company available for distribution amongst the members (i) in priority to the holders of the non-cumulative preference shares and any other shares ranking pari passu therewith, the arrears of any fixed dividends including the amount of any dividend due for a payment after the date of commencement of any winding-up or liquidation but which is payable in respect of a half-year period ending on or before such date and (ii) pari passu with the holders of the non-cumulative preference shares and any other shares ranking pari passu therewith, the amount paid up or credited as paid up on such shares together with any premium.
General
On a winding-up of the company, the liquidator may, with the authority of any extraordinary resolution and any other sanction required by the Insolvency Act 1986 and subject to the rights attaching to any class of shares after payment of all liabilities, including the payment to holders of preference shares, divide amongst the members in specie or kind the whole or any part of the assets of the company or vest the whole or any part of the assets in trustees upon such trusts for the benefit of the members and may determine the scope and terms of those trusts. No member shall be compelled to accept any assets on which there is a liability.
Voting Rights
General
Subject to any rights or restrictions as to voting attaching to any shares or class of shares, on a show of hands every member who is present in person or by proxy at a general meeting shall have one vote (except that a proxy who is appointed by more than one member has one vote for and one vote against if the proxy has been instructed by one or more members to vote for the resolution and by one or more members to vote against the resolution) and on a poll every holder of ordinary shares present in person or by proxy and entitled to vote, shall have four votes for every share held, and holders of cumulative preference shares shall have one vote for each 25p nominal amount held. No member shall, unless the directors otherwise determine, be entitled to vote at a general meeting or at a separate meeting of the holders of shares in the capital of the company, either in person or by proxy, in respect of any share held by him unless all monies presently payable by him in respect of that share have been paid. There is no obligation on the company to check and ensure that a proxy is voting at a general meeting in accordance with the voting directions provided by the appointing member. The chairman of a general meeting does not have a casting vote in the event of an equality of votes, as this is not permitted under the 2006 Act. The quorum required for a meeting of members is not less than five members present in person and entitled to vote. If a meeting is adjourned because of the lack of a quorum, the members present in person or by proxy and entitled to vote will constitute a quorum at the adjourned meeting.
Meetings are convened upon written notice of not less than 21 days in respect of annual general meetings of members and not less than 14 days in respect of other meetings of members subject to certain conditions. An adjourned meeting may be called at shorter notice than applied to the original meeting, but where a meeting is adjourned for lack of quorum only if the adjourned meeting is held at least ten days after the original meeting and does not include any new business.
| |
NatWest Group – Annual Report on Form 20-F 2023 | 202 |
Shareholder information continued
Cumulative preference shares
At a general meeting of the company, every holder of a cumulative preference share who is present in person or by proxy shall be entitled to one vote on a show of hands and, on a poll, every person who is present in person or by proxy shall have one vote for each 25 pence in nominal amount of shares held. No member shall be entitled to vote any share in person or by proxy unless all moneys owed in respect of that share have been paid.
Redemption
Except as set forth in the following paragraph, unless the directors determine, prior to allotment of any particular series of non-cumulative preference shares, that such series shall be non-redeemable, the preference shares will be redeemable at the option of the company on any date which (subject to certain exceptions described in the terms of such shares) falls no earlier than such date (if any) as may be fixed by the directors, prior to allotment of such shares. On redemption, there shall be paid on each non-cumulative preference share the aggregate of its nominal amount together with any premium paid on issue, where applicable a redemption premium and accruals of dividend.
If the company wishes to issue redeemable shares, the Directors are authorised to determine the terms and manner of redemption.
Purchase
General
Under the 2006 Act a company requires shareholder authority to purchase its own shares, consolidate and sub-divide its shares and reduce its share capital.
Whenever non-cumulative preference shares are issued in the future the Articles have no restriction on the maximum purchase price payable by the company unless such restriction is expressly applied by the directors in relation to an issuance of non-cumulative preference shares.
Changes in share capital and variation of rights
Subject to the provisions of the 2006 Act and without prejudice to any rights attached to any existing shares or class of shares, any share may be issued with such rights or restrictions as the company may by ordinary resolution determine or, subject to and in default of such determination, as the Board shall determine. Subject to the provisions of the 2006 Act, the company may issue shares which are, or at the option of the company or the holder are liable, to be redeemed. Subject to the provisions of the 2006 Act and the Articles, unissued shares are at the disposal of the Board.
The company may by ordinary resolution: increase its share capital; consolidate and divide all or any of its share capital into shares of larger amount than its existing shares; subject to the provisions of the 2006 Act, subdivide its shares, or any of them, into shares of smaller amount than is fixed by the Memorandum; or cancel any shares which have not been taken or agreed to be taken by any person and diminish the amount of its share capital by the amount of the shares so cancelled.
Subject to the provisions of the 2006 Act, if at any time the capital of the company is divided into different classes of shares, the rights attached to any class of shares may (unless further conditions are provided by the terms of issue of the shares of that class) be varied or abrogated, whether or not the company is being wound up, either with the consent in writing of the holders of three-quarters in-nominal value of the issued shares of the class or with the sanction of an extraordinary resolution passed at a separate general meeting of holders of the shares of the class (but not otherwise). To any such separate general meeting the provision of the Articles relating to general meeting s will apply, save that:
(i) | if at any adjourned meeting of such holders a quorum as defined above is not present, two people who hold shares of the class, or their proxies, are a quorum; and |
(ii) | any such holder present in person or by proxy may demand a poll. |
The rights attaching to any class of shares having preferential rights are not, unless otherwise expressly provided by the terms of issue thereof, deemed to be varied by the creation or issue of further shares ranking, as regards participation in the profits or assets of the company, pari passu therewith, but in no respect in priority thereto.
Disclosure of interests in shares
The 2006 Act gives the company the power to require persons who it believes to be, or have been within the previous three years, interested in its shares, to disclose prescribed particulars of those interests. Failure to supply the information or supplying a statement which is materially false may lead to the Board imposing restrictions upon the relevant shares. The restrictions available are the suspension of voting or other rights conferred by membership in relation to meetings of the company in respect of the relevant shares and, additionally, in the case of a shareholding representing at least 0.25 per cent of the class of shares concerned, the withholding of payment of dividends on, and the restriction of transfers of, the relevant shares.
| |
NatWest Group – Annual Report on Form 20-F 2023 | 203 |
Shareholder information continued
Limitations on rights to own shares
There are no limitations imposed by UK law or the Memorandum and Articles on the right of non-residents or foreign persons to hold or vote the company’s shares other than the limitations that would generally apply to all of the company’s shareholders.
Members resident abroad
Members with registered addresses outside the United Kingdom are not entitled to receive notices from the company unless they have given the company an address within the United Kingdom at which such notices may be served.
Sending notices and other documents to shareholders
The company may communicate with members by electronic and/or website communications. A member whose registered address is not within the United Kingdom shall not be entitled to receive any notice from the Company unless he gives the Company a postal address within the United Kingdom at which notices may be given to him.
Documents on display
Documents concerning the company may be inspected at 36 St Andrew Square, Edinburgh, EH2 2YB.
Executive directors’ service contracts and copies of directors’ indemnities granted by the company in terms of section 236 of the Companies Act 2006 may be inspected at the company’s office at Gogarburn, Edinburgh, EH12 1HQ (telephone +44 (0)131 556 8555).
We are subject to the informational requirements of the U.S. Securities Exchange Act of 1934, as amended (the “Exchange Act”), and in accordance therewith, we file reports and other information with the SEC. The SEC’s website, at http://www.sec.gov, and our website, at http://www.natwestgroup.com, contain reports and other information in electronic form that we have filed. Except for SEC filings incorporated by reference in this prospectus supplement and the accompanying prospectus, none of the information on or that can be access through our website is part of this prospectus supplement or the accompanying prospectus. You may also request a copy of any filings referred to below (other than exhibits not specifically incorporated by reference) at no cost, by contacting us at NatWest Group plc, Gogarburn, P.O. Box 1000, Edinburgh EH12 1HQ, Scotland. Telephone +44 (0) 131 556 8555.
Incorporation and registration
The company was incorporated and registered in Scotland under the Companies Act 1948 as a limited company on 25 March 1968 under the name National and Commercial Banking Group Limited, and changed its name to The Royal Bank of Scotland Group Limited on 3 September 1979. On 10 March 1982 it was re-registered under the Companies Acts 1948 to 1980 as a public company with limited liability. The company is registered under Company No. SC45551. The Royal Bank of Scotland Group plc was renamed NatWest Group plc on 22 July 2020.
Important addresses
Shareholder enquiries Registrar
Computershare Investor Services PLC
The Pavilions
Bridgwater Road Bristol BS99 6ZZ
Telephone: +44 (0)370 702 0135
Facsimile: +44 (0)370 703 6009
Website: www-uk.computershare.com/investor/contactus
ADR Depositary Bank
BNY Mellon Shareowner Services
PO Box 505000
Louisville, KY 40233-5000
Direct Mailing for overnight packages:
BNY Mellon Shareowner Services
462 South 4th Street
| |
NatWest Group – Annual Report on Form 20-F 2023 | 204 |
Shareholder information continued
Suite 1600
Louisville KY 40202
Telephone: 1-888-269-2377 (US callers – toll free)
Telephone: +1 201 680 6825 (International)
Email: shrrelations@cpushareownerservices.com
Website: www.mybnymdr.com
Corporate Governance
NatWest Group plc
PO Box 1000
Gogarburn Edinburgh EH12 1HQ
Investor Relations
250 Bishopsgate London EC2M 4AA
Email: investor.relations@natwest.com
Registered office
36 St Andrew Square
Edinburgh EH2 2YB
Registered in Scotland No. SC45551
Website
natwestgroup.com
Principal offices
NatWest Group plc
PO Box 1000, Gogarburn, Edinburgh EH12 1HQ
NatWest Markets Plc
250 Bishopsgate, London, EC2M 4AA, England
National Westminster Bank Plc
250 Bishopsgate, London, EC2M 4AA, England
The Royal Bank of Scotland plc
PO Box 1000, Gogarburn
Edinburgh, EH12 1HQ
Coutts & Company
440 Strand, London WC2R 0QS, England
| |
NatWest Group – Annual Report on Form 20-F 2023 | 205 |
Shareholder information continued
NatWest Markets Plc
250 Bishopsgate, London
EC2M 4AA, England
NatWest Markets N.V.
Claude Debussylaan, 94
Amsterdam, 1082 MD
The Royal Bank of Scotland International Limited
Royal Bank House, 71 Bath Street
St Helier, JE4 8PJ
| |
NatWest Group – Annual Report on Form 20-F 2023 | 206 |
Exhibit Index
1.1 | |
2.1 | |
2.2 | |
2.3 | NatWest Group plc is not party to any single instrument relating to long-term debt pursuant to which a total amount of securities exceeding 10% of the Group’s total assets (on a consolidated basis) is authorized to be issued. NatWest Group plc hereby agrees to furnish to the Securities and Exchange Commission (the “Commission”), upon its request, a copy of any instrument defining the rights of holders of its long-term debt or the rights of holders of the long-term debt of any of its subsidiaries for which consolidated or unconsolidated financial statements are required to be filed with the Commission |
2.4 | Description of Securities Registered under Section 12 of the Exchange Act |
4.1 | Service agreement for Paul Thwaite, Group Chief Executive, dated 15 August 2023 |
4.2 | |
4.3 | |
4.4 | |
4.5 | |
4.6 | |
4.7 | |
4.8 | |
4.9 | |
4.10 | |
4.11 | Letter of Appointment for Stuart Lewis, Non-Executive Director, dated 13 December 2022 |
4.12 | |
4.13 | |
4.14 | |
4.15 | |
4.16(2) | |
4.17(2) | |
4.18(1) | |
4.19(1) | |
4.20(1) |
4.21 | |
4.22 | |
4.23 | |
4.24 | |
4.25 | |
4.26 (2) | |
4.27 | |
4.28 | |
8.1 | |
12.1 | |
12.2 | |
13.1 | |
15.1 | Consent of independent registered public accounting firm (Ernst & Young LLP) |
15.2 | |
101 INS | XBRL Instance Document |
101.SCH | XBRL Taxonomy Extension Scheme |
101.CAL | XBRL Taxonomy Extension Scheme Calculation Linkbase |
101.DEF | XBRL Taxonomy Extension Scheme Definition Linkbase |
101. LAB | XBRL Taxonomy Extension Scheme Label Linkbase |
101.PRE | XBRL Taxonomy Extension Scheme Presentation Linkbase |
Note:
| (1) | Confidential treatment has been granted. |
| (2) | Portions of this exhibit have been omitted as the Registrant has determined that (i) the omitted information is not material and (ii) the omitted information is of the type that the Registrant customarily and actually treats as private or confidential. |
SIGNATURE
The registrant hereby certifies that it meets all of the requirements for filing on Form 20-F and that it has duly caused and authorized the undersigned to sign this annual report on its behalf.
NatWest Group plc
Registrant
/s/ Katie Murray
Katie Murray
Group Chief Financial Officer
23 February 2024