UNITED STATES
SECURITIES AND EXCHANGE COMMISSION
Washington, D.C. 20549
FORM N-CSR
CERTIFIED SHAREHOLDER REPORT OF REGISTERED MANAGEMENT INVESTMENT COMPANIES
Investment Company Act file number: 811-05739
Name of Fund: BlackRock MuniEnhanced Fund, Inc. (MEN)
Fund Address: 100 Bellevue Parkway, Wilmington, DE 19809
Name and address of agent for service: John M. Perlowski, Chief Executive Officer, BlackRock MuniEnhanced Fund, Inc., 55 East 52nd Street, New York, NY 10055
Registrant’s telephone number, including area code: (800) 882-0052, Option 4
Date of fiscal year end: 04/30/2019
Date of reporting period: 10/31/2018
Item 1 – Report to Stockholders
OCTOBER 31, 2018
| | |
SEMI-ANNUAL REPORT (UNAUDITED) | |  |
BlackRock MuniAssets Fund, Inc. (MUA)
BlackRock MuniEnhanced Fund, Inc. (MEN)
BlackRock MuniHoldings Fund, Inc. (MHD)
BlackRock MuniHoldings Fund II, Inc. (MUH)
BlackRock MuniHoldings Quality Fund, Inc. (MUS)
BlackRock Muni Intermediate Duration Fund, Inc. (MUI)
BlackRock MuniVest Fund II, Inc. (MVT)
|
| Not FDIC Insured • May Lose Value • No Bank Guarantee |
The Markets in Review
Dear Shareholder,
In the 12 months ended October 31, 2018, ongoing strength in corporate profits drove the equity market higher, while rising interest rates constrained bond returns. Though the market’s appetite for risk remained healthy, risk-taking was tempered somewhat, as shorter-term, higher-quality securities led the bond market, and U.S. equities outperformed most international stock markets.
In international markets, the rising value of the U.S. dollar limited U.S. investors’ returns for the reporting period. When the U.S. dollar appreciates relative to foreign currencies, the value of international investments declines in U.S. dollar terms. Volatility rose in emerging market stocks, which are relatively sensitive to changes in the U.S. dollar. U.S.-China trade relations and debt concerns adversely affected the Chinese stock market, while Turkey and Argentina became embroiled in currency crises, largely due to hyperinflation in both countries. An economic slowdown in Europe led to negative performance for European equities.
In fixed income markets, short-term U.S. Treasury interest rates rose the fastest, while longer-term rates slightly increased. This led to a negative return for long-term U.S. Treasuries and a substantial flattening of the yield curve. Many investors are concerned with the flattening yield curve as a harbinger of recession. However, given the extraordinary monetary measures in the last decade, we believe a more accurate barometer for the economy is the returns along the risk spectrums in stock and bond markets. Although the fundamentals in credit markets remained relatively solid, investment-grade bonds declined slightly, and high-yield bonds posted modest returns.
In response to rising growth and inflation, the U.S. Federal Reserve (the “Fed”) increased short-term interest rates four times during the reporting period. The Fed also continued to reduce its balance sheet during the reporting period, gradually reversing the unprecedented stimulus measures it enacted after the financial crisis. We believe the Fed is likely to continue to raise interest rates in the coming year. By our estimation, the Fed’s neutral interest rate, or the theoretical rate that is neither stimulative nor restrictive to the economy, is approximately 3.0%. With that perspective, the Fed’s current policy is still mildly stimulative to the U.S. economy, which leaves room for further Fed rate hikes to arrive at monetary policy that is a neutral factor for economic growth.
The U.S. economy continued to gain momentum despite the Fed’s modest reduction of economic stimulus; unemployment declined to 3.7%, the lowest rate of unemployment in almost 50 years. The number of job openings reached a record high of more than 7 million, which exceeded the total number of unemployed workers. Strong economic performance has justified the Fed’s somewhat faster pace of rate hikes, as several inflation measures and investors’ expectations for inflation have already surpassed the Fed’s target of 2.0% per year.
While markets have recently focused on the risk of rising long-term interest rates, we continue to believe the primary risk to economic expansion is trade protectionism that could lead to slower global trade and unintended consequences for the globalized supply chain. So far, U.S. tariffs have only had a modest negative impact on economic growth, but the fear of an escalating trade war has stifled market optimism somewhat, leading to higher volatility in risk assets. The outcome of trade negotiations between the United States and China is likely to influence the global growth trajectory and set the tone for free trade in many other nations. Easing of tensions could lead to greater upside for markets, while additional tariffs could adversely affect investor sentiment.
In this environment, investors need to think globally, extend their scope across a broad array of asset classes, and be nimble as market conditions change. We encourage you to talk with your financial advisor and visit blackrock.com for further insight about investing in today’s markets.
Sincerely,

Rob Kapito
President, BlackRock Advisors, LLC

Rob Kapito
President, BlackRock Advisors, LLC
| | | | |
| Total Returns as of October 31, 2018 |
| | | 6-month | | 12-month |
U.S. large cap equities
(S&P 500® Index) | | 3.40% | | 7.35% |
U.S. small cap equities
(Russell 2000® Index) | | (1.37) | | 1.85 |
International equities
(MSCI Europe, Australasia, Far East Index) | | (9.92) | | (6.85) |
Emerging market equities
(MSCI Emerging Markets Index) | | (16.53) | | (12.52) |
3-month Treasury bills
(ICE BofAML 3-Month U.S. Treasury Bill Index) | | 0.99 | | 1.68 |
U.S. Treasury securities
(ICE BofAML 10-Year U.S. Treasury Index) | | (0.60) | | (4.37) |
U.S. investment grade bonds
(Bloomberg Barclays U.S. Aggregate Bond Index) | | (0.19) | | (2.05) |
Tax-exempt municipal bonds
(S&P Municipal Bond Index) | | 0.45 | | (0.31) |
U.S. high yield bonds
(Bloomberg Barclays U.S. Corporate High Yield 2% Issuer Capped Index) | | 1.14 | | 0.98 |
| Past performance is no guarantee of future results. Index performance is shown for illustrative purposes only. You cannot invest directly in an index. |
| | |
| 2 | | THIS PAGEISNOT PARTOF YOUR FUND REPORT |
Table of Contents
Municipal Market Overview For the Reporting Period Ended October 31, 2018
Municipal Market Conditions
Municipal bonds experienced negative total returns during the period alongside fixed income broadly, as interest rates moved higher on the back of continued Fed policy normalization, fiscal stimulus, strong economic growth, and increased U.S. Treasury issuance. At the same time, demand for the asset class remained firm. Investors favored the tax-exempt income, diversification, quality, and value of municipal bonds, particularly given that tax reform ultimately lowered the top individual tax rate just 2.6% while eliminating deductions. During the 12 months ended October 31, 2018, municipal bond funds experienced net inflows of approximately $12.8 billion (based on data from the Investment Company Institute).
| | |
For the same 12-month period, total new issuance was moderate from a historical perspective at $366 billion (slightly above the $363 billion issued in the prior 12-month period), but displayed significant month-to-month volatility. Notably, issuance in December posted the highest monthly total on record at $56 billion, as issuers rushed deals to market ahead of the expected elimination of the tax-exemption for advanced refunding bonds and possibly private activity bonds (PABs). Ultimately, the final version of the Tax Cuts and Jobs Act left PABs unchanged, though the elimination of advanced refundings has suppressed supply in 2018, providing a powerful technical tailwind. | | S&P Municipal Bond Index
Total Returns as of October 31, 2018 6 months: 0.45% 12 months: (0.31)% |
| | |
A Closer Look at Yields
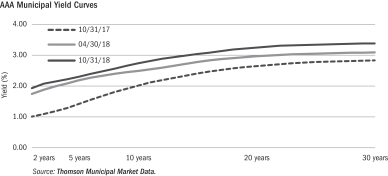
| From October 31, 2017 to October 31, 2018, yields on AAA-rated 30-year municipal bonds increased by 55 basis points (“bps”) from 2.83% to 3.38%, while 10-year rates increased by 72 bps from 2.01% to 2.73% and 5-year rates increased by 88 bps from 1.42% to 2.30% (as measured by Thomson Municipal Market Data). The municipal yield curve bear flattened over the 12-month period with the spread between 2- and 30-year maturities flattening by 43 bps, however remained a significant 78 bps steeper than the corresponding U.S. Treasury curve. |
During the same time period, on a relative basis, tax-exempt municipal bonds strongly outperformed U.S. Treasuries with the greatest outperformance experienced in the front and intermediate portions of the yield curve. The relative positive performance of municipal bonds was driven largely by a supply/demand imbalance within the municipal market as investors sought income, incremental yield, and tax shelter in an environment where opportunities became increasingly scarce. The asset class is known for its lower relative volatility and preservation of principal with an emphasis on income as tax rates rise.
Financial Conditions of Municipal Issuers
The majority of municipal credits remain strong, despite well-publicized problems among a few issuers. Four of the five states with the largest amount of debt outstanding — California, New York, Texas and Florida — continue to exhibit improved credit fundamentals. However, several states with the largest unfunded pension liabilities are faced with elevated borrowing costs and difficult budgetary decisions. Across the country on the local level, property values support credit stability. Standard & Poor’s recent decision to remove its “negative” outlook on New Mexico underscores the improvement in state finances as it was the only remaining state with the designation. Revenue bonds continue to drive performance as investors continue to seek higher yield bonds in the tobacco sector. BlackRock maintains the view that municipal bond defaults will remain minimal and in the periphery while the overall market is fundamentally sound. We continue to advocate careful credit research and believe that a thoughtful approach to structure and security selection remains imperative amid uncertainty in a modestly improving economic environment.
The opinions expressed are those of BlackRock as of October 31, 2018, and are subject to change at any time due to changes in market or economic conditions. The comments should not be construed as a recommendation of any individual holdings or market sectors. Investing involves risk including loss of principal. Bond values fluctuate in price so the value of your investment can go down depending on market conditions. Fixed income risks include interest-rate and credit risk. Typically, when interest rates rise, there is a corresponding decline in bond values. Credit risk refers to the possibility that the bond issuer will not be able to make principal and interest payments. There may be less information on the financial condition of municipal issuers than for public corporations. The market for municipal bonds may be less liquid than for taxable bonds. Some investors may be subject to Alternative Minimum Tax (“AMT”). Capital gains distributions, if any, are taxable.
The Standard & Poor’s Municipal Bond Index, a broad, market value-weighted index, seeks to measure the performance of the U.S. municipal bond market. All bonds in the index are exempt from U.S. federal income taxes or subject to the AMT. Past performance is no guarantee of future results. Index performance is shown for illustrative purposes only. It is not possible to invest directly in an index.
| | |
| 4 | | 2018 BLACKROCK SEMI-ANNUAL REPORTTO SHAREHOLDERS |
The Benefits and Risks of Leveraging
The Funds may utilize leverage to seek to enhance the distribution rate on, and net asset value (“NAV”) of, their common shares (“Common Shares”). However, there is no guarantee that these objectives can be achieved in all interest rate environments.
In general, the concept of leveraging is based on the premise that the financing cost of leverage, which is based on short-term interest rates, is normally lower than the income earned by a Fund on its longer-term portfolio investments purchased with the proceeds from leverage. To the extent that the total assets of the Funds (including the assets obtained from leverage) are invested in higher-yielding portfolio investments, the Funds’ shareholders benefit from the incremental net income. The interest earned on securities purchased with the proceeds from leverage is paid to shareholders in the form of dividends, and the value of these portfolio holdings is reflected in the per share NAV.
To illustrate these concepts, assume a Fund’s Common Shares capitalization is $100 million and it utilizes leverage for an additional $30 million, creating a total value of $130 million available for investment in longer-term income securities. If prevailing short-term interest rates are 3% and longer-term interest rates are 6%, the yield curve has a strongly positive slope. In this case, a Fund’s financing costs on the $30 million of proceeds obtained from leverage are based on the lower short-term interest rates. At the same time, the securities purchased by a Fund with the proceeds from leverage earn income based on longer-term interest rates. In this case, a Fund’s financing cost of leverage is significantly lower than the income earned on a Fund’s longer-term investments acquired from such leverage proceeds, and therefore the holders of Common Shares (“Common Shareholders”) are the beneficiaries of the incremental net income.
However, in order to benefit Common Shareholders, the return on assets purchased with leverage proceeds must exceed the ongoing costs associated with the leverage. If interest and other costs of leverage exceed the Funds’ return on assets purchased with leverage proceeds, income to shareholders is lower than if the Funds had not used leverage. Furthermore, the value of the Funds’ portfolio investments generally varies inversely with the direction of long-term interest rates, although other factors can influence the value of portfolio investments. In contrast, the value of the Funds’ obligations under their respective leverage arrangements generally does not fluctuate in relation to interest rates. As a result, changes in interest rates can influence the Funds’ NAVs positively or negatively. Changes in the future direction of interest rates are very difficult to predict accurately, and there is no assurance that the Funds’ intended leveraging strategy will be successful.
The use of leverage also generally causes greater changes in each Fund’s NAV, market price and dividend rates than comparable portfolios without leverage. In a declining market, leverage is likely to cause a greater decline in the NAV and market price of a Fund’s Common Shares than if the Fund were not leveraged. In addition, each Fund may be required to sell portfolio securities at inopportune times or at distressed values in order to comply with regulatory requirements applicable to the use of leverage or as required by the terms of leverage instruments, which may cause the Fund to incur losses. The use of leverage may limit a Fund’s ability to invest in certain types of securities or use certain types of hedging strategies. Each Fund incurs expenses in connection with the use of leverage, all of which are borne by Common Shareholders and may reduce income to the Common Shares. Moreover, to the extent the calculation of the Funds’ investment advisory fees includes assets purchased with the proceeds of leverage, the investment advisory fees payable to the Funds’ investment adviser will be higher than if the Funds did not use leverage.
To obtain leverage, each Fund has issued Variable Rate Demand Preferred Shares (“VRDP Shares”) or Variable Rate Muni Term Preferred Shares (“VMTP Shares”) (collectively, “Preferred Shares”) and/or leveraged its assets through the use of tender option bond trusts (“TOB Trusts”) as described in the Notes to Financial Statements.
Under the Investment Company Act of 1940, as amended (the “1940 Act”), each Fund is permitted to issue debt up to 33 1/3% of its total managed assets or equity securities (e.g., Preferred Shares) up to 50% of its total managed assets. A Fund may voluntarily elect to limit its leverage to less than the maximum amount permitted under the 1940 Act. In addition, a Fund may also be subject to certain asset coverage, leverage or portfolio composition requirements imposed by the Preferred Shares’ governing instruments or by agencies rating the Preferred Shares, which may be more stringent than those imposed by the 1940 Act.
If a Fund segregates or designates on its books and records cash or liquid assets having a value not less than the value of a Fund’s obligations under the TOB Trust (including accrued interest), then the TOB Trust is not considered a senior security and is not subject to the foregoing limitations and requirements imposed by the 1940 Act.
Derivative Financial Instruments
The Funds may invest in various derivative financial instruments. These instruments are used to obtain exposure to a security, commodity, index, market, and/or other assets without owning or taking physical custody of securities, commodities and/or other referenced assets or to manage market, equity, credit, interest rate, foreign currency exchange rate, commodity and/or other risks. Derivative financial instruments may give rise to a form of economic leverage and involve risks, including the imperfect correlation between the value of a derivative financial instrument and the underlying asset, possible default of the counterparty to the transaction or illiquidity of the instrument. The Funds’ successful use of a derivative financial instrument depends on the investment adviser’s ability to predict pertinent market movements accurately, which cannot be assured. The use of these instruments may result in losses greater than if they had not been used, may limit the amount of appreciation a Fund can realize on an investment and/or may result in lower distributions paid to shareholders. The Funds’ investments in these instruments, if any, are discussed in detail in the Notes to Financial Statements.
| | | | |
| THE BENEFITSAND RISKSOF LEVERAGING / DERIVATIVE FINANCIAL INSTRUMENTS | | | 5 | |
| | |
| Fund Summary as of October 31, 2018 | | BlackRock MuniAssets Fund, Inc. |
Investment Objective
BlackRock MuniAssets Fund, Inc.’s (MUA) (the “Fund”) investment objective is to provide high current income exempt from U.S. federal income taxes by investing primarily in a portfolio of medium- to lower-grade or unrated municipal obligations, the interest on which, in the opinion of bond counsel to the issuer, is exempt from U.S. federal income taxes. The Fund seeks to achieve its investment objective by investing, under normal market conditions, at least 80% of its assets in municipal bonds exempt from U.S. federal income taxes (except that the interest may be subject to the U.S. federal alternative minimum tax). The Fund invests at least 65% of its assets in municipal bonds that are rated in the medium to lower rating categories by nationally recognized rating services (for example, Baa or lower by Moody’s Investors Service, Inc. (“Moody’s”) or BBB or lower by Standard & Poor’s Corporation (“S&P”), or securities that are unrated but are deemed by the investment adviser to be of comparable quality at the time of investment. The Fund may invest directly in such securities or synthetically through the use of derivatives.
No assurance can be given that the Fund’s investment objective will be achieved.
Fund Information
| | |
Symbol on New York Stock Exchange (“NYSE”) | | MUA |
Initial Offering Date | | June 25, 1993 |
Yield on Closing Market Price as of October 31, 2018 ($12.65)(a) | | 5.17% |
Tax Equivalent Yield(b) | | 8.73% |
Current Monthly Distribution per Common Share(c) | | $0.0545 |
Current Annualized Distribution per Common Share(c) | | $0.6540 |
Economic Leverage as of October 31, 2018(d) | | 13% |
| | (a) | Yield on closing market price is calculated by dividing the current annualized distribution per share by the closing market price. Past performance does not guarantee future results. | |
| | (b) | Tax equivalent yield assumes the maximum marginal U.S. federal tax rate of 40.8%, which includes the 3.8% Medicare tax. Actual tax rates will vary based on income, exemptions and deductions. Lower taxes will result in lower tax equivalent yields. | |
| | (c) | The distribution rate is not constant and is subject to change. | |
| | (d) | Represents TOB Trusts as a percentage of total managed assets, which is the total assets of the Fund, including any assets attributable to TOB Trusts, minus the sum of its accrued liabilities. For a discussion of leveraging techniques utilized by the Fund, please see The Benefits and Risks of Leveraging on page 5. | |
Performance
Returns for the six months ended October 31, 2018 were as follows:
| | | | | | | | |
| | | Returns Based On | |
| | | Market Price | | | NAV | |
MUA(a)(b) | | | (1.84 | )% | | | 1.19 | % |
Lipper High Yield Municipal Debt Funds(c) | | | (1.78 | ) | | | 0.27 | |
| | (a) | All returns reflect reinvestment of dividends and/or distributions at actual reinvestment prices. | |
| | (b) | The Fund’s discount to NAV widened during the period, which accounts for the difference between performance based on market price and performance based on NAV. | |
| | (c) | Average return. Returns reflect reinvestment of dividends and/or distributions at NAV on the ex-dividend as calculated by Lipper. | |
Performance results may include adjustments made for financial reporting purposes in accordance with U.S. generally accepted accounting principles.
Past performance is not indicative of future results.
The following discussion relates to the Fund’s absolute performance based on NAV:
Municipal bonds experienced lackluster returns in the past six months, with price weakness outweighing the contribution from income. After trading sideways through the summer months, tax-exempt issues fell sharply in September and October. During this time, investors reacted to commentary from Fed Chairman Jerome Powell indicating that future monetary policy tightening could be more aggressive than the markets had anticipated. Supply and demand factors also had an adverse effect on returns in the latter part of the period, with mutual fund outflows occurring at the same time that a wave of new issuance was hitting the market.
The Fund’s yield curve positioning made the largest contribution to performance. Positions in high-quality, short-dated, pre-refunded bonds performed relatively well and held their value better than long-dated holdings. The latter experienced larger price declines amid a steepening yield curve in which rates on intermediate- and long-term issues rose at a faster pace than those of short-term securities. (Prices and yields move in opposite directions.)
Positions in lower-quality issues continued to benefit results, as investor risk appetites remained robust for much of the reporting period. Holdings in non- investment-grade and unrated categories outperformed due to the combination of their higher income and stronger price performance. However, these bonds lagged late in the period once investor sentiment began to deteriorate.
At the sector level, positions in tobacco, health care and transportation issues all contributed to results. Investments in project finance and development-district bonds added value, as well.
The Fund sought to manage interest rate risk using U.S. Treasury futures. Given that Treasury yields rose, as prices fell, this aspect of the Fund’s positioning had a positive effect on returns by offsetting the weakness in prices.
The views expressed reflect the opinions of BlackRock as of the date of this report and are subject to change based on changes in market, economic or other conditions. These views are not intended to be a forecast of future events and are no guarantee of future results.
| | |
| 6 | | 2018 BLACKROCK SEMI-ANNUAL REPORTTO SHAREHOLDERS |
| | |
| Fund Summary as of October 31, 2018 (continued) | | BlackRock MuniAssets Fund, Inc. |
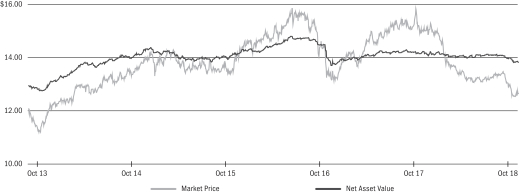
Market Price and Net Asset Value Per Share Summary
| | | | | | | | | | | | | | | | | | | | |
| | | 10/31/18 | | | 04/30/18 | | | Change | | | High | | | Low | |
Market Price | | $ | 12.65 | | | $ | 13.21 | | | | (4.24 | )% | | $ | 13.48 | | | $ | 12.51 | |
Net Asset Value | | | 13.83 | | | | 14.01 | | | | (1.28 | ) | | | 14.13 | | | | 13.83 | |
Market Price and Net Asset Value History For the Past Five Years
Overview of the Fund’s Total Investments*
SECTOR ALLOCATION
| | | | | | | | |
| Sector | | 10/31/18 | | | 04/30/18 | |
Health | | | 20 | % | | | 22 | % |
County/City/Special District/School District | | | 18 | | | | 17 | |
Tobacco | | | 14 | | | | 16 | |
Transportation | | | 12 | | | | 15 | |
Education | | | 10 | | | | 10 | |
Utilities | | | 10 | | | | 9 | |
Corporate | | | 7 | | | | 6 | |
State | | | 5 | | | | 3 | |
Housing | | | 4 | | | | 2 | |
For Fund compliance purposes, the Fund’s sector classifications refer to one or more of the sector sub-classifications used by one or more widely recognized market indexes or rating group indexes, and/or as defined by the investment adviser. These definitions may not apply for purposes of this report, which may combine such sector sub-classifications for reporting ease.
CALL/MATURITY SCHEDULE (c)
| | | | |
Calendar Year Ended December 31, | | | | |
2018 | | | 13 | % |
2019 | | | 5 | |
2020 | | | 12 | |
2021 | | | 19 | |
2022 | | | 8 | |
| | (c) | Scheduled maturity dates and/or bonds that are subject to potential calls by issuers over the next five years. | |
| | * | Excludes short-term securities. | |
CREDIT QUALITY ALLOCATION (a)
| | | | | | | | |
| Credit Rating | | 10/31/18 | | | 04/30/18 | |
AAA/Aaa | | | 1 | % | | | 1 | % |
AA/Aa | | | 19 | | | | 18 | |
A | | | 10 | | | | 7 | |
BBB/Baa | | | 19 | | | | 21 | |
BB/Ba | | | 12 | | | | 12 | |
B/B | | | 18 | | | | 19 | |
CCC/Caa | | | 1 | | | | 1 | |
N/R(b) | | | 20 | | | | 21 | |
| | (a) | For financial reporting purposes, credit quality ratings shown above reflect the highest rating assigned by either S&P or Moody’s if ratings differ. These rating agencies are independent, nationally recognized statistical rating organizations and are widely used. Investment grade ratings are credit ratings of BBB/Baa or higher. Below investment grade ratings are credit ratings of BB/Ba or lower. Investments designated N/R are not rated by either rating agency. Unrated investments do not necessarily indicate low credit quality. Credit quality ratings are subject to change. | |
| | (b) | The investment adviser evaluates the credit quality of unrated investments based upon certain factors including, but not limited to, credit ratings for similar investments and financial analysis of sectors and individual investments. Using this approach, the investment adviser has deemed certain of these unrated securities as investment grade quality. As of October 31, 2018 and April 30, 2018, the market value of unrated securities deemed by the investment adviser to be investment grade represents less than 1% and 1%, respectively, of the Fund’s total investments. | |
| | |
| Fund Summary as of October 31, 2018 | | BlackRock MuniEnhanced Fund, Inc. |
Investment Objective
BlackRock MuniEnhanced Fund, Inc.’s (MEN) (the “Fund”) investment objective is to provide shareholders with as high a level of current income exempt from U.S. federal income taxes as is consistent with its investment policies and prudent investment management. The Fund seeks to achieve its investment objective by investing at least 80% of its assets in municipal bonds exempt from U.S. federal income taxes (except that the interest may be subject to the U.S. federal alternative minimum tax). Under normal market conditions, the Fund invests primarily in long-term municipal bonds that are rated investment grade quality or, if unrated, are deemed to be of comparable quality by the investment adviser at the time of investment and invests primarily in long-term municipal bonds with maturities of more than ten years at the time of investment. The Fund may invest directly in such securities or synthetically through the use of derivatives.
No assurance can be given that the Fund’s investment objective will be achieved.
Fund Information
| | |
Symbol on NYSE | | MEN |
Initial Offering Date | | March 2, 1989 |
Yield on Closing Market Price as of October 31, 2018 ($9.69)(a) | | 5.94% |
Tax Equivalent Yield(b) | | 10.03% |
Current Monthly Distribution per Common Share(c) | | $0.0480 |
Current Annualized Distribution per Common Share(c) | | $0.5760 |
Economic Leverage as of October 31, 2018(d) | | 41% |
| | (a) | Yield on closing market price is calculated by dividing the current annualized distribution per share by the closing market price. Past performance does not guarantee future results. | |
| | (b) | Tax equivalent yield assumes the maximum marginal U.S. federal tax rate of 40.8%, which includes the 3.8% Medicare tax. Actual tax rates will vary based on income, exemptions and deductions. Lower taxes will result in lower tax equivalent yields. | |
| | (c) | The distribution rate is not constant and is subject to change. | |
| | (d) | Represents VRDP Shares and TOB Trusts as a percentage of total managed assets, which is the total assets of the Fund, including any assets attributable to VRDP Shares and TOB Trusts, minus the sum of its accrued liabilities. For a discussion of leveraging techniques utilized by the Fund, please see The Benefits and Risks of Leveraging on page 5. | |
Performance
Returns for the six months ended October 31, 2018 were as follows:
| | | | | | | | |
| | | Returns Based On | |
| | | Market Price | | | NAV | |
MEN(a)(b) | | | (4.92 | )% | | | (0.30 | )% |
Lipper General & Insured Municipal Debt Funds (Leveraged)(c) | | | (3.47 | ) | | | (0.13 | ) |
| | (a) | All returns reflect reinvestment of dividends and/or distributions at actual reinvestment prices. | |
| | (b) | The Fund’s discount to NAV widened during the period, which accounts for the difference between performance based on market price and performance based on NAV. | |
| | (c) | Average return. Returns reflect reinvestment of dividends and/or distributions at NAV on the ex-dividend as calculated by Lipper. | |
Performance results may include adjustments made for financial reporting purposes in accordance with U.S. generally accepted accounting principles.
Past performance is not indicative of future results.
The following discussion relates to the Fund’s absolute performance based on NAV:
Municipal bonds experienced lackluster returns in the past six months, with price weakness outweighing the contribution from income. After trading sideways through the summer, tax-exempt issues fell sharply in September and October. During this time, investors reacted to commentary from Fed Chairman Jerome Powell indicating that future monetary policy tightening could be more aggressive than the markets had anticipated. Supply and demand factors also had an adverse effect on returns in the latter part of the period, with mutual fund outflows occurring at the same time that a wave of new issuance was hitting the market.
The Fund’s quality focus detracted from performance given the underperformance of higher-rated debt.
Holdings in longer-term bonds detracted as their weak price performance outweighed the benefit of added income. An allocation to low-coupon and zero-coupon bonds, which have a higher sensitivity to interest rates, also hurt performance.
Although yields rose during the period, reinvestment had an adverse effect on the Fund’s income since the proceeds of higher-yielding bonds that matured or were called needed to be reinvested at lower prevailing rates.
The use of leverage, while providing additional income, was a net detractor since it amplified the impact of falling prices.
The Fund sought to manage interest rate risk using U.S. Treasury futures. Given that Treasury yields rose, as prices fell, this aspect of the Fund’s positioning had a positive effect on returns by offsetting the weakness in prices.
The views expressed reflect the opinions of BlackRock as of the date of this report and are subject to change based on changes in market, economic or other conditions. These views are not intended to be a forecast of future events and are no guarantee of future results.
| | |
| 8 | | 2018 BLACKROCK SEMI-ANNUAL REPORTTO SHAREHOLDERS |
| | |
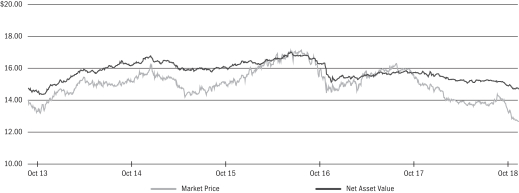
| Fund Summary as of October 31, 2018 (continued) | | BlackRock MuniEnhanced Fund, Inc. |
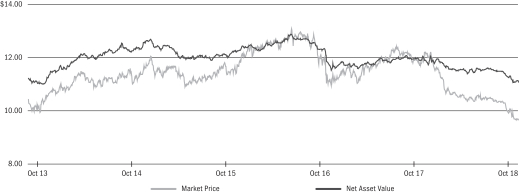
Market Price and Net Asset Value Per Share Summary
| | | | | | | | | | | | | | | | | | | | |
| | | 10/31/18 | | | 04/30/18 | | | Change | | | High | | | Low | |
Market Price | | $ | 9.69 | | | $ | 10.48 | | | | (7.54 | )% | | $ | 10.63 | | | $ | 9.63 | |
Net Asset Value | | | 11.11 | | | | 11.46 | | | | (3.05 | ) | | | 11.63 | | | | 11.10 | |
Market Price and Net Asset Value History For the Past Five Years
Overview of the Fund’s Total Investments*
SECTOR ALLOCATION
| | | | | | | | |
| Sector | | 10/31/18 | | | 04/30/18 | |
Transportation | | | 25 | % | | | 24 | % |
County/City/Special District/School District | | | 15 | | | | 17 | |
Health | | | 14 | | | | 14 | |
State | | | 13 | | | | 16 | |
Utilities | | | 12 | | | | 13 | |
Education | | | 9 | | | | 9 | |
Finance | | | 7 | | | | — | |
Housing | | | 2 | | | | 2 | |
Corporate | | | 2 | | | | 3 | |
Tobacco | | | 1 | | | | 2 | |
For Fund compliance purposes, the Fund’s sector classifications refer to one or more of the sector sub-classifications used by one or more widely recognized market indexes or rating group indexes, and/or as defined by the investment adviser. These definitions may not apply for purposes of this report, which may combine such sector sub-classifications for reporting ease.
CALL/MATURITY SCHEDULE (c)
| | | | |
Calendar Year Ended December 31, | | | | |
2018 | | | 5 | % |
2019 | | | 13 | |
2020 | | | 3 | |
2021 | | | 11 | |
2022 | | | 8 | |
| | (c) | Scheduled maturity dates and/or bonds that are subject to potential calls by issuers over the next five years. | |
| | * | Excludes short-term securities. | |
CREDIT QUALITY ALLOCATION (a)
| | | | | | | | |
| Credit Rating | | 10/31/18 | | | 04/30/18 | |
AAA/Aaa | | | 6 | % | | | 7 | % |
AA/Aa | | | 48 | | | | 51 | |
A | | | 24 | | | | 23 | |
BBB/Baa | | | 13 | | | | 13 | |
BB/Ba | | | 2 | | | | 2 | |
N/R(b) | | | 7 | | | | 4 | |
| | (a) | For financial reporting purposes, credit quality ratings shown above reflect the highest rating assigned by either S&P or Moody’s if ratings differ. These rating agencies are independent, nationally recognized statistical rating organizations and are widely used. Investment grade ratings are credit ratings of BBB/Baa or higher. Below investment grade ratings are credit ratings of BB/Ba or lower. Investments designated N/R are not rated by either rating agency. Unrated investments do not necessarily indicate low credit quality. Credit quality ratings are subject to change. | |
| | (b) | The investment adviser evaluates the credit quality of unrated investments based upon certain factors including but not limited to, credit ratings for similar investments and financial analysis of sectors and individual investments. Using this approach, the investment adviser has deemed certain of these unrated securities as investment grade quality. As of October 31, 2018 and April 30, 2018, the market value of unrated securities deemed by the investment adviser to be investment grade represents 1% and less than 1%, respectively, of the Fund’s total investments. | |
| | |
| Fund Summary as of October 31, 2018 | | BlackRock MuniHoldings Fund, Inc. |
Investment Objective
BlackRock MuniHoldings Fund, Inc.’s (MHD) (the “Fund”) investment objective is to provide shareholders with current income exempt from U.S. federal income taxes. The Fund seeks to achieve its investment objective by investing at least 80% of its assets in municipal bonds exempt from U.S. federal income taxes (except that the interest may be subject to the U.S. federal alternative minimum tax). The Fund invests, under normal market conditions, at least 75% of its assets in municipal bonds that are rated investment grade or, if unrated, are deemed to be of comparable quality by the investment adviser at the time of investment and invests primarily in long-term municipal bonds with a maturity of more than ten years at the time of investment. The Fund may invest directly in such securities or synthetically through the use of derivatives.
No assurance can be given that the Fund’s investment objective will be achieved.
Fund Information
| | |
Symbol on NYSE | | MHD |
Initial Offering Date | | May 2, 1997 |
Yield on Closing Market Price as of October 31, 2018 ($14.03)(a) | | 5.99% |
Tax Equivalent Yield(b) | | 10.12% |
Current Monthly Distribution per Common Share(c) | | $0.0700 |
Current Annualized Distribution per Common Share(c) | | $0.8400 |
Economic Leverage as of October 31, 2018(d) | | 39% |
| | (a) | Yield on closing market price is calculated by dividing the current annualized distribution per share by the closing market price. Past performance does not guarantee future results. | |
| | (b) | Tax equivalent yield assumes the maximum marginal U.S. federal tax rate of 40.8%, which includes the 3.8% Medicare tax. Actual tax rates will vary based on income, exemptions and deductions. Lower taxes will result in lower tax equivalent yields. | |
| | (c) | The monthly distribution per Common Share, declared on December 3, 2018, was decreased to $0.0675 per share. The yield on closing market price, current monthly distribution per Common Share and current annualized distribution per Common Share do not reflect the new distribution rate. The new distribution rate is not constant and is subject to change in the future. | |
| | (d) | Represents VMTP Shares and TOB Trusts as a percentage of total managed assets, which is the total assets of the Fund, including any assets attributable to VMTP Shares and TOB Trusts, minus the sum of its accrued liabilities. For a discussion of leveraging techniques utilized by the Fund, please see The Benefits and Risks of Leveraging on page 5. | |
Performance
Returns for the six months ended October 31, 2018 were as follows:
| | | | | | | | |
| | | Returns Based On | |
| | | Market Price | | | NAV | |
MHD(a)(b) | | | (3.73 | )% | | | 0.28 | % |
Lipper General & Insured Municipal Debt Funds (Leveraged)(c) | | | (3.47 | ) | | | (0.13 | ) |
| | (a) | All returns reflect reinvestment of dividends and/or distributions at actual reinvestment prices. | |
| | (b) | The Fund’s discount to NAV widened during the period, which accounts for the difference between performance based on market price and performance based on NAV. | |
| | (c) | Average return. Returns reflect reinvestment of dividends and/or distributions at NAV on the ex-dividend as calculated by Lipper. | |
Performance results may include adjustments made for financial reporting purposes in accordance with U.S. generally accepted accounting principles.
Past performance is not indicative of future results.
The following discussion relates to the Fund’s absolute performance based on NAV:
Municipal bonds experienced lackluster returns in the past six months, with price weakness outweighing the contribution from income. After trading sideways through the summer months, tax-exempt issues fell sharply in September and October. During this time, investors reacted to commentary from Fed Chairman Jerome Powell indicating that future monetary policy tightening could be more aggressive than the markets had anticipated. Supply and demand factors also had an adverse effect on returns in the latter part of the period, with mutual fund outflows occurring at the same time that a wave of new issuance was hitting the market.
The Fund’s yield curve positioning made the largest contribution to performance. Positions in high-quality, short-dated, pre-refunded bonds performed relatively well and held their value better than longer-dated holdings. The latter experienced larger price declines amid a steepening yield curve in which rates on intermediate- and long-term issues rose at a faster pace than those of short-term securities. (Prices and yields move in opposite directions.)
Positions in lower-quality issues continued to benefit results, as investor risk appetites remained robust for much of the reporting period. Holdings in lower-rated investment-grade bonds and high-yield issues outperformed due to the combination of their higher income and stronger price performance. However, these bonds lagged late in the period once investor sentiment began to deteriorate.
At the sector level, positions in tobacco and state tax-backed issues contributed to results. Investments in transportation and corporate-related debt added value, as well.
The use of leverage, while providing additional income, was a net detractor since it amplified the impact of falling prices.
The Fund sought to manage interest rate risk using U.S. Treasury futures. Given that Treasury yields rose, as prices fell, this aspect of the Fund’s positioning had a positive effect on returns by offsetting the weakness in prices.
The views expressed reflect the opinions of BlackRock as of the date of this report and are subject to change based on changes in market, economic or other conditions. These views are not intended to be a forecast of future events and are no guarantee of future results.
| | |
| 10 | | 2018 BLACKROCK SEMI-ANNUAL REPORTTO SHAREHOLDERS |
| | |
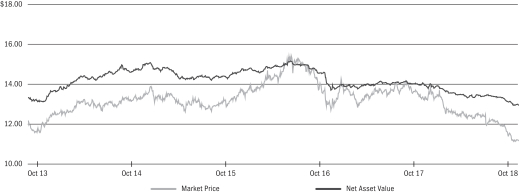
| Fund Summary as of October 31, 2018 (continued) | | BlackRock MuniHoldings Fund, Inc. |
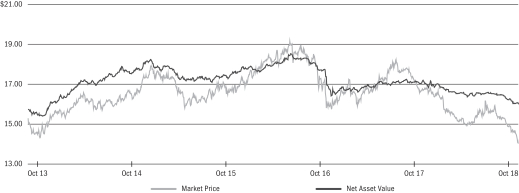
Market Price and Net Asset Value Per Share Summary
| | | | | | | | | | | | | | | | | | | | |
| | | 10/31/18 | | | 04/30/18 | | | Change | | | High | | | Low | |
Market Price | | $ | 14.03 | | | $ | 14.98 | | | | (6.34 | )% | | $ | 16.21 | | | $ | 14.02 | |
Net Asset Value | | | 16.01 | | | | 16.41 | | | | (2.44 | ) | | | 16.58 | | | | 16.01 | |
Market Price and Net Asset Value History For the Past Five Years
Overview of the Fund’s Total Investments*
SECTOR ALLOCATION
| | | | | | | | |
| Sector | | 10/31/18 | | | 04/30/18 | |
Transportation | | | 22 | % | | | 24 | % |
Health | | | 19 | | | | 18 | |
Utilities | | | 14 | | | | 14 | |
County/City/Special District/School District | | | 12 | | | | 12 | |
State | | | 11 | | | | 11 | |
Education | | | 9 | | | | 9 | |
Tobacco | | | 6 | | | | 6 | |
Corporate | | | 6 | | | | 5 | |
Housing | | | 1 | | | | 1 | |
For Fund compliance purposes, the Fund’s sector classifications refer to one or more of the sector sub-classifications used by one or more widely recognized market indexes or rating group indexes, and/or as defined by the investment adviser. These definitions may not apply for purposes of this report, which may combine such sector sub-classifications for reporting ease.
CALL/MATURITY SCHEDULE (c)
| | | | |
Calendar Year Ended December 31, | | | | |
2018 | | | 4 | % |
2019 | | | 22 | |
2020 | | | 11 | |
2021 | | | 12 | |
2022 | | | 10 | |
| | (c) | Scheduled maturity dates and/or bonds that are subject to potential calls by issuers over the next five years. | |
| | * | Excludes short-term securities. | |
CREDIT QUALITY ALLOCATION (a)
| | | | | | | | |
| Credit Rating | | 10/31/18 | | | 04/30/18 | |
AAA/Aaa | | | 4 | % | | | 3 | % |
AA/Aa | | | 42 | | | | 44 | |
A | | | 21 | | | | 20 | |
BBB/Baa | | | 15 | | | | 15 | |
BB/Ba | | | 4 | | | | 4 | |
B | | | 4 | | | | 4 | |
N/R(b) | | | 10 | | | | 10 | |
| | (a) | For financial reporting purposes, credit quality ratings shown above reflect the highest rating assigned by either S&P or Moody’s if ratings differ. These rating agencies are independent, nationally recognized statistical rating organizations and are widely used. Investment grade ratings are credit ratings of BBB/Baa or higher. Below investment grade ratings are credit ratings of BB/Ba or lower. Investments designated N/R are not rated by either rating agency. Unrated investments do not necessarily indicate low credit quality. Credit quality ratings are subject to change. | |
| | (b) | The investment adviser evaluates the credit quality of unrated investments based upon certain factors including, but not limited to, credit ratings for similar investments and financial analysis of sectors and individual investments. Using this approach, the investment adviser has deemed certain of these unrated securities as investment grade quality. As of October 31, 2018 and April 30, 2018, the market value of unrated securities deemed by the investment adviser to be investment grade represents less than 1% and 1%, respectively, of the Fund’s total investments. | |
| | |
| Fund Summary as of October 31, 2018 | | BlackRock MuniHoldings Fund II, Inc. |
Investment Objective
BlackRock MuniHoldings Fund II, Inc.’s (MUH) (the “Fund”) investment objective is to provide shareholders with current income exempt from U.S. federal income taxes. The Fund seeks to achieve its investment objective by investing, under normal market conditions, at least 80% of its assets in municipal bonds exempt from U.S. federal income taxes (except that the interest may be subject to the U.S. federal alternative minimum tax). The Fund invests, under normal market conditions, at least 75% of its assets in municipal bonds that are rated investment grade or, if unrated, are deemed to be of comparable quality by the investment adviser at the time of investment and invests primarily in long-term municipal bonds with a maturity of more than ten years at the time of investment. The Fund may invest directly in such securities or synthetically through the use of derivatives.
No assurance can be given that the Fund’s investment objective will be achieved.
Fund Information
| | |
Symbol on NYSE | | MUH |
Initial Offering Date | | February 27, 1998 |
Yield on Closing Market Price as of October 31, 2018 ($12.67)(a) | | 5.82% |
Tax Equivalent Yield(b) | | 9.83% |
Current Monthly Distribution per Common Share(c) | | $0.0615 |
Current Annualized Distribution per Common Share(c) | | $0.7380 |
Economic Leverage as of October 31, 2018(d) | | 41% |
| | (a) | Yield on closing market price is calculated by dividing the current annualized distribution per share by the closing market price. Past performance does not guarantee future results. | |
| | (b) | Tax equivalent yield assumes the maximum marginal U.S. federal tax rate of 40.8%, which includes the 3.8% Medicare tax. Actual tax rates will vary based on income, exemptions and deductions. Lower taxes will result in lower tax equivalent yields. | |
| | (c) | The distribution rate is not constant and is subject to change. | |
| | (d) | Represents VMTP Shares and TOB Trusts as a percentage of total managed assets, which is the total assets of the Fund, including any assets attributable to VMTP Shares and TOB Trusts, minus the sum of its accrued liabilities. For a discussion of leveraging techniques utilized by the Fund, please see The Benefits and Risks of Leveraging on page 5. | |
Performance
Returns for the six months ended October 31, 2018 were as follows:
| | | | | | | | |
| | | Returns Based On | |
| | | Market Price | | | NAV | |
MUH(a)(b) | | | (5.24 | )% | | | 0.05 | % |
Lipper General & Insured Municipal Debt Funds (Leveraged)(c) | | | (3.47 | ) | | | (0.13 | ) |
| | (a) | All returns reflect reinvestment of dividends and/or distributions at actual reinvestment prices. | |
| | (b) | The Fund’s discount to NAV widened during the period, which accounts for the difference between performance based on market price and performance based on NAV. | |
| | (c) | Average return. Returns reflect reinvestment of dividends and/or distributions at NAV on the ex-dividend as calculated by Lipper. | |
Performance results may include adjustments made for financial reporting purposes in accordance with U.S. generally accepted accounting principles.
Past performance is not indicative of future results.
The following discussion relates to the Fund’s absolute performance based on NAV:
Municipal bonds experienced lackluster returns in the past six months, with price weakness outweighing the contribution from income. After trading sideways through the summer, tax-exempt issues fell sharply in September and October. During this time, investors reacted to commentary from Fed Chairman Jerome Powell indicating that future monetary policy tightening could be more aggressive than the markets had anticipated. Supply and demand factors also had an adverse effect on returns in the latter part of the period, with mutual fund outflows occurring at the same time that a wave of new issuance was hitting the market.
The Fund generated a small gain at net asset value. Its return was primarily derived from income given that bond prices fell.
Positions in lower-rated bonds performed well amid investors’ ongoing preference for higher-yielding issues. Conversely, holdings in investment-grade issues produced weaker returns.
The Fund’s high concentration in short-maturity, pre-refunded securities aided results due to the strong relative performance of short-term securities. On the other end of the spectrum, holdings in longer-term bonds detracted as their weak price performance outweighed the benefit of added income.
The use of leverage, while providing additional income, was a net detractor since it amplified the impact of falling prices.
The Fund sought to manage interest rate risk using U.S. Treasury futures. Given that Treasury yields rose, as prices fell, this aspect of the Fund’s positioning had a positive effect on returns by offsetting the weakness in prices.
An allocation to low-coupon and zero-coupon bonds, which have a higher sensitivity to interest rates, also hurt performance.
Although yields rose during the period, reinvestment had an adverse effect on the Fund’s income since the proceeds of higher-yielding bonds that matured or were called needed to be reinvested at lower prevailing rates.
The views expressed reflect the opinions of BlackRock as of the date of this report and are subject to change based on changes in market, economic or other conditions. These views are not intended to be a forecast of future events and are no guarantee of future results.
| | |
| 12 | | 2018 BLACKROCK SEMI-ANNUAL REPORTTO SHAREHOLDERS |
| | |
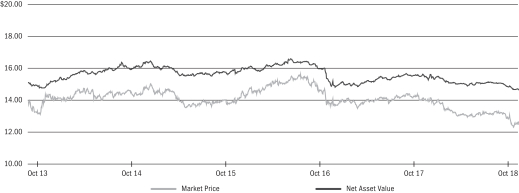
| Fund Summary as of October 31, 2018 (continued) | | BlackRock MuniHoldings Fund II, Inc. |
Market Price and Net Asset Value Per Share Summary
| | | | | | | | | | | | | | | | | | | | |
| | | 10/31/18 | | | 04/30/18 | | | Change | | | High | | | Low | |
Market Price | | $ | 12.67 | | | $ | 13.75 | | | | (7.85 | )% | | $ | 14.46 | | | $ | 12.65 | |
Net Asset Value | | | 14.70 | | | | 15.11 | | | | (2.71 | ) | | | 15.27 | | | | 14.70 | |
Market Price and Net Asset Value History For the Past Five Years
Overview of the Fund’s Total Investments*
SECTOR ALLOCATION
| | | | | | | | |
| Sector | | 10/31/18 | | | 04/30/18 | |
Health | | | 20 | % | | | 20 | % |
Transportation | | | 18 | | | | 20 | |
State | | | 16 | | | | 15 | |
County/City/Special District/School District | | | 12 | | | | 13 | |
Utilities | | | 10 | | | | 10 | |
Education | | | 7 | | | | 9 | |
Tobacco | | | 5 | | | | 6 | |
Financing | | | 5 | | | | — | |
Corporate | | | 5 | | | | 5 | |
Housing | | | 2 | | | | 2 | |
For Fund compliance purposes, the Fund’s sector classifications refer to one or more of the sector sub-classifications used by one or more widely recognized market indexes or rating group indexes, and/or as defined by the investment adviser. These definitions may not apply for purposes of this report, which may combine such sector sub-classifications for reporting ease.
CALL/MATURITY SCHEDULE (c)
| | | | |
Calendar Year Ended December 31, | | | | |
2018 | | | 3 | % |
2019 | | | 24 | |
2020 | | | 11 | |
2021 | | | 11 | |
2022 | | | 6 | |
| | (c) | Scheduled maturity dates and/or bonds that are subject to potential calls by issuers over the next five years. | |
| | * | Excludes short-term securities. | |
CREDIT QUALITY ALLOCATION (a)
| | | | | | | | |
| Credit Rating | | 10/31/18 | | | 04/30/18 | |
AAA/Aaa | | | 4 | % | | | 4 | % |
AA/Aa | | | 48 | | | | 46 | |
A | | | 17 | | | | 20 | |
BBB/Baa | | | 15 | | | | 14 | |
BB/Ba | | | 4 | | | | 4 | |
B | | | 4 | | | | 4 | |
N/R(b) | | | 8 | | | | 8 | |
| | (a) | For financial reporting purposes, credit quality ratings shown above reflect the highest rating assigned by either S&P or Moody’s if ratings differ. These rating agencies are independent, nationally recognized statistical rating organizations and are widely used. Investment grade ratings are credit ratings of BBB/Baa or higher. Below investment grade ratings are credit ratings of BB/Ba or lower. Investments designated N/R are not rated by either rating agency. Unrated investments do not necessarily indicate low credit quality. Credit quality ratings are subject to change. | |
| | (b) | The investment adviser evaluates the credit quality of unrated investments based upon certain factors including, but not limited to, credit ratings for similar investments and financial analysis of sectors and individual investments. Using this approach, the investment adviser has deemed certain of these unrated securities as investment grade quality. As of October 31, 2018 and April 30, 2018, the market value of unrated securities deemed by the investment adviser to be investment grade each less than 1% and 2%, respectively, of the Fund’s total investments. | |
| | |
| Fund Summary as of October 31, 2018 | | BlackRock MuniHoldings Quality Fund, Inc. |
Investment Objective
BlackRock MuniHoldings Quality Fund, Inc.’s (MUS) (the “Fund”) investment objective is to provide shareholders with current income exempt from U.S. federal income taxes. The Fund seeks to achieve its investment objective by investing primarily in long-term, investment grade municipal obligations exempt from U.S. federal income taxes (except that the interest may be subject to the U.S. federal alternative minimum tax). Under normal market conditions, the Fund invests at least 80% of its assets in investment grade municipal obligations, and obligations deemed to be of comparable quality by the investment adviser at the time of investment, with remaining maturities of one year or more at the time of investment. The Fund may invest directly in such securities or synthetically through the use of derivatives.
No assurance can be given that the Fund’s investment objective will be achieved.
Fund Information
| | |
Symbol on NYSE | | MUS |
Initial Offering Date | | May 1, 1998 |
Yield on Closing Market Price as of October 31, 2018 ($11.17)(a) | | 5.43% |
Tax Equivalent Yield(b) | | 9.17% |
Current Monthly Distribution per Common Share(c) | | $0.0505 |
Current Annualized Distribution per Common Share(c) | | $0.6060 |
Economic Leverage as of October 31, 2018(d) | | 39% |
| | (a) | Yield on closing market price is calculated by dividing the current annualized distribution per share by the closing market price. Past performance does not guarantee future results. | |
| | (b) | Tax equivalent yield assumes the maximum marginal U.S. federal tax rate of 40.8%, which includes the 3.8% Medicare tax. Actual tax rates will vary based on income, exemptions and deductions. Lower taxes will result in lower tax equivalent yields. | |
| | (c) | The distribution rate is not constant and is subject to change. | |
| | (d) | Represents VMTP Shares and TOB Trusts as a percentage of total managed assets, which is the total assets of the Fund, including any assets attributable to VMTP Shares and TOB Trusts, minus the sum of its accrued liabilities. For a discussion of leveraging techniques utilized by the Fund, please see The Benefits and Risks of Leveraging on page 5. | |
Performance
Returns for the six months ended October 31, 2018 were as follows:
| | | | | | | | |
| | | Returns Based On | |
| | | Market Price | | | NAV | |
MUS(a)(b) | | | (7.40 | )% | | | (0.21 | )% |
Lipper General & Insured Municipal Debt Funds (Leveraged)(c) | | | (3.47 | ) | | | (0.13 | ) |
| | (a) | All returns reflect reinvestment of dividends and/or distributions at actual reinvestment prices. | |
| | (b) | The Fund’s discount to NAV widened during the period, which accounts for the difference between performance based on market price and performance based on NAV. | |
| | (c) | Average return. Returns reflect reinvestment of dividends and/or distributions at NAV on the ex-dividend as calculated by Lipper. | |
Performance results may include adjustments made for financial reporting purposes in accordance with U.S. generally accepted accounting principles.
Past performance is not indicative of future results.
The following discussion relates to the Fund’s absolute performance based on NAV:
Municipal bonds experienced lackluster returns in the past six months, with price weakness outweighing the contribution from income. After trading sideways through the summer, tax-exempt issues fell sharply in September and October. During this time, investors reacted to commentary from Fed Chairman Jerome Powell indicating that future monetary policy tightening could be more aggressive than the markets had anticipated. Supply and demand factors also had an adverse effect on returns in the latter part of the period, with mutual fund outflows occurring at the same time that a wave of new issuance was hitting the market.
The Fund’s emphasis on higher-quality bonds, which lagged the overall market, was the primary factor in its underperformance. However, positions in lower-rated investment-grade securities, to the extent that they were held in the portfolio, aided results. The improving domestic economy helped support the underlying fundamentals of lower-quality issues. In addition, this market segment benefited from the combination of limited supply and strong investor demand.
Consistent with the broader market environment, the Fund’s positions in longer-term bonds detracted from returns.
The Fund’s performance was helped by positions in the transportation, pre-refunded, and utilities sectors. Pre-refunded bonds outperformed due to their attractive yields and below-average sensitivity to interest rate movements.
Reinvestment had an adverse impact on the Fund’s income, as the proceeds of higher-yielding bonds that matured or were called needed to be reinvested at lower prevailing rates.
Holdings in Illinois and New Jersey bonds were additional contributors of note. Economic tailwinds helped improve the credit fundamentals of both states by boosting income and sales tax revenues. This trend, coupled with a limited supply of high-yielding, tax-exempt bonds, led to outperformance for these issuers.
The use of leverage, while providing additional income, was a net detractor since it amplified the impact of falling prices.
The Fund sought to manage interest rate risk using U.S. Treasury futures. Given that Treasury yields rose, as prices fell, this aspect of the Fund’s positioning had a positive effect on returns by offsetting the weakness in prices.
Positions in standard-structure 5% coupon issues, which outperformed discount coupon bonds, were also additive.
The views expressed reflect the opinions of BlackRock as of the date of this report and are subject to change based on changes in market, economic or other conditions. These views are not intended to be a forecast of future events and are no guarantee of future results.
| | |
| 14 | | 2018 BLACKROCK SEMI-ANNUAL REPORTTO SHAREHOLDERS |
| | |
| Fund Summary as of October 31, 2018 (continued) | | BlackRock MuniHoldings Quality Fund, Inc. |
Market Price and Net Asset Value Per Share Summary
| | | | | | | | | | | | | | | | | | | | |
| | | 10/31/18 | | | 04/30/18 | | | Change | | | High | | | Low | |
Market Price | | $ | 11.17 | | | $ | 12.40 | | | | (9.92 | )% | | $ | 12.57 | | | $ | 11.10 | |
Net Asset Value | | | 12.96 | | | | 13.35 | | | | (2.92 | ) | | | 13.48 | | | | 12.96 | |
Market Price and Net Asset Value History For the Past Five Years
Overview of the Fund’s Total Investments*
SECTOR ALLOCATION
| | | | | | | | |
| Sector | | 10/31/18 | | | 04/30/18 | |
Transportation | | | 32 | % | | | 31 | % |
County/City/Special District/School District | | | 20 | | | | 26 | |
Utilities | | | 14 | | | | 14 | |
Education | | | 10 | | | | 7 | |
State | | | 9 | | | | 8 | |
Health | | | 8 | | | | 8 | |
Housing | | | 4 | | | | 3 | |
Tobacco | | | 2 | | | | 2 | |
Corporate | | | 1 | | | | 1 | |
For Fund compliance purposes, the Fund’s sector classifications refer to one or more of the sector sub-classifications used by one or more widely recognized market indexes or rating group indexes, and/or as defined by the investment adviser. These definitions may not apply for purposes of this report, which may combine such sector sub-classifications for reporting ease.
CALL/MATURITY SCHEDULE (b)
| | | | |
Calendar Year Ended December 31, | | | | |
2018 | | | 5 | % |
2019 | | | 12 | |
2020 | | | 4 | |
2021 | | | 18 | |
2022 | | | 2 | |
| | (b) | Scheduled maturity dates and/or bonds that are subject to potential calls by issuers over the next five years. | |
| | * | Excludes short-term securities. | |
CREDIT QUALITY ALLOCATION (a)
| | | | | | | | |
| Credit Rating | | 10/31/18 | | | 04/30/18 | |
AAA/Aaa | | | 4 | % | | | 6 | % |
AA/Aa | | | 53 | | | | 52 | |
A | | | 28 | | | | 28 | |
BBB/Baa | | | 11 | | | | 10 | |
N/R | | | 4 | | | | 4 | |
| | (a) | For financial reporting purposes, credit quality ratings shown above reflect the highest rating assigned by either S&P or Moody’s if ratings differ. These rating agencies are independent, nationally recognized statistical rating organizations and are widely used. Investment grade ratings are credit ratings of BBB/Baa or higher. Below investment grade ratings are credit ratings of BB/Ba or lower. Investments designated N/R are not rated by either rating agency. Unrated investments do not necessarily indicate low credit quality. Credit quality ratings are subject to change. | |
| | |
| Fund Summary as of October 31, 2018 | | BlackRock Muni Intermediate Duration Fund, Inc. |
Investment Objective
BlackRock Muni Intermediate Duration Fund, Inc.’s (MUI) (the “Fund”) investment objective is to provide common shareholders with high current income exempt from U.S. federal income taxes. The Fund seeks to achieve its investment objective by investing at least 80% of its assets in municipal bonds exempt from U.S. federal income taxes (except that the interest may be subject to the U.S. federal alternative minimum tax). Under normal market conditions, the Fund invests at least 75% of its assets in municipal bonds that are rated investment grade or, if unrated, are deemed to be of comparable quality by the investment adviser at the time of investment and invests at least 80% of its assets in municipal bonds with a duration of three to ten years at the time of investment. The Fund expects to maintain a dollar-weighted average portfolio duration, as calculated by the investment adviser, of three to ten years. The Fund may invest directly in such securities or synthetically through the use of derivatives.
No assurance can be given that the Fund’s investment objective will be achieved.
Fund Information
| | |
Symbol on NYSE | | MUI |
Initial Offering Date | | August 1, 2003 |
Yield on Closing Market Price as of October 31, 2018 ($12.66)(a) | | 4.22% |
Tax Equivalent Yield(b) | | 7.13% |
Current Monthly Distribution per Common Share(c) | | $0.0445 |
Current Annualized Distribution per Common Share(c) | | $0.5340 |
Economic Leverage as of October 31, 2018(d) | | 40% |
| | (a) | Yield on closing market price is calculated by dividing the current annualized distribution per share by the closing market price. Past performance does not guarantee future results. | |
| | (b) | Tax equivalent yield assumes the maximum marginal U.S. federal tax rate of 40.8%, which includes the 3.8% Medicare tax. Actual tax rates will vary based on income, exemptions and deductions. Lower taxes will result in lower tax equivalent yields. | |
| | (c) | The distribution rate is not constant and is subject to change. | |
| | (d) | Represents VMTP Shares and TOB Trusts as a percentage of total managed assets, which is the total assets of the Fund, including any assets attributable to VMTP Shares and TOB Trusts, minus the sum of its accrued liabilities. For a discussion of leveraging techniques utilized by the Fund, please see The Benefits and Risks of Leveraging on page 5. | |
Performance
Returns for the six months ended October 31, 2018 were as follows:
| | | | | | | | |
| | | Returns Based On | |
| | | Market Price | | | NAV | |
MUI(a)(b) | | | (0.68 | )% | | | 0.22 | % |
Lipper Intermediate Municipal Debt Funds(c) | | | (1.05 | ) | | | 0.37 | |
| | (a) | All returns reflect reinvestment of dividends and/or distributions at actual reinvestment prices. | |
| | (b) | The Fund’s discount to NAV widened during the period, which accounts for the difference between performance based on market price and performance based on NAV. | |
| | (c) | Average return. Returns reflect reinvestment of dividends and/or distributions at NAV on the ex-dividend as calculated by Lipper. | |
Performance results may include adjustments made for financial reporting purposes in accordance with U.S. generally accepted accounting principles.
Past performance is not indicative of future results.
The following discussion relates to the Fund’s absolute performance based on NAV:
Municipal bonds experienced lackluster returns in the past six months, with price weakness outweighing the contribution from income. After trading sideways through the summer, tax-exempt issues fell sharply in September and October. During this time, investors reacted to commentary from Fed Chairman Jerome Powell indicating that future monetary policy tightening could be more aggressive than the markets had anticipated. Supply and demand factors also had an adverse effect on returns in the latter part of the period, with mutual fund outflows occurring at the same time that a wave of new issuance was hitting the market.
The Fund’s positions in lower-duration bonds, including pre-refunded securities, were strong performers due do their defensive nature and lower sensitivity to interest-rate movements.
Positions in BBB and A rated issues, which outperformed higher quality securities, aided results. Holdings in the transportation sector, as well as in Illinois and New Jersey issues, were particularly strong performers. Economic tailwinds helped improve the credit fundamentals of both states by boosting income and sales tax revenues. This trend, coupled with a limited supply of high-yielding, tax-exempt bonds, led to outperformance for these issuers.
The Fund’s yield curve positioning, which featured concentrations in the 10- to 15-year maturity range, also helped performance.
The use of leverage, while providing additional income, was a net detractor since it amplified the impact of falling prices.
The Fund sought to manage interest rate risk using U.S. Treasury futures. Given that Treasury yields rose, as prices fell, this aspect of the Fund’s positioning had a positive effect on returns by offsetting the weakness in prices.
At the sector level, an allocation to tobacco issues was a key detractor.
The views expressed reflect the opinions of BlackRock as of the date of this report and are subject to change based on changes in market, economic or other conditions. These views are not intended to be a forecast of future events and are no guarantee of future results.
| | |
| 16 | | 2018 BLACKROCK SEMI-ANNUAL REPORTTO SHAREHOLDERS |
| | |
| Fund Summary as of October 31, 2018 (continued) | | BlackRock Muni Intermediate Duration Fund, Inc. |
Market Price and Net Asset Value Per Share Summary
| | | | | | | | | | | | | | | | | | | | |
| | | 10/31/18 | | | 04/30/18 | | | Change | | | High | | | Low | |
Market Price | | $ | 12.66 | | | $ | 13.01 | | | | (2.69 | )% | | $ | 13.33 | | | $ | 12.30 | |
Net Asset Value | | | 14.66 | | | | 14.93 | | | | (1.81 | ) | | | 15.15 | | | | 14.66 | |
Market Price and Net Asset Value History For the Past Five Years
Overview of the Fund’s Total Investments*
SECTOR ALLOCATION
| | | | | | | | |
| Sector | | 10/31/18 | | | 04/30/18 | |
Transportation | | | 30 | % | | | 27 | % |
County/City/Special District/School District | | | 16 | | | | 17 | |
State | | | 14 | | | | 16 | |
Health | | | 12 | | | | 10 | |
Education | | | 11 | | | | 12 | |
Utilities | | | 8 | | | | 9 | |
Corporate | | | 3 | | | | 5 | |
Tobacco | | | 3 | | | | 3 | |
Housing | | | 3 | | | | 1 | |
For Fund compliance purposes, the Fund’s sector classifications refer to one or more of the sector sub-classifications used by one or more widely recognized market indexes or rating group indexes, and/or as defined by the investment adviser. These definitions may not apply for purposes of this report, which may combine such sector sub-classifications for reporting ease.
CALL/MATURITY SCHEDULE (c)
| | | | |
Calendar Year Ended December 31, | | | | |
2018 | | | 1 | % |
2019 | | | 8 | |
2020 | | | 7 | |
2021 | | | 15 | |
2022 | | | 5 | |
| | (c) | Scheduled maturity dates and/or bonds that are subject to potential calls by issuers over the next five years. | |
| | * | Excludes short-term securities. | |
CREDIT QUALITY ALLOCATION (a)
| | | | | | | | |
| Credit Rating | | 10/31/18 | | | 04/30/18 | |
AAA/Aaa | | | 6 | % | | | 5 | % |
AA/Aa | | | 33 | | | | 37 | |
A | | | 34 | | | | 32 | |
BBB/Baa | | | 18 | | | | 18 | |
BB/Ba | | | 2 | | | | 2 | |
B | | | 3 | | | | 1 | |
N/R(b) | | | 4 | | | | 5 | |
| | (a) | For financial reporting purposes, credit quality ratings shown above reflect the highest rating assigned by either S&P’s or Moody’s if ratings differ. These rating agencies are independent, nationally recognized statistical rating organizations and are widely used. Investment grade ratings are credit ratings of BBB/Baa or higher. Below investment grade ratings are credit ratings of BB/Ba or lower. Investments designated N/R are not rated by either rating agency. Unrated investments do not necessarily indicate low credit quality. Credit quality ratings are subject to change. | |
| | (b) | The investment adviser evaluates the credit quality of unrated Investments based upon certain factors including, but not limited to, credit ratings for similar investments and financial analysis of sectors and individual investments. Using this approach, the investment adviser has deemed certain of these unrated securities as investment grade quality. As of October 31, 2018 and April 30, 2018, the market value of unrated securities deemed by the investment adviser to be investment grade represents less than 1% of the Fund’s total investments. | |
| | |
| Fund Summary as of October 31, 2018 | | BlackRock MuniVest Fund II, Inc. |
Investment Objective
BlackRock MuniVest Fund II, Inc.’s (MVT) (the “Fund”) investment objective is to provide shareholders with as high a level of current income exempt from U.S. federal income taxes as is consistent with its investment policies and prudent investment management. The Fund seeks to achieve its investment objective by investing at least 80% of its assets in municipal bonds exempt from U.S. federal income taxes (except that the interest may be subject to the U.S. federal alternative minimum tax). The Fund invests, under normal market conditions, at least 75% of its assets in municipal bonds that are rated investment grade or, if unrated, are deemed to be of comparable quality by the investment adviser at the time of investment and invests primarily in long-term municipal bonds with a maturity of more than ten years at the time of investment. The Fund may invest directly in such securities or synthetically through the use of derivatives.
No assurance can be given that the Fund’s investment objective will be achieved.
Fund Information
| | |
Symbol on NYSE | | MVT |
Initial Offering Date | | March 29, 1993 |
Yield on Closing Market Price as of October 31, 2018 ($12.80)(a) | | 5.95% |
Tax Equivalent Yield(b) | | 10.05% |
Current Monthly Distribution per Common Share(c) | | $0.0635 |
Current Annualized Distribution per Common Share(c) | | $0.7620 |
Economic Leverage as of October 31, 2018(d) | | 40% |
| | (a) | Yield on closing market price is calculated by dividing the current annualized distribution per share by the closing market price. Past performance does not guarantee future results. | |
| | (b) | Tax equivalent yield assumes the maximum marginal U.S. federal tax rate of 40.8%, which includes the 3.8% Medicare tax. Actual tax rates will vary based on income, exemptions and deductions. Lower taxes will result in lower tax equivalent yields. | |
| | (c) | The distribution rate is not constant and is subject to change. | |
| | (d) | Represents VMTP Shares and TOB Trusts as a percentage of total managed assets, which is the total assets of the Fund, including any assets attributable to VMTP Shares and TOB Trusts, minus the sum of its accrued liabilities. For a discussion of leveraging techniques utilized by the Fund, please see The Benefits and Risks of Leveraging on page 5. | |
Performance
Returns for the six months ended October 31, 2018 were as follows:
| | | | | | | | |
| | | Returns Based On | |
| | | Market Price | | | NAV | |
MVT(a)(b) | | | (6.34 | )% | | | 0.09 | % |
Lipper General & Insured Municipal Debt Funds (Leveraged)(c) | | | (3.47 | ) | | | (0.13 | ) |
| | (a) | All returns reflect reinvestment of dividends and/or distributions at actual reinvestment prices. | |
| | (b) | The Fund’s discount to NAV widened during the period, which accounts for the difference between performance based on market price and performance based on NAV. | |
| | (c) | Average return. Returns reflect reinvestment of dividends and/or distributions at NAV on the ex-dividend as calculated by Lipper. | |
Performance results may include adjustments made for financial reporting purposes in accordance with U.S. generally accepted accounting principles.
Past performance is not indicative of future results.
The following discussion relates to the Fund’s absolute performance based on NAV:
Municipal bonds experienced lackluster returns in the past six months, with price weakness outweighing the contribution from income. After trading sideways through the summer months, tax-exempt issues fell sharply in September and October. During this time, investors reacted to commentary from Fed Chairman Jerome Powell indicating that future monetary policy tightening could be more aggressive than the markets had anticipated. Supply and demand factors also had an adverse effect on returns in the latter part of the period, with mutual fund outflows occurring at the same time that a wave of new issuance was hitting the market.
The Fund’s yield curve positioning made the largest contribution to performance. Positions in high-quality, short-dated, pre-refunded bonds performed relatively well and held their value better than long-dated holdings. The latter experienced larger price declines amid a steepening yield curve in which rates on intermediate- and long-term issues rose at a faster pace than those of short-term securities. (Prices and yields move in opposite directions.)
Positions in lower-quality issues continued to benefit results, as investor risk appetites remained robust for much of the reporting period. Holdings in lower-rated investment-grade bonds and high-yield issues outperformed due to the combination of their higher income and stronger price performance. However, these bonds lagged late in the period once investor sentiment began to deteriorate.
At the sector level, positions in tobacco, tax-backed and corporate-related issues all contributed to results. Investments in project finance and development-district debt added value, as well. An allocation to the health care sector was a slight detractor.
The use of leverage, while providing additional income, was a net detractor since it amplified the impact of falling prices.
The Fund sought to manage interest rate risk using U.S. Treasury futures. Given that Treasury yields rose, as prices fell, this aspect of the Fund’s positioning had a positive effect on returns by offsetting the weakness in prices.
The views expressed reflect the opinions of BlackRock as of the date of this report and are subject to change based on changes in market, economic or other conditions. These views are not intended to be a forecast of future events and are no guarantee of future results.
| | |
| 18 | | 2018 BLACKROCK SEMI-ANNUAL REPORTTO SHAREHOLDERS |
| | |
| Fund Summary as of October 31, 2018 (continued) | | BlackRock MuniVest Fund II, Inc. |
Market Price and Net Asset Value Per Share Summary
| | | | | | | | | | | | | | | | | | | | |
| | | 10/31/18 | | | 04/30/18 | | | Change | | | High | | | Low | |
Market Price | | $ | 12.80 | | | $ | 14.05 | | | | (8.90 | )% | | $ | 14.25 | | | $ | 12.77 | |
Net Asset Value | | | 14.36 | | | | 14.75 | | | | (2.64 | ) | | | 14.88 | | | | 14.36 | |
Market Price and Net Asset Value History For the Past Five Years
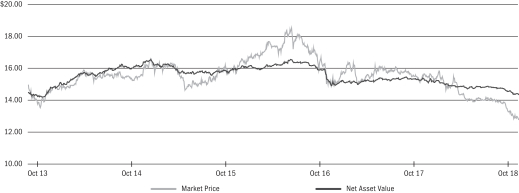
Overview of the Fund’s Total Investments*
SECTOR ALLOCATION
| | | | | | | | |
| Sector Allocation | | 10/31/18 | | | 04/30/18 | |
Transportation | | | 24 | % | | | 29 | % |
Health | | | 14 | | | | 18 | |
Utilities | | | 14 | | | | 13 | |
County/City/Special District/School District | | | 14 | | | | 9 | |
State | | | 11 | | | | 12 | |
Education | | | 9 | | | | 6 | |
Corporate | | | 7 | | | | 6 | |
Tobacco | | | 6 | | | | 6 | |
Housing | | | 1 | | | | 1 | |
For Fund compliance purposes, the Fund’s sector classifications refer to one or more of the sector sub-classifications used by one or more widely recognized market indexes or rating group indexes, and/or as defined by the investment adviser. These definitions may not apply for purposes of this report, which may combine such sector sub-classifications for reporting ease.
CALL/MATURITY SCHEDULE (c)
| | | | |
Calendar Year Ended December 31, | | | | |
2018 | | | 6 | % |
2019 | | | 16 | |
2020 | | | 10 | |
2021 | | | 11 | |
2022 | | | 8 | |
| | (c) | Scheduled maturity dates and/or bonds that are subject to potential calls by issuers over the next five years. | |
| | * | Excludes short-term securities. | |
CREDIT QUALITY ALLOCATION (a)
| | | | | | | | |
| Credit Rating | | 10/31/18 | | | 04/30/18 | |
AAA/Aaa | | | 3 | % | | | 4 | % |
AA/Aa | | | 40 | | | | 42 | |
A | | | 22 | | | | 20 | |
BBB/Baa | | | 16 | | | | 18 | |
BB/Ba | | | 4 | | | | 5 | |
B | | | 4 | | | | 5 | |
N/R(b) | | | 11 | | | | 6 | |
| | (a) | For financial reporting purposes, credit quality ratings shown above reflect the highest rating assigned by either S&P or Moody’s if ratings differ. These rating agencies are independent, nationally recognized statistical rating organizations and are widely used. Investment grade ratings are credit ratings of BBB/Baa or higher. Below investment grade ratings are credit ratings of BB/Ba or lower. Investments designated N/R are not rated by either rating agency. Unrated investments do not necessarily indicate low credit quality. Credit quality ratings are subject to change. | |
| | (b) | The investment adviser evaluates the credit quality of unrated investments based upon certain factors including, but not limited to, credit ratings for similar investments and financial analysis of sectors and individual investments. Using this approach, the investment adviser has deemed certain of these unrated securities as investment grade quality. As of October 31, 2018 and April 30, 2018, the market value of unrated securities deemed by the investment adviser to be investment grade represents less than 1% and 1%, respectively, of the Fund’s total investments. | |
| | |
Schedule of Investments (unaudited) October 31, 2018 | | BlackRock MuniAssets Fund, Inc. (MUA) (Percentages shown are based on Net Assets) |
| | | | | | | | |
| Security | | Par
(000) | | | Value | |
Municipal Bonds — 88.6% | |
|
Alabama — 1.3% | |
County of Jefferson Alabama Sewer Revenue, Refunding RB, Sub-Lien, Series D, 6.00%, 10/01/42 | | $ | 3,745 | | | $ | 4,228,330 | |
State of Alabama Docks Department, Refunding RB, 6.00%, 10/01/20(a) | | | 2,165 | | | | 2,322,114 | |
| | | | | | | | |
| | | | 6,550,444 | |
| Alaska — 1.2% | | | | | | |
Northern Tobacco Securitization Corp., Refunding RB, Tobacco Settlement, Asset-Backed, Series A: | | | | | | | | |
4.63%, 06/01/23 | | | 225 | | | | 225,043 | |
5.00%, 06/01/32 | | | 1,500 | | | | 1,492,635 | |
5.00%, 06/01/46 | | | 4,290 | | | | 4,169,022 | |
| | | | | | | | |
| | | | 5,886,700 | |
| Arizona — 2.6% | | | | | | |
Arizona IDA, Refunding RB, Series A(b): | | | | | | | | |
Basis Schools, Inc. Projects, 5.13%, 07/01/37 | | | 960 | | | | 972,989 | |
Odyssey Preparatory Academy Project, 5.50%, 07/01/52 | | | 1,500 | | | | 1,408,395 | |
City of Phoenix Arizona IDA, RB: | | | | | | | | |
Great Hearts Academies — Veritas Project, 6.40%, 07/01/21(a) | | | 425 | | | | 470,339 | |
Great Hearts Academies — Veritas Projects, 6.30%, 07/01/21(a) | | | 500 | | | | 552,055 | |
Legacy Traditional Schools Project, Series A, 6.50%, 07/01/34(b) | | | 570 | | | | 618,689 | |
Legacy Traditional Schools Projects, Series A, 6.75%, 07/01/44(b) | | | 1,000 | | | | 1,085,310 | |
City of Phoenix Arizona IDA, Refunding RB(b): | | | | | | | | |
Basis Schools, Inc. Projects, 5.00%, 07/01/35 | | | 305 | | | | 307,559 | |
Basis Schools, Inc. Projects, 5.00%, 07/01/45 | | | 855 | | | | 852,444 | |
Basis Schools, Inc. Projects, Series A, 5.00%, 07/01/35 | | | 260 | | | | 262,181 | |
Basis Schools, Inc. Projects, Series A, 5.00%, 07/01/46 | | | 290 | | | | 288,689 | |
Legacy Traditional School Projects, 5.00%, 07/01/35 | | | 320 | | | | 323,411 | |
Legacy Traditional School Projects, 5.00%, 07/01/45 | | | 255 | | | | 255,125 | |
County of La Paz IDA, RB, Imagine Schools Desert West Middle Project, 5.88%, 06/15/48(b) | | | 875 | | | | 841,733 | |
Salt Verde Financial Corp., RB, Senior, 5.00%, 12/01/37 | | | 1,650 | | | | 1,871,067 | |
State of Arizona IDA, RB, Academies of Math & Science Project, Series B, 5.13%, 07/01/47(b) | | | 665 | | | | 612,139 | |
State of Arizona IDA, Refunding RB, Basis Schools, Inc. Projects, Series A, 5.25%, 07/01/47(b) | | | 1,765 | | | | 1,788,192 | |
University Medical Center Corp., RB, 6.50%, 07/01/19(a) | | | 500 | | | | 514,580 | |
| | | | | | | | |
| | | | 13,024,897 | |
| California — 6.8% | | | | | | |
California Municipal Finance Authority, ARB, Senior Lien-Linxs APM Project, AMT, 4.00%, 12/31/47 | | | 1,650 | | | | 1,565,471 | |
California Municipal Finance Authority, RB, Urban Discovery Academy Project(b): | | | | | | | | |
5.50%, 08/01/34 | | | 315 | | | | 309,932 | |
6.00%, 08/01/44 | | | 665 | | | | 666,523 | |
6.13%, 08/01/49 | | | 580 | | | | 583,416 | |
California Municipal Finance Authority, Refunding RB, Community Medical Centers, Series A: | | | | | | | | |
5.00%, 02/01/36 | | | 345 | | | | 375,074 | |
5.00%, 02/01/37 | | | 255 | | | | 276,287 | |
California School Finance Authority, RB: | | | | | | | | |
Alliance for College Ready Public School — 2023 Union LLC Project, Series A, 6.40%, 07/01/48 | | | 1,570 | | | | 1,728,068 | |
Value Schools, 6.65%, 07/01/33 | | | 435 | | | | 479,879 | |
Value Schools, 6.90%, 07/01/43 | | | 975 | | | | 1,071,515 | |
| | | | | | | | |
| Security | | Par
(000) | | | Value | |
| California (continued) | | | | | | |
California Statewide Communities Development Authority, RB, Loma Linda University Medical Center(b): | | | | | | | | |
5.25%, 12/01/38 | | $ | 580 | | | $ | 609,841 | |
Series A, 5.00%, 12/01/46 | | | 725 | | | | 737,318 | |
Series A, 5.25%, 12/01/56 | | | 620 | | | | 639,914 | |
California Statewide Communities Development Authority, Refunding RB, American Baptist Homes of the West, 6.25%, 10/01/39 | | | 2,175 | | | | 2,252,996 | |
California Statewide Financing Authority, RB, Asset-Backed, Tobacco Settlement, Series B, 6.00%, 05/01/43 | | | 1,650 | | | | 1,649,951 | |
City & County of San Francisco California Redevelopment Agency, Tax Allocation Bonds, Mission Bay South Redevelopment Project, Series D(b)(c): | | | | | | | | |
0.00%, 08/01/26 | | | 1,250 | | | | 864,950 | |
0.00%, 08/01/43 | | | 1,500 | | | | 418,035 | |
City of San Jose California Hotel Tax, RB, Convention Center Expansion & Renovation Project: | | | | | | | | |
6.50%, 05/01/36 | | | 900 | | | | 989,613 | |
6.50%, 05/01/42 | | | 2,220 | | | | 2,441,045 | |
City of Stockton California Public Financing Authority, RB, Delta Water Supply Project, Series A, 6.25%, 10/01/40 | | | 375 | | | | 433,624 | |
County of Los Angeles California Tobacco Securitization Agency, RB, Asset-Backed, Los Angeles County Securitization Corp.: | | | | | | | | |
5.60%, 06/01/36 | | | 1,285 | | | | 1,286,709 | |
5.70%, 06/01/46 | | | 3,600 | | | | 3,602,700 | |
County of Riverside California Transportation Commission, RB, Senior Lien, Series A, 5.75%, 06/01/48 | | | 2,885 | | | | 3,137,062 | |
Golden State Tobacco Securitization Corp., Refunding RB, Series A-1, 5.25%, 06/01/47 | | | 1,120 | | | | 1,126,115 | |
Tobacco Securitization Authority of Southern California, Refunding RB, Tobacco Settlement, Asset-Backed, Senior Series A-1: | | | | | | | | |
4.75%, 06/01/25 | | | 880 | | | | 882,182 | |
5.00%, 06/01/37 | | | 5,580 | | | | 5,593,838 | |
| | | | | | | | |
| | | | 33,722,058 | |
| Colorado — 1.4% | | | | | | |
Arista Metropolitan District, GO, Refunding, Series A: | | | | | | | | |
5.00%, 12/01/38 | | | 1,240 | | | | 1,241,587 | |
5.13%, 12/01/48 | | | 880 | | | | 880,827 | |
Castle Oaks Metropolitan District No. 3, GO, 6.25%, 12/01/20(a) | | | 500 | | | | 555,065 | |
Centerra Metropolitan District No. 1, Tax Allocation Bonds, 5.00%, 12/01/47(b) | | | 575 | | | | 573,212 | |
Colorado Health Facilities Authority, Refunding RB, Sunny Vista Living Center Project, Series A, 6.13%, 12/01/45(b) | | | 335 | | | | 346,330 | |
Copperleaf Metropolitan District No. 2, GO, Refunding, 5.75%, 12/01/45 | | | 720 | | | | 747,525 | |
North Holly Metropolitan District, GOL, Series A, 5.50%, 12/01/48 | | | 500 | | | | 476,015 | |
Prairie Farm Metropolitan District, GO, Series A, 5.25%, 12/01/48 | | | 760 | | | | 732,169 | |
Regional Transportation District, RB, Denver Transit Partners Eagle P3 Project, 6.00%, 01/15/34 | | | 1,500 | | | | 1,551,810 | |
| | | | | | | | |
| | | | 7,104,540 | |
| Connecticut — 0.9% | | | | | | |
Mohegan Tribal Finance Authority, RB, 7.00%, 02/01/45(b) | | | 1,400 | | | | 1,417,668 | |
Mohegan Tribe of Indians of Connecticut, RB, Series A, 6.75%, 02/01/45(b) | | | 971 | | | | 1,032,777 | |
Mohegan Tribe of Indians of Connecticut, Refunding RB, Public Improvement, Priority Distribution, Series C, 6.25%, 02/01/30(b) | | | 1,835 | | | | 1,990,241 | |
| | | | | | | | |
| | | | 4,440,686 | |
| | |
| 20 | | 2018 BLACKROCK SEMI-ANNUAL REPORTTO SHAREHOLDERS |
| | |
Schedule of Investments (unaudited) (continued) October 31, 2018 | | BlackRock MuniAssets Fund, Inc. (MUA) (Percentages shown are based on Net Assets) |
| | | | | | | | |
| Security | | Par
(000) | | | Value | |
| Delaware — 0.9% | | | | | | |
County of Sussex Delaware, RB, NRG Energy, Inc., Indian River Power LLC Project, 6.00%, 10/01/40 | | $ | 1,000 | | | $ | 1,057,580 | |
State of Delaware EDA, RB, Exempt Facilities, Indian River Power LLC Project, 5.38%, 10/01/45 | | | 3,180 | | | | 3,298,932 | |
| | | | | | | | |
| | | | 4,356,512 | |
| Florida — 8.8% | | | | | | |
Boggy Creek Improvement District, Refunding RB, Special Assessment Bonds, 5.13%, 05/01/43 | | | 1,460 | | | | 1,442,232 | |
Capital Region Community Development District, Refunding, Special Assessment, Capital Improvement Revenue Bond, Series A-1, 5.13%, 05/01/39 | | | 1,500 | | | | 1,451,940 | |
Capital Trust Agency, Inc., RB, Silver Creek St. Augustine Project Series A(d)(e): | | | | | | | | |
1st Mortgage, 8.25%, 01/01/44 | | | 515 | | | | 360,500 | |
1st Mortgage, 8.25%, 01/01/49 | | | 1,105 | | | | 773,500 | |
5.75%, 01/01/50 | | | 655 | | | | 622,250 | |
University Bridge, LLC Student Housing Project, 5.25%, 12/01/58(b) | | | 1,910 | | | | 1,847,448 | |
County of Collier Florida IDA, Refunding RB, Arlington of Naples Project, Series A, 8.13%, 05/15/44(b) | | | 630 | | | | 607,975 | |
County of Miami-Dade Florida IDA, RB, Doral Academy Project, 5.00%, 01/15/48 | | | 915 | | | | 940,766 | |
County of Palm Beach Florida Health Facilities Authority, RB, Acts Retirement Life Community, 5.50%, 11/15/20(a) | | | 3,500 | | | | 3,727,990 | |
County of Palm Beach Florida Health Facilities Authority, Refunding RB, Series A, 7.25%, 06/01/34 | | | 500 | | | | 561,115 | |
Florida Development Finance Corp., RB: | | | | | | | | |
Renaissance Charter School, Series A, 5.75%, 06/15/29 | | | 690 | | | | 721,913 | |
Renaissance Charter School, Series A, 6.00%, 06/15/34 | | | 835 | | | | 872,492 | |
Renaissance Charter School, Series A, 6.13%, 06/15/44 | | | 3,180 | | | | 3,298,042 | |
Solid Waste Disposal Facility, Waste Pro USA, Inc. Project, AMT, 5.00%, 08/01/29(b)(f) | | | 1,550 | | | | 1,588,161 | |
Florida Higher Educational Facilities Financial Authority, RB, Jacksonville University Project, Series A-1, 5.00%, 06/01/48(b) | | | 1,115 | | | | 1,142,239 | |
Greeneway Improvement District, RB, Special Assessment Bonds, 5.13%, 05/01/43 | | | 1,820 | | | | 1,801,218 | |
Harbor Bay Community Development District Florida, Special Assessment Bonds, Series A, 7.00%, 05/01/33 | | | 380 | | | | 381,273 | |
Lakewood Ranch Stewardship District Special Assessment Bonds, Village of Lakewood Ranch Sector Projects, 4.00%, 05/01/21 | | | 105 | | | | 105,664 | |
Lakewood Ranch Stewardship District Special Assessment Bonds, Refunding, Lakewood Center & New Sector Projects, 8.00%, 05/01/40 | | | 1,485 | | | | 1,666,942 | |
Lakewood Ranch Stewardship District Special Assessment Bonds, Village of Lakewood Ranch Sector Projects: | | | | | | | | |
4.25%, 05/01/26 | | | 145 | | | | 144,356 | |
5.13%, 05/01/46 | | | 860 | | | | 845,672 | |
Mid-Bay Florida Bridge Authority, RB, Springing Lien, Series A, 7.25%, 10/01/21(a) | | | 4,550 | | | | 5,163,203 | |
Midtown Miami Community Development District, Refunding, Special Assessment Bonds: | | | | | | | | |
Series A, 5.00%, 05/01/37 | | | 845 | | | | 871,043 | |
Series B, 5.00%, 05/01/37 | | | 495 | | | | 510,256 | |
Santa Rosa Bay Bridge Authority, RB, 6.25%, 07/01/28(d)(e) | | | 3,845 | | | | 2,845,589 | |
Tolomato Community Development District, Refunding, Special Assessment Bonds(g): | | | | | | | | |
Convertible CAB, Series A3, 6.61%, 05/01/40 | | | 580 | | | | 563,853 | |
Convertible CAB, Series A4, 6.61%, 05/01/40 | | | 305 | | | | 247,950 | |
Series 2015-2, 6.61%, 05/01/40 | | | 805 | | | | 527,492 | |
Tolomato Community Development District: | | | | | | | | |
Series 1, 6.61%, 05/01/40(d)(e)(g) | | | 1,305 | | | | 1,039,354 | |
| | | | | | | | |
| Security | | Par
(000) | | | Value | |
| Florida (continued) | | | | | | |
Tolomato Community Development District (continued): | | | | | | | | |
Series 1, 6.65%, 05/01/40(d)(e) | | $ | 50 | | | $ | 47,644 | |
Series 3, 6.61%, 05/01/40(d)(e) | | | 875 | | | | 9 | |
Series 3, 6.65%, 05/01/40(d)(e) | | | 710 | | | | 7 | |
Trout Creek Community Development District, Special Assessment Bonds: | | | | | | | | |
5.38%, 05/01/38 | | | 430 | | | | 420,854 | |
5.50%, 05/01/49 | | | 1,105 | | | | 1,090,513 | |
Village Community Development District No. 9, Special Assessment Bonds: | | | | | | | | |
6.75%, 05/01/31 | | | 1,480 | | | | 1,613,688 | |
7.00%, 05/01/41 | | | 2,430 | | | | 2,706,898 | |
5.50%, 05/01/42 | | | 1,160 | | | | 1,220,517 | |
| | | | | | | | |
| | | | 43,772,558 | |
| Georgia — 1.1% | | | | | | |
County of Clayton Georgia Development Authority, Refunding RB, Delta Air Lines, Inc. Project, Series A, 8.75%, 06/01/29 | | | 3,365 | | | | 3,663,543 | |
County of Gainesville & Hall Georgia Development Authority, Refunding RB, Acts Retirement Life Community, Series A-2(a): | | | | | | | | |
6.38%, 11/15/19 | | | 700 | | | | 730,429 | |
6.63%, 11/15/19 | | | 880 | | | | 920,409 | |
| | | | | | | | |
| | | | 5,314,381 | |
| Guam — 0.3% | | | | | | |
Territory of Guam, GO, Series A: | | | | | | | | |
6.00%, 11/15/19 | | | 140 | | | | 141,749 | |
7.00%, 11/15/19(a) | | | 1,115 | | | | 1,171,753 | |
| | | | | | | | |
| | | | 1,313,502 | |
| Illinois — 6.6% | | | | | | |
Chicago Board of Education, GO: | | | | | | | | |
Series H, 5.00%, 12/01/46 | | | 720 | | | | 719,957 | |
Project, Series C, 5.25%, 12/01/35 | | | 1,655 | | | | 1,685,071 | |
Chicago Board of Education, GO, Refunding, Series B, 4.00%, 12/01/35 | | | 745 | | | | 669,591 | |
Chicago Board of Education, GO, Dedicated Revenues: | | | | | | | | |
Series A, 5.00%, 12/01/42 | | | 1,020 | | | | 1,003,129 | |
Refunding, 5.00%, 12/01/27 | | | 900 | | | | 930,492 | |
Refunding, 5.00%, 12/01/31 | | | 1,000 | | | | 1,020,450 | |
Refunding Series F, 5.00%, 12/01/22 | | | 675 | | | | 700,157 | |
Refunding Series G, 5.00%, 12/01/44 | | | 2,150 | | | | 2,153,032 | |
City of Chicago Illinois, GO, Refunding, Series A, 6.00%, 01/01/38 | | | 1,260 | | | | 1,397,844 | |
Illinois Finance Authority, Refunding RB: | | | | | | | | |
Friendship Village of Schaumburg, 7.25%, 02/15/20(a) | | | 4,000 | | | | 4,246,680 | |
Lutheran Home & Services Obligated Group, 5.63%, 05/15/42 | | | 2,395 | | | | 2,471,856 | |
Primary Health Care Centers Program, 6.60%, 07/01/24 | | | 780 | | | | 770,515 | |
Rogers Park Montessori School Project, Series 2014, 6.00%, 02/01/34 | | | 365 | | | | 376,366 | |
Rogers Park Montessori School Project, Series 2014, 6.13%, 02/01/45 | | | 860 | | | | 883,728 | |
Roosevelt University Project, 6.50%, 10/01/19(a) | | | 2000 | | | | 2,079,760 | |
Metropolitan Pier & Exposition Authority, RB, Series A, McCormick Place Expansion Project: | | | | | | | | |
Bonds, 0.00%, 12/15/56(c) | | | 5,005 | | | | 639,739 | |
5.50%, 06/15/53 | | | 2,370 | | | | 2,501,061 | |
Metropolitan Pier & Exposition Authority, Refunding RB, McCormick Place Expansion Project Bonds, Series B, 0.00%, 12/15/54(c) | | | 6,980 | | | | 993,882 | |
Railsplitter Tobacco Settlement Authority, RB(a): | | | | | | | | |
5.50%, 06/01/21 | | | 180 | | | | 194,348 | |
6.00%, 06/01/21 | | | 710 | | | | 775,441 | |
| | | | |
| SCHEDULES OF INVESTMENTS | | | 21 | |
| | |
Schedule of Investments (unaudited) (continued) October 31, 2018 | | BlackRock MuniAssets Fund, Inc. (MUA) (Percentages shown are based on Net Assets) |
| | | | | | | | |
| Security | | Par
(000) | | | Value | |
| Illinois (continued) | | | | | | |
State of Illinois, GO: | | | | | | | | |
Series A, 5.00%, 01/01/33 | | $ | 740 | | | $ | 750,752 | |
Series D, 5.00%, 11/01/28 | | | 1,365 | | | | 1,405,868 | |
5.25%, 02/01/29 | | | 1,000 | | | | 1,041,750 | |
State of Illinois, GO, Refunding, Series B, 5.00%, 10/01/29 | | | 1,975 | | | | 2,026,172 | |
Village of Lincolnshire Illinois, Special Tax Bonds, Sedgebrook Project, 6.25%, 03/01/34 | | | 1,659 | | | | 1,662,102 | |
| | | | | | | | |
| | | | 33,099,743 | |
| Indiana — 2.5% | | | | | | |
City of Valparaiso Indiana, RB, Exempt Facilities, Pratt Paper LLC Project, AMT: | | | | | | | | |
6.75%, 01/01/34 | | | 825 | | | | 942,241 | |
7.00%, 01/01/44 | | | 2,000 | | | | 2,295,360 | |
City of Vincennes Indiana, Refunding RB, Southwest Indiana Regional Youth Village Project, 6.25%, 01/01/29(b) | | | 2,315 | | | | 2,354,540 | |
County of Allen Indiana, RB, StoryPoint Fort Wayne Project, Series A-1(b): | | | | | | | | |
6.63%, 01/15/34 | | | 290 | | | | 303,868 | |
6.75%, 01/15/43 | | | 525 | | | | 549,118 | |
6.88%, 01/15/52 | | | 2,450 | | | | 2,567,600 | |
Indiana Finance Authority, RB, Private Activity Bond, Ohio River Bridges East End Crossing Project, Series A, AMT: | | | | | | | | |
5.00%, 07/01/44 | | | 470 | | | | 492,034 | |
5.00%, 07/01/48 | | | 1,555 | | | | 1,623,840 | |
Town of Chesterton Indiana, RB, StoryPoint Chesterton Project, Series A-1, 6.38%, 01/15/51(b) | | | 1,190 | | | | 1,209,968 | |
| | | | | | | | |
| | | | 12,338,569 | |
| Iowa — 2.3% | | | | | | |
Iowa Finance Authority, Refunding RB: | | | | | | | | |
Iowa Fertilizer Co. Project, Series B, 5.25%, 12/01/50(f) | | | 2,085 | | | | 2,214,103 | |
Midwestern Disaster Area, Iowa Fertilizer Co. Project, 5.50%, 12/01/22 | | | 5 | | | | 5,010 | |
Midwestern Disaster Area, Iowa Fertilizer Co. Project, 5.25%, 12/01/25 | | | 2,190 | | | | 2,313,625 | |
Sunrise Retirement Community Project, 5.50%, 09/01/37 | | | 1,355 | | | | 1,363,713 | |
Iowa Tobacco Settlement Authority, Refunding RB: | | | | | | | | |
Asset-Backed, CAB, Series B, 5.60%, 06/01/34 | | | 795 | | | | 797,250 | |
Series C, 5.38%, 06/01/38 | | | 4,900 | | | | 4,912,789 | |
| | | | | | | | |
| | | | 11,606,490 | |
| Kentucky — 0.9% | | | | | | |
Kentucky Public Transportation Infrastructure Authority, RB, Downtown Crossing, First Tier, Series A, 5.75%, 07/01/49 | | | 4,000 | | | | 4,289,640 | |
| | | | | | | | |
| Louisiana — 2.0% | | | | | | |
Juban Crossing Economic Development District, Refunding RB, General Infrastructure Project, Series C, 7.00%, 09/15/44(b) | | | 2,460 | | | | 2,526,174 | |
Louisiana Public Facilities Authority, RB, Belle Chasse Educational Foundation Project, 6.75%, 05/01/41 | | | 1,745 | | | | 1,822,932 | |
Tobacco Settlement Financing Corp., Refunding RB, Asset-Backed, Series A, 5.25%, 05/15/35 | | | 5,570 | | | | 5,894,731 | |
| | | | | | | | |
| | | | 10,243,837 | |
| Maine — 0.6% | | | | | | |
Maine Health & Higher Educational Facilities Authority, RB, Maine General Medical Center, 6.75%, 07/01/41 | | | 2,955 | | | | 3,134,398 | |
| | | | | | | | |
| Maryland — 2.5% | | | | | | |
County of Frederick Maryland, RB, Jefferson Technology Park Project, Series B, 7.13%, 07/01/43(b) | | | 2,835 | | | | 3,002,860 | |
Maryland EDC, RB: | | | | | | | | |
Purple Line Light Rail Project, AMT, 5.00%, 03/31/51 | | | 2,185 | | | | 2,291,060 | |
| | | | | | | | |
| Security | | Par
(000) | | | Value | |
| Maryland (continued) | | | | | | |
Maryland EDC, RB (continued): | | | | | | | | |
Transportation Facilities Project, Series A, 5.75%, 06/01/20(a) | | $ | 3,615 | | | $ | 3,820,151 | |
Maryland EDC, Refunding RB, CNX Marine Terminals, Inc., 5.75%, 09/01/25 | | | 3,085 | | | | 3,185,263 | |
| | | | | | | | |
| | | | 12,299,334 | |
| Massachusetts — 1.0% | | | | | | |
Massachusetts Development Finance Agency, RB, Series A(a): | | | | | | | | |
Foxborough Regional Charter School, 7.00%, 07/01/20 | | | 1,025 | | | | 1,105,965 | |
North Hill Communities Issue, 6.50%, 11/15/23(b) | | | 2,020 | | | | 2,396,932 | |
Massachusetts Development Finance Agency, Refunding RB, Tufts Medical Center, Series I: | | | | | | | | |
6.75%, 01/01/21(a) | | | 895 | | | | 979,962 | |
6.75%, 01/01/36 | | | 595 | | | | 647,390 | |
| | | | | | | | |
| | | | 5,130,249 | |
| Michigan — 0.9% | | | | | | |
City of Detroit Michigan Sewage Disposal System, Refunding RB, Senior Lien, Series A, 5.25%, 07/01/39 | | | 2,785 | | | | 2,948,145 | |
Michigan Finance Authority, RB, Detroit Water & Sewage Disposal System, Senior Lien, Series 2014 C-2, AMT, 5.00%, 07/01/44 | | | 415 | | | | 434,904 | |
Michigan Finance Authority, Refunding RB, Detroit Water & Sewage Department Project, Senior Lien, Series C-1, 5.00%, 07/01/44 | | | 920 | | | | 972,541 | |
| | | | | | | | |
| | | | 4,355,590 | |
| Minnesota — 0.1% | | | | | | |
St. Paul Housing & Redevelopment Authority, Refunding RB, Hmong College Prep Academy Project, Series A: | | | | | | | | |
5.75%, 09/01/46 | | | 195 | | | | 201,304 | |
6.00%, 09/01/51 | | | 290 | | | | 302,093 | |
| | | | | | | | |
| | | | 503,397 | |
| Missouri — 0.9% | | | | | | |
City of St. Louis Missouri IDA, Refunding RB, BallPark Village Development Project, Series A: | | | | | | | | |
4.38%, 11/15/35 | | | 685 | | | | 687,528 | |
4.75%, 11/15/47 | | | 760 | | | | 764,530 | |
Kirkwood Missouri IDA, RB, Aberdeen Heights, Series A, 8.25%, 05/15/20(a) | | | 2,315 | | | | 2,520,595 | |
Lees Summit Missouri IDA, RB, John Knox Obligated Group, 5.25%, 08/15/39 | | | 450 | | | | 456,457 | |
| | | | | | | | |
| | | | 4,429,110 | |
| New Hampshire — 0.3% | | | | | | |
New Hampshire Business Finance Authority, Refunding RB, Resource Recovery, Covanta Project(b): | | | | | | | | |
Series B, 4.63%, 11/01/42 | | | 1,015 | | | | 982,824 | |
Series C, AMT, 4.88%, 11/01/42 | | | 485 | | | | 473,273 | |
| | | | | | | | |
| | | | 1,456,097 | |
| New Jersey — 3.7% | | | | | | |
Casino Reinvestment Development Authority, Refunding RB: | | | | | | | | |
5.25%, 11/01/39 | | | 1,065 | | | | 1,123,170 | |
5.25%, 11/01/44 | | | 770 | | | | 809,971 | |
County of Essex New Jersey Improvement Authority, RB, AMT, 5.25%, 07/01/45(b) | | | 1,150 | | | | 1,153,542 | |
New Jersey EDA, RB: | | | | | | | | |
Goethals Bridge Replacement Project, AMT, Private Activity Bond, 5.38%, 01/01/43 | | | 2,155 | | | | 2,305,376 | |
Kapkowski Road Landfill Project, Series B, AMT, 6.50%, 04/01/31 | | | 2,250 | | | | 2,496,443 | |
Provident Group-Kean Properties, Series A, 5.00%, 07/01/32 | | | 165 | | | | 176,624 | |
| | |
| 22 | | 2018 BLACKROCK SEMI-ANNUAL REPORTTO SHAREHOLDERS |
| | |
Schedule of Investments (unaudited) (continued) October 31, 2018 | | BlackRock MuniAssets Fund, Inc. (MUA) (Percentages shown are based on Net Assets) |
| | | | | | | | |
| Security | | Par
(000) | | | Value | |
| New Jersey (continued) | | | | | | |
New Jersey EDA, RB (continued): | | | | | | | | |
Provident Group-Kean Properties, Series A, 5.00%, 07/01/37 | | $ | 260 | | | $ | 274,235 | |
State Housing Project, Series B, 5.00%, 06/15/43 | | | 2,245 | | | | 2,326,089 | |
Team Academy Charter School Project, 6.00%, 10/01/43 | | | 1,530 | | | | 1,644,046 | |
New Jersey EDA, Refunding RB, Greater Brunswick Charter School, Inc. Project, Series A, 6.00%, 08/01/49(b) | | | 500 | | | | 495,785 | |
New Jersey Health Care Facilities Financing Authority, Refunding RB, St. Barnabas Health Care System, Series A, 5.63%, 07/01/21(a) | | | 2,650 | | | | 2,880,630 | |
New Jersey Transportation Trust Fund Authority, RB, Transportation Program, Series AA, 5.25%, 06/15/41 | | | 1,140 | | | | 1,193,067 | |
Tobacco Settlement Financing Corp., Refunding RB: | | | | | | | | |
Series A, 5.25%, 06/01/46 | | | 590 | | | | 623,636 | |
Sub-Series B, 5.00%, 06/01/46 | | | 830 | | | | 840,690 | |
| | | | | | | | |
| | | | 18,343,304 | |
| New Mexico — 0.6% | | | | | | |
New Mexico Hospital Equipment Loan Council, Refunding RB, Gerald Champion Regional Medical Center Project, 5.50%, 07/01/42 | | | 2,970 | | | | 3,143,092 | |
| | | | | | | | |
| New York — 6.7% | | | | | | |
Counties of New York Tobacco Trust IV, Refunding RB, Settlement Pass-Through Turbo, Series A: | | | | | | | | |
6.25%, 06/01/41(b) | | | 5,300 | | | | 5,453,594 | |
5.00%, 06/01/42 | | | 3,155 | | | | 3,036,530 | |
5.00%, 06/01/45 | | | 1,185 | | | | 1,131,319 | |
Counties of New York Tobacco Trust VI, Refunding RB, Tobacco Settlement Pass-Through: | | | | | | | | |
Series A-2B, 5.00%, 06/01/51 | | | 1,900 | | | | 1,940,793 | |
Series B, 5.00%, 06/01/45 | | | 2,655 | | | | 2,765,342 | |
County of Dutchess New York Industrial Development Agency, Refunding RB, Bard College Civic Facility, Series A-1, 5.00%, 08/01/46 | | | 970 | | | | 911,800 | |
County of Westchester New York Healthcare Corp., RB, Senior Lien, Series A, 5.00%, 11/01/44 | | | 1,286 | | | | 1,339,794 | |
Erie Tobacco Asset Securitization Corp., Refunding RB, Asset-Backed, Series A, 5.00%, 06/01/45 | | | 2,890 | | | | 2,779,746 | |
Metropolitan Transportation Authority, RB, Series C: | | | | | | | | |
6.50%, 11/15/18(a) | | | 1,490 | | | | 1,492,593 | |
6.50%, 11/15/18(a) | | | 125 | | | | 125,218 | |
6.50%, 11/15/28 | | | 385 | | | | 385,662 | |
New York Liberty Development Corp., Refunding RB: | | | | | | | | |
2nd Priority, Bank of America Tower at One Bryant Park Project, Class 3, 6.38%, 07/15/49 | | | 1,270 | | | | 1,319,581 | |
3 World Trade Center Project, Class 1,
5.00%, 11/15/44(b) | | | 4,705 | | | | 4,818,061 | |
3 World Trade Center Project, Class 2,
5.15%, 11/15/34(b) | | | 455 | | | | 469,019 | |
3 World Trade Center Project, Class 2,
5.38%, 11/15/40(b) | | | 1,080 | | | | 1,112,184 | |
3 World Trade Center Project, Class 3, 7.25%, 11/15/44(b) | | | 1,565 | | | | 1,800,063 | |
Port Authority of New York & New Jersey, ARB, Special Project, JFK International Air Terminal LLC Project, Series 8, 6.00%, 12/01/36 | | | 1,340 | | | | 1,436,453 | |
State of New York Dormitory Authority, Refunding RB, Orange Regional Medical Center, 5.00%, 12/01/33(b) | | | 955 | | | | 1,031,677 | |
| | | | | | | | |
| | | | 33,349,429 | |
| North Carolina — 0.8% | | | | | | |
North Carolina Medical Care Commission, Refunding RB, 1st Mortgage, Series A(a): | | | | | | | | |
Deerfield Project, 6.13%, 11/01/18 | | | 1,230 | | | | 1,230,000 | |
| | | | | | | | |
| Security | | Par
(000) | | | Value | |
| North Carolina (continued) | | | | | | |
North Carolina Medical Care Commission, Refunding RB, 1st Mortgage, Series A(a) (continued): | | | | | | | | |
Retirement Facilities Whitestone Project, 7.75%, 03/01/21 | | $ | 1,000 | | | $ | 1,121,240 | |
Retirement Facilities Whitestone Project, 7.75%, 03/01/21 | | | 1,420 | | | | 1,592,161 | |
| | | | | | | | |
| | | | 3,943,401 | |
| Ohio — 3.2% | | | | | | |
Buckeye Tobacco Settlement Financing Authority, RB, Asset-Backed, Series A-2: | | | | | | | | |
Senior Turbo Term, 5.75%, 06/01/34 | | | 6,745 | | | | 6,494,828 | |
Senior Turbo Term, 5.88%, 06/01/47 | | | 5,570 | | | | 5,408,414 | |
6.00%, 06/01/42 | | | 3,040 | | | | 2,990,874 | |
County of Hamilton Ohio, Refunding RB, Improvement-Life Enriching Communities, 5.00%, 01/01/46 | | | 875 | | | | 889,157 | |
| | | | | | | | |
| | | | 15,783,273 | |
| Oklahoma — 1.4% | | | | | | |
County of Tulsa Oklahoma Industrial Authority, Refunding RB, Montereau, Inc. Project, 5.25%, 11/15/37 | | | 750 | | | | 810,638 | |
Oklahoma Development Finance Authority, RB, OU Medicine Project, Series B: | | | | | | | | |
5.00%, 08/15/38 | | | 2,990 | | | | 3,136,061 | |
5.25%, 08/15/43 | | | 2,690 | | | | 2,856,861 | |
| | | | | | | | |
| | | | 6,803,560 | |
| Oregon — 0.8% | | | | | | |
County of Multnomah Oregon Hospital Facilities Authority, Refunding RB, Mirabella at South Waterfront, 5.50%, 10/01/49 | | | 1,765 | | | | 1,849,155 | |
Polk County Hospital Facility Authority, RB, Dallas Retirement Village Project, Series A: | | | | | | | | |
5.13%, 07/01/35 | | | 620 | | | | 631,334 | |
5.38%, 07/01/45 | | | 1,435 | | | | 1,473,257 | |
| | | | | | | | |
| | | | 3,953,746 | |
| Pennsylvania — 4.2% | | | | | | |
Allentown Neighborhood Improvement Zone Development Authority, Refunding RB, Series A, 5.00%, 05/01/42 | | | 2,140 | | | | 2,181,195 | |
City of Philadelphia Pennsylvania Hospitals & Higher Education Facilities Authority, RB, Temple University Health System, Series A, 5.63%, 07/01/36 | | | 2,000 | | | | 2,111,720 | |
Commonwealth Financing Authority, RB, Tobacco Master Settlement Payment: | | | | | | | | |
5.00%, 06/01/33 | | | 115 | | | | 126,283 | |
5.00%, 06/01/34 | | | 150 | | | | 164,211 | |
County of Cumberland Pennsylvania Municipal Authority, Refunding RB, Diakon Lutheran: | | | | | | | | |
6.38%, 01/01/19(a) | | | 5,550 | | | | 5,588,794 | |
6.38%, 01/01/39 | | | 615 | | | | 619,452 | |
County of Lehigh Pennsylvania General Purpose Authority, Refunding RB, Bible Fellowship Church Homes, 5.13%, 07/01/32 | | | 1,800 | | | | 1,804,932 | |
County of Montgomery Higher Education & Health Authority, Refunding RB, Thomas Jefferson University, Series A: | | | | | | | | |
4.00%, 09/01/49 | | | 620 | | | | 590,401 | |
5.00%, 09/01/43 | | | 1,365 | | | | 1,474,978 | |
County of Montgomery Pennsylvania IDA, Refunding RB, Whitemarsh Continuing Care Retirement Community Project, 5.38%, 01/01/50 | | | 1,135 | | | | 1,115,535 | |
County of Northampton Pennsylvania IDA, Route 33 Project, Tax Allocation Bonds, 7.00%, 07/01/32 | | | 1,945 | | | | 2,173,343 | |
Pennsylvania Economic Development Financing Authority, Refunding RB, National Gypsum Co., AMT, 5.50%, 11/01/44 | | | 2,710 | | | | 2,800,704 | |
| | | | | | | | |
| | | | 20,751,548 | |
| | | | |
| SCHEDULES OF INVESTMENTS | | | 23 | |
| | |
Schedule of Investments (unaudited) (continued) October 31, 2018 | | BlackRock MuniAssets Fund, Inc. (MUA) (Percentages shown are based on Net Assets) |
| | | | | | | | |
| Security | | Par
(000) | | | Value | |
| Puerto Rico — 2.5% | | | | | | |
Children’s Trust Fund, Refunding RB, Tobacco Settlement Asset-Backed Bonds: | | | | | | | | |
5.50%, 05/15/39 | | $ | 635 | | | $ | 644,017 | |
5.63%, 05/15/43 | | | 2,145 | | | | 2,174,193 | |
Commonwealth of Puerto Rico, GO, Refunding, Series A(d)(e): | | | | | | | | |
Public Improvement, 5.50%, 07/01/39 | | | 665 | | | | 389,025 | |
8.00%, 07/01/35 | | | 1,765 | | | | 1,041,350 | |
Commonwealth of Puerto Rico, GO, , 6.00%, 07/01/38(d)(e) | | | 750 | | | | 450,000 | |
Commonwealth of Puerto Rico Aqueduct & Sewer Authority, RB, Senior Lien, Series A, 6.00%, 07/01/44 | | | 1,445 | | | | 1,372,750 | |
Commonwealth of Puerto Rico Aqueduct & Sewer Authority, Refunding RB, Senior Lien, Series A, 6.00%, 07/01/38 | | | 2,215 | | | | 2,104,250 | |
Puerto Rico Commonwealth Aqueduct & Sewer Authority, RB, Senior Lien, Series A, 5.75%, 07/01/37 | | | 3,355 | | | | 3,145,312 | |
Puerto Rico Electric Power Authority, RB(d)(e): | | | | | | | | |
Series A, 5.00%, 07/01/29 | | | 660 | | | | 419,100 | |
Series A, 7.00%, 07/01/33 | | | 210 | | | | 135,450 | |
Series A, 5.00%, 07/01/42 | | | 640 | | | | 406,400 | |
Series TT, 5.00%, 07/01/25 | | | 100 | | | | 63,500 | |
Series XX, 5.25%, 07/01/40 | | | 445 | | | | 283,688 | |
Puerto Rico Electric Power Authority, Refunding RB, Series ZZ, 5.25%, 07/01/21 | | | 50 | | | | 31,875 | |
| | | | | | | | |
| | | | 12,660,910 | |
| Rhode Island — 2.2% | | | | | | |
Central Falls Detention Facility Corp., Refunding RB, 7.25%, 07/15/35(d)(e) | | | 4,190 | | | | 754,200 | |
Tobacco Settlement Financing Corp., Refunding RB: | | | | | | | | |
Series A, 5.00%, 06/01/35 | | | 1,000 | | | | 1,052,000 | |
Series A, 5.00%, 06/01/40 | | | 980 | | | | 1,019,494 | |
Series B, 4.50%, 06/01/45 | | | 5,055 | | | | 4,985,393 | |
Series B, 5.00%, 06/01/50 | | | 3,330 | | | | 3,414,282 | |
| | | | | | | | |
| | | | 11,225,369 | |
| South Carolina — 0.7% | | | | | | |
State of South Carolina Public Service Authority, RB, Series E, 5.50%, 12/01/53 | | | 3,275 | | | | 3,454,044 | |
| | | | | | | | |
| Tennessee — 0.4% | | | | | | |
County of Memphis-Shelby Tennessee Industrial Development Board, Refunding, Tax Allocation Bonds, Senior Tax Increment, Graceland Project, Series A: | | | | | | | | |
5.50%, 07/01/37 | | | 925 | | | | 972,397 | |
5.63%, 01/01/46 | | | 1,085 | | | | 1,129,810 | |
| | | | | | | | |
| | | | 2,102,207 | |
| Texas — 10.2% | | | | | | |
Central Texas Regional Mobility Authority, Refunding RB: | | | | | | | | |
CAB, 0.00%, 01/01/28(c) | | | 1,000 | | | | 711,440 | |
CAB, 0.00%, 01/01/29(c) | | | 2,000 | | | | 1,357,380 | |
CAB, 0.00%, 01/01/30(c) | | | 1,170 | | | | 757,692 | |
CAB, 0.00%, 01/01/33(c) | | | 3,690 | | | | 2,045,256 | |
CAB, 0.00%, 01/01/34(c) | | | 4,000 | | | | 2,101,480 | |
Senior Lien, 6.25%, 01/01/21(a) | | | 2,210 | | | | 2,392,192 | |
City of Houston Texas Airport System, Refunding ARB, AMT: | | | | | | | | |
Special Facilities, Continental Airlines, Inc., Series A, 6.63%, 07/15/38 | | | 2,890 | | | | 3,107,646 | |
United Airlines, Inc. Terminal E Project, 5.00%, 07/01/29 | | | 910 | | | | 967,039 | |
Clifton Higher Education Finance Corp., ERB, Idea Public Schools(a): | | | | | | | | |
5.50%, 08/15/21 | | | 955 | | | | 1,034,017 | |
5.75%, 08/15/21 | | | 720 | | | | 784,397 | |
County of Bexar Texas Health Facilities Development Corp., RB, Army Retirement Residence Project,
6.20%, 07/01/20(a) | | | 5,040 | | | | 5,359,738 | |
| | | | | | | | |
| Security | | Par
(000) | | | Value | |
| Texas (continued) | | | | | | |
County of Harris Texas Cultural Education Facilities Finance Corp., RB, 1st Mortgage, Brazos Presbyterian Homes, Inc. Project, Series B, 7.00%, 01/01/23(a) | | $ | 475 | | | $ | 559,009 | |
County of Matagorda Texas Navigation District No. 1, Refunding RB, Central Power & Light Co., Project, Series A, 6.30%, 11/01/29 | | | 2,090 | | | | 2,185,429 | |
County of Tarrant Texas Cultural Education Facilities Finance Corp., RB, Senior Living Center Project, Series A, 8.25%, 11/15/44 | | | 4,200 | | | | 4,066,440 | |
County of Tarrant Texas Cultural Education Facilities Finance Corp., Refunding RB, Trinity Terrace Project, 5.00%, 10/01/49 | | | 865 | | | | 899,038 | |
County of Travis Texas Health Facilities Development Corp., Refunding RB, 7.13%, 01/01/21(a) | | | 3,080 | | | | 3,390,433 | |
Mesquite Health Facility Development Corp., Refunding RB, 5.13%, 02/15/42 | | | 810 | | | | 818,335 | |
Mission Economic Development Corp., Refunding RB, Senior Lien, Natural Gasoline Project, AMT, 4.63%, 10/01/31(b)(h) | | | 890 | | | | 886,965 | |
Mission Texas Economic Development Corp., RB, Senior Lien, Natural Gasoline Project, Series B, AMT,
5.75%, 10/01/31(b) | | | 1,325 | | | | 1,365,081 | |
New Hope Cultural Education Facilities Corp., RB, Stephenville LLC Tarleton State University Project: | | | | | | | | |
5.88%, 04/01/36 | | | 1,210 | | | | 1,311,616 | |
6.00%, 04/01/45 | | | 1,845 | | | | 1,996,751 | |
New Hope Cultural Education Facilities Finance Corp., RB, Legacy Midtown Park Project, Series A, 5.50%, 07/01/54 | | | 260 | | | | 249,790 | |
Newark Higher Education Finance Corp., RB, Series A(b): | | | | | | | | |
5.50%, 08/15/35 | | | 290 | | | | 300,768 | |
5.75%, 08/15/45 | | | 580 | | | | 603,032 | |
North Texas Education Finance Corp., ERB, Uplift Education, Series A, 5.25%, 12/01/47 | | | 1,600 | | | | 1,660,640 | |
Red River Health Facilities Development Corp., First MRB, Project: | | | | | | | | |
Eden Home, Inc., 7.25%, 12/15/42(d)(e) | | | 2,895 | | | | 1,802,137 | |
Wichita Falls Retirement Foundation, 5.13%, 01/01/41 | | | 900 | | | | 913,446 | |
Texas Private Activity Bond Surface Transportation Corp., RB, Senior Lien: | | | | | | | | |
LBJ Infrastructure Group LLC, 7.00%, 06/30/40 | | | 3,775 | | | | 4,018,978 | |
NTE Mobility Partners LLC, North Tarrant Express Managed Lanes Project, 6.88%, 12/31/39 | | | 3,000 | | | | 3,136,050 | |
| | | | | | | | |
| | | | 50,782,215 | |
| Utah — 0.6% | | | | | | |
State of Utah Charter School Finance Authority, Refunding RB, 6.75%, 10/15/43 | | | 2,950 | | | | 2,952,360 | |
| | | | | | | | |
| Vermont — 0.2% | | | | | | |
Vermont EDA, Refunding, MRB, Wake Robin Corp. Project, 5.40%, 05/01/33 | | | 770 | | | | 803,072 | |
| | | | | | | | |
| Virginia — 2.3% | | | | | | |
Lower Magnolia Green Community Development Authority, Special Assessment Bonds(b): | | | | | | | | |
5.00%, 03/01/35 | | | 495 | | | | 492,233 | |
5.00%, 03/01/45 | | | 505 | | | | 492,688 | |
Mosaic District Community Development Authority, Special Assessment, Series A: | | | | | | | | |
6.63%, 03/01/26 | | | 1,485 | | | | 1,581,718 | |
6.88%, 03/01/36 | | | 1,300 | | | | 1,388,569 | |
Tobacco Settlement Financing Corp., Refunding RB, Senior Series B-1, 5.00%, 06/01/47 | | | 2,355 | | | | 2,307,170 | |
Virginia College Building Authority, RB, Marymount University Project, Series B, 5.00%, 07/01/45(b) | | | 535 | | | | 544,058 | |
| | |
| 24 | | 2018 BLACKROCK SEMI-ANNUAL REPORTTO SHAREHOLDERS |
| | |
Schedule of Investments (unaudited) (continued) October 31, 2018 | | BlackRock MuniAssets Fund, Inc. (MUA) (Percentages shown are based on Net Assets) |
| | | | | | | | |
| Security | | Par
(000) | | | Value | |
| Virginia (continued) | |
Virginia Small Business Financing Authority, RB, Senior Lien, Elizabeth River Crossings OpCo LLC Project, AMT, 6.00%, 01/01/37 | | $ | 4,440 | | | $ | 4,831,075 | |
| | | | | | | | |
| | | | | | | 11,637,511 | |
| Washington — 0.8% | |
County of King Washington Public Hospital District No. 4, GO, Refunding, Snoqualmie Valley Hospital, 7.00%, 12/01/40 | | | 1,455 | | | | 1,480,986 | |
Greater Wenatchee Regional Events Center Public Facilities District, Refunding RB, Series A, 5.50%, 09/01/42 | | | 1,495 | | | | 1,509,247 | |
Washington State Housing Finance Commission, Refunding RB(b): | | | | | | | | |
5.75%, 01/01/35 | | | 315 | | | | 310,414 | |
6.00%, 01/01/45 | | | 850 | | | | 842,163 | |
| | | | | | | | |
| | | | | | | 4,142,810 | |
| Wisconsin — 1.4% | |
Public Finance Authority, RB: | | | | | | | | |
Alabama Proton Therapy Center, Series A, 6.25%, 10/01/31(b) | | | 605 | | | | 575,658 | |
Alabama Proton Therapy Center, Series A, 7.00%, 10/01/47(b) | | | 605 | | | | 576,934 | |
Delray Beach Radiation Therapy, 6.85%, 11/01/46(b) | | | 900 | | | | 904,941 | |
Delray Beach Radiation Therapy, 7.00%, 11/01/46(b) | | | 570 | | | | 578,345 | |
Series A, 5.00%, 12/01/45 | | | 1,505 | | | | 1,526,431 | |
Series A, 5.15%, 12/01/50 | | | 1,170 | | | | 1,190,077 | |
Wisconsin Health & Educational Facilities Authority, Refunding RB: | | | | | | | | |
Benevolent Corporation Cedar Community, 5.00%, 06/01/41 | | | 225 | | | | 227,898 | |
St. Johns Communities, Inc., Series A,
7.25%, 09/15/19(a) | | | 425 | | | | 443,819 | |
St. Johns Communities, Inc., Series A,
7.63%, 09/15/19(a) | | | 855 | | | | 895,604 | |
| | | | | | | | |
| | | | | | | 6,919,707 | |
| | | | | | | | |
Total Municipal Bonds — 88.6%
(Cost — $425,243,040) | | | | 441,124,290 | |
| | | | | | | | |
|
Municipal Bonds Transferred to Tender Option Bond Trusts(i) | |
| | |
Colorado — 2.4% | | | | | | | | |
Colorado Health Facilities Authority, Refunding RB, Sisters of Leavenworth Health System, Series A, 5.00%, 01/01/40 | | | 11,468 | | | | 11,766,090 | |
| | | | | | | | |
| Illinois — 2.9% | | | | | | |
Illinois Finance Authority, RB, The Carle Foundation, Series A (AGM), 6.00%, 08/15/41 | | | 7,180 | | | | 7,762,119 | |
Illinois Finance Authority, Refunding RB, Presence Health Network, Series C, 4.00%, 02/15/41 | | | 1,499 | | | | 1,440,865 | |
State of Illinois Toll Highway Authority, RB, Series A, 5.00%, 01/01/40 | | | 5,056 | | | | 5,491,295 | |
| | | | | | | | |
| | | | | | | 14,694,279 | |
| Massachusetts — 0.5% | | | | | | |
Commonwealth of Massachusetts Transportation Fund Revenue, RB, Rail Enhancement Program, Series A, 4.00%, 06/01/45 | | | 2,268 | | | | 2,272,966 | |
| | | | | | | | |
| New York — 14.8% | | | | | | |
City of New York Housing Development Corp., RB, M/F: | | | | | | | | |
Housing, Series D-1, Class B, 4.25%, 11/01/45 | | | 8,996 | | | | 9,034,050 | |
Series C-1A, 4.15%, 11/01/39 | | | 1,893 | | | | 1,913,680 | |
Series C-1A, 4.20%, 11/01/44 | | | 3,470 | | | | 3,507,709 | |
Series C-1A, 4.30%, 11/01/47 | | | 2,840 | | | | 2,870,479 | |
| | | | | | | | |
| Security | | Par
(000) | | | Value | |
| New York (continued) | | | | | | |
City of New York Water & Sewer System, Refunding RB, 2nd General Resolution: | | | | | | | | |
Series HH, 5.00%, 06/15/31(j) | | $ | 8,610 | | | $ | 9,141,093 | |
Fiscal 2013, Series CC, 5.00%, 06/15/47 | | | 14,181 | | | | 15,523,310 | |
Hudson Yards Infrastructure Corp., RB, Senior-Fiscal 2012(j): | | | | | | | | |
5.75%, 02/15/21(a) | | | 2,798 | | | | 3,009,925 | |
5.75%, 02/15/47 | | | 1,721 | | | | 1,851,615 | |
New York Liberty Development Corp., ARB, 1 World Trade Center Port Authority Consolidated Bonds, 5.25%, 12/15/43 | | | 18,104 | | | | 19,515,114 | |
New York Liberty Development Corp., Refunding RB, 4 World Trade Center Project, 5.75%, 11/15/51(j) | | | 6,600 | | | | 7,183,998 | |
| | | | | | | | |
| | | | 73,550,973 | |
| Pennsylvania — 0.6% | | | | | | |
Pennsylvania Turnpike Commission, RB, Sub-Series A, 5.50%, 12/01/42 | | | 2,505 | | | | 2,804,172 | |
| | | | | | | | |
| Rhode Island — 0.3% | | | | | | |
Narragansett Bay Commission, Refunding RB, Wastewater System, Series A, 4.00%, 09/01/43 | | | 1,710 | | | | 1,712,331 | |
| | | | | | | | |
| Texas — 0.4% | | | | | | |
Lower Colorado River Authority, Refunding RB, LCRA Transmission Services Corporation Project, 4.00%, 05/15/43 | | | 2,271 | | | | 2,249,573 | |
| | | | | | | | |
| Washington — 1.7% | | | | | | |
City of Bellingham Washington Water & Sewer Revenue, RB, Water & Sewer, 5.00%, 08/01/40 | | | 7,966 | | | | 8,455,086 | |
| | | | | | | | |
| Wisconsin — 0.2% | | | | | | |
Wisconsin Health & Educational Facilities Authority, Refunding RB, The Medical College of Wisconsin, Inc., 4.00%, 12/01/46 | | | 1,142 | | | | 1,095,697 | |
| | | | | | | | |
Total Municipal Bonds Transferred to Tender Option Bond Trusts — 23.8%
(Cost — $115,524,078) | | | | 118,601,167 | |
| | | | | | | | |
Total Long-Term Investments — 112.4%
(Cost — $540,767,118) | | | | 559,725,457 | |
| | | | | | | | |
| | |
| | | Shares | | | | |
| Short-Term Securities — 0.7% | | | | | | |
BlackRock Liquidity Funds, MuniCash, Institutional Class,
1.45%(k)(l) | | | 3,111,236 | | | | 3,111,547 | |
| | | | | | | | |
Total Short-Term Securities — 0.7%
(Cost — $3,111,547) | | | | 3,111,547 | |
| | | | | | | | |
| |
Total Investments — 113.1%
(Cost — $543,878,665) | | | | 562,837,004 | |
Other Assets Less Liabilities — 1.4% | | | | 6,996,828 | |
Liability for TOB Trust Certificates, Including Interest Expense and Fees Payable — (14.5)% | | | | (72,026,607 | ) |
| | | | | | | | |
Net Assets Applicable to Common Shares — 100.0% | | | $ | 497,807,225 | |
| | | | | | | | |
| (a) | U.S. Government securities, held in escrow, are used to pay interest on this security, as well as to retire the bond in full at the date indicated, typically at a premium to par. |
| (b) | Security exempt from registration pursuant to Rule 144A under the Securities Act of 1933, as amended. These securities may be resold in transactions exempt from registration to qualified institutional investors. |
| (d) | Issuer filed for bankruptcy and/or is in default. |
| (e) | Non-income producing security. |
| | | | |
| SCHEDULES OF INVESTMENTS | | | 25 | |
| | |
Schedule of Investments (unaudited) (continued) October 31, 2018 | | BlackRock MuniAssets Fund, Inc. (MUA) |
| (f) | Variable or floating rate security, which interest rate adjusts periodically based on changes in current interest rates and prepayments on the underlying pool of assets. Rate shown is the rate in effect as of period end. |
| (g) | Step-up bond that pays an initial coupon rate for the first period and then a higher coupon rate for the following periods. Rate as of period end. |
| (h) | When-issued security. |
| (i) | Represent bonds transferred to a TOB Trust in exchange of cash and residual certificates received by the Fund. These bonds serve as collateral in a secured borrowing. See Note 4 of the Notes to Financial Statements for details. |
| (j) | All or a portion of security is subject to a recourse agreement. The aggregate maximum potential amount the Fund could ultimately be required to pay under the agreements, which expire between February 15, 2019 to November 15, 2019 is $11,849,809. See Note 4 of the Notes to Financial Statements for details. |
| (k) | Annualized 7-day yield as of period end. |
| (l) | During the six months ended October 31, 2018, investments in issuers considered to be an affiliate of the Fund for purposes of Section 2(a)(3) of the Investment Company Act of 1940, as amended, were as follows: |
| | | | | | | | | | | | | | | | | | | | | | | | | | | | |
| Affiliate | | Shares
Held at
04/30/18 | | | Net
Activity | | | Shares
Held at
10/31/18 | | | Value at
10/31/18 | | | Income | | | Net
Realized
Gain (Loss) (a) | | | Change in
Unrealized
Appreciation (Depreciation) | |
BlackRock Liquidity Funds, MuniCash, Institutional Class | | | 2,226,571 | | | | 884,665 | | | | 3,111,236 | | | $ | 3,111,547 | | | $ | 21,981 | | | $ | 267 | | | $ | — | |
| | | | | | | | | | | | | | | | | | | | | | | | | | | | |
| | (a) | Includes net capital gain distributions, if applicable. | |
Derivative Financial Instruments Outstanding as of Period End
Futures Contracts
| | | | | | | | | | | | | | | | |
| Description | | Number of
Contracts | | | Expiration
Date | | | Notional
Amount (000) | | | Value/
Unrealized
Appreciation
(Depreciation) | |
Short Contracts: | | | | | | | | | | | | | | | | |
10-Year U.S. Treasury Note | | | 13 | | | | 12/19/18 | | | $ | 1,540 | | | $ | 12,014 | |
Long U.S. Treasury Bond | | | 58 | | | | 12/19/18 | | | | 8,011 | | | | 178,306 | |
5-Year U.S. Treasury Note | | | 23 | | | | 12/31/18 | | | | 2,585 | | | | 11,353 | |
| | | | | | | | | | | | | | | | |
| | | | | | | $ | 201,673 | |
| | | | | | | | | | | | | | | | |
Derivative Financial Instruments Categorized by Risk Exposure
As of period end, the fair values of derivative financial instruments located in the Statements of Assets and Liabilities were as follows:
| | | | | | | | | | | | | | | | | | | | | | | | | | | | |
| | | Commodity
Contracts | | | Credit
Contracts | | | Equity
Contracts | | | Foreign
Currency
Exchange
Contracts | | | Interest
Rate
Contracts | | | Other
Contracts | | | Total | |
Assets — Derivative Financial Instruments | | | | | | | | | | | | | | | | | | | | | | | | | |
Futures contracts | | | | | | | | | | | | | | | | | | | | | | | | | | | | |
Net unrealized appreciation(a) | | $ | — | | | $ | — | | | $ | — | | | $ | — | | | $ | 201,673 | | | $ | — | | | $ | 201,673 | |
| | | | | | | | | | | | | | | | | | | | | | | | | | | | |
| | (a) | Includes cumulative appreciation (depreciation) on futures contracts if any, as reported in the Schedule of Investments. Only current day’s variation margin is reported within the Statements of Assets and Liabilities. | |
For the six months ended October 31, 2018, the effect of derivative financial instruments in the Statements of Operations was as follows:
| | | | | | | | | | | | | | | | | | | | | | | | | | | | |
| | | Commodity
Contracts | | | Credit
Contracts | | | Equity
Contracts | | | Foreign
Currency
Exchange
Contracts | | | Interest
Rate
Contracts | | | Other
Contracts | | | Total | |
Net Realized Gain (Loss) from: | | | | | | | | | | | | | | | | | | | | | | | | | | | | |
Futures contracts | | $ | — | | | $ | — | | | $ | — | | | $ | — | | | $ | 242,334 | | | $ | — | | | $ | 242,334 | |
| | | | | | | | | | | | | | | | | | | | | | | | | | | | |
| Net Change in Unrealized Appreciation (Depreciation) on: | | | | | | | | | | | | | | | | | | | | | |
Futures contracts | | $ | — | | | $ | — | | | $ | — | | | $ | — | | | $ | 162,091 | | | $ | — | | | $ | 162,091 | |
| | | | | | | | | | | | | | | | | | | | | | | | | | | | |
Average Quarterly Balances of Outstanding Derivative Financial Instruments
| | | | |
Futures contracts: | | | | |
Average notional value of contracts — short | | $ | 16,385,605 | |
For more information about the Fund’s investment risks regarding derivative financial instruments, refer to the Notes to Financial Statements.
| | |
| 26 | | 2018 BLACKROCK SEMI-ANNUAL REPORTTO SHAREHOLDERS |
| | |
Schedule of Investments (unaudited) (continued) October 31, 2018 | | BlackRock MuniAssets Fund, Inc. (MUA) |
Fair Value Hierarchy as of Period End
Various inputs are used in determining the fair value of investments and derivative financial instruments. For information about the Fund’s policy regarding valuation of investments and derivative financial instruments, refer to the Notes to Financial Statements.
The following table summarizes the Fund’s investments and derivative financial instruments categorized in the disclosure hierarchy:
| | | | | | | | | | | | | | | | |
| | | Level 1 | | | Level 2 | | | Level 3 | | | Total | |
Assets: | | | | | | | | | | | | | | | | |
Investments: | | | | | | | | | | | | | | | | |
Long-Term Investments(a) | | $ | — | | | $ | 559,725,457 | | | $ | — | | | $ | 559,725,457 | |
Short-Term Securities | | | 3,111,547 | | | | — | | | | — | | | | 3,111,547 | |
| | | | | | | | | | | | | | | | |
| | $ | 3,111,547 | | | $ | 559,725,457 | | | $ | — | | | $ | 562,837,004 | |
| | | | | | | | | | | | | | | | |
Derivative Financial Instruments(b) | | | | | | | | | | | | | | | | |
Assets: | | | | | | | | | | | | | | | | |
Interest rate contracts | | $ | 201,673 | | | $ | — | | | $ | — | | | $ | 201,673 | |
| | | | | | | | | | | | | | | | |
| | (a) | See above Schedule of Investments for values in each state or political subdivision | |
| | (b) | Derivative financial instruments are futures contracts, which are valued at the unrealized appreciation (depreciation) on the instrument. | |
The Fund may hold assets and/or liabilities in which the fair value approximates the carrying amount for financial statement purposes. As of period end, TOB Trust Certificates of $71,659,281 are categorized as Level 2 within the disclosure hierarchy.
During the six months ended October 31, 2018, there were no transfers between levels.
See notes to financial statements.
| | | | |
| SCHEDULES OF INVESTMENTS | | | 27 | |
| | |
Schedule of Investments (unaudited) October 31, 2018 | | BlackRock MuniEnhanced Fund, Inc. (MEN) (Percentages shown are based on Net Assets) |
| | | | | | | | |
| Security | | Par
(000) | | | Value | |
| Municipal Bonds — 124.8% | |
|
Alabama — 0.3% | |
Homewood Educational Building Authority, Refunding RB, Educational Facilities, Samford University, Series A, 5.00%, 12/01/47 | | $ | 1,010 | | | $ | 1,077,418 | |
| | | | | | | | |
| Alaska — 0.7% | |
Alaska Industrial Development & Export Authority, RB, Providence Health Services, Series A, 5.50%, 10/01/41 | | | 990 | | | | 1,057,964 | |
Borough of Matanuska-Susitna Alaska, RB, Goose Creek Correctional Center (AGC)(a): | | | | | | | | |
6.00%, 09/01/19 | | | 765 | | | | 790,184 | |
6.00%, 09/01/19 | | | 435 | | | | 449,320 | |
| | | | | | | | |
| | | | | | | 2,297,468 | |
| Arizona — 1.6% | |
County of Maricopa Arizona IDA, Refunding RB, Banner Health Obligation Group, Series A, 4.00%, 01/01/41 | | | 2,240 | | | | 2,207,498 | |
State of Arizona, COP, Department of Administration, Series A (AGM): | | | | | | | | |
5.00%, 10/01/27 | | | 2,700 | | | | 2,768,472 | |
5.00%, 10/01/29 | | | 400 | | | | 409,924 | |
| | | | | | | | |
| | | | | | | 5,385,894 | |
| California — 13.8% | |
Anaheim California Public Financing Authority, RB, Senior, Public Improvements Project, Series A (AGM), 6.00%, 09/01/24 | | | 5,000 | | | | 5,693,300 | |
California Health Facilities Financing Authority, RB: | | | | | | | | |
St. Joseph Health System, Series A, 5.75%, 07/01/39 | | | 550 | | | | 563,849 | |
Sutter Health, Series A, 5.00%, 11/15/41 | | | 945 | | | | 1,029,029 | |
Sutter Health, Series B, 5.88%, 08/15/20(a) | | | 1,200 | | | | 1,284,216 | |
California Health Facilities Financing Authority, Refunding RB, St. Joseph Health System, Series A, 5.00%, 07/01/37 | | | 1,090 | | | | 1,183,685 | |
California Statewide Communities Development Authority, RB, Kaiser Permanente, Series A, 5.00%, 04/01/42 | | | 1,480 | | | | 1,566,447 | |
California Statewide Communities Development Authority, Refunding RB, John Muir Health, Series A, 4.00%, 12/01/53 | | | 975 | | | | 948,070 | |
City of San Jose California, Refunding ARB, Norman Y Mineta San Jose International Airport SJC, AMT: | | | | | | | | |
Series A, 5.00%, 03/01/36 | | | 410 | | | | 450,668 | |
Series A, 5.00%, 03/01/37 | | | 455 | | | | 499,103 | |
Series A-1, 5.75%, 03/01/34 | | | 850 | | | | 909,339 | |
County of San Joaquin California Transportation Authority, Refunding RB, Limited Tax, Measure K, Series A, 6.00%, 03/01/21(a) | | | 2,175 | | | | 2,376,231 | |
County of San Mateo California Community College District, GO, CAB, Election of 2001, Series C (NPFGC), 0.00%, 09/01/30(b) | | | 12,740 | | | | 8,589,563 | |
Golden State Tobacco Securitization Corp., Refunding RB, Series A-1, 3.50%, 06/01/36 | | | 1,700 | | | | 1,665,864 | |
Mount San Antonio Community College District, GO, Refunding, CAB, Election of 2008, Series A, 6.25%, 08/01/43(c) | | | 2,500 | | | | 1,981,725 | |
Poway Unified School District, GO, Refunding, CAB, School Facilities Improvement, Election of 2008, Series B, 0.00%, 08/01/36(b) | | | 3,750 | | | | 1,818,487 | |
Rio Hondo Community College District California, GO, CAB, Election of 2004, Series C, 0.00%, 08/01/38(b) | | | 5,000 | | | | 2,196,150 | |
San Diego California Community College District, GO, CAB, Election of 2006(b): | | | | | | | | |
0.00%, 08/01/31 | | | 2,145 | | | | 1,207,935 | |
0.00%, 08/01/32 | | | 2,680 | | | | 1,416,675 | |
| | | | | | | | |
| Security | | Par
(000) | | | Value | |
| California (continued) | |
San Diego California Unified School District, GO, CAB, Election of 2008(b): | | | | | | | | |
Series C, 0.00%, 07/01/38 | | $ | 1,600 | | | $ | 716,160 | |
Series G, 0.00%, 07/01/34 | | | 650 | | | | 315,153 | |
Series G, 0.00%, 07/01/35 | | | 690 | | | | 314,744 | |
Series G, 0.00%, 07/01/36 | | | 1,035 | | | | 444,191 | |
Series G, 0.00%, 07/01/37 | | | 690 | | | | 278,705 | |
San Diego California Unified School District, GO, Refunding, Series R-1(b): | | | | | | | | |
0.00%, 07/01/30 | | | 5,000 | | | | 3,309,200 | |
0.00%, 07/01/31 | | | 1,280 | | | | 803,584 | |
San Marcos Unified School District, GO, Election of 2010, Series A(a): | | | | | | | | |
5.00%, 08/01/21 | | | 700 | | | | 757,603 | |
5.00%, 08/01/21 | | | 600 | | | | 649,374 | |
Walnut Valley Unified School District, GO, CAB, Election of 2007, Series B, 0.00%, 08/01/36(b) | | | 5,500 | | | | 2,584,670 | |
| | | | | | | | |
| | | | | | | 45,553,720 | |
| Colorado — 1.1% | |
City & County of Denver Colorado, COP, Colorado Convention Center Expansion Project, Series A, 4.00%, 06/01/48 | | | 1,375 | | | | 1,363,175 | |
Regional Transportation District, COP, Refunding, Series A, 5.38%, 06/01/31 | | | 2,000 | | | | 2,089,160 | |
| | | | | | | | |
| | | | | | | 3,452,335 | |
| Connecticut — 1.0% | |
Connecticut HFA, Refunding RB: | | | | | | | | |
M/F Housing, Sub-Series E-1 (Ginnie Mae, Fannie Mae & Freddie Mac), 4.00%, 05/15/36(d) | | | 770 | | | | 765,195 | |
S/F Housing, Sub-Series A-1, 3.85%, 11/15/43 | | | 445 | | | | 429,033 | |
S/F Housing, Sub-Series B-1, 4.00%, 05/15/45 | | | 1,445 | | | | 1,408,037 | |
State of Connecticut, GO, Series C, 5.00%, 06/15/32 | | | 615 | | | | 671,900 | |
| | | | | | | | |
| | | | | | | 3,274,165 | |
| District of Columbia — 1.9% | |
District of Columbia Ballpark Revenue, RB, Series B-1 (NPFGC), 5.00%, 02/01/31 | | | 5,360 | | | | 5,369,112 | |
District of Columbia HFA, RB, M/F Housing, Series B-2 (FHA), 4.10%, 09/01/39 | | | 1,030 | | | | 1,010,131 | |
| | | | | | | | |
| | | | | | | 6,379,243 | |
| Florida — 10.1% | |
County of Brevard Florida Health Facilities Authority, Refunding RB, Health First, Inc. Project, 5.00%, 04/01/39 | | | 1,600 | | | | 1,693,904 | |
County of Highlands Florida Health Facilities Authority, RB, Adventist Health System/Sunbelt Obligated Group: | | | | | | | | |
6.00%, 11/15/19(a) | | | 5 | | | | 5,204 | |
6.00%, 11/15/37 | | | 1,445 | | | | 1,501,991 | |
County of Lee Florida, Refunding ARB, Series A, AMT: | | | | | | | | |
5.63%, 10/01/26 | | | 960 | | | | 1,030,550 | |
5.38%, 10/01/32 | | | 3,160 | | | | 3,363,378 | |
County of Miami-Dade Florida, RB, Seaport: | | | | | | | | |
Department, Series A, 6.00%, 10/01/38 | | | 2,025 | | | | 2,274,986 | |
Department, Series B, AMT, 6.25%, 10/01/38 | | | 415 | | | | 467,896 | |
Department, Series B, AMT, 6.00%, 10/01/42 | | | 660 | | | | 738,296 | |
Series B, AMT, 6.00%, 10/01/30 | | | 640 | | | | 721,178 | |
County of Miami-Dade Florida, Refunding RB, 4.00%, 10/01/40 | | | 885 | | | | 885,566 | |
County of Miami-Dade Florida Aviation, Refunding ARB, AMT, 5.00%, 10/01/34 | | | 190 | | | | 205,310 | |
County of Miami-Dade Florida Educational Facilities Authority, RB, University of Miami, Series A, 5.00%, 04/01/40 | | | 2,995 | | | | 3,231,365 | |
| | |
| 28 | | 2018 BLACKROCK SEMI-ANNUAL REPORTTO SHAREHOLDERS |
| | |
Schedule of Investments (unaudited) (continued) October 31, 2018 | | BlackRock MuniEnhanced Fund, Inc. (MEN) (Percentages shown are based on Net Assets) |
| | | | | | | | |
| Security | | Par
(000) | | | Value | |
| Florida (continued) | |
County of Orange Florida Health Facilities Authority, Refunding RB, Presbyterian Retirement Communities Project: | | | | | | | | |
5.00%, 08/01/41 | | $ | 560 | | | $ | 593,891 | |
5.00%, 08/01/47 | | | 1,620 | | | | 1,711,433 | |
County of Orange HFA, RB, S/F Housing, Multi-County Program, Series A (Ginnie Mae, Fannie Mae & Freddie Mac), 3.75%, 09/01/47 | | | 560 | | | | 517,194 | |
County of Palm Beach Florida Solid Waste Authority, Refunding RB, Series B: | | | | | | | | |
5.00%, 10/01/21(a) | | | 30 | | | | 32,287 | |
5.00%, 10/01/31 | | | 1,970 | | | | 2,110,973 | |
County of Putnam Florida Development Authority, Refunding RB, Seminole Project, Series A, 5.00%, 03/15/42 | | | 520 | | | | 563,316 | |
County of Sarasota Florida Public Hospital District, RB, Sarasota Memorial Hospital Project, Series A, 5.63%, 07/01/19(a) | | | 275 | | | | 281,553 | |
Florida Ports Financing Commission, Refunding RB, State Transportation Trust Fund, Series B, AMT: | | | | | | | | |
5.13%, 06/01/27 | | | 2,000 | | | | 2,132,440 | |
5.38%, 10/01/29 | | | 1,050 | | | | 1,133,380 | |
Greater Orlando Aviation Authority, RB, Priority Subordinated, Series A, AMT: | | | | | | | | |
5.00%, 10/01/47 | | | 3,970 | | | | 4,255,840 | |
5.00%, 10/01/52 | | | 1,490 | | | | 1,591,529 | |
State of Florida, GO, Department of Transportation, Right-of-Way Acquisition and Bridge Construction Bonds, 4.00%, 07/01/39 | | | 2,065 | | | | 2,099,733 | |
| | | | | | | | |
| | | | | | | 33,143,193 | |
| Georgia — 3.5% | |
County of Gainesville Georgia & Hall Hospital Authority, Refunding RB, Northeast Georgia Health System, Inc. Project, Series A (GTD), 5.50%, 08/15/54 | | | 500 | | | | 558,050 | |
County of LaGrange-Troup Hospital Authority, Refunding RB, Revenue Anticipation Certificates, 4.00%, 04/01/47 | | | 1,250 | | | | 1,182,900 | |
Municipal Electric Authority of Georgia, Refunding RB, Series EE (AMBAC), 7.00%, 01/01/25 | | | 7,475 | | | | 9,197,838 | |
Private Colleges & Universities Authority, RB, Savannah College of Art & Design: | | | | | | | | |
5.00%, 04/01/33 | | | 140 | | | | 149,772 | |
5.00%, 04/01/44 | | | 380 | | | | 400,212 | |
| | | | | | | | |
| | | | | | | 11,488,772 | |
| Illinois — 16.0% | |
City of Chicago Illinois O’Hare International Airport, GARB: | | | | | | | | |
3rd Lien, Series A, 5.75%, 01/01/21(a) | | | 4,290 | | | | 4,612,780 | |
3rd Lien, Series A, 5.75%, 01/01/39 | | | 820 | | | | 868,995 | |
Senior Lien, Series D, 5.25%, 01/01/42 | | | 2,900 | | | | 3,181,967 | |
City of Chicago Illinois Transit Authority, RB: | | | | | | | | |
5.25%, 12/01/49 | | | 900 | | | | 978,372 | |
Sales Tax Receipts, 5.25%, 12/01/36 | | | 595 | | | | 625,494 | |
County of Cook Illinois Forest Preserve District, GO, Refunding, Limited Tax Project, Series B, 5.00%, 12/15/37 | | | 45 | | | | 46,454 | |
Illinois Finance Authority, RB, Carle Foundation, Series A: | | | | | | | | |
5.75%, 08/15/34 | | | 650 | | | | 698,126 | |
6.00%, 08/15/41 | | | 1,000 | | | | 1,082,070 | |
Illinois Finance Authority, Refunding RB, Silver Cross Hospital & Medical Centers, Series C: | | | | | | | | |
4.13%, 08/15/37 | | | 740 | | | | 711,377 | |
5.00%, 08/15/44 | | | 350 | | | | 365,943 | |
Illinois Housing Development Authority, RB, S/F Housing, 4.13%, 10/01/38 | | | 1,365 | | | | 1,371,839 | |
| | | | | | | | |
| Security | | Par
(000) | | | Value | |
| Illinois (continued) | |
Illinois Sports Facilities Authority, RB, State Tax Supported (AMBAC), 5.50%, 06/15/30 | | $ | 10,490 | | | $ | 10,514,861 | |
Illinois State Toll Highway Authority, RB, Series B, 5.00%, 01/01/37 | | | 1,785 | | | | 1,926,283 | |
Kane McHenry Cook & De Kalb Counties Unit School District No. 300, GO, Refunding, 5.25%, 01/01/33 | | | 9,145 | | | | 10,019,445 | |
Metropolitan Pier & Exposition Authority, RB, CAB, McCormick Place Expansion Project, Series A (NPFGC)(b): | | | | | | | | |
0.00%, 12/15/26 | | | 5,000 | | | | 3,536,750 | |
0.00%, 12/15/33 | | | 9,950 | | | | 4,750,627 | |
Metropolitan Pier & Exposition Authority, Refunding RB, CAB, McCormick Place Expansion Project, Series B (AGM), 0.00%, 06/15/44(b) | | | 3,450 | | | | 983,284 | |
Railsplitter Tobacco Settlement Authority, RB, 6.00%, 06/01/21(a) | | | 675 | | | | 737,215 | |
Regional Transportation Authority, RB, Series A (AMBAC), 7.20%, 11/01/20 | | | 2,460 | | | | 2,581,819 | |
State of Illinois, GO: | | | | | | | | |
5.25%, 02/01/33 | | | 830 | | | | 854,834 | |
5.50%, 07/01/33 | | | 820 | | | | 864,674 | |
5.25%, 02/01/34 | | | 830 | | | | 853,281 | |
5.50%, 07/01/38 | | | 445 | | | | 465,216 | |
| | | | | | | | |
| | | | | | | 52,631,706 | |
| Indiana — 1.0% | |
Indiana Finance Authority, RB, Series A: | | | | | | | | |
CWA Authority Project, 1st Lien, 5.25%, 10/01/38 | | | 1,100 | | | | 1,175,834 | |
Private Activity Bond, Ohio River Bridges East End Crossing Project, AMT, 5.00%, 07/01/44 | | | 515 | | | | 539,143 | |
Indianapolis Local Public Improvement Bond Bank, Refunding RB, Waterworks Project, Series A (AGC): | | | | | | | | |
5.25%, 01/01/19(a) | | | 115 | | | | 115,643 | |
5.25%, 01/01/29 | | | 485 | | | | 487,585 | |
State of Indiana Finance Authority, RB, Private Activity Bond, Ohio River Bridges, Series A, AMT, 5.00%, 07/01/40 | | | 890 | | | | 934,429 | |
| | | | | | | | |
| | | | | | | 3,252,634 | |
| Iowa — 2.6% | |
Iowa Finance Authority, RB, Iowa Health Care Facilities, Series A (AGC), 5.63%, 08/15/19(a) | | | 5,725 | | | | 5,885,415 | |
Iowa Student Loan Liquidity Corp., RB, Senior Series A-2, AMT: | | | | | | | | |
5.60%, 12/01/26 | | | 1,330 | | | | 1,368,809 | |
5.70%, 12/01/27 | | | 600 | | | | 617,184 | |
5.80%, 12/01/29 | | | 405 | | | | 415,886 | |
5.85%, 12/01/30 | | | 425 | | | | 436,314 | |
| | | | | | | | |
| | | | | | | 8,723,608 | |
| Louisiana — 1.3% | |
City of New Orleans Louisiana Aviation Board, ARB, Series B, AMT, 5.00%, 01/01/40 | | | 2,795 | | | | 2,960,296 | |
Louisiana Public Facilities Authority, Refunding RB, Christus Health, Series B (AGC), 6.50%, 07/01/30 | | | 1,250 | | | | 1,259,450 | |
| | | | | | | | |
| | | | | | | 4,219,746 | |
| Maine — 1.0% | |
Maine State Housing Authority, RB: | | | | | | | | |
M/F Housing, Series E, 4.15%, 11/15/38(d) | | | 1,405 | | | | 1,410,241 | |
M/F Housing, Series E, 4.25%, 11/15/43(d) | | | 1,260 | | | | 1,262,797 | |
Series D-1, 3.65%, 11/15/42 | | | 645 | | | | 594,387 | |
| | | | | | | | |
| | | | | | | 3,267,425 | |
| Maryland — 0.3% | |
Maryland Community Development Administration, Refunding RB, S/F Housing, Series A, 4.10%, 09/01/38(d) | | | 1,150 | | | | 1,142,226 | |
| | | | | | | | |
| | | | |
| SCHEDULES OF INVESTMENTS | | | 29 | |
| | |
Schedule of Investments (unaudited) (continued) October 31, 2018 | | BlackRock MuniEnhanced Fund, Inc. (MEN) (Percentages shown are based on Net Assets) |
| | | | | | | | |
| Security | | Par
(000) | | | Value | |
| Massachusetts — 2.7% | |
Massachusetts Development Finance Agency, RB, Emerson College Issue, Series A, 5.00%, 01/01/47 | | $ | 2,090 | | | $ | 2,189,714 | |
Massachusetts Development Finance Agency, Refunding RB, Partners Health Care System, 4.00%, 07/01/41 | | | 3,235 | | | | 3,187,413 | |
Massachusetts HFA, Refunding RB, Series A, AMT, 4.45%, 12/01/42 | | | 795 | | | | 806,750 | |
Massachusetts Housing Finance Agency, RB, M/F Housing, Series A: | | | | | | | | |
3.80%, 12/01/43 | | | 255 | | | | 241,544 | |
3.85%, 06/01/46 | | | 75 | | | | 70,384 | |
Massachusetts Housing Finance Agency, Refunding RB, Series C, AMT, 5.35%, 12/01/42 | | | 375 | | | | 376,609 | |
Massachusetts School Building Authority, RB: | | | | | | | | |
Dedicated Sales Tax, Senior Series A, 5.00%, 05/15/43 | | | 1,280 | | | | 1,388,928 | |
Sub-Series B, 4.00%, 02/15/43 | | | 755 | | | | 748,009 | |
| | | | | | | | |
| | | | | | | 9,009,351 | |
| Michigan — 3.1% | |
City of Detroit Michigan Water Supply System Revenue, RB, 2nd Lien, Series B (AGM), 6.25%, 07/01/19(a) | | | 400 | | | | 411,304 | |
City of Lansing Michigan, RB, Board of Water & Light Utilities System, Series A, 5.50%, 07/01/41 | | | 1,700 | | | | 1,829,217 | |
Eastern Michigan University, RB, Series A (AGM), 4.00%, 03/01/44 | | | 615 | | | | 595,904 | |
Michigan Finance Authority, Refunding RB: | | | | | | | | |
Henry Ford Health System, 3.25%, 11/15/42 | | | 325 | | | | 266,529 | |
Trinity Health Credit Group, 5.00%, 12/01/21(a) | | | 20 | | | | 21,609 | |
Trinity Health Credit Group, Series A, 4.00%, 12/01/40 | | | 2,180 | | | | 2,148,477 | |
Royal Oak Hospital Finance Authority Michigan, Refunding RB, Beaumont Health Credit Group, Series D, 5.00%, 09/01/39 | | | 1,040 | | | | 1,108,963 | |
State of Michigan Building Authority, Refunding RB, Facilities Program: | | | | | | | | |
Series I-A, 5.38%, 10/15/36 | | | 145 | | | | 156,278 | |
Series I-A, 5.38%, 10/15/41 | | | 700 | | | | 752,171 | |
Series II-A (AGM), 5.25%, 10/15/36 | | | 900 | | | | 970,551 | |
State of Michigan Housing Development Authority, RB, S/F Housing, Series C, 4.13%, 12/01/38(d) | | | 1,465 | | | | 1,466,612 | |
Western Michigan University, Refunding RB, General, University and College Improvements (AGM), 5.00%, 11/15/39 | | | 380 | | | | 416,016 | |
| | | | | | | | |
| | | | | | | 10,143,631 | |
| Minnesota — 0.8% | |
City of Minneapolis Minnesota, Refunding RB, Fairview Health Services, Series B (AGC): | | | | | | | | |
6.50%, 11/15/18(a) | | | 385 | | | | 385,647 | |
6.50%, 11/15/38 | | | 2,115 | | | | 2,118,553 | |
| | | | | | | | |
| | | | | | | 2,504,200 | |
| Mississippi — 0.1% | |
Mississippi State University Educational Building Corp., Refunding RB, Mississippi State University Faciliities Refinancing, Series A, 4.00%, 08/01/43 | | | 400 | | | | 399,980 | |
| | | | | | | | |
| Missouri — 0.3% | |
State of Missouri Health & Educational Facilities Authority, RB, Mercy Health, 4.00%, 11/15/42 | | | 1,015 | | | | 1,013,427 | |
| | | | | | | | |
| Nebraska — 1.9% | |
Central Plains Nebraska Energy Project, RB, Gas Project No. 3: | | | | | | | | |
5.00%, 09/01/32 | | | 5,010 | | | | 5,382,994 | |
5.25%, 09/01/37 | | | 750 | | | | 812,580 | |
| | | | | | | | |
| | | | | | | 6,195,574 | |
| | | | | | | | |
| Security | | Par
(000) | | | Value | |
| Nevada — 1.6% | |
City of Las Vegas Nevada, GO, Limited Tax, Performing Arts Center, 6.00%, 04/01/19(a) | | $ | 850 | | | $ | 864,314 | |
County of Clark Nevada, ARB, Las Vegas-McCarran International Airport, Series A: | | | | | | | | |
5.25%, 07/01/42 | | | 500 | | | | 515,890 | |
(AGM), 5.25%, 07/01/39 | | | 3,800 | | | | 3,922,094 | |
| | | | | | | | |
| | | | | | | 5,302,298 | |
| New Jersey — 8.7% | |
New Jersey EDA, RB: | | | | | | | | |
Goethals Bridge Replacement Project, AMT, Private Activity Bond, 5.38%, 01/01/43 | | | 895 | | | | 957,453 | |
Goethals Bridge Replacement Project, AMT, Private Activity Bond, 5.13%, 01/01/34 | | | 685 | | | | 728,813 | |
School Facilities Construction (AGC), 6.00%, 12/15/18(a) | | | 1,975 | | | | 1,984,756 | |
School Facilities Construction (AGC), 6.00%, 12/15/18(a) | | | 25 | | | | 25,125 | |
Series WW, 5.25%, 06/15/33 | | | 155 | | | | 164,773 | |
Series WW, 5.00%, 06/15/34 | | | 205 | | | | 214,504 | |
Series WW, 5.00%, 06/15/36 | | | 925 | | | | 962,453 | |
Series WW, 5.25%, 06/15/40 | | | 265 | | | | 279,045 | |
New Jersey EDA, Refunding RB: | | | | | | | | |
Series B, 5.50%, 06/15/30 | | | 5,360 | | | | 5,908,542 | |
Sub-Series A, 4.00%, 07/01/32 | | | 1,270 | | | | 1,227,049 | |
New Jersey Higher Education Student Assistance Authority, Refunding RB, Series 1, AMT: | | | | | | | | |
5.50%, 12/01/26 | | | 300 | | | | 314,505 | |
5.75%, 12/01/27 | | | 1,950 | | | | 2,055,436 | |
New Jersey Housing & Mortgage Finance Agency, Refunding RB, M/F Housing, Series 2, AMT, 4.35%, 11/01/33 | | | 970 | | | | 986,015 | |
New Jersey Transportation Trust Fund Authority, RB: | | | | | | | | |
Transportation Program, Series AA, 5.25%, 06/15/33 | | | 1,490 | | | | 1,580,681 | |
Transportation Program, Series AA, 5.00%, 06/15/38 | | | 1,885 | | | | 1,949,203 | |
Transportation System, Series A, 5.50%, 06/15/41 | | | 3,150 | | | | 3,287,781 | |
Transportation System, Series AA, 5.50%, 06/15/39 | | | 1,150 | | | | 1,220,058 | |
Transportation System, Series B, 5.50%, 06/15/31 | | | 1,000 | | | | 1,052,160 | |
Transportation System, Series B, 5.00%, 06/15/42 | | | 520 | | | | 534,222 | |
Transportation System, Series D, 5.00%, 06/15/32 | | | 735 | | | | 774,514 | |
Tobacco Settlement Financing Corp., Refunding RB, Series A: | | | | | | | | |
5.00%, 06/01/46 | | | 1,845 | | | | 1,904,483 | |
5.25%, 06/01/46 | | | 405 | | | | 428,089 | |
| | | | | | | | |
| | | | | | | 28,539,660 | |
| New York — 6.9% | |
City of New York Transitional Finance Authority, BARB, Fiscal 2009, Series S-4, 5.50%, 01/15/33 | | | 1,600 | | | | 1,611,968 | |
City of New York Housing Development Corp., Refunding RB, Sustainable Neighborhood Bonds, Series A, 4.15%, 11/01/38(d) | | | 2,175 | | | | 2,146,029 | |
City of New York New York Municipal Water Finance Authority, Refunding RB, Second General Resolution, Fiscal 2012, Series BB, 5.25%, 06/15/44 | | | 1,425 | | | | 1,540,069 | |
City of New York New York Transitional Finance Authority, RB, Series S-3, 4.00%, 07/15/46 | | | 1,130 | | | | 1,111,333 | |
City of New York Transitional Finance Authority, RB, Fiscal 2009, Series S-4, 5.50%, 01/15/34 | | | 2,750 | | | | 2,770,570 | |
City of New York Transitional Finance Authority, Refunding RB, Future Tax Secured, Series B, 5.00%, 11/01/32 | | | 1,480 | | | | 1,605,830 | |
Hudson Yards Infrastructure Corp., RB, Senior, Fiscal 2012: | | | | | | | | |
5.75%, 02/15/21(a) | | | 430 | | | | 465,041 | |
5.75%, 02/15/47 | | | 270 | | | | 288,932 | |
Metropolitan Transportation Authority, RB, Series C: | | | | | | | | |
6.50%, 11/15/18(a) | | | 2,985 | | | | 2,990,194 | |
6.50%, 11/15/18(a) | | | 245 | | | | 245,426 | |
6.50%, 11/15/28 | | | 770 | | | | 771,324 | |
| | |
| 30 | | 2018 BLACKROCK SEMI-ANNUAL REPORTTO SHAREHOLDERS |
| | |
Schedule of Investments (unaudited) (continued) October 31, 2018 | | BlackRock MuniEnhanced Fund, Inc. (MEN) (Percentages shown are based on Net Assets) |
| | | | | | | | |
| Security | | Par
(000) | | | Value | |
| New York (continued) | |
New York Transportation Development Corp., ARB, LaGuardia Airport Terminal B Redevelopment Project, Series A, AMT, 5.25%, 01/01/50 | | $ | 2,715 | | | $ | 2,857,212 | |
Port Authority of New York & New Jersey, Refunding ARB, Series 207, AMT, 4.00%, 09/15/43 | | | 460 | | | | 450,740 | |
State of New York Dormitory Authority, RB, Series B, 5.75%, 03/15/19(a) | | | 1,200 | | | | 1,217,376 | |
State of New York HFA, RB, M/F Housing, Series B: | | | | | | | | |
Affordable Housing, AMT, 5.30%, 11/01/37 | | | 2,500 | | | | 2,502,125 | |
Green Bond (SONYMA), 3.88%, 11/01/48 | | | 170 | | | | 166,015 | |
| | | | | | | | |
| | | | | | | 22,740,184 | |
| Ohio — 1.8% | |
County of Butler Ohio, Refunding RB, UC Health, 4.00%, 11/15/37 | | | 460 | | | | 443,918 | |
County of Lucas Ohio, Refunding RB, Promedica Healthcare, Series A, 6.50%, 11/15/21(a) | | | 530 | | | | 595,079 | |
Ohio HFA, RB, S/F Housing, Series A (Ginnie Mae, Fannie Mae & Freddie Mac), 4.00%, 09/01/48 | | | 325 | | | | 316,687 | |
State of Ohio Turnpike Commission, RB, CAB, Junior Lien, Infrastructure Projects, Series A-2, 0.00%, 02/15/37(b) | | | 10,000 | | | | 4,618,100 | |
| | | | | | | | |
| | | | | | | 5,973,784 | |
| Oklahoma — 0.2% | |
Oklahoma Turnpike Authority, RB, Series A, 4.00%, 01/01/48 | | | 555 | | | | 546,514 | |
| | | | | | | | |
| Oregon — 1.3% | |
County of Clackamas Oregon Community College District, GO, Convertible Deferred Interest Bonds, Series A, 5.00%, 06/15/40(c) | | | 440 | | | | 445,262 | |
County of Clackamas Oregon School District No. 12 North Clackamas, GO, CAB, Series A, 0.00%, 06/15/38(b) | | | 995 | | | | 432,855 | |
State of Oregon, GO, Refunding, Veteran’s Welfare Series 100th, 3.65%, 06/01/42 | | | 550 | | | | 524,821 | |
State of Oregon Housing & Community Services Department, RB: | | | | | | | | |
S/F Housing, Mortgage Program, Series C, 3.95%, 07/01/43 | | | 425 | | | | 416,441 | |
Series D, 3.45%, 01/01/38 | | | 2,760 | | | | 2,532,162 | |
| | | | | | | | |
| | | | | | | 4,351,541 | |
| Pennsylvania — 9.3% | |
City of Philadelphia Pennsylvania Airport Revenue, Refunding ARB, Series B, AMT, 5.00%, 07/01/47 | | | 1,610 | | | | 1,718,321 | |
Commonwealth Financing Authority, RB: | | | | | | | | |
Series B, 5.00%, 06/01/42 | | | 1,600 | | | | 1,693,888 | |
Tobacco Master Settlement Payment (AGM), 4.00%, 06/01/39 | | | 1,050 | | | | 1,029,745 | |
County of Montgomery Higher Education & Health Authority, Refunding RB, Thomas Jefferson University, Series A, 4.00%, 09/01/49 | | | 950 | | | | 904,647 | |
Pennsylvania Economic Development Financing Authority, RB: | | | | | | | | |
AMT, 5.00%, 06/30/42 | | | 1,035 | | | | 1,081,120 | |
PA Bridges Finco LP, 5.00%, 12/31/38 | | | 1,305 | | | | 1,369,232 | |
PA Bridges Finco LP, AMT, 5.00%, 12/31/34 | | | 7,290 | | | | 7,746,791 | |
Pennsylvania Economic Development Financing Authority, Refunding RB, Series A, 4.00%, 11/15/42 | | | 570 | | | | 553,687 | |
Pennsylvania Higher Educational Facilities Authority, Refunding RB, Thomas Jefferson University, Series A, 5.25%, 09/01/50 | | | 2,330 | | | | 2,538,908 | |
Pennsylvania Housing Finance Agency, RB, S/F Housing, Series 127-B, 3.88%, 10/01/38 | | | 885 | | | | 862,760 | |
| | | | | | | | |
| Security | | Par
(000) | | | Value | |
| Pennsylvania (continued) | |
Pennsylvania Turnpike Commission, RB: | | | | | | | | |
Series A, 5.00%, 12/01/38 | | $ | 620 | | | $ | 667,709 | |
Series A-1, 5.00%, 12/01/41 | | | 2,385 | | | | 2,575,156 | |
Series B, 5.00%, 12/01/40 | | | 935 | | | | 1,008,874 | |
Series C, 5.50%, 12/01/23(a) | | | 555 | | | | 637,678 | |
Sub-Series A-1, 5.00%, 12/01/41 | | | 2,430 | | | | 2,563,140 | |
Subordinate, Special Motor License Fund, 6.00%, 12/01/20(a) | | | 575 | | | | 619,551 | |
Pennsylvania Turnpike Commission, Refunding RB: | | | | | | | | |
Motor Licenced Fund Enhancement, Third Series, 4.00%, 12/01/38 | | | 2,070 | | | | 2,030,691 | |
Series A-1, 5.00%, 12/01/40 | | | 765 | | | | 821,671 | |
Philadelphia School District, GO, Refunding, Series F, 5.00%, 09/01/38 | | | 305 | | | | 326,161 | |
| | | | | | | | |
| | | | | | | 30,749,730 | |
| Rhode Island — 1.5% | |
Rhode Island Health & Educational Building Corp., RB, Series A, 4.00%, 09/15/42 | | | 805 | | | | 784,408 | |
Rhode Island Turnpike & Bridge Authority, Refunding RB, Series A, 5.00%, 10/01/40 | | | 465 | | | | 502,930 | |
Tobacco Settlement Financing Corp., Refunding RB, Series B: | | | | | | | | |
4.50%, 06/01/45 | | | 1,055 | | | | 1,040,473 | |
5.00%, 06/01/50 | | | 2,630 | | | | 2,696,565 | |
| | | | | | | | |
| | | | | | | 5,024,376 | |
| South Carolina — 5.1% | |
South Carolina Jobs EDA, Refunding RB, Palmetto Health, Series A (AGM), 6.50%, 08/01/21(a) | | | 115 | | | | 128,042 | |
South Carolina Ports Authority, ARB, AMT, 5.00%, 07/01/48 | | | 530 | | | | 568,590 | |
South Carolina Transportation Infrastructure Bank, RB, Series A, 5.25%, 10/01/19(a) | | | 3,000 | | | | 3,086,130 | |
State of South Carolina Ports Authority, RB, AMT, 5.25%, 07/01/50 | | | 2,330 | | | | 2,517,169 | |
State of South Carolina Public Service Authority, RB: | | | | | | | | |
Santee Cooper, Series A, 5.50%, 12/01/54 | | | 6,225 | | | | 6,595,076 | |
Series E, 5.50%, 12/01/53 | | | 745 | | | | 785,729 | |
State of South Carolina Public Service Authority, Refunding RB: | | | | | | | | |
Santee Cooper, Series B, 5.00%, 12/01/38 | | | 2,080 | | | | 2,163,075 | |
Series A, 5.50%, 01/01/19(a) | | | 80 | | | | 80,473 | |
Series A, 5.50%, 01/01/19(a) | | | 920 | | | | 925,437 | |
| | | | | | | | |
| | | | | | | 16,849,721 | |
| South Dakota — 1.2% | |
South Dakota Health & Educational Facilities Authority, Refunding RB, Avera Health Issue: | | | | | | | | |
4.00%, 07/01/37 | | | 1,225 | | | | 1,204,371 | |
4.00%, 07/01/42 | | | 3,000 | | | | 2,901,690 | |
| | | | | | | | |
| | | | | | | 4,106,061 | |
| Tennessee — 2.1% | |
Metropolitan Government of Nashville & Davidson County Health & Educational Facilities Board, Refunding RB, Vanderbilt University, Series B, 5.50%, 10/01/19(a) | | | 5,000 | | | | 5,159,450 | |
Tennessee Housing Development Agency, RB: | | | | | | | | |
3.60%, 07/01/42 | | | 550 | | | | 507,006 | |
3.65%, 07/01/47 | | | 1,465 | | | | 1,326,836 | |
| | | | | | | | |
| | | | | | | 6,993,292 | |
| Texas — 15.7% | |
City of Houston Texas Combined Utility System Revenue, Refunding RB, Combined 1st Lien, Series A (AGC)(a): | | | | | | | | |
5.38%, 05/15/19 | | | 1,280 | | | | 1,303,462 | |
5.38%, 05/15/19 | | | 70 | | | | 71,302 | |
| | | | |
| SCHEDULES OF INVESTMENTS | | | 31 | |
| | |
Schedule of Investments (unaudited) (continued) October 31, 2018 | | BlackRock MuniEnhanced Fund, Inc. (MEN) (Percentages shown are based on Net Assets) |
| | | | | | | | |
| Security | | Par
(000) | | | Value | |
| Texas (continued) | |
City of Houston Texas Combined Utility System Revenue, Refunding RB, Combined 1st Lien, Series A (AGC)(a) (continued): | | | | | | | | |
6.00%, 05/15/19 | | $ | 1,990 | | | $ | 2,033,083 | |
6.00%, 05/15/19 | | | 110 | | | | 112,411 | |
City of San Antonio Texas Electric & Gas Revenue, RB, Junior Lien, 5.00%, 02/01/38 | | | 575 | | | | 618,850 | |
County of Midland Texas Fresh Water Supply District No. 1, RB, CAB, City of Midland Project, Series A, 0.00%, 09/15/36(b) | | | 2,130 | | | | 993,517 | |
County of Tarrant Texas Cultural Education Facilities Finance Corp., Refunding RB, Cook Children’s Medical Center, 5.25%, 12/01/39 | | | 750 | | | | 819,338 | |
Dallas Texas Area Rapid Transit, Refunding RB, Series A, 5.00%, 12/01/48 | | | 3,160 | | | | 3,465,288 | |
Dallas-Fort Worth International Airport, ARB, Joint Improvement, AMT: | | | | | | | | |
Series D, 5.00%, 11/01/38 | | | 1,975 | | | | 2,060,320 | |
Series D, 5.00%, 11/01/42 | | | 1,500 | | | | 1,562,190 | |
Series H, 5.00%, 11/01/32 | | | 3,000 | | | | 3,151,410 | |
Dallas-Fort Worth International Airport, Refunding ARB, Series F, 5.25%, 11/01/33 | | | 975 | | | | 1,072,305 | |
Grand Parkway Transportation Corp., RB, Subordinate Tier Toll Revenue Bonds, TELA Supported, Series A, 5.00%, 10/01/48 | �� | | 1,810 | | | | 1,991,018 | |
Leander ISD, GO, Refunding, CAB, Series D (PSF-GTD), 0.00%, 08/15/38(b) | | | 3,420 | | | | 1,447,789 | |
North Texas Tollway Authority, Refunding RB: | | | | | | | | |
4.25%, 01/01/49(d) | | | 1,225 | | | | 1,202,460 | |
1st Tier System, Series A, 6.00%, 01/01/19(a) | | | 2,270 | | | | 2,284,800 | |
1st Tier System, Series A, 6.00%, 01/01/28 | | | 525 | | | | 528,176 | |
1st Tier System, Series K-2 (AGC), 6.00%, 01/01/19(a) | | | 4,015 | | | | 4,041,178 | |
1st Tier, Series K-1 (AGC), 5.75%, 01/01/19(a) | | | 3,800 | | | | 3,823,218 | |
San Antonio Public Facilities Corp., Refunding RB, Convention Center Refinancing & Expansion Project, CAB(b): | | | | | | | | |
0.00%, 09/15/35 | | | 4,990 | | | | 2,304,182 | |
0.00%, 09/15/36 | | | 11,525 | | | | 5,011,416 | |
0.00%, 09/15/37 | | | 8,245 | | | | 3,371,545 | |
San Antonio Water System, Refunding RB, Junior Lien, Series A, 5.00%, 05/15/48 | | | 1,355 | | | | 1,496,584 | |
Texas Department of Housing & Community Affairs, RB, S/F Housing Mortgage, Series A (Ginnie Mae), 4.25%, 09/01/43 | | | 390 | | | | 391,693 | |
Texas Municipal Gas Acquisition & Supply Corp. III, RB, Natural Gas Utility Improvements: | | | | | | | | |
5.00%, 12/15/31 | | | 1,190 | | | | 1,264,446 | |
5.00%, 12/15/32 | | | 705 | | | | 747,991 | |
Texas Private Activity Bond Surface Transportation Corp., RB, Senior Lien, AMT, Blueridge Transportation Group, 5.00%, 12/31/45 | | | 1,275 | | | | 1,332,656 | |
Texas Transportation Commission, Refunding RB, Central Texas Turnpike System, 1st Tier, Series A, 5.00%, 08/15/41 | | | 3,080 | | | | 3,249,061 | |
| | | | | | | | |
| | | | | | | 51,751,689 | |
| Utah — 0.6% | |
City of Salt Lake Corp. Airport Revenue, ARB, Series A, AMT: | | | | | | | | |
5.00%, 07/01/48 | | | 445 | | | | 480,725 | |
5.00%, 07/01/42 | | | 1,240 | | | | 1,333,731 | |
| | | | | | | | |
| | | | | | | 1,814,456 | |
| Virginia — 0.1% | |
County of Fairfax Virginia IDA, Refunding RB, Health Care-Inova Health(a): | | | | | | | | |
5.50%, 05/15/19 | | | 225 | | | | 229,311 | |
5.50%, 05/15/19 | | | 125 | | | | 127,395 | |
| | | | | | | | |
| | | | | | | 356,706 | |
| | | | | | | | |
| Security | | Par
(000) | | | Value | |
| Washington — 2.3% | |
Port of Seattle Washington, RB, AMT: | | | | | | | | |
Intermediate Lien, Series C, 5.00%, 04/01/40 | | $ | 1,015 | | | $ | 1,086,710 | |
Series A, 5.00%, 05/01/43 | | | 1,955 | | | | 2,096,112 | |
State of Washington Convention Center Public Facilities District, RB, 5.00%, 07/01/43 | | | 615 | | | | 671,592 | |
Washington Health Care Facilities Authority, RB, Providence Health & Services: | | | | | | | | |
4.00%, 10/01/45 | | | 705 | | | | 686,818 | |
Series A, 5.00%, 10/01/39 | | | 525 | | | | 540,078 | |
Series A, 5.25%, 10/01/39 | | | 625 | | | | 647,125 | |
Washington Health Care Facilities Authority, Refunding RB, Multicare Health System, Series B, 4.00%, 08/15/41 | | | 1,835 | | | | 1,794,593 | |
| | | | | | | | |
| | | | | | | 7,523,028 | |
| West Virginia — 0.8% | |
West Virginia Hospital Finance Authority, RB, Improvement West Virginia University Health System Obligated Group, Series A, 4.00%, 06/01/51 | | | 2,945 | | | | 2,675,768 | |
| | | | | | | | |
| Wisconsin — 0.5% | |
State of Wisconsin Health & Educational Facilities Authority, RB: | | | | | | | | |
Ascension Health Senior Credit Group, Series E, 5.00%, 11/15/33 | | | 1,375 | | | | 1,409,925 | |
Marshfield Clinic Health System, Inc. Series C, 4.00%, 02/15/42 | | | 315 | | | | 300,274 | |
| | | | | | | | |
| | | | | | | 1,710,199 | |
| | | | | | | | |
Total Municipal Bonds — 124.8%
(Cost — $393,588,393) | | | | 411,564,723 | |
| | | | | |
|
Municipal Bonds Transferred to Tender Option Bond Trusts(e) | |
|
Arizona — 0.9% | |
City of Phoenix Civic Improvement Corp., Refunding RB, Water System, Junior Lien, Series A, 5.00%, 07/01/19(a) | | | 1,200 | | | | 1,224,024 | |
County of Maricopa Industrial Development Authority, RB, Banner Health, Series A, 4.00%, 01/01/41 | | | 1,710 | | | | 1,685,182 | |
| | | | | | | | |
| | | | | | | 2,909,206 | |
| California — 2.1% | |
Bay Area Toll Authority, Refunding RB, San Francisco Bay Area Toll Bridge Subordinate, 4.00%, 04/01/47(f) | | | 3,827 | | | | 3,837,291 | |
Los Angeles California Unified School District, GO, Election of 2008, Series B-1, 5.25%, 07/01/42(f) | | | 1,571 | | | | 1,803,211 | |
San Diego California Community College District, GO, Election of 2002, 5.25%, 08/01/19(a) | | | 404 | | | | 414,288 | |
University of California, RB, Series O, 5.75%, 05/15/19(a) | | | 840 | | | | 858,163 | |
| | | | | | | | |
| | | | | | | 6,912,953 | |
| Colorado — 3.2% | |
City & County of Denver Colorado Airport System Revenue, Refunding ARB, Subordinate System, Series A, AMT, 5.25%, 12/01/48(f) | | | 2,324 | | | | 2,581,262 | |
Colorado Health Facilities Authority, Refunding RB, Catholic Health Initiatives, Series A: | | | | | | | | |
5.50%, 07/01/34(f) | | | 900 | | | | 919,598 | |
5.00%, 02/01/41 | | | 7,000 | | | | 7,165,235 | |
| | | | | | | | |
| | | | | | | 10,666,095 | |
| Connecticut — 0.4% | |
State of Connecticut Health & Educational Facility Authority, Refunding RB, Trinity Health Credit Group, 5.00%, 12/01/45 | | | 1,381 | | | | 1,496,333 | |
| | | | | | | | |
| | |
| 32 | | 2018 BLACKROCK SEMI-ANNUAL REPORTTO SHAREHOLDERS |
| | |
Schedule of Investments (unaudited) (continued) October 31, 2018 | | BlackRock MuniEnhanced Fund, Inc. (MEN) (Percentages shown are based on Net Assets) |
| | | | | | | | |
| Security | | Par
(000) | | | Value | |
| District of Columbia — 0.3% | |
District of Columbia, RB, Series A, 5.50%, 12/01/30(f) | | $ | 1,005 | | | $ | 1,039,665 | |
| | | | | | | | |
| Florida — 4.9% | |
County of Miami-Dade Florida Transit System, Refunding RB, Sales Tax, 5.00%, 07/01/42 | | | 4,480 | | | | 4,781,191 | |
County of Miami-Dade Florida Water & Sewer System, RB, (AGM), 5.00%, 10/01/20(a) | | | 4,621 | | | | 4,869,728 | |
County of Orange Florida School Board, COP, Series A (AGC), 5.50%, 08/01/19(a) | | | 3,544 | | | | 3,636,702 | |
South Miami Health Facilities Authority, Refunding RB, Baptist Health South Florida, 5.00%, 08/15/47 | | | 2,640 | | | | 2,874,617 | |
| | | | | | | | |
| | | | | | | 16,162,238 | |
| Illinois — 3.3% | |
State of Illinois, RB, Build Illinois, Series B, 5.25%, 06/15/19(a)(f) | | | 4,399 | | | | 4,486,037 | |
State of Illinois Toll Highway Authority, RB: | | | | | | | | |
Series A, 5.00%, 01/01/38 | | | 2,138 | | | | 2,284,292 | |
Series A, 5.00%, 01/01/40 | | | 2,730 | | | | 2,965,625 | |
Series B, 5.00%, 01/01/40 | | | 1,050 | | | | 1,131,332 | |
| | | | | | | | |
| | | | | | | 10,867,286 | |
| Kansas — 1.6% | |
County of Wyandotte Kansas Unified School District, GO, Series A, 5.50%, 09/01/47 | | | 4,723 | | | | 5,426,798 | |
| | | | | | | | |
| Louisiana — 0.5% | |
County of St. Louisiana Gasoline & Fuels Tax Revenue, Refunding RB, First Lien, Series A, 4.00%, 05/01/41 | | | 1,515 | | | | 1,521,030 | |
| | | | | | | | |
| Maryland — 1.3% | |
City of Baltimore Maryland, RB, Wastewater Project, Series A, 5.00%, 07/01/46 | | | 1,061 | | | | 1,162,425 | |
City of Baltimore Maryland Water Utility Fund, RB, Sub-Water Projects, Series A, 5.00%, 07/01/41 | | | 2,808 | | | | 3,084,285 | |
| | | | | | | | |
| | | | | | | 4,246,710 | |
| Massachusetts — 0.5% | |
Commonwealth of Massachusetts, GO, Series A, 5.00%, 03/01/46 | | | 1,461 | | | | 1,586,166 | |
| | | | | | | | |
| Michigan — 3.3% | |
Michigan Finance Authority, RB, Beaumont Health Credit Group, Series A, 5.00%, 11/01/44 | | | 1,970 | | | | 2,098,298 | |
Michigan Finance Authority, Refunding RB, Hospital, Trinity Health Credit Group, 5.00%, 12/01/39 | | | 7,530 | | | | 7,935,039 | |
State of Michigan Building Authority, Refunding RB, Facilities Program, Series I, 5.00%, 10/15/45 | | | 870 | | | | 952,541 | |
| | | | | | | | |
| | | | | | | 10,985,878 | |
| Nevada — 5.3% | |
City of Las Vegas Nevada, GO, Limited Tax, Performing Arts Center, 6.00%, 04/01/19(a)(f) | | | 3,778 | | | | 3,840,087 | |
County of Clark Nevada, GOL, Stadium Improvement, Series A, 5.00%, 06/01/38 | | | 3,061 | | | | 3,429,547 | |
County of Clark Nevada Water Reclamation District, GO, Series B(a): | | | | | | | | |
5.50%, 07/01/19 | | | 4,499 | | | | 4,605,094 | |
5.75%, 07/01/19 | | | 1,829 | | | | 1,875,674 | |
Las Vegas Valley Water District Nevada, GO, Refunding, Water Improvement, Series A, 5.00%, 06/01/46 | | | 3,460 | | | | 3,771,582 | |
| | | | | | | | |
| | | | | | | 17,521,984 | |
| New Jersey — 2.2% | |
County of Hudson New Jersey Improvement Authority, RB, Hudson County Vocational-Technical Schools Project, 5.25%, 05/01/51 | | | 800 | | | | 879,440 | |
| | | | | | | | |
| Security | | Par
(000) | | | Value | |
| New Jersey (continued) | |
New Jersey State Turnpike Authority, Refunding RB: | | | | | | | | |
Series B, 4.00%, 01/01/37 | | $ | 2,308 | | | $ | 2,333,119 | |
Series G, 4.00%, 01/01/43 | | | 2,146 | | | | 2,129,708 | |
New Jersey Transportation Trust Fund Authority, RB, Transportation System, Series B, 5.25%, 06/15/36(f) | | | 1,840 | | | | 1,916,081 | |
| | | | | | | | |
| | | | | | | 7,258,348 | |
| New York — 6.8% | |
City of New York Water & Sewer System, Refunding RB, Series DD, 5.00%, 06/15/35 | | | 1,665 | | | | 1,834,214 | |
City of New York New York Transitional Finance Authority, RB, Future Tax, Sub-Series A-3, 5.00%, 08/01/40(f) | | | 3,058 | | | | 3,382,004 | |
City of New York Transitional Finance Authority, BARB, Series S-1, 4.00%, 07/15/42(f) | | | 1,680 | | | | 1,662,142 | |
City of New York Water & Sewer System, Refunding RB, 2nd General Resolution, Fiscal 2013, Series CC, 5.00%, 06/15/47 | | | 5,680 | | | | 6,218,082 | |
Metropolitan Transportation Authority, RB, Transportation, Sub-Series D-1, 5.25%, 11/15/44 | | | 3,470 | | | | 3,833,084 | |
Metropolitan Transportation Authority, Refunding RB, Series C-1, 5.25%, 11/15/56 | | | 1,498 | | | | 1,636,506 | |
Port Authority of New York & New Jersey, Refunding ARB, Consolidated, 198th Series, 5.25%, 11/15/56 | | | 2,241 | | | | 2,480,178 | |
Triborough Bridge & Tunnel Authority, RB, General, Series A-2(f): | | | | | | | | |
5.25%, 11/15/18(a) | | | 486 | | | | 487,083 | |
5.25%, 11/15/34 | | | 814 | | | | 814,581 | |
| | | | | | | | |
| | | | | | | 22,347,874 | |
| Ohio — 1.7% | |
Northeast Ohio Regional Sewer District, Refunding RB: | | | | | | | | |
4.00%, 11/15/49(f) | | | 2,115 | | | | 2,081,675 | |
4.00%, 11/15/43 | | | 2,912 | | | | 2,918,370 | |
State of Ohio, RB, Cleveland Clinic Health Obligated Group, Series B, 5.50%, 01/01/34 | | | 580 | | | | 583,329 | |
| | | | | | | | |
| | | | | | | 5,583,374 | |
| Pennsylvania — 0.7% | |
County of Westmoreland Pennsylvania Municipal Authority, Refunding RB, (BAM), 5.00%, 08/15/42 | | | 900 | | | | 967,921 | |
Philadelphia Authority for Industrial Development, RB, Childrens Hospital of Philadelphia Project, Series A, 4.00%, 07/01/44 | | | 1,229 | | | | 1,229,315 | |
| | | | | | | | |
| | | | | | | 2,197,236 | |
| Rhode Island — 0.4% | |
Rhode Island Housing & Mortgage Finance Corp., Refunding RB, S/F Housing, Home Ownership Opportunity Bonds, Series 69-B (Ginnie Mae, Fannie Mae & Freddie Mac), 3.95%, 10/01/43 | | | 1,450 | | | | 1,431,824 | |
| | | | | | | | |
| South Carolina — 0.4% | |
South Carolina Public Service Authority, Refunding RB, Series A(a)(f): | | | | | | | | |
5.50%, 01/01/19 | | | 102 | | | | 102,206 | |
5.50%, 01/01/19 | | | 1,175 | | | | 1,181,789 | |
| | | | | | | | |
| | | | | | | 1,283,995 | |
| Texas — 2.5% | |
City of Houston Texas Community College, GO, Limited Tax, 4.00%, 02/15/43 | | | 1,470 | | | | 1,458,632 | |
County of Harris Texas Toll Road Authority, Refunding RB, Senior Lien, Series A, 5.00%, 08/15/43 | | | 1,229 | | | | 1,360,606 | |
County of Tarrant Texas Cultural Education Facilities Finance Corp., Refunding RB, Texas Health Resources System, Series A, 5.00%, 02/15/41 | | | 3,440 | | | | 3,730,259 | |
| | | | |
| SCHEDULES OF INVESTMENTS | | | 33 | |
| | |
Schedule of Investments (unaudited) (continued) October 31, 2018 | | BlackRock MuniEnhanced Fund, Inc. (MEN) (Percentages shown are based on Net Assets) |
| | | | | | | | |
| Security | | Par
(000) | | | Value | |
| Texas (continued) | |
San Antonio Public Facilities Corp., Refunding RB, Convention Center Refinancing And Expansion Project, 4.00%, 09/15/42 | | $ | 1,874 | | | $ | 1,878,552 | |
| | | | | | | | |
| | | | | | | 8,428,049 | |
| Virginia — 0.8% | |
Hampton Roads Transportation Accountability Commission, RB, Transportation Fund, Senior Lien, Series A, 5.50%, 07/01/57 | | | 2,234 | | | | 2,573,803 | |
| | | | | | | | |
| Washington — 1.8% | |
Metropolitan Washington Airports Authority, Refunding ARB, Series A, AMT, 5.00%, 10/01/30 | | | 2,530 | | | | 2,713,577 | |
Washington Health Care Facilities Authority, Refunding RB, Seattle Children’s Hospital, Series B, 5.00%, 10/01/38 | | | 2,880 | | | | 3,225,907 | |
| | | | | | | | |
| | | | | | | 5,939,484 | |
| Wisconsin — 1.1% | |
Wisconsin Health & Educational Facilities Authority, Refunding RB, Froedtert & Community Health, Inc., Obligated Group: | | | | | | | | |
Series A, 5.00%, 04/01/42 | | | 1,980 | | | | 2,085,663 | |
Series C, 5.25%, 04/01/19(a)(f) | | | 1,430 | | | | 1,448,987 | |
| | | | | | | | |
| | | | | | | 3,534,650 | |
| | | | | | | | |
Total Municipal Bonds Transferred to Tender Option Bond
Trusts — 46.0%
(Cost — $152,482,326) | | | | 151,920,979 | |
| | | | | |
Total Long-Term Investments — 170.8%
(Cost — $546,070,719) | | | | 563,485,702 | |
| | | | | | | | |
| | | | | | | | |
| Security | |
Shares | | | Value | |
| Short-Term Securities — 0.9% | |
BlackRock Liquidity Funds, MuniCash, Institutional Class, 1.45%(g)(h) | | | 2,882,896 | | | $ | 2,883,184 | |
| | | | | | | | |
Total Short-Term Securities — 0.9%
(Cost — $2,883,184) | | | | 2,883,184 | |
| | | | | | | | |
| |
Total Investments — 171.7%
(Cost — $548,953,903) | | | | 566,368,886 | |
Liabilities in Excess of Other Assets — (0.7)% | | | | (2,290,871 | ) |
Liability for TOB Trust Certificates, Including Interest Expense and Fees Payable — (27.9)% | | | | (91,986,593 | ) |
VRDP Shares at Liquidation Value, Net of Deferred Offering
Costs — (43.1)% | | | | (142,274,618 | ) |
| | | | | | | | |
Net Assets Applicable to Common Shares — 100.0% | | | $ | 329,816,804 | |
| | | | | | | | |
| (a) | U.S. Government securities, held in escrow, are used to pay interest on this security, as well as to retire the bond in full at the date indicated, typically at a premium to par. |
| (c) | Step-up bond that pays an initial coupon rate for the first period and then a higher coupon rate for the following periods. Rate as of period end. |
| (d) | When-issued security. |
| (e) | Represent bonds transferred to a TOB Trust in exchange of cash and residual certificates received by the Fund. These bonds serve as collateral in a secured borrowing. See Note 4 of the Notes to Financial Statements for details. |
| (f) | All or a portion of security is subject to a recourse agreement. The aggregate maximum potential amount the Fund could ultimately be required to pay under the agreements, which expire between December 1, 2018 to April 1, 2039, is $19,944,102. See Note 4 of the Notes to Financial Statements for details. |
| (g) | Annualized 7-day yield as of period end. |
| (h) | During the six months ended October 31, 2018, investments in issuers considered to be an affiliate of the Fund for purposes of Section 2(a)(3) of the Investment Company Act of 1940, as amended,were as follows: |
| | | | | | | | | | | | | | | | | | | | | | | | | | | | |
| Affiliate | | Shares
Held at
04/30/18 | | | Net
Activity | | | Shares
Held at
10/31/18 | | | Value at
10/31/18 | | | Income | | | Net
Realized
Gain (Loss) (a) | | | Change in
Unrealized
Appreciation
(Depreciation) | |
BlackRock Liquidity Funds, MuniCash, Institutional Class | | | — | | | | 2,882,896 | | | | 2,882,896 | | | $ | 2,883,184 | | | $ | 9,066 | | | $ | 277 | | | $ | — | |
| | | | | | | | | | | | | | | | | | | | | | | | | | | | |
| | (a) | Includes net capital gain distributions, if applicable. | |
Derivative Financial Instruments Outstanding as of Period End
Futures Contracts
| | | | | | | | | | | | | | | | |
| Description | | Number of
Contracts | | | Expiration
Date | | | Notional
Amount
(000) | | | Value /
Unrealized
Appreciation
(Depreciation) | |
Short Contracts: | | | | | | | | | | | | | | | | |
10-Year U.S. Treasury Note | | | 18 | | | | 12/19/18 | | | $ | 2,132 | | | $ | 12,803 | |
Long U.S. Treasury Bond | | | 98 | | | | 12/19/18 | | | | 13,536 | | | | 308,178 | |
5-Year U.S. Treasury Note | | | 24 | | | | 12/31/18 | | | | 2,697 | | | | 8,876 | |
| | | | | | | | | | | | | | | | |
| | | | | | | | | | | | | | $ | 329,857 | |
| | | | | | | | | | | | | | | | |
| | |
| 34 | | 2018 BLACKROCK SEMI-ANNUAL REPORTTO SHAREHOLDERS |
| | |
Schedule of Investments (unaudited) (continued) October 31, 2018 | | BlackRock MuniEnhanced Fund, Inc. (MEN) |
Derivative Financial Instruments Categorized by Risk Exposure
As of period end, the fair values of derivative financial instruments located in the Statements of Assets and Liabilities were as follows:
| | | | | | | | | | | | | | | | | | | | | | | | | | | | |
| | | Commodity
Contracts | | | Credit
Contracts | | | Equity
Contracts | | | Foreign
Currency
Exchange
Contracts | | | Interest
Rate
Contracts | | | Other
Contracts | | | Total | |
Assets — Derivative Financial Instruments | | | | | | | | | | | | | | | | | | | | | | | | | | | | |
Futures contracts | | | | | | | | | | | | | | | | | | | | | | | | | | | | |
Net unrealized appreciation(a) | | $ | — | | | $ | — | | | $ | — | | | $ | — | | | $ | 329,857 | | | $ | — | | | $ | 329,857 | |
| | | | | | | | | | | | | | | | | | | | | | | | | | | | |
| | (a) | Includes cumulative appreciation (depreciation) on futures contracts if any, as reported in the Schedule of Investments. Only current day’s variation margin is reported within the Statements of Assets and Liabilities. | |
For the six months ended October 31, 2018, the effect of derivative financial instruments in the Statements of Operations was as follows:
| | | | | | | | | | | | | | | | | | | | | | | | | | | | |
| | | Commodity
Contracts | | | Credit
Contracts | | | Equity
Contracts | | | Foreign
Currency
Exchange
Contracts | | | Interest
Rate
Contracts | | | Other
Contracts | | | Total | |
Net Realized Gain (Loss) from: | | | | | | | | | | | | | | | | | | | | | | | | | | | | |
Futures contracts | | $ | — | | | $ | — | | | $ | — | | | $ | — | | | $ | 464,110 | | | $ | — | | | $ | 464,110 | |
| | | | | | | | | | | | | | | | | | | | | | | | | | | | |
Net Change in Unrealized Appreciation (Depreciation) on: | | | | | | | | | | | | | | | | | | | | | | | | | | | | |
Futures contracts | | $ | — | | | $ | — | | | $ | — | | | $ | — | | | $ | 277,230 | | | $ | — | | | $ | 277,230 | |
| | | | | | | | | | | | | | | | | | | | | | | | | | | | |
Average Quarterly Balances of Outstanding Derivative Financial Instruments
| | | | |
Futures contracts: | |
Average notional value of contracts — short | | $ | 23,577,555 | |
For more information about the Fund’s investment risks regarding derivative financial instruments, refer to the Notes to Financial Statements.
Fair Value Hierarchy as of Period End
Various inputs are used in determining the fair value of investments and derivative financial instruments. For information about the Fund’s policy regarding valuation of investments and derivative financial instruments, refer to the Notes to Financial Statements.
The following tables summarize the Fund’s investments and derivative financial instruments categorized in the disclosure hierarchy:
| | | | | | | | | | | | | | | | |
| | | Level 1 | | | Level 2 | | | Level 3 | | | Total | |
Assets: | |
Investments: | |
Long-Term Investments(a) | | $ | — | | | $ | 563,485,702 | | | $ | — | | | $ | 563,485,702 | |
Short-Term Securities | | | 2,883,184 | | | | — | | | | — | | | | 2,883,184 | |
| | | | | | | | | | | | | | | | |
| | $ | 2,883,184 | | | $ | 563,485,702 | | | $ | — | | | $ | 566,368,886 | |
| | | | | | | | | | | | | | | | |
Derivative Financial Instruments(b) | |
Assets: | |
Interest rate contracts | | $ | 329,857 | | | $ | — | | | $ | — | | | $ | 329,857 | |
| | | | | | | | | | | | | | | | |
| | (a) | See above Schedule of Investments for values in each state or political subdivision. | |
| | (b) | Derivative financial instruments are futures contracts, which are valued at the unrealized appreciation (depreciation) on the instrument. | |
The Fund may hold assets and/or liabilities in which the fair value approximates the carrying for financial statement purposes. As of period end, such assets and/or liabilities are categorized within the disclosure hierarchy as follows:
| | | | | | | | | | | | | | | | |
| | | Level 1 | | | Level 2 | | | Level 3 | | | Total | |
Liabilities: | |
TOB Trust Certificates | | $ | — | | | $ | (91,588,127 | ) | | $ | — | | | $ | (91,588,127 | ) |
VRDP Shares at Liquidation Value | | | — | | | | (142,500,000 | ) | | | — | | | | (142,500,000 | ) |
| | | | | | | | | | | | | | | | |
| | $ | — | | | $ | (234,088,127 | ) | | $ | — | | | $ | (234,088,127 | ) |
| | | | | | | | | | | | | | | | |
During the six months ended October 31, 2018, there were no transfers between levels.
See notes to financial statements.
| | | | |
| SCHEDULES OF INVESTMENTS | | | 35 | |
| | |
Schedule of Investments (unaudited) October 31, 2018 | | BlackRock MuniHoldings Fund, Inc. (MHD) (Percentages shown are based on Net Assets) |
| | | | | | | | |
| Security | | Par
(000) | | | Value | |
| Municipal Bonds — 116.6% | |
|
Alabama — 2.1% | |
County of Jefferson Alabama Sewer, Refunding RB: | | | | | | | | |
Senior Lien, Series A (AGM), 5.00%, 10/01/44 | | $ | 570 | | | $ | 609,324 | |
Senior Lien, Series A (AGM), 5.25%, 10/01/48 | | | 1,090 | | | | 1,175,761 | |
Sub-Lien, Series D, 6.00%, 10/01/42 | | | 1,000 | | | | 1,129,060 | |
Sub-Lien, Series D, 7.00%, 10/01/51 | | | 1,545 | | | | 1,824,213 | |
| | | | | | | | |
| | | | 4,738,358 | |
| Arizona — 2.7% | |
City of Phoenix Arizona IDA, RB, Legacy Traditional Schools Projects, Series A, 5.00%, 07/01/46(a) | | | 1,230 | | | | 1,232,238 | |
Salt Verde Financial Corp., RB, Senior: | | | | | | | | |
5.00%, 12/01/32 | | | 2,000 | | | | 2,266,800 | |
5.00%, 12/01/37 | | | 2,360 | | | | 2,676,193 | |
| | | | | | | | |
| | | | 6,175,231 | |
| California — 11.7% | |
California Health Facilities Financing Authority, RB: | | | | | | | | |
St. Joseph Health System, Series A, 5.75%, 07/01/39 | | | 1,530 | | | | 1,568,525 | |
Sutter Health, Series B, 6.00%, 08/15/20(b) | | | 2,200 | | | | 2,359,214 | |
California Health Facilities Financing Authority, Refunding RB, St. Joseph Health System, Series A, 5.00%, 07/01/33 | | | 875 | | | | 954,984 | |
California Municipal Finance Authority, RB, Senior, Caritas Affordable Housing, Inc. Projects, S/F Housing, Series A: | | | | | | | | |
5.25%, 08/15/39 | | | 105 | | | | 113,005 | |
5.25%, 08/15/49 | | | 265 | | | | 283,780 | |
California Municipal Finance Authority, Refunding RB, Community Medical Centers, Series A, 5.00%, 02/01/42 | | | 165 | | | | 177,444 | |
California Pollution Control Financing Authority, RB, Poseidon Resources (Channel Side) LP Desalination Project, AMT, 5.00%, 11/21/45(a) | | | 2,200 | | | | 2,265,098 | |
California Statewide Communities Development Authority, RB, Series A: | | | | | | | | |
John Muir Health, 5.13%, 07/01/19(b) | | | 1,510 | | | | 1,544,066 | |
Loma Linda University Medical Center,
5.00%, 12/01/46(a) | | | 330 | | | | 335,607 | |
City of Los Angeles California Department of Airports, Refunding ARB, Los Angeles International Airport, Series A, 5.25%, 05/15/39 | | | 555 | | | | 563,819 | |
City of Stockton California Public Financing Authority, RB, Delta Water Supply Project, Series A, 6.25%, 10/01/38 | | | 255 | | | | 295,372 | |
Golden State Tobacco Securitization Corp., Refunding RB, Series A-1, 5.25%, 06/01/47 | | | 730 | | | | 733,986 | |
Montebello Unified School District, GO, CAB (NPFGC), 0.00%, 08/01/22(c) | | | 2,405 | | | | 2,163,033 | |
San Diego Unified School District California, GO, CAB, Election of 2008, Series A, 0.00%, 07/01/29(c) | | | 3,475 | | | | 2,420,511 | |
State of California, GO, Various Purposes: | | | | | | | | |
6.50%, 04/01/19(b) | | | 4,535 | | | | 4,626,199 | |
6.50%, 04/01/33 | | | 3,835 | | | | 3,905,679 | |
State of California Public Works Board, LRB, Various Capital Projects: | | | | | | | | |
Series I, 5.00%, 11/01/38 | | | 550 | | | | 599,626 | |
Sub-Series I-1, 6.38%, 11/01/19(b) | | | 820 | | | | 857,663 | |
Tobacco Securitization Authority of Southern California, Refunding RB, Tobacco Settlement, Asset-Backed, Senior Series A-1, 4.75%, 06/01/25 | | | 890 | | | | 892,207 | |
| | | | | | | | |
| | | | 26,659,818 | |
| Colorado — 2.2% | |
Colorado Educational & Cultural Facilities Authority, RB, Charter School, Colorado Springs, 5.50%, 07/01/40 | | | 1,455 | | | | 1,487,112 | |
Regional Transportation District, COP, Refunding, Series A, 5.38%, 06/01/31 | | | 710 | | | | 741,652 | |
| | | | | | | | |
| Security | | Par
(000) | | | Value | |
| Colorado (continued) | |
Regional Transportation District, RB, Denver Transit Partners Eagle P3 Project, 6.00%, 01/15/34 | | $ | 1,425 | | | $ | 1,474,219 | |
University of Colorado, RB, Series A, 5.38%, 06/01/19(b) | | | 1,250 | | | | 1,274,788 | |
| | | | | | | | |
| | | | 4,977,771 | |
| Delaware — 1.9% | |
County of Sussex Delaware, RB, NRG Energy, Inc., Indian River Power LLC Project, 6.00%, 10/01/40 | | | 790 | | | | 835,488 | |
Delaware Transportation Authority, RB, U.S. 301 Project, 5.00%, 06/01/55 | | | 840 | | | | 902,227 | |
State of Delaware EDA, RB, Exempt Facilities, Indian River Power LLC Project, 5.38%, 10/01/45 | | | 2,430 | | | | 2,520,882 | |
| | | | | | | | |
| | | | 4,258,597 | |
| District of Columbia — 4.8% | |
District of Columbia, Refunding RB, Georgetown University: | | | | | | | | |
5.00%, 04/01/35 | | | 315 | | | | 348,204 | |
Issue, 5.00%, 04/01/42 | | | 365 | | | | 397,375 | |
District of Columbia, Tax Allocation Bonds, City Market at O Street Project, 5.13%, 06/01/41 | | | 1,520 | | | | 1,603,858 | |
Metropolitan Washington Airports Authority, Refunding ARB, Dulles Toll Road, CAB, 2nd Senior Lien, Series B (AGC), 0.00%, 10/01/35(c) | | | 13,485 | | | | 6,458,776 | |
Metropolitan Washington Airports Authority, Refunding RB, Dulles Toll Road, 1st Senior Lien, Series A: | | | | | | | | |
5.00%, 10/01/39 | | | 505 | | | | 515,863 | |
5.25%, 10/01/44 | | | 1,470 | | | | 1,504,516 | |
| | | | | | | | |
| | | | 10,828,592 | |
| Florida — 4.5% | |
City of Clearwater Florida Water & Sewer Revenue, RB, Series A, 5.25%, 12/01/19(b) | | | 2,375 | | | | 2,457,840 | |
County of Collier Florida Health Facilities Authority, Refunding RB, Series A, 5.00%, 05/01/45 | | | 960 | | | | 1,005,494 | |
County of Miami-Dade Florida Aviation, Refunding ARB, Miami International Airport, Series A-1, 5.38%, 10/01/20(b) | | | 2,620 | | | | 2,777,043 | |
Mid-Bay Florida Bridge Authority, RB, Springing Lien, Series A, 7.25%, 10/01/21(b) | | | 2,095 | | | | 2,377,343 | |
Village Community Development District No.10, Special Assessment Bonds, 5.13%, 05/01/43 | | | 1,400 | | | | 1,509,172 | |
| | | | | | | | |
| | | | 10,126,892 | |
| Georgia — 1.6% | |
County of Dalton Whitfield Joint Development Authority, RB, Hamilton Health Care System Obligation,
4.00%, 08/15/48 | | | 2,645 | | | | 2,586,254 | |
County of Gainesville Georgia & Hall Hospital Authority, Refunding RB, Northeast Georgia Health System, Inc. Project, Series A (GTD), 5.50%, 08/15/54 | | | 370 | | | | 412,957 | |
DeKalb Georgia Private Hospital Authority, Refunding RB, Children’s Healthcare, 5.25%, 11/15/39 | | | 585 | | | | 601,591 | |
| | | | | | | | |
| | | | 3,600,802 | |
| Hawaii — 0.4% | |
State of Hawaii Harbor System, RB, Series A,
5.25%, 07/01/30 | | | 945 | | | | 988,479 | |
| | | | | | | | |
| Idaho — 0.2% | |
Idaho Health Facilities Authority, RB, Trinity Health Credit Group, Series A, 5.00%, 12/01/46 | | | 540 | | | | 579,285 | |
| | | | | | | | |
| Illinois — 16.2% | |
Chicago Board of Education, GO: | | | | | | | | |
Dedicated Revenues, Series H, 5.00%, 12/01/36 | | | 350 | | | | 352,783 | |
Project, Series C, 5.25%, 12/01/35 | | | 1,075 | | | | 1,094,533 | |
Chicago Board of Education, GO, Refunding Dedicated Revenues, Series C, 5.00%, 12/01/30 | | | 605 | | | | 619,163 | |
| | |
| 36 | | 2018 BLACKROCK SEMI-ANNUAL REPORTTO SHAREHOLDERS |
| | |
Schedule of Investments (unaudited) (continued) October 31, 2018 | | BlackRock MuniHoldings Fund, Inc. (MHD) (Percentages shown are based on Net Assets) |
| | | | | | | | |
| Security | | Par
(000) | | | Value | |
| Illinois (continued) | |
Chicago Board of Education, GO (continued): | | | | | | | | |
Series F, 5.00%, 12/01/22 | | $ | 455 | | | $ | 471,958 | |
Series G, 5.00%, 12/01/34 | | | 315 | | | | 318,654 | |
City of Chicago Illinois, GO, Project, Series A,
5.00%, 01/01/34 | | | 1,220 | | | | 1,242,777 | |
City of Chicago Illinois, GO, Refunding, Project, Series A, 5.25%, 01/01/32 | | | 2,195 | | | | 2,289,473 | |
City of Chicago Illinois, Special Assessment Bonds, Lake Shore East Project, 6.75%, 12/01/32 | | | 881 | | | | 885,634 | |
City of Chicago Illinois O’Hare International Airport, GARB, 3rd Lien: | | | | | | | | |
Series A, 5.75%, 01/01/21(b) | | | 1,680 | | | | 1,806,403 | |
Series A, 5.75%, 01/01/39 | | | 320 | | | | 339,120 | |
Series C, 6.50%, 01/01/21(b) | | | 4,055 | | | | 4,423,153 | |
City of Chicago Illinois Transit Authority, RB, Sales Tax Receipts, 5.25%, 12/01/40 | | | 730 | | | | 766,544 | |
City of Chicago Illinois Waterworks, Refunding RB, 2nd Lien Project, 5.00%, 11/01/42 | | | 1,000 | | | | 1,041,850 | |
County of Cook Illinois Community College District No. 508, GO, City College of Chicago, 5.50%, 12/01/38 | | | 560 | | | | 582,064 | |
Illinois Finance Authority, Refunding RB, Central Dupage Health, Series B, 5.50%, 11/01/19(b) | | | 1,115 | | | | 1,152,665 | |
Metropolitan Pier & Exposition Authority, Refunding RB, McCormick Place Expansion Project: | | | | | | | | |
CAB, Series B (AGM), 0.00%, 06/15/47(c) | | | 13,220 | | | | 3,225,680 | |
Series B (AGM), 5.00%, 06/15/50 | | | 3,070 | | | | 3,148,592 | |
Series B-2, 5.00%, 06/15/50 | | | 1,740 | | | | 1,740,713 | |
Railsplitter Tobacco Settlement Authority, RB(b): | | | | | | | | |
5.50%, 06/01/21 | | | 315 | | | | 340,109 | |
6.00%, 06/01/21 | | | 800 | | | | 873,736 | |
State of Illinois, GO: | | | | | | | | |
5.00%, 02/01/39 | | | 1,100 | | | | 1,106,468 | |
Series A, 5.00%, 04/01/38 | | | 2,625 | | | | 2,658,049 | |
State of Illinois, RB, Build Illinois, Series B,
5.25%, 06/15/19(b) | | | 440 | | | | 448,831 | |
State of Illinois, GO, Refunding Series B, 5.00%, 10/01/29 | | | 930 | | | | 954,096 | |
State of Illinois Toll Highway Authority, RB, Series C: | | | | | | | | |
Senior, 5.00%, 01/01/36 | | | 1,870 | | | | 2,031,792 | |
5.00%, 01/01/37 | | | 2,000 | | | | 2,167,260 | |
University of Illinois, RB, Auxiliary Facilities System, Series A, 5.00%, 04/01/44 | | | 705 | | | | 750,282 | |
| | | | | | | | |
| | | | 36,832,382 | |
| Indiana — 4.4% | |
City of Valparaiso Indiana, RB, Exempt Facilities, Pratt Paper LLC Project, AMT: | | | | | | | | |
6.75%, 01/01/34 | | | 560 | | | | 639,582 | |
7.00%, 01/01/44 | | | 1,355 | | | | 1,555,106 | |
Indiana Finance Authority, RB, Series A: | | | | | | | | |
CWA Authority Project, 1st Lien, 5.25%, 10/01/38 | | | 2,275 | | | | 2,431,839 | |
Private Activity Bond, Ohio River Bridges East End Crossing Project, AMT, 5.00%, 07/01/44 | | | 310 | | | | 324,533 | |
Private Activity Bond, Ohio River Bridges East End Crossing Project, AMT, 5.00%, 07/01/48 | | | 1,030 | | | | 1,075,598 | |
Private Activity Bond, Ohio River Bridges East End Crossing Project, AMT, 5.25%, 01/01/51 | | | 290 | | | | 305,393 | |
Sisters of St. Francis Health Services, 5.25%, 11/01/19(b) | | | 585 | | | | 603,328 | |
Indiana Finance Authority, Refunding RB, Parkview Health System, Series A: | | | | | | | | |
5.75%, 05/01/19(b) | | | 1,075 | | | | 1,095,113 | |
5.75%, 05/01/31 | | | 225 | | | | 229,266 | |
Indiana Municipal Power Agency, RB, Series B,
6.00%, 01/01/19(b) | | | 775 | | | | 780,270 | |
| | | | | | | | |
| Security | | Par
(000) | | | Value | |
| Indiana (continued) | |
Indianapolis Local Public Improvement Bond Bank, RB, Series A, 5.00%, 01/15/40 | | $ | 880 | | | $ | 956,226 | |
| | | | | | | | |
| | | | 9,996,254 | |
| Iowa — 1.8% | |
Iowa Finance Authority, Refunding RB, Iowa Fertilizer Co. Project: | | | | | | | | |
Series B, 5.25%, 12/01/50(d) | | | 1,955 | | | | 2,076,054 | |
Midwestern Disaster Area, 5.50%, 12/01/22 | | | 5 | | | | 5,009 | |
Midwestern Disaster Area, 5.25%, 12/01/25 | | | 320 | | | | 338,064 | |
Midwestern Disaster Area, 5.88%, 12/01/26(a) | | | 285 | | | | 299,489 | |
Iowa Student Loan Liquidity Corp., Refunding RB, Student Loan, Senior Series A-1, AMT, 5.15%, 12/01/22 | | | 470 | | | | 483,691 | |
Iowa Tobacco Settlement Authority, Refunding RB, Asset-Backed, Series C, 5.63%, 06/01/46 | | | 980 | | | | 981,245 | |
| | | | | | | | |
| | | | 4,183,552 | |
| Kansas — 0.7% | |
Kansas Development Finance Authority, Refunding RB, Adventist Health System/Sunbelt Obligated Group, Series C(b): | | | | | | | | |
5.75%, 11/15/19 | | | 35 | | | | 36,262 | |
5.75%, 11/15/19 | | | 1,485 | | | | 1,541,653 | |
| | | | | | | | |
| | | | 1,577,915 | |
| Kentucky — 0.7% | |
Kentucky Economic Development Finance Authority, RB, Catholic Health Initiatives, Series A, 5.25%, 01/01/45 | | | 705 | | | | 741,216 | |
Kentucky Public Transportation Infrastructure Authority, RB, Downtown Crossing Project, Convertible CAB, 1st Tier, Series C, 0.00%, 07/01/43(e) | | | 865 | | | | 791,648 | |
| | | | | | | | |
| | | | 1,532,864 | |
| Louisiana — 2.0% | |
East Baton Rouge Sewerage Commission, RB, Series A, 5.25%, 02/01/19(b) | | | 570 | | | | 574,794 | |
New Orleans Aviation Board, RB, Passenger Facility Charge, Series A, 5.25%, 01/01/41 | | | 430 | | | | 442,762 | |
Tobacco Settlement Financing Corp., Refunding RB, Asset-Backed, Series A: | | | | | | | | |
5.50%, 05/15/30 | | | 700 | | | | 727,139 | |
5.25%, 05/15/31 | | | 600 | | | | 631,974 | |
5.25%, 05/15/32 | | | 765 | | | | 815,444 | |
5.25%, 05/15/33 | | | 830 | | | | 878,754 | |
5.25%, 05/15/35 | | | 350 | | | | 370,405 | |
| | | | | | | | |
| | | | 4,441,272 | |
| Maine — 0.1% | |
Maine Health & Higher Educational Facilities Authority, RB, Series A: | | | | | | | | |
5.00%, 07/01/19(b) | | | 65 | | | | 66,282 | |
5.00%, 07/01/39 | | | 145 | | | | 147,310 | |
| | | | | | | | |
| | | | 213,592 | |
| Maryland — 1.2% | |
Maryland EDC, RB, Transportation Facilities Project, Series A, 5.75%, 06/01/20(b) | | | 300 | | | | 317,025 | |
Maryland EDC, Refunding RB, CNX Marine Terminals, Inc., 5.75%, 09/01/25 | | | 530 | | | | 547,225 | |
Maryland Health & Higher Educational Facilities Authority, RB, Trinity Health Credit Group, Series 2017,
5.00%, 12/01/46 | | | 305 | | | | 334,618 | |
Maryland Health & Higher Educational Facilities Authority, Refunding RB, Charlestown Community Project,
6.25%, 01/01/21(b) | | | 1,520 | | | | 1,645,309 | |
| | | | | | | | |
| | | | 2,844,177 | |
| | | | |
| SCHEDULES OF INVESTMENTS | | | 37 | |
| | |
Schedule of Investments (unaudited) (continued) October 31, 2018 | | BlackRock MuniHoldings Fund, Inc. (MHD) (Percentages shown are based on Net Assets) |
| | | | | | | | |
| Security | | Par
(000) | | | Value | |
| Massachusetts — 0.7% | |
Massachusetts Development Finance Agency, Refunding RB, Boston University, Series P, 5.45%, 05/15/59 | | $ | 1,165 | | | $ | 1,330,966 | |
Massachusetts Health & Educational Facilities Authority, Refunding RB, Partners Healthcare System, Series J1, 5.00%, 07/01/19(b) | | | 255 | | | | 260,202 | |
| | | | | | | | |
| | | | 1,591,168 | |
| Michigan — 3.1% | |
City of Detroit Michigan Sewage Disposal System, Refunding RB, Senior Lien, Series A, 5.25%, 07/01/39 | | | 3,085 | | | | 3,265,719 | |
Kalamazoo Hospital Finance Authority, Refunding RB, Bronson Methodist Hospital: | | | | | | | | |
5.50%, 05/15/20(b) | | | 530 | | | | 556,023 | |
5.50%, 05/15/36 | | | 425 | | | | 441,805 | |
Michigan Finance Authority, Refunding RB, Detroit Water & Sewage Department Project, Senior Lien, Series C-1, 5.00%, 07/01/44 | | | 630 | | | | 665,979 | |
Michigan State Hospital Finance Authority, Refunding RB, Henry Ford Health System, 5.75%, 11/15/19(b) | | | 2,105 | | | | 2,184,211 | |
| | | | | | | | |
| | | | 7,113,737 | |
| Minnesota — 2.0% | |
City of Minneapolis Minnesota, Refunding RB, Fairview Health Services, Series A, 6.75%, 11/15/18(b) | | | 2,135 | | | | 2,138,779 | |
Duluth Economic Development Authority, Refunding RB, Essentia Health Obligated Group, Series A(f): | | | | | | | | |
4.25%, 02/15/48 | | | 750 | | | | 716,085 | |
5.25%, 02/15/53 | | | 1,500 | | | | 1,599,765 | |
| | | | | | | | |
| | | | 4,454,629 | |
| Mississippi — 0.3% | |
University of Southern Mississippi, RB, Campus Facilities Improvements Project, 5.38%, 09/01/19(b) | | | 675 | | | | 694,049 | |
| | | | | | | | |
| Missouri — 0.2% | |
Bi-State Development Agency of the Missouri-Illinois Metropolitan District, Refunding RB, Combined Lien, Series A, 5.00%, 10/01/44 | | | 175 | | | | 189,647 | |
State of Missouri Health & Educational Facilities Authority, Refunding RB, St. Louis College of Pharmacy Project, 5.50%, 05/01/43 | | | 175 | | | | 183,943 | |
| | | | | | | | |
| | | | 373,590 | |
| Nebraska — 0.3% | |
Central Plains Nebraska Energy Project, RB, Gas Project No. 3, 5.25%, 09/01/37 | | | 575 | | | | 622,978 | |
| | | | | | | | |
| New Hampshire — 2.1% | |
New Hampshire Business Finance Authority, Refunding RB, Resource Recovery, Covanta Project(a): | | | | | | | | |
Series B, 4.63%, 11/01/42 | | | 1,105 | | | | 1,069,971 | |
Series C, AMT, 4.88%, 11/01/42 | | | 575 | | | | 561,097 | |
New Hampshire Health & Education Facilities Authority, Refunding RB, Dartmouth-Hitchcock, 6.00%, 08/01/19(b) | | | 3,035 | | | | 3,124,259 | |
| | | | | | | | |
| | | | 4,755,327 | |
| New Jersey — 7.3% | |
Casino Reinvestment Development Authority, Refunding RB: | | | | | | | | |
5.25%, 11/01/39 | | | 735 | | | | 775,146 | |
5.25%, 11/01/44 | | | 1,095 | | | | 1,151,841 | |
County of Essex New Jersey Improvement Authority, RB, AMT, 5.25%, 07/01/45(a) | | | 775 | | | | 777,387 | |
New Jersey EDA, ARB, Continental Airlines, Inc. Project, 5.13%, 09/15/23 | | | 1,410 | | | | 1,503,116 | |
New Jersey EDA, RB, Continental Airlines, Inc. Project, AMT, 5.25%, 09/15/29 | | | 1,365 | | | | 1,462,707 | |
| | | | | | | | |
| Security | | Par
(000) | | | Value | |
| New Jersey (continued) | |
New Jersey EDA, Refunding ARB, Port Network Container Terminal LLC Project, AMT, 5.00%, 10/01/47 | | $ | 1,060 | | | $ | 1,098,520 | |
New Jersey EDA, Refunding, Special Assessment Bonds, Kapkowski Road Landfill Project, 5.75%, 04/01/31 | | | 1,550 | | | | 1,675,132 | |
New Jersey State Turnpike Authority, RB: | | | | | | | | |
Series A, 5.00%, 01/01/43 | | | 715 | | | | 765,007 | |
Series E, 5.00%, 01/01/45 | | | 1,875 | | | | 2,017,781 | |
New Jersey Transportation Trust Fund Authority, RB: | | | | | | | | |
Transportation Program, Series AA, 5.00%, 06/15/44 | | | 315 | | | | 324,144 | |
Transportation Program, Series AA, 5.00%, 06/15/44 | | | 580 | | | | 595,353 | |
Transportation System, Series A, 5.50%, 06/15/41 | | | 1,575 | | | | 1,643,891 | |
Transportation System, Series B, 5.25%, 06/15/36 | | | 1,705 | | | | 1,775,093 | |
Tobacco Settlement Financing Corp., Refunding RB: | | | | | | | | |
Series A, 5.25%, 06/01/46 | | | 390 | | | | 412,234 | |
Sub-Series B, 5.00%, 06/01/46 | | | 550 | | | | 557,084 | |
| | | | | | | | |
| | | | 16,534,436 | |
| New York — 8.4% | |
City of New York Transitional Finance Authority Future Tax Secured, RB, Fiscal 2012, Sub-Series E-1,
5.00%, 02/01/42 | | | 310 | | | | 328,048 | |
Counties of New York Tobacco Trust IV, Refunding RB, Settlement Pass-Through Turbo, Series A,
6.25%, 06/01/41(a) | | | 1,300 | | | | 1,337,674 | |
County of Dutchess New York Industrial Development Agency, Refunding RB, Bard College Civic Facility, Series A-1, 5.00%, 08/01/46 | | | 715 | | | | 672,100 | |
County of Westchester New York Healthcare Corp., RB, Senior Lien, Series A, 5.00%, 11/01/44 | | | 229 | | | | 238,728 | |
Erie Tobacco Asset Securitization Corp., Refunding RB, Asset-Backed, Series A, 5.00%, 06/01/45 | | | 1,405 | | | | 1,351,399 | |
Long Island Power Authority, Refunding RB, Electric System, Series A, 5.75%, 04/01/19(b) | | | 1,450 | | | | 1,473,418 | |
Metropolitan Transportation Authority, RB, Series B, 5.25%, 11/15/38 | | | 1,715 | | | | 1,886,569 | |
Metropolitan Transportation Authority, Refunding RB: | | | | | | | | |
Dedicated Tax Fund, Series B, 5.00%, 11/15/19(b) | | | 1,740 | | | | 1,795,436 | |
Series C-1, 5.25%, 11/15/56 | | | 2,415 | | | | 2,638,025 | |
New York Counties Tobacco Trust IV, Refunding RB, Tobacco Settlement Pass-Through Bonds, Series A, 5.00%, 06/01/38 | | | 1,415 | | | | 1,377,050 | |
New York Liberty Development Corp., Refunding RB: | | | | | | | | |
2nd Priority, Bank of America Tower at One Bryant Park Project, Class 3, 6.38%, 07/15/49 | | | 850 | | | | 883,184 | |
3 World Trade Center Project, Class 1,
5.00%, 11/15/44(a) | | | 2,275 | | | | 2,329,668 | |
3 World Trade Center Project, Class 2,
5.15%, 11/15/34(a) | | | 245 | | | | 252,548 | |
3 World Trade Center Project, Class 2,
5.38%, 11/15/40(a) | | | 605 | | | | 623,029 | |
Port Authority of New York & New Jersey, ARB, Special Project, JFK International Air Terminal LLC Project, Series 8: | | | | | | | | |
6.00%, 12/01/36 | | | 900 | | | | 964,782 | |
6.00%, 12/01/42 | | | 875 | | | | 936,871 | |
| | | | | | | | |
| | | | 19,088,529 | |
| North Carolina — 0.6% | |
North Carolina Medical Care Commission, RB, Health Care Facilities, Duke University Health System, Series A, 5.00%, 06/01/19(b) | | | 970 | | | | 987,489 | |
| | |
| 38 | | 2018 BLACKROCK SEMI-ANNUAL REPORTTO SHAREHOLDERS |
| | |
Schedule of Investments (unaudited) (continued) October 31, 2018 | | BlackRock MuniHoldings Fund, Inc. (MHD) (Percentages shown are based on Net Assets) |
| | | | | | | | |
| Security | | Par
(000) | | | Value | |
| North Carolina (continued) | |
North Carolina Medical Care Commission, Refunding RB, 1st Mortgage, Retirement Facilities Whitestone Project, Series A, 7.75%, 03/01/21(b) | | $ | 415 | | | $ | 465,315 | |
| | | | | | | | |
| | | | 1,452,804 | |
| North Dakota — 0.3% | |
County of Cass North Dakota, Refunding RB, Essentia Health Obligated Group, Series B, 5.25%, 02/15/58(f) | | | 695 | | | | 731,467 | |
| | | | | | | | |
| Ohio — 1.7% | |
Buckeye Tobacco Settlement Financing Authority, RB, Asset-Backed, Senior Turbo Term, Series A-2,
5.88%, 06/01/47 | | | 2,570 | | | | 2,495,444 | |
County of Franklin Ohio, RB: | | | | | | | | |
Health Care Facilities Improvement, OPRS Communities Obligation Group, Series A, 6.13%, 07/01/40 | | | 470 | | | | 503,032 | |
Trinity Health Credit Group, Series 2017,
5.00%, 12/01/46 | | | 290 | | | | 311,098 | |
State of Ohio, RB, Portsmouth Bypass Project, AMT, 5.00%, 06/30/53 | | | 580 | | | | 606,001 | |
| | | | | | | | |
| | | | 3,915,575 | |
| Oklahoma — 1.7% | |
Oklahoma Development Finance Authority, RB, OU Medicine Project, Series B, 5.25%, 08/15/48 | | | 855 | | | | 905,249 | |
Oklahoma Turnpike Authority, RB: | | | | | | | | |
2nd Series C, 4.00%, 01/01/42 | | | 1,420 | | | | 1,415,683 | |
Series A, 4.00%, 01/01/48 | | | 1,500 | | | | 1,477,065 | |
| | | | | | | | |
| | | | 3,797,997 | |
| Pennsylvania — 4.0% | |
City of Philadelphia Pennsylvania Airport Revenue, Refunding ARB, Series B, AMT, 5.00%, 07/01/47 | | | 330 | | | | 352,202 | |
City of Philadelphia Pennsylvania Hospitals & Higher Education Facilities Authority, RB, Temple University Health System, Series A, 5.63%, 07/01/42 | | | 460 | | | | 483,294 | |
Commonwealth Financing Authority, RB, Tobacco Master Settlement Payment: | | | | | | | | |
5.00%, 06/01/33 | | | 75 | | | | 82,358 | |
5.00%, 06/01/34 | | | 100 | | | | 109,474 | |
County of Montgomery Higher Education & Health Authority, Refunding RB, Thomas Jefferson University, Series A: | | | | | | | | |
4.00%, 09/01/49 | | | 415 | | | | 395,188 | |
5.00%, 09/01/43 | | | 905 | | | | 977,916 | |
Pennsylvania Economic Development Financing Authority, RB: | | | | | | | | |
American Water Co. Project, 6.20%, 04/01/39 | | | 2,520 | | | | 2,559,539 | |
AMT, 5.00%, 06/30/42 | | | 2,015 | | | | 2,104,789 | |
Pennsylvania Economic Development Financing Authority, Refunding RB, National Gypsum Co., AMT,
5.50%, 11/01/44 | | | 1,105 | | | | 1,141,984 | |
Pennsylvania Turnpike Commission, RB, Series A,
5.00%, 12/01/44 | | | 795 | | | | 851,684 | |
| | | | | | | | |
| | | | 9,058,428 | |
| Puerto Rico — 1.2% | |
Children’s Trust Fund, Refunding RB, Tobacco Settlement Asset-Backed Bonds: | | | | | | | | |
5.50%, 05/15/39 | | | 1,345 | | | | 1,364,099 | |
5.63%, 05/15/43 | | | 1,280 | | | | 1,297,421 | |
| | | | | | | | |
| | | | 2,661,520 | |
| Rhode Island — 2.3% | |
Tobacco Settlement Financing Corp., Refunding RB: | | | | | | | | |
Series A, 5.00%, 06/01/35 | | | 580 | | | | 610,160 | |
Series B, 4.50%, 06/01/45 | | | 1,900 | | | | 1,873,837 | |
Series B, 5.00%, 06/01/50 | | | 2,605 | | | | 2,670,933 | |
| | | | | | | | |
| | | | 5,154,930 | |
| | | | | | | | |
| Security | | Par
(000) | | | Value | |
| South Carolina — 3.7% | |
State of South Carolina Ports Authority, ARB: | | | | | | | | |
5.25%, 07/01/20(b) | | $ | 2,285 | | | $ | 2,400,484 | |
AMT, 5.25%, 07/01/55 | | | 925 | | | | 997,613 | |
State of South Carolina Public Service Authority, RB, Santee Cooper, Series A, 5.50%, 12/01/54 | | | 2,410 | | | | 2,553,274 | |
State of South Carolina Public Service Authority, Refunding RB, Series E, 5.25%, 12/01/55 | | | 2,260 | | | | 2,391,193 | |
| | | | | | | | |
| | | | 8,342,564 | |
| Tennessee — 0.7% | |
City of Chattanooga Health Educational & Housing Facility Board, RB, Catholic Health Initiatives, Series A,
5.25%, 01/01/45 | | | 980 | | | | 1,030,342 | |
County of Nashville & Davidson Metropolitan Government Health & Educational Facilities Board, RB, Vanderbilt University Medical Center, Series A, 5.00%, 07/01/40 | | | 495 | | | | 528,378 | |
| | | | | | | | |
| | | | 1,558,720 | |
| Texas — 8.6% | |
Central Texas Regional Mobility Authority, Refunding RB: | | | | | | | | |
Senior Lien, 6.25%, 01/01/21(b) | | | 1,480 | | | | 1,602,011 | |
Sub-Lien, 5.00%, 01/01/33 | | | 250 | | | | 264,700 | |
City of Austin Texas Airport System, ARB, AMT,
5.00%, 11/15/39 | | | 440 | | | | 473,145 | |
City of Austin Texas Electric Utility Revenue, Refunding RB, Series A, 5.00%, 11/15/37 | | | 1,500 | | | | 1,622,115 | |
County of Harris Texas Cultural Education Facilities Finance Corp., RB, 1st Mortgage, Brazos Presbyterian Homes, Inc. Project, Series B, 7.00%, 01/01/23(b) | | | 325 | | | | 382,480 | |
County of Harris Texas Health Facilities Development Corp., Refunding RB, Memorial Hermann Healthcare System, Series B, 7.25%, 12/01/18(b) | | | 1,910 | | | | 1,918,213 | |
County of Tarrant Texas Cultural Education Facilities Finance Corp., RB, Christus Health, Series B, 5.00%, 07/01/48 | | | 3,330 | | | | 3,542,687 | |
La Vernia Higher Education Finance Corp., RB, Kipp, Inc., Series A, 6.38%, 08/15/19(b) | | | 450 | | | | 464,616 | |
North Texas Tollway Authority, RB, CAB, Special Project System, Series B, 0.00%, 09/01/31(b)(c) | | | 1,400 | | | | 585,998 | |
Permanent University Fund — University of Texas System, Refunding RB, Series B, 4.00%, 07/01/41 | | | 2,725 | | | | 2,751,787 | |
San Antonio Water System, Refunding RB, Junior Lien, Series A, 5.00%, 05/15/48 | | | 1,825 | | | | 2,015,694 | |
Texas Private Activity Bond Surface Transportation Corp., RB, Senior Lien: | | | | | | | | |
LBJ Infrastructure Group LLC, 7.00%, 06/30/40 | | | 2,000 | | | | 2,129,260 | |
NTE Mobility Partners LLC, North Tarrant Express Managed Lanes Project, 6.88%, 12/31/39 | | | 1,700 | | | | 1,777,095 | |
| | | | | | | | |
| | | | 19,529,801 | |
| Utah — 0.6% | |
City of Salt Lake Corp. Airport Revenue, ARB, Series A, AMT, 5.00%, 07/01/48 | | | 640 | | | | 691,379 | |
Salt Lake City Corp. Airport Revenue, ARB, Series A, AMT, 5.00%, 07/01/47 | | | 665 | | | | 712,747 | |
| | | | | | | | |
| | | | 1,404,126 | |
| Virginia — 2.2% | |
County of Hanover Virginia EDA, Refunding RB, Covenant Woods, Series A: | | | | | | | | |
5.00%, 07/01/42 | | | 625 | | | | 630,994 | |
Residential Care Facility, 5.00%, 07/01/47 | | | 970 | | | | 977,682 | |
Hampton Roads Transportation Accountability Commission, RB, Transportation Fund, Senior Lien, Series A,
5.50%, 07/01/57 | | | 810 | | | | 933,282 | |
| | | | |
| SCHEDULES OF INVESTMENTS | | | 39 | |
| | |
Schedule of Investments (unaudited) (continued) October 31, 2018 | | BlackRock MuniHoldings Fund, Inc. (MHD) (Percentages shown are based on Net Assets) |
| | | | | | | | |
| Security | | Par
(000) | | | Value | |
| Virginia (continued) | |
Virginia Small Business Financing Authority, RB, Senior Lien, Elizabeth River Crossings OpCo LLC Project, AMT: | | | | | | | | |
5.25%, 01/01/32 | | $ | 550 | | | $ | 583,578 | |
6.00%, 01/01/37 | | | 1,830 | | | | 1,991,186 | |
| | | | | | | | |
| | | | 5,116,722 | |
| Washington — 2.3% | |
Grant County Public Utility District No. 2, Refunding RB, Series A, 5.00%, 01/01/43 | | | 1,555 | | | | 1,686,211 | |
Port of Seattle Washington, ARB, Intermediate Lien, Series C, AMT, 5.00%, 05/01/42 | | | 1,085 | | | | 1,167,362 | |
Port of Seattle Washington, RB, Intermediate Lien, Series C, AMT, 5.00%, 04/01/40 | | | 540 | | | | 578,151 | |
Washington Health Care Facilities Authority, RB, Catholic Health Initiatives, Series A, 5.75%, 01/01/45 | | | 1,625 | | | | 1,757,584 | |
| | | | | | | | |
| | | | 5,189,308 | |
| Wisconsin — 3.0% | |
State of Wisconsin, Refunding RB, Series A,
6.00%, 05/01/19(b) | | | 4,980 | | | | 5,081,841 | |
State of Wisconsin Health & Educational Facilities Authority, RB, Ascension Health Senior Credit Group, Series E, 5.00%, 11/15/33 | | | 1,710 | | | | 1,753,434 | |
| | | | | | | | |
| | | | 6,835,275 | |
| Wyoming — 0.1% | |
Wyoming Municipal Power Agency, Inc., RB, Series A, 5.00%, 01/01/19(b) | | | 210 | | | | 211,052 | |
| | | | | | | | |
Total Municipal Bonds — 116.6%
(Cost — $251,893,028) | | | | 264,744,565 | |
| | | | | |
|
Municipal Bonds Transferred to Tender Option Bond Trusts(g) | |
|
California — 8.3% | |
Bay Area Toll Authority, Refunding RB, San Francisco Bay Area: | | | | | | | | |
Toll Bridge, 4.00%, 04/01/42(h) | | | 2,257 | | | | 2,275,088 | |
Series F-1, 5.63%, 04/01/19(b) | | | 2,271 | | | | 2,307,756 | |
City & County of San Francisco California Public Utilities Commission, RB, Water Revenue, Series B,
5.00%, 11/01/19(b) | | | 6,600 | | | | 6,810,034 | |
City of Los Angeles California Department of Airports, Refunding ARB, Los Angeles International Airport, Senior Series A, 5.00%, 05/15/40 | | | 4,121 | | | | 4,267,944 | |
Sacramento Area Flood Control Agency, Refunding, Consolidated Capital Assessment District No. 2 Bonds, 5.00%, 10/01/47 | | | 2,250 | | | | 2,474,246 | |
San Diego California Community College District, GO, Election of 2002, 5.25%, 08/01/19(b) | | | 748 | | | | 767,201 | |
| | | | | | | | |
| | | | 18,902,269 | |
| Colorado — 2.7% | |
City & County of Denver Colorado Airport System Revenue, Refunding ARB, Subordinate System, Series A, AMT, 5.25%, 12/01/48(h) | | | 1,664 | | | | 1,848,517 | |
Colorado Health Facilities Authority, Refunding RB, Catholic Health Initiatives, Series A, 5.50%, 07/01/34(h) | | | 1,490 | | | | 1,522,445 | |
County of Adams Colorado, COP, Refunding,
4.00%, 12/01/45 | | | 2,700 | | | | 2,669,085 | |
| | | | | | | | |
| | | | 6,040,047 | |
| Florida — 1.8% | |
County of Miami-Dade Florida, RB, Water & Sewer System, 5.00%, 10/01/20(b) | | | 3,939 | | | | 4,151,806 | |
| | | | | | | | |
| | | | | | | | |
| Security | | Par
(000) | | | Value | |
| Illinois — 0.4% | |
Illinois Finance Authority, Refunding RB, Presence Health Network, Series C, 4.00%, 02/15/41 | | $ | 1,034 | | | $ | 994,197 | |
| | | | | | | | |
| Massachusetts — 4.4% | |
Commonwealth of Massachusetts Transportation Fund Revenue, RB, Rail Enhancement Program, Series A, 4.00%, 06/01/45 | | | 1,502 | | | | 1,505,276 | |
Massachusetts Development Finance Agency, Refunding RB, Partners Healthcare System, 5.00%, 07/01/47 | | | 3,359 | | | | 3,604,124 | |
Massachusetts School Building Authority, RB, Senior, Series B, 5.00%, 10/15/41 | | | 4,502 | | | | 4,771,926 | |
| | | | | | | | |
| | | | 9,881,326 | |
| New Hampshire — 0.6% | |
New Hampshire Health & Education Facilities Authority, RB, Dartmouth College, 5.25%, 06/01/19(b)(h) | | | 1,410 | | | | 1,436,467 | |
| | | | | | | | |
| New York — 7.6% | |
City of New York Municipal Water Finance Authority, Refunding RB, Water & Sewer System, 2nd General Resolution, Series FF-2, 5.50%, 06/15/40 | | | 1,110 | | | | 1,131,345 | |
Hudson Yards Infrastructure Corp., RB, Senior-Fiscal 2012(h): | | | | | | | | |
5.75%, 02/15/21(b) | | | 687 | | | | 739,163 | |
5.75%, 02/15/47 | | | 423 | | | | 454,711 | |
New York Liberty Development Corp., ARB, 1 World Trade Center Port Authority Consolidated Bonds,
5.25%, 12/15/43 | | | 7,440 | | | | 8,019,467 | |
New York Liberty Development Corp., Refunding RB, 4 World Trade Center Project, 5.75%, 11/15/51(h) | | | 4,460 | | | | 4,854,641 | |
Port Authority of New York & New Jersey, Refunding ARB, 194th Series, 5.25%, 10/15/55 | | | 1,860 | | | | 2,054,320 | |
| | | | | | | | |
| | | | 17,253,647 | |
| North Carolina — 1.4% | |
North Carolina Capital Facilities Finance Agency, Refunding RB: | | | | | | | | |
Duke University Project, Series B, 5.00%, 10/01/55 | | | 1,830 | | | | 2,013,448 | |
Wake Forest University, 5.00%, 01/01/19(b) | | | 1,080 | | | | 1,085,541 | |
| | | | | | | | |
| | | | 3,098,989 | |
| Ohio — 4.3% | |
State of Ohio, Refunding RB, Cleveland Clinic Health System Obligated Group, Series A, 5.50%, 01/01/19(b) | | | 9,644 | | | | 9,698,877 | |
| | | | | | | | |
| Pennsylvania — 0.8% | |
Pennsylvania Turnpike Commission, RB, Sub-Series A, 5.50%, 12/01/42 | | | 1,695 | | | | 1,897,434 | |
| | | | | | | | |
| Rhode Island — 0.5% | |
Narragansett Bay Commission, Refunding RB, Wastewater System, Series A, 4.00%, 09/01/43 | | | 1,140 | | | | 1,141,554 | |
| | | | | | | | |
| Texas — 6.6% | |
City of San Antonio Texas Electric and Gas Systems, RB, Junior Lien, 5.00%, 02/01/43 | | | 1,720 | | | | 1,843,853 | |
County of Harris Texas, RB, Toll Road, Senior Lien, Series A(h): | | | | | |
5.00%, 08/15/19(b) | | | 2,620 | | | | 2,671,693 | |
5.00%, 08/15/38 | | | 2,004 | | | | 2,043,614 | |
County of Harris Texas Metropolitan Transit Authority, Refunding RB, Series A, 5.00%, 11/01/41 | | | 2,350 | | | | 2,492,328 | |
Lower Colorado River Authority, Refunding RB, LCRA Transmission Services Corporation Project,
4.00%, 05/15/43 | | | 1,504 | | | | 1,489,783 | |
San Antonio Public Facilities Corp., Refunding RB, Convention Center Refinancing And Expansion Project,
4.00%, 09/15/42 | | | 2,295 | | | | 2,300,630 | |
University of Texas, Refunding RB, Financing System, Series B, 5.00%, 08/15/43 | | | 2,041 | | | | 2,201,554 | |
| | | | | | | | |
| | | | 15,043,455 | |
| | |
| 40 | | 2018 BLACKROCK SEMI-ANNUAL REPORTTO SHAREHOLDERS |
| | |
Schedule of Investments (unaudited) (continued) October 31, 2018 | | BlackRock MuniHoldings Fund, Inc. (MHD) (Percentages shown are based on Net Assets) |
| | | | | | | | |
| Security | | Par
(000) | | | Value | |
| Utah — 1.1% | |
City of Riverton Utah, RB, IHC Health Services, Inc., 5.00%, 08/15/19(b) | | $ | 2,519 | | | $ | 2,579,285 | |
| | | | | | | | |
| Virginia — 1.0% | |
Virginia Small Business Financing Authority, Refunding RB, Sentara Healthcare, 5.00%, 11/01/40 | | | 2,095 | | | | 2,174,511 | |
| | | | | | | | |
| Wisconsin — 2.6% | |
Wisconsin Health & Educational Facilities Authority, Refunding RB: | | | | | | | | |
Froedtert & Community Health, Inc., Obligated Group, Series C, 5.25%, 04/01/19(b)(h) | | | 3,959 | | | | 4,012,581 | |
The Medical College of Wisconsin, Inc., 4.00%, 12/01/46 | | | 2,059 | | | | 1,975,137 | |
| | | | | | | | |
| | | | 5,987,718 | |
Total Municipal Bonds Transferred to Tender Option
Bond Trusts — 44.1%
(Cost — $98,532,977) | | | | 100,281,582 | |
| | | | | |
Total Long-Term Investments — 160.7%
(Cost — $350,426,005) | | | | 365,026,147 | |
| | | | | |
| | |
| | | Shares | | | | |
| Short-Term Securities — 1.4% | |
BlackRock Liquidity Funds, MuniCash, Institutional Class,
1.45%(i)(j) | | | 3,203,888 | | | | 3,204,209 | |
| | | | | | | | |
Total Short-Term Securities — 1.4%
(Cost — $3,204,209) | | | | 3,204,209 | |
| | | | | |
| |
Total Investments — 162.1%
(Cost — $353,630,214) | | | | 368,230,356 | |
Other Assets Less Liabilities — 1.4% | | | | 3,326,429 | |
Liability for TOB Trust Certificates, Including Interest Expense and Fees Payable — (26.7)% | | | | (60,716,940 | ) |
VMTP Shares at Liquidation Value — (36.8)% | | | | (83,700,000 | ) |
| | | | | |
Net Assets Applicable to Common Shares — 100.0% | | | $ | 227,139,845 | |
| | | | | |
| (a) | Security exempt from registration pursuant to Rule 144A under the Securities Act of 1933, as amended. These securities may be resold in transactions exempt from registration to qualified institutional investors. |
| (b) | U.S. Government securities, held in escrow, are used to pay interest on this security, as well as to retire the bond in full at the date indicated, typically at a premium to par. |
| (d) | Variable or floating rate security, which interest rate adjusts periodically based on changes in current interest rates and prepayments on the underlying pool of assets. Rate shown is the rate in effect as of period end. |
| (e) | Step-up bond that pays an initial coupon rate for the first period and then a higher coupon rate for the following periods. Rate as of period end. |
| (f) | When-issued security. |
| (g) | Represent bonds transferred to a TOB Trust in exchange of cash and residual certificates received by the Fund. These bonds serve as collateral in a secured borrowing. See Note 4 of the Notes to Financial Statements for details. |
| (h) | All or a portion of security is subject to a recourse agreement. The aggregate maximum potential amount the Fund could ultimately be required to pay under the agreement, which expire between December 1, 2018 to April 1, 2039, is $13,285,379. See Note 4 of the Notes to Financial Statements for details. |
| (i) | Annualized 7-day yield as of period end. |
| (j) | During the six months ended October 31, 2018, investments in issuers considered to be an affiliate of the Fund for purposes of Section 2(a)(3) of the Investment Company Act of 1940, as amended, were as follows: |
| | | | | | | | | | | | | | | | | | | | | | | | | | | | |
| Affiliate | | Shares
Held at
04/30/18 | | | Net
Activity | | | Shares
Held at
10/31/18 | | | Value at
10/31/18 | | | Income | | | Net
Realized
Gain (Loss) (a) | | | Change in
Unrealized
Appreciation
(Depreciation) | |
BlackRock Liquidity Funds, MuniCash, Institutional Class | | | 733,990 | | | | 2,469,898 | | | | 3,203,888 | | | $ | 3,204,209 | | | $ | 22,334 | | | $ | 24 | | | $ | — | |
| | | | | | | | | | | | | | | | | | | | | | | | | | | | |
| | (a) | Includes net capital gain distributions, if applicable. | |
Derivative Financial Instruments Outstanding as of Period End
Futures Contracts
| | | | | | | | | | | | | | | | |
| Description | | Number of
Contracts | | | Expiration
Date | | | Notional
Amount
(000) | | | Value /
Unrealized
Appreciation
(Depreciation) | |
Short Contracts: | | | | | | | | | | | | | | | | |
10-Year U.S. Treasury Note | | | 5 | | | | 12/19/18 | | | $ | 592 | | | $ | 541 | |
Long U.S. Treasury Bond | | | 46 | | | | 12/19/18 | | | | 6,354 | | | | 140,831 | |
5-Year U.S. Treasury Note | | | 15 | | | | 12/31/18 | | | | 1,686 | | | | 6,535 | |
| | | | | | | | | | | | | | | | |
| | | | | | | | | | | | | | $ | 147,907 | |
| | | | | | | | | | | | | | | | |
| | | | |
| SCHEDULES OF INVESTMENTS | | | 41 | |
| | |
Schedule of Investments (unaudited) (continued) October 31, 2018 | | BlackRock MuniHoldings Fund, Inc. (MHD) |
Derivative Financial Instruments Categorized by Risk Exposure
As of period end, the fair values of derivative financial instruments located in the Statements of Assets and Liabilities were as follows:
| | | | | | | | | | | | | | | | | | | | | | | | | | | | |
| | | Commodity
Contracts | | | Credit
Contracts | | | Equity
Contracts | | | Foreign
Currency
Exchange
Contracts | | | Interest
Rate
Contracts | | | Other
Contracts | | | Total | |
Assets — Derivative Financial Instruments | | | | | | | | | | | | | | | | | | | | | | | | | | | | |
Futures contracts | | | | | | | | | | | | | | | | | | | | | | | | | | | | |
Net unrealized appreciation(a) | | $ | — | | | $ | — | | | $ | — | | | $ | — | | | $ | 147,907 | | | $ | — | | | $ | 147,907 | |
| | | | | | | | | | | | | | | | | | | | | | | | | | | | |
| | (a) | Includes cumulative appreciation (depreciation) on futures contracts if any, as reported in the Schedule of Investments. Only current day’s variation margin is reported within the Statements of Assets and Liabilities. | |
For the six months ended October 31, 2018, the effect of derivative financial instruments in the Statements of Operations was as follows:
| | | | | | | | | | | | | | | | | | | | | | | | | | | | |
| | | Commodity
Contracts | | | Credit
Contracts | | | Equity
Contracts | | | Foreign
Currency
Exchange
Contracts | | | Interest
Rate
Contracts | | | Other
Contracts | | | Total | |
Net Realized Gain (Loss) from: | | | | | | | | | | | | | | | | | | | | | | | | | | | | |
Futures contracts | | $ | — | | | $ | — | | | $ | — | | | $ | — | | | $ | 221,664 | | | $ | — | | | $ | 221,664 | |
| | | | | | | | | | | | | | | | | | | | | | | | | | | | |
Net Change in Unrealized Appreciation (Depreciation) on: | | | | | | | | | | | | | | | | | | | | | | | | | | | | |
Futures contracts | | $ | — | | | $ | — | | | $ | — | | | $ | — | | | $ | 135,314 | | | $ | — | | | $ | 135,314 | |
| | | | | | | | | | | | | | | | | | | | | | | | | | | | |
Average Quarterly Balances of Outstanding Derivative Financial Instruments
| | | | |
Futures contracts: | |
Average notional value of contracts — short | | $ | 12,202,168 | |
For more information about the Fund’s investment risks regarding derivative financial instruments, refer to the Notes to Financial Statements.
Fair Value Hierarchy as of Period End
Various inputs are used in determining the fair value of investments and derivative financial instruments. For information about the Fund’s policy regarding valuation of investments and derivative financial instruments, refer to the Notes to Financial Statements.
The following tables summarize the Fund’s investments and derivative financial instruments categorized in the disclosure hierarchy:
| | | | | | | | | | | | | | | | |
| | | Level 1 | | | Level 2 | | | Level 3 | | | Total | |
Assets: | |
Investments: | |
Long-Term Investments(a) | | $ | — | | | $ | 365,026,147 | | | $ | — | | | $ | 365,026,147 | |
Short-Term Securities | | | 3,204,209 | | | | — | | | | — | | | | 3,204,209 | |
| | | | | | | | | | | | | | | | |
| | $ | 3,204,209 | | | $ | 365,026,147 | | | $ | — | | | $ | 368,230,356 | |
| | | | | | | | | | | | | | | | |
Derivative Financial Instruments(b) | |
Assets: | |
Interest rate contracts | | $ | 147,907 | | | $ | — | | | $ | — | | | $ | 147,907 | |
| | | | | | | | | | | | | | | | |
| | (a) | See above Schedule of Investments for values in each state or political subdivision. | |
| | (b) | Derivative financial instruments are futures contracts, which are valued at the unrealized appreciation (depreciation) on the instrument. | |
The Fund may hold assets and/or liabilities in which the fair value approximates the carrying for financial statement purposes. As of period end, such assets and/or liabilities are categorized within the disclosure hierarchy as follows:
| | | | | | | | | | | | | | | | |
| | | Level 1 | | | Level 2 | | | Level 3 | | | Total | |
Liabilities: | |
TOB Trust Certificates | | $ | — | | | $ | (60,465,002 | ) | | $ | — | | | $ | (60,465,002 | ) |
VMTP Shares at Liquidation Value | | | — | | | | (83,700,000 | ) | | | — | | | | (83,700,000 | ) |
| | | | | | | | | | | | | | | | |
| | $ | — | | | $ | (144,165,002 | ) | | $ | — | | | $ | (144,165,002 | ) |
| | | | | | | | | | | | | | | | |
During the six months ended October 31, 2018, there were no transfers between levels.
See notes to financial statements.
| | |
| 42 | | 2018 BLACKROCK SEMI-ANNUAL REPORTTO SHAREHOLDERS |
| | |
Schedule of Investments (unaudited) October 31, 2018 | | BlackRock MuniHoldings Fund II, Inc. (MUH) (Percentages shown are based on Net Assets) |
| | | | | | | | |
| Security | | Par
(000) | | | Value | |
| Municipal Bonds — 110.3% | |
|
Alabama — 1.3% | |
County of Jefferson Alabama Sewer Revenue, Refunding RB, Sub-Lien, Series D, 6.00%, 10/01/42 | | $ | 1,875 | | | $ | 2,116,987 | |
| | | | | | | | |
| Arizona — 1.1% | |
City of Phoenix Arizona IDA, RB, Legacy Traditional Schools Projects, Series A, 5.00%, 07/01/46(a) | | | 890 | | | | 891,620 | |
Salt Verde Financial Corp., RB, Senior, 5.00%, 12/01/37 | | | 810 | | | | 918,524 | |
| | | | | | | | |
| | | | | | | 1,810,144 | |
| California — 14.0% | |
Benicia Unified School District, GO, CAB, Series A (NPFGC), 0.00%, 08/01/20(b) | | | 2,000 | | | | 1,924,660 | |
California Health Facilities Financing Authority, RB: | | | | | | | | |
St. Joseph Health System, Series A, 5.75%, 07/01/39 | | | 1,110 | | | | 1,137,950 | |
Sutter Health, Series B, 6.00%, 08/15/20(c) | | | 1,585 | | | | 1,699,707 | |
California Health Facilities Financing Authority, Refunding RB, St. Joseph Health System, Series A, 5.00%, 07/01/33 | | | 445 | | | | 485,677 | |
California Municipal Finance Authority, RB, Senior, Caritas Affordable Housing, Inc. Projects, S/F Housing, Series A: | | | | | | | | |
5.25%, 08/15/39 | | | 80 | | | | 86,099 | |
5.25%, 08/15/49 | | | 195 | | | | 208,820 | |
California Municipal Finance Authority, Refunding RB, Community Medical Centers, Series A, 5.00%, 02/01/42 | | | 120 | | | | 129,050 | |
California Pollution Control Financing Authority, RB, Poseidon Resources (Channel Side) LP Desalination Project, AMT, 5.00%, 11/21/45(a) | | | 730 | | | | 751,601 | |
California Statewide Communities Development Authority, RB, Series A: | | | | | | | | |
John Muir Health, 5.13%, 07/01/19(c) | | | 1,090 | | | | 1,114,590 | |
Loma Linda University Medical Center,
5.00%, 12/01/46(a) | | | 235 | | | | 238,993 | |
City of Los Angeles California Department of Airports, Refunding ARB, Los Angeles International Airport, Series A, 5.25%, 05/15/39 | | | 400 | | | | 406,356 | |
City of Stockton California Public Financing Authority, RB, Delta Water Supply Project, Series A, 6.25%, 10/01/38 | | | 185 | | | | 214,289 | |
Golden State Tobacco Securitization Corp., Refunding RB, Series A-1, 5.25%, 06/01/47 | | | 540 | | | | 542,948 | |
San Diego Unified School District California, GO, CAB, Election of 2008, Series A, 0.00%, 07/01/29(b) | | | 2,525 | | | | 1,758,789 | |
San Marino Unified School District, GO, Series A (NPFGC), 0.00%, 07/01/19(b) | | | 2,070 | | | | 2,044,166 | |
State of California, GO, Various Purposes: | | | | | | | | |
6.50%, 04/01/19(c) | | | 3,965 | | | | 4,044,736 | |
6.00%, 03/01/33 | | | 1,265 | | | | 1,332,956 | |
6.50%, 04/01/33 | | | 3,360 | | | | 3,421,925 | |
State of California Public Works Board, LRB, Various Capital Projects: | | | | | | | | |
Series I, 5.00%, 11/01/38 | | | 405 | | | | 441,543 | |
Sub-Series I-1, 6.38%, 11/01/19(c) | | | 600 | | | | 627,558 | |
Tobacco Securitization Authority of Southern California, Refunding RB, Tobacco Settlement, Asset-Backed, Senior Series A-1, 4.75%, 06/01/25 | | | 670 | | | | 671,662 | |
| | | | | | | | |
| | | | | | | 23,284,075 | |
| Colorado — 2.3% | |
City & County of Denver Colorado, COP, Colorado Convention Center Expansion Project, Series A, 4.00%, 06/01/48 | | | 680 | | | | 674,152 | |
City & County of Denver Colorado, RB,Series A-2, 0.00%, 08/01/37(b) | | | 1,490 | | | | 676,058 | |
Colorado Educational & Cultural Facilities Authority, RB, Charter School, Colorado Springs, 5.50%, 07/01/40 | | | 1,055 | | | | 1,078,284 | |
| | | | | | | | |
| Security | | Par
(000) | | | Value | |
| Colorado (continued) | |
Regional Transportation District, COP, Refunding, Series A, 5.38%, 06/01/31 | | $ | 510 | | | $ | 532,736 | |
University of Colorado, RB, Series A, 5.38%, 06/01/19(c) | | | 920 | | | | 938,243 | |
| | | | | | | | |
| | | | | | | 3,899,473 | |
| Connecticut — 0.2% | |
Connecticut HFA, Refunding RB, S/F Housing,
Sub-Series B-1, 4.00%, 05/15/45 | | | 265 | | | | 258,221 | |
| | | | | | | | |
| Delaware — 1.6% | |
County of Sussex Delaware, RB, NRG Energy, Inc., Indian River Power LLC Project, 6.00%, 10/01/40 | | | 570 | | | | 602,821 | |
State of Delaware EDA, RB, Exempt Facilities, Indian River Power LLC Project, 5.38%, 10/01/45 | | | 2,050 | | | | 2,126,670 | |
| | | | | | | | |
| | | | | | | 2,729,491 | |
| District of Columbia — 4.1% | |
District of Columbia HFA, RB, M/F Housing, Series B-2 (FHA), 4.10%, 09/01/39 | | | 510 | | | | 500,162 | |
Metropolitan Washington Airports Authority, Refunding RB, Dulles Toll Road: | | | | | | | | |
1st Senior Lien, Series A, 5.00%, 10/01/39 | | | 255 | | | | 260,485 | |
1st Senior Lien, Series A, 5.25%, 10/01/44 | | | 1,000 | | | | 1,023,480 | |
CAB, 2nd Senior Lien, Series B (AGC),
0.00%, 10/01/34(b) | | | 10,170 | | | | 5,127,409 | |
| | | | | | | | |
| | | | | | | 6,911,536 | |
| Florida — 3.6% | |
City of Clearwater Florida Water & Sewer Revenue, RB, Series A, 5.25%, 12/01/19(c) | | | 1,725 | | | | 1,785,168 | |
County of Collier Florida Health Facilities Authority, Refunding RB, Series A, 5.00%, 05/01/45 | | | 700 | | | | 733,173 | |
Florida Housing Finance Corp., RB, S/F Housing, Series 1 (Ginnie Mae, Fannie Mae & Freddie Mac),
3.75%, 07/01/42 | | | 640 | | | | 609,050 | |
Mid-Bay Florida Bridge Authority, RB, Springing Lien, Series A, 7.25%, 10/01/21(c) | | | 1,525 | | | | 1,730,524 | |
Village Community Development District No.10, Special Assessment Bonds, 5.13%, 05/01/43 | | | 1,120 | | | | 1,207,337 | |
| | | | | | | | |
| | | | | | | 6,065,252 | |
| Georgia — 1.8% | |
County of Gainesville Georgia & Hall Hospital Authority, Refunding RB, Northeast Georgia Health System, Inc. Project, Series A (GTD), 5.50%, 08/15/54 | | | 270 | | | | 301,347 | |
County of Griffin-Spalding Hospital Authority, RB, Revenue Anticipation Certificates, 4.00%, 04/01/42 | | | 2,310 | | | | 2,218,178 | |
DeKalb Georgia Private Hospital Authority, Refunding RB, Children’s Healthcare, 5.25%, 11/15/39 | | | 420 | | | | 431,911 | |
| | | | | | | | |
| | | | | | | 2,951,436 | |
| Hawaii — 0.4% | |
State of Hawaii Harbor System, RB, Series A,
5.25%, 07/01/30 | | | 680 | | | | 711,287 | |
| | | | | | | | |
| Idaho — 1.2% | |
County of Power Idaho Industrial Development Corp., RB, FMC Corp. Project, AMT, 6.45%, 08/01/32 | | | 2,000 | | | | 2,007,540 | |
| | | | | | | | |
| Illinois — 15.1% | |
Chicago Board of Education, GO, Series C: | | | | | | | | |
Series H, 5.00%, 12/01/46 | | | 240 | | | | 239,986 | |
Project, 5.25%, 12/01/35 | | | 805 | | | | 819,627 | |
Chicago Board of Education, GO, Refunding, Dedicated Revenues: | | | | | | | | |
5.00%, 12/01/34 | | | 240 | | | | 242,784 | |
Series D, 5.00%, 12/01/25 | | | 435 | | | | 450,447 | |
| | | | |
| SCHEDULES OF INVESTMENTS | | | 43 | |
| | |
Schedule of Investments (unaudited) (continued) October 31, 2018 | | BlackRock MuniHoldings Fund II, Inc. (MUH) (Percentages shown are based on Net Assets) |
| | | | | | | | |
| Security | | Par
(000) | | | Value | |
| Illinois (continued) | |
Chicago Board of Education, GO, Refunding Series F, 5.00%, 12/01/24 | | $ | 340 | | | $ | 352,971 | |
City of Chicago Illinois, GO, Project, Series A,
5.00%, 01/01/34 | | | 885 | | | | 901,523 | |
City of Chicago Illinois, GO, Refunding, Project, Series A, 5.25%, 01/01/32 | | | 2,290 | | | | 2,388,561 | |
City of Chicago Illinois, Special Assessment Bonds, Lake Shore East Project, 6.75%, 12/01/32 | | | 587 | | | | 590,088 | |
City of Chicago Illinois O’Hare International Airport, GARB, 3rd Lien: | | | | | | | | |
Series A, 5.75%, 01/01/21(c) | | | 2,100 | | | | 2,258,004 | |
Series A, 5.75%, 01/01/39 | | | 400 | | | | 423,900 | |
Series C, 6.50%, 01/01/21(c) | | | 2,935 | | | | 3,201,469 | |
City of Chicago Illinois Transit Authority, RB, Sales Tax Receipts, 5.25%, 12/01/40 | | | 530 | | | | 556,532 | |
County of Cook Illinois Community College District No. 508, GO, City College of Chicago, 5.50%, 12/01/38 | | | 410 | | | | 426,154 | |
Illinois Finance Authority, Refunding RB: | | | | | | | | |
Central Dupage Health, Series B, 5.50%, 11/01/19(c) | | | 800 | | | | 827,024 | |
Southern Illinois Healthcare Enterprises, Inc.,
4.00%, 03/01/35 | | | 1,290 | | | | 1,255,209 | |
Metropolitan Pier & Exposition Authority, Refunding RB, McCormick Place Expansion Project: | | | | | | | | |
CAB, Series B (AGM), 0.00%, 06/15/47(b) | | | 9,555 | | | | 2,331,420 | |
Series B (AGM), 5.00%, 06/15/50 | | | 2,230 | | | | 2,287,088 | |
Series B-2, 5.00%, 06/15/50 | | | 1,260 | | | | 1,260,516 | |
Railsplitter Tobacco Settlement Authority, RB(c): | | | | | | | | |
5.50%, 06/01/21 | | | 230 | | | | 248,333 | |
6.00%, 06/01/21 | | | 500 | | | | 546,085 | |
State of Illinois, GO: | | | | | | | | |
5.00%, 02/01/39 | | | 810 | | | | 814,763 | |
Series A, 5.00%, 04/01/38 | | | 1,920 | | | | 1,944,173 | |
State of Illinois, RB, Build Illinois, Series B, 5.25%, 06/15/19(c) | | | 315 | | | | 321,322 | |
University of Illinois, RB, Auxiliary Facilities System, Series A, 5.00%, 04/01/44 | | | 520 | | | | 553,399 | |
| | | | | | | | |
| | | | | | | 25,241,378 | |
| Indiana — 4.8% | |
City of Valparaiso Indiana, RB, Exempt Facilities, Pratt Paper LLC Project, AMT: | | | | | | | | |
6.75%, 01/01/34 | | | 415 | | | | 473,976 | |
7.00%, 01/01/44 | | | 1,000 | | | | 1,147,680 | |
Indiana Finance Authority, RB, Series A: | | | | | | | | |
CWA Authority Project, 1st Lien, 5.25%, 10/01/38 | | | 1,660 | | | | 1,774,440 | |
Private Activity Bond, Ohio River Bridges East End Crossing Project, AMT, 5.00%, 07/01/44 | | | 225 | | | | 235,548 | |
Private Activity Bond, Ohio River Bridges East End Crossing Project, AMT, 5.00%, 07/01/48 | | | 740 | | | | 772,760 | |
Private Activity Bond, Ohio River Bridges East End Crossing Project, AMT, 5.25%, 01/01/51 | | | 210 | | | | 221,147 | |
Sisters of St. Francis Health Services,
5.25%, 11/01/19(c) | | | 420 | | | | 433,158 | |
Indiana Finance Authority, Refunding RB, Parkview Health System, Series A: | | | | | | | | |
5.75%, 05/01/19(c) | | | 1,370 | | | | 1,395,633 | |
5.75%, 05/01/31 | | | 290 | | | | 295,498 | |
Indiana Municipal Power Agency, RB, Series B,
6.00%, 01/01/19(c) | | | 565 | | | | 568,842 | |
Indianapolis Local Public Improvement Bond Bank, RB, Series A, 5.00%, 01/15/40 | | | 640 | | | | 695,437 | |
| | | | | | | | |
| | | | | | | 8,014,119 | |
| | | | | | | | |
| Security | | Par
(000) | | | Value | |
| Iowa — 1.3% | |
Iowa Finance Authority, RB, Lifespace Communities, Series A, 5.00%, 05/15/43 | | $ | 250 | | | $ | 256,280 | |
Iowa Finance Authority, Refunding RB, Iowa Fertilizer Co. Project: | | | | | | | | |
Series B, 5.25%, 12/01/50(d) | | | 240 | | | | 254,861 | |
Midwestern Disaster Area, 5.25%, 12/01/25 | | | 940 | | | | 993,063 | |
Midwestern Disaster Area, 5.88%, 12/01/26(a) | | | 210 | | | | 220,676 | |
Iowa Student Loan Liquidity Corp., Refunding RB, Student Loan, Senior Series A-1, AMT, 5.15%, 12/01/22 | | | 415 | | | | 427,089 | |
| | | | | | | | |
| | | | | | | 2,151,969 | |
| Kansas — 0.7% | |
Kansas Development Finance Authority, Refunding RB, Adventist Health System/Sunbelt Obligated Group, Series C(c): | | | | | | | | |
5.75%, 11/15/19 | | | 25 | | | | 25,901 | |
5.75%, 11/15/19 | | | 1,080 | | | | 1,121,202 | |
| | | | | | | | |
| | | | | | | 1,147,103 | |
| Kentucky — 0.7% | |
Kentucky Economic Development Finance Authority, RB, Catholic Health Initiatives, Series A, 5.25%, 01/01/45 | | | 525 | | | | 551,969 | |
Kentucky Public Transportation Infrastructure Authority, RB, Downtown Crossing Project, Convertible CAB, 1st Tier, Series C, 0.00%, 07/01/43(e) | | | 635 | | | | 581,152 | |
| | | | | | | | |
| | | | | | | 1,133,121 | |
| Louisiana — 3.0% | |
East Baton Rouge Sewerage Commission, RB, Series A, 5.25%, 02/01/19(c) | | | 420 | | | | 423,532 | |
Louisiana Public Facilities Authority, Refunding RB, Ochsner Clinic Foundation Project, 5.00%, 05/15/47 | | | 1,635 | | | | 1,714,412 | |
New Orleans Aviation Board, RB, Passenger Facility Charge, Series A, 5.25%, 01/01/41 | | | 310 | | | | 319,201 | |
Tobacco Settlement Financing Corp., Refunding RB, Asset-Backed, Series A: | | | | | | | | |
5.50%, 05/15/30 | | | 510 | | | | 529,773 | |
5.25%, 05/15/31 | | | 435 | | | | 458,181 | |
5.25%, 05/15/32 | | | 555 | | | | 591,597 | |
5.25%, 05/15/33 | | | 600 | | | | 635,244 | |
5.25%, 05/15/35 | | | 255 | | | | 269,866 | |
| | | | | | | | |
| | | | | | | 4,941,806 | |
| Maine — 1.1% | |
Maine Health & Higher Educational Facilities Authority, RB, Series A: | | | | | | | | |
5.00%, 07/01/19(c) | | | 45 | | | | 45,888 | |
5.00%, 07/01/39 | | | 105 | | | | 106,673 | |
Maine State Housing Authority, RB: | | | | | | | | |
M/F Housing, Series E, 4.15%, 11/15/38(f) | | | 700 | | | | 702,611 | |
M/F Housing, Series E, 4.25%, 11/15/43(f) | | | 625 | | | | 626,387 | |
S/F Housing, Series C, 3.95%, 11/15/43 | | | 335 | | | | 323,104 | |
| | | | | | | | |
| | | | | | | 1,804,663 | |
| Maryland — 1.1% | |
Maryland EDC, RB, Transportation Facilities Project, Series A, 5.75%, 06/01/20(c) | | | 220 | | | | 232,485 | |
Maryland EDC, Refunding RB, CNX Marine Terminals, Inc., 5.75%, 09/01/25 | | | 390 | | | | 402,675 | |
Maryland Health & Higher Educational Facilities Authority, Refunding RB, Charlestown Community Project,
6.25%, 01/01/21(c) | | | 1,095 | | | | 1,185,272 | |
| | | | | | | | |
| | | | | | | 1,820,432 | |
| | |
| 44 | | 2018 BLACKROCK SEMI-ANNUAL REPORTTO SHAREHOLDERS |
| | |
Schedule of Investments (unaudited) (continued) October 31, 2018 | | BlackRock MuniHoldings Fund II, Inc. (MUH) (Percentages shown are based on Net Assets) |
| | | | | | | | |
| Security | | Par
(000) | | | Value | |
| Massachusetts — 1.9% | |
Massachusetts Development Finance Agency, Refunding RB: | | | | | | | | |
Boston University, Series P, 5.45%, 05/15/59 | | $ | 845 | | | $ | 965,379 | |
Suffolk University, 4.00%, 07/01/39 | | | 1,140 | | | | 1,074,039 | |
Massachusetts Health & Educational Facilities Authority, Refunding RB, Partners Healthcare System, Series J1, 5.00%, 07/01/19(c) | | | 360 | | | | 367,344 | |
Massachusetts HFA, Refunding RB, Series F, AMT, 5.70%, 06/01/40 | | | 805 | | | | 806,296 | |
| | | | | | | | |
| | | | | | | 3,213,058 | |
| Michigan — 5.6% | |
City of Detroit Michigan Sewage Disposal System, Refunding RB, Senior Lien, Series A, 5.25%, 07/01/39 | | | 2,235 | | | | 2,365,926 | |
Eastern Michigan University, RB, Series A,
4.00%, 03/01/47 | | | 1,820 | | | | 1,699,880 | |
Kalamazoo Hospital Finance Authority, Refunding RB, Bronson Methodist Hospital: | | | | | | | | |
5.50%, 05/15/20(c) | | | 380 | | | | 398,658 | |
5.50%, 05/15/36 | | | 310 | | | | 322,257 | |
Michigan Finance Authority, Refunding RB: | | | | | | | | |
Detroit Water & Sewage Department Project, Senior Lien, Series C-1, 5.00%, 07/01/44 | | | 455 | | | | 480,985 | |
Trinity Health Credit Group, Series A, 4.00%, 12/01/40 | | | 1,835 | | | | 1,808,466 | |
Michigan State Hospital Finance Authority, Refunding RB, Henry Ford Health System, 5.75%, 11/15/19(c) | | | 1,520 | | | | 1,577,198 | |
State of Michigan Housing Development Authority, RB, S/F Housing, Series C, 4.13%, 12/01/38(f) | | | 730 | | | | 730,803 | |
| | | | | | | | |
| | | | | | | 9,384,173 | |
| Missouri — 0.2% | |
Bi-State Development Agency of the Missouri-Illinois Metropolitan District, Refunding RB, Combined Lien, Series A, 5.00%, 10/01/44 | | | 125 | | | | 135,462 | |
State of Missouri Health & Educational Facilities Authority, Refunding RB, St. Louis College of Pharmacy Project, 5.50%, 05/01/43 | | | 130 | | | | 136,643 | |
| | | | | | | | |
| | | | | | | 272,105 | |
| New Hampshire — 2.1% | |
New Hampshire Business Finance Authority, Refunding RB, Resource Recovery, Covanta Project(a): | | | | | | | | |
Series B, 4.63%, 11/01/42 | | | 735 | | | | 711,701 | |
Series C, AMT, 4.88%, 11/01/42 | | | 420 | | | | 409,844 | |
New Hampshire Health & Education Facilities Authority, Refunding RB, Dartmouth-Hitchcock, 6.00%, 08/01/19(c) | | | 1,530 | | | | 1,574,997 | |
New Hampshire Housing Finance Authority, RB, Cimarron, Whittier Falls & Marshall (FHA), 4.00%, 07/01/52 | | | 800 | | | | 756,120 | |
| | | | | | | | |
| | | | | | | 3,452,662 | |
| New Jersey — 7.7% | |
Casino Reinvestment Development Authority, Refunding RB: | | | | | | | | |
5.25%, 11/01/39 | | | 530 | | | | 558,949 | |
5.25%, 11/01/44 | | | 790 | | | | 831,009 | |
County of Essex New Jersey Improvement Authority, RB, AMT, 5.25%, 07/01/45(a) | | | 560 | | | | 561,725 | |
New Jersey EDA, ARB, Continental Airlines, Inc. Project, 5.13%, 09/15/23 | | | 1,040 | | | | 1,108,681 | |
New Jersey EDA, RB: | | | | | | | | |
Continental Airlines, Inc. Project, AMT, 5.25%, 09/15/29 | | | 990 | | | | 1,060,864 | |
S/F Housing, Series B, 4.50%, 06/15/40 | | | 1,270 | | | | 1,247,534 | |
Series WW, 5.00%, 06/15/36 | | | 210 | | | | 218,503 | |
New Jersey EDA, Refunding, Special Assessment Bonds, Kapkowski Road Landfill Project, 5.75%, 04/01/31 | | | 1,125 | | | | 1,215,821 | |
| | | | | | | | |
| Security | | Par
(000) | | | Value | |
| New Jersey (continued) | |
New Jersey State Turnpike Authority, RB, Series E, 5.00%, 01/01/45 | | $ | 715 | | | $ | 769,447 | |
New Jersey Transportation Trust Fund Authority, RB: | | | | | | | | |
Transportation Program, Series AA, 5.00%, 06/15/44 | | | 330 | | | | 339,580 | |
Transportation Program, Series AA, 5.00%, 06/15/44 | | | 610 | | | | 626,147 | |
Transportation System, Series A, 5.50%, 06/15/41 | | | 1,025 | | | | 1,069,833 | |
Transportation System, Series B, 5.25%, 06/15/36 | | | 1,235 | | | | 1,285,771 | |
New Jersey Transportation Trust Fund Authority, Refunding RB, Transportation System, Series A, 5.00%, 12/15/36 | | | 155 | | | | 162,393 | |
Tobacco Settlement Financing Corp., Refunding RB: | | | | | | | | |
Series A, 5.00%, 06/01/46 | | | 770 | | | | 794,825 | |
Series A, 5.25%, 06/01/46 | | | 200 | | | | 211,402 | |
Sub-Series B, 5.00%, 06/01/46 | | | 775 | | | | 784,982 | |
| | | | | | | | |
| | | | | | | 12,847,466 | |
| New Mexico — 1.0% | |
New Mexico Mortgage Finance Authority, RB, S/F Housing, Mortgage Program, Class I, Fannie Mae & Freddie Mac): | | | | | | | | |
Series B (Ginnie Mae, 3.90%, 07/01/48 | | | 705 | | | | 677,385 | |
Series C (Ginnie Mae, 3.88%, 07/01/43 | | | 1,085 | | | | 1,047,296 | |
| | | | | | | | |
| | | | | | | 1,724,681 | |
| New York — 7.6% | |
City of New York Housing Development Corp., Refunding RB, Sustainable Neighborhood Bonds, Series A, 4.15%, 11/01/38(f) | | | 1,080 | | | | 1,065,614 | |
City of New York Transitional Finance Authority Future Tax Secured, RB, Fiscal 2012, Sub-Series E-1, 5.00%, 02/01/42 | | | 740 | | | | 783,083 | |
Counties of New York Tobacco Trust IV, Refunding RB, Settlement Pass-Through Turbo, Series A, 6.25%, 06/01/41(a) | | | 1,000 | | | | 1,028,980 | |
County of Dutchess New York Industrial Development Agency, Refunding RB, Bard College Civic Facility, Series A-1, 5.00%, 08/01/46 | | | 555 | | | | 521,700 | |
County of Westchester New York Healthcare Corp., RB, Senior Lien, Series A, 5.00%, 11/01/44 | | | 257 | | | | 267,958 | |
Erie Tobacco Asset Securitization Corp., Refunding RB, Asset-Backed, Series A, 5.00%, 06/01/45 | | | 1,020 | | | | 981,087 | |
Long Island Power Authority, Refunding RB, Electric System, Series A, 5.75%, 04/01/19(c) | | | 1,050 | | | | 1,066,958 | |
Metropolitan Transportation Authority, RB, Series B, 5.25%, 11/15/38 | | | 1,255 | | | | 1,380,550 | |
Metropolitan Transportation Authority, Refunding RB, Dedicated Tax Fund, Series B, 5.00%, 11/15/19(c) | | | 1,270 | | | | 1,310,462 | |
New York Liberty Development Corp., Refunding RB: | | | | | | | | |
2nd Priority, Bank of America Tower at One Bryant Park Project, Class 3, 6.38%, 07/15/49 | | | 615 | | | | 639,010 | |
3 World Trade Center Project, Class 1, 5.00%, 11/15/44(a) | | | 1,495 | | | | 1,530,925 | |
3 World Trade Center Project, Class 2, 5.15%, 11/15/34(a) | | | 175 | | | | 180,392 | |
3 World Trade Center Project, Class 2, 5.38%, 11/15/40(a) | | | 440 | | | | 453,112 | |
Port Authority of New York & New Jersey, ARB, Special Project, JFK International Air Terminal LLC Project, Series 8: | | | | | | | | |
6.00%, 12/01/36 | | | 650 | | | | 696,787 | |
6.00%, 12/01/42 | | | 630 | | | | 674,547 | |
| | | | | | | | |
| | | | | | | 12,581,165 | |
| North Carolina — 0.2% | |
North Carolina Medical Care Commission, Refunding RB, 1st Mortgage, Retirement Facilities Whitestone Project, Series A, 7.75%, 03/01/21(c) | | | 305 | | | | 341,978 | |
| | | | | | | | |
| | | | |
| SCHEDULES OF INVESTMENTS | | | 45 | |
| | |
Schedule of Investments (unaudited) (continued) October 31, 2018 | | BlackRock MuniHoldings Fund II, Inc. (MUH) (Percentages shown are based on Net Assets) |
| | | | | | | | |
| Security | | Par
(000) | | | Value | |
| Ohio — 1.7% | |
Buckeye Tobacco Settlement Financing Authority, RB, Asset-Backed, Senior Turbo Term, Series A-2, 5.88%, 06/01/47 | | $ | 1,855 | | | $ | 1,801,186 | |
County of Franklin Ohio, RB, Health Care Facilities Improvement, OPRS Communities Obligation Group, Series A, 6.13%, 07/01/40 | | | 350 | | | | 374,598 | |
Ohio HFA, RB, S/F Housing, Series A (Ginnie Mae, Fannie Mae & Freddie Mac), 4.00%, 09/01/48 | | | 150 | | | | 146,163 | |
State of Ohio, RB, Portsmouth Bypass Project, AMT, 5.00%, 06/30/53 | | | 420 | | | | 438,829 | |
| | | | | | | | |
| | | | | | | 2,760,776 | |
| Oklahoma — 0.6% | |
Oklahoma Development Finance Authority, RB, OU Medicine Project, Series B, 5.50%, 08/15/57 | | | 625 | | | | 668,875 | |
Oklahoma Turnpike Authority, RB, Series A, 4.00%, 01/01/48 | | | 280 | | | | 275,719 | |
| | | | | | | | |
| | | | | | | 944,594 | |
| Oregon — 0.1% | |
State of Oregon Housing & Community Services Department, RB, S/F Housing, Mortgage Program, Series C, 3.95%, 07/01/43 | | | 210 | | | | 205,771 | |
| | | | | | | | |
| Pennsylvania — 3.1% | |
City of Philadelphia Pennsylvania Hospitals & Higher Education Facilities Authority, RB, Temple University Health System, Series A, 5.63%, 07/01/42 | | | 335 | | | | 351,964 | |
County of Montgomery Higher Education & Health Authority, Refunding RB, Thomas Jefferson University, Series A, 4.00%, 09/01/49 | | | 470 | | | | 447,562 | |
Pennsylvania Economic Development Financing Authority, RB: | | | | | | | | |
American Water Co. Project, 6.20%, 04/01/39 | | | 1,830 | | | | 1,858,713 | |
AMT, 5.00%, 06/30/42 | | | 440 | | | | 459,606 | |
Pennsylvania Economic Development Financing Authority, Refunding RB, National Gypsum Co., AMT,
5.50%, 11/01/44 | | | 800 | | | | 826,776 | |
Pennsylvania Turnpike Commission, RB, Series A, 5.00%, 12/01/44 | | | 585 | | | | 626,711 | |
State Public School Building Authority, Refunding RB, The School District of Philadelphia Project, Series A, 5.00%, 06/01/34 | | | 550 | | | | 594,341 | |
| | | | | | | | |
| | | | | | | 5,165,673 | |
| Puerto Rico — 1.2% | |
Children’s Trust Fund, Refunding RB, Tobacco Settlement Asset-Backed Bonds: | | | | | | | | |
5.50%, 05/15/39 | | | 975 | | | | 988,845 | |
5.63%, 05/15/43 | | | 925 | | | | 937,589 | |
| | | | | | | | |
| | | | | | | 1,926,434 | |
| Rhode Island — 2.2% | |
Tobacco Settlement Financing Corp., Refunding RB: | | | | | | | | |
Series A, 5.00%, 06/01/35 | | | 420 | | | | 441,840 | |
Series B, 4.50%, 06/01/45 | | | 1,375 | | | | 1,356,066 | |
Series B, 5.00%, 06/01/50 | | | 1,895 | | | | 1,942,963 | |
| | | | | | | | |
| | | | | | | 3,740,869 | |
| South Carolina — 4.3% | |
South Carolina Ports Authority, ARB, AMT, 5.00%, 07/01/55 | | | 710 | | | | 755,859 | |
State of South Carolina Ports Authority, ARB: | | | | | | | | |
5.25%, 07/01/20(c) | | | 1,650 | | | | 1,733,391 | |
AMT, 5.25%, 07/01/55 | | | 670 | | | | 722,595 | |
State of South Carolina Public Service Authority, RB, Santee Cooper, Series A, 5.50%, 12/01/54 | | | 2,040 | | | | 2,161,278 | |
| | | | | | | | |
| Security | | Par
(000) | | | Value | |
| South Carolina (continued) | |
State of South Carolina Public Service Authority, Refunding RB, Series E, 5.25%, 12/01/55 | | $ | 1,635 | | | $ | 1,729,912 | |
| | | | | | | | |
| | | | | | | 7,103,035 | |
| Tennessee — 0.7% | |
City of Chattanooga Health Educational & Housing Facility Board, RB, Catholic Health Initiatives, Series A, 5.25%, 01/01/45 | | | 720 | | | | 756,986 | |
County of Nashville & Davidson Metropolitan Government Health & Educational Facilities Board, RB, Vanderbilt University Medical Center, Series A, 5.00%, 07/01/40 | | | 360 | | | | 384,275 | |
| | | | | | | | |
| | | | | | | 1,141,261 | |
| Texas — 4.4% | |
Central Texas Regional Mobility Authority, Refunding RB: | | | | | | | | |
Senior Lien, 6.25%, 01/01/21(c) | | | 1,070 | | | | 1,158,211 | |
Sub-Lien, 5.00%, 01/01/33 | | | 180 | | | | 190,584 | |
County of Harris Texas Cultural Education Facilities Finance Corp., RB, 1st Mortgage, Brazos Presbyterian Homes, Inc. Project, Series B, 7.00%, 01/01/23(c) | | | 240 | | | | 282,446 | |
County of Midland Texas Fresh Water Supply District No. 1, RB, CAB, City of Midland Project, Series A(b): | | | | | | | | |
0.00%, 09/15/40 | | | 2,525 | | | | 946,749 | |
0.00%, 09/15/41 | | | 1,395 | | | | 495,253 | |
La Vernia Higher Education Finance Corp., RB, Kipp, Inc., Series A, 6.38%, 08/15/19(c) | | | 320 | | | | 330,394 | |
New Hope Cultural Education Facilities Corp., RB, Collegiate Housing Tarleton State University Project, 5.00%, 04/01/35 | | | 145 | | | | 151,458 | |
North Texas Tollway Authority, RB, CAB, Special Project System, Series B, 0.00%, 09/01/31(b)(c) | | | 1,015 | | | | 424,849 | |
North Texas Tollway Authority, Refunding RB, 4.25%, 01/01/49(f) | | | 610 | | | | 598,776 | |
Texas Department of Housing & Community Affairs, RB, S/F Housing Mortgage, Series A (Ginnie Mae), 4.25%, 09/01/43 | | | 195 | | | | 195,846 | |
Texas Private Activity Bond Surface Transportation Corp., RB, Senior Lien: | | | | | | | | |
LBJ Infrastructure Group LLC, 7.00%, 06/30/40 | | | 1,165 | | | | 1,240,294 | |
NTE Mobility Partners LLC, North Tarrant Express Managed Lanes Project, 6.88%, 12/31/39 | | | 1,300 | | | | 1,358,955 | |
| | | | | | | | |
| | | | | | | 7,373,815 | |
| Virginia — 1.1% | |
Virginia Small Business Financing Authority, RB, Senior Lien, Elizabeth River Crossings OpCo LLC Project, AMT: | | | | | | | | |
5.25%, 01/01/32 | | | 400 | | | | 424,420 | |
6.00%, 01/01/37 | | | 1,345 | | | | 1,463,468 | |
| | | | | | | | |
| | | | | | | 1,887,888 | |
| Washington — 1.0% | |
Port of Seattle Washington, RB, Intermediate Lien, Series C, AMT, 5.00%, 04/01/40 | | | 390 | | | | 417,554 | |
Washington Health Care Facilities Authority, RB, Catholic Health Initiatives, Series A, 5.75%, 01/01/45 | | | 1,195 | | | | 1,292,500 | |
| | | | | | | | |
| | | | | | | 1,710,054 | |
| West Virginia — 1.2% | |
West Virginia Hospital Finance Authority, RB, Improvement West Virginia University Health System Obligated Group, Series A, 4.00%, 06/01/51 | | | 2,260 | | | | 2,053,391 | |
| | | | | | | | |
| Wisconsin — 3.0% | |
State of Wisconsin, Refunding RB, Series A, 6.00%, 05/01/19(c) | | | 3,620 | | | | 3,694,029 | |
| | |
| 46 | | 2018 BLACKROCK SEMI-ANNUAL REPORTTO SHAREHOLDERS |
| | |
Schedule of Investments (unaudited) (continued) October 31, 2018 | | BlackRock MuniHoldings Fund II, Inc. (MUH) (Percentages shown are based on Net Assets) |
| | | | | | | | |
| Security | | Par
(000) | | | Value | |
| Wisconsin (continued) | |
State of Wisconsin Health & Educational Facilities Authority, RB, Ascension Health Senior Credit Group, Series E, 5.00%, 11/15/33 | | $ | 1,235 | | | $ | 1,266,369 | |
| | | | | | | | |
| | | | | | | 4,960,398 | |
| | | | | | | | |
Total Municipal Bonds — 110.3%
(Cost — $175,018,089) | | | | 183,791,280 | |
| | | | | |
|
Municipal Bonds Transferred to Tender Option Bond Trusts(g) | |
|
Arizona — 0.5% | |
County of Maricopa Industrial Development Authority, RB, Banner Health, Series A, 4.00%, 01/01/41 | | | 915 | | | | 901,720 | |
| | | | | | | | |
| California — 8.2% | |
Bay Area Toll Authority, Refunding RB, San Francisco Bay Area: | | | | | | | | |
Toll Bridge, 4.00%, 04/01/42(h) | | | 1,638 | | | | 1,650,949 | |
Series F-1, 5.63%, 04/01/19(c) | | | 1,640 | | | | 1,667,277 | |
City & County of San Francisco California Public Utilities Commission, RB, Water Revenue, Series B, 5.00%, 11/01/19(c) | | | 4,770 | | | | 4,921,797 | |
City of Los Angeles California Department of Airports, Refunding ARB, Los Angeles International Airport, Senior Series A, 5.00%, 05/15/40 | | | 2,967 | | | | 3,072,920 | |
Sacramento Area Flood Control Agency, Refunding, Consolidated Capital Assessment District No. 2 Bonds, 5.00%, 10/01/47 | | | 1,635 | | | | 1,797,952 | |
San Diego California Community College District, GO, Election of 2002, 5.25%, 08/01/19(c) | | | 553 | | | | 567,729 | |
| | | | | | | | |
| | | | | | | 13,678,624 | |
| Colorado — 1.8% | |
Colorado Health Facilities Authority, Refunding RB, Catholic Health Initiatives, Series A, 5.50%, 07/01/34(h) | | | 1,080 | | | | 1,103,517 | |
County of Adams Colorado, COP, Refunding, 4.00%, 12/01/45 | | | 1,950 | | | | 1,927,673 | |
| | | | | | | | |
| | | | | | | 3,031,190 | |
| Florida — 3.8% | |
City of Tampa Florida, RB, Baycare Health System, Series A, 4.00%, 11/15/46 | | | 1,932 | | | | 1,881,567 | |
County of Miami-Dade Florida, RB, Water & Sewer System, 5.00%, 10/01/20(c) | | | 2,840 | | | | 2,992,673 | |
South Miami Health Facilities Authority, Refunding RB, Baptist Health South Florida, 5.00%, 08/15/47 | | | 1,290 | | | | 1,404,642 | |
| | | | | | | | |
| | | | | | | 6,278,882 | |
| Illinois — 0.6% | |
Illinois Finance Authority, Refunding RB, Presence Health Network, Series C, 4.00%, 02/15/41 | | | 1,004 | | | | 965,380 | |
| | | | | | | | |
| Louisiana — 0.7% | |
County of St. Louisiana Gasoline & Fuels Tax Revenue, Refunding RB, First Lien, Series A, 4.00%, 05/01/41 | | | 1,245 | | | | 1,249,955 | |
| | | | | | | | |
| Maryland — 2.1% | |
City of Baltimore Maryland, RB, Wastewater Project, Series A, 5.00%, 07/01/46 | | | 1,515 | | | | 1,660,606 | |
State of Maryland Stadium Authority, RB, Construction and Revitalization Program, 5.00%, 05/01/42 | | | 1,740 | | | | 1,921,221 | |
| | | | | | | | |
| | | | | | | 3,581,827 | |
| Massachusetts — 3.4% | |
Commonwealth of Massachusetts, GO, Series A, 5.00%, 01/01/46 | | | 1,982 | | | | 2,190,331 | |
| | | | | | | | |
| Security | | Par
(000) | | | Value | |
| Massachusetts (continued) | |
Massachusetts School Building Authority, RB, Senior, Series B, 5.00%, 10/15/41 | | $ | 3,211 | | | $ | 3,403,974 | |
| | | | | | | | |
| | | | | | | 5,594,305 | |
| Michigan — 0.8% | |
State of Michigan Housing Development Authority, RB, M/F Housing, Series A, 4.05%, 10/01/48 | | | 1,409 | | | | 1,377,511 | |
| | | | | | | | |
| Nevada — 1.5% | |
County of Clark Nevada, GO, Stadium Improvement, Series A, 5.00%, 05/01/48 | | | 2,260 | | | | 2,505,264 | |
| | | | | | | | |
| New Hampshire — 0.6% | |
New Hampshire Health & Education Facilities Authority, RB, Dartmouth College, 5.25%, 06/01/19(c)(h) | | | 1,020 | | | | 1,039,147 | |
| | | | | | | | |
| New York — 11.9% | |
City of New York Municipal Water Finance Authority, Refunding RB, Water & Sewer System, 2nd General Resolution, Series FF-2, 5.50%, 06/15/40 | | | 810 | | | | 825,576 | |
City of New York Transitional Finance Authority, BARB: | | | | | | | | |
Fiscal 2009, Series S-3, 5.25%, 01/15/39 | | | 3,299 | | | | 3,322,332 | |
Series S-1, 4.00%, 07/15/42(h) | | | 1,395 | | | | 1,380,171 | |
Hudson Yards Infrastructure Corp., RB, Senior-Fiscal 2012(h): | | | | | | | | |
5.75%, 02/15/21(c) | | | 501 | | | | 539,389 | |
5.75%, 02/15/47 | | | 309 | | | | 331,816 | |
Metropolitan Transportation Authority, Refunding RB, Series C-1, 5.25%, 11/15/56 | | | 2,337 | | | | 2,552,950 | |
New York Liberty Development Corp., ARB, 1 World Trade Center Port Authority Consolidated Bonds, 5.25%, 12/15/43 | | | 5,400 | | | | 5,820,581 | |
New York Liberty Development Corp., Refunding RB, 4 World Trade Center Project, 5.75%, 11/15/51(h) | | | 3,250 | | | | 3,537,575 | |
Port Authority of New York & New Jersey, Refunding ARB, 194th Series, 5.25%, 10/15/55 | | | 1,350 | | | | 1,491,039 | |
| | | | | | | | |
| | | | | | | 19,801,429 | |
| North Carolina — 1.4% | |
North Carolina Capital Facilities Finance Agency, Refunding RB: | | | | | | | | |
Duke University Project, Series B, 5.00%, 10/01/55 | | | 1,320 | | | | 1,452,323 | |
Wake Forest University, 5.00%, 01/01/19(c) | | | 800 | | | | 804,104 | |
| | | | | | | | |
| | | | | | | 2,256,427 | |
| Ohio — 4.2% | |
State of Ohio, Refunding RB, Cleveland Clinic Health System Obligated Group, Series A, 5.50%, 01/01/19(c) | | | 6,974 | | | | 7,013,962 | |
| | | | | | | | |
| Pennsylvania — 1.8% | |
Commonwealth of Pennsylvania, GO, 1st Series, 4.00%, 03/01/36(h) | | | 1,559 | | | | 1,555,284 | |
Pennsylvania Turnpike Commission, RB, Sub-Series A, 5.50%, 12/01/42 | | | 1,229 | | | | 1,376,080 | |
| | | | | | | | |
| | | | | | | 2,931,364 | |
| Rhode Island — 0.4% | |
Rhode Island Housing & Mortgage Finance Corp., Refunding RB, S/F Housing, Home Ownership Opportunity Bonds, Series 69-B (Ginnie Mae, Fannie Mae & Freddie Mac), 3.95%, 10/01/43 | | | 750 | | | | 740,599 | |
| | | | | | | | |
| Texas — 10.1% | |
City of Houston Texas Community College, GO, Limited Tax, 4.00%, 02/15/43 | | | 1,395 | | | | 1,384,212 | |
City of San Antonio Texas Electric and Gas Systems, RB, Junior Lien, 5.00%, 02/01/43 | | | 1,260 | | | | 1,350,729 | |
| | | | |
| SCHEDULES OF INVESTMENTS | | | 47 | |
| | |
Schedule of Investments (unaudited) (continued) October 31, 2018 | | BlackRock MuniHoldings Fund II, Inc. (MUH) (Percentages shown are based on Net Assets) |
| | | | | | | | |
| Security | | Par
(000) | | | Value | |
| Texas (continued) | |
County of Harris Texas, RB, Toll Road, Senior Lien, Series A(h): | | | | | |
5.00%, 08/15/19(c) | | $ | 1,905 | | | $ | 1,943,050 | |
5.00%, 08/15/38 | | | 1,457 | | | | 1,486,265 | |
County of Harris Texas Metropolitan Transit Authority, Refunding RB, Series A, 5.00%, 11/01/41 | | | 1,710 | | | | 1,813,566 | |
County of Harris Texas Toll Road Authority, Refunding RB, Senior Lien, Series A, 5.00%, 08/15/43 | | | 1,859 | | | | 2,057,502 | |
County of Hidalgo Texas, GO, Series A, 4.00%, 08/15/43 | | | 2,297 | | | | 2,254,626 | |
Howe Texas Independent School District, GO, School Building (PSF-GTD), 4.00%, 08/15/43 | | | 1,095 | | | | 1,079,685 | |
San Antonio Public Facilities Corp., Refunding RB, Convention Center Refinancing And Expansion Project, 4.00%, 09/15/42 | | | 1,499 | | | | 1,502,842 | |
University of Texas, Refunding RB, Financing System, Series B, 5.00%, 08/15/43 | | | 1,801 | | | | 1,942,547 | |
| | | | | | | | |
| | | | 16,815,024 | |
| Utah — 0.9% | |
City of Riverton Utah, RB, IHC Health Services, Inc., 5.00%, 08/15/19(c) | | | 1,395 | | | | 1,427,818 | |
| | | | | | | | |
| Virginia — 1.0% | |
Virginia Small Business Financing Authority, Refunding RB, Sentara Healthcare, 5.00%, 11/01/40 | | | 1,553 | | | | 1,611,951 | |
| | | | | | | | |
| Washington — 0.9% | |
Washington Health Care Facilities Authority, Refunding RB, Multicare Health System, Series B, 4.13%, 08/15/43 | | | 1,445 | | | | 1,435,389 | |
| | | | | | | | |
| Wisconsin — 1.7% | |
Wisconsin Health & Educational Facilities Authority, Refunding RB, Froedtert & Community Health, Inc., Obligated Group, Series C, 5.25%, 04/01/19(c)(h) | | | 2,859 | | | | 2,897,975 | |
| | | | | | | | |
Total Municipal Bonds Transferred to Tender Option Bond
Trusts — 58.3%
(Cost — $96,547,949) | | | | 97,135,743 | |
| | | | | |
Total Long-Term Investments — 168.6%
(Cost — $271,566,038) | | | | 280,927,023 | |
| | | | | |
| | | | | | | | |
| Security | |
Shares | | | Value | |
| Short-Term Securities — 0.9% | |
BlackRock Liquidity Funds, MuniCash, Institutional Class, 1.45%(i)(j) | | | 1,461,701 | | | $ | 1,461,847 | |
| | | | | | | | |
Total Short-Term Securities — 0.9%
(Cost — $1,461,847) | | | | 1,461,847 | |
| | | | | |
| |
Total Investments — 169.5%
(Cost — $273,027,885) | | | | 282,388,870 | |
Liabilities in Excess of Other Assets — (0.4)% | | | | (655,429 | ) |
Liability for TOB Trust Certificates, Including Interest Expense and Fees Payable — (36.1)% | | | | (60,120,939 | ) |
VMTP Shares at Liquidation Value — (33.0)% | | | | (55,000,000 | ) |
| | | | | |
Net Assets Applicable to Common Shares — 100.0% | | | $ | 166,612,502 | |
| | | | | |
| (a) | Security exempt from registration pursuant to Rule 144A under the Securities Act of 1933, as amended. These securities may be resold in transactions exempt from registration to qualified institutional investors. |
| (c) | U.S. Government securities, held in escrow, are used to pay interest on this security, as well as to retire the bond in full at the date indicated, typically at a premium to par. |
| (d) | Variable or floating rate security, which interest rate adjusts periodically based on changes in current interest rates and prepayments on the underlying pool of assets. Rate shown is the rate in effect as of period end. |
| (e) | Step-up bond that pays an initial coupon rate for the first period and then a higher coupon rate for the following periods. Rate as of period end. |
| (f) | When-issued security. |
| (g) | Represent bonds transferred to a TOB Trust in exchange of cash and residual certificates received by the Fund. These bonds serve as collateral in a secured borrowing. See Note 4 of the Notes to Financial Statements for details. |
| (h) | All or a portion of security is subject to a recourse agreement. The aggregate maximum potential amount the Fund could ultimately be required to pay under the agreements, which expire between December 1, 2018 to April 1, 2039, is $10,825,937. See Note 4 of the Notes to Financial Statements for details. |
| (i) | Annualized 7-day yield as of period end. |
| (j) | During the six months ended October 31, 2018, investments in issuers considered to be an affiliate of the Fund for purposes of Section 2(a)(3) of the Investment Company Act of 1940, as amended, were as follows: |
| | | | | | | | | | | | | | | | | | | | | | | | | | | | |
| Affiliate | | Shares
Held at
04/30/18 | | | Net
Activity | | | Shares
Held at
10/31/18 | | | Value at
10/31/18 | | | Income | | | Net
Realized
Gain (Loss) (a) | | | Change in
Unrealized
Appreciation
(Depreciation) | |
BlackRock Liquidity Funds, MuniCash, Institutional Class | | | 978,065 | | | | 483,636 | | | | 1,461,701 | | | $ | 1,461,847 | | | $ | 4,221 | | | $ | 218 | | | $ | — | |
| | | | | | | | | | | | | | | | | | | | | | | | | | | | |
| | (a) | Includes net capital gain distributions, if applicable. | |
Derivative Financial Instruments Outstanding as of Period End
Futures Contracts
| | | | | | | | | | | | | | | | |
| Description | | Number of
Contracts | | | Expiration
Date | | | Notional
Amount (000) | | | Value/
Unrealized
Appreciation
(Depreciation) | |
Short Contracts: | | | | | | | | | | | | | | | | |
10-Year U.S. Treasury Note | | | 1 | | | | 12/19/18 | | | $ | 118 | | | $ | (813 | ) |
Long U.S. Treasury Bond | | | 43 | | | | 12/19/18 | | | | 5,939 | | | | 136,367 | |
5-Year U.S. Treasury Note | | | 9 | | | | 12/31/18 | | | | 1,011 | | | | 12 | |
| | | | | | | | | | | | | | | | |
| | | | | | | | | | | | | | $ | 135,566 | |
| | | | | | | | | | | | | | | | |
| | |
| 48 | | 2018 BLACKROCK SEMI-ANNUAL REPORTTO SHAREHOLDERS |
| | |
Schedule of Investments (unaudited) (continued) October 31, 2018 | | BlackRock MuniHoldings Fund II, Inc. (MUH) |
Derivative Financial Instruments Categorized by Risk Exposure
As of period end, the fair values of derivative financial instruments located in the Statements of Assets and Liabilities were as follows:
| | | | | | | | | | | | | | | | | | | | | | | | | | | | |
| | | Commodity
Contracts | | | Credit
Contracts | | | Equity
Contracts | | | Foreign
Currency
Exchange
Contracts | | | Interest
Rate
Contracts | | | Other
Contracts | | | Total | |
Assets — Derivative Financial Instruments | | | | | | | | | | | | | | | | | | | | | | | | | | | | |
Futures contracts | | | | | | | | | | | | | | | | | | | | | | | | | | | | |
Net unrealized appreciation(a) | | $ | — | | | $ | — | | | $ | — | | | $ | — | | | $ | 136,379 | | | $ | — | | | $ | 136,379 | |
| | | | | | | | | | | | | | | | | | | | | | | | | | | | |
Liabilities — Derivative Financial Instruments | | | | | | | | | | | | | | | | | | | | | | | | | | | | |
Futures contracts | | | | | | | | | | | | | | | | | | | | | | | | | | | | |
Net unrealized depreciation(a) | | $ | — | | | $ | — | | | $ | — | | | $ | — | | | $ | 813 | | | $ | — | | | $ | 813 | |
| | | | | | | | | | | | | | | | | | | | | | | | | | | | |
| | (a) | Includes cumulative appreciation (depreciation) on futures contracts, if any, as reported in the Schedule of Investments. Only current day’s variation margin is reported within the Statements of Assets and Liabilities. | |
For the six months ended October 31, 2018, the effect of derivative financial instruments in the Statements of Operations was as follows:
| | | | | | | | | | | | | | | | | | | | | | | | | | | | |
| | | Commodity
Contracts | | | Credit
Contracts | | | Equity
Contracts | | | Foreign
Currency
Exchange
Contracts | | | Interest
Rate
Contracts | | | Other
Contracts | | | Total | |
Net Realized Gain (Loss) from: | | | | | | | | | | | | | | | | | | | | | | | | | | | | |
Futures contracts | | $ | — | | | $ | — | | | $ | — | | | $ | — | | | $ | 181,181 | | | $ | — | | | $ | 181,181 | |
| | | | | | | | | | | | | | | | | | | | | | | | | | | | |
Net Change in Unrealized Appreciation (Depreciation) on: | | | | | | | | | | | | | | | | | | | | | | | | | | | | |
Futures contracts | | $ | — | | | $ | — | | | $ | — | | | $ | — | | | $ | 128,614 | | | $ | — | | | $ | 128,614 | |
| | | | | | | | | | | | | | | | | | | | | | | | | | | | |
Average Quarterly Balances of Outstanding Derivative Financial Instruments
| | | | |
Futures contracts: | |
Average notional value of contracts — short | | $ | 8,667,496 | |
For more information about the Fund’s investment risks regarding derivative financial instruments, refer to the Notes to Financial Statements.
Fair Value Hierarchy as of Period End
Various inputs are used in determining the fair value of investments and derivative financial instruments. For information about the Fund’s policy regarding valuation of investments and derivative financial instruments, refer to the Notes to Financial Statements.
The following tables summarize the Fund’s investments and derivative financial instruments categorized in the disclosure hierarchy:
| | | | | | | | | | | | | | | | |
| | | Level 1 | | | Level 2 | | | Level 3 | | | Total | |
Assets: | |
Investments: | |
Long-Term Investments(a) | | $ | — | | | $ | 280,927,023 | | | $ | — | | | $ | 280,927,023 | |
Short-Term Securities | | | 1,461,847 | | | | — | | | | — | | | | 1,461,847 | |
| | | | | | | | | | | | | | | | |
| | $ | 1,461,847 | | | $ | 280,927,023 | | | $ | | | | $ | 282,388,870 | |
| | | | | | | | | | | | | | | | |
Derivative Financial Instruments(b) | |
Assets: | |
Interest rate contracts | | $ | 136,379 | | | $ | — | | | $ | — | | | $ | 136,379 | |
Liabilities: | |
Interest rate contracts | | | (813 | ) | | | — | | | | — | | | | (813 | ) |
| | | | | | | | | | | | | | | | |
| | $ | 135,566 | | | $ | | | | $ | | | | $ | 135,566 | |
| | | | | | | | | | | | | | | | |
| | (a) | See above Schedule of Investments for values in each state or political subdivision. | |
| | (b) | Derivative financial instruments are futures contracts, which are valued at the unrealized appreciation (depreciation) on the instrument. | |
| | | | |
| SCHEDULES OF INVESTMENTS | | | 49 | |
| | |
Schedule of Investments (unaudited) (continued) October 31, 2018 | | BlackRock MuniHoldings Fund II, Inc. (MUH) |
The Fund may hold assets and/or liabilities in which the fair value approximates the carrying amount for financial statement purposes. As of period end, such assets and/or liabilities are categorized within the disclosure hierarchy as follows:
| | | | | | | | | | | | | | | | |
| | | Level 1 | | | Level 2 | | | Level 3 | | | Total | |
Liabilities: | |
TOB Trust Certificates | | $ | — | | | $ | (59,871,076 | ) | | $ | — | | | $ | (59,871,076 | ) |
VMTP Shares at Liquidation Value | | | — | | | | (55,000,000 | ) | | | — | | | | (55,000,000 | ) |
| | | | | | | | | | | | | | | | |
| | $ | — | | | $ | (114,871,076 | ) | | $ | — | | | $ | (114,871,076 | ) |
| | | | | | | | | | | | | | | | |
During the six months ended October 31, 2018, there were no transfers between levels.
See notes to financial statements.
| | |
| 50 | | 2018 BLACKROCK SEMI-ANNUAL REPORTTO SHAREHOLDERS |
| | |
Schedule of Investments (unaudited) October 31, 2018 | | BlackRock MuniHoldings Quality Fund, Inc. (MUS) (Percentages shown are based on Net Assets) |
| | | | | | | | |
| Security | | Par
(000) | | | Value | |
| Municipal Bonds — 139.8% | |
|
Alabama — 3.0% | |
City of Birmingham Alabama Special Care Facilities Financing Authority, RB, Children’s Hospital (AGC), 6.00%, 06/01/19(a) | | $ | 2,330 | | | $ | 2,383,893 | |
City of Selma Alabama IDB, RB, Gulf Opportunity Zone, International Paper Co. Project, Series A, 5.38%, 12/01/35 | | | 565 | | | | 610,765 | |
Lower Alabama Gas District, RB, Series A, 5.00%, 09/01/46 | | | 1,800 | | | | 2,015,820 | |
| | | | | | | | |
| | | | 5,010,478 | |
| California — 18.6% | |
California Health Facilities Financing Authority, RB, Sutter Health, Series B, 6.00%, 08/15/20(a) | | | 1,730 | | | | 1,855,200 | |
California Municipal Finance Authority, ARB, Senior Lien-Linxs APM Project, AMT, 5.00%, 12/31/43 | | | 800 | | | | 854,944 | |
Central Unified School District, GO, Election of 2008, Series A (AGC), 5.63%, 08/01/19(a) | | | 1,325 | | | | 1,363,306 | |
City & County of San Francisco California Airports Commission, Refunding ARB, AMT, Series A: | | | | | | | | |
2nd, 5.50%, 05/01/28 | | | 1,085 | | | | 1,210,415 | |
2nd, 5.25%, 05/01/33 | | | 850 | | | | 925,794 | |
5.00%, 05/01/44 | | | 1,090 | | | | 1,173,374 | |
City of San Jose California, Refunding ARB, Norman Y Mineta San Jose International Airport SJC, Series A-1, AMT: | | | | | | | | |
5.50%, 03/01/30 | | | 2,400 | | | | 2,555,184 | |
5.75%, 03/01/34 | | | 2,180 | | | | 2,332,186 | |
City of Sunnyvale California, Refunding RB, 5.25%, 04/01/20(a) | | | 1,605 | | | | 1,681,013 | |
County of Riverside Public Financing Authority, RB, Capital Facilities Project, 5.25%, 11/01/40 | | | 2,500 | | | | 2,834,100 | |
Kern Community College District, GO, Safety, Repair & Improvement, Series C, 5.50%, 11/01/33 | | | 1,420 | | | | 1,614,668 | |
Los Angeles Community College District California, GO, Election of 2008, Series C, 5.25%, 08/01/20(a) | | | 1,000 | | | | 1,057,980 | |
Redondo Beach Unified School District, GO, Election of 2008, Series E, 5.50%, 08/01/21(a) | | | 1,335 | | | | 1,462,639 | |
Regents of the University of California Medical Center Pooled Revenue, Refunding RB, Series J: | | | | | | | | |
5.25%, 05/15/23(a) | | | 3,170 | | | | 3,601,342 | |
5.25%, 05/15/38 | | | 900 | | | | 993,312 | |
State of California Public Works Board, LRB, Various Capital Projects, Series I: | | | | | | | | |
5.50%, 11/01/30 | | | 1,500 | | | | 1,692,120 | |
5.50%, 11/01/31 | | | 2,465 | | | | 2,777,044 | |
State of California Public Works Board, RB, Department of Corrections & Rehabilitation, Series F, 5.25%, 09/01/33 | | | 725 | | | | 804,011 | |
Township of Washington California Health Care District, GO, Election of 2004, Series B, 5.50%, 08/01/40 | | | 540 | | | | 614,115 | |
| | | | | | | | |
| | | | 31,402,747 | |
| Colorado — 2.3% | |
City & County of Denver Colorado Airport System, ARB, Series A, AMT: | | | | | | | | |
5.50%, 11/15/28 | | | 1,000 | | | | 1,120,000 | |
5.50%, 11/15/30 | | | 340 | | | | 379,790 | |
5.50%, 11/15/31 | | | 405 | | | | 451,794 | |
Colorado Health Facilities Authority, RB, Hospital, NCMC, Inc. Project, Series B (AGM), 6.00%, 05/15/19(a) | | | 1,900 | | | | 1,941,344 | |
| | | | | | | | |
| | | | 3,892,928 | |
| Connecticut — 1.0% | |
State of Connecticut, GO, Series A, 5.00%, 04/15/38 | | | 985 | | | | 1,051,487 | |
State of Connecticut Health & Educational Facility Authority, Refunding RB, Sacred Heart University Issue, Series I-1, 5.00%, 07/01/42 | | | 590 | | | | 633,259 | |
| | | | | | | | |
| | | | 1,684,746 | |
| | | | | | | | |
| Security | | Par
(000) | | | Value | |
| Florida — 16.1% | |
County of Broward Florida Airport System, ARB, Series A, AMT, 5.00%, 10/01/45 | | $ | 2,845 | | | $ | 3,048,986 | |
County of Hillsborough Florida Aviation Authority, Refunding ARB, Tampa International Airport, Series A, AMT, 5.50%, 10/01/29 | | | 1,735 | | | | 1,929,251 | |
County of Lee Florida, Refunding ARB, Series A, AMT, 5.38%, 10/01/32 | | | 1,500 | | | | 1,596,540 | |
County of Lee Florida HFA, RB, S/F Housing, Multi-County Program, Series A-2, AMT (Ginnie Mae, Fannie Mae & Freddie Mac), 6.00%, 09/01/40 | | | 90 | | | | 90,859 | |
County of Miami-Dade Florida, RB, Seaport Department: | | | | | | | | |
Series A, 5.38%, 10/01/33 | | | 1,015 | | | | 1,113,648 | |
Series A, 6.00%, 10/01/38 | | | 1,000 | | | | 1,123,450 | |
Series B, AMT, 6.25%, 10/01/38 | | | 460 | | | | 518,632 | |
Series B, AMT, 6.00%, 10/01/42 | | | 615 | | | | 687,957 | |
County of Miami-Dade Florida Aviation, Refunding ARB, Series A, AMT, 5.00%, 10/01/31 | | | 2,900 | | | | 3,098,244 | |
County of Miami-Dade Florida Educational Facilities Authority, RB, University of Miami, Series A, 5.00%, 04/01/40 | | | 3,465 | | | | 3,738,458 | |
County of Orange Florida School Board, COP, Series A (AGC), 5.50%, 08/01/19(a) | | | 4,645 | | | | 4,768,000 | |
Reedy Creek Florida Improvement District, GO, Series A, 5.25%, 06/01/32 | | | 1,040 | | | | 1,156,366 | |
Tohopekaliga Water Authority, Refunding RB, Series A, 5.25%, 10/01/21(a) | | | 3,995 | | | | 4,333,456 | |
| | | | | | | | |
| | | | 27,203,847 | |
| Hawaii — 1.5% | |
State of Hawaii Airports System, ARB, Series A, AMT, 5.00%, 07/01/45 | | | 1,500 | | | | 1,624,290 | |
State of Hawaii Airports System, COP, AMT: | | | | | | | | |
5.25%, 08/01/25 | | | 425 | | | | 466,208 | |
5.25%, 08/01/26 | | | 460 | | | | 502,265 | |
| | | | | | | | |
| | | | 2,592,763 | |
| Illinois — 15.3% | |
City of Chicago Illinois Midway International Airport, Refunding GARB, 2nd Lien, Series A, AMT, 5.00%, 01/01/41 | | | 1,000 | | | | 1,059,580 | |
City of Chicago Illinois O’Hare International Airport, GARB: | | | | | | | | |
3rd Lien, Series A, 5.75%, 01/01/21(a) | | | 960 | | | | 1,032,230 | |
3rd Lien, Series A, 5.75%, 01/01/39 | | | 185 | | | | 196,054 | |
3rd Lien, Series C, 6.50%, 01/01/21(a) | | | 5,225 | | | | 5,699,378 | |
Senior Lien, Series D, AMT, 5.00%, 01/01/42 | | | 430 | | | | 455,680 | |
City of Chicago Illinois Transit Authority, RB: | | | | | | | | |
Federal Transit Administration, Section 5309, Series A (AGC), 6.00%, 12/01/18(a) | | | 2,000 | | | | 2,006,700 | |
Sales Tax Receipts, 5.25%, 12/01/36 | | | 1,000 | | | | 1,051,250 | |
Sales Tax Receipts, 5.25%, 12/01/40 | | | 1,790 | | | | 1,879,607 | |
City of Chicago Illinois Wastewater Transmission, RB, 2nd Lien, 5.00%, 01/01/42 | | | 2,050 | | | | 2,127,531 | |
County of Cook Illinois Community College District No. 508, GO, City College of Chicago: | | | | | | | | |
5.50%, 12/01/38 | | | 1,250 | | | | 1,299,250 | |
5.25%, 12/01/43 | | | 1,505 | | | | 1,542,655 | |
Illinois Finance Authority, Refunding RB, Presence Health Network, Series C, 5.00%, 02/15/41 | | | 555 | | | | 602,342 | |
Railsplitter Tobacco Settlement Authority, RB(a): | | | | | | | | |
5.50%, 06/01/21 | | | 1,405 | | | | 1,516,993 | |
6.00%, 06/01/21 | | | 400 | | | | 436,868 | |
State of Illinois, GO: | | | | | | | | |
5.25%, 02/01/31 | | | 875 | | | | 906,132 | |
5.25%, 02/01/32 | | | 1,355 | | | | 1,398,739 | |
5.50%, 07/01/33 | | | 2,000 | | | | 2,108,960 | |
5.50%, 07/01/38 | | | 425 | | | | 444,308 | |
| | | | | | | | |
| | | | 25,764,257 | |
| | | | |
| SCHEDULES OF INVESTMENTS | | | 51 | |
| | |
Schedule of Investments (unaudited) (continued) October 31, 2018 | | BlackRock MuniHoldings Quality Fund, Inc. (MUS) (Percentages shown are based on Net Assets) |
| | | | | | | | |
| Security | | Par
(000) | | | Value | |
| Indiana — 3.9% | |
Indianapolis Local Public Improvement Bond Bank, RB, Series F, 5.25%, 02/01/36 | | $ | 3,055 | | | $ | 3,225,683 | |
Indianapolis Local Public Improvement Bond Bank, Refunding RB, Waterworks Project, Series A (AGC): | | | | | | | | |
5.50%, 01/01/19(a) | | | 545 | | | | 548,264 | |
5.50%, 01/01/38 | | | 2,235 | | | | 2,247,829 | |
State of Indiana Finance Authority, RB, Private Activity Bond, Ohio River Bridges, Series A, AMT, 5.00%, 07/01/40 | | | 565 | | | | 593,205 | |
| | | | | | | | |
| | | | 6,614,981 | |
| Iowa — 0.7% | |
Iowa Finance Authority, RB, Lifespace Communities, Series A, 5.00%, 05/15/48 | | | 1,100 | | | | 1,123,738 | |
| | | | | | | | |
| Louisiana — 1.7% | |
Lake Charles Louisiana Harbor & Terminal District, RB, Series B, AMT (AGM), 5.50%, 01/01/29 | | | 1,500 | | | | 1,656,180 | |
Tobacco Settlement Financing Corp., Refunding RB, Asset-Backed, Series A, 5.50%, 05/15/29 | | | 1,215 | | | | 1,234,015 | |
| | | | | | | | |
| | | | 2,890,195 | |
| Maryland — 2.7% | |
County of Howard Maryland Housing Commission, RB, M/F Housing, Woodfield Oxford Square Apartments, 5.00%, 12/01/42 | | | 1,430 | | | | 1,532,316 | |
Maryland Stadium Authority, RB, Construction and Revitalization Program, 5.00%, 05/01/34 | | | 2,700 | | | | 3,045,789 | |
| | | | | | | | |
| | | | 4,578,105 | |
| Massachusetts — 1.2% | |
Massachusetts Development Finance Agency, RB, Emerson College Issue, Series A: | | | | | | | | |
5.00%, 01/01/47 | | | 245 | | | | 256,689 | |
5.25%, 01/01/42 | | | 545 | | | | 582,229 | |
Massachusetts Development Finance Agency, Refunding RB, Emerson College, Series A, 5.00%, 01/01/40 | | | 595 | | | | 629,474 | |
Massachusetts Housing Finance Agency, Refunding RB, Series C, AMT, 5.35%, 12/01/42 | | | 485 | | | | 487,081 | |
| | | | | | | | |
| | | | 1,955,473 | |
| Minnesota — 1.1% | |
City of Minneapolis Minnesota, Refunding RB, Fairview Health Services, Series B (AGC): | | | | | | | | |
6.50%, 11/15/18(a) | | | 205 | | | | 205,344 | |
6.50%, 11/15/38 | | | 1,120 | | | | 1,121,882 | |
County of St. Paul Minnesota Housing & Redevelopment Authority, Refunding RB, Fairview Health Services, Series A, 4.00%, 11/15/43 | | | 575 | | | | 558,153 | |
| | | | | | | | |
| | | | 1,885,379 | |
| Mississippi — 2.5% | |
Mississippi Development Bank, RB, Jackson Water & Sewer System Project (AGM), 6.88%, 12/01/40 | | | 2,595 | | | | 3,045,466 | |
Mississippi State University Educational Building Corp., Refunding RB, Mississippi State University Improvement Project, 5.25%, 08/01/23(a) | | | 1,000 | | | | 1,129,990 | |
| | | | | | | | |
| | | | 4,175,456 | |
| Montana — 0.3% | |
Montana State Board of Housing, RB, S/F, Series B-2: | | | | | | | | |
3.38%, 12/01/37 | | | 245 | | | | 229,369 | |
3.50%, 12/01/42 | | | 105 | | | | 96,242 | |
3.60%, 12/01/47 | | | 165 | | | | 149,234 | |
| | | | | | | | |
| | | | 474,845 | |
| | | | | | | | |
| Security | | Par
(000) | | | Value | |
| Nevada — 4.8% | |
City of Carson City Nevada, Refunding RB, Carson Tahoe Regional Healthcare Project, 5.00%, 09/01/42 | | $ | 340 | | | $ | 359,877 | |
County of Clark Nevada, ARB, Las Vegas-McCarran International Airport, Series A (AGM), 5.25%, 07/01/39 | | | 1,410 | | | | 1,455,303 | |
County of Clark Nevada, GO, Stadium Improvement, Series A: | | | | | | | | |
5.00%, 06/01/36 | | | 1,205 | | | | 1,357,288 | |
5.00%, 06/01/37 | | | 3,000 | | | | 3,371,340 | |
County of Clark Nevada Water Reclamation District, GO, Series A, 5.25%, 07/01/19(a) | | | 1,500 | | | | 1,533,060 | |
| | | | | | | | |
| | | | 8,076,868 | |
| New Jersey — 11.8% | |
New Jersey EDA, RB: | | | | | | | | |
Goethals Bridge Replacement Project, AMT (AGM), Private Activity Bond, 5.00%, 01/01/31 | | | 790 | | | | 853,247 | |
Goethals Bridge Replacement Project, AMT, Private Activity Bond, 5.38%, 01/01/43 | | | 3,000 | | | | 3,209,340 | |
State Government Buildings Project, Series A, 5.00%, 06/15/47 | | | 2,500 | | | | 2,571,800 | |
New Jersey Health Care Facilities Financing Authority, RB, Virtua Health, Series A (AGC), 5.50%, 07/01/38 | | | 2,100 | | | | 2,147,040 | |
New Jersey Housing & Mortgage Finance Agency, Refunding RB, S/F Housing, Series BB, AMT, 3.80%, 10/01/32 | | | 1,435 | | | | 1,376,122 | |
New Jersey Transportation Trust Fund Authority, RB, Transportation System: | | | | | | | | |
Series A (AGC), 5.63%, 12/15/28 | | | 3,170 | | | | 3,184,265 | |
Series AA, 5.50%, 06/15/39 | | | 1,890 | | | | 2,005,139 | |
Series B, 5.25%, 06/15/36 | | | 1,000 | | | | 1,041,110 | |
New Jersey Transportation Trust Fund Authority, Refunding RB, Transportation System, Series A, 5.00%, 12/15/32 | | | 1,600 | | | | 1,705,920 | |
Tobacco Settlement Financing Corp., Refunding RB: | | | | | | | | |
Series A, 5.25%, 06/01/46 | | | 1,390 | | | | 1,469,244 | |
Sub-Series B, 5.00%, 06/01/46 | | | 305 | | | | 308,928 | |
| | | | | | | | |
| | | | 19,872,155 | |
| New York — 7.4% | |
City of New York New York, GO, Sub-Series F-1, 5.00%, 04/01/36 | | | 2,090 | | | | 2,343,099 | |
City of New York New York Municipal Water Finance Authority, Refunding RB, Water & Sewer System, 2nd General Resolution, Series EE, 5.38%, 06/15/43 | | | 1,305 | | | | 1,384,997 | |
City of New York New York Water & Sewer System, Refunding RB, 2nd General Resolution, Fiscal 2009, Series EE, 5.25%, 06/15/40 | | | 3,410 | | | | 3,469,504 | |
Hudson Yards Infrastructure Corp., RB, Senior, Fiscal 2012: | | | | | | | | |
5.75%, 02/15/21(a) | | | 1,555 | | | | 1,681,717 | |
5.75%, 02/15/47 | | | 955 | | | | 1,021,965 | |
Port Authority of New York & New Jersey, Refunding ARB, Consolidated, 166th Series, 5.25%, 07/15/36 | | | 2,000 | | | | 2,121,960 | |
TSASC, Inc., Refunding RB, Series A, 5.00%, 06/01/41 | | | 535 | | | | 547,722 | |
| | | | | | | | |
| | | | 12,570,964 | |
| Ohio — 1.3% | |
State of Ohio Turnpike Commission, RB, Junior Lien, Infrastructure Projects, Series A-1, 5.25%, 02/15/31 | | | 2,000 | | | | 2,199,080 | |
| | | | | | | | |
| Oklahoma — 0.5% | |
Oklahoma Development Finance Authority, RB, Provident Oklahoma Education Resources, Inc., Cross Village Student Housing Project, Series A, 5.25%, 08/01/57 | | | 955 | | | | 878,753 | |
| | | | | | | | |
| Pennsylvania — 7.2% | |
Altoona Area School District, GO, 5.00%, 12/01/36 | | | 110 | | | | 120,121 | |
County of Delaware Springfield School District, GO: | | | | | | | | |
5.00%, 03/01/40 | | | 865 | | | | 961,664 | |
5.00%, 03/01/43 | | | 590 | | | | 654,446 | |
| | |
| 52 | | 2018 BLACKROCK SEMI-ANNUAL REPORTTO SHAREHOLDERS |
| | |
Schedule of Investments (unaudited) (continued) October 31, 2018 | | BlackRock MuniHoldings Quality Fund, Inc. (MUS) (Percentages shown are based on Net Assets) |
| | | | | | | | |
| Security | | Par
(000) | | | Value | |
| Pennsylvania (continued) | |
County of Montgomery Higher Education & Health Authority, Refunding RB, Thomas Jeferson University, Series A, 5.00%, 09/01/48 | | $ | 980 | | | $ | 1,053,186 | |
County of Westmoreland Pennsylvania Municipal Authority, Refunding RB, (BAM), 5.00%, 08/15/36 | | | 1,290 | | | | 1,420,844 | |
Northampton County General Purpose Authority, Refunding RB, Lafayette College, 4.00%, 11/01/38 | | | 2,595 | | | | 2,573,825 | |
Pennsylvania Housing Finance Agency, RB, S/F, Series 125B, 3.65%, 10/01/42 | | | 1,000 | | | | 928,910 | |
Pennsylvania Turnpike Commission, RB, Sub-Series B-1, 5.25%, 06/01/47 | | | 1,170 | | | | 1,256,826 | |
Swarthmore Borough Authority, RB, Swarthmore College, 5.00%, 09/15/48 | | | 1,900 | | | | 2,139,419 | |
Township of Bristol Pennsylvania School District, GO, 5.25%, 06/01/37 | | | 1,000 | | | | 1,080,470 | |
| | | | | | | | |
| | | | 12,189,711 | |
| South Carolina — 6.8% | |
County of Charleston South Carolina, RB, Special Source, 5.25%, 12/01/38 | | | 2,180 | | | | 2,444,412 | |
County of Charleston South Carolina Airport District, ARB, Series A, AMT: | | | | | | | | |
5.50%, 07/01/38 | | | 1,000 | | | | 1,097,510 | |
6.00%, 07/01/38 | | | 1,695 | | | | 1,896,688 | |
5.50%, 07/01/41 | | | 1,000 | | | | 1,096,140 | |
State of South Carolina Ports Authority, RB, AMT, 5.25%, 07/01/50 | | | 1,095 | | | | 1,182,962 | |
State of South Carolina Public Service Authority, RB, Series E, 5.50%, 12/01/53 | | | 1,000 | | | | 1,054,670 | |
State of South Carolina Public Service Authority, Refunding RB, Series E, 5.25%, 12/01/55 | | | 2,500 | | | | 2,645,125 | |
| | | | | | | | |
| | | | 11,417,507 | |
| Tennessee — 1.6% | |
Metropolitan Nashville Airport Authority, ARB, Series B, AMT, 5.00%, 07/01/40 | | | 2,500 | | | | 2,679,575 | |
| | | | | | | | |
| Texas — 12.7% | |
City of Beaumont Texas, GO, Certificates of Obligation, 5.25%, 03/01/37 | | | 1,360 | | | | 1,487,976 | |
City of Houston Texas Airport System Revenue, Refunding RB, Sub-Series D, 5.00%, 07/01/37 | | | 1,175 | | | | 1,308,210 | |
City of Houston Texas Combined Utility System Revenue, Refunding RB, Combined 1st Lien, Series A (AGC)(a): | | | | | | | | |
6.00%, 05/15/19 | | | 4,000 | | | | 4,086,656 | |
Dallas Texas Area Rapid Transit, Refunding RB, Senior Lien(a): | | | | | | | | |
5.25%, 12/01/18 | | | 2,600 | | | | 2,607,143 | |
Dallas-Fort Worth Texas International Airport, ARB, Joint Improvement, AMT: | | | | | | | | |
Series A, 5.00%, 11/01/38 | | | 2,965 | | | | 3,067,470 | |
Series H, 5.00%, 11/01/37 | | | 2,200 | | | | 2,298,230 | |
Lower Colorado River Authority, Refunding RB, 5.50%, 05/15/33 | | | 1,240 | | | | 1,383,356 | |
North Texas Tollway Authority, RB, Special Projects, Series A, 5.50%, 09/01/21(a) | | | 3,150 | | | | 3,422,790 | |
North Texas Tollway Authority, Refunding RB, 1st Tier-Series A, 5.00%, 01/01/48 | | | 1,060 | | | | 1,149,061 | |
Red River Texas Education Financing Corp., RB, Texas Christian University Project, 5.25%, 03/15/38 | | | 620 | | | | 679,105 | |
| | | | | | | | |
| | | | 21,489,997 | |
| Vermont — 1.0% | |
University of Vermont & State Agricultural College, Refunding RB, 5.00%, 10/01/43 | | | 1,470 | | | | 1,622,160 | |
| | | | | | | | |
| | | | | | | | |
| Security | | Par
(000) | | | Value | |
| Virginia — 2.6% | |
City of Lexington Virginia IDA, RB, Washington & Lee University, 5.00%, 01/01/43 | | $ | 570 | | | $ | 609,478 | |
State of Virginia Public School Authority, RB, Fluvanna County School Financing, 6.50%, 12/01/18(a) | | | 1,300 | | | | 1,304,719 | |
Virginia Small Business Financing Authority, RB, Transform 66 P3 Project, AMT, 5.00%, 12/31/49 | | | 2,330 | | | | 2,441,607 | |
| | | | | | | | |
| | | | 4,355,804 | |
| Washington — 9.2% | |
City of Seattle Washington Municipal Light & Power, Refunding RB, Series A, 5.25%, 02/01/21(a) | | | 1,375 | | | | 1,468,912 | |
Port of Seattle Washington, ARB, Intermediate Lien, Series C, AMT: | | | | | | | | |
5.00%, 05/01/37 | | | 1,450 | | | | 1,578,644 | |
5.00%, 05/01/42 | | | 385 | | | | 414,225 | |
State of Washington, COP, Series B: | | | | | | | | |
5.00%, 07/01/36 | | | 1,000 | | | | 1,114,230 | |
5.00%, 07/01/37 | | | 3,910 | | | | 4,329,699 | |
5.00%, 07/01/38 | | | 650 | | | | 714,773 | |
State of Washington, GO: | | | | | | | | |
Series C, 5.00%, 02/01/36 | | | 4,300 | | | | 4,838,145 | |
Various Purposes, Series B, 5.25%, 02/01/21(a) | | | 1,075 | | | | 1,148,423 | |
| | | | | | | | |
| | | | 15,607,051 | |
| Wisconsin — 0.8% | |
Wisconsin Health & Educational Facilities Authority, Refunding RB, Milwaukee Regional Medical Center Thermal Service, 5.00%, 04/01/44(b) | | | 1,205 | | | | 1,318,101 | |
| | | | | | | | |
| Wyoming — 0.2% | |
State of Wyoming Municipal Power Agency, Inc., Refunding RB, Series A (BAM), 5.00%, 01/01/42 | | | 330 | | | | 357,796 | |
| | | | | | | | |
Total Municipal Bonds — 139.8%
(Cost — $229,404,336) | | | | 235,885,460 | |
| | | | | | | | |
|
Municipal Bonds Transferred to Tender Option Bond Trusts(c) | |
|
California — 2.9% | |
Sacramento Area Flood Control Agency, Refunding, Consolidated Capital Assessment District No. 2 Bonds, 5.00%, 10/01/47 | | | 4,500 | | | | 4,948,492 | |
| | | | | | | | |
| Colorado — 1.3% | |
City & County of Denver Colorado Airport System Revenue, Refunding ARB, Sub-System, Series A, AMT, 5.25%, 12/01/43(d) | | | 1,901 | | | | 2,119,966 | |
| | | | | | | | |
| Connecticut — 1.1% | |
State of Connecticut Health & Educational Facility Authority, Refunding RB, Trinity Health Credit Group, 5.00%, 12/01/45 | | | 1,771 | | | | 1,919,209 | |
| | | | | | | | |
| Illinois — 1.5% | |
City of Chicago Illionis Waterworks, Refunding RB, Water Revenue Project (AGM), 2nd Lien: | | | | | | | | |
2017, 5.25%, 11/01/18(a) | | | 1,662 | | | | 1,662,432 | |
2017, 5.25%, 11/01/33 | | | 482 | | | | 482,458 | |
5.25%, 11/01/18(a) | | | 364 | | | | 364,252 | |
| | | | | | | | |
| | | | 2,509,142 | |
| Maryland — 1.0% | |
City of Baltimore Maryland, RB, Wastewater Project, Series A, 5.00%, 07/01/46 | | | 1,499 | | | | 1,643,187 | |
| | | | | | | | |
| Michigan — 2.0% | |
State of Michigan Building Authority, Refunding RB, Facilities Program, Series I, 5.00%, 10/15/45 | | | 3,020 | | | | 3,306,523 | |
| | | | | | | | |
| | | | |
| SCHEDULES OF INVESTMENTS | | | 53 | |
| | |
Schedule of Investments (unaudited) (continued) October 31, 2018 | | BlackRock MuniHoldings Quality Fund, Inc. (MUS) (Percentages shown are based on Net Assets) |
| | | | | | | | |
| Security | | Par
(000) | | | Value | |
| Nevada — 2.3% | |
County of Clark Nevada Water Reclamation District, GO, Series B, 5.50%, 07/01/19(a) | | $ | 3,749 | | | $ | 3,837,579 | |
| | | | | | | | |
| New Jersey — 1.1% | |
New Jersey Housing & Mortgage Finance Agency, RB, S/F Housing, Series CC, 5.25%, 10/01/29 | | | 1,801 | | | | 1,812,575 | |
| | | | | | | | |
| New York — 5.4% | |
City of New York Transitional Finance Authority, BARB, Fiscal 2009, Series S-3, 5.25%, 01/15/39 | | | 1,400 | | | | 1,409,474 | |
New York Liberty Development Corp., ARB, 1 World Trade Center Port Authority Consolidated Bonds, 5.25%, 12/15/43 | | | 4,530 | | | | 4,882,820 | |
New York Liberty Development Corp., Refunding RB, 4 World Trade Center Project, 5.75%, 11/15/51(d) | | | 2,660 | | | | 2,895,369 | |
| | | | | | | | |
| | | | 9,187,663 | |
| Pennsylvania — 2.9% | |
Commonwealth of Pennsylvania, GO, 1st Series, 4.00%, 03/01/38(d) | | | 3,650 | | | | 3,606,237 | |
County of Westmoreland Pennsylvania Municipal Authority, Refunding RB, (BAM), 5.00%, 08/15/38 | | | 1,184 | | | | 1,279,914 | |
| | | | | | | | |
| | | | 4,886,151 | |
| Utah — 0.6% | |
City of Riverton Utah, RB, IHC Health Services, Inc., 5.00%, 08/15/19(a) | | | 1,005 | | | | 1,028,643 | |
| | | | | | | | |
| | | | | | | | |
| Security | | Par
(000) | | | Value | |
| Virginia — 1.5% | |
County of Fairfax Virginia EDA, RB, Metrorail Parking System Project, 5.00%, 04/01/47(d) | | $ | 2,320 | | | $ | 2,559,215 | |
| | | | | | | | |
Total Municipal Bonds Transferred to Tender Option Bond
Trusts — 23.6%.
(Cost — $39,426,088) | | | | 39,758,345 | |
| | | | | | | | |
| |
Total Investments — 163.4%
(Cost — $268,830,424) | | | | 275,643,805 | |
Other Assets Less Liabilities — 1.2% | | | | 1,996,566 | |
Liability for TOB Trust Certificates, Including Interest Expense and Fees Payable — (13.0)% | | | | (21,969,820 | ) |
VMTP Shares at Liquidation Value — (51.6)% | | | | (87,000,000 | ) |
| | | | | | | | |
Net Assets Applicable to Common Shares — 100.0% | | | $ | 168,670,551 | |
| | | | | | | | |
| (a) | U.S. Government securities, held in escrow, are used to pay interest on this security, as well as to retire the bond in full at the date indicated, typically at a premium to par. |
| (b) | When-issued security. |
| (c) | Represent bonds transferred to a TOB Trust in exchange of cash and residual certificates received by the Fund. These bonds serve as collateral in a secured borrowing. See Note 4 of the Notes to Financial Statements for details. |
| (d) | All or a portion of security is subject to a recourse agreement. The aggregate maximum potential amount the Fund could ultimately be required to pay under the agreements, which expire between November 15, 2019 to June 1, 2026, is $5,539,532. See Note 4 of the Notes to Financial Statements for details. |
During the six months ended October 31, 2018, investments in issuers considered to be an affiliate of the Fund for purposes of Section 2(a)(3) of the Investment Company Act of 1940, as amended, were as follows:
| | | | | | | | | | | | | | | | | | | | | | | | | | | | |
| Affiliate | | Shares
Held at
04/30/18 | | | Net
Activity | | | Shares
Held at
10/31/18 | | | Value at
10/31/18 | | | Income | | | Net
Realized
Gain (Loss) (a) | | | Change in
Unrealized
Appreciation
(Depreciation) | |
BlackRock Liquidity Funds, MuniCash, Institutional Class | | | 2,822,221 | | | | (2,822,221 | ) | | | — | | | $ | — | | | $ | 14,894 | | | $ | 1,368 | | | $ | — | |
| | | | | | | | | | | | | | | | | | | | | | | | | | | | |
| | (a) | Includes net capital gain distributions, if applicable. | |
Derivative Financial Instruments Outstanding as of Period End
Futures Contracts
| | | | | | | | | | | | | | | | |
| Description | | Number of
Contracts | | | Expiration
Date | | | Notional
Amount (000) | | | Value/
Unrealized
Appreciation
(Depreciation) | |
Short Contracts: | | | | | | | | | | | | | | | | |
10-Year U.S. Treasury Note | | | 11 | | | | 12/19/18 | | | $ | 1,303 | | | $ | 8,000 | |
Long U.S. Treasury Bond | | | 31 | | | | 12/19/18 | | | | 4,282 | | | | 102,392 | |
5-Year U.S. Treasury Note | | | 15 | | | | 12/31/18 | | | | 1,686 | | | | 7,309 | |
| | | | | | | | | | | | | | | | |
| | | | | | | | | | | | | | $ | 117,701 | |
| | | | | | | | | | | | | | | | |
| | |
| 54 | | 2018 BLACKROCK SEMI-ANNUAL REPORTTO SHAREHOLDERS |
| | |
Schedule of Investments (unaudited) (continued) October 31, 2018 | | BlackRock MuniHoldings Quality Fund, Inc. (MUS) |
Derivative Financial Instruments Categorized by Risk Exposure
As of period end, the fair values of derivative financial instruments located in the Statements of Assets and Liabilities were as follows:
| | | | | | | | | | | | | | | | | | | | | | | | | | | | |
| | | Commodity
Contracts | | | Credit
Contracts | | | Equity
Contracts | | | Foreign
Currency
Exchange
Contracts | | | Interest
Rate
Contracts | | | Other
Contracts | | | Total | |
Assets — Derivative Financial Instruments | | | | | | | | | | | | | | | | | | | | | | | | | | | | |
Futures contracts | | | | | | | | | | | | | | | | | | | | | | | | | | | | |
Net unrealized appreciation(a) | | $ | — | | | $ | — | | | $ | — | | | $ | — | | | $ | 117,701 | | | $ | — | | | $ | 117,701 | |
| | | | | | | | | | | | | | | | | | | | | | | | | | | | |
| | (a) | Includes cumulative appreciation (depreciation) on futures contracts, if any, as reported in the Schedule of Investments. Only current day’s variation margin is reported within the Statements of Assets and Liabilities. | |
For the six months ended October 31, 2018, the effect of derivative financial instruments in the Statements of Operations was as follows:
| | | | | | | | | | | | | | | | | | | | | | | | | | | | |
| | | Commodity
Contracts | | | Credit
Contracts | | | Equity
Contracts | | | Foreign
Currency
Exchange
Contracts | | | Interest
Rate
Contracts | | | Other
Contracts | | | Total | |
Net Realized Gain (Loss) from: | | | | | | | | | | | | | | | | | | | | | | | | | | | | |
Futures contracts | | $ | — | | | $ | — | | | $ | — | | | $ | — | | | $ | 158,324 | | | $ | — | | | $ | 158,324 | |
| | | | | | | | | | | | | | | | | | | | | | | | | | | | |
| Net Change in Unrealized Appreciation (Depreciation) on: | | | | | | | | | | | | | | | | | | | | | |
Futures contracts | | $ | — | | | $ | — | | | $ | — | | | $ | — | | | $ | 68,524 | | | $ | — | | | $ | 68,524 | |
| | | | | | | | | | | | | | | | | | | | | | | | | | | | |
Average Quarterly Balances of Outstanding Derivative Financial Instruments
| | | | |
Futures contracts: | |
Average notional value of contracts — short | | $ | 8,260,777 | |
For more information about the Fund’s investment risks regarding derivative financial instruments, refer to the Notes to Financial Statements.
Fair Value Hierarchy as of Period End
Various inputs are used in determining the fair value of investments and derivative financial instruments. For information about the Fund’s policy regarding valuation of investments and derivative financial instruments, refer to the Notes to Financial Statements.
The following tables summarize the Fund’s investments and derivative financial instruments categorized in the disclosure hierarchy:
| | | | | | | | | | | | | | | | |
| | | Level 1 | | | Level 2 | | | Level 3 | | | Total | |
Assets: | |
Investments: | |
Long-Term Investments(a) | | $ | — | | | $ | 275,643,805 | | | $ | — | | | $ | 275,643,805 | |
| | | | | | | | | | | | | | | | |
Derivative Financial Instruments(b) | |
Assets: | |
Interest rate contracts | | $ | 117,701 | | | $ | — | | | $ | — | | | $ | 117,701 | |
| | | | | | | | | | | | | | | | |
| | (a) | See above Schedule of Investments for values in each state or political subdivision. | |
| | (b) | Derivative financial instruments are futures contracts, which are valued at the unrealized appreciation (depreciation) on the instrument. | |
The Fund may hold assets and/or liabilities in which the fair value approximates the carrying amount for financial statement purposes. As of period end, such assets and/or liabilities are categorized within the disclosure hierarchy as follows:
| | | | | | | | | | | | | | | | |
| | | Level 1 | | | Level 2 | | | Level 3 | | | Total | |
Liabilities: | |
TOB Trust Certificates | | $ | — | | | $ | (21,886,518 | ) | | $ | — | | | $ | (21,886,518 | ) |
VMTP Shares at Liquidation Value | | | — | | | | (87,000,000 | ) | | | — | | | | (87,000,000 | ) |
| | | | | | | | | | | | | | | | |
| | $ | — | | | $ | (108,886,518 | ) | | $ | — | | | $ | (108,886,518 | ) |
| | | | | | | | | | | | | | | | |
During the six months ended October 31, 2018, there were no transfers between levels.
See notes to financial statements.
| | | | |
| SCHEDULES OF INVESTMENTS | | | 55 | |
| | |
Schedule of Investments (unaudited) October 31, 2018 | | BlackRock Muni Intermediate Duration Fund, Inc. (MUI) (Percentages shown are based on Net Assets) |
| | | | | | | | |
| Security | | Par (000) | | | Value | |
| Municipal Bonds — 138.4% | |
|
Alabama — 0.8% | |
City of Birmingham Alabama Special Care Facilities Financing Authority, RB, Children’s Hospital (AGC), 6.00%, 06/01/19(a) | | $ | 4,615 | | | $ | 4,721,745 | |
| | | | | | | | |
| Arizona — 3.5% | |
Arizona Board of Regents, RB, University of Arizona, 5.00%, 08/01/28 | | | 2,000 | | | | 2,128,580 | |
Arizona Health Facilities Authority, Refunding RB, Phoenix Children’s Hospital, Series A, 5.00%, 02/01/30 | | | 2,685 | | | | 2,845,590 | |
Arizona Industrial Development Authority, RB, Academies of Math & Science Projects, Series B, 4.25%, 07/01/27(b) | | | 545 | | | | 520,061 | |
City of Phoenix Arizona IDA, RB, Facility, Legacy Traditional Schools Project, Series A, 5.75%, 07/01/24(b) | | | 750 | | | | 796,327 | |
City of Phoenix Arizona IDA, Refunding RB, Downtown Phoenix Student Housing, Series A: | | | | | | | | |
5.00%, 07/01/25 | | | 300 | | | | 330,837 | |
5.00%, 07/01/29 | | | 175 | | | | 193,785 | |
5.00%, 07/01/31 | | | 175 | | | | 191,695 | |
City of Tucson Arizona, COP, Refunding, (AGC), 4.00%, 07/01/20 | | | 2,325 | | | | 2,392,192 | |
County of Pinal Arizona Electric District No. 3, Refunding RB, 5.00%, 07/01/21(a) | | | 1,600 | | | | 1,715,248 | |
Glendale Union School District No. 205, GO, Series C (BAM): | | | | | | | | |
5.00%, 07/01/24 | | | 1,945 | | | | 2,147,825 | |
5.00%, 07/01/27 | | | 500 | | | | 547,765 | |
Phoenix-Mesa Gateway Airport Authority, RB, Mesa Project, AMT: | | | | | | | | |
5.00%, 07/01/27 | | | 700 | | | | 746,704 | |
5.00%, 07/01/32 | | | 1,925 | | | | 2,042,444 | |
Scottsdale IDA, Refunding RB, Scottsdale Healthcare,
Series C (AGM), 5.00%, 09/01/35 | | | 2,050 | | | | 2,137,699 | |
State of Arizona, COP, Department of Administration,
Series A (AGM), 4.25%, 10/01/23 | | | 1,000 | | | | 1,017,150 | |
| | | | | | | | |
| | | | | | | 19,753,902 | |
| Arkansas — 0.7% | |
City of Benton Arkansas, RB, 5.00%, 06/01/29 | | | 1,055 | | | | 1,167,221 | |
University of Arkansas, Refunding RB, 5.00%, 03/01/31 | | | 2,315 | | | | 2,587,128 | |
| | | | | | | | |
| | | | | | | 3,754,349 | |
| California — 4.7% | |
California Health Facilities Financing Authority, RB, Sutter Health, Series B, 5.00%, 08/15/20(a) | | | 2,135 | | | | 2,252,169 | |
California Infrastructure & Economic Development Bank, Refunding RB, 4.00%, 11/01/31 | | | 1,335 | | | | 1,391,484 | |
City of San Jose California, Refunding ARB, Series A-1, AMT, 5.00%, 03/01/25 | | | 2,000 | | | | 2,109,660 | |
Golden State Tobacco Securitization Corp., Refunding RB, Series A-1: | | | | | | | | |
5.00%, 06/01/32 | | | 6,715 | | | | 7,351,179 | |
5.00%, 06/01/34 | | | 5,785 | | | | 6,284,650 | |
State of California, GO: | | | | | | | | |
5.50%, 04/01/28 | | | 15 | | | | 15,046 | |
Various Purposes, 5.75%, 04/01/31 | | | 7,000 | | | | 7,108,640 | |
| | | | | | | | |
| | | | | | | 26,512,828 | |
| Colorado — 1.5% | |
City & County of Denver Colorado Airport System Revenue, Refunding ARB, AMT, Sub-System, Series A, 5.00%, 12/01/32 | | | 5,000 | | | | 5,591,750 | |
Colorado Health Facilities Authority, Refunding RB, Catholic Health Initiatives, Series B-1, 5.00%, 07/01/38 | | | 270 | | | | 281,351 | |
| | | | | | | | |
| Security | | Par (000) | | | Value | |
| Colorado (continued) | |
Park Creek Metropolitan District, Refunding, Tax Allocation Bonds, 5.00%, 12/01/34 | | $ | 500 | | | $ | 543,720 | |
University of Northern Colorado, Refunding RB, Series A, 5.00%, 06/01/31 | | | 2,000 | | | | 2,205,160 | |
| | | | | | | | |
| | | | | | | 8,621,981 | |
| Connecticut — 2.6% | |
Connecticut State Health & Educational Facility Authority, Refunding RB, Lawrence & Memorial Hospital, Series F,
5.00%, 07/01/21(a) | | | 4,530 | | | | 4,844,155 | |
State of Connecticut, GO, Series A: | | | | | | | | |
5.00%, 04/15/30 | | | 5,000 | | | | 5,506,050 | |
5.00%, 04/15/31 | | | 4,000 | | | | 4,384,800 | |
| | | | | | | | |
| | | | | | | 14,735,005 | |
| Delaware — 0.8% | |
County of Kent Delaware, RB, CHF-Dover, LLC-Delaware State University Project, Series A: | | | | | | | | |
5.00%, 07/01/29 | | | 880 | | | | 951,826 | |
5.00%, 07/01/30 | | | 1,030 | | | | 1,108,321 | |
5.00%, 07/01/31 | | | 750 | | | | 804,052 | |
5.00%, 07/01/32 | | | 375 | | | | 400,545 | |
5.00%, 07/01/33 | | | 1,190 | | | | 1,266,386 | |
| | | | | | | | |
| | | | | | | 4,531,130 | |
| Florida — 6.0% | |
Capital Region Community Development District, Refunding, Special Assessment Bonds, Series A-1: | | | | | | | | |
4.13%, 05/01/23 | | | 500 | | | | 495,145 | |
4.63%, 05/01/28 | | | 500 | | | | 489,845 | |
County of Broward Florida School Board, COP, Refunding, Series A (AGM), 5.00%, 07/01/21(a) | | | 10,000 | | | | 10,733,800 | |
County of Lee Florida, Refunding ARB, Series A, AMT (AGM), 5.00%, 10/01/27 | | | 1,635 | | | | 1,739,280 | |
County of Lee Florida, Refunding RB, Series A, AMT, 5.50%, 10/01/23 | | | 1,000 | | | | 1,079,090 | |
County of Miami-Dade Florida, RB, AMT, Series B: | | | | | | | | |
6.00%, 10/01/28 | | | 3,470 | | | | 3,916,866 | |
6.00%, 10/01/29 | | | 3,480 | | | | 3,924,779 | |
County of Miami-Dade Florida Educational Facilities Authority, Refunding RB, Series A, 5.00%, 04/01/32 | | | 5,020 | | | | 5,521,749 | |
County of Miami-Dade Florida Transit System Sales Surtax Revenue, Refunding RB, 5.00%, 07/01/32 | | | 1,500 | | | | 1,620,075 | |
Lakewood Ranch Stewardship District, Special Assessment Bonds: | | | | | | | | |
Del Webb Project, 3.65%, 05/01/22(b) | | | 525 | | | | 523,462 | |
Del Webb Project, 4.30%, 05/01/27(b) | | | 520 | | | | 514,166 | |
Lakewood National and Polo Run Projects,
4.00%, 05/01/22 | | | 1,230 | | | | 1,235,990 | |
Midtown Miami Community Development District, Refunding, Special Assessment Bonds, Series A, 4.25%, 05/01/24 | | | 1,300 | | | | 1,329,367 | |
Sarasota County Health Facilities Authority, RB, Sunnyside Village Project, 5.00%, 05/15/33 | | | 600 | | | | 650,142 | |
Sterling Hill Community Development District, Refunding, Special Assessment Bonds, Series B, 5.50%, 11/01/10(c)(d) | | | 143 | | | | 91,229 | |
| | | | | | | | |
| | | | | | | 33,864,985 | |
| Georgia — 2.8% | |
City of Atlanta Georgia Water & Wastewater Revenue, Refunding RB, 5.00%, 11/01/32 | | | 10,315 | | | | 11,498,853 | |
County of Cobb Kennestone Hospital Authority, Refunding RB, Revenue Anticipation Certificates, 5.00%, 04/01/32 | | | 1,250 | | | | 1,379,850 | |
Main Street Natural Gas Inc, RB, Series A,
5.50%, 09/15/28 | | | 2,500 | | | | 2,900,525 | |
| | | | | | | | |
| | | | | | | 15,779,228 | |
| | |
| 56 | | 2018 BLACKROCK SEMI-ANNUAL REPORTTO SHAREHOLDERS |
| | |
Schedule of Investments (unaudited) (continued) October 31, 2018 | | BlackRock Muni Intermediate Duration Fund, Inc. (MUI) (Percentages shown are based on Net Assets) |
| | | | | | | | |
| Security | | Par (000) | | | Value | |
| Hawaii — 0.9% | |
State of Hawaii Airports System, Refunding ARB, Series A, 5.25%, 07/01/29 | | $ | 5,000 | | | $ | 5,249,350 | |
| | | | | | | | |
| Idaho — 1.3% | |
Idaho Health Facilities Authority, Refunding RB, St. Lukes Health Syatem, Series A: | | | | | | | | |
5.00%, 03/01/32 | | | 4,100 | | | | 4,525,047 | |
5.00%, 03/01/33 | | | 2,410 | | | | 2,649,434 | |
| | | | | | | | |
| | | | | | | 7,174,481 | |
| Illinois — 15.1% | |
Chicago Board of Education, GO, Refunding Dedicated Revenues, Series D, 5.00%, 12/01/26 | | | 4,185 | | | | 4,322,435 | |
City of Chicago Illinois Midway International Airport, Refunding ARB, 2nd Lien, Series A, AMT: | | | | | | | | |
5.00%, 01/01/32 | | | 5,000 | | | | 5,336,650 | |
5.50%, 01/01/32 | | | 1,500 | | | | 1,638,315 | |
City of Chicago Illinois O’Hare International Airport, Refunding GARB, AMT, Series C: | | | | | | | | |
5.25%, 01/01/28 | | | 1,350 | | | | 1,467,464 | |
5.25%, 01/01/29 | | | 3,020 | | | | 3,276,609 | |
City of Chicago Illinois O’Hare International Airport, RB, Refunding GARB, 5.00%, 01/01/32 | | | 3,745 | | | | 4,079,878 | |
City of Chicago Illinois O’Hare International Airport, Refunding GARB, Senior Lien, Series A, AMT, 5.00%, 01/01/23 | | | 13,000 | | | | 14,084,330 | |
City of Chicago Illinois Transit Authority, RB,
5.25%, 12/01/31 | | | 3,700 | | | | 3,916,265 | |
Cook County Community College District No. 508, GO, City College of Chicago, 5.13%, 12/01/38 | | | 1,000 | | | | 1,022,600 | |
Illinois Finance Authority, Refunding RB, CHF-Chicago, LLC-University Of Illinois at Chicago: | | | | | | | | |
5.00%, 02/15/28 | | | 810 | | | | 887,695 | |
5.00%, 02/15/29 | | | 400 | | | | 436,172 | |
5.00%, 02/15/30 | | | 500 | | | | 542,490 | |
5.00%, 02/15/31 | | | 500 | | | | 540,170 | |
5.00%, 02/15/32 | | | 500 | | | | 537,855 | |
Madison-Macoupin Etc. Counties Community College District No. 536, GO, Refunding, Lewis & Clark Community College: | | | | | | | | |
5.00%, 05/01/30 | | | 475 | | | | 490,571 | |
5.00%, 05/01/31 | | | 500 | | | | 516,315 | |
5.00%, 05/01/32 | | | 500 | | | | 515,720 | |
Metropolitan Pier & Exposition Authority, Refunding RB, McCormick Place Expansion Project, 5.00%, 12/15/28 | | | 1,200 | | | | 1,300,428 | |
Railsplitter Tobacco Settlement Authority, RB,
5.50%, 06/01/21(a) | | | 3,500 | | | | 3,778,985 | |
State of Illinois, GO: | | | | | | | | |
5.25%, 02/01/30 | | | 5,000 | | | | 5,192,100 | |
5.00%, 04/01/31 | | | 1,000 | | | | 1,017,980 | |
5.00%, 05/01/31 | | | 10,010 | | | | 10,187,978 | |
State of Illinois, GO, Refunding, Series B, 5.00%, 10/01/27 | | | 470 | | | | 487,780 | |
State of Illinois, GO, Series D, 5.00%, 11/01/28 | | | 1,645 | | | | 1,694,251 | |
State of Illinois Finance Authority, Refunding RB, Southern Illinois Healthcare Enterprises, Inc.: | | | | | | | | |
5.00%, 03/01/30 | | | 550 | | | | 605,385 | |
5.00%, 03/01/32 | | | 920 | | | | 1,003,645 | |
State of Illinois Toll Highway Authority, RB, Series A, 5.00%, 01/01/34 | | | 9,140 | | | | 9,872,480 | |
State of Illinois Toll Highway Authority, Refunding RB, Senior Series A, 5.00%, 12/01/31 | | | 5,220 | | | | 5,774,834 | |
| | | | | | | | |
| | | | | | | 84,527,380 | |
| Indiana — 4.1% | |
City of Whiting Indiana, RB, BP Products North America, Inc. Project, 5.25%, 01/01/21 | | | 4,800 | | | | 5,078,256 | |
| | | | | | | | |
| Security | | Par (000) | | | Value | |
| Indiana (continued) | |
County of Jasper Indiana, Refunding RB, Northern Indiana Public Service Co., Series C (NPFGC), 5.85%, 04/01/19 | | $ | 2,000 | | | $ | 2,029,020 | |
Indiana Finance Authority, RB, Wastewater, 1st Lien, Series A, 5.25%, 10/01/31 | | | 10,000 | | | | 10,773,800 | |
Indiana Finance Authority, Refunding RB, US Steel Corp. Project, 6.00%, 12/01/19 | | | 5,000 | | | | 5,115,200 | |
| | | | | | | | |
| | | | | | | 22,996,276 | |
| Iowa — 1.2% | |
Iowa Higher Education Loan Authority, RB, Private College Facility: | | | | | | | | |
5.25%, 04/01/23 | | | 695 | | | | 741,002 | |
5.25%, 04/01/24 | | | 730 | | | | 778,319 | |
5.25%, 04/01/25 | | | 520 | | | | 554,419 | |
5.25%, 04/01/26 | | | 360 | | | | 383,652 | |
Iowa Higher Education Loan Authority, Refunding RB, Private College Facility: | | | | | | | | |
5.00%, 09/01/20(a) | | | 2,315 | | | | 2,430,171 | |
Upper Iowa University Project, 5.00%, 09/01/20(e) | | | 800 | | | | 828,392 | |
Iowa Student Loan Liquidity Corp., Refunding RB, AMT, Series A, 5.00%, 12/01/26 | | | 775 | | | | 850,469 | |
| | | | | | | | |
| | | | | | | 6,566,424 | |
| Kansas — 1.4% | |
County of Seward Unified School District No. 480 Liberal, GO, Refunding: | | | | | | | | |
5.00%, 09/01/22(a) | | | 1,005 | | | | 1,092,365 | |
5.00%, 09/01/22(a) | | | 3,990 | | | | 4,382,736 | |
5.00%, 09/01/33 | | | 1,005 | | | | 1,092,365 | |
Kansas Development Finance Authority, Refunding RB, Health Hospital Nursing Home Improvements: | | | | | | | | |
5.00%, 11/15/19(a) | | | 35 | | | | 35,994 | |
5.00%, 11/15/23 | | | 1,465 | | | | 1,502,064 | |
| | | | | | | | |
| | | | | | | 8,105,524 | |
| Kentucky — 0.5% | |
Countyof Louisville/Jefferson Metropolitan Government, Refunding RB, Catholic Health Initiatives: | | | | | | | | |
5.00%, 12/01/35 | | | 120 | | | | 124,816 | |
Series A, 5.00%, 12/01/31 | | | 2,750 | | | | 2,877,242 | |
| | | | | | | | |
| | | | | | | 3,002,058 | |
| Louisiana — 3.4% | |
City of Bossier City Louisiana Utilities, Refunding RB, 5.00%, 10/01/32 | | | 2,000 | | | | 2,242,860 | |
City of New Orleans Louisiana Aviation Board, Refunding GARB, Restructuring, Series A-2 (AGC),
6.00%, 01/01/19(a) | | | 850 | | | | 855,500 | |
Louisiana Local Government Environmental Facilities & Community Development Authority, Refunding RB, BRCC Facilities Corp. Project: | | | | | | | | |
5.00%, 12/01/27 | | | 3,445 | | | | 3,685,013 | |
5.00%, 12/01/28 | | | 3,715 | | | | 3,973,824 | |
New Orleans Aviation Board, RB, Series A, 5.00%, 01/01/33 | | | 1,000 | | | | 1,079,590 | |
State of Louisiana Gasoline & Fuels Tax Revenue, Refunding RB, 4.00%, 05/01/34 | | | 3,000 | | | | 3,079,800 | |
Terrebonne Levee & Conservation District, RB, Sales Tax, 5.00%, 07/01/28 | | | 3,660 | | | | 4,007,956 | |
| | | | | | | | |
| | | | | | | 18,924,543 | |
| Maine — 0.4% | |
Portland Housing Development Corp., Refunding RB, Senior Living, Retirement Facilities, Series A, 6.00%, 02/01/34 | | | 1,965 | | | | 1,967,240 | |
| | | | | | | | |
| | | | |
| SCHEDULES OF INVESTMENTS | | | 57 | |
| | |
Schedule of Investments (unaudited) (continued) October 31, 2018 | | BlackRock Muni Intermediate Duration Fund, Inc. (MUI) (Percentages shown are based on Net Assets) |
| | | | | | | | |
| Security | | Par (000) | | | Value | |
| Maryland — 1.7% | |
City of Rockville Maryland, RB, Ingleside King Farm Project, 3.50%, 11/01/26 | | $ | 1,825 | | | $ | 1,780,160 | |
Maryland Economic Development Corp., RB, Transportation Facilities Project, Series A, 5.13%, 06/01/20(e) | | | 1,020 | | | | 1,056,394 | |
Maryland Economic Development Corp., Refunding RB, Transportation Facilities Project, Series A: | | | | | | | | |
5.00%, 06/01/29 | | | 1,835 | | | | 2,046,282 | |
5.00%, 06/01/30 | | | 1,015 | | | | 1,124,914 | |
5.00%, 06/01/31 | | | 1,000 | | | | 1,103,190 | |
5.00%, 06/01/32 | | | 1,000 | | | | 1,095,580 | |
Maryland Health & Higher Educational Facilities Authority, RB, Johns Hopkins Health System, Series B,
5.00%, 07/01/33 | | | 1,140 | | | | 1,238,735 | |
| | | | | | | | |
| | | | | | | 9,445,255 | |
| Massachusetts — 1.7% | |
Massachusetts Development Finance Agency, Refunding RB: | | | | | | | | |
Emerson College Issue, Series A, 5.00%, 01/01/31 | | | 1,730 | | | | 1,842,069 | |
Suffolk University, 5.00%, 07/01/29 | | | 2,700 | | | | 2,981,178 | |
Suffolk University, 5.00%, 07/01/30 | | | 3,125 | | | | 3,430,938 | |
Massachusetts Health & Educational Facilities Authority, Refunding RB, Winchester Hospital, 5.00%, 07/01/25 | | | 1,060 | | | | 1,101,658 | |
| | | | | | | | |
| | | | | | | 9,355,843 | |
| Michigan — 2.3% | |
Manistee Area Public Schools, GO, Refunding, (Q-SBLF), 5.00%, 05/01/25 | | | 1,000 | | | | 1,066,170 | |
Michigan Finance Authority, Refunding RB, Senior Lien, Detroit Water and Sewer, Series C-3 (AGM),
5.00%, 07/01/31 | | | 4,000 | | | | 4,370,120 | |
Michigan State Building Authority, Refunding RB, Facilities Program, Series II-A, 5.00%, 10/15/24 | | | 2,500 | | | | 2,681,225 | |
Michigan State Hospital Finance Authority, Refunding RB, Henry Ford Health System, 5.25%, 11/15/19(a) | | | 4,900 | | | | 5,059,397 | |
| | | | | | | | |
| | | | | | | 13,176,912 | |
| Minnesota — 2.1% | |
City of Minneapolis, RB, YMCA of the Greater Twin Cities Project: | | | | | | | | |
4.00%, 06/01/30 | | | 150 | | | | 154,146 | |
4.00%, 06/01/31 | | | 50 | | | | 51,082 | |
City of Minneapolis, Refunding RB, Fairview Health Services, Series A, 5.00%, 11/15/33 | | | 2,370 | | | | 2,632,596 | |
County of St. Paul Minnesota Housing & Redevelopment Authority, RB, Great River School Project, Series A,
4.75%, 07/01/29(b) | | | 250 | | | | 247,102 | |
Duluth Economic Development Authority, Refunding RB, Essentia Health Obligated Group, Series A(f): | | | | | | | | |
5.00%, 02/15/33 | | | 1,000 | | | | 1,093,920 | |
5.00%, 02/15/34 | | | 1,185 | | | | 1,286,626 | |
University of Minnesota, RB, Biomedical Science Research Facilities Funding Program: | | | | | | | | |
Series B, 5.00%, 08/01/36 | | | 1,000 | | | | 1,065,660 | |
Series C, 5.00%, 08/01/27 | | | 1,390 | | | | 1,538,021 | |
Series C, 5.00%, 08/01/28 | | | 740 | | | | 818,107 | |
Series C, 5.00%, 08/01/29 | | | 1,555 | | | | 1,716,938 | |
Series C, 5.00%, 08/01/30 | | | 835 | | | | 920,779 | |
| | | | | | | | |
| | | | | | | 11,524,977 | |
| Missouri — 0.3% | |
City of St. Louis Missouri IDA, Refunding RB, Ballpark Village Development Project, Series A, 3.88%, 11/15/29 | | | 370 | | | | 368,187 | |
St. Louis County Industrial Development Authority, Refunding RB, Friendship Village St. Louis Obligated Group: | | | | | | | | |
5.00%, 09/01/27 | | | 360 | | | | 375,912 | |
5.00%, 09/01/32 | | | 1,015 | | | | 1,039,685 | |
| | | | | | | | |
| | | | | | | 1,783,784 | |
| | | | | | | | |
| Security | | Par (000) | | | Value | |
| Montana — 0.1% | |
County of Yellowstone Montana School District No. 2 Billings, GO, 5.00%, 06/15/30 | | $ | 500 | | | $ | 552,160 | |
| | | | | | | | |
| Nebraska — 0.9% | |
County of Douglas Nebraska Hospital Authority No. 3, Refunding RB, 5.00%, 11/01/30 | | | 800 | | | | 879,632 | |
County of Lancaster Nebraska Hospital Authority No. 1, Refunding RB, Immanuel Obligation Group,
5.50%, 01/01/30 | | | 1,000 | | | | 1,032,060 | |
Nebraska Public Power District, Refunding RB, Series A: | | | | | | | | |
5.00%, 01/01/30 | | | 1,000 | | | | 1,071,150 | |
5.00%, 01/01/32 | | | 2,000 | | | | 2,136,020 | |
| | | | | | | | |
| | | | | | | 5,118,862 | |
| Nevada — 1.7% | |
County of Clark Nevada Department of Aviation, Refunding RB, 5.00%, 07/01/33 | | | 5,000 | | | | 5,457,200 | |
County of Humboldt Nevada, Refunding RB, Idaho Power Co. Project, 5.15%, 12/01/24 | | | 3,800 | | | | 3,887,058 | |
| | | | | | | | |
| | | | | | | 9,344,258 | |
| New Hampshire — 0.3% | |
New Hampshire Business Finance Authority, Refunding RB, Resource Recovery, Covanta Project, Series A, AMT, 4.00%, 11/01/27(b) | | | 795 | | | | 784,943 | |
New Hampshire Health & Education Facilities Authority Act, Refunding RB, Dartmouth-Hitchcock Obligated Group, Series A: | | | | | | | | |
5.00%, 08/01/31 | | | 640 | | | | 714,176 | |
5.00%, 08/01/32 | | | 365 | | | | 405,176 | |
| | | | | | | | |
| | | | | | | 1,904,295 | |
| New Jersey — 26.6% | |
County of Essex New Jersey Improvement Authority, LRB, Newark Project, Series A (AGM), 5.00%, 11/01/20 | | | 1,364 | | | | 1,399,873 | |
New Jersey EDA, ARB, Continental Airlines, Inc. Project, 5.13%, 09/15/23 | | | 6,040 | | | | 6,438,882 | |
New Jersey EDA, RB, Goethals Bridge Replacement Project, Private Activity Bond AMT: | | | | | | | | |
5.50%, 01/01/26 | | | 1,500 | | | | 1,667,475 | |
5.50%, 01/01/27 | | | 1,000 | | | | 1,107,120 | |
New Jersey EDA, Refunding ARB, Port Newark Container Terminal LLC Project, AMT: | | | | | | | | |
5.00%, 10/01/26 | | | 2,135 | | | | 2,322,325 | |
5.00%, 10/01/27 | | | 1,680 | | | | 1,827,202 | |
New Jersey EDA, Refunding RB: | | | | | | | | |
New Jersey American Water Co., Series E, AMT, 4.70%, 12/01/25 | | | 3,000 | | | | 3,100,830 | |
School Facilities Construction, Series AA, 4.25%, 12/15/24 | | | 3,850 | | | | 3,872,830 | |
School Facilities Construction, Series EE, 5.00%, 09/01/23 | | | 3,465 | | | | 3,618,153 | |
New Jersey Educational Facilities Authority, RB, Higher Education Facilities Trust Fund, 5.00%, 06/15/28 | | | 10,000 | | | | 10,622,500 | |
New Jersey Educational Facilities Authority, Refunding RB, 5.00%, 07/01/30 | | | 5,000 | | | | 5,495,100 | |
New Jersey Higher Education Student Assistance Authority, Refunding RB: | | | | | | | | |
AMT, Series B, 5.00%, 12/01/27 | | | 1,000 | | | | 1,114,150 | |
AMT, Series B, 5.00%, 12/01/28 | | | 1,000 | | | | 1,110,000 | |
Series 1, AMT, 5.50%, 12/01/26 | | | 835 | | | | 875,372 | |
Student Loan, Series 1A, 4.75%, 12/01/21 | | | 1,160 | | | | 1,184,256 | |
New Jersey State Turnpike Authority, RB, Series E, 5.00%, 01/01/32 | | | 12,000 | | | | 13,227,360 | |
| | |
| 58 | | 2018 BLACKROCK SEMI-ANNUAL REPORTTO SHAREHOLDERS |
| | |
Schedule of Investments (unaudited) (continued) October 31, 2018 | | BlackRock Muni Intermediate Duration Fund, Inc. (MUI) (Percentages shown are based on Net Assets) |
| | | | | | | | |
| Security | | Par (000) | | | Value | |
| New Jersey (continued) | |
New Jersey State Turnpike Authority, Refunding RB,
Series B, 5.00%, 01/01/29 | | $ | 10,000 | | | $ | 10,858,600 | |
New Jersey Transportation Trust Fund Authority, RB: | | | | | | | | |
Federal Highway Reimbursement Revenue Notes,
Series A, 5.00%, 06/15/30 | | | 2,000 | | | | 2,173,940 | |
Series B, 5.25%, 06/15/26 | | | 3,500 | | | | 3,685,990 | |
Transportation Program, Series AA, 5.25%, 06/15/31 | | | 12,000 | | | | 12,766,920 | |
Transportation Program, Series AA, 5.25%, 06/15/32 | | | 2,250 | | | | 2,412,045 | |
Transportation System, Series A, 5.25%, 06/15/24 | | | 3,185 | | | | 3,366,609 | |
Transportation System, Series B, 5.50%, 06/15/31 | | | 13,970 | | | | 14,698,675 | |
Transportation System, Series C, 5.25%, 06/15/32 | | | 10,000 | | | | 10,672,100 | |
New Jersey Transportation Trust Fund Authority, Refunding RB, Series A: | | | | | | | | |
Federal Highway Reimbursement Revenue Notes, 5.00%, 06/15/30 | | | 1,695 | | | | 1,842,414 | |
Transportation System, 5.00%, 12/15/33 | | | 2,285 | | | | 2,426,579 | |
Newark Housing Authority, RB, Series A: | | | | | | | | |
5.00%, 12/01/23 | | | 1,230 | | | | 1,359,839 | |
5.00%, 12/01/25 | | | 1,345 | | | | 1,488,901 | |
South Jersey Port Corp., ARB, Sobordinated Marine Terminal, Series B, AMT: | | | | | | | | |
5.00%, 01/01/29 | | | 250 | | | | 272,010 | |
5.00%, 01/01/30 | | | 200 | | | | 216,804 | |
5.00%, 01/01/31 | | | 350 | | | | 378,007 | |
5.00%, 01/01/32 | | | 425 | | | | 456,977 | |
South Jersey Port Corp., RB, Marine Terminal, Series O-1 (AGC), 4.63%, 01/01/19(a) | | | 1,375 | | | | 1,381,284 | |
State of New Jersey, GO, Various Purposes,
5.00%, 06/01/28 | | | 5,000 | | | | 5,586,700 | |
Tobacco Settlement Financing Corp., Refunding RB, Series A: | | | | | | | | |
5.00%, 06/01/30 | | | 850 | | | | 936,266 | |
5.00%, 06/01/32 | | | 11,980 | | | | 13,074,732 | |
Tobacco Settlement Bonds, 5.00%, 06/01/33 | | | 220 | | | | 239,184 | |
| | | | | | | | |
| | | | | | | 149,278,004 | |
| New Mexico — 1.2% | |
Albuquerque Municipal School District No. 12, GO,
Series 2017, 5.00%, 08/01/30 | | | 1,250 | | | | 1,426,262 | |
County of Albuquerque Bernalillo New Mexico Water Utility Authority, Refunding RB, 4.00%, 07/01/33 | | | 2,510 | | | | 2,591,475 | |
New Mexico Hospital Equipment Loan Council, Refunding RB, 5.00%, 08/01/31 | | | 2,500 | | | | 2,767,825 | |
| | | | | | | | |
| | | | | | | 6,785,562 | |
| New York — 12.3% | |
Build NYC Resource Corp., RB, Inwood Academy for Leadership Charter School Project, Series A,
4.88%, 05/01/31(b) | | | 450 | | | | 448,956 | |
City of New York, GO, Refunding, Series A,
5.00%, 08/01/29 | | | 6,125 | | | | 6,891,850 | |
City of New York, GO, Sub-Series I-1, 5.50%, 04/01/19(a) | | | 5,000 | | | | 5,076,650 | |
City of New York Transitional Finance Authority, BARB, Fiscal 2009, Series S-3, 5.00%, 01/15/23 | | | 3,560 | | | | 3,583,033 | |
Counties of Buffalo & Erie New York Industrial Land Development Corp., Refunding RB, The Charter School for Applied Technologies Project, Series A: | | | | | | | | |
4.00%, 06/01/22 | | | 800 | | | | 822,568 | |
4.50%, 06/01/27 | | | 1,710 | | | | 1,816,208 | |
5.00%, 06/01/35 | | | 415 | | | | 439,805 | |
County of Monroe New York Industrial Development Corp., Refunding RB, Series A, 5.00%, 07/01/23(a) | | | 5,695 | | | | 6,392,637 | |
| | | | | | | | |
| Security | | Par (000) | | | Value | |
| New York (continued) | |
County of Westchester New York Healthcare Corp., Refunding RB, Senior Lien, Remarketing, Series A: | | | | | | | | |
5.00%, 11/01/24 | | $ | 5,470 | | | $ | 5,776,539 | |
5.00%, 11/01/30 | | | 655 | | | | 686,912 | |
Long Island Power Authority, Refunding RB, Electric System, Series A, 5.50%, 04/01/19(a) | | | 1,000 | | | | 1,015,120 | |
Metropolitan Transportation Authority, RB(a): | | | | | | | | |
Sub-Series B-1, 5.00%, 11/15/21 | | | 2,300 | | | | 2,495,891 | |
Sub-Series B-4, 5.00%, 11/15/21 | | | 1,500 | | | | 1,627,755 | |
New York City Trust for Cultural Resources, Refunding RB, Carnegie Hall, Series A, 5.00%, 12/01/29 | | | 2,750 | | | | 2,830,245 | |
New York State Dormitory Authority, RB, Series A: | | | | | | | | |
North Shore-Long Island Jewish Health System, 5.50%, 05/01/19(a) | | | 1,495 | | | | 1,522,478 | |
State University Dormitory Facilities, 5.00%, 07/01/33 | | | 1,440 | | | | 1,632,168 | |
New York State Dormitory Authority, Refunding RB: | | | | | | | | |
4.25%, 09/01/19(a) | | | 480 | | | | 489,038 | |
5.00%, 07/01/30 | | | 1,555 | | | | 1,753,527 | |
Niagara Area Development Corp., Refunding RB, Covanta Project, Series B, 3.50%, 11/01/24(b) | | | 1,000 | | | | 990,920 | |
Port Authority of New York & New Jersey, ARB, JFK International Air Terminal LLC Project, Series 8, 5.00%, 12/01/20 | | | 1,690 | | | | 1,740,987 | |
State of New York Dormitory Authority, RB: | | | | | | | | |
Fordham University, Series A, 5.25%, 07/01/21(a) | | | 900 | | | | 974,025 | |
Icahn School of Medicine at Mount Sinai, Series A,
5.00%, 07/01/32 | | | 9,000 | | | | 9,908,190 | |
Mental Health Services (AGM), 5.00%, 02/15/22 | | | 325 | | | | 325,504 | |
New York University Hospitals Center, Series A, 5.00%, 07/01/20(a) | | | 1,725 | | | | 1,807,489 | |
New York University Hospitals Center, Series A, 5.13%, 07/01/20(a) | | | 1,670 | | | | 1,753,250 | |
State of New York Dormitory Authority, Refunding RB: | | | | | | | | |
North Shore-Long Island Jewish Obligated Group,
Series A, 5.00%, 05/01/32 | | | 3,060 | | | | 3,350,731 | |
Orange Regional Medical Center, 5.00%, 12/01/27(b) | | | 900 | | | | 997,884 | |
Orange Regional Medical Center,
5.00%, 12/01/28(b) | | | 1,800 | | | | 1,984,554 | |
| | | | | | | | |
| | | | | | | 69,134,914 | |
| North Carolina — 0.3% | |
North Carolina Medical Care Commission, Refunding RB, WakeMed, Series A, 5.00%, 10/01/31 | | | 1,500 | | | | 1,620,915 | |
| | | | | | | | |
| Ohio — 1.2% | |
State of Ohio Turnpike Commission, RB, Junior Lien, Infrastructure Projects, Series A-1, 5.25%, 02/15/31 | | | 6,000 | | | | 6,597,240 | |
| | | | | | | | |
| Oklahoma — 1.6% | |
Norman Regional Hospital Authority, Refunding RB, 5.00%, 09/01/28 | | | 1,575 | | | | 1,746,895 | |
Oklahoma City Public Property Authority, Refunding RB: | | | | | | | | |
5.00%, 10/01/27 | | | 1,190 | | | | 1,344,712 | |
5.00%, 10/01/28 | | | 1,265 | | | | 1,426,933 | |
5.00%, 10/01/29 | | | 1,400 | | | | 1,573,628 | |
Oklahoma Development Finance Authority, RB, OU Medicene Project, Series B: | | | | | | | | |
5.00%, 08/15/29 | | | 1,200 | | | | 1,328,076 | |
5.00%, 08/15/33 | | | 1,305 | | | | 1,408,643 | |
| | | | | | | | |
| | | | | | | 8,828,887 | |
| Oregon — 1.5% | |
County of Klamath Oregon School District, GO: | | | | | | | | |
5.00%, 06/15/30 | | | 1,000 | | | | 1,101,510 | |
5.00%, 06/15/31 | | | 1,000 | | | | 1,100,140 | |
| | | | |
| SCHEDULES OF INVESTMENTS | | | 59 | |
| | |
Schedule of Investments (unaudited) (continued) October 31, 2018 | | BlackRock Muni Intermediate Duration Fund, Inc. (MUI) (Percentages shown are based on Net Assets) |
| | | | | | | | |
| Security | | Par (000) | | | Value | |
| Oregon (continued) | |
County of Umatilla Oregon School District No. 16R Pendleton, GO, Series A, 5.00%, 06/15/32 | | $ | 2,000 | | | $ | 2,218,480 | |
Oregon State Facilities Authority, Refunding RB, Reed College Project, Series A, 5.00%, 07/01/20(a) | | | 1,835 | | | | 1,921,832 | |
State of Oregon, GO, Series H, 5.00%, 05/01/36 | | | 2,000 | | | | 2,155,300 | |
| | | | | | | | |
| | | | | | | 8,497,262 | |
| Pennsylvania — 7.3% | |
Allentown Neighborhood Improvement Zone Development Authority, RB, City Center Project(b): | | | | | | | | |
5.00%, 05/01/22 | | | 2,000 | | | | 2,094,580 | |
5.00%, 05/01/23 | | | 640 | | | | 674,720 | |
5.00%, 05/01/28 | | | 835 | | | | 897,709 | |
Commonwealth Financing Authority, RB, Tobacco Master Settlement Payment: | | | | | | | | |
5.00%, 06/01/33 | | | 2,000 | | | | 2,196,220 | |
5.00%, 06/01/34 | | | 3,750 | | | | 4,105,275 | |
County of Allegheny Pennsylvania, GO, Refunding, Series C-68, 5.00%, 11/01/25 | | | 2,515 | | | | 2,693,967 | |
County of Allegheny Pennsylvania, GO, Series C-67: | | | | | | | | |
5.00%, 11/01/25 | | | 2,700 | | | | 2,892,132 | |
5.00%, 11/01/26 | | | 2,375 | | | | 2,541,868 | |
Pennsylvania Economic Development Financing Authority, RB, PA Bridges Finco LP, AMT, 5.00%, 12/31/28 | | | 115 | | | | 125,289 | |
Pennsylvania Turnpike Commission, RB, Sub-Series B, 5.25%, 12/01/21(a) | | | 4,000 | | | | 4,363,880 | |
Pennsylvania Turnpike Commission, Refunding RB: | | | | | | | | |
Second Series, 5.00%, 12/01/30 | | | 2,620 | | | | 2,870,000 | |
Sub-Series B, 5.00%, 06/01/32 | | | 5,000 | | | | 5,431,850 | |
School District of Philadelphia, GOL, Series A: | | | | | | | | |
5.00%, 09/01/30 | | | 1,200 | | | | 1,327,524 | |
5.00%, 09/01/31 | | | 1,000 | | | | 1,101,940 | |
5.00%, 09/01/32 | | | 1,200 | | | | 1,318,176 | |
South Fork Municipal Authority, Refunding RB, Conemaugh Valley Memorial Hospital, Series A (AGC), 6.00%, 07/01/20(a) | | | 6,225 | | | | 6,599,683 | |
| | | | | | | | |
| | | | | | | 41,234,813 | |
| Rhode Island — 1.3% | |
Providence Redevelopment Agency, Refunding RB, Series A, 5.00%, 04/01/29 | | | 1,000 | | | | 1,063,610 | |
Rhode Island Health & Educational Building Corp., RB, City of Newport Issue Financing Program, Series C, 5.00%, 05/15/30 | | | 2,305 | | | | 2,490,714 | |
Rhode Island Health & Educational Building Corp., Refunding RB, 5.00%, 09/01/32 | | | 2,000 | | | | 2,197,440 | |
Rhode Island Student Loan Authority, Refunding RB, Senior Series A, AMT: | | | | | | | | |
5.00%, 12/01/24 | | | 750 | | | | 816,690 | |
5.00%, 12/01/25 | | | 850 | | | | 930,996 | |
| | | | | | | | |
| | | | | | | 7,499,450 | |
| South Carolina — 2.5% | |
South Carolina Jobs-Economic Development Authority, Refunding RB, The Woodlands at Furman, 4.00%, 11/15/27 | | | 905 | | | | 890,158 | |
South Carolina Public Service Authority, Refunding RB, Series A: | | | | | | | | |
5.00%, 12/01/30 | | | 5,500 | | | | 5,961,175 | |
5.00%, 12/01/31 | | | 5,660 | | | | 6,099,669 | |
5.00%, 12/01/32 | | | 200 | | | | 214,584 | |
5.00%, 12/01/33 | | | 800 | | | | 855,080 | |
| | | | | | | | |
| | | | | | | 14,020,666 | |
| | | | | | | | |
| Security | | Par (000) | | | Value | |
| South Dakota — 0.2% | |
South Dakota Health & Educational Facilities Authority, Refunding RB, Regional Health, 5.00%, 09/01/20(a) | | $ | 1,000 | | | $ | 1,050,680 | |
| | | | | | | | |
| Tennessee — 2.0% | |
County of Memphis-Shelby Industrial Development Board, Refunding, Tax Allocation Bonds, Graceland Project, Series A, 4.75%, 07/01/27 | | | 220 | | | | 227,568 | |
County of Memphis-Shelby Tennessee Sports Authority, Inc., Refunding RB, Memphis Arena Project: | | | | | | | | |
Series A, 5.00%, 11/01/23 | | | 2,695 | | | | 2,769,840 | |
Series B, 5.00%, 11/01/22 | | | 1,000 | | | | 1,027,670 | |
Knox County Health Educational & Housing Facility Board Tennessee, Refunding RB, Eastowne Village Project, 4.00%, 06/01/31(g) | | | 2,965 | | | | 3,020,861 | |
Metropolitan Government Nashville & Davidson County Health & Educational Facilities Board, RB, Vanderbilt University Medical Center, Series A, 5.00%, 07/01/35 | | | 4,000 | | | | 4,341,280 | |
| | | | | | | | |
| | | | | | | 11,387,219 | |
| Texas — 12.0% | |
City of Austin Texas Water & Wastewater System Revenue, Refunding RB, 5.00%, 11/15/30 | | | 6,000 | | | | 6,800,820 | |
City of Grapevine Texas, GO, 5.00%, 02/15/33 | | | 5,685 | | | | 6,198,583 | |
City of Houston Texas, Refunding ARB, Subordinate Lien, Series A, AMT: | | | | | | | | |
5.00%, 07/01/25 | | | 1,500 | | | | 1,592,415 | |
5.00%, 07/01/32 | | | 1,010 | | | | 1,076,296 | |
City of Houston TX Airport System Revenue, Refunding ARB, Sub-Series A, AMT: | | | | | | | | |
5.00%, 07/01/31 | | | 1,430 | | | | 1,583,496 | |
5.00%, 07/01/32 | | | 1,115 | | | | 1,229,912 | |
County of Tarrant Texas Cultural Education Facilities Finance Corp., RB, Christus Health, Series B, 5.00%, 07/01/33 | | | 8,485 | | | | 9,328,918 | |
Dallas-Fort Worth International Airport, ARB, Joint Improvement, Series D, AMT, 5.00%, 11/01/38 | | | 8,290 | | | | 8,648,128 | |
Dallas/Fort Worth Texas International Airport, Refunding RB, AMT: | | | | | | | | |
Series E, 5.00%, 11/01/26 | | | 2,185 | | | | 2,279,480 | |
Series E, 5.00%, 11/01/27 | | | 4,960 | | | | 5,171,495 | |
Series F, 5.00%, 11/01/31 | | | 6,345 | | | | 6,587,950 | |
Love Field Airport Modernization Corp., RB, Southwest Airlines Co. Project, AMT, 5.00%, 11/01/28 | | | 1,000 | | | | 1,064,330 | |
Mission Economic Development Corp., Refunding RB, Senior Lien, Natural Gasoline Project, AMT,
4.63%, 10/01/31(b)(f) | | | 1,475 | | | | 1,469,970 | |
New Hope Cultural Education Facilities Finance Corp., RB, Jubilee Academic Center Project, Series A(b): | | | | | | | | |
3.63%, 08/15/22 | | | 105 | | | | 103,806 | |
4.25%, 08/15/27 | | | 160 | | | | 156,546 | |
Red River Education Financing Corp., RB, 5.00%, 03/15/33 | | | 1,340 | | | | 1,451,796 | |
San Jacinto River Authority, RB, Special Project (AGM), 5.25%, 10/01/25 | | | 2,910 | | | | 2,993,284 | |
Socorro Independent School District, GO, Refunding(PSF-GTD): | | | | | | | | |
5.00%, 08/15/20(a) | | | 2,410 | | | | 2,531,826 | |
5.00%, 08/15/32 | | | 90 | | | | 94,290 | |
Via Metropolitan Transit Authority, Refunding RB: | | | | | | | | |
5.25%, 08/01/28 | | | 1,585 | | | | 1,752,709 | |
5.25%, 08/01/29 | | | 1,720 | | | | 1,899,585 | |
5.25%, 08/01/33 | | | 3,000 | | | | 3,311,820 | |
| | | | | | | | |
| | | | | | | 67,327,455 | |
| | |
| 60 | | 2018 BLACKROCK SEMI-ANNUAL REPORTTO SHAREHOLDERS |
| | |
Schedule of Investments (unaudited) (continued) October 31, 2018 | | BlackRock Muni Intermediate Duration Fund, Inc. (MUI) (Percentages shown are based on Net Assets) |
| | | | | | | | |
| Security | | Par (000) | | | Value | |
| U.S. Virgin Islands — 0.9% | |
Virgin Islands Public Finance Authority, Refunding RB, Series A (AGM), 5.25%, 10/01/24 | | $ | 5,000 | | | $ | 5,265,150 | |
| | | | | | | | |
| Utah — 1.0% | |
Salt Lake City Corp. Airport Revenue, ARB, AMT, Series A, 5.00%, 07/01/33 | | | 3,500 | | | | 3,878,700 | |
Utah Charter School Finance Authority, Refunding RB, Freedom Academy Foundation Project,
4.50%, 06/15/27(b) | | | 1,500 | | | | 1,460,205 | |
| | | | | | | | |
| | | | | | | 5,338,905 | |
| Vermont — 1.0% | |
University of Vermont & State Agricultural College, Refunding RB, 4.00%, 10/01/30 | | | 5,565 | | | | 5,739,351 | |
| | | | | | | | |
| Washington — 0.3% | |
Washington State Housing Finance Commission, Refunding RB, Horizone House Project, 5.00%, 01/01/27(b) | | | 1,355 | | | | 1,473,102 | |
| | | | | | | | |
| West Virginia — 1.0% | |
West Virginia Hospital Finance Authority, Refunding RB, Charleston Area Medical Center, Inc., Series A, 5.13%, 09/01/23 | | | 4,000 | | | | 4,076,320 | |
West Virginia University, RB, West Virginia University Project, Series B, 5.00%, 10/01/30 | | | 1,500 | | | | 1,598,625 | |
| | | | | | | | |
| | | | | | | 5,674,945 | |
| Wisconsin — 1.4% | |
Public Finance Authority, Refunding RB, AMT: | | | | | | | | |
National Gypsum Co., 5.25%, 04/01/30 | | | 2,410 | | | | 2,520,836 | |
Wisconsin Airport Facilities, Senior Obligated Group, Series B, 5.25%, 07/01/28 | | | 4,765 | | | | 5,060,954 | |
| | | | | | | | |
| | | | | | | 7,581,790 | |
Total Municipal Bonds — 138.4%
(Cost — $761,890,099) | | | | 777,331,085 | |
| | | | | |
|
Municipal Bonds Transferred to Tender Option Bond Trusts(h) | |
|
California — 4.0% | |
Bay Area Toll Authority, Refunding RB, San Francisco Bay Area Subordinate, 4.00%, 04/01/31(i) | | | 8,080 | | | | 8,504,543 | |
State of California, GO, Refunding Water Utility Authority, 5.00%, 10/01/35 | | | 12,500 | | | | 14,000,482 | |
| | | | | | | | |
| | | | | | | 22,505,025 | |
| Iowa — 1.3% | |
Iowa Finance Authority, Refunding RB, UnityPoint Health, Series C, 4.13%, 02/15/35 | | | 7,500 | | | | 7,519,050 | |
| | | | | | | | |
| Massachusetts — 3.5% | |
Massachusetts Development Finance Agency, Refunding RB, Partners Healthcare System: | | | | | | | | |
5.00%, 07/01/32 | | | 7,500 | | | | 8,494,525 | |
Series L, 5.00%, 07/01/31 | | | 10,175 | | | | 10,844,963 | |
| | | | | | | | |
| | | | | | | 19,339,488 | |
| Minnesota — 1.9% | |
State of Minnesota, GO, State Various Purposes, Series A, 4.00%, 08/01/20(a) | | | 10,525 | | | | 10,866,012 | |
| | | | | | | | |
| New Jersey — 1.6% | |
New Jersey Housing & Mortgage Finance Agency, Refunding RB, S/F, AMT, Series BB: | | | | | | | | |
3.65%, 04/01/28 | | | 5,000 | | | | 4,902,348 | |
3.70%, 10/01/28 | | | 3,875 | | | | 3,799,016 | |
| | | | | | | | |
| | | | | | | 8,701,364 | |
| | | | | | | | |
| Security | | Par (000) | | | Value | |
| New York — 10.9% | |
City of New York, GO: | | | | | | | | |
Sub-Series 1-I, 5.00%, 03/01/32 | | $ | 7,009 | | | $ | 7,711,422 | |
Refunding Series E, 5.00%, 08/01/19(a) | | | 1,017 | | | | 1,040,280 | |
Refunding Series E, 5.00%, 08/01/27 | | | 2,489 | | | | 2,545,162 | |
Metropolitan Transportation Authority, RB, Sub-Series D-1, 5.00%, 11/15/39 | | | 4,980 | | | | 5,366,365 | |
Metropolitan Transportation Authority, Refunding RB, Series B, 5.25%, 11/15/19(a) | | | 4,001 | | | | 4,138,453 | |
New York City Transitional Finance Authority Future Tax Secured Revenue, RB, Future Tax Secured Subordinate Bonds, SubSeries B-1, 5.00%, 08/01/36 | | | 9,444 | | | | 10,458,076 | |
Port Authority of New York & New Jersey, Refunding ARB: | | | | | | | | |
178th Series, AMT, 5.00%, 12/01/32 | | | 4,009 | | | | 4,367,283 | |
Consolidated, Series 169th, 5.00%, 10/15/26 | | | 5,530 | | | | 5,895,533 | |
Sales Tax Asset Receivable Corp., Refunding RB, Fiscal 2015, Series A, 5.00%, 10/15/31 | | | 5,010 | | | | 5,598,775 | |
State of New York Dormitory Authority, Refunding RB, Series E, 5.25%, 03/15/33 | | | 7,000 | | | | 7,919,870 | |
State of New York Urban Development Corp., RB, Personal Income Tax, Series A-1, 5.00%, 03/15/32 | | | 5,501 | | | | 6,001,896 | |
| | | | | | | | |
| | | | | | | 61,043,115 | |
| Texas — 1.5% | |
Pflugerville Independent School District, GO, (PSF-GTD), 5.00%, 02/15/24(a) | | | 7,500 | | | | 8,470,150 | |
| | | | | | | | |
| Washington — 2.9% | |
Port of Seattle Washington, ARB, AMT, Series A, 5.00%, 05/01/34 | | | 15,000 | | | | 16,479,500 | |
| | | | | | | | |
Total Municipal Bonds Transferred to Tender Option Bond Trusts — 27.6%
(Cost — $154,519,083) | | | | 154,923,704 | |
| | | | | |
Total Long-Term Investments — 166.0%
(Cost — $916,409,182) | | | | 932,254,789 | |
| | | | | |
| | |
| | | Shares | | | | |
| Short-Term Securities — 0.3% | |
BlackRock Liquidity Funds, MuniCash, Institutional Class, 1.45%(j)(k) | | | 1,637,362 | | | | 1,637,526 | |
| | | | | | | | |
Total Short-Term Securities — 0.3%
(Cost — $1,637,526) | | | | 1,637,526 | |
| | | | | |
| |
Total Investments — 166.3%
(Cost — $918,046,708) | | | | 933,892,315 | |
Other Assets Less Liabilities — 1.5% | | | | 8,353,827 | |
Liability for TOB Trust Certificates, Including Interest Expense and Fees Payable — (16.7)% | | | | (93,696,888 | ) |
VMTP Shares at Liquidation Value — (51.1)% | | | | (287,100,000 | ) |
| | | | | |
Net Assets Applicable to Common Shares — 100.0% | | | $ | 561,449,254 | |
| | | | | |
| (a) | U.S. Government securities, held in escrow, are used to pay interest on this security, as well as to retire the bond in full at the date indicated, typically at a premium to par. |
| (b) | Security exempt from registration pursuant to Rule 144A under the Securities Act of 1933, as amended. These securities may be resold in transactions exempt from registration to qualified institutional investors. |
| (c) | Issuer filed for bankruptcy and/or is in default. |
| (d) | Non-income producing security. |
| (e) | Security is collateralized by municipal bonds or U.S. Treasury obligations. |
| (f) | When-issued security. |
| (g) | Variable or floating rate security, which interest rate adjusts periodically based on changes in current interest rates and prepayments on the underlying pool of assets. Rate shown is the rate in effect as of period end. |
| | | | |
| SCHEDULES OF INVESTMENTS | | | 61 | |
| | |
Schedule of Investments (unaudited) (continued) October 31, 2018 | | BlackRock Muni Intermediate Duration Fund, Inc. (MUI) |
| (h) | Represent bonds transferred to a TOB Trust in exchange of cash and residual certificates received by the Fund. These bonds serve as collateral in a secured borrowing. See Note 4 of the Notes to Financial Statements for details. |
| (i) | All or a portion of security is subject to a recourse agreement. The aggregate maximum potential amount the Fund could ultimately be required to pay under the agreement, which expires on April 1, 2025 is $6,226,089. See Note 4 of the Notes to Financial Statements for details. |
| (j) | Annualized 7-day yield as of period end. |
| (k) | During the six months ended October 31, 2018, investments in issuers considered to be an affiliate of the Fund for purposes of Section 2(a)(3) of the Investment Company Act of 1940, as amended, were as follows: |
| | | | | | | | | | | | | | | | | | | | | | | | | | | | |
| Affiliate | | Shares
Held at
04/30/18 | | | Net
Activity | | | Shares
Held at
10/31/18 | | | Value at
10/31/18 | | | Income | | | Net
Realized
Gain (Loss) (a) | | | Change in
Unrealized
Appreciation
(Depreciation) | |
BlackRock Liquidity Funds, MuniCash, Institutional Class | | | — | | | | 1,637,362 | | | | 1,637,362 | | | $ | 1,637,526 | | | $ | 23,415 | | | $ | 35 | | | $ | — | |
| | | | | | | | | | | | | | | | | | | | | | | | | | | | |
| | (a) | Includes net capital gain distributions, if applicable. | |
Derivative Financial Instruments Outstanding as of Period End
Futures Contracts
| | | | | | | | | | | | | | | | |
| Description | | Number of
Contracts | | | Expiration Date | | | Notional
Amount
(000) | | | Value
Unrealized
Appreciation
(Depreciation) | |
Short Contracts: | | | | | | | | | | | | | | | | |
10-Year U.S. Treasury Note | | | 95 | | | | 12/19/18 | | | $ | 11,252 | | | $ | 70,285 | |
Long U.S. Treasury Bond | | | 45 | | | | 12/19/18 | | | | 6,216 | | | | 115,436 | |
5-Year U.S. Treasury Note | | | 76 | | | | 12/31/18 | | | | 8,541 | | | | 39,697 | |
| | | | | | | | | | | | | | | | |
| | | | | | | | | | | | | | $ | 225,418 | |
| | | | | | | | | | | | | | | | |
Derivative Financial Instruments Categorized by Risk Exposure
As of period-end, the fair values of derivative financial instruments located in the Statements of Assets and Liabilities were as follows:
| | | | | | | | | | | | | | | | | | | | | | | | | | | | |
| | | Commodity
Contracts | | | Credit
Contracts | | | Equity
Contracts | | | Foreign
Currency
Exchange
Contracts | | | Interest
Rate
Contracts | | | Other
Contracts | | | Total | |
Assets — Derivative Financial Instruments | | | | | | | | | | | | | | | | | | | | | | | | | | | | |
Futures contracts | | | | | | | | | | | | | | | | | | | | | | | | | | | | |
Net unrealized appreciation(a) | | $ | — | | | $ | — | | | $ | — | | | $ | — | | | $ | 225,418 | | | $ | — | | | $ | 225,418 | |
| | | | | | | | | | | | �� | | | | | | | | | | | | | | | | |
| | (a) | Includes cumulative appreciation (depreciation) on futures contracts if any, as reported in the Schedule of Investments. Only current day’s variation margin is reported within the Statements of Assets and Liabilities. | |
For the six months ended October 31, 2018, the effect of derivative financial instruments in the Statements of Operations were as follows:
| | | | | | | | | | | | | | | | | | | | | | | | | | | | |
| | | Commodity
Contracts | | | Credit
Contracts | | | Equity
Contracts | | | Foreign
Currency
Exchange
Contracts | | | Interest
Rate
Contracts | | | Other
Contracts | | | Total | |
Net Realized Gain (Loss) from: | | | | | | | | | | | | | | | | | | | | | | | | | | | | |
Futures contracts | | $ | — | | | $ | — | | | $ | — | | | $ | — | | | $ | 506,457 | | | $ | — | | | $ | 506,457 | |
| | | | | | | | | | | | | | | | | | | | | | | | | | | | |
Net Change in Unrealized Appreciation (Depreciation) on: | | | | | | | | | | | | | | | | | | | | | | | | | | | | |
Futures contracts | | $ | — | | | $ | — | | | $ | — | | | $ | — | | | $ | 36,938 | | | $ | — | | | $ | 36,938 | |
| | | | | | | | | | | | | | | | | | | | | | | | | | | | |
Average Quarterly Balances of Outstanding Derivative Financial Instruments
| | | | |
Futures contracts: | | | | |
Average notional value of contracts — short | | $ | 35,722,711 | |
For more information about the Fund’s investment risks regarding derivative financial instruments, refer to the Notes to Financial Statements.
| | |
| 62 | | 2018 BLACKROCK SEMI-ANNUAL REPORTTO SHAREHOLDERS |
| | |
Schedule of Investments (unaudited) (continued) October 31, 2018 | | BlackRock Muni Intermediate Duration Fund, Inc. (MUI) |
Fair Value Hierarchy as of Period End
Various inputs are used in determining the fair value of investments and derivative financial instruments. For information about the Fund’s policy regarding valuation of investments and derivative financial instruments, refer to the Notes to Financial Statements.
The following tables summarize the Fund’s investments and derivative financial instruments categorized in the disclosure hierarchy:
| | | | | | | | | | | | | | | | |
| | | Level 1 | | | Level 2 | | | Level 3 | | | Total | |
Assets: | | | | | | | | | | | | | | | | |
Investments: | | | | | | | | | | | | | | | | |
Long-Term Investments(a) | | $ | — | | | $ | 932,254,789 | | | $ | — | | | $ | 932,254,789 | |
Short-Term Securities | | | 1,637,526 | | | | — | | | | — | | | | 1,637,526 | |
| | | | | | | | | | | | | | | | |
| | $ | 1,637,526 | | | $ | 932,254,789 | | | $ | — | | | $ | 933,892,315 | |
| | | | | | | | | | | | | | | | |
Derivative Financial Instruments(b) | | | | | | | | | | | | | | | | |
Assets: | | | | | | | | | | | | | | | | |
Interest rate contracts | | $ | 225,418 | | | $ | — | | | $ | — | | | $ | 225,418 | |
| | | | | | | | | | | | | | | | |
| | (a) | See above Schedule of Investments for values in each state or political subdivision. | |
| | (b) | Derivative financial instruments are futures contracts, which are valued at the unrealized appreciation (depreciation) on the instrument. | |
The Fund may hold assets and/or liabilities in which the fair value approximates the carrying amount for financial statement purposes. As of period end, such assets and/or liabilities are categorized within the disclosure hierarchy as follows:
| | | | | | | | | | | | | | | | |
| | | Level 1 | | | Level 2 | | | Level 3 | | | Total | |
Liabilities: | | | | | | | | | | | | | | | | |
TOB Trust Certificates | | $ | — | | | $ | (93,380,641 | ) | | $ | — | | | $ | (93,380,641 | ) |
VMTP Shares at Liquidation Value | | | — | | | | (287,100,000 | ) | | | — | | | | (287,100,000 | ) |
| | | | | | | | | | | | | | | | |
| | $ | — | | | $ | (380,480,641 | ) | | $ | — | | | $ | (380,480,641 | ) |
| | | | | | | | | | | | | | | | |
During the six months ended October 31, 2018, there were no transfers between levels.
See notes to financial statements.
| | | | |
| SCHEDULES OF INVESTMENTS | | | 63 | |
| | |
Schedule of Investments (unaudited) October 31, 2018 | | BlackRock MuniVest Fund II, Inc. (MVT) (Percentages shown are based on Net Assets) |
| | | | | | | | |
| Security | | Par
(000) | | | Value | |
| Municipal Bonds — 130.4% | |
|
Alabama — 1.6% | |
County of Jefferson Alabama Sewer Revenue, Refunding RB: | | | | | | | | |
Senior Lien, Series A (AGM), 5.00%, 10/01/44 | | $ | 805 | | | $ | 860,537 | |
Sub-Lien, Series D, 6.00%, 10/01/42 | | | 3,575 | | | | 4,036,389 | |
| | | | | | | | |
| | | | 4,896,926 | |
| Alaska — 0.1% | |
Northern Tobacco Securitization Corp., Refunding RB, Tobacco Settlement, Asset-Backed, Series A,
4.63%, 06/01/23 | | | 220 | | | | 220,042 | |
| | | | | | | | |
| Arizona(a) — 0.5% | |
City of Phoenix Arizona IDA, RB, Legacy Traditional Schools Projects, Series A, 5.00%, 07/01/46 | | | 1,685 | | | | 1,688,067 | |
| | | | | | | | |
| Arkansas — 0.9% | |
University of Arkansas, RB, Various Facilities, Fayetteville Campus, Series A, 5.00%, 11/01/48 | | | 2,500 | | | | 2,791,675 | |
| | | | | | | | |
| California — 14.3% | |
California Health Facilities Financing Authority, RB: | | | | | | | | |
St. Joseph Health System, Series A, 5.75%, 07/01/39 | | | 2,200 | | | | 2,255,396 | |
Sutter Health, Series B, 6.00%, 08/15/20(b) | | | 3,170 | | | | 3,399,413 | |
California Health Facilities Financing Authority, Refunding RB, St. Joseph Health System, Series A, 5.00%, 07/01/33 | | | 890 | | | | 971,355 | |
California Municipal Finance Authority, ARB, Senior Lien-Linxs APM Project, AMT, 4.00%, 12/31/47 | | | 1,475 | | | | 1,399,436 | |
California Municipal Finance Authority, RB, Senior, Caritas Affordable Housing, Inc. Projects, S/F Housing, Series A: | | | | | | | | |
5.25%, 08/15/39 | | | 145 | | | | 156,055 | |
5.25%, 08/15/49 | | | 370 | | | | 396,222 | |
California Municipal Finance Authority, Refunding RB, Community Medical Centers, Series A, 5.00%, 02/01/42 | | | 225 | | | | 241,969 | |
California Pollution Control Financing Authority, RB, Poseidon Resources (Channel Side) LP Desalination Project, AMT, 5.00%, 11/21/45(a) | | | 4,425 | | | | 4,555,936 | |
California Statewide Communities Development Authority, RB, Loma Linda University Medical Center, Series A(a): | | | | | | | | |
5.00%, 12/01/41 | | | 290 | | | | 295,855 | |
5.00%, 12/01/46 | | | 455 | | | | 462,730 | |
City of Los Angeles California Department of Airports, Refunding ARB, Los Angeles International Airport, Series A: | | | | | | | | |
Senior, 5.00%, 05/15/40 | | | 5,930 | | | | 6,145,615 | |
5.25%, 05/15/39 | | | 800 | | | | 812,712 | |
City of Stockton California Public Financing Authority, RB, Delta Water Supply Project, Series A, 6.25%, 10/01/40 | | | 360 | | | | 416,279 | |
Golden State Tobacco Securitization Corp., Refunding RB, Series A-1, 5.25%, 06/01/47 | | | 995 | | | | 1,000,433 | |
San Marcos Unified School District, GO, CAB, Election of 2010, Series B, 0.00%, 08/01/42(c) | | | 2,000 | | | | 731,600 | |
State of California, GO, Various Purposes: | | | | | | | | |
6.50%, 04/01/19(b) | | | 8,085 | | | | 8,247,589 | |
6.00%, 03/01/33 | | | 2,525 | | | | 2,660,643 | |
6.50%, 04/01/33 | | | 6,840 | | | | 6,966,061 | |
State of California Public Works Board, LRB, Various Capital Projects: | | | | | | | | |
Series I, 5.00%, 11/01/38 | | | 775 | | | | 844,928 | |
Sub-Series I-1, 6.38%, 11/01/19(b) | | | 1,185 | | | | 1,239,427 | |
Tobacco Securitization Authority of Southern California, Refunding RB, Tobacco Settlement, Asset-Backed, Senior Series A-1, 4.75%, 06/01/25 | | | 425 | | | | 426,054 | |
| | | | | | | | |
| | | | 43,625,708 | |
| | | | | | | | |
| Security | | Par
(000) | | | Value | |
| Colorado — 0.3% | |
Colorado Health Facilities Authority, RB, Catholic Health Initiatives, Series D, 6.25%, 10/01/33 | | $ | 1,060 | | | $ | 1,063,805 | |
| | | | | | | | |
| Connecticut — 1.6% | |
Connecticut State Health & Educational Facility Authority, RB, Ascension Health Senior Credit, Series A,
5.00%, 11/15/40 | | | 1,375 | | | | 1,407,505 | |
Connecticut State Health & Educational Facility Authority, Refunding RB, Wesleyan University, Series G,
5.00%, 07/01/20(b) | | | 3,385 | | | | 3,545,178 | |
| | | | | | | | |
| | | | 4,952,683 | |
| Delaware — 2.2% | |
County of Sussex Delaware, RB, NRG Energy, Inc., Indian River Power LLC Project, 6.00%, 10/01/40 | | | 1,125 | | | | 1,189,778 | |
Delaware Transportation Authority, RB, U.S. 301 Project, 5.00%, 06/01/55 | | | 1,165 | | | | 1,251,303 | |
State of Delaware EDA, RB, Exempt Facilities, Indian River Power LLC Project, 5.38%, 10/01/45 | | | 4,065 | | | | 4,217,031 | |
| | | | | | | | |
| | | | 6,658,112 | |
| District of Columbia — 3.9% | |
District of Columbia, Refunding RB: | | | | | | | | |
Georgetown University, 5.00%, 04/01/35 | | | 435 | | | | 480,853 | |
Georgetown University Issue, 5.00%, 04/01/42 | | | 500 | | | | 544,350 | |
Kipp Charter School, Series A, 6.00%, 07/01/23(b) | | | 240 | | | | 278,129 | |
Metropolitan Washington Airports Authority, Refunding ARB, Dulles Toll Road, CAB, 2nd Senior Lien, Series B (AGC), 0.00%, 10/01/35(c) | | | 6,515 | | | | 3,120,424 | |
Metropolitan Washington Airports Authority, Refunding RB, Dulles Toll Road: | | | | | | | | |
1st Senior Lien, Series A, 5.25%, 10/01/44 | | | 1,500 | | | | 1,535,220 | |
CAB, 2nd Senior Lien, Series B (AGC),
0.00%, 10/01/33(c) | | | 6,590 | | | | 3,488,944 | |
CAB, 2nd Senior Lien, Series B (AGC),
0.00%, 10/01/34(c) | | | 4,830 | | | | 2,435,141 | |
| | | | | | | | |
| | | | 11,883,061 | |
| Florida — 5.3% | |
Celebration Pointe Community Development District, Special Assessment Bonds, County of Alachua Florida(a): | | | | | | | | |
5.00%, 05/01/32 | | | 470 | | | | 485,623 | |
5.00%, 05/01/48 | | | 1,175 | | | | 1,175,799 | |
County of Collier Florida Health Facilities Authority, Refunding RB, Series A, 5.00%, 05/01/45 | | | 1,340 | | | | 1,403,503 | |
County of Collier Health Facilities Authority, RB, Moorings, Inc., Series A, 5.00%, 05/01/48 | | | 1,190 | | | | 1,264,887 | |
County of Miami-Dade Florida Aviation, Refunding ARB, Miami International Airport, Series A-1, 5.38%, 10/01/20(b) | | | 1,165 | | | | 1,234,830 | |
County of Palm Beach Health Facilities Authority, RB, Acts Retirement-Life Communities, Inc., 5.00%, 11/15/45 | | | 4,500 | | | | 4,765,815 | |
Mid-Bay Florida Bridge Authority, RB, Springing Lien, Series A, 7.25%, 10/01/21(b) | | | 3,015 | | | | 3,421,331 | |
Village Community Development District No.10, Special Assessment Bonds, 5.13%, 05/01/43 | | | 2,210 | | | | 2,382,336 | |
| | | | | | | | |
| | | | 16,134,124 | |
| Georgia — 1.9% | |
City of Atlanta Georgia Water & Wastewater Revenue, Refunding RB, 5.00%, 11/01/40 | | | 600 | | | | 658,110 | |
County of Dalton Whitfield Joint Development Authority, RB, Hamilton Health Care System Obligation,
4.00%, 08/15/48 | | | 1,825 | | | | 1,784,467 | |
County of Gainesville Georgia & Hall Hospital Authority, Refunding RB, Northeast Georgia Health System, Inc. Project, Series A (GTD), 5.50%, 08/15/54 | | | 515 | | | | 574,791 | |
| | |
| 64 | | 2018 BLACKROCK SEMI-ANNUAL REPORTTO SHAREHOLDERS |
| | |
Schedule of Investments (unaudited) (continued) October 31, 2018 | | BlackRock MuniVest Fund II, Inc. (MVT) (Percentages shown are based on Net Assets) |
| | | | | | | | |
| Security | | Par
(000) | | | Value | |
| Georgia (continued) | |
DeKalb Georgia Private Hospital Authority, Refunding RB, Children’s Healthcare, 5.25%, 11/15/39 | | $ | 130 | | | $ | 133,687 | |
Glynn-Brunswick Memorial Hospital Authority, RB, Southeast Georgia Health System Project, 5.00%, 08/01/47 | | | 2,500 | | | | 2,645,000 | |
| | | | | | | | |
| | | | 5,796,055 | |
| Hawaii — 0.5% | |
State of Hawaii Harbor System, RB, Series A,
5.25%, 07/01/30 | | | 1,355 | | | | 1,417,344 | |
| | | | | | | | |
| Idaho — 0.3% | |
Idaho Health Facilities Authority, RB, Trinity Health Credit Group, Series A, 5.00%, 12/01/46 | | | 745 | | | | 799,199 | |
| | | | | | | | |
| Illinois — 19.4% | |
Chicago Board of Education, GO: | | | | | | | | |
Dedicated Revenues, Series H, 5.00%, 12/01/36 | | | 450 | | | | 453,578 | |
Project, Series C, 5.25%, 12/01/35 | | | 1,465 | | | | 1,491,619 | |
Refunding Dedicated Revenues, Series C,
5.00%, 12/01/25 | | | 815 | | | | 843,941 | |
Refunding Dedicated Revenues, Series F,
5.00%, 12/01/24 | | | 615 | | | | 638,462 | |
Refunding Dedicated Revenues, Series G,
5.00%, 12/01/34 | | | 450 | | | | 455,220 | |
City of Chicago Illinois, GO, Project, Series A,
5.00%, 01/01/34 | | | 1,750 | | | | 1,782,673 | |
City of Chicago Illinois, GO, Refunding, Project, Series A, 5.25%, 01/01/32 | | | 4,555 | | | | 4,751,047 | |
City of Chicago Illinois, Special Assessment Bonds, Lake Shore East Project, 6.75%, 12/01/32 | | | 782 | | | | 786,113 | |
City of Chicago Illinois O’Hare International Airport, GARB, 3rd Lien, Series C, 6.50%, 01/01/21(b) | | | 5,865 | | | | 6,397,483 | |
City of Chicago Illinois Transit Authority, RB, Sales Tax Receipts, 5.25%, 12/01/40 | | | 1,050 | | | | 1,102,563 | |
City of Chicago Illinois Waterworks, Refunding RB: | | | | | | | | |
2nd Lien (AGM), 5.25%, 11/01/18(b) | | | 875 | | | | 875,000 | |
2nd Lien (AGM), 5.25%, 11/01/33 | | | 260 | | | | 260,582 | |
2nd Lien Project, 5.00%, 11/01/42 | | | 915 | | | | 953,293 | |
County of Cook Illinois Community College District No. 508, GO, City College of Chicago, 5.50%, 12/01/38 | | | 805 | | | | 836,717 | |
Illinois Finance Authority, RB: | | | | | | | | |
Advocate Health Care Network, Series D,
6.50%, 11/01/18(b) | | | 5,000 | | | | 5,000,000 | |
Chicago LLC, University of Illinois at Chicago Project, Series A, 5.00%, 02/15/47 | | | 200 | | | | 209,992 | |
Chicago LLC, University of Illinois at Chicago Project, Series A, 5.00%, 02/15/50 | | | 100 | | | | 104,624 | |
Illinois Finance Authority, Refunding RB, Central Dupage Health, Series B, 5.50%, 11/01/19(b) | | | 1,610 | | | | 1,664,386 | |
Metropolitan Pier & Exposition Authority, Refunding RB, McCormick Place Expansion Project: | | | | | | | | |
Series B (AGM), 5.00%, 06/15/50 | | | 4,315 | | | | 4,425,464 | |
Series B-2, 5.00%, 06/15/50 | | | 2,500 | | | | 2,501,025 | |
Railsplitter Tobacco Settlement Authority, RB(b): | | | | | | | | |
5.50%, 06/01/21 | | | 440 | | | | 475,072 | |
6.00%, 06/01/21 | | | 1,140 | | | | 1,245,074 | |
Regional Transportation Authority, RB: | | | | | | | | |
Series A (AMBAC), 7.20%, 11/01/20 | | | 350 | | | | 367,332 | |
Series A (NPFGC), 6.70%, 11/01/21 | | | 2,570 | | | | 2,739,491 | |
Series C (NPFGC), 7.75%, 06/01/20 | | | 970 | | | | 1,024,359 | |
State of Illinois, GO: | | | | | | | | |
5.00%, 02/01/39 | | | 1,540 | | | | 1,549,055 | |
Series A, 5.00%, 04/01/35 | | | 3,000 | | | | 3,052,110 | |
Series A, 5.00%, 04/01/38 | | | 3,490 | | | | 3,533,939 | |
| | | | | | | | |
| Security | | Par
(000) | | | Value | |
| Illinois (continued) | |
State of Illinois, RB, Build Illinois, Series B,
5.25%, 06/15/19(b) | | $ | 630 | | | $ | 642,644 | |
State of Illinois Toll Highway Authority, RB, Series C: | | | | | | | | |
Senior, 5.00%, 01/01/36 | | | 2,615 | | | | 2,841,250 | |
5.00%, 01/01/37 | | | 2,800 | | | | 3,034,164 | |
University of Illinois, RB, Auxiliary Facilities System, Series A, 5.00%, 04/01/44 | | | 985 | | | | 1,048,267 | |
Village of Hodgkins Illinois, RB, Metropolitan Biosolids Management LLC Project, AMT, 6.00%, 11/01/23 | | | 2,400 | | | | 2,402,544 | |
| | | | | | | | |
| | | | 59,489,083 | |
| Indiana — 4.6% | |
City of Valparaiso Indiana, RB, Exempt Facilities, Pratt Paper LLC Project, AMT: | | | | | | | | |
6.75%, 01/01/34 | | | 790 | | | | 902,267 | |
7.00%, 01/01/44 | | | 1,905 | | | | 2,186,331 | |
Indiana Finance Authority, RB, Series A: | | | | | | | | |
CWA Authority Project, 1st Lien, 5.25%, 10/01/38 | | | 3,280 | | | | 3,506,123 | |
Private Activity Bond, Ohio River Bridges East End Crossing Project, AMT, 5.00%, 07/01/44 | | | 450 | | | | 471,096 | |
Private Activity Bond, Ohio River Bridges East End Crossing Project, AMT, 5.00%, 07/01/48 | | | 1,430 | | | | 1,493,306 | |
Private Activity Bond, Ohio River Bridges East End Crossing Project, AMT, 5.25%, 01/01/51 | | | 405 | | | | 426,497 | |
Sisters of St. Francis Health Services, 5.25%, 11/01/19(b) | | | 840 | | | | 866,317 | |
Indiana Finance Authority, Refunding RB, Parkview Health System, Series A: | | | | | | | | |
5.75%, 05/01/19(b) | | | 2,310 | | | | 2,353,220 | |
5.75%, 05/01/31 | | | 485 | | | | 494,196 | |
Indianapolis Local Public Improvement Bond Bank, RB, Series A, 5.00%, 01/15/40 | | | 1,270 | | | | 1,380,007 | |
| | | | | | | | |
| | | | 14,079,360 | |
| Iowa — 1.5% | |
Iowa Finance Authority, Refunding RB, Iowa Fertilizer Co. Project: | | | | | | | | |
Series B, 5.25%, 12/01/50(d) | | | 2,810 | | | | 2,983,995 | |
Midwestern Disaster Area, 5.50%, 12/01/22 | | | 10 | | | | 10,019 | |
Midwestern Disaster Area, 5.25%, 12/01/25 | | | 460 | | | | 485,967 | |
Midwestern Disaster Area, 5.88%, 12/01/26(a) | | | 410 | | | | 430,845 | |
Iowa Student Loan Liquidity Corp., Refunding RB, Student Loan, Senior Series A-1, AMT, 5.15%, 12/01/22 | | | 695 | | | | 715,245 | |
| | | | | | | | |
| | | | 4,626,071 | |
| Kentucky — 1.1% | |
Kentucky Economic Development Finance Authority, RB, Catholic Health Initiatives, Series A, 5.25%, 01/01/45 | | | 995 | | | | 1,046,113 | |
Kentucky Economic Development Finance Authority, Refunding RB, Louisville Arena Authority, Inc. (AGM), 5.00%, 12/01/45 | | | 1,235 | | | | 1,334,084 | |
Kentucky Public Transportation Infrastructure Authority, RB, Downtown Crossing Project, Convertible CAB, 1st Tier, Series C, 0.00%, 07/01/43(e) | | | 1,200 | | | | 1,098,240 | |
| | | | | | | | |
| | | | 3,478,437 | |
| Louisiana — 3.4% | |
Louisiana Local Government Environmental Facilities & Community Development Authority, RB, Westlake Chemical Corp. Project, Series A-1, 6.50%, 11/01/35 | | | 3,320 | | | | 3,559,671 | |
Louisiana Public Facilities Authority, Refunding RB, Tulane University of Lousiana Project, 4.00%, 12/15/50 | | | 2,000 | | | | 1,902,660 | |
Tobacco Settlement Financing Corp., Refunding RB, Asset-Backed, Series A: | | | | | | | | |
5.50%, 05/15/30 | | | 1,020 | | | | 1,059,545 | |
5.25%, 05/15/31 | | | 870 | | | | 916,362 | |
| | | | |
| SCHEDULES OF INVESTMENTS | | | 65 | |
| | |
Schedule of Investments (unaudited) (continued) October 31, 2018 | | BlackRock MuniVest Fund II, Inc. (MVT) (Percentages shown are based on Net Assets) |
| | | | | | | | |
| Security | | Par
(000) | | | Value | |
| Louisiana (continued) | |
Tobacco Settlement Financing Corp., Refunding RB, Asset-Backed, Series A (continued): | | | | | | | | |
5.25%, 05/15/32 | | $ | 1,110 | | | $ | 1,183,193 | |
5.25%, 05/15/33 | | | 1,205 | | | | 1,275,782 | |
5.25%, 05/15/35 | | | 505 | | | | 534,442 | |
| | | | | | | | |
| | | | 10,431,655 | |
| Maryland — 0.8% | |
Maryland EDC, RB, Transportation Facilities Project, Series A, 5.75%, 06/01/20(b) | | | 435 | | | | 459,686 | |
Maryland EDC, Refunding RB, CNX Marine Terminals, Inc., 5.75%, 09/01/25 | | | 750 | | | | 774,375 | |
Maryland Health & Higher Educational Facilities Authority, RB: | | | | | | | | |
Trinity Health Credit Group, Series 2017,
5.00%, 12/01/46 | | | 420 | | | | 460,786 | |
University of Maryland Medical System, Series B (NPFGC), 7.00%, 07/01/22(f) | | | 595 | | | | 665,746 | |
| | | | | | | | |
| | | | 2,360,593 | |
| Massachusetts — 1.1% | |
Massachusetts Development Finance Agency, Refunding RB, New Bridge Charles, Inc.(a): | | | | | | | | |
4.00%, 10/01/32 | | | 215 | | | | 203,751 | |
4.13%, 10/01/42 | | | 135 | | | | 120,004 | |
5.00%, 10/01/57 | | | 340 | | | | 345,362 | |
Massachusetts Health & Educational Facilities Authority, Refunding RB, Partners Healthcare System, Series J1, 5.00%, 07/01/19(b) | | | 990 | | | | 1,010,196 | |
Massachusetts HFA, Refunding RB, Series F, AMT, 5.70%, 06/01/40 | | | 1,660 | | | | 1,662,673 | |
| | | | | | | | |
| | | | 3,341,986 | |
| Michigan — 2.3% | |
City of Detroit Michigan Sewage Disposal System, Refunding RB, Senior Lien, Series A, 5.25%, 07/01/39 | | | 4,425 | | | | 4,684,216 | |
Kalamazoo Hospital Finance Authority, Refunding RB, Bronson Methodist Hospital: | | | | | | | | |
5.50%, 05/15/20(b) | | | 760 | | | | 797,316 | |
5.50%, 05/15/36 | | | 620 | | | | 644,515 | |
Michigan Finance Authority, Refunding RB, Detroit Water & Sewage Department Project, Senior Lien, Series C-1, 5.00%, 07/01/44 | | | 880 | | | | 930,257 | |
| | | | | | | | |
| | | | 7,056,304 | |
| Minnesota — 1.0% | |
Duluth Economic Development Authority, Refunding RB, Essentia Health Obligated Group, Series A(g): | | | | | | | | |
4.25%, 02/15/48 | | | 1,020 | | | | 973,876 | |
5.25%, 02/15/53 | | | 2,045 | | | | 2,181,013 | |
| | | | | | | | |
| | | | 3,154,889 | |
| Mississippi — 1.5% | |
County of Lowndes Mississippi, Refunding RB, Solid Waste Disposal & Pollution Control, Weyerhaeuser Co. Project, Series A, 6.80%, 04/01/22 | | | 3,000 | | | | 3,359,940 | |
University of Southern Mississippi, RB, Campus Facilities Improvements Project, 5.38%, 09/01/19(b) | | | 1,065 | | | | 1,095,054 | |
| | | | | | | | |
| | | | 4,454,994 | |
| Missouri — 2.0% | |
Bi-State Development Agency of the Missouri-Illinois Metropolitan District, Refunding RB, Combined Lien, Series A, 5.00%, 10/01/44 | | | 255 | | | | 276,343 | |
State of Missouri Health & Educational Facilities Authority, RB, Kansas City Art Institute, 5.00%, 09/01/48 | | | 2,610 | | | | 2,776,596 | |
State of Missouri Health & Educational Facilities Authority, Refunding RB: | | | | | | | | |
Mercy Health, Series C, 5.00%, 11/15/47 | | | 2,570 | | | | 2,785,546 | |
| | | | | | | | |
| Security | | Par
(000) | | | Value | |
| Missouri (continued) | |
State of Missouri Health & Educational Facilities Authority, Refunding RB (continued): | | | | | | | | |
St. Louis College of Pharmacy Project,
5.50%, 05/01/43 | | $ | 245 | | | $ | 257,520 | |
| | | | | | | | |
| | | | 6,096,005 | |
| Nebraska — 0.8% | |
Central Plains Nebraska Energy Project, RB, Gas
Project No. 3: | | | | | | | | |
5.25%, 09/01/37 | | | 825 | | | | 893,838 | |
5.00%, 09/01/42 | | | 1,445 | | | | 1,552,580 | |
| | | | | | | | |
| | | | 2,446,418 | |
| New Hampshire(a) — 0.7% | |
New Hampshire Business Finance Authority, Refunding RB, Resource Recovery, Covanta Project: | | | | | | | | |
Series B, 4.63%, 11/01/42 | | | 1,545 | | | | 1,496,024 | |
Series C, AMT, 4.88%, 11/01/42 | | | 805 | | | | 785,535 | |
| | | | | | | | |
| | | | 2,281,559 | |
| New Jersey — 6.8% | |
Casino Reinvestment Development Authority, Refunding RB: | | | | | | | | |
5.25%, 11/01/39 | | | 1,675 | | | | 1,766,488 | |
5.25%, 11/01/44 | | | 1,525 | | | | 1,604,163 | |
County of Essex New Jersey Improvement Authority, RB, AMT, 5.25%, 07/01/45(a) | | | 1,085 | | | | 1,088,342 | |
New Jersey EDA, RB, Continental Airlines, Inc. Project, AMT, 5.25%, 09/15/29 | | | 1,955 | | | | 2,094,939 | |
New Jersey EDA, Refunding ARB, Port Network Container Terminal LLC Project, AMT, 5.00%, 10/01/47 | | | 1,425 | | | | 1,476,784 | |
New Jersey EDA, Refunding, Special Assessment Bonds, Kapkowski Road Landfill Project, 5.75%, 04/01/31 | | | 2,240 | | | | 2,420,835 | |
New Jersey State Turnpike Authority, RB: | | | | | | | | |
Series A, 5.00%, 01/01/43 | | | 740 | | | | 791,756 | |
Series E, 5.00%, 01/01/45 | | | 2,615 | | | | 2,814,132 | |
New Jersey Transportation Trust Fund Authority, RB: | | | | | | | | |
Transportation Program, Series AA, 5.00%, 06/15/44 | | | 445 | | | | 457,918 | |
Transportation Program, Series AA, 5.00%, 06/15/44 | | | 825 | | | | 846,838 | |
Transportation System, Series A, 5.50%, 06/15/41 | | | 1,635 | | | | 1,706,515 | |
Transportation System, Series B, 5.25%, 06/15/36 | | | 2,460 | | | | 2,561,131 | |
Tobacco Settlement Financing Corp., Refunding RB: | | | | | | | | |
Series A, 5.25%, 06/01/46 | | | 525 | | | | 554,930 | |
Sub-Series B, 5.00%, 06/01/46 | | | 745 | | | | 754,596 | |
| | | | | | | | |
| | | | 20,939,367 | |
| New York — 15.5% | |
City of New York Transitional Finance Authority, RB, Fiscal 2009, Series S-3, 5.25%, 01/15/39 | | | 6,700 | | | | 6,746,766 | |
City of New York Transitional Finance Authority Future Tax Secured, RB, Fiscal 2012, Sub-Series E-1,
5.00%, 02/01/42 | | | 1,960 | | | | 2,074,111 | |
Counties of New York Tobacco Trust IV, Refunding RB, Settlement Pass-Through Turbo, Series A,
6.25%, 06/01/41(a) | | | 1,800 | | | | 1,852,164 | |
Erie Tobacco Asset Securitization Corp., Refunding RB, Asset-Backed, Series A, 5.00%, 06/01/45 | | | 1,960 | | | | 1,885,226 | |
Metropolitan Transportation Authority, RB, Series C: | | | | | | | | |
6.50%, 11/15/18(b) | | | 7,595 | | | | 7,608,215 | |
6.50%, 11/15/28 | | | 1,810 | | | | 1,813,113 | |
Metropolitan Transportation Authority, Refunding RB, Series C-1, 5.25%, 11/15/56 | | | 3,585 | | | | 3,916,075 | |
New York Counties Tobacco Trust IV, Refunding RB, Tobacco Settlement Pass-Through Bonds, Series A,
5.00%, 06/01/38 | | | 1,910 | | | | 1,858,774 | |
New York Liberty Development Corp., RB, World Trade Center Port Authority Consolidated, 5.25%, 12/15/43 | | | 10,735 | | | | 11,585,105 | |
| | |
| 66 | | 2018 BLACKROCK SEMI-ANNUAL REPORTTO SHAREHOLDERS |
| | |
Schedule of Investments (unaudited) (continued) October 31, 2018 | | BlackRock MuniVest Fund II, Inc. (MVT) (Percentages shown are based on Net Assets) |
| | | | | | | | |
| Security | | Par
(000) | | | Value | |
| New York (continued) | |
New York Liberty Development Corp., Refunding RB: | | | | | | | | |
2nd Priority, Bank of America Tower at One Bryant Park Project, Class 3, 6.38%, 07/15/49 | | $ | 1,220 | | | $ | 1,267,629 | |
3 World Trade Center Project, Class 1,
5.00%, 11/15/44(a) | | | 2,860 | | | | 2,928,726 | |
3 World Trade Center Project, Class 2,
5.15%, 11/15/34(a) | | | 340 | | | | 350,475 | |
3 World Trade Center Project, Class 2,
5.38%, 11/15/40(a) | | | 850 | | | | 875,330 | |
Port Authority of New York & New Jersey, ARB, Special Project, JFK International Air Terminal LLC Project, Series 8: | | | | | | | | |
6.00%, 12/01/36 | | | 1,165 | | | | 1,248,857 | |
6.00%, 12/01/42 | | | 1,250 | | | | 1,338,387 | |
| | | | | | | | |
| | | | 47,348,953 | |
| North Carolina — 0.2% | |
North Carolina Medical Care Commission, Refunding RB, 1st Mortgage, Retirement Facilities Whitestone Project, Series A, 7.75%, 03/01/21(b) | | | 595 | | | | 667,138 | |
| | | | | | | | |
| North Dakota — 0.3% | |
County of Cass North Dakota, Refunding RB, Essentia Health Obligated Group, Series B, 5.25%, 02/15/58(g) | | | 950 | | | | 999,847 | |
| | | | | | | | |
| Ohio — 1.5% | |
Buckeye Tobacco Settlement Financing Authority, RB, Asset-Backed, Senior Turbo Term, Series A-2,
5.88%, 06/01/47 | | | 3,230 | | | | 3,136,298 | |
County of Franklin Ohio, RB: | | | | | | | | |
Health Care Facilities Improvement, OPRS Communities Obligation Group, Series A, 6.13%, 07/01/40 | | | 660 | | | | 706,385 | |
Trinity Health Credit Group, Series 2017,
5.00%, 12/01/46 | | | 400 | | | | 429,100 | |
State of Ohio, RB, Portsmouth Bypass Project, AMT, 5.00%, 06/30/53 | | | 275 | | | | 287,328 | |
| | | | | | | | |
| | | | 4,559,111 | |
| Oklahoma — 1.7% | |
Oklahoma Development Finance Authority, RB, OU Medicine Project, Series B, 5.50%, 08/15/57 | | | 1,155 | | | | 1,236,081 | |
Oklahoma Turnpike Authority, RB: | | | | | | | | |
2nd Series C, 4.00%, 01/01/42 | | | 1,950 | | | | 1,944,072 | |
Series A, 4.00%, 01/01/48 | | | 2,050 | | | | 2,018,655 | |
| | | | | | | | |
| | | | 5,198,808 | |
| Pennsylvania — 2.7% | |
City of Philadelphia Pennsylvania Airport Revenue, Refunding ARB, Series B, AMT, 5.00%, 07/01/47 | | | 445 | | | | 474,940 | |
City of Philadelphia Pennsylvania Hospitals & Higher Education Facilities Authority, RB, Temple University Health System, Series A, 5.63%, 07/01/42 | | | 635 | | | | 667,156 | |
Commonwealth Financing Authority, RB, Tobacco Master Settlement Payment: | | | | | | | | |
5.00%, 06/01/33 | | | 100 | | | | 109,811 | |
5.00%, 06/01/34 | | | 135 | | | | 147,790 | |
County of Montgomery Higher Education & Health Authority, Refunding RB, Thomas Jefferson University, Series A: | | | | | | | | |
4.00%, 09/01/49 | | | 555 | | | | 528,504 | |
5.00%, 09/01/43 | | | 1,220 | | | | 1,318,295 | |
Pennsylvania Economic Development Financing Authority, RB: | | | | | | | | |
AMT, 5.00%, 06/30/42 | | | 850 | | | | 887,876 | |
Aqua Pennsylvania, Inc. Project, Series B, 5.00%, 11/15/40 | | | 1,890 | | | | 1,939,972 | |
| | | | | | | | |
| Security | | Par
(000) | | | Value | |
| Pennsylvania (continued) | |
Pennsylvania Economic Development Financing Authority, Refunding RB, National Gypsum Co., AMT,
5.50%, 11/01/44 | | $ | 1,035 | | | $ | 1,069,641 | |
Pennsylvania Turnpike Commission, RB, Series A, 5.00%, 12/01/44 | | | 1,105 | | | | 1,183,787 | |
| | | | | | | | |
| | | | 8,327,772 | |
| Puerto Rico — 1.2% | |
Children’s Trust Fund, Refunding RB, Tobacco Settlement Asset-Backed Bonds: | | | | | | | | |
5.50%, 05/15/39 | | | 1,855 | | | | 1,881,341 | |
5.63%, 05/15/43 | | | 1,770 | | | | 1,794,090 | |
| | | | | | | | |
| | | | 3,675,431 | |
| Rhode Island — 2.1% | |
Tobacco Settlement Financing Corp., Refunding RB: | | | | | | | | |
Series A, 5.00%, 06/01/35 | | | 820 | | | | 862,640 | |
Series B, 4.50%, 06/01/45 | | | 2,645 | | | | 2,608,578 | |
Series B, 5.00%, 06/01/50 | | | 2,945 | | | | 3,019,538 | |
| | | | | | | | |
| | | | 6,490,756 | |
| South Carolina — 4.8% | |
State of South Carolina Ports Authority, ARB: | | | | | | | | |
5.25%, 07/01/20(b) | | | 3,280 | | | | 3,445,771 | |
AMT, 5.25%, 07/01/55 | | | 1,295 | | | | 1,396,658 | |
State of South Carolina Public Service Authority, RB, Santee Cooper, Series A, 5.50%, 12/01/54 | | | 6,180 | | | | 6,547,401 | |
State of South Carolina Public Service Authority, Refunding RB, Series E, 5.25%, 12/01/55 | | | 3,165 | | | | 3,348,728 | |
| | | | | | | | |
| | | | 14,738,558 | |
| Tennessee — 0.6% | |
City of Chattanooga Health Educational & Housing Facility Board, RB, Catholic Health Initiatives, Series A,
5.25%, 01/01/45 | | | 995 | | | | 1,046,113 | |
County of Nashville & Davidson Metropolitan Government Health & Educational Facilities Board, RB, Vanderbilt University Medical Center, Series A, 5.00%, 07/01/40 | | | 690 | | | | 736,527 | |
| | | | | | | | |
| | | | 1,782,640 | |
| Texas — 9.5% | |
Central Texas Regional Mobility Authority, Refunding RB, Senior Lien, 6.25%, 01/01/21(b) | | | 2,140 | | | | 2,316,422 | |
City of Houston Texas Airport System, Refunding ARB, United Airlines, Inc. Terminal E Project, AMT, 5.00%, 07/01/29 | | | 965 | | | | 1,025,486 | |
Clifton Higher Education Finance Corp., RB, Idea Public Schools, 6.00%, 08/15/43 | | | 745 | | | | 811,633 | |
County of Harris Texas Cultural Education Facilities Finance Corp., RB, 1st Mortgage, Brazos Presbyterian Homes, Inc. Project, Series B, 7.00%, 01/01/23(b) | | | 455 | | | | 535,471 | |
County of Harris Texas Health Facilities Development Corp., Refunding RB, Memorial Hermann Healthcare System, Series B, 7.25%, 12/01/18(b) | | | 2,000 | | | | 2,008,600 | |
County of Tarrant Texas Cultural Education Facilities Finance Corp., RB, Christus Health, Series B, 5.00%, 07/01/48 | | | 4,545 | | | | 4,835,289 | |
County of Tarrant Texas Cultural Education Facilities Finance Corp., Refunding RB, Trinity Terrace Project, 5.00%, 10/01/49 | | | 1,000 | | | | 1,039,350 | |
Fort Bend County Industrial Development Corp., RB, NRG Energy Inc. Project, Series B, 4.75%, 11/01/42 | | | 670 | | | | 679,983 | |
North Texas Tollway Authority, Refunding RB, Series A: | | | | | | | | |
1st Tier System, 6.25%, 01/01/19(b) | | | 5,690 | | | | 5,729,375 | |
1st Tier System, 6.25%, 01/01/39 | | | 1,310 | | | | 1,318,345 | |
5.00%, 01/01/38 | | | 925 | | | | 997,030 | |
San Antonio Water System, Refunding RB, Junior Lien, Series A, 5.00%, 05/15/48 | | | 2,470 | | | | 2,728,090 | |
| | | | |
| SCHEDULES OF INVESTMENTS | | | 67 | |
| | |
Schedule of Investments (unaudited) (continued) October 31, 2018 | | BlackRock MuniVest Fund II, Inc. (MVT) (Percentages shown are based on Net Assets) |
| | | | | | | | |
| Security | | Par
(000) | | | Value | |
| Texas (continued) | |
Texas Private Activity Bond Surface Transportation Corp., RB, Senior Lien: | | | | | | | | |
LBJ Infrastructure Group LLC, 7.00%, 06/30/40 | | $ | 2,000 | | | $ | 2,129,260 | |
NTE Mobility Partners LLC, North Tarrant Express Managed Lanes Project, 6.88%, 12/31/39 | | | 2,775 | | | | 2,900,846 | |
| | | | | | | | |
| | | | 29,055,180 | |
| Utah — 1.6% | |
City of Riverton Utah, RB, IHC Health Services, Inc., 5.00%, 08/15/19(b) | | | 2,780 | | | | 2,846,192 | |
City of Salt Lake Corp. Airport Revenue, ARB, Series A, AMT, 5.00%, 07/01/48 | | | 875 | | | | 945,245 | |
Salt Lake City Corp. Airport Revenue, ARB, Series A, AMT, 5.00%, 07/01/47 | | | 915 | | | | 980,697 | |
| | | | | | | | |
| | | | 4,772,134 | |
| Virginia — 2.3% | |
Front Royal & Warren County Industrial Development Authority, RB, Valley Health System Obligated Group, 4.00%, 01/01/50 | | | 1,160 | | | | 1,094,808 | |
Hampton Roads Transportation Accountability Commission, RB, Transportation Fund, Senior Lien, Series A,
5.50%, 07/01/57 | | | 1,095 | | | | 1,261,659 | |
Lexington Industrial Development Authority, RB, Kendal st Lexington, Series A, 5.00%, 01/01/48 | | | 820 | | | | 863,804 | |
Virginia Small Business Financing Authority, RB, Senior Lien, Elizabeth River Crossings OpCo LLC Project, AMT: | | | | | | | | |
5.25%, 01/01/32 | | | 1,615 | | | | 1,713,596 | |
6.00%, 01/01/37 | | | 1,940 | | | | 2,110,875 | |
| | | | | | | | |
| | | | 7,044,742 | |
| Washington — 2.8% | |
Port of Seattle Washington, ARB, Intermediate Lien, Series C, AMT, 5.00%, 05/01/42 | | | 1,465 | | | | 1,576,208 | |
Port of Seattle Washington, RB, Intermediate Lien, Series C, AMT, 5.00%, 04/01/40 | | | 755 | | | | 808,341 | |
Washington Health Care Facilities Authority, RB, Catholic Health Initiatives, Series A, 5.75%, 01/01/45 | | | 2,290 | | | | 2,476,841 | |
Washington Health Care Facilities Authority, Refunding RB, Catholic Health Initiatives, Series D, 6.38%, 10/01/36 | | | 3,700 | | | | 3,711,211 | |
| | | | | | | | |
| | | | 8,572,601 | |
| Wisconsin — 3.2% | |
State of Wisconsin, Refunding RB, Series A,
6.00%, 05/01/19(b) | | | 7,100 | | | | 7,245,195 | |
State of Wisconsin Health & Educational Facilities Authority, RB, Ascension Health Senior Credit Group, Series E, 5.00%, 11/15/33 | | | 2,465 | | | | 2,527,611 | |
| | | | | | | | |
| | | | 9,772,806 | |
| | | | | |
Total Municipal Bonds — 130.4%
(Cost — $385,210,404) | | | | 399,169,999 | |
| | | | | |
|
Municipal Bonds Transferred to Tender Option Bond Trusts(h) | |
|
California — 6.8% | |
Bay Area Toll Authority, Refunding RB, San Francisco Bay Area: | | | | | | | | |
Toll Bridge, 4.00%, 04/01/42(i) | | | 3,057 | | | | 3,080,430 | |
Series F-1, 5.63%, 04/01/19(b) | | | 3,271 | | | | 3,324,388 | |
City & County of San Francisco California Public Utilities Commission, RB, Water Revenue, Series B, 5.00%, 11/01/19(b) | | | 9,480 | | | | 9,781,685 | |
Sacramento Area Flood Control Agency, Refunding, Consolidated Capital Assessment District No. 2 Bonds, 5.00%, 10/01/47 | | | 3,075 | | | | 3,381,470 | |
| | | | | | | | |
| Security | | Par
(000) | | | Value | |
| California (continued) | |
San Diego California Community College District, GO, Election of 2002, 5.25%, 08/01/19(b) | | $ | 1,077 | | | $ | 1,104,769 | |
| | | | | | | | |
| | | | 20,672,742 | |
| Colorado — 1.5% | |
City & County of Denver Colorado Airport System Revenue, Refunding ARB, Subordinate System, Series A, AMT, 5.25%, 12/01/48(i) | | | 2,252 | | | | 2,501,809 | |
Colorado Health Facilities Authority, Refunding RB, Catholic Health Initiatives, Series A, 5.50%, 07/01/34(i) | | | 2,129 | | | | 2,176,381 | |
| | | | | | | | |
| | | | 4,678,190 | |
| Florida — 2.0% | |
County of Miami-Dade Florida, RB, Water & Sewer System, 5.00%, 10/01/20(b) | | | 5,679 | | | | 5,985,345 | |
| | | | | | | | |
| Illinois — 1.0% | |
Illinois Finance Authority, Refunding RB, Presence Health Network, Series C, 4.00%, 02/15/41 | | | 3,225 | | | | 3,100,440 | |
| | | | | | | | |
| Massachusetts — 3.1% | |
Commonwealth of Massachusetts Transportation Fund Revenue, RB, Rail Enhancement Program, Series A, 4.00%, 06/01/45 | | | 2,043 | | | | 2,047,175 | |
Massachusetts Development Finance Agency, Refunding RB, Partners Healthcare System, 5.00%, 07/01/47 | | | 4,574 | | | | 4,907,401 | |
Massachusetts School Building Authority, RB, Senior, Series B, 5.00%, 10/15/41 | | | 2,266 | | | | 2,401,869 | |
| | | | | | | | |
| | | | 9,356,445 | |
| New Hampshire — 0.7% | |
New Hampshire Health & Education Facilities Authority, RB, Dartmouth College, 5.25%, 06/01/19(b)(i) | | | 2,009 | | | | 2,047,730 | |
| | | | | | | | |
| New York — 4.3% | |
City of New York Municipal Water Finance Authority, Refunding RB, Water & Sewer System, 2nd General Resolution, Series FF-2, 5.50%, 06/15/40 | | | 1,575 | | | | 1,605,287 | |
Hudson Yards Infrastructure Corp., RB, Senior-Fiscal 2012(i): | | | | | | | | |
5.75%, 02/15/21(b) | | | 997 | | | | 1,072,120 | |
5.75%, 02/15/47 | | | 613 | | | | 659,536 | |
New York Liberty Development Corp., Refunding RB, 4 World Trade Center Project, 5.75%, 11/15/51(i) | | | 6,440 | | | | 7,009,840 | |
Port Authority of New York & New Jersey, Refunding ARB, 194th Series, 5.25%, 10/15/55 | | | 2,595 | | | | 2,866,108 | |
| | | | | | | | |
| | | | 13,212,891 | |
| North Carolina — 0.9% | |
North Carolina Capital Facilities Finance Agency, Refunding RB, Duke University Project, Series B, 5.00%, 10/01/55 | | | 2,550 | | | | 2,805,625 | |
| | | | | | | | |
| Ohio — 4.5% | |
State of Ohio, Refunding RB, Cleveland Clinic Health System Obligated Group, Series A, 5.50%, 01/01/19(b) | | | 13,843 | | | | 13,922,338 | |
| | | | | | | | |
| Pennsylvania — 0.9% | |
Pennsylvania Turnpike Commission, RB, Sub-Series A, 5.50%, 12/01/42 | | | 2,340 | | | | 2,619,466 | |
| | | | | | | | |
| Rhode Island — 0.5% | |
Narragansett Bay Commission, Refunding RB, Wastewater System, Series A, 4.00%, 09/01/43 | | | 1,530 | | | | 1,532,086 | |
| | | | | | | | |
| South Carolina — 1.6% | |
South Carolina Public Service Authority, Refunding RB,
Series A 5.50%, 01/01/19(b)(i) | | | 5,001 | | | | 5,030,241 | |
| | | | | | | | |
| | |
| 68 | | 2018 BLACKROCK SEMI-ANNUAL REPORTTO SHAREHOLDERS |
| | |
Schedule of Investments (unaudited) (continued) October 31, 2018 | | BlackRock MuniVest Fund II, Inc. (MVT) (Percentages shown are based on Net Assets) |
| | | | | | | | |
| Security | | Par
(000) | | | Value | |
| Texas — 3.4% | |
City of San Antonio Texas Electric and Gas Systems, RB, Junior Lien, 5.00%, 02/01/43 | | $ | 2,520 | | | $ | 2,701,459 | |
County of Harris Texas Metropolitan Transit Authority, Refunding RB, Series A, 5.00%, 11/01/41 | | | 3,400 | | | | 3,605,921 | |
Lower Colorado River Authority, Refunding RB, LCRA Transmission Services Corporation Project, 4.00%, 05/15/43 | | | 2,030 | | | | 2,011,207 | |
University of Texas, Refunding RB, Financing System, Series B, 5.00%, 08/15/43 | | | 1,831 | | | | 1,974,923 | |
| | | | | | | | |
| | | | 10,293,510 | |
| Wisconsin — 1.7% | |
Wisconsin Health & Educational Facilities Authority, Refunding RB: | | | | | | | | |
Froedtert & Community Health, Inc., Obligated Group, Series C, 5.25%, 04/01/19(b)(i) | | | 2,499 | | | | 2,533,195 | |
The Medical College of Wisconsin, Inc., 4.00%, 12/01/46 | | | 2,833 | | | | 2,717,017 | |
| | | | | | | | |
| | | | 5,250,212 | |
| | | | | |
Total Municipal Bonds Transferred to Tender Option Bond
Trusts — 32.9%
(Cost — $99,149,660) | | | | 100,507,261 | |
| | | | | |
Total Long-Term Investments — 163.3%
(Cost — $484,360,064) | | | | 499,677,260 | |
| | | | | |
| | |
| | | Shares | | | | |
| Short-Term Securities — 1.1% | |
BlackRock Liquidity Funds, MuniCash, Institutional Class, 1.45%(j)(k) | | | 3,341,276 | | | | 3,341,610 | |
| | | | | | | | |
Total Short-Term Securities — 1.1%
(Cost — $3,341,590) | | | | 3,341,610 | |
| | | | | |
| |
Total Investments — 164.4%
(Cost — $487,701,654) | | | | 503,018,870 | |
Other Assets Less Liabilities — 1.1% | | | | 3,605,534 | |
Liability for TOB Trust Certificates, Including Interest Expense and Fees Payable — (19.8)% | | | | (60,610,996 | ) |
VMTP Shares at Liquidation Value, Net of Deferred Offering
Costs — (45.7)% | | | | (140,000,000 | ) |
| | | | | |
Net Assets Applicable to Common Shares — 100.0% | | | $ | 306,013,408 | |
| | | | | |
| (a) | Security exempt from registration pursuant to Rule 144A under the Securities Act of 1933, as amended. These securities may be resold in transactions exempt from registration to qualified institutional investors. |
| (b) | U.S. Government securities, held in escrow, are used to pay interest on this security, as well as to retire the bond in full at the date indicated, typically at a premium to par. |
| (d) | Variable or floating rate security, which interest rate adjusts periodically based on changes in current interest rates and prepayments on the underlying pool of assets. Rate shown is the rate in effect as of period end. |
| (e) | Step-up bond that pays an initial coupon rate for the first period and then a higher coupon rate for the following periods. Rate as of period end. |
| (f) | Security is collateralized by municipal bonds or U.S. Treasury obligations. |
| (g) | When-issued security. |
| (h) | Represent bonds transferred to a TOB Trust in exchange of cash and residual certificates received by the Fund. These bonds serve as collateral in a secured borrowing. See Note 4 of the Notes to Financial Statements for details. |
| (i) | All or a portion of security is subject to a recourse agreement. The aggregate maximum potential amount the Fund could ultimately be required to pay under the agreement(s), which expire between December 1, 2018 to April 1, 2039, is $15,489,034. See Note 4 of the Notes to Financial Statements for details. |
| (j) | Annualized 7-day yield as of period end. |
| (k) | During the six months ended October 31, 2018, investments in issuers considered to be an affiliate of the Fund for purposes of Section 2(a)(3) of the Investment Company Act of 1940, as amended, were as follows: |
| | | | | | | | | | | | | | | | | | | | | | | | | | | | |
| Affiliate | | Shares
Held at
04/30/18 | | | Net
Activity | | | Shares
Held at
10/31/18 | | | Value at
10/31/18 | | | Income | | | Net
Realized
Gain (Loss) (a) | | | Change in
Unrealized
Appreciation
(Depreciation) | |
BlackRock Liquidity Funds, MuniCash, Institutional Class | | | 986,303 | | | | 2,354,973 | | | | 3,341,276 | | | $ | 3,341,610 | | | $ | 39,652 | | | $ | 1,065 | | | $ | 20 | |
| | | | | | | | | | | | | | | | | | | | | | | | | | | | |
| | (a) | Includes net capital gain distributions, if applicable. | |
| | | | |
| SCHEDULES OF INVESTMENTS | | | 69 | |
| | |
Schedule of Investments (unaudited) (continued) October 31, 2018 | | BlackRock MuniVest Fund II, Inc. (MVT) |
Derivative Financial Instruments Outstanding as of Period End
Futures Contracts
| | | | | | | | | | | | | | | | |
| Description | | Number of
Contracts | | | Expiration
Date | | | Notional
Amount (000) | | | Value/
Unrealized
Appreciation
(Depreciation) | |
Short Contracts: | | | | | | | | | | | | | | | | |
10-Year U.S. Treasury Note | | | 6 | | | | 12/19/18 | | | $ | 711 | | | $ | 5,757 | |
Long U.S. Treasury Bond | | | 58 | | | | 12/19/18 | | | | 8,011 | | | | 176,116 | |
5-Year U.S. Treasury Note | | | 17 | | | | 12/31/18 | | | | 1,911 | | | | 11,892 | |
| | | | | | | | | | | | | | | | |
| | | | | | | | | | | | | | $ | 193,765 | |
| | | | | | | | | | | | | | | | |
Derivative Financial Instruments Categorized by Risk Exposure
As of period end, the fair values of derivative financial instruments located in the Statements of Assets and Liabilities were as follows:
| | | | | | | | | | | | | | | | | | | | | | | | | | | | |
| | | Commodity
Contracts | | | Credit
Contracts | | | Equity
Contracts | | | Foreign
Currency
Exchange
Contracts | | | Interest
Rate
Contracts | | | Other
Contracts | | | Total | |
Assets — Derivative Financial Instruments | | | | | | | | | | | | | | | | | | | | | | | | | | | | |
Futures contracts | | | | | | | | | | | | | | | | | | | | | | | | | | | | |
Net unrealized appreciation(a) | | $ | — | | | $ | — | | | $ | — | | | $ | — | | | $ | 193,765 | | | $ | — | | | $ | 193,765 | |
| | | | | | | | | | | | | | | | | | | | | | | | | | | | |
| | (a) | Includes cumulative appreciation (depreciation) on futures contracts if any, as reported in the Schedule of Investments. Only current day’s variation margin is reported within the Statements of Assets and Liabilities. | |
For the six months ended October 31, 2018, the effect of derivative financial instruments in the Statements of Operations was as follows:
| | | | | | | | | | | | | | | | | | | | | | | | | | | | |
| | | Commodity
Contracts | | | Credit
Contracts | | | Equity
Contracts | | | Foreign
Currency
Exchange
Contracts | | | Interest
Rate
Contracts | | | Other
Contracts | | | Total | |
Net Realized Gain (Loss) from: | | | | | | | | | | | | | | | | | | | | | | | | | | | | |
Futures contracts | | $ | — | | | $ | — | | | $ | — | | | $ | — | | | $ | 261,633 | | | $ | — | | | $ | 261,633 | |
| | | | | | | | | | | | | | | | | | | | | | | | | | | | |
Net Change in Unrealized Appreciation (Depreciation) on: | | | | | | | | | | | | | | | | | | | | | | | | | | | | |
Futures contracts | | $ | — | | | $ | — | | | $ | — | | | $ | — | | | $ | 171,276 | | | $ | — | | | $ | 171,276 | |
| | | | | | | | | | | | | | | | | | | | | | | | | | | | |
Average Quarterly Balances of Outstanding Derivative Financial Instruments
| | | | |
Futures contracts: | | | | |
Average notional value of contracts — short | | $ | 15,515,301 | |
For more information about the Fund’s investment risks regarding derivative financial instruments, refer to the Notes to Financial Statements.
Fair Value Hierarchy as of Period End
Various inputs are used in determining the fair value of investments and derivative financial instruments. For information about the Fund’s policy regarding valuation of investments and derivative financial instruments, refer to the Notes to Financial Statements.
The following tables summarize the Fund’s investments and derivative financial instruments categorized in the disclosure hierarchy:
| | | | | | | | | | | | | | | | |
| | | Level 1 | | | Level 2 | | | Level 3 | | | Total | |
Assets: | | | | | | | | | | | | | | | | |
Investments: | | | | | | | | | | | | | | | | |
Long-Term Investments(a) | | $ | — | | | $ | 499,677,260 | | | $ | — | | | $ | 499,677,260 | |
Short-Term Securities | | | 3,341,610 | | | | — | | | | — | | | | 3,341,610 | |
| | | | | | | | | | | | | | | | |
| | $ | 3,341,610 | | | $ | 499,677,260 | | | $ | — | | | $ | 503,018,870 | |
| | | | | | | | | | | | | | | | |
Derivative Financial Instruments(b) | | | | | | | | | | | | | | | | |
Assets: | | | | | | | | | | | | | | | | |
Interest rate contracts | | $ | 193,765 | | | $ | — | | | $ | — | | | $ | 193,765 | |
| | | | | | | | | | | | | | | | |
| | (a) | See above Schedule of Investments for values in each state or political subdivision. | |
| | (b) | Derivative financial instruments are futures contracts, which are valued at the unrealized appreciation (depreciation) on the instrument. | |
| | |
| 70 | | 2018 BLACKROCK SEMI-ANNUAL REPORTTO SHAREHOLDERS |
| | |
Schedule of Investments (unaudited) (continued) October 31, 2018 | | BlackRock MuniVest Fund II, Inc. (MVT) |
The Fund may hold assets and/or liabilities in which the fair value approximates the carrying for financial statement purposes. As of period end, such assets and/or liabilities are categorized within the disclosure hierarchy as follows:
| | | | | | | | | | | | | | | | |
| | | Level 1 | | | Level 2 | | | Level 3 | | | Total | |
Liabilities: | |
TOB Trust Certificates | | $ | — | | | $ | (60,358,700 | ) | | $ | — | | | $ | (60,358,700 | ) |
VMTP Shares at Liquidation Value | | | — | | | | (140,000,000 | ) | | | — | | | | (140,000,000 | ) |
| | | | | | | | | | | | | | | | |
| | $ | — | | | $ | (200,358,700 | ) | | $ | — | | | $ | (200,358,700 | ) |
| | | | | | | | | | | | | | | | |
During the six months ended October 31, 2018, there were no transfers between levels.
See notes to financial statements.
| | | | |
| SCHEDULES OF INVESTMENTS | | | 71 | |
Statements of Assets and Liabilities (unaudited)
October 31, 2018
| | | | | | | | | | | | | | | | |
| | | MUA | | | MEN | | | MHD | | | MUH | |
|
ASSETS | |
Investments at value — unaffiliated(a) | | $ | 559,725,457 | | | $ | 563,485,702 | | | $ | 365,026,147 | | | $ | 280,927,023 | |
Investments at value — affiliated(b) | | | 3,111,547 | | | | 2,883,184 | | | | 3,204,209 | | | | 1,461,847 | |
Cash | | | 29,946 | | | | 48,407 | | | | 22,508 | | | | 19,899 | |
Cash pledged for futures contracts | | | 164,950 | | | | 263,900 | | | | 122,550 | | | | 107,200 | |
Receivables: | |
Interest — unaffiliated | | | 9,822,608 | | | | 7,269,007 | | | | 5,376,120 | | | | 3,899,195 | |
Investments sold | | | 228,773 | | | | 1,831,163 | | | | 2,100,817 | | | | 1,705,169 | |
Variation margin on futures contracts | | | 54,813 | | | | 88,000 | | | | 40,929 | | | | 35,906 | |
Dividends — affiliated | | | 4,956 | | | | 2,555 | | | | 7,577 | | | | 700 | |
Dividends — unaffiliated | | | — | | | | — | | | | — | | | | — | |
Prepaid expenses | | | 3,448 | | | | 17,991 | | | | 17,404 | | | | 17,266 | |
| | | | | | | | | | | | | | | | |
Total assets | | | 573,146,498 | | | | 575,889,909 | | | | 375,918,261 | | | | 288,174,205 | |
| | | | | | | | | | | | | | | | |
|
ACCRUED LIABILITIES | |
Bank overdraft | | | — | | | | — | | | | — | | | | — | |
Payables: | |
Income dividend distributions — Common Shares | | | 1,962,421 | | | | 1,424,711 | | | | 993,385 | | | | 697,181 | |
Investments purchased | | | 882,213 | | | | 9,955,495 | | | | 3,052,042 | | | | 5,489,259 | |
Interest expense and fees | | | 367,326 | | | | 398,466 | | | | 251,938 | | | | 249,863 | |
Investment advisory fees | | | 268,317 | | | | 240,347 | | | | 173,361 | | | | 131,735 | |
Other accrued expenses | | | 195,335 | | | | 188,135 | | | | 140,563 | | | | 121,028 | |
Directors’ and Officer’s fees | | | 4,380 | | | | 3,206 | | | | 2,125 | | | | 1,561 | |
| | | | | | | | | | | | | | | | |
Total accrued liabilities | | | 3,679,992 | | | | 12,210,360 | | | | 4,613,414 | | | | 6,690,627 | |
| | | | | | | | | | | | | | | | |
|
OTHER LIABILITIES | |
TOB Trust Certificates | | | 71,659,281 | | | | 91,588,127 | | | | 60,465,002 | | | | 59,871,076 | |
VMTP Shares, at liquidation value of $100,000 per share(c)(d) | | | — | | | | — | | | | 83,700,000 | | | | 55,000,000 | |
VRDP Shares, at liquidation value of $100,000 per share, net of deferred offering costs(c)(d) | | | — | | | | 142,274,618 | | | | — | | | | — | |
| | | | | | | | | | | | | | | | |
Total other liabilities | | | 71,659,281 | | | | 233,862,745 | | | | 144,165,002 | | | | 114,871,076 | |
| | | | | | | | | | | | | | | | |
Total liabilities | | | 75,339,273 | | | | 246,073,105 | | | | 148,778,416 | | | | 121,561,703 | |
| | | | | | | | | | | | | | | | |
| | | | |
NET ASSETS APPLICABLE TO COMMON SHAREHOLDERS | | $ | 497,807,225 | | | $ | 329,816,804 | | | $ | 227,139,845 | | | $ | 166,612,502 | |
| | | | | | | | | | | | | | | | |
|
NET ASSETS APPLICABLE TO COMMON SHAREHOLDERS CONSIST OF | |
Paid-in capital(e)(f)(g) | | $ | 479,963,923 | | | $ | 311,666,822 | | | $ | 211,660,385 | | | $ | 155,975,320 | |
Accumulated earnings | | | 17,843,302 | | | | 18,149,982 | | | | 15,479,460 | | | | 10,637,182 | |
| | | | | | | | | | | | | | | | |
NET ASSETS APPLICABLE TO COMMON SHAREHOLDERS | | $ | 497,807,225 | | | $ | 329,816,804 | | | $ | 227,139,845 | | | $ | 166,612,502 | |
| | | | | | | | | | | | | | | | |
| | | | |
Net asset value, offering and redemption price per share | | $ | 13.83 | | | $ | 11.11 | | | $ | 16.01 | | | $ | 14.70 | |
| | | | | | | | | | | | | | | | |
| | | | |
(a) Investments at cost — unaffiliated | | $ | 540,767,118 | | | $ | 546,070,719 | | | $ | 350,426,005 | | | $ | 271,566,038 | |
(b) Investments at cost — affiliated | | $ | 3,111,547 | | | $ | 2,883,184 | | | $ | 3,204,209 | | | $ | 1,461,847 | |
(c) Preferred Shares outstanding, par value $0.10 per share | | | — | | | | 1,425 | | | | 837 | | | | 550 | |
(d) Preferred Shares authorized. | | | — | | | | 8,905 | | | | 5,837 | | | | 4,030 | |
(e) Par value per Common Share | | $ | 0.10 | | | $ | 0.10 | | | $ | 0.10 | | | $ | 0.10 | |
(f) Common Shares outstanding | | | 36,007,711 | | | | 29,681,476 | | | | 14,191,210 | | | | 11,336,282 | |
(g) Common Shares authorized | | | 200,000,000 | | | | 199,991,095 | | | | 199,994,163 | | | | 199,995,970 | |
See notes to financial statements.
| | |
| 72 | | 2018 BLACKROCK SEMI-ANNUAL REPORTTO SHAREHOLDERS |
Statements of Assets and Liabilities (unaudited) (continued)
October 31, 2018
| | | | | | | | | | | | |
| | | MUS | | | MUI | | | MVT | |
|
ASSETS | |
Investments at value — unaffiliated(a) | | $ | 275,643,805 | | | $ | 932,254,789 | | | $ | 499,677,260 | |
Investments at value — affiliated(b) | | | — | | | | 1,637,526 | | | | 3,341,610 | |
Cash | | | — | | | | 129,792 | | | | 28,133 | |
Cash pledged for futures contracts | | | 94,150 | | | | 257,900 | | | | 153,050 | |
Receivables: | |
Interest — unaffiliated | | | 4,175,038 | | | | 12,889,894 | | | | 7,905,313 | |
Investments sold | | | — | | | | 3,209,279 | | | | 1,345,000 | |
Variation margin on futures contracts | | | 31,281 | | | | 84,436 | | | | 51,094 | |
Dividends — affiliated | | | 2,935 | | | | 9,265 | | | | 7,356 | |
Prepaid expenses | | | 17,256 | | | | 19,041 | | | | 17,648 | |
| | | | | | | | | | | | |
Total assets | | | 279,964,465 | | | | 950,491,922 | | | | 512,526,464 | |
| | | | | | | | | | | | |
|
ACCRUED LIABILITIES | |
Bank overdraft | | | 99,152 | | | | — | | | | — | |
Payables: | |
Income dividend distributions — Common Shares | | | 657,423 | | | | 1,704,184 | | | | 1,352,892 | |
Investments purchased | | | 1,322,259 | | | | 5,506,883 | | | | 4,161,169 | |
Interest expense and fees | | | 83,302 | | | | 316,247 | | | | 252,296 | |
Investment advisory fees | | | 121,598 | | | | 442,165 | | | | 215,085 | |
Other accrued expenses | | | 122,035 | | | | 284,949 | | | | 170,053 | |
Directors’ and Officer’s fees | | | 1,627 | | | | 307,599 | | | | 2,861 | |
| | | | | | | | | | | | |
Total accrued liabilities | | | 2,407,396 | | | | 8,562,027 | | | | 6,154,356 | |
| | | | | | | | | | | | |
|
OTHER LIABILITIES | |
TOB Trust Certificates | | | 21,886,518 | | | | 93,380,641 | | | | 60,358,700 | |
VMTP Shares, at liquidation value of $100,000 per share(c)(d) | | | 87,000,000 | | | | 287,100,000 | | | | 140,000,000 | |
| | | | | | | | | | | | |
Total other liabilities | | | 108,886,518 | | | | 380,480,641 | | | | 200,358,700 | |
| | | | | | | | | | | | |
Total liabilities | | | 111,293,914 | | | | 389,042,668 | | | | 206,513,056 | |
| | | | | | | | | | | | |
| | | |
NET ASSETS APPLICABLE TO COMMON SHAREHOLDERS | | $ | 168,670,551 | | | $ | 561,449,254 | | | $ | 306,013,408 | |
| | | | | | | | | | | | |
|
NET ASSETS APPLICABLE TO COMMON SHAREHOLDERS CONSIST OF | |
Paid-in capital(e)(f)(g) | | $ | 168,134,858 | | | $ | 543,452,920 | | | $ | 289,451,564 | |
Accumulated earnings | | | 535,693 | | | | 17,996,334 | | | | 16,561,844 | |
| | | | | | | | | | | | |
NET ASSETS APPLICABLE TO COMMON SHAREHOLDERS | | $ | 168,670,551 | | | $ | 561,449,254 | | | $ | 306,013,408 | |
| | | | | | | | | | | | |
| | | |
Net asset value, offering and redemption price per share | | $ | 12.96 | | | $ | 14.66 | | | $ | 14.36 | |
| | | | | | | | | | | | |
| | | |
(a) Investments at cost — unaffiliated | | $ | 268,830,424 | | | $ | 916,409,182 | | | $ | 484,360,064 | |
(b) Investments at cost — affiliated | | $ | — | | | $ | 1,637,526 | | | $ | 3,341,590 | |
(c) Preferred Shares outstanding, par value $0.10 per share | | | 870 | | | | 2,871 | | | | 1,400 | |
(d) Preferred Shares authorized | | | 6,230 | | | | 15,671 | | | | 8,400 | |
(e) Par value per Common Share | | $ | 0.10 | | | $ | 0.10 | | | $ | 0.10 | |
(f) Common Shares outstanding | | | 13,018,276 | | | | 38,296,266 | | | | 21,305,383 | |
(g) Common Shares authorized | | | 199,993,770 | | | | 199,984,329 | | | | 199,991,600 | |
See notes to financial statements.
Statements of Operations (unaudited)
Six Months Ended October 31, 2018
| | | | | | | | | | | | | | | | |
| | | MUA | | | MEN | | | MHD | | | MUH | |
|
INVESTMENT INCOME | |
Interest — unaffiliated | | $ | 14,576,151 | | | $ | 12,369,820 | | | $ | 8,692,447 | | | $ | 6,570,042 | |
Dividends — affiliated | | | 21,981 | | | | 9,066 | | | | 22,334 | | | | 4,221 | |
| | | | | | | | | | | | | | | | |
Total investment income | | | 14,598,132 | | | | 12,378,886 | | | | 8,714,781 | | | | 6,574,263 | |
| | | | | | | | | | | | | | | | |
|
EXPENSES | |
Investment advisory | | | 1,607,255 | | | | 1,442,458 | | | | 1,045,098 | | | | 782,615 | |
Professional | | | 43,028 | | | | 45,662 | | | | 38,408 | | | | 33,206 | |
Accounting services | | | 41,810 | | | | 41,593 | | | | 30,020 | | | | 24,304 | |
Transfer agent | | | 28,731 | | | | 20,601 | | | | 13,630 | | | | 12,209 | |
Directors and Officer | | | 24,095 | | | | 16,198 | | | | 11,071 | | | | 8,140 | |
Registration | | | 7,062 | | | | 5,889 | | | | 4,835 | | | | 4,824 | |
Printing | | | 6,218 | | | | 5,376 | | | | 4,751 | | | | 4,374 | |
Custodian | | | 4,798 | | | | 6,879 | | | | 3,514 | | | | 3,332 | |
Rating agency | | | — | | | | 21,608 | | | | 21,599 | | | | 21,595 | |
Miscellaneous | | | 17,342 | | | | 10,311 | | | | 4,325 | | | | 3,691 | |
| | | | | | | | | | | | | | | | |
Total expenses excluding interest expense, fees and amortization of offering costs | | | 1,780,339 | | | | 1,616,575 | | | | 1,177,251 | | | | 898,290 | |
Interest expense, fees and amortization of offering costs(a) | | | 776,234 | | | | 2,553,118 | | | | 1,627,762 | | | | 1,237,567 | |
| | | | | | | | | | | | | | | | |
Total expenses | | | 2,556,573 | | | | 4,169,693 | | | | 2,805,013 | | | | 2,135,857 | |
Less fees waived and/or reimbursed by the Manager | | | (1,660 | ) | | | (620 | ) | | | (1,570 | ) | | | (323 | ) |
| | | | | | | | | | | | | | | | |
Total expenses after fees waived and/or reimbursed | | | 2,554,913 | | | | 4,169,073 | | | | 2,803,443 | | | | 2,135,534 | |
| | | | | | | | | | | | | | | | |
Net investment income | | | 12,043,219 | | | | 8,209,813 | | | | 5,911,338 | | | | 4,438,729 | |
| | | | | | | | | | | | | | | | |
|
REALIZED AND UNREALIZED GAIN (LOSS) | |
Net realized gain (loss) from: | |
Investments — unaffiliated | | | 1,885,092 | | | | (510,298 | ) | | | 144,235 | | | | (6,099 | ) |
Investments — affiliated | | | 267 | | | | 277 | | | | 24 | | | | 218 | |
Futures contracts | | | 242,334 | | | | 464,110 | | | | 221,664 | | | | 181,181 | |
| | | | | | | | | | | | | | | | |
| | | 2,127,693 | | | | (45,911 | ) | | | 365,923 | | | | 175,300 | |
| | | | | | | | | | | | | | | | |
Net change in unrealized appreciation (depreciation) on: | | | | | | | | | | | | | | | | |
Investments — unaffiliated | | | (9,221,704 | ) | | | (10,362,097 | ) | | | (6,233,782 | ) | | | (5,156,732 | ) |
Investments — affiliated | | | — | | | | — | | | | — | | | | — | |
Futures contracts | | | 162,091 | | | | 277,230 | | | | 135,314 | | | | 128,614 | |
| | | | | | | | | | | | | | | | |
| | | (9,059,613 | ) | | | (10,084,867 | ) | | | (6,098,468 | ) | | | (5,028,118 | ) |
| | | | | | | | | | | | | | | | |
Net realized and unrealized loss | | | (6,931,920 | ) | | | (10,130,778 | ) | | | (5,732,545 | ) | | | (4,852,818 | ) |
| | | | | | | | | | | | | | | | |
NET INCREASE (DECREASE) IN NET ASSETS APPLICABLE TO COMMON SHAREHOLDERS RESULTING FROM OPERATIONS | | $ | 5,111,299 | | | $ | (1,920,965 | ) | | $ | 178,793 | | | $ | (414,089 | ) |
| | | | | | | | | | | | | | | | |
| (a) | Related to TOB Trusts, VRDP Shares and/or VMTP Shares. |
See notes to financial statements.
| | |
| 74 | | 2018 BLACKROCK SEMI-ANNUAL REPORTTO SHAREHOLDERS |
Statements of Operations (unaudited) (continued)
Six Months Ended October 31, 2018
| | | | | | | | | | | | |
| | | MUS | | | MUI | | | MVT | |
|
INVESTMENT INCOME | |
Interest — unaffiliated | | $ | 6,130,387 | | | $ | 18,203,276 | | | $ | 11,945,158 | |
Dividends — affiliated | | | 14,894 | | | | 23,415 | | | | 39,652 | |
| | | | | | | | | | | | |
Total investment income | | | 6,145,281 | | | | 18,226,691 | | | | 11,984,810 | |
| | | | | | | | | | | | |
|
EXPENSES | |
Investment advisory | | | 788,235 | | | | 2,645,376 | | | | 1,294,020 | |
Professional | | | 35,660 | | | | 55,912 | | | | 41,720 | |
Accounting services | | | 24,216 | | | | 61,015 | | | | 38,453 | |
Transfer agent | | | 11,770 | | | | 24,302 | | | | 16,996 | |
Directors and Officer | | | 8,248 | | | | 9,381 | | | | 14,924 | |
Registration | | | 4,790 | | | | 7,512 | | | | 5,042 | |
Printing | | | 4,365 | | | | 6,655 | | | | 5,175 | |
Custodian | | | 4,174 | | | | 19,746 | | | | 4,481 | |
Rating agency | | | 21,600 | | | | 21,630 | | | | 21,607 | |
Miscellaneous | | | 6,155 | | | | 44,275 | | | | 7,071 | |
| | | | | | | | | | | | |
Total expenses excluding interest expense, fees and amortization of offering costs | | | 909,213 | | | | 2,895,804 | | | | 1,449,489 | |
Interest expense, fees and amortization of offering costs(a) | | | 1,293,424 | | | | 4,395,427 | | | | 2,303,311 | |
| | | | | | | | | | | | |
Total expenses | | | 2,202,637 | | | | 7,291,231 | | | | 3,752,800 | |
Less fees waived and/or reimbursed by the Manager | | | (50,278 | ) | | | (1,538 | ) | | | (3,093 | ) |
| | | | | | | | | | | | |
Total expenses after fees waived and/or reimbursed | | | 2,152,359 | | | | 7,289,693 | | | | 3,749,707 | |
| | | | | | | | | | | | |
Net investment income | | | 3,992,922 | | | | 10,936,998 | | | | 8,235,103 | |
| | | | | | | | | | | | |
|
REALIZED AND UNREALIZED GAIN (LOSS) | |
Net realized gain (loss) from: | |
Investments — unaffiliated | | | (21,534 | ) | | | (713,714 | ) | | | 600,839 | |
Investments — affiliated | | | 1,368 | | | | 35 | | | | 1,065 | |
Futures contracts | | | 158,324 | | | | 506,457 | | | | 261,633 | |
| | | | | | | | | | | | |
| | | 138,158 | | | | (207,222 | ) | | | 863,537 | |
| | | | | | | | | | | | |
Net change in unrealized appreciation (depreciation) on: | | | | | | | | | | | | |
Investments — unaffiliated | | | (5,064,210 | ) | | | (10,861,047 | ) | | | (9,400,328 | ) |
Investments — affiliated | | | — | | | | — | | | | 20 | |
Futures contracts | | | 68,524 | | | | 36,938 | | | | 171,276 | |
| | | | | | | | | | | | |
| | | (4,995,686 | ) | | | (10,824,109 | ) | | | (9,229,032 | ) |
| | | | | | | | | | | | |
Net realized and unrealized loss | | | (4,857,528 | ) | | | (11,031,331 | ) | | | (8,365,495 | ) |
| | | | | | | | | | | | |
NET DECREASE IN NET ASSETS APPLICABLE TO COMMON SHAREHOLDERS RESULTING FROM OPERATIONS | | $ | (864,606 | ) | | $ | (94,333 | ) | | $ | (130,392 | ) |
| | | | | | | | | | | | |
| (a) | Related to TOB Trusts and/or VMTP Shares. |
See notes to financial statements.
Statements of Changes in Net Assets
| | | | | | | | | | | | | | | | | | | | |
| | | MUA | | | | | | MEN | |
| | | Six Months Ended
10/31/18
(unaudited) | | | Year Ended
04/30/18 | | | | | | Six Months Ended
10/31/18
(unaudited) | | | Year Ended
04/30/18 | |
| | | | | |
INCREASE (DECREASE) IN NET ASSETS APPLICABLE TO COMMON SHAREHOLDERS | | | | | | | | | | | | | | | | | | | | |
| | | | | |
OPERATIONS | | | | | | | | | | | | | | | | | | | | |
Net investment income | | $ | 12,043,219 | | | $ | 24,585,086 | | | | | | | $ | 8,209,813 | | | $ | 17,481,665 | |
Net realized gain (loss) | | | 2,127,693 | | | | 3,861,385 | | | | | | | | (45,911 | ) | | | 1,316,883 | |
Net change in unrealized appreciation (depreciation) | | | (9,059,613 | ) | | | (6,115,970 | ) | | | | | | | (10,084,867 | ) | | | (8,990,694 | ) |
| | | | | | | | | | | | | | | | | | | | |
Net increase (decrease) in net assets applicable to Common Shareholders resulting from operations | | | 5,111,299 | | | | 22,330,501 | | | | | | | | (1,920,965 | ) | | | 9,807,854 | |
| | | | | | | | | | | | | | | | | | | | |
| | | | | |
DISTRIBUTIONS TO COMMON SHAREHOLDERS(a)(b) | | | | | | | | | | | | | | | | | | | | |
Decrease in net assets resulting from distributions to Common Shareholders | | | (11,774,522 | ) | | | (24,403,775 | ) | | | | | | | (8,548,265 | ) | | | (19,006,534 | ) |
| | | | | | | | | | | | | | | | | | | | |
| | | | | |
CAPITAL SHARE TRANSACTIONS | | | | | | | | | | | | | | | | | | | | |
Reinvestment of common distributions | | | — | | | | 1,238,029 | | | | | | | | — | | | | 447,450 | |
| | | | | | | | | | | | | | | | | | | | |
| | | | | |
NET ASSETS APPLICABLE TO COMMON SHAREHOLDERS(b) | | | | | | | | | | | | | | | | | | | | |
Total decrease in net assets applicable to Common Shareholders | | | (6,663,223 | ) | | | (835,245 | ) | | | | | | | (10,469,230 | ) | | | (8,751,230 | ) |
Beginning of period | | | 504,470,448 | | | | 505,305,693 | | | | | | | | 340,286,034 | | | | 349,037,264 | |
| | | | | | | | | | | | | | | | | | | | |
End of period | | $ | 497,807,225 | | | $ | 504,470,448 | | | | | | | $ | 329,816,804 | | | $ | 340,286,034 | |
| | | | | | | | | | | | | | | | | | | | |
| (a) | Distributions for annual periods determined in accordance with U.S. federal income tax regulations. |
| (b) | Prior year distribution character information and undistributed net investment income has been modified or removed to conform with current year Regulation S-X presentation changes. Refer to Note 11 for this prior year information. |
See notes to financial statements.
| | |
| 76 | | 2018 BLACKROCK SEMI-ANNUAL REPORTTO SHAREHOLDERS |
Statements of Changes in Net Assets (continued)
| | | | | | | | | | | | | | | | | | | | |
| | | MHD | | | | | | MUH | |
| | | Six Months Ended
10/31/18
(unaudited) | | | Year Ended
04/30/18 | | | | | | Six Months Ended
10/31/18
(unaudited) | | | Year Ended
04/30/18 | |
| | |
INCREASE (DECREASE) IN NET ASSETS APPLICABLE TO COMMON SHAREHOLDERS | | | | | | | | | |
| | |
OPERATIONS | | | | | | | | | |
Net investment income | | $ | 5,911,338 | | | $ | 12,456,818 | | | | | | | $ | 4,438,729 | | | $ | 9,097,811 | |
Net realized gain | | | 365,923 | | | | 275,314 | | | | | | | | 175,300 | | | | 349,549 | |
Net change in unrealized appreciation (depreciation) | | | (6,098,468 | ) | | | (5,682,277 | ) | | | | | | | (5,028,118 | ) | | | (4,335,638 | ) |
| | | | | | | | | | | | | | | | | | | | |
Net increase (decrease) in net assets applicable to Common Shareholders resulting from operations | | | 178,793 | | | | 7,049,855 | | | | | | | | (414,089 | ) | | | 5,111,722 | |
| | | | | | | | | | | | | | | | | | | | |
| | |
DISTRIBUTIONS TO COMMON SHAREHOLDERS(a)(b) | | | | | | | | | |
Decrease in net assets resulting from distributions to Common Shareholders | | | (5,960,308 | ) | | | (13,224,063 | ) | | | | | | | (4,319,123 | ) | | | (9,693,560 | ) |
| | | | | | | | | | | | | | | | | | | | |
| | |
CAPITAL SHARE TRANSACTIONS | | | | | | | | | |
Reinvestment of common distributions | | | — | | | | 411,605 | | | | | | | | — | | | | 290,507 | |
| | | | | | | | | | | | | | | | | | | | |
| | |
NET ASSETS APPLICABLE TO COMMON SHAREHOLDERS(b) | | | | | | | | | |
Total decrease in net assets applicable to Common Shareholders | | | (5,781,515 | ) | | | (5,762,603 | ) | | | | | | | (4,733,212 | ) | | | (4,291,331 | ) |
Beginning of period | | | 232,921,360 | | | | 238,683,963 | | | | | | | | 171,345,714 | | | | 175,637,045 | |
| | | | | | | | | | | | | | | | | | | | |
End of period | | $ | 227,139,845 | | | $ | 232,921,360 | | | | | | | $ | 166,612,502 | | | $ | 171,345,714 | |
| | | | | | | | | | | | | | | | | | | | |
| (a) | Distributions for annual periods determined in accordance with U.S. federal income tax regulations. |
| (b) | Prior year distribution character information and undistributed net investment income has been modified or removed to conform with current year Regulation S-X presentation changes. Refer to Note 11 for this prior year information. |
See notes to financial statements.
Statements of Changes in Net Assets (continued)
| | | | | | | | | | | | | | | | | | | | |
| | | MUS | | | | | | MUI | |
| | | Six Months Ended
10/31/18 (unaudited) | | | Year Ended 04/30/18 | | | | | | Six Months Ended
10/31/18
(unaudited) | | | Year Ended
04/30/18 | |
| | | | | |
INCREASE (DECREASE) IN NET ASSETS APPLICABLE TO COMMON SHAREHOLDERS | | | | | | | | | | | | | | | | | | | | |
| | |
OPERATIONS | | | | | | | | | |
Net investment income | | $ | 3,992,922 | | | $ | 9,174,345 | | | | | | | $ | 10,936,998 | | | $ | 22,724,306 | |
Net realized gain (loss) | | | 138,158 | | | | 291,275 | | | | | | | | (207,222 | ) | | | 2,650,231 | |
Net change in unrealized appreciation (depreciation) | | | (4,995,686 | ) | | | (7,382,682 | ) | | | | | | | (10,824,109 | ) | | | (11,610,455 | ) |
| | | | | | | | | | | | | | | | | | | | |
Net increase (decrease) in net assets applicable to Common Shareholders resulting from operations | | | (864,606 | ) | | | 2,082,938 | | | | | | | | (94,333 | ) | | | 13,764,082 | |
| | | | | | | | | | | | | | | | | | | | |
| | |
DISTRIBUTIONS TO COMMON SHAREHOLDERS(a)(b) | | | | | | | | | |
Decrease in net assets resulting from distributions to Common Shareholders | | | (4,283,013 | ) | | | (9,919,384 | ) | | | | | | | (10,225,103 | ) | | | (22,940,382 | ) |
| | | | | | | | | | | | | | | | | | | | |
| | |
CAPITAL SHARE TRANSACTIONS | | | | | | | | | |
Reinvestment of common distributions | | | — | | | | 40,885 | | | | | | | | — | | | | — | |
| | | | | | | | | | | | | | | | | | | | |
| | |
NET ASSETS APPLICABLE TO COMMON SHAREHOLDERS(b) | | | | | | | | | |
Total decrease in net assets applicable to Common Shareholders | | | (5,147,619 | ) | | | (7,795,561 | ) | | | | | | | (10,319,436 | ) | | | (9,176,300 | ) |
Beginning of period | | | 173,818,170 | | | | 181,613,731 | | | | | | | | 571,768,690 | | | | 580,944,990 | |
| | | | | | | | | | | | | | | | | | | | |
End of period | | $ | 168,670,551 | | | $ | 173,818,170 | | | | | | | $ | 561,449,254 | | | $ | 571,768,690 | |
| | | | | | | | | | | | | | | | | | | | |
| (a) | Distributions for annual periods determined in accordance with U.S. federal income tax regulations. |
| (b) | Prior year distribution character information and undistributed net investment income has been modified or removed to conform with current year Regulation S-X presentation changes. Refer to Note 11 for this prior year information. |
See notes to financial statements.
| | |
| 78 | | 2018 BLACKROCK SEMI-ANNUAL REPORTTO SHAREHOLDERS |
Statements of Changes in Net Assets (continued)
| | | | | | | | |
| | | MVT | |
| | | Six Months Ended
10/31/18
(unaudited) | | | Year Ended
04/30/18 | |
|
INCREASE (DECREASE) IN NET ASSETS APPLICABLE TO COMMON SHAREHOLDERS | |
|
OPERATIONS | |
Net investment income | | $ | 8,235,103 | | | $ | 17,559,402 | |
Net realized gain | | | 863,537 | | | | 910,384 | |
Net change in unrealized appreciation (depreciation) | | | (9,229,032 | ) | | | (9,581,981 | ) |
| | | | | | | | |
Net increase (decrease) in net assets applicable to Common Shareholders resulting from operations | | | (130,392 | ) | | | 8,887,805 | |
| | | | | | | | |
|
DISTRIBUTIONS TO COMMON SHAREHOLDERS(a)(b) | |
Decrease in net assets resulting from distributions to Common Shareholders | | | (8,117,351 | ) | | | (18,273,763 | ) |
| | | | | | | | |
|
CAPITAL SHARE TRANSACTIONS | |
Reinvestment of common distributions | | | — | | | | 1,708,157 | |
| | | | | | | | |
|
NET ASSETS APPLICABLE TO COMMON SHAREHOLDERS(b) | |
Total decrease in net assets applicable to Common Shareholders | | | (8,247,743 | ) | | | (7,677,801 | ) |
Beginning of period | | | 314,261,151 | | | | 321,938,952 | |
| | | | | | | | |
End of period | | $ | 306,013,408 | | | $ | 314,261,151 | |
| | | | | | | | |
| (a) | Distributions for annual periods determined in accordance with U.S. federal income tax regulations. |
| (b) | Prior year distribution character information and undistributed net investment income has been modified or removed to conform with current year Regulation S-X presentation changes. Refer to Note 11 for this prior year information. |
See notes to financial statements.
Statements of Cash Flows (unaudited)
Six Months Ended October 31, 2018
| | | | | | | | | | | | | | | | |
| | | MUA | | | MEN | | | MHD | | | MUH | |
|
CASH PROVIDED BY (USED FOR) OPERATING ACTIVITIES | |
Net increase (decrease) in net assets resulting from operations | | $ | 5,111,299 | | | $ | (1,920,965 | ) | | $ | 178,793 | | | $ | (414,089 | ) |
Adjustments to reconcile net increase (decrease) in net assets resulting from operations to net cash provided by (used for) operating activities: | | | | | | | | | | | | | | | | |
Proceeds from sales of long-term investments | | | 50,281,529 | | | | 68,322,776 | | | | 27,257,485 | | | | 36,444,129 | |
Purchases of long-term investments | | | (51,340,502 | ) | | | (72,827,729 | ) | | | (23,218,732 | ) | | | (43,193,368 | ) |
Net proceeds from sales (purchases) of short-term securities | | | (884,709 | ) | | | (2,883,184 | ) | | | (2,470,195 | ) | | | (483,564 | ) |
Amortization of premium and accretion of discount on investments and other fees | | | 196,946 | | | | (92,904 | ) | | | 170,845 | | | | 23,802 | |
Net realized (gain) loss on investments | | | (1,885,359 | ) | | | 510,021 | | | | (144,259 | ) | | | 5,881 | |
Net unrealized appreciation on investments | | | 9,221,704 | | | | 10,362,097 | | | | 6,233,782 | | | | 5,156,732 | |
| (Increase) Decrease in Assets: | | | | | | | | | | | | |
Receivables: | | | | | | | | | | | | | | | | |
Interest — unaffiliated | | | (132,715 | ) | | | 61,617 | | | | 233,984 | | | | 85,813 | |
Dividends — affiliated | | | (3,009 | ) | | | (1,573 | ) | | | (6,988 | ) | | | 830 | |
Variation margin on futures contracts | | | (54,813 | ) | | | (88,000 | ) | | | (40,929 | ) | | | (35,906 | ) |
Prepaid expenses | | | 13,678 | | | | 54,676 | | | | 4,589 | | | | 3,733 | |
Other assets | | | 374 | | | | 2,408 | | | | 617 | | | | 657 | |
| Increase (Decrease) in Liabilities: | | | | | | | | | | | | |
Payables: | | | | | | | | | | | | | | | | |
Investment advisory fees | | | 8,838 | | | | 7,640 | | | | 1,345 | | | | 5,958 | |
Interest expense and fees | | | 59,245 | | | | 73,835 | | | | 17,103 | | | | 60,975 | |
Directors’ and Officer’s | | | 157 | | | | 83 | | | | 49 | | | | 36 | |
Variation margin on futures contracts | | | (36,531 | ) | | | (75,719 | ) | | | (33,125 | ) | | | (25,875 | ) |
Other accrued expenses | | | 9,038 | | | | 4,958 | | | | (7,828 | ) | | | (7,536 | ) |
| | | | | | | | | | | | | | | | |
Net cash provided by (used for) operating activities | | | 10,565,170 | | | | 1,510,037 | | | | 8,176,536 | | | | (2,371,792 | ) |
| | | | | | | | | | | | | | | | |
| | | | |
CASH PROVIDED BY (USED FOR) FINANCING ACTIVITIES | | | | | | | | | | | | | | | | |
Proceeds from TOB Trust Certificates | | | 8,749,297 | | | | 11,057,697 | | | | 7,951,758 | | | | 12,407,277 | |
Repayments of TOB Trust Certificates | | | (7,500,000 | ) | | | (3,579,715 | ) | | | (10,166,247 | ) | | | (5,631,076 | ) |
Cash dividends paid to Common Shareholders | | | (11,774,521 | ) | | | (8,548,265 | ) | | | (5,960,308 | ) | | | (4,387,141 | ) |
Increase (decrease) in bank overdraft | | | — | | | | (395,816 | ) | | | — | | | | — | |
Amortization of deferred offering costs | | | — | | | | (42,531 | ) | | | — | | | | — | |
| | | | | | | | | | | | | | | | |
Net cash (provided by) used for financing activities | | | (10,525,224 | ) | | | (1,508,630 | ) | | | (8,174,797 | ) | | | 2,389,060 | |
| | | | | | | | | | | | | | | | |
| | | | |
CASH | | | | | | | | | | | | | | | | |
Net increase in restricted and unrestricted cash and foreign currency | | | 39,946 | | | | 1,407 | | | | 1,739 | | | | 17,268 | |
Restricted and unrestricted cash and foreign currency at beginning of period | | | 154,950 | | | | 310,900 | | | | 143,319 | | | | 109,831 | |
| | | | | | | | | | | | | | | | |
Restricted and unrestricted cash and foreign currency at end of period | | $ | 194,896 | | | $ | 312,307 | | | $ | 145,058 | | | $ | 127,099 | |
| | | | | | | | | | | | | | | | |
| | | | |
SUPPLEMENTAL DISCLOSURE OF CASH FLOW INFORMATION | | | | | | | | | | | | | | | | |
Cash paid during the period for interest expense | | $ | 716,989 | | | $ | 2,479,283 | | | $ | 1,610,659 | | | $ | 1,176,592 | |
| | | | | | | | | | | | | | | | |
| | | | |
RECONCILIATION OF RESTRICTED AND UNRESTRICTED CASH AT THE END OF PERIOD TO THE STATEMENTS OF ASSETS AND LIABILITIES | | | | | | | | | | | | | | | | |
Cash | | $ | 29,946 | | | $ | 48,407 | | | $ | 22,508 | | | $ | 19,899 | |
Cash pledged: | |
Futures contracts | | | 164,950 | | | | 263,900 | | | | 122,550 | | | | 107,200 | |
| | | | | | | | | | | | | | | | |
| | $ | 194,896 | | | $ | 312,307 | | | $ | 145,058 | | | $ | 127,099 | |
| | | | | | | | | | | | | | | | |
| | | | |
RECONCILIATION OF RESTRICTED AND UNRESTRICTED CASH AT THE BEGINNING OF PERIOD TO THE STATEMENTS OF ASSETS AND LIABILITIES | | | | | | | | | | | | | | | | |
Cash | | $ | — | | | $ | — | | | $ | 7,769 | | | $ | 5,631 | |
Cash pledged: | |
Futures contracts | | | 154,950 | | | | 310,900 | | | | 135,550 | | | | 104,200 | |
| | | | | | | | | | | | | | | | |
| | $ | 154,950 | | | $ | 310,900 | | | $ | 143,319 | | | $ | 109,831 | |
| | | | | | | | | | | | | | | | |
See notes to financial statements.
| | |
| 80 | | 2018 BLACKROCK SEMI-ANNUAL REPORTTO SHAREHOLDERS |
Statements of Cash Flows (unaudited) (continued)
Six Months Ended October 31, 2018
| | | | | | | | | | | | |
| | | MUS | | | MUI | | | MVT | |
| | | |
CASH PROVIDED BY OPERATING ACTIVITIES | | | | | | | | | | | | |
Net decrease in net assets resulting from operations | | $ | (864,606 | ) | | $ | (94,333 | ) | | $ | (130,392 | ) |
Adjustments to reconcile net decrease in net assets resulting from operations to net cash provided by operating activities: | | | | | | | | | | | | |
Proceeds from sales of long-term investments | | | 45,476,874 | | | | 150,273,905 | | | | 42,083,514 | |
Purchases of long-term investments | | | (44,467,680 | ) | | | (158,688,300 | ) | | | (41,524,970 | ) |
Net proceeds from sales (purchases) of short-term securities | | | 2,823,589 | | | | (1,637,491 | ) | | | (2,354,221 | ) |
Amortization of premium and accretion of discount on investments and other fees | | | 729,124 | | | | 3,475,352 | | | | 615,162 | |
Net realized (gain) loss on investments | | | 20,166 | | | | 713,679 | | | | (601,904 | ) |
Net unrealized appreciation on investments | | | 5,064,210 | | | | 10,861,047 | | | | 9,400,308 | |
| (Increase) Decrease in Assets: | | | | | | | | | |
Receivables: | | | | | | | | | | | | |
Interest — unaffiliated | | | (22,693 | ) | | | (419,849 | ) | | | 347,246 | |
Dividends — affiliated | | | (1,091 | ) | | | 486 | | | | (2,256 | ) |
Variation margin on futures contracts | | | (31,281 | ) | | | (84,436 | ) | | | (51,094 | ) |
Prepaid expenses | | | 3,766 | | | | 11,889 | | | | 5,882 | |
Other assets | | | 398 | | | | 2,879 | | | | 2,609 | |
| Increase (Decrease) in Liabilities: | | | | | | | | | |
Payables: | | | | | | | | | | | | |
Investment advisory fees | | | 95 | | | | 14,160 | | | | 4,106 | |
Interest expense and fees | | | (16,080 | ) | | | 100,629 | | | | 17,710 | |
Directors’ and Officer’s | | | 47 | | | | (9,168 | ) | | | 75 | |
Variation margin on futures contracts | | | (21,000 | ) | | | (56,625 | ) | | | (37,406 | ) |
Other accrued expenses | | | (6,775 | ) | | | 53,209 | | | | (2,940 | ) |
| | | | | | | | | | | | |
Net cash provided by operating activities | | | 8,687,063 | | | | 4,517,033 | | | | 7,771,429 | |
| | | | | | | | | | | | |
| | | |
CASH USED FOR FINANCING ACTIVITIES | | | | | | | | | | | | |
Proceeds from TOB Trust Certificates | | | 2,777,274 | | | | 27,999,998 | | | | 9,943,814 | |
Repayments of TOB Trust Certificates | | | (7,129,130 | ) | | | (21,066,337 | ) | | | (9,572,765 | ) |
Cash dividends paid to Common Shareholders | | | (4,452,251 | ) | | | (10,225,103 | ) | | | (8,117,345 | ) |
Increase (decrease) in bank overdraft | | | 99,152 | | | | (1,152,799 | ) | | | — | |
| | | | | | | | | | | | |
Net cash used for financing activities | | | (8,704,955 | ) | | | (4,444,241 | ) | | | (7,746,296 | ) |
| | | | | | | | | | | | |
| | | |
CASH | | | | | | | | | | | | |
Net increase (decrease) in restricted and unrestricted cash and foreign currency | | | (17,892 | ) | | | 72,792 | | | | 25,133 | |
Restricted and unrestricted cash and foreign currency at beginning of period | | | 112,042 | | | | 314,900 | | | | 156,050 | |
| | | | | | | | | | | | |
Restricted and unrestricted cash and foreign currency at end of period | | $ | 94,150 | | | $ | 387,692 | | | $ | 181,183 | |
| | | | | | | | | | | | |
| | | |
SUPPLEMENTAL DISCLOSURE OF CASH FLOW INFORMATION | | | | | | | | | | | | |
Cash paid during the period for interest expense | | $ | 1,309,504 | | | $ | 4,294,798 | | | $ | 2,285,601 | |
| | | | | | | | | | | | |
| | | |
RECONCILIATION OF RESTRICTED AND UNRESTRICTED CASH AT THE END OF PERIOD TO THE STATEMENTS OF ASSETS AND LIABILITIES | | | | | | | | | | | | |
Cash | | $ | — | | | $ | 129,792 | | | $ | 28,133 | |
Cash pledged: | |
Futures contracts | | | 94,150 | | | | 257,900 | | | | 153,050 | |
| | | | | | | | | | | | |
| | $ | 94,150 | | | $ | 387,692 | | | $ | 181,183 | |
| | | | | | | | | | | | |
| | | |
RECONCILIATION OF RESTRICTED AND UNRESTRICTED CASH AT THE BEGINNING OF PERIOD TO THE STATEMENTS OF ASSETS AND LIABILITIES | | | | | | | | | | | | |
Cash | | $ | 16,892 | | | $ | — | | | $ | — | |
Cash pledged: | |
Futures contracts | | | 95,150 | | | | 314,900 | | | | 156,050 | |
| | | | | | | | | | | | |
| | $ | 112,042 | | | $ | 314,900 | | | $ | 156,050 | |
| | | | | | | | | | | | |
See notes to financial statements.
Financial Highlights
(For a share outstanding throughout each period)
| | | | | | | | | | | | | | | | | | | | | | | | | | | | |
| | | MUA | |
| | | Six Months Ended
10/31/18
(unaudited) | | | | | | Year Ended April 30, | |
| | | | | | 2018 | | | 2017 | | | 2016 | | | 2015 | | | 2014 | |
Net asset value, beginning of period | | $ | 14.01 | | | | | | | $ | 14.07 | | | $ | 14.45 | | | $ | 14.12 | | | $ | 13.56 | | | $ | 14.36 | |
| | | | | | | | | | | | | | | | | | | | | | | | | | | | |
Net investment income(a) | | | 0.33 | | | | | | | | 0.68 | | | | 0.70 | | | | 0.72 | | | | 0.73 | | | | 0.77 | |
Net realized and unrealized gain (loss) | | | (0.18 | ) | | | | | | | (0.06 | ) | | | (0.38 | ) | | | 0.35 | | | | 0.59 | | | | (0.82 | ) |
| | | | | | | | | | | | | | | | | | | | | | | | | | | | |
Net increase (decrease) from investment operations | | | 0.15 | | | | | | | | 0.62 | | | | 0.32 | | | | 1.07 | | | | 1.32 | | | | (0.05 | ) |
| | | | | | | | | | | | | | | | | | | | | | | | | | | | |
Distributions to Common Shareholders from net investment income(b) | | | (0.33 | ) | | | | | | | (0.68 | ) | | | (0.70 | ) | | | (0.74 | ) | | | (0.76 | ) | | | (0.75 | ) |
| | | | | | | | | | | | | | | | | | | | | | | | | | | | |
Net asset value, end of period | | $ | 13.83 | | | | | | | $ | 14.01 | | | $ | 14.07 | | | $ | 14.45 | | | $ | 14.12 | | | $ | 13.56 | |
| | | | | | | | | | | | | | | | | | | | | | | | | | | | |
Market price, end of period | | $ | 12.65 | | | | | | | $ | 13.21 | | | $ | 14.82 | | | $ | 14.74 | | | $ | 14.22 | | | $ | 12.85 | |
| | | | | | | | | | | | | | | | | | | | | | | | | | | | |
| | | | | | | |
Total Return Applicable to Common Shareholders(c) | | | | | | | | | | | | | | | | | | | | | | | | | | | | |
Based on net asset value | | | 1.19 | %(d) | | | | | | | 4.47 | % | | | 2.23 | % | | | 7.90 | % | | | 10.11 | % | | | 0.47 | % |
| | | | | | | | | | | | | | | | | | | | | | | | | | | | |
Based on market price | | | (1.84 | )%(d) | | | | | | | (6.48 | )% | | | 5.56 | % | | | 9.30 | % | | | 17.02 | % | | | (2.06 | )% |
| | | | | | | | | | | | | | | | | | | | | | | | | | | | |
| | | | | | | |
Ratios to Average Net Assets Applicable to Common Shareholders | | | | | | | | | | | | | | | | | | | | | | | | | | | | |
Total expenses | | | 1.00 | %(e) | | | | | | | 0.93 | % | | | 0.87 | % | | | 0.81 | % | | | 0.82 | % | | | 0.82 | % |
| | | | | | | | | | | | | | | | | | | | | | | | | | | | |
Total expenses after fees waived and/or reimbursed and paid indirectly | | | 1.00 | %(e) | | | | | | | 0.93 | % | | | 0.87 | % | | | 0.81 | % | | | 0.82 | % | | | 0.82 | % |
| | | | | | | | | | | | | | | | | | | | | | | | | | | | |
Total expenses after fees waived and/or reimbursed and paid indirectly and excluding interest expense, fees and amortization of offering costs(f) | | | 0.70 | %(e) | | | | | | | 0.69 | % | | | 0.69 | % | | | 0.70 | % | | | 0.71 | % | | | 0.70 | % |
| | | | | | | | | | | | | | | | | | | | | | | | | | | | |
Net investment income to Common Shareholders | | | 4.73 | %(e) | | | | | | | 4.83 | % | | | 4.93 | % | | | 5.09 | % | | | 5.24 | % | | | 5.84 | % |
| | | | | | | | | | | | | | | | | | | | | | | | | | | | |
| | | | | | | |
Supplemental Data | | | | | | | | | | | | | | | | | | | | | | | | | | | | |
Net assets applicable to Common Shareholders, end of period (000) | | $ | 497,807 | | | | | | | $ | 504,470 | | | $ | 505,306 | | | $ | 517,697 | | | $ | 505,341 | | | $ | 485,319 | |
| | | | | | | | | | | | | | | | | | | | | | | | | | | | |
Borrowings outstanding, end of period (000) | | $ | 71,659 | | | | | | | $ | 71,925 | | | $ | 67,507 | | | $ | 66,087 | | | $ | 61,066 | | | $ | 71,145 | |
| | | | | | | | | | | | | | | | | | | | | | | | | | | | |
Portfolio turnover rate | | | 9 | % | | | | | | | 15 | % | | | 11 | % | | | 18 | % | | | 22 | % | | | 19 | % |
| | | | | | | | | | | | | | | | | | | | | | | | | | | | |
| (a) | Based on average Common Shares outstanding. |
| (b) | Distributions for annual periods determined in accordance with U.S. federal income tax regulations. |
| (c) | Total returns based on market price, which can be significantly greater or less than the net asset value, may result in substantially different returns. Where applicable, excludes the effects of any sales charges and assumes the reinvestment of distributions at actual reinvestment prices. |
| (d) | Aggregate total return. |
| (f) | Interest expense and fees relate to TOB Trusts. See Note 4 of the Notes to Financial Statements for details. |
See notes to financial statements.
| | |
| 82 | | 2018 BLACKROCK SEMI-ANNUAL REPORTTO SHAREHOLDERS |
Financial Highlights (continued)
(For a share outstanding throughout each period)
| | | | | | | | | | | | | | | | | | | | | | | | | | | | |
| | | MEN | |
| | | Six Months Ended
10/31/18
(unaudited) | | | | | | Year Ended April 30, | |
| | | | | | 2018 | | | 2017 | | | 2016 | | | 2015 | | | 2014 | |
Net asset value, beginning of period | | $ | 11.46 | | | | | | | $ | 11.77 | | | $ | 12.52 | | | $ | 12.27 | | | $ | 11.94 | | | $ | 12.63 | |
| | | | | | | | | | | | | | | | | | | | | | | | | | | | |
Net investment income(a) | | | 0.28 | | | | | | | | 0.59 | | | | 0.65 | | | | 0.70 | | | | 0.71 | | | | 0.73 | |
Net realized and unrealized gain (loss) | | | (0.34 | ) | | | | | | | (0.26 | ) | | | (0.72 | ) | | | 0.28 | | | | 0.35 | | | | (0.70 | ) |
| | | | | | | | | | | | | | | | | | | | | | | | | | | | |
Net increase (decrease) from investment operations | | | (0.06 | ) | | | | | | | 0.33 | | | | (0.07 | ) | | | 0.98 | | | | 1.06 | | | | 0.03 | |
| | | | | | | | | | | | | | | | | | | | | | | | | | | | |
Distributions to Common Shareholders from net investment income(b) | | | (0.29 | ) | | | | | | | (0.64 | ) | | | (0.68 | ) | | | (0.73 | ) | | | (0.73 | ) | | | (0.72 | ) |
| | | | | | | | | | | | | | | | | | | | | | | | | | | | |
Net asset value, end of period | | $ | 11.11 | | | | | | | $ | 11.46 | | | $ | 11.77 | | | $ | 12.52 | | | $ | 12.27 | | | $ | 11.94 | |
| | | | | | | | | | | | | | | | | | | | | | | | | | | | |
Market price, end of period | | $ | 9.69 | | | | | | | $ | 10.48 | | | $ | 11.69 | | | $ | 12.55 | | | $ | 11.67 | | | $ | 11.27 | |
| | | | | | | | | | | | | | | | | | | | | | | | | | | | |
| | | | | | | |
Total Return Applicable to Common Shareholders(c) | | | | | | | | | | | | | | | | | | | | | | | | | | | | |
Based on net asset value | | | (0.30 | )%(d) | | | | | | | 2.93 | % | | | (0.51 | )% | | | 8.50 | % | | | 9.49 | % | | | 1.06 | % |
| | | | | | | | | | | | | | | | | | | | | | | | | | | | |
Based on market price | | | (4.92 | )%(d) | | | | | | | (5.23 | )% | | | (1.42 | )% | | | 14.35 | % | | | 10.33 | % | | | (4.76 | )% |
| | | | | | | | | | | | | | | | | | | | | | | | | | | | |
| | | | | | | |
Ratios to Average Net Assets Applicable to Common Shareholders | | | | | | | | | | | | | | | | | | | | | | | | | | | | |
Total expenses | | | 2.43 | %(e) | | | | | | | 2.06 | % | | | 1.73 | % | | | 1.44 | % | | | 1.44 | % | | | 1.50 | % |
| | | | | | | | | | | | | | | | | | | | | | | | | | | | |
Total expenses after fees waived and/or reimbursed and paid indirectly | | | 2.43 | %(e) | | | | | | | 2.06 | % | | | 1.73 | % | | | 1.44 | % | | | 1.43 | % | | | 1.50 | % |
| | | | | | | | | | | | | | | | | | | | | | | | | | | | |
Total expenses after fees waived and/or reimbursed and paid indirectly and excluding interest expense and fees, and amortization of offering costs(f) | | | 0.94 | %(e) | | | | | | | 0.92 | % | | | 0.89 | % | | | 0.90 | % | | | 0.91 | % | | | 0.92 | % |
| | | | | | | | | | | | | | | | | | | | | | | | | | | | |
Net investment income to Common Shareholders | | | 4.79 | %(e) | | | | | | | 4.97 | % | | | 5.29 | % | | | 5.71 | % | | | 5.76 | % | | | 6.37 | % |
| | | | | | | | | | | | | | | | | | | | | | | | | | | | |
| | | | | | | |
Supplemental Data | | | | | | | | | | | | | | | | | | | | | | | | | | | | |
Net assets applicable to Common Shareholders, end of period (000) | | $ | 329,817 | | | | | | | $ | 340,286 | | | $ | 349,037 | | | $ | 370,342 | | | $ | 362,703 | | | $ | 352,878 | |
| | | | | | | | | | | | | | | | | | | | | | | | | | | | |
VRDP Shares outstanding at $100,000 liquidation value, end of period (000) | | $ | 142,500 | | | | | | | $ | 142,500 | | | $ | 142,500 | | | $ | 142,500 | | | $ | 142,500 | | | $ | 142,500 | |
| | | | | | | | | | | | | | | | | | | | | | | | | | | | |
Asset coverage per VRDP Shares at $100,000 liquidation value, end of period | | $ | 331,450 | | | | | | | $ | 338,797 | | | $ | 344,938 | | | $ | 359,889 | | | $ | 354,528 | | | $ | 347,633 | |
| | | | | | | | | | | | | | | | | | | | | | | | | | | | |
Borrowings outstanding, end of period (000) | | $ | 91,588 | | | | | | | $ | 87,395 | | | $ | 70,823 | | | $ | 67,160 | | | $ | 76,094 | | | $ | 73,379 | |
| | | | | | | | | | | | | | | | | | | | | | | | | | | | |
Portfolio turnover rate | | | 12 | % | | | | | | | 21 | % | | | 12 | % | | | 10 | % | | | 12 | % | | | 16 | % |
| | | | | | | | | | | | | | | | | | | | | | | | | | | | |
| (a) | Based on average Common Shares outstanding. |
| (b) | Distributions for annual periods determined in accordance with U.S. federal income tax regulations. |
| (c) | Total returns based on market price, which can be significantly greater or less than the net asset value, may result in substantially different returns. Where applicable, excludes the effects of any sales charges and assumes the reinvestment of distributions at actual reinvestment prices. |
| (d) | Aggregate total return. |
| (f) | Interest expense, fees and amortization of offering costs related to TOB Trusts and/or VRDP Shares. See Note 4 and Note 10 of the Notes to Financial Statements for details. |
See notes to financial statements.
Financial Highlights (continued)
(For a share outstanding throughout each period)
| | | | | | | | | | | | | | | | | | | | | | | | | | | | |
| | | MHD | |
| | | Six Months Ended
10/31/18
(unaudited) | | | | | | Year Ended April 30, | |
| | | | | | 2018 | | | 2017 | | | 2016 | | | 2015 | | | 2014 | |
Net asset value, beginning of period | | $ | 16.41 | | | | | | | $ | 16.85 | | | $ | 17.95 | | | $ | 17.59 | | | $ | 16.85 | | | $ | 18.12 | |
| | | | | | | | | | | | | | | | | | | | | | | | | | | | |
Net investment income(a) | | | 0.42 | | | | | | | | 0.88 | | | | 0.95 | | | | 1.00 | | | | 1.03 | | | | 1.04 | |
Net realized and unrealized gain (loss) | | | (0.40 | ) | | | | | | | (0.39 | ) | | | (1.07 | ) | | | 0.42 | | | | 0.77 | | | | (1.22 | ) |
| | | | | | | | | | | | | | | | | | | | | | | | | | | | |
Net increase (decrease) from investment operations | | | 0.02 | | | | | | | | 0.49 | | | | (0.12 | ) | | | 1.42 | | | | 1.80 | | | | (0.18 | ) |
| | | | | | | | | | | | | | | | | | | | | | | | | | | | |
| Distributions to Common Shareholders(b) | | | | | | | | | | | | | | | | | | | | | |
From net investment income | | | (0.42 | ) | | | | | | | (0.92 | ) | | | (0.98 | ) | | | (1.06 | ) | | | (1.06 | ) | | | (1.08 | ) |
From net realized gain | | | — | | | | | | | | (0.01 | ) | | | — | | | | — | | | | — | | | | (0.01 | ) |
| | | | | | | | | | | | | | | | | | | | | | | | | | | | |
Total distributions to Common Shareholders | | | (0.42 | ) | | | | | | | (0.93 | ) | | | (0.98 | ) | | | (1.06 | ) | | | (1.06 | ) | | | (1.09 | ) |
| | | | | | | | | | | | | | | | | | | | | | | | | | | | |
Net asset value, end of period | | $ | 16.01 | | | | | | | $ | 16.41 | | | $ | 16.85 | | | $ | 17.95 | | | $ | 17.59 | | | $ | 16.85 | |
| | | | | | | | | | | | | | | | | | | | | | | | | | | | |
Market price, end of period | | $ | 14.03 | | | | | | | $ | 14.98 | | | $ | 16.65 | | | $ | 18.14 | | | $ | 17.25 | | | $ | 16.01 | |
| | | | | | | | | | | | | | | | | | | | | | | | | | | | |
| | | | | | | |
Total Return Applicable to Common Shareholders(c) | | | | | | | | | | | | | | | | | | | | | | | | | | | | |
Based on net asset value | | | 0.28 | %(d) | | | | | | | 3.07 | % | | | (0.67 | )% | | | 8.65 | % | | | 11.22 | % | | | (0.15 | )% |
| | | | | | | | | | | | | | | | | | | | | | | | | | | | |
Based on market price | | | (3.73 | )%(d) | | | | | | | (4.79 | )% | | | (2.87 | )% | | | 11.91 | % | | | 14.80 | % | | | (5.55 | )% |
| | | | | | | | | | | | | | | | | | | | | | | | | | | | |
| | | | | | | |
Ratios to Average Net Assets Applicable to Common Shareholders | | | | | | | | | | | | | | | | | | | | | | | | | | | | |
Total expenses | | | 2.39 | %(e) | | | | | | | 2.16 | % | | | 1.87 | % | | | 1.53 | % | | | 1.50 | % | | | 1.64 | % |
| | | | | | | | | | | | | | | | | | | | | | | | | | | | |
Total expenses after fees waived and/or reimbursed and paid indirectly | | | 2.39 | %(e) | | | | | | | 2.16 | % | | | 1.87 | % | | | 1.53 | % | | | 1.50 | % | | | 1.64 | % |
| | | | | | | | | | | | | | | | | | | | | | | | | | | | |
Total expenses after fees waived and/or reimbursed and paid indirectly and excluding interest expense, fees and amortization of offering costs(f) | | | 1.00 | %(e) | | | | | | | 1.01 | % | | | 0.99 | % | | | 0.99 | % | | | 0.99 | % | | | 1.04 | % |
| | | | | | | | | | | | | | | | | | | | | | | | | | | | |
Net investment income to Common Shareholders | | | 5.04 | %(e) | | | | | | | 5.19 | % | | | 5.42 | % | | | 5.75 | % | | | 5.86 | % | | | 6.48 | % |
| | | | | | | | | | | | | | | | | | | | | | | | | | | | |
| | | | | | | |
Supplemental Data | | | | | | | | | | | | | | | | | | | | | | | | | | | | |
Net assets applicable to Common Shareholders, end of period (000) | | $ | 227,140 | | | | | | | $ | 232,921 | | | $ | 238,684 | | | $ | 253,864 | | | $ | 248,646 | | | $ | 238,113 | |
| | | | | | | | | | | | | | | | | | | | | | | | | | | | |
VMTP Shares outstanding at $100,000 liquidation value, end of period (000) | | $ | 83,700 | | | | | | | $ | 83,700 | | | $ | 83,700 | | | $ | 83,700 | | | $ | 83,700 | | | $ | 83,700 | |
| | | | | | | | | | | | | | | | | | | | | | | | | | | | |
Asset coverage per VMTP Shares at $100,000 liquidation value, end of period | | $ | 371,374 | | | | | | | $ | 378,281 | | | $ | 385,166 | | | $ | 403,302 | | | $ | 397,068 | | | $ | 384,484 | |
| | | | | | | | | | | | | | | | | | | | | | | | | | | | |
Borrowings outstanding, end of period (000) | | $ | 60,465 | | | | | | | $ | 63,166 | | | $ | 62,233 | | | $ | 60,289 | | | $ | 56,784 | | | $ | 60,238 | |
| | | | | | | | | | | | | | | | | | | | | | | | | | | | |
Portfolio turnover rate | | | 5 | % | | | | | | | 12 | % | | | 9 | % | | | 7 | % | | | 11 | % | | | 20 | % |
| | | | | | | | | | | | | | | | | | | | | | | | | | | | |
| (a) | Based on average Common Shares outstanding. |
| (b) | Distributions for annual periods determined in accordance with U.S. federal income tax regulations. |
| (c) | Total returns based on market price, which can be significantly greater or less than the net asset value, may result in substantially different returns. Where applicable, excludes the effects of any sales charges and assumes the reinvestment of distributions at actual reinvestment prices. |
| (d) | Aggregate total return. |
| (f) | Interest expense, fees and amortization of offering costs related to TOB Trusts and/or VMTP Shares. See Note 4 and Note 10 of the Notes to Financial Statements for details. |
See notes to financial statements.
| | |
| 84 | | 2018 BLACKROCK SEMI-ANNUAL REPORTTO SHAREHOLDERS |
Financial Highlights (continued)
(For a share outstanding throughout each period)
| | | | | | | | | | | | | | | | | | | | | | | | | | | | |
| | | MUH | |
| | | Six Months Ended 10/31/18
(unaudited) | | | | | | Year Ended April 30, | |
| | | | | | 2018 | | | 2017 | | | 2016 | | | 2015 | | | 2014 | |
Net asset value, beginning of period | | $ | 15.11 | | | | | | | $ | 15.52 | | | $ | 16.51 | | | $ | 16.21 | | | $ | 15.61 | | | $ | 16.93 | |
| | | | | | | | | | | | | | | | | | | | | | | | | | | | |
Net investment income(a) | | | 0.39 | | | | | | | | 0.80 | | | | 0.86 | | | | 0.91 | | | | 0.93 | | | | 0.95 | |
Net realized and unrealized gain (loss) | | | (0.42 | ) | | | | | | | (0.35 | ) | | | (0.95 | ) | | | 0.33 | | | | 0.64 | | | | (1.17 | ) |
| | | | | | | | | | | | | | | | | | | | | | | | | | | | |
Net increase (decrease) from investment operations | | | (0.03 | ) | | | | | | | 0.45 | | | | (0.09 | ) | | | 1.24 | | | | 1.57 | | | | (0.22 | ) |
| | | | | | | | | | | | | | | | | | | | | | | | | | | | |
| Distributions to Common Shareholders(b) | | | | | | | | | | | | | | | | | | | | | |
From net investment income | | | (0.38 | ) | | | | | | | (0.85 | ) | | | (0.90 | ) | | | (0.94 | ) | | | (0.97 | ) | | | (1.00 | ) |
From net realized gain | | | — | | | | | | | | (0.01 | ) | | | — | | | | — | | | | — | | | | (0.10 | ) |
| | | | | | | | | | | | | | | | | | | | | | | | | | | | |
Total distributions to Common Shareholders | | | (0.38 | ) | | | | | | | (0.86 | ) | | | (0.90 | ) | | | (0.94 | ) | | | (0.97 | ) | | | (1.10 | ) |
| | | | | | | | | | | | | | | | | | | | | | | | | | | | |
Net asset value, end of period | | $ | 14.70 | | | | | | | $ | 15.11 | | | $ | 15.52 | | | $ | 16.51 | | | $ | 16.21 | | | $ | 15.61 | |
| | | | | | | | | | | | | | | | | | | | | | | | | | | | |
Market price, end of period | | $ | 12.67 | | | | | | | $ | 13.75 | | | $ | 15.59 | | | $ | 16.23 | | | $ | 15.28 | | | $ | 14.84 | |
| | | | | | | | | | | | | | | | | | | | | | | | | | | | |
| | | | | | | |
Total Return Applicable to Common Shareholders(c) | | | | | | | | | | | | | | | | | | | | | | | | | | | | |
Based on net asset value | | | 0.05 | %(d) | | | | | | | 3.09 | % | | | (0.52 | )% | | | 8.25 | % | | | 10.64 | % | | | (0.40 | )% |
| | | | | | | | | | | | | | | | | | | | | | | | | | | | |
Based on market price | | | (5.24 | )%(d) | | | | | | | (6.61 | )% | | | 1.65 | % | | | 12.90 | % | | | 9.71 | % | | | (4.30 | )% |
| | | | | | | | | | | | | | | | | | | | | | | | | | | | |
| | | | | | | |
Ratios to Average Net Assets Applicable to Common Shareholders | | | | | | | | | | | | | | | | | | | | | | | | | | | | |
Total expenses | | | 2.48 | %(e) | | | | | | | 2.12 | % | | | 1.83 | % | | | 1.50 | % | | | 1.48 | % | | | 1.61 | % |
| | | | | | | | | | | | | | | | | | | | | | | | | | | | |
Total expenses after fees waived and/or reimbursed and paid indirectly | | | 2.48 | %(e) | | | | | | | 2.12 | % | | | 1.83 | % | | | 1.50 | % | | | 1.48 | % | | | 1.61 | % |
| | | | | | | | | | | | | | | | | | | | | | | | | | | | |
Total expenses after fees waived and/or reimbursed and paid indirectly and excluding interest expense, fees and amortization of offering costs(f) | | | 1.04 | %(e) | | | | | | | 1.02 | % | | | 1.00 | % | | | 1.00 | % | | | 1.00 | % | | | 1.04 | % |
| | | | | | | | | | | | | | | | | | | | | | | | | | | | |
Net investment income to Common Shareholders | | | 5.14 | %(e) | | | | | | | 5.16 | % | | | 5.37 | % | | | 5.66 | % | | | 5.76 | % | | | 6.36 | % |
| | | | | | | | | | | | | | | | | | | | | | | | | | | | |
| | | | | | | |
Supplemental Data | | | | | | | | | | | | | | | | | | | | | | | | | | | | |
Net assets applicable to Common Shareholders, end of period (000) | | $ | 166,613 | | | | | | | $ | 171,346 | | | $ | 175,637 | | | $ | 186,553 | | | $ | 183,214 | | | $ | 176,395 | |
| | | | | | | | | | | | | | | | | | | | | | | | | | | | |
VMTP Shares outstanding at $100,000 liquidation value, end of period (000) | | $ | 55,000 | | | | | | | $ | 55,000 | | | $ | 55,000 | | | $ | 55,000 | | | $ | 55,000 | | | $ | 55,000 | |
| | | | | | | | | | | | | | | | | | | | | | | | | | | | |
Asset coverage per VMTP Shares at $100,000 liquidation value, end of period | | $ | 402,932 | | | | | | | $ | 411,538 | | | $ | 419,340 | | | $ | 439,188 | | | $ | 433,117 | | | $ | 420,718 | |
| | | | | | | | | | | | | | | | | | | | | | | | | | | | |
Borrowings outstanding, end of period (000) | | $ | 59,871 | | | | | | | $ | 54,100 | | | $ | 47,507 | | | $ | 46,103 | | | $ | 43,568 | | | $ | 48,497 | |
| | | | | | | | | | | | | | | | | | | | | | | | | | | | |
Portfolio turnover rate | | | 13 | % | | | | | | | 16 | % | | | 10 | % | | | 7 | % | | | 11 | % | | | 18 | % |
| | | | | | | | | | | | | | | | | | | | | | | | | | | | |
| (a) | Based on average Common Shares outstanding. |
| (b) | Distributions for annual periods determined in accordance with U.S. federal income tax regulations. |
| (c) | Total returns based on market price, which can be significantly greater or less than the net asset value, may result in substantially different returns. Where applicable, excludes the effects of any sales charges and assumes the reinvestment of distributions at actual reinvestment prices. |
| (d) | Aggregate total return. |
| (f) | Interest expense, fees and amortization of offering costs related to TOB Trusts and/or VMTP Shares. See Note 4 and Note 10 of the Notes to Financial Statements for details. |
See notes to financial statements.
Financial Highlights (continued)
(For a share outstanding throughout each period)
| | | | | | | | | | | | | | | | | | | | | | | | | | | | |
| | | MUS | |
| | | Six Months Ended
10/31/18
(unaudited) | | | | | | Year Ended April 30, | |
| | | | | | 2018 | | | 2017 | | | 2016 | | | 2015 | | | 2014 | |
Net asset value, beginning of period | | $ | 13.35 | | | | | | | $ | 13.95 | | | $ | 14.84 | | | $ | 14.57 | | | $ | 14.18 | | | $ | 15.31 | |
| | | | | | | | | | | | | | | | | | | | | | | | | | | | |
Net investment income(a) | | | 0.31 | | | | | | | | 0.70 | | | | 0.75 | | | | 0.80 | | | | 0.80 | | | | 0.82 | |
Net realized and unrealized gain (loss) | | | (0.37 | ) | | | | | | | (0.54 | ) | | | (0.84 | ) | | | 0.28 | | | | 0.40 | | | | (1.13 | ) |
| | | | | | | | | | | | | | | | | | | | | | | | | | | | |
Net increase (decrease) from investment operations | | | (0.06 | ) | | | | | | | 0.16 | | | | (0.09 | ) | | | 1.08 | | | | 1.20 | | | | (0.31 | ) |
| | | | | | | | | | | | | | | | | | | | | | | | | | | | |
Distributions to Common Shareholders from net investment income(b) | | | (0.33 | ) | | | | | | | (0.76 | ) | | | (0.80 | ) | | | (0.81 | ) | | | (0.81 | ) | | | (0.82 | ) |
| | | | | | | | | | | | | | | | | | | | | | | | | | | | |
Net asset value, end of period | | $ | 12.96 | | | | | | | $ | 13.35 | | | $ | 13.95 | | | $ | 14.84 | | | $ | 14.57 | | | $ | 14.18 | |
| | | | | | | | | | | | | | | | | | | | | | | | | | | | |
Market price, end of period | | $ | 11.17 | | | | | | | $ | 12.40 | | | $ | 13.38 | | | $ | 14.31 | | | $ | 13.32 | | | $ | 12.88 | |
| | | | | | | | | | | | | | | | | | | | | | | | | | | | |
| | | | | | | |
Total Return Applicable to Common Shareholders(c) | | | | | | | | | | | | | | | | | | | | | | | | | | | | |
Based on net asset value | | | (0.21 | )%(d) | | | | | | | 1.33 | % | | | (0.47 | )% | | | 8.24 | % | | | 9.20 | % | | | (1.07 | )% |
| | | | | | | | | | | | | | | | | | | | | | | | | | | | |
Based on market price | | | (7.40 | )%(d) | | | | | | | (1.88 | )% | | | (1.00 | )% | | | 14.09 | % | | | 9.91 | % | | | (7.78 | )% |
| | | | | | | | | | | | | | | | | | | | | | | | | | | | |
| | | | | | | |
Ratios to Average Net Assets Applicable to Common Shareholders | | | | | | | | | | | | | | | | | | | | | | | | | | | | |
Total expenses | | | 2.52 | %(e) | | | | | | | 2.30 | % | | | 1.95 | % | | | 1.60 | % | | | 1.59 | % | | | 1.75 | % |
| | | | | | | | | | | | | | | | | | | | | | | | | | | | |
Total expenses after fees waived and/or reimbursed and paid indirectly | | | 2.46 | %(e) | | | | | | | 2.24 | % | | | 1.91 | % | | | 1.58 | % | | | 1.57 | % | | | 1.67 | % |
| | | | | | | | | | | | | | | | | | | | | | | | | | | | |
Total expenses after fees waived and/or reimbursed and/or paid indirectly and excluding interest expense, fees and amortization of offering costs(f) | | | 0.98 | %(e) | | | | | | | 0.99 | % | | | 0.98 | % | | | 0.99 | % | | | 0.99 | % | | | 0.99 | % |
| | | | | | | | | | | | | | | | | | | | | | | | | | | | |
Net investment income to Common Shareholders | | | 4.57 | %(e) | | | | | | | 5.08 | % | | | 5.22 | % | | | 5.49 | % | | | 5.49 | % | | | 6.00 | % |
| | | | | | | | | | | | | | | | | | | | | | | | | | | | |
| | | | | | | |
Supplemental Data | | | | | | | | | | | | | | | | | | | | | | | | | | | | |
Net assets applicable to Common Shareholders, end of period (000) | | $ | 168,671 | | | | | | | $ | 173,818 | | | $ | 181,614 | | | $ | 193,110 | | | $ | 189,594 | | | $ | 184,479 | |
| | | | | | | | | | | | | | | | | | | | | | | | | | | | |
VMTP Shares outstanding at $100,000 liquidation value, end of period (000) | | $ | 87,000 | | | | | | | $ | 87,000 | | | $ | 87,000 | | | $ | 87,000 | | | $ | 87,000 | | | $ | 87,000 | |
| | | | | | | | | | | | | | | | | | | | | | | | | | | | |
Asset coverage per VMTP Shares at $100,000 liquidation value, end of period | | $ | 293,874 | | | | | | | $ | 299,791 | | | $ | 308,751 | | | $ | 321,966 | | | $ | 317,924 | | | $ | 312,045 | |
| | | | | | | | | | | | | | | | | | | | | | | | | | | | |
Borrowings outstanding, end of period (000) | | $ | 21,887 | | | | | | | $ | 26,238 | | | $ | 29,150 | | | $ | 24,429 | | | $ | 21,937 | | | $ | 25,187 | |
| | | | | | | | | | | | | | | | | | | | | | | | | | | | |
Portfolio turnover rate | | | 15 | % | | | | | | | 21 | % | | | 18 | % | | | 25 | % | | | 11 | % | | | 46 | % |
| | | | | | | | | | | | | | | | | | | | | | | | | | | | |
| (a) | Based on average Common Shares outstanding. |
| (b) | Distributions for annual periods determined in accordance with U.S. federal income tax regulations. |
| (c) | Total returns based on market price, which can be significantly greater or less than the net asset value, may result in substantially different returns. Where applicable, excludes the effects of any sales charges and assumes the reinvestment of distributions at actual reinvestment prices. |
| (d) | Aggregate total return. |
| (f) | Interest expense, fees and amortization of offering costs related to TOB Trusts and/or VMTP Shares. See Note 4 and Note 10 of the Notes to Financial Statements for details. |
See notes to financial statements.
| | |
| 86 | | 2018 BLACKROCK SEMI-ANNUAL REPORTTO SHAREHOLDERS |
Financial Highlights (continued)
(For a share outstanding throughout each period)
| | | | | | | | | | | | | | | | | | | | | | | | | | | | |
| | | MUI | |
| | | Six Months Ended
10/31/18
(unaudited) | | | | | | Year Ended April 30, | |
| | | | | | 2018 | | | 2017 | | | 2016 | | | 2015 | | | 2014 | |
Net asset value, beginning of period | | $ | 14.93 | | | | | | | $ | 15.17 | | | $ | 16.16 | | | $ | 15.86 | | | $ | 15.64 | | | $ | 16.60 | |
| | | | | | | | | | | | | | | | | | | | | | | | | | | | |
Net investment income(a) | | | 0.29 | | | | | | | | 0.59 | | | | 0.65 | | | | 0.73 | | | | 0.77 | | | | 0.80 | |
Net realized and unrealized gain (loss) | | | (0.29 | ) | | | | | | | (0.23 | ) | | | (0.83 | ) | | | 0.53 | | | | 0.27 | | | | (0.85 | ) |
| | | | | | | | | | | | | | | | | | | | | | | | | | | | |
Net increase (decrease) from investment operations | | | — | | | | | | | | 0.36 | | | | (0.18 | ) | | | 1.26 | | | | 1.04 | | | | (0.05 | ) |
| | | | | | | | | | | | | | | | | | | | | | | | | | | | |
| Distributions to Common Shareholders(b) | | | | | | | | | | | | | | | | | | | | | |
From net investment income | | | (0.27 | ) | | | | | | | (0.60 | ) | | | (0.67 | ) | | | (0.78 | ) | | | (0.82 | ) | | | (0.86 | ) |
From net realized gain | | | — | | | | | | | | (0.00 | )(c) | | | (0.14 | ) | | | (0.18 | ) | | | — | | | | (0.05 | ) |
| | | | | | | | | | | | | | | | | | | | | | | | | | | | |
Total distributions to Common Shareholders | | | (0.27 | ) | | | | | | | (0.60 | ) | | | (0.81 | ) | | | (0.96 | ) | | | (0.82 | ) | | | (0.91 | ) |
| | | | | | | | | | | | | | | | | | | | | | | | | | | | |
Net asset value, end of period | | $ | 14.66 | | | | | | | $ | 14.93 | | | $ | 15.17 | | | $ | 16.16 | | | $ | 15.86 | | | $ | 15.64 | |
| | | | | | | | | | | | | | | | | | | | | | | | | | | | |
Market price, end of period | | $ | 12.66 | | | | | | | $ | 13.01 | | | $ | 13.96 | | | $ | 15.19 | | | $ | 14.47 | | | $ | 14.55 | |
| | | | | | | | | | | | | | | | | | | | | | | | | | | | |
| | | | | | | |
Total Return Applicable to Common Shareholders(d) | | | | | | | | | | | | | | | | | | | | | | | | | | | | |
Based on net asset value | | | 0.22 | %(e) | | | | | | | 2.76 | % | | | (0.69 | )% | | | 9.04 | % | | | 7.27 | % | | | 0.50 | % |
| | | | | | | | | | | | | | | | | | | | | | | | | | | | |
Based on market price | | | (0.68 | )%(e) | | | | | | | (2.69 | )% | | | (2.77 | )% | | | 12.27 | % | | | 5.20 | % | | | (3.73 | )% |
| | | | | | | | | | | | | | | | | | | | | | | | | | | | |
| | | | | | | |
Ratios to Average Net Assets Applicable to Common Shareholders | | | | | | | | | | | | | | | | | | | | | | | | | | | | |
Total expenses | | | 2.52 | %(f) | | | | | | | 2.17 | % | | | 1.90 | % | | | 1.57 | % | | | 1.52 | % | | | 1.65 | % |
| | | | | | | | | | | | | | | | | | | | | | | | | | | | |
Total expenses after fees waived and/or reimbursed and paid indirectly | | | 2.52 | %(f) | | | | | | | 2.17 | % | | | 1.89 | % | | | 1.57 | % | | | 1.52 | % | | | 1.65 | % |
| | | | | | | | | | | | | | | | | | | | | | | | | | | | |
Total expenses after fees waived and/or reimbursed and paid indirectly and excluding interest expense, fees and amortization of offering costs(g) | | | 1.00 | %(f) | | | | | | | 0.97 | % | | | 0.96 | % | | | 0.94 | % | | | 0.96 | % | | | 1.00 | % |
| | | | | | | | | | | | | | | | | | | | | | | | | | | | |
Net investment income to Common Shareholders | | | 3.78 | %(f) | | | | | | | 3.87 | % | | | 4.12 | % | | | 4.61 | % | | | 4.82 | % | | | 5.28 | % |
| | | | | | | | | | | | | | | | | | | | | | | | | | | | |
| | | | | | | |
Supplemental Data | | | | | | | | | | | | | | | | | | | | | | | | | | | | |
Net assets applicable to Common Shareholders, end of period (000) | | $ | 561,449 | | | | | | | $ | 571,769 | | | $ | 580,945 | | | $ | 618,971 | | | $ | 607,440 | | | $ | 599,066 | |
| | | | | | | | | | | | | | | | | | | | | | | | | | | | |
VMTP Shares outstanding at $100,000 liquidation value, end of period (000) | | $ | 287,100 | | | | | | | $ | 287,100 | | | $ | 287,100 | | | $ | 287,100 | | | $ | 287,100 | | | $ | 287,100 | |
| | | | | | | | | | | | | | | | | | | | | | | | | | | | |
Asset coverage per VMTP Shares at $100,000 liquidation value, end of period | | $ | 295,559 | | | | | | | $ | 299,153 | | | $ | 302,349 | | | $ | 315,594 | | | $ | 311,578 | | | $ | 308,661 | |
| | | | | | | | | | | | | | | | | | | | | | | | | | | | |
Borrowings outstanding, end of period (000) | | $ | 93,381 | | | | | | | $ | 79,136 | | | $ | 58,337 | | | $ | 63,102 | | | $ | 52,932 | | | $ | 69,070 | |
| | | | | | | | | | | | | | | | | | | | | | | | | | | | |
Portfolio turnover rate | | | 14 | % | | | | | | | 34 | % | | | 12 | % | | | 20 | % | | | 18 | % | | | 22 | % |
| | | | | | | | | | | | | | | | | | | | | | | | | | | | |
| (a) | Based on average Common Shares outstanding. |
| (b) | Distributions for annual periods determined in accordance with U.S. federal income tax regulations. |
| (c) | Amount is greater than $(0.005) per share. |
| (d) | Total returns based on market price, which can be significantly greater or less than the net asset value, may result in substantially different returns. Where applicable, excludes the effects of any sales charges and assumes the reinvestment of distributions at actual reinvestment prices. |
| (e) | Aggregate total return. |
| (g) | Interest expense, fees and amortization of offering costs related to TOB Trusts and/or VMTP Shares. See Note 4 and Note 10 of the Notes to Financial Statements for details. |
See notes to financial statements.
Financial Highlights (continued)
(For a share outstanding throughout each period)
| | | | | | | | | | | | | | | | | | | | | | | | | | | | |
| | | MVT | |
| | | Six Months Ended
10/31/18
(unaudited) | | | | | | Year Ended April 30, | |
| | | | | | 2018 | | | 2017 | | | 2016 | | | 2015 | | | 2014 | |
Net asset value, beginning of period | | $ | 14.75 | | | | | | | $ | 15.19 | | | $ | 16.17 | | | $ | 16.01 | | | $ | 15.45 | | | $ | 16.69 | |
| | | | | | | | | | | | | | | | | | | | | | | | | | | | |
Net investment income(a) | | | 0.39 | | | | | | | | 0.83 | | | | 0.91 | | | | 0.98 | | | | 0.99 | | | | 1.03 | |
Net realized and unrealized gain (loss) | | | (0.40 | ) | | | | | | | (0.41 | ) | | | (0.95 | ) | | | 0.18 | | | | 0.61 | | | | (1.19 | ) |
| | | | | | | | | | | | | | | | | | | | | | | | | | | | |
Net increase (decrease) from investment operations | | | (0.01 | ) | | | | | | | 0.42 | | | | (0.04 | ) | | | 1.16 | | | | 1.60 | | | | (0.16 | ) |
| | | | | | | | | | | | | | | | | | | | | | | | | | | | |
Distributions to Common Shareholders from net investment income(b) | | | (0.38 | ) | | | | | | | (0.86 | ) | | | (0.94 | ) | | | (1.00 | ) | | | (1.04 | ) | | | (1.08 | ) |
| | | | | | | | | | | | | | | | | | | | | | | | | | | | |
Net asset value, end of period | | $ | 14.36 | | | | | | | $ | 14.75 | | | $ | 15.19 | | | $ | 16.17 | | | $ | 16.01 | | | $ | 15.45 | |
| | | | | | | | | | | | | | | | | | | | | | | | | | | | |
Market price, end of period | | $ | 12.80 | | | | | | | $ | 14.05 | | | $ | 15.45 | | | $ | 17.38 | | | $ | 16.26 | | | $ | 15.16 | |
| | | | | | | | | | | | | | | | | | | | | | | | | | | | |
| | | | | | | |
Total Return Applicable to Common Shareholders(c) | | | | | | | | | | | | | | | | | | | | | | | | | | | | |
Based on net asset value | | | 0.09 | %(d) | | | | | | | 2.79 | % | | | (0.34 | )% | | | 7.61 | % | | | 10.65 | % | | | (0.37 | )% |
| | | | | | | | | | | | | | | | | | | | | | | | | | | | |
Based on market price | | | (6.34 | )%(d) | | | | | | | (3.74 | )% | | | (5.68 | )% | | | 13.88 | % | | | 14.52 | % | | | (5.74 | )% |
| | | | | | | | | | | | | | | | | | | | | | | | | | | | |
| | | | | | | |
Ratios to Average Net Assets Applicable to Common Shareholders | | | | | | | | | | | | | | | | | | | | | | | | | | | | |
Total expenses | | | 2.37 | %(e) | | | | | | | 2.11 | % | | | 1.88 | % | | | 1.52 | % | | | 1.50 | % | | | 1.63 | % |
| | | | | | | | | | | | | | | | | | | | | | | | | | | | |
Total expenses after fees waived and/or reimbursed and paid indirectly | | | 2.37 | %(e) | | | | | | | 2.11 | % | | | 1.87 | % | | | 1.52 | % | | | 1.50 | % | | | 1.63 | % |
| | | | | | | | | | | | | | | | | | | | | | | | | | | | |
Total expenses after fees waived and/or reimbursed and paid indirectly and excluding interest expense, fees and amortization of offering costs(f) | | | 0.91 | %(e) | | | | | | | 0.91 | % | | | 0.92 | % | | | 0.92 | % | | | 0.92 | % | | | 0.96 | % |
| | | | | | | | | | | | | | | | | | | | | | | | | | | | |
Net investment income to Common Shareholders | | | 5.21 | %(e) | | | | | | | 5.44 | % | | | 5.78 | % | | | 6.15 | % | | | 6.17 | % | | | 6.93 | % |
| | | | | | | | | | | | | | | | | | | | | | | | | | | | |
| | | | | | | |
Supplemental Data | | | | | | | | | | | | | | | | | | | | | | | | | | | | |
Net assets applicable to Common Shareholders, end of period (000) | | $ | 306,013 | | | | | | | $ | 314,261 | | | $ | 321,939 | | | $ | 340,753 | | | $ | 336,320 | | | $ | 324,146 | |
| | | | | | | | | | | | | | | | | | | | | | | | | | | | |
VMTP Shares outstanding at $100,000 liquidation value, end of period (000) | | $ | 140,000 | | | | | | | $ | 140,000 | | | $ | 140,000 | | | $ | 140,000 | | | $ | 140,000 | | | $ | 140,000 | |
| | | | | | | | | | | | | | | | | | | | | | | | | | | | |
Asset coverage per VMTP Shares at $100,000 liquidation value, end of period | | $ | 318,581 | | | | | | | $ | 324,472 | | | $ | 329,956 | | | $ | 343,395 | | | $ | 340,229 | | | $ | 331,533 | |
| | | | | | | | | | | | | | | | | | | | | | | | | | | | |
Borrowings outstanding, end of period (000) | | $ | 60,359 | | | | | | | $ | 61,343 | | | $ | 60,575 | | | $ | 69,195 | | | $ | 66,439 | | | $ | 66,715 | |
| | | | | | | | | | | | | | | | | | | | | | | | | | | | |
Portfolio turnover rate | | | 8 | % | | | | | | | 11 | % | | | 9 | % | | | 6 | % | | | 10 | % | | | 17 | % |
| | | | | | | | | | | | | | | | | | | | | | | | | | | | |
| (a) | Based on average Common Shares outstanding. |
| (b) | Distributions for annual periods determined in accordance with U.S. federal income tax regulations. |
| (c) | Total returns based on market price, which can be significantly greater or less than the net asset value, may result in substantially different returns. Where applicable, excludes the effects of any sales charges and assumes the reinvestment of distributions at actual reinvestment prices. |
| (d) | Aggregate total return. |
| (f) | Interest expense, fees and amortization of offering costs related to TOB Trusts and/or VMTP Shares. See Note 4 and Note 10 of the Notes to Financial Statements for details. |
See notes to financial statements.
| | |
| 88 | | 2018 BLACKROCK SEMI-ANNUAL REPORTTO SHAREHOLDERS |
Notes to Financial Statements (unaudited)
The following are registered under the Investment Company Act of 1940, as amended (the “1940 Act”), as closed-end management investment companies and are referred to herein collectively as the “Funds”, or individually as a “Fund”:
| | | | | | |
| Fund Name | | Herein Referred To As | | Organized | | Diversification
Classification |
BlackRock MuniAssets Fund, Inc. | | MUA | | Maryland | | Diversified |
BlackRock MuniEnhanced Fund, Inc. | | MEN | | Maryland | | Diversified |
BlackRock MuniHoldings Fund, Inc. | | MHD | | Maryland | | Diversified |
BlackRock MuniHoldings Fund II, Inc. | | MUH | | Maryland | | Diversified |
BlackRock MuniHoldings Quality Fund, Inc. | | MUS | | Maryland | | Diversified |
BlackRock Muni Intermediate Duration Fund, Inc. | | MUI | | Maryland | | Diversified |
BlackRock MuniVest Fund II, Inc. | | MVT | | Maryland | | Diversified |
The Boards of Directors of the Funds are collectively referred to throughout this report as the “Board of Directors” or the “Board,” and the directors thereof are collectively referred to throughout this report as “Directors”. The Funds determine and make available for publication the net asset values (“NAVs”) of their Common Shares on a daily basis.
The Funds, together with certain other registered investment companies advised by BlackRock Advisors, LLC (the “Manager”) or its affiliates, are included in a complex of closed-end funds referred to as the Closed-End Complex.
| 2. | SIGNIFICANT ACCOUNTING POLICIES |
The financial statements are prepared in conformity with accounting principles generally accepted in the United States of America (“U.S. GAAP”), which may require management to make estimates and assumptions that affect the reported amounts of assets and liabilities in the financial statements, disclosure of contingent assets and liabilities at the date of the financial statements and the reported amounts of increases and decreases in net assets from operations during the reporting period. Actual results could differ from those estimates. Each Fund is considered an investment company under U.S. GAAP and follows the accounting and reporting guidance applicable to investment companies. Below is a summary of significant accounting policies:
Investment Transactions and Income Recognition: For financial reporting purposes, investment transactions are recorded on the dates the transactions are entered into (the “trade dates”). Realized gains and losses on investment transactions are determined on the identified cost basis. Dividend income is recorded on the ex-dividend date. Interest income, including amortization and accretion of premiums and discounts on debt securities, is recognized on an accrual basis.
Segregation and Collateralization: In cases where a Fund enters into certain investments (e.g., futures contracts) or certain borrowings (e.g., TOB Trust transactions) that would be treated as “senior securities” for 1940 Act purposes, a Fund may segregate or designate on its books and records cash or liquid assets having a market value at least equal to the amount of its future obligations under such investments or borrowings. Doing so allows the investment or borrowing to be excluded from treatment as a “senior security.” Furthermore, if required by an exchange or counterparty agreement, the Funds may be required to deliver/deposit cash and/or securities to/with an exchange, or broker-dealer or custodian as collateral for certain investments or obligations.
Distributions: Distributions from net investment income are declared monthly and paid monthly. Distributions of capital gains are recorded on the ex-dividend date and made at least annually. The character and timing of distributions are determined in accordance with U.S. federal income tax regulations, which may differ from U.S. GAAP.
Distributions to Preferred Shareholders are accrued and determined as described in Note 10.
Deferred Compensation Plan: Under the Deferred Compensation Plan (the “Plan”) approved by each Fund’s Board, the independent Directors (“Independent Directors”) may defer a portion of their annual complex-wide compensation. Deferred amounts earn an approximate return as though equivalent dollar amounts had been invested in common shares of certain other BlackRock Closed-End Funds selected by the Independent Directors. This has the same economic effect for the Independent Directors as if the Independent Directors had invested the deferred amounts directly in certain other BlackRock Closed-End Funds.
The Plan is not funded and obligations thereunder represent general unsecured claims against the general assets of each Fund, if applicable. Deferred compensation liabilities are included in the Directors’ and Officer’s fees payable in the Statements of Assets and Liabilities and will remain as a liability of the Funds until such amounts are distributed in accordance with the Plan.
Recent Accounting Standards: In March 2017, the Financial Accounting Standards Board issued Accounting Standards Update “Premium Amortization of Purchased Callable Debt Securities” which amends the amortization period for certain purchased callable debt securities. Under the new guidance, the premium amortization of purchased callable debt securities that have explicit, non-contingent call features and are callable at fixed prices will be amortized to the earliest call date. The guidance will be applied on a modified retrospective basis and is effective for fiscal years, and their interim periods, beginning after December 15, 2018. Management is currently evaluating the impact of this guidance to the Funds.
In August 2018, the Financial Accounting Standards Board issued Accounting Standards Update 2018-13 “Changes to the Disclosure Requirements for Fair Value Measurement” which modifies disclosure requirements for fair value measurements. The guidance is effective for fiscal years beginning after December 15, 2019 and for interim periods within those fiscal years. Management is currently evaluating the impact of this guidance to the Funds.
Indemnifications: In the normal course of business, a Fund enters into contracts that contain a variety of representations that provide general indemnification. A Fund’s maximum exposure under these arrangements is unknown because it involves future potential claims against a Fund, which cannot be predicted with any certainty.
| | | | |
| NOTESTO FINANCIAL STATEMENTS | | | 89 | |
Notes to Financial Statements (unaudited) (continued)
Other: Expenses directly related to a Fund are charged to that Fund. Other operating expenses shared by several funds, including other funds managed by the Manager, are prorated among those funds on the basis of relative net assets or other appropriate methods.
| 3. | INVESTMENT VALUATION AND FAIR VALUE MEASUREMENTS |
Investment Valuation Policies: The Funds’ investments are valued at fair value (also referred to as “market value” within the financial statements) as of the close of trading on the New York Stock Exchange (“NYSE”) (generally 4:00 p.m., Eastern time). U.S. GAAP defines fair value as the price the Funds would receive to sell an asset or pay to transfer a liability in an orderly transaction between market participants at the measurement date. The Funds determine the fair values of their financial instruments using various independent dealers or pricing services under policies approved by the Board. The BlackRock Global Valuation Methodologies Committee (the “Global Valuation Committee”) is the committee formed by management to develop global pricing policies and procedures and to oversee the pricing function for all financial instruments.
Fair Value Inputs and Methodologies: The following methods and inputs are used to establish the fair value of each Fund’s assets and liabilities:
| | • | | Municipal investments (including commitments to purchase such investments on a “when-issued” basis) are valued on the basis of prices provided by dealers or pricing services. In determining the value of a particular investment, pricing services may use certain information with respect to transactions in such investments, quotations from dealers, pricing matrixes, market transactions in comparable investments and information with respect to various relationships between investments. |
| | • | | Investments in open-end U.S. mutual funds are valued at NAV each business day. |
| | • | | Futures contracts traded on exchanges are valued at their last sale price. |
If events (e.g., a company announcement, market volatility or a natural disaster) occur that are expected to materially affect the value of such investments, or in the event that the application of these methods of valuation results in a price for an investment that is deemed not to be representative of the market value of such investment, or if a price is not available, the investment will be valued by the Global Valuation Committee, or its delegate, in accordance with a policy approved by the Board as reflecting fair value (“Fair Valued Investments”). The fair valuation approaches that may be used by the Global Valuation Committee will include market approach, income approach and cost approach. Valuation techniques such as discounted cash flow, use of market comparables and matrix pricing are types of valuation approaches and are typically used in determining fair value. When determining the price for Fair Valued Investments, the Global Valuation Committee, or its delegate, seeks to determine the price that each Fund might reasonably expect to receive or pay from the current sale or purchase of that asset or liability in an arm’s-length transaction. Fair value determinations shall be based upon all available factors that the Global Valuation Committee, or its delegate, deems relevant and consistent with the principles of fair value measurement. The pricing of all Fair Valued Investments is subsequently reported to the Board or a committee thereof on a quarterly basis.
Fair Value Hierarchy: Various inputs are used in determining the fair value of investments and derivative financial instruments. These inputs to valuation techniques are categorized into a fair value hierarchy consisting of three broad levels for financial statement purposes as follows:
| | • | | Level 1 — Unadjusted price quotations in active markets/exchanges for identical assets or liabilities that each Fund has the ability to access |
| | • | | Level 2 — Other observable inputs (including, but not limited to, quoted prices for similar assets or liabilities in markets that are active, quoted prices for identical or similar assets or liabilities in markets that are not active, inputs other than quoted prices that are observable for the assets or liabilities (such as interest rates, yield curves, volatilities, prepayment speeds, loss severities, credit risks and default rates) or other market–corroborated inputs) |
| | • | | Level 3 — Unobservable inputs based on the best information available in the circumstances, to the extent observable inputs are not available (including each Fund’s own assumptions used in determining the fair value of investments and derivative financial instruments) |
The hierarchy gives the highest priority to unadjusted quoted prices in active markets for identical assets or liabilities (Level 1 measurements) and the lowest priority to unobservable inputs (Level 3 measurements). Accordingly, the degree of judgment exercised in determining fair value is greatest for instruments categorized in Level 3. The inputs used to measure fair value may fall into different levels of the fair value hierarchy. In such cases, for disclosure purposes, the fair value hierarchy classification is determined based on the lowest level input that is significant to the fair value measurement in its entirety. Investments classified within Level 3 have significant unobservable inputs used by the Global Valuation Committee in determining the price for Fair Valued Investments. Level 3 investments include equity or debt issued by privately held companies or funds. There may not be a secondary market, and/or there are a limited number of investors. Level 3 investments may also be adjusted to reflect illiquidity and/or non-transferability, with the amount of such discount estimated by the Global Valuation Committee in the absence of market information.
Changes in valuation techniques may result in transfers into or out of an assigned level within the hierarchy. In accordance with each Fund’s policy, transfers between different levels of the fair value hierarchy are deemed to have occurred as of the beginning of the reporting period. The categorization of a value determined for investments and derivative financial instruments is based on the pricing transparency of the investments and derivative financial instruments and is not necessarily an indication of the risks associated with investing in those securities.
| 4. | SECURITIES AND OTHER INVESTMENTS |
Zero-Coupon Bonds: Zero-coupon bonds are normally issued at a significant discount from face value and do not provide for periodic interest payments. These bonds may experience greater volatility in market value than other debt obligations of similar maturity which provide for regular interest payments.
Forward Commitments and When-Issued Delayed Delivery Securities: Certain funds may purchase securities on a when-issued basis and may purchase or sell securities on a forward commitment basis. Settlement of such transactions normally occurs within a month or more after the purchase or sale commitment is made. A fund
| | |
| 90 | | 2018 BLACKROCK SEMI-ANNUAL REPORTTO SHAREHOLDERS |
Notes to Financial Statements (unaudited) (continued)
may purchase securities under such conditions with the intention of actually acquiring them, but may enter into a separate agreement to sell the securities before the settlement date. Since the value of securities purchased may fluctuate prior to settlement, a fund may be required to pay more at settlement than the security is worth. In addition, a fund is not entitled to any of the interest earned prior to settlement. When purchasing a security on a delayed delivery basis, a fund assumes the rights and risks of ownership of the security, including the risk of price and yield fluctuations. In the event of default by the counterparty, a fund’s maximum amount of loss is the unrealized appreciation of unsettled when-issued transactions.
Municipal Bonds Transferred to TOB Trusts: Certain funds leverage their assets through the use of “TOB Trust” transactions. The funds transfer municipal bonds into a special purpose trust (a “TOB Trust”). A TOB Trust issues two classes of beneficial interests: short-term floating rate interests (“TOB Trust Certificates”), which are sold to third party investors, and residual inverse floating rate interests (“TOB Residuals”), which are issued to the participating funds that contributed the municipal bonds to the TOB Trust. The TOB Trust Certificates have interest rates that reset weekly and their holders have the option to tender such certificates to the TOB Trust for redemption at par and any accrued interest at each reset date. The TOB Residuals held by a fund provide the fund with the right to cause the holders of a proportional share of the TOB Trust Certificates to tender their certificates to the TOB Trust at par plus accrued interest. The funds may withdraw a corresponding share of the municipal bonds from the TOB Trust. Other funds managed by the investment adviser may also contribute municipal bonds to a TOB Trust into which a fund has contributed bonds. If multiple BlackRock advised funds participate in the same TOB Trust, the economic rights and obligations under the TOB Residuals will be shared among the funds ratably in proportion to their participation in the TOB Trust.
TOB Trusts are supported by a liquidity facility provided by a third party bank or other financial institution (the “Liquidity Provider”) that allows the holders of the TOB Trust Certificates to tender their certificates in exchange for payment of par plus accrued interest on any business day. The tendered TOB Trust Certificates are remarketed by a Remarketing Agent. In the event of a failed remarketing, the TOB Trust may draw upon a loan from the Liquidity Provider to purchase the tendered TOB Trust Certificates. Any loans made by the Liquidity Provider will be secured by the purchased TOB Trust Certificates held by the TOB Trust and will be subject to an increased interest rate based on number of days the loan is outstanding.
The TOB Trust may be collapsed without the consent of a fund, upon the occurrence of a termination event, as defined in the TOB Trust agreement. Upon the occurrence of a termination event, a TOB Trust would be liquidated with the proceeds applied first to any accrued fees owed to the trustee of the TOB Trust, the Remarketing Agent and the Liquidity Provider. Upon certain termination events, TOB Trust Certificates holders will be paid before the TOB Residuals holders (i.e., the Funds) whereas in other termination events, TOB Trust Certificates holders and TOB Residuals holders will be paid pro rata.
While a fund’s investment policies and restrictions expressly permit investments in inverse floating rate securities, such as TOB Residuals, they restrict the ability of a fund to borrow money for purposes of making investments. MUA, MEN and MVT management believes that a fund’s restrictions on borrowings do not apply to the Funds’ TOB Trust transactions. Each fund’s transfer of the municipal bonds to a TOB Trust is considered a secured borrowing for financial reporting purposes. The cash received by the TOB Trust from the sale of the TOB Trust Certificates, less certain transaction expenses, is paid to a fund. A fund typically invests the cash received in additional municipal bonds.
Accounting for TOB Trusts: The municipal bonds deposited into a TOB Trust are presented in a fund’s Schedule of Investments and the TOB Trust Certificates are shown in Other Liabilities in the Statements of Assets and Liabilities. Any loans drawn by the TOB Trust pursuant to the liquidity facility to purchase tendered TOB Trust Certificates are shown as Loan for TOB Trust Certificates. The carrying amount of a fund’s payable to the holder of the TOB Trust Certificates, as reported in the Statements of Assets and Liabilities as TOB Trust Certificates, approximates its fair value.
Interest income, including amortization and accretion of premiums and discounts, from the underlying municipal bonds is recorded by a fund on an accrual basis. Interest expense incurred on the TOB Trust transaction and other expenses related to remarketing, administration, trustee, liquidity and other services to a TOB Trust are shown as interest expense, fees and amortization of offering costs in the Statements of Operations. Fees paid upon creation of the TOB Trust are recorded as debt issuance costs and are amortized to interest expense, fees and amortization of offering costs in the Statements of Operations to the expected maturity of the TOB Trust. In connection with the restructurings of the TOB Trusts to non-bank sponsored TOB Trusts, the funds incurred non-recurring, legal and restructuring fees, which are recorded as interest expense, fees and amortization of deferred offering costs in the Statements of Operations. Amounts recorded within interest expense, fees and amortization of offering costs in the Statements of Operations are:
| | | | | | | | | | | | | | | | |
| | | Interest Expense | | | Liquidity Fees | | | Other Expenses | | | Total | |
MUA | | $ | 541,271 | | | $ | 159,985 | | | $ | 74,978 | | | $ | 776,234 | |
MEN | | | 627,900 | | | | 193,380 | | | | 65,295 | | | | 886,575 | |
MHD | | | 438,779 | | | | 131,101 | | | | 51,166 | | | | 621,046 | |
MUH | | | 407,754 | | | | 122,955 | | | | 45,336 | | | | 576,045 | |
MUS | | | 171,476 | | | | 54,789 | | | | 20,752 | | | | 247,017 | |
MUI | | | 666,805 | | | | 218,012 | | | | 57,465 | | | | 942,282 | |
MVT | | | 436,222 | | | | 128,080 | | | | 55,135 | | | | 619,437 | |
| | | | |
| NOTESTO FINANCIAL STATEMENTS | | | 91 | |
Notes to Financial Statements (unaudited) (continued)
For the six months ended October 31, 2018, the following table is a summary of each Fund’s TOB Trusts:
| | | | | | | | | | | | | | | | | | | | |
| | | Underlying
Municipal Bonds
Transferred to
TOB Trusts (a) | | | Liability for
TOB Trust
Certificates (b) | | | Range of
Interest Rates
on TOB Trust
Certificates at
Period End | | | Average
TOB Trust
Certificates
Outstanding | | | Daily Weighted
Average Rate
of Interest and
Other Expenses
on TOB Trusts | |
MUA | | $ | 118,601,167 | | | $ | 71,659,281 | | | | 1.62% — 1.80 | % | | $ | 73,912,944 | | | | 2.08 | % |
MEN | | | 151,920,979 | | | | 91,588,127 | | | | 1.56 — 2.24 | | | | 89,618,170 | | | | 2.04 | |
MHD | | | 100,281,582 | | | | 60,465,002 | | | | 1.56 — 2.24 | | | | 60,371,404 | | | | 2.03 | |
MUH | | | 97,135,743 | | | | 59,871,076 | | | | 1.56 — 2.24 | | | | 56,318,740 | | | | 2.02 | |
MUS | | | 39,758,345 | | | | 21,886,518 | | | | 1.60 — 1.90 | | | | 23,848,557 | | | | 2.05 | |
MUI | | | 154,923,704 | | | | 93,380,641 | | | | 1.60 — 1.68 | | | | 93,827,462 | | | | 1.99 | |
MVT | | | 100,507,261 | | | | 60,358,700 | | | | 1.56 — 2.24 | | | | 59,740,474 | | | | 2.05 | |
| | (a) | The municipal bonds transferred to a TOB Trust are generally high grade municipal bonds. In certain cases, when municipal bonds transferred are lower grade municipal bonds, the TOB Trust transaction may include a credit enhancement feature that provides for the timely payment of principal and interest on the bonds to the TOB Trust by a credit enhancement provider in the event of default of the municipal bond. The TOB Trust would be responsible for the payment of the credit enhancement fee and the funds, as TOB Residuals holders, would be responsible for reimbursement of any payments of principal and interest made by the credit enhancement provider. The maximum potential amounts owed by the fund, for such reimbursements, as applicable, are included in the maximum potential amounts disclosed for recourse TOB Trusts. | |
| | (b) | TOB Trusts may be structured on a non-recourse or recourse basis. When a fund invests in TOB Trusts on a non-recourse basis, the Liquidity Provider may be required to make a payment under the liquidity facility to allow the TOB Trust to repurchase TOB Trust Certificates. The Liquidity Provider will be reimbursed from the liquidation of bonds held in the TOB Trust. If a fund invests in a TOB Trust on a recourse basis, a fund enters into a reimbursement agreement with the Liquidity Provider where a fund is required to reimburse the Liquidity Provider for any shortfall between the amount paid by the Liquidity Provider and proceeds received from liquidation of municipal bonds held in the TOB Trust (the “Liquidation Shortfall”). As a result, if a fund invests in a recourse TOB Trust, a fund will bear the risk of loss with respect to any Liquidation Shortfall. If multiple funds participate in any such TOB Trust, these losses will be shared ratably, including the maximum potential amounts owed by a fund at October 31, 2018, in proportion to their participation in the TOB Trust. The recourse TOB Trusts are identified in the Schedules of Investments including the maximum potential amounts owed by a fund at October 31, 2018. | |
| 5. | DERIVATIVE FINANCIAL INSTRUMENTS |
The Funds engage in various portfolio investment strategies using derivative contracts both to increase the returns of the Funds and/or to manage their exposure to certain risks such as credit risk, equity risk, interest rate risk, foreign currency exchange rate risk, commodity price risk or other risks (e.g., inflation risk). Derivative financial instruments categorized by risk exposure are included in the Schedules of Investments. These contracts may be transacted on an exchange or over-the-counter (“OTC”).
Futures Contracts: Futures contracts are purchased or sold to gain exposure to, or manage exposure to, changes in interest rates (interest rate risk), changes in the value of equity securities (equity risk) or foreign currencies (foreign currency exchange rate risk).
Futures contracts are agreements between the Funds and a counterparty to buy or sell a specific quantity of an underlying instrument at a specified price and on a specified date. Depending on the terms of a contract, it is settled either through physical delivery of the underlying instrument on the settlement date or by payment of a cash amount on the settlement date. Upon entering into a futures contract, the Funds are required to deposit initial margin with the broker in the form of cash or securities in an amount that varies depending on a contract’s size and risk profile. The initial margin deposit must then be maintained at an established level over the life of the contract. Amounts pledged, which are considered restricted, are included in cash pledged for futures contracts in the Statements of Assets and Liabilities.
Securities deposited as initial margin are designated in the Schedules of Investments and cash deposited, if any, is shown as cash pledged for futures contracts in the Statements of Assets and Liabilities. Pursuant to the contract, the Funds agree to receive from or pay to the broker an amount of cash equal to the daily fluctuation in market value of the contract (“variation margin”). Variation margin is recorded as unrealized appreciation (depreciation) and, if any, shown as variation margin receivable (or payable) on futures contracts in the Statements of Assets and Liabilities. When the contract is closed, a realized gain or loss is recorded in the Statements of Operations equal to the difference between the notional amount of the contract at the time it was opened and the notional amount at the time it was closed. The use of futures contracts involves the risk of an imperfect correlation in the movements in the price of futures contracts and interest, foreign currency exchange rates or underlying assets.
| 6. | INVESTMENT ADVISORY AGREEMENT AND OTHER TRANSACTIONS WITH AFFILIATES |
The PNC Financial Services Group, Inc. is the largest stockholder and an affiliate of BlackRock, Inc. (“BlackRock”) for 1940 Act purposes.
Investment Advisory: Each Fund entered into an Investment Advisory Agreement with the Manager, the Funds’ investment adviser and an indirect, wholly-owned subsidiary of BlackRock, to provide investment advisory and administration services. The Manager is responsible for the management of each Fund’s portfolio and provides the personnel, facilities, equipment and certain other services necessary to the operations of each Fund.
For such services, each Fund, except MUI, pays the Manager a monthly fee at an annual rate equal to the following percentages of the average daily value of each Fund’s net assets:
| | | | | | | | | | | | | | | | | | | | | | | | |
| | | MUA | | | MEN | | | MHD | | | MUH | | | MUS | | | MVT | |
Investment advisory fees | | | 0.55 | % | | | 0.50 | % | | | 0.55 | % | | | 0.55 | % | | | 0.55 | % | | | 0.50 | % |
| | |
| 92 | | 2018 BLACKROCK SEMI-ANNUAL REPORTTO SHAREHOLDERS |
Notes to Financial Statements (unaudited) (continued)
For such services, MUI pays the Manager a monthly fee of 0.55% of (i) the average daily value of MUI’s net assets and (ii) the proceeds of any outstanding debt securities and borrowings used for leverage.
For purposes of calculating these fees, “net assets” mean the total assets of a Fund minus the sum of its accrued liabilities (which does not include liabilities represented by TOB Trusts and the liquidation preference of any outstanding preferred shares). It is understood that the liquidation preference of any outstanding preferred shares (other than accumulated dividends) and TOB Trusts is not considered a liability in determining a Fund’s NAV.
Waivers: The Manager, for MUS, voluntarily agreed to waive its investment advisory fee on the proceeds of the Preferred Shares and TOB Trusts that exceed 35% of total assets minus the sum of its accrued liabilities (which does not include liabilities represented by TOB Trusts and the liquidation preference of any outstanding preferred shares). The voluntary waiver may be reduced or discontinued at any time without notice. This amount is included in fees waived and/or reimbursed by the Manager in the Statements of Operations. For the six months ended October 31, 2018, the waiver was $49,117.
The Manager voluntarily agreed to waive its investment advisory fees by the amount of investment advisory fees each Fund pays to the Manager indirectly through its investment in affiliated money market funds (the “affiliated money market fund waiver”). These amounts are included in fees waived by the Manager in the Statements of Operations. For the six months ended October 31, 2018, the amounts waived were as follows:
| | | | | | | | | | | | | | | | | | | | | | | | | | | | |
| | | MUA | | | MEN | | | MHD | | | MUH | | | MUS | | | MUI | | | MVT | |
Amounts waived | | $ | 1,660 | | | $ | 620 | | | $ | 1,570 | | | $ | 323 | | | $ | 1,161 | | | $ | 1,538 | | | $ | 3,093 | |
The Manager contractually agreed to waive its investment advisory fee with respect to any portion of each Fund’s assets invested in affiliated equity and fixed-income mutual funds and affiliated exchange-traded funds that have a contractual management fee through June 30, 2019. The agreement can be renewed for annual periods thereafter, and may be terminated on 90 days’ notice, each subject to approval by a majority of the Funds’ Independent Directors. For the six months ended October 31, 2018, there were no fees waived by the Manager.
Directors and Officers: Certain directors and/or officers of the Funds are directors and/or officers of BlackRock or its affiliates. The Funds reimburse the Manager for a portion of the compensation paid to the Funds’ Chief Compliance Officer, which is included in Directors and Officer in the Statements of Operations.
Other Transactions: The Funds may purchase securities from, or sell securities to, an affiliated fund provided the affiliation is due solely to having a common investment adviser, common officers, or common trustees. For the six months ended October 31, 2018, there were no transactions to report.
For the six months ended October 31, 2018, purchases and sales of investments, excluding short-term securities, were as follows:
| | | | | | | | | | | | | | | | | | | | | | | | | | | | |
| | | MUA | | | MEN | | | MHD | | | MUH | | | MUS | | | MUI | | | MVT | |
Purchases | | $ | 50,083,178 | | | $ | 69,743,308 | | | $ | 20,253,507 | | | $ | 43,068,279 | | | $ | 43,298,240 | | | $ | 149,861,164 | | | $ | 40,988,870 | |
Sales | | | 50,055,261 | | | | 68,830,595 | | | | 29,142,517 | | | | 37,952,332 | | | | 45,476,874 | | | | 128,719,580 | | | | 42,753,514 | |
It is each Fund’s policy to comply with the requirements of the Internal Revenue Code of 1986, as amended, applicable to regulated investment companies, and to distribute substantially all of its taxable income to its shareholders. Therefore, no U.S. federal income tax provision is required.
Each Fund files U.S. federal and various state and local tax returns. No income tax returns are currently under examination. The statute of limitations on each Fund’s U.S. federal tax returns generally remains open for each of the four years ended April 30, 2018. The statutes of limitations on each Fund’s state and local tax returns may remain open for an additional year depending upon the jurisdiction.
Management has analyzed tax laws and regulations and their application to the Funds as of April 30, 2018, inclusive of the open tax return years, and does not believe that there are any uncertain tax positions that require recognition of a tax liability in the Funds’ financial statements.
As of April 30, 2018, the Funds had capital loss carryforwards available to offset future realized capital gains through the indicated expiration dates as follows:
| | | | | | | | | | | | |
| Expires April 30, | | MUA | | | MEN | | | MUS | |
No expiration date(a) | | $ | 2,348,073 | | | $ | — | | | $ | 6,959,194 | |
2019 | | | 2,194,154 | | | | 76,432 | | | | — | |
| | | | | | | | | | | | |
| | $ | 4,542,227 | | | $ | 76,432 | | | $ | 6,959,194 | |
| | | | | | | | | | | | |
| | (a) | Must be utilized prior to losses subject to expiration. | |
| | | | |
| NOTESTO FINANCIAL STATEMENTS | | | 93 | |
Notes to Financial Statements (unaudited) (continued)
As of October 31, 2018, gross unrealized appreciation and depreciation for investments and derivatives based on cost for U.S. federal income tax purposes were as follows:
| | | | | | | | | | | | | | | | | | | | | | | | | | | | |
| | | MUA | | | MEN | | | MHD | | | MUH | | | MUS | | | MUI | | | MVT | |
Tax cost | | $ | 471,569,803 | | | $ | 458,026,247 | | | $ | 293,419,602 | | | $ | 212,775,313 | | | $ | 247,081,281 | | | $ | 824,959,979 | | | $ | 427,483,120 | |
| | | | | | | | | | | | | | | | | | | | | | | | | | | | |
Gross unrealized appreciation | | $ | 28,389,908 | | | $ | 22,926,341 | | | $ | 16,556,625 | | | $ | 12,007,452 | | | $ | 9,380,968 | | | $ | 20,943,920 | | | $ | 18,451,829 | |
Gross unrealized depreciation | | | (8,580,315 | ) | | | (5,841,972 | ) | | | (2,062,966 | ) | | | (2,129,405 | ) | | | (2,587,261 | ) | | | (5,166,807 | ) | | | (3,081,014 | ) |
| | | | | | | | | | | | | | | | | | | | | | | | | | | | |
Net unrealized appreciation (depreciation) | | $ | 19,809,593 | | | $ | 17,084,369 | | | $ | 14,493,659 | | | $ | 9,878,047 | | | $ | 6,793,707 | | | $ | 15,777,113 | | | $ | 15,370,815 | |
| | | | | | | | | | | | | | | | | | | | | | | | | | | | |
Many municipalities insure repayment of their bonds, which may reduce the potential for loss due to credit risk. The market value of these bonds may fluctuate for other reasons, including market perception of the value of such insurance, and there is no guarantee that the insurer will meet its obligation.
Inventories of municipal bonds held by brokers and dealers may decrease, which would lessen their ability to make a market in these securities. Such a reduction in market making capacity could potentially decrease a Fund’s ability to buy or sell bonds. As a result, a Fund may sell a security at a lower price, sell other securities to raise cash, or give up an investment opportunity, any of which could have a negative impact on performance. If a Fund needed to sell large blocks of bonds, those sales could further reduce the bonds’ prices and impact performance.
In the normal course of business, certain Funds invest in securities or other instruments and may enter into certain transactions, and such activities subject each Fund to various risks, including among others, fluctuations in the market (market risk) or failure of an issuer to meet all of its obligations. The value of securities or other instruments may also be affected by various factors, including, without limitation: (i) the general economy; (ii) the overall market as well as local, regional or global political and/or social instability; (iii) regulation, taxation or international tax treaties between various countries; or (iv) currency, interest rate and price fluctuations.
Each Fund may be exposed to prepayment risk, which is the risk that borrowers may exercise their option to prepay principal earlier than scheduled during periods of declining interest rates, which would force each Fund to reinvest in lower yielding securities. Each Fund may also be exposed to reinvestment risk, which is the risk that income from each Fund’s portfolio will decline if each Fund invests the proceeds from matured, traded or called fixed-income securities at market interest rates that are below each Fund portfolio’s current earnings rate.
The Funds may hold a significant amount of bonds subject to calls by the issuers at defined dates and prices. When bonds are called by issuers and the Funds reinvest the proceeds received, such investments may be in securities with lower yields than the bonds originally held, and correspondingly, could adversely impact the yield and total return performance of a Fund.
A Fund structures and “sponsors” the TOB Trusts in which it holds TOB Residuals and has certain duties and responsibilities, which may give rise to certain additional risks including, but not limited to, compliance, securities law and operational risks.
Should short-term interest rates rise, the Funds’ investments in the TOB Trusts may adversely affect the Funds’ net investment income and dividends to shareholders. Also, fluctuations in the market value of municipal bonds deposited into the TOB Trust may adversely affect the Funds’ NAVs per share.
The SEC and various federal banking and housing agencies have adopted credit risk retention rules for securitizations (the “Risk Retention Rules”). The Risk Retention Rules would require the sponsor of a TOB Trust to retain at least 5% of the credit risk of the underlying assets supporting the TOB Trust’s municipal bonds. The Risk Retention Rules may adversely affect the Funds’ ability to engage in TOB Trust transactions or increase the costs of such transactions in certain circumstances.
TOB Trusts constitute an important component of the municipal bond market. Any modifications or changes to rules governing TOB Trusts may adversely impact the municipal market and the Funds, including through reduced demand for and liquidity of municipal bonds and increased financing costs for municipal issuers. The ultimate impact of any potential modifications on the TOB Trust market and the overall municipal market is not yet certain.
Counterparty Credit Risk: The Funds may be exposed to counterparty credit risk, or the risk that an entity may fail to or be unable to perform on its commitments related to unsettled or open transactions. The Funds manage counterparty credit risk by entering into transactions only with counterparties that the Manager believes have the financial resources to honor their obligations and by monitoring the financial stability of those counterparties. Financial assets, which potentially expose the Funds to market, issuer and counterparty credit risks, consist principally of financial instruments and receivables due from counterparties. The extent of the Funds’ exposure to market, issuer and counterparty credit risks with respect to these financial assets is approximately their value recorded in the Statements of Assets and Liabilities, less any collateral held by the Funds.
A derivative contract may suffer a mark-to-market loss if the value of the contract decreases due to an unfavorable change in the market rates or values of the underlying instrument. Losses can also occur if the counterparty does not perform under the contract.
With exchange-traded futures, there is less counterparty credit risk to the Funds since the exchange or clearinghouse, as counterparty to such instruments, guarantees against a possible default. The clearinghouse stands between the buyer and the seller of the contract; therefore, credit risk is limited to failure of the clearinghouse. While offset rights may exist under applicable law, a Fund does not have a contractual right of offset against a clearing broker or clearinghouse in the event of a default (including the bankruptcy or insolvency). Additionally, credit risk exists in exchange-traded futures with respect to initial and variation margin that is held in a clearing broker’s customer accounts. While clearing brokers are required to segregate customer margin from their own assets, in the event that a clearing broker becomes insolvent or goes into bankruptcy and at that time there is a shortfall in the aggregate amount of margin held by the clearing broker for all its clients, typically the shortfall would be allocated on a pro rata basis across all the clearing broker’s customers, potentially resulting in losses to the Funds.
| | |
| 94 | | 2018 BLACKROCK SEMI-ANNUAL REPORTTO SHAREHOLDERS |
Notes to Financial Statements (unaudited) (continued)
Concentration Risk: As of period end, MEN, MUS and MUI invested a significant portion of their assets in securities in the Transportation sector. Changes in economic conditions affecting such sectors would have a greater impact on the Funds and could affect the value, income and/or liquidity of positions in such securities.
The Funds invest a significant portion of their assets in fixed-income securities and/or use derivatives tied to the fixed-income markets. Changes in market interest rates or economic conditions may affect the value and/or liquidity of such investments. Interest rate risk is the risk that prices of bonds and other fixed-income securities will increase as interest rates fall and decrease as interest rates rise. The Funds may be subject to a greater risk of rising interest rates due to the current period of historically low rates. The Federal Reserve has begun to raise the Federal Funds rate, and each increase results in more pronounced interest rate risk in the current market environment.
| 10. | CAPITAL SHARE TRANSACTIONS |
Each Fund is authorized to issue 200 million shares, all of which were initially classified as Common Shares. The par value for each Fund’s Common Shares is $0.10. The par value for each Fund’s Preferred Shares outstanding is $0.10. The Board is authorized, however, to reclassify any unissued shares to Preferred Shares without the approval of Common Shareholders.
Common Shares
For the periods shown, shares issued and outstanding increased by the following amounts as a result of dividend reinvestment:
| | | | | | | | | | | | | | | | | | | | | | | | |
| | | MUA | | | MEN | | | MHD | | | MUH | | | MUS | | | MVT | |
Year Ended April 30, 2018 | | | 86,656 | | | | 37,435 | | | | 24,051 | | | | 18,533 | | | | 2,901 | | | | 111,960 | |
For the six months ended October 31, 2018, shares issued and outstanding remained constant for all Funds.
For the year ended April 30, 2018, shares issued and outstanding remained constant for MUI.
Preferred Shares
A Fund’s Preferred Shares rank prior to the Fund’s Common Shares as to the payment of dividends by the Fund and distribution of assets upon dissolution or liquidation of a Fund. The 1940 Act prohibits the declaration of any dividend on Common Shares or the repurchase of Common Shares if the Fund fails to maintain asset coverage of at least 200% of the liquidation preference of its outstanding Preferred Shares. In addition, pursuant to the Preferred Shares’ governing instruments, a Fund is restricted from declaring and paying dividends on classes of shares ranking junior to or on parity with the Fund’s Preferred Shares or repurchasing such shares if a Fund fails to declare and pay dividends on the Preferred Shares, redeem any Preferred Shares required to be redeemed under the Preferred Shares’ governing instruments or comply with the basic maintenance amount requirement of the ratings agencies rating the Preferred Shares.
The holders of Preferred Shares have voting rights equal to the voting rights of the holders of Common Shares (one vote per share) and will vote together with holders of Common Shares (one vote per share) as a single class on certain matters. However, the holders of Preferred Shares, voting as a separate class, are also entitled to (i) elect two members to the Board, (ii) elect the full Board if dividends on the Preferred Shares are not paid for a period of two years and (iii) a separate class vote to amend the Preferred Share governing documents. In addition, the 1940 Act requires the approval of the holders of a majority of any outstanding Preferred Shares, voting as a separate class, to (a) adopt any plan of reorganization that would adversely affect the Preferred Shares, (b) change a Fund’s sub-classification as a closed-end investment company or change its fundamental investment restrictions or (c) change its business so as to cease to be an investment company.
VRDP Shares
MEN has issued Series W-7 VRDP Shares, $100,000 liquidation preference per share, in one or more privately negotiated offerings to qualified institutional buyers as defined pursuant to Rule 144A under the Securities Act of 1933, as amended (the “Securities Act”). The VRDP Shares include a liquidity feature and may be subject to a special rate period. As of period end, the VRDP Shares outstanding were as follows:
| | | | | | | | | | | | | | | | |
| | | Issue
Date | | | Shares
Issued | | | Aggregate
Principal | | | Maturity
Date | |
MEN | | | 05/19/11 | | | | 1,425 | | | $ | 142,500,000 | | | | 06/01/41 | |
Redemption Terms: MEN is required to redeem its VRDP Shares on the maturity date, unless earlier redeemed or repurchased. Six months prior to the maturity date, MEN is required to begin to segregate liquid assets with the Fund’s custodian to fund the redemption. In addition, MEN is required to redeem certain of its outstanding VRDP Shares if it fails to comply with certain asset coverage, basic maintenance amount or leverage requirements.
Subject to certain conditions, the VRDP Shares may also be redeemed, in whole or in part, at any time at the option MEN. The redemption price per VRDP Share is equal to the liquidation preference per share plus any outstanding unpaid dividends.
Liquidity Feature: VRDP Shares are subject to a fee agreement between MEN and the liquidity provider that requires a per annum liquidity fee and, in some cases, an upfront or initial commitment fee, payable to the liquidity provider. These fees, if applicable, are shown as liquidity fees in the Statements of Operations. The fee agreement between MEN and the liquidity provider is scheduled to expire on July 4, 2019 unless renewed or terminated in advance.
| | | | |
| NOTESTO FINANCIAL STATEMENTS | | | 95 | |
Notes to Financial Statements (unaudited) (continued)
In the event a fee agreement is not renewed or is terminated in advance, and MEN does not enter into a fee agreement with an alternate liquidity provider, the VRDP Shares will be subject to mandatory purchase by the liquidity provider prior to the termination of the fee agreement. In the event of such mandatory purchase, MEN is required to redeem the VRDP Shares six months after the purchase date. Immediately after such mandatory purchase, MEN is required to begin to segregate liquid assets with its custodian to fund the redemption. There is no assurance that MEN will replace such redeemed VRDP Shares with any other preferred shares or other form of leverage.
Remarketing: MEN may incur remarketing fees of 0.10% on the aggregate principal amount of all its VRDP Shares, which, if any, are included in remarketing fees on Preferred Shares in the Statements of Operations. During any special rate period (as described below), MEN may incur nominal or no remarketing fees.
Ratings: As of period end, the VRDP Shares were assigned the following long-term ratings:
| | | | | | | | |
| | | Moody’s | | | Fitch | |
MEN | | | Aa1 | | | | AAA | |
Special Rate Period: MEN may commence a “special rate period” with respect to its VRDP Shares, during which the VRDP Shares will not be subject to any remarketing and the dividend rate will be based on a predetermined methodology. During a special rate period, short-term ratings on VRDP Shares are withdrawn. MEN has commenced or is set to commence a special rate period:
| | | | | | | | |
| | | Commencement
Date | | | Expiration Date
as of period ended
10/31/18 | |
MEN | | | 06/21/12 | | | | 06/19/19 | |
Prior to the expiration date, MEN and the VRDP Shares holder may mutually agree to extend the special rate period. If a special rate period is not extended, the VRDP Shares will revert to remarketable securities upon the termination of the special rate period and will be remarketed and available for purchase by qualified institutional investors.
During the special rate period: (i) the liquidity and fee agreements remain in effect, (ii) VRDP Shares remain subject to mandatory redemption by MEN on the maturity date, (iii) VRDP Shares will not be remarketed or subject to optional or mandatory tender events, (iv) MEN is required to comply with the same asset coverage, basic maintenance amount and leverage requirements for the VRDP Shares as is required when the VRDP Shares are not in a special rate period, (v) MEN will pay dividends monthly based on the sum of the Securities Industry and Financial Markets Association (“SIFMA”) Municipal Swap Index rate and a percentage per annum based on the long-term ratings assigned to the VRDP Shares and (vi) MEN will pay nominal or no fees to the liquidity provider and remarketing agent.
If MEN redeems its VRDP Shares prior to end of the special rate period and the VRDP Shares have long-term ratings above A1/A+ and its equivalent by all ratings agencies then rating the VRDP Shares, then such redemption may be subject to a redemption premium payable to the holder of the VRDP Shares based on the time remaining in the special rate period, subject to certain exceptions for redemptions that are required to comply with minimum asset coverage requirements.
Dividends: Except during the Special Rate Period, dividends on the VRDP Shares are payable monthly at a variable rate set weekly by the remarketing agent. Such dividend rates are generally based upon a spread over a base rate and cannot exceed a maximum rate. A change in the short-term credit rating of the liquidity provider or the VRDP Shares may adversely affect the dividend rate paid on such shares, although the dividend rate paid on the VRDP Shares is not directly based upon either short-term rating. In the event of a failed remarketing, the dividend rate of the VRDP Shares will be reset to a maximum rate. The maximum rate is determined based on, among other things, the long-term preferred share rating assigned to the VRDP Shares and the length of time that the VRDP Shares fail to be remarketed.
For the six months ended October 31, 2018, the annualized dividend rate for the VRDP Shares was 2.26%.
For the six months ended October 31, 2018, VRDP Shares issued and outstanding of MEN remained constant.
VMTP Shares
MHD, MUH, MUS, MUI and MVT (for purposes of this section, a “VMTP Fund”) have issued Series W-7 VMTP Shares, $100,000 liquidation preference per share, in one or more privately negotiated offerings to qualified institutional buyers as defined pursuant to Rule 144A under the Securities Act. The VMTP Shares are subject to certain restrictions on transfer, and a VMTP Fund may also be required to register the VMTP Shares for sale under the Securities Act under certain circumstances.
As of period end, the VMTP Shares outstanding were as follows:
| | | | | | | | | | | | | | | | |
| | | Issue
Date | | | Shares
Issued | | | Aggregate
Principal | | | Term
Redemption
Date | |
MHD | | | 12/16/11 | | | | 837 | | | $ | 83,700,000 | | | | 07/02/19 | |
MUH | | | 12/16/11 | | | | 550 | | | | 55,000,000 | | | | 07/02/19 | |
MUS | | | 12/16/11 | | | | 870 | | | | 87,000,000 | | | | 07/02/19 | |
MUI | | | 12/07/12 | | | | 2,871 | | | | 287,100,000 | | | | 07/02/19 | |
MVT | | | 12/16/11 | | | | 1,400 | | | | 140,000,000 | | | | 07/02/19 | |
| | |
| 96 | | 2018 BLACKROCK SEMI-ANNUAL REPORTTO SHAREHOLDERS |
Notes to Financial Statements (unaudited) (continued)
Redemption Terms: A VMTP Fund is required to redeem its VMTP Shares on the term redemption date, unless earlier redeemed or repurchased or unless extended. There is no assurance that the term will be extended further or that VMTP Shares will be replaced with any other preferred shares or other form of leverage upon the redemption or repurchase of the VMTP Shares. Six months prior to the term redemption date, a VMTP Fund is required to begin to segregate liquid assets with its custodian to fund the redemption. In addition, a VMTP Fund is required to redeem certain of its outstanding VMTP Shares if it fails to comply with certain asset coverage, basic maintenance amount or leverage requirements.
Subject to certain conditions, VMTP Shares may be redeemed, in whole or in part, at any time at the option of the VMTP Fund. The redemption price per VMTP Share is equal to the liquidation preference per share plus any outstanding unpaid dividends and applicable redemption premium. If a VMTP Fund redeems the VMTP Shares prior to the term redemption date and the VMTP Shares have long-term ratings above A1/A+ or its equivalent by the ratings agencies then rating the VMTP Shares, then such redemption may be subject to a prescribed redemption premium (up to 3% of the liquidation preference) payable to the holder of the VMTP Shares based on the time remaining until the term redemption date, subject to certain exceptions for redemptions that are required to comply with minimum asset coverage requirements.
Dividends: Dividends on the VMTP Shares are declared daily and payable monthly at a variable rate set weekly at a fixed rate spread to SIFMA Municipal Swap Index. The fixed spread is determined based on the long-term preferred share rating assigned to the VMTP Shares by the ratings agencies then rating the VMTP Shares. As of period end, the VMTP Shares were assigned the following long-term ratings:
| | | | | | | | |
| | | Moody’s | | | Fitch | |
MHD | | | Aa1 | | | | AAA | |
MUH | | | Aa1 | | | | AAA | |
MUS | | | Aa1 | | | | AAA | |
MUI | | | Aa1 | | | | AAA | |
MVT | | | Aa1 | | | | AAA | |
The dividend rate on the VMTP Shares is subject to a step-up spread if the VMPT Funds fail to comply with certain provisions, including, among other things, the timely payment of dividends, redemptions or gross-up payments, and complying with certain asset coverage and leverage requirements.
For the six months ended October 31, 2018, the average annualized dividend rates for the VMTP Shares were as follows:
| | | | | | | | | | | | | | | | | | | | |
| | | MHD | | | MUH | | | MUS | | | MUI | | | MVT | |
Rate | | | 2.39 | % | | | 2.39 | % | | | 2.39 | % | | | 2.39 | % | | | 2.39 | % |
For the six months ended October 31, 2018, VMTP Shares issued and outstanding of each Fund remained constant.
Offering Costs: The Funds incurred costs in connection with the issuance of VRDP and VMTP Shares, which were recorded as a direct deduction from the carrying value of the related debt liability and will be amortized over the life of the VRDP and VMTP Shares with the exception of any upfront fees paid by a VRDP Fund to the liquidity provider which, if any, were amortized over the life of the liquidity agreement. Amortization of these costs is included in interest expense, fees and amortization of offering costs in the Statements of Operations.
MUI’s offering costs that were recorded as a deferred charge and amortized over the 30-year life of MUI’s VMTP Shares were accelerated and charged to expense immediately upon redemption of MUI’s VMTP Shares. Costs incurred in connection with the issuance of MUI’s VMTP Shares were recorded as a deferred charge and will be amortized over the life of the VMTP Shares.
Financial Reporting: The VRDP and VMTP Shares are considered debt of the issuer; therefore, the liquidation preference, which approximates fair value of the VRDP and VMTP Shares, is recorded as a liability in the Statements of Assets and Liabilities net of deferred offering costs. Unpaid dividends are included in interest expense and fees payable in the Statements of Assets and Liabilities, and the dividends accrued and paid on the VRDP and VMTP Shares are included as a component of interest expense, fees and amortization of offering costs in the Statements of Operations. The VRDP and VMTP Shares are treated as equity for tax purposes. Dividends paid to holders of the VRDP and VMTP Shares are generally classified as tax-exempt income for tax-reporting purposes. Dividends and amortization of deferred offering costs on VRDP and VMTP Shares are included in interest expense, fees and amortization of offering costs in the Statements of Operations:
| | | | | | | | |
| | | Dividends Accrued | | | Deferred
Offering
Costs
Amortization | |
MUA | | $ | — | | | $ | — | |
MEN | | | 1,624,012 | | | | 42,531 | |
MHD | | | 1,006,716 | | | | — | |
MUH | | | 661,522 | | | | — | |
MUS | | | 1,046,407 | | | | — | |
MUI | | | 3,453,145 | | | | — | |
MVT | | | 1,683,874 | | | | — | |
| | | | |
| NOTESTO FINANCIAL STATEMENTS | | | 97 | |
Notes to Financial Statements (unaudited) (continued)
| 11. | REGULATION S-X AMENDMENTS |
On August 17, 2018, the SEC adopted amendments to certain disclosure requirements in Securities Act Release No. 33-10532, Disclosure Update and Simplification. The Funds have adopted the amendments pertinent to Regulation S-X in this shareholder report. The amendments impacted certain disclosure presentation on the Statements of Assets and Liabilities, Statements of Changes in Net Assets and Notes to Financial Statements.
Prior year distribution information and undistributed net investment income in the Statements of Changes in Net Assets has been modified to conform to the current year presentation in accordance with the Regulation S-X changes.
Distributions for the year ended April 30, 2018 were classified as follows:
| | | | | | | | |
| | | Net Investment Income | | | Net Realized Gain | |
MUA | | $ | 24,403,775 | | | $ | — | |
MEN | | | 19,006,534 | | | | — | |
MHD | | | 13,034,780 | | | | 189,283 | |
MUH | | | 9,599,378 | | | | 94,182 | |
MUS | | | 9,919,384 | | | | — | |
MUI | | | 22,880,908 | | | | 59,474 | |
MVT | | | 18,273,763 | | | | — | |
Undistributed net investment income as of April 30, 2018 is as follows:
| | | | |
| | | Undistributed
Net Investment Income | |
MUA | | $ | 964,175 | |
MEN | | | 2,730,008 | |
MHD | | | 797,480 | |
MUH | | | 1,379,268 | |
MUS | | | 1,190,147 | |
MUI | | | 1,116,863 | |
MVT | | | 1,315,017 | |
Management’s evaluation of the impact of all subsequent events on the Funds’ financial statements was completed through the date the financial statements were issued and the following items were noted:
| | | | | | | | | | | | | | | | | | | | | | | | |
| | | Common Dividend
Per Share | | | | | | Preferred Shares (c) | |
| | | Paid (a) | | | Declared (b) | | | | | | Shares | | | Series | | | Declared | |
MUA | | $ | 0.0545 | | | $ | 0.0545 | | | | | | | | — | | | | — | | | $ | — | |
MEN | | | 0.0480 | | | | 0.0480 | | | | | | | | VRDP | | | | W-7 | | | | 314,905 | |
MHD | | | 0.0700 | | | | 0.0675 | | | | | | | | VMTP | | | | W-7 | | | | 182,168 | |
MUH | | | 0.0615 | | | | 0.0615 | | | | | | | | VMTP | | | | W-7 | | | | 119,704 | |
MUS | | | 0.0505 | | | | 0.0505 | | | | | | | | VMTP | | | | W-7 | | | | 189,350 | |
MUI | | | 0.0445 | | | | 0.0445 | | | | | | | | VMTP | | | | W-7 | | | | 624,855 | |
MVT | | | 0.0635 | | | | 0.0635 | | | | | | | | VMTP | | | | W-7 | | | | 304,701 | |
| | (a) | Net investment income dividend paid on December 3, 2018 to Common Shareholders of record on November 15, 2018. | |
| | (b) | Net investment income dividend declared on December 3, 2018 payable to Common Shareholders of record on December 13, 2018. | |
| | (c) | Dividends declared for period November 1, 2018 to November 30, 2018. | |
| | | | | | | | | | | | |
| | | Common Dividends Per Share | |
| | | Declared (a) | | | Declared (b) | | | Declared (c) | |
MUA | | $ | 0.004380 | | | $ | — | | | $ | — | |
MEN | | | 0.000160 | | | | — | | | | 0.004955 | |
MHD | | | 0.000669 | | | | 0.016620 | | | | 0.035907 | |
MUH | | | 0.001253 | | | | 0.018947 | | | | 0.033816 | |
MUS | | | — | | | | — | | | | — | |
MUI | | | 0.000421 | | | | — | | | | 0.033545 | |
MVT | | | 0.001559 | | | | 0.004690 | | | | 0.050768 | |
| | (a) | Net investment income special dividend declared amounts per share on December 3, 2018, payable to Common Shareholders of record on December 13, 2018. | |
| | (b) | Special short-term capital gain distribution declared amounts per share on December 3, 2018, payable to Common Shareholders of record on December 13, 2018. | |
| | (c) | Special long-term capital gain distribution declared amounts per share on December 3, 2018, payable to Common Shareholders of record on December 13, 2018. | |
On November 15, 2018, the Board authorized each Fund to participate in an open market share repurchase program. Under the program, each Fund may repurchase up to 5% of its outstanding common shares through November 30, 2019, based on common shares outstanding as of the close of business on November 30, 2018, subject to certain conditions. There is no assurance that the Funds will purchase shares in any particular amounts.
| | |
| 98 | | 2018 BLACKROCK SEMI-ANNUAL REPORTTO SHAREHOLDERS |
Disclosure of Investment Advisory Agreements
The Board of Directors (each, a “Board,” collectively, the “Boards,” and the members of which are referred to as “Board Members”) of BlackRock MuniAssets Fund, Inc. (“MUA”), BlackRock MuniEnhanced Fund, Inc. (“MEN”), BlackRock MuniHoldings Fund, Inc. (“MHD”), BlackRock MuniHoldings Fund II, Inc. (“MUH”), BlackRock MuniHoldings Quality Fund, Inc. (“MUS”), BlackRock Muni Intermediate Duration Fund, Inc. (“MUI”) and BlackRock MuniVest Fund II, Inc. (“MVT,” and together with MUA, MEN, MHD, MUH, MUS and MUI, each, a “Fund,” and, collectively, the “Funds”) met in person on April 24, 2018 (the “April Meeting”) and June 6-7, 2018 (the “June Meeting”) to consider the approval of each Fund’s investment advisory agreement (each, an “Agreement,” and collectively, the “Agreements”) with BlackRock Advisors, LLC (the “Manager”), each Fund’s investment advisor. The Manager is referred to herein as “BlackRock”.
Activities and Composition of the Board
On the date of the June Meeting, the Board of each Fund consisted of ten individuals, eight of whom were not “interested persons” of the Fund as defined in the Investment Company Act of 1940, as amended (the “1940 Act”) (the “Independent Board Members”). The Board Members are responsible for the oversight of the operations of its Fund and perform the various duties imposed on the directors of investment companies by the 1940 Act. The Independent Board Members have retained independent legal counsel to assist them in connection with their duties. The Chair of each Board is an Independent Board Member. Each Board has established five standing committees: an Audit Committee, a Governance and Nominating Committee, a Compliance Committee, a Performance Oversight Committee, and an Executive Committee, each of which is chaired by an Independent Board Member and composed of Independent Board Members (except for the Executive Committee, which also has one interested Board Member).
The Agreements
Pursuant to the 1940 Act, each Board is required to consider the continuation of the Agreement for its Fund on an annual basis. Each Board has four quarterly meetings per year, each typically extending for two days, and additional in-person and telephonic meetings throughout the year, as needed. Each Board also has a fifth one-day meeting to consider specific information surrounding the consideration of renewing the Agreement for its Fund. Each Board’s consideration of the Agreement for its Fund is a year-long deliberative process, during which the Board assessed, among other things, the nature, extent and quality of the services provided to its Fund by BlackRock, BlackRock’s personnel and affiliates, including, as applicable; investment management, accounting, administrative, and shareholder services; oversight of the Fund’s service providers; marketing; risk management and oversight; legal and compliance services; and ability to meet applicable legal and regulatory requirements.
Each Board, acting directly and through its committees, considers at each of its meetings, and from time to time as appropriate, factors that are relevant to its annual consideration of the renewal of the Agreement for its Fund, including the services and support provided by BlackRock to the Fund and its shareholders. BlackRock also furnished additional information to each Board in response to specific questions from the Board. This additional information is discussed further below in the section titled “Board Considerations in Approving the Agreements.” Among the matters each Board considered were: (a) investment performance for one-year, three-year, five-year, ten-year, and/or since inception periods, as applicable, against peer funds, applicable benchmarks, and performance metrics, as applicable, as well as senior management’s and portfolio managers’ analysis of the reasons for any over-performance or underperformance relative to its peers, benchmarks, and other performance metrics, as applicable; (b) leverage management, as applicable; (c) fees, including advisory, administration, if applicable, paid to BlackRock and its affiliates by the Fund for services; (d) Fund operating expenses and how BlackRock allocates expenses to the Fund; (e) the resources devoted to, risk oversight of, and compliance reports relating to, implementation of the Fund’s investment objective(s), policies and restrictions, and meeting regulatory requirements; (f) the Fund’s adherence to its compliance policies and procedures; (g) the nature, character and scope of non-investment management services provided by BlackRock and its affiliates and the estimated cost of such services; (h) BlackRock’s and other service providers’ internal controls and risk and compliance oversight mechanisms; (i) BlackRock’s implementation of the proxy voting policies approved by the Board; (j) execution quality of portfolio transactions; (k) BlackRock’s implementation of the Fund’s valuation and liquidity procedures; (l) an analysis of management fees for products with similar investment mandates across the open-end fund, closed-end fund, sub-advised mutual fund, collective investment trust, and institutional separate account product channels, as applicable, and the similarities and differences between these products and the services provided as compared to the Fund; (m) BlackRock’s compensation methodology for its investment professionals and the incentives and accountability it creates, along with investment professionals’ investments in the fund(s) they manage; and (n) periodic updates on BlackRock’s business.
The Board of each of MEN, MHD, MUH, MUS, MUI and MVT considered BlackRock’s efforts during the past several years with regard to the redemption of outstanding auction rate preferred securities. Each of MEN, MHD, MUH, MUS, MUI and MVT has redeemed all of its outstanding auction rate preferred securities.
Board Considerations in Approving the Agreements
The Approval Process: Prior to the April Meeting, each Board requested and received materials specifically relating to the Agreement for its Fund. Each Board is continuously engaged in a process with its independent legal counsel and BlackRock to review the nature and scope of the information provided to better assist its deliberations. The materials provided in connection with the April Meeting included, among other things: (a) information independently compiled and prepared by Broadridge Financial Solutions, Inc. (“Broadridge”), based on Lipper classifications, regarding the Funds’ fees and expenses as compared with a peer group of funds as determined by Broadridge (“Expense Peers”) and the investment performance of the Funds’ as compared with a peer group of funds (“Performance Peers”) and other metrics, as applicable; (b) information on the composition of the Expense Peers and Performance Peers, and a description of the Broadridge’s methodology; (c) information on the estimated profits realized by BlackRock and its affiliates pursuant to each Fund’s Agreement and a discussion of fall-out benefits to BlackRock and its affiliates; (d) a general analysis provided by BlackRock concerning investment management fees received in connection with other types of investment products, such as institutional accounts, sub-advised mutual funds, closed-end funds, and open-end funds, under similar investment mandates, as applicable; (e) review of non-management fees; (f) the existence and impact and sharing of potential economies of scale, if any, and the sharing of potential economies of scale with each Fund; (g) a summary of aggregate amounts paid by each Fund to BlackRock; and (h) various additional information requested by each Board as appropriate regarding BlackRock’s and the operations of its Fund.
| | | | |
| DISCLOSUREOF INVESTMENT ADVISORY AGREEMENTS | | | 99 | |
Disclosure of Investment Advisory Agreements (continued)
At the April Meeting, each Board reviewed materials relating to its consideration of the Agreement for its Fund. As a result of the discussions that occurred during the April Meeting, and as a culmination of each Board’s year-long deliberative process, each Board presented BlackRock with questions and requests for additional information. BlackRock responded to these requests with additional written information in advance of the June Meeting.
At the June Meeting, each Board considered, among other things: (a) the nature, extent and quality of the services provided by BlackRock; (b) the investment performance of the Fund as compared with Performance Peers and other metrics, as applicable; (c) the advisory fee and the estimated cost of the services and estimated profits realized by BlackRock and its affiliates from their relationship with the Fund; (d) the Fund’s fees and expenses compared to Expense Peers; (e) the sharing of potential economies of scale; (f) fall-out benefits to BlackRock and its affiliates as a result of BlackRock’s relationship with the Fund; and (g) other factors deemed relevant by the Board Members.
Each Board also considered other matters it deemed important to the approval process, such as other payments made to BlackRock or its affiliates relating to securities lending and cash management, services related to the valuation and pricing of Fund portfolio holdings, and advice from independent legal counsel with respect to the review process and materials submitted for the Board’s review. Each Board noted the willingness of BlackRock personnel to engage in open, candid discussions with the Board. Each Board did not identify any particular information as determinative, and each Board Member may have attributed different weights to the various items considered.
A. Nature, Extent and Quality of the Services Provided by BlackRock: Each Board, including the Independent Board Members, reviewed the nature, extent and quality of services provided by BlackRock, including the investment advisory services and the resulting performance of its Fund. Throughout the year, each Board compared its Fund’s performance to the performance of a comparable group of closed-end funds, relevant benchmark, and performance metrics, as applicable. Each Board met with BlackRock’s senior management personnel responsible for investment activities, including the senior investment officers. Each Board also reviewed the materials provided by its Fund’s portfolio management team discussing the Fund’s performance and the Fund’s investment objective(s), strategies and outlook.
Each Board considered, among other factors, with respect to BlackRock: the number, education and experience of investment personnel generally and its Fund’s portfolio management team; BlackRock’s research capabilities; investments by portfolio managers in the funds they manage; portfolio trading capabilities; use of technology; commitment to compliance; credit analysis capabilities; risk analysis and oversight capabilities; and the approach to training and retaining portfolio managers and other research, advisory and management personnel. Each Board also considered BlackRock’s overall risk management program, including the continued efforts of BlackRock and its affiliates to address cybersecurity risks and the role of BlackRock’s Risk & Quantitative Analysis Group. Each Board engaged in a review of BlackRock’s compensation structure with respect to its Fund’s portfolio management team and BlackRock’s ability to attract and retain high-quality talent and create performance incentives.
In addition to investment advisory services, each Board considered the quality of the administrative and other non-investment advisory services provided to its Fund. BlackRock and its affiliates provide each Fund with certain administrative, shareholder, and other services (in addition to any such services provided to its Fund by third parties) and officers and other personnel as are necessary for the operations of the Fund. In particular, BlackRock and its affiliates provide each Fund with administrative services including, among others: (i) responsibility for disclosure documents, such as the prospectus and the statement of additional information in connection with the initial public offering and periodic shareholder reports; (ii) preparing communications with analysts to support secondary market trading of the Fund; (iii) oversight of daily accounting and pricing; (iv) responsibility for periodic filings with regulators and stock exchanges; (v) overseeing and coordinating the activities of other service providers including, among others, the Fund’s custodian, fund accountant, transfer agent, and auditor; (vi) organizing Board meetings and preparing the materials for such Board meetings; (vii) providing legal and compliance support; (viii) furnishing analytical and other support to assist the Board in its consideration of strategic issues such as the merger, consolidation or repurposing of certain closed-end funds; and (ix) performing administrative functions necessary for the operation of the Fund, such as tax reporting, expense management, fulfilling regulatory filing requirements, and shareholder call center and other services. The Board reviewed the structure and duties of BlackRock’s fund administration, shareholder services, and legal & compliance departments and considered BlackRock’s policies and procedures for assuring compliance with applicable laws and regulations.
B. The Investment Performance of the Funds and BlackRock: Each Board, including the Independent Board Members, also reviewed and considered the performance history of its Fund. In preparation for the April Meeting, each Board was provided with reports independently prepared by Broadridge, which included a comprehensive analysis of its Fund’s performance as of December 31, 2017. The performance information is based on net asset value (NAV), and utilizes Lipper data. Lipper’s methodology calculates a fund’s total return assuming distributions are reinvested on the ex-date at a fund’s ex-date NAV. Broadridge ranks funds in quartiles, ranging from first to fourth, where first is the most desirable quartile position and fourth is the least desirable. In connection with its review, each Board received and reviewed information regarding the investment performance of its Fund as compared to its Performance Peers and a custom peer group of funds as defined by BlackRock (“Customized Peer Group”). Each Board and its Performance Oversight Committee regularly review, and meet with Fund management to discuss, the performance of the Fund throughout the year.
In evaluating performance, each Board recognized that the performance data reflects a snapshot of a period as of a particular date and that selecting a different performance period could produce significantly different results. Further, each Board recognized that it is possible that long-term performance can be impacted by even one period of significant outperformance or underperformance, so that a single investment theme has the ability to affect long-term performance disproportionately.
The Board of MUA noted that for each of the one-, three- and five-year periods reported, MUA ranked second out of three funds against its Customized Peer Group Composite. BlackRock believes that the Customized Peer Group Composite is an appropriate performance metric for MUA. The Composite measures a blend of total return and yield. The Board and BlackRock reviewed MUA’s underperformance during the applicable periods.
The Board of each of MEN and MUS noted that for each of the one-, three- and five-year periods reported, its Fund ranked first out of two funds against its Customized Peer Group Composite. BlackRock believes that the Customized Peer Group Composite is an appropriate performance metric for MEN and MUS. The Composite measures a blend of total return and yield.
| | |
| 100 | | 2018 BLACKROCK SEMI-ANNUAL REPORTTO SHAREHOLDERS |
Disclosure of Investment Advisory Agreements (continued)
The Board of each of MHD and MVT noted that for the one-, three- and five-year periods reported, its Fund ranked in the second, second and first quartiles, respectively, against its Customized Peer Group Composite. BlackRock believes that the Customized Peer Group Composite is an appropriate performance metric for MHD and MVT. The Composite measures a blend of total return and yield.
The Board of MUH noted that for the one-, three- and five-year periods reported, MUH ranked in the second, fourth and second quartiles, respectively, against its Customized Peer Group Composite. BlackRock believes that the Customized Peer Group Composite is an appropriate performance metric for MUH. The Composite measures a blend of total return and yield. The Board and BlackRock reviewed the Fund’s underperformance during the applicable period. The Board was informed that, among other things, MUH’s short duration position was the primary detractor of performance over the three-year period.
The Board and BlackRock discussed BlackRock’s strategy for improving MUH’s investment performance. Discussions covered topics such as performance attribution, MUH’s investment personnel, and the resources appropriate to support the Fund’s investment processes.
The Board of MUI noted that for the one-, three- and five-year periods reported, MUI ranked in the third quartile, second quartile, and third out of four funds, respectively, against its Customized Peer Group Composite. BlackRock believes that the Customized Peer Group Composite is an appropriate performance metric for MUI. The Composite measures a blend of total return and yield. The Board and BlackRock reviewed MUI’s underperformance during the applicable periods.
C. Consideration of the Advisory/Management Fees and the Estimated Cost of the Services and Estimated Profits Realized by BlackRock and its Affiliates from their Relationship with the Funds: Each Board, including the Independent Board Members, reviewed its Fund’s contractual management fee rate compared with those of its Expense Peers. The contractual management fee rate represents a combination of the advisory fee and any administrative fees, before taking into account any reimbursements or fee waivers. Each Board also compared its Fund’s total expense ratio, as well as its actual management fee rate as a percentage of total assets, to those of its Expense Peers. The total expense ratio represents a fund’s total net operating expenses, excluding any investment related expenses. The total expense ratio gives effect to any expense reimbursements or fee waivers that benefit a fund, and the actual management fee rate gives effect to any management fee reimbursements or waivers that benefit a fund. Each Board considered the services provided and the fees charged by BlackRock and its affiliates to other types of clients with similar investment mandates, as applicable, including institutional accounts and sub-advised mutual funds (including mutual funds sponsored by third parties).
Each Board received and reviewed statements relating to BlackRock’s financial condition. Each Board reviewed BlackRock’s profitability methodology and was also provided with an estimated profitability analysis that detailed the revenues earned and the expenses incurred by BlackRock for services provided to its Fund. Each Board reviewed BlackRock’s estimated profitability with respect to its Fund and other funds the Board currently oversees for the year ended December 31, 2017 compared to available aggregate estimated profitability data provided for the prior two years. Each Board reviewed BlackRock’s estimated profitability with respect to certain other U.S. fund complexes managed by the Manager and/or its affiliates. Each Board reviewed BlackRock’s assumptions and methodology of allocating expenses in the estimated profitability analysis, noting the inherent limitations in allocating costs among various advisory products. Each Board recognized that profitability may be affected by numerous factors including, among other things, fee waivers and expense reimbursements by the Manager, the types of funds managed, precision of expense allocations and business mix. As a result, calculating and comparing profitability at individual fund levels is difficult.
Each Board noted that, in general, individual fund or product line profitability of other advisors is not publicly available. Each Board reviewed BlackRock’s overall operating margin, in general, compared to that of certain other publicly-traded asset management firms. Each Board considered the differences between BlackRock and these other firms, including the contribution of technology at BlackRock, BlackRock’s expense management, and the relative product mix.
In addition, each Board considered the estimated cost of the services provided to its Fund by BlackRock, and BlackRock’s and its affiliates’ estimated profits relating to the management of its Fund and the other funds advised by BlackRock and its affiliates. As part of its analysis, each Board reviewed BlackRock’s methodology in allocating its costs of managing its Fund, to the Fund. Each Board considered whether BlackRock has the financial resources necessary to attract and retain high quality investment management personnel to perform its obligations under the Agreement for its Fund and to continue to provide the high quality of services that is expected by the Board. Each Board further considered factors including but not limited to BlackRock’s commitment of time, assumption of risk, and liability profile in servicing its Fund in contrast to what is required of BlackRock with respect to other products with similar investment mandates across the open-end fund, closed-end fund, sub-advised mutual fund, collective investment trust, and institutional separate account product channels, as applicable.
The Board of each of MUA, MEN, MHD, MUH, MUS and MVT noted that its Fund’s contractual management fee rate ranked in the first quartile, and that the actual management fee rate and total expense ratio each ranked in the first quartile, relative to the Expense Peers.
The Board of MUI noted that the Fund’s contractual management fee rate ranked in the second quartile, and that the actual management fee rate and total expense ratio ranked in the second and third quartiles, respectively, relative to the Expense Peers.
D. Economies of Scale: Each Board, including the Independent Board Members, considered the extent to which economies of scale might be realized as the assets of its Fund increase. Each Board also considered the extent to which its Fund benefits from such economies in a variety of ways, and whether there should be changes in the advisory fee rate or breakpoint structure in order to enable the Fund to more fully participate in these economies of scale. Each Board considered the Fund’s asset levels and whether the current fee was appropriate.
Based on each Board’s review and consideration of the issue, each Board concluded that most closed-end funds do not have fund level breakpoints because closed-end funds generally do not experience substantial growth after the initial public offering. They are typically priced at scale at a fund’s inception.
E. Other Factors Deemed Relevant by the Board Members: Each Board, including the Independent Board Members, also took into account other ancillary or “fall-out” benefits that BlackRock or its affiliates may derive from BlackRock’s respective relationships with its Fund, both tangible and intangible, such as BlackRock’s ability to leverage its investment professionals who manage other portfolios and risk management personnel, an increase in BlackRock’s profile in the investment advisory community, and the engagement of BlackRock’s affiliates as service providers to the Fund, including for administrative, securities lending and cash management services. Each Board also considered BlackRock’s overall operations and its efforts to expand the scale of, and improve the quality of, its operations. Each Board also noted that,
| | | | |
| DISCLOSUREOF INVESTMENT ADVISORY AGREEMENTS | | | 101 | |
Disclosure of Investment Advisory Agreements (continued)
subject to applicable law, BlackRock may use and benefit from third party research obtained by soft dollars generated by certain registered fund transactions to assist in managing all or a number of its other client accounts.
In connection with its consideration of the Agreement for its Fund, each Board also received information regarding BlackRock’s brokerage and soft dollar practices. Each Board received reports from BlackRock which included information on brokerage commissions and trade execution practices throughout the year.
Each Board noted the competitive nature of the closed-end fund marketplace, and that shareholders are able to sell their Fund shares in the secondary market if they believe that the Fund’s fees and expenses are too high or if they are dissatisfied with the performance of the Fund.
Each Board also considered the various notable initiatives and projects BlackRock performed in connection with its closed-end fund product line. These initiatives included the completion of the redemption of auction rate preferred securities for all of the BlackRock closed-end funds; developing equity shelf programs; efforts to eliminate product overlap with fund mergers; ongoing services to manage leverage that has become increasingly complex; periodic evaluation of share repurchases and other support initiatives for certain BlackRock funds; and continued communications efforts with shareholders, fund analysts and financial advisers. With respect to the latter, the Independent Board Members of each Fund noted BlackRock’s continued commitment to supporting the secondary market for the common shares of its closed-end funds through a comprehensive secondary market communication program designed to raise investor and analyst awareness and understanding of closed-end funds. BlackRock’s support services included, among other things: sponsoring and participating in conferences; communicating with closed-end fund analysts covering the BlackRock funds throughout the year; providing marketing and product updates for the closed-end funds; and maintaining and enhancing its closed-end fund website.
Conclusion
Each Board, including the Independent Board Members, unanimously approved the continuation of the Agreement between the Manager and its Fund for a one-year term ending June 30, 2019. Based upon its evaluation of all of the aforementioned factors in their totality, as well as other information, each Board, including the Independent Board Members, was satisfied that the terms of the Agreement for its Fund were fair and reasonable and in the best interest of the Fund and its shareholders. In arriving at its decision to approve the Agreement for its Fund, each Board did not identify any single factor or group of factors as, all-important or controlling, but considered all factors together, and different Board Members may have attributed different weights to the various factors considered. The Independent Board Members of each Fund were also assisted by the advice of independent legal counsel in making this determination.
| | |
| 102 | | 2018 BLACKROCK SEMI-ANNUAL REPORTTO SHAREHOLDERS |
Director and Officer Information
Richard E. Cavanagh, Chair of the Board and Director
Karen P. Robards, Vice Chair of the Board and Director
Michael J. Castellano, Director
Cynthia L. Egan, Director
Frank J. Fabozzi, Director
R. Glenn Hubbard, Director
W. Carl Kester, Director
Catherine A. Lynch, Director
Robert Fairbairn, Director
John M. Perlowski, Director, President and Chief Executive Officer
Jonathan Diorio, Vice President
Neal J. Andrews, Chief Financial Officer
Jay M. Fife, Treasurer
Charles Park, Chief Compliance Officer
Janey Ahn, Secretary
Effective January 1, 2019, Henry Gabbay is appointed as an Independent Director of the Funds.
Investment Adviser
BlackRock Advisors, LLC
Wilmington, DE 19809
Transfer Agent
Computershare Trust Company, N.A.
Canton, MA 02021
VRDP Tender and Paying Agent and VMTP Redemption and Paying Agent
The Bank of New York Mellon
New York, NY 10289
VRDP Remarketing Agent
Citigroup Global Markets Inc.(a)
New York, NY 10179
VRDP Liquidity Provider
Citibank, N.A.(a)
New York, NY 10179
Accounting Agent and Custodian
State Street Bank and Trust Company
Boston, MA 02111
Independent Registered
Public Accounting Firm
Deloitte & Touche LLP
Boston, MA 02116
Legal Counsel
Skadden, Arps, Slate, Meagher & Flom LLP
Boston, MA 02116
Address of the Funds
100 Bellevue Parkway
Wilmington, DE 19809
| | | | |
| DIRECTORAND OFFICER INFORMATION | | | 103 | |
Additional Information
Proxy Results
The Annual Meeting of Shareholders was held on July 30, 2018 for shareholders of record on May 31 2018, to elect director nominees for each Fund. There were no broker non-votes with regard to any of the Funds.
Shareholders elected the Class II Directors & Class III Director as follows:
| | | | | | | | | | | | | | | | | | | | | | | | | | | | | | | | |
| | | Frank J. Fabozzi (a) | | | Robert Fairbairn (b) | | | Catherine A. Lynch (a) | | | Karen P. Robards (a) | |
| | | Votes For | | | Votes Withheld | | | Votes For | | | Votes Withheld | | | Votes For | | | Votes Withheld | | | Votes For | | | Votes Withheld | |
MUA | | | 33,488,233 | | | | 1,209,322 | | | | 33,756,449 | | | | 941,106 | | | | 33,789,330 | | | | 908,225 | | | | 33,684,110 | | | | 1,013,445 | |
For the Fund listed above, Directors whose term of office continued after the Annual Meeting of Shareholders because they were not up for election are Michael J. Castellano, Richard E. Cavanagh, Cynthia L. Egan, R. Glenn Hubbard, John M. Perlowski and W. Carl Kester.
Shareholders elected the Directors as follows:
| | | | | | | | | | | | | | | | | | | | | | | | |
| | | Michael J. Castellano | | | Richard E. Cavanagh | | | Cynthia L. Egan | |
| | | Votes For | | | Votes Withheld | | | Votes For | | | Votes Withheld | | | Votes For | | | Votes Withheld | |
MEN | | | 27,634,267 | | | | 513,220 | | | | 27,589,860 | | | | 557,627 | | | | 27,569,786 | | | | 577,701 | |
MHD | | | 13,474,429 | | | | 437,906 | | | | 13,391,691 | | | | 520,644 | | | | 13,354,164 | | | | 558,171 | |
MUH | | | 10,568,233 | | | | 312,686 | | | | 10,571,693 | | | | 309,226 | | | | 10,554,635 | | | | 326,284 | |
MUS | | | 11,728,284 | | | | 641,171 | | | | 11,752,944 | | | | 616,511 | | | | 11,882,918 | | | | 486,537 | |
MUI | | | 35,226,098 | | | | 1,354,486 | | | | 34,665,081 | | | | 1,915,503 | | | | 35,046,781 | | | | 1,533,803 | |
MVT | | | 20,101,583 | | | | 429,937 | | | | 20,120,718 | | | | 410,802 | | | | 20,132,709 | | | | 398,811 | |
| | | | | | | | | | | | | | | | | | | | | | | | |
| | | Robert Fairbairn | | | R. Glenn Hubbard | | | Catherine A. Lynch | |
| | | Votes For | | | Votes Withheld | | | Votes For | | | Votes Withheld | | | Votes For | | | Votes Withheld | |
MEN | | | 27,613,423 | | | | 534,064 | | | | 27,427,438 | | | | 720,049 | | | | 27,620,062 | | | | 527,425 | |
MHD | | | 13,521,103 | | | | 391,232 | | | | 13,299,291 | | | | 613,044 | | | | 13,354,164 | | | | 558,171 | |
MUH | | | 10,681,032 | | | | 199,887 | | | | 10,579,982 | | | | 300,937 | | | | 10,559,027 | | | | 321,892 | |
MUS | | | 11,903,256 | | | | 466,199 | | | | 11,850,559 | | | | 518,896 | | | | 11,802,381 | | | | 567,074 | |
MUI | | | 35,449,820 | | | | 1,130,764 | | | | 34,520,591 | | | | 2,059,993 | | | | 35,114,369 | | | | 1,466,215 | |
MVT | | | 20,181,036 | | | | 350,484 | | | | 20,109,953 | | | | 421,567 | | | | 20,138,622 | | | | 392,898 | |
| | | | | | | | | | | | | | | | | | | | | | | | |
| | | | | | | | | | | | | | | | | | | | | | | | | | | | | | | | |
| | | John M. Perlowski | | | Karen P. Robards | | | Frank J. Fabozzi (c) | | | W. Carl Kester (c) | |
| | | Votes For | | | Votes Withheld | | | Votes For | | | Votes Withheld | | | Votes For | | | Votes Withheld | | | Votes For | | | Votes Withheld | |
MEN | | | 27,671,921 | | | | 475,566 | | | | 27,557,889 | | | | 589,598 | | | | 1,425 | | | | 0 | | | | 1,425 | | | | 0 | |
MHD | | | 13,534,692 | | | | 377,643 | | | | 13,430,248 | | | | 482,087 | | | | 837 | | | | 0 | | | | 837 | | | | 0 | |
MUH | | | 10,687,384 | | | | 193,535 | | | | 10,564,599 | | | | 316,320 | | | | 550 | | | | 0 | | | | 550 | | | | 0 | |
MUS | | | 11,882,511 | | | | 486,944 | | | | 11,704,108 | | | | 665,347 | | | | 870 | | | | 0 | | | | 870 | | | | 0 | |
MUI | | | 35,445,184 | | | | 1,135,400 | | | | 35,153,342 | | | | 1,427,242 | | | | 2,871 | | | | 0 | | | | 2,871 | | | | 0 | |
MVT | | | 20,186,271 | | | | 345,249 | | | | 20,131,287 | | | | 400,233 | | | | 1,400 | | | | 0 | | | | 1,400 | | | | 0 | |
| | (C) | Voted on by holders of Preferred Shares only. | |
Fund Certification
Certain Funds are listed for trading on the NYSE and have filed with the NYSE their annual chief executive officer certification regarding compliance with the NYSE’s listing standards. The Funds filed with the SEC the certification of its chief executive officer and chief financial officer required by section 302 of the Sarbanes-Oxley Act.
Dividend Policy
Each Fund’s dividend policy is to distribute all or a portion of its net investment income to its shareholders on a monthly basis. In order to provide shareholders with a more stable level of distributions, the Funds may at times pay out less than the entire amount of net investment income earned in any particular month and may at times in any particular month pay out such accumulated but undistributed income in addition to net investment income earned in that month. As a result, the distributions paid by the Funds for any particular month may be more or less than the amount of net investment income earned by the Funds during such month. The Funds’ current accumulated but undistributed net investment income, if any, is disclosed in the Statements of Assets and Liabilities, which comprises part of the financial information included in this report.
| | |
| 104 | | 2018 BLACKROCK SEMI-ANNUAL REPORTTO SHAREHOLDERS |
Additional Information (continued)
General Information
The Funds do not make available copies of their Statements of Additional Information because the Funds’ shares are not continuously offered, which means that the Statement of Additional Information of each Fund has not been updated after completion of the respective Fund’s offerings and the information contained in each Fund’s Statement of Additional Information may have become outdated.
During the period, there were no material changes in the Funds’ investment objectives or policies or to the Funds’ charters or by-laws that would delay or prevent a change of control of the Funds that were not approved by the shareholders or in the principal risk factors associated with investment in the Funds. There have been no changes in the persons who are primarily responsible for the day-to-day management of the Funds’ portfolios.
In accordance with Section 23(c) of the Investment Company Act of 1940, each Fund may from time to time purchase shares of its common stock in open market or in private transactions.
Quarterly performance, semi-annual and annual reports, current net asset value and other information regarding the Funds may be found on BlackRock’s website, which can be accessed at http://www.blackrock.com. Any reference to BlackRock’s website in this report is intended to allow investors public access to information regarding the Funds and does not, and is not intended to, incorporate BlackRock’s website in this report.
Electronic Delivery
Shareholders can sign up for e-mail notifications of quarterly statements, annual and semi-annual shareholder reports by enrolling in the electronic delivery program. Electronic copies of shareholder reports are available on BlackRock’s website.
To enroll in electronic delivery:
Shareholders Who Hold Accounts with Investment Advisers, Banks or Brokerages:
Please contact your financial advisor. Please note that not all investment advisers, banks or brokerages may offer this service.
Householding
The Funds will mail only one copy of shareholder documents, annual and semi-annual reports and proxy statements, to shareholders with multiple accounts at the same address. This practice is commonly called “householding” and is intended to reduce expenses and eliminate duplicate mailings of shareholder documents. Mailings of your shareholder documents may be householded indefinitely unless you instruct us otherwise. If you do not want the mailing of these documents to be combined with those for other members of your household, please call the Funds at (800) 882-0052.
Availability of Quarterly Schedule of Investments
The Funds file their complete schedule of portfolio holdings with the SEC for the first and third quarters of each fiscal year on Form N-Q. The Funds’ Forms N-Q are available on the SEC’s website at http://www.sec.gov. The Funds’ Forms N-Q may also be obtained upon request and without charge by calling (800) 882-0052.
Availability of Proxy Voting Policies and Procedures
A description of the policies and procedures that the Funds use to determine how to vote proxies relating to portfolio securities is available upon request and without charge (1) by calling (800) 882-0052; (2) at http://www.blackrock.com; and (3) on the SEC’s website at http://www.sec.gov.
Availability of Proxy Voting Record
Information about how the Funds voted proxies relating to securities held in the Funds’ portfolios during the most recent 12-month period ended June 30 is available upon request and without charge (1) at http://www.blackrock.com; or by calling (800) 882-0052; and (2) on the SEC’s website at http://www.sec.gov.
Availability of Fund Updates
BlackRock will update performance and certain other data for the Funds on a monthly basis on its website in the “Closed-end Funds” section of http://www.blackrock.com as well as certain other material information as necessary from time to time. Investors and others are advised to check the website for updated performance information and the release of other material information about the Funds. This reference to BlackRock’s website is intended to allow investors public access to information regarding the Funds and does not, and is not intended to, incorporate BlackRock’s website in this report.
| | | | |
| ADDITIONAL INFORMATION | | | 105 | |
Additional Information (continued)
BlackRock Privacy Principles
BlackRock is committed to maintaining the privacy of its current and former fund investors and individual clients (collectively, “Clients”) and to safeguarding their non-public personal information. The following information is provided to help you understand what personal information BlackRock collects, how we protect that information and why in certain cases we share such information with select parties.
If you are located in a jurisdiction where specific laws, rules or regulations require BlackRock to provide you with additional or different privacy-related rights beyond what is set forth below, then BlackRock will comply with those specific laws, rules or regulations.
BlackRock obtains or verifies personal non-public information from and about you from different sources, including the following: (i) information we receive from you or, if applicable, your financial intermediary, on applications, forms or other documents; (ii) information about your transactions with us, our affiliates, or others; (iii) information we receive from a consumer reporting agency; and (iv) from visits to our websites.
BlackRock does not sell or disclose to non-affiliated third parties any non-public personal information about its Clients, except as permitted by law or as is necessary to respond to regulatory requests or to service Client accounts. These non-affiliated third parties are required to protect the confidentiality and security of this information and to use it only for its intended purpose.
We may share information with our affiliates to service your account or to provide you with information about other BlackRock products or services that may be of interest to you. In addition, BlackRock restricts access to non-public personal information about its Clients to those BlackRock employees with a legitimate business need for the information. BlackRock maintains physical, electronic and procedural safeguards that are designed to protect the non-public personal information of its Clients, including procedures relating to the proper storage and disposal of such information.
| | |
| 106 | | 2018 BLACKROCK SEMI-ANNUAL REPORTTO SHAREHOLDERS |
Glossary of Terms Used in this Report
| | |
| Portfolio Abbreviations |
| |
| AGC | | Assured Guarantee Corp. |
| AGM | | Assured Guaranty Municipal Corp. |
| AMBAC | | American Municipal Bond Assurance Corp. |
| AMT | | Alternative Minimum Tax (subject to) |
| ARB | | Airport Revenue Bonds |
| BAM | | Build America Mutual Assurance Co. |
| BARB | | Building Aid Revenue Bonds |
| CAB | | Capital Appreciation Bonds |
| COP | | Certificates of Participation |
| EDA | | Economic Development Authority |
| EDC | | Economic Development Corp. |
| ERB | | Education Revenue Bonds |
| FHA | | Federal Housing Administration |
| GARB | | General Airport Revenue Bonds |
| GO | | General Obligation Bonds |
| GTD | | Guaranteed |
| HFA | | Housing Finance Agency |
| IDA | | Industrial Development Authority |
| IDB | | Industrial Development Board |
| ISD | | Independent School District |
| LRB | | Lease Revenue Bonds |
| M/F | | Multi-Family |
| MRB | | Mortgage Revenue Bonds |
| NPFGC | | National Public Finance Guarantee Corp. |
| PSF | | Permanent School Fund |
| Q-SBLF | | Qualified School Bond Loan Fund |
| RB | | Revenue Bonds |
| S/F | | Single-Family |
| SONYMA | | State of New York Mortgage Agency |
| | | | |
| GLOSSARYOF TERMS USEDINTHIS REPORT | | | 107 | |
This report is intended for current holders. It is not a prospectus. Past performance results shown in this report should not be considered a representation of future performance. The Funds have leveraged their Common Shares, which creates risks for Common Shareholders, including the likelihood of greater volatility of net asset value and market price of the Common Shares, and the risk that fluctuations in short-term interest rates may reduce the Common Shares’ yield. Statements and other information herein are as dated and are subject to change.

| | |
| CEMUNI7-10/18-SAR | |  |
| | |
Item 2 – | | Code of Ethics – Not Applicable to this semi-annual report |
| |
Item 3 – | | Audit Committee Financial Expert – Not Applicable to this semi-annual report |
| |
Item 4 – | | Principal Accountant Fees and Services – Not Applicable to this semi-annual report |
| |
Item 5 – | | Audit Committee of Listed Registrants – Not Applicable to this semi-annual report |
| |
Item 6 – | | Investments |
| |
| | (a) The registrant’s Schedule of Investments is included as part of the Report to Stockholders filed under Item 1 of this Form. |
| |
| | (b) Not Applicable due to no such divestments during the semi-annual period covered since the previous Form N-CSR filing. |
| |
Item 7 – | | Disclosure of Proxy Voting Policies and Procedures for Closed-End Management Investment Companies – Not Applicable to this semi-annual report |
| |
Item 8 – | | Portfolio Managers of Closed-End Management Investment Companies |
| |
| | (a) Not Applicable to this semi-annual report |
| |
| | (b) As of the date of this filing, there have been no changes in any of the portfolio managers identified in the most recent annual report on Form N-CSR. |
| |
Item 9 – | | Purchases of Equity Securities by Closed-End Management Investment Company and Affiliated Purchasers – Not Applicable |
| |
Item 10 – | | Submission of Matters to a Vote of Security Holders – There have been no material changes to these procedures. |
| |
Item 11 – | | Controls and Procedures |
| |
| | (a) The registrant’s principal executive and principal financial officers, or persons performing similar functions, have concluded that the registrant’s disclosure controls and procedures (as defined in Rule 30a-3(c) under the Investment Company Act of 1940, as amended (the “1940 Act”)) are effective as of a date within 90 days of the filing of this report based on the evaluation of these controls and procedures required by Rule 30a-3(b) under the 1940 Act and Rule 13a-15(b) under the Securities Exchange Act of 1934, as amended. |
| |
| | (b) There were no changes in the registrant’s internal control over financial reporting (as defined in Rule 30a-3(d) under the 1940 Act) that occurred during the second fiscal quarter of the period covered by this report that have materially affected, or are reasonably likely to materially affect, the registrant’s internal control over financial reporting. |
| |
Item 12 – | | Disclosure of Securities Lending Activities for Closed-End Management Investment Companies – Not Applicable |
| |
Item 13 – | | Exhibits attached hereto |
| |
| | (a)(1) – Code of Ethics – Not Applicable to this semi-annual report |
| |
| | (a)(2) – Certifications – Attached hereto |
| |
| | (a)(3) – Not Applicable |
| |
| | (a)(4) – Not Applicable |
| |
| | (b) – Certifications – Attached hereto |
2
Pursuant to the requirements of the Securities Exchange Act of 1934 and the Investment Company Act of 1940, the registrant has duly caused this report to be signed on its behalf by the undersigned, thereunto duly authorized.
BlackRock MuniEnhanced Fund, Inc.
| | |
| By: | | /s/ John M. Perlowski |
| | John M. Perlowski |
| | Chief Executive Officer (principal executive officer) of |
| | BlackRock MuniEnhanced Fund, Inc. |
| |
| Date: | | January 4, 2019 |
Pursuant to the requirements of the Securities Exchange Act of 1934 and the Investment Company Act of 1940, this report has been signed below by the following persons on behalf of the registrant and in the capacities and on the dates indicated.
| | |
| By: | | /s/ John M. Perlowski |
| | John M. Perlowski |
| | Chief Executive Officer (principal executive officer) of |
| | BlackRock MuniEnhanced Fund, Inc. |
| |
| Date: | | January 4, 2019 |
| |
| By: | | /s/ Neal J. Andrews |
| | Neal J. Andrews |
| | Chief Financial Officer (principal financial officer) of |
| | BlackRock MuniEnhanced Fund, Inc. |
| |
| Date: | | January 4, 2019 |
3