Exhibit 99.4
SUSTAINABLE DEVELOPMENT REPORT
Acknowledging country Woodside recognises Aboriginal and Torres Strait Islander peoples as Australia’s first peoples. We acknowledge the unique connection that First Nations peoples have to land, waters and the environment. We extend this recognition and respect to First Nations peoples and communities around the world. On the cover The cover features Woodside employees on a Greater Angostura facility in Trinidad and Tobago. About this report This report provides an annual overview of Woodside’s sustainability approach and performance for the 12 month reporting period from 1 January 2022 to 31 December 2022. Woodside recognises that environmental, social and governance (ESG) performance is integral to our success. This report was approved by Woodside’s Board of Directors. This report was published on 27 February 2023. For disclaimer information regarding performance and forward looking statements and emissions data, please see pages 116-117 of this report. For the purposes of Woodside’s sustainability reporting we classify the topics into three categories of material, significant or important. For these purposes, ‘material topic’ means a 2022 sustainability topic described in this report, determined as part of the 2022 materiality assessment process undertaken by Woodside. Classification of any topic as material, significant or important should not be read as a determination of whether that topic may necessarily rise to the level of materiality of disclosures required by law, including the laws of Australia, the United States and the United Kingdom. Scope Woodside Energy Group Ltd (ABN 55 004 898 962) is the ultimate holding company of the Woodside group of companies. In this report, unless otherwise stated, references to ‘Woodside’, the ‘Group’, the ‘company’, ‘we’, ‘us’ and ‘our’ refer to Woodside Energy Group Ltd and its controlled entities, as a whole. The text does not distinguish between the activities of the ultimate holding company and those of its controlled entities. In this report, references to a year are to the calendar and financial year ended 31 December 2022 unless otherwise stated. Please note dollar figures are expressed in either Australian or United States currency. The information in this report covers all sites and production facilities wholly owned and operated by Woodside, and/ or operated by Woodside in a joint venture. Environmental performance data is outlined in the Environment and biodiversity section of this report including data that is relevant to a range of environmental indicators and parameters, detailed in the footnotes of the Environmental performance data table. Health and safety, and people performance data is reported on a total operated basis. Health and safety data includes Woodside activities carried out by employees and contractors whose work or workplace is controlled by Woodside. Social contributions are Woodside equity only. With respect to tax payments, only BHP Petroleum Australian tax payments made from 1 June 2022 (merger completion) have been included within the tax transparency data. On 1 June 2022 Woodside and BHP Group Limited (BHP Group) completed the merger of Woodside with BHP Petroleum. Content and data relevant to the assets acquired from BHP Group, as applicable from 1 June 2022 to 31 December 2022 has been included where available. The Sustainable Development
ii | Sustainable Development Report 2022
— Coastal landscape in the Pilbara (Australia).
Report 2022 provides a holistic description of our activities. Please note that in 2023, work will continue to progress the development of fully integrated systems and processes, to ensure the consistent coordination and collation of data and information regarding the activities relating to the assets acquired from BHP Group in 2022 and activities relating to Woodside’s other assets. Annual Report 2022 and Climate Report 2022 Our Annual Report 2022 provides a summary of Woodside’s operations, activities and financial position as at 31 December 2022. The Climate Report 2022 summarises Woodside’s climate-related plans, activities, progress and climate-related data for the period 1 January 2022 to 31 December 2022. The Climate Report has been structured to align with the Task Force on Climate-related Financial Disclosures (TCFD) recommendations framework. The Annual Report 2022, Sustainable Development Report 2022 and Climate Report 2022 together provide a complementary review of Woodside’s business. The reports are available on our website at woodside.com Reporting frameworks This report has been prepared with reference to the Global Reporting Initiative (GRI) Standards and with reference to the Ipieca Sustainability Reporting Guidance (4th edition, 2020) Index developed by Ipieca, API and IOGP for the period of 1 January 2022 to 31 December 2022. Ipieca is the global oil and gas industry association for environmental and social issues. Green Reports We are working with Green Reports™ on an initiative to ensure that communications minimise environmental impact and create a more sustainable future for the community. Report feedback We welcome feedback on our report via companyinfo@woodside.com External assurance A copy of Deloitte Touche Tohmatsu’s assurance statement is available on pages 118-123. Deloitte has conducted limited assurance over selected information in this report and the associated data tables. Our selected greenhouse gas emissions data is assured by GHD and is available on pages 124-125 and our social investment contribution is verified by Business for Societal Impact and is available on page 126. Woodside Energy Group Ltd | iii
— Landscape of Murujuga in Western Australia, also known as the Burrup Peninsula
iv | Sustainable Development Report 2022
Contents 1. Overview 6 1.1 About Woodside 6 1.2 Materiality 7 1.3 Focus areas 8 1.4 2022 summary 10 1.5 2022 ESG topics 10 1.6 2022 ESG ratings performance 11 1.7 Message from the Chair of the Sustainability Committee 13 1.8 Message from the Chief Executive Officer 14 1.9 Sustainability targets 16 1.10 United Nations Sustainable Development Goals 17 2. Environment 26 2.1 Climate change resilience and transition 27 2.2 Environment and biodiversity 32 2.3 Environment performance data table 48 2.4 Decommissioning 50 3. Social 52 3.1 First Nations cultural heritage and engagement 53 3.2 Social contribution 59 3.3 People and culture 68 3.4 People data table 77 3.5 Human rights 80 4. Governance 82 4.1 Health, safety and wellbeing 83 4.2 Health and safety performance data table 87 4.3 Corporate governance 89 4.4 Cybersecurity 96 4.5 Major incident preparedness 97 5. Appendices 98 5.1 Our stakeholders 99 5.2 Glossary 103 5.3 Terms and units 106 5.4 GRI content index 108 5.5 Ipieca sustainability reporting guidance (4th edition, 2020) index 112 5.6 Disclaimer 116 5.7 External assurance statements 118 Woodside Energy Group Ltd | v
Section 1.1 About Woodside
We are a global energy company, founded in Australia with a spirit of innovation and determination. The world needs energy that is affordable, reliable and lower carbon to support a successful energy transition. We provide energy to heat and cool homes, keep lights on and support industry. We aim to thrive through the global energy transition with a low cost, lower carbon, profitable, resilient and diversified portfolio.1 The merger with BHP’s petroleum business has increased the scale and diversification of our global portfolio, which includes oil and gas assets and interests in Australia, the Gulf of Mexico, the Caribbean, Senegal and TimorLeste. We also have a focused exploration program. Our focus in operations remains on safety, reliability, efficiency and environmental performance, leveraging more than 35 years of operating experience. We have growth opportunities across gas, oil and new energy. Woodside has several projects currently in execution phase. The Scarborough and Pluto Train 2 projects in Australia achieved a positive final investment decision (FID) in November 2021 and are targeting first LNG cargo in 2026. In Senegal, the Sangomar Field Development Phase 1 is targeting first oil in late 2023. In the United States Gulf of Mexico, Shenzi North, a brownfield expansion of the Shenzi oil project, is targeting first oil in 2024 and Mad Dog Phase 2, a development of the southern flank of the Mad Dog field, is targeting start up in 2023. Woodside completed front-end engineering design for the Trion oil project in 2022 and is aiming to be FID ready in 2023. Our marketing, trading and shipping activities enable us to supply a diverse range of customers from our recently expanded global portfolio. Our climate strategy has two key elements: reducing our net equity Scope 1 and 2 greenhouse gas emissions; and investing in the products and services to help our customers secure their energy needs and reduce their emissions. We have targets to reduce our net equity Scope 1 and 2 greenhouse gas emissions by 15% by 2025 and 30% by 2030, towards our aspiration to achieve net zero by 2050 or sooner.2,3 We also have a target to invest US$5 billion in new energy products and lower carbon services by 2030.4 We take a disciplined and prudent approach to investment through our capital allocation framework, with the goal to manage financial risks and maintain a resilient financial position to allow us to optimise the value delivered from our portfolio of opportunities. Our new energy opportunities include the proposed hydrogen and ammonia projects H2Perth and H2TAS in Australia, and the proposed hydrogen projects H2OK in the United States and Southern Green Hydrogen in New Zealand. Integrity, accountability and transparency drive our environmental, social and governance (ESG) aspirations and guide decision making at all levels of our business. We strive to operate responsibly across our business activities. Enduring and meaningful relationships with communities are fundamental to our social performance. We recognise that our success is driven by our people and our culture. We value diversity and we strive to keep each other safe. 1 For Woodside, a lower carbon portfolio is one from which the net equity scope 1 and 2 greenhouse gas emissions, which includes the use of offsets, are being reduced towards targets, and into which new energy products and lower carbon services are planned to be introduced as a complement to existing and new investments in oil and gas. Our Climate Policy, featured in the Climate Report 2022 and available on our website, sets out the principles that we believe will assist us achieve this aim. 2 Target is for net equity Scope 1 and 2 greenhouse gas emissions, relative to a starting base representative of the gross annual average equity Scope 1 and 2 greenhouse gas emissions over 2016-2020 and may be adjusted (up or down) for potential equity changes in producing or sanctioned assets with a final investment decision prior to 2021. 3 Net equity greenhouse gas emissions are equal to Woodside’s equity share of gross greenhouse gas emissions reduced by the number of retired carbon credits. 4 Individual investment decisions are subject to Woodside’s investment targets. Not guidance. Potentially includes both organic and inorganic investment.
6 | Sustainable Development Report 2022
S E CTION 1 . 2 Materiality Woodside conducts a broad based materiality process each year to inform our understanding of which sustainability topics are relevant to our business activities and stakeholders. Our approach This annual process involves an in depth desktop study transition remains a material topic in 2022, given the nature drawing from a wide range of internal and external inputs. of our business. Our approach seeks to understand the topics relevant to The increased focus on environment and biodiversity in our business activities and important to our stakeholders. 2022 highlights the need for our continued environmental This includes consideration of potential risks, opportunities performance.2 In January 2023, we published an Environment and impacts on the economy, environment and people, and Biodiversity Policy highlighting the increased focus on this including impacts on human rights. topic and reinforcing the approach that Woodside will take on We aim to engage with stakeholders in a range of categories Environmental and Biodiversity Management moving forward. including customers, employees, investors, banks and ratings In 2022, a new material topic emerged, with First Nations agencies, joint venture participants, First Nations communities, cultural heritage and engagement being added to the local communities, local, state and national governments, material topics list. Woodside understands the importance of non-government organisations, suppliers and contractors. identifying and working with First Nations communities who Engagements with stakeholders via online surveys and have longstanding cultural and spiritual connections to land interviews (online and face-to-face) help identify and prioritise and waters where we have a presence. In Australia, we have relevant topics. established relationships with First Nations communities. We are also a global company and we have a presence in the We then classify the topics into three categories of material, United States, Mexico, Trinidad and Tobago, and New Zealand. significant or important.1 This is followed by an endorsement We continue to learn from the First Nations communities across process with our Executive Leadership Team and the Board’s these regions and are committed to working alongside them. Sustainability Committee. We also continue to monitor developments, trends and stakeholder expectations The continuance of health, safety and wellbeing as a material throughout the year. topic reinforces the nature of our business and areas of activity, as well as our continued commitment to operating safely and Following the merger with BHP’s petroleum business our protecting the health of our workforce. ESG topics have been updated. Climate change resilience and 1 For the purposes of Woodside’s sustainability reporting we classify the topics into three categories of material, significant or important. For these purposes, ‘material topic’ means a 2022 sustainability topic described in this report, determined as part of the 2022 materiality assessment process undertaken by Woodside. Classification of any topic as material, significant or important should not be read as a determination of whether that topic may necessarily rise to the level of materiality of disclosures required by law, including the laws of Australia, the United States and the United Kingdom. 2 Biodiversity formed part of the assurance process of this report. STEP 1 STEP 2 STEP 3STEP 4 IDENTIFYPRIORITISEVALIDATEREVIEW Undertake a desktop study toTopics are ranked basedTopics are endorsed by theThe materiality process is identify sustainability topics.on their importance toExecutive Leadership Teamreviewed to identify areas for the business and externaland the Board’s Sustainabilityimprovement and tracking stakeholders using a rangeCommittee.emerging trends and topics. of inputs, before being classified as material, significant or important. Woodside Energy Group Ltd | 7
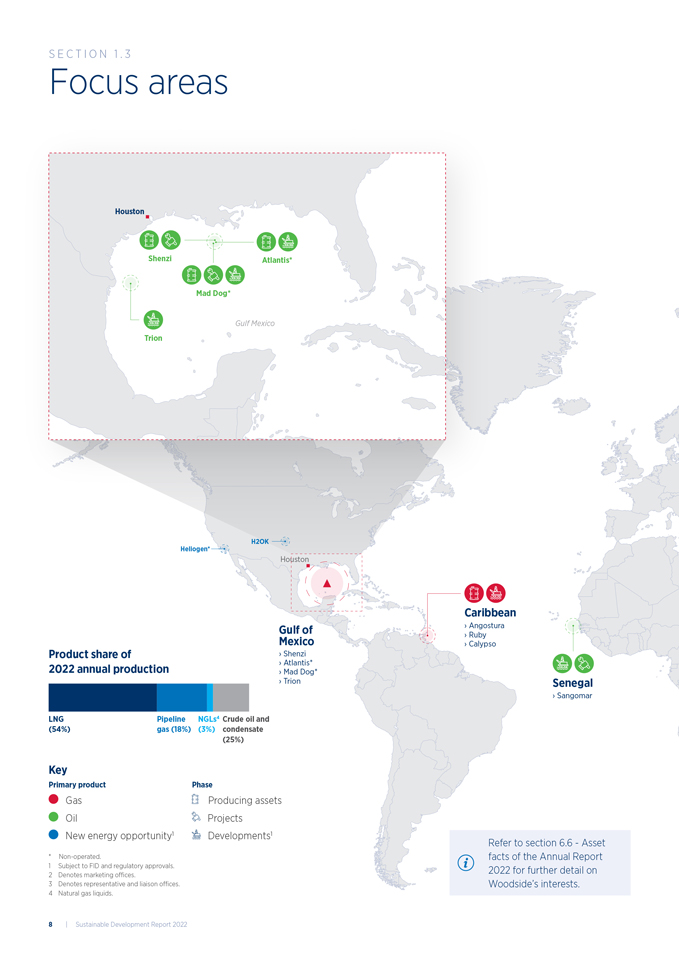
S E CTION 1 . 3 Focus areas Houston Shenzi Atlantis* Mad Dog* Gulf Mexico Trion H2OK Heliogen* Houston Caribbean Gulf of › Angostura › Ruby Mexico › Calypso Product share of › Shenzi 2022 annual production › Atlantis* › Mad Dog* › Trion Senegal › Sangomar LNG Pipeline NGLs4 Crude oil and (54%) gas (18%) (3%) condensate (25%) Key Primary product Phase Gas Producing assets Oil Projects New energy opportunity1 Developments1 Refer to section 6.6—Asset * Non-operated. facts of the Annual Report 1 Subject to FID and regulatory approvals. 2022 for further detail on 2 Denotes marketing offices. 3 Denotes representative and liaison offices. Woodside’s interests. 4 Natural gas liquids. 8 | Sustainable Development Report 2022
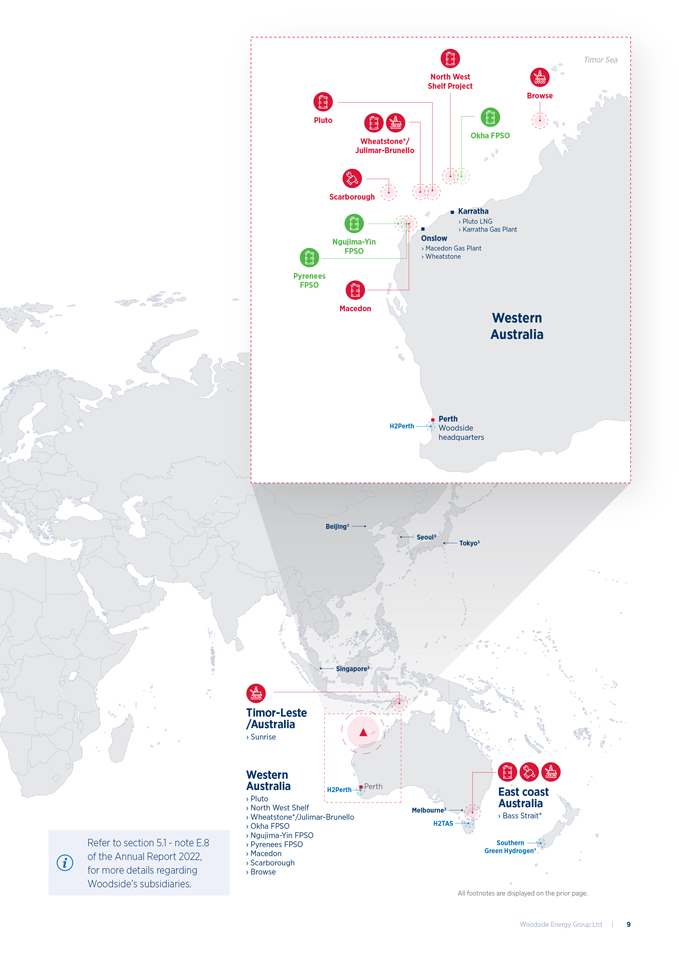
Timor Sea North West Shelf Project Browse Pluto Okha FPSO Wheatstone*/ Julimar-Brunello Scarborough Karratha › Pluto LNG › Karratha Gas Plant Ngujima-Yin Onslow FPSO › Macedon Gas Plant › Wheatstone Pyrenees FPSO Macedon Western Australia H2Perth Perth Woodside headquarters Beijing‡ Seoul‡ Tokyo‡ Singapore‰ /Australia Timor-Leste › Sunrise Western Australia H2Perth Perth East coast › Pluto Australia › North West Shelf Melbourne‰ › Bass Strait* › Wheatstone*/Julimar-Brunello › Okha FPSO H2TAS › Ngujima-Yin FPSO Southern Refer to section 5.1—note E.8 › Pyrenees FPSO Green Hydrogen* of the Annual Report 2022, › Macedon › Scarborough for more details regarding › Browse Woodside’s subsidiaries. All footnotes are displayed on the prior page. Woodside Energy Group Ltd | 9
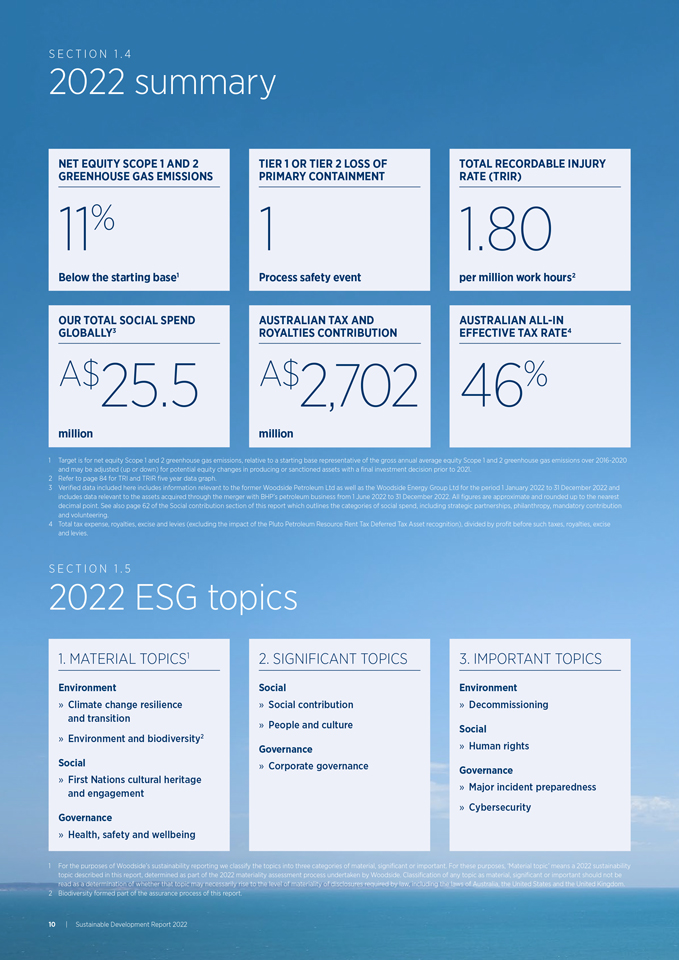
SECTION 1. 4 2022 summary NET EQUITY SCOPE 1 AND 2 TIER 1 OR TIER 2 LOSS OF TOTAL RECORDABLE INJURY GREENHOUSE GAS EMISSIONS PRIMARY CONTAINMENT RATE (TRIR) 11% 1 1.80 Below the starting base1 Process safety event per million work hours2 OUR TOTAL SOCIAL SPEND AUSTRALIAN TAX AND AUSTRALIAN ALL-IN GLOBALLY3 ROYALTIES CONTRIBUTION EFFECTIVE TAX RATE4 A$25.5 A$2,702 46% million million 1 Target is for net equity Scope 1 and 2 greenhouse gas emissions, relative to a starting base representative of the gross annual average equity Scope 1 and 2 greenhouse gas emissions over 2016-2020 and may be adjusted (up or down) for potential equity changes in producing or sanctioned assets with a final investment decision prior to 2021. 2 Refer to page 84 for TRI and TRIR five year data graph. 3 Verified data included here includes information relevant to the former Woodside Petroleum Ltd as well as the Woodside Energy Group Ltd for the period 1 January 2022 to 31 December 2022 and includes data relevant to the assets acquired through the merger with BHP’s petroleum business from 1 June 2022 to 31 December 2022. All figures are approximate and rounded up to the nearest decimal point. See also page 62 of the Social contribution section of this report which outlines the categories of social spend, including strategic partnerships, philanthropy, mandatory contribution and volunteering. 4 Total tax expense, royalties, excise and levies (excluding the impact of the Pluto Petroleum Resource Rent Tax Deferred Tax Asset recognition), divided by profit before such taxes, royalties, excise and levies. S E C T I O N 1 . 5 2022 ESG topics 1. MATERIAL TOPICS1 2. SIGNIFICANT TOPICS 3. IMPORTANT TOPICS Environment Social Environment » Climate change resilience » Social contribution » Decommissioning and transition » People and culture Social » Environment and biodiversity2 Governance » Human rights Social » Corporate governance Governance » First Nations cultural heritage » Major incident preparedness and engagement Governance » Cybersecurity » Health, safety and wellbeing 1 For the purposes of Woodside’s sustainability reporting we classify the topics into three categories of material, significant or important. For these purposes, ‘Material topic’ means a 2022 sustainability topic described in this report, determined as part of the 2022 materiality assessment process undertaken by Woodside. Classification of any topic as material, significant or important should not be read as a determination of whether that topic may necessarily rise to the level of materiality of disclosures required by law, including the laws of Australia, the United States and the United Kingdom. 2 Biodiversity formed part of the assurance process of this report. 10 | Sustainable Development Report 2022
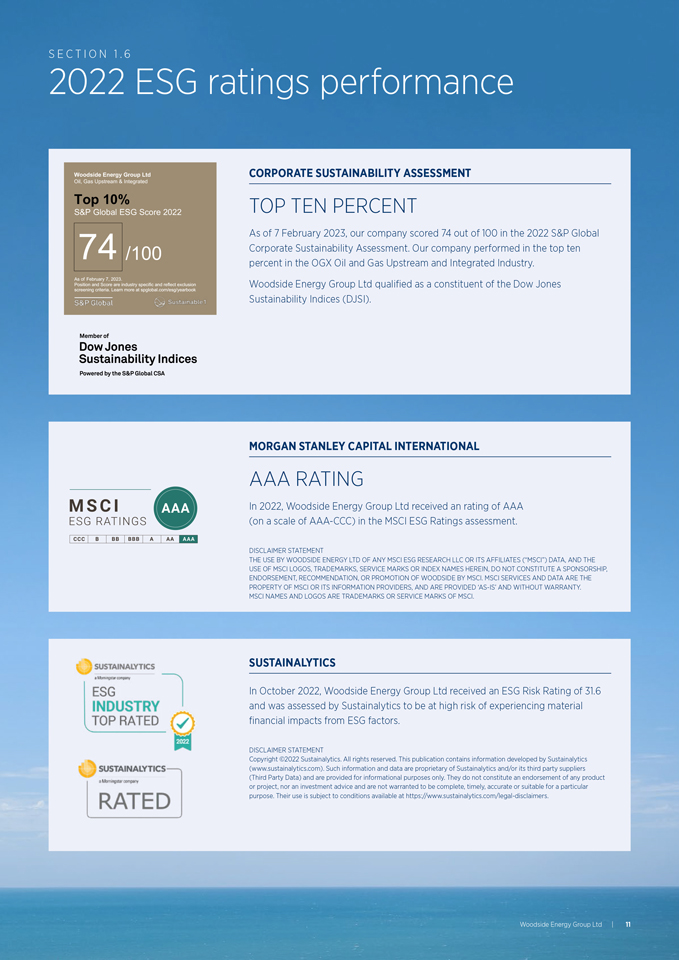
SECTION 1.6 2022 ESG ratings performance Woodside Energy Group Ltd CORPORATE SUSTAINABILITY ASSESSMENT Oil, Gas Upstream & Integrated Top 10% TOP TEN PERCENT S&P Global ESG Score 2022 As of 7 February 2023, our company scored 74 out of 100 in the 2022 S&P Global 74 /100 Corporate Sustainability Assessment. Our company performed in the top ten percent in the OGX Oil and Gas Upstream and Integrated Industry. As of February 7, 2023. Position and Score are industry specific and reflect exclusion Woodside Energy Group Ltd qualified as a constituent of the Dow Jones screening criteria. Learn more at spglobal.com/esg/yearbook Sustainability Indices (DJSI). MORGAN STANLEY CAPITAL INTERNATIONAL AAA RATING In 2022, Woodside Energy Group Ltd received an rating of AAA (on a scale of AAA-CCC) in the MSCI ESG Ratings assessment. DISCLAIMER STATEMENT THE USE BY WOODSIDE ENERGY LTD OF ANY MSCI ESG RESEARCH LLC OR ITS AFFILIATES (“MSCI”) DATA, AND THE USE OF MSCI LOGOS, TRADEMARKS, SERVICE MARKS OR INDEX NAMES HEREIN, DO NOT CONSTITUTE A SPONSORSHIP, ENDORSEMENT, RECOMMENDATION, OR PROMOTION OF WOODSIDE BY MSCI. MSCI SERVICES AND DATA ARE THE PROPERTY OF MSCI OR ITS INFORMATION PROVIDERS, AND ARE PROVIDED ‘AS-IS’ AND WITHOUT WARRANTY. MSCI NAMES AND LOGOS ARE TRADEMARKS OR SERVICE MARKS OF MSCI. SUSTAINALYTICS In October 2022, Woodside Energy Group Ltd received an ESG Risk Rating of 31.6 and was assessed by Sustainalytics to be at high risk of experiencing material financial impacts from ESG factors. DISCLAIMER STATEMENT Copyright ©2022 Sustainalytics. All rights reserved. This publication contains information developed by Sustainalytics (www.sustainalytics.com). Such information and data are proprietary of Sustainalytics and/or its third party suppliers (Third Party Data) and are provided for informational purposes only. They do not constitute an endorsement of any product or project, nor an investment advice and are not warranted to be complete, timely, accurate or suitable for a particular purpose. Their use is subject to conditions available at https://www.sustainalytics.com/legal-disclaimers. Woodside Energy Group Ltd | 11
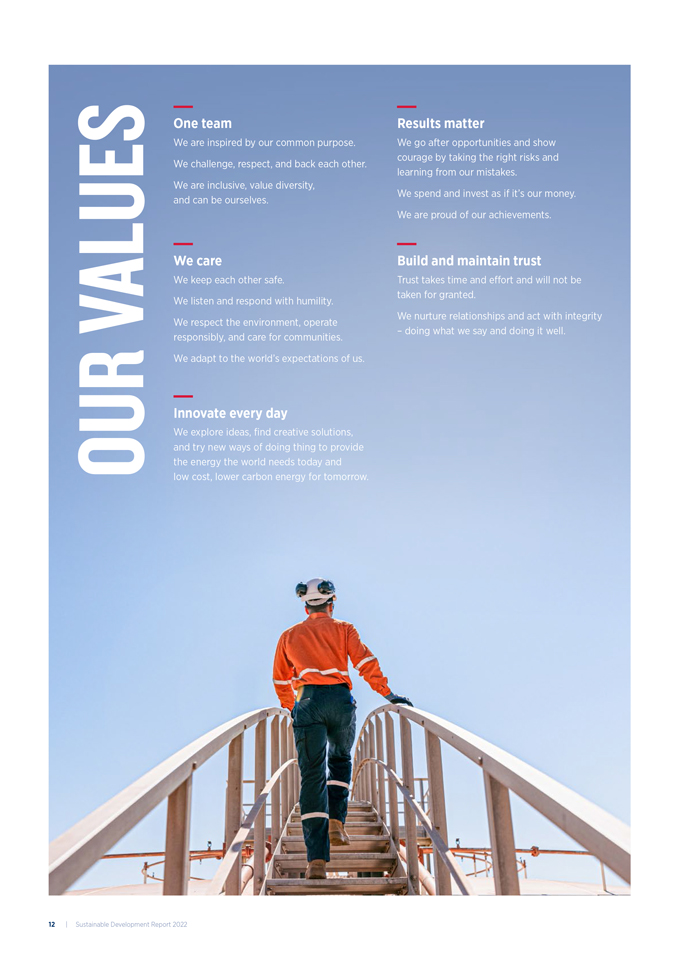
One team Results matter We are inspired by our common purpose. We go after opportunities and show courage by taking the right risks and We challenge, respect, and back each other. learning from our mistakes. We are inclusive, value diversity, We spend and invest as if it’s our money. and can be ourselves. We are proud of our achievements. We care Build and maintain trust We keep each other safe. Trust takes time and effort and will not be taken for granted. We listen and respond with humility. We nurture relationships and act with integrity We respect the environment, operate VALUES – doing what we say and doing it well. responsibly, and care for communities. We adapt to the world’s expectations of us. Innovate every day We explore ideas, find creative solutions, and try new ways of doing thing to provide OUR the energy the world needs today and low cost, lower carbon energy for tomorrow. 12 | Sustainable Development Report 2022
Message from the Chair of the Sustainability Committee Woodside is proud to be a global energy company, supplying the oil and gas that the world needs and working to develop new energy products. There is a growing global focus on Environmental, Social and Governance (ESG) issues for corporate boards and organisations. The oversight for many of the ESG issues that internal and external stakeholders believe are important fall under the Sustainability Committee. In 2022, Woodside underwent a transformation with the completion of the merger between Woodside and BHP’s petroleum business. This occurred against a backdrop of uncertainty as global energy markets responded to Russia’s invasion of Ukraine. The completion of the merger led to substantial change inside the company, with a much broader global footprint and workforce. The culture of our company is important to our success both now and in the future and with an engaged workforce who understand and promote our values, we will succeed. We want our people focused on the right things. Our CEO has refreshed the corporate values, which encompasses aspects across the ESG landscape and is at the heart of everything we do. We want an organisation driven by our people, who in turn are motivated by integrity, accountability and transparency. Not only do we want to keep people safe, but we also want the company to be a place where people want to come to work and where they feel valued for what they do. Our updated inclusion and diversity programs, cover ethnicity and race, and strive for equal opportunity. We made progress on delivering our 2021-2025 Reconciliation Action Plan with a focus on achieving positive outcomes for our First Nations communities. All of our local communities are important. To this point, in 2022 we prepared social performance plans for communities where we are active. These include plans in Australia for the Pilbara, Exmouth, Onslow, and internationally in the United States, Trinidad and Tobago, Mexico and Senegal. The plans consider community and social context, potential social risks, impacts and emerging trends, social obligations and commitments. The Sustainable Development Report 2022 includes information on our approach to biodiversity, along with a range of other sustainability topics. This report also includes detail on key governance issues which are further detailed in the Annual Report 2022 along with relevant risks factors. In 2023, we published our second Climate Report, which contains disclosures consistent with the Task Force on Climaterelated Financial Disclosures. We have worked on ensuring ESG expertise across the Sustainability Committee, the Board and the broader company. This report utilises the United Nations Sustainable Development Goals to guide our approach to sustainability. We look on our proactive and robust management of ESG as an opportunity to ensure the long-term viability of the company. We have many exciting opportunities ahead of us, be it in the traditional oil and gas sector, or in the emerging new energy area, with potential projects across the globe. This is an exciting time for the company, our people, and the communities where we are active. Ann Pickard Chair of the Sustainability Committee 27 February 2023 S ection 1 . 7 — Ann Pickard. Board Sustainability Committee Ann Pickard (Chair) Larry Archibald Swee Chen Goh Christopher Haynes Ian Macfarlane Sarah Ryan Ben Wyatt Woodside Energy Group Ltd | 13
Message from the Chief Executive Officer 2022 has been a transformational year for our business. I am proud of the efforts of our people who have come together across our global portfolio to create a new team. We continued producing and developing the products and services needed for both decarbonisation and to support growing populations and economies. As we also continued our focus on ESG and sustainability performance across all levels of decision-making which has contributed to our success. The critical importance of energy security and affordability on the road to net zero were reinforced in 2022. Russia’s invasion of Ukraine brought the United Nations Sustainable Development Goal 7, Ensure access to affordable, reliable, sustainable and modern energy, squarely into focus. At Woodside, we played our part in supporting global energy security, continuing to support our customers, primarily in Asia, who have long relied on us for their energy security. In 2022, Woodside entered into a flexible, long-term sale and purchase agreement with Uniper Global Commodities SE for Woodside to supply LNG from its global portfolio into Europe. We also worked carefully to deliver safe, reliable operations and protect the health of the communities where we live and work, as the COVID-19 pandemic continued to impact the world. In 2022, our Western Australian workforce faced the first major community transmission of COVID-19, including in Perth where we are headquartered, and Karratha where many of our operations are centred. Our Sangomar team contended with disruptions caused by the virus, while still successfully completing construction of the floating production storage and offloading facility in China. I thank everyone in the Woodside team, around the world, for their commitment to keeping each other safe and continuing to come together to adapt to new ways of working during the COVID-19 pandemic. The safety of our people is our top priority and maintaining process safety is critical. We recorded zero Tier 1 loss of primary containment process safety events across our global business and one low risk Tier 2 event. Our injury performance, however, continues to be challenged. Our total recordable injury rate of 1.80 remains above our target of 1.0. We know we need to improve and we are making progress. Our focus is on safety culture, leadership and applying human and organisational performance principles to help us learn and return to leading safety performance. We are also focused on the psychological safety of our people. Our Code of Conduct is fundamental to how we work and further defines the expected behaviours of everyone working at and with Woodside. Sexual harassment or any type of bullying, discrimination or victimisation has no place at Woodside and we continue to progress the implementation of our Working Respectfully Policy. Following the launch of this policy in 2021, we now have a multidisciplinary team working on embedding the Australian Human Rights Commission’s Respect@Work framework, outlined in its 2020 Sexual Harassment National Inquiry Report. Our approach is also aligned to recommendations from the Western Australian Legislative Assembly Community Development and Justice Standing Committee’s Enough is Enough report on sexual harassment against women in the fly in fly out industry. In 2022, there were three environmental incidents (two hazardous non-hydrocarbon and one hydrocarbon) involving spills of greater than 1 bbl released to the environment. The incidents did not result in significant negative impacts to the surrounding environment, were localised and temporary in nature. Section 1 . 8 14 | Sustainable Development Report 2022
In 2022, we delivered towards our 2022 Reconciliation Action Plan targets, which we publish annually to tell our story with integrity and transparency and because we want our results to reflect our values. In our Climate Report 2022, we outline our work to reduce our net equity Scope 1 and 2 greenhouse gas emissions and how we are investing in the products and services our customers need as they reduce their emissions. We achieved an 11% reduction in our net equity Scope 1 and 2 greenhouse gas emissions, against a starting base recalculated following the merger.1 We developed asset decarbonisation plans for our Woodside assets and projects, which we plan to extend to the former BHP petroleum assets in 2023. We were the first Australasian company to sign the Aiming for Zero Methane Emissions Initiative, committing to strive to reach near zero methane emissions from operated assets by 2030. We also progressed a range of opportunities towards achieving our target to invest US$5 billion in new energy products and lower carbon services by 2030.2 These include our most advanced opportunity, H2OK, a proposed liquid hydrogen project in Ardmore, Oklahoma (United States). We signed contracts for the alkaline electrolyser and liquefaction equipment for the project and completed front-end engineering design activities ahead of a final investment decision targeted for 2023. Biodiversity has become an increasingly material topic for our stakeholders. Reporting requirements are also evolving, including those currently being developed by the Taskforce on Nature-Related Financial Disclosures. We are setting targets and publicly reporting on our environmental and biodiversity performance while progressing projects that have a positive impact on biodiversity. Our current biodiversity initiatives including those acquired from BHP Petroleum are outlined in this report. 1 Target is for net equity Scope 1 and 2 greenhouse gas emissions, relative to a starting base representative of the gross annual average equity Scope 1 and 2 greenhouse gas emissions over 2016-2020 and may be adjusted (up or down) for potential equity changes in producing or sanctioned assets with a final investment decision prior to 2021. 2 Individual investment decision are subject to Woodside’s investment targets. Not guidance. Potentially includes organic and inorganic investment. Our decommissioning portfolio has increased through the merger and we have seen an increasing interest in the topic amongst our stakeholders. In 2022, we continued executing decommissioning activities, progressed engineering work for planned decommissioning activities and continued our support for the National Decommissioning Research Initiative. The world changed dramatically in 2022 and our stakeholders’ sustainability and ESG priorities have evolved too. We continue to adapt in response, both in our activities and our reporting. I am proud of the way Woodside and our people have delivered great results during a year of significant change, demonstrating a strong ongoing commitment to doing our part for a better future. Meg O’Neill Chief Executive Officer and Managing Director 27 February 2023 The world changed dramatically in 2022 and our stakeholders’ sustainability and ESG priorities have evolved accordingly. — Meg O’Neill. Woodside Energy Group Ltd | 15
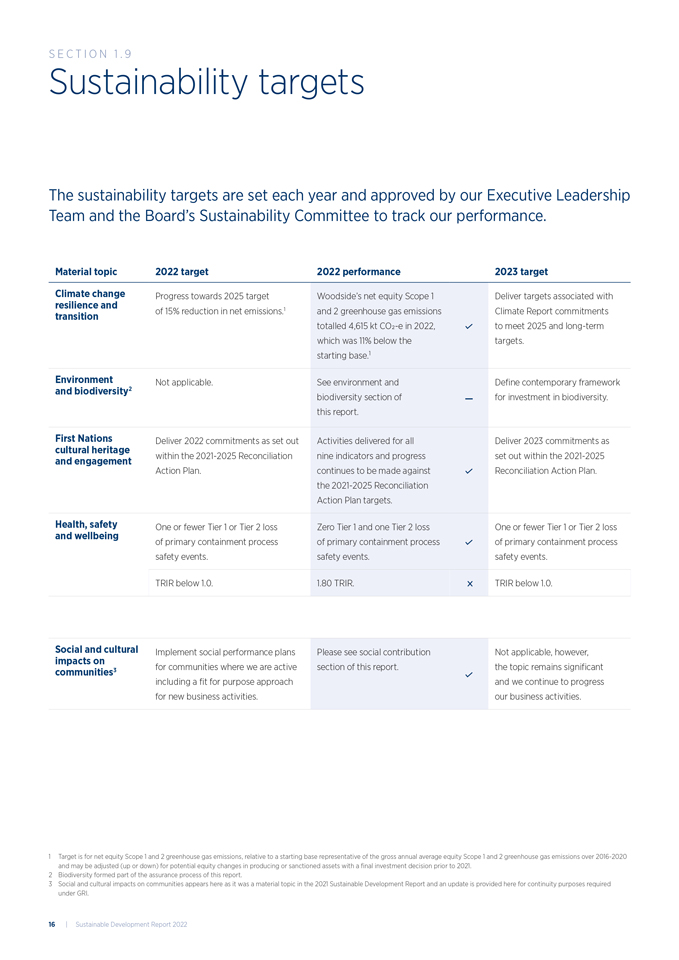
Material topic 2022 target 2022 performance 2023 target Climate change resilience and transition Progress towards 2025 target of 15% reduction in net emissions.1 Woodside’s net equity Scope 1 and 2 greenhouse gas emissions totalled 4,615 kt CO2-e in 2022, which was 11% below the starting base.1 Deliver targets associated with Climate Report commitments to meet 2025 and long-term targets. Environment and biodiversity2 Not applicable. See environment and biodiversity section of this report. — Define contemporary framework for investment in biodiversity. First Nations cultural heritage and engagement Deliver 2022 commitments as set out within the 2021-2025 Reconciliation Action Plan. Activities delivered for all nine indicators and progress continues to be made against the 2021-2025 Reconciliation Action Plan targets. Deliver 2023 commitments as set out within the 2021-2025 Reconciliation Action Plan. Health, safety and wellbeing One or fewer Tier 1 or Tier 2 loss of primary containment process safety events. Zero Tier 1 and one Tier 2 loss of primary containment process safety events. One or fewer Tier 1 or Tier 2 loss of primary containment process safety events. TRIR below 1.0. 1.80 TRIR. TRIR below 1.0. Social and cultural impacts on communities3 Implement social performance plans for communities where we are active including a fit for purpose approach for new business activities. Please see social contribution section of this report. Not applicable, however, the topic remains significant and we continue to progress our business activities. Sustainability targets The sustainability targets are set each year and approved by our Executive Leadership Team and the Board’s Sustainability Committee to track our performance. 1 Target is for net equity Scope 1 and 2 greenhouse gas emissions, relative to a starting base representative of the gross annual average equity Scope 1 and 2 greenhouse gas emissions over 2016-2020 and may be adjusted (up or down) for potential equity changes in producing or sanctioned assets with a final investment decision prior to 2021. 2 Biodiversity formed part of the assurance process of this report. 3 Social and cultural impacts on communities appears here as it was a material topic in the 2021 Sustainable Development Report and an update is provided here for continuity purposes required under GRI. S ection 1 . 9 16 | Sustainable Development Report 2022
United Nations Sustainable Development Goals The United Nations Sustainable Development Goals (UNSDGs) respond to the world’s economic, social and environmental challenges. They provide a globally applicable framework, through which Woodside can identify and articulate its priorities for sustainability. The UNSDGs are a guide for partnership between governments, society and businesses in contributing towards relevant targeted deliverables. Recent international political events and economic factors have highlighted the importance of the UNSDGs, particularly UNSDG7, Ensure access to affordable, reliable, sustainable and modern energy. The UNSDGs are used to inform Woodside’s strategy in meeting our sustainability deliverables throughout the company’s value chain. We continued to play a part by delivering energy to our customers to contribute towards their energy security needs. Our strategy comprises of primary and secondary goals, these are where we aim to make the most notable contribution. These are both underpinned by UNSDG17, Partnership for the goals, which reinforces the importance of collaboration and partnership. In 2023, our UNSDG strategy will be reviewed to address our expanded global portfolio. Progress against the current deliverables are outlined on the following pages. S ection 1 .1 0 — Woodside employee on facility. Woodside Energy Group Ltd | 17
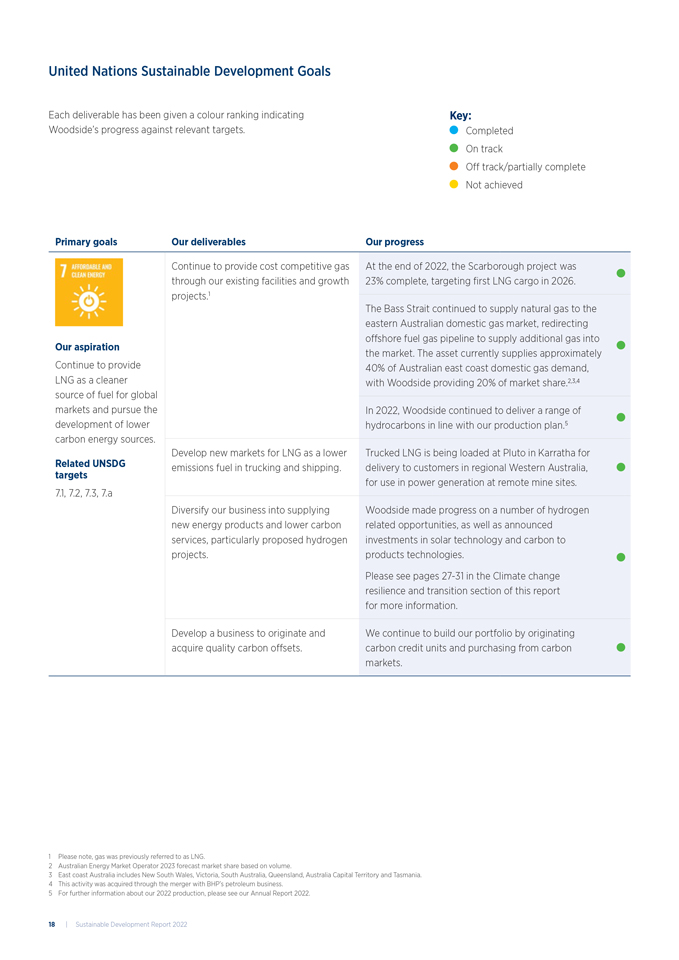
United Nations Sustainable Development Goals Primary goals Our deliverables Our progress Our aspiration Continue to provide LNG as a cleaner source of fuel for global markets and pursue the development of lower carbon energy sources. Related UNSDG targets 7.1, 7.2, 7.3, 7.a Continue to provide cost competitive gas through our existing facilities and growth projects.1 At the end of 2022, the Scarborough project was 23% complete, targeting first LNG cargo in 2026. The Bass Strait continued to supply natural gas to the eastern Australian domestic gas market, redirecting offshore fuel gas pipeline to supply additional gas into the market. The asset currently supplies approximately 40% of Australian east coast domestic gas demand, with Woodside providing 20% of market share.2,3,4 In 2022, Woodside continued to deliver a range of hydrocarbons in line with our production plan.5 Develop new markets for LNG as a lower emissions fuel in trucking and shipping. Trucked LNG is being loaded at Pluto in Karratha for delivery to customers in regional Western Australia, for use in power generation at remote mine sites. Diversify our business into supplying new energy products and lower carbon services, particularly proposed hydrogen projects. Woodside made progress on a number of hydrogen related opportunities, as well as announced investments in solar technology and carbon to products technologies. Please see pages 27-31 in the Climate change resilience and transition section of this report for more information. Develop a business to originate and acquire quality carbon offsets. We continue to build our portfolio by originating carbon credit units and purchasing from carbon markets. Each deliverable has been given a colour ranking indicating Woodside’s progress against relevant targets. Key: Completed On track Off track/partially complete Not achieved 1 Please note, gas was previously referred to as LNG. 2 Australian Energy Market Operator 2023 forecast market share based on volume. 3 East coast Australia includes New South Wales, Victoria, South Australia, Queensland, Australia Capital Territory and Tasmania. 4 This activity was acquired through the merger with BHP’s petroleum business. 5 For further information about our 2022 production, please see our Annual Report 2022. 18 | Sustainable Development Report 2022
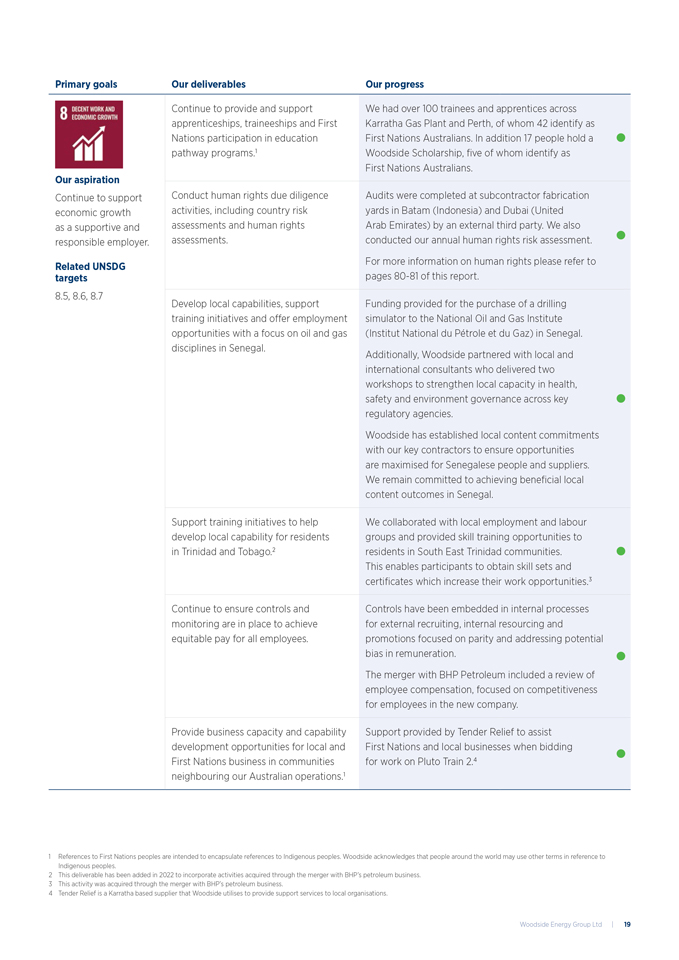
Primary goals Our deliverables Our progress Our aspiration Continue to support economic growth as a supportive and responsible employer. Related UNSDG targets 8.5, 8.6, 8.7 Continue to provide and support apprenticeships, traineeships and First Nations participation in education pathway programs.1 We had over 100 trainees and apprentices across Karratha Gas Plant and Perth, of whom 42 identify as First Nations Australians. In addition 17 people hold a Woodside Scholarship, five of whom identify as First Nations Australians. Conduct human rights due diligence activities, including country risk assessments and human rights assessments. Audits were completed at subcontractor fabrication yards in Batam (Indonesia) and Dubai (United Arab Emirates) by an external third party. We also conducted our annual human rights risk assessment. For more information on human rights please refer to pages 80-81 of this report. Develop local capabilities, support training initiatives and offer employment opportunities with a focus on oil and gas disciplines in Senegal. Funding provided for the purchase of a drilling simulator to the National Oil and Gas Institute (Institut National du Petrole et du Gaz) in Senegal. Additionally, Woodside partnered with local and international consultants who delivered two workshops to strengthen local capacity in health, safety and environment governance across key regulatory agencies. Woodside has established local content commitments with our key contractors to ensure opportunities are maximised for Senegalese people and suppliers. We remain committed to achieving beneficial local content outcomes in Senegal. Support training initiatives to help develop local capability for residents in Trinidad and Tobago.2 We collaborated with local employment and labour groups and provided skill training opportunities to residents in South East Trinidad communities. This enables participants to obtain skill sets and certificates which increase their work opportunities.3 Continue to ensure controls and monitoring are in place to achieve equitable pay for all employees. Controls have been embedded in internal processes for external recruiting, internal resourcing and promotions focused on parity and addressing potential bias in remuneration. The merger with BHP Petroleum included a review of employee compensation, focused on competitiveness for employees in the new company. Provide business capacity and capability development opportunities for local and First Nations business in communities neighbouring our Australian operations.1 Support provided by Tender Relief to assist First Nations and local businesses when bidding for work on Pluto Train 2.4 1 References to First Nations peoples are intended to encapsulate references to Indigenous peoples. Woodside acknowledges that people around the world may use other terms in reference to Indigenous peoples. 2 This deliverable has been added in 2022 to incorporate activities acquired through the merger with BHP’s petroleum business. 3 This activity was acquired through the merger with BHP’s petroleum business. 4 Tender Relief is a Karratha based supplier that Woodside utilises to provide support services to local organisations. Woodside Energy Group Ltd | 19
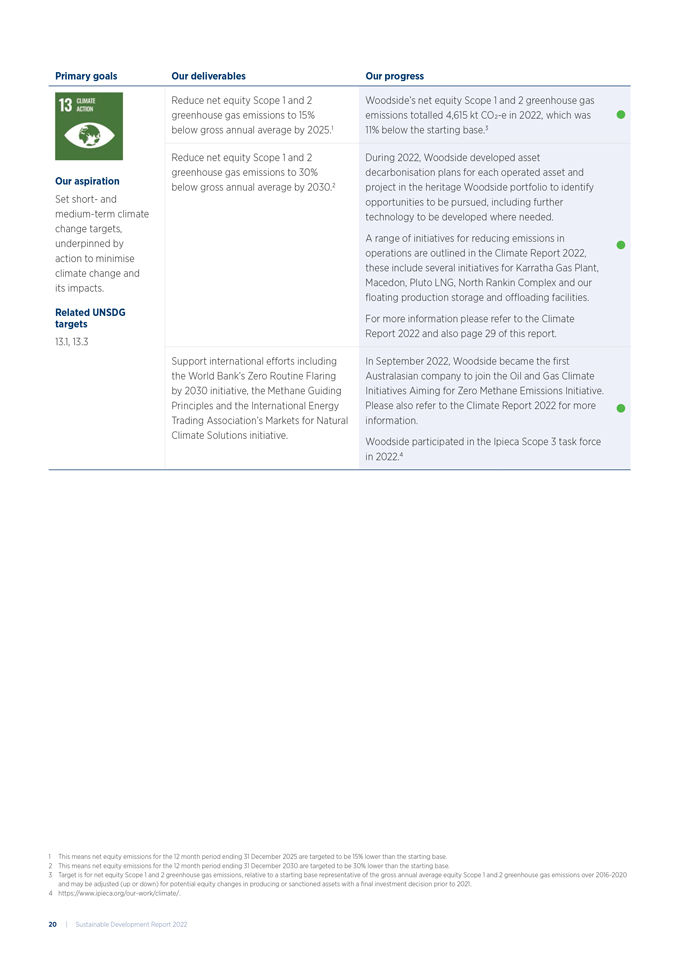
Primary goals Our deliverables Our progress Our aspiration Set short- and medium-term climate change targets, underpinned by action to minimise climate change and its impacts. Related UNSDG targets 13.1, 13.3 Reduce net equity Scope 1 and 2 greenhouse gas emissions to 15% below gross annual average by 2025.1 Woodside’s net equity Scope 1 and 2 greenhouse gas emissions totalled 4,615 kt CO2-e in 2022, which was 11% below the starting base.3 Reduce net equity Scope 1 and 2 greenhouse gas emissions to 30% below gross annual average by 2030.2 During 2022, Woodside developed asset decarbonisation plans for each operated asset and project in the heritage Woodside portfolio to identify opportunities to be pursued, including further technology to be developed where needed. A range of initiatives for reducing emissions in operations are outlined in the Climate Report 2022, these include several initiatives for Karratha Gas Plant, Macedon, Pluto LNG, North Rankin Complex and our floating production storage and offloading facilities. For more information please refer to the Climate Report 2022 and also page 29 of this report. Support international efforts including the World Bank’s Zero Routine Flaring by 2030 initiative, the Methane Guiding Principles and the International Energy Trading Association’s Markets for Natural Climate Solutions initiative. In September 2022, Woodside became the first Australasian company to join the Oil and Gas Climate Initiatives Aiming for Zero Methane Emissions Initiative. Please also refer to the Climate Report 2022 for more information. Woodside participated in the Ipieca Scope 3 task force in 2022.4 1 This means net equity emissions for the 12 month period ending 31 December 2025 are targeted to be 15% lower than the starting base. 2 This means net equity emissions for the 12 month period ending 31 December 2030 are targeted to be 30% lower than the starting base. 3 Target is for net equity Scope 1 and 2 greenhouse gas emissions, relative to a starting base representative of the gross annual average equity Scope 1 and 2 greenhouse gas emissions over 2016-2020 and may be adjusted (up or down) for potential equity changes in producing or sanctioned assets with a final investment decision prior to 2021. 4 https://www.ipieca.org/our-work/climate/. 20 | Sustainable Development Report 2022
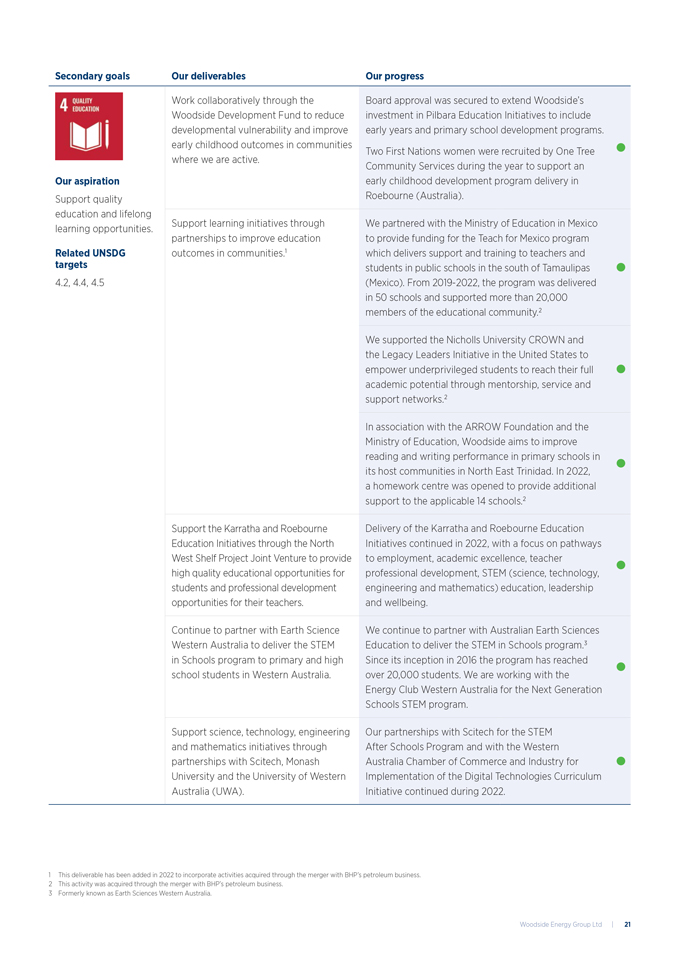
Secondary goals Our deliverables Our progress Our aspiration Support quality education and lifelong learning opportunities. Related UNSDG targets 4.2, 4.4, 4.5 Work collaboratively through the Woodside Development Fund to reduce developmental vulnerability and improve early childhood outcomes in communities where we are active. Board approval was secured to extend Woodside’s investment in Pilbara Education Initiatives to include early years and primary school development programs. Two First Nations women were recruited by One Tree Community Services during the year to support an early childhood development program delivery in Roebourne (Australia). Support learning initiatives through partnerships to improve education outcomes in communities.1 We partnered with the Ministry of Education in Mexico to provide funding for the Teach for Mexico program which delivers support and training to teachers and students in public schools in the south of Tamaulipas (Mexico). From 2019-2022, the program was delivered in 50 schools and supported more than 20,000 members of the educational community.2 We supported the Nicholls University CROWN and the Legacy Leaders Initiative in the United States to empower underprivileged students to reach their full academic potential through mentorship, service and support networks.2 In association with the ARROW Foundation and the Ministry of Education, Woodside aims to improve reading and writing performance in primary schools in its host communities in North East Trinidad. In 2022, a homework centre was opened to provide additional support to the applicable 14 schools.2 Support the Karratha and Roebourne Education Initiatives through the North West Shelf Project Joint Venture to provide high quality educational opportunities for students and professional development opportunities for their teachers. Delivery of the Karratha and Roebourne Education Initiatives continued in 2022, with a focus on pathways to employment, academic excellence, teacher professional development, STEM (science, technology, engineering and mathematics) education, leadership and wellbeing. Continue to partner with Earth Science Western Australia to deliver the STEM in Schools program to primary and high school students in Western Australia. We continue to partner with Australian Earth Sciences Education to deliver the STEM in Schools program.3 Since its inception in 2016 the program has reached over 20,000 students. We are working with the Energy Club Western Australia for the Next Generation Schools STEM program. Support science, technology, engineering and mathematics initiatives through partnerships with Scitech, Monash University and the University of Western Australia (UWA). Our partnerships with Scitech for the STEM After Schools Program and with the Western Australia Chamber of Commerce and Industry for Implementation of the Digital Technologies Curriculum Initiative continued during 2022. 1 This deliverable has been added in 2022 to incorporate activities acquired through the merger with BHP’s petroleum business. 2 This activity was acquired through the merger with BHP’s petroleum business. 3 Formerly known as Earth Sciences Western Australia. Woodside Energy Group Ltd | 21
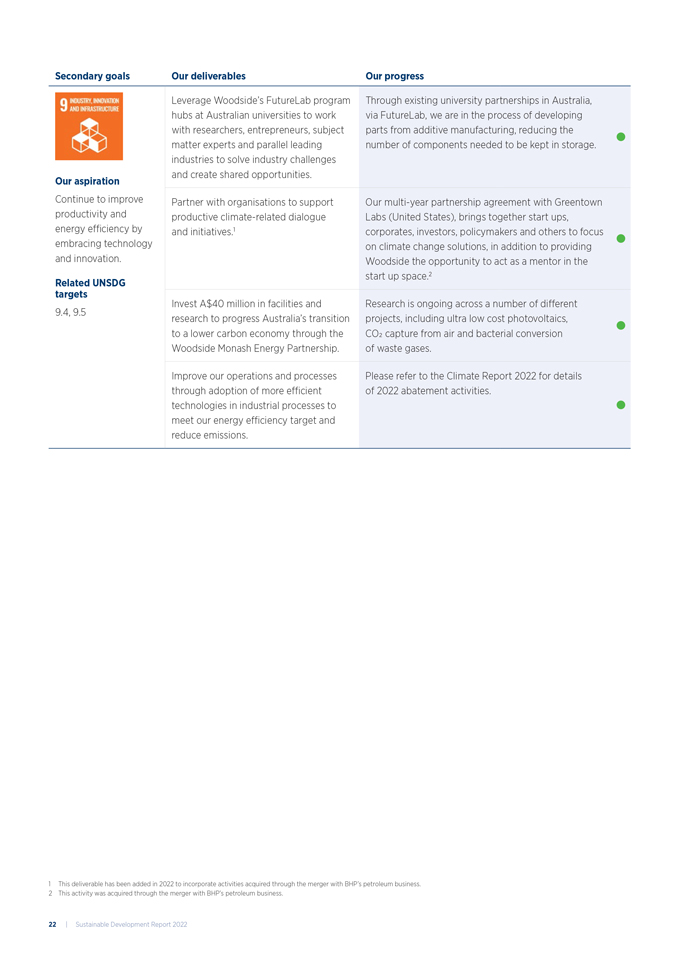
Secondary goals Our deliverables Our progress Our aspiration Continue to improve productivity and energy efficiency by embracing technology and innovation. Related UNSDG targets 9.4, 9.5 Leverage Woodside’s FutureLab program hubs at Australian universities to work with researchers, entrepreneurs, subject matter experts and parallel leading industries to solve industry challenges and create shared opportunities. Through existing university partnerships in Australia, via FutureLab, we are in the process of developing parts from additive manufacturing, reducing the number of components needed to be kept in storage. Partner with organisations to support productive climate-related dialogue and initiatives.1 Our multi-year partnership agreement with Greentown Labs (United States), brings together start ups, corporates, investors, policymakers and others to focus on climate change solutions, in addition to providing Woodside the opportunity to act as a mentor in the start up space.2 Invest A$40 million in facilities and research to progress Australia’s transition to a lower carbon economy through the Woodside Monash Energy Partnership. Research is ongoing across a number of different projects, including ultra low cost photovoltaics, CO2 capture from air and bacterial conversion of waste gases. Improve our operations and processes through adoption of more efficient technologies in industrial processes to meet our energy efficiency target and reduce emissions. Please refer to the Climate Report 2022 for details of 2022 abatement activities. 1 This deliverable has been added in 2022 to incorporate activities acquired through the merger with BHP’s petroleum business. 2 This activity was acquired through the merger with BHP’s petroleum business. 22 | Sustainable Development Report 2022
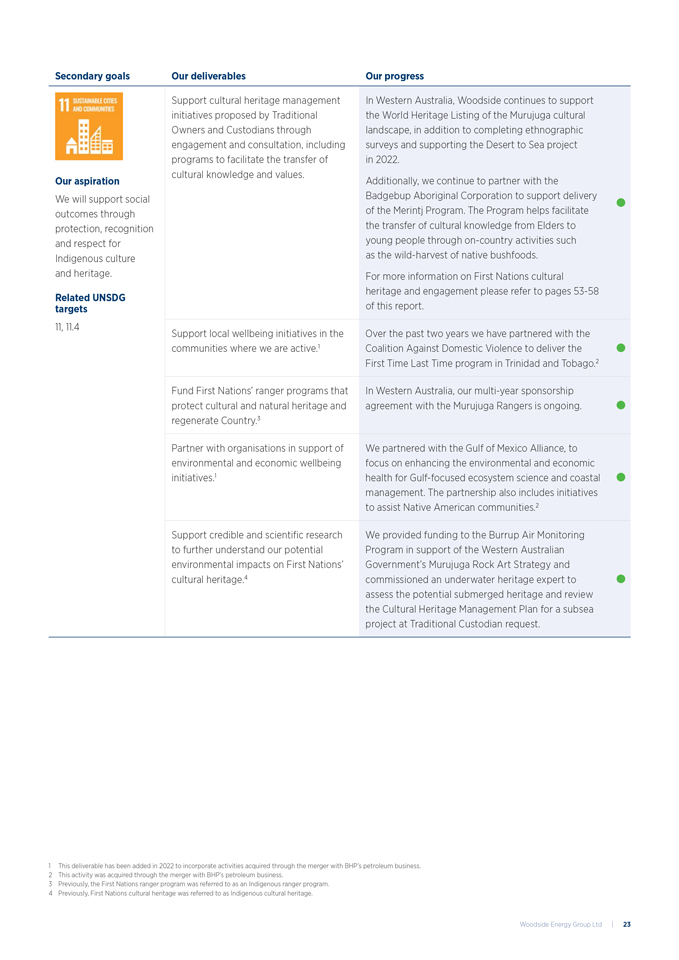
Secondary goals Our deliverables Our progress Our aspiration We will support social outcomes through protection, recognition and respect for Indigenous culture and heritage. Related UNSDG targets 11, 11.4 Support cultural heritage management initiatives proposed by Traditional Owners and Custodians through engagement and consultation, including programs to facilitate the transfer of cultural knowledge and values. In Western Australia, Woodside continues to support the World Heritage Listing of the Murujuga cultural landscape, in addition to completing ethnographic surveys and supporting the Desert to Sea project in 2022. Additionally, we continue to partner with the Badgebup Aboriginal Corporation to support delivery of the Merintj Program. The Program helps facilitate the transfer of cultural knowledge from Elders to young people through on-country activities such as the wild-harvest of native bushfoods. For more information on First Nations cultural heritage and engagement please refer to pages 53-58 of this report. Support local wellbeing initiatives in the communities where we are active.1 Over the past two years we have partnered with the Coalition Against Domestic Violence to deliver the First Time Last Time program in Trinidad and Tobago.2 Fund First Nations’ ranger programs that protect cultural and natural heritage and regenerate Country.3 In Western Australia, our multi-year sponsorship agreement with the Murujuga Rangers is ongoing. Partner with organisations in support of environmental and economic wellbeing initiatives.1 We partnered with the Gulf of Mexico Alliance, to focus on enhancing the environmental and economic health for Gulf-focused ecosystem science and coastal management. The partnership also includes initiatives to assist Native American communities.2 Support credible and scientific research to further understand our potential environmental impacts on First Nations’ cultural heritage.4 We provided funding to the Burrup Air Monitoring Program in support of the Western Australian Government’s Murujuga Rock Art Strategy and commissioned an underwater heritage expert to assess the potential submerged heritage and review the Cultural Heritage Management Plan for a subsea project at Traditional Custodian request. 1 This deliverable has been added in 2022 to incorporate activities acquired through the merger with BHP’s petroleum business. 2 This activity was acquired through the merger with BHP’s petroleum business. 3 Previously, the First Nations ranger program was referred to as an Indigenous ranger program. 4 Previously, First Nations cultural heritage was referred to as Indigenous cultural heritage. Woodside Energy Group Ltd | 23
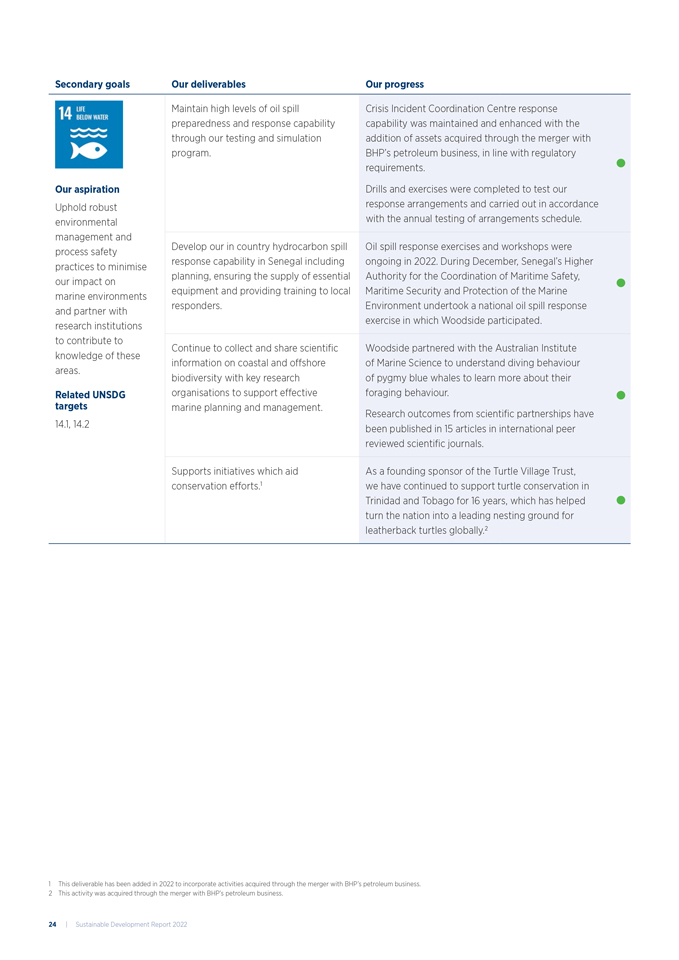
Secondary goals Our deliverables Our progress Our aspiration Uphold robust environmental management and process safety practices to minimise our impact on marine environments and partner with research institutions to contribute to knowledge of these areas. Related UNSDG targets 14.1, 14.2 Maintain high levels of oil spill preparedness and response capability through our testing and simulation program. Crisis Incident Coordination Centre response capability was maintained and enhanced with the addition of assets acquired through the merger with BHP’s petroleum business, in line with regulatory requirements. Drills and exercises were completed to test our response arrangements and carried out in accordance with the annual testing of arrangements schedule. Develop our in country hydrocarbon spill response capability in Senegal including planning, ensuring the supply of essential equipment and providing training to local responders. Oil spill response exercises and workshops were ongoing in 2022. During December, Senegal’s Higher Authority for the Coordination of Maritime Safety, Maritime Security and Protection of the Marine Environment undertook a national oil spill response exercise in which Woodside participated. Continue to collect and share scientific information on coastal and offshore biodiversity with key research organisations to support effective marine planning and management. Woodside partnered with the Australian Institute of Marine Science to understand diving behaviour of pygmy blue whales to learn more about their foraging behaviour. Research outcomes from scientific partnerships have been published in 15 articles in international peer reviewed scientific journals. Supports initiatives which aid conservation efforts.1 As a founding sponsor of the Turtle Village Trust, we have continued to support turtle conservation in Trinidad and Tobago for 16 years, which has helped turn the nation into a leading nesting ground for leatherback turtles globally.2 1 This deliverable has been added in 2022 to incorporate activities acquired through the merger with BHP’s petroleum business. 2 This activity was acquired through the merger with BHP’s petroleum business. 24 | Sustainable Development Report 2022
Secondary goals Our deliverables Our progress Our aspiration Improve air quality and degraded habitats through restoration and sustainable use of land. Related UNSDG targets 15.3 Undertake quality carbon offset projects that deliver co-benefits, including land restoration and biodiversity outcomes. Woodside has planted approximately 5,200 hectares of diverse mixed native species on properties in rural Western Australia. These projects deliver First Nations employment opportunities and local content outcomes. Underpinning goal Our aspiration This goal underpins our UNSDG strategy and informs our approach to our primary and secondary goals. Our strategy is supported by working with our key stakeholder groups to enhance our contribution across our primary and secondary UNSDGs. This underpinning goal reinforces the importance and collaboration with our stakeholders. Woodside Energy Group Ltd | 25
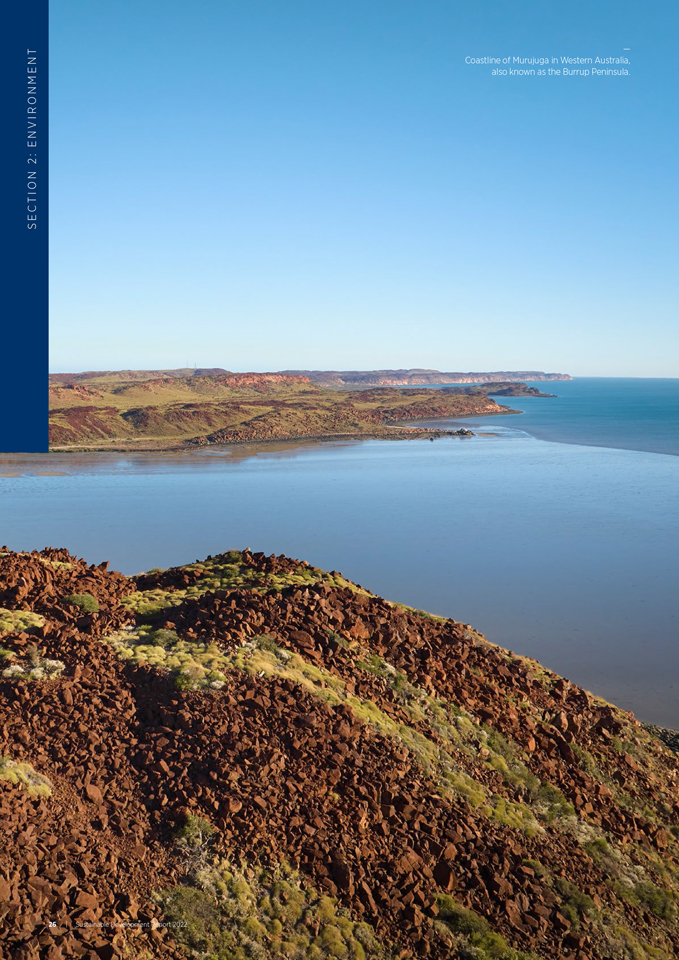
— Coastline of Murujuga in Western Australia, also known as the Burrup Peninsula. S ection 2 : ENVIRONMENT 26 | Sustainable Development Report 2022
Climate change resilience and transition Our climate strategy has two key elements: reducing our net equity Scope 1 and 2 greenhouse gas emissions, and investing in the products and services that our customers need as they secure their energy needs and reduce their emissions. 2022 HIGHLIGHTS » Woodside’s net equity Scope 1 and 2 greenhouse gas emissions totalled 4,615 kt CO2-e in 2022, which was 11% below the starting base for its targets1 » Initial asset decarbonisation plans developed for each operated asset and project in the heritage Woodside portfolio2 » US$100m spent to date towards the US$5 billion investment in new energy products and lower carbon services OPPORTUNITIES » Invest in new energy products and lower carbon services » Pursue technology opportunities through a portfolio level technology decarbonisation plan » Continue to grow the carbon credit portfolio3 POTENTIAL RISKS4 » Lower demand for hydrocarbon, new energy or lower carbon services relative to investment case » Increased pricing or other regulatory control of emissions » Increased severity of extreme weather events impacting operations Our approach Woodside considers that its disclosures are consistent with the Task Force on Climate-related Financial Disclosures (TCFD) four recommendations and eleven recommended disclosures, noting its Guidance for all Sectors and Guidance for Non- Financial Groups.5,6 Woodside is a supporter of the TCFD. These disclosures are primarily included in the Climate Report 2022, and a summary is provided here. In 2020, Woodside announced targets for near- and mediumterm emissions reduction below the gross annual average equity Scope 1 and 2 greenhouse gas emissions over 2016-2020.1 Woodside’s targets to reduce net equity Scope 1 and 2 greenhouse gas emissions are: • 15% by 20257 • 30% by 20308 relative to a starting base representative of gross annual average equity Scope 1 and 2 greenhouse gas emissions over 2016-2020. Woodside has also announced an aspiration of net zero equity Scope 1 and 2 greenhouse gas emissions by 2050 or sooner. 1 Target is for net equity Scope 1 and 2 greenhouse gas emissions, relative to a starting base representative of the gross annual average equity Scope 1 and 2 greenhouse gas emissions over 2016-2020 and may be adjusted (up or down) for potential equity changes in producing or sanctioned assets with a final investment decision prior to 2021. 2 Heritage Woodside refers to Woodside’s assets prior to the merger with BHP’s petroleum business. Heritage BHP refers to the assets acquired through the merger with BHP’s petroleum business. 3 For more information please refer to the Climate Report 2022. Pages 34-35. 4 Potential risk means an environmental, social or governance related risk, that if it occurs over the next 12 months, could cause an actual or a perceived negative impact on the business or on our activities. 5 Financial Stability Board (2017). “Recommendations of the Task Force on Climate-related Financial Disclosures. Final Report.” Figure 4, page 14. Some elements of the TCFD’s four recommendations and eleven recommended disclosure have been presented in different order to enhance readability. A cross reference between the TCFD and this report is provided on page 62. 6 Financial Stability Board (2021). “Implementing the Recommendations of the Task Force on Climate-related Financial Disclosures.” 7 This means net equity emissions for the 12-month period ending 31 December 2025 are targeted to be 15% lower than the starting base. 8 This means net equity emissions for the 12-month period ending 31 December 2030 are targeted to be 30% lower than the starting base. S ection 2 . 1 Woodside Energy Group Ltd | 27
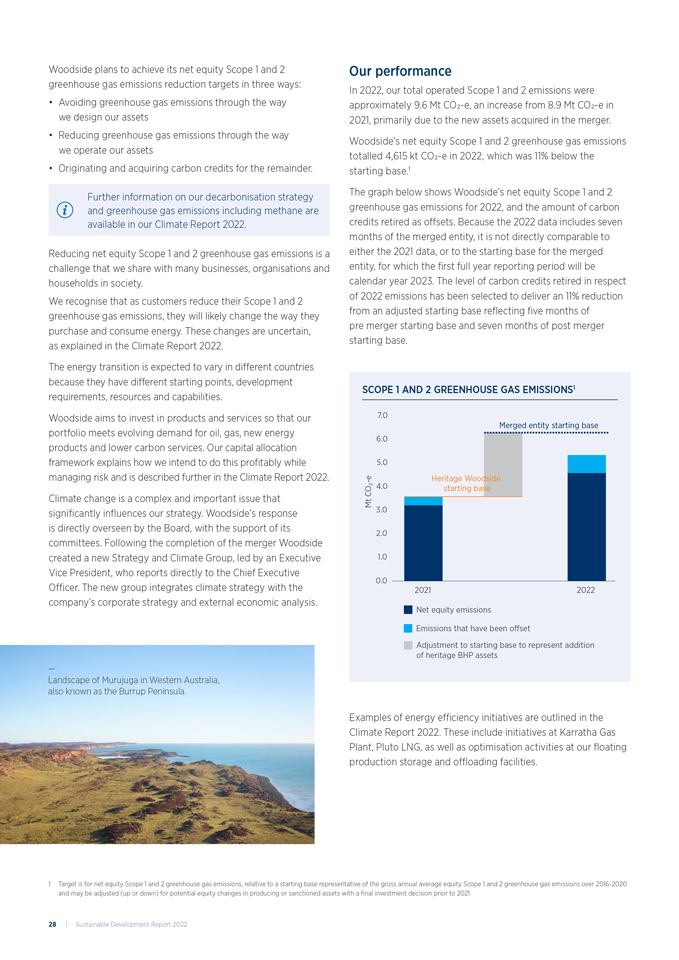
Woodside plans to achieve its net equity Scope 1 and 2 greenhouse gas emissions reduction targets in three ways: • Avoiding greenhouse gas emissions through the way we design our assets • Reducing greenhouse gas emissions through the way we operate our assets • Originating and acquiring carbon credits for the remainder. Further information on our decarbonisation strategy and greenhouse gas emissions including methane are available in our Climate Report 2022. Reducing net equity Scope 1 and 2 greenhouse gas emissions is a challenge that we share with many businesses, organisations and households in society. We recognise that as customers reduce their Scope 1 and 2 greenhouse gas emissions, they will likely change the way they purchase and consume energy. These changes are uncertain, as explained in the Climate Report 2022. The energy transition is expected to vary in different countries because they have different starting points, development requirements, resources and capabilities. Woodside aims to invest in products and services so that our portfolio meets evolving demand for oil, gas, new energy products and lower carbon services. Our capital allocation framework explains how we intend to do this profitably while managing risk and is described further in the Climate Report 2022. Climate change is a complex and important issue that significantly influences our strategy. Woodside’s response is directly overseen by the Board, with the support of its committees. Following the completion of the merger Woodside created a new Strategy and Climate Group, led by an Executive Vice President, who reports directly to the Chief Executive Officer. The new group integrates climate strategy with the company’s corporate strategy and external economic analysis. Our performance In 2022, our total operated Scope 1 and 2 emissions were approximately 9.6 Mt CO2-e, an increase from 8.9 Mt CO2-e in 2021, primarily due to the new assets acquired in the merger. Woodside’s net equity Scope 1 and 2 greenhouse gas emissions totalled 4,615 kt CO2-e in 2022, which was 11% below the starting base.1 The graph below shows Woodside’s net equity Scope 1 and 2 greenhouse gas emissions for 2022, and the amount of carbon credits retired as offsets. Because the 2022 data includes seven months of the merged entity, it is not directly comparable to either the 2021 data, or to the starting base for the merged entity, for which the first full year reporting period will be calendar year 2023. The level of carbon credits retired in respect of 2022 emissions has been selected to deliver an 11% reduction from an adjusted starting base reflecting five months of pre merger starting base and seven months of post merger starting base. Examples of energy efficiency initiatives are outlined in the Climate Report 2022. These include initiatives at Karratha Gas Plant, Pluto LNG, as well as optimisation activities at our floating production storage and offloading facilities. SCOPE 1 AND 2 GREENHOUSE GAS EMISSIONS1 2021 2022 1.0 2.0 3.0 7.0 6.0 5.0 4.0 0.0 Emissions that have been o set Net equity emissions Adjustment to starting base to represent addition of heritage BHP assets Heritage Woodside starting base Merged entity starting base Mt CO.-e 1 Target is for net equity Scope 1 and 2 greenhouse gas emissions, relative to a starting base representative of the gross annual average equity Scope 1 and 2 greenhouse gas emissions over 2016-2020 and may be adjusted (up or down) for potential equity changes in producing or sanctioned assets with a final investment decision prior to 2021. — Landscape of Murujuga in Western Australia, also known as the Burrup Peninsula. 28 | Sustainable Development Report 2022
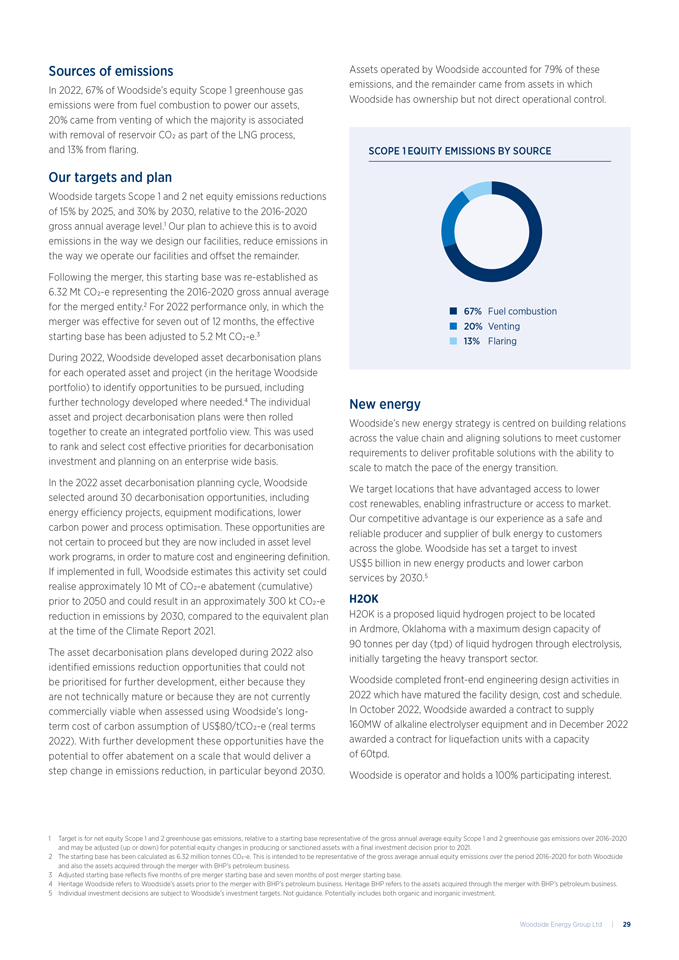
Sources of emissions In 2022, 67% of Woodside’s equity Scope 1 greenhouse gas emissions were from fuel combustion to power our assets, 20% came from venting of which the majority is associated with removal of reservoir CO2 as part of the LNG process, and 13% from flaring. 1 Target is for net equity Scope 1 and 2 greenhouse gas emissions, relative to a starting base representative of the gross annual average equity Scope 1 and 2 greenhouse gas emissions over 2016-2020 and may be adjusted (up or down) for potential equity changes in producing or sanctioned assets with a final investment decision prior to 2021. 2 The starting base has been calculated as 6.32 million tonnes CO2-e. This is intended to be representative of the gross average annual equity emissions over the period 2016-2020 for both Woodside and also the assets acquired through the merger with BHP’s petroleum business. 3 Adjusted starting base reflects five months of pre merger starting base and seven months of post merger starting base. 4 Heritage Woodside refers to Woodside’s assets prior to the merger with BHP’s petroleum business. Heritage BHP refers to the assets acquired through the merger with BHP’s petroleum business. 5 Individual investment decisions are subject to Woodside’s investment targets. Not guidance. Potentially includes both organic and inorganic investment. Assets operated by Woodside accounted for 79% of these emissions, and the remainder came from assets in which Woodside has ownership but not direct operational control. Our targets and plan Woodside targets Scope 1 and 2 net equity emissions reductions of 15% by 2025, and 30% by 2030, relative to the 2016-2020 gross annual average level.1 Our plan to achieve this is to avoid emissions in the way we design our facilities, reduce emissions in the way we operate our facilities and offset the remainder. Following the merger, this starting base was re-established as 6.32 Mt CO2-e representing the 2016-2020 gross annual average for the merged entity.2 For 2022 performance only, in which the merger was effective for seven out of 12 months, the effective starting base has been adjusted to 5.2 Mt CO2-e.3 During 2022, Woodside developed asset decarbonisation plans for each operated asset and project (in the heritage Woodside portfolio) to identify opportunities to be pursued, including further technology developed where needed.4 The individual asset and project decarbonisation plans were then rolled together to create an integrated portfolio view. This was used to rank and select cost effective priorities for decarbonisation investment and planning on an enterprise wide basis. In the 2022 asset decarbonisation planning cycle, Woodside selected around 30 decarbonisation opportunities, including energy efficiency projects, equipment modifications, lower carbon power and process optimisation. These opportunities are not certain to proceed but they are now included in asset level work programs, in order to mature cost and engineering definition. If implemented in full, Woodside estimates this activity set could realise approximately 10 Mt of CO2-e abatement (cumulative) prior to 2050 and could result in an approximately 300 kt CO2-e reduction in emissions by 2030, compared to the equivalent plan at the time of the Climate Report 2021. The asset decarbonisation plans developed during 2022 also identified emissions reduction opportunities that could not be prioritised for further development, either because they are not technically mature or because they are not currently commercially viable when assessed using Woodside’s longterm cost of carbon assumption of US$80/tCO2-e (real terms 2022). With further development these opportunities have the potential to offer abatement on a scale that would deliver a step change in emissions reduction, in particular beyond 2030. New energy Woodside’s new energy strategy is centred on building relations across the value chain and aligning solutions to meet customer requirements to deliver profitable solutions with the ability to scale to match the pace of the energy transition. We target locations that have advantaged access to lower cost renewables, enabling infrastructure or access to market. Our competitive advantage is our experience as a safe and reliable producer and supplier of bulk energy to customers across the globe. Woodside has set a target to invest US$5 billion in new energy products and lower carbon services by 2030.5 H2OK H2OK is a proposed liquid hydrogen project to be located in Ardmore, Oklahoma with a maximum design capacity of 90 tonnes per day (tpd) of liquid hydrogen through electrolysis, initially targeting the heavy transport sector. Woodside completed front-end engineering design activities in 2022 which have matured the facility design, cost and schedule. In October 2022, Woodside awarded a contract to supply 160MW of alkaline electrolyser equipment and in December 2022 awarded a contract for liquefaction units with a capacity of 60tpd. Woodside is operator and holds a 100% participating interest. SCOPE 1 EQUITY EMISSIONS BY SOURCE 67% Fuel combustion 20% Venting 13% Flaring Woodside Energy Group Ltd | 29
H2Perth H2Perth is a proposed hydrogen and ammonia production facility to be located in Perth, Western Australia. Phase 1 of the project is targeting up to 2,700 tpd of ammonia produced through both gas reforming and electrolysis. It is targeting supply to local industry and international users. Subsequent phases have the potential to expand to 8,900 tpd by increasing the electrolysis component. Pre front-end engineering design commenced in May 2022. Woodside is operator and holds a 100% participating interest. Hydrogen Refueller @H2Perth In 2022, Woodside announced plans for a proposed selfcontained hydrogen production, storage and refuelling station located adjacent to H2Perth, named the Hydrogen Refueller @H2Perth. Initially, Woodside is targeting production of 0.2 tpd of hydrogen, with the potential to scale up to a targeted 0.8 tpd. Woodside is targeting the supply of hydrogen to industrial customers and the public. Woodside is operator and holds a 100% participating interest. Southern Green Hydrogen Woodside has been selected as the preferred partner for the Southern Green Hydrogen project, a proposed hydrogen and ammonia facility to be located in Southland, New Zealand. The proposal is targeting up to 1,400 tpd of ammonia. Southern Green Hydrogen is expected to utilise renewable power to produce hydrogen and ammonia for export and domestic supply. H2TAS Woodside has a proposed renewable ammonia and hydrogen production facility in the Bell Bay area of Tasmania. H2TAS is planned to be a phased development, targeting an initial capacity of up to 550 tpd of ammonia. Ammonia would be produced through electrolysis, utilising a combination of wind and hydroelectric power. Woodside continues to evaluate the cost and schedule impacts of the renewable power solutions that would enable the project to progress. Woodside is operator and holds a 100% participating interest. Heliogen Woodside and Heliogen entered into a project agreement in 2022 to deploy a 5 MW module of Heliogen’s artificial intelligence-enabled concentrated solar energy technology in California. In addition, Heliogen and Woodside have signed a collaboration agreement to jointly market Heliogen’s renewable energy technology in Australia. Woodside Solar Woodside is progressing the proposed Woodside Solar project, a facility which would initially generate electricity from a solar photovoltaic farm approximately 15 km south-west of Karratha in Western Australia, complemented by a battery energy storage system. The facility is expected to supply up to 100 MW of solar energy with potential expansion to a maximum of 500 MW. It could supply Pluto LNG (potentially reducing Woodside’s Scope 1 emissions) as well as other customers located near Karratha that are connected to the North West Interconnected System (NWIS). In 2022, Woodside entered a bilateral Indigenous Land Use Agreement and a modern benefit sharing agreement with the Ngarluma Aboriginal Corporation, which holds the native title rights on behalf of the Ngarluma people, for the land where Woodside Solar is proposed. Woodside also executed options to lease associated land within the Maitland Industrial Estate with Development WA and has been progressing NWIS connection and transmission access arrangements. Woodside is operator and holds a 100% participating interest. Carbon capture and storage Woodside, as a participant in various joint ventures, was awarded three greenhouse gas assessment permits in 2022. These permits enable carbon capture and storage assessments in the Browse Basin (operated), Northern Carnarvon Basin (operated) and Bonaparte Basin (non-operated). One of these permits covers the depleted Angel gas field, which could provide a storage reservoir for a multi-user carbon capture and storage (CCS) project near Karratha in Western Australia. This could be ideally located to aggregate emissions from various existing industrial emissions sources on the Burrup Peninsula. It could also have the potential to facilitate the development of new industries, such as the production of hydrogen and ammonia, by providing a local solution for emissions. The size of the potential CCS facility is subject to the completion of additional technical, regulatory and commercial studies, but could have a processing capacity of up to 5 million tonnes of carbon dioxide per annum. Woodside is also a participant in the Gippsland Basin Joint Venture, which is progressing a feasibility study into the development of a south-east Australian carbon capture and storage hub. This aims to utilise existing infrastructure to capture and store CO2 in the depleted Bream reservoir located offshore Victoria. 30 | Sustainable Development Report 2022
Carbon to products In 2022, Woodside launched a carbon capture and utilisation (CCU) collaboration with United States based technology developers ReCarbon and LanzaTech to assess the viability of a proposed CCU pilot facility in Perth, Western Australia. The proposed pilot CCU facility would convert greenhouse gases into ethanol. Woodside and LanzaTech also entered into a strategic framework agreement, under which Woodside will collaborate with LanzaTech to design, construct, own, maintain and operate pilot facilities utilising LanzaTech’s CCU technologies. LanzaTech’s skillset is in the fields of synthetic biology, bioinformatics, artificial intelligence, and machine learning coupled with engineering. Woodside also announced an investment of US$9.9 million in String Bio Private Limited (String Bio), the developer of a patented process for recycling greenhouse gases into products such as livestock feed. Woodside and String Bio entered a strategic development agreement to explore opportunities for the potential commercial scale up of String Bio’s technology. Climate advocacy Woodside regularly engages with governments of countries where we are active in support of our business strategy to exchange information and to inform policy development and decision-making. This engagement is undertaken both directly and by working with industry associations. Woodside’s participation in government consultation related to climate change is summarised in the Climate Report 2022. We also participated in a number of industry associations and our approach is explained in our Industry Association Climate Alignment Review, which can be found on our website. 1 UNFCCC 2016. The Paris Agreement, preamble. Just transition The Paris Agreement emphasises “the intrinsic relationship that climate change actions, responses and impacts have with equitable access to sustainable development and eradication of poverty”. It also takes into account “the imperatives of a just transition of the workforce and the creation of decent work and quality jobs”.1 When we consider Woodside’s contribution towards a just transition we primarily consider our investment in supplying the products and services that our customers need as they secure their energy needs and reduce their emissions. Our broader contribution to society is outlined in the United Nations Sustainable Development Goals on pages 17-25 of this report. It includes but is not limited to: • Provision of decent work • Our approach to the inclusion of local content, in the procurement of goods and services • Payments to government including taxes • Social contribution and stakeholder engagement including amongst others, employee engagement, partnering with communities and social investment • Research programs and contributions towards scientific research and studies. For more information on Just transition, please refer to the Climate Report 2022. Collaboration The scale of the change required to achieve a just transition will require commitment and collaboration between governments, industry, investors and communities. Our approach is informed by our membership of Ipieca’s Just Transition Task Force that aims to support collaboration and sharing of good practice as companies develop their decarbonisation plans. Woodside is also a member of various international forums that encourage information sharing and collaboration across industry. For more information regarding industry associations please see our website. Woodside Energy Group Ltd | 31
The continued focus on environmental performance of our business is essential to our success. 2022 HIGHLIGHTS » Investment in science and biodiversity knowledge outcomes through key science and conservation partnerships » Air monitoring program directly supporting the Murujuga Rock Art Strategy » A new Environment and Biodiversity Policy1 » More than one million native seedlings planted as part of the Woodside Native Reforestation Project OPPORTUNITIES » Revise our environmental management system to reflect our new policy and expanded global portfolio » Integrate global environmental management standards post merger » Develop a framework to deliver positive biodiversity and environmental outcomes in the areas we operate1 POTENTIAL RISKS2 » Increased regulatory and stakeholder expectations leading to extended timeframes and complexity of environmental approvals » Failure to progress biodiversity initiatives in a timely manner leading to missed opportunities to support positive biodiversity outcomes in regions and areas we operate1 Our approach The nature of our operations is accompanied by certain environmental impacts and risks. We work to minimise our impacts by integrating environmental management into our activities, including the design, construction, operation and decommissioning of our facilities. The merger with BHP Petroleum brings an opportunity for Woodside to integrate our environmental management approaches, requirements and performance standards to optimise environmental outcomes. We have started this integration by reviewing our processes and commitments, identifying areas of strength to build on and look to embed renewed environmental standards across Woodside. Our focus on implementing leading environmental management and mitigation strategies has allowed us to minimise our environmental impacts and maintain our over 30 year record of oil and gas operations without any major environmental incidents. We recognise that it is not just how we approach environmental management, such as the use of a risk based assessment which matters, but we also need to be clear and transparent on what we stand for as a company. We aim to set appropriate targets and metrics against our key environmental and biodiversity areas and we expect to be able to include these in our Sustainable Development Report 2023.1 We engage with our stakeholders to better understand the possible impacts of our activities and to further understand preferred methods and frequency of engagement. Refer to our website for our Environment and Biodiversity Policy. Environment and biodiversity 1 This section of text regarding biodiversity formed part of the assurance process of this report. 2 Potential risk means an environmental, social or governance related-risk, that if it occurs over the next 12 months, could cause an actual or a perceived negative impact on the business or on our activities. S ection 2 . 2 32 | Sustainable Development Report 2022
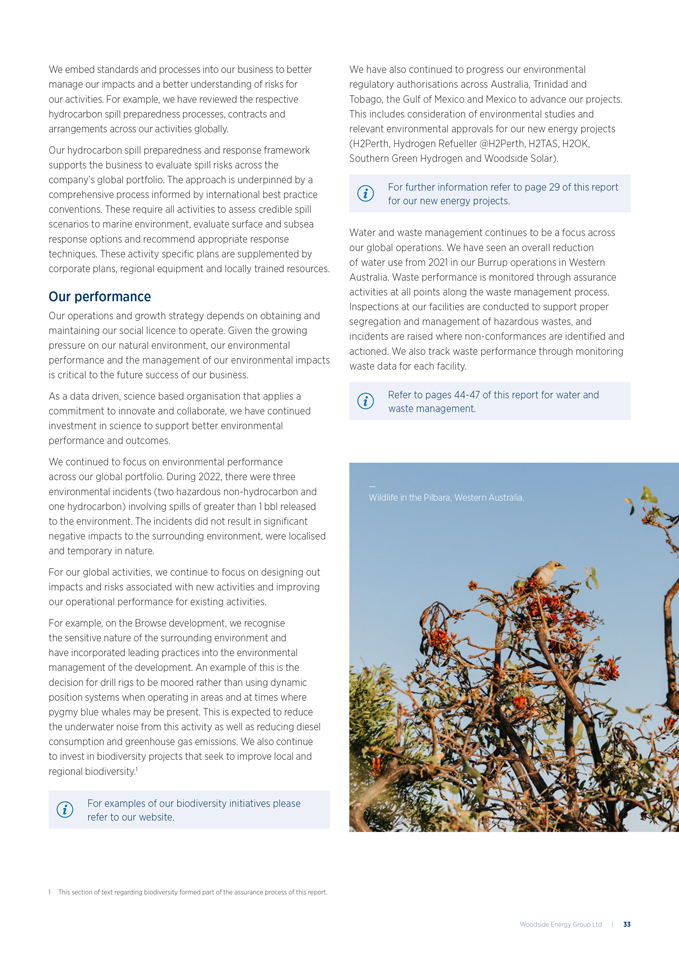
We embed standards and processes into our business to better manage our impacts and a better understanding of risks for our activities. For example, we have reviewed the respective hydrocarbon spill preparedness processes, contracts and arrangements across our activities globally. Our hydrocarbon spill preparedness and response framework supports the business to evaluate spill risks across the company’s global portfolio. The approach is underpinned by a comprehensive process informed by international best practice conventions. These require all activities to assess credible spill scenarios to marine environment, evaluate surface and subsea response options and recommend appropriate response techniques. These activity specific plans are supplemented by corporate plans, regional equipment and locally trained resources. Our performance Our operations and growth strategy depends on obtaining and maintaining our social licence to operate. Given the growing pressure on our natural environment, our environmental performance and the management of our environmental impacts is critical to the future success of our business. As a data driven, science based organisation that applies a commitment to innovate and collaborate, we have continued investment in science to support better environmental performance and outcomes. We continued to focus on environmental performance across our global portfolio. During 2022, there were three environmental incidents (two hazardous non-hydrocarbon and one hydrocarbon) involving spills of greater than 1 bbl released to the environment. The incidents did not result in significant negative impacts to the surrounding environment, were localised and temporary in nature. For our global activities, we continue to focus on designing out impacts and risks associated with new activities and improving our operational performance for existing activities. For example, on the Browse development, we recognise the sensitive nature of the surrounding environment and have incorporated leading practices into the environmental management of the development. An example of this is the decision for drill rigs to be moored rather than using dynamic position systems when operating in areas and at times where pygmy blue whales may be present. This is expected to reduce the underwater noise from this activity as well as reducing diesel consumption and greenhouse gas emissions. We also continue to invest in biodiversity projects that seek to improve local and regional biodiversity.1 For examples of our biodiversity initiatives please refer to our website. We have also continued to progress our environmental regulatory authorisations across Australia, Trinidad and Tobago, the Gulf of Mexico and Mexico to advance our projects. This includes consideration of environmental studies and relevant environmental approvals for our new energy projects (H2Perth, Hydrogen Refueller @H2Perth, H2TAS, H2OK, Southern Green Hydrogen and Woodside Solar). For further information refer to page 29 of this report for our new energy projects. Water and waste management continues to be a focus across our global operations. We have seen an overall reduction of water use from 2021 in our Burrup operations in Western Australia. Waste performance is monitored through assurance activities at all points along the waste management process. Inspections at our facilities are conducted to support proper segregation and management of hazardous wastes, and incidents are raised where non-conformances are identified and actioned. We also track waste performance through monitoring waste data for each facility. Refer to pages 44-47 of this report for water and waste management. 1 This section of text regarding biodiversity formed part of the assurance process of this report. — Wildlife in the Pilbara, Western Australia. Woodside Energy Group Ltd | 33
Environmental management1 In a world that is changing rapidly, we need to ensure that both our existing and planned activities contribute towards acceptable outcomes across the environmental, social and economic landscape. We recognise our activities have an environmental footprint and we seek to prevent or minimise adverse environmental impacts to the natural environment in the regions we operate. We seek to understand the nature of the environments in which we operate to inform our planning and decision-making. An adaptive approach to certain activities such as produced water discharges allows us to constantly respond to changing operational and environmental conditions to ensure our impacts remain acceptable and as low as reasonably practicable. With increasing awareness of the impact of business activities on biodiversity, we have engaged further with peers and industry bodies to understand leading approaches to reinforce our biodiversity and broader environmental management. We do this by adopting a risk based approach that allows us to address the environmental impacts and risks associated with our activities in a consistent way. It allows us to focus our effort and resources on the most significant risks associated with our activities no matter where we operate or what a regulatory regime may require. Woodside recognises that risk is inherent to our business and effectively managing risk is vital to delivering on company objectives, success and continued growth. Woodside is committed to managing our risks proactively and effectively. The objective of Woodside’s risk management system is to provide a consistent process for recognising and managing risks across the business. Achieving this objective includes ensuring risks consider impacts across the key areas of exposure: • Health and safety • Environment • Finance • Reputation and brand • Legal and compliance • Social and cultural. Our environmental risk management methodology has been informed by the International Standard ISO 31000 for risk management. This provides a framework to demonstrate that the risks and impacts are continually identified, reduced to a level that is considered as low as reasonably practicable and assessed to ensure impacts of an activity are at a level we consider to be acceptable. This approach means we identify potential ways to eliminate or avoid an impact before we consider ways of reducing or minimising it. The management measures include at a minimum those that are considered good international industry practice. We regularly reassess environmental impacts and risks of operations across our portfolio at the activity level. This is to ensure emerging scientific understanding and best practices are captured in these assessments, ultimately resulting in improved environmental outcomes. To support the risk assessment process and Woodside’s determination of acceptability, our health, safety and environment risk management procedures include the use of a decision support framework based on principles set out in the Guidance on Risk Related Decision Making (Oil and Gas UK 2014). This is to confirm activities do not pose an unacceptable environmental risk. In addition, appropriate focus is placed on activities where the impact or risk is anticipated to be acceptable and demonstrated to be as low as reasonably practicable. The appropriate effort is also applied to the management of risks and impacts based on the uncertainty of the risk, the complexity and risk rating. Strong partnerships, sound research and transparency are the elements of our approach to minimising environmental impacts. A key focus of the risk based process undertaken for environmental impacts is defined under the relevant environmental legislation. This includes consideration of the key values of the environment, such as protected areas, threatened and migratory species, and a component of robust impact assessment is to evaluate activities against the relevant management plans for habitats and species. Refer to our website for our Environmental Management Approach. 1 This section of text regarding biodiversity formed part of the assurance process of this report. 34 | Sustainable Development Report 2022
Investing in science1 Our approach to science enables us to deliver environmental performance throughout the entire life cycle of our operations, from exploration and development to production and decommissioning, strengthening our ambition to demonstrate environmental leadership and innovation. Our continued investment in science allows us to proudly collaborate and partner with some of the world’s leading experts and research organisations to understand the environments in which we operate and inform decision-making. Our commitment to shared scientific understanding of biodiversity in the regions that we operate is demonstrated through our meaningful partnerships. Our collaborative work with strategic partners and local communities is focused on contributing to positive environmental and social benefits through biodiversity conservation and ecosystem restoration. Our commitment to the shared scientific understanding of environmental characteristics including biodiversity in the regions that we operate is demonstrated by the continued, scientific publication track record of the organisations with which we partner. The knowledge from these partnership programs supports our ongoing environmental management processes including our impact assessment and improving our management controls to avoid and minimise our environmental impacts. In addition, we support our research partners to publish research findings in international peer reviewed scientific journals. In 2022, there were at least 15 scientific journal articles highlighting the findings of research supported by Woodside. In 2022, our science partnership programs included a range of initiatives as outlined below. We worked with the Australian Institute of Marine Science to undertake satellite tagging of pygmy blue whales in the Perth Canyon, Western Australia. This program is intended to further the knowledge of movement, foraging and feeding behaviour. We supported the Western Australian Department of Biodiversity, Conservation and Attractions, with regards to the Ningaloo Turtle Program to continue long-term monitoring of nesting marine turtles in the Ningaloo Marine Park and Ningaloo Coast World Heritage Area. We worked with BirdLife Australia on migratory shorebird and seabird assessments, banding and satellite tagging activities in the Exmouth Gulf. Field work planning and preparation activities are well underway for scheduled survey work in February 2023. The planned field program may allow for further understanding of habitats, their utilisation by migration shorebird and seabird species, and future conservation management of a recognised site of the East Asia-Australasian Flyway in Western Australia. Our support for Pendoley Environmental enabled the completion of a benchmark study of artificial light at night of the Dampier Archipelago. We also supported the National Decommissioning Research Initiative, an industry research collaboration to progress decommissioning options for offshore oil and gas infrastructure via a range of environmental studies to assess impacts, risks and benefits of different offshore decommissioning options. We continued our ongoing membership of the IOGP Sound and Marine Life Joint Industry Program, a globally recognised contributor of knowledge on the potential effects of anthropogenic sound on marine life. In 2023, Woodside will continue to support research that improves our ability to avoid and minimise the impacts of our activities on the environment and biodiversity around us. 1 This section of text regarding biodiversity formed part of the assurance process of this report. Woodside Energy Group Ltd | 35
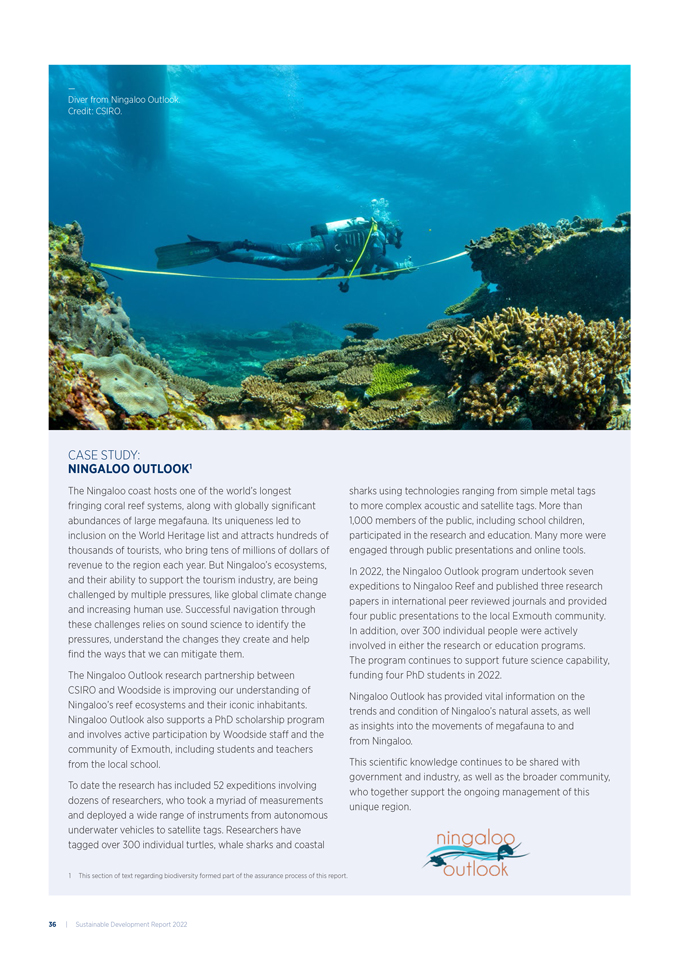
CASE STUDY: NINGALOO OUTLOOK1 The Ningaloo coast hosts one of the world’s longest fringing coral reef systems, along with globally significant abundances of large megafauna. Its uniqueness led to inclusion on the World Heritage list and attracts hundreds of thousands of tourists, who bring tens of millions of dollars of revenue to the region each year. But Ningaloo’s ecosystems, and their ability to support the tourism industry, are being challenged by multiple pressures, like global climate change and increasing human use. Successful navigation through these challenges relies on sound science to identify the pressures, understand the changes they create and help find the ways that we can mitigate them. The Ningaloo Outlook research partnership between CSIRO and Woodside is improving our understanding of Ningaloo’s reef ecosystems and their iconic inhabitants. Ningaloo Outlook also supports a PhD scholarship program and involves active participation by Woodside staff and the community of Exmouth, including students and teachers from the local school. To date the research has included 52 expeditions involving dozens of researchers, who took a myriad of measurements and deployed a wide range of instruments from autonomous underwater vehicles to satellite tags. Researchers have tagged over 300 individual turtles, whale sharks and coastal sharks using technologies ranging from simple metal tags to more complex acoustic and satellite tags. More than 1,000 members of the public, including school children, participated in the research and education. Many more were engaged through public presentations and online tools. In 2022, the Ningaloo Outlook program undertook seven expeditions to Ningaloo Reef and published three research papers in international peer reviewed journals and provided four public presentations to the local Exmouth community. In addition, over 300 individual people were actively involved in either the research or education programs. The program continues to support future science capability, funding four PhD students in 2022. Ningaloo Outlook has provided vital information on the trends and condition of Ningaloo’s natural assets, as well as insights into the movements of megafauna to and from Ningaloo. This scientific knowledge continues to be shared with government and industry, as well as the broader community, who together support the ongoing management of this unique region. — Diver from Ningaloo Outlook. Credit: CSIRO. 1 This section of text regarding biodiversity formed part of the assurance process of this report. 36 | Sustainable Development Report 2022
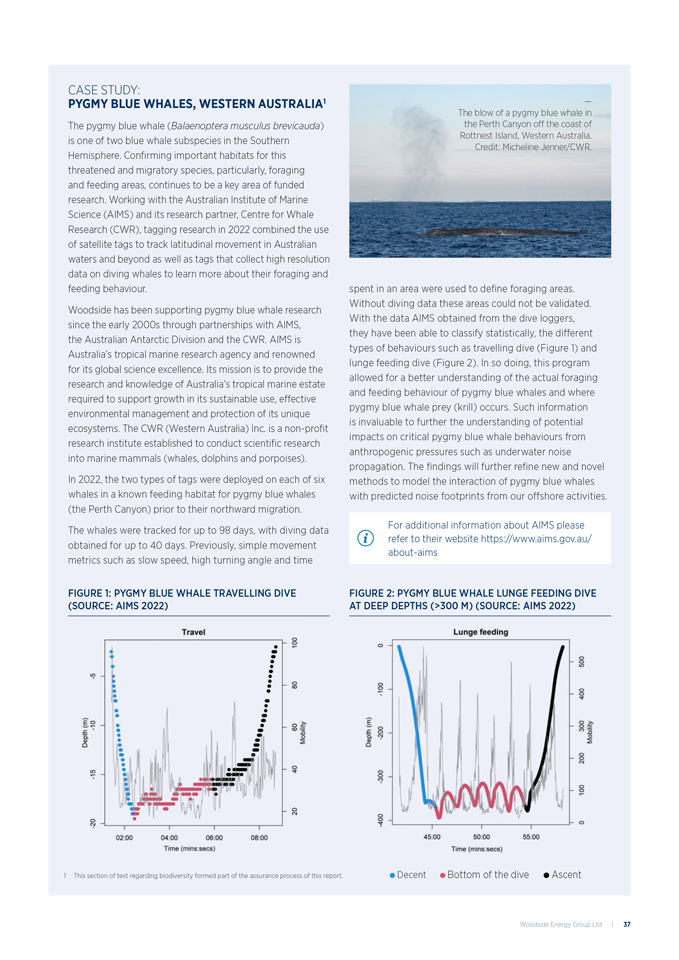
CASE STUDY: PYGMY BLUE WHALES, WESTERN AUSTRALIA1 The pygmy blue whale (Balaenoptera musculus brevicauda) is one of two blue whale subspecies in the Southern Hemisphere. Confirming important habitats for this threatened and migratory species, particularly, foraging and feeding areas, continues to be a key area of funded research. Working with the Australian Institute of Marine Science (AIMS) and its research partner, Centre for Whale Research (CWR), tagging research in 2022 combined the use of satellite tags to track latitudinal movement in Australian waters and beyond as well as tags that collect high resolution data on diving whales to learn more about their foraging and feeding behaviour. Woodside has been supporting pygmy blue whale research since the early 2000s through partnerships with AIMS, the Australian Antarctic Division and the CWR. AIMS is Australia’s tropical marine research agency and renowned for its global science excellence. Its mission is to provide the research and knowledge of Australia’s tropical marine estate required to support growth in its sustainable use, effective environmental management and protection of its unique ecosystems. The CWR (Western Australia) Inc. is a non-profit research institute established to conduct scientific research into marine mammals (whales, dolphins and porpoises). In 2022, the two types of tags were deployed on each of six whales in a known feeding habitat for pygmy blue whales (the Perth Canyon) prior to their northward migration. The whales were tracked for up to 98 days, with diving data obtained for up to 40 days. Previously, simple movement metrics such as slow speed, high turning angle and time spent in an area were used to define foraging areas. Without diving data these areas could not be validated. With the data AIMS obtained from the dive loggers, they have been able to classify statistically, the different types of behaviours such as travelling dive (Figure 1) and lunge feeding dive (Figure 2). In so doing, this program allowed for a better understanding of the actual foraging and feeding behaviour of pygmy blue whales and where pygmy blue whale prey (krill) occurs. Such information is invaluable to further the understanding of potential impacts on critical pygmy blue whale behaviours from anthropogenic pressures such as underwater noise propagation. The findings will further refine new and novel methods to model the interaction of pygmy blue whales with predicted noise footprints from our offshore activities. For additional information about AIMS please refer to their website https://www.aims.gov.au/ about-aims — The blow of a pygmy blue whale in the Perth Canyon off the coast of Rottnest Island, Western Australia. Credit: Micheline Jenner/CWR. FIGURE 1: PYGMY BLUE WHALE TRAVELLING DIVE (SOURCE: AIMS 2022) FIGURE 2: PYGMY BLUE WHALE LUNGE FEEDING DIVE AT DEEP DEPTHS (>300 M) (SOURCE: AIMS 2022) 1 This section of text regarding biodiversity formed part of the assurance process of this report. Decent Bottom of the dive Ascent Woodside Energy Group Ltd | 37
Environmental approvals Scarborough environmental approvals Woodside continues to progress our secondary environmental approvals and associated stakeholder consultation activities for the Scarborough Project. Three Commonwealth Environment Plans are currently under assessment with National Offshore Petroleum Safety and Environmental Management Authority. These are available via the following regulator link. Refer to https://www.nopsema.gov.au/ In addition a State Environment Plan is also under assessment with the Western Australian Department of Mines, Industry Regulation and Safety. Refer to https://dmp.wa.gov.au/ Refer to https://www.epa.wa.gov.au/ Consultation on all of the above plans and activities remains ongoing as is responding to comments from the various regulators and stakeholders as part of the environmental approvals assessment process. Browse environmental approvals On 9 September 2022, the Final Environment Impact Statement for the Browse development was published. Woodside provided a response to each of the over 19,800 comments that were received from stakeholders including members of the public, non-government organisations and government departments. Comments primarily related to the following topics: • Greenhouse gas emissions • Potential (indirect) impacts to Burrup Peninsula (Murujuga) rock art • Potential impacts to threatened and migratory marine fauna (particularly turtles and whales) • Potential impacts to Scott Reef. In addition, two new management plans were developed to provide greater transparency as to the way in which risks to turtles and whales will be managed. A detailed process of measures to be put in place to minimise oil spill risks was also provided. Refer to our website for more information on environmental approvals. Legal proceedings Woodside is involved from time to time in legal proceedings and governmental investigations of a character normally incidental to its business, including claims and pending actions against it seeking damages, or clarification or prosecution of legal rights and regulatory inquiries regarding business practices. A summary of material legal proceedings is provided in the Annual Report 2022. Refer to the Annual Report 2022 for additional information. 38 | Sustainable Development Report 2022
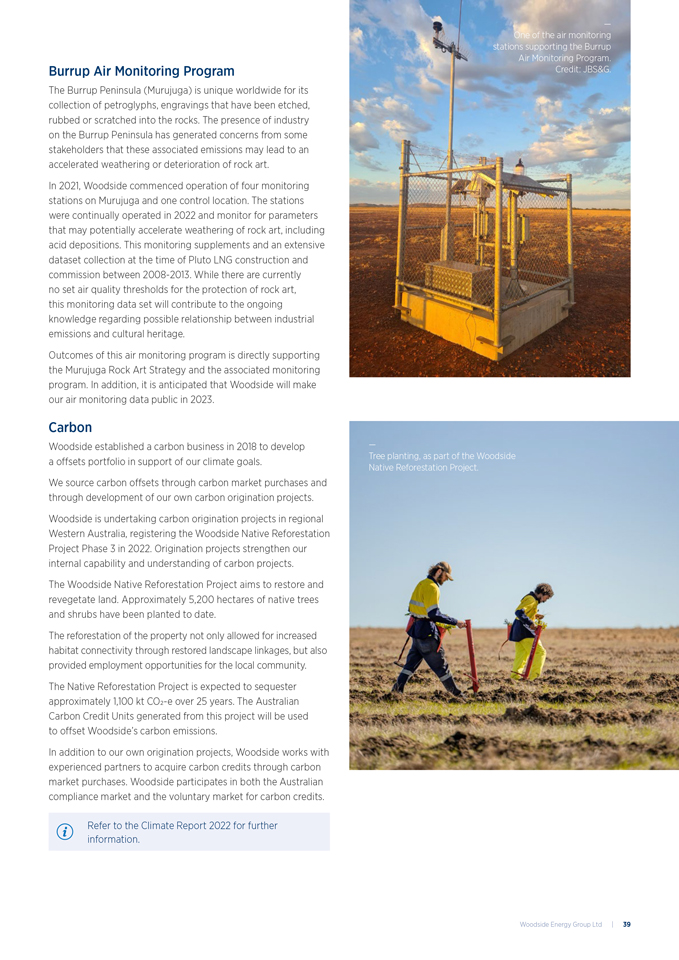
— One of the air monitoring stations supporting the Burrup Air Monitoring Program. Burrup Air Monitoring Program Credit: JBS&G. The Burrup Peninsula (Murujuga) is unique worldwide for its collection of petroglyphs, engravings that have been etched, rubbed or scratched into the rocks. The presence of industry on the Burrup Peninsula has generated concerns from some stakeholders that these associated emissions may lead to an accelerated weathering or deterioration of rock art. In 2021, Woodside commenced operation of four monitoring stations on Murujuga and one control location. The stations were continually operated in 2022 and monitor for parameters that may potentially accelerate weathering of rock art, including acid depositions. This monitoring supplements and an extensive dataset collection at the time of Pluto LNG construction and commission between 2008-2013. While there are currently no set air quality thresholds for the protection of rock art, this monitoring data set will contribute to the ongoing knowledge regarding possible relationship between industrial emissions and cultural heritage. Outcomes of this air monitoring program is directly supporting the Murujuga Rock Art Strategy and the associated monitoring program. In addition, it is anticipated that Woodside will make our air monitoring data public in 2023. Carbon Woodside established a carbon business in 2018 to develop a offsets portfolio in support of our climate goals. We source carbon offsets through carbon market purchases and through development of our own carbon origination projects. Woodside is undertaking carbon origination projects in regional Western Australia, registering the Woodside Native Reforestation Project Phase 3 in 2022. Origination projects strengthen our internal capability and understanding of carbon projects. The Woodside Native Reforestation Project aims to restore and revegetate land. Approximately 5,200 hectares of native trees and shrubs have been planted to date. The reforestation of the property not only allowed for increased habitat connectivity through restored landscape linkages, but also provided employment opportunities for the local community. The Native Reforestation Project is expected to sequester approximately 1,100 kt CO2-e over 25 years. The Australian Carbon Credit Units generated from this project will be used to offset Woodside’s carbon emissions. In addition to our own origination projects, Woodside works with experienced partners to acquire carbon credits through carbon market purchases. Woodside participates in both the Australian compliance market and the voluntary market for carbon credits. Refer to the Climate Report 2022 for further information. — Tree planting, as part of the Woodside Native Reforestation Project. Woodside Energy Group Ltd | 39
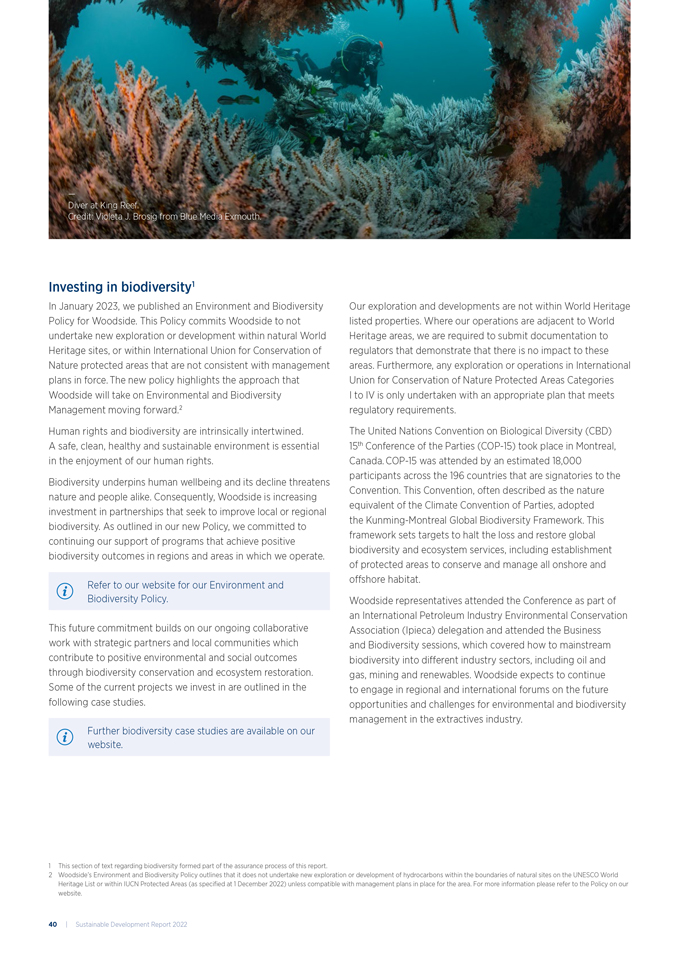
Investing in biodiversity1 In January 2023, we published an Environment and Biodiversity Policy for Woodside. This Policy commits Woodside to not undertake new exploration or development within natural World Heritage sites, or within International Union for Conservation of Nature protected areas that are not consistent with management plans in force. The new policy highlights the approach that Woodside will take on Environmental and Biodiversity Management moving forward.2 Human rights and biodiversity are intrinsically intertwined. A safe, clean, healthy and sustainable environment is essential in the enjoyment of our human rights. Biodiversity underpins human wellbeing and its decline threatens nature and people alike. Consequently, Woodside is increasing investment in partnerships that seek to improve local or regional biodiversity. As outlined in our new Policy, we committed to continuing our support of programs that achieve positive biodiversity outcomes in regions and areas in which we operate. Refer to our website for our Environment and Biodiversity Policy. This future commitment builds on our ongoing collaborative work with strategic partners and local communities which contribute to positive environmental and social outcomes through biodiversity conservation and ecosystem restoration. Some of the current projects we invest in are outlined in the following case studies. Further biodiversity case studies are available on our website. Our exploration and developments are not within World Heritage listed properties. Where our operations are adjacent to World Heritage areas, we are required to submit documentation to regulators that demonstrate that there is no impact to these areas. Furthermore, any exploration or operations in International Union for Conservation of Nature Protected Areas Categories I to IV is only undertaken with an appropriate plan that meets regulatory requirements. The United Nations Convention on Biological Diversity (CBD) 15th Conference of the Parties (COP-15) took place in Montreal, Canada. COP-15 was attended by an estimated 18,000 participants across the 196 countries that are signatories to the Convention. This Convention, often described as the nature equivalent of the Climate Convention of Parties, adopted the Kunming-Montreal Global Biodiversity Framework. This framework sets targets to halt the loss and restore global biodiversity and ecosystem services, including establishment of protected areas to conserve and manage all onshore and offshore habitat. Woodside representatives attended the Conference as part of an International Petroleum Industry Environmental Conservation Association (Ipieca) delegation and attended the Business and Biodiversity sessions, which covered how to mainstream biodiversity into different industry sectors, including oil and gas, mining and renewables. Woodside expects to continue to engage in regional and international forums on the future opportunities and challenges for environmental and biodiversity management in the extractives industry. 1 This section of text regarding biodiversity formed part of the assurance process of this report. 2 Woodside’s Environment and Biodiversity Policy outlines that it does not undertake new exploration or development of hydrocarbons within the boundaries of natural sites on the UNESCO World Heritage List or within IUCN Protected Areas (as specified at 1 December 2022) unless compatible with management plans in place for the area. For more information please refer to the Policy on our website. — Diver at King Reef. Credit: Violeta J. Brosig from Blue Media Exmouth. 40 | Sustainable Development Report 2022
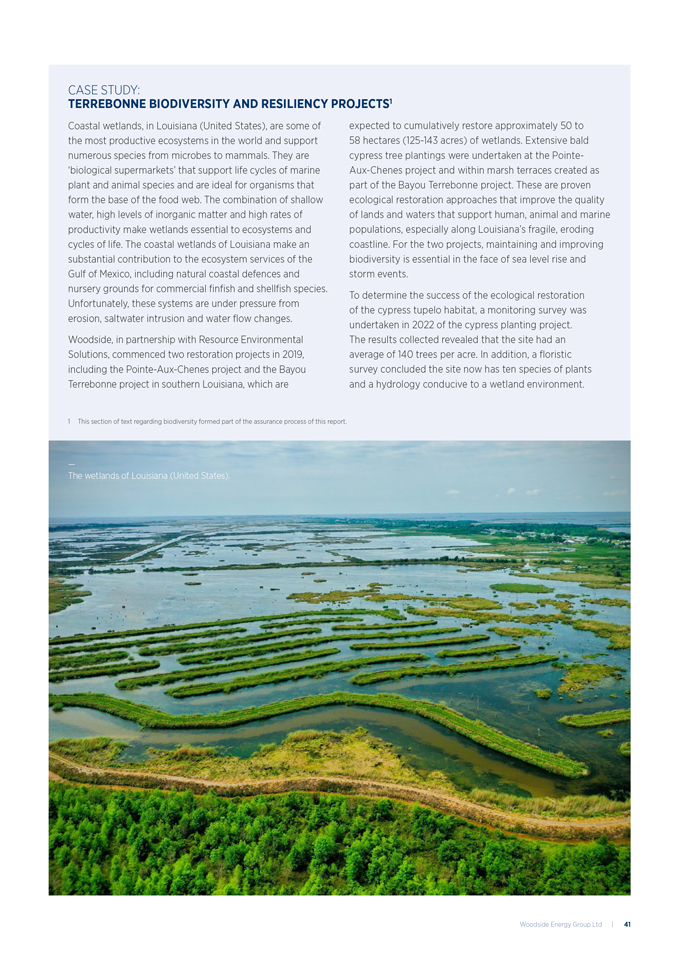
CASE STUDY: TERREBONNE BIODIVERSITY AND RESILIENCY PROJECTS1 Coastal wetlands, in Louisiana (United States), are some of the most productive ecosystems in the world and support numerous species from microbes to mammals. They are ‘biological supermarkets’ that support life cycles of marine plant and animal species and are ideal for organisms that form the base of the food web. The combination of shallow water, high levels of inorganic matter and high rates of productivity make wetlands essential to ecosystems and cycles of life. The coastal wetlands of Louisiana make an substantial contribution to the ecosystem services of the Gulf of Mexico, including natural coastal defences and nursery grounds for commercial finfish and shellfish species. Unfortunately, these systems are under pressure from erosion, saltwater intrusion and water flow changes. Woodside, in partnership with Resource Environmental Solutions, commenced two restoration projects in 2019, including the Pointe-Aux-Chenes project and the Bayou Terrebonne project in southern Louisiana, which are expected to cumulatively restore approximately 50 to 58 hectares (125-143 acres) of wetlands. Extensive bald cypress tree plantings were undertaken at the Pointe- Aux-Chenes project and within marsh terraces created as part of the Bayou Terrebonne project. These are proven ecological restoration approaches that improve the quality of lands and waters that support human, animal and marine populations, especially along Louisiana’s fragile, eroding coastline. For the two projects, maintaining and improving biodiversity is essential in the face of sea level rise and storm events. To determine the success of the ecological restoration of the cypress tupelo habitat, a monitoring survey was undertaken in 2022 of the cypress planting project. The results collected revealed that the site had an average of 140 trees per acre. In addition, a floristic survey concluded the site now has ten species of plants and a hydrology conducive to a wetland environment. — The wetlands of Louisiana (United States). 1 This section of text regarding biodiversity formed part of the assurance process of this report. Woodside Energy Group Ltd | 41
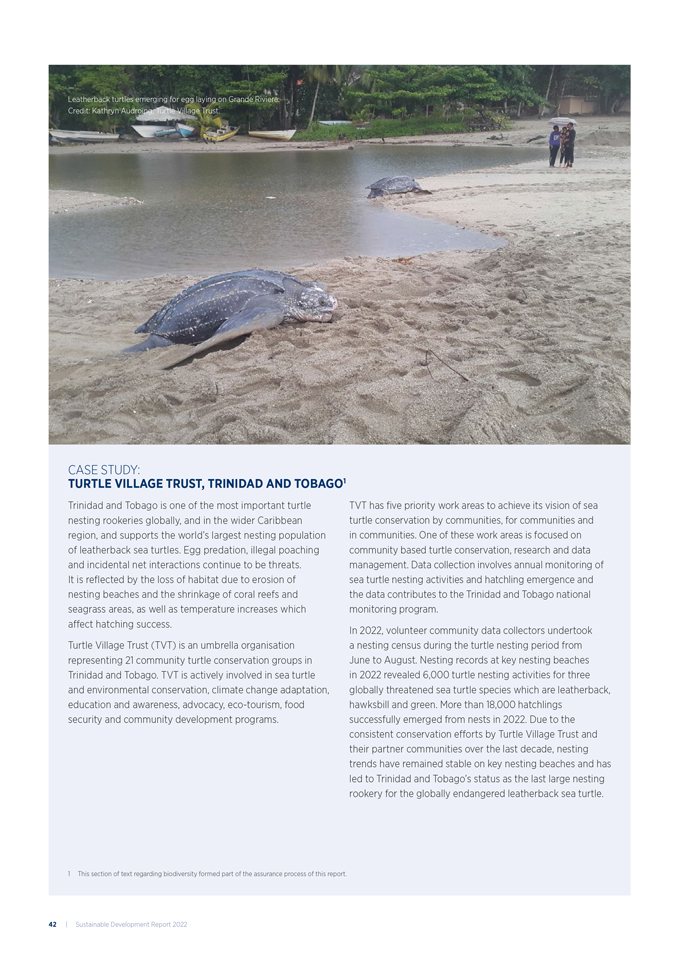
CASE STUDY: TURTLE VILLAGE TRUST, TRINIDAD AND TOBAGO1 Trinidad and Tobago is one of the most important turtle nesting rookeries globally, and in the wider Caribbean region, and supports the world’s largest nesting population of leatherback sea turtles. Egg predation, illegal poaching and incidental net interactions continue to be threats. It is reflected by the loss of habitat due to erosion of nesting beaches and the shrinkage of coral reefs and seagrass areas, as well as temperature increases which affect hatching success. Turtle Village Trust (TVT) is an umbrella organisation representing 21 community turtle conservation groups in Trinidad and Tobago. TVT is actively involved in sea turtle and environmental conservation, climate change adaptation, education and awareness, advocacy, eco-tourism, food security and community development programs. TVT has five priority work areas to achieve its vision of sea turtle conservation by communities, for communities and in communities. One of these work areas is focused on community based turtle conservation, research and data management. Data collection involves annual monitoring of sea turtle nesting activities and hatchling emergence and the data contributes to the Trinidad and Tobago national monitoring program. In 2022, volunteer community data collectors undertook a nesting census during the turtle nesting period from June to August. Nesting records at key nesting beaches in 2022 revealed 6,000 turtle nesting activities for three globally threatened sea turtle species which are leatherback, hawksbill and green. More than 18,000 hatchlings successfully emerged from nests in 2022. Due to the consistent conservation efforts by Turtle Village Trust and their partner communities over the last decade, nesting trends have remained stable on key nesting beaches and has led to Trinidad and Tobago’s status as the last large nesting rookery for the globally endangered leatherback sea turtle. 1 This section of text regarding biodiversity formed part of the assurance process of this report. — Leatherback turtles emerging for egg laying on Grande Riviere. Credit: Kathryn Audroing, Turtle Village Trust. 42 | Sustainable Development Report 2022
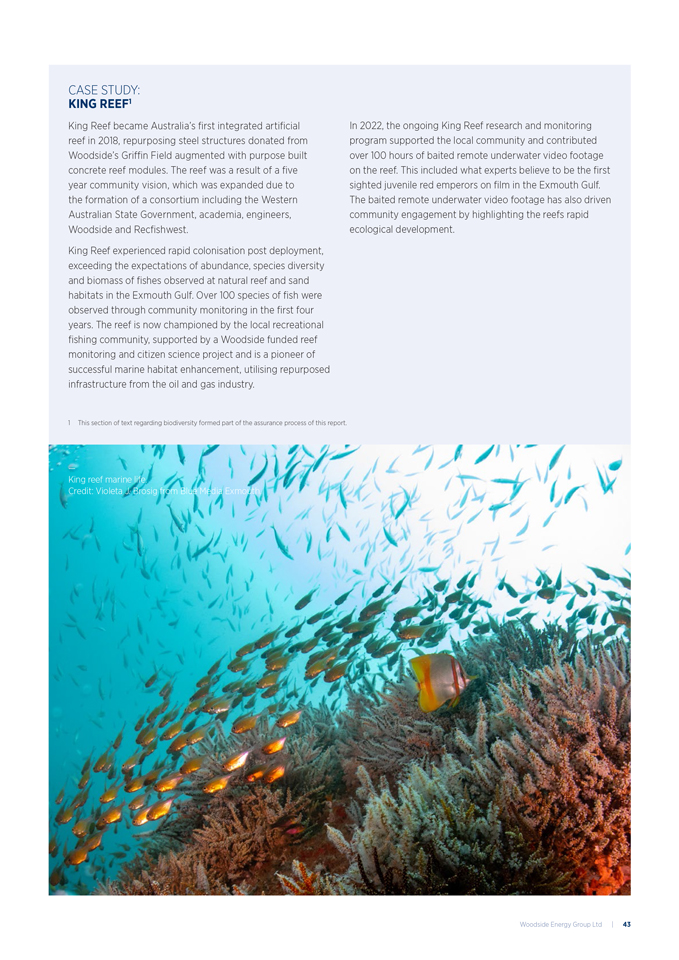
CASE STUDY: KING REEF1 King Reef became Australia’s first integrated artificial reef in 2018, repurposing steel structures donated from Woodside’s Griffin Field augmented with purpose built concrete reef modules. The reef was a result of a five year community vision, which was expanded due to the formation of a consortium including the Western Australian State Government, academia, engineers, Woodside and Recfishwest. King Reef experienced rapid colonisation post deployment, exceeding the expectations of abundance, species diversity and biomass of fishes observed at natural reef and sand habitats in the Exmouth Gulf. Over 100 species of fish were observed through community monitoring in the first four years. The reef is now championed by the local recreational fishing community, supported by a Woodside funded reef monitoring and citizen science project and is a pioneer of successful marine habitat enhancement, utilising repurposed infrastructure from the oil and gas industry. In 2022, the ongoing King Reef research and monitoring program supported the local community and contributed over 100 hours of baited remote underwater video footage on the reef. This included what experts believe to be the first sighted juvenile red emperors on film in the Exmouth Gulf. The baited remote underwater video footage has also driven community engagement by highlighting the reefs rapid ecological development. — King reef marine life. Credit: Violeta J. Brosig from Blue Media Exmouth. 1 This section of text regarding biodiversity formed part of the assurance process of this report. Woodside Energy Group Ltd | 43
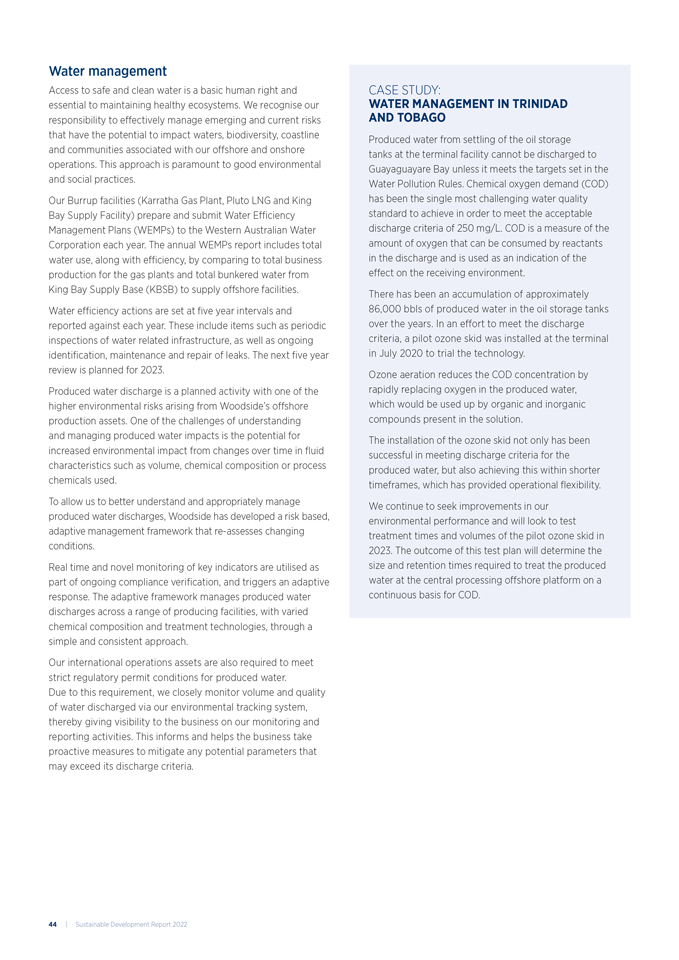
Water management Access to safe and clean water is a basic human right and essential to maintaining healthy ecosystems. We recognise our responsibility to effectively manage emerging and current risks that have the potential to impact waters, biodiversity, coastline and communities associated with our offshore and onshore operations. This approach is paramount to good environmental and social practices. Our Burrup facilities (Karratha Gas Plant, Pluto LNG and King Bay Supply Facility) prepare and submit Water Efficiency Management Plans (WEMPs) to the Western Australian Water Corporation each year. The annual WEMPs report includes total water use, along with efficiency, by comparing to total business production for the gas plants and total bunkered water from King Bay Supply Base (KBSB) to supply offshore facilities. Water efficiency actions are set at five year intervals and reported against each year. These include items such as periodic inspections of water related infrastructure, as well as ongoing identification, maintenance and repair of leaks. The next five year review is planned for 2023. Produced water discharge is a planned activity with one of the higher environmental risks arising from Woodside’s offshore production assets. One of the challenges of understanding and managing produced water impacts is the potential for increased environmental impact from changes over time in fluid characteristics such as volume, chemical composition or process chemicals used. To allow us to better understand and appropriately manage produced water discharges, Woodside has developed a risk based, adaptive management framework that re-assesses changing conditions. Real time and novel monitoring of key indicators are utilised as part of ongoing compliance verification, and triggers an adaptive response. The adaptive framework manages produced water discharges across a range of producing facilities, with varied chemical composition and treatment technologies, through a simple and consistent approach. Our international operations assets are also required to meet strict regulatory permit conditions for produced water. Due to this requirement, we closely monitor volume and quality of water discharged via our environmental tracking system, thereby giving visibility to the business on our monitoring and reporting activities. This informs and helps the business take proactive measures to mitigate any potential parameters that may exceed its discharge criteria. CASE STUDY: WATER MANAGEMENT IN TRINIDAD AND TOBAGO Produced water from settling of the oil storage tanks at the terminal facility cannot be discharged to Guayaguayare Bay unless it meets the targets set in the Water Pollution Rules. Chemical oxygen demand (COD) has been the single most challenging water quality standard to achieve in order to meet the acceptable discharge criteria of 250 mg/L. COD is a measure of the amount of oxygen that can be consumed by reactants in the discharge and is used as an indication of the effect on the receiving environment. There has been an accumulation of approximately 86,000 bbls of produced water in the oil storage tanks over the years. In an effort to meet the discharge criteria, a pilot ozone skid was installed at the terminal in July 2020 to trial the technology. Ozone aeration reduces the COD concentration by rapidly replacing oxygen in the produced water, which would be used up by organic and inorganic compounds present in the solution. The installation of the ozone skid not only has been successful in meeting discharge criteria for the produced water, but also achieving this within shorter timeframes, which has provided operational flexibility. We continue to seek improvements in our environmental performance and will look to test treatment times and volumes of the pilot ozone skid in 2023. The outcome of this test plan will determine the size and retention times required to treat the produced water at the central processing offshore platform on a continuous basis for COD. 44 | Sustainable Development Report 2022
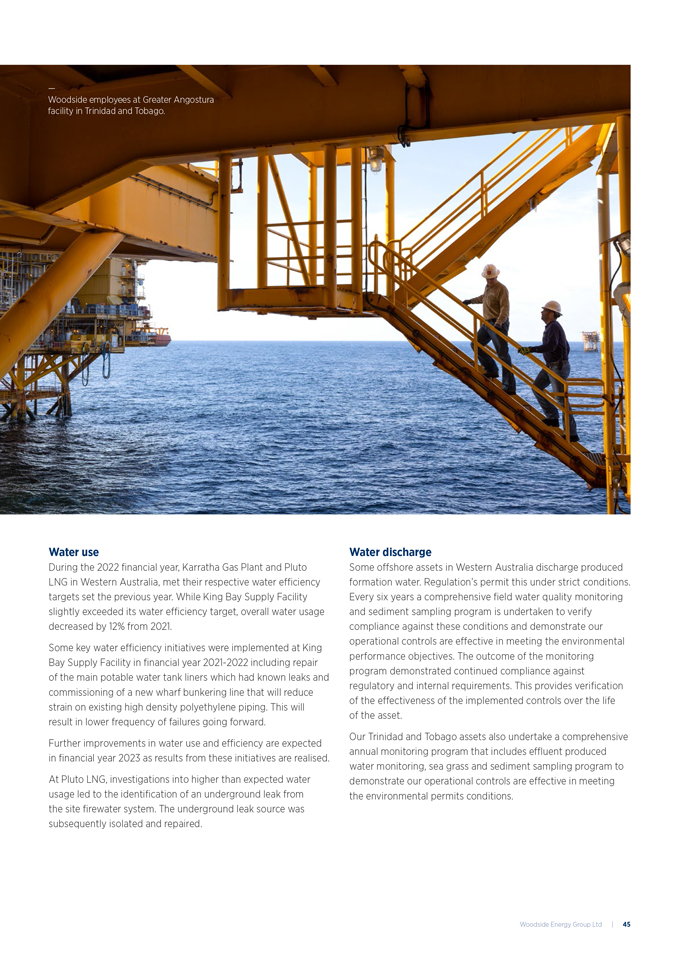
Water use During the 2022 financial year, Karratha Gas Plant and Pluto LNG in Western Australia, met their respective water efficiency targets set the previous year. While King Bay Supply Facility slightly exceeded its water efficiency target, overall water usage decreased by 12% from 2021. Some key water efficiency initiatives were implemented at King Bay Supply Facility in financial year 2021-2022 including repair of the main potable water tank liners which had known leaks and commissioning of a new wharf bunkering line that will reduce strain on existing high density polyethylene piping. This will result in lower frequency of failures going forward. Further improvements in water use and efficiency are expected in financial year 2023 as results from these initiatives are realised. At Pluto LNG, investigations into higher than expected water usage led to the identification of an underground leak from the site firewater system. The underground leak source was subsequently isolated and repaired. Water discharge Some offshore assets in Western Australia discharge produced formation water. Regulation’s permit this under strict conditions. Every six years a comprehensive field water quality monitoring and sediment sampling program is undertaken to verify compliance against these conditions and demonstrate our operational controls are effective in meeting the environmental performance objectives. The outcome of the monitoring program demonstrated continued compliance against regulatory and internal requirements. This provides verification of the effectiveness of the implemented controls over the life of the asset. Our Trinidad and Tobago assets also undertake a comprehensive annual monitoring program that includes effluent produced water monitoring, sea grass and sediment sampling program to demonstrate our operational controls are effective in meeting the environmental permits conditions. — Woodside employees at Greater Angostura facility in Trinidad and Tobago. Woodside Energy Group Ltd | 45
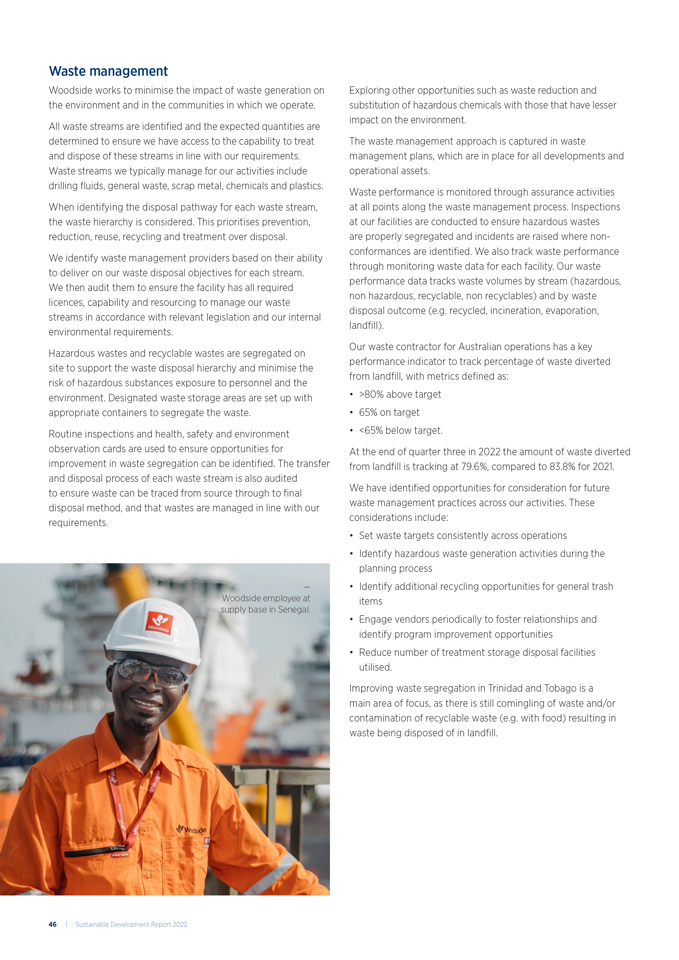
Waste management Woodside works to minimise the impact of waste generation on the environment and in the communities in which we operate. All waste streams are identified and the expected quantities are determined to ensure we have access to the capability to treat and dispose of these streams in line with our requirements. Waste streams we typically manage for our activities include drilling fluids, general waste, scrap metal, chemicals and plastics. When identifying the disposal pathway for each waste stream, the waste hierarchy is considered. This prioritises prevention, reduction, reuse, recycling and treatment over disposal. We identify waste management providers based on their ability to deliver on our waste disposal objectives for each stream. We then audit them to ensure the facility has all required licences, capability and resourcing to manage our waste streams in accordance with relevant legislation and our internal environmental requirements. Hazardous wastes and recyclable wastes are segregated on site to support the waste disposal hierarchy and minimise the risk of hazardous substances exposure to personnel and the environment. Designated waste storage areas are set up with appropriate containers to segregate the waste. Routine inspections and health, safety and environment observation cards are used to ensure opportunities for improvement in waste segregation can be identified. The transfer and disposal process of each waste stream is also audited to ensure waste can be traced from source through to final disposal method, and that wastes are managed in line with our requirements. Exploring other opportunities such as waste reduction and substitution of hazardous chemicals with those that have lesser impact on the environment. The waste management approach is captured in waste management plans, which are in place for all developments and operational assets. Waste performance is monitored through assurance activities at all points along the waste management process. Inspections at our facilities are conducted to ensure hazardous wastes are properly segregated and incidents are raised where nonconformances are identified. We also track waste performance through monitoring waste data for each facility. Our waste performance data tracks waste volumes by stream (hazardous, non hazardous, recyclable, non recyclables) and by waste disposal outcome (e.g. recycled, incineration, evaporation, landfill). Our waste contractor for Australian operations has a key performance indicator to track percentage of waste diverted from landfill, with metrics defined as: • >80% above target • 65% on target • <65% below target. At the end of quarter three in 2022 the amount of waste diverted from landfill is tracking at 79.6%, compared to 83.8% for 2021. We have identified opportunities for consideration for future waste management practices across our activities. These considerations include: • Set waste targets consistently across operations • Identify hazardous waste generation activities during the planning process • Identify additional recycling opportunities for general trash items • Engage vendors periodically to foster relationships and identify program improvement opportunities • Reduce number of treatment storage disposal facilities utilised. Improving waste segregation in Trinidad and Tobago is a main area of focus, as there is still comingling of waste and/or contamination of recyclable waste (e.g. with food) resulting in waste being disposed of in landfill. — Woodside employee at supply base in Senegal. 46 | Sustainable Development Report 2022
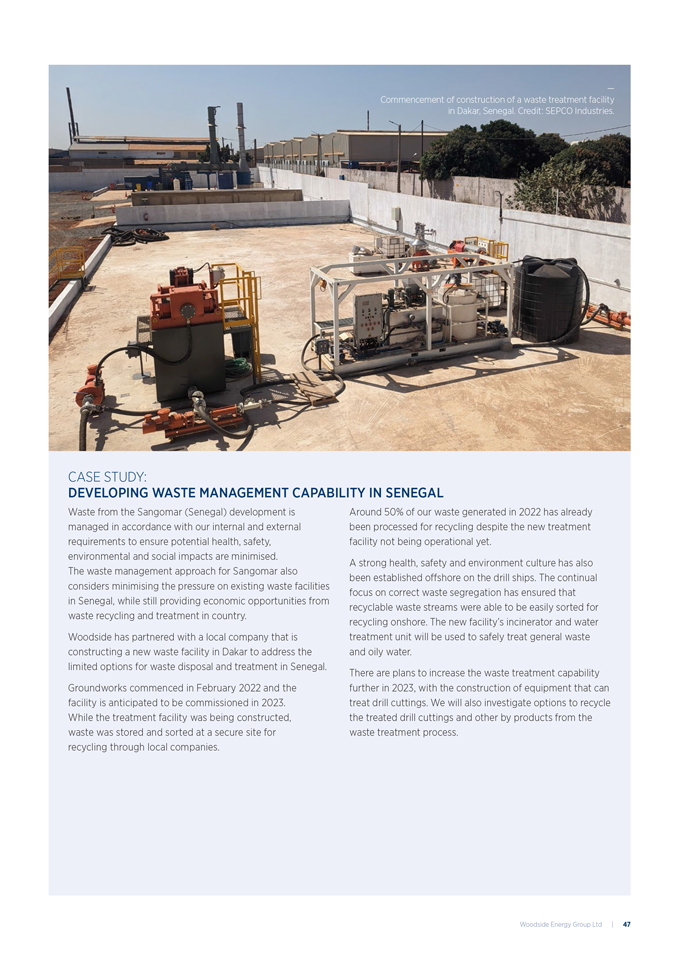
CASE STUDY: DEVELOPING WASTE MANAGEMENT CAPABILITY IN SENEGAL Waste from the Sangomar (Senegal) development is managed in accordance with our internal and external requirements to ensure potential health, safety, environmental and social impacts are minimised. The waste management approach for Sangomar also considers minimising the pressure on existing waste facilities in Senegal, while still providing economic opportunities from waste recycling and treatment in country. Woodside has partnered with a local company that is constructing a new waste facility in Dakar to address the limited options for waste disposal and treatment in Senegal. Groundworks commenced in February 2022 and the facility is anticipated to be commissioned in 2023. While the treatment facility was being constructed, waste was stored and sorted at a secure site for recycling through local companies. Around 50% of our waste generated in 2022 has already been processed for recycling despite the new treatment facility not being operational yet. A strong health, safety and environment culture has also been established offshore on the drill ships. The continual focus on correct waste segregation has ensured that recyclable waste streams were able to be easily sorted for recycling onshore. The new facility’s incinerator and water treatment unit will be used to safely treat general waste and oily water. There are plans to increase the waste treatment capability further in 2023, with the construction of equipment that can treat drill cuttings. We will also investigate options to recycle the treated drill cuttings and other by products from the waste treatment process. — Commencement of construction of a waste treatment facility in Dakar, Senegal. Credit: SEPCO Industries. Woodside Energy Group Ltd | 47
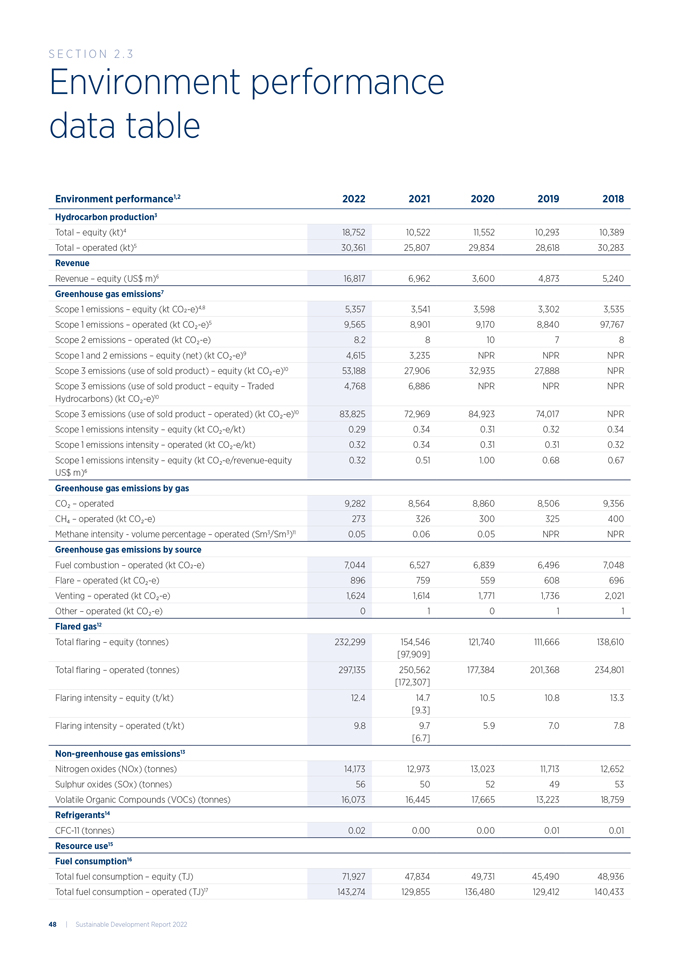
Environment performance data table Section 2 . 3 Environment performance1,2 2022 2021 2020 2019 2018 Hydrocarbon production3 Total – equity (kt)4 18,752 10,522 11,552 10,293 10,389 Total – operated (kt)5 30,361 25,807 29,834 28,618 30,283 Revenue Revenue – equity (US$ m)6 16,817 6,962 3,600 4,873 5,240 Greenhouse gas emissions7 Scope 1 emissions – equity (kt CO2-e)4,8 5,357 3,541 3,598 3,302 3,535 Scope 1 emissions – operated (kt COâ,,-e)5 9,565 8,901 9,170 8,840 97,767 Scope 2 emissions – operated (kt COâ,,-e) 8.2 8 10 7 8 Scope 1 and 2 emissions – equity (net) (kt COâ,,-e)9 4,615 3,235 NPR NPR NPR Scope 3 emissions (use of sold product) – equity (kt COâ,,-e)10 53,188 27,906 32,935 27,888 NPR Scope 3 emissions (use of sold product – equity – Traded Hydrocarbons) (kt COâ,,-e)10 4,768 6,886 NPR NPR NPR Scope 3 emissions (use of sold product – operated) (kt COâ,,-e)10 83,825 72,969 84,923 74,017 NPR Scope 1 emissions intensity – equity (kt COâ,,-e/kt) 0.29 0.34 0.31 0.32 0.34 Scope 1 emissions intensity – operated (kt COâ,,-e/kt) 0.32 0.34 0.31 0.31 0.32 Scope 1 emissions intensity – equity (kt COâ,,-e/revenue-equity US$ m)6 0.32 0.51 1.00 0.68 0.67 Greenhouse gas emissions by gas COâ,, – operated 9,282 8,564 8,860 8,506 9,356 CHâ,„ – operated (kt COâ,,-e) 273 326 300 325 400 Methane intensity—volume percentage – operated (Sm3/Sm3)11 0.05 0.06 0.05 NPR NPR Greenhouse gas emissions by source Fuel combustion – operated (kt CO2-e) 7,044 6,527 6,839 6,496 7,048 Flare – operated (kt COâ,,-e) 896 759 559 608 696 Venting – operated (kt COâ,,-e) 1,624 1,614 1,771 1,736 2,021 Other – operated (kt COâ,,-e) 0 1 0 1 1 Flared gas12 Total flaring – equity (tonnes) 232,299 154,546 [97,909] 121,740 111,666 138,610 Total flaring – operated (tonnes) 297,135 250,562 [172,307] 177,384 201,368 234,801 Flaring intensity – equity (t/kt) 12.4 14.7 [9.3] 10.5 10.8 13.3 Flaring intensity – operated (t/kt) 9.8 9.7 [6.7] 5.9 7.0 7.8 Non-greenhouse gas emissions13 Nitrogen oxides (NOx) (tonnes) 14,173 12,973 13,023 11,713 12,652 Sulphur oxides (SOx) (tonnes) 56 50 52 49 53 Volatile Organic Compounds (VOCs) (tonnes) 16,073 16,445 17,665 13,223 18,759 Refrigerants14 CFC-11 (tonnes) 0.02 0.00 0.00 0.01 0.01 Resource use15 Fuel consumption16 Total fuel consumption – equity (TJ) 71,927 47,834 49,731 45,490 48,936 Total fuel consumption – operated (TJ)17 143,274 129,855 136,480 129,412 140,433 48 | Sustainable Development Report 2022
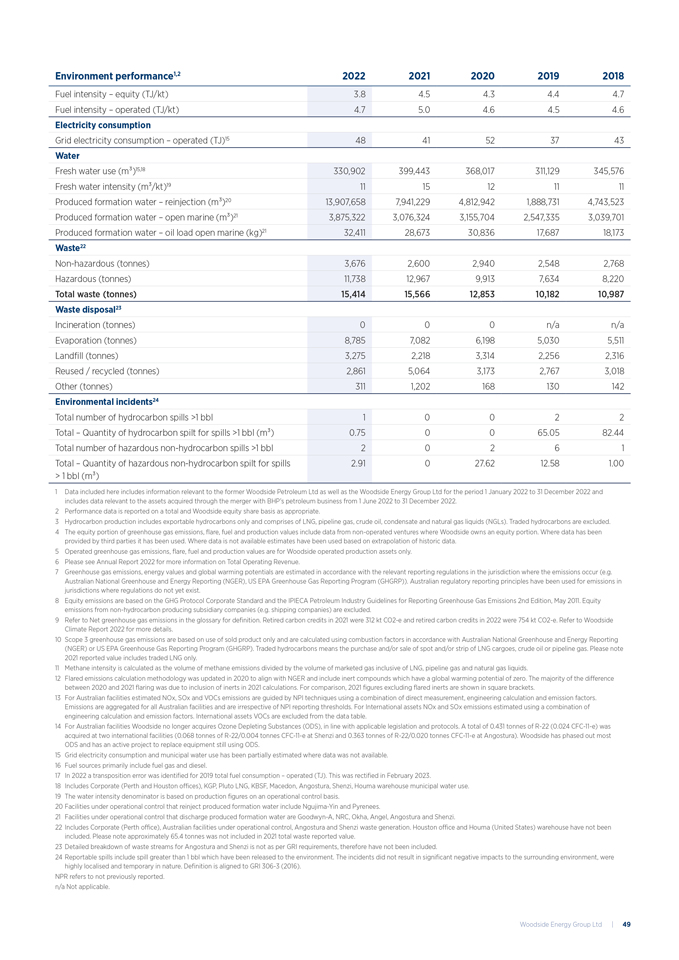
Environment performance1,2 2022 2021 2020 2019 2018 Fuel intensity – equity (TJ/kt) 3.8 4.5 4.3 4.4 4.7 Fuel intensity – operated (TJ/kt) 4.7 5.0 4.6 4.5 4.6 Electricity consumption Grid electricity consumption – operated (TJ)15 48 41 52 37 43 Water Fresh water use (m3)15,18 330,902 399,443 368,017 311,129 345,576 Fresh water intensity (m3/kt)19 11 15 12 11 11 Produced formation water – reinjection (m3)20 13,907,658 7,941,229 4,812,942 1,888,731 4,743,523 Produced formation water – open marine (m3)21 3,875,322 3,076,324 3,155,704 2,547,335 3,039,701 Produced formation water – oil load open marine (kg)21 32,411 28,673 30,836 17,687 18,173 Waste22 Non-hazardous (tonnes) 3,676 2,600 2,940 2,548 2,768 Hazardous (tonnes) 11,738 12,967 9,913 7,634 8,220 Total waste (tonnes) 15,414 15,566 12,853 10,182 10,987 Waste disposal23 Incineration (tonnes) 0 0 0 n/a n/a Evaporation (tonnes) 8,785 7,082 6,198 5,030 5,511 Landfill (tonnes) 3,275 2,218 3,314 2,256 2,316 Reused / recycled (tonnes) 2,861 5,064 3,173 2,767 3,018 Other (tonnes) 311 1,202 168 130 142 Environmental incidents24 Total number of hydrocarbon spills >1 bbl 1 0 0 2 2 Total – Quantity of hydrocarbon spilt for spills >1 bbl (m3) 0.75 0 0 65.05 82.44 Total number of hazardous non-hydrocarbon spills >1 bbl 2 0 2 6 1 Total – Quantity of hazardous non-hydrocarbon spilt for spills > 1 bbl (m3) 2.91 0 27.62 12.58 1.00 1 Data included here includes information relevant to the former Woodside Petroleum Ltd as well as the Woodside Energy Group Ltd for the period 1 January 2022 to 31 December 2022 and includes data relevant to the assets acquired through the merger with BHP’s petroleum business from 1 June 2022 to 31 December 2022. 2 Performance data is reported on a total and Woodside equity share basis as appropriate. 3 Hydrocarbon production includes exportable hydrocarbons only and comprises of LNG, pipeline gas, crude oil, condensate and natural gas liquids (NGLs). Traded hydrocarbons are excluded. 4 The equity portion of greenhouse gas emissions, flare, fuel and production values include data from non-operated ventures where Woodside owns an equity portion. Where data has been provided by third parties it has been used. Where data is not available estimates have been used based on extrapolation of historic data. 5 Operated greenhouse gas emissions, flare, fuel and production values are for Woodside operated production assets only. 6 Please see Annual Report 2022 for more information on Total Operating Revenue. 7 Greenhouse gas emissions, energy values and global warming potentials are estimated in accordance with the relevant reporting regulations in the jurisdiction where the emissions occur (e.g. Australian National Greenhouse and Energy Reporting (NGER), US EPA Greenhouse Gas Reporting Program (GHGRP)). Australian regulatory reporting principles have been used for emissions in jurisdictions where regulations do not yet exist. 8 Equity emissions are based on the GHG Protocol Corporate Standard and the IPIECA Petroleum Industry Guidelines for Reporting Greenhouse Gas Emissions 2nd Edition, May 2011. Equity emissions from non-hydrocarbon producing subsidiary companies (e.g. shipping companies) are excluded. 9 Refer to Net greenhouse gas emissions in the glossary for definition. Retired carbon credits in 2021 were 312 kt CO2-e and retired carbon credits in 2022 were 754 kt CO2-e. Refer to Woodside Climate Report 2022 for more details. 10 Scope 3 greenhouse gas emissions are based on use of sold product only and are calculated using combustion factors in accordance with Australian National Greenhouse and Energy Reporting (NGER) or US EPA Greenhouse Gas Reporting Program (GHGRP). Traded hydrocarbons means the purchase and/or sale of spot and/or strip of LNG cargoes, crude oil or pipeline gas. Please note 2021 reported value includes traded LNG only. 11 Methane intensity is calculated as the volume of methane emissions divided by the volume of marketed gas inclusive of LNG, pipeline gas and natural gas liquids. 12 Flared emissions calculation methodology was updated in 2020 to align with NGER and include inert compounds which have a global warming potential of zero. The majority of the difference between 2020 and 2021 flaring was due to inclusion of inerts in 2021 calculations. For comparison, 2021 figures excluding flared inerts are shown in square brackets. 13 For Australian facilities estimated NOx, SOx and VOCs emissions are guided by NPI techniques using a combination of direct measurement, engineering calculation and emission factors. Emissions are aggregated for all Australian facilities and are irrespective of NPI reporting thresholds. For International assets NOx and SOx emissions estimated using a combination of engineering calculation and emission factors. International assets VOCs are excluded from the data table. 14 For Australian facilities Woodside no longer acquires Ozone Depleting Substances (ODS), in line with applicable legislation and protocols. A total of 0.431 tonnes of R-22 (0.024 CFC-11-e) was acquired at two international facilities (0.068 tonnes of R-22/0.004 tonnes CFC-11-e at Shenzi and 0.363 tonnes of R-22/0.020 tonnes CFC-11-e at Angostura). Woodside has phased out most ODS and has an active project to replace equipment still using ODS. 15 Grid electricity consumption and municipal water use has been partially estimated where data was not available. 16 Fuel sources primarily include fuel gas and diesel. 17 In 2022 a transposition error was identified for 2019 total fuel consumption – operated (TJ). This was rectified in February 2023. 18 Includes Corporate (Perth and Houston offices), KGP, Pluto LNG, KBSF, Macedon, Angostura, Shenzi, Houma warehouse municipal water use. 19 The water intensity denominator is based on production figures on an operational control basis. 20 Facilities under operational control that reinject produced formation water include Ngujima-Yin and Pyrenees. 21 Facilities under operational control that discharge produced formation water are Goodwyn-A, NRC, Okha, Angel, Angostura and Shenzi. 22 Includes Corporate (Perth office), Australian facilities under operational control, Angostura and Shenzi waste generation. Houston office and Houma (United States) warehouse have not been included. Please note approximately 65.4 tonnes was not included in 2021 total waste reported value. 23 Detailed breakdown of waste streams for Angostura and Shenzi is not as per GRI requirements, therefore have not been included. 24 Reportable spills include spill greater than 1 bbl which have been released to the environment. The incidents did not result in significant negative impacts to the surrounding environment, were highly localised and temporary in nature. Definition is aligned to GRI 306-3 (2016). NPR refers to not previously reported. n/a Not applicable. Woodside Energy Group Ltd | 49
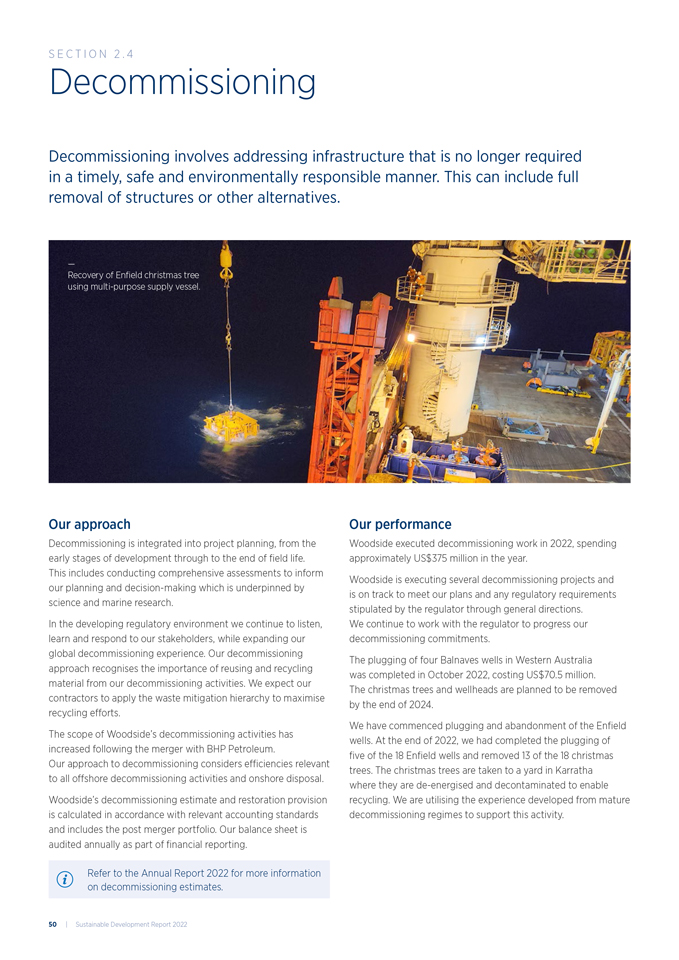
Decommissioning Decommissioning involves addressing infrastructure that is no longer required in a timely, safe and environmentally responsible manner. This can include full removal of structures or other alternatives. Our approach Decommissioning is integrated into project planning, from the early stages of development through to the end of field life. This includes conducting comprehensive assessments to inform our planning and decision-making which is underpinned by science and marine research. In the developing regulatory environment we continue to listen, learn and respond to our stakeholders, while expanding our global decommissioning experience. Our decommissioning approach recognises the importance of reusing and recycling material from our decommissioning activities. We expect our contractors to apply the waste mitigation hierarchy to maximise recycling efforts. The scope of Woodside’s decommissioning activities has increased following the merger with BHP Petroleum. Our approach to decommissioning considers efficiencies relevant to all offshore decommissioning activities and onshore disposal. Woodside’s decommissioning estimate and restoration provision is calculated in accordance with relevant accounting standards and includes the post merger portfolio. Our balance sheet is audited annually as part of financial reporting. Refer to the Annual Report 2022 for more information on decommissioning estimates. Our performance Woodside executed decommissioning work in 2022, spending approximately US$375 million in the year. Woodside is executing several decommissioning projects and is on track to meet our plans and any regulatory requirements stipulated by the regulator through general directions. We continue to work with the regulator to progress our decommissioning commitments. The plugging of four Balnaves wells in Western Australia was completed in October 2022, costing US$70.5 million. The christmas trees and wellheads are planned to be removed by the end of 2024. We have commenced plugging and abandonment of the Enfield wells. At the end of 2022, we had completed the plugging of five of the 18 Enfield wells and removed 13 of the 18 christmas trees. The christmas trees are taken to a yard in Karratha where they are de-energised and decontaminated to enable recycling. We are utilising the experience developed from mature decommissioning regimes to support this activity. — Recovery of Enfield christmas tree using multi-purpose supply vessel. S ection 2 .4 50 | Sustainable Development Report 2022
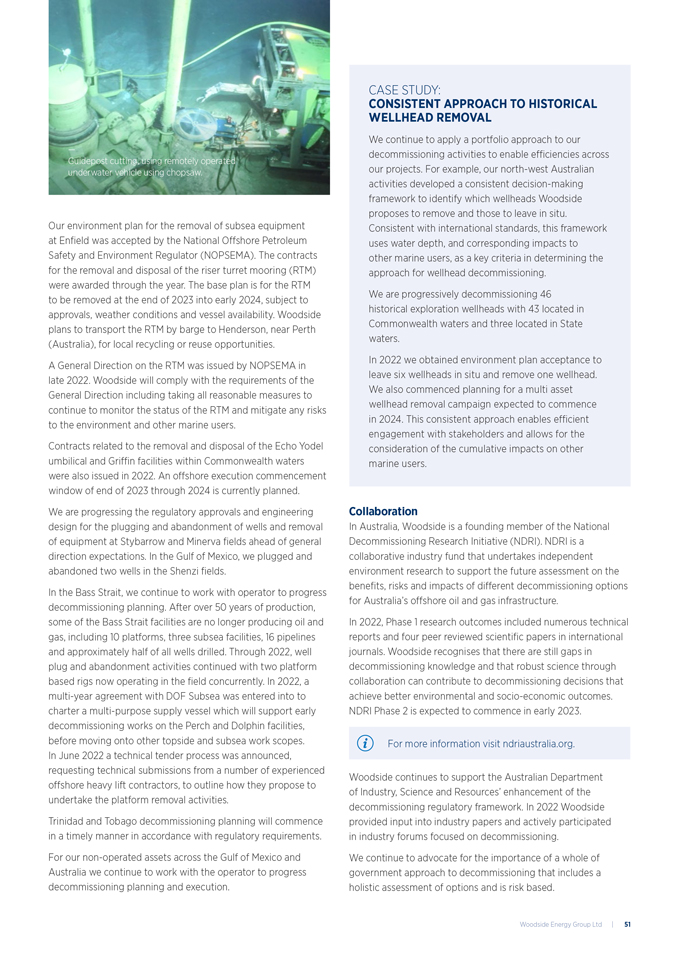
Our environment plan for the removal of subsea equipment at Enfield was accepted by the National Offshore Petroleum Safety and Environment Regulator (NOPSEMA). The contracts for the removal and disposal of the riser turret mooring (RTM) were awarded through the year. The base plan is for the RTM to be removed at the end of 2023 into early 2024, subject to approvals, weather conditions and vessel availability. Woodside plans to transport the RTM by barge to Henderson, near Perth (Australia), for local recycling or reuse opportunities. A General Direction on the RTM was issued by NOPSEMA in late 2022. Woodside will comply with the requirements of the General Direction including taking all reasonable measures to continue to monitor the status of the RTM and mitigate any risks to the environment and other marine users. Contracts related to the removal and disposal of the Echo Yodel umbilical and Griffin facilities within Commonwealth waters were also issued in 2022. An offshore execution commencement window of end of 2023 through 2024 is currently planned. We are progressing the regulatory approvals and engineering design for the plugging and abandonment of wells and removal of equipment at Stybarrow and Minerva fields ahead of general direction expectations. In the Gulf of Mexico, we plugged and abandoned two wells in the Shenzi fields. In the Bass Strait, we continue to work with operator to progress decommissioning planning. After over 50 years of production, some of the Bass Strait facilities are no longer producing oil and gas, including 10 platforms, three subsea facilities, 16 pipelines and approximately half of all wells drilled. Through 2022, well plug and abandonment activities continued with two platform based rigs now operating in the field concurrently. In 2022, a multi-year agreement with DOF Subsea was entered into to charter a multi-purpose supply vessel which will support early decommissioning works on the Perch and Dolphin facilities, before moving onto other topside and subsea work scopes. In June 2022 a technical tender process was announced, requesting technical submissions from a number of experienced offshore heavy lift contractors, to outline how they propose to undertake the platform removal activities. Trinidad and Tobago decommissioning planning will commence in a timely manner in accordance with regulatory requirements. For our non-operated assets across the Gulf of Mexico and Australia we continue to work with the operator to progress decommissioning planning and execution. Collaboration In Australia, Woodside is a founding member of the National Decommissioning Research Initiative (NDRI). NDRI is a collaborative industry fund that undertakes independent environment research to support the future assessment on the benefits, risks and impacts of different decommissioning options for Australia’s offshore oil and gas infrastructure. In 2022, Phase 1 research outcomes included numerous technical reports and four peer reviewed scientific papers in international journals. Woodside recognises that there are still gaps in decommissioning knowledge and that robust science through collaboration can contribute to decommissioning decisions that achieve better environmental and socio-economic outcomes. NDRI Phase 2 is expected to commence in early 2023. For more information visit ndriaustralia.org. Woodside continues to support the Australian Department of Industry, Science and Resources’ enhancement of the decommissioning regulatory framework. In 2022 Woodside provided input into industry papers and actively participated in industry forums focused on decommissioning. We continue to advocate for the importance of a whole of government approach to decommissioning that includes a holistic assessment of options and is risk based. CASE STUDY: CONSISTENT APPROACH TO HISTORICAL WELLHEAD REMOVAL We continue to apply a portfolio approach to our decommissioning activities to enable efficiencies across our projects. For example, our north-west Australian activities developed a consistent decision-making framework to identify which wellheads Woodside proposes to remove and those to leave in situ. Consistent with international standards, this framework uses water depth, and corresponding impacts to other marine users, as a key criteria in determining the approach for wellhead decommissioning. We are progressively decommissioning 46 historical exploration wellheads with 43 located in Commonwealth waters and three located in State waters. In 2022 we obtained environment plan acceptance to leave six wellheads in situ and remove one wellhead. We also commenced planning for a multi asset wellhead removal campaign expected to commence in 2024. This consistent approach enables efficient engagement with stakeholders and allows for the consideration of the cumulative impacts on other marine users. — Guidepost cutting, using remotely operated underwater vehicle using chopsaw. Woodside Energy Group Ltd | 51
— Woodside employee at Mia Yellagonga. S ection 3 : S O C I A L 52 | Sustainable Development Report 2022
First Nations cultural heritage and engagement We partner with First Nations communities to create positive outcomes that leave a lasting legacy. 2022 HIGHLIGHTS » Successful negotiations with Ngarluma Aboriginal Corporation of an Indigenous Land Use Agreement for the Woodside Solar project » Approval of the Cultural Heritage Management Plan for the Scarborough project » Cultivation of new relationships in New Zealand with the Ngāi Tahu iwi resulting in support for Woodside selection as preferred partner for the Southern Green Hydrogen Project » Further work to assess submerged heritage at Murujuga and manage impacts in a rapidly emerging field of study » Inaugural Indigenous Advisory Group Roundtable discussion held on 21 November 2022 » Updated First Nations Communities Policy OPPORTUNITIES » Advocate for A Voice to Parliament » Consistent progress towards achieving Reconciliation Action Plan targets » Progressing our coexistence with National Heritage and continuing to support the World Heritage listing nomination POTENTIAL RISKS1 » Impacts to Murujuga Rock Art and coexistence » Meeting local content target outcomes for First Nations communities Our approach We acknowledge the unique connection that First Nations communities have to land, waters and the environment. We believe First Nations cultural heritage and industry can successfully coexist. We seek to ensure Traditional Owners and Custodians are central to heritage management so that cultural values are understood and remain protected. We understand the importance of identifying and working with those who have longstanding cultural and spiritual connections to land and waters where we have a presence and we are guided by them in our efforts to avoid or minimise potential impact of our operations on those First Nations communities. Our First Nations Communities Policy (formerly Indigenous Communities Policy) defines this approach and is regularly reviewed and updated as required. Woodside employees, contractors and joint venture partners engaged in activities under Woodside operational control, are collectively responsible for the application of the policy and are provided with training to ensure they are able to do so. The Policy notes that Woodside is to be guided by the United Nations Declaration on the Rights of Indigenous Peoples which demonstrates our commitment to understanding the relevant human rights considerations as we engage with different First Nations communities. In Australia, we maintain relationships with First Nations communities in the Pilbara, Kimberley, South West and Perth. Our approach has been extended to the diverse range of environments we are operating in as a global company, which include the United States, Mexico, Trinidad and Tobago, and New Zealand. We continue to learn from the First Nations communities within those regions and are committed to working alongside these communities. Refer to our website for our First Nations Communities Policy and Human Rights Policy. 1 Potential risk means an environmental, social or governance related-risk, that if it occurs over the next 12 months, could cause an actual or a perceived negative impact on the business or on our activities. S ection 3 . 1 Woodside Energy Group Ltd | 53
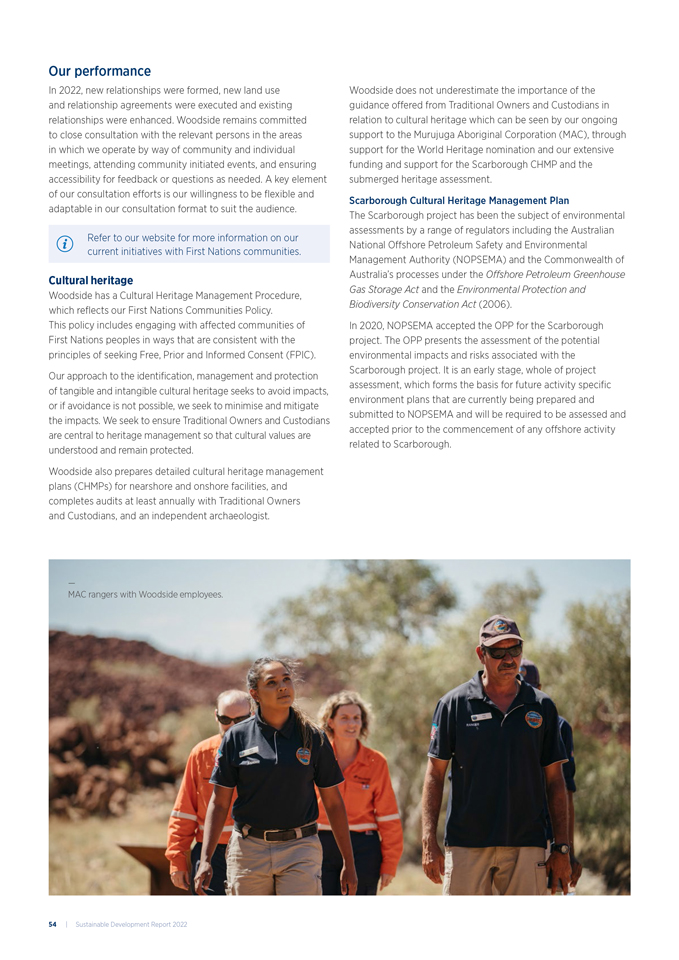
Our performance In 2022, new relationships were formed, new land use and relationship agreements were executed and existing relationships were enhanced. Woodside remains committed to close consultation with the relevant persons in the areas in which we operate by way of community and individual meetings, attending community initiated events, and ensuring accessibility for feedback or questions as needed. A key element of our consultation efforts is our willingness to be flexible and adaptable in our consultation format to suit the audience. Refer to our website for more information on our current initiatives with First Nations communities. Cultural heritage Woodside has a Cultural Heritage Management Procedure, which reflects our First Nations Communities Policy. This policy includes engaging with affected communities of First Nations peoples in ways that are consistent with the principles of seeking Free, Prior and Informed Consent (FPIC). Our approach to the identification, management and protection of tangible and intangible cultural heritage seeks to avoid impacts, or if avoidance is not possible, we seek to minimise and mitigate the impacts. We seek to ensure Traditional Owners and Custodians are central to heritage management so that cultural values are understood and remain protected. Woodside also prepares detailed cultural heritage management plans (CHMPs) for nearshore and onshore facilities, and completes audits at least annually with Traditional Owners and Custodians, and an independent archaeologist. Woodside does not underestimate the importance of the guidance offered from Traditional Owners and Custodians in relation to cultural heritage which can be seen by our ongoing support to the Murujuga Aboriginal Corporation (MAC), through support for the World Heritage nomination and our extensive funding and support for the Scarborough CHMP and the submerged heritage assessment. Scarborough Cultural Heritage Management Plan The Scarborough project has been the subject of environmental assessments by a range of regulators including the Australian National Offshore Petroleum Safety and Environmental Management Authority (NOPSEMA) and the Commonwealth of Australia’s processes under the Offshore Petroleum Greenhouse Gas Storage Act and the Environmental Protection and Biodiversity Conservation Act (2006). In 2020, NOPSEMA accepted the OPP for the Scarborough project. The OPP presents the assessment of the potential environmental impacts and risks associated with the Scarborough project. It is an early stage, whole of project assessment, which forms the basis for future activity specific environment plans that are currently being prepared and submitted to NOPSEMA and will be required to be assessed and accepted prior to the commencement of any offshore activity related to Scarborough. — MAC rangers with Woodside employees. 54 | Sustainable Development Report 2022
Consultation with stakeholders such as MAC commenced in 2018. A broad range of consultation activities were undertaken as part of this process. This included external communication including on our website, factsheets, direct emails to stakeholders and other communication tools such as advertising in local, state and national newspapers. We held community forums and group meetings with a broad range of stakeholders including First Nations stakeholders. We also held one-onone meetings between environment, stakeholder and project management representatives. One of the requests made by MAC during consultations was the addition of a mechanism in the CHMP to address any new ethnographic values identified through further heritage assessments. Woodside worked with MAC to establish a Heritage Management Committee (HMC) whose role would be to consider the necessary mitigation measures required to address any new heritage information arising following certain milestones related to the Scarborough project. The HMC is expected to advise Woodside where any additional mitigation measures are recommended and of any other actions MAC or Woodside should consider. MAC responded to Woodside’s proposal, specifying that membership of the HMC should include: • MAC’s Circle of Elders • MAC’s Board and/or executive • MAC staff • Woodside • Appropriately qualified heritage experts agreed between MAC and Woodside. This year, Woodside in consultation with MAC completed the CHMP for the Scarborough project and provided it to the Department of Water and Environmental Regulation for approval, which was confirmed in January 2023. The CHMP is designed to ensure that impacts to heritage sites and values, including to Murujuga’s National Heritage Listed and World Tentative Heritage Listed values, are adequately protected in a manner agreed between Woodside and Traditional Owners and Custodians represented through MAC. It should ensure that the tangible and intangible heritage values are preserved and that cultural and spiritual values of the Traditional Owners and Custodians are protected. Submerged heritage Woodside has engaged with researchers to investigate the potential for First Nations archaeological material that may remain on the sea floor from a time when sea levels were lower and the land would have been exposed and inhabited. We have proactively sought to understand the potential heritage values of the submerged cultural landscape for the proposed Scarborough pipeline by engaging with MAC. In this process we consulted the same heritage experts who were involved with the groundbreaking discoveries in Murujuga’s waters to conduct an archaeological assessment that is the first of its kind in Australia. This research project concluded the development proposal is likely to have nil to low impact on archaeological heritage. In particular, the Scarborough project will not impact any submerged igneous rock, which could potentially contain undiscovered examples of Murujuga’s internationally significant petroglyphs. For further information regarding research on submerged heritage, please refer to our website. In 2020, Woodside commissioned MAC to undertake a further ethnographic survey with Elders and traditional knowledge holders to identify any intangible or other heritage values associated with the Scarborough project, particularly beyond the shoreline. This work did not identify any heritage sites that would be impacted by the project. At the request of MAC, in 2022 Woodside commissioned a further review of existing side scan sonar geophysical data for stone structures such as traditional fish traps. This work was conducted by an experienced underwater archaeologist and did not identify any archaeological or other cultural features. These assessments have been conducted in consultation with First Nations community members and included detailed consultation with MAC on the development of the CHMP. The assessments have also been informed by the Burra Charter, United Nations Declaration on the Rights of Indigenous Peoples and other national and international guidance. Murujuga—World Heritage nomination extended boundaries In August 2018, the Western Australian Government announced it would work in partnership with MAC towards the World Heritage nomination of Murujuga. The Murujuga Cultural Landscape was added to the World Heritage tentative list in January 2020. The Western Australian Government and MAC are finalising the dossier that supports the nomination. Since 2018, Woodside has supported the nomination, noting that a commitment to and demonstration of coexistence is central to the success of the nomination. In 2021, Woodside was advised that the proposed World Heritage boundary extends beyond the National Heritage boundary that currently exists at Murujuga. The extended boundaries includes islands within the conservation estate, areas of sea country and parts of Woodside leases. Woodside met with a range of stakeholders to understand various perspectives about the revised boundaries. Upon completion of stakeholder consultation, Woodside has continued to support the World Heritage nomination including the new boundaries. Woodside Energy Group Ltd | 55
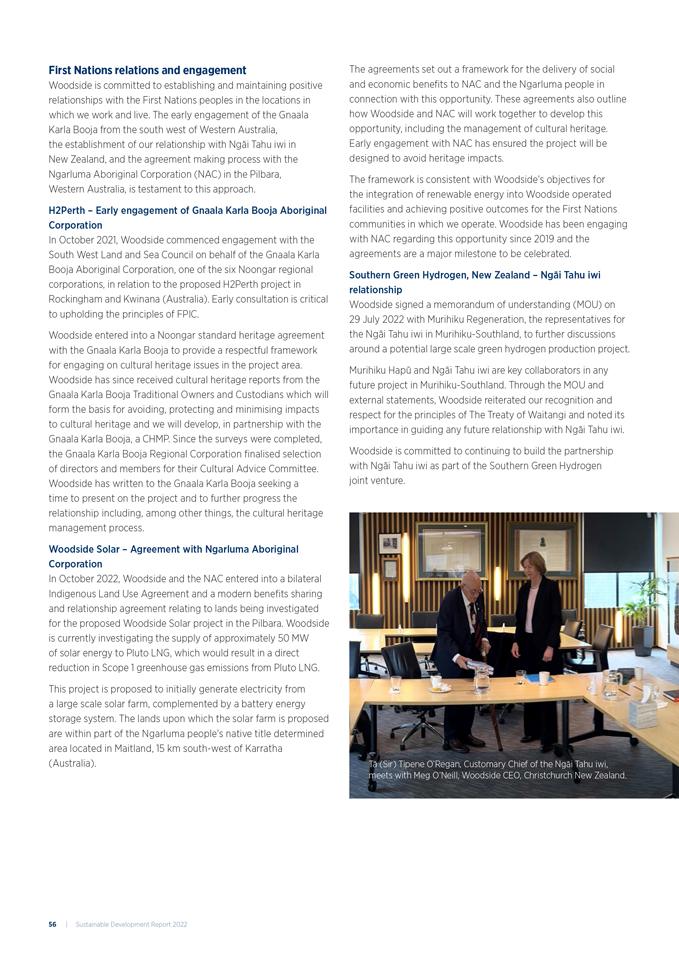
First Nations relations and engagement Woodside is committed to establishing and maintaining positive relationships with the First Nations peoples in the locations in which we work and live. The early engagement of the Gnaala Karla Booja from the south west of Western Australia, the establishment of our relationship with Ngāi Tahu iwi in New Zealand, and the agreement making process with the Ngarluma Aboriginal Corporation (NAC) in the Pilbara, Western Australia, is testament to this approach. H2Perth – Early engagement of Gnaala Karla Booja Aboriginal Corporation In October 2021, Woodside commenced engagement with the South West Land and Sea Council on behalf of the Gnaala Karla Booja Aboriginal Corporation, one of the six Noongar regional corporations, in relation to the proposed H2Perth project in Rockingham and Kwinana (Australia). Early consultation is critical to upholding the principles of FPIC. Woodside entered into a Noongar standard heritage agreement with the Gnaala Karla Booja to provide a respectful framework for engaging on cultural heritage issues in the project area. Woodside has since received cultural heritage reports from the Gnaala Karla Booja Traditional Owners and Custodians which will form the basis for avoiding, protecting and minimising impacts to cultural heritage and we will develop, in partnership with the Gnaala Karla Booja, a CHMP. Since the surveys were completed, the Gnaala Karla Booja Regional Corporation finalised selection of directors and members for their Cultural Advice Committee. Woodside has written to the Gnaala Karla Booja seeking a time to present on the project and to further progress the relationship including, among other things, the cultural heritage management process. Woodside Solar – Agreement with Ngarluma Aboriginal Corporation In October 2022, Woodside and the NAC entered into a bilateral Indigenous Land Use Agreement and a modern benefits sharing and relationship agreement relating to lands being investigated for the proposed Woodside Solar project in the Pilbara. Woodside is currently investigating the supply of approximately 50 MW of solar energy to Pluto LNG, which would result in a direct reduction in Scope 1 greenhouse gas emissions from Pluto LNG. This project is proposed to initially generate electricity from a large scale solar farm, complemented by a battery energy storage system. The lands upon which the solar farm is proposed are within part of the Ngarluma people’s native title determined area located in Maitland, 15 km south-west of Karratha (Australia). The agreements set out a framework for the delivery of social and economic benefits to NAC and the Ngarluma people in connection with this opportunity. These agreements also outline how Woodside and NAC will work together to develop this opportunity, including the management of cultural heritage. Early engagement with NAC has ensured the project will be designed to avoid heritage impacts. The framework is consistent with Woodside’s objectives for the integration of renewable energy into Woodside operated facilities and achieving positive outcomes for the First Nations communities in which we operate. Woodside has been engaging with NAC regarding this opportunity since 2019 and the agreements are a major milestone to be celebrated. Southern Green Hydrogen, New Zealand – Ngāi Tahu iwi relationship Woodside signed a memorandum of understanding (MOU) on 29 July 2022 with Murihiku Regeneration, the representatives for the Ngāi Tahu iwi in Murihiku-Southland, to further discussions around a potential large scale green hydrogen production project. Murihiku Hapū and Ngāi Tahu iwi are key collaborators in any future project in Murihiku-Southland. Through the MOU and external statements, Woodside reiterated our recognition and respect for the principles of The Treaty of Waitangi and noted its importance in guiding any future relationship with Ngāi Tahu iwi. Woodside is committed to continuing to build the partnership with Ngāi Tahu iwi as part of the Southern Green Hydrogen joint venture. — Tā (Sir) Tipene O’Regan, Customary Chief of the Ngāi Tahu iwi, meets with Meg O’Neill, Woodside CEO, Christchurch New Zealand. 56 | Sustainable Development Report 2022
Reconciliation Action Plan 2021-2025 Woodside has been part of Reconciliation Australia’s Reconciliation Action Plan (RAP) program since 2009. Overseen by not-for-profit organisation Reconciliation Australia, RAPs require participants to publicly nominate and report on practical actions they are taking to advance reconciliation. Woodside’s vision for reconciliation is to partner with First Nations communities to create positive economic, social and cultural outcomes. It is also to reflect on our shared history, empower First Nations voices to speak and be heard so all Australians can learn and work together towards a better, shared future. An example of a long-term outcome from our first RAP was the establishment of the Indigenous Collegiate and the Woodside Reconciliation Community (WRC) (previously named the Reconciliation Interest Group). The Indigenous Collegiate is a group of First Nations employees and contractors who work together to offer support and mentorship to each other, and advice and education to the broader Woodside community. Supporting work readiness in the Pilbara community Woodside is committed to increasing First Nations participation through employment, especially for those local to the area of our operations. This commitment is reinforced as a specific target in our RAP and in our Indigenous Land Use Agreements. One of the ways in which we honour this commitment is through our long-standing partnership with the Ngarluma Yindjibarndi Foundation Limited (NYFL) through the North West Shelf Project. NYFL delivers the Warrgamugardi Yirdiyabura program which supports upskilling and empowering members of the community to be ready for work in a diverse range of industries. The program offers participants supported employment, education and training with a host employer for a two year period. In 2022, participation almost doubled with 65 people engaged in the program, and 18 gaining full employment as a result. The WRC is a community of Woodside employees and contractors who have reconciliation at front of mind. The WRC is made up of First Nations and non-First Nations employees. Their activities include coordination of events and training opportunities, awareness raising, and by virtue of a multidisciplined committee, the WRC offers organisation wide insight into our culture of reconciliation internally. Both groups have a role to play on our reconciliation journey. Both were involved in Woodside’s public support of the Uluru Statement from the Heart and are currently working on advocacy in relation to the Indigenous Voice to Parliament. The Woodside RAP Report for 2022 is expected to be finalised in the second quarter of 2023. An example of this was the establishment of the Indigenous Advisory Group. For further information about Woodside’s RAP and commitments, please refer to our website. Inaugural Indigenous Advisory Group roundtable discussion A key commitment of our RAP is the establishment of an Indigenous Advisory Group (IAG). On 21 November 2022 this commitment came to fruition at our inaugural roundtable discussion. The role of the IAG is to provide Woodside with expert knowledge, advice and recommendations on matters affecting First Nations peoples and communities that are of regional, national and international importance. IAG participants are selected based on their expertise relevant to the topics being discussed at each meeting. The IAG will share current knowledge, insights, context and perspectives to work with Woodside to instil confidence, recommend areas for improvement, help inform decision-making processes and strengthen relationships with communities. The IAG held in November 2022 included three non Woodside participants, a highly regarded specialist in native title law and related issues, a published author and devoted campaigner for an Indigenous Voice to Parliament and a distinguished and well known human rights lawyer. The attendees from Woodside included members of the Executive Leadership Team, the Head of First Nations and Communities and representatives from both the WRC and Indigenous Collegiate. The topics covered were FPIC and the Indigenous Voice to Parliament. Going forward Woodside will welcome a diverse range of members to ensure various perspectives are heard and that the individuals are subject matter experts best placed to discuss the topic at hand. We expect to hold roundtable discussions at least twice per year. Woodside Energy Group Ltd | 57
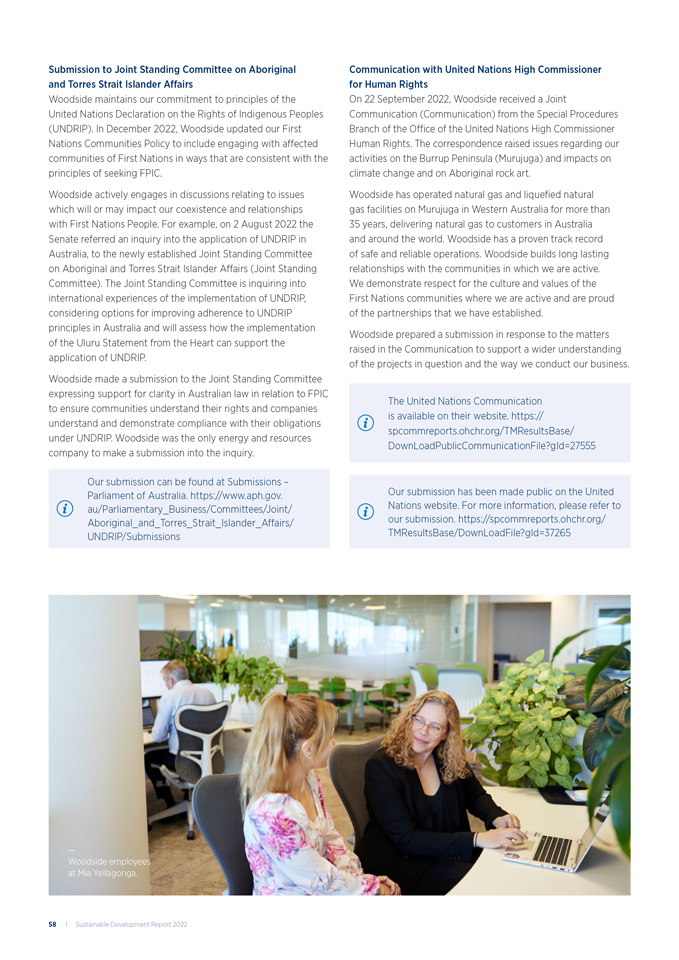
Submission to Joint Standing Committee on Aboriginal and Torres Strait Islander Affairs Woodside maintains our commitment to principles of the United Nations Declaration on the Rights of Indigenous Peoples (UNDRIP). In December 2022, Woodside updated our First Nations Communities Policy to include engaging with affected communities of First Nations in ways that are consistent with the principles of seeking FPIC. Woodside actively engages in discussions relating to issues which will or may impact our coexistence and relationships with First Nations People. For example, on 2 August 2022 the Senate referred an inquiry into the application of UNDRIP in Australia, to the newly established Joint Standing Committee on Aboriginal and Torres Strait Islander Affairs (Joint Standing Committee). The Joint Standing Committee is inquiring into international experiences of the implementation of UNDRIP, considering options for improving adherence to UNDRIP principles in Australia and will assess how the implementation of the Uluru Statement from the Heart can support the application of UNDRIP. Woodside made a submission to the Joint Standing Committee expressing support for clarity in Australian law in relation to FPIC to ensure communities understand their rights and companies understand and demonstrate compliance with their obligations under UNDRIP. Woodside was the only energy and resources company to make a submission into the inquiry. Our submission can be found at Submissions – Parliament of Australia. https://www.aph.gov. au/Parliamentary_Business/Committees/Joint/ Aboriginal_and_Torres_Strait_Islander_Affairs/ UNDRIP/Submissions Communication with United Nations High Commissioner for Human Rights On 22 September 2022, Woodside received a Joint Communication (Communication) from the Special Procedures Branch of the Office of the United Nations High Commissioner Human Rights. The correspondence raised issues regarding our activities on the Burrup Peninsula (Murujuga) and impacts on climate change and on Aboriginal rock art. Woodside has operated natural gas and liquefied natural gas facilities on Murujuga in Western Australia for more than 35 years, delivering natural gas to customers in Australia and around the world. Woodside has a proven track record of safe and reliable operations. Woodside builds long lasting relationships with the communities in which we are active. We demonstrate respect for the culture and values of the First Nations communities where we are active and are proud of the partnerships that we have established. Woodside prepared a submission in response to the matters raised in the Communication to support a wider understanding of the projects in question and the way we conduct our business. The United Nations Communication is available on their website. https:// spcommreports.ohchr.org/TMResultsBase/ DownLoadPublicCommunicationFile?gId=27555 Our submission has been made public on the United Nations website. For more information, please refer to our submission. https://spcommreports.ohchr.org/ TMResultsBase/DownLoadFile?gId=37265 — Woodside employees at Mia Yellagonga. 58 | Sustainable Development Report 2022
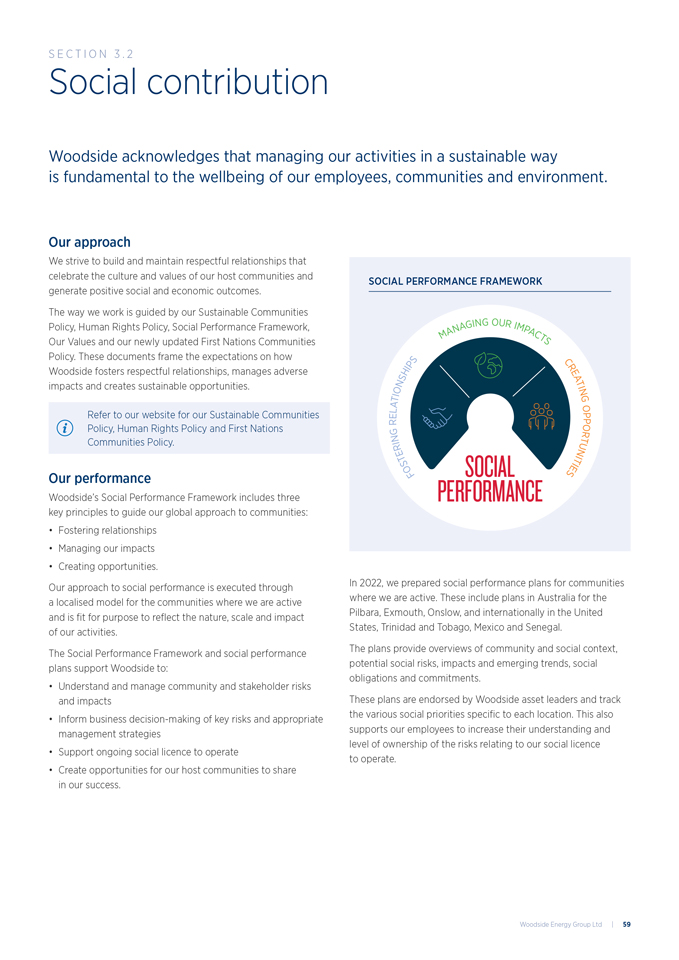
Social contribution Woodside acknowledges that managing our activities in a sustainable way is fundamental to the wellbeing of our employees, communities and environment. Our approach We strive to build and maintain respectful relationships that celebrate the culture and values of our host communities and generate positive social and economic outcomes. The way we work is guided by our Sustainable Communities Policy, Human Rights Policy, Social Performance Framework, Our Values and our newly updated First Nations Communities Policy. These documents frame the expectations on how Woodside fosters respectful relationships, manages adverse impacts and creates sustainable opportunities. Refer to our website for our Sustainable Communities Policy, Human Rights Policy and First Nations Communities Policy. Our performance Woodside’s Social Performance Framework includes three key principles to guide our global approach to communities: • Fostering relationships • Managing our impacts • Creating opportunities. Our approach to social performance is executed through a localised model for the communities where we are active and is fit for purpose to reflect the nature, scale and impact of our activities. The Social Performance Framework and social performance plans support Woodside to: • Understand and manage community and stakeholder risks and impacts • Inform business decision-making of key risks and appropriate management strategies • Support ongoing social licence to operate • Create opportunities for our host communities to share in our success. In 2022, we prepared social performance plans for communities where we are active. These include plans in Australia for the Pilbara, Exmouth, Onslow, and internationally in the United States, Trinidad and Tobago, Mexico and Senegal. The plans provide overviews of community and social context, potential social risks, impacts and emerging trends, social obligations and commitments. These plans are endorsed by Woodside asset leaders and track the various social priorities specific to each location. This also supports our employees to increase their understanding and level of ownership of the risks relating to our social licence to operate. SOCIAL PERFORMANCE FRAMEWORK SOCIAL PERFORMANCE FOSTERING RELATIONSHIPS MANAGING OUR IMPACTS CREATING OPPORTUNITIES S ection 3 . 2 Woodside Energy Group Ltd | 59
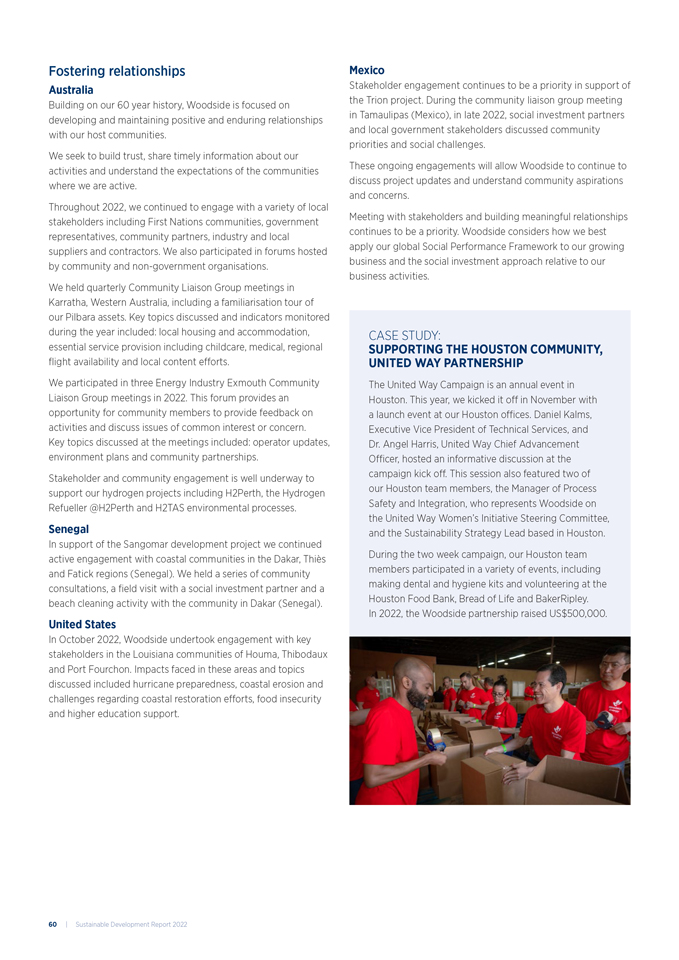
Fostering relationships Australia Building on our 60 year history, Woodside is focused on developing and maintaining positive and enduring relationships with our host communities. We seek to build trust, share timely information about our activities and understand the expectations of the communities where we are active. Throughout 2022, we continued to engage with a variety of local stakeholders including First Nations communities, government representatives, community partners, industry and local suppliers and contractors. We also participated in forums hosted by community and non-government organisations. We held quarterly Community Liaison Group meetings in Karratha, Western Australia, including a familiarisation tour of our Pilbara assets. Key topics discussed and indicators monitored during the year included: local housing and accommodation, essential service provision including childcare, medical, regional flight availability and local content efforts. We participated in three Energy Industry Exmouth Community Liaison Group meetings in 2022. This forum provides an opportunity for community members to provide feedback on activities and discuss issues of common interest or concern. Key topics discussed at the meetings included: operator updates, environment plans and community partnerships. Stakeholder and community engagement is well underway to support our hydrogen projects including H2Perth, the Hydrogen Refueller @H2Perth and H2TAS environmental processes. Senegal In support of the Sangomar development project we continued active engagement with coastal communities in the Dakar, Thies and Fatick regions (Senegal). We held a series of community consultations, a field visit with a social investment partner and a beach cleaning activity with the community in Dakar (Senegal). United States In October 2022, Woodside undertook engagement with key stakeholders in the Louisiana communities of Houma, Thibodaux and Port Fourchon. Impacts faced in these areas and topics discussed included hurricane preparedness, coastal erosion and challenges regarding coastal restoration efforts, food insecurity and higher education support. Mexico Stakeholder engagement continues to be a priority in support of the Trion project. During the community liaison group meeting in Tamaulipas (Mexico), in late 2022, social investment partners and local government stakeholders discussed community priorities and social challenges. These ongoing engagements will allow Woodside to continue to discuss project updates and understand community aspirations and concerns. Meeting with stakeholders and building meaningful relationships continues to be a priority. Woodside considers how we best apply our global Social Performance Framework to our growing business and the social investment approach relative to our business activities. CASE STUDY: SUPPORTING THE HOUSTON COMMUNITY, UNITED WAY PARTNERSHIP The United Way Campaign is an annual event in Houston. This year, we kicked it off in November with a launch event at our Houston offices. Daniel Kalms, Executive Vice President of Technical Services, and Dr. Angel Harris, United Way Chief Advancement Officer, hosted an informative discussion at the campaign kick off. This session also featured two of our Houston team members, the Manager of Process Safety and Integration, who represents Woodside on the United Way Women’s Initiative Steering Committee, and the Sustainability Strategy Lead based in Houston. During the two week campaign, our Houston team members participated in a variety of events, including making dental and hygiene kits and volunteering at the Houston Food Bank, Bread of Life and BakerRipley. In 2022, the Woodside partnership raised US$500,000. 60 | Sustainable Development Report 2022
Understanding community concerns Woodside’s Community Grievance Framework is designed to ensure prompt and respectful receipt, investigation and response to community concerns from stakeholders in our operational areas. The associated local mechanisms are available to community members who feel Woodside’s activities have impacted them. Translated versions of local mechanisms in Myanmar and Senegal are also available and for the Trion project in Mexico a local community grievance mechanism will be developed as part of the social impact assessment (SIA) work. For the First Nations communities in Western Australia, our grievance mechanism are communicated verbally, in respect to the communities strong spoken language and preference of the same. Community members can lodge grievances via the Community Concerns page on our website, the Woodside community phone line, via email or they may contact their closest Woodside office. Our regional offices support local teams to build trusting relationships with communities and receive feedback on a regular basis. In 2022, we received four community grievances from our operational areas, which related mostly to First Nations contracting opportunities. All grievances were addressed and discussed with relevant community members. The number of grievances in 2022 has declined from previous years. In Trinidad and Tobago, we received three fishing claims related to lost equipment during a survey for the Calypso project. The claims were settled amicably after consultation and investigation. To help ensure we have an effective and consistent approach to grievance management across all communities where we are active, we completed a review of our mechanisms against the United Nations Guiding Principles effectiveness criteria in 2022. Recommendations from the review are expected to be included in 2023 workplans. Managing our impacts Woodside seeks to identify, understand, manage and monitor potential impacts and opportunities associated with our activities. We are committed to communicating performance and progress to stakeholders and communities where we are active. In 2022, an SIA was completed to identify impacts and opportunities from our operations and proposed activities in the Pilbara region in Western Australia. The work also extended to inform our early phases of the Northern Carnarvon carbon capture and storage project. The social performance dashboard for the Pilbara region, including review of emerging trends, key community indicators and stakeholder sentiment, was shared monthly with leaders to ensure the business was responding to community needs and aspirations and not contributing to adverse impacts. We aim to implement a similar dashboard for the Exmouth and Onslow (Australia) communities and continue to share information and grow knowledge about the social performance priorities with our teams and employees. An SIA and Social Impact Management Plan for these communities is underway. Interviews were undertaken with community stakeholders in November with findings to be delivered in 2023. A social baseline scan for the Broome (Australia) region was also completed to support proactive identification of evolving social issues, emerging regulatory or policy changes and any changes in societal expectations for the Browse development. Findings are anticipated to inform future social performance activities, including social impact assessment, stakeholder engagement and social contribution. For our hydrogen business, we are targeting completion of SIAs for H2Perth, the Hydrogen Refueller @H2Perth and H2TAS and Southern Green Hydrogen in 2023. An update of the SIA for the Sangomar Field Development commenced in 2022 to understand any changes to the socioeconomic environment in Senegal, community priorities and human rights risks and impacts. Recommendations and findings will be integrated into social impact management plans in 2023. For our host communities in Trinidad and Tobago, Tamaulipas (Mexico) and coastal Louisiana (United States), we have started a process to improve how we map social impacts and identify how we continue to create opportunities. In 2023, an SIA is planned for the Tamaulipas (Mexico) region. A human rights assessment is being undertaken by the University of Tamaulipas to support our understanding of potential impacts associated with our proposed activities. The assessment will consider the environmental, social, cultural and human rights elements that require active monitoring and management. We will continue to engage and work closely with community stakeholders in 2023 to share the outcomes of our engagements, further develop our impact management plans and provide communities with proactive operational and project updates. Refer to pages 53-58 for more information on Cultural heritage management. Woodside Energy Group Ltd | 61
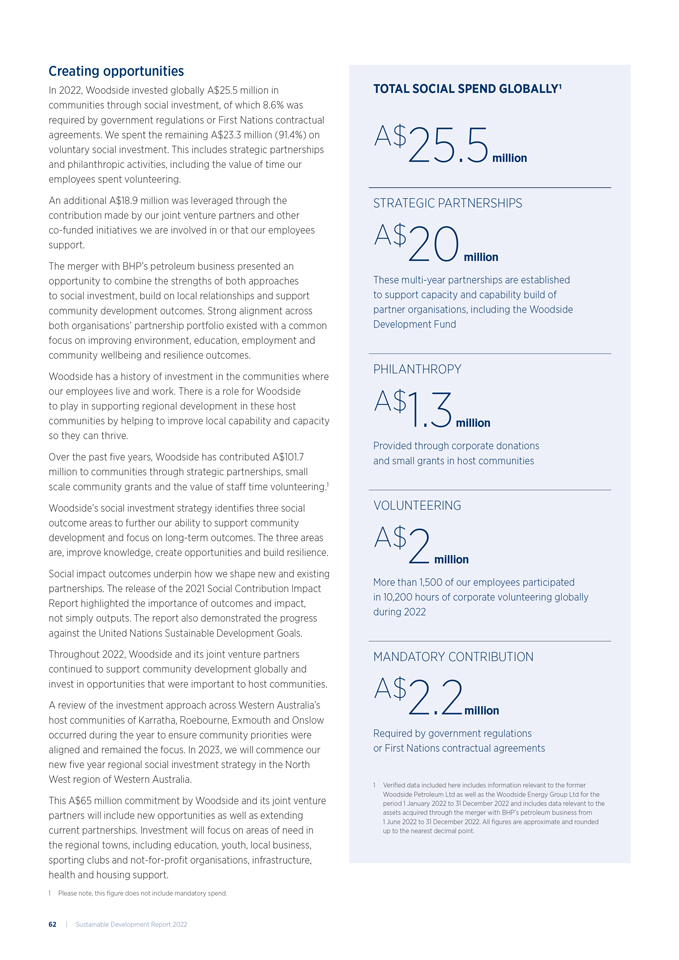
Creating opportunities In 2022, Woodside invested globally A$25.5 million in communities through social investment, of which 8.6% was required by government regulations or First Nations contractual agreements. We spent the remaining A$23.3 million (91.4%) on voluntary social investment. This includes strategic partnerships and philanthropic activities, including the value of time our employees spent volunteering. An additional A$18.9 million was leveraged through the contribution made by our joint venture partners and other co-funded initiatives we are involved in or that our employees support. The merger with BHP’s petroleum business presented an opportunity to combine the strengths of both approaches to social investment, build on local relationships and support community development outcomes. Strong alignment across both organisations’ partnership portfolio existed with a common focus on improving environment, education, employment and community wellbeing and resilience outcomes. Woodside has a history of investment in the communities where our employees live and work. There is a role for Woodside to play in supporting regional development in these host communities by helping to improve local capability and capacity so they can thrive. Over the past five years, Woodside has contributed A$101.7 million to communities through strategic partnerships, small scale community grants and the value of staff time volunteering.1 Woodside’s social investment strategy identifies three social outcome areas to further our ability to support community development and focus on long-term outcomes. The three areas are, improve knowledge, create opportunities and build resilience. Social impact outcomes underpin how we shape new and existing partnerships. The release of the 2021 Social Contribution Impact Report highlighted the importance of outcomes and impact, not simply outputs. The report also demonstrated the progress against the United Nations Sustainable Development Goals. Throughout 2022, Woodside and its joint venture partners continued to support community development globally and invest in opportunities that were important to host communities. A review of the investment approach across Western Australia’s host communities of Karratha, Roebourne, Exmouth and Onslow occurred during the year to ensure community priorities were aligned and remained the focus. In 2023, we will commence our new five year regional social investment strategy in the North West region of Western Australia. This A$65 million commitment by Woodside and its joint venture partners will include new opportunities as well as extending current partnerships. Investment will focus on areas of need in the regional towns, including education, youth, local business, sporting clubs and not-for-profit organisations, infrastructure, health and housing support. TOTAL SOCIAL SPEND GLOBALLY1 A$25.5 million STRATEGIC PARTNERSHIPS A$20 million These multi-year partnerships are established to support capacity and capability build of partner organisations, including the Woodside Development Fund PHILANTHROPY A$1.3 million Provided through corporate donations and small grants in host communities VOLUNTEERING A$2 million More than 1,500 of our employees participated in 10,200 hours of corporate volunteering globally during 2022 MANDATORY CONTRIBUTION A$2.2million Required by government regulations or First Nations contractual agreements 1 Verified data included here includes information relevant to the former Woodside Petroleum Ltd as well as the Woodside Energy Group Ltd for the period 1 January 2022 to 31 December 2022 and includes data relevant to the assets acquired through the merger with BHP’s petroleum business from 1 June 2022 to 31 December 2022. All figures are approximate and rounded up to the nearest decimal point. 1 Please note, this figure does not include mandatory spend. 62 | Sustainable Development Report 2022
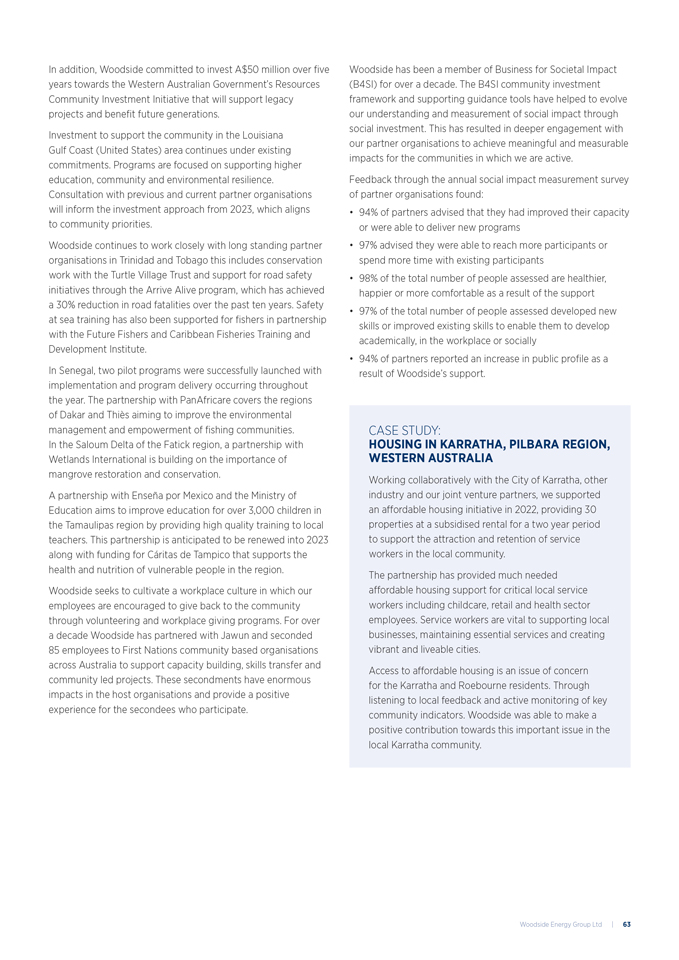
In addition, Woodside committed to invest A$50 million over five years towards the Western Australian Government’s Resources Community Investment Initiative that will support legacy projects and benefit future generations. Investment to support the community in the Louisiana Gulf Coast (United States) area continues under existing commitments. Programs are focused on supporting higher education, community and environmental resilience. Consultation with previous and current partner organisations will inform the investment approach from 2023, which aligns to community priorities. Woodside continues to work closely with long standing partner organisations in Trinidad and Tobago this includes conservation work with the Turtle Village Trust and support for road safety initiatives through the Arrive Alive program, which has achieved a 30% reduction in road fatalities over the past ten years. Safety at sea training has also been supported for fishers in partnership with the Future Fishers and Caribbean Fisheries Training and Development Institute. In Senegal, two pilot programs were successfully launched with implementation and program delivery occurring throughout the year. The partnership with PanAfricare covers the regions of Dakar and Thies aiming to improve the environmental management and empowerment of fishing communities. In the Saloum Delta of the Fatick region, a partnership with Wetlands International is building on the importance of mangrove restoration and conservation. A partnership with Ensena por Mexico and the Ministry of Education aims to improve education for over 3,000 children in the Tamaulipas region by providing high quality training to local teachers. This partnership is anticipated to be renewed into 2023 along with funding for Caritas de Tampico that supports the health and nutrition of vulnerable people in the region. Woodside seeks to cultivate a workplace culture in which our employees are encouraged to give back to the community through volunteering and workplace giving programs. For over a decade Woodside has partnered with Jawun and seconded 85 employees to First Nations community based organisations across Australia to support capacity building, skills transfer and community led projects. These secondments have enormous impacts in the host organisations and provide a positive experience for the secondees who participate. Woodside has been a member of Business for Societal Impact (B4SI) for over a decade. The B4SI community investment framework and supporting guidance tools have helped to evolve our understanding and measurement of social impact through social investment. This has resulted in deeper engagement with our partner organisations to achieve meaningful and measurable impacts for the communities in which we are active. Feedback through the annual social impact measurement survey of partner organisations found: • 94% of partners advised that they had improved their capacity or were able to deliver new programs • 97% advised they were able to reach more participants or spend more time with existing participants • 98% of the total number of people assessed are healthier, happier or more comfortable as a result of the support • 97% of the total number of people assessed developed new skills or improved existing skills to enable them to develop academically, in the workplace or socially • 94% of partners reported an increase in public profile as a result of Woodside’s support. CASE STUDY: HOUSING IN KARRATHA, PILBARA REGION, WESTERN AUSTRALIA Working collaboratively with the City of Karratha, other industry and our joint venture partners, we supported an affordable housing initiative in 2022, providing 30 properties at a subsidised rental for a two year period to support the attraction and retention of service workers in the local community. The partnership has provided much needed affordable housing support for critical local service workers including childcare, retail and health sector employees. Service workers are vital to supporting local businesses, maintaining essential services and creating vibrant and liveable cities. Access to affordable housing is an issue of concern for the Karratha and Roebourne residents. Through listening to local feedback and active monitoring of key community indicators. Woodside was able to make a positive contribution towards this important issue in the local Karratha community. Woodside Energy Group Ltd | 63
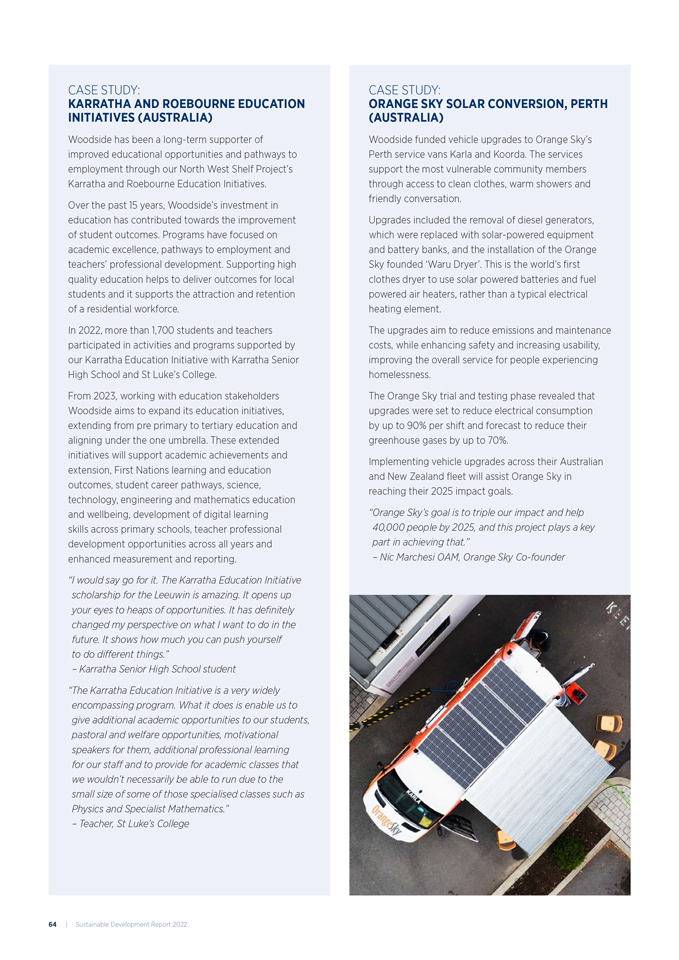
CASE STUDY: KARRATHA AND ROEBOURNE EDUCATION INITIATIVES (AUSTRALIA) Woodside has been a long-term supporter of improved educational opportunities and pathways to employment through our North West Shelf Project’s Karratha and Roebourne Education Initiatives. Over the past 15 years, Woodside’s investment in education has contributed towards the improvement of student outcomes. Programs have focused on academic excellence, pathways to employment and teachers’ professional development. Supporting high quality education helps to deliver outcomes for local students and it supports the attraction and retention of a residential workforce. In 2022, more than 1,700 students and teachers participated in activities and programs supported by our Karratha Education Initiative with Karratha Senior High School and St Luke’s College. From 2023, working with education stakeholders Woodside aims to expand its education initiatives, extending from pre primary to tertiary education and aligning under the one umbrella. These extended initiatives will support academic achievements and extension, First Nations learning and education outcomes, student career pathways, science, technology, engineering and mathematics education and wellbeing, development of digital learning skills across primary schools, teacher professional development opportunities across all years and enhanced measurement and reporting. “ I would say go for it. The Karratha Education Initiative scholarship for the Leeuwin is amazing. It opens up your eyes to heaps of opportunities. It has definitely changed my perspective on what I want to do in the future. It shows how much you can push yourself to do different things.” – Karratha Senior High School student “ The Karratha Education Initiative is a very widely encompassing program. What it does is enable us to give additional academic opportunities to our students, pastoral and welfare opportunities, motivational speakers for them, additional professional learning for our staff and to provide for academic classes that we wouldn’t necessarily be able to run due to the small size of some of those specialised classes such as Physics and Specialist Mathematics.” – Teacher, St Luke’s College CASE STUDY: ORANGE SKY SOLAR CONVERSION, PERTH (AUSTRALIA) Woodside funded vehicle upgrades to Orange Sky’s Perth service vans Karla and Koorda. The services support the most vulnerable community members through access to clean clothes, warm showers and friendly conversation. Upgrades included the removal of diesel generators, which were replaced with solar-powered equipment and battery banks, and the installation of the Orange Sky founded ‘Waru Dryer’. This is the world’s first clothes dryer to use solar powered batteries and fuel powered air heaters, rather than a typical electrical heating element. The upgrades aim to reduce emissions and maintenance costs, while enhancing safety and increasing usability, improving the overall service for people experiencing homelessness. The Orange Sky trial and testing phase revealed that upgrades were set to reduce electrical consumption by up to 90% per shift and forecast to reduce their greenhouse gases by up to 70%. Implementing vehicle upgrades across their Australian and New Zealand fleet will assist Orange Sky in reaching their 2025 impact goals. “ Orange Sky’s goal is to triple our impact and help 40,000 people by 2025, and this project plays a key part in achieving that.” – Nic Marchesi OAM, Orange Sky Co-founder 64 | Sustainable Development Report 2022
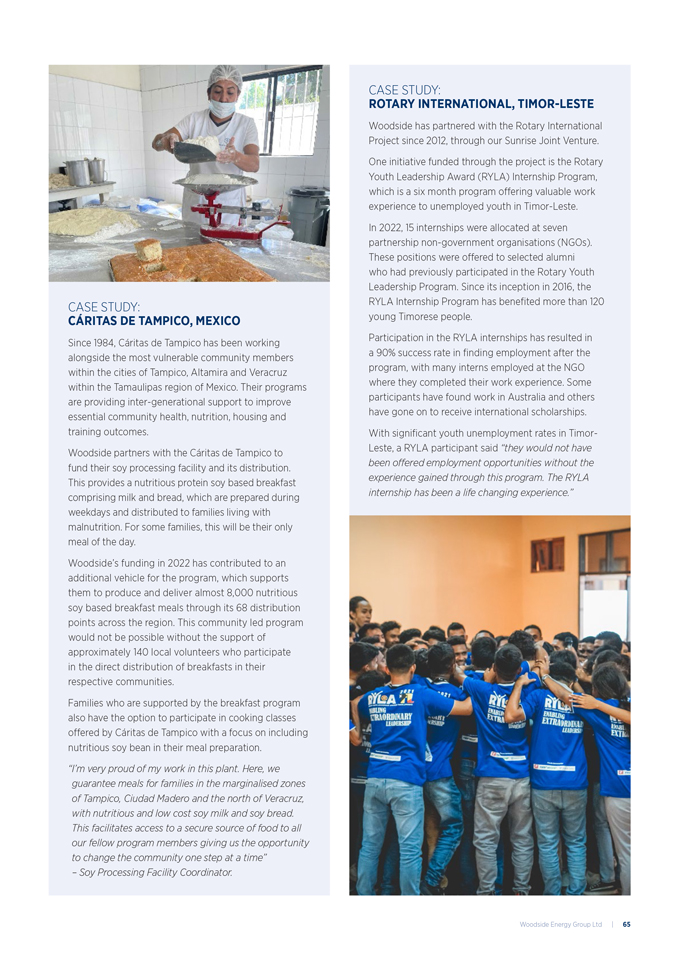
CASE STUDY: CÁRITAS DE TAMPICO, MEXICO Since 1984, Caritas de Tampico has been working alongside the most vulnerable community members within the cities of Tampico, Altamira and Veracruz within the Tamaulipas region of Mexico. Their programs are providing inter-generational support to improve essential community health, nutrition, housing and training outcomes. Woodside partners with the Caritas de Tampico to fund their soy processing facility and its distribution. This provides a nutritious protein soy based breakfast comprising milk and bread, which are prepared during weekdays and distributed to families living with malnutrition. For some families, this will be their only meal of the day. Woodside’s funding in 2022 has contributed to an additional vehicle for the program, which supports them to produce and deliver almost 8,000 nutritious soy based breakfast meals through its 68 distribution points across the region. This community led program would not be possible without the support of approximately 140 local volunteers who participate in the direct distribution of breakfasts in their respective communities. Families who are supported by the breakfast program also have the option to participate in cooking classes offered by Caritas de Tampico with a focus on including nutritious soy bean in their meal preparation. “ I’m very proud of my work in this plant. Here, we guarantee meals for families in the marginalised zones of Tampico, Ciudad Madero and the north of Veracruz, with nutritious and low cost soy milk and soy bread. This facilitates access to a secure source of food to all our fellow program members giving us the opportunity to change the community one step at a time” – Soy Processing Facility Coordinator. CASE STUDY: ROTARY INTERNATIONAL, TIMOR-LESTE Woodside has partnered with the Rotary International Project since 2012, through our Sunrise Joint Venture. One initiative funded through the project is the Rotary Youth Leadership Award (RYLA) Internship Program, which is a six month program offering valuable work experience to unemployed youth in Timor-Leste. In 2022, 15 internships were allocated at seven partnership non-government organisations (NGOs). These positions were offered to selected alumni who had previously participated in the Rotary Youth Leadership Program. Since its inception in 2016, the RYLA Internship Program has benefited more than 120 young Timorese people. Participation in the RYLA internships has resulted in a 90% success rate in finding employment after the program, with many interns employed at the NGO where they completed their work experience. Some participants have found work in Australia and others have gone on to receive international scholarships. With significant youth unemployment rates in Timor- Leste, a RYLA participant said “they would not have been offered employment opportunities without the experience gained through this program. The RYLA internship has been a life changing experience.” Woodside Energy Group Ltd | 65
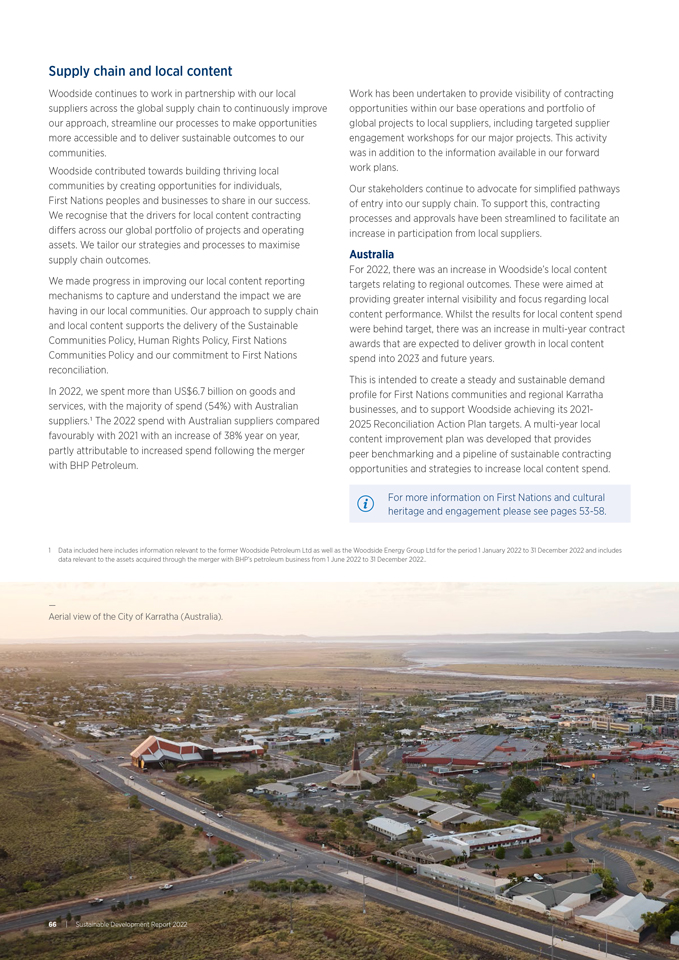
Supply chain and local content 1 Data included here includes information relevant to the former Woodside Petroleum Ltd as well as the Woodside Energy Group Ltd for the period 1 January 2022 to 31 December 2022 and includes data relevant to the assets acquired through the merger with BHP’s petroleum business from 1 June 2022 to 31 December 2022.. Woodside continues to work in partnership with our local suppliers across the global supply chain to continuously improve our approach, streamline our processes to make opportunities more accessible and to deliver sustainable outcomes to our communities. Woodside contributed towards building thriving local communities by creating opportunities for individuals, First Nations peoples and businesses to share in our success. We recognise that the drivers for local content contracting differs across our global portfolio of projects and operating assets. We tailor our strategies and processes to maximise supply chain outcomes. We made progress in improving our local content reporting mechanisms to capture and understand the impact we are having in our local communities. Our approach to supply chain and local content supports the delivery of the Sustainable Communities Policy, Human Rights Policy, First Nations Communities Policy and our commitment to First Nations reconciliation. In 2022, we spent more than US$6.7 billion on goods and services, with the majority of spend (54%) with Australian suppliers.1 The 2022 spend with Australian suppliers compared favourably with 2021 with an increase of 38% year on year, partly attributable to increased spend following the merger with BHP Petroleum. Work has been undertaken to provide visibility of contracting opportunities within our base operations and portfolio of global projects to local suppliers, including targeted supplier engagement workshops for our major projects. This activity was in addition to the information available in our forward work plans. Our stakeholders continue to advocate for simplified pathways of entry into our supply chain. To support this, contracting processes and approvals have been streamlined to facilitate an increase in participation from local suppliers. Australia For 2022, there was an increase in Woodside’s local content targets relating to regional outcomes. These were aimed at providing greater internal visibility and focus regarding local content performance. Whilst the results for local content spend were behind target, there was an increase in multi-year contract awards that are expected to deliver growth in local content spend into 2023 and future years. This is intended to create a steady and sustainable demand profile for First Nations communities and regional Karratha businesses, and to support Woodside achieving its 2021- 2025 Reconciliation Action Plan targets. A multi-year local content improvement plan was developed that provides peer benchmarking and a pipeline of sustainable contracting opportunities and strategies to increase local content spend. For more information on First Nations and cultural heritage and engagement please see pages 53-58. — Aerial view of the City of Karratha (Australia). 66 | Sustainable Development Report 2022
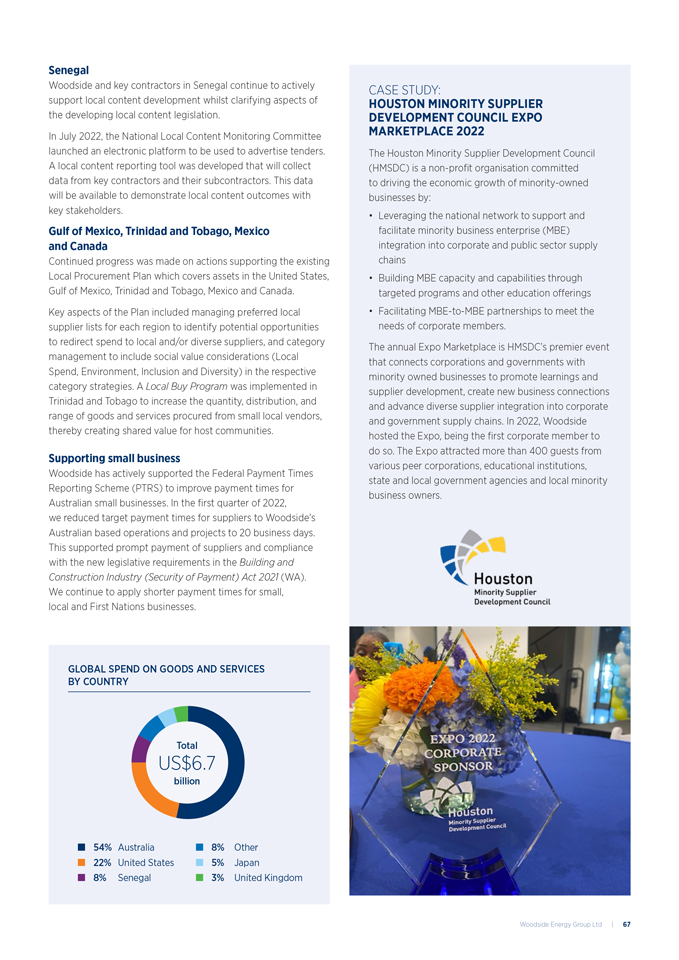
Senegal Woodside and key contractors in Senegal continue to actively support local content development whilst clarifying aspects of the developing local content legislation. In July 2022, the National Local Content Monitoring Committee launched an electronic platform to be used to advertise tenders. A local content reporting tool was developed that will collect data from key contractors and their subcontractors. This data will be available to demonstrate local content outcomes with key stakeholders. Gulf of Mexico, Trinidad and Tobago, Mexico and Canada Continued progress was made on actions supporting the existing Local Procurement Plan which covers assets in the United States, Gulf of Mexico, Trinidad and Tobago, Mexico and Canada. Key aspects of the Plan included managing preferred local supplier lists for each region to identify potential opportunities to redirect spend to local and/or diverse suppliers, and category management to include social value considerations (Local Spend, Environment, Inclusion and Diversity) in the respective category strategies. A Local Buy Program was implemented in Trinidad and Tobago to increase the quantity, distribution, and range of goods and services procured from small local vendors, thereby creating shared value for host communities. Supporting small business Woodside has actively supported the Federal Payment Times Reporting Scheme (PTRS) to improve payment times for Australian small businesses. In the first quarter of 2022, we reduced target payment times for suppliers to Woodside’s Australian based operations and projects to 20 business days. This supported prompt payment of suppliers and compliance with the new legislative requirements in the Building and Construction Industry (Security of Payment) Act 2021 (WA). We continue to apply shorter payment times for small, local and First Nations businesses. GLOBAL SPEND ON GOODS AND SERVICES BY COUNTRY Total US$6.7 billion 54% Australia 22% United States 8% Senegal 8% Other 5% Japan 3% United Kingdom CASE STUDY: HOUSTON MINORITY SUPPLIER DEVELOPMENT COUNCIL EXPO MARKETPLACE 2022 The Houston Minority Supplier Development Council (HMSDC) is a non-profit organisation committed to driving the economic growth of minority-owned businesses by: • Leveraging the national network to support and facilitate minority business enterprise (MBE) integration into corporate and public sector supply chains • Building MBE capacity and capabilities through targeted programs and other education offerings • Facilitating MBE-to-MBE partnerships to meet the needs of corporate members. The annual Expo Marketplace is HMSDC’s premier event that connects corporations and governments with minority owned businesses to promote learnings and supplier development, create new business connections and advance diverse supplier integration into corporate and government supply chains. In 2022, Woodside hosted the Expo, being the first corporate member to do so. The Expo attracted more than 400 guests from various peer corporations, educational institutions, state and local government agencies and local minority business owners. Woodside Energy Group Ltd | 67
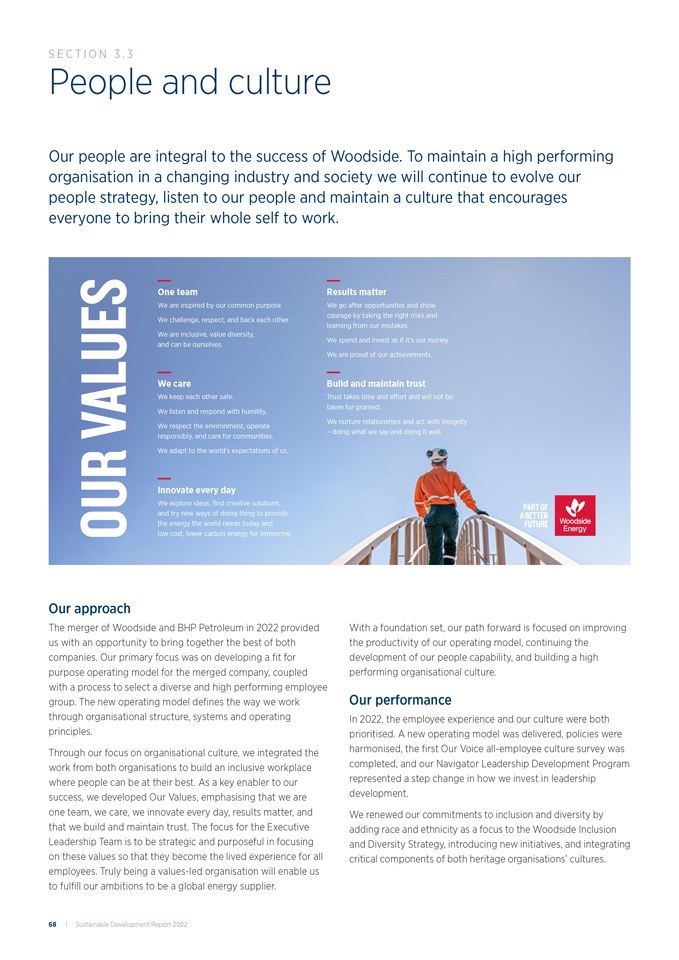
People and culture Our people are integral to the success of Woodside. To maintain a high performing organisation in a changing industry and society we will continue to evolve our people strategy, listen to our people and maintain a culture that encourages everyone to bring their whole self to work. Our approach The merger of Woodside and BHP Petroleum in 2022 provided us with an opportunity to bring together the best of both companies. Our primary focus was on developing a fit for purpose operating model for the merged company, coupled with a process to select a diverse and high performing employee group. The new operating model defines the way we work through organisational structure, systems and operating principles. Through our focus on organisational culture, we integrated the work from both organisations to build an inclusive workplace where people can be at their best. As a key enabler to our success, we developed Our Values, emphasising that we are one team, we care, we innovate every day, results matter, and that we build and maintain trust. The focus for the Executive Leadership Team is to be strategic and purposeful in focusing on these values so that they become the lived experience for all employees. Truly being a values-led organisation will enable us to fulfill our ambitions to be a global energy supplier. With a foundation set, our path forward is focused on improving the productivity of our operating model, continuing the development of our people capability, and building a high performing organisational culture. Our performance In 2022, the employee experience and our culture were both prioritised. A new operating model was delivered, policies were harmonised, the first Our Voice all-employee culture survey was completed, and our Navigator Leadership Development Program represented a step change in how we invest in leadership development. We renewed our commitments to inclusion and diversity by adding race and ethnicity as a focus to the Woodside Inclusion and Diversity Strategy, introducing new initiatives, and integrating critical components of both heritage organisations’ cultures. OUR VALUES One team We are inspired by our common purpose. We challenge, respect, and back each other. We are inclusive, value diversity, and can be ourselves. Results matter We go after opportunities and show courage by taking the right risks and learning from our mistakes. We spend and invest as if it’s our money. We are proud of our achievements. Build and maintain trust Trust takes time and eff ort and will not be taken for granted. We nurture relationships and act with integrity – doing what we say and doing it well. We care We keep each other safe. We listen and respond with humility. We respect the environment, operate responsibly, and care for communities. We adapt to the world’s expectations of us. Innovate every day We explore ideas, fi nd creative solutions, and try new ways of doing thing to provide the energy the world needs today and low cost, lower carbon energy for tomorrow. S ection 3 . 3 68 | Sustainable Development Report 2022
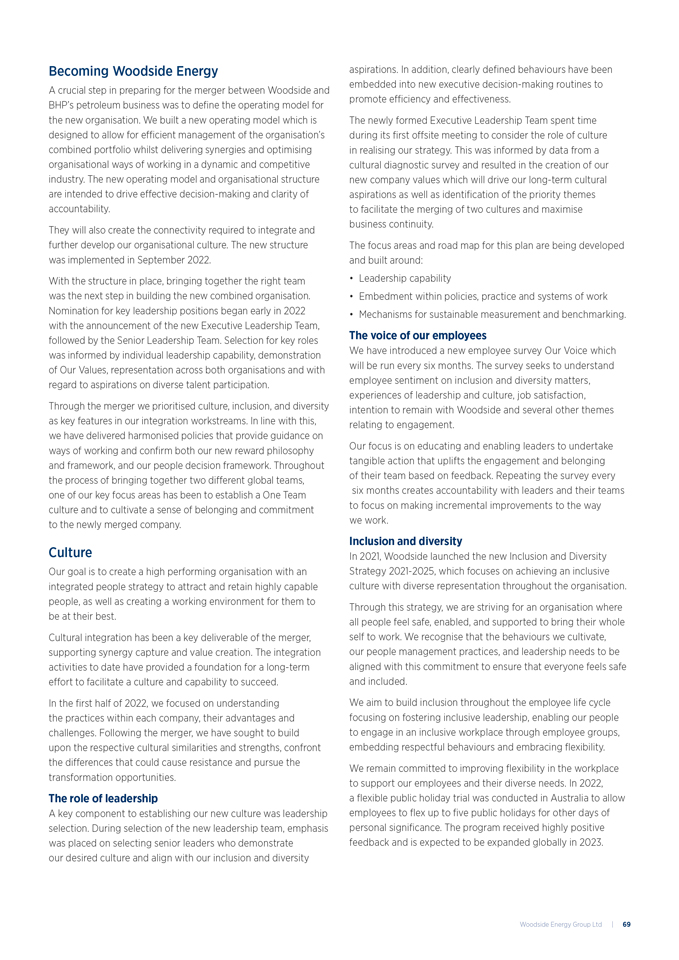
Becoming Woodside Energy A crucial step in preparing for the merger between Woodside and BHP’s petroleum business was to define the operating model for the new organisation. We built a new operating model which is designed to allow for efficient management of the organisation’s combined portfolio whilst delivering synergies and optimising organisational ways of working in a dynamic and competitive industry. The new operating model and organisational structure are intended to drive effective decision-making and clarity of accountability. They will also create the connectivity required to integrate and further develop our organisational culture. The new structure was implemented in September 2022. With the structure in place, bringing together the right team was the next step in building the new combined organisation. Nomination for key leadership positions began early in 2022 with the announcement of the new Executive Leadership Team, followed by the Senior Leadership Team. Selection for key roles was informed by individual leadership capability, demonstration of Our Values, representation across both organisations and with regard to aspirations on diverse talent participation. Through the merger we prioritised culture, inclusion, and diversity as key features in our integration workstreams. In line with this, we have delivered harmonised policies that provide guidance on ways of working and confirm both our new reward philosophy and framework, and our people decision framework. Throughout the process of bringing together two different global teams, one of our key focus areas has been to establish a One Team culture and to cultivate a sense of belonging and commitment to the newly merged company. Culture Our goal is to create a high performing organisation with an integrated people strategy to attract and retain highly capable people, as well as creating a working environment for them to be at their best. Cultural integration has been a key deliverable of the merger, supporting synergy capture and value creation. The integration activities to date have provided a foundation for a long-term effort to facilitate a culture and capability to succeed. In the first half of 2022, we focused on understanding the practices within each company, their advantages and challenges. Following the merger, we have sought to build upon the respective cultural similarities and strengths, confront the differences that could cause resistance and pursue the transformation opportunities. The role of leadership A key component to establishing our new culture was leadership selection. During selection of the new leadership team, emphasis was placed on selecting senior leaders who demonstrate our desired culture and align with our inclusion and diversity aspirations. In addition, clearly defined behaviours have been embedded into new executive decision-making routines to promote efficiency and effectiveness. The newly formed Executive Leadership Team spent time during its first offsite meeting to consider the role of culture in realising our strategy. This was informed by data from a cultural diagnostic survey and resulted in the creation of our new company values which will drive our long-term cultural aspirations as well as identification of the priority themes to facilitate the merging of two cultures and maximise business continuity. The focus areas and road map for this plan are being developed and built around: • Leadership capability • Embedment within policies, practice and systems of work • Mechanisms for sustainable measurement and benchmarking. The voice of our employees We have introduced a new employee survey Our Voice which will be run every six months. The survey seeks to understand employee sentiment on inclusion and diversity matters, experiences of leadership and culture, job satisfaction, intention to remain with Woodside and several other themes relating to engagement. Our focus is on educating and enabling leaders to undertake tangible action that uplifts the engagement and belonging of their team based on feedback. Repeating the survey every six months creates accountability with leaders and their teams to focus on making incremental improvements to the way we work. Inclusion and diversity In 2021, Woodside launched the new Inclusion and Diversity Strategy 2021-2025, which focuses on achieving an inclusive culture with diverse representation throughout the organisation. Through this strategy, we are striving for an organisation where all people feel safe, enabled, and supported to bring their whole self to work. We recognise that the behaviours we cultivate, our people management practices, and leadership needs to be aligned with this commitment to ensure that everyone feels safe and included. We aim to build inclusion throughout the employee life cycle focusing on fostering inclusive leadership, enabling our people to engage in an inclusive workplace through employee groups, embedding respectful behaviours and embracing flexibility. We remain committed to improving flexibility in the workplace to support our employees and their diverse needs. In 2022, a flexible public holiday trial was conducted in Australia to allow employees to flex up to five public holidays for other days of personal significance. The program received highly positive feedback and is expected to be expanded globally in 2023. Woodside Energy Group Ltd | 69
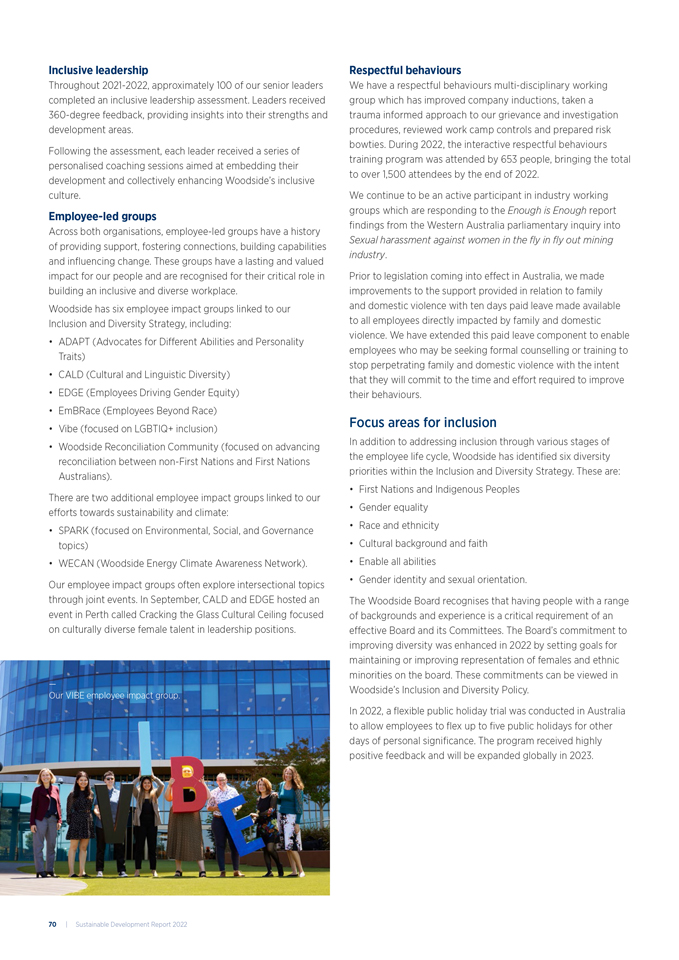
Inclusive leadership Throughout 2021-2022, approximately 100 of our senior leaders completed an inclusive leadership assessment. Leaders received 360-degree feedback, providing insights into their strengths and development areas. Following the assessment, each leader received a series of personalised coaching sessions aimed at embedding their development and collectively enhancing Woodside’s inclusive culture. Employee-led groups Across both organisations, employee-led groups have a history of providing support, fostering connections, building capabilities and influencing change. These groups have a lasting and valued impact for our people and are recognised for their critical role in building an inclusive and diverse workplace. Woodside has six employee impact groups linked to our Inclusion and Diversity Strategy, including: • ADAPT (Advocates for Different Abilities and Personality Traits) • CALD (Cultural and Linguistic Diversity) • EDGE (Employees Driving Gender Equity) • EmBRace (Employees Beyond Race) • Vibe (focused on LGBTIQ+ inclusion) • Woodside Reconciliation Community (focused on advancing reconciliation between non-First Nations and First Nations Australians). There are two additional employee impact groups linked to our efforts towards sustainability and climate: • SPARK (focused on Environmental, Social, and Governance topics) • WECAN (Woodside Energy Climate Awareness Network). Our employee impact groups often explore intersectional topics through joint events. In September, CALD and EDGE hosted an event in Perth called Cracking the Glass Cultural Ceiling focused on culturally diverse female talent in leadership positions. Respectful behaviours We have a respectful behaviours multi-disciplinary working group which has improved company inductions, taken a trauma informed approach to our grievance and investigation procedures, reviewed work camp controls and prepared risk bowties. During 2022, the interactive respectful behaviours training program was attended by 653 people, bringing the total to over 1,500 attendees by the end of 2022. We continue to be an active participant in industry working groups which are responding to the Enough is Enough report findings from the Western Australia parliamentary inquiry into Sexual harassment against women in the fly in fly out mining industry. Prior to legislation coming into effect in Australia, we made improvements to the support provided in relation to family and domestic violence with ten days paid leave made available to all employees directly impacted by family and domestic violence. We have extended this paid leave component to enable employees who may be seeking formal counselling or training to stop perpetrating family and domestic violence with the intent that they will commit to the time and effort required to improve their behaviours. Focus areas for inclusion In addition to addressing inclusion through various stages of the employee life cycle, Woodside has identified six diversity priorities within the Inclusion and Diversity Strategy. These are: • First Nations and Indigenous Peoples • Gender equality • Race and ethnicity • Cultural background and faith • Enable all abilities • Gender identity and sexual orientation. The Woodside Board recognises that having people with a range of backgrounds and experience is a critical requirement of an effective Board and its Committees. The Board’s commitment to improving diversity was enhanced in 2022 by setting goals for maintaining or improving representation of females and ethnic minorities on the board. These commitments can be viewed in Woodside’s Inclusion and Diversity Policy. In 2022, a flexible public holiday trial was conducted in Australia to allow employees to flex up to five public holidays for other days of personal significance. The program received highly positive feedback and will be expanded globally in 2023. — Our VIBE employee impact group. 70 | Sustainable Development Report 2022
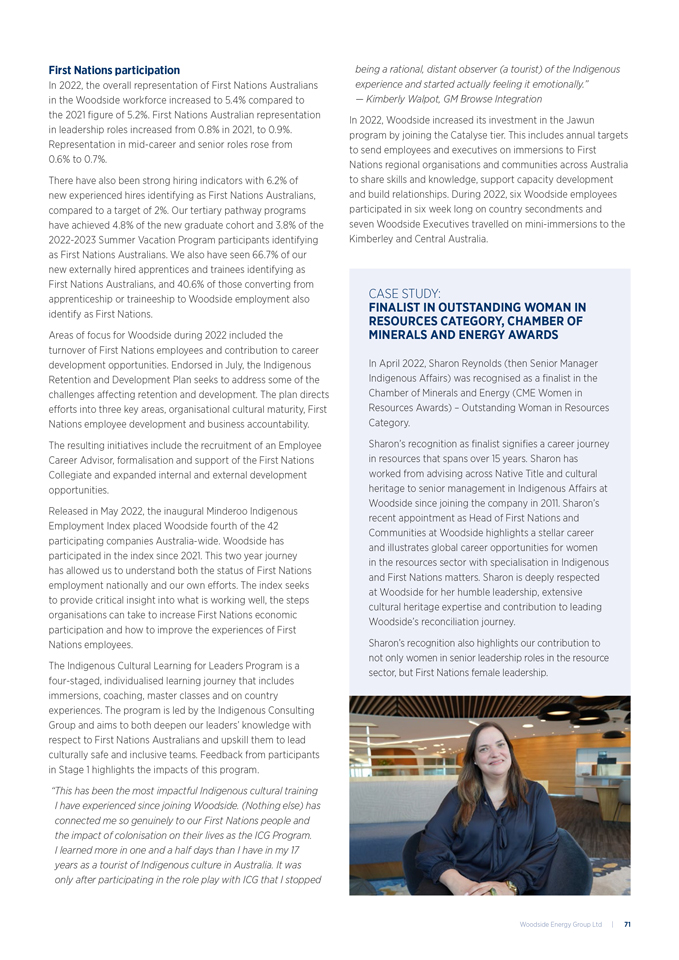
First Nations participation In 2022, the overall representation of First Nations Australians in the Woodside workforce increased to 5.4% compared to the 2021 figure of 5.2%. First Nations Australian representation in leadership roles increased from 0.8% in 2021, to 0.9%. Representation in mid-career and senior roles rose from 0.6% to 0.7%. There have also been strong hiring indicators with 6.2% of new experienced hires identifying as First Nations Australians, compared to a target of 2%. Our tertiary pathway programs have achieved 4.8% of the new graduate cohort and 3.8% of the 2022-2023 Summer Vacation Program participants identifying as First Nations Australians. We also have seen 66.7% of our new externally hired apprentices and trainees identifying as First Nations Australians, and 40.6% of those converting from apprenticeship or traineeship to Woodside employment also identify as First Nations. Areas of focus for Woodside during 2022 included the turnover of First Nations employees and contribution to career development opportunities. Endorsed in July, the Indigenous Retention and Development Plan seeks to address some of the challenges affecting retention and development. The plan directs efforts into three key areas, organisational cultural maturity, First Nations employee development and business accountability. The resulting initiatives include the recruitment of an Employee Career Advisor, formalisation and support of the First Nations Collegiate and expanded internal and external development opportunities. Released in May 2022, the inaugural Minderoo Indigenous Employment Index placed Woodside fourth of the 42 participating companies Australia-wide. Woodside has participated in the index since 2021. This two year journey has allowed us to understand both the status of First Nations employment nationally and our own efforts. The index seeks to provide critical insight into what is working well, the steps organisations can take to increase First Nations economic participation and how to improve the experiences of First Nations employees. The Indigenous Cultural Learning for Leaders Program is a four-staged, individualised learning journey that includes immersions, coaching, master classes and on country experiences. The program is led by the Indigenous Consulting Group and aims to both deepen our leaders’ knowledge with respect to First Nations Australians and upskill them to lead culturally safe and inclusive teams. Feedback from participants in Stage 1 highlights the impacts of this program. “ This has been the most impactful Indigenous cultural training I have experienced since joining Woodside. (Nothing else) has connected me so genuinely to our First Nations people and the impact of colonisation on their lives as the ICG Program. I learned more in one and a half days than I have in my 17 years as a tourist of Indigenous culture in Australia. It was only after participating in the role play with ICG that I stopped being a rational, distant observer (a tourist) of the Indigenous experience and started actually feeling it emotionally.” — Kimberly Walpot, GM Browse Integration In 2022, Woodside increased its investment in the Jawun program by joining the Catalyse tier. This includes annual targets to send employees and executives on immersions to First Nations regional organisations and communities across Australia to share skills and knowledge, support capacity development and build relationships. During 2022, six Woodside employees participated in six week long on country secondments and seven Woodside Executives travelled on mini-immersions to the Kimberley and Central Australia. CASE STUDY: FINALIST IN OUTSTANDING WOMAN IN RESOURCES CATEGORY, CHAMBER OF MINERALS AND ENERGY AWARDS In April 2022, Sharon Reynolds (then Senior Manager Indigenous Affairs) was recognised as a finalist in the Chamber of Minerals and Energy (CME Women in Resources Awards) – Outstanding Woman in Resources Category. Sharon’s recognition as finalist signifies a career journey in resources that spans over 15 years. Sharon has worked from advising across Native Title and cultural heritage to senior management in Indigenous Affairs at Woodside since joining the company in 2011. Sharon’s recent appointment as Head of First Nations and Communities at Woodside highlights a stellar career and illustrates global career opportunities for women in the resources sector with specialisation in Indigenous and First Nations matters. Sharon is deeply respected at Woodside for her humble leadership, extensive cultural heritage expertise and contribution to leading Woodside’s reconciliation journey. Sharon’s recognition also highlights our contribution to not only women in senior leadership roles in the resource sector, but First Nations female leadership. Woodside Energy Group Ltd | 71
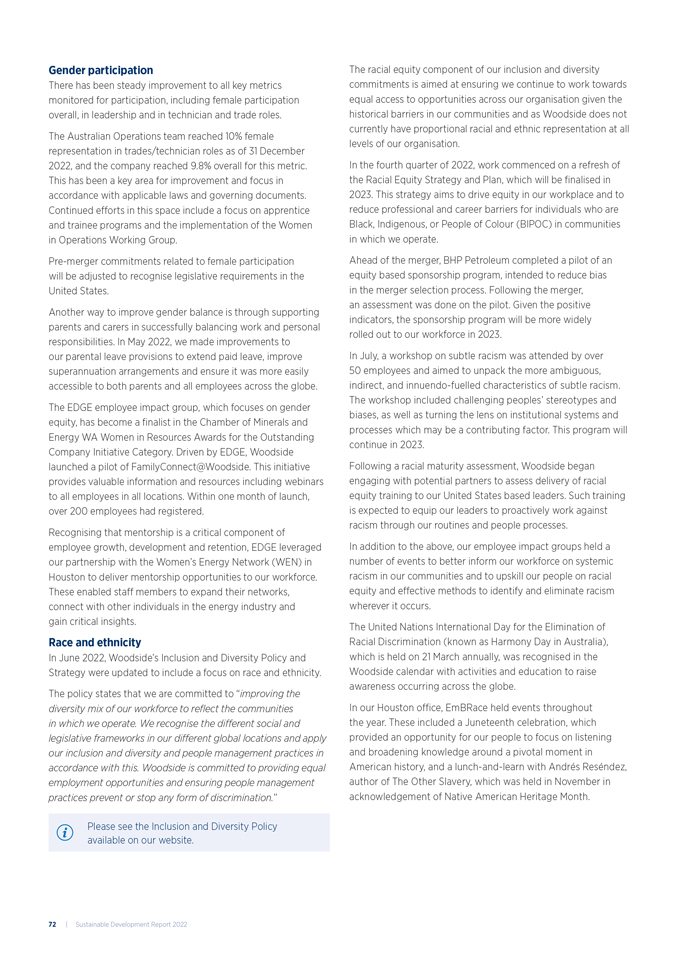
Gender participation There has been steady improvement to all key metrics monitored for participation, including female participation overall, in leadership and in technician and trade roles. The Australian Operations team reached 10% female representation in trades/technician roles as of 31 December 2022, and the company reached 9.8% overall for this metric. This has been a key area for improvement and focus in accordance with applicable laws and governing documents. Continued efforts in this space include a focus on apprentice and trainee programs and the implementation of the Women in Operations Working Group. Pre-merger commitments related to female participation will be adjusted to recognise legislative requirements in the United States. Another way to improve gender balance is through supporting parents and carers in successfully balancing work and personal responsibilities. In May 2022, we made improvements to our parental leave provisions to extend paid leave, improve superannuation arrangements and ensure it was more easily accessible to both parents and all employees across the globe. The EDGE employee impact group, which focuses on gender equity, has become a finalist in the Chamber of Minerals and Energy WA Women in Resources Awards for the Outstanding Company Initiative Category. Driven by EDGE, Woodside launched a pilot of FamilyConnect@Woodside. This initiative provides valuable information and resources including webinars to all employees in all locations. Within one month of launch, over 200 employees had registered. Recognising that mentorship is a critical component of employee growth, development and retention, EDGE leveraged our partnership with the Women’s Energy Network (WEN) in Houston to deliver mentorship opportunities to our workforce. These enabled staff members to expand their networks, connect with other individuals in the energy industry and gain critical insights. Race and ethnicity In June 2022, Woodside’s Inclusion and Diversity Policy and Strategy were updated to include a focus on race and ethnicity. The policy states that we are committed to “improving the diversity mix of our workforce to reflect the communities in which we operate. We recognise the different social and legislative frameworks in our different global locations and apply our inclusion and diversity and people management practices in accordance with this. Woodside is committed to providing equal employment opportunities and ensuring people management practices prevent or stop any form of discrimination.” Please see the Inclusion and Diversity Policy available on our website. The racial equity component of our inclusion and diversity commitments is aimed at ensuring we continue to work towards equal access to opportunities across our organisation given the historical barriers in our communities and as Woodside does not currently have proportional racial and ethnic representation at all levels of our organisation. In the fourth quarter of 2022, work commenced on a refresh of the Racial Equity Strategy and Plan, which will be finalised in 2023. This strategy aims to drive equity in our workplace and to reduce professional and career barriers for individuals who are Black, Indigenous, or People of Colour (BIPOC) in communities in which we operate. Ahead of the merger, BHP Petroleum completed a pilot of an equity based sponsorship program, intended to reduce bias in the merger selection process. Following the merger, an assessment was done on the pilot. Given the positive indicators, the sponsorship program will be more widely rolled out to our workforce in 2023. In July, a workshop on subtle racism was attended by over 50 employees and aimed to unpack the more ambiguous, indirect, and innuendo-fuelled characteristics of subtle racism. The workshop included challenging peoples’ stereotypes and biases, as well as turning the lens on institutional systems and processes which may be a contributing factor. This program will continue in 2023. Following a racial maturity assessment, Woodside began engaging with potential partners to assess delivery of racial equity training to our United States based leaders. Such training is expected to equip our leaders to proactively work against racism through our routines and people processes. In addition to the above, our employee impact groups held a number of events to better inform our workforce on systemic racism in our communities and to upskill our people on racial equity and effective methods to identify and eliminate racism wherever it occurs. The United Nations International Day for the Elimination of Racial Discrimination (known as Harmony Day in Australia), which is held on 21 March annually, was recognised in the Woodside calendar with activities and education to raise awareness occurring across the globe. In our Houston office, EmBRace held events throughout the year. These included a Juneteenth celebration, which provided an opportunity for our people to focus on listening and broadening knowledge around a pivotal moment in American history, and a lunch-and-learn with Andres Resendez, author of The Other Slavery, which was held in November in acknowledgement of Native American Heritage Month. 72 | Sustainable Development Report 2022
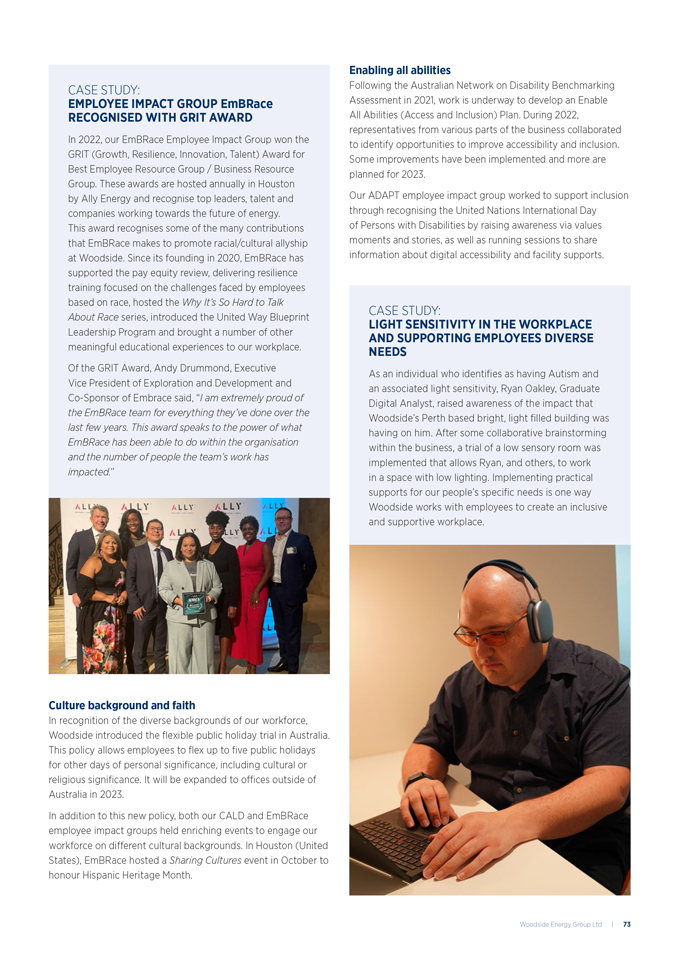
Culture background and faith In recognition of the diverse backgrounds of our workforce, Woodside introduced the flexible public holiday trial in Australia. This policy allows employees to flex up to five public holidays for other days of personal significance, including cultural or religious significance. It will be expanded to offices outside of Australia in 2023. In addition to this new policy, both our CALD and EmBRace employee impact groups held enriching events to engage our workforce on different cultural backgrounds. In Houston (United States), EmBRace hosted a Sharing Cultures event in October to honour Hispanic Heritage Month. Enabling all abilities Following the Australian Network on Disability Benchmarking Assessment in 2021, work is underway to develop an Enable All Abilities (Access and Inclusion) Plan. During 2022, representatives from various parts of the business collaborated to identify opportunities to improve accessibility and inclusion. Some improvements have been implemented and more are planned for 2023. Our ADAPT employee impact group worked to support inclusion through recognising the United Nations International Day of Persons with Disabilities by raising awareness via values moments and stories, as well as running sessions to share information about digital accessibility and facility supports. CASE STUDY: EMPLOYEE IMPACT GROUP EmBRace RECOGNISED WITH GRIT AWARD In 2022, our EmBRace Employee Impact Group won the GRIT (Growth, Resilience, Innovation, Talent) Award for Best Employee Resource Group / Business Resource Group. These awards are hosted annually in Houston by Ally Energy and recognise top leaders, talent and companies working towards the future of energy. This award recognises some of the many contributions that EmBRace makes to promote racial/cultural allyship at Woodside. Since its founding in 2020, EmBRace has supported the pay equity review, delivering resilience training focused on the challenges faced by employees based on race, hosted the Why It’s So Hard to Talk About Race series, introduced the United Way Blueprint Leadership Program and brought a number of other meaningful educational experiences to our workplace. Of the GRIT Award, Andy Drummond, Executive Vice President of Exploration and Development and Co-Sponsor of Embrace said, “I am extremely proud of the EmBRace team for everything they’ve done over the last few years. This award speaks to the power of what EmBRace has been able to do within the organisation and the number of people the team’s work has impacted.” CASE STUDY: LIGHT SENSITIVITY IN THE WORKPLACE AND SUPPORTING EMPLOYEES DIVERSE NEEDS As an individual who identifies as having Autism and an associated light sensitivity, Ryan Oakley, Graduate Digital Analyst, raised awareness of the impact that Woodside’s Perth based bright, light filled building was having on him. After some collaborative brainstorming within the business, a trial of a low sensory room was implemented that allows Ryan, and others, to work in a space with low lighting. Implementing practical supports for our people’s specific needs is one way Woodside works with employees to create an inclusive and supportive workplace. Woodside Energy Group Ltd | 73
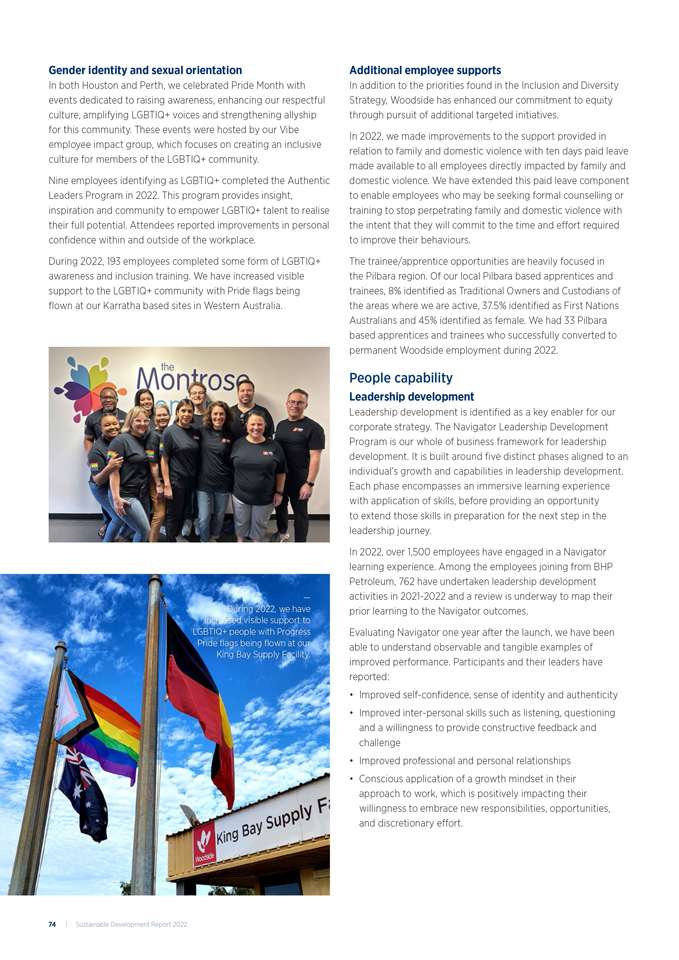
Gender identity and sexual orientation In both Houston and Perth, we celebrated Pride Month with events dedicated to raising awareness, enhancing our respectful culture, amplifying LGBTIQ+ voices and strengthening allyship for this community. These events were hosted by our Vibe employee impact group, which focuses on creating an inclusive culture for members of the LGBTIQ+ community. Nine employees identifying as LGBTIQ+ completed the Authentic Leaders Program in 2022. This program provides insight, inspiration and community to empower LGBTIQ+ talent to realise their full potential. Attendees reported improvements in personal confidence within and outside of the workplace. During 2022, 193 employees completed some form of LGBTIQ+ awareness and inclusion training. We have increased visible support to the LGBTIQ+ community with Pride flags being flown at our Karratha based sites in Western Australia. Additional employee supports In addition to the priorities found in the Inclusion and Diversity Strategy, Woodside has enhanced our commitment to equity through pursuit of additional targeted initiatives. In 2022, we made improvements to the support provided in relation to family and domestic violence with ten days paid leave made available to all employees directly impacted by family and domestic violence. We have extended this paid leave component to enable employees who may be seeking formal counselling or training to stop perpetrating family and domestic violence with the intent that they will commit to the time and effort required to improve their behaviours. The trainee/apprentice opportunities are heavily focused in the Pilbara region. Of our local Pilbara based apprentices and trainees, 8% identified as Traditional Owners and Custodians of the areas where we are active, 37.5% identified as First Nations Australians and 45% identified as female. We had 33 Pilbara based apprentices and trainees who successfully converted to permanent Woodside employment during 2022. People capability Leadership development Leadership development is identified as a key enabler for our corporate strategy. The Navigator Leadership Development Program is our whole of business framework for leadership development. It is built around five distinct phases aligned to an individual’s growth and capabilities in leadership development. Each phase encompasses an immersive learning experience with application of skills, before providing an opportunity to extend those skills in preparation for the next step in the leadership journey. In 2022, over 1,500 employees have engaged in a Navigator learning experience. Among the employees joining from BHP Petroleum, 762 have undertaken leadership development activities in 2021-2022 and a review is underway to map their prior learning to the Navigator outcomes. Evaluating Navigator one year after the launch, we have been able to understand observable and tangible examples of improved performance. Participants and their leaders have reported: • Improved self-confidence, sense of identity and authenticity • Improved inter-personal skills such as listening, questioning and a willingness to provide constructive feedback and challenge • Improved professional and personal relationships • Conscious application of a growth mindset in their approach to work, which is positively impacting their willingness to embrace new responsibilities, opportunities, and discretionary effort. — During 2022, we have increased visible support to LGBTIQ+ people with Progress Pride flags being flown at our King Bay Supply Facility. 74 | Sustainable Development Report 2022
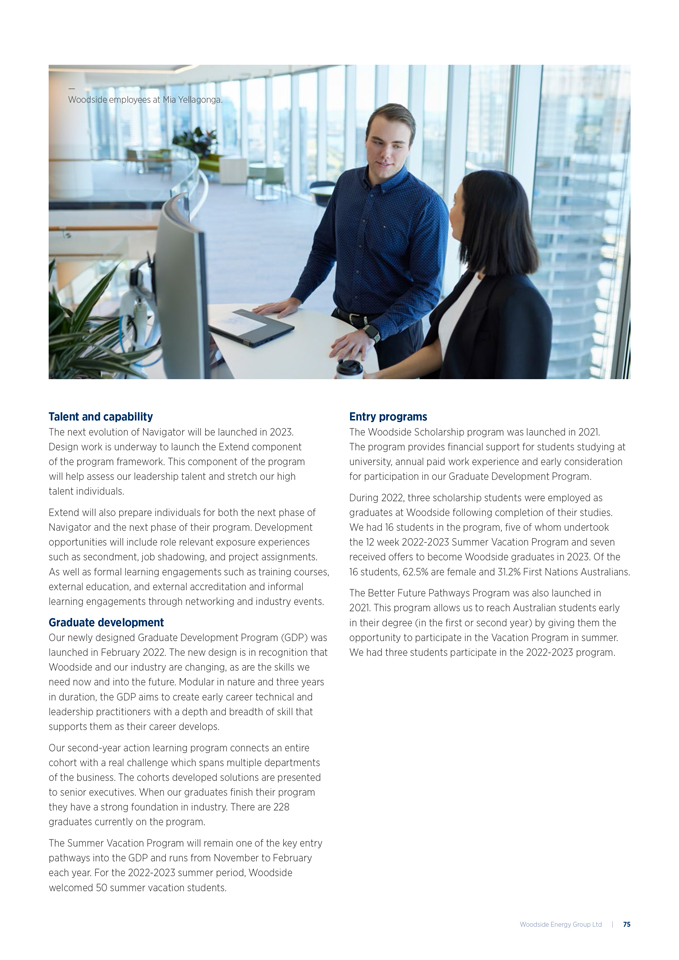
Talent and capability The next evolution of Navigator will be launched in 2023. Design work is underway to launch the Extend component of the program framework. This component of the program will help assess our leadership talent and stretch our high talent individuals. Extend will also prepare individuals for both the next phase of Navigator and the next phase of their program. Development opportunities will include role relevant exposure experiences such as secondment, job shadowing, and project assignments. As well as formal learning engagements such as training courses, external education, and external accreditation and informal learning engagements through networking and industry events. Graduate development Our newly designed Graduate Development Program (GDP) was launched in February 2022. The new design is in recognition that Woodside and our industry are changing, as are the skills we need now and into the future. Modular in nature and three years in duration, the GDP aims to create early career technical and leadership practitioners with a depth and breadth of skill that supports them as their career develops. Our second-year action learning program connects an entire cohort with a real challenge which spans multiple departments of the business. The cohorts developed solutions are presented to senior executives. When our graduates finish their program they have a strong foundation in industry. There are 228 graduates currently on the program. The Summer Vacation Program will remain one of the key entry pathways into the GDP and runs from November to February each year. For the 2022-2023 summer period, Woodside welcomed 50 summer vacation students. Entry programs The Woodside Scholarship program was launched in 2021. The program provides financial support for students studying at university, annual paid work experience and early consideration for participation in our Graduate Development Program. During 2022, three scholarship students were employed as graduates at Woodside following completion of their studies. We had 16 students in the program, five of whom undertook the 12 week 2022-2023 Summer Vacation Program and seven received offers to become Woodside graduates in 2023. Of the 16 students, 62.5% are female and 31.2% First Nations Australians. The Better Future Pathways Program was also launched in 2021. This program allows us to reach Australian students early in their degree (in the first or second year) by giving them the opportunity to participate in the Vacation Program in summer. We had three students participate in the 2022-2023 program. — Woodside employees at Mia Yellagonga. Woodside Energy Group Ltd | 75
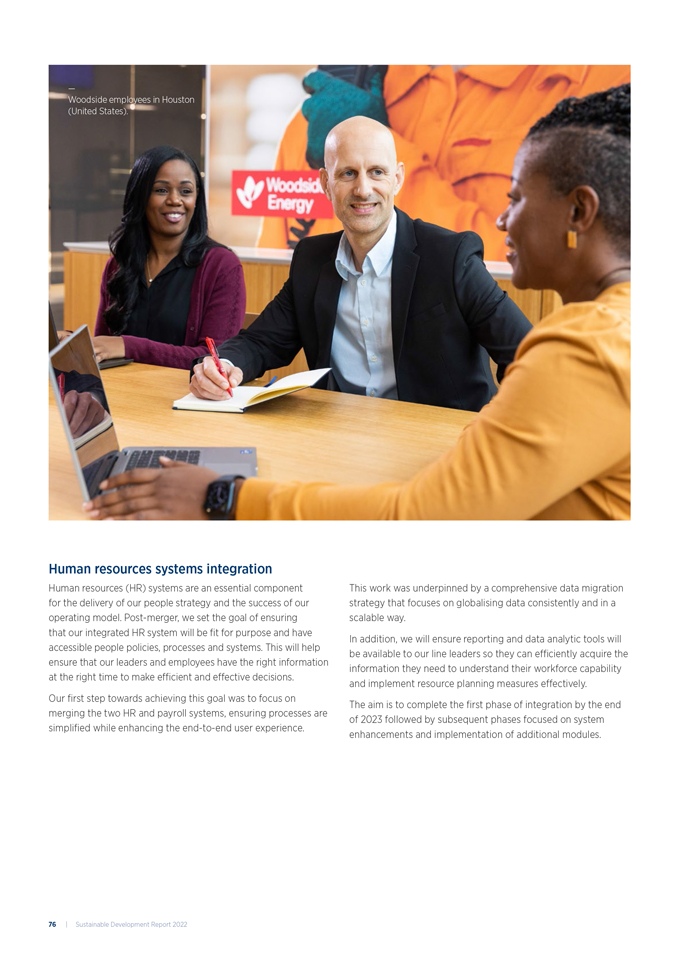
Human resources systems integration Human resources (HR) systems are an essential component for the delivery of our people strategy and the success of our operating model. Post-merger, we set the goal of ensuring that our integrated HR system will be fit for purpose and have accessible people policies, processes and systems. This will help ensure that our leaders and employees have the right information at the right time to make efficient and effective decisions. Our first step towards achieving this goal was to focus on merging the two HR and payroll systems, ensuring processes are simplified while enhancing the end-to-end user experience. This work was underpinned by a comprehensive data migration strategy that focuses on globalising data consistently and in a scalable way. In addition, we will ensure reporting and data analytic tools will be available to our line leaders so they can efficiently acquire the information they need to understand their workforce capability and implement resource planning measures effectively. The aim is to complete the first phase of integration by the end of 2023 followed by subsequent phases focused on system enhancements and implementation of additional modules. — Woodside employees in Houston (United States). 76 | Sustainable Development Report 2022
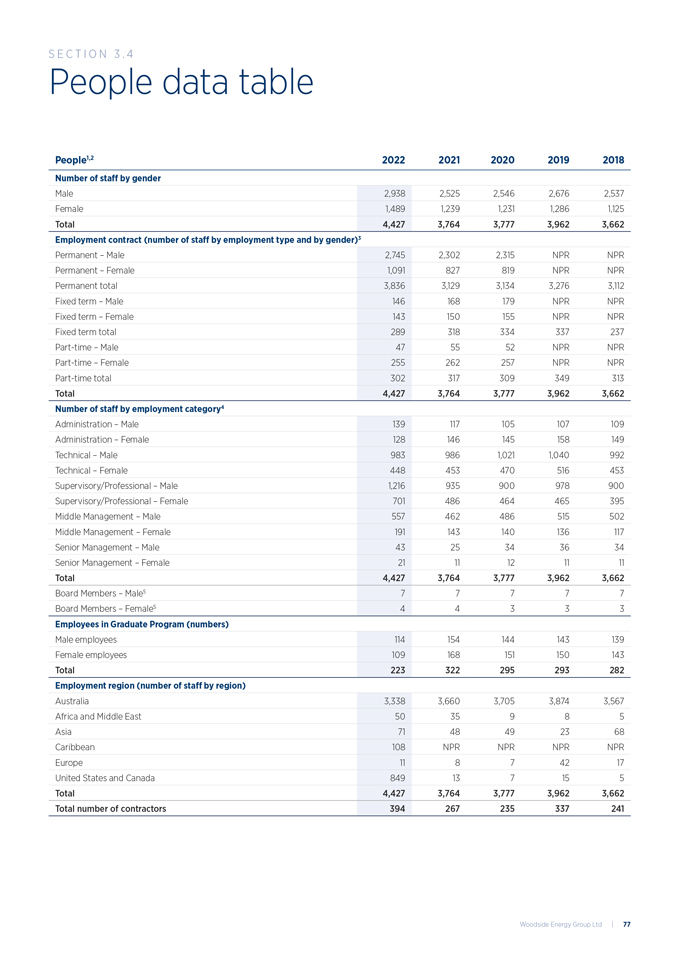
People data table S ection 3 .4 People1,2 2022 2021 2020 2019 2018 Number of staff by gender Male 2,938 2,525 2,546 2,676 2,537 Female 1,489 1,239 1,231 1,286 1,125 Total 4,427 3,764 3,777 3,962 3,662 Employment contract (number of staff by employment type and by gender)3 Permanent – Male 2,745 2,302 2,315 NPR NPR Permanent – Female 1,091 827 819 NPR NPR Permanent total 3,836 3,129 3,134 3,276 3,112 Fixed term – Male 146 168 179 NPR NPR Fixed term – Female 143 150 155 NPR NPR Fixed term total 289 318 334 337 237 Part-time – Male 47 55 52 NPR NPR Part-time – Female 255 262 257 NPR NPR Part-time total 302 317 309 349 313 Total 4,427 3,764 3,777 3,962 3,662 Number of staff by employment category4 Administration – Male 139 117 105 107 109 Administration – Female 128 146 145 158 149 Technical – Male 983 986 1,021 1,040 992 Technical – Female 448 453 470 516 453 Supervisory/Professional – Male 1,216 935 900 978 900 Supervisory/Professional – Female 701 486 464 465 395 Middle Management – Male 557 462 486 515 502 Middle Management – Female 191 143 140 136 117 Senior Management – Male 43 25 34 36 34 Senior Management – Female 21 11 12 11 11 Total 4,427 3,764 3,777 3,962 3,662 Board Members – Male5 7 7 7 7 7 Board Members – Female5 4 4 3 3 3 Employees in Graduate Program (numbers) Male employees 114 154 144 143 139 Female employees 109 168 151 150 143 Total 223 322 295 293 282 Employment region (number of staff by region) Australia 3,338 3,660 3,705 3,874 3,567 Africa and Middle East 50 35 9 8 5 Asia 71 48 49 23 68 Caribbean 108 NPR NPR NPR NPR Europe 11 8 7 42 17 United States and Canada 849 13 7 15 5 Total 4,427 3,764 3,777 3,962 3,662 Total number of contractors 394 267 235 337 241 Woodside Energy Group Ltd | 77
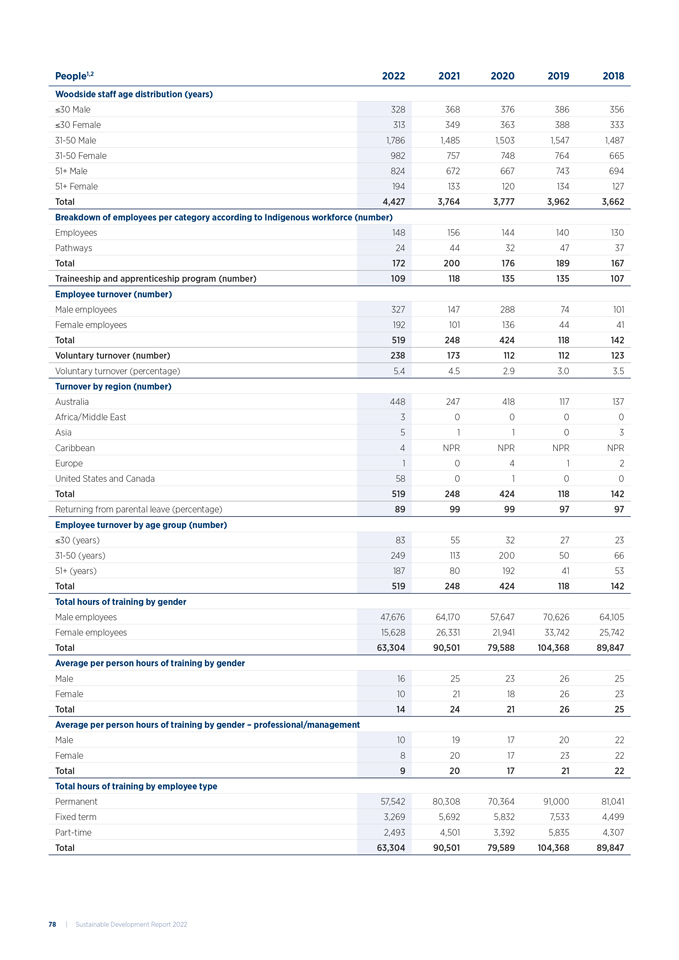
People1,2 2022 2021 2020 2019 2018 Woodside staff age distribution (years) ≤30 Male 328 368 376 386 356 ≤30 Female 313 349 363 388 333 31-50 Male 1,786 1,485 1,503 1,547 1,487 31-50 Female 982 757 748 764 665 51+ Male 824 672 667 743 694 51+ Female 194 133 120 134 127 Total 4,427 3,764 3,777 3,962 3,662 Breakdown of employees per category according to Indigenous workforce (number) Employees 148 156 144 140 130 Pathways 24 44 32 47 37 Total 172 200 176 189 167 Traineeship and apprenticeship program (number) 109 118 135 135 107 Employee turnover (number) Male employees 327 147 288 74 101 Female employees 192 101 136 44 41 Total 519 248 424 118 142 Voluntary turnover (number) 238 173 112 112 123 Voluntary turnover (percentage) 5.4 4.5 2.9 3.0 3.5 Turnover by region (number) Australia 448 247 418 117 137 Africa/Middle East 3 0 0 0 0 Asia 5 1 1 0 3 Caribbean 4 NPR NPR NPR NPR Europe 1 0 4 1 2 United States and Canada 58 0 1 0 0 Total 519 248 424 118 142 Returning from parental leave (percentage) 89 99 99 97 97 Employee turnover by age group (number) ≤30 (years) 83 55 32 27 23 31-50 (years) 249 113 200 50 66 51+ (years) 187 80 192 41 53 Total 519 248 424 118 142 Total hours of training by gender Male employees 47,676 64,170 57,647 70,626 64,105 Female employees 15,628 26,331 21,941 33,742 25,742 Total 63,304 90,501 79,588 104,368 89,847 Average per person hours of training by gender Male 16 25 23 26 25 Female 10 21 18 26 23 Total 14 24 21 26 25 Average per person hours of training by gender – professional/management Male 10 19 17 20 22 Female 8 20 17 23 22 Total 9 20 17 21 22 Total hours of training by employee type Permanent 57,542 80,308 70,364 91,000 81,041 Fixed term 3,269 5,692 5,832 7,533 4,499 Part-time 2,493 4,501 3,392 5,835 4,307 Total 63,304 90,501 79,589 104,368 89,847 78 | Sustainable Development Report 2022
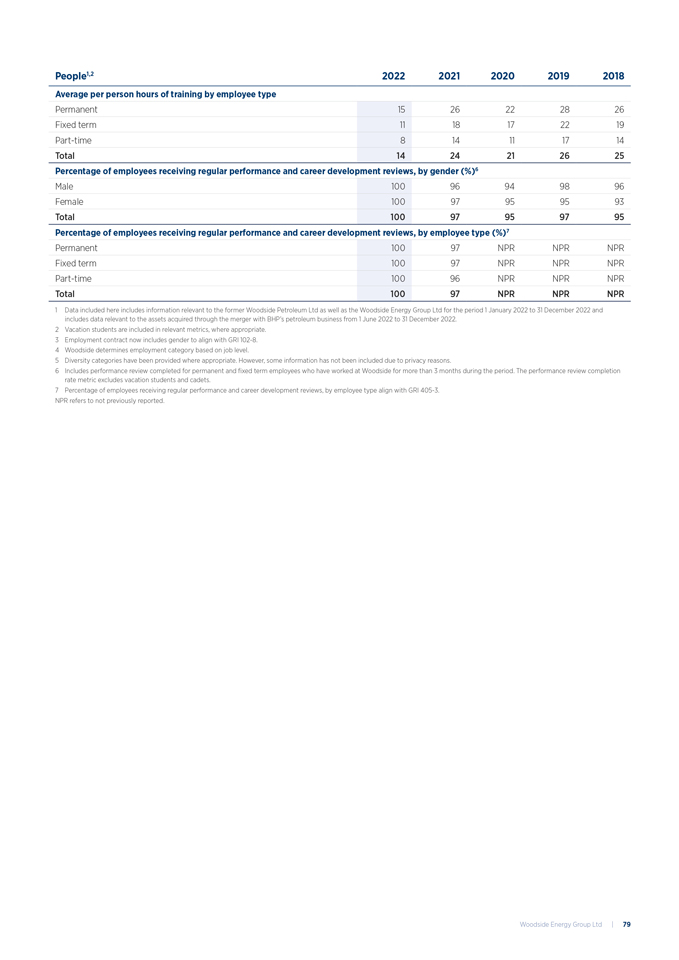
People1,2 2022 2021 2020 2019 2018 Average per person hours of training by employee type Permanent 15 26 22 28 26 Fixed term 11 18 17 22 19 Part-time 8 14 11 17 14 Total 14 24 21 26 25 Percentage of employees receiving regular performance and career development reviews, by gender (%)6 Male 100 96 94 98 96 Female 100 97 95 95 93 Total 100 97 95 97 95 Percentage of employees receiving regular performance and career development reviews, by employee type (%)7 Permanent 100 97 NPR NPR NPR Fixed term 100 97 NPR NPR NPR Part-time 100 96 NPR NPR NPR Total 100 97 NPR NPR NPR 1 Data included here includes information relevant to the former Woodside Petroleum Ltd as well as the Woodside Energy Group Ltd for the period 1 January 2022 to 31 December 2022 and includes data relevant to the assets acquired through the merger with BHP’s petroleum business from 1 June 2022 to 31 December 2022. 2 Vacation students are included in relevant metrics, where appropriate. 3 Employment contract now includes gender to align with GRI 102-8. 4 Woodside determines employment category based on job level. 5 Diversity categories have been provided where appropriate. However, some information has not been included due to privacy reasons. 6 Includes performance review completed for permanent and fixed term employees who have worked at Woodside for more than 3 months during the period. The performance review completion rate metric excludes vacation students and cadets. 7 Percentage of employees receiving regular performance and career development reviews, by employee type align with GRI 405-3. NPR refers to not previously reported. Woodside Energy Group Ltd | 79
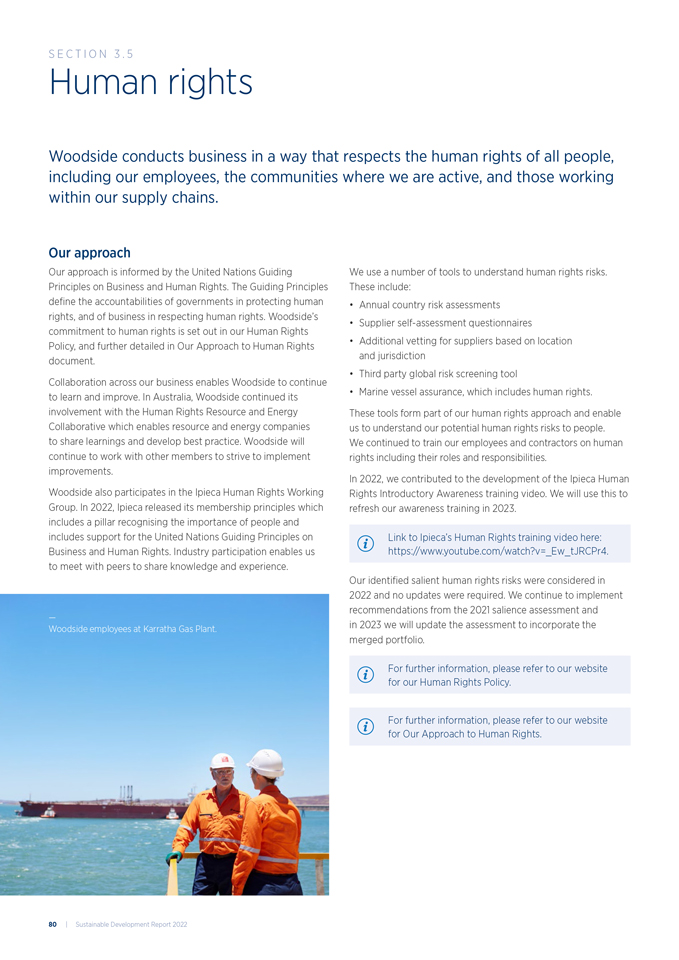
Human rights Woodside conducts business in a way that respects the human rights of all people, including our employees, the communities where we are active, and those working within our supply chains. Our approach Our approach is informed by the United Nations Guiding Principles on Business and Human Rights. The Guiding Principles define the accountabilities of governments in protecting human rights, and of business in respecting human rights. Woodside’s commitment to human rights is set out in our Human Rights Policy, and further detailed in Our Approach to Human Rights document. Collaboration across our business enables Woodside to continue to learn and improve. In Australia, Woodside continued its involvement with the Human Rights Resource and Energy Collaborative which enables resource and energy companies to share learnings and develop best practice. Woodside will continue to work with other members to strive to implement improvements. Woodside also participates in the Ipieca Human Rights Working Group. In 2022, Ipieca released its membership principles which includes a pillar recognising the importance of people and includes support for the United Nations Guiding Principles on Business and Human Rights. Industry participation enables us to meet with peers to share knowledge and experience. We use a number of tools to understand human rights risks. These include: • Annual country risk assessments • Supplier self-assessment questionnaires • Additional vetting for suppliers based on location and jurisdiction • Third party global risk screening tool • Marine vessel assurance, which includes human rights. These tools form part of our human rights approach and enable us to understand our potential human rights risks to people. We continued to train our employees and contractors on human rights including their roles and responsibilities. In 2022, we contributed to the development of the Ipieca Human Rights Introductory Awareness training video. We will use this to refresh our awareness training in 2023. Link to Ipieca’s Human Rights training video here: https://www.youtube.com/watch?v=_Ew_tJRCPr4. Our identified salient human rights risks were considered in 2022 and no updates were required. We continue to implement recommendations from the 2021 salience assessment and in 2023 we will update the assessment to incorporate the merged portfolio. For further information, please refer to our website for our Human Rights Policy. For further information, please refer to our website for Our Approach to Human Rights. — Woodside employees at Karratha Gas Plant. S ection 3 . 5 80 | Sustainable Development Report 2022
Our performance Our multi-disciplinary Human Rights Working Group aspires to meet monthly, during 2022 the group met nine times. This working group reviews existing and potential human rights risks, whilst also sharing trends and lessons learnt. Modern Slavery Statement In 2022, we submitted our second Modern Slavery Statement in accordance with the obligations under the Australian Modern Slavery Act 2018 (Cth). In 2023, we will submit a joint statement under the United Kingdom’s Modern Slavery Act 2015, in addition to our existing Australian requirements. This statement will be published in the first half of 2023. We participated in the review of the Australian Modern Slavery Act 2018, through our involvement in the Human Rights Resource and Energy Collaborative by submitting a joint statement to the review committee. Supply chain We expect our suppliers to also respect human rights and not tolerate the occurrence of modern slavery. We continue to assess supplier human rights related risks through our Supply Chain Modern Slavery Risk Management Framework. The framework is informed by our supplier Code of Conduct, contractual commitments, and internal guidelines. In 2022, we updated our supplier Code of Conduct. This was also reflected in the training, which is required to be conducted by all contracting and procurement staff. We have also commenced the process of deploying training for our entire contracting and procurement team to help manage human rights risks in our supply chain. In 2022, we shadowed our lead Pluto Train 2 contractors whilst undertaking an audit on international fabrication yards, in Batam (Indonesia) and Dubai (United Arab of Emirates). We will continue to seek opportunities to work with our contractors to further understand the supply chain. We will work with the contractors on any findings as part of the audit process. If we identify adverse human rights impacts in our supply chain, we may not immediately terminate the relationship, we will consider whether we play a role in remediation. If the supplier is not receptive to remedying the impact and improving their practices, then we may terminate the relationship. In 2022 we conducted due diligence on the solar panel supply chain, including an independent environment and social governance supply chain consultant desktop review of the industry’s main suppliers and the receipt of traceability information. The due diligence will inform our business decisions related to procurement of solar equipment. Managing security Woodside remains an active member of the Voluntary Principles on Security and Human Rights (VPSHR) initiative. Our VPSHR framework continues to be implemented and matured post merger. It is underpinned by risk assessments, training, management of arrangements with private security providers and, where applicable, arrangements with public security. In 2022, Woodside had no reported or suspected human rights incidents in relation to our activities. In Senegal, we have continued to implement our VPSHR framework ensuring ongoing awareness and safe management of security related human rights. In August, the annual VPSHR conformance assessment of our primary, in country, private security provider was completed. This conformance assessment reinforced a commitment to providing sustainable training to our employees regarding our human rights policy and approach. Woodside complies with Senegalese legislation for offshore oil and gas platforms and vessels, where the continuous presence of an unarmed Senegalese naval officer liaison role must be maintained. Ongoing engagement with the Senegalese Navy and other Senegalese Government authorities has continued throughout 2022, as Woodside works towards a shared understanding of the offshore security environment and potential development of a fit for purpose management framework for maritime risks. Woodside also introduced an online VPSHR training package, which has been successfully tested and implemented with key contractors. Woodside’s online training for VPSHR, developed in 2021 to complement the training programs supplied by private security providers, is now available with the intent to expand the content into additional languages in 2023. Myanmar We have watched the political unrest in Myanmar with concern since the declaration of the state of emergency in February 2021. Our offshore exploration activities have since ceased, and with no producing assets in country, we have reduced our presence. On 27 January 2022, Woodside decided to withdraw its interest in Myanmar. Some formal exit activities continue in 2023 in order to complete Woodside’s exit from the country. Woodside Energy Group Ltd | 81
— Woodside employees at Mia Yellagonga. S ection 4 : GOVERNANCE 82 | Sustainable Development Report 2022
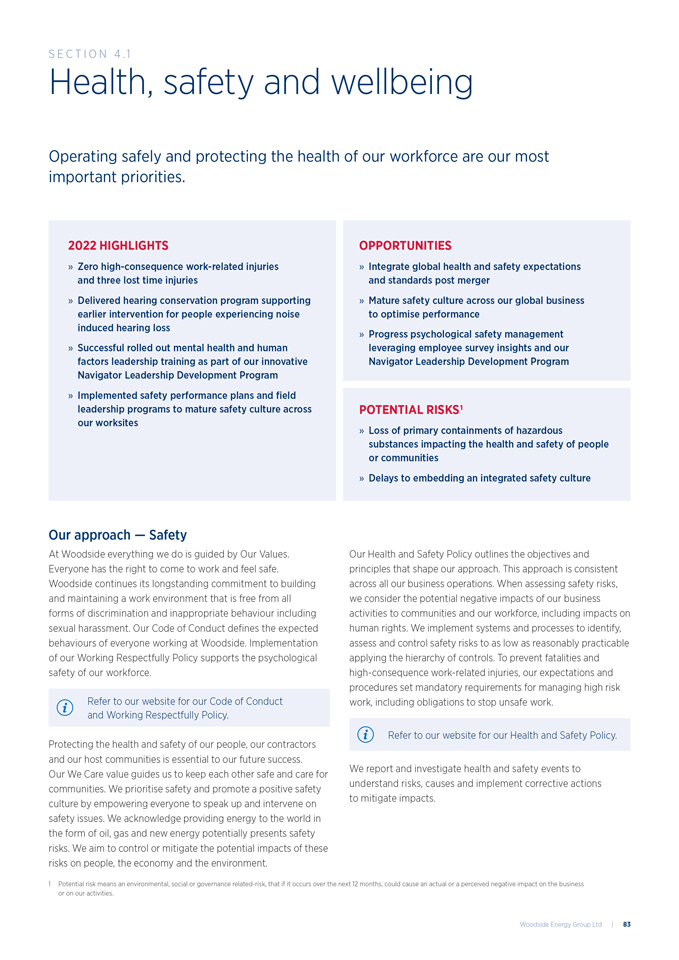
Operating safely and protecting the health of our workforce are our most important priorities. 2022 HIGHLIGHTS » Zero high-consequence work-related injuries and three lost time injuries » Delivered hearing conservation program supporting earlier intervention for people experiencing noise induced hearing loss » Successful rolled out mental health and human factors leadership training as part of our innovative Navigator Leadership Development Program » Implemented safety performance plans and field leadership programs to mature safety culture across our worksites OPPORTUNITIES » Integrate global health and safety expectations and standards post merger » Mature safety culture across our global business to optimise performance » Progress psychological safety management leveraging employee survey insights and our Navigator Leadership Development Program POTENTIAL RISKS1 » Loss of primary containments of hazardous substances impacting the health and safety of people or communities » Delays to embedding an integrated safety culture Our approach — Safety At Woodside everything we do is guided by Our Values. Everyone has the right to come to work and feel safe. Woodside continues its longstanding commitment to building and maintaining a work environment that is free from all forms of discrimination and inappropriate behaviour including sexual harassment. Our Code of Conduct defines the expected behaviours of everyone working at Woodside. Implementation of our Working Respectfully Policy supports the psychological safety of our workforce. Refer to our website for our Code of Conduct and Working Respectfully Policy. Protecting the health and safety of our people, our contractors and our host communities is essential to our future success. Our We Care value guides us to keep each other safe and care for communities. We prioritise safety and promote a positive safety culture by empowering everyone to speak up and intervene on safety issues. We acknowledge providing energy to the world in the form of oil, gas and new energy potentially presents safety risks. We aim to control or mitigate the potential impacts of these risks on people, the economy and the environment. Our Health and Safety Policy outlines the objectives and principles that shape our approach. This approach is consistent across all our business operations. When assessing safety risks, we consider the potential negative impacts of our business activities to communities and our workforce, including impacts on human rights. We implement systems and processes to identify, assess and control safety risks to as low as reasonably practicable applying the hierarchy of controls. To prevent fatalities and high-consequence work-related injuries, our expectations and procedures set mandatory requirements for managing high risk work, including obligations to stop unsafe work. Refer to our website for our Health and Safety Policy. We report and investigate health and safety events to understand risks, causes and implement corrective actions to mitigate impacts. Health, safety and wellbeing 1 Potential risk means an environmental, social or governance related-risk, that if it occurs over the next 12 months, could cause an actual or a perceived negative impact on the business or on our activities. S ection 4 . 1 Woodside Energy Group Ltd | 83
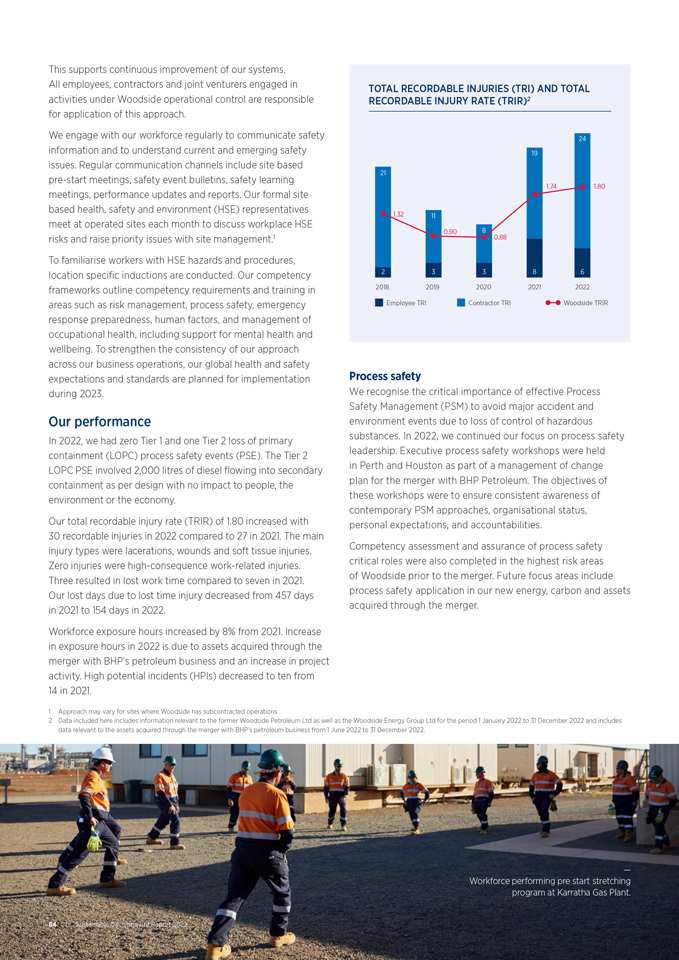
— Workforce performing pre start stretching program at Karratha Gas Plant. This supports continuous improvement of our systems. All employees, contractors and joint venturers engaged in activities under Woodside operational control are responsible for application of this approach. We engage with our workforce regularly to communicate safety information and to understand current and emerging safety issues. Regular communication channels include site based pre-start meetings, safety event bulletins, safety learning meetings, performance updates and reports. Our formal site based health, safety and environment (HSE) representatives meet at operated sites each month to discuss workplace HSE risks and raise priority issues with site management.1 To familiarise workers with HSE hazards and procedures, location specific inductions are conducted. Our competency frameworks outline competency requirements and training in areas such as risk management, process safety, emergency response preparedness, human factors, and management of occupational health, including support for mental health and wellbeing. To strengthen the consistency of our approach across our business operations, our global health and safety expectations and standards are planned for implementation during 2023. Our performance In 2022, we had zero Tier 1 and one Tier 2 loss of primary containment (LOPC) process safety events (PSE). The Tier 2 LOPC PSE involved 2,000 litres of diesel flowing into secondary containment as per design with no impact to people, the environment or the economy. Our total recordable injury rate (TRIR) of 1.80 increased with 30 recordable injuries in 2022 compared to 27 in 2021. The main injury types were lacerations, wounds and soft tissue injuries. Zero injuries were high-consequence work-related injuries. Three resulted in lost work time compared to seven in 2021. Our lost days due to lost time injury decreased from 457 days in 2021 to 154 days in 2022. Workforce exposure hours increased by 8% from 2021. Increase in exposure hours in 2022 is due to assets acquired through the merger with BHP’s petroleum business and an increase in project activity. High potential incidents (HPIs) decreased to ten from 14 in 2021. Process safety We recognise the critical importance of effective Process Safety Management (PSM) to avoid major accident and environment events due to loss of control of hazardous substances. In 2022, we continued our focus on process safety leadership. Executive process safety workshops were held in Perth and Houston as part of a management of change plan for the merger with BHP Petroleum. The objectives of these workshops were to ensure consistent awareness of contemporary PSM approaches, organisational status, personal expectations, and accountabilities. Competency assessment and assurance of process safety critical roles were also completed in the highest risk areas of Woodside prior to the merger. Future focus areas include process safety application in our new energy, carbon and assets acquired through the merger. TOTAL RECORDABLE INJURIES (TRI) AND TOTAL RECORDABLE INJURY RATE (TRIR)2 0.90 2019 3 11 2018 2021 21 2 1.32 2020 3 8 0.88 Employee TRI Contractor TRI Woodside TRIR 1.74 8 19 2022 1.80 6 24 1 Approach may vary for sites where Woodside has subcontracted operations 2 Data included here includes information relevant to the former Woodside Petroleum Ltd as well as the Woodside Energy Group Ltd for the period 1 January 2022 to 31 December 2022 and includes data relevant to the assets acquired through the merger with BHP’s petroleum business from 1 June 2022 to 31 December 2022. 84 | Sustainable Development Report 2022
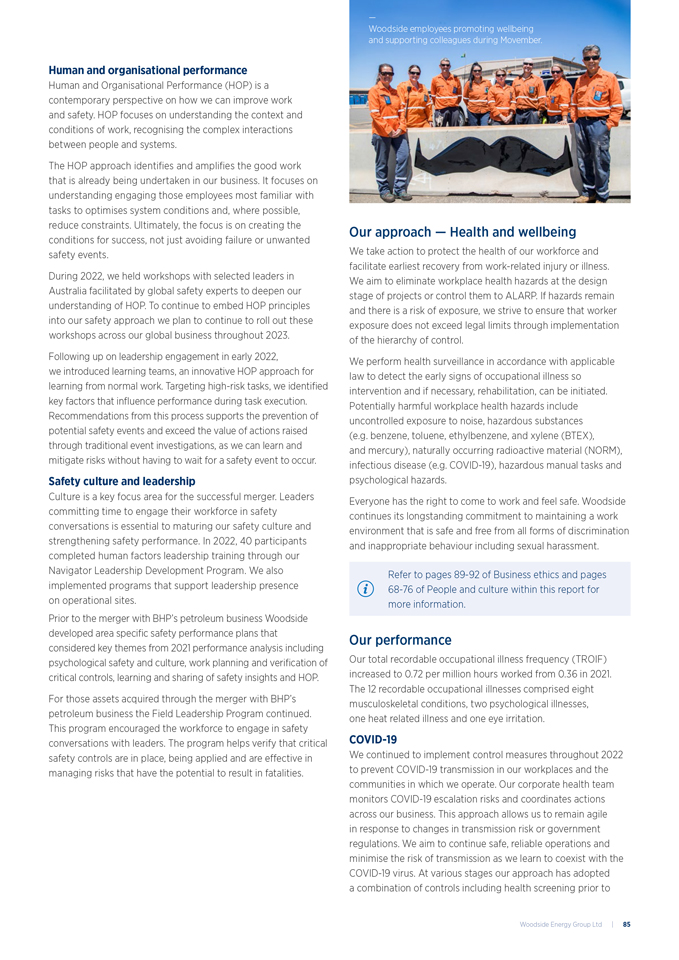
Human and organisational performance Human and Organisational Performance (HOP) is a contemporary perspective on how we can improve work and safety. HOP focuses on understanding the context and conditions of work, recognising the complex interactions between people and systems. The HOP approach identifies and amplifies the good work that is already being undertaken in our business. It focuses on understanding engaging those employees most familiar with tasks to optimises system conditions and, where possible, reduce constraints. Ultimately, the focus is on creating the conditions for success, not just avoiding failure or unwanted safety events. During 2022, we held workshops with selected leaders in Australia facilitated by global safety experts to deepen our understanding of HOP. To continue to embed HOP principles into our safety approach we plan to continue to roll out these workshops across our global business throughout 2023. Following up on leadership engagement in early 2022, we introduced learning teams, an innovative HOP approach for learning from normal work. Targeting high-risk tasks, we identified key factors that influence performance during task execution. Recommendations from this process supports the prevention of potential safety events and exceed the value of actions raised through traditional event investigations, as we can learn and mitigate risks without having to wait for a safety event to occur. Safety culture and leadership Culture is a key focus area for the successful merger. Leaders committing time to engage their workforce in safety conversations is essential to maturing our safety culture and strengthening safety performance. In 2022, 40 participants completed human factors leadership training through our Navigator Leadership Development Program. We also implemented programs that support leadership presence on operational sites. Prior to the merger with BHP’s petroleum business Woodside developed area specific safety performance plans that considered key themes from 2021 performance analysis including psychological safety and culture, work planning and verification of critical controls, learning and sharing of safety insights and HOP. For those assets acquired through the merger with BHP’s petroleum business the Field Leadership Program continued. This program encouraged the workforce to engage in safety conversations with leaders. The program helps verify that critical safety controls are in place, being applied and are effective in managing risks that have the potential to result in fatalities. Our approach — Health and wellbeing We take action to protect the health of our workforce and facilitate earliest recovery from work-related injury or illness. We aim to eliminate workplace health hazards at the design stage of projects or control them to ALARP. If hazards remain and there is a risk of exposure, we strive to ensure that worker exposure does not exceed legal limits through implementation of the hierarchy of control. We perform health surveillance in accordance with applicable law to detect the early signs of occupational illness so intervention and if necessary, rehabilitation, can be initiated. Potentially harmful workplace health hazards include uncontrolled exposure to noise, hazardous substances (e.g. benzene, toluene, ethylbenzene, and xylene (BTEX), and mercury), naturally occurring radioactive material (NORM), infectious disease (e.g. COVID-19), hazardous manual tasks and psychological hazards. Everyone has the right to come to work and feel safe. Woodside continues its longstanding commitment to maintaining a work environment that is safe and free from all forms of discrimination and inappropriate behaviour including sexual harassment. Refer to pages 89-92 of Business ethics and pages 68-76 of People and culture within this report for more information. Our performance Our total recordable occupational illness frequency (TROIF) increased to 0.72 per million hours worked from 0.36 in 2021. The 12 recordable occupational illnesses comprised eight musculoskeletal conditions, two psychological illnesses, one heat related illness and one eye irritation. COVID-19 We continued to implement control measures throughout 2022 to prevent COVID-19 transmission in our workplaces and the communities in which we operate. Our corporate health team monitors COVID-19 escalation risks and coordinates actions across our business. This approach allows us to remain agile in response to changes in transmission risk or government regulations. We aim to continue safe, reliable operations and minimise the risk of transmission as we learn to coexist with the COVID-19 virus. At various stages our approach has adopted a combination of controls including health screening prior to — Woodside employees promoting wellbeing and supporting colleagues during Movember. Woodside Energy Group Ltd | 85
site entry or travel to remote communities, capacity to perform on-site screening and medical response at our operations, leveraging flexible working arrangements and encouraging office workers to work from home, and continued support through our Employee Assistance Program (EAP). Our occupational illness data excludes cases of COVID-19 among our employees and contractors. With high levels of community transmission and an evolving understanding of the epidemiological criteria for infection and COVID-19 variants with evidence of increased transmission, it is difficult to conclude with reasonable certainty that a worker was infected because of work-related activities or exposure. Hearing conservation We recognise that the risk of noise induced hearing loss (NIHL) from exposure to workplace noise is one of our greatest health risks. In 2022, we adopted a consistent approach across global operations. This resulted in a more stringent criteria being applied for hearing testing for our existing Woodside workforce. This improvement helps to identify NIHL cases at the earliest opportunity to support the initiation of intervention to prevent more debilitating illnesses. In 2022, we identified zero cases of NIHL.1 This resulted in a more stringent criteria being applied for hearing testing for our existing Woodside workforce. However, we expect case numbers to increase as implementation of this more stringent criteria continues. We continued our focus on effective hearing protection programs by ensuring people exposed to excessive noise have been fit tested for their hearing protectors. Mental health Promoting wellbeing and protecting the mental health of our workforce was a key priority during the merger with BHP’s petroleum business. We acknowledge the process of merging organisations has created a level of uncertainty for our workforces. We collaborated with culture teams and employee impact groups to implement several initiatives to empower our people through the transition. 1 The process of collecting baseline Audiometric tests for assessment using the updated criteria commenced in 2022. If workers had previous audiometric testing on record the most recent audiometric test prior to 2022 was adopted as the baseline audiogram. New workers and workers without a record have their baseline reset at their next medical. Consistent with our We Care value, we took a holistic approach to wellbeing. We promoted the use of our EAP globally and in Houston, we proactively offered several onsite and virtual support resources to promote career development and financial wellbeing. We also promoted our One Team value by supporting global mental health campaigns including R U OK? Day, World Mental Health Day, and Movember, giving our workforce the education and tools to initiate conversations and support each other. Woodside also continues to partner with and support Lifeline WA with its annual Push Up Challenge and matched giving program. We continue to evolve our wellbeing strategy and framework to ensure a culture of wellbeing is embedded across our global organisation and management of psychosocial hazards is integrated into our approach. Our Navigator Leadership Development Program forms part of our wellbeing strategy. The Navigator Leadership Development Program is designed to equip our leaders with the skills necessary to support a psychologically safe work environment. The program provides capability development and enablement through workshops, multi-day immersions, experiential learning, and group coaching. The core program curriculum focuses on responsible, sustainable and ethical leadership. The mental health leadership component was completed by 105 participants in 2022. For more information on People and culture refer to pages 68-76. Occupational health Our medical assessment process aims to ensure that our workforce demonstrates a capacity for work and that their ongoing health and fitness is assessed at regular intervals. We seek to ensure processes are in place to assist individuals with a temporary or permanent incapacity. Risk assessments are conducted for specific job areas to inform any medical assessments. We aim to ensure the ongoing security and management of all personal information collected in accordance with our Code of Conduct and applicable legal and regulatory requirements through our privacy management process. Health promotion We facilitate access to non-occupational medical and healthcare services through benefits such as gym membership subsidies, wellness reimbursements and health plans. Health related benefits are offered in all locations however they are not uniform in each location and vary by market practise and regulatory requirements. Our fully subsidised EAP provides voluntary access to professional, confidential coaching and support for employees and eligible family members to promote wellbeing. All reporting from our EAP provider is aggregated and — deidentified to maintain confidentiality. R U OK? event in our Houston office. 86 | Sustainable Development Report 2022
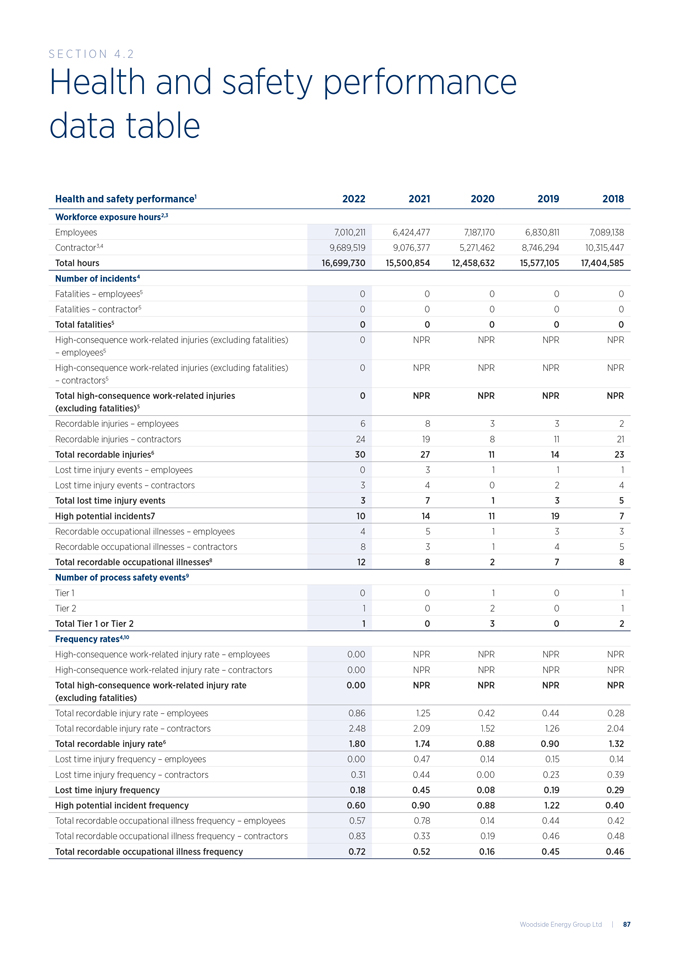
Health and safety performance data table S ection 4 . 2 Health and safety performance1 2022 2021 2020 2019 2018 Workforce exposure hours2,3 Employees 7,010,211 6,424,477 7,187,170 6,830,811 7,089,138 Contractor3,4 9,689,519 9,076,377 5,271,462 8,746,294 10,315,447 Total hours 16,699,730 15,500,854 12,458,632 15,577,105 17,404,585 Number of incidents4 Fatalities – employees5 0 0 0 0 0 Fatalities – contractor5 0 0 0 0 0 Total fatalities5 0 0 0 0 0 High-consequence work-related injuries (excluding fatalities) – employees5 0 NPR NPR NPR NPR High-consequence work-related injuries (excluding fatalities) – contractors5 0 NPR NPR NPR NPR Total high-consequence work-related injuries (excluding fatalities)5 0 NPR NPR NPR NPR Recordable injuries – employees 6 8 3 3 2 Recordable injuries – contractors 24 19 8 11 21 Total recordable injuries6 30 27 11 14 23 Lost time injury events – employees 0 3 1 1 1 Lost time injury events – contractors 3 4 0 2 4 Total lost time injury events 3 7 1 3 5 High potential incidents7 10 14 11 19 7 Recordable occupational illnesses – employees 4 5 1 3 3 Recordable occupational illnesses – contractors 8 3 1 4 5 Total recordable occupational illnesses8 12 8 2 7 8 Number of process safety events9 Tier 1 0 0 1 0 1 Tier 2 1 0 2 0 1 Total Tier 1 or Tier 2 1 0 3 0 2 Frequency rates4,10 High-consequence work-related injury rate – employees 0.00 NPR NPR NPR NPR High-consequence work-related injury rate – contractors 0.00 NPR NPR NPR NPR Total high-consequence work-related injury rate (excluding fatalities) 0.00 NPR NPR NPR NPR Total recordable injury rate – employees 0.86 1.25 0.42 0.44 0.28 Total recordable injury rate – contractors 2.48 2.09 1.52 1.26 2.04 Total recordable injury rate6 1.80 1.74 0.88 0.90 1.32 Lost time injury frequency – employees 0.00 0.47 0.14 0.15 0.14 Lost time injury frequency – contractors 0.31 0.44 0.00 0.23 0.39 Lost time injury frequency 0.18 0.45 0.08 0.19 0.29 High potential incident frequency 0.60 0.90 0.88 1.22 0.40 Total recordable occupational illness frequency – employees 0.57 0.78 0.14 0.44 0.42 Total recordable occupational illness frequency – contractors 0.83 0.33 0.19 0.46 0.48 Total recordable occupational illness frequency 0.72 0.52 0.16 0.45 0.46 Woodside Energy Group Ltd | 87
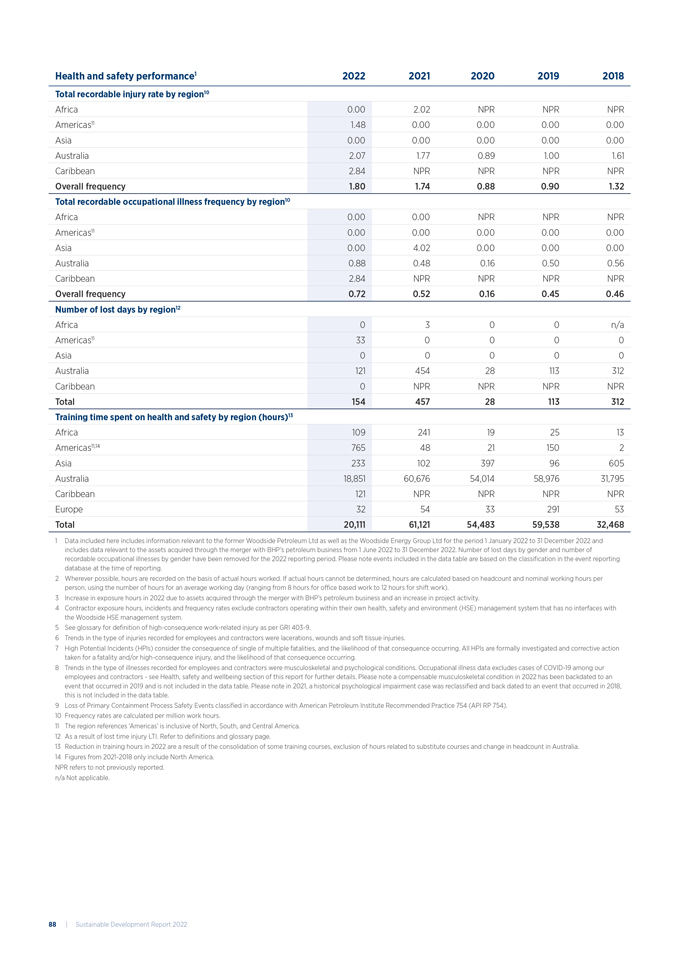
Health and safety performance1 2022 2021 2020 2019 2018 Total recordable injury rate by region10 Africa 0.00 2.02 NPR NPR NPR Americas11 1.48 0.00 0.00 0.00 0.00 Asia 0.00 0.00 0.00 0.00 0.00 Australia 2.07 1.77 0.89 1.00 1.61 Caribbean 2.84 NPR NPR NPR NPR Overall frequency 1.80 1.74 0.88 0.90 1.32 Total recordable occupational illness frequency by region10 Africa 0.00 0.00 NPR NPR NPR Americas11 0.00 0.00 0.00 0.00 0.00 Asia 0.00 4.02 0.00 0.00 0.00 Australia 0.88 0.48 0.16 0.50 0.56 Caribbean 2.84 NPR NPR NPR NPR Overall frequency 0.72 0.52 0.16 0.45 0.46 Number of lost days by region12 Africa 0 3 0 0 n/a Americas11 33 0 0 0 0 Asia 0 0 0 0 0 Australia 121 454 28 113 312 Caribbean 0 NPR NPR NPR NPR Total 154 457 28 113 312 Training time spent on health and safety by region (hours)13 Africa 109 241 19 25 13 Americas11,14 765 48 21 150 2 Asia 233 102 397 96 605 Australia 18,851 60,676 54,014 58,976 31,795 Caribbean 121 NPR NPR NPR NPR Europe 32 54 33 291 53 Total 20,111 61,121 54,483 59,538 32,468 1 Data included here includes information relevant to the former Woodside Petroleum Ltd as well as the Woodside Energy Group Ltd for the period 1 January 2022 to 31 December 2022 and includes data relevant to the assets acquired through the merger with BHP’s petroleum business from 1 June 2022 to 31 December 2022. Number of lost days by gender and number of recordable occupational illnesses by gender have been removed for the 2022 reporting period. Please note events included in the data table are based on the classification in the event reporting database at the time of reporting. 2 Wherever possible, hours are recorded on the basis of actual hours worked. If actual hours cannot be determined, hours are calculated based on headcount and nominal working hours per person, using the number of hours for an average working day (ranging from 8 hours for office based work to 12 hours for shift work). 3 Increase in exposure hours in 2022 due to assets acquired through the merger with BHP’s petroleum business and an increase in project activity. 4 Contractor exposure hours, incidents and frequency rates exclude contractors operating within their own health, safety and environment (HSE) management system that has no interfaces with the Woodside HSE management system. 5 See glossary for definition of high-consequence work-related injury as per GRI 403-9. 6 Trends in the type of injuries recorded for employees and contractors were lacerations, wounds and soft tissue injuries. 7 High Potential Incidents (HPIs) consider the consequence of single of multiple fatalities, and the likelihood of that consequence occurring. All HPIs are formally investigated and corrective action taken for a fatality and/or high-consequence injury, and the likelihood of that consequence occurring. 8 Trends in the type of illnesses recorded for employees and contractors were musculoskeletal and psychological conditions. Occupational illness data excludes cases of COVID-19 among our employees and contractors—see Health, safety and wellbeing section of this report for further details. Please note a compensable musculoskeletal condition in 2022 has been backdated to an event that occurred in 2019 and is not included in the data table. Please note in 2021, a historical psychological impairment case was reclassified and back dated to an event that occurred in 2018, this is not included in the data table. 9 Loss of Primary Containment Process Safety Events classified in accordance with American Petroleum Institute Recommended Practice 754 (API RP 754). 10 Frequency rates are calculated per million work hours. 11 The region references ‘Americas’ is inclusive of North, South, and Central America. 12 As a result of lost time injury LTI. Refer to definitions and glossary page. 13 Reduction in training hours in 2022 are a result of the consolidation of some training courses, exclusion of hours related to substitute courses and change in headcount in Australia. 14 Figures from 2021-2018 only include North America. NPR refers to not previously reported. n/a Not applicable. 88 | Sustainable Development Report 2022
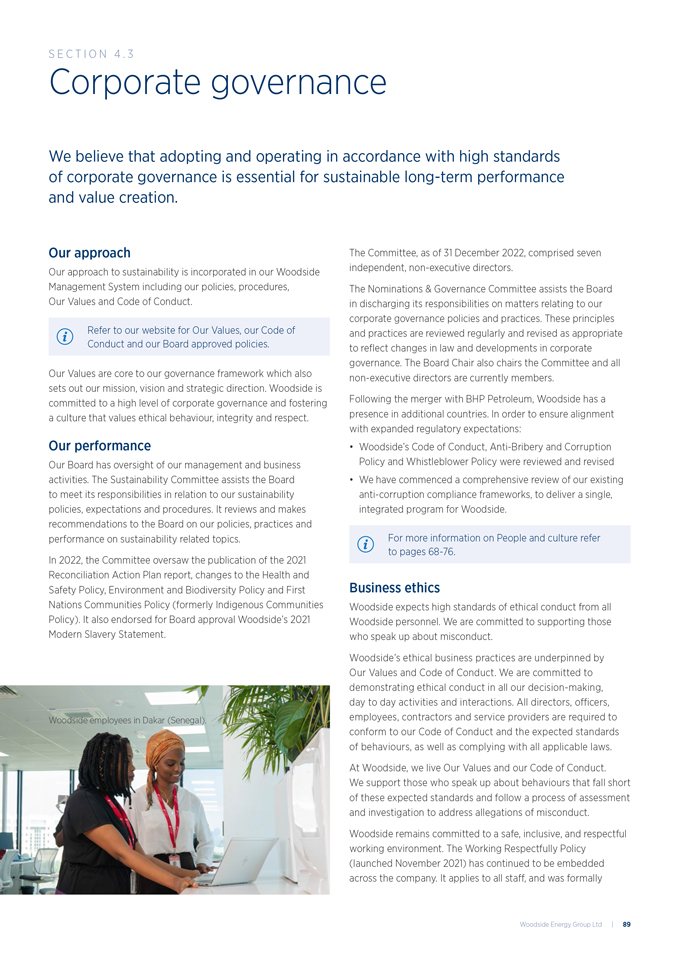
Corporate governance We believe that adopting and operating in accordance with high standards of corporate governance is essential for sustainable long-term performance and value creation. Our approach Our approach to sustainability is incorporated in our Woodside Management System including our policies, procedures, Our Values and Code of Conduct. Refer to our website for Our Values, our Code of Conduct and our Board approved policies. Our Values are core to our governance framework which also sets out our mission, vision and strategic direction. Woodside is committed to a high level of corporate governance and fostering a culture that values ethical behaviour, integrity and respect. Our performance Our Board has oversight of our management and business activities. The Sustainability Committee assists the Board to meet its responsibilities in relation to our sustainability policies, expectations and procedures. It reviews and makes recommendations to the Board on our policies, practices and performance on sustainability related topics. In 2022, the Committee oversaw the publication of the 2021 Reconciliation Action Plan report, changes to the Health and Safety Policy, Environment and Biodiversity Policy and First Nations Communities Policy (formerly Indigenous Communities Policy). It also endorsed for Board approval Woodside’s 2021 Modern Slavery Statement. The Committee, as of 31 December 2022, comprised seven independent, non-executive directors. The Nominations & Governance Committee assists the Board in discharging its responsibilities on matters relating to our corporate governance policies and practices. These principles and practices are reviewed regularly and revised as appropriate to reflect changes in law and developments in corporate governance. The Board Chair also chairs the Committee and all non-executive directors are currently members. Following the merger with BHP Petroleum, Woodside has a presence in additional countries. In order to ensure alignment with expanded regulatory expectations: • Woodside’s Code of Conduct, Anti-Bribery and Corruption Policy and Whistleblower Policy were reviewed and revised • We have commenced a comprehensive review of our existing anti-corruption compliance frameworks, to deliver a single, integrated program for Woodside. For more information on People and culture refer to pages 68-76. Business ethics Woodside expects high standards of ethical conduct from all Woodside personnel. We are committed to supporting those who speak up about misconduct. Woodside’s ethical business practices are underpinned by Our Values and Code of Conduct. We are committed to demonstrating ethical conduct in all our decision-making, day to day activities and interactions. All directors, officers, employees, contractors and service providers are required to conform to our Code of Conduct and the expected standards of behaviours, as well as complying with all applicable laws. At Woodside, we live Our Values and our Code of Conduct. We support those who speak up about behaviours that fall short of these expected standards and follow a process of assessment and investigation to address allegations of misconduct. Woodside remains committed to a safe, inclusive, and respectful working environment. The Working Respectfully Policy (launched November 2021) has continued to be embedded across the company. It applies to all staff, and was formally S ection 4 . 3 — Woodside employees in Dakar (Senegal). Woodside Energy Group Ltd | 89
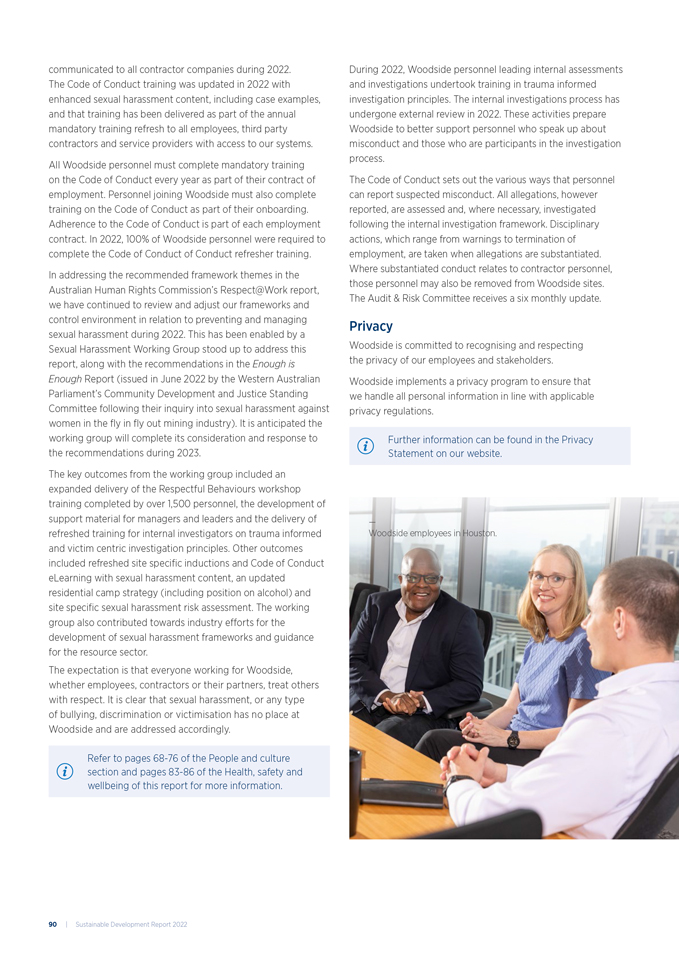
communicated to all contractor companies during 2022. The Code of Conduct training was updated in 2022 with enhanced sexual harassment content, including case examples, and that training has been delivered as part of the annual mandatory training refresh to all employees, third party contractors and service providers with access to our systems. All Woodside personnel must complete mandatory training on the Code of Conduct every year as part of their contract of employment. Personnel joining Woodside must also complete training on the Code of Conduct as part of their onboarding. Adherence to the Code of Conduct is part of each employment contract. In 2022, 100% of Woodside personnel were required to complete the Code of Conduct of Conduct refresher training. In addressing the recommended framework themes in the Australian Human Rights Commission’s Respect@Work report, we have continued to review and adjust our frameworks and control environment in relation to preventing and managing sexual harassment during 2022. This has been enabled by a Sexual Harassment Working Group stood up to address this report, along with the recommendations in the Enough is Enough Report (issued in June 2022 by the Western Australian Parliament’s Community Development and Justice Standing Committee following their inquiry into sexual harassment against women in the fly in fly out mining industry). It is anticipated the working group will complete its consideration and response to the recommendations during 2023. The key outcomes from the working group included an expanded delivery of the Respectful Behaviours workshop training completed by over 1,500 personnel, the development of support material for managers and leaders and the delivery of refreshed training for internal investigators on trauma informed and victim centric investigation principles. Other outcomes included refreshed site specific inductions and Code of Conduct eLearning with sexual harassment content, an updated residential camp strategy (including position on alcohol) and site specific sexual harassment risk assessment. The working group also contributed towards industry efforts for the development of sexual harassment frameworks and guidance for the resource sector. The expectation is that everyone working for Woodside, whether employees, contractors or their partners, treat others with respect. It is clear that sexual harassment, or any type of bullying, discrimination or victimisation has no place at Woodside and are addressed accordingly. Refer to pages 68-76 of the People and culture section and pages 83-86 of the Health, safety and wellbeing of this report for more information. During 2022, Woodside personnel leading internal assessments and investigations undertook training in trauma informed investigation principles. The internal investigations process has undergone external review in 2022. These activities prepare Woodside to better support personnel who speak up about misconduct and those who are participants in the investigation process. The Code of Conduct sets out the various ways that personnel can report suspected misconduct. All allegations, however reported, are assessed and, where necessary, investigated following the internal investigation framework. Disciplinary actions, which range from warnings to termination of employment, are taken when allegations are substantiated. Where substantiated conduct relates to contractor personnel, those personnel may also be removed from Woodside sites. The Audit & Risk Committee receives a six monthly update. Privacy Woodside is committed to recognising and respecting the privacy of our employees and stakeholders. Woodside implements a privacy program to ensure that we handle all personal information in line with applicable privacy regulations. Further information can be found in the Privacy Statement on our website. — Woodside employees in Houston. 90 | Sustainable Development Report 2022
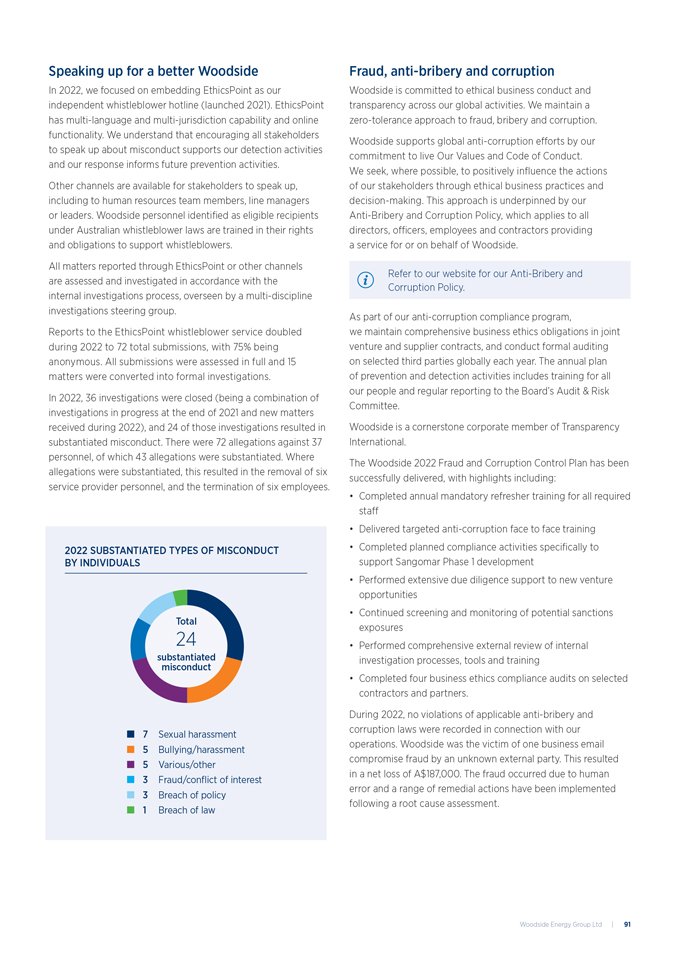
Speaking up for a better Woodside In 2022, we focused on embedding EthicsPoint as our independent whistleblower hotline (launched 2021). EthicsPoint has multi-language and multi-jurisdiction capability and online functionality. We understand that encouraging all stakeholders to speak up about misconduct supports our detection activities and our response informs future prevention activities. Other channels are available for stakeholders to speak up, including to human resources team members, line managers or leaders. Woodside personnel identified as eligible recipients under Australian whistleblower laws are trained in their rights and obligations to support whistleblowers. All matters reported through EthicsPoint or other channels are assessed and investigated in accordance with the internal investigations process, overseen by a multi-discipline investigations steering group. Reports to the EthicsPoint whistleblower service doubled during 2022 to 72 total submissions, with 75% being anonymous. All submissions were assessed in full and 15 matters were converted into formal investigations. In 2022, 36 investigations were closed (being a combination of investigations in progress at the end of 2021 and new matters received during 2022), and 24 of those investigations resulted in substantiated misconduct. There were 72 allegations against 37 personnel, of which 43 allegations were substantiated. Where allegations were substantiated, this resulted in the removal of six service provider personnel, and the termination of six employees. Fraud, anti-bribery and corruption Woodside is committed to ethical business conduct and transparency across our global activities. We maintain a zero-tolerance approach to fraud, bribery and corruption. Woodside supports global anti-corruption efforts by our commitment to live Our Values and Code of Conduct. We seek, where possible, to positively influence the actions of our stakeholders through ethical business practices and decision-making. This approach is underpinned by our Anti-Bribery and Corruption Policy, which applies to all directors, officers, employees and contractors providing a service for or on behalf of Woodside. Refer to our website for our Anti-Bribery and Corruption Policy. As part of our anti-corruption compliance program, we maintain comprehensive business ethics obligations in joint venture and supplier contracts, and conduct formal auditing on selected third parties globally each year. The annual plan of prevention and detection activities includes training for all our people and regular reporting to the Board’s Audit & Risk Committee. Woodside is a cornerstone corporate member of Transparency International. The Woodside 2022 Fraud and Corruption Control Plan has been successfully delivered, with highlights including: • Completed annual mandatory refresher training for all required staff • Delivered targeted anti-corruption face to face training • Completed planned compliance activities specifically to support Sangomar Phase 1 development • Performed extensive due diligence support to new venture opportunities • Continued screening and monitoring of potential sanctions exposures • Performed comprehensive external review of internal investigation processes, tools and training • Completed four business ethics compliance audits on selected contractors and partners. During 2022, no violations of applicable anti-bribery and corruption laws were recorded in connection with our operations. Woodside was the victim of one business email compromise fraud by an unknown external party. This resulted in a net loss of A$187,000. The fraud occurred due to human error and a range of remedial actions have been implemented following a root cause assessment. 2022 SUBSTANTIATED TYPES OF MISCONDUCT BY INDIVIDUALS Total 24 substantiated misconduct 7 Sexual harassment 5 Bullying/harassment 5 Various/other 3 Fraud/conflict of interest 3 Breach of policy 1 Breach of law Woodside Energy Group Ltd | 91
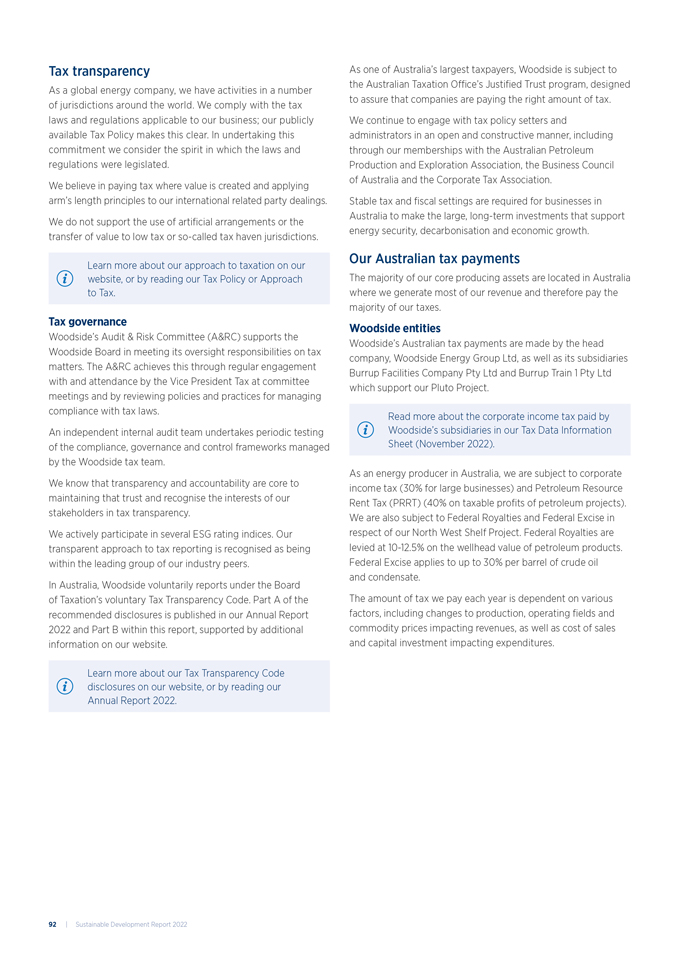
Tax transparency As a global energy company, we have activities in a number of jurisdictions around the world. We comply with the tax laws and regulations applicable to our business; our publicly available Tax Policy makes this clear. In undertaking this commitment we consider the spirit in which the laws and regulations were legislated. We believe in paying tax where value is created and applying arm’s length principles to our international related party dealings. We do not support the use of artificial arrangements or the transfer of value to low tax or so-called tax haven jurisdictions. Learn more about our approach to taxation on our website, or by reading our Tax Policy or Approach to Tax. Tax governance Woodside’s Audit & Risk Committee (A&RC) supports the Woodside Board in meeting its oversight responsibilities on tax matters. The A&RC achieves this through regular engagement with and attendance by the Vice President Tax at committee meetings and by reviewing policies and practices for managing compliance with tax laws. An independent internal audit team undertakes periodic testing of the compliance, governance and control frameworks managed by the Woodside tax team. We know that transparency and accountability are core to maintaining that trust and recognise the interests of our stakeholders in tax transparency. We actively participate in several ESG rating indices. Our transparent approach to tax reporting is recognised as being within the leading group of our industry peers. In Australia, Woodside voluntarily reports under the Board of Taxation’s voluntary Tax Transparency Code. Part A of the recommended disclosures is published in our Annual Report 2022 and Part B within this report, supported by additional information on our website. Learn more about our Tax Transparency Code disclosures on our website, or by reading our Annual Report 2022. As one of Australia’s largest taxpayers, Woodside is subject to the Australian Taxation Office’s Justified Trust program, designed to assure that companies are paying the right amount of tax. We continue to engage with tax policy setters and administrators in an open and constructive manner, including through our memberships with the Australian Petroleum Production and Exploration Association, the Business Council of Australia and the Corporate Tax Association. Stable tax and fiscal settings are required for businesses in Australia to make the large, long-term investments that support energy security, decarbonisation and economic growth. Our Australian tax payments The majority of our core producing assets are located in Australia where we generate most of our revenue and therefore pay the majority of our taxes. Woodside entities Woodside’s Australian tax payments are made by the head company, Woodside Energy Group Ltd, as well as its subsidiaries Burrup Facilities Company Pty Ltd and Burrup Train 1 Pty Ltd which support our Pluto Project. Read more about the corporate income tax paid by Woodside’s subsidiaries in our Tax Data Information Sheet (November 2022). As an energy producer in Australia, we are subject to corporate income tax (30% for large businesses) and Petroleum Resource Rent Tax (PRRT) (40% on taxable profits of petroleum projects). We are also subject to Federal Royalties and Federal Excise in respect of our North West Shelf Project. Federal Royalties are levied at 10-12.5% on the wellhead value of petroleum products. Federal Excise applies to up to 30% per barrel of crude oil and condensate. The amount of tax we pay each year is dependent on various factors, including changes to production, operating fields and commodity prices impacting revenues, as well as cost of sales and capital investment impacting expenditures. 92 | Sustainable Development Report 2022
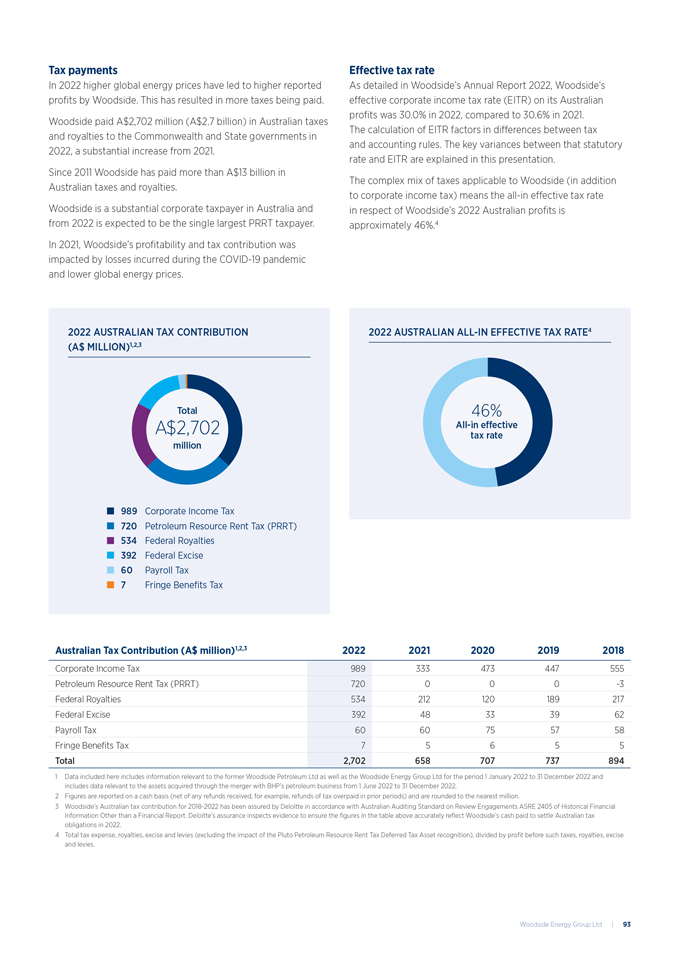
Tax payments In 2022 higher global energy prices have led to higher reported profits by Woodside. This has resulted in more taxes being paid. Woodside paid A$2,702 million (A$2.7 billion) in Australian taxes and royalties to the Commonwealth and State governments in 2022, a substantial increase from 2021. Since 2011 Woodside has paid more than A$13 billion in Australian taxes and royalties. Woodside is a substantial corporate taxpayer in Australia and from 2022 is expected to be the single largest PRRT taxpayer. In 2021, Woodside’s profitability and tax contribution was impacted by losses incurred during the COVID-19 pandemic and lower global energy prices. Effective tax rate As detailed in Woodside’s Annual Report 2022, Woodside’s effective corporate income tax rate (EITR) on its Australian profits was 30.0% in 2022, compared to 30.6% in 2021. The calculation of EITR factors in differences between tax and accounting rules. The key variances between that statutory rate and EITR are explained in this presentation. The complex mix of taxes applicable to Woodside (in addition to corporate income tax) means the all-in effective tax rate in respect of Woodside’s 2022 Australian profits is approximately 46%.4 Australian Tax Contribution (A$ million)1,2,3 2022 2021 2020 2019 2018 Corporate Income Tax 989 333 473 447 555 Petroleum Resource Rent Tax (PRRT) 720 0 0 0 -3 Federal Royalties 534 212 120 189 217 Federal Excise 392 48 33 39 62 Payroll Tax 60 60 75 57 58 Fringe Benefits Tax 7 5 6 5 5 Total 2,702 658 707 737 894 1 Data included here includes information relevant to the former Woodside Petroleum Ltd as well as the Woodside Energy Group Ltd for the period 1 January 2022 to 31 December 2022 and includes data relevant to the assets acquired through the merger with BHP’s petroleum business from 1 June 2022 to 31 December 2022. 2 Figures are reported on a cash basis (net of any refunds received, for example, refunds of tax overpaid in prior periods) and are rounded to the nearest million. 3 Woodside’s Australian tax contribution for 2018-2022 has been assured by Deloitte in accordance with Australian Auditing Standard on Review Engagements ASRE 2405 of Historical Financial Information Other than a Financial Report. Deloitte’s assurance inspects evidence to ensure the figures in the table above accurately reflect Woodside’s cash paid to settle Australian tax obligations in 2022. 4 Total tax expense, royalties, excise and levies (excluding the impact of the Pluto Petroleum Resource Rent Tax Deferred Tax Asset recognition), divided by profit before such taxes, royalties, excise and levies. 2022 AUSTRALIAN TAX CONTRIBUTION (A$ MILLION)1,2,3 Total A$2,702 million 989 Corporate Income Tax 720 Petroleum Resource Rent Tax (PRRT) 534 Federal Royalties 392 Federal Excise 60 Payroll Tax 7 Fringe Benefits Tax 2022 AUSTRALIAN ALL-IN EFFECTIVE TAX RATE4 46% All-in e_ective tax rate Woodside Energy Group Ltd | 93
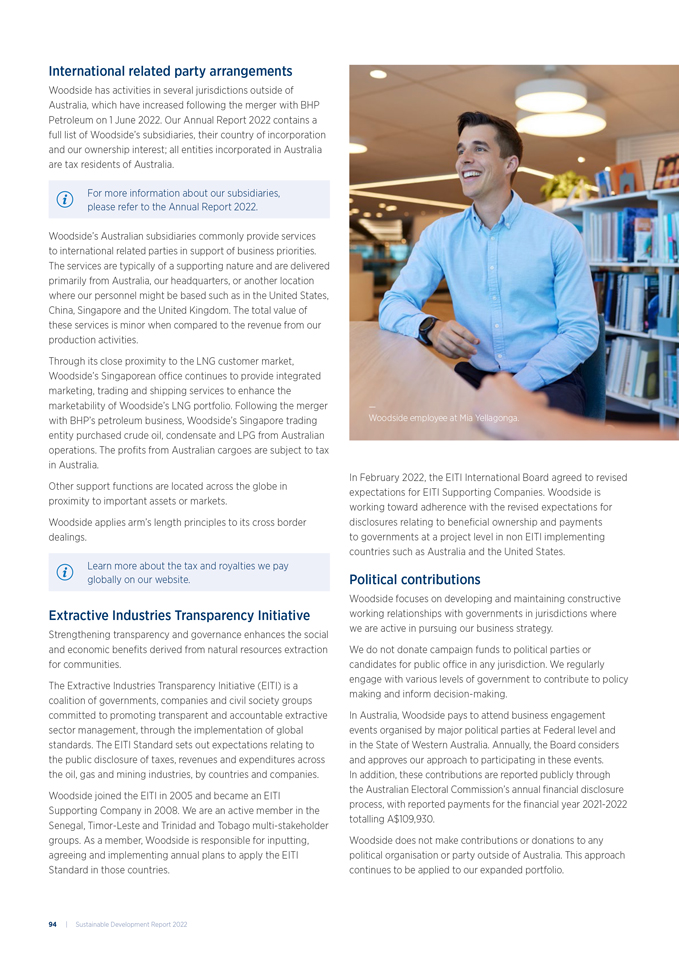
International related party arrangements Woodside has activities in several jurisdictions outside of Australia, which have increased following the merger with BHP Petroleum on 1 June 2022. Our Annual Report 2022 contains a full list of Woodside’s subsidiaries, their country of incorporation and our ownership interest; all entities incorporated in Australia are tax residents of Australia. For more information about our subsidiaries, please refer to the Annual Report 2022. Woodside’s Australian subsidiaries commonly provide services to international related parties in support of business priorities. The services are typically of a supporting nature and are delivered primarily from Australia, our headquarters, or another location where our personnel might be based such as in the United States, China, Singapore and the United Kingdom. The total value of these services is minor when compared to the revenue from our production activities. Through its close proximity to the LNG customer market, Woodside’s Singaporean office continues to provide integrated marketing, trading and shipping services to enhance the marketability of Woodside’s LNG portfolio. Following the merger with BHP’s petroleum business, Woodside’s Singapore trading entity purchased crude oil, condensate and LPG from Australian operations. The profits from Australian cargoes are subject to tax in Australia. Other support functions are located across the globe in proximity to important assets or markets. Woodside applies arm’s length principles to its cross border dealings. Learn more about the tax and royalties we pay globally on our website. Extractive Industries Transparency Initiative Strengthening transparency and governance enhances the social and economic benefits derived from natural resources extraction for communities. The Extractive Industries Transparency Initiative (EITI) is a coalition of governments, companies and civil society groups committed to promoting transparent and accountable extractive sector management, through the implementation of global standards. The EITI Standard sets out expectations relating to the public disclosure of taxes, revenues and expenditures across the oil, gas and mining industries, by countries and companies. Woodside joined the EITI in 2005 and became an EITI Supporting Company in 2008. We are an active member in the Senegal, Timor-Leste and Trinidad and Tobago multi-stakeholder groups. As a member, Woodside is responsible for inputting, agreeing and implementing annual plans to apply the EITI Standard in those countries. In February 2022, the EITI International Board agreed to revised expectations for EITI Supporting Companies. Woodside is working toward adherence with the revised expectations for disclosures relating to beneficial ownership and payments to governments at a project level in non EITI implementing countries such as Australia and the United States. Political contributions Woodside focuses on developing and maintaining constructive working relationships with governments in jurisdictions where we are active in pursuing our business strategy. We do not donate campaign funds to political parties or candidates for public office in any jurisdiction. We regularly engage with various levels of government to contribute to policy making and inform decision-making. In Australia, Woodside pays to attend business engagement events organised by major political parties at Federal level and in the State of Western Australia. Annually, the Board considers and approves our approach to participating in these events. In addition, these contributions are reported publicly through the Australian Electoral Commission’s annual financial disclosure process, with reported payments for the financial year 2021-2022 totalling A$109,930. Woodside does not make contributions or donations to any political organisation or party outside of Australia. This approach continues to be applied to our expanded portfolio. — Woodside employee at Mia Yellagonga. 94 | Sustainable Development Report 2022
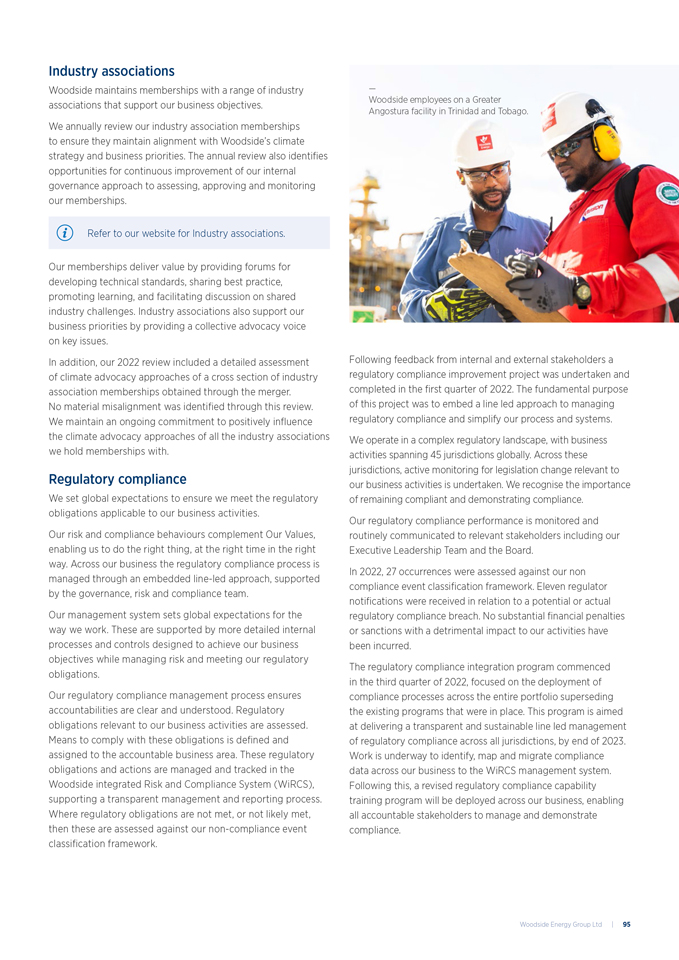
Industry associations Woodside maintains memberships with a range of industry associations that support our business objectives. We annually review our industry association memberships to ensure they maintain alignment with Woodside’s climate strategy and business priorities. The annual review also identifies opportunities for continuous improvement of our internal governance approach to assessing, approving and monitoring our memberships. Refer to our website for Industry associations. Our memberships deliver value by providing forums for developing technical standards, sharing best practice, promoting learning, and facilitating discussion on shared industry challenges. Industry associations also support our business priorities by providing a collective advocacy voice on key issues. In addition, our 2022 review included a detailed assessment of climate advocacy approaches of a cross section of industry association memberships obtained through the merger. No material misalignment was identified through this review. We maintain an ongoing commitment to positively influence the climate advocacy approaches of all the industry associations we hold memberships with. Regulatory compliance We set global expectations to ensure we meet the regulatory obligations applicable to our business activities. Our risk and compliance behaviours complement Our Values, enabling us to do the right thing, at the right time in the right way. Across our business the regulatory compliance process is managed through an embedded line-led approach, supported by the governance, risk and compliance team. Our management system sets global expectations for the way we work. These are supported by more detailed internal processes and controls designed to achieve our business objectives while managing risk and meeting our regulatory obligations. Our regulatory compliance management process ensures accountabilities are clear and understood. Regulatory obligations relevant to our business activities are assessed. Means to comply with these obligations is defined and assigned to the accountable business area. These regulatory obligations and actions are managed and tracked in the Woodside integrated Risk and Compliance System (WiRCS), supporting a transparent management and reporting process. Where regulatory obligations are not met, or not likely met, then these are assessed against our non-compliance event classification framework. Following feedback from internal and external stakeholders a regulatory compliance improvement project was undertaken and completed in the first quarter of 2022. The fundamental purpose of this project was to embed a line led approach to managing regulatory compliance and simplify our process and systems. We operate in a complex regulatory landscape, with business activities spanning 45 jurisdictions globally. Across these jurisdictions, active monitoring for legislation change relevant to our business activities is undertaken. We recognise the importance of remaining compliant and demonstrating compliance. Our regulatory compliance performance is monitored and routinely communicated to relevant stakeholders including our Executive Leadership Team and the Board. In 2022, 27 occurrences were assessed against our non compliance event classification framework. Eleven regulator notifications were received in relation to a potential or actual regulatory compliance breach. No substantial financial penalties or sanctions with a detrimental impact to our activities have been incurred. The regulatory compliance integration program commenced in the third quarter of 2022, focused on the deployment of compliance processes across the entire portfolio superseding the existing programs that were in place. This program is aimed at delivering a transparent and sustainable line led management of regulatory compliance across all jurisdictions, by end of 2023. Work is underway to identify, map and migrate compliance data across our business to the WiRCS management system. Following this, a revised regulatory compliance capability training program will be deployed across our business, enabling all accountable stakeholders to manage and demonstrate compliance. — Woodside employees on a Greater Angostura facility in Trinidad and Tobago. Woodside Energy Group Ltd | 95
Cybersecurity Responding to widespread and sustained cyber attacks and preventing breaches requires vigilance, layered security controls and a cyber aware mindset across Woodside. 1 Any observable occurrence in a user’s activities, system, and/or network. Events can be used to identify indicators of attack. Our approach Woodside’s approach to cybersecurity remains multi-faceted and dynamic to reflect the changing cyber threat landscape. Our cyber program includes focusing on securely connecting Operational Technology and tightly managing, verifying and assuring the vital systems. We have built a strong internal cyber capability that aims to protect our people, assets and information, and we collaborate with peers, government and our partners to ensure that we build and maintain the right culture, processes and tools. Following the merger with BHP petroleum’s business, we are establishing a United States cyber hub and a global response capability. Our performance Woodside reported three events to the Australian Cyber Security Centre (ACSC) in 2022.1 These were voluntary reports providing information to the ACSC as the events did not result in any actual cyber incidents. Woodside responded to an increased number of cyber related events in 2022, with none causing any substantial business impact. External assessments and increased cyber maturity Woodside participated in the Australian Cyber Security Centre’s Critical Infrastructure Uplift (CI-UP) pilot program. CI-UP included assessing our controls against the United States Department of Energy Cybersecurity Capability Maturity Model and the Australian Signals Directorate Essential Eight. We reported our cybersecurity maturity for Information Technology and Operational Technology to the Australian Energy Market Operator for a second year, achieving improved maturity indicator levels in both domains. Woodside maintains a watching brief on new legislation in the countries where we operate. We anticipate increased governmental focus on compliance to help prevent the loss or theft of sensitive information. Operational Technology Cyber Security Incident Response Team The Operational Technology Cyber Security Incident Response Team (CSIRT) capability is based on Woodside’s mature Information Technology CSIRT model and continues to be extended with the intent to be able to detect and respond rapidly, effectively and consistently to cyber incidents across our Operational Technology environment. The Operational Technology CSIRT team is given the same priority as the assets’ traditional emergency response capabilities in the event of a cyber event. This enables recovery of Operational Technology systems as quickly as possible to limit any health, safety, environmental or financial impacts. Cyber awareness A company wide refresh and expansion of cyber education and awareness was implemented in 2022. Fundamental training for all Woodside personnel was refreshed and aligned to current threats, privacy risks and best practices. Targeted role based training was developed for all Information Technology Administrators to ensure their competency when working in our digital ecosystem. Tailored threat based briefings were delivered to senior leaders, executives and directors that gave context to current cyber threats and protective controls enabled across the environment. Organisation wide events for Cybersecurity Awareness Month in October promoted four key cyber practices our workforce could take into their personal digital lives to uplift security. Woodside’s Audit & Risk Committee of the Board has direct oversight of cybersecurity matters including evolving risk and business considerations. For more information please see section 3.8 Risk Factors and section 4.1.2 Corporate Governance of the Annual Report 2022. S ection 4 .4 96 | Sustainable Development Report 2022
Major incident preparedness Whilst prevention of major incidents is key, our capability to respond to and recover from major incidents is a regulatory and licence to operate requirement. Our approach Woodside maintains a comprehensive and integrated all hazards approach to major incident preparedness by applying the emergency risk management philosophy to prevent, prepare for, respond to and recover from major incident events. Focusing on the protection of our people, the environment, our assets, reputation and livelihood, Woodside maintains a tiered response framework, providing scalability and measured escalation to incidents or crises. These arrangements enable the organisation to act swiftly, proportionately and safely to incidents, aiming to preserve business continuity and return impacted assets to normal or near normal conditions as soon as possible following the event. Our performance During 2022, whilst our crisis emergency management arrangements were not activated for any major incidents, our focus on preparedness remained high. Woodside preparedness activities included: Operational Assets (level one teams) • Weekly training activities, focusing on major incident event and environmental scenarios. Corporate Incident Coordination Centre (level two teams) • Eight level two practical deployment exercises, in collaboration with operational assets. • Weekly skills maintenance training sessions, focusing on a range of domestic and international themed scenarios. • Six Corporate Incident Coordination Centre (CICC) courses delivered, resulting in 66 new CICC members. Crisis Management Team (level three team) • One crisis exercise, focusing on strategic implications of a major oil spill incident. Global approach During 2022 Woodside increased its global resources and capabilities in order to respond to a major incident across our global portfolio noting our expanded global presence following the merger with BHP’s petroleum business. In 2023, our approach will continue to be monitored and refined as necessary. Planned 2023 activities: In 2023, we plan to undertake the activities outlined below. Work will continue on company incident management frameworks to develop a common Incident Management Framework. The Incident Management Framework will not only deliver a common system, language, naming conventions and processes, but will facilitate a truly global and collaborative capability to respond to major incidents across our global activities and time zones. We will also broaden the Gulf of Mexico (GOM) Incident Management Team (IMT), into a Houston Incident Management Team. This project is expected to effectively broaden the scope of the existing GOM IMT, which is currently focused primarily on GOM based operational assets, to provide an all hazards response capability supporting all assets, office locations and risks throughout the Americas and Africa Region. Capability development framework redesign will continue with actions underway for the progression of company incident management frameworks. The resulting training framework is expected to deliver a fit for risk program, to ensure our response personnel are prepared to respond to major incidents. Work will also continue on Company Crisis and Emergency Management and Hydrocarbon Spill Preparedness Assurance programs into a common, fit for purpose, global assurance program. Delivery of Crisis and Emergency Management projects, coupled with the ongoing execution of our standard preparedness program, Woodside remains ready and capable to collaboratively respond to and recover from major incidents across our global activities and time zones. S ection 4 . 5 Woodside Energy Group Ltd | 97

Section 5 : APPENDICES — Woodside employees at Mia Yellagonga. 98 | Sustainable Development Report 2022
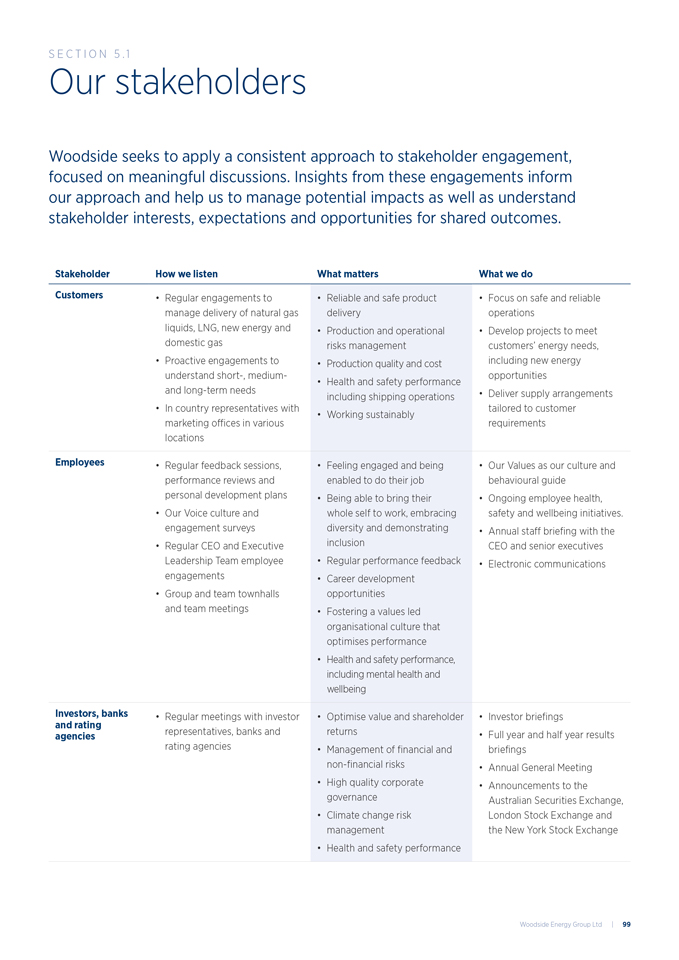
Our stakeholders Woodside seeks to apply a consistent approach to stakeholder engagement, focused on meaningful discussions. Insights from these engagements inform our approach and help us to manage potential impacts as well as understand stakeholder interests, expectations and opportunities for shared outcomes. Stakeholder How we listen What matters What we do Customers • Regular engagements to manage delivery of natural gas liquids, LNG, new energy and domestic gas • Proactive engagements to understand short-, mediumand long-term needs • In country representatives with marketing offices in various locations • Reliable and safe product delivery • Production and operational risks management • Production quality and cost • Health and safety performance including shipping operations • Working sustainably • Focus on safe and reliable operations • Develop projects to meet customers’ energy needs, including new energy opportunities • Deliver supply arrangements tailored to customer requirements Employees • Regular feedback sessions, performance reviews and personal development plans • Our Voice culture and engagement surveys • Regular CEO and Executive Leadership Team employee engagements • Group and team townhalls and team meetings • Feeling engaged and being enabled to do their job • Being able to bring their whole self to work, embracing diversity and demonstrating inclusion • Regular performance feedback • Career development opportunities • Fostering a values led organisational culture that optimises performance • Health and safety performance, including mental health and wellbeing • Our Values as our culture and behavioural guide • Ongoing employee health, safety and wellbeing initiatives. • Annual staff briefing with the CEO and senior executives • Electronic communications Investors, banks and rating agencies • Regular meetings with investor representatives, banks and rating agencies • Optimise value and shareholder returns • Management of financial and non-financial risks • High quality corporate governance • Climate change risk management • Health and safety performance • Investor briefings • Full year and half year results briefings • Annual General Meeting • Announcements to the Australian Securities Exchange, London Stock Exchange and the New York Stock Exchange S ection 5 . 1 Woodside Energy Group Ltd | 99
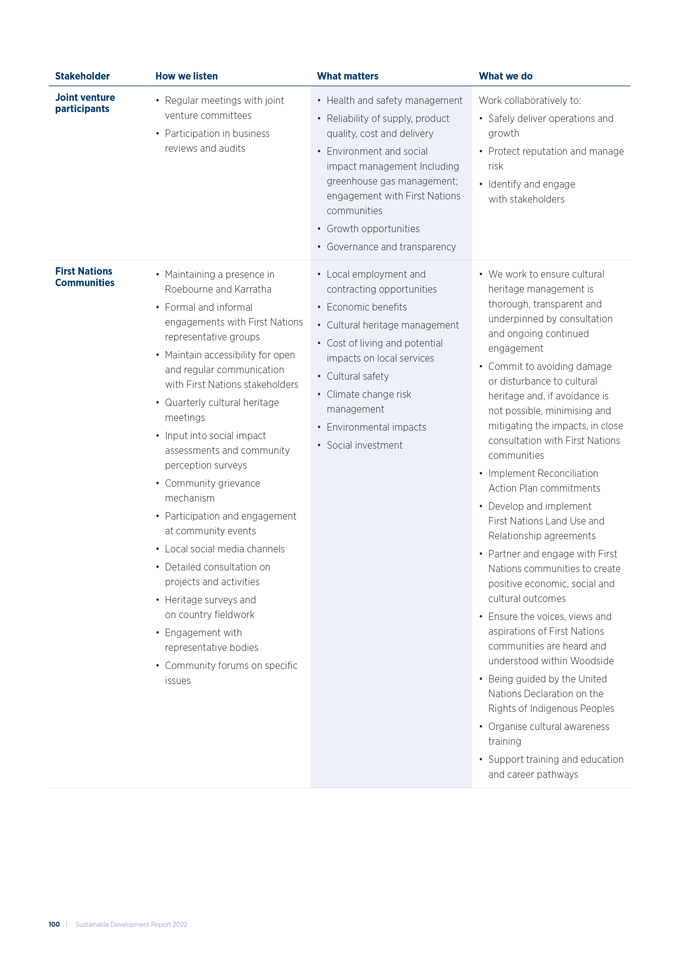
Stakeholder How we listen What matters What we do Joint venture participants • Regular meetings with joint venture committees • Participation in business reviews and audits • Health and safety management • Reliability of supply, product quality, cost and delivery • Environment and social impact management Including greenhouse gas management; engagement with First Nations communities • Growth opportunities • Governance and transparency Work collaboratively to: • Safely deliver operations and growth • Protect reputation and manage risk • Identify and engage with stakeholders First Nations Communities • Maintaining a presence in Roebourne and Karratha • Formal and informal engagements with First Nations representative groups • Maintain accessibility for open and regular communication with First Nations stakeholders • Quarterly cultural heritage meetings • Input into social impact assessments and community perception surveys • Community grievance mechanism • Participation and engagement at community events • Local social media channels • Detailed consultation on projects and activities • Heritage surveys and on country fieldwork • Engagement with representative bodies • Community forums on specific issues • Local employment and contracting opportunities • Economic benefits • Cultural heritage management • Cost of living and potential impacts on local services • Cultural safety • Climate change risk management • Environmental impacts • Social investment • We work to ensure cultural heritage management is thorough, transparent and underpinned by consultation and ongoing continued engagement • Commit to avoiding damage or disturbance to cultural heritage and, if avoidance is not possible, minimising and mitigating the impacts, in close consultation with First Nations communities • Implement Reconciliation Action Plan commitments • Develop and implement First Nations Land Use and Relationship agreements • Partner and engage with First Nations communities to create positive economic, social and cultural outcomes • Ensure the voices, views and aspirations of First Nations communities are heard and understood within Woodside • Being guided by the United Nations Declaration on the Rights of Indigenous Peoples • Organise cultural awareness training • Support training and education and career pathways 100 | Sustainable Development Report 2022
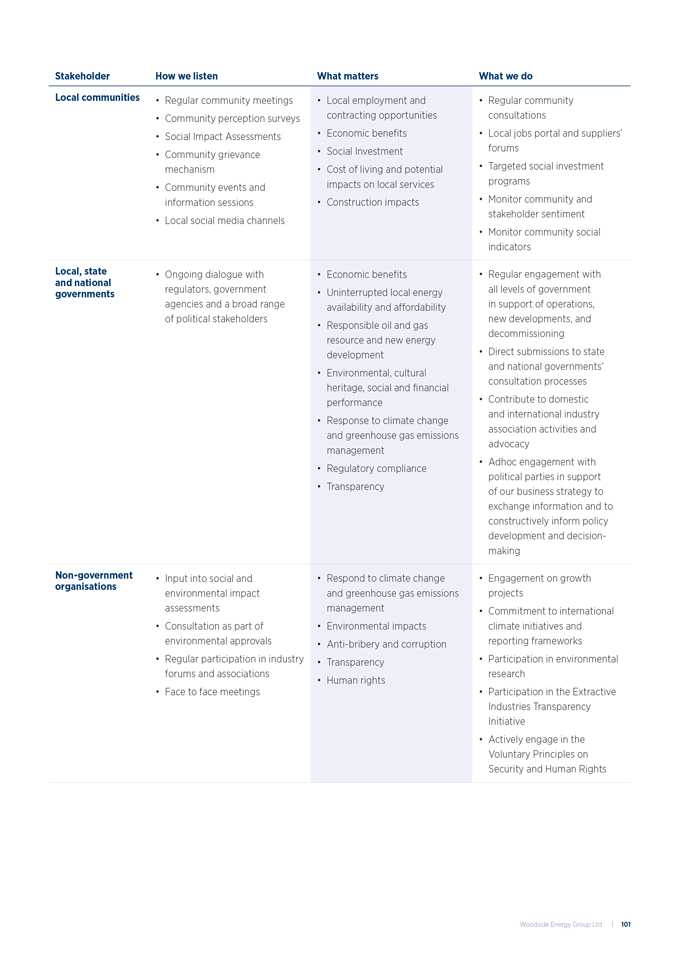
Stakeholder How we listen What matters What we do Local communities • Regular community meetings • Community perception surveys • Social Impact Assessments • Community grievance mechanism • Community events and information sessions • Local social media channels • Local employment and contracting opportunities • Economic benefits • Social Investment • Cost of living and potential impacts on local services • Construction impacts • Regular community consultations • Local jobs portal and suppliers’ forums • Targeted social investment programs • Monitor community and stakeholder sentiment • Monitor community social indicators Local, state and national governments • Ongoing dialogue with regulators, government agencies and a broad range of political stakeholders • Economic benefits • Uninterrupted local energy availability and affordability • Responsible oil and gas resource and new energy development • Environmental, cultural heritage, social and financial performance • Response to climate change and greenhouse gas emissions management • Regulatory compliance • Transparency • Regular engagement with all levels of government in support of operations, new developments, and decommissioning • Direct submissions to state and national governments’ consultation processes • Contribute to domestic and international industry association activities and advocacy • Adhoc engagement with political parties in support of our business strategy to exchange information and to constructively inform policy development and decisionmaking Non-government organisations • Input into social and environmental impact assessments • Consultation as part of environmental approvals • Regular participation in industry forums and associations • Face to face meetings • Respond to climate change and greenhouse gas emissions management • Environmental impacts • Anti-bribery and corruption • Transparency • Human rights • Engagement on growth projects • Commitment to international climate initiatives and reporting frameworks • Participation in environmental research • Participation in the Extractive Industries Transparency Initiative • Actively engage in the Voluntary Principles on Security and Human Rights Woodside Energy Group Ltd | 101
Stakeholder How we listen What matters What we do Suppliers and contractors • Supplier networking events and Contractor Forums • Workshops with local business networks • Regular reciprocal supplier performance reviews • Tender debrief and feedback sessions • Embedded supplier relationship management with our tier one suppliers • Supply opportunities for growth projects • Sustainable long-term opportunities beyond Construction phase into Operations • Health and safety • On time payment of invoices • Visibility of work plans and look ahead • Supporting First Nations and local contractors • Collaborate to deliver tangible safety improvements • Provide supplier forums for growth projects • Implementation of invoice payment cycle time improvements • Increased visibility and sharing of forward work plans • Collaborate to ensure First Nations engagement outcomes • Support programs to develop local business capacity and capability — Woodside employees in Houston. 102 | Sustainable Development Report 2022
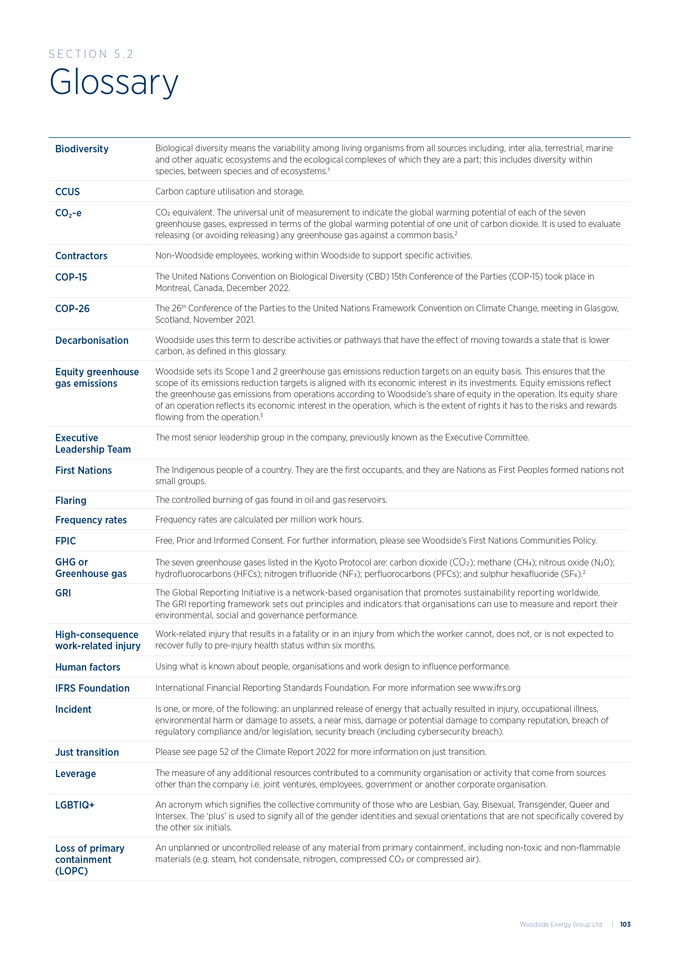
Glossary Biodiversity Biological diversity means the variability among living organisms from all sources including, inter alia, terrestrial, marine and other aquatic ecosystems and the ecological complexes of which they are a part; this includes diversity within species, between species and of ecosystems.1 CCUS Carbon capture utilisation and storage. COâ,,-e CO2 equivalent. The universal unit of measurement to indicate the global warming potential of each of the seven greenhouse gases, expressed in terms of the global warming potential of one unit of carbon dioxide. It is used to evaluate releasing (or avoiding releasing) any greenhouse gas against a common basis.2 Contractors Non-Woodside employees, working within Woodside to support specific activities. COP-15 The United Nations Convention on Biological Diversity (CBD) 15th Conference of the Parties (COP-15) took place in Montreal, Canada, December 2022. COP-26 The 26th Conference of the Parties to the United Nations Framework Convention on Climate Change, meeting in Glasgow, Scotland, November 2021. Decarbonisation Woodside uses this term to describe activities or pathways that have the effect of moving towards a state that is lower carbon, as defined in this glossary. Equity greenhouse gas emissions Woodside sets its Scope 1 and 2 greenhouse gas emissions reduction targets on an equity basis. This ensures that the scope of its emissions reduction targets is aligned with its economic interest in its investments. Equity emissions reflect the greenhouse gas emissions from operations according to Woodside’s share of equity in the operation. Its equity share of an operation reflects its economic interest in the operation, which is the extent of rights it has to the risks and rewards flowing from the operation.3 Executive Leadership Team The most senior leadership group in the company, previously known as the Executive Committee. First Nations The Indigenous people of a country. They are the first occupants, and they are Nations as First Peoples formed nations not small groups. Flaring The controlled burning of gas found in oil and gas reservoirs. Frequency rates Frequency rates are calculated per million work hours. FPIC Free, Prior and Informed Consent. For further information, please see Woodside’s First Nations Communities Policy. GHG or Greenhouse gas The seven greenhouse gases listed in the Kyoto Protocol are: carbon dioxide (CO2); methane (CH4); nitrous oxide (N20); hydrofluorocarbons (HFCs); nitrogen trifluoride (NF3); perfluorocarbons (PFCs); and sulphur hexafluoride (SF6).2 GRI The Global Reporting Initiative is a network-based organisation that promotes sustainability reporting worldwide. The GRI reporting framework sets out principles and indicators that organisations can use to measure and report their environmental, social and governance performance. High-consequence work-related injury Work-related injury that results in a fatality or in an injury from which the worker cannot, does not, or is not expected to recover fully to pre-injury health status within six months. Human factors Using what is known about people, organisations and work design to influence performance. IFRS Foundation International Financial Reporting Standards Foundation. For more information see www.ifrs.org Incident Is one, or more, of the following: an unplanned release of energy that actually resulted in injury, occupational illness, environmental harm or damage to assets, a near miss, damage or potential damage to company reputation, breach of regulatory compliance and/or legislation, security breach (including cybersecurity breach). Just transition Please see page 52 of the Climate Report 2022 for more information on just transition. Leverage The measure of any additional resources contributed to a community organisation or activity that come from sources other than the company i.e. joint ventures, employees, government or another corporate organisation. LGBTIQ+ An acronym which signifies the collective community of those who are Lesbian, Gay, Bisexual, Transgender, Queer and Intersex. The ‘plus’ is used to signify all of the gender identities and sexual orientations that are not specifically covered by the other six initials. Loss of primary containment (LOPC) An unplanned or uncontrolled release of any material from primary containment, including non-toxic and non-flammable materials (e.g. steam, hot condensate, nitrogen, compressed CO2 or compressed air). S ection 5 . 2 Woodside Energy Group Ltd | 103
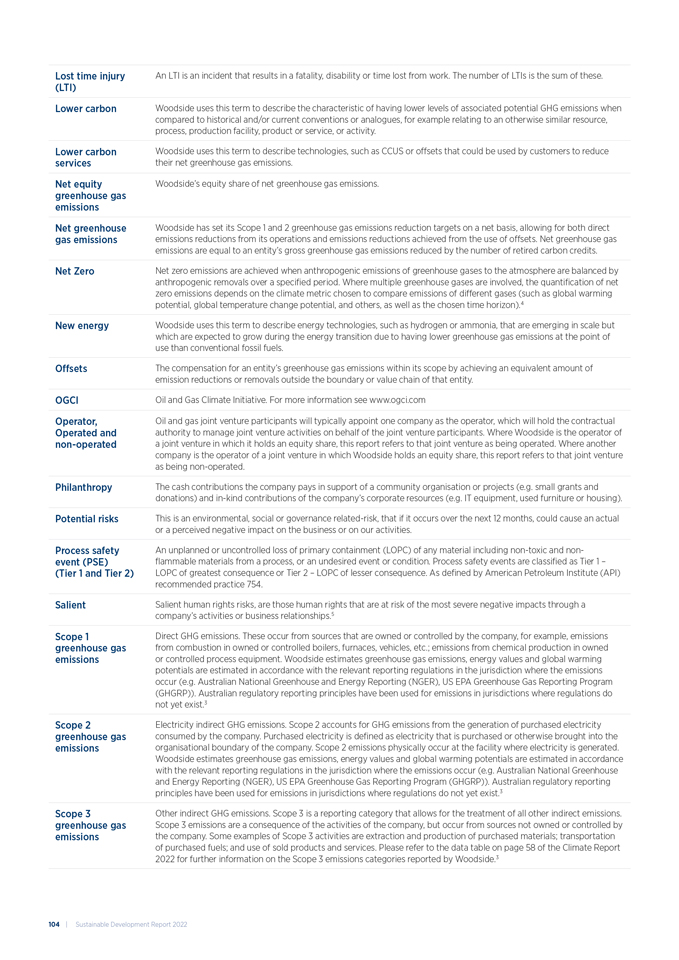
Lost time injury (LTI) An LTI is an incident that results in a fatality, disability or time lost from work. The number of LTIs is the sum of these. Lower carbon Woodside uses this term to describe the characteristic of having lower levels of associated potential GHG emissions when compared to historical and/or current conventions or analogues, for example relating to an otherwise similar resource, process, production facility, product or service, or activity. Lower carbon services Woodside uses this term to describe technologies, such as CCUS or offsets that could be used by customers to reduce their net greenhouse gas emissions. Net equity greenhouse gas emissions Woodside’s equity share of net greenhouse gas emissions. Net greenhouse gas emissions Woodside has set its Scope 1 and 2 greenhouse gas emissions reduction targets on a net basis, allowing for both direct emissions reductions from its operations and emissions reductions achieved from the use of offsets. Net greenhouse gas emissions are equal to an entity’s gross greenhouse gas emissions reduced by the number of retired carbon credits. Net Zero Net zero emissions are achieved when anthropogenic emissions of greenhouse gases to the atmosphere are balanced by anthropogenic removals over a specified period. Where multiple greenhouse gases are involved, the quantification of net zero emissions depends on the climate metric chosen to compare emissions of different gases (such as global warming potential, global temperature change potential, and others, as well as the chosen time horizon).4 New energy Woodside uses this term to describe energy technologies, such as hydrogen or ammonia, that are emerging in scale but which are expected to grow during the energy transition due to having lower greenhouse gas emissions at the point of use than conventional fossil fuels. Offsets The compensation for an entity’s greenhouse gas emissions within its scope by achieving an equivalent amount of emission reductions or removals outside the boundary or value chain of that entity. OGCI Oil and Gas Climate Initiative. For more information see www.ogci.com Operator, Operated and non-operated Oil and gas joint venture participants will typically appoint one company as the operator, which will hold the contractual authority to manage joint venture activities on behalf of the joint venture participants. Where Woodside is the operator of a joint venture in which it holds an equity share, this report refers to that joint venture as being operated. Where another company is the operator of a joint venture in which Woodside holds an equity share, this report refers to that joint venture as being non-operated. Philanthropy The cash contributions the company pays in support of a community organisation or projects (e.g. small grants and donations) and in-kind contributions of the company’s corporate resources (e.g. IT equipment, used furniture or housing). Potential risks This is an environmental, social or governance related-risk, that if it occurs over the next 12 months, could cause an actual or a perceived negative impact on the business or on our activities. Process safety event (PSE) (Tier 1 and Tier 2) An unplanned or uncontrolled loss of primary containment (LOPC) of any material including non-toxic and nonflammable materials from a process, or an undesired event or condition. Process safety events are classified as Tier 1 – LOPC of greatest consequence or Tier 2 – LOPC of lesser consequence. As defined by American Petroleum Institute (API) recommended practice 754. Salient Salient human rights risks, are those human rights that are at risk of the most severe negative impacts through a company’s activities or business relationships.5 Scope 1 greenhouse gas emissions Direct GHG emissions. These occur from sources that are owned or controlled by the company, for example, emissions from combustion in owned or controlled boilers, furnaces, vehicles, etc.; emissions from chemical production in owned or controlled process equipment. Woodside estimates greenhouse gas emissions, energy values and global warming potentials are estimated in accordance with the relevant reporting regulations in the jurisdiction where the emissions occur (e.g. Australian National Greenhouse and Energy Reporting (NGER), US EPA Greenhouse Gas Reporting Program (GHGRP)). Australian regulatory reporting principles have been used for emissions in jurisdictions where regulations do not yet exist.3 Scope 2 greenhouse gas emissions Electricity indirect GHG emissions. Scope 2 accounts for GHG emissions from the generation of purchased electricity consumed by the company. Purchased electricity is defined as electricity that is purchased or otherwise brought into the organisational boundary of the company. Scope 2 emissions physically occur at the facility where electricity is generated. Woodside estimates greenhouse gas emissions, energy values and global warming potentials are estimated in accordance with the relevant reporting regulations in the jurisdiction where the emissions occur (e.g. Australian National Greenhouse and Energy Reporting (NGER), US EPA Greenhouse Gas Reporting Program (GHGRP)). Australian regulatory reporting principles have been used for emissions in jurisdictions where regulations do not yet exist.3 Scope 3 greenhouse gas emissions Other indirect GHG emissions. Scope 3 is a reporting category that allows for the treatment of all other indirect emissions. Scope 3 emissions are a consequence of the activities of the company, but occur from sources not owned or controlled by the company. Some examples of Scope 3 activities are extraction and production of purchased materials; transportation of purchased fuels; and use of sold products and services. Please refer to the data table on page 58 of the Climate Report 2022 for further information on the Scope 3 emissions categories reported by Woodside.3 104 | Sustainable Development Report 2022
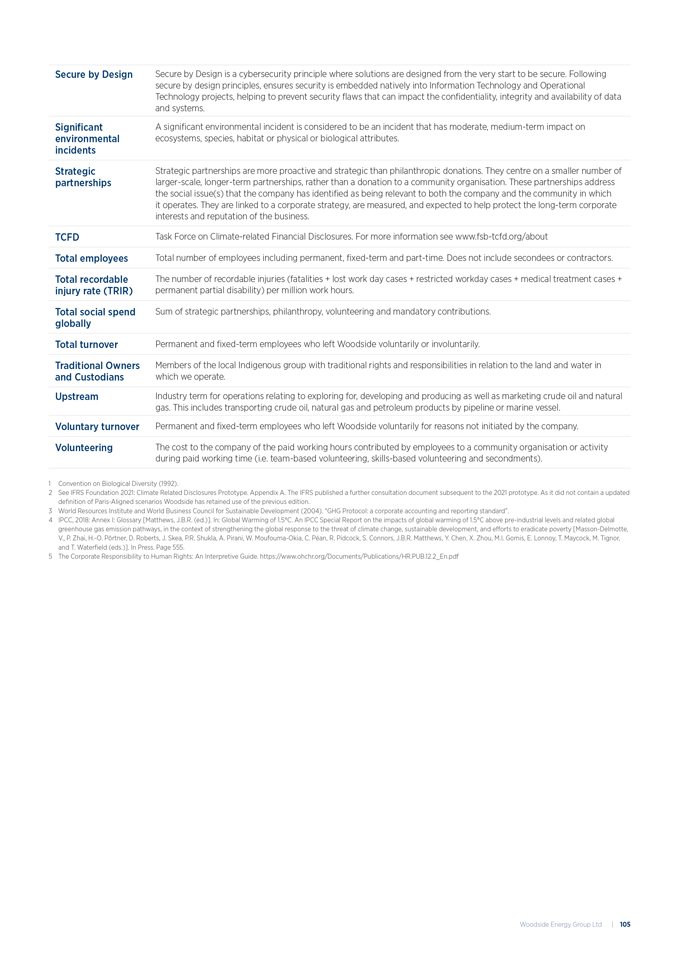
Secure by Design Secure by Design is a cybersecurity principle where solutions are designed from the very start to be secure. Following secure by design principles, ensures security is embedded natively into Information Technology and Operational Technology projects, helping to prevent security flaws that can impact the confidentiality, integrity and availability of data and systems. Significant environmental incidents A significant environmental incident is considered to be an incident that has moderate, medium-term impact on ecosystems, species, habitat or physical or biological attributes. Strategic partnerships Strategic partnerships are more proactive and strategic than philanthropic donations. They centre on a smaller number of larger-scale, longer-term partnerships, rather than a donation to a community organisation. These partnerships address the social issue(s) that the company has identified as being relevant to both the company and the community in which it operates. They are linked to a corporate strategy, are measured, and expected to help protect the long-term corporate interests and reputation of the business. TCFD Task Force on Climate-related Financial Disclosures. For more information see www.fsb-tcfd.org/about Total employees Total number of employees including permanent, fixed-term and part-time. Does not include secondees or contractors. Total recordable injury rate (TRIR) The number of recordable injuries (fatalities + lost work day cases + restricted workday cases + medical treatment cases + permanent partial disability) per million work hours. Total social spend globally Sum of strategic partnerships, philanthropy, volunteering and mandatory contributions. Total turnover Permanent and fixed-term employees who left Woodside voluntarily or involuntarily. Traditional Owners and Custodians Members of the local Indigenous group with traditional rights and responsibilities in relation to the land and water in which we operate. Upstream Industry term for operations relating to exploring for, developing and producing as well as marketing crude oil and natural gas. This includes transporting crude oil, natural gas and petroleum products by pipeline or marine vessel. Voluntary turnover Permanent and fixed-term employees who left Woodside voluntarily for reasons not initiated by the company. Volunteering The cost to the company of the paid working hours contributed by employees to a community organisation or activity during paid working time (i.e. team-based volunteering, skills-based volunteering and secondments). 1 Convention on Biological Diversity (1992). 2 See IFRS Foundation 2021: Climate Related Disclosures Prototype. Appendix A. The IFRS published a further consultation document subsequent to the 2021 prototype. As it did not contain a updated definition of Paris-Aligned scenarios Woodside has retained use of the previous edition. 3 World Resources Institute and World Business Council for Sustainable Development (2004). “GHG Protocol: a corporate accounting and reporting standard”. 4 IPCC, 2018: Annex I: Glossary [Matthews, J.B.R. (ed.)]. In: Global Warming of 1.5°C. An IPCC Special Report on the impacts of global warming of 1.5°C above pre-industrial levels and related global greenhouse gas emission pathways, in the context of strengthening the global response to the threat of climate change, sustainable development, and efforts to eradicate poverty [Masson-Delmotte, V., P. Zhai, H.-O. Portner, D. Roberts, J. Skea, P.R. Shukla, A. Pirani, W. Moufouma-Okia, C. Pean, R. Pidcock, S. Connors, J.B.R. Matthews, Y. Chen, X. Zhou, M.I. Gomis, E. Lonnoy, T. Maycock, M. Tignor, and T. Waterfield (eds.)]. In Press. Page 555. 5 The Corporate Responsibility to Human Rights: An Interpretive Guide. https://www.ohchr.org/Documents/Publications/HR.PUB.12.2_En.pdf Woodside Energy Group Ltd | 105
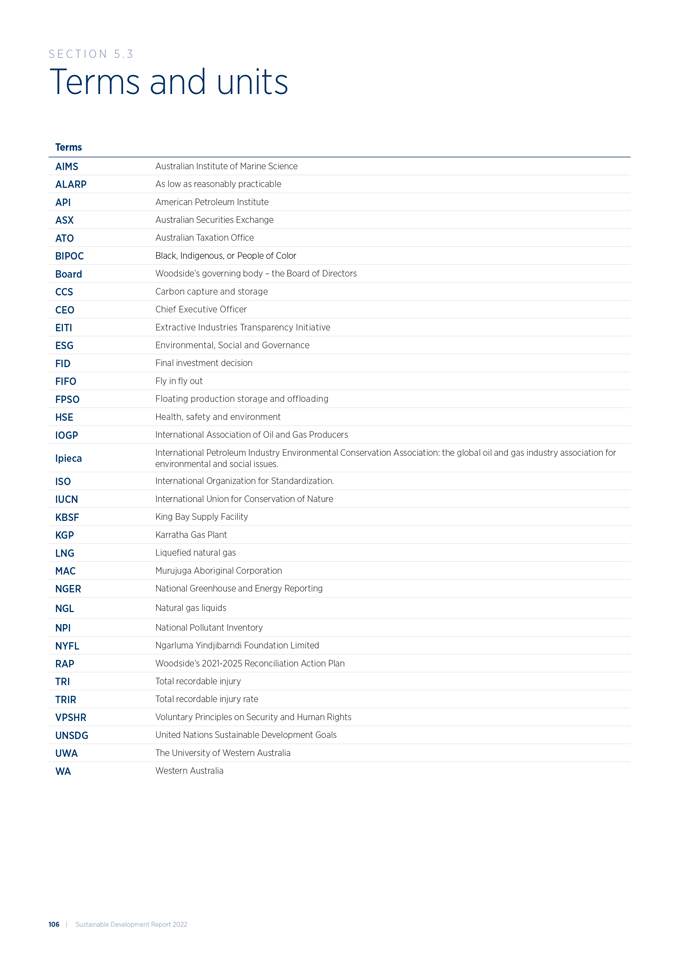
Terms and units Terms AIMS Australian Institute of Marine Science ALARP As low as reasonably practicable API American Petroleum Institute ASX Australian Securities Exchange ATO Australian Taxation Office BIPOC Black, Indigenous, or People of Color Board Woodside’s governing body – the Board of Directors CCS Carbon capture and storage CEO Chief Executive Officer EITI Extractive Industries Transparency Initiative ESG Environmental, Social and Governance FID Final investment decision FIFO Fly in fly out FPSO Floating production storage and offloading HSE Health, safety and environment IOGP International Association of Oil and Gas Producers Ipieca International Petroleum Industry Environmental Conservation Association: the global oil and gas industry association for environmental and social issues. ISO International Organization for Standardization. IUCN International Union for Conservation of Nature KBSF King Bay Supply Facility KGP Karratha Gas Plant LNG Liquefied natural gas MAC Murujuga Aboriginal Corporation NGER National Greenhouse and Energy Reporting NGL Natural gas liquids NPI National Pollutant Inventory NYFL Ngarluma Yindjibarndi Foundation Limited RAP Woodside’s 2021-2025 Reconciliation Action Plan TRI Total recordable injury TRIR Total recordable injury rate VPSHR Voluntary Principles on Security and Human Rights UNSDG United Nations Sustainable Development Goals UWA The University of Western Australia WA Western Australia S ection 5 . 3 106 | Sustainable Development Report 2022
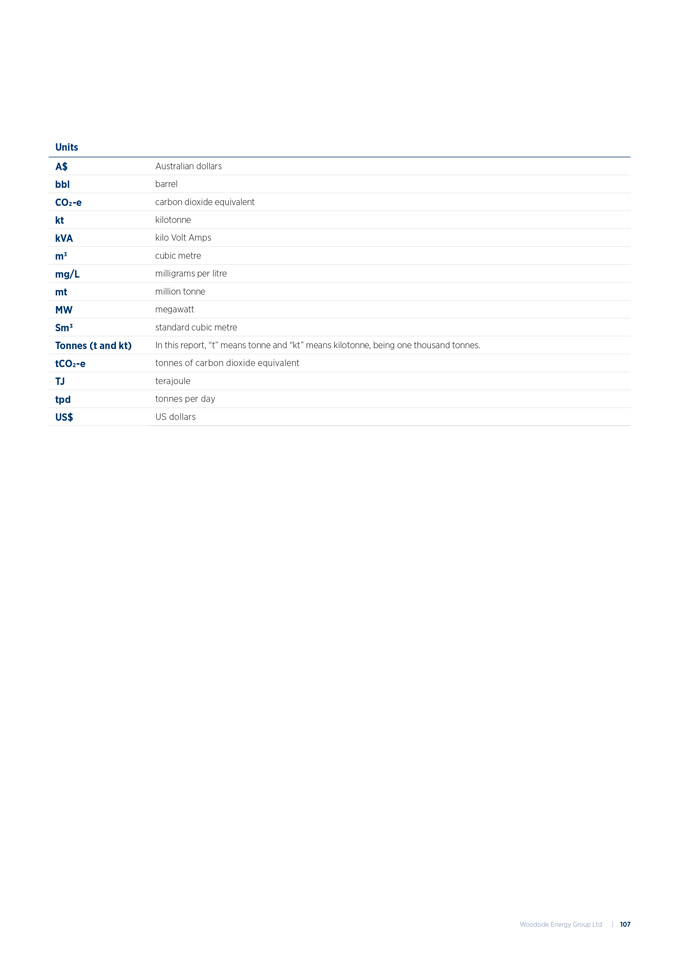
Units A$ Australian dollars bbl barrel CO2-e carbon dioxide equivalent kt kilotonne kVA kilo Volt Amps m3 cubic metre mg/L milligrams per litre mt million tonne MW megawatt Sm3 standard cubic metre Tonnes (t and kt) In this report, “t” means tonne and “kt” means kilotonne, being one thousand tonnes. tCO2-e tonnes of carbon dioxide equivalent TJ terajoule tpd tonnes per day US$ US dollars Woodside Energy Group Ltd | 107
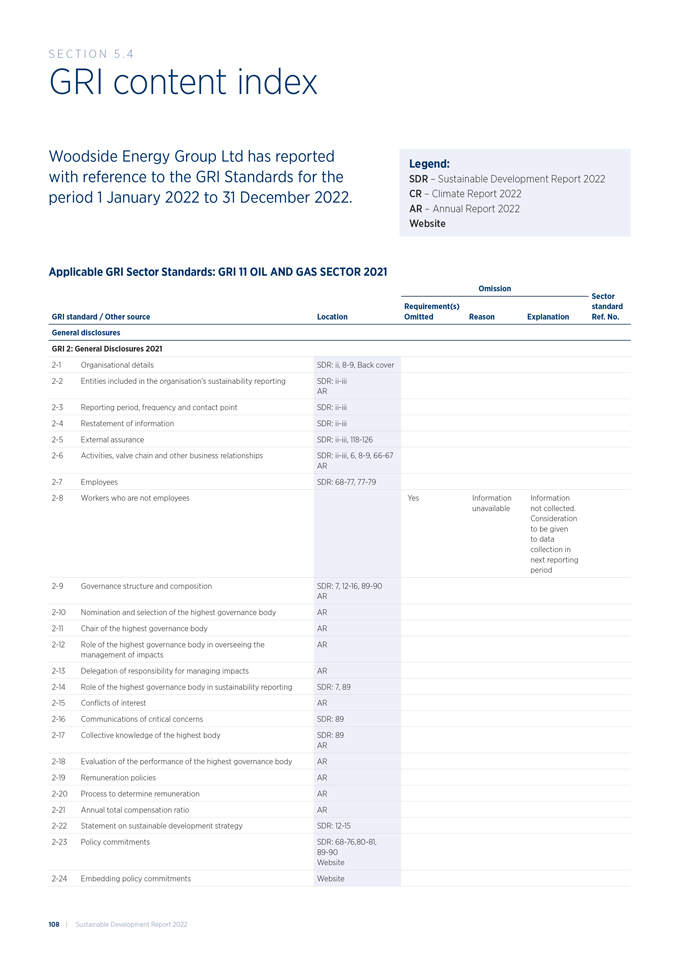
GRI content index Woodside Energy Group Ltd has reported with reference to the GRI Standards for the period 1 January 2022 to 31 December 2022. Applicable GRI Sector Standards: GRI 11 OIL AND GAS SECTOR 2021 Omission Sector standard GRI standard / Other source Location Ref. No. Requirement(s) Omitted Reason Explanation General disclosures GRI 2: General Disclosures 2021 2-1 Organisational details SDR: ii, 8-9, Back cover 2-2 Entities included in the organisation’s sustainability reporting SDR: ii-iii AR 2-3 Reporting period, frequency and contact point SDR: ii-iii 2-4 Restatement of information SDR: ii-iii 2-5 External assurance SDR: ii-iii, 118-126 2-6 Activities, valve chain and other business relationships SDR: ii-iii, 6, 8-9, 66-67 AR 2-7 Employees SDR: 68-77, 77-79 2-8 Workers who are not employees Yes Information unavailable Information not collected. Consideration to be given to data collection in next reporting period 2-9 Governance structure and composition SDR: 7, 12-16, 89-90 AR 2-10 Nomination and selection of the highest governance body AR 2-11 Chair of the highest governance body AR 2-12 Role of the highest governance body in overseeing the management of impacts AR 2-13 Delegation of responsibility for managing impacts AR 2-14 Role of the highest governance body in sustainability reporting SDR: 7, 89 2-15 Conflicts of interest AR 2-16 Communications of critical concerns SDR: 89 2-17 Collective knowledge of the highest body SDR: 89 AR 2-18 Evaluation of the performance of the highest governance body AR 2-19 Remuneration policies AR 2-20 Process to determine remuneration AR 2-21 Annual total compensation ratio AR 2-22 Statement on sustainable development strategy SDR: 12-15 2-23 Policy commitments SDR: 68-76,80-81, 89-90 Website 2-24 Embedding policy commitments Website S ection 5 .4 Legend: SDR – Sustainable Development Report 2022 CR – Climate Report 2022 AR – Annual Report 2022 Website 108 | Sustainable Development Report 2022
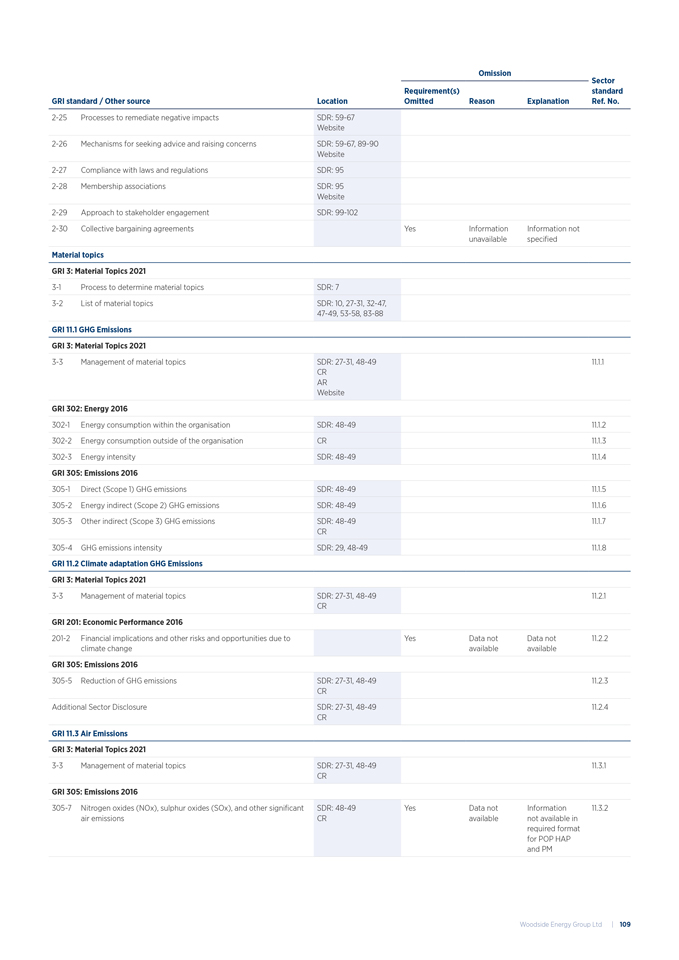
Omission Sector standard GRI standard / Other source Location Ref. No. Requirement(s) Omitted Reason Explanation 2-25 Processes to remediate negative impacts SDR: 59-67 Website 2-26 Mechanisms for seeking advice and raising concerns SDR: 59-67, 89-90 Website 2-27 Compliance with laws and regulations SDR: 95 2-28 Membership associations SDR: 95 Website 2-29 Approach to stakeholder engagement SDR: 99-102 2-30 Collective bargaining agreements Yes Information unavailable Information not specified Material topics GRI 3: Material Topics 2021 3-1 Process to determine material topics SDR: 7 3-2 List of material topics SDR: 10, 27-31, 32-47, 47-49, 53-58, 83-88 GRI 11.1 GHG Emissions GRI 3: Material Topics 2021 3-3 Management of material topics SDR: 27-31, 48-49 CR AR Website 11.1.1 GRI 302: Energy 2016 302-1 Energy consumption within the organisation SDR: 48-49 11.1.2 302-2 Energy consumption outside of the organisation CR 11.1.3 302-3 Energy intensity SDR: 48-49 11.1.4 GRI 305: Emissions 2016 305-1 Direct (Scope 1) GHG emissions SDR: 48-49 11.1.5 305-2 Energy indirect (Scope 2) GHG emissions SDR: 48-49 11.1.6 305-3 Other indirect (Scope 3) GHG emissions SDR: 48-49 CR 11.1.7 305-4 GHG emissions intensity SDR: 29, 48-49 11.1.8 GRI 11.2 Climate adaptation GHG Emissions GRI 3: Material Topics 2021 3-3 Management of material topics SDR: 27-31, 48-49 CR 11.2.1 GRI 201: Economic Performance 2016 201-2 Financial implications and other risks and opportunities due to climate change Yes Data not available Data not available 11.2.2 GRI 305: Emissions 2016 305-5 Reduction of GHG emissions SDR: 27-31, 48-49 CR 11.2.3 Additional Sector Disclosure SDR: 27-31, 48-49 CR 11.2.4 GRI 11.3 Air Emissions GRI 3: Material Topics 2021 3-3 Management of material topics SDR: 27-31, 48-49 CR 11.3.1 GRI 305: Emissions 2016 305-7 Nitrogen oxides (NOx), sulphur oxides (SOx), and other significant air emissions SDR: 48-49 CR Yes Data not available Information not available in required format for POP HAP and PM 11.3.2 Woodside Energy Group Ltd | 109
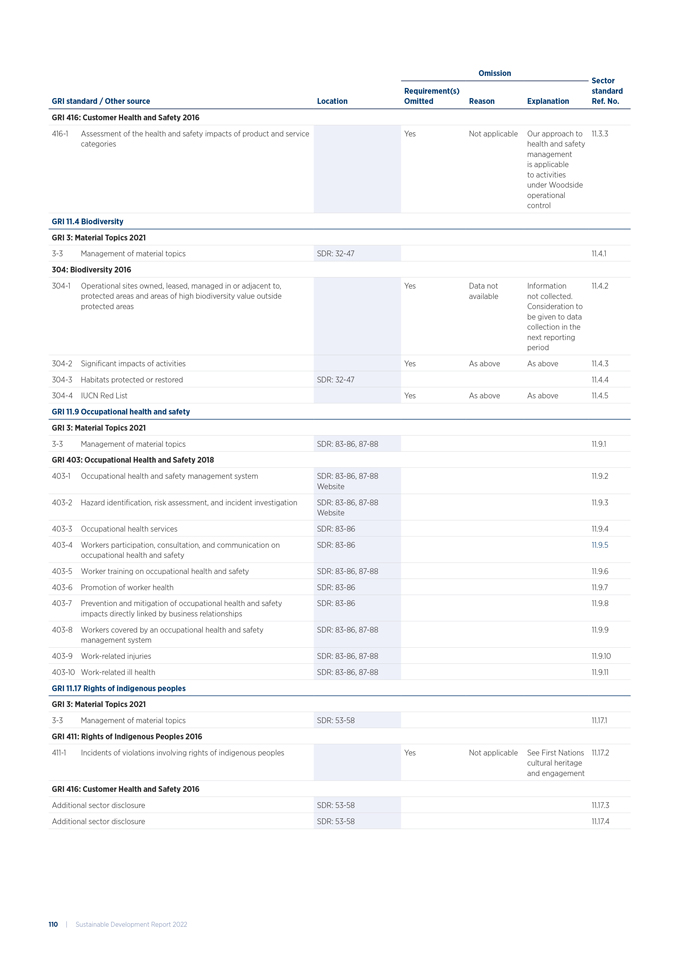
Omission Sector standard GRI standard / Other source Location Ref. No. Requirement(s) Omitted Reason Explanation GRI 416: Customer Health and Safety 2016 416-1 Assessment of the health and safety impacts of product and service categories Yes Not applicable Our approach to health and safety management is applicable to activities under Woodside operational control 11.3.3 GRI 11.4 Biodiversity GRI 3: Material Topics 2021 3-3 Management of material topics SDR: 32-47 11.4.1 304: Biodiversity 2016 304-1 Operational sites owned, leased, managed in or adjacent to, protected areas and areas of high biodiversity value outside protected areas Yes Data not available Information not collected. Consideration to be given to data collection in the next reporting period 11.4.2 304-2 Significant impacts of activities Yes As above As above 11.4.3 304-3 Habitats protected or restored SDR: 32-47 11.4.4 304-4 IUCN Red List Yes As above As above 11.4.5 GRI 11.9 Occupational health and safety GRI 3: Material Topics 2021 3-3 Management of material topics SDR: 83-86, 87-88 11.9.1 GRI 403: Occupational Health and Safety 2018 403-1 Occupational health and safety management system SDR: 83-86, 87-88 Website 11.9.2 403-2 Hazard identification, risk assessment, and incident investigation SDR: 83-86, 87-88 Website 11.9.3 403-3 Occupational health services SDR: 83-86 11.9.4 403-4 Workers participation, consultation, and communication on occupational health and safety SDR: 83-86 11.9.5 403-5 Worker training on occupational health and safety SDR: 83-86, 87-88 11.9.6 403-6 Promotion of worker health SDR: 83-86 11.9.7 403-7 Prevention and mitigation of occupational health and safety impacts directly linked by business relationships SDR: 83-86 11.9.8 403-8 Workers covered by an occupational health and safety management system SDR: 83-86, 87-88 11.9.9 403-9 Work-related injuries SDR: 83-86, 87-88 11.9.10 403-10 Work-related ill health SDR: 83-86, 87-88 11.9.11 GRI 11.17 Rights of indigenous peoples GRI 3: Material Topics 2021 3-3 Management of material topics SDR: 53-58 11.17.1 GRI 411: Rights of Indigenous Peoples 2016 411-1 Incidents of violations involving rights of indigenous peoples Yes Not applicable See First Nations cultural heritage and engagement 11.17.2 GRI 416: Customer Health and Safety 2016 Additional sector disclosure SDR: 53-58 11.17.3 Additional sector disclosure SDR: 53-58 11.17.4 110 | Sustainable Development Report 2022
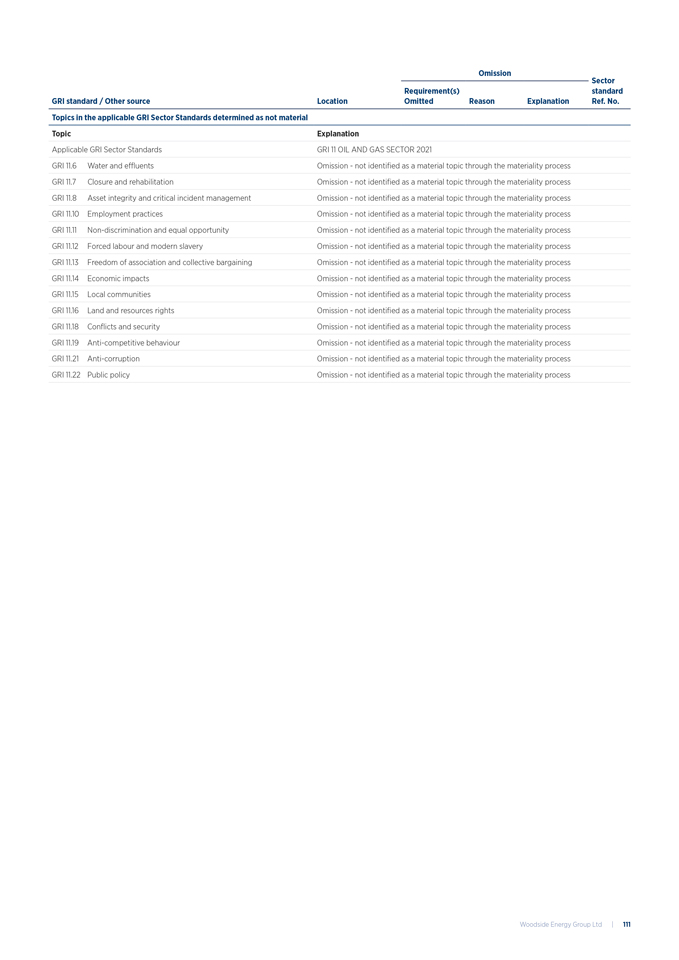
Omission Sector standard GRI standard / Other source Location Ref. No. Requirement(s) Omitted Reason Explanation Topics in the applicable GRI Sector Standards determined as not material Topic Explanation Applicable GRI Sector Standards GRI 11 OIL AND GAS SECTOR 2021 GRI 11.6 Water and effluents Omission—not identified as a material topic through the materiality process GRI 11.7 Closure and rehabilitation Omission—not identified as a material topic through the materiality process GRI 11.8 Asset integrity and critical incident management Omission—not identified as a material topic through the materiality process GRI 11.10 Employment practices Omission—not identified as a material topic through the materiality process GRI 11.11 Non-discrimination and equal opportunity Omission—not identified as a material topic through the materiality process GRI 11.12 Forced labour and modern slavery Omission—not identified as a material topic through the materiality process GRI 11.13 Freedom of association and collective bargaining Omission—not identified as a material topic through the materiality process GRI 11.14 Economic impacts Omission—not identified as a material topic through the materiality process GRI 11.15 Local communities Omission—not identified as a material topic through the materiality process GRI 11.16 Land and resources rights Omission—not identified as a material topic through the materiality process GRI 11.18 Conflicts and security Omission—not identified as a material topic through the materiality process GRI 11.19 Anti-competitive behaviour Omission—not identified as a material topic through the materiality process GRI 11.21 Anti-corruption Omission—not identified as a material topic through the materiality process GRI 11.22 Public policy Omission—not identified as a material topic through the materiality process Woodside Energy Group Ltd | 111
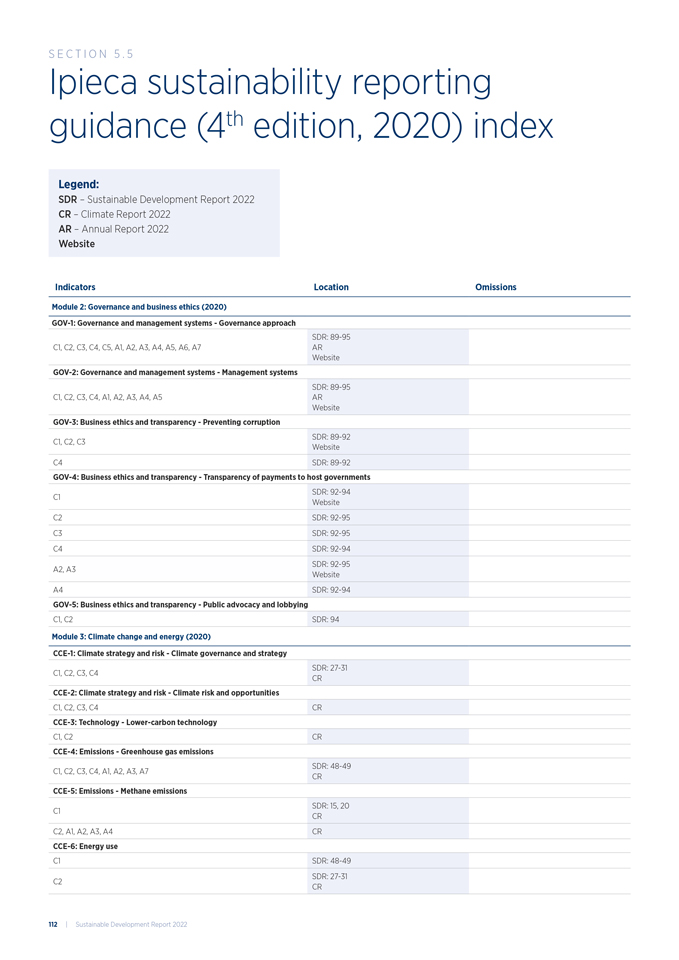
Ipieca sustainability reporting guidance (4th edition, 2020) index Indicators Location Omissions Module 2: Governance and business ethics (2020) GOV-1: Governance and management systems—Governance approach C1, C2, C3, C4, C5, A1, A2, A3, A4, A5, A6, A7 SDR: 89-95 AR Website GOV-2: Governance and management systems—Management systems C1, C2, C3, C4, A1, A2, A3, A4, A5 SDR: 89-95 AR Website GOV-3: Business ethics and transparency—Preventing corruption C1, C2, C3 SDR: 89-92 Website C4 SDR: 89-92 GOV-4: Business ethics and transparency—Transparency of payments to host governments C1 SDR: 92-94 Website C2 SDR: 92-95 C3 SDR: 92-95 C4 SDR: 92-94 A2, A3 SDR: 92-95 Website A4 SDR: 92-94 GOV-5: Business ethics and transparency—Public advocacy and lobbying C1, C2 SDR: 94 Module 3: Climate change and energy (2020) CCE-1: Climate strategy and risk—Climate governance and strategy C1, C2, C3, C4 SDR: 27-31 CR CCE-2: Climate strategy and risk—Climate risk and opportunities C1, C2, C3, C4 CR CCE-3: Technology—Lower-carbon technology C1, C2 CR CCE-4: Emissions—Greenhouse gas emissions C1, C2, C3, C4, A1, A2, A3, A7 SDR: 48-49 CR CCE-5: Emissions—Methane emissions C1 SDR: 15, 20 CR C2, A1, A2, A3, A4 CR CCE-6: Energy use C1 SDR: 48-49 C2 SDR: 27-31 CR S ection 5 . 5 Legend: SDR – Sustainable Development Report 2022 CR – Climate Report 2022 AR – Annual Report 2022 Website 112 | Sustainable Development Report 2022
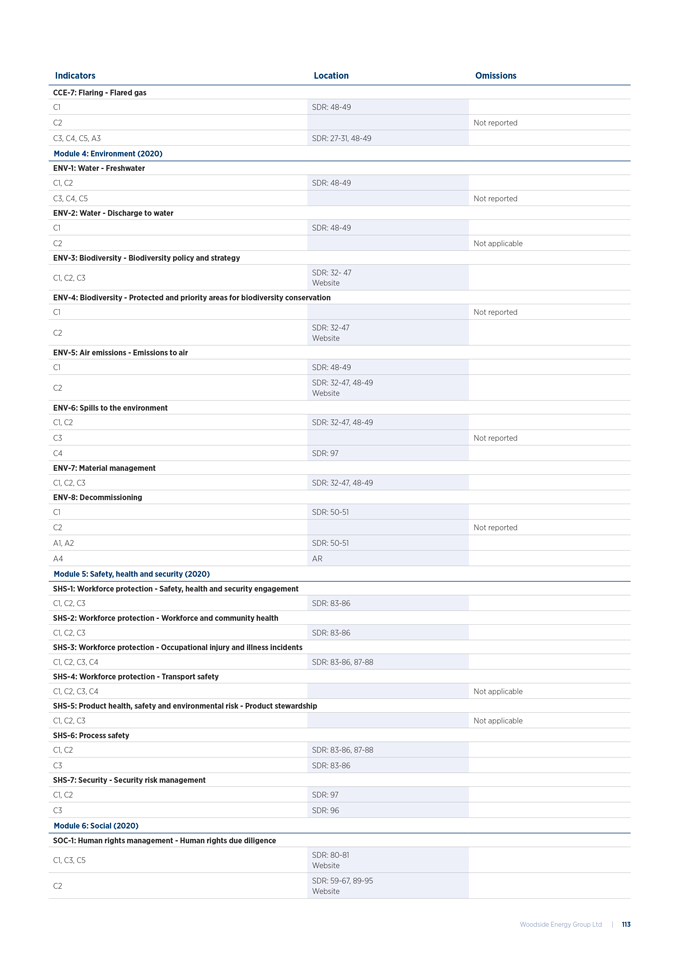
Indicators Location Omissions CCE-7: Flaring—Flared gas C1 SDR: 48-49 C2 Not reported C3, C4, C5, A3 SDR: 27-31, 48-49 Module 4: Environment (2020) ENV-1: Water—Freshwater C1, C2 SDR: 48-49 C3, C4, C5 Not reported ENV-2: Water—Discharge to water C1 SDR: 48-49 C2 Not applicable ENV-3: Biodiversity—Biodiversity policy and strategy C1, C2, C3 SDR: 32- 47 Website ENV-4: Biodiversity—Protected and priority areas for biodiversity conservation C1 Not reported C2 SDR: 32-47 Website ENV-5: Air emissions—Emissions to air C1 SDR: 48-49 C2 SDR: 32-47, 48-49 Website ENV-6: Spills to the environment C1, C2 SDR: 32-47, 48-49 C3 Not reported C4 SDR: 97 ENV-7: Material management C1, C2, C3 SDR: 32-47, 48-49 ENV-8: Decommissioning C1 SDR: 50-51 C2 Not reported A1, A2 SDR: 50-51 A4 AR Module 5: Safety, health and security (2020) SHS-1: Workforce protection—Safety, health and security engagement C1, C2, C3 SDR: 83-86 SHS-2: Workforce protection—Workforce and community health C1, C2, C3 SDR: 83-86 SHS-3: Workforce protection—Occupational injury and illness incidents C1, C2, C3, C4 SDR: 83-86, 87-88 SHS-4: Workforce protection—Transport safety C1, C2, C3, C4 Not applicable SHS-5: Product health, safety and environmental risk—Product stewardship C1, C2, C3 Not applicable SHS-6: Process safety C1, C2 SDR: 83-86, 87-88 C3 SDR: 83-86 SHS-7: Security—Security risk management C1, C2 SDR: 97 C3 SDR: 96 Module 6: Social (2020) SOC-1: Human rights management—Human rights due diligence C1, C3, C5 SDR: 80-81 Website C2 SDR: 59-67, 89-95 Website Woodside Energy Group Ltd | 113
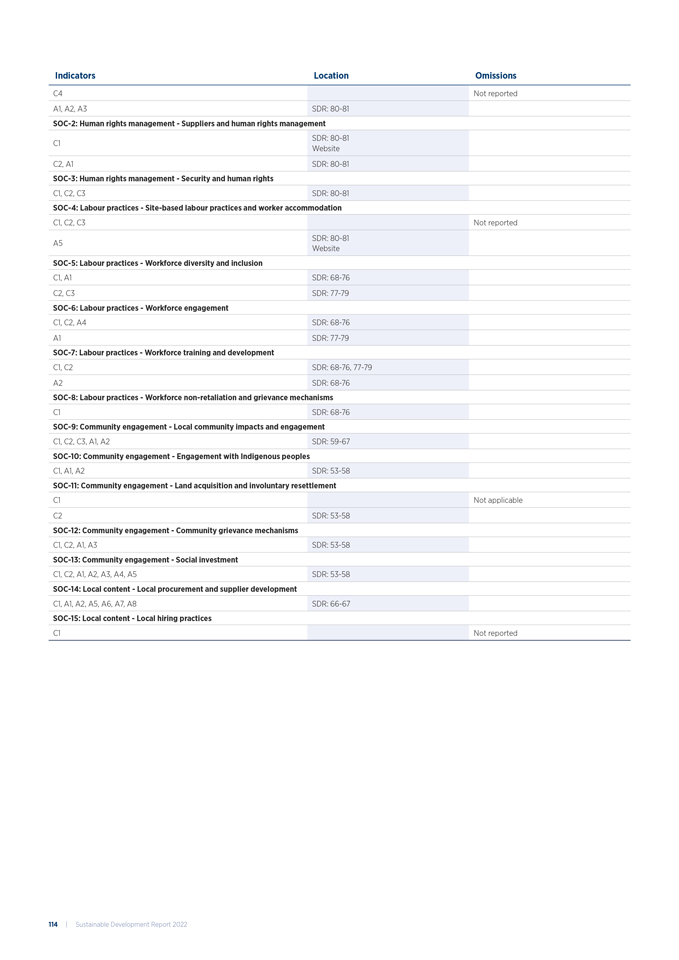
Indicators Location Omissions C4 Not reported A1, A2, A3 SDR: 80-81 SOC-2: Human rights management—Suppliers and human rights management C1 SDR: 80-81 Website C2, A1 SDR: 80-81 SOC-3: Human rights management—Security and human rights C1, C2, C3 SDR: 80-81 SOC-4: Labour practices—Site-based labour practices and worker accommodation C1, C2, C3 Not reported A5 SDR: 80-81 Website SOC-5: Labour practices—Workforce diversity and inclusion C1, A1 SDR: 68-76 C2, C3 SDR: 77-79 SOC-6: Labour practices—Workforce engagement C1, C2, A4 SDR: 68-76 A1 SDR: 77-79 SOC-7: Labour practices—Workforce training and development C1, C2 SDR: 68-76, 77-79 A2 SDR: 68-76 SOC-8: Labour practices—Workforce non-retaliation and grievance mechanisms C1 SDR: 68-76 SOC-9: Community engagement—Local community impacts and engagement C1, C2, C3, A1, A2 SDR: 59-67 SOC-10: Community engagement—Engagement with Indigenous peoples C1, A1, A2 SDR: 53-58 SOC-11: Community engagement—Land acquisition and involuntary resettlement C1 Not applicable C2 SDR: 53-58 SOC-12: Community engagement—Community grievance mechanisms C1, C2, A1, A3 SDR: 53-58 SOC-13: Community engagement—Social investment C1, C2, A1, A2, A3, A4, A5 SDR: 53-58 SOC-14: Local content—Local procurement and supplier development C1, A1, A2, A5, A6, A7, A8 SDR: 66-67 SOC-15: Local content—Local hiring practices C1 Not reported 114 | Sustainable Development Report 2022

— Woodside employees in Houston. Woodside Energy Group Ltd | 115
Disclaimer Performance and forward looking statements The information included in this report and in any oral statements made in connection with it include “forward looking statements” within the meaning of applicable securities laws. Such statements may be identified by words such as “may,” “could,” “project,” “believe,” “anticipate,” “expect,” “estimate,” “potential,” “plan,” “forecast” and other similar words. All statements other that statements of historical facts included in this report that address current intention, statements of opinion and expectations regarding Woodside’s present and future operations, possible future events and future financial prospects and impacts are forward-looking statements. In particular, this report contains forward looking statements pertaining to, but not limited to, information with respect to the following: Woodside’s strategic plan, priorities, outlook and expected performance; sustainability goals, strategies, priorities and initiatives, including, among others, greenhouse gas emissions reduction, investment in the energy transition, inclusion and diversity, health, safety and wellbeing, planned or proposed renewable and lower carbon services and new energy projects, investment in certain communities, and our Reconciliation Action Plan targets; our plans to achieve our sustainability goals and to monitor and report our progress thereon; commitments and disclosure; and other related items. Such statements are not statements of fact and may be affected by a variety of known and unknown risks, variables and changes in underlying assumptions or strategy that could cause Woodside’s actual results or performance to differ materially from the results or performance expressed or implied by such statements. Risks that could cause actual results and financial condition to differ materially from those described in forward-looking statements can be found in this report, in Woodside’s reports to the ASX, filings with the SEC and other disclosures available on our corporate website at https://www.woodside.com/. There can be no certainty of outcome in relation to the matters to which the statements relate, and the outcomes are not all within the control of Woodside. Further information on some important factors that could cause actual results or performance to differ materially from those projected in such statements is contained in the Annual Report 2022 and Climate Report 2022. Readers are cautioned not to place undue reliance on any forward looking statements contained in this report. While this report describes potential future events and matters that may be significant, and with respect to which we may use the words “material” or “materiality”, the potential significance of these events and matters should not be read as equating to “materiality” as the concept is used in connection with Woodside’s required disclosures made in response to SEC and exchange rules and regulations. For the purposes of Woodside’s sustainability reporting we classify the topics into three categories of material, significant or important. For these purposes, ‘Material topic’ means a 2022 sustainability topic described in this report, determined as part of the 2022 materiality assessment process undertaken by Woodside. Classification of any topic as material, significant or important should not be read as a determination of whether that topic may necessarily rise to the level of materiality of disclosures required by law, including the laws of Australia, the United States and the United Kingdom. Moreover, while we have provided information on several sustainability topics, there are inherent uncertainties in providing such information, due to the complexity and novelty of many methodologies established for collecting, measuring, and analysing sustainability data. While we anticipate continuing to monitor and report on certain sustainability information, we cannot guarantee that such data will be consistent year-to-year, as methodologies and expectations continue to evolve. Woodside makes no representation, warranty (express or implied) assurance or guarantee as to the accuracy, completeness or correctness or likelihood of fulfilment of any forward looking statements in any forward looking statements. Unless otherwise provided, the information contained in this report is expressly not incorporated by reference into any filing of Woodside made with the SEC, or any other filing, report, application, or statement made by Woodside to any governmental authority. S ection 5 . 6 116 | Sustainable Development Report 2022
The forward looking statements in this report are not guidance, forecasts, guarantees or predictions that future events will or are likely to occur or of future performance. The forward looking statements in this report reflect management’s expectations, judgments, assessments, assumptions, estimates and other information available at the date of this report and/or the date of our planning processes. Except as required by applicable law or the Australian Securities Exchange (ASX) Listing Rules, Woodside does not undertake to provide ongoing market updates on any forward looking statements, or discussion of future financial prospects, whether as a result of new information or of future events. This report has not been prepared as financial or investment advice or to provide any guidance in relation to our future performance. Past performance cannot be relied on as a guide to future performance. It should be read in conjunction with our periodic reporting and other announcements made to the Australian Securities Exchange, New York Stock Exchange and London Stock Exchange. This report is not intended to, and does not constitute, form part of, or contain an offer or invitation to sell to Woodside (or any other person) or a solicitation of an offer from Woodside (or any other person) in any jurisdiction. This presentation may contain industry, market and competitive position data that is based on industry publications and studies conducted by third parties as well as Woodside’s internal estimates and research. While Woodside believes that each of these publications and third party studies is reliable and has been prepared by a reputable source, Woodside has not independently verified the market and industry data obtained from these third party sources and cannot guarantee the completeness or accuracy of such data. Undue reliance should not be placed on any of the industry, market or competitive position data contained in this report. Emissions data All greenhouse gas emissions data in this report are estimates, due to the inherent uncertainty and limitations in measuring or quantifying greenhouse gas emissions, including those uncertainties set out in the GHD Assurance Statement on page 124-125. Further information regarding the calculation of Woodside’s greenhouse gas emissions is contained in the supporting table of climate-related data provided in the Climate Report 2022. There may be differences in the way third parties calculate or report greenhouse gas emissions compared to Woodside, which means third party data may not be comparable to Woodside’s data. NOTE: Data in the Environment table on page 48-49 has been prepared with reference to the Global Reporting Initiative (GRI) Standards, Oil and Gas Standards and with reference to the Ipieca, API and IOGP (2020) Sustainability Reporting Guidance for the oil and gas industry. Woodside Energy Group Ltd | 117
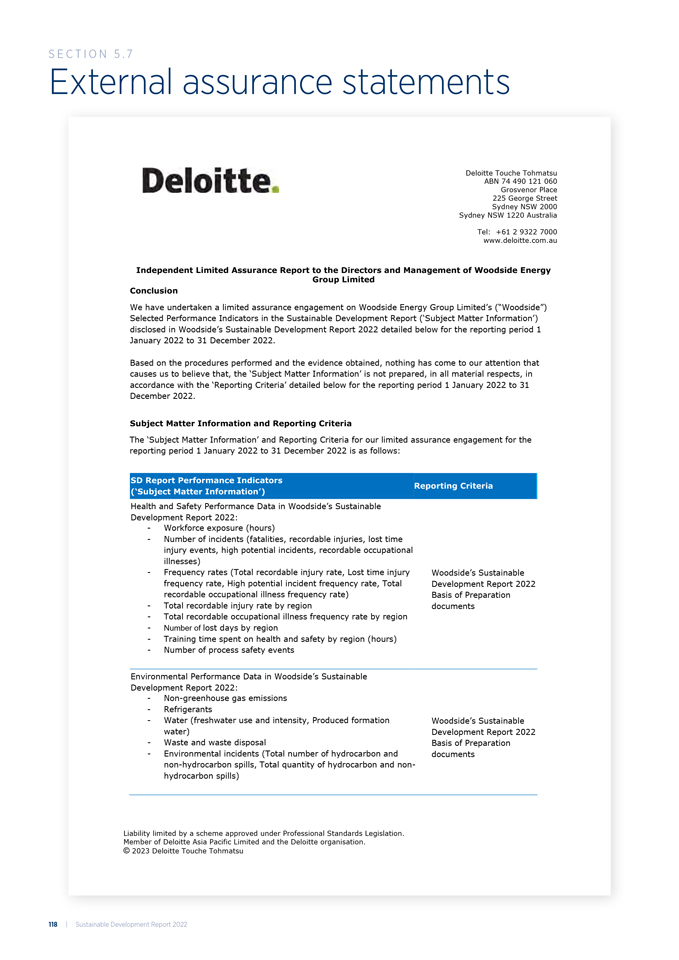
S E CTION 5 . 7 External assurance statements Deloitte Touche Tohmatsu ABN 74 490 121 060 Grosvenor Place 225 George Street Sydney NSW 2000 Sydney NSW 1220 Australia Tel: +61 2 9322 7000 www.deloitte.com.au Independent Limited Assurance Report to the Directors and Management of Woodside Energy Group Limited Conclusion We have undertaken a limited assurance engagement on Woodside Energy Group Limited’s (“Woodside”) Selected Performance Indicators in the Sustainable Development Report (‘Subject Matter Information’) disclosed in Woodside’s Sustainable Development Report 2022 detailed below for the reporting period 1 January 2022 to 31 December 2022. Based on the procedures performed and the evidence obtained, nothing has come to our attention that causes us to believe that, the ‘Subject Matter Information’ is not prepared, in all material respects, in accordance with the ‘Reporting Criteria’ detailed below for the reporting period 1 January 2022 to 31 December 2022. Subject Matter Information and Reporting Criteria The ‘Subject Matter Information’ and Reporting Criteria for our limited assurance engagement for the reporting period 1 January 2022 to 31 December 2022 is as follows: SD Report Performance Indicators (‘Subject Matter Information’) Reporting Criteria Health and Safety Performance Data in Woodside’s Sustainable Development Report 2022: - Workforce exposure (hours) - Number of incidents (fatalities, recordable injuries, lost time injury events, high potential incidents, recordable occupational illnesses) - Frequency rates (Total recordable injury rate, Lost time injury Woodside’s Sustainable frequency rate, High potential incident frequency rate, Total Development Report 2022 recordable occupational illness frequency rate) Basis of Preparation - Total recordable injury rate by region documents - Total recordable occupational illness frequency rate by region - Number of lost days by region - Training time spent on health and safety by region (hours) - Number of process safety events Environmental Performance Data in Woodside’s Sustainable Development Report 2022: - Non-greenhouse gas emissions - Refrigerants - Water (freshwater use and intensity, Produced formation Woodside’s Sustainable water) Development Report 2022 - Waste and waste disposal Basis of Preparation - Environmental incidents (Total number of hydrocarbon and documents non-hydrocarbon spills, Total quantity of hydrocarbon and non-hydrocarbon spills) Liability limited by a scheme approved under Professional Standards Legislation. Member of Deloitte Asia Pacific Limited and the Deloitte organisation. © 2023 Deloitte Touche Tohmatsu 118 | Sustainable Development Report 2022
SD Report Performance Indicators (‘Subject Matter Information’) Reporting Criteria People Data in Woodside’s Sustainable Development Report 2022: - Number of staff by gender, employment type, employment category, region, age - Number of contractors - Number of employees per category according to Indigenous workforce - Employee turnover by gender, region, age group (number) Woodside’s Sustainable - Employees in graduate program (number) Development Report 2022 - Total hours and average per person hours of training by Basis of Preparation gender (including professional/ management) documents - Total hours and average per person hours of training by employee type - Percentage of employees receiving regular performance and career development reviews, by gender (%) - Returning from parental leave (percentage) Selected assertions made in relation to the four material topics in Woodside’s Sustainable Development Report 2022: - Climate change resilience and transition GRI 1: Foundation 2021 - - Biodiversity Reporting Principles - First Nations cultural heritage and engagement - Health, safety, and wellbeing Basis for Conclusion We conducted our limited assurance engagement in accordance with Australian Standard on Assurance Engagements ASAE 3000 Assurance Engagements Other than Audits or Reviews of Historical Financial Information (“ASAE 3000”), issued by the Australian Auditing and Assurance Standards Board. We believe that the evidence we have obtained is sufficient and appropriate to provide a basis for our conclusion. Management’s Responsibilities Management is responsible for: a) Ensuring that the ‘Subject Matter Information’ is prepared in accordance with the ‘Reporting Criteria’; b) Confirming the measurement or evaluation of the underlying ‘Subject Matter Information’ against the ‘Reporting Criteria’, including that all relevant matters are reflected in the ‘Subject Matter Information’; c) Designing, establishing, and maintaining an effective system of internal control over its operations and financial reporting, including, without limitation, systems designed to assure achievement of its control objectives and its compliance with applicable laws and regulations; and d) The electronic presentation of the ‘Subject Matter Information’ and our limited assurance report on the website. 2 Woodside Energy Group Ltd | 119
Our Independence and Quality Control We have complied with the independence and other relevant ethical requirements relating to assurance engagements and applied Auditing Standard ASQM 1 Quality Control for Firms that Perform Audits and Reviews of Financial Reports and Other Financial Information, Other Assurance Engagements and Related Services Engagements in undertaking this assurance engagement. Assurance Practitioner’s Responsibilities Our responsibility is to express a limited assurance conclusion on Woodside Energy Group Limited’s ‘Subject Matter Information’ as evaluated against the ‘Reporting Criteria’ based on the procedures we have performed and the evidence we have obtained. ASAE 3000 requires that we plan and perform our procedures to obtain limited assurance about whether, anything has come to our attention that causes us to believe that the ‘Subject Matter Information’ is not properly prepared, in all material respects, in accordance with the ‘Reporting Criteria’. A limited assurance engagement in accordance with ASAE 3000 involves identifying areas where a material misstatement of the ‘Subject Matter Information’ is likely to arise, addressing the areas identified and considering the process used to prepare the ‘Subject Matter Information’. A limited assurance engagement is substantially less in scope than a reasonable assurance engagement in relation to both the risk assessment procedures, including an understanding of internal control, and the procedures performed in response to the assessed risks. The procedures performed in a limited assurance engagement vary in nature and timing from, and are less in extent than for, a reasonable assurance engagement. Consequently, the level of assurance obtained in a limited assurance engagement is substantially lower than the assurance that would have been obtained had a reasonable assurance engagement been performed. Accordingly, we do not express a reasonable assurance opinion about whether the ‘Subject Matter Information’ has been properly prepared, in all material respects, in accordance with the ‘Reporting Criteria’. Our procedures included: • Inquiries with Subject Matter data owners and management responsible for Woodside’s Sustainable Development Report 2022 to understand and assess the approach for collating, calculating and reporting the respective ‘Subject Matter Information’ across the reporting period ended 31 December 2022. • Inspection of documents as part of the walk throughs of key systems and processes for collating, calculating and reporting the respective ‘Subject Matter Information’ for the Woodside’s Sustainable Development Report 2022. • Selection on a sample basis items to test from the selected performance indicators and agree to relevant supporting documentation. • Analytical reviews over material data streams to identify any material anomalies for the ’Subject Matter Information’ and investigate further where required. Agreeing overall data sets for the ’Subject Matter Information’ to the final data contained in Woodside’s Sustainable Development Report 2022. 3 120 | Sustainable Development Report 2022
Inherent Limitations Because of the inherent limitations of an assurance engagement, together with the inherent limitations of any system of internal control there is an unavoidable risk that it is possible that fraud, error, or non-compliance with laws and regulations, where there has been concealment through collusion, forgery and other illegal acts may occur and not be detected, even though the engagement is properly planned and performed in accordance with Standards on Assurance Engagements. Other Information Management is responsible for the other information. The other information comprises Woodside’s Climate Report 2022 for the reporting period 1 January 2022 to 31 December 2022, but does not include the Sustainable Development Report Performance Indicators listed above. Our opinion on the Subject Matter Information does not cover the other information and we do not express any form of assurance conclusion thereon. In connection with our engagement, our responsibility is to read the other information and, in doing so, consider whether the other information is materially inconsistent with the knowledge obtained during the engagement, or otherwise appears to be materially misstated. If, based on the work we have performed, we conclude that there is a material misstatement of this other information, we are required to report that fact. We have nothing to report in this regard. Restricted use The applicable criteria used for this engagement was designed for a specific purpose of assisting the directors and management in reporting the ‘Subject Matter Information’ presented in Woodside’s Sustainable Development Report 2022, as a result, the ‘Subject Matter Information’ may not be suitable for another purpose. This report has been prepared for use by directors and management for the purpose reporting on the subject matter information presented in Woodside’s Sustainable Development Report 2022. We disclaim any assumption of responsibility for any reliance on this report to any person other than the directors and management or for any purpose other than that for which it was prepared. It is our understanding that Woodside intends to electronically present the assured Sustainable Development Report and Assurance Report on its internet website. Responsibility for the electronic presentation of the Sustainable Development Report on Woodside’s website is that of management of Woodside. The security and controls over information on the web site should be addressed by Woodside to maintain the integrity of the data presented. The examination of the controls over the electronic presentation of the assured Sustainable Development Report on Woodside’s web site is beyond the scope of the assurance of Woodside’s Sustainable Development Report 2022. DELOITTE TOUCHE TOHMATSU Chi Mun Woo Partner Sydney, 24 February 2023 4 Woodside Energy Group Ltd | 121
Deloitte Touche Tohmatsu ABN 74 490 121 060 Grosvenor Place 225 George Street Sydney NSW 2000 Sydney NSW 1220 Australia Tel: +61 2 9322 7000 www.deloitte.com.au Independent Assurance Practitioner’s Review Report to the Directors and Management of Woodside Energy Group Limited We have reviewed the attached selected financial information of Woodside Energy Group Limited (“Woodside”) which comprises the Financial Information listed in the table below for the period 1 January 2022 to 31 December 2022 (“selected financial information”). SD Report Performance Indicators (‘Selected Financial Information’) Reporting Criteria Tax paid - Corporate income tax - Petroleum Resource Rent Tax - Federal Royalties - Federal Excise - Payroll Tax - Fringe Benefits Tax Woodside’s Sustainable Development Report 2022 Basis of Preparation document Management’s Responsibility for the Selected Financial Information Management is responsible for the preparation and fair presentation of the Selected Financial Information and has determined that the basis of accounting described in Woodside’s Sustainable Development Report 2022 Basis of Preparation document is appropriate to meet the needs of the directors and management. Management’s responsibility also includes such internal control as management determines necessary to enable the preparation of the Selected Financial Information that is free from material misstatement whether due to fraud or error. Assurance Practitioner’s Responsibility Our responsibility is to express a conclusion on the Selected Financial Information based on our review. We have conducted our review in accordance with Auditing Standard on Review Engagements ASRE 2405 Review of Historical Information Other than a Financial Report. ASRE 2405 requires us to conclude whether anything has come to our attention that causes us to believe that Woodside’s Sustainable Development Report 2022 is not prepared, in all material respects, in accordance with Woodside’s Sustainable Development Report 2022 Basis of Preparation document. This Standard also requires us to comply with relevant ethical requirements. The procedures performed in a review are substantially less than those performed in an audit conducted in accordance with Australian Auditing Standards. Accordingly, we do not express an audit opinion on the Statement. Conclusion Based on our review, nothing has come to our attention that causes us to believe that the Selected Financial Information for the period 1 January 2022 to 31 December 2022 is not prepared, in all material respects, in accordance with Woodside’s Sustainable Development Report 2022 Basis of Preparation document. Liability limited by a scheme approved under Professional Standards Legislation. Member of Deloitte Asia Pacific Limited and the Deloitte organisation. © 2023 Deloitte Touche Tohmatsu 122 | Sustainable Development Report 2022
Basis of Accounting and Restriction on Distribution and Use Without modifying our conclusion, we draw attention to page 93 of Woodside’s Sustainable Development Report 2022 report to the Selected Financial Information for the reporting period 1 January 2022 to 31 December 2022, which describes the basis of accounting. The Selected Financial Information for the reporting period 1 January 2022 to 31 December 2022 has been prepared for use by the directors and management of Woodside Energy Group Limited for the purpose of enabling Woodside to include the review report in their Sustainable Development Report 2022. As a result, the Selected Financial Information for the reporting period 1 January 2022 to 31 December 2022 may not be suitable for another purpose. Our report is intended solely for the directors and management and should not be distributed to or used by parties other than the directors and management. It is our understanding that Woodside intends to electronically present the assured Sustainable Development Report and Assurance Report on its internet website. Responsibility for the electronic presentation of the Sustainable Development Report on Woodside’s website is that of management of Woodside. The security and controls over information on the web site should be addressed by Woodside to maintain the integrity of the data presented. The examination of the controls over the electronic presentation of the assured Sustainable Development Report on Woodside’s website is beyond the scope of the assurance of Woodside’s Sustainable Development Report 2022. DELOITTE TOUCHE TOHMATSU Chi Mun Woo Partner Sydney, 24 February 2023 Woodside Energy Group Ltd | 123
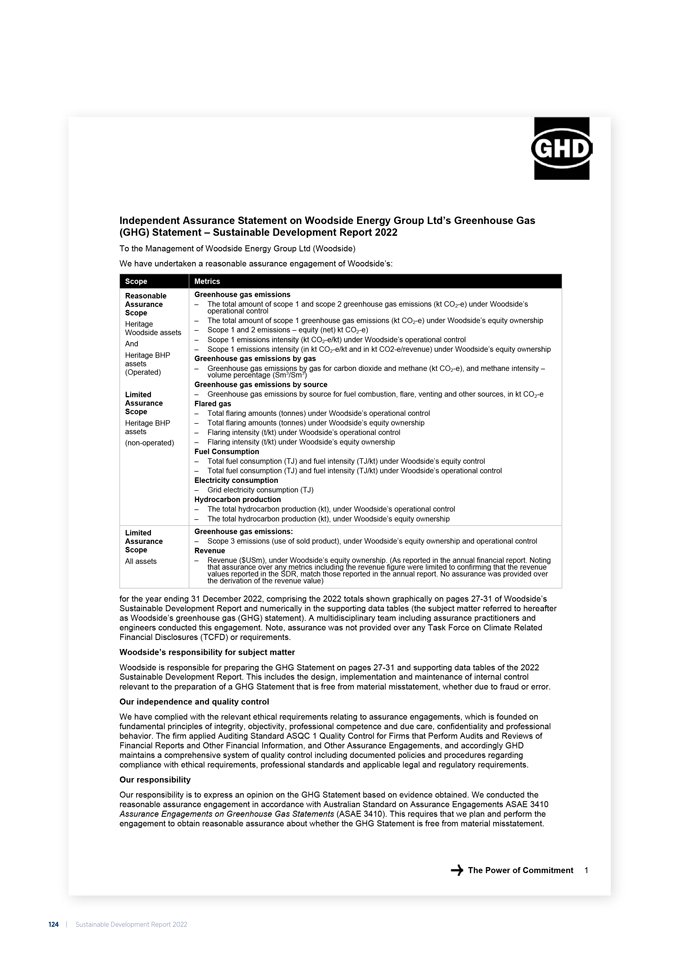
The Power of Commitment 1 Independent Assurance Statement on Woodside Energy Group Ltd’s Greenhouse Gas (GHG) Statement – Sustainable Development Report 2022 To the Management of Woodside Energy Group Ltd (Woodside) We have undertaken a reasonable assurance engagement of Woodside’s: Scope Metrics Reasonable Assurance Scope Heritage Woodside assets And Heritage BHP assets (Operated) Limited Assurance Scope Heritage BHP assets (non-operated) Greenhouse gas emissions – The total amount of scope 1 and scope 2 greenhouse gas emissions (kt CO2-e) under Woodside’s operational control – The total amount of scope 1 greenhouse gas emissions (kt CO2-e) under Woodside’s equity ownership – Scope 1 and 2 emissions – equity (net) kt CO2-e) – Scope 1 emissions intensity (kt CO2-e/kt) under Woodside’s operational control – Scope 1 emissions intensity (in kt CO2-e/kt and in kt CO2-e/revenue) under Woodside’s equity ownership – Greenhouse gas emissions by gas – Greenhouse gas emissions by gas for carbon dioxide and methane (kt CO2-e), and methane intensity – volume percentage (Sm3/Sm3) – Greenhouse gas emissions by source – Greenhouse gas emissions by source for fuel combustion, flare, venting and other sources, in kt CO2-e – Flared gas – Total flaring amounts (tonnes) under Woodside’s operational control – Total flaring amounts (tonnes) under Woodside’s equity ownership – Flaring intensity (t/kt) under Woodside’s operational control – Flaring intensity (t/kt) under Woodside’s equity ownership – Fuel Consumption – Total fuel consumption (TJ) and fuel intensity (TJ/kt) under Woodside’s equity control – Total fuel consumption (TJ) and fuel intensity (TJ/kt) under Woodside’s operational control – Electricity consumption – Grid electricity consumption (TJ) – Hydrocarbon production – The total hydrocarbon production (kt), under Woodside’s operational control – The total hydrocarbon production (kt), under Woodside’s equity ownership Limited Assurance Scope All assets Greenhouse gas emissions: – Scope 3 emissions (use of sold product), under Woodside’s equity ownership and operational control – Revenue – Revenue ($USm), under Woodside’s equity ownership. (As reported in the annual financial report. Noting that assurance over any metrics including the revenue figure were limited to confirming that the revenue values reported in the SDR, match those reported in the annual report. No assurance was provided over the derivation of the revenue value) for the year ending 31 December 2022, comprising the 2022 totals shown graphically on pages 27-31 of Woodside’s Sustainable Development Report and numerically in the supporting data tables (the subject matter referred to hereafter as Woodside’s greenhouse gas (GHG) statement). A multidisciplinary team including assurance practitioners and engineers conducted this engagement. Note, assurance was not provided over any Task Force on Climate Related Financial Disclosures (TCFD) or requirements. Woodside’s responsibility for subject matter Woodside is responsible for preparing the GHG Statement on pages 27-31 and supporting data tables of the 2022 Sustainable Development Report. This includes the design, implementation and maintenance of internal control relevant to the preparation of a GHG Statement that is free from material misstatement, whether due to fraud or error. Our independence and quality control We have complied with the relevant ethical requirements relating to assurance engagements, which is founded on fundamental principles of integrity, objectivity, professional competence and due care, confidentiality and professional behavior. The firm applied Auditing Standard ASQC 1 Quality Control for Firms that Perform Audits and Reviews of Financial Reports and Other Financial Information, and Other Assurance Engagements, and accordingly GHD maintains a comprehensive system of quality control including documented policies and procedures regarding compliance with ethical requirements, professional standards and applicable legal and regulatory requirements. Our responsibility Our responsibility is to express an opinion on the GHG Statement based on evidence obtained. We conducted the reasonable assurance engagement in accordance with Australian Standard on Assurance Engagements ASAE 3410 Assurance Engagements on Greenhouse Gas Statements (ASAE 3410). This requires that we plan and perform the engagement to obtain reasonable assurance about whether the GHG Statement is free from material misstatement. 124 | Sustainable Development Report 2022
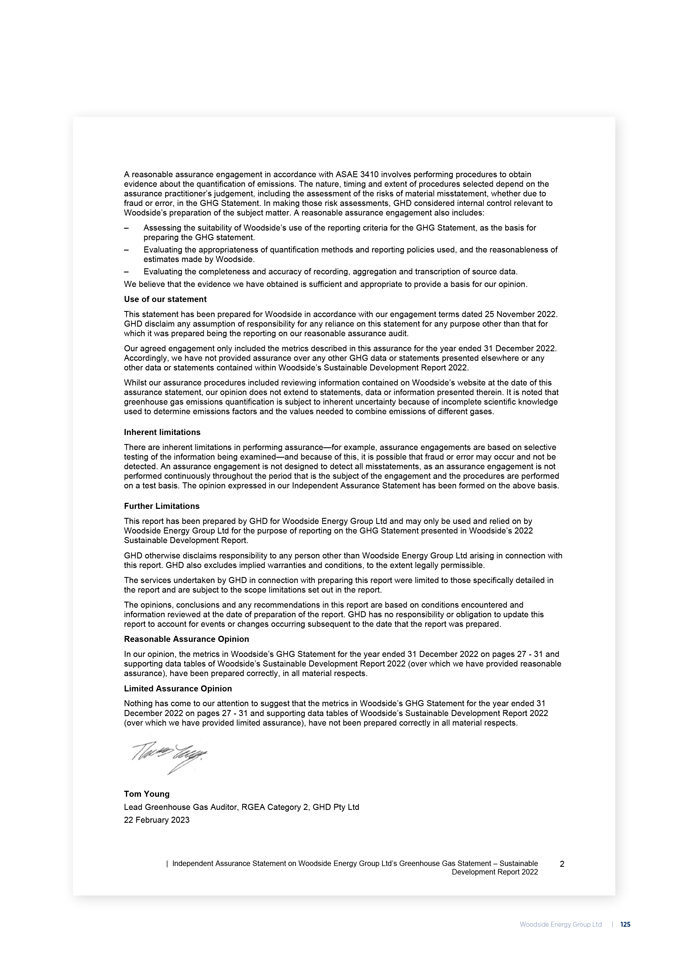
| Independent Assurance Statement on Woodside Energy Group Ltd’s Greenhouse Gas Statement – Sustainable Development Report 2022 2 A reasonable assurance engagement in accordance with ASAE 3410 involves performing procedures to obtain evidence about the quantification of emissions. The nature, timing and extent of procedures selected depend on the assurance practitioner’s judgement, including the assessment of the risks of material misstatement, whether due to fraud or error, in the GHG Statement. In making those risk assessments, GHD considered internal control relevant to Woodside’s preparation of the subject matter. A reasonable assurance engagement also includes: – Assessing the suitability of Woodside’s use of the reporting criteria for the GHG Statement, as the basis for preparing the GHG statement. – Evaluating the appropriateness of quantification methods and reporting policies used, and the reasonableness of estimates made by Woodside. – Evaluating the completeness and accuracy of recording, aggregation and transcription of source data. We believe that the evidence we have obtained is sufficient and appropriate to provide a basis for our opinion. Use of our statement This statement has been prepared for Woodside in accordance with our engagement terms dated 25 November 2022. GHD disclaim any assumption of responsibility for any reliance on this statement for any purpose other than that for which it was prepared being the reporting on our reasonable assurance audit. Our agreed engagement only included the metrics described in this assurance for the year ended 31 December 2022. Accordingly, we have not provided assurance over any other GHG data or statements presented elsewhere or any other data or statements contained within Woodside’s Sustainable Development Report 2022. Whilst our assurance procedures included reviewing information contained on Woodside’s website at the date of this assurance statement, our opinion does not extend to statements, data or information presented therein. It is noted that greenhouse gas emissions quantification is subject to inherent uncertainty because of incomplete scientific knowledge used to determine emissions factors and the values needed to combine emissions of different gases. Inherent limitations There are inherent limitations in performing assurance—for example, assurance engagements are based on selective testing of the information being examined—and because of this, it is possible that fraud or error may occur and not be detected. An assurance engagement is not designed to detect all misstatements, as an assurance engagement is not performed continuously throughout the period that is the subject of the engagement and the procedures are performed on a test basis. The opinion expressed in our Independent Assurance Statement has been formed on the above basis. Further Limitations This report has been prepared by GHD for Woodside Energy Group Ltd and may only be used and relied on by Woodside Energy Group Ltd for the purpose of reporting on the GHG Statement presented in Woodside’s 2022 Sustainable Development Report. GHD otherwise disclaims responsibility to any person other than Woodside Energy Group Ltd arising in connection with this report. GHD also excludes implied warranties and conditions, to the extent legally permissible. The services undertaken by GHD in connection with preparing this report were limited to those specifically detailed in the report and are subject to the scope limitations set out in the report. The opinions, conclusions and any recommendations in this report are based on conditions encountered and information reviewed at the date of preparation of the report. GHD has no responsibility or obligation to update this report to account for events or changes occurring subsequent to the date that the report was prepared. Reasonable Assurance Opinion In our opinion, the metrics in Woodside’s GHG Statement for the year ended 31 December 2022 on pages 27—31 and supporting data tables of Woodside’s Sustainable Development Report 2022 (over which we have provided reasonable assurance), have been prepared correctly, in all material respects. Limited Assurance Opinion Nothing has come to our attention to suggest that the metrics in Woodside’s GHG Statement for the year ended 31 December 2022 on pages 27—31 and supporting data tables of Woodside’s Sustainable Development Report 2022 (over which we have provided limited assurance), have not been prepared correctly in all material respects. Tom Young Lead Greenhouse Gas Auditor, RGEA Category 2, GHD Pty Ltd 22 February 2023 Woodside Energy Group Ltd | 125
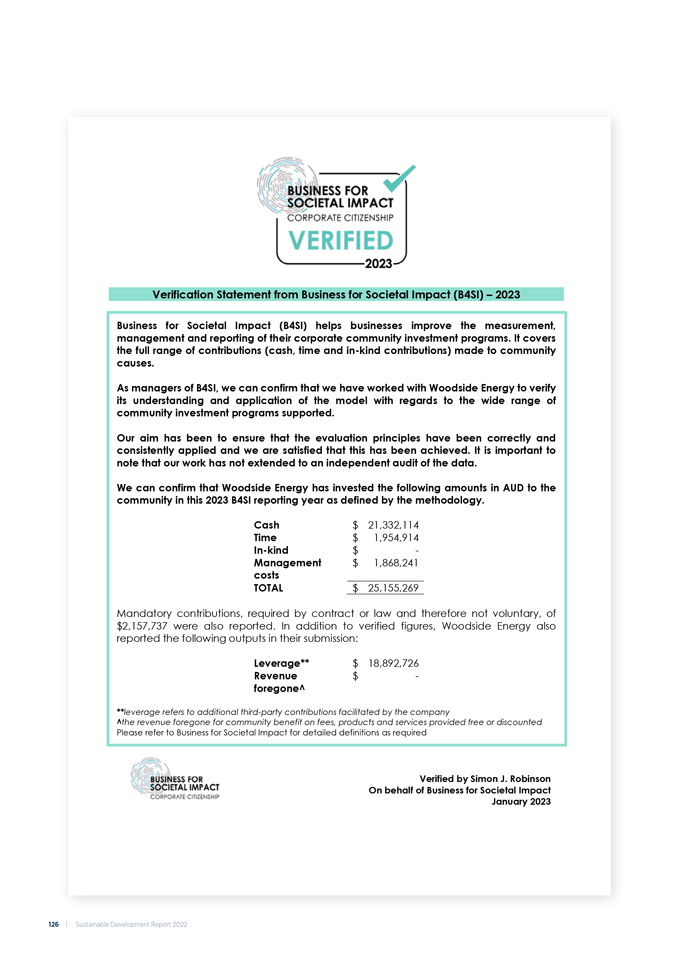
Verification Statement from Business for Societal Impact (B4SI) – 2023 Business for Societal Impact (B4SI) helps businesses improve the measurement, management and reporting of their corporate community investment programs. It covers the full range of contributions (cash, time and in-kind contributions) made to community causes. As managers of B4SI, we can confirm that we have worked with Woodside Energy to verify its understanding and application of the model with regards to the wide range of community investment programs supported. Our aim has been to ensure that the evaluation principles have been correctly and consistently applied and we are satisfied that this has been achieved. It is important to note that our work has not extended to an independent audit of the data. We can confirm that Woodside Energy has invested the following amounts in AUD to the community in this 2023 B4SI reporting year as defined by the methodology. Cash $ 21,332,114 Time $ 1,954,914 In-kind $—Management costs $ 1,868,241 TOTAL $ 25,155,269 Mandatory contributions, required by contract or law and therefore not voluntary, of $2,157,737 were also reported. In addition to verified figures, Woodside Energy also reported the following outputs in their submission: Leverage** $ 18,892,726 Revenue foregone^ $—**leverage refers to additional third-party contributions facilitated by the company ^the revenue foregone for community benefit on fees, products and services provided free or discounted Please refer to Business for Societal Impact for detailed definitions as required Verified by Simon J. Robinson On behalf of Business for Societal Impact January 2023 126 | Sustainable Development Report 2022

Head Office Woodside Energy Group Ltd Mia Yellagonga 11 Mount Street Perth WA 6000 Postal Address GPO Box D188 Perth WA 6840 Australia T +61 8 9348 4000 F +61 8 9214 2777 E companyinfo@woodside.com Woodside Energy Group Ltd ABN 55 004 898 962 woodside.com