Exhibit 99.2

Woodside Energy Group Ltd
ACN 004 898 962
Mia Yellagonga
11 Mount Street
Perth WA 6000
Australia
T +61 8 9348 4000
www.woodside.com
ASX: WDS
NYSE: WDS
LSE: WDS
Announcement
Tuesday, 22 August 2023
HALF-YEAR 2023 RESULTS TELECONFERENCE AND PRESENTATION
A teleconference providing an overview of the half-year 2023 results and a question-and-answer session will be hosted by Woodside CEO and Managing Director, Meg O’Neill, and Chief Financial Officer, Graham Tiver, today at 08:00 AWST / 10:00 AEST (19:00 CDT on Monday, 21 August 2023).
We recommend participants pre-register 5 to 10 minutes prior to the event with one of the following links:
| • | https://webcast.openbriefing .com/wds-hyr-2023/ to view the presentation and listen to a live stream of the question-and-answer session |
| • | https://s1.c-conf. com/diamondpass/10031114-ldyp34.html to participate in the question-and-answer session. Following pre-registration, participants will receive the teleconference details and a unique access passcode. |
The half-year results briefing pack follows this announcement and will be referred to during the teleconference. The briefing pack, Half-Year Report 2023 and teleconference archive will also be available on the Woodside website (www.woodside.com).
| Contacts: | ||||
| INVESTORS | MEDIA | |||
| Matthew Turnbull (Group) | Christine Forster | |||
| M: +61 410 471 079 | M: +61 484 112 469 | |||
| E: christine.forster@woodside.com | ||||
| Sarah Peyman (Australia) | ||||
| M: +61 457 513 249 | ||||
| Rohan Goudge (US) | ||||
| M: +1 (713) 679-1550 | ||||
| E: investor@woodside.com | ||||
This announcement was approved and authorised for release by Woodside’s Disclosure Committee.

HALF-YEAR RESULTS BRIEFING 2023 22 August 2023 www.woodside.com investor@woodside.com
Disclaimer, important notes and assumptions Information historical or present facts, are forward-looking statements and generally may be identified by the use of forward-looking words such as ‘guidance’, ‘foresee’, ‘likely’, ‘potential’, ‘anticipate’, ‘believe’, ‘aim’, ‘estimate’, ‘expect’, ‘intend’, ‘may’, • This presentation has been prepared by Woodside Energy Group Ltd (“Woodside”). ‘target’, ‘plan’, ‘strategy’, ‘forecast’, ‘outlook’, ‘project’, ‘schedule’, ‘will’, ‘should’, ‘seek’ and other similar words or • All information included in this presentation, including any forward-looking statements, reflects Woodside’s views held as expressions. Similarly, statements that describe the objectives, plans, goals or expectations of Woodside are forward- at the date of this presentation and, except as required by applicable law, neither Woodside, its related bodies corporate, looking statements. nor any of their respective officers, directors, employees, advisers or representatives (“Beneficiaries”) intends to, or • Forward-looking statements in this presentation are not guidance, forecasts, guarantees or predictions of future events or undertakes to, or assumes any obligation to, provide any additional information or update or revise any information or performance, but are in the nature of future expectations that are based on management’s current expectations and forward-looking statements in this presentation after the date of this presentation, either to make them conform to actual assumptions. Those statements and any assumptions on which they are based are subject to change without notice and results or as a result of new information, future events, changes in Woodside’s expectations or otherwise. are subject to inherent known and unknown risks, uncertainties, assumptions and other factors, many of which are • This presentation may contain industry, market and competitive position data that is based on industry publications and beyond the control of Woodside, its related bodies corporate and their respective Beneficiaries. Important factors that studies conducted by third parties as well as Woodside’s internal estimates and research. While Woodside believes that could cause actual results to differ materially from those in the forward-looking statements include, but are not limited each of these publications and third party studies is reliable and has been prepared by a reputable source, Woodside has to, fluctuations in commodity prices, actual demand, currency fluctuations, geotechnical factors, drilling and production not independently verified the market and industry data obtained from these third party sources and cannot guarantee results, gas commercialisation, development progress, operating results, engineering estimates, reserve and resource the accuracy or completeness of such data. Accordingly, undue reliance should not be placed on any of the industry, estimates, loss of market, industry competition, environmental risks, climate related risks, physical risks, legislative, fiscal market and competitive position data contained in this presentation. and regulatory developments, changes in accounting standards, economic and financial markets conditions in various • To the maximum extent permitted by law, neither Woodside, its related bodies corporate, nor any of their respective countries and regions, political risks, project delay or advancement, regulatory approvals, the impact of armed conflict Beneficiaries, assume any liability (including liability for equitable, statutory or other damages) in connection with, any and political instability (such as the ongoing conflict in Ukraine) on economic activity and oil and gas supply and responsibility for, or make any representation or warranty (express or implied) as to, the fairness, currency, accuracy, demand, cost estimates, and the effect of future regulatory or legislative actions on Woodside or the industries in which it adequacy, reliability or completeness of the information or any opinions expressed in this presentation or the operates, including potential changes to tax laws, and the impact of general economic conditions, inflationary conditions, reasonableness of any underlying assumptions. prevailing exchange rates and interest rates and conditions in financial markets. No offer or advice • A more detailed summary of the key risks relating to Woodside and its business can be found in the “Risk” section of Woodside’s most recent Annual Report released to the Australian Securities Exchange and the London Stock Exchange • This presentation is not intended to and does not constitute, form part of, or contain an offer or invitation to sell to and in Woodside’s most recent Annual Report on Form 20-F filed with the United States Securities and Exchange Woodside shareholders (or any other person), or a solicitation of an offer from Woodside shareholders (or any other Commission and available on the Woodside website at https://www.woodside.com/investors/reports-investor-briefings. person), or a solicitation of any vote or approval from Woodside shareholders (or any other person) in any jurisdiction. You should review and have regard to these risks when considering the information contained in this presentation. • This presentation has been prepared without reference to the investment objectives, financial and taxation situation or • Investors are strongly cautioned not to place undue reliance on any forward-looking statements. Actual results or particular needs of any Woodside shareholder or any other person. The information contained in this presentation does performance may vary materially from those expressed in, or implied by, any forward-looking statements. not constitute, and should not be taken as, financial product or investment advice. Woodside encourages you to seek independent legal, financial, taxation and other professional advice before making any investment decision. Notes to petroleum resource estimates • This presentation shall not be distributed, transmitted, published, reproduced or otherwise made available to any other • Unless otherwise stated, all petroleum resource estimates are quoted as at the effective date (i.e. 31 December 2022) of person, in whole or in part, directly or indirectly, for any purposes whatsoever. In particular, this presentation and the the Reserves and Resources Statement included in Woodside’s most recent Annual Report released to the Australian information contained herein may not be taken or transmitted, in, into or from and may not be copied, forwarded, Securities Exchange and the London Stock Exchange and in Woodside’s most recent Annual Report on Form 20-F filed distributed or transmitted in or into any jurisdiction in which such release, publication or distribution would be unlawful. with the United States Securities and Exchange Commission (SEC) and available on the Woodside website at The release, presentation, publication or distribution of this presentation, in whole or in part, in certain jurisdictions may https://www.woodside.com/investors/reports-investor-briefings, net Woodside share at standard oilfield conditions of be restricted by law or regulation, and persons into whose possession this presentation comes should inform themselves 14.696 psi (101.325 kPa) and 60 degrees Fahrenheit (15.56 degrees Celsius). about, and observe, any such restrictions. Any failure to comply with these restrictions may constitute a violation of the • Woodside estimates and reports its Proved (1P) Reserves in accordance with the SEC regulations, which are also laws of the relevant jurisdiction. Woodside does not accept liability to any person in relation to the distribution or compliant with SPE-PRMS guidelines. SEC-compliant Proved (1P) Reserves estimates use a more restrictive, rules-based possession of this document in or from any such jurisdiction. approach and are generally lower than estimates prepared solely in accordance with SPE-PRMS guidelines due to, among Forward-looking statements other things, the requirement to use commodity prices based on the average price during the 12-month period in the reporting company’s fiscal year. Woodside estimates and reports its Proved plus Probable (2P) Reserves and Best Estimate • This presentation contains forward-looking statements with respect to Woodside’s business and operations, market (2C) Contingent Resources in accordance with SPE-PRMS guidelines. conditions, results of operations and financial condition, including, for example, but not limited to, statements regarding development, completion and execution of Woodside’s projects, expectations regarding future capital expenditures, • Woodside is not aware of any new information or data that materially affects the information included in the Reserves future results of projects, operating activities, new energy products, expectations and plans for renewables production and Resources Update. All the material assumptions and technical parameters underpinning the estimates in the Reserves capacity and investments in, and development of, renewables projects, expectations and guidance with respect to and Resources Update continue to apply and have not materially changed. production, investment expenditure and gas hub exposure for 2023, and expectations regarding the achievement of Woodside’s net equity Scope 1 and 2 greenhouse gas emissions targets]. All statements, other than statements of 2
Disclaimer, important notes and assumptions (continued) Notes to petroleum resource estimates (continued) These growth opportunities are subject to relevant joint venture participant approvals, commercial arrangements with third parties and regulatory approvals being obtained in the timeframe contemplated or at all. Woodside expresses no • Woodside reports its petroleum resource estimates inclusive of all fuel consumed in operations. view as to whether its joint venture participants will agree with and support Woodside’s current position in relation to • For offshore oil projects, the reference point is defined as the outlet of the floating production storage and offloading these opportunities, or such commercial arrangements and regulatory approvals will be obtained. Additional assumptions facility (FPSO) or platform, while for the onshore gas projects the reference point is defined as the outlet of the relevant to particular targets or other statements in this presentation may be set out in the relevant slides. Any such downstream (onshore) gas processing facility. additional assumptions are in addition to the assumptions and qualifications applicable to the presentation as a whole. • Woodside uses both deterministic and probabilistic methods for the estimation of Reserves and Contingent Resources at Climate strategy and emissions data the field and project levels. All Proved (1P) Reserves estimates have been estimated using deterministic methodology and • All greenhouse gas emissions data in this presentation are estimates, due to the inherent uncertainty and limitations in reported on a net interest basis in accordance with the SEC regulations and have been determined in accordance with measuring or quantifying greenhouse gas emissions, and our methodologies for measuring or quantifying greenhouse SEC Rule 4-10(a) of Regulation S-X. Unless otherwise stated, all petroleum estimates reported at the company or region gas emissions may evolve as best practices continue to develop and data quality and quantity continue to improve. level are aggregated by arithmetic summation by category. The aggregated Proved (1P) Reserves may be a conservative estimate due to the portfolio effects of arithmetic summation. • Woodside “greenhouse gas” or “emissions” information reported are net equity Scope 1 greenhouse emissions, Scope 2 6 greenhouse emissions, and/or Scope 3 greenhouse emissions, unless otherwise stated. • ‘MMboe’ means millions (10 ) of barrels of oil equivalent. Natural gas volumes are converted to oil equivalent volumes via a constant conversion factor, which for Woodside is 5.7 Bcf of dry gas per 1 MMboe. Volumes of natural gas liquids, • For more information on Woodside’s climate strategy, including references to “lower carbon” as part of that strategy, and oil and condensate are converted from MMbbl to MMboe on a 1:1 ratio. emissions data refer to Woodside’s Climate Report 2022 available on the Woodside website at https://www.woodside.com/sustainability/climate-change. The glossary and footnotes to this presentation provide further Disclosure of reserve information and cautionary note to US investors clarification of “lower carbon” where applicable. • Woodside is an Australian company listed on the Australian Securities Exchange, the New York Stock Exchange and the Non-IFRS Financial Measures London Stock Exchange. As noted above, Woodside estimates and reports its Proved (1P) Reserves in accordance with the SEC regulations, which are also compliant with SPE-PRMS guidelines, and estimates and reports its Proved plus Probable • Throughout this presentation, a range of financial and non-financial measures are used to assess Woodside’s (2P) Reserves and Best Estimate (2C) Contingent Resources in accordance with SPE-PRMS guidelines. Woodside reports all performance, including a number of financial measures that are not defined in, and have not been prepared in of its petroleum resource estimates using definitions consistent with the 2018 Society of Petroleum Engineers (SPE)/World accordance with, International Financial Reporting Standards (IFRS) and are not recognised measures of financial Petroleum Council (WPC)/American Association of Petroleum Geologists (AAPG)/Society of Petroleum Evaluation performance or liquidity under IFRS (Non-IFRS Financial Measures). These measures include EBIT, EBITDA, EBITDA Engineers (SPEE) Petroleum Resources Management System (PRMS). excluding impairment, Gearing, Underlying NPAT, Net debt, Free cash flow, Cash margin, Capital expenditure, Exploration expenditure. These Non-IFRS Financial Measures are defined in the glossary section of this presentation. A quantitative • The SEC permits oil and gas companies, in their filings with the SEC, to disclose only Proved, Probable and Possible reconciliation of these measures to the most directly comparable financial measure calculated and presented in Reserves, and only when such Reserves have been determined in accordance with the SEC guidelines. In this presentation, accordance with IFRS can be found in Woodside’s Half Year Report for the period ended 30 June 2023. Woodside includes estimates of quantities of oil and gas using certain terms, such as “Proved plus Probable (2P) Reserves”, “Best Estimate (2C) Contingent Resources”, “Reserves and Contingent Resources”, “Proved plus Probable”, • Woodside’s management uses these measures to monitor Woodside’s financial performance alongside IFRS measures to “Developed and Undeveloped”, “Probable Developed”, “Probable Undeveloped”, “Contingent Resources” or other improve the comparability of information between reporting periods and business units and Woodside believes that the descriptions of volumes of reserves, which terms include quantities of oil and gas that may not meet the SEC’s definitions Non-IFRS Financial Measures it presents provide a useful means through which to examine the underlying performance of of proved, probable and possible reserves, and which the SEC’s guidelines strictly prohibit Woodside from including in its business. filings with the SEC. These types of estimates do not represent, and are not intended to represent, any category of • Undue reliance should not be placed on the Non-IFRS Financial Measures contained in this presentation and these Non- reserves based on SEC definitions, and may differ from and may not be comparable to the same or similarly-named IFRS Financial Measures should be considered in addition to, and not as a substitute for, or as superior to, measures of measures used by other companies. These estimates are by their nature more speculative than estimates of proved financial performance, financial position or cash flows reported in accordance with IFRS. Non-IFRS Financial Measures are reserves, and accordingly are subject to substantially greater risk of being recovered by Woodside. In addition, actual not uniformly defined by all companies, including those in Woodside’s industry. Accordingly, they may not be locations drilled and quantities that may be ultimately recovered from Woodside’s properties may differ substantially. US comparable with similarly titled measures and disclosures by other companies. investors are urged to consider closely the disclosures in Woodside’s most recent Annual Report on Form 20-F filed with Other important information the SEC and available on the Woodside website at https://www.woodside.com/investors/reports-investor-briefings and its • All references to dollars, cents or $ in this presentation are to US currency, unless otherwise stated. other filings with the SEC, which are available from Woodside at https://www.woodside.com. These reports can also be obtained from the SEC at www.sec.gov. • References to “Woodside” may be references to Woodside Energy Group Ltd and/or its applicable subsidiaries (as the Assumptions context requires). • This presentation does not include any express or implied prices at which Woodside will buy or sell financial products. • Unless otherwise indicated, the targets set out in this presentation have been estimated on the basis of a variety of economic assumptions including: (1) US$70/bbl Brent long-term oil price (2022 real terms, inflated at 2.0%); (2) currently • A securities rating is not a recommendation to buy, sell or hold securities and may be subject to revision or withdrawal at sanctioned projects being delivered in accordance with their current project schedules; and (3) applicable growth any time. opportunities being sanctioned and delivered in accordance with the target schedules provided in this presentation. 3
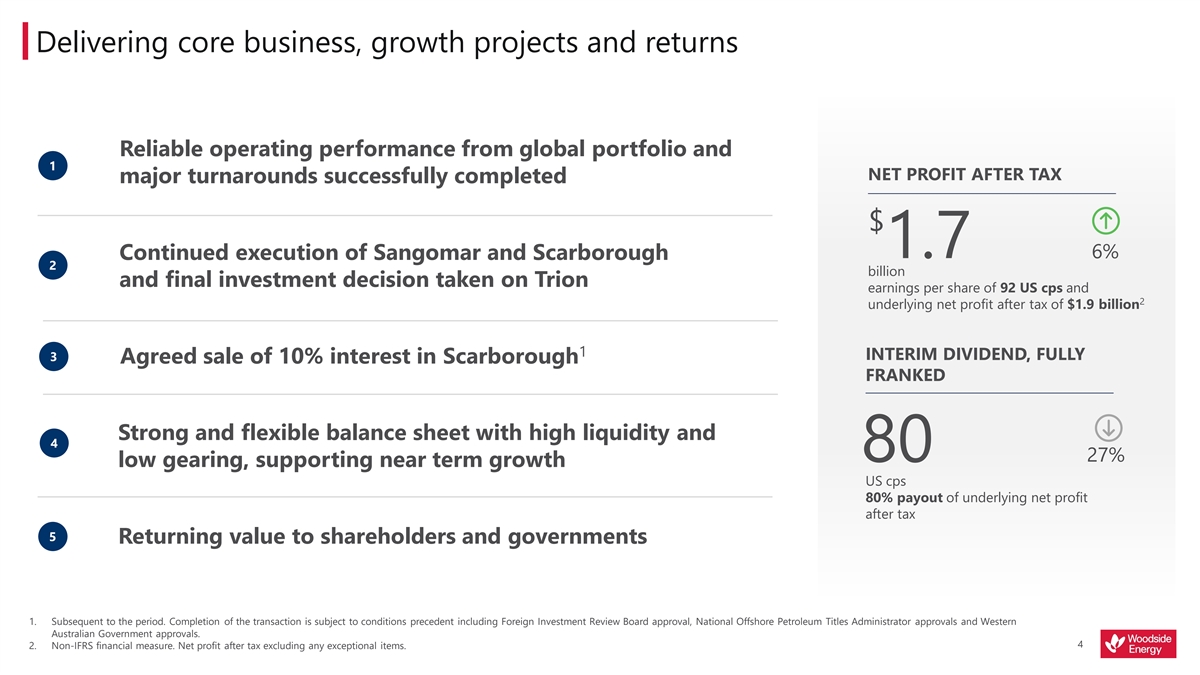
Delivering core business, growth projects and returns Reliable operating performance from global portfolio and 1 NET PROFIT AFTER TAX major turnarounds successfully completed $ 1.7 6% Continued execution of Sangomar and Scarborough 2 billion and final investment decision taken on Trion earnings per share of 92 US cps and 2 underlying net profit after tax of $1.9 billion 1 INTERIM DIVIDEND, FULLY 3 Agreed sale of 10% interest in Scarborough FRANKED Strong and flexible balance sheet with high liquidity and 4 80 27% low gearing, supporting near term growth US cps 80% payout of underlying net profit after tax 5 Returning value to shareholders and governments 1. Subsequent to the period. Completion of the transaction is subject to conditions precedent including Foreign Investment Review Board approval, National Offshore Petroleum Titles Administrator approvals and Western Australian Government approvals. 4 2. Non-IFRS financial measure. Net profit after tax excluding any exceptional items.
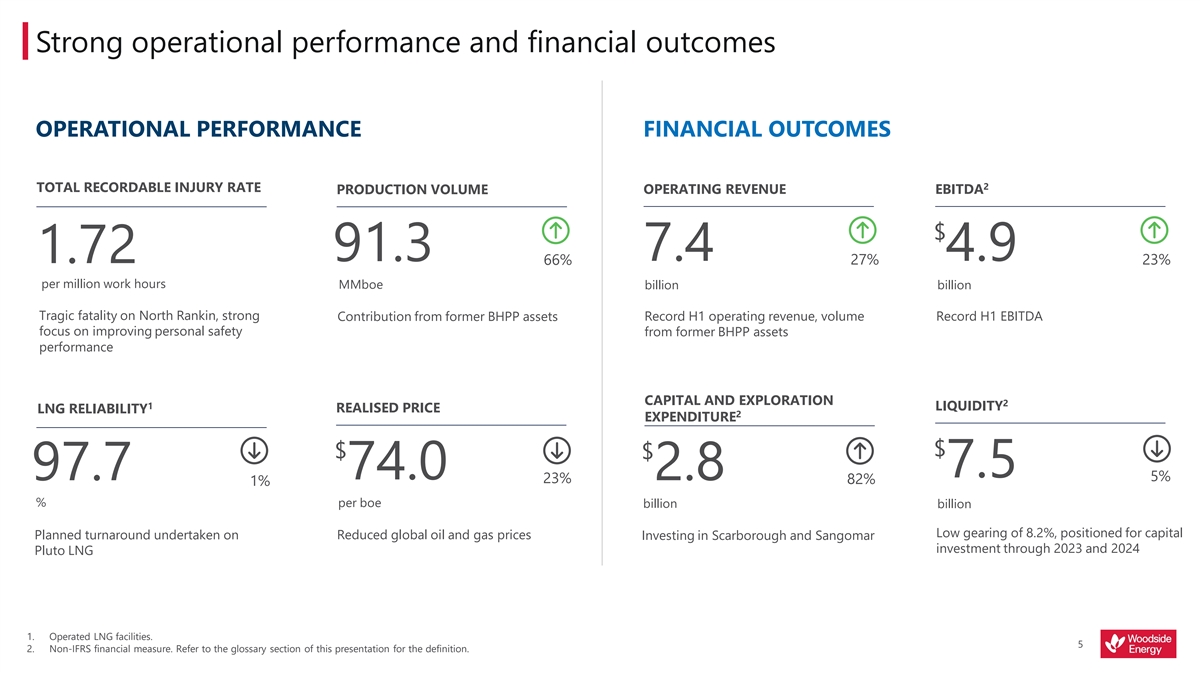
Strong operational performance and financial outcomes OPERATIONAL PERFORMANCE FINANCIAL OUTCOMES 2 TOTAL RECORDABLE INJURY RATE OPERATING REVENUE EBITDA PRODUCTION VOLUME $ 91.3 7.4 4.9 1.72 66% 27% 23% per million work hours MMboe billion billion Tragic fatality on North Rankin, strong Contribution from former BHPP assets Record H1 operating revenue, volume Record H1 EBITDA focus on improving personal safety from former BHPP assets performance CAPITAL AND EXPLORATION 2 1 LIQUIDITY REALISED PRICE LNG RELIABILITY 2 EXPENDITURE $ $ $ 7.5 97.7 74.0 2.8 5% 23% 82% 1% % per boe billion billion Low gearing of 8.2%, positioned for capital Planned turnaround undertaken on Reduced global oil and gas prices Investing in Scarborough and Sangomar investment through 2023 and 2024 Pluto LNG 1. Operated LNG facilities. 5 2. Non-IFRS financial measure. Refer to the glossary section of this presentation for the definition.
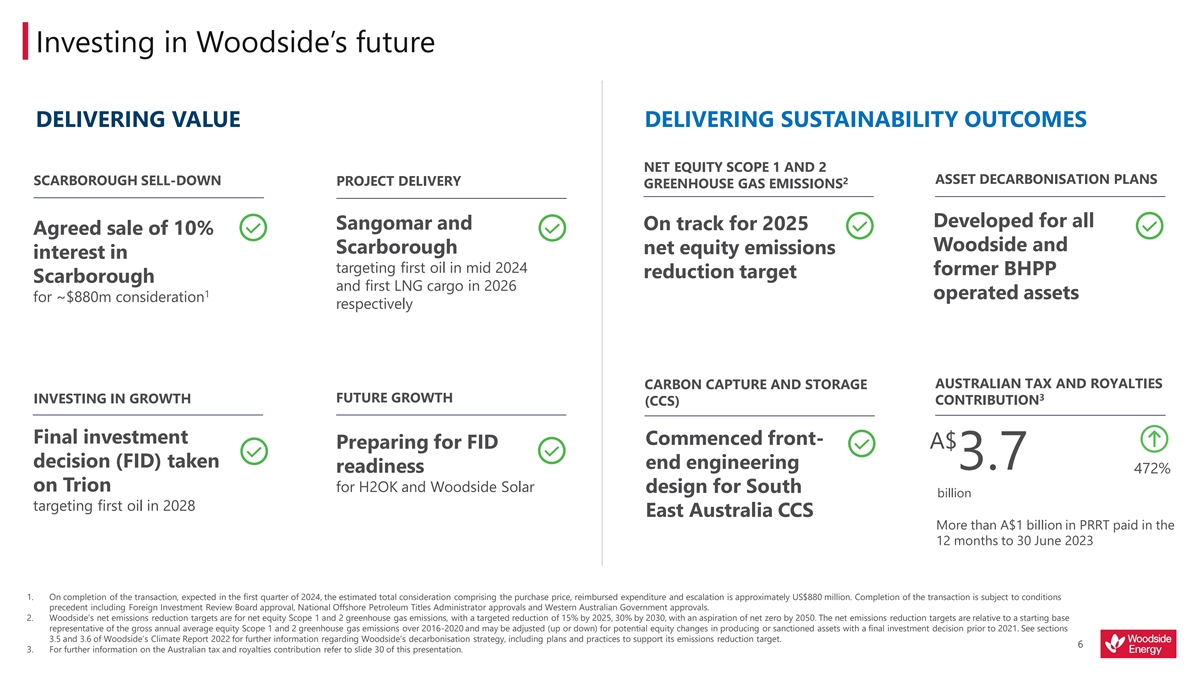
Investing in Woodside’s future DELIVERING VALUE DELIVERING SUSTAINABILITY OUTCOMES NET EQUITY SCOPE 1 AND 2 2 ASSET DECARBONISATION PLANS SCARBOROUGH SELL-DOWN PROJECT DELIVERY GREENHOUSE GAS EMISSIONS Developed for all Sangomar and On track for 2025 Agreed sale of 10% Woodside and Scarborough net equity emissions interest in targeting first oil in mid 2024 former BHPP reduction target Scarborough and first LNG cargo in 2026 1 operated assets for ~$880m consideration respectively AUSTRALIAN TAX AND ROYALTIES CARBON CAPTURE AND STORAGE 3 FUTURE GROWTH INVESTING IN GROWTH CONTRIBUTION (CCS) Final investment Commenced front- Preparing for FID A$ decision (FID) taken end engineering 3.7 readiness 472% on Trion for H2OK and Woodside Solar design for South billion targeting first oil in 2028 East Australia CCS More than A$1 billion in PRRT paid in the 12 months to 30 June 2023 1. On completion of the transaction, expected in the first quarter of 2024, the estimated total consideration comprising the purchase price, reimbursed expenditure and escalation is approximately US$880 million. Completion of the transaction is subject to conditions precedent including Foreign Investment Review Board approval, National Offshore Petroleum Titles Administrator approvals and Western Australian Government approvals. 2. Woodside’s net emissions reduction targets are for net equity Scope 1 and 2 greenhouse gas emissions, with a targeted reduction of 15% by 2025, 30% by 2030, with an aspiration of net zero by 2050. The net emissions reduction targets are relative to a starting base representative of the gross annual average equity Scope 1 and 2 greenhouse gas emissions over 2016-2020 and may be adjusted (up or down) for potential equity changes in producing or sanctioned assets with a final investment decision prior to 2021. See sections 3.5 and 3.6 of Woodside’s Climate Report 2022 for further information regarding Woodside’s decarbonisation strategy, including plans and practices to support its emissions reduction target. 6 3. For further information on the Australian tax and royalties contribution refer to slide 30 of this presentation.
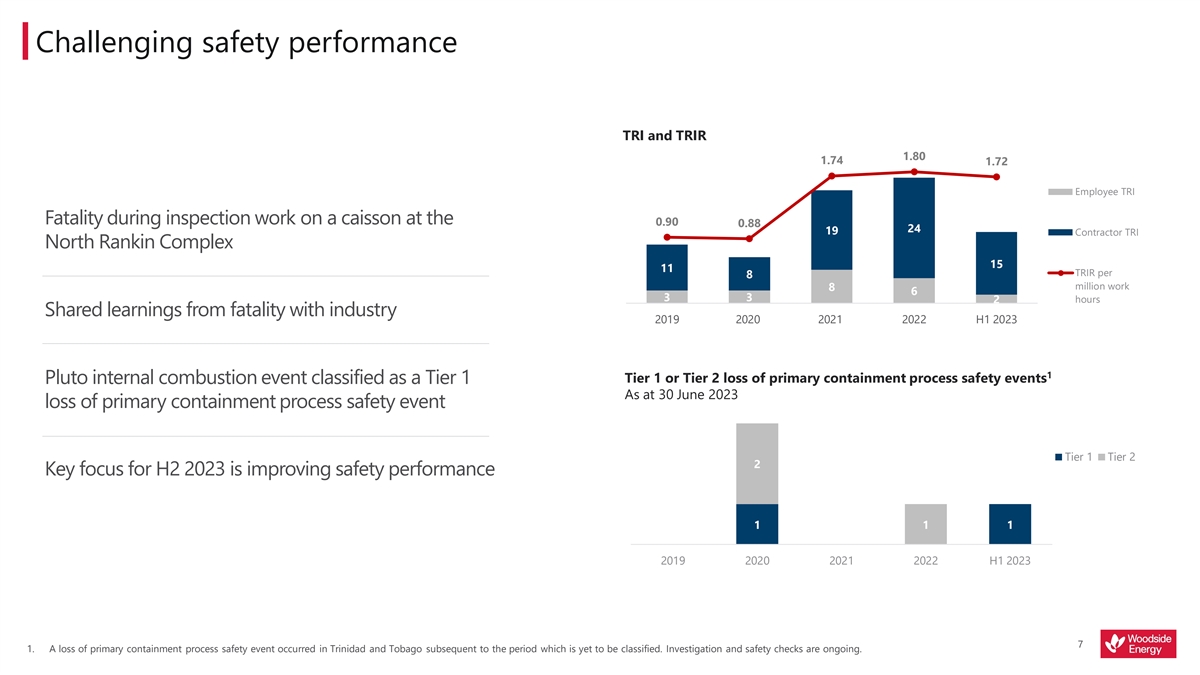
Challenging safety performance TRI and TRIR 1.80 35 2.00 1.74 1.72 30 Employee TRI 1.50 25 20 Fatality during inspection work on a caisson at the 0.90 0.88 24 1.00 19 Contractor TRI 15 North Rankin Complex 10 15 0.50 11 TRIR per 8 5 million work 8 6 3 3 hours 2 0 0.00 Shared learnings from fatality with industry 2019 2020 2021 2022 H1 2023 1 Tier 1 or Tier 2 loss of primary containment process safety events Pluto internal combustion event classified as a Tier 1 As at 30 June 2023 loss of primary containment process safety event Tier 1 Tier 2 2 Key focus for H2 2023 is improving safety performance 1 1 1 2019 2020 2021 2022 H1 2023 7 1. A loss of primary containment process safety event occurred in Trinidad and Tobago subsequent to the period which is yet to be classified. Investigation and safety checks are ongoing.

Operational performance North West Shelf Project Pluto LNG Other Australia Gulf of Mexico/ Trinidad & Tobago § LNG reliability of 99.9% § Completed planned five-yearly § First production achieved at § LNG reliability of 97.6% achieved in the five months Ngujima-Yin FPSO the Argos platform for Mad 1 prior to turnaround maintenance Dog Phase 2 § 5.4 MMboe of gas processed through Interconnector § Major turnaround completed § Enfield plug and abandonment § Successful appraisal well on onshore and offshore campaign continued with eight drilled in the south-west § On track to receive Waitsia facilities wells permanently plugged part of the Mad Dog field gas for processing § Pluto Remote Operations § Nganhurra riser turret mooring § Wells completed on Shenzi § Progressing negotiation of Centre in Perth fully decommissioning Environment North, first oil expected in key commercial terms to operational Plan approved in July 2023 2023 support Browse to NWS development concept § Installed electrical tie-in § Awarded all major contracts for points supporting potential decommissioning of Enfield, utilisation of solar energy Griffin, Stybarrow and Echo Yodel subsea infrastructure 8 1. Floating, production, storage and offloading (FPSO).
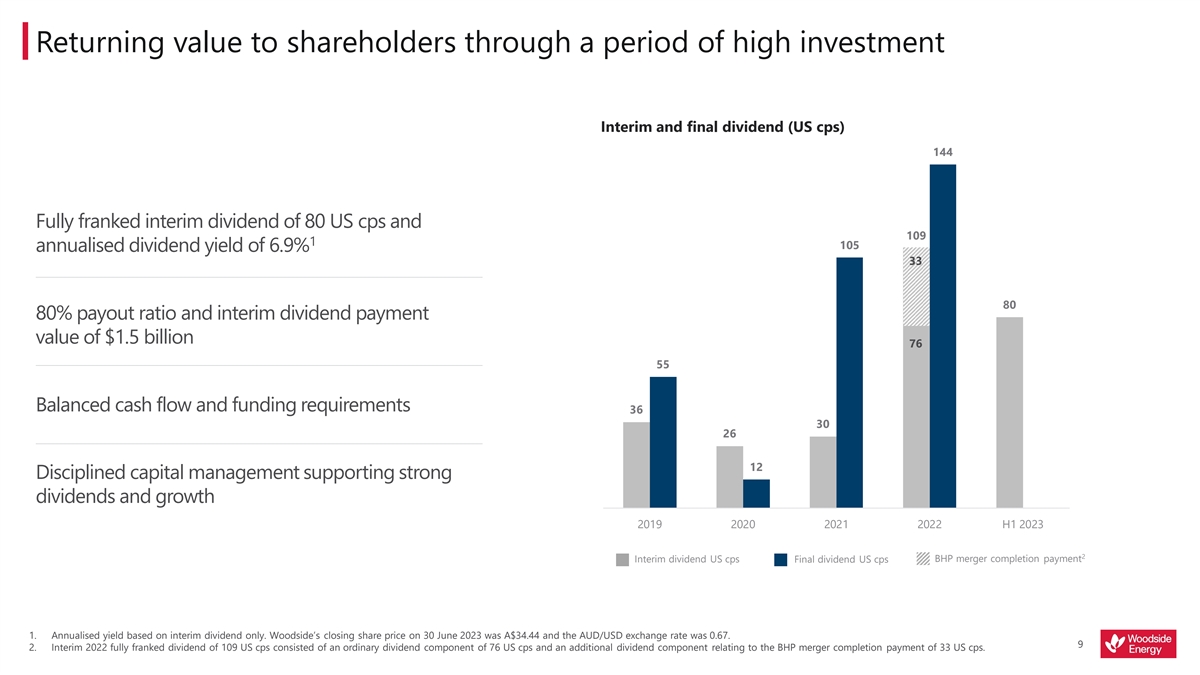
Returning value to shareholders through a period of high investment Interim and final dividend (US cps) 144 Fully franked interim dividend of 80 US cps and 109 1 105 annualised dividend yield of 6.9% 33 80 80% payout ratio and interim dividend payment value of $1.5 billion 76 55 Balanced cash flow and funding requirements 36 30 26 12 Disciplined capital management supporting strong dividends and growth 2019 2020 2021 2022 H1 2023 2 Interim dividend US cps Final dividend US cps BHP merger completion payment 1. Annualised yield based on interim dividend only. Woodside’s closing share price on 30 June 2023 was A$34.44 and the AUD/USD exchange rate was 0.67. 9 2. Interim 2022 fully franked dividend of 109 US cps consisted of an ordinary dividend component of 76 US cps and an additional dividend component relating to the BHP merger completion payment of 33 US cps.
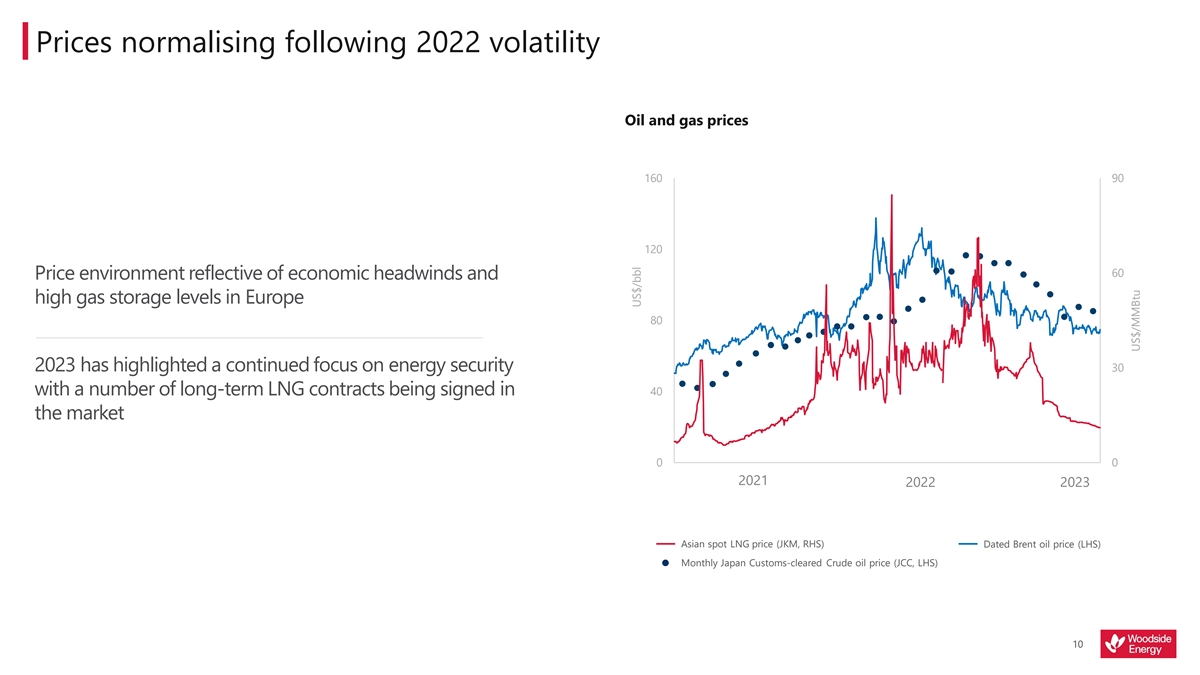
Prices normalising following 2022 volatility Oil and gas prices 160 90 120 60 Price environment reflective of economic headwinds and high gas storage levels in Europe 80 2023 has highlighted a continued focus on energy security 30 40 with a number of long-term LNG contracts being signed in the market 0 0 2021 2022 2023 Asian spot LNG price (JKM, RHS) Dated Brent oil price (LHS) Monthly Japan Customs-cleared Crude oil price (JCC, LHS) 10 US$/bbl January March May July September November January March May July September November January March May US$/MMBtu
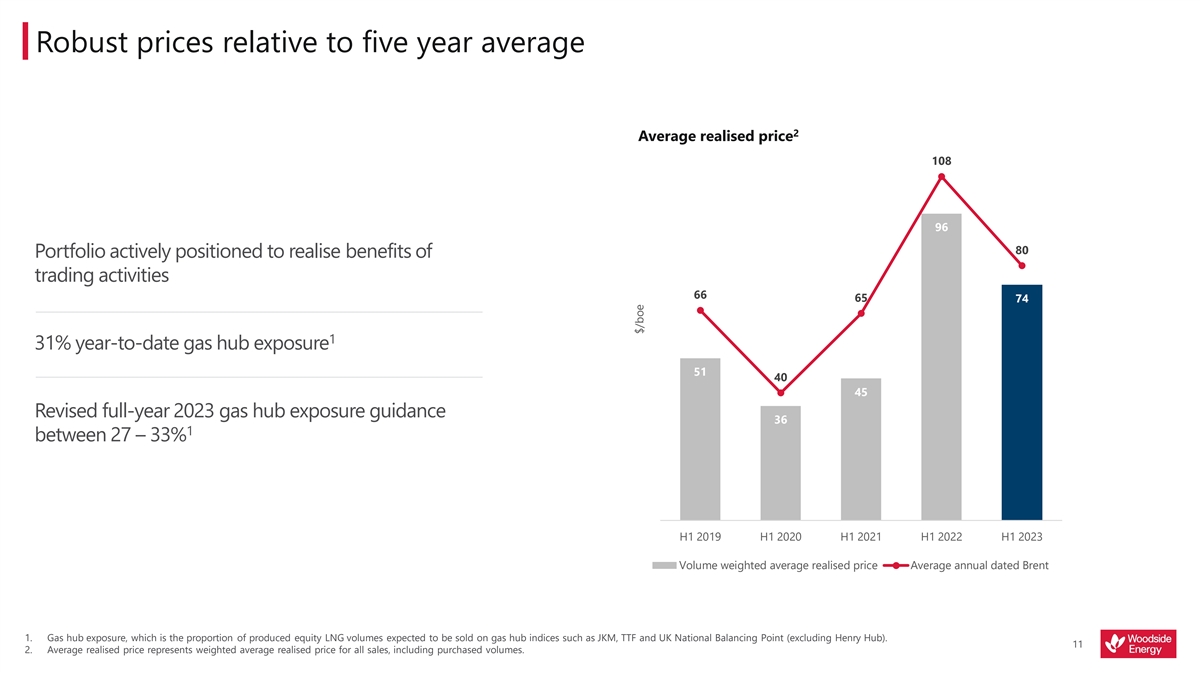
Robust prices relative to five year average 2 Average realised price 108 96 80 Portfolio actively positioned to realise benefits of trading activities 66 65 74 1 31% year-to-date gas hub exposure 51 40 45 Revised full-year 2023 gas hub exposure guidance 36 1 between 27 – 33% H1 2019 H1 2020 H1 2021 H1 2022 H1 2023 Volume weighted average realised price Average annual dated Brent 1. Gas hub exposure, which is the proportion of produced equity LNG volumes expected to be sold on gas hub indices such as JKM, TTF and UK National Balancing Point (excluding Henry Hub). 11 2. Average realised price represents weighted average realised price for all sales, including purchased volumes. $/boe
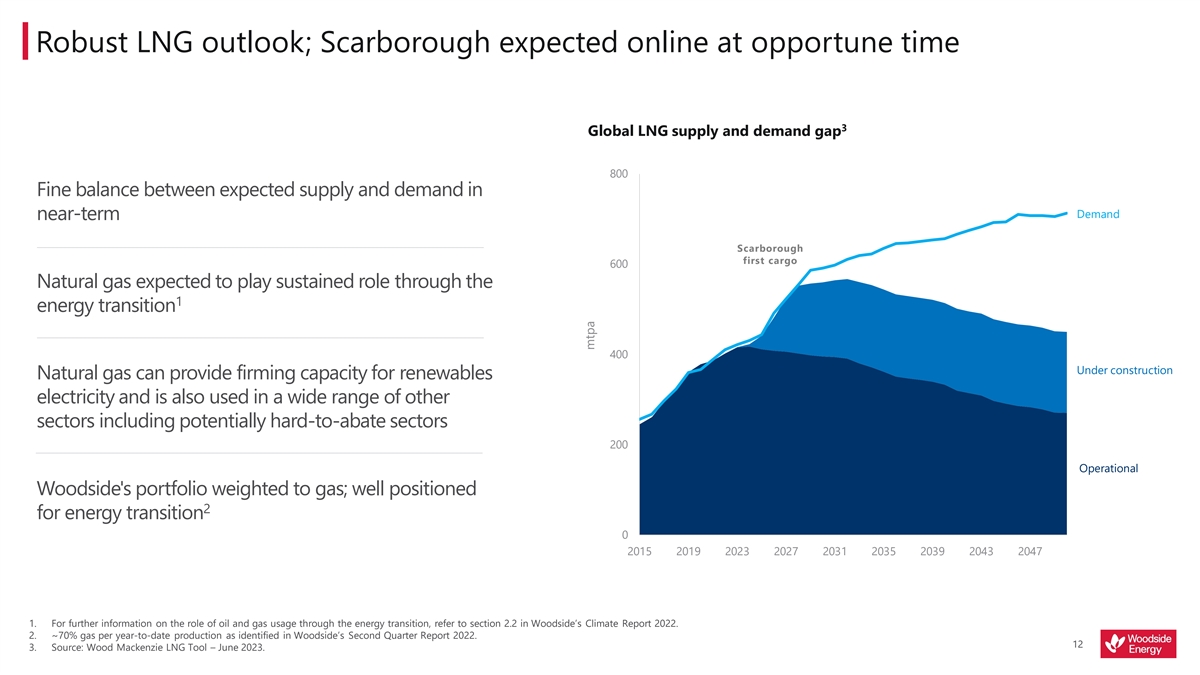
Robust LNG outlook; Scarborough expected online at opportune time 3 Global LNG supply and demand gap 800 Fine balance between expected supply and demand in Demand near-term Scarborough first cargo 600 Natural gas expected to play sustained role through the 1 energy transition 400 Under construction Natural gas can provide firming capacity for renewables electricity and is also used in a wide range of other sectors including potentially hard-to-abate sectors 200 Operational Woodside's portfolio weighted to gas; well positioned 2 for energy transition 0 2015 2019 2023 2027 2031 2035 2039 2043 2047 1. For further information on the role of oil and gas usage through the energy transition, refer to section 2.2 in Woodside’s Climate Report 2022. 2. ~70% gas per year-to-date production as identified in Woodside’s Second Quarter Report 2022. 12 3. Source: Wood Mackenzie LNG Tool – June 2023. mtpa

Sangomar – 88% complete, targeting first oil mid-2024 H1 2023 HIGHLIGHTS § Completed installation and testing of rigid flowlines § Completed 12 of 23 wells, with 11 wells partially complete § Progressed the subsea installation campaign, now 76% complete FPSO Léopold Sédar Senghor Subsea package H2 2023 FOCUS AREAS § Complete FPSO remedial work and pre-commissioning for sail away § Complete subsea installation § Continue development drilling campaign § Advance operational readiness activities Subsea installation campaign FPSO turret 13
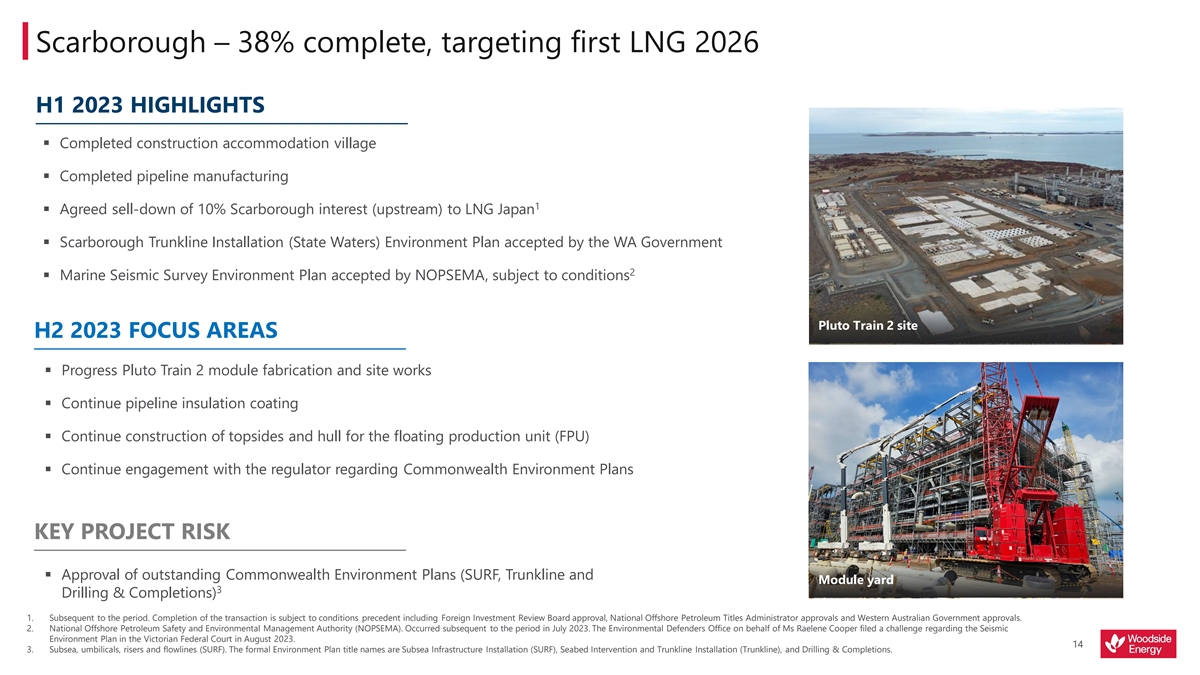
Scarborough – 38% complete, targeting first LNG 2026 H1 2023 HIGHLIGHTS § Completed construction accommodation village § Completed pipeline manufacturing 1 § Agreed sell-down of 10% Scarborough interest (upstream) to LNG Japan § Scarborough Trunkline Installation (State Waters) Environment Plan accepted by the WA Government 2 § Marine Seismic Survey Environment Plan accepted by NOPSEMA, subject to conditions Pluto Train 2 site H2 2023 FOCUS AREAS § Progress Pluto Train 2 module fabrication and site works § Continue pipeline insulation coating § Continue construction of topsides and hull for the floating production unit (FPU) § Continue engagement with the regulator regarding Commonwealth Environment Plans KEY PROJECT RISK § Approval of outstanding Commonwealth Environment Plans (SURF, Trunkline and Module yard 3 Drilling & Completions) 1. Subsequent to the period. Completion of the transaction is subject to conditions precedent including Foreign Investment Review Board approval, National Offshore Petroleum Titles Administrator approvals and Western Australian Government approvals. 2. National Offshore Petroleum Safety and Environmental Management Authority (NOPSEMA). Occurred subsequent to the period in July 2023. The Environmental Defenders Office on behalf of Ms Raelene Cooper filed a challenge regarding the Seismic Environment Plan in the Victorian Federal Court in August 2023. 14 3. Subsea, umbilicals, risers and flowlines (SURF). The formal Environment Plan title names are Subsea Infrastructure Installation (SURF), Seabed Intervention and Trunkline Installation (Trunkline), and Drilling & Completions.
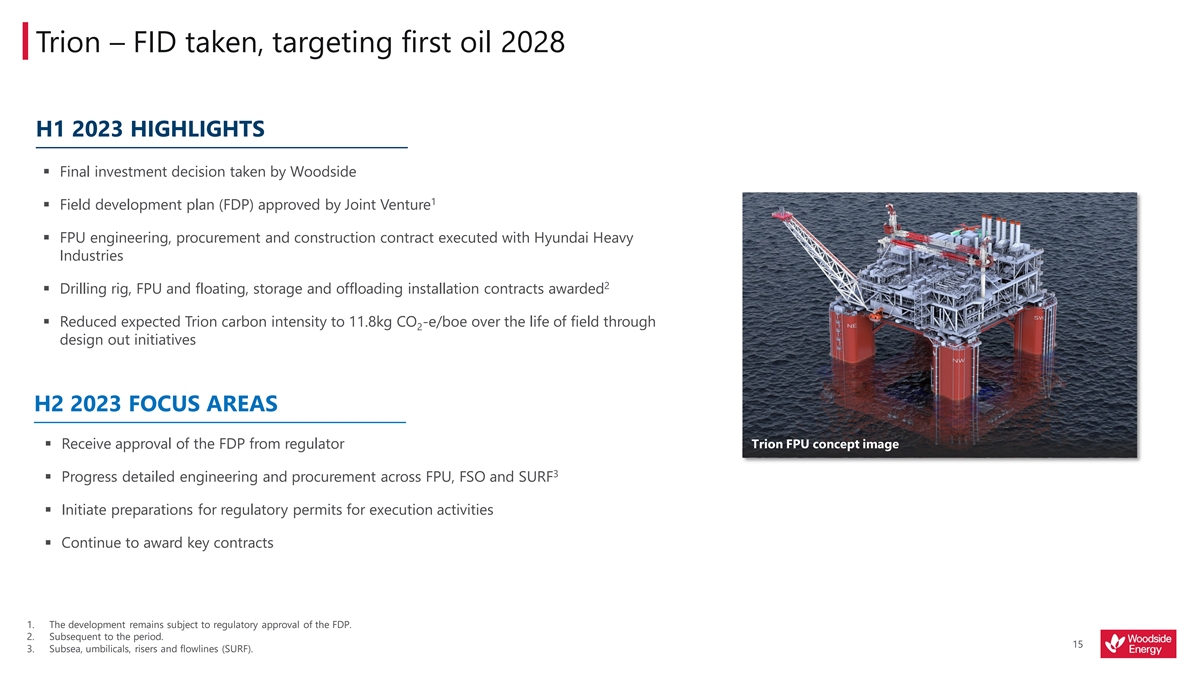
Trion – FID taken, targeting first oil 2028 H1 2023 HIGHLIGHTS § Final investment decision taken by Woodside 1 § Field development plan (FDP) approved by Joint Venture § FPU engineering, procurement and construction contract executed with Hyundai Heavy Industries 2 § Drilling rig, FPU and floating, storage and offloading installation contracts awarded § Reduced expected Trion carbon intensity to 11.8kg CO -e/boe over the life of field through 2 design out initiatives H2 2023 FOCUS AREAS § Receive approval of the FDP from regulator Trion FPU concept image 3 § Progress detailed engineering and procurement across FPU, FSO and SURF § Initiate preparations for regulatory permits for execution activities § Continue to award key contracts 1. The development remains subject to regulatory approval of the FDP. 2. Subsequent to the period. 15 3. Subsea, umbilicals, risers and flowlines (SURF).
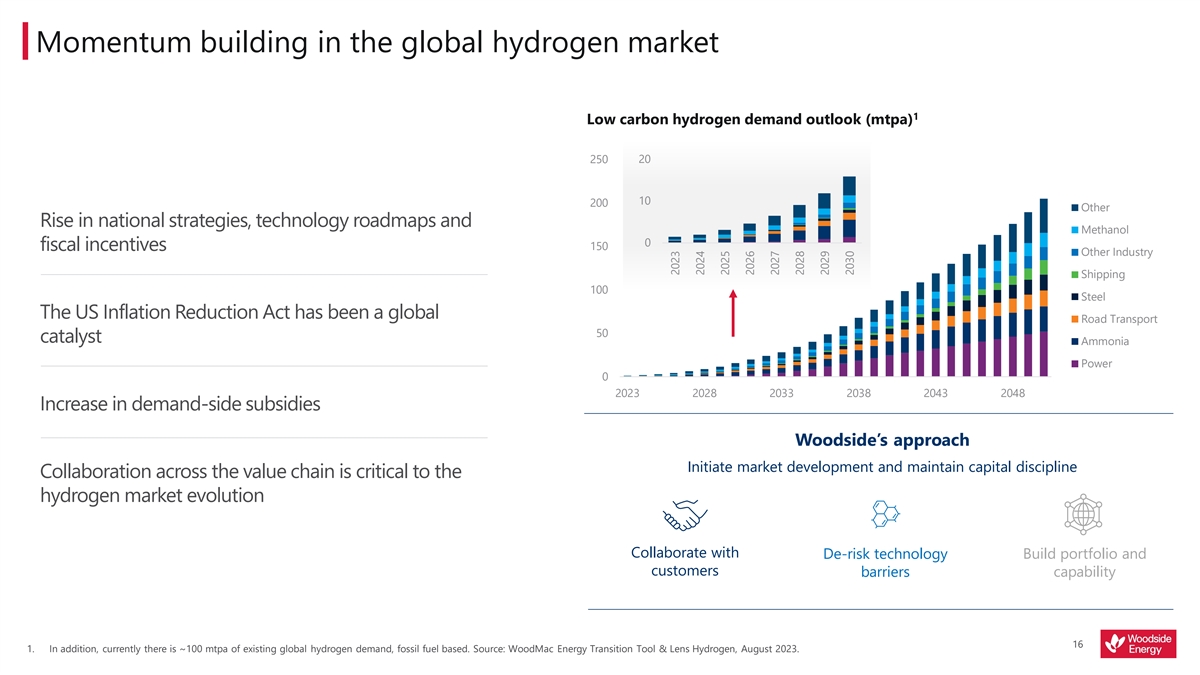
Momentum building in the global hydrogen market 1 Low carbon hydrogen demand outlook (mtpa) 20 250 10 200 Other Rise in national strategies, technology roadmaps and Methanol 0 150 fiscal incentives Other Industry Shipping 100 Steel The US Inflation Reduction Act has been a global Road Transport 50 catalyst Ammonia Power 0 2023 2028 2033 2038 2043 2048 Increase in demand-side subsidies Woodside’s approach Initiate market development and maintain capital discipline Collaboration across the value chain is critical to the hydrogen market evolution Collaborate with De-risk technology Build portfolio and customers barriers capability 16 1. In addition, currently there is ~100 mtpa of existing global hydrogen demand, fossil fuel based. Source: WoodMac Energy Transition Tool & Lens Hydrogen, August 2023. 2023 2024 2025 2026 2027 2028 2029 2030
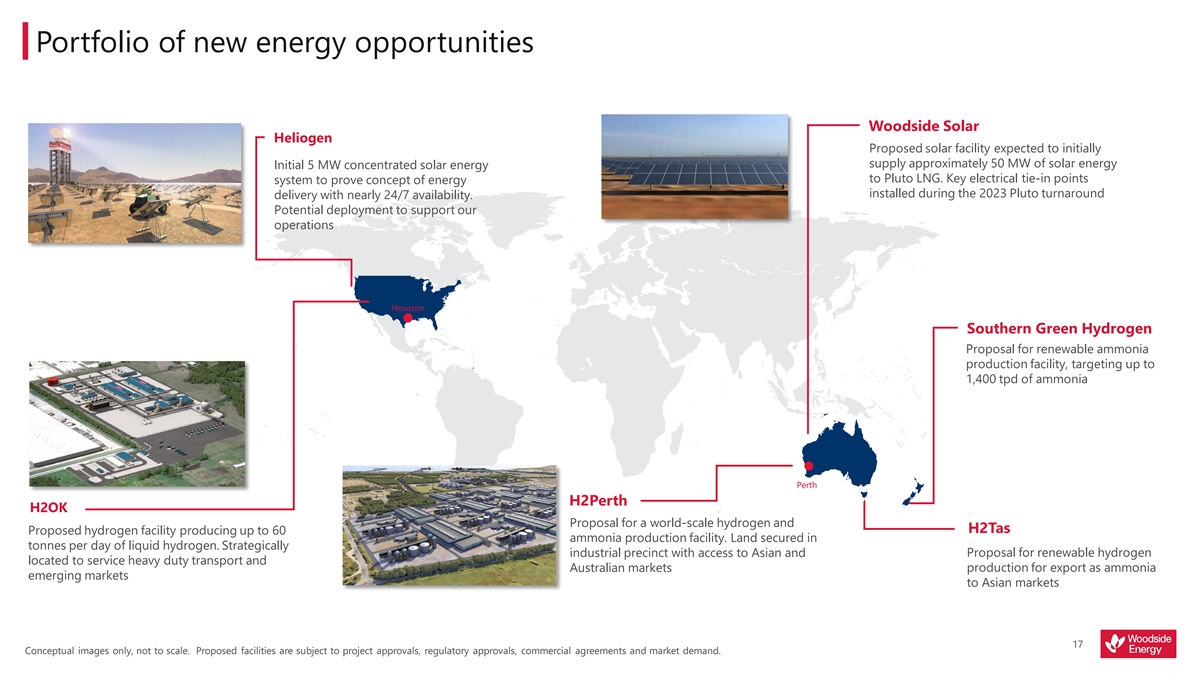
Portfolio of new energy opportunities Woodside Solar Heliogen Proposed solar facility expected to initially supply approximately 50 MW of solar energy Initial 5 MW concentrated solar energy to Pluto LNG. Key electrical tie-in points system to prove concept of energy installed during the 2023 Pluto turnaround delivery with nearly 24/7 availability. Potential deployment to support our operations Houston Southern Green Hydrogen Proposal for renewable ammonia production facility, targeting up to 1,400 tpd of ammonia Perth H2Perth H2OK Proposal for a world-scale hydrogen and H2Tas Proposed hydrogen facility producing up to 60 ammonia production facility. Land secured in tonnes per day of liquid hydrogen. Strategically industrial precinct with access to Asian and Proposal for renewable hydrogen located to service heavy duty transport and Australian markets production for export as ammonia emerging markets to Asian markets 17 Conceptual images only, not to scale. Proposed facilities are subject to project approvals, regulatory approvals, commercial agreements and market demand.
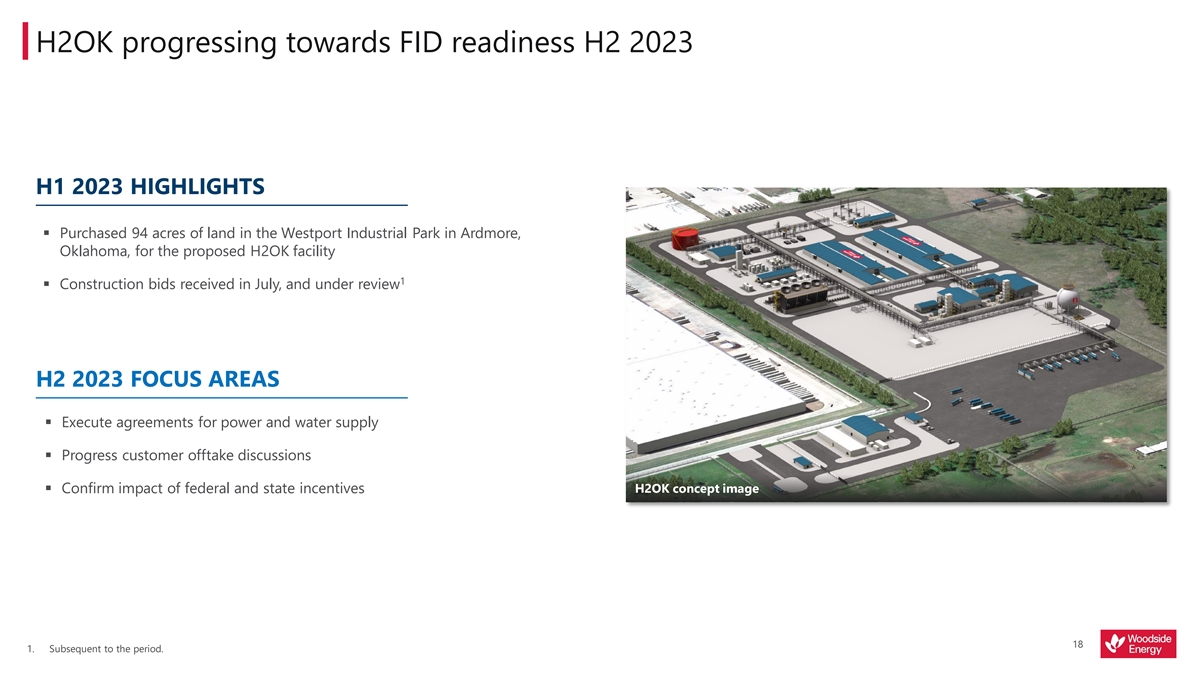
H2OK progressing towards FID readiness H2 2023 H1 2023 HIGHLIGHTS § Purchased 94 acres of land in the Westport Industrial Park in Ardmore, Oklahoma, for the proposed H2OK facility 1 § Construction bids received in July, and under review H2 2023 FOCUS AREAS § Execute agreements for power and water supply § Progress customer offtake discussions H2OK concept image § Confirm impact of federal and state incentives 18 1. Subsequent to the period.

Building CCS options Carbon capture and storage (CCS) portfolio options Catalysts for de-risking Carbon capture technology Browse CCS Bonaparte CCS CCS included as base case for Collaboration with industry to develop business Government support; Browse development concept case for large-scale carbon capture utilisation incentives and regulation and storage (CCUS) hub Large reservoir storage Northern Carnarvon Basin CCS capacity South East Australia CCS Potential for third party CO storage in 2 FEED commenced in H1 2023 for potential CO 2 the depleted Angel gas field End to end value-chain storage in the Gippsland Basin development § Woodside CCS locations based on extensive subsurface experience Location and proximity to CO sources 2 Pathways to § Collaborating and partnering with major operators with CCS Capability overcome CCS experience challenges § Stable legislation, regulatory and policy frameworks with path to Government support approvals 19
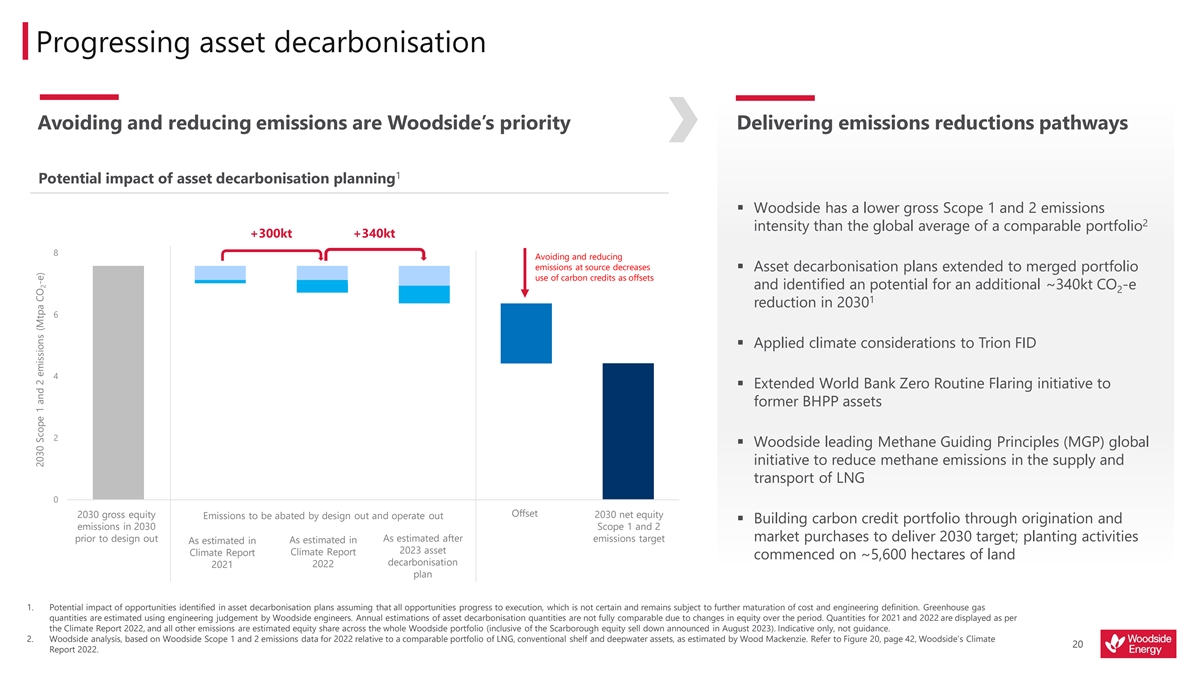
Progressing asset decarbonisation Avoiding and reducing emissions are Woodside’s priority Delivering emissions reductions pathways 1 Potential impact of asset decarbonisation planning § Woodside has a lower gross Scope 1 and 2 emissions 2 intensity than the global average of a comparable portfolio +300kt +340kt 8 Avoiding and reducing emissions at source decreases § Asset decarbonisation plans extended to merged portfolio use of carbon credits as offsets and identified an potential for an additional ~340kt CO -e 2 1 reduction in 2030 6 § Applied climate considerations to Trion FID 4 § Extended World Bank Zero Routine Flaring initiative to former BHPP assets 2 § Woodside leading Methane Guiding Principles (MGP) global initiative to reduce methane emissions in the supply and transport of LNG 0 2030 Gross equity emissions in Offset 2030 net equity scope 1&2 2030 gross equity Offset 2030 net equity Emissions to be abated by design out and operate out 2030 prior to Design Out As estimated in Climate As estimated in Climate As estimated after 2023 asset emissions target§ Building carbon credit portfolio through origination and emissions in 2030 Scope 1 and 2 Report 2021 Report 2022 decarbonisation plan As estimated after market purchases to deliver 2030 target; planting activities prior to design out emissions target As estimated in As estimated in 2023 asset Climate Report Climate Report commenced on ~5,600 hectares of land decarbonisation 2022 2021 plan 1. Potential impact of opportunities identified in asset decarbonisation plans assuming that all opportunities progress to execution, which is not certain and remains subject to further maturation of cost and engineering definition. Greenhouse gas quantities are estimated using engineering judgement by Woodside engineers. Annual estimations of asset decarbonisation quantities are not fully comparable due to changes in equity over the period. Quantities for 2021 and 2022 are displayed as per the Climate Report 2022, and all other emissions are estimated equity share across the whole Woodside portfolio (inclusive of the Scarborough equity sell down announced in August 2023). Indicative only, not guidance. 2. Woodside analysis, based on Woodside Scope 1 and 2 emissions data for 2022 relative to a comparable portfolio of LNG, conventional shelf and deepwater assets, as estimated by Wood Mackenzie. Refer to Figure 20, page 42, Woodside’s Climate 20 Report 2022. 2030 Scope 1 and 2 emissions (Mtpa CO -e) 2
FINANCIAL UPDATE Graham Tiver Chief Financial Officer and Executive Vice President 21

Strong earnings and balance sheet from expanded global portfolio HY23 HY22 Change $m Operating revenue 7,400 5,810 27% 1 $m EBITDA 4,888 3,971 23% Additional volume from former BHPP assets and Pluto- 1 $m EBIT 2,791 2,982 6% KGP Interconnector, impacted by lower prices and planned turnaround activities $m NPAT 1,740 1,640 6% 1,2 $m Underlying NPAT 1,896 1,819 4% $7.5 billion liquidity enabling investments in near-term 3 $m Operating cash flow 2,931 2,506 17% growth 3,4 $m Free cash flow 294 2,551 88% Delivering strong returns to shareholders whilst 1 $m Liquidity 7,509 7,915 5% maintaining balance sheet flexibility US cps Earnings per share 92 146 37% % Return on equity 9.7 10.1 4% US cps Half-year dividend 80 109 27% 1. Non-IFRS financial measure. Refer to the glossary section of this presentation for the definition. 2. Refer to slide 36 of this presentation for the list of specific items for HY23. 3. HY22 comparative has been restated due to the reclassification of purchases of shares and payments relating to employee share plans from cash flows from financing activities to cash flows from operating activities. 4. Non-IFRS financial measure. Refer to the glossary section of this presentation for the definition. For HY23, free cash flow of $0.3 billion includes the impact of collateral receipts of $332 million against hedging activities (included 22 in operating cash flow). For HY22, free cash flow includes the cash received on the acquisition of BHP Petroleum, including cash acquired of $1.082 billion.
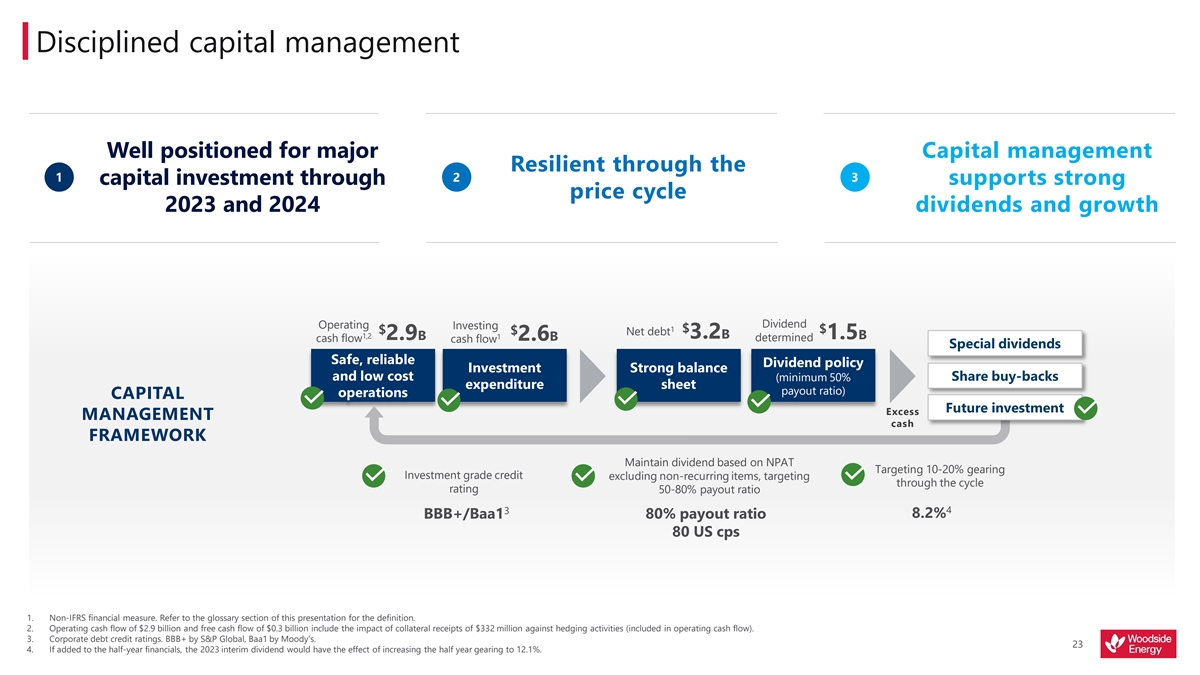
Disciplined capital management Well positioned for major Capital management Resilient through the 1 2 3 capital investment through supports strong price cycle 2023 and 2024 dividends and growth Dividend Operating Investing 1 $ $ $ $ Net debt 1,2 3.2B 2.9B 1 1.5B 2.6B determined cash flow cash flow Special dividends Safe, reliable Dividend policy Investment Strong balance and low cost (minimum 50% Share buy-backs expenditure sheet payout ratio) operations CAPITAL Future investment Excess MANAGEMENT cash FRAMEWORK Maintain dividend based on NPAT Targeting 10-20% gearing Investment grade credit excluding non-recurring items, targeting through the cycle rating 50-80% payout ratio 4 3 8.2% BBB+/Baa1 80% payout ratio 80 US cps 1. Non-IFRS financial measure. Refer to the glossary section of this presentation for the definition. 2. Operating cash flow of $2.9 billion and free cash flow of $0.3 billion include the impact of collateral receipts of $332 million against hedging activities (included in operating cash flow). 3. Corporate debt credit ratings. BBB+ by S&P Global, Baa1 by Moody’s. 23 4. If added to the half-year financials, the 2023 interim dividend would have the effect of increasing the half year gearing to 12.1%.
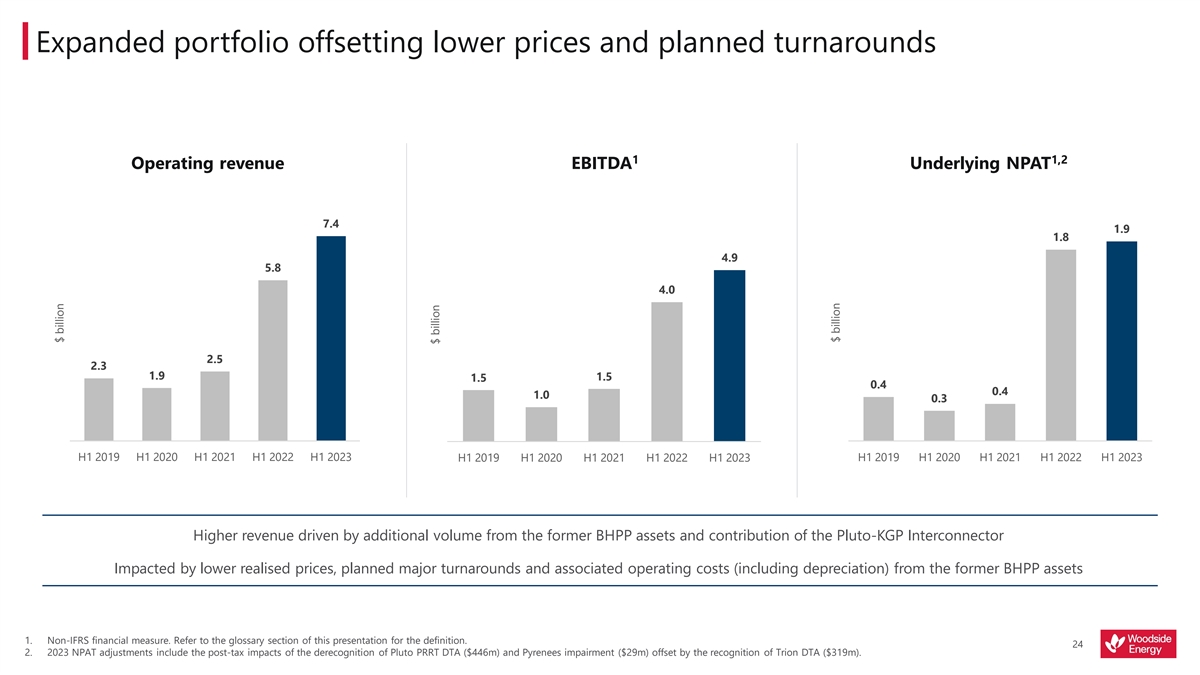
Expanded portfolio offsetting lower prices and planned turnarounds 1 1,2 Operating revenue EBITDA Underlying NPAT 7.4 1.9 1.8 4.9 5.8 4.0 2.5 2.3 1.9 1.5 1.5 0.4 0.4 1.0 0.3 H1 2019 H1 2020 H1 2021 H1 2022 H1 2023 H1 2019 H1 2020 H1 2021 H1 2022 H1 2023 H1 2019 H1 2020 H1 2021 H1 2022 H1 2023 Higher revenue driven by additional volume from the former BHPP assets and contribution of the Pluto-KGP Interconnector Impacted by lower realised prices, planned major turnarounds and associated operating costs (including depreciation) from the former BHPP assets 1. Non-IFRS financial measure. Refer to the glossary section of this presentation for the definition. 24 2. 2023 NPAT adjustments include the post-tax impacts of the derecognition of Pluto PRRT DTA ($446m) and Pyrenees impairment ($29m) offset by the recognition of Trion DTA ($319m). $ billion $ billion $ billion
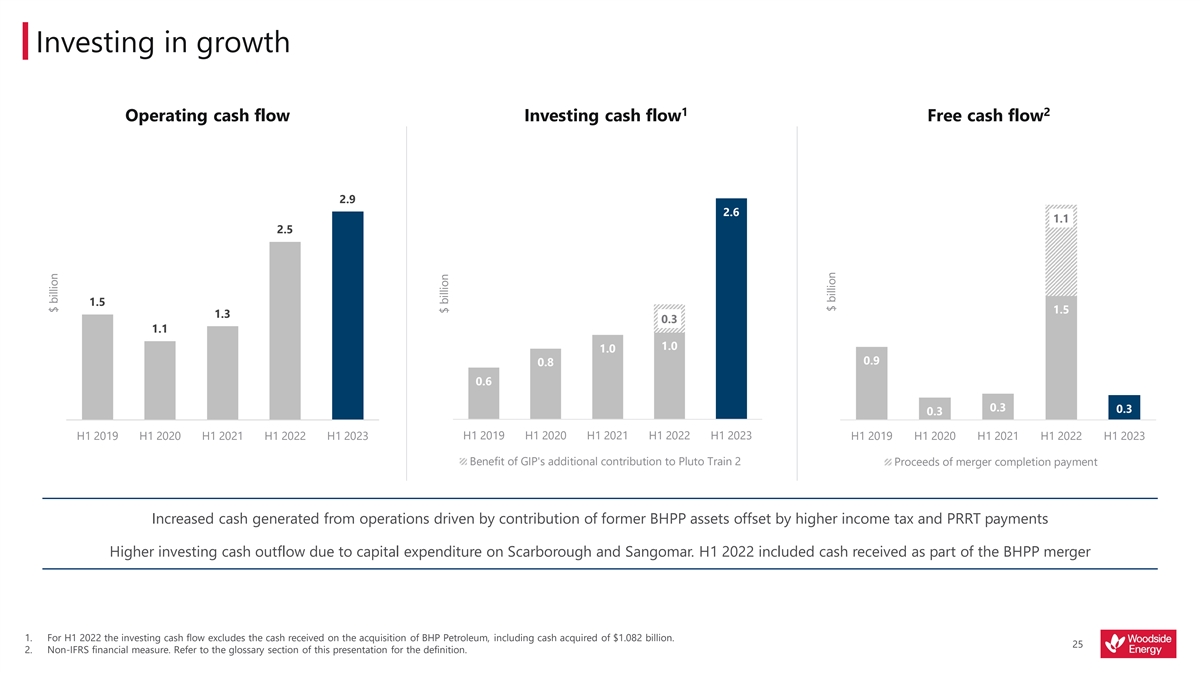
Investing in growth 1 2 Operating cash flow Investing cash flow Free cash flow 2.9 2.6 1.1 2.5 1.5 1.5 1.3 0.3 1.1 1.0 1.0 0.9 0.8 0.6 0.3 0.3 0.3 H1 2019 H1 2020 H1 2021 H1 2022 H1 2023 H1 2019 H1 2020 H1 2021 H1 2022 H1 2023 H1 2019 H1 2020 H1 2021 H1 2022 H1 2023 Benefit of GIP's additional contribution to Pluto Train 2 Proceeds of merger completion payment Increased cash generated from operations driven by contribution of former BHPP assets offset by higher income tax and PRRT payments Higher investing cash outflow due to capital expenditure on Scarborough and Sangomar. H1 2022 included cash received as part of the BHPP merger 1. For H1 2022 the investing cash flow excludes the cash received on the acquisition of BHP Petroleum, including cash acquired of $1.082 billion. 25 2. Non-IFRS financial measure. Refer to the glossary section of this presentation for the definition. $ billion $ billion $ billion

Cost performance impacted by planned turnarounds 2 Production cost Major turnarounds 84 413 Production cost (BHPP) Heritage Woodside costs remain in line with H1 2022 86 65 Production cost (WDS) 311 310 Full period contribution of former BHPP assets 224 225 218 changing cost mix H1 2019 H1 2020 H1 2021 H1 2022 H1 2023 2,3 Interconnector continues to drive value Unit production cost 8.8 Impact of major 0.9 7.3 3 7.2 turnarounds Completed planned major turnarounds on 1 1.7 Pluto LNG and Ngujima-Yin FPSO 4.9 4.5 UPC excluding major 7.9 turnarounds 7.2 5.6 4.9 Managing inflationary pressures 4.5 H1 2019 H1 2020 H1 2021 H1 2022 H1 2023 1. Ngujima-Yin FPSO resumed production subsequent to the period. 2. H1 2022 increased primarily as result of the Pluto-KGP Interconnector and the inclusion of the former BHPP assets. 26 3. Does not consider the volume loss impact associated with the major turnarounds. $/boe $ million
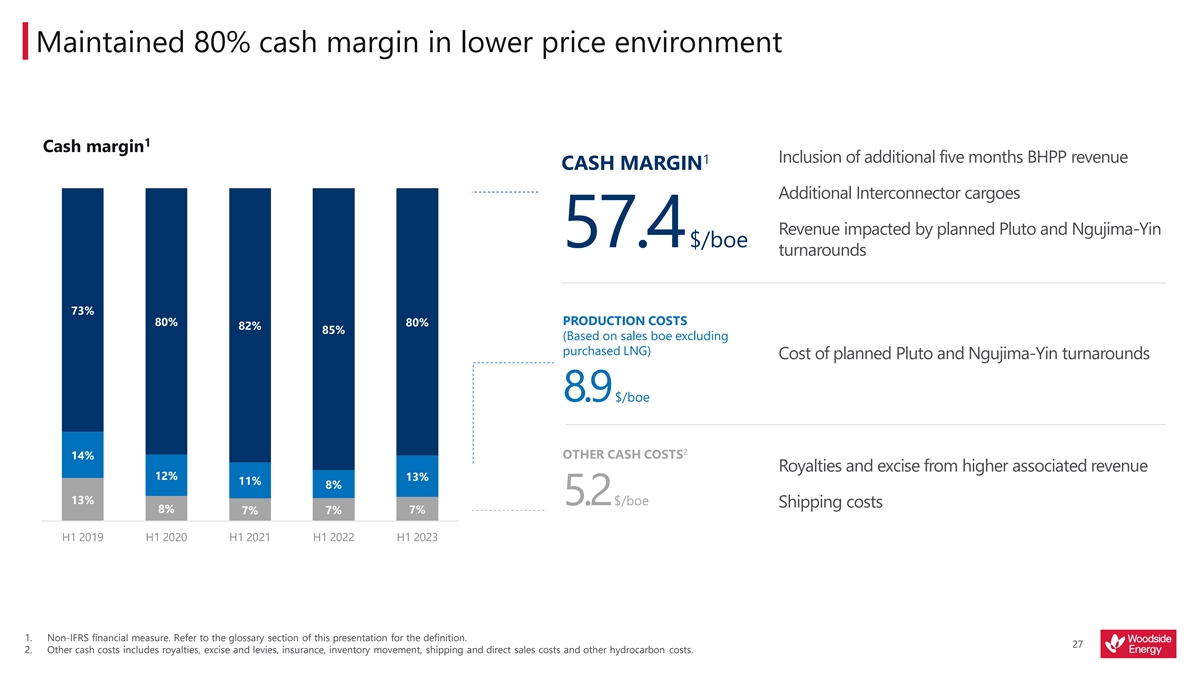
Maintained 80% cash margin in lower price environment 1 Cash margin Inclusion of additional five months BHPP revenue 1 CASH MARGIN Additional Interconnector cargoes Revenue impacted by planned Pluto and Ngujima-Yin 57.4$/boe turnarounds 73% PRODUCTION COSTS 80% 80% 82% 85% (Based on sales boe excluding purchased LNG) Cost of planned Pluto and Ngujima-Yin turnarounds 8.9$/boe 2 OTHER CASH COSTS 14% Royalties and excise from higher associated revenue 12% 13% 11% 8% 13% 5.2$/boe Shipping costs 8% 7% 7% 7% H1 2019 H1 2020 H1 2021 H1 2022 H1 2023 1. Non-IFRS financial measure. Refer to the glossary section of this presentation for the definition. 27 2. Other cash costs includes royalties, excise and levies, insurance, inventory movement, shipping and direct sales costs and other hydrocarbon costs.

Positioned to deliver strong shareholder returns and business priorities 1 Net debt and gearing 4.5 30% 3.9 3.8 4.0 25% 3.2 3.5 2.8 3.0 20% Target 10-20% Gearing and net debt increased in line with planned 2.5 gearing through 15% 1 2.0 capital expenditure the cycle 1.5 10% 1.0 0.6 Net debt 5% 0.5 Gearing (%) Low gearing of 8.2% and low cost of drawn debt of 0.0 0% FY 2019 FY 2020 FY 2021 FY 2022 H1 2023 2,3 4.0% provides balance sheet resilience 2 Balanced debt maturity profile 4 Credit ratings of BBB+ and Baa1 2.0 1.5 No significant near-term maturities 1.0 Undrawn Drawn 0.5 0.0 1. Non-IFRS financial measures. Refer to the glossary section of this presentation for the definition. 2. As at 30 June 2023. 3. If added to the half-year financials, the 2023 interim dividend would have the effect of increasing the half year gearing to 12.1%. 28 4. Corporate debt credit ratings. BBB+ by S&P Global, Baa1 by Moody’s. $ billion $ billion 2023 2024 2025 2026 2027 2028 2029 2030 2031 2032

Maintaining strong liquidity through the cycle Continuing strong liquidity 10.2 Robust liquidity management to support near term growth and returns 7.5 7.0 6.7 6.1 Total forecast $6.0 – 6.5 billion dollars of capital Undrawn facilities expenditure in 2023 remains unchanged Cash Liquidity Scarborough sell-down proceeds, expected to be 1 received in Q1 2024, supporting liquidity Proactively manage the debt portfolio FY 2019 FY 2020 FY 2021 FY 2022 H1 2023 1. Completion of the transaction is subject to conditions precedent including Foreign Investment Review Board approval, National Offshore Petroleum Titles Administrator approvals and Western Australian Government 29 approvals. $ billion
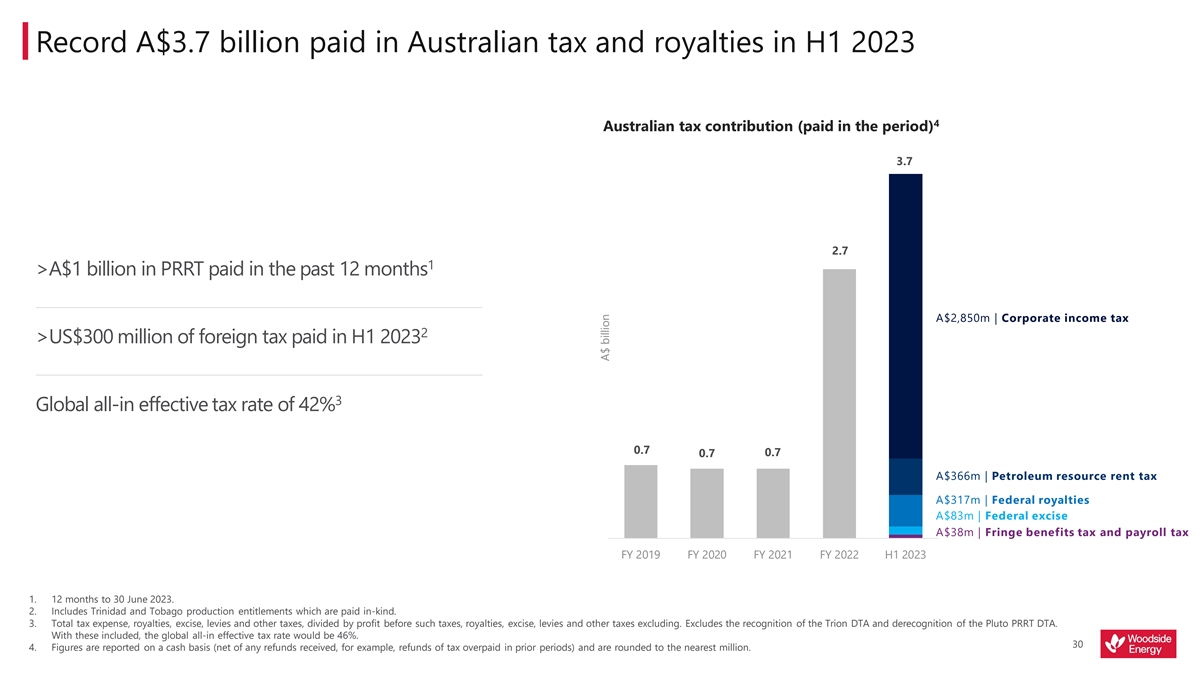
Record A$3.7 billion paid in Australian tax and royalties in H1 2023 4 Australian tax contribution (paid in the period) 3.7 2.7 1 >A$1 billion in PRRT paid in the past 12 months A$2,850m | Corporate income tax 2 >US$300 million of foreign tax paid in H1 2023 3 Global all-in effective tax rate of 42% 0.7 0.7 0.7 A$366m | Petroleum resource rent tax A$317m | Federal royalties A$83m | Federal excise A$38m | Fringe benefits tax and payroll tax FY 2019 FY 2020 FY 2021 FY 2022 H1 2023 1. 12 months to 30 June 2023. 2. Includes Trinidad and Tobago production entitlements which are paid in-kind. 3. Total tax expense, royalties, excise, levies and other taxes, divided by profit before such taxes, royalties, excise, levies and other taxes excluding. Excludes the recognition of the Trion DTA and derecognition of the Pluto PRRT DTA. With these included, the global all-in effective tax rate would be 46%. 30 4. Figures are reported on a cash basis (net of any refunds received, for example, refunds of tax overpaid in prior periods) and are rounded to the nearest million. A$ billion

OUTLOOK Meg O’Neill Chief Executive Officer and Managing Director 31
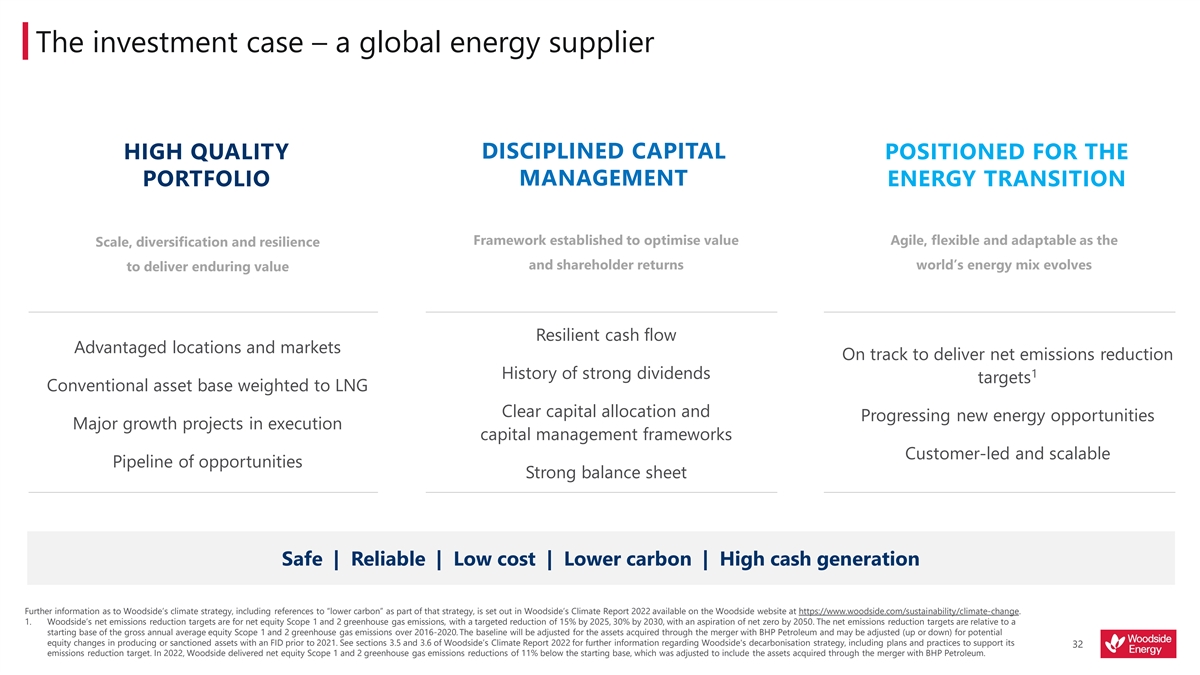
The investment case – a global energy supplier DISCIPLINED CAPITAL HIGH QUALITY POSITIONED FOR THE PORTFOLIO MANAGEMENT ENERGY TRANSITION Framework established to optimise value Agile, flexible and adaptable as the Scale, diversification and resilience and shareholder returns world’s energy mix evolves to deliver enduring value Resilient cash flow Advantaged locations and markets On track to deliver net emissions reduction 1 History of strong dividends targets Conventional asset base weighted to LNG Clear capital allocation and Progressing new energy opportunities Major growth projects in execution capital management frameworks Customer-led and scalable Pipeline of opportunities Strong balance sheet Safe | Reliable | Low cost | Lower carbon | High cash generation Further information as to Woodside’s climate strategy, including references to “lower carbon” as part of that strategy, is set out in Woodside’s Climate Report 2022 available on the Woodside website at https://www.woodside.com/sustainability/climate-change. 1. Woodside’s net emissions reduction targets are for net equity Scope 1 and 2 greenhouse gas emissions, with a targeted reduction of 15% by 2025, 30% by 2030, with an aspiration of net zero by 2050. The net emissions reduction targets are relative to a starting base of the gross annual average equity Scope 1 and 2 greenhouse gas emissions over 2016-2020. The baseline will be adjusted for the assets acquired through the merger with BHP Petroleum and may be adjusted (up or down) for potential equity changes in producing or sanctioned assets with an FID prior to 2021. See sections 3.5 and 3.6 of Woodside’s Climate Report 2022 for further information regarding Woodside's decarbonisation strategy, including plans and practices to support its 32 emissions reduction target. In 2022, Woodside delivered net equity Scope 1 and 2 greenhouse gas emissions reductions of 11% below the starting base, which was adjusted to include the assets acquired through the merger with BHP Petroleum.
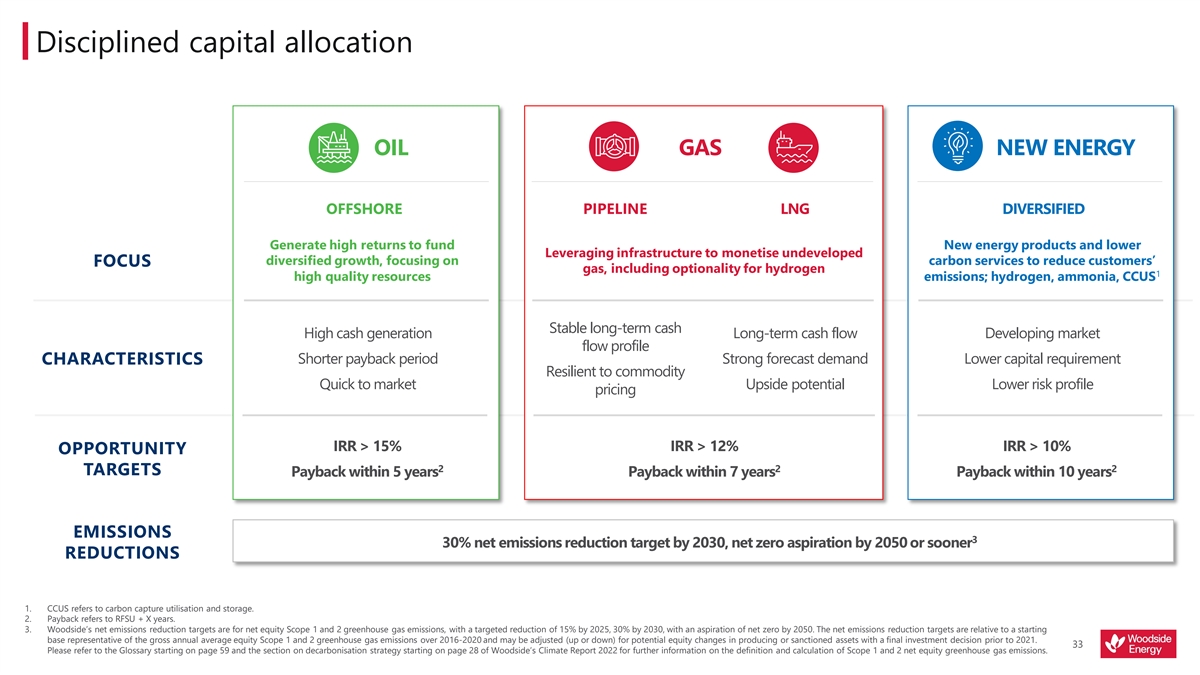
Disciplined capital allocation OIL GAS NEW ENERGY OFFSHORE PIPELINE LNG DIVERSIFIED Generate high returns to fund New energy products and lower Leveraging infrastructure to monetise undeveloped diversified growth, focusing on carbon services to reduce customers’ FOCUS gas, including optionality for hydrogen 1 high quality resources emissions; hydrogen, ammonia, CCUS Stable long-term cash High cash generation Long-term cash flow Developing market flow profile Shorter payback period Strong forecast demand Lower capital requirement CHARACTERISTICS Resilient to commodity Quick to market Upside potential Lower risk profile pricing IRR > 15% IRR > 12% IRR > 10% OPPORTUNITY 2 2 2 TARGETS Payback within 5 years Payback within 7 years Payback within 10 years EMISSIONS 3 30% net emissions reduction target by 2030, net zero aspiration by 2050 or sooner REDUCTIONS 1. CCUS refers to carbon capture utilisation and storage. 2. Payback refers to RFSU + X years. 3. Woodside’s net emissions reduction targets are for net equity Scope 1 and 2 greenhouse gas emissions, with a targeted reduction of 15% by 2025, 30% by 2030, with an aspiration of net zero by 2050. The net emissions reduction targets are relative to a starting base representative of the gross annual average equity Scope 1 and 2 greenhouse gas emissions over 2016-2020 and may be adjusted (up or down) for potential equity changes in producing or sanctioned assets with a final investment decision prior to 2021. 33 Please refer to the Glossary starting on page 59 and the section on decarbonisation strategy starting on page 28 of Woodside’s Climate Report 2022 for further information on the definition and calculation of Scope 1 and 2 net equity greenhouse gas emissions.
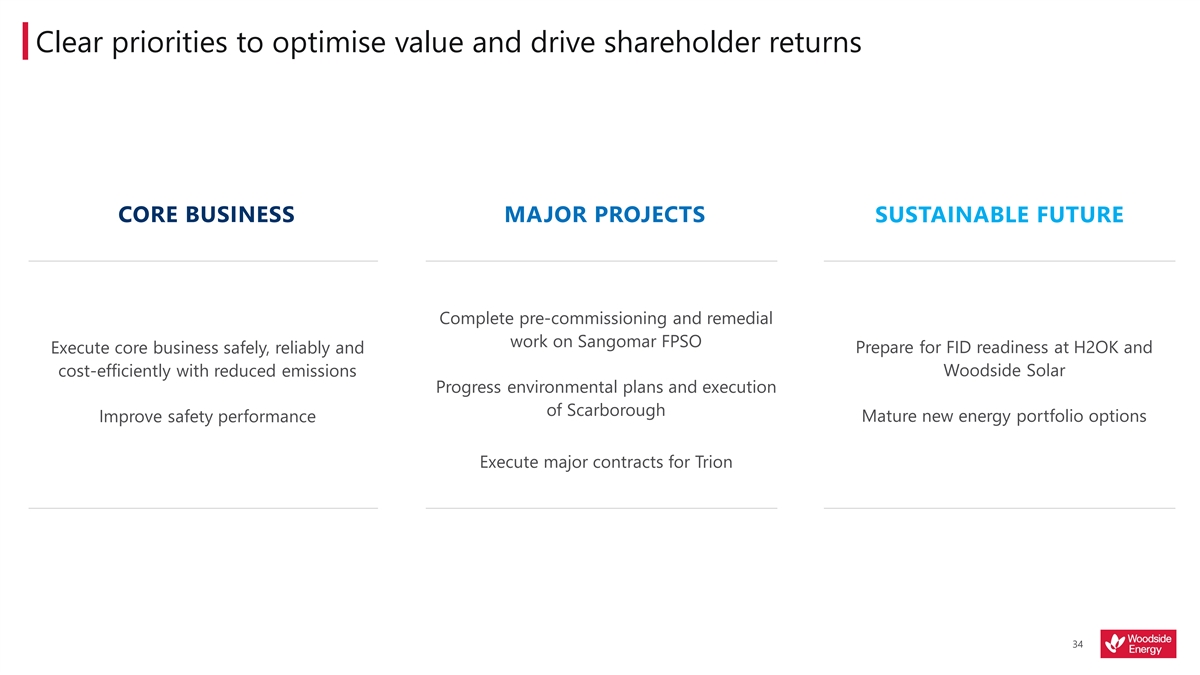
Clear priorities to optimise value and drive shareholder returns CORE BUSINESS MAJOR PROJECTS SUSTAINABLE FUTURE Complete pre-commissioning and remedial work on Sangomar FPSO Execute core business safely, reliably and Prepare for FID readiness at H2OK and Woodside Solar cost-efficiently with reduced emissions Progress environmental plans and execution of Scarborough Improve safety performance Mature new energy portfolio options Execute major contracts for Trion 34

ANNEXURE 35
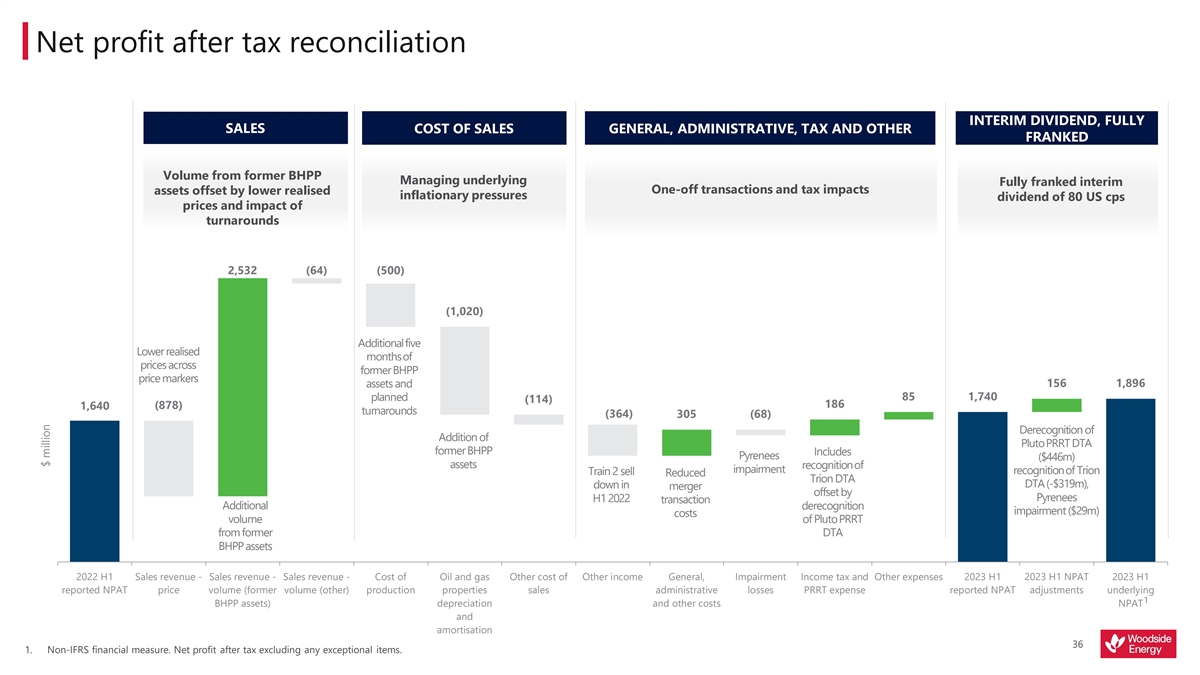
Net profit after tax reconciliation INTERIM DIVIDEND, FULLY SALES COST OF SALES GENERAL, ADMINISTRATIVE, TAX AND OTHER FRANKED Volume from former BHPP Managing underlying Fully franked interim One-off transactions and tax impacts assets offset by lower realised inflationary pressures dividend of 80 US cps prices and impact of turnarounds 2,532 (64) (500) (1,020) Additional five Lower realised months of prices across former BHPP price markers assets and 156 1,896 planned 85 1,740 (114) 186 (878) 1,640 turnarounds (364) 305 (68) Derecognition of Addition of Pluto PRRT DTA former BHPP Includes Pyrenees ($446m) assets recognition of impairment recognition of Trion Train 2 sell Reduced Trion DTA DTA (-$319m), down in merger offset by Pyrenees H1 2022 transaction Additional derecognition impairment ($29m) costs volume of Pluto PRRT from former DTA BHPP assets 2022 H1 Sales revenue - Sales revenue - Sales revenue - Cost of Oil and gas Other cost of Other income General, Impairment Income tax and Other expenses 2023 H1 2023 H1 NPAT 2023 H1 reported NPAT price volume (former volume (other) production properties sales administrative losses PRRT expense reported NPAT adjustments underlying 1 BHPP assets) depreciation and other costs NPAT and amortisation 36 1. Non-IFRS financial measure. Net profit after tax excluding any exceptional items. $ million
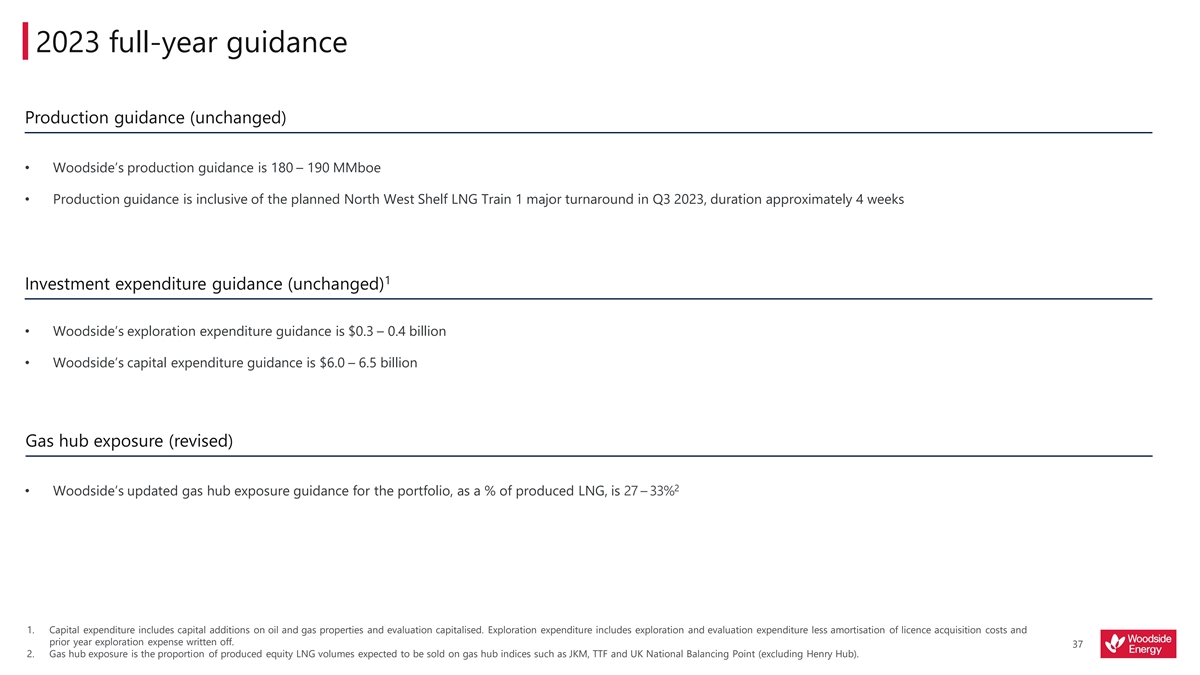
2023 full-year guidance Production guidance (unchanged) • Woodside’s production guidance is 180 – 190 MMboe • Production guidance is inclusive of the planned North West Shelf LNG Train 1 major turnaround in Q3 2023, duration approximately 4 weeks 1 Investment expenditure guidance (unchanged) • Woodside’s exploration expenditure guidance is $0.3 – 0.4 billion • Woodside’s capital expenditure guidance is $6.0 – 6.5 billion Gas hub exposure (revised) 2 • Woodside’s updated gas hub exposure guidance for the portfolio, as a % of produced LNG, is 27 – 33% 1. Capital expenditure includes capital additions on oil and gas properties and evaluation capitalised. Exploration expenditure includes exploration and evaluation expenditure less amortisation of licence acquisition costs and prior year exploration expense written off. 37 2. Gas hub exposure is the proportion of produced equity LNG volumes expected to be sold on gas hub indices such as JKM, TTF and UK National Balancing Point (excluding Henry Hub).
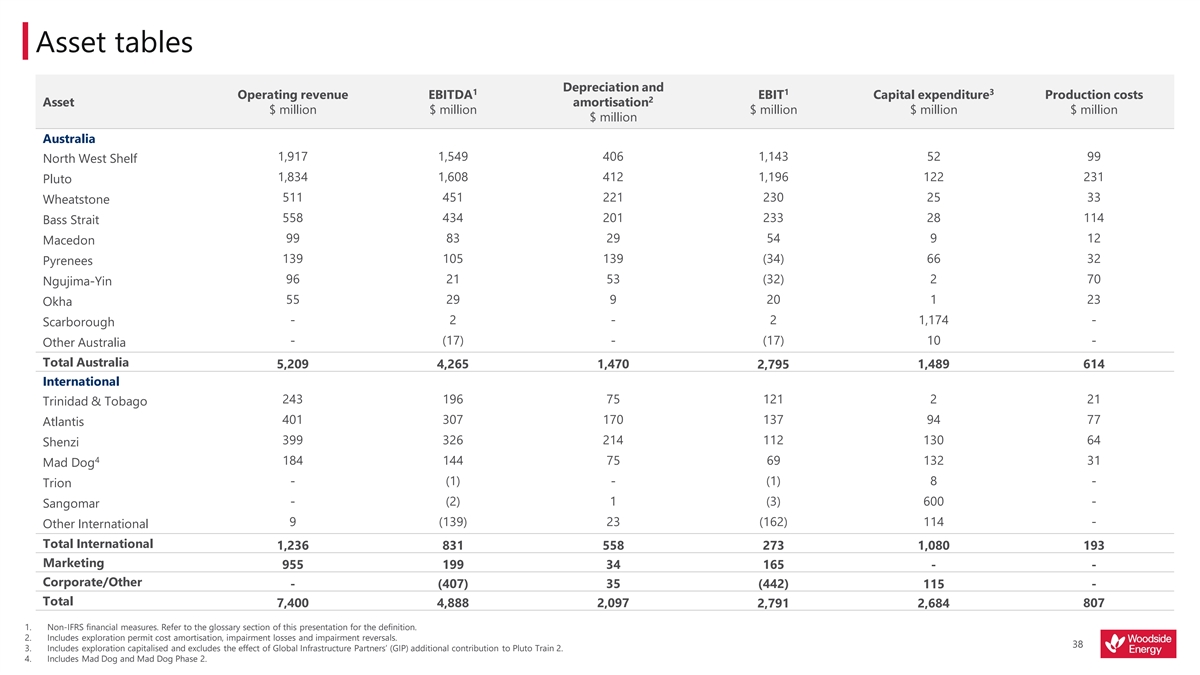
Asset tables Depreciation and 1 1 3 Operating revenue EBITDA EBIT Capital expenditure Production costs 2 Asset amortisation $ million $ million $ million $ million $ million $ million Australia 1,917 1,549 406 1,143 52 99 North West Shelf 1,834 1,608 412 1,196 122 231 Pluto 511 451 221 230 25 33 Wheatstone 558 434 201 233 28 114 Bass Strait 99 83 29 54 9 12 Macedon 139 105 139 (34) 66 32 Pyrenees 96 21 53 (32) 2 70 Ngujima-Yin 55 29 9 20 1 23 Okha - 2 - 2 1,174 - Scarborough - (17) - (17) 10 - Other Australia Total Australia 5,209 4,265 1,470 2,795 1,489 614 International 243 196 75 121 2 21 Trinidad & Tobago 401 307 170 137 94 77 Atlantis 399 326 214 112 130 64 Shenzi 4 184 144 75 69 132 31 Mad Dog - (1) - (1) 8 - Trion - (2) 1 (3) 600 - Sangomar 9 (139) 23 (162) 114 - Other International Total International 1,236 831 558 273 1,080 193 Marketing 955 199 34 165 - - Corporate/Other - (407) 35 (442) 115 - Total 7,400 4,888 2,097 2,791 2,684 807 1. Non-IFRS financial measures. Refer to the glossary section of this presentation for the definition. 2. Includes exploration permit cost amortisation, impairment losses and impairment reversals. 38 3. Includes exploration capitalised and excludes the effect of Global Infrastructure Partners’ (GIP) additional contribution to Pluto Train 2. 4. Includes Mad Dog and Mad Dog Phase 2.

Realised price 4 5 Products Units H1 2023 H1 2022 Variance 1 LNG produced $/boe 88 89 (1) 2 LNG traded $/boe 90 140 (50) Pipeline gas $/boe 38 52 (14) Oil and condensate $/boe 75 114 (39) NGLs $/boe 47 48 (1) Average realised price $/boe 74 96 (22) Average Dated Brent $/bbl 80 108 JCC (lagged three months) $/bbl 94 83 JKM $/MMBtu 19 31 WTI $/bbl 75 101 3 TTF $/MMBtu 19 33 1. Realised prices include the impact of periodic adjustments reflecting the arrangements governing Wheatstone LNG sales. 2. Excludes any additional benefit attributed to produced LNG through third-party trading activities. 3. TTF is converted from EUR/MWh to US$/MMBtu using published exchange rates and conversion factors. 4. HY22 realised price incorporates the updated boe conversion factors. 39 5. Minor differences due to rounding.
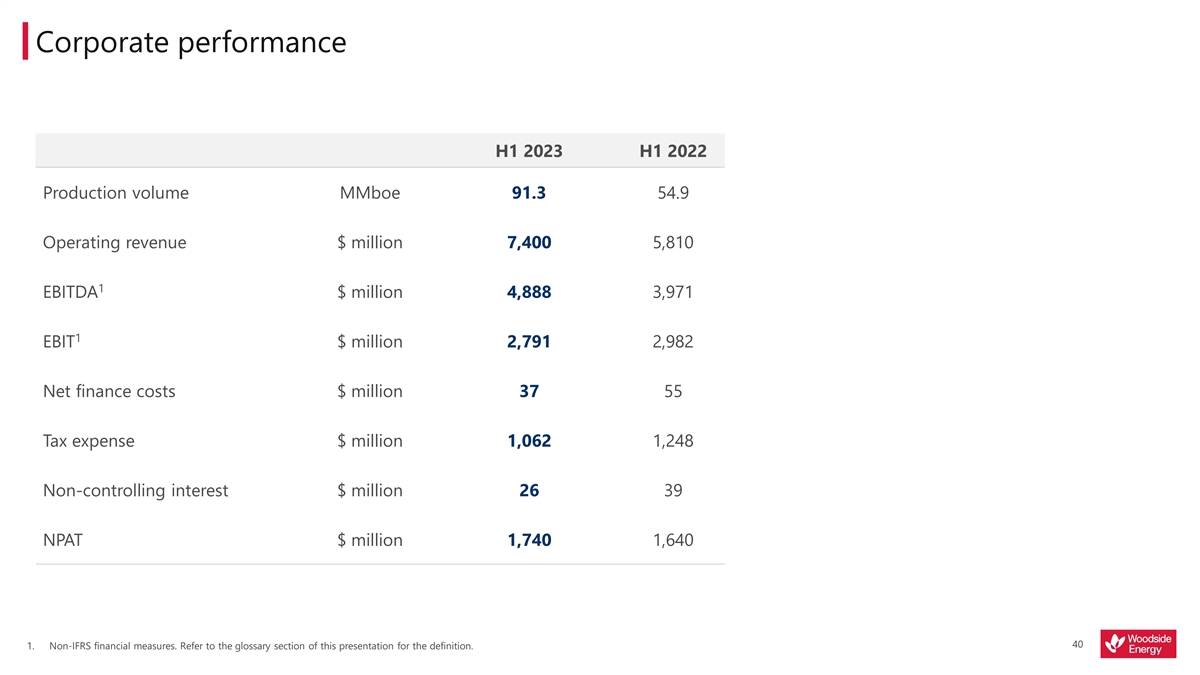
Corporate performance H1 2023 H1 2022 Production volume MMboe 91.3 54.9 Operating revenue $ million 7,400 5,810 1 EBITDA $ million 4,888 3,971 1 EBIT $ million 2,791 2,982 Net finance costs $ million 37 55 Tax expense $ million 1,062 1,248 Non-controlling interest $ million 26 39 NPAT $ million 1,740 1,640 40 1. Non-IFRS financial measures. Refer to the glossary section of this presentation for the definition.
Glossary Woodside sets its Scope 1 and 2 greenhouse gas emissions reduction targets on an equity basis. This $, $m, $B US dollar unless otherwise stated, millions of dollars, billions of dollars ensures that the scope of its emissions reduction targets is aligned with its economic interest in its Equity greenhouse gas emissions investments. Equity emissions reflect the greenhouse gas emissions from operations according to A$, AUD Australian dollar Woodside’s share of equity in the operation. Its equity share of an operation reflects its economic interest 2 in the operation, which is the extent of rights it has to the risks and rewards flowing from the operation Woodside uses this term to describe an aspiration to seek the achievement of an outcome but where Aspiration achievement of the outcome is subject to material uncertainties and contingencies such that Woodside Exploration expenditure includes exploration and evaluation expenditure less amortisation of licence Exploration expenditure considers there is not yet a suitable defined plan or pathway to achieve that outcome. acquisition costs and prior year exploration expense written off Bcf Billion cubic feet FDP Field development plan Woodside Energy Global Holdings Pty Ltd ACN 006 923 897 (formerly known as BHP Petroleum FEED Front-end engineering design International Pty Ltd) and, unless context otherwise requires, its subsidiaries. References to “Woodside BHP Petroleum or BHPP Energy Global Holdings Pty Ltd” or “BHP Petroleum International Pty Ltd” are references to Woodside FID Final investment decision Energy Global Holdings Pty Ltd ACN 006 923 897 (formerly known as BHP Petroleum International Pty FPSO Floating production storage and offloading Ltd) excluding its subsidiaries. Barrel of oil equivalent, thousand barrels of oil equivalent, million barrels of oil equivalent, billion FPU Floating production unit boe, kboe, MMboe, Bboe barrels of oil equivalent Free cash flow Cash flow from operating activities less cash flow from investing activities Capital expenditure Includes capital additions on oil and gas properties and evaluation capitalised Gearing Net debt divided by net debt and equity attributable to the equity holders of the parent Revenue from sale of produced hydrocarbons less production costs, royalties, excise and levies, The seven greenhouse gases listed in the Kyoto Protocol are: carbon dioxide (CO ); methane (CH ); nitrous 2 4 insurance, inventory movement, shipping and direct sales costs and other hydrocarbon costs; divided Cash margin GHG or greenhouse gas oxide (N O); hydrofluorocarbons (HFCs); nitrogen trifluoride (NF ); perfluorocarbons (PFCs); and sulphur 2 3 by revenue from the sale of produced hydrocarbons (sales volume). Excludes exploration and hexafluoride (SF ) 6 evaluation, general administrative and other costs, depreciation and amortisation, PRRT and income tax Investing cash flow Cash flow from investing activities CCS Carbon capture and storage IRR Internal rate of return CCU Carbon capture and utilisation The Japan customs-cleared crude is the average price of customs-cleared crude oil imports into Japan as CCUS Carbon capture, utilisation and storage JCC reported in customs statistics (also known as ‘Japanese crude cocktail’) and is used as a reference price for Methane CH 4 long-term supply LNG contracts CO Carbon dioxide 2 Japan Korea Marker is the North-east Asian spot price index for LNG delivered ex-ship to Japan, South JKM Korea, China and Taiwan. CO2 equivalent. The universal unit of measurement to indicate the global warming potential of each of the seven greenhouse gases, expressed in terms of the global warming potential of one unit of carbon CO -e JV Joint venture 2 dioxide. It is used to evaluate releasing (or avoiding releasing) any greenhouse gas against a common 1 basis KGP Karratha Gas Plant Conventional resources exist in porous and permeable rock with pressure equilibrium. The Liquidity Cash and undrawn facilities Conventional hydrocarbons are trapped in discrete accumulations related local geological structure feature and/or LNG Liquefied natural gas stratigraphic condition Woodside uses this term to describe the characteristic of having lower levels of associated potential GHG cps Cents per share Lower carbon emissions when compared to historical and/or current conventions or analogues, for example relating to Woodside uses this term to describe activities or pathways that have the effect of moving towards a an otherwise similar resource, process, production facility, product or service, or activity Decarbonisation state that is lower carbon, as defined in this glossary A lower carbon economy is an economy that produces lower levels of greenhouse gas emissions relative Lower carbon economy DTA Deferred tax asset to today’s economy Lower carbon energy provider Woodside uses this term to describe its aspiration to develop a lower carbon portfolio EBIT Calculated as a profit before income tax, PRRT and net finance costs Calculated as profit before income tax, PRRT, net finance costs, depreciation and amortisation, For Woodside, a lower carbon portfolio is one from which the net equity scope 1 and 2 greenhouse gas EBITDA impairment losses, impairment reversals emissions, which includes the use of offsets, are being reduced towards targets, and into which new Lower carbon portfolio energy products and lower carbon services are planned to be introduced as a complement to existing and new investments in oil and gas. Woodside’s Climate Policy sets out the principles that we believe will assist us achieve this aim 1. See IFRS Foundation 2021: Climate Related Disclosures Prototype. Appendix A. The IFRS published a further consultation document subsequent to the 2021 prototype. As it did not contain a updated definition of Paris-Aligned scenarios Woodside has retained use of the previous edition. 41 2. World Resources Institute and World Business Council for Sustainable Development 2004. “GHG Protocol: a corporate accounting and reporting standard”.

Glossary Woodside uses this term to describe technologies, such as CCUS or offsets, that may be capable of PRRT Petroleum resource rent tax Lower carbon services reducing the net greenhouse gas emissions of our customers RFSU Ready for start-up MGP Methane Guiding Principles Direct GHG emissions. These occur from sources that are owned or controlled by the company, for example, emissions from combustion in owned or controlled boilers, furnaces, vehicles, etc.; emissions MMbbl Million barrels from chemical production in owned or controlled process equipment. Woodside estimates greenhouse MMBtu Million British thermal units Scope 1 greenhouse gas gas emissions, energy values and global warming potentials are estimated in accordance with the relevant emissions reporting regulations in the jurisdiction where the emissions occur (e.g. Australian National Greenhouse Mtpa Million tonnes per annum and Energy Reporting (NGER), US EPA Greenhouse Gas Reporting Program (GHGRP)). Australian regulatory reporting principles have been used for emissions in jurisdictions where regulations do not yet MW Megawatt 3 exist MWh Megawatt hour Electricity indirect GHG emissions. Scope 2 accounts for GHG emissions from the generation of purchased electricity consumed by the company. Purchased electricity is defined as electricity that is purchased or Net debt Interest-bearing liabilities and lease liabilities less cash and cash equivalents otherwise brought into the organisational boundary of the company. Scope 2 emissions physically occur Net equity Scope 1 and 2 Scope 2 greenhouse gas at the facility where electricity is generated. Woodside estimates greenhouse gas emissions, energy values Woodside’s equity share of net Scope 1 and 2 greenhouse gas emissions 1 greenhouse gas emissions emissions and global warming potentials are estimated in accordance with the relevant reporting regulations in the jurisdiction where the emissions occur (e.g. Australian National Greenhouse and Energy Reporting (NGER), Net zero emissions are achieved when anthropogenic emissions of greenhouse gases to the US EPA Greenhouse Gas Reporting Program (GHGRP)). Australian regulatory reporting principles have atmosphere are balanced by anthropogenic removals over a specified period. Where multiple 3 been used for emissions in jurisdictions where regulations do not yet exist Net zero greenhouse gases are involved, the quantification of net zero emissions depends on the climate metric chosen to compare emissions of different gases (such as global warming potential, global temperature Other indirect GHG emissions. Scope 3 is a reporting category that allows for the treatment of all other 2 change potential, and others, as well as the chosen time horizon) indirect emissions. Scope 3 emissions are a consequence of the activities of the company, but occur from Scope 3 greenhouse gas sources not owned or controlled by the company. Some examples of Scope 3 activities are extraction and Woodside uses this term to describe energy technologies, such as hydrogen or ammonia, that are emissions production of purchased materials; transportation of purchased fuels; and use of sold products and New energy emerging in scale but which are expected to grow during the energy transition due to having lower services. Please refer to the data table on page 58 of the Climate Report 2022 for further information on greenhouse gas emissions at the point of use than conventional fossil fuels 3 the Scope 3 emissions categories reported by Woodside NGLs Natural gas liquids SURF Subsea, umbilicals, risers and flowlines (SURF) NOPSEMA National Offshore Petroleum Safety and Environmental Management Authority In the context of Woodside’s Climate strategy, Woodside uses this term to describe an intention to seek Target the achievement of an outcome, where Woodside considers that it has developed a suitably defined plan NPAT Net profit after tax or pathway to achieve that outcome NWS North West Shelf TTF Title transfer facility The compensation for an entity’s greenhouse gas emissions within its scope by achieving an equivalent Offsets TRI Total recordable injuries amount of emission reductions or removals outside the boundary or value chain of that entity TRIR Total recordable injury rate Operating cash flow Cash flow from operating activities Underlying NPAT Net profit after tax excluding any exceptional items Oil and gas joint venture participants will typically appoint one company as the operator, which will hold the contractual authority to manage joint venture activities on behalf of the joint venture Unit production cost or UPC Production cost divided by production volume Operated and participants. Where Woodside is the operator of a joint venture in which it holds an equity share, this non-operated report refers to that joint venture as being operated. Where another company is the operator of a joint USD United States dollar venture in which Woodside holds an equity share, this report refers to that joint venture as being non- Woodside Woodside Energy Group Ltd ACN 004 898 962 or its applicable subsidiaries operated YTD Year to date An unplanned or uncontrolled loss of primary containment (LOPC) of any material including non-toxic Process safety event (Tier 1 and and nonflammable materials from a process, or an undesired event or condition. Process safety events Tier 2) are classified as Tier 1 – LOPC of greatest consequence or Tier 2 – LOPC of lesser consequence. As defined by American Petroleum Institute (API) recommended practice 754 1. Woodside has set its Scope 1 and 2 greenhouse gas emissions reduction targets on a net basis, allowing for both direct emissions reductions from its operations and emissions reductions achieved from the use of offsets. Net greenhouse gas emissions are equal to an entity’s gross greenhouse gas emissions reduced by the number of retired carbon credits. 2. IPCC, 2018: Annex I: Glossary [Matthews, J.B.R. (ed.)]. In: Global Warming of 1.5°C. An IPCC Special Report on the impacts of global warming of 1.5°C above pre-industrial levels and related global greenhouse gas emission pathways, in the context of strengthening the global response to the threat of climate change, sustainable development, and efforts to eradicate poverty [Masson-Delmotte, V., P. Zhai, H.-O. Pörtner, D. Roberts, J. Skea, P.R. Shukla, A. Pirani, W. Moufouma-Okia, C. Péan, R. Pidcock, S. Connors, J.B.R. Matthews, Y. Chen, X. Zhou, M.I. Gomis, E. Lonnoy, T. Maycock, M. Tignor, and T. Waterfield (eds.)]. In Press. Page 555. 42 3. World Resources Institute and World Business Council for Sustainable Development 2004. “GHG Protocol: a corporate accounting and reporting standard”.

Head Office: Woodside Energy Group Ltd Mia Yellagonga 11 Mount Street Perth WA 6000 Postal Address: GPO Box D188 Perth WA 6840 Australia T: +61 8 9348 4000 F: +61 8 9214 2777 E: companyinfo@woodside.com Woodside Energy Group Ltd ABN 55 004 898 962 woodside.com