Exhibit 99.3
About this document
This document contains summary information concerning the industry, operations, activities and financial position of Woodside Energy Group Ltd that Woodside intends to refer in certain investor meetings or related interactions in September 2024. The information contained in this document is extracted or derived from information that Woodside has previously published.
Woodside Energy Group Ltd (ABN 55 004 898 962) is the parent company of the Woodside group of companies. In this document, unless otherwise stated, references to ‘Woodside’, ‘the company’, ‘the Group’, ‘we’, ‘us’ and ‘our’ refer to Woodside Energy Group Ltd and its controlled entities as a whole. The text does not distinguish between the activities of the parent company and those of its controlled entities.
All dollar figures are expressed in US currency unless otherwise stated. Production and sales volumes, reserves and resources are quoted as Woodside share. A glossary of key terms, units of measure and conversion factors is on pages A-10 to A-14 of Woodside’s 2024 Half Year Report, attached as Exhibit 99.1 to the Form 6-K to which this document is filed (the “2024 Half-Year Report”).
Forward looking statements
This document contains forward-looking statements with respect to Woodside’s business and operations, market conditions, results of operations and financial condition, including, for example, but not limited to, statements regarding outcomes of transactions, statements regarding long-term demand for Woodside’s products, development, completion and execution of Woodside’s projects, expectations regarding future capital expenditures, the payment of future dividends and the amount thereof, future results of projects, operating activities and new energy products, expectations and plans for renewables production capacity and investments in, and development of, renewables projects expectations and guidance with respect to production, capital and exploration expenditure and gas hub exposure, and expectations regarding the achievement of Woodside’s net equity Scope 1 and 2 greenhouse gas emissions reduction and new energy investment targets and other climate and sustainability goals.
All statements, other than statements of historical or present facts, are forward-looking statements and generally may be identified by the use of forward-looking words such as ‘guidance’, ‘foresee’, ‘likely’, ‘potential’, ‘anticipate’, ‘believe’, ‘aim’, ‘aspire’, ‘estimate’, ‘expect’, ‘intend’, ‘may’, ‘target’, ‘plan’, ‘strategy’, ‘forecast’, ‘outlook’, ‘project’, ‘schedule’, ‘will’, ‘should’, ‘seek’ and other similar words or expressions. Similarly, statements that describe the objectives, plans, goals or expectations of Woodside are forward-looking statements.
Forward-looking statements in this document are not guidance, forecasts, guarantees or predictions of future events or performance, but are in the nature of future expectations that are based on management’s current expectations and assumptions.
Those statements and any assumptions on which they are based are subject to change without notice and are subject to inherent known and unknown risks, uncertainties, assumptions and other factors, many of which are beyond the control of Woodside, its related bodies corporate and their respective officers, directors, employees, advisers or representatives.
Important factors that could cause actual results to differ materially from those in the forward-looking statements include, but are not limited to, fluctuations in commodity prices, actual demand for Woodside’s products, currency fluctuations, geotechnical factors, drilling and production results, gas commercialisation, development progress, operating results, engineering estimates, reserve and resource estimates, loss of market, industry competition, environmental risks, climate related risks, physical risks, legislative, fiscal and regulatory developments, changes in accounting standards, economic and financial markets conditions in various countries and regions, political risks, the actions of third parties, project delay or advancement, regulatory approvals, the impact of armed conflict and political instability (such as the ongoing conflict in Ukraine and in the Middle East) on economic activity and oil and gas supply and demand, cost estimates, the effect of future regulatory or legislative actions on Woodside or the industries in which it operates, including potential changes to tax laws, the impact of general economic conditions, inflationary conditions, prevailing exchange rates and interest rates and conditions in financial markets, and risks associated with acquisitions, mergers and joint ventures, including difficulties integrating businesses, uncertainty associated with financial projections, restructuring, increased costs and adverse tax consequences, and uncertainties and liabilities associated with acquired and divested properties and businesses.
A more detailed summary of the key risks relating to Woodside and its business can be found in the “Risk” section of Woodside’s most recent Annual Report on Form 20-F filed with the United States Securities and Exchange Commission. You should review and have regard to these risks when considering the information contained in this document.
If any of the assumptions on which a forward-looking statement is based were to change or be found to be incorrect, this would likely cause outcomes to differ from the statements made in this document.
Investors are strongly cautioned not to place undue reliance on any forward-looking statements. Actual results or performance may vary materially from those expressed in, or implied by, any forward-looking statements. None of Woodside nor any of its related bodies corporate, nor any of their respective officers, directors, employees, advisers or representatives, nor any person named in this document or involved in the preparation of the information in this document, makes any representation, assurance, guarantee or warranty (either express or implied) as to the accuracy or likelihood of fulfilment of any forward-looking statement, or any outcomes, events or results expressed or implied in any forward-looking statement in this document.
All forward-looking statements contained in this document reflect Woodside’s views held as at the date of this document and, except as required by applicable law, Woodside does not intend to, undertake to, or assume any obligation to, provide any additional information or update or revise any of these statements after the date of this document, either to make them conform to actual results or as a result of new information, future events, changes in Woodside’s expectations or otherwise.
Past performance (including historical financial and operational information) is given for illustrative purposes only. It should not be relied on as, and is not necessarily, a reliable indicator of future performance, including future security prices.
Non-IFRS Measures
Throughout this document, a range of financial and non-financial measures are used to assess Woodside’s performance, including a number of financial measures that are not defined in, and have not been prepared in accordance with, International Financial Reporting Standards (IFRS) and are not recognised measures of financial performance or liquidity under IFRS (Non-IFRS Financial Measures). These measures include Capital expenditure, Cash margin, Production cost margin and Other cash cost margin. These Non-IFRS Financial Measures are defined in the glossary on pages A-10 to A-13 of the 2024 Half-Year Report. A quantitative reconciliation of these measures to the most directly comparable financial measure calculated and presented in accordance with IFRS can be found in the following disclosures: (i) in respect of Cash Margins, under “Non-IFRS Financial Measures” below; (ii) in respect non-IFRS measures presented in the 2024 Half-Year Report, in the Alternative Performance Measures section of the 2024 Half-Year Report on pages A-8 to A-9, and (iii) in respect of non-IFRS measures presented in the 2024 Form 20-F, section 6.6 of the 2024 Form 20-F beginning on page A-42 therein.
Woodside’s management uses these measures to monitor Woodside’s financial performance alongside IFRS measures to improve the comparability of information between reporting periods and business units and Woodside believes that the Non-IFRS Financial Measures it presents provide a useful means through which to examine the underlying performance of its business.
Undue reliance should not be placed on the Non-IFRS Financial Measures contained in this report and these Non-IFRS Financial Measures should be considered in addition to, and not as a substitute for, or as superior to, measures of financial performance, financial position or cash flows reported in accordance with IFRS. Non-IFRS Financial Measures are not uniformly defined by all companies, including those in Woodside’s industry. Accordingly, they may not be comparable with similarly titled measures and disclosures by other companies.
Climate strategy and emissions data
All greenhouse gas emissions data in this document are estimates, due to the inherent uncertainty and limitations in measuring or quantifying greenhouse gas emissions, and our methodologies for measuring or quantifying greenhouse gas emissions may evolve as best practices continue to develop and data quality and quantity continue to improve.
Woodside “greenhouse gas” or “emissions” information reported are net equity Scope 1 greenhouse emissions, Scope 2 greenhouse emissions, and/or Scope 3 greenhouse emissions, unless otherwise stated.
No express or implied prices
This report does not include any express or implied prices at which Woodside will buy or sell financial products.
* * *
About Woodside — Strategy
Woodside’s strategy is to thrive through this transition by developing a low cost, lower carbon, profitable, resilient and diversified portfolio.1 There are three goals which drive this strategic direction.
| • | First, we strive to have the right portfolio to provide the energy required for future demand. |
| • | Secondly, we want to create and return value to our shareholders. |
| • | Finally, we aim to conduct our business sustainably. |
We strive to have the right portfolio to provide the energy required for future demand.
Well-positioned portfolio — Wood Mackenzie forecasts in its base case scenario that global LNG demand will grow 53% to 2033, supported by growth in Europe (until 2029), China, and emerging Asian markets.2 This expected demand growth follows an increase of more than 60% increase in LNG demand from 2015 to 2022, according to Wood Mackenzie.
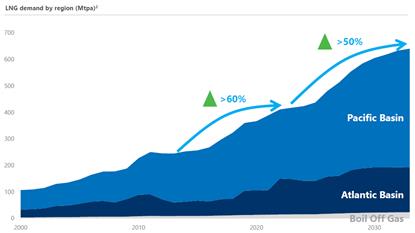
Source: Base case scenario. Wood Mackenzie LNG Tool (1Q24).
| 1 | Please see Woodside’s Annual Report on Form 20-F for the year ended December 31, 2023, Section 6.7 — Glossary, units of measure and conversion factors for a definition of how Woodside uses the term lower carbon portfolio. |
| 2 | Wood Mackenzie, October 2023. “Global Gas Investment Horizon Outlook”. |
Woodside is well-positioned to meet LNG demand in Asia.
Woodside has entered into agreements supporting its ability to service a number of markets, including those summarized below. For further information, refer to ‘Section 3.3 Our business — Marketing and trading’ in Woodside’s annual report on Form 20-F for the year ended December 31, 2023.
| • | In H1 2024, Woodside signed sale and purchase agreements (“SPAs”) with Korea Gas Corporation (“KOGAS”) and CPC Corporation, Taiwan (“CPC”) for the long-term supply of LNG to Korea and Taiwan, respectively. The KOGAS SPA is for the supply of approximately 0.5 Mtpa of LNG from 2026, for a period of 10.5 years. The CPC SPA is for the supply of approximately 6 million tonnes of LNG over 10 years, from July 2024. Under the CPC SPA, Woodside may also deliver approximately 8.4 million tonnes of LNG for a further 10 years, from 2034 to 2043.3 |
| • | In December 2023, Woodside signed an SPA with Mexico Pacific Limited (“Mexico Pacific”) for the purchase of 1.3 Mtpa of LNG over 20 years from Mexico Pacific’s Saguaro Energia LNG project on the Pacific coast of Mexico. The SPA is subject to Mexico Pacific taking a FID on the proposed third train, which is expected in the second half of 2024. Commercial operations are targeted to commence in 2029. |
Following our merger with BHP’s petroleum business in 2022, we have become a larger supplier of energy to the world through an expanded global portfolio. Our expanded portfolio allowed us to achieve record production in 2023 and assisted Woodside to offset lower commodity prices.
| 3 | Subject to conditions and agreements on terms for this period. |
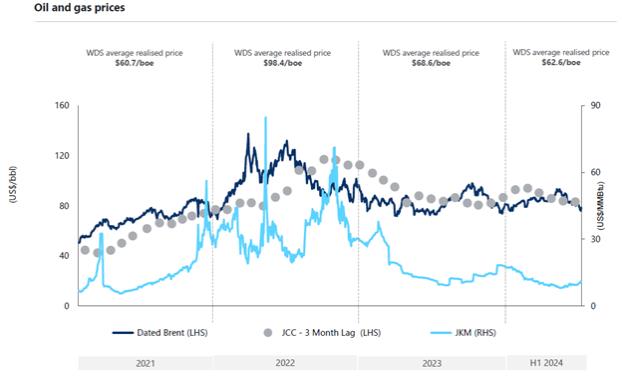
The graphic below sets out Woodside’s average realized oil and gas prices for the six months ended June 30, 2024, and the financial years ended December 31, 2023, 2022 and 2021:
Quality Customers – Woodside has contracted with a large number of quality customers in order to achieve revenue diversification. Based on their respective year-end 2023 debt ratings, approximately 92% of Woodside’s revenues were from companies who were investment grade rated.
Price Index Diversification – Woodside’s revenues are primarily derived from sales of LNG, crude oil, condensate, pipeline gas and natural gas liquids (“NGLs”). For the year ended December 31, 2023, the majority (approximately 72%) of Woodside’s production was attributed to natural gas, comprising LNG, NGLs and pipeline gas (47%, 4% and 21%, respectively), and the remaining portion (approximately 28%) of Woodside’s production was attributed to oil and condensate. In the 2024 Half-Year Report, Woodside reiterated its 2024 full-year expectation that approximately 26% to 33% of Woodside’s total LNG production would be linked to gas hub indices.4 The table below sets out additional detail as to the manner in which Woodside expects to maximize its portfolio value through contractual flexibility.
WOODSIDE PRODUCTION | LNG PORTFOLIO | TOTAL PORTFOLIO | ||||||||||||||
| Near-Term (2024 – 2025) | Longer-Term (2027+) | Near-Term (2024 – 2025) | Longer-Term (2027+) | |||||||||||||
GAS HUB INDICES | 25% to 30% | 30% to 35% | 10% | 20% | ||||||||||||
OIL PRICE INDICES | 60% | 55% | 70% | 60% | ||||||||||||
FIXED OR LOW VOLATILITY PRICING MECHANISMS | 10% | 10% | 20% | 20% | ||||||||||||
Refers to Woodside’s exposure to different pricing indices for produced hydrocarbons and does not reflect the potential impact of the Tellurian and OCI transactions. The information in the table above are management estimates and are not guidance. The allocations are rounded to the nearest 5%.
| 4 | Gas hub indices include Japan Korea Marker (“JKM”), Title Transfer Facility (“TTF”) and National Balancing Point (“NBP”). It excludes Henry Hub. |
We want to create and return value to our shareholders. Our capital management framework aims to optimize value, balance strong shareholder returns and invest in quality opportunities.
Woodside’s high margin portfolio is made up of quality assets which have the scale and resilience to deliver ongoing value. For a presentation of Woodside’s cash margins for the half year ended June 30, 2024, and the years ended December 31, 2023, 2022 and 2021, including a reconciliation of these measures to the most directly comparable financial measure calculated and presented in accordance with IFRS in Woodside’s Financial Statements, refer to pages “Non-IFRS Financial Measures” below.
Woodside’s business does not generally require significant sustaining capital in order to maintain production. Woodside’s capital expenditure for 2024 is expected to be between $5,000 million and $5,500 million, primarily due to Sangomar, Scarborough and Trion project expenditure. This excludes the impact of any subsequent asset sell-downs, acquisitions or other changes in equity.
| 2023 US$m | 2022 US$m | 2021 US$m | ||||||||||
Capital expenditure | ||||||||||||
Capital additions on evaluation | 163 | 119 | 453 | |||||||||
Capital additions on oil and gas properties | 5,317 | 3,904 | 2,178 | |||||||||
Capital additions on other(1) | 256 | 92 | — | |||||||||
|
|
|
|
|
| |||||||
Capital expenditure(2) | 5,736 | 4,115 | 2,631 | |||||||||
|
|
|
|
|
| |||||||
| (1) | Includes capital additions on other corporate spend. The 2023 amounts have been restated to be presented on the same basis. |
| (2) | Capital expenditure includes capital expenditure for the following projects: Trion (2023: $0.3 billion), Scarborough (2023: $2.5 billion; 2022: $1.8 billion; 2021: $1.0 billion), and Sangomar (2023: $1.1 billion; 2022: $1.0 billion; 2021: $1.0 billion). The Scarborough Energy Project was 67% complete at the end of H1 2024 (excluding Pluto Train 1 modifications), with a forecast total estimated cost of $12.5 billion. The forecast total capital expenditure for Trion is $7.2 billion. |
We aim to conduct our business sustainably. To achieve this, we need to manage our impact on people, communities and the environment in which we operate. The safety of our people and a strong focus on managing our net equity Scope 1 and 2 emissions to meet our targets is critical to the longevity of our business.
We have also continued to focus on maintaining meaningful relationships with communities. In 1H 2024, Woodside made Australian tax and royalty payments of A$2,682 million. In the State of Western Australia, Woodside had more than A$1.46 billion of expenditures at the North West Shelf Project and more than A$989 million of contracts awarded to Western Australia businesses in 2023. For further information, refer to “Communities” in our 2024 Half-Year Report.
Non-IFRS Financial Measures
Cash margin is a measure that is not defined in, and has not been prepared in accordance with, International Financial Reporting Standards as issued by the International Accounting Standards Board (“IFRS”) and is not a recognised measure of financial performance or liquidity under IFRS.
Cash margin is among the measures that Woodside’s management uses to monitor its financial performance alongside IFRS measures to improve the comparability of information between reporting periods and business units and Woodside believes that the non-IFRS financial measures it presents provide a useful means through which to examine the underlying performance of its business. Undue reliance should not be placed on non-IFRS financial measures, including cash margin, and these non-IFRS financial measures should be considered in addition to, and not as a substitute for, or as superior to, measures of financial performance, financial position or cash flows reported in accordance with IFRS. Non-IFRS financial measures, including cash margin, are not uniformly defined by all companies, including those in Woodside’s industry. Accordingly, they may not be comparable with similarly titled measures and disclosures by other companies.
Cash margin is calculated as revenue from sale of produced hydrocarbons less production costs, royalties, excise and levies, insurance, inventory movement, shipping and direct sales costs and other hydrocarbon costs; divided by revenue from the sale of produced hydrocarbons (sales volume). Excludes exploration and evaluation, general administrative and other costs, depreciation and amortization, petroleum resource rent tax and income tax.
Reconciliation of cash margin, production costs and other cash costs
| Six months ended June 30, | ||||||||
| 2024 | 2023 | |||||||
Revenue from sale of hydrocarbons (excluding marketing segment) | 5,376 | 6,486 | ||||||
|
|
|
| |||||
Cash margin (excluding marketing segment) | ||||||||
Gross profit/(loss) | 2,526 | 3,221 | ||||||
Adjusted for: | ||||||||
Other cost of sales | 21 | — | ||||||
Trading costs | — | 4 | ||||||
Oil and gas properties depreciation and amortisation | 1,893 | 1,944 | ||||||
Other revenue | (99 | ) | 41 | |||||
|
|
|
| |||||
Cash margin (excluding marketing segment) | 4,341 | 5,210 | ||||||
|
|
|
| |||||
Cash margin % | 81 | % | 80 | % | ||||
|
|
|
| |||||
Production costs (excluding marketing segment) | 745 | 807 | ||||||
|
|
|
| |||||
Production cost margin % | 14 | % | 13 | % | ||||
|
|
|
| |||||
Other cash costs (excluding marketing segment): | ||||||||
Royalties, excise and levies | 196 | 316 | ||||||
Insurance | 26 | 34 | ||||||
Inventory movement | (62 | ) | (33 | ) | ||||
Shipping and direct sales costs | 104 | 145 | ||||||
Other hydrocarbon costs | 26 | 7 | ||||||
|
|
|
| |||||
Total other cash costs (excluding marketing segment) | 290 | 469 | ||||||
|
|
|
| |||||
Other cash cost margin % | 5 | % | 7 | % | ||||
|
|
|
| |||||
| Year ended December 31, | ||||||||||||
APMs derived from other notes | 2023 | 2022 | 2021 | |||||||||
Revenue from sale of hydrocarbons (excluding marketing segment) | 12,348 | 14,154 | 5,329 | |||||||||
|
|
|
|
|
| |||||||
Cash margin (excluding marketing segment) | ||||||||||||
Gross profit/(loss) | 5,942 | 8,949 | 2792 | |||||||||
Adjusted for: | ||||||||||||
Other cost of sales | 7 | 4 | 12 | |||||||||
Trading costs | 12 | 14 | 3 | |||||||||
Oil and gas properties depreciation and amortisation | 3,956 | 2,798 | 1549 | |||||||||
Other revenue | (3 | ) | 285 | 89 | ||||||||
|
|
|
|
|
| |||||||
Cash margin (excluding marketing segment) | 9,914 | 12,050 | 4,445 | |||||||||
|
|
|
|
|
| |||||||
Cash margin % | 80 | % | 85 | % | 83 | % | ||||||
|
|
|
|
|
| |||||||
Production costs (excluding marketing segment) | 1,562 | 1281 | 481 | |||||||||
|
|
|
|
|
| |||||||
Production cost margin % | 13 | % | 9 | % | 9 | % | ||||||
|
|
|
|
|
| |||||||
Other cash costs (excluding marketing segment): | ||||||||||||
Royalties, excise and levies | 503 | 596 | 218 | |||||||||
Insurance | 60 | 43 | 31 | |||||||||
Inventory movement | 37 | (41 | ) | (17 | ) | |||||||
Shipping and direct sales costs | 265 | 206 | 165 | |||||||||
Other hydrocarbon costs | 7 | 19 | 6 | |||||||||
|
|
|
|
|
| |||||||
Total other cash costs (excluding marketing segment) | 872 | 823 | 403 | |||||||||
|
|
|
|
|
| |||||||
Other cash cost margin % | 7 | % | 6 | % | 8 | % | ||||||
|
|
|
|
|
| |||||||